Mortality and Immortality Matthew D Rablen and Andrew J Oswald No 785 WARWICK ECONOMIC RESEARCH PAPERS DEPARTMENT OF ECONOMICS

Welcome message from author
This document is posted to help you gain knowledge. Please leave a comment to let me know what you think about it! Share it to your friends and learn new things together.
Transcript
Mortality and Immortality
Matthew D Rablen and Andrew J Oswald
No 785
WARWICK ECONOMIC RESEARCH PAPERS
DEPARTMENT OF ECONOMICS
Mortality and Immortality
Matthew D. Rablen
Andrew J. Oswald [email protected]
University of Warwick
January 2007
Abstract
It has been known for centuries that the rich and famous have longer lives than the poor and ordinary. Causality, however, remains trenchantly debated. The ideal experiment would be one in which status and money could somehow be dropped upon a sub-sample of individuals while those in a control group received neither. This paper attempts to formulate a test in that spirit. It collects 19th-century birth data on science Nobel Prize winners and nominees. Using a variety of corrections for potential biases, the paper concludes that winning the Nobel Prize, rather than merely being nominated, is associated with between 1 and 2 years of extra longevity. Greater wealth, as measured by the real value of the Prize, does not seem to affect lifespan. JEL classification: I12 Keywords: Longevity; status; health; wealth; mortality The views expressed in this paper are those of the authors alone and cannot be attributed to H.M. Revenue & Customs or the British government. We thank John Heilbron for pointing us toward data on the Nobel Prizes in Physics and Chemistry, for his assistance with finding biographical details, and for valuable discussions. For many helpful ideas, we are grateful to Andrew Clark, Angus Deaton, Andrew Gelman, and Daniel Gilbert.
1
1 Introduction
This paper provides evidence consistent with the view that an increase in status raises a
person's lifespan. It uses data on the lives of 528 Nobel Prize winners and nominees. The
paper uncovers no evidence that the money that comes with the Prize affects the
longevity of recipients.
Work in the medical sciences has shown that measures of socio-economic status (SES)
are associated with better health and longer life. A famous demonstration of these results
comes from two Whitehall studies of British civil servants. The first (Reid et al., 1974)
covered 18,403 non-industrial male civil servants aged 40-64 years. Analysis of mortality
rates for coronary heart disease (CHD) at follow-up times of 7.5 years (Marmot, Rose &
Hamilton, 1978), 10 years (Marmot, Shipley & Rose, 1984) and 25 years (Marmot &
Shipley, 1996) all found occupational grade to be an important explanatory factor, with
mortality rates successively decreasing with each occupational grade. In the 7.5 year
follow-up, men in the lowest grade were 3.6 times more likely to die of CHD than were
men in the highest grade, with only around 40% of this difference being explained by
obvious risk factors that differ across grade, such as smoking, body mass index, blood
pressure, and plasma cholesterol. Importantly, the finding pertained even within the
uppermost grades, which exclusively contained well-educated professionals and top
administrators, so it could not be explained solely by poverty.
Other studies have confirmed the independent association of civil service grade, after
controlling for known risk factors, to mortality rates for a range of other common
diseases (van Rossum et al., 2000; Marmot, Shipley & Rose, 1984) and in women civil
servants as well as men (Marmot et al., 1991; Ferrie et al., 2002). The association has also
been found in all other industrialized countries where the issue has been studied,
including amongst populations other than civil servants (Adams et al., 2003; Adler &
Ostrove, 1999; Adler et al., 1993).
2
The question of cause-and-effect, however, remains. Two influential accounts of the
causal process based on perceived social status, and its psychobiological consequences,
have been proposed by Marmot (2004) and Wilkinson (2000). Lower levels of SES are
argued to raise levels of psychological stress, primarily through the association of low
SES with low levels of job control (Marmot et al., 1991), and low levels of fall-back
social support (Putnam, 2000; Marmot et al., 1991). A growing body of evidence
indicates that lack of control in the workplace is associated with increased stress and
depressive symptoms (Steptoe et al., 2003a; Stansfeld et al., 1999; Karasek & Theorell,
1990), while the degree to which an individual has social support is believed to determine
the degree to which they can buffer job strain (Falk et al., 1992; Johnson & Hall, 1988).
Wilkinson (2000) argues that perceived low social standing is linked with feelings of
shame, humiliation, disrespect, and social anxiety. It is argued that increased levels of
psychological stress can lead to the maintenance over time of high levels of stress
hormones, and that this damages endocrine and immunological processes (Steptoe &
Marmot, 2005). The result is a causal pathway from SES to mortality.
Important in this account is the idea that human societies are structured into hierarchies.
As in other natural species, these occur whenever a species must ration access to scarce
resources such as food or mates. Social status reflects position in the various societal
hierarchies, and is therefore a fundamentally relative phenomenon. In principle, it can be
measured distinct from economic measures of status, although in human societies the two
routinely go hand-in-hand.
Experimental studies on rhesus macaques that control for dietary and living conditions,
and in which rank can be manipulated, indicate that causation runs from hierarchical
position to the presence of stress hormones (Shively, 2000). Sapolsky (1993) finds that
levels of biological stress markers follow a hierarchical pattern in troops of wild baboons.
However, studies of the cortisol stress marker in humans so far yield mixed results
(Steptoe & Marmot, 2005; Kunz-Ebrecht et al., 2004, Steptoe et al., 2003b). When social
and economic status go together, the pursuit of social status is reinforced by the greater
entitlement to economic resources. Theoretical and experimental research into the
3
economic consequences of status-seeking behavior includes Becker, Murphy & Werning
(2005), Ball et al. (2001), Clark and Oswald (1998), Fershtman, Murphy & Weiss (1996),
Frank (1985), Oswald and Powdthavee (2007), and Rablen (2006)).
While medical scientists support the idea that causation runs from SES to health, many
economists -- see for example the review by Cutler et al (2006) -- have taken seriously
two other possibilities. One is that causation may be from health to SES (social
selection). Another is that there may exist common factors, the most obvious being
unobserved behavioral or genetic heterogeneity, that influence both susceptibility to
disease and the determinants of SES. Of course, these routes are not mutually exclusive;
it seems likely that all three combine in subtle ways to create the observed association
between SES and health. Economists have questioned the psychological notion of
perceived social status, or hierarchical position, and wondered whether it is unworkable
for policy or testing (e.g. Deaton, 2003). The simplest social selection hypothesis argues
that bouts of ill health lead to serious loss of income, so health has a causal link to SES.
Economists have gone a step further to argue that individuals who expect a long duration
of life may accumulate assets to finance their retirement, and that healthy workers may be
paid higher wages due to their higher productivity (Luft, 1975). While social selection is
widely thought nugatory by medical scientists, economists give it greater credence. Smith
(1998, 1999, 2005) argues persuasively that there are significant pathways from health to
economic measures of SES.
Measuring SES in terms of income or education, economists have uncovered mixed
evidence for a causal association from SES to health. The majority of the evidence on
economic measures of SES suggests that any causal effect is weak and small in
magnitude. For instance, Meer, Miller & Rosen (2003) reject causation from wealth to
health in US data. Also, holding constant initial health, Gardner & Oswald (2004) find no
significant effect from income to later mortality risk using the British Household Panel
Survey. Gravelle and Sutton (2006) and Miller and Paxson (2006) cannot find persuasive
evidence of health effects from relative income. However, some innovative recent work
4
by Frijters, Haisken-DeNew & Shields (2005a,b) does suggest a role for income.1
An association between education and mortality has been independently confirmed by
several authors since an early finding by Kitagawa & Hauser (1973). More recent
research argues that a causal connection can be established from education to health (see
e.g. Lleras-Muney, 2005; Smith, 2005). An important contribution by Adams et al.
(2003) tests for the absence of direct causality from SES to health, using both economic
and education measures of SES. The hypothesis of non-causality is, in general, only
accepted if no direct causal link is present and there are no persistent common factors at
work. The authors perform their tests on data from the Asset and Health Dynamics
(AHEAD) Panel covering Americans aged 70 and older, and cannot reject the hypothesis
of no causal link from SES to overall mortality after conditioning upon initial health
conditions. However, for three of the top four causes of death amongst men the
hypothesis of no direct causation can be rejected (Adda et al., 2003). The hypothesis of
no direct causation is rejected for some mental, chronic, and degenerative conditions,
which may be of importance as these are the types of conditions that can result from
sustained levels of biological stress.
Testing for the role of social status has taken a different approach. Redelmeier & Singh
(2001a) consider the longevity of Oscar winning actors and actresses relative to those
who had been nominated for an award but had never won. Winning an Oscar, it is
reasoned, should have a positive effect on feelings of perceived social standing. Indeed,
as almost as many Americans watch the Oscar ceremony as vote in presidential elections,
there are perhaps few greater public validations of self worth in the USA (Davey Smith,
2001). Additionally, film stars generally do not have a substantial amount of education,
and are far from the poverty line irrespective of whether they win an Oscar. Finally, while
being nominated for an Oscar may be down to ability, it is sometimes said that winning
one is due partly to luck. The authors conclude that Oscar winners have a life expectancy
3.6 years longer than the control group of Oscar nominees, which is only slightly reduced
1 However, see Snyder & Evans (2006) for evidence that higher-income individuals die slightly younger -- not older -- than lower-income individuals.
5
by controlling for possible causality from longevity to winning an Oscar. Despite this
remarkable finding, a follow-up study (Redelmeier & Singh, 2001b) that performed an
identical analysis on Oscar winning and Oscar nominated screenwriters found that the
unsuccessful Oscar nominees live on average 3.6 years longer than do winners. Thus the
findings of the Redelmeier & Singh papers contradict each other.2
1.1 A Test
The paper contributes to this debate by using data on Nobel Prize winners and nominees
in Physics and Chemistry between 1901-1950. Winners of a Nobel Prize are held in
esteem, achieve international recognition of their work, and are often awarded titles or
honors in their home countries. In addition to these markers of social distinction, the prize
(which can be shared by up to three people) currently amounts to $1 - $1.5 million,
although most winners donate a proportion of their winnings to academic and charitable
causes. There is some consensus in the literature (see e.g. Frey, 2005; Layard, 1980), as
well as among Nobel Prize winners themselves, that the intrinsic value of a Nobel Prize
outweighs its accompanying or subsequent monetary rewards. Accordingly, we interpret
winning the Prize as primarily a one-time innovation to social status.3 The innovation to
wealth cannot, though, be ignored. However, we show that there is no relationship over
time between the real value of the Prize and the longevity of Prize winners. The idea that
the demand for awards relies partly on individuals' desire for distinction, rather than from
direct monetary concerns, is a plank of a nascent economic literature on awards (Frey,
2005). Without this, it is difficult to explain the large number of non-monetary awards
that exist in many walks of life.
Thus we view winning the Nobel Prize as akin to an extraneous4 or ‘exogenous’ boost to
status. We attempt to measure the impact of winning a Nobel Prize on longevity by
2 After the first draft of our paper was written, our attention was also drawn to the note by Miskie et al. (2003), which discusses the lifespans of Nobel Prize winners but does not correct for the biases discussed in our paper. Their note argues that this Redelmeier-Singh paper is unpersuasive. 3 In Economics, some believe the Prize is approximately a lifetime achievement award, with a timing that is influenced by the health status of the individual. In the sciences, however, the Prize is more generally viewed as a reward for a single (sometimes quite recent) key discovery. 4 We thank Angus Deaton for helpful discussions about exogeneity and extraneity.
6
comparing winners to a control group, namely, those scientists nominated for a Nobel
Prize who were never successful. These persons in themselves are top scientists who
made important contributions in their individual fields, and are likely to be similar to
Nobel winners in terms of SES characteristics and behavioral traits.
The raw data described in Section 2 and analyzed in Section 3 show that historically
winners live just under 1.4 years longer than nominees. However, this does not establish a
causal link from winning a Nobel Prize to longevity. As all scientists must be alive at the
time they are nominated for a Nobel Prize, reverse causality from longevity to winning a
Nobel Prize can arise in two ways. Even if scientists are thought to sequentially explore
new ideas, some of which turn out to be good and others less so, the longer this process is
allowed to continue the more chance any scientist has of stumbling upon a major
discovery. Weinberg & Galenson (2005) suggest that this is especially the case for
scientists who work inductively, accumulating knowledge from experience, for they tend
to write their best works later in their careers than do scientists who work deductively
from abstract principles. Second, there is a variable lag, in some cases large, between the
award of a Nobel Prize and the completion of the work for which it is awarded. Low
survival increases the likelihood of dying before receiving a Nobel Prize, even when the
Prize would have been merited.
For these reasons, the remainder of the paper is devoted to modes of analysis that aim to
overcome these difficulties. In Section 3 we present a simple non-parametric test of the
null hypothesis that winners and nominees have identical survival. This proposes one way
to overcome the issue of reverse causality. It compares the longevity of each given
winner against the expected longevity of a nominee, conditional on that nominee having
lived to the age at which the winner won a Nobel Prize. This is a simple matching test.
The test relies upon the near absence of censoring in the lifespan data, which is a feature
of our data, but not of the datasets used in the earlier research of Redelmeier & Singh
(2001a,b).
In Section 4 we present a semi-parametric regression-based approach using the
7
proportional hazards model of Cox (1972). This allows us to control for heterogeneities
between the two Prizes and across countries, as well as for possible sources of status
other than winning a Nobel Prize. To mitigate reverse-causality bias we use the method
of time-dependent covariates. Our final estimate here is that winners live 2.1 years longer
than do nominees. Analysis of winners shows that there is no relationship over time
between the real value of the Prize and the longevity of Prize winners. Hence, as well as
being, in an important but controversial area, a test in the spirit of Redelmeier & Singh,
this paper allows a test for the influence of an increase in wealth upon longevity. It also
suggests a methodology not performed by Redelmeier & Singh. Section 5 concludes.
2 Data
The statutes of the Nobel Foundation mandate that the names of nominators and their
nominees are to be kept secret for a period of 50 years. Because the Nobel Prizes in
Chemistry, Literature, Peace, Physiology-or-Medicine, and Physics were first awarded in
1901, there are now more than 50 years of data on nominees for these Prizes. Our sample
is drawn from a published census of Nobel Prize nominees in the Chemistry and Physics
Prizes for the period 1901-1950 (Crawford, 2002). Of the 560 scientists nominated for
one of these Prizes over this period, we were able to find the year of death for 532
scientists using the internet search engine Google, the `Recent Deaths' column of the
academic journal Science, and a rolling scientific bibliographic dictionary initiated as
Poggendorff (1863). Where possible, when information from the internet was conflicting,
we used information linked to reputable published sources, such as the online entries
from the Encyclopedia Britannica. Information on nationality, sex, year of birth, plus a
full record of the years in which each scientist was nominated and/or won each Prize was
collected from Crawford (2002). Three scientists are thought to be alive at time of
writing. We were unable to find the year of death for the remaining 24 scientists assumed
to be dead. They are therefore omitted.
Of the 532 scientists with known biographical details, we restrict attention to male
scientists, of which there are 528, in order to escape the difference in life expectancy
8
across sexes. To avoid misplaced inference due to outliers, we drop a further four
scientists who are known to have died prematurely from non-biological causes. These are
Henry G. J. Moseley and Eduard Buchner, who both died in active combat in the First
World-War; and Pierre Curie and Arnold J. W. Sommerfeld, who were both fatally
wounded in traffic accidents. The final sample therefore contains some 524 scientists, of
whom 135 won a Nobel Prize. For clarity we shall refer to these latter scientists as
`winners'. Those scientists who never won a Nobel Prize we term `nominees'. The
winners group contains twelve scientists who were nominated for, but did not win, either
the Chemistry or Physics Prize, but instead won the Nobel Prize for Physiology or
Medicine.5 No scientist won either the Prize in Literature or the Prize in Physiology-or-
Medicine in conjunction with the Chemistry or Physics Prizes.6
3 Non-Parametric Analysis
Average lifespan is just over 76 years, measured as the area under the survival function
(Kaplan-Meier method). This is perhaps surprising for it is equivalent to male life
expectancy for people born in the US in 2006, yet the sample was born on average in
1876, predominantly in rich countries with comparable levels of life expectancy.
However, it can most probably be explained by the fact that all scientists in the sample
survived infancy.
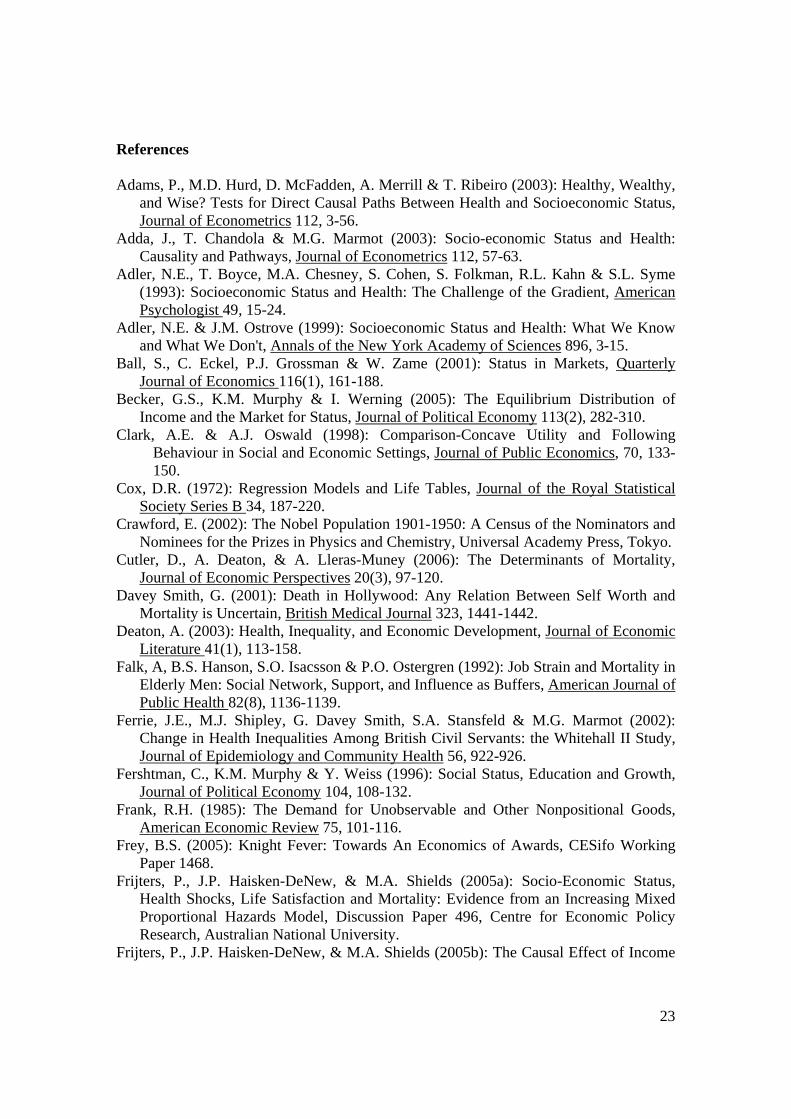
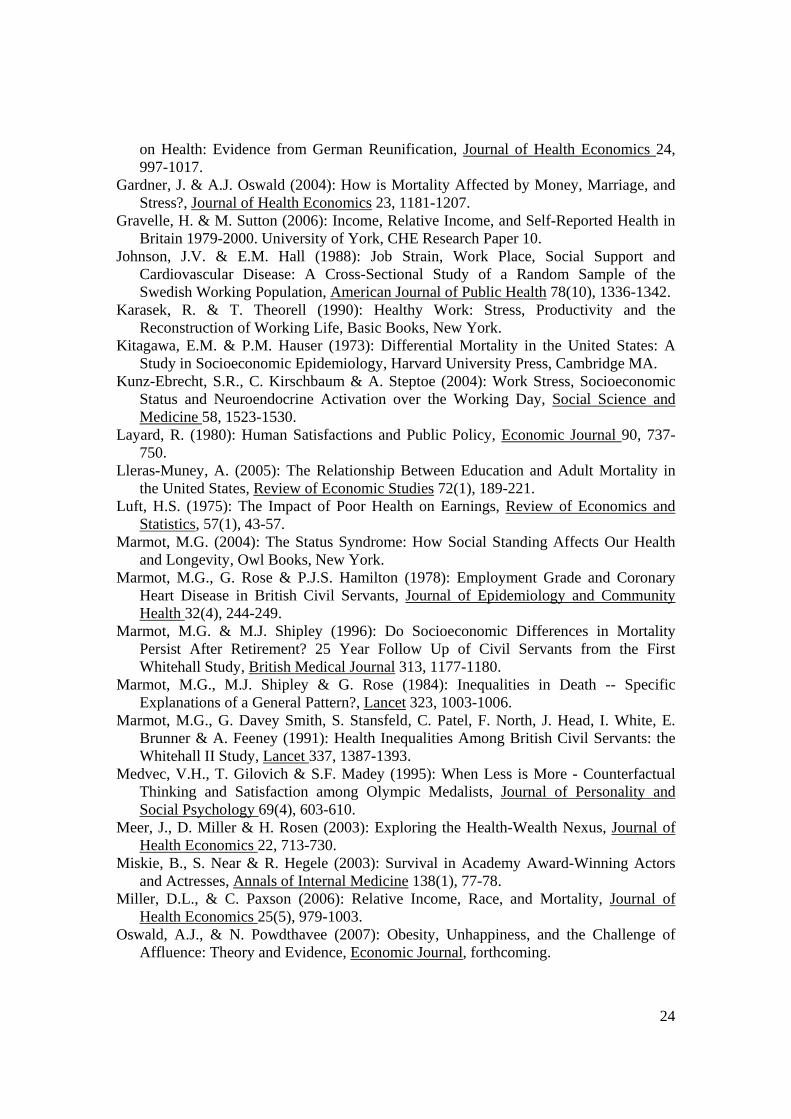
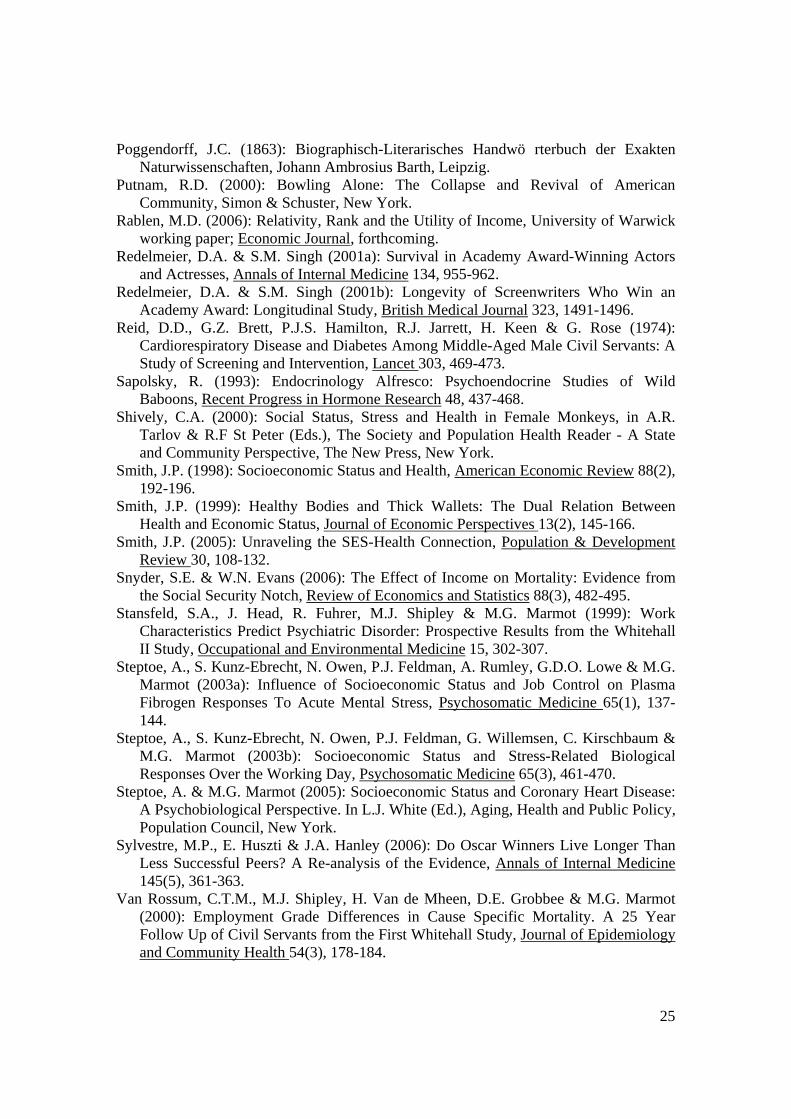
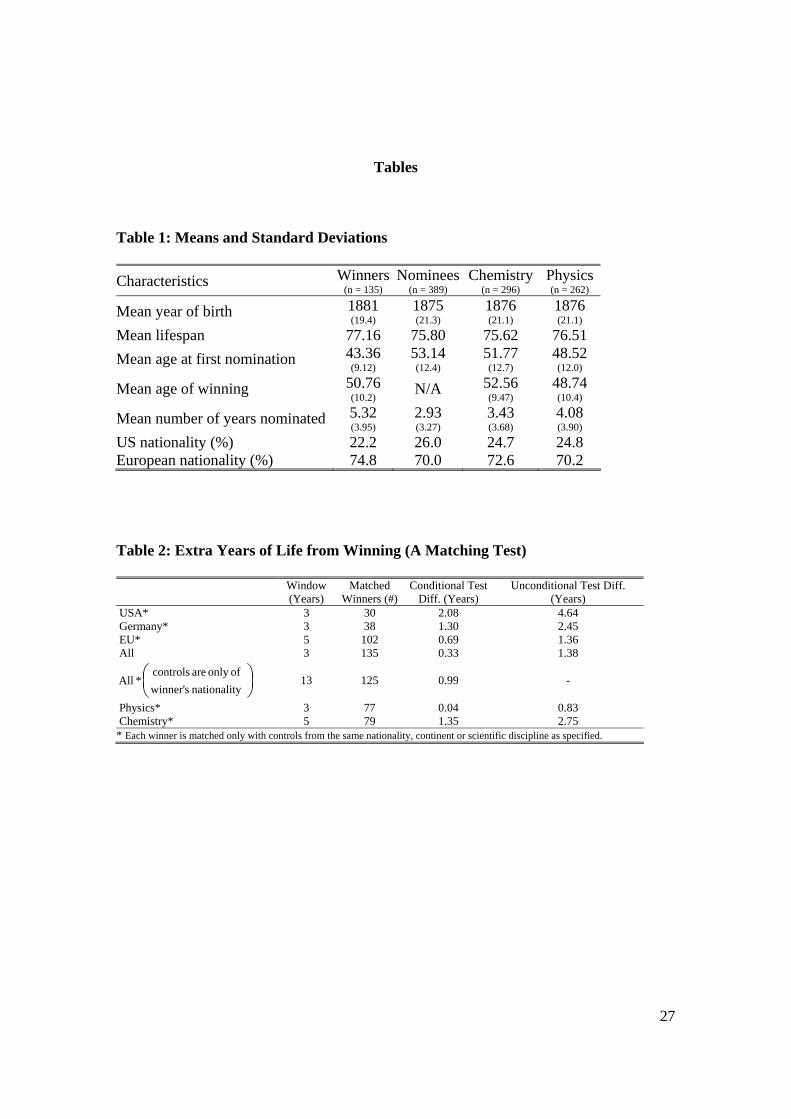
The baseline characteristics of winners and nominees are shown in Table 1 (standard
deviations in parentheses).
Winners were born several years later in time than the sample average, but the difference
is not statistically significant. Demographically, the two groups are similar. Two
potentially important differences are that winners are first nominated for a Prize some ten
5 We count as a Physics winner a scientist who won the Prize in Physiology-or-Medicine and who was nominated for the Physics Prize, and similarly for chemists. This avoids (i) the necessity to somehow allow for `unsuccessful' nominees who won a Physiology-or-Medicine Prize and (ii) having to lose 12 winners. 6 No individual has both won the Nobel Peace Prize and been nominated for (without winning) the Chemistry or Physics Prizes. However, Linus Pauling won both the Chemistry (1954) and Peace (1962) Prizes.
9
years earlier on average than are nominees, and are also nominated in more than 1.5 times
as many distinct years.7
Second, we also decompose the data for each individual Prize. There appear to be more
observations here due to the presence of 34 scientists who were nominated at various
times for both Prizes. The statistics reveal some small heterogeneity between Prizes.
Physicists lived almost a year longer than Chemists. Second, the Physics Prize has tended
to draw from a smaller pool of scientists, with scientists first being nominated at a
younger age and winning at a younger age also. Nevertheless, at least for the raw data, we
cannot reject the hypothesis that the estimated survival functions for each Prize are the
same using a log-rank test.
These raw data yield a first opportunity to assess the hypothesis that survival of winners
differs from that of nominees.
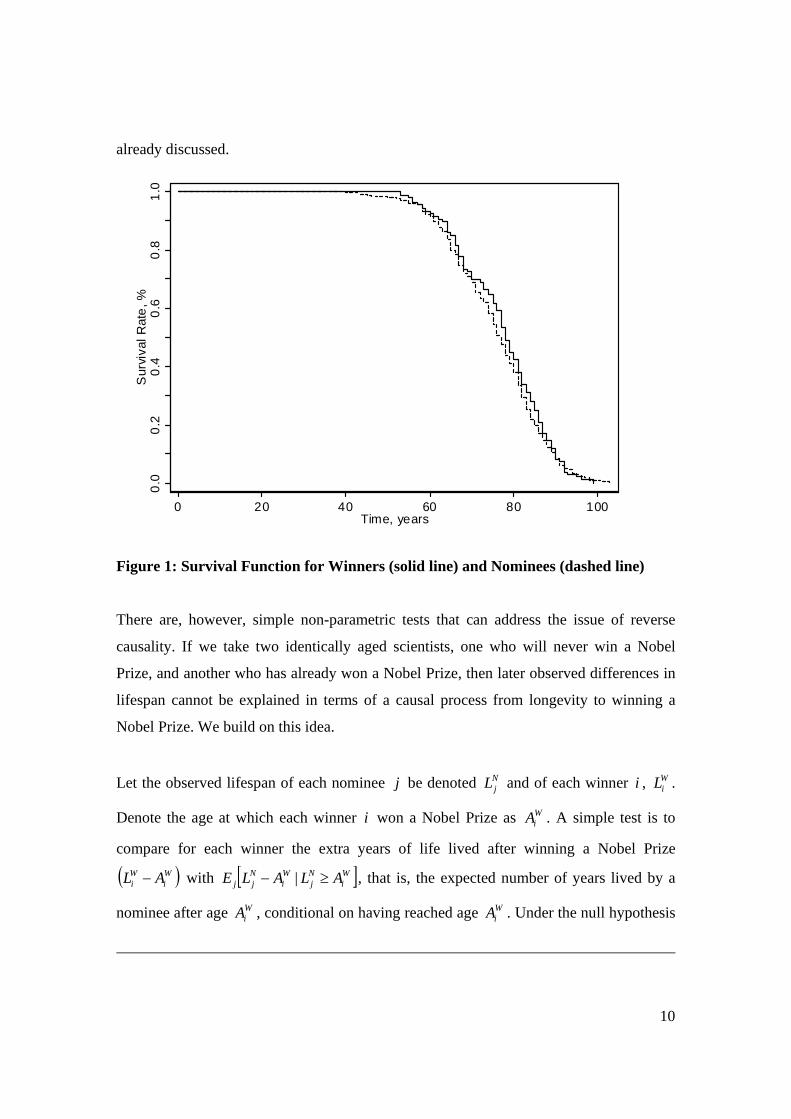
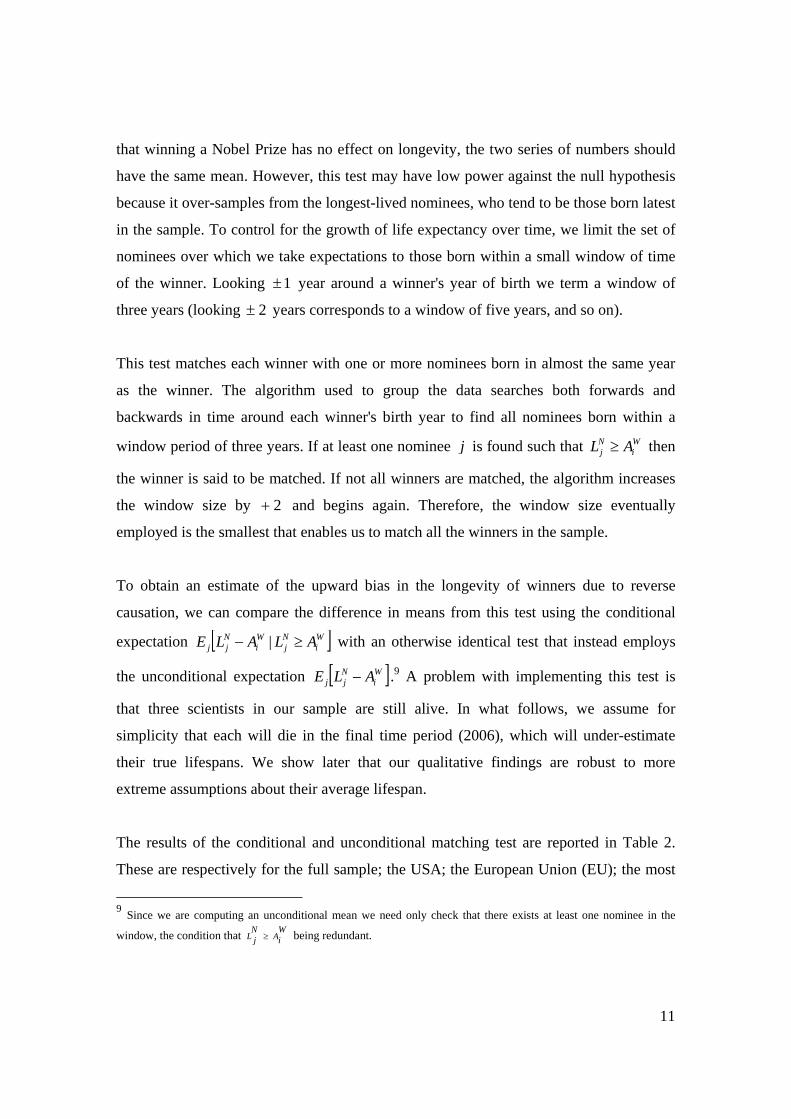
In uncensored populations we calculate mean lifespan directly. In censored populations
we predict mean lifespan as the area under the relevant survival function. Using the
survival functions for winners and nominees (Figure 1), winners are estimated to live 1.4
years (77.2 v. 75.8) longer than nominees, which breaks down to an effect of 1.3 extra
years in Chemistry (76.6 v. 75.3) and 1.2 extra years in Physics (77.4 v. 76.2).8 However,
the inferences we can make from these results are limited. Perhaps unsurprisingly, there
is too much noise in the raw data to be able to show statistical significance at
conventional levels for these differences: we cannot distinguish the survival functions for
winners and nominees in Figure 1 using a log-rank test.
Second, these reported differences cannot be given a causal interpretation, for reasons
7 That winners were nominated 10 years earlier on average suggests that they arguably had more, and earlier, inherent status than did nominees. This does not affect the nature of the test described in this paper, but it could potentially lead to an underestimation of the true effect (if, hypothetically, those who went on to win already knew that they were particularly distinguished scientists, and thus gained less, psychologically, from the award of the Prize per se). 8 The apparent discrepancy here is due to the effect of scientists nominated for both Prizes and the effects of rounding.
10
already discussed. 0.
00.
20.
40.
60.
81.
0S
urvi
val R
ate,
%
0 20 40 60 80 100Time, years
Figure 1: Survival Function for Winners (solid line) and Nominees (dashed line)
There are, however, simple non-parametric tests that can address the issue of reverse
causality. If we take two identically aged scientists, one who will never win a Nobel
Prize, and another who has already won a Nobel Prize, then later observed differences in
lifespan cannot be explained in terms of a causal process from longevity to winning a
Nobel Prize. We build on this idea.
Let the observed lifespan of each nominee j be denoted NjL and of each winner i , W
iL .
Denote the age at which each winner i won a Nobel Prize as WiA . A simple test is to
compare for each winner the extra years of life lived after winning a Nobel Prize
( )Wi
Wi AL − with [ ]W
iNj
Wi
Njj ALALE ≥− | , that is, the expected number of years lived by a
nominee after age WiA , conditional on having reached age W
iA . Under the null hypothesis
11
that winning a Nobel Prize has no effect on longevity, the two series of numbers should
have the same mean. However, this test may have low power against the null hypothesis
because it over-samples from the longest-lived nominees, who tend to be those born latest
in the sample. To control for the growth of life expectancy over time, we limit the set of
nominees over which we take expectations to those born within a small window of time
of the winner. Looking 1± year around a winner's year of birth we term a window of
three years (looking 2± years corresponds to a window of five years, and so on).
This test matches each winner with one or more nominees born in almost the same year
as the winner. The algorithm used to group the data searches both forwards and
backwards in time around each winner's birth year to find all nominees born within a
window period of three years. If at least one nominee j is found such that Wi
Nj AL ≥ then
the winner is said to be matched. If not all winners are matched, the algorithm increases
the window size by 2+ and begins again. Therefore, the window size eventually
employed is the smallest that enables us to match all the winners in the sample.
To obtain an estimate of the upward bias in the longevity of winners due to reverse
causation, we can compare the difference in means from this test using the conditional
expectation [ ]Wi
Nj
Wi
Njj ALALE ≥− | with an otherwise identical test that instead employs
the unconditional expectation [ ]Wi
Njj ALE − .9 A problem with implementing this test is
that three scientists in our sample are still alive. In what follows, we assume for
simplicity that each will die in the final time period (2006), which will under-estimate
their true lifespans. We show later that our qualitative findings are robust to more
extreme assumptions about their average lifespan.
The results of the conditional and unconditional matching test are reported in Table 2.
These are respectively for the full sample; the USA; the European Union (EU); the most
9 Since we are computing an unconditional mean we need only check that there exists at least one nominee in the
window, the condition that WiA
NjL ≥ being redundant.
12
represented EU country (Germany); and the sample broken down by prize. `Conditional'
here means that winners are matched only to nominees in the window who were alive at
the age the winner won the Nobel Prize. The third and fourth columns report the
difference in means between the lifespan of winners and nominees for the conditional and
unconditional tests respectively. The unconditional differences are, by definition,
uncorrected for bias, and we would therefore expect them to be positive. However, under
the null hypothesis that the Nobel Prize has no effect on longevity, we would expect our
corrected conditional estimates to lie around zero, with some estimates positive and
others negative, due to the presence of noise in the data. Contrary to this prediction, in
Table 2 we find positive differences in all the subsamples considered and for the sample
as a whole. Winners outlive nominees.
It is noticeable that the estimated effect is larger in the single country sub-samples
relative to those that mix scientists from different countries. This suggests that
heterogeneities in the matches can obscure the longevity effect. In particular, we obtain
estimates exceeding one and two years respectively for the Germany and the USA. For
the matching test applied to the full sample, we find this issue so serious that we perform
a further test that controls for unexplained variation in longevity across countries. In
addition to restricting the expectation to nominees within the window, we further remove
from the expectation nominees of a different nationality to the winner. Under this stricter
matching rule it becomes impossible to match all winners without allowing the window
size to converge towards the span of the full sample. In the row labelled `All (controls
only of winner's nationality)' we present the results for a window-size of 13 years (the
results at other window sizes being comparable). This procedure significantly increases
our longevity estimates for the full sample by around two-thirds of a year.
Comparing the third and fourth columns yields initial estimates of the effect of
conditioning on nominees living to at least the age their matched winner won a Nobel
Prize. These estimates range from 2.56 years for the US to only 0.67 years for the EU.
This is, then, an initial measure of the extent to which winners wrongly appear to live
13
longer due to causality from longevity to winning a Nobel Prize. A final thing to note
from Table 2 is that the conditional test appears to exacerbate differences between the
two Prizes, with no apparent winning effect visible for the Physics Prize. Again, however,
it is worth treating this apparent finding with caution as the Physics and Chemistry sub-
samples are heterogeneous in many respects.
The three scientists still alive have a current average age of 90.7 years. It is a
simplification to assume that all die in 2006. Were we to assume that all three lived to
100, the conditional estimate for the full sample falls to 0.27. Were they to live to 110 it
falls again to 0.19, but nevertheless remains positive. Since all three are chemists, the
0.04 years of the Physics test is unaffected. One of the scientists is German, but is not
matched to any German winner by the grouping algorithm, so the German result of 1.30
years is unaffected. Another of the scientists is American. Were he to live even to 110,
we still estimate a 1.87 year difference for the USA. We conclude that our qualitative
conclusions are robust to reasonable assumptions concerning the lifespans of those
scientists still alive.
Given the amount of noise in lifespan data, the size of sample, and the relatively small
effect we are trying to isolate, we would not expect to find statistical significance at
conventional levels from such a test. Nevertheless, the fact that the conditional matching
test yields positive estimates from the full sample and all the main sub-samples, with the
estimates in the most homogeneous sub-samples being the highest, is suggestive.
The `All' result of one-third of a year from winning a Nobel Prize is probably too low.
When Americans are matched with fellow Americans, Germans with Germans, and EU
scientists with others from the EU, the longevity effects of winning are between two-
thirds of a year and 2 years. However, it is true to say that the non-parametric tests
considered here are not capable of providing precise measures of the degree to which
winners out-live nominees. In the next section we address this issue.
14
4 Semi-Parametric Analysis
We now estimate a hazard model to the data. The advantage of this approach over that of
the previous section is that we can produce estimates of the effect of longevity from
winning a Nobel Prize in an environment where we control for confounding influences,
including the possibility that there might exist important sources of status other than
winning a Nobel Prize.
The workhorses of much survival analysis in economics are the Mixed Proportional
Hazards (MPH) model and the Proportional Hazards (PH) model. They represent a
compromise between possibly over-specified fully parametric forms and the non-
parametric approaches discussed in the previous section. The MPH model includes the
PH as a special case, but has the advantage of allowing for unobserved heterogeneity at
the cost of an additional parameter. We estimate both models and perform a Likelihood
Ratio Test of the additional value of the extra heterogeneity parameter versus the PH
model. For each regression equation, we find that the additional Likelihood between the
MPH and PH models is insufficient to justify the additional parameter. We therefore
present results for the more parsimonious PH model. The proportionality assumption
maintained in the PH model cannot be rejected based on a global test using the unscaled
Schoenfeld residuals, or from tests on the individual covariates. Analysis of the Cox-
Snell residuals suggests that the PH model provides a good overall fit to the data.
In the first instance we measure time from the date of birth, thereby conforming the
analysis to that of longevity. In choosing the covariates we control for systematic
differences between winners and nominees on dimensions that are possible sources of
status (other than from winning a Nobel Prize). It might be that being a successful
scientist over a prolonged period is an important source of status independent of winning
the Prize. This would produce confounding influences since winners are nominated over
1.8 times more years than nominees (Table 1). We therefore include as a covariate the
number of distinct years each scientist was nominated for either of the two Prizes: the
idea being that scientists were at the top of their respective fields during the period in
15
which they received nominations. The measure does not work well with respect to
winners as they typically cease to be nominated after winning the Prize. Nevertheless, if
time at or near the top is what is important, we would expect this to show up in an
analysis of the nominees alone.
A second variable we include is an individual's age at first nomination, for this could
influence our results in a number of ways. On the one hand, in essentially all professions,
those who rise fastest are regarded highly, and therefore enjoy high social status. The
ability to reach the top early in life may also be an indicator of underlying genetic
qualities. Alternatively, it may be that there is adaptation over time to boosts to status. It
might be better to boost status later in life, at a time when resistance to disease would be
more valuable. Again, risk of confounding arises since winners are first nominated almost
ten years younger than nominees (Table 1). In addition to these controls, we allow for
systematic differences between the two Prizes by defining the dummy variable
'Chemistry' that takes a value of one for scientists nominated in the Chemistry Prize. We
include dummies for country-specific effects.
Finally, within the regression context we must still deal with the issue of reverse
causality. This is done by using time-dependent covariates within the PH model.
Specifically, we estimate a model in which there is a step function for winning a Nobel
Prize, such that a scientist is coded as a nominee until they win the Prize, and as a winner
thereafter.
4.1 Results
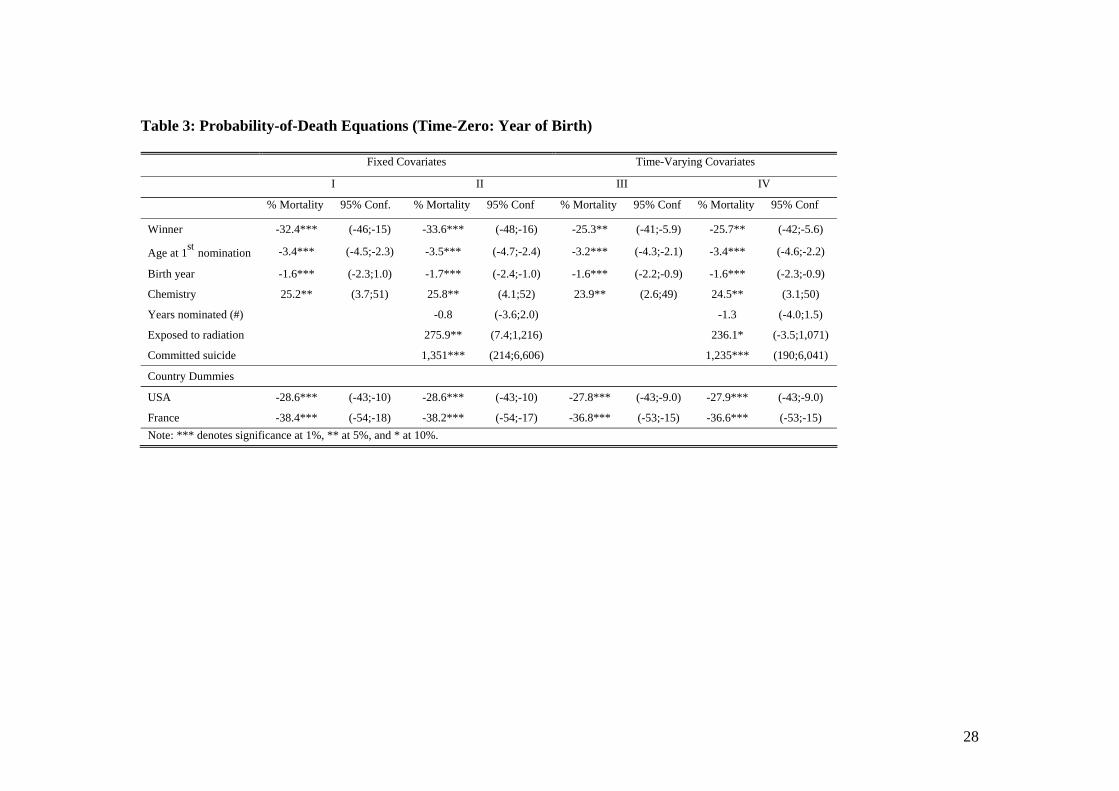
Table 3 contains the results when time-zero is the year of birth. We term the analyses in
Table 3 as `probability-of-death' equations, which, while not literally accurate, is to make
clear that negative entries are associated with longer observed lifespans, while positive
entries are associated with shorter observed lifespans. More precisely, the columns
marked `% Mortality' show the percentage change in the relative mortality rate associated
with a given covariate.
16
In regression I, winning a Nobel Prize is associated with a 32% decline in relative
mortality. The comparable analysis of Oscar winners and nominees by Redelmeier &
Singh (2001a) reported a 24-25% decline in relative mortality. Estimation of the baseline
survival function allows us to convert these estimates into differences in expected
lifespan. Doing this, the implied difference in years of life between winners and nominees
is 3.6 years (78.7 v. 75.2). Consistent with expectation, we find evidence of increasing
life expectancy across the period of the sample, equivalent to a decline in relative
mortality of 1.6%. Paralleling the findings of Table 1, we also find an increased mortality
risk associated with chemists relative to physicists, although we are unsure as to why.
Age at first nomination is also found to be a strong predictor of longevity, with those
older at first nomination living longer. However, interpreting this latter finding causally is
dangerous.
In regression II we add the `years nominated (#)' covariate and additional controls. The
`exposed to radiation' dummy is for three scientists (Henri Becquerel, Frederic Joliot &
Wilhelm Rontgen) who are known to have been exposed to harmful amounts of radiation
in the course of their research, at a time when the health effects of doing so were not fully
understood. Two other prominent scientists (Marie and Pierre Curie) would also have
entered this category were they not excluded on other grounds. We also know that at least
two outliers in our data are scientists who committed suicide (Hans Fischer and Rudolf
Schoenheimer). We decided that scientists who were exposed to radiation and who
committed suicide should not be excluded from the analysis: in the case of suicide the
cause of death cannot be assumed exogenous to the individual, while the extent to which
radiation shortened the lives of particular scientists can only be guessed at, not proved.
Nevertheless, it would be disconcerting if our results hinged on such factors, so we test
for such a possibility. In Regression II, eliminating such scientists increases slightly our
estimate of the effect of winning, though has little effect on the confidence intervals.
Estimates for the other parameters are relatively unchanged. The number of years a
scientist was nominated appears to be associated with small reductions in relative
mortality risk, but the effect falls short of conventional significance levels.
17
Regressions III and IV are analogous to I and II, but now we adjust for the bias caused by
reverse causality by specifying the winner covariate as a time-dependent step-function.
The effect of this change is to reduce the estimated drop in relative mortality of winning
from 32.4% to 25.3%. The co-efficient is sufficiently well estimated for this to be
significant at the 5% level. Redelmeier & Singh (2001a) estimate a 20% relative
reduction for Oscar winners and nominees with a time-varying step function. Converting
our finding into life expectancy, we obtain a difference of 2.6 years (77.7 v. 75.1)
between winners and nominees. There appear to be few differences in the estimation of
the remaining variables relative to the analysis with fixed covariates. Regression IV
shows that these qualitative conclusions continue to hold in the presence of further
controls.
The positive co-efficient estimated on the `Age at first nomination' covariate contains a
possible upward bias due to endogeneity effects. Furthermore, we know from Table 1 that
winners are around 10 years younger than nominees at first nomination, so would be
expected to have shorter lifespans than nominees. Since winners actually live longer than
nominees in the data, this has to accounted for by an upwardly biased Winner co-
efficient.
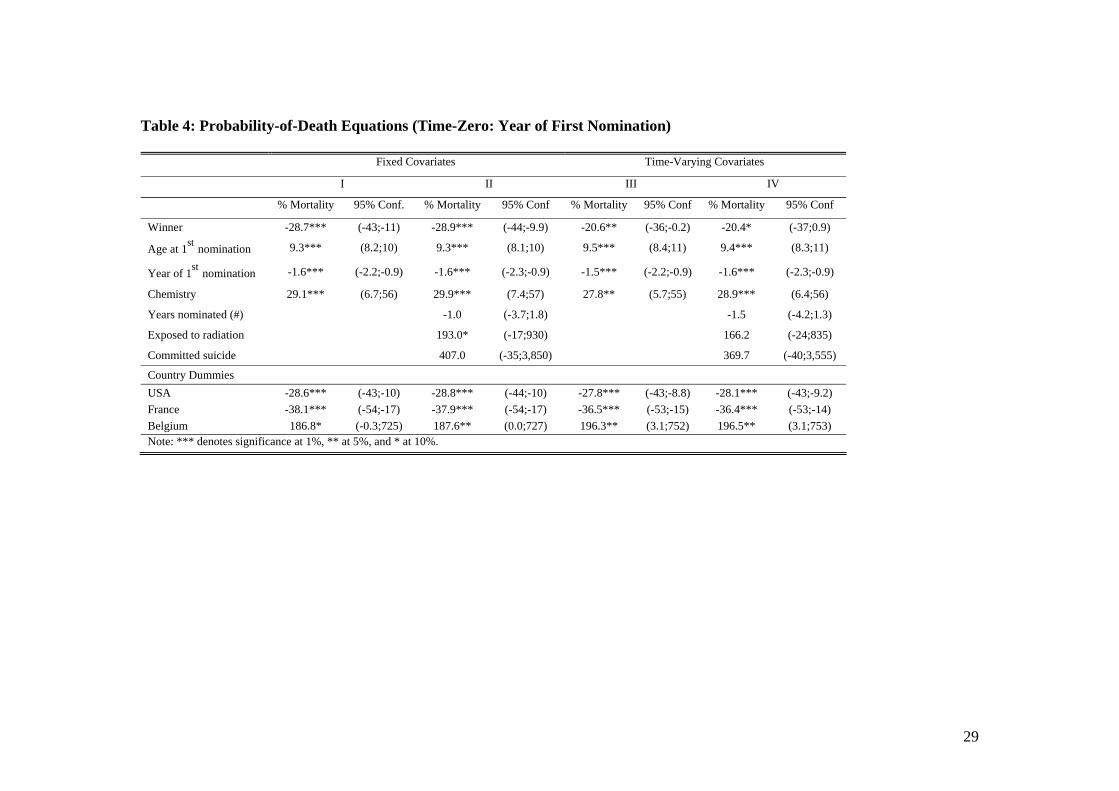
To check for this effect, we re-estimate the PH model, taking the year of first nomination
as time-zero. Results for this test are shown in Table 4. Here, as well as allowing for age
at first nomination, we also allow for the year of first nomination to capture any time
trend due to life expectancy changes or changes in the average age of nominated
scientists. Fixed covariate analysis (I and II) reveals a 28.7% reduction in relative
mortality from winning the Prize. As anticipated, this is lower than the equivalent
estimate taking time-zero as birth. The calculations, though still subject to bias from
reverse causation, suggest that winners live 3.1 years longer than do nominees. Although
a higher age at first nomination is associated with fewer extra years, the 9% increase in
relative mortality is relatively modest, suggesting that years pre first-nomination are not
perfect substitutes with years post first-nomination. Rather, those who are nominated later
18
in life appear to benefit the most in increased longevity.
Turning now to the time-varying covariate approach (regressions III and IV of Table 4),
we estimate a reduction in relative mortality of 20.6% (regression III), which is here
significant at the 5% level. As anticipated, this effect is again smaller than the estimate
obtained taking time-zero as birth. In the final column IV of Table 4, the Winner co-
efficient fractionally drops below significance at the 5% level. The point estimate is
effectively the same as that in the previous equation, and the case for including the three
extra controls is arguably weak as none approaches conventional significance levels.
Calculating the implied longevity differences yields the result that winners live 2.15 years
longer than do nominees. The analyses of Redelmeier & Singh (2001a,b) do not perform
this test and therefore do not allow fully for possible reverse causality and endogeneity
biases. Indeed Sylvestre et al. (2006) recalculate Redelmeier & Singh’s (2001a) result on
Oscar winners, allowing for such potential biases, and reach the finding that their 3.6 year
estimate becomes closer to one year, and not significantly different from zero at the 95%
confidence level.
4.2 Winners, Nominees, and Money
Breaking the sample down into winners and nominees allows a test of further hypotheses.
First, one possible reason why the `years nominated (#)' covariate may appear
insignificant in the pooled analysis is that winners cease being nominated after winning
the Prize. Nevertheless, were a prolonged period of nominations an important source of
status we would expect this to be evident when analyzing the nominees separately.
Second, it is interesting to examine whether the economic boost from winning a Nobel
Prize may be a source of improved longevity (by the nature of their data Redelmeier &
Singh were unable to explore the role of money). Although winners do donate a
proportion of their prize-money, we can be reasonably sure that winning a Nobel Prize
never harms the bank balance. Our approach is to test for a relationship between the real
value of the Nobel prize-money and longevity of its recipients. The null hypothesis is that
19
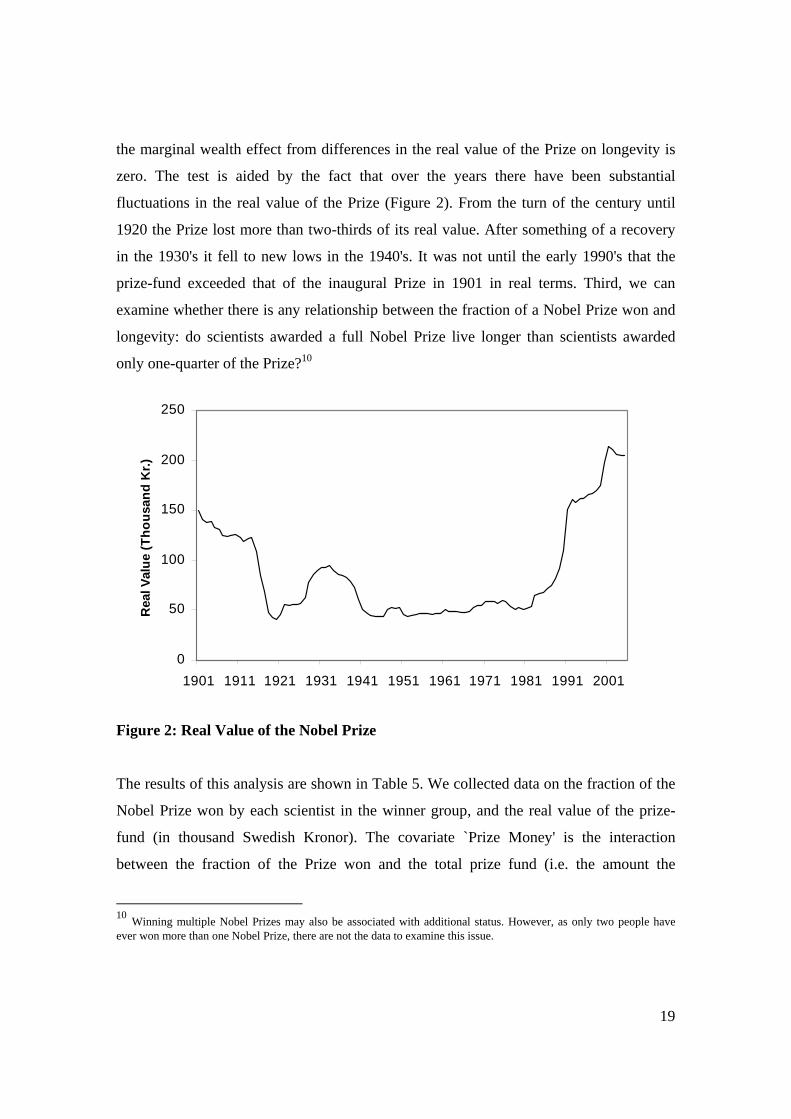
the marginal wealth effect from differences in the real value of the Prize on longevity is
zero. The test is aided by the fact that over the years there have been substantial
fluctuations in the real value of the Prize (Figure 2). From the turn of the century until
1920 the Prize lost more than two-thirds of its real value. After something of a recovery
in the 1930's it fell to new lows in the 1940's. It was not until the early 1990's that the
prize-fund exceeded that of the inaugural Prize in 1901 in real terms. Third, we can
examine whether there is any relationship between the fraction of a Nobel Prize won and
longevity: do scientists awarded a full Nobel Prize live longer than scientists awarded
only one-quarter of the Prize?10
0
50
100
150
200
250
1901 1911 1921 1931 1941 1951 1961 1971 1981 1991 2001
Rea
l Val
ue (T
hous
and
Kr.)
Figure 2: Real Value of the Nobel Prize
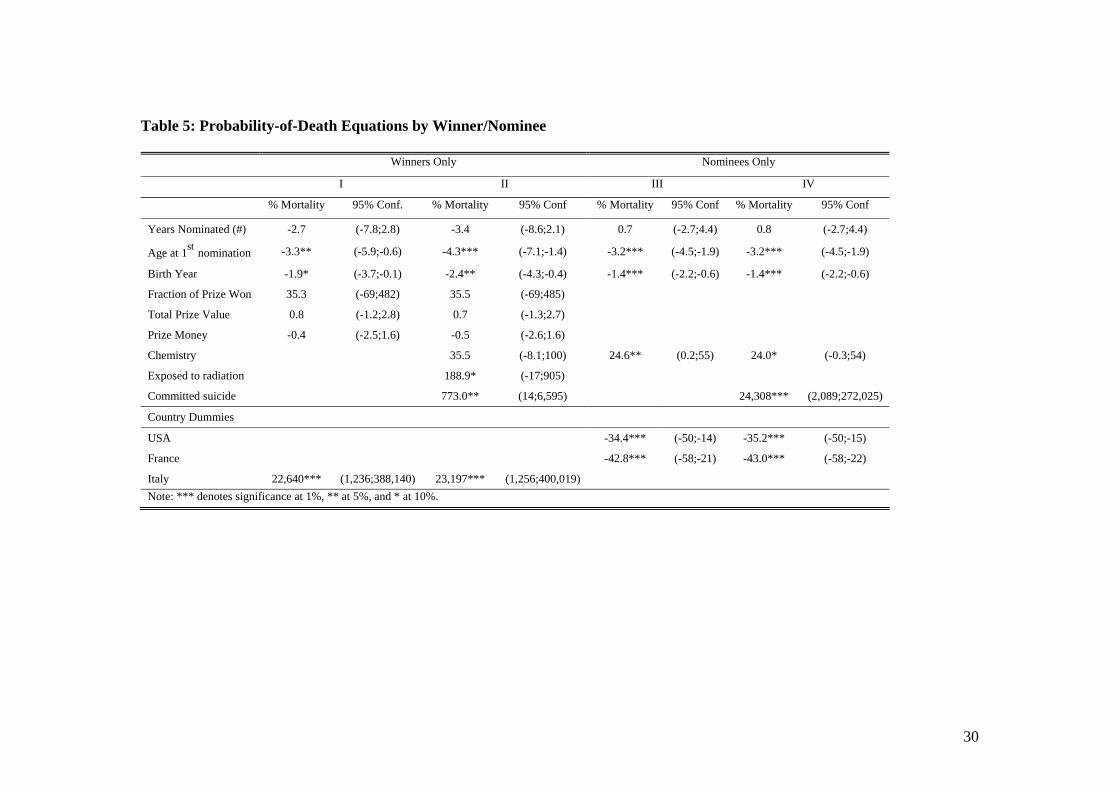
The results of this analysis are shown in Table 5. We collected data on the fraction of the
Nobel Prize won by each scientist in the winner group, and the real value of the prize-
fund (in thousand Swedish Kronor). The covariate `Prize Money' is the interaction
between the fraction of the Prize won and the total prize fund (i.e. the amount the
10 Winning multiple Nobel Prizes may also be associated with additional status. However, as only two people have ever won more than one Nobel Prize, there are not the data to examine this issue.
20
scientist actually received). Regression I in Table 5 shows that, amongst the winners, age
at first nomination is a statistically significant predictor of longevity, with an implied
reduction in relative mortality of around 3%. However, this conclusion must again be
treated with caution due to endogeneity bias. Nevertheless, this result, and those in
previous sections, suggests to us that the weight of evidence favors the position that those
who enter the fray later reap greater rewards in longevity. The fraction of the Prize won is
poorly determined but, if anything, enters with an unexpected sign that implies that the
higher the fraction, the higher the mortality risk. However, even were this effect
statistically significant, it would not constitute decisive evidence against the importance
of pure status, as arguably there is no important status difference for outright as opposed
to shared winners: scientists who win any fraction of a Nobel Prize are in common
parlance said to have won a Nobel Prize.
Importantly, there is no statistically discernible relationship between either the real value
of the total prize fund or the real value of the amount received by the individual scientist.
The finding is compatible with existing evidence, presented in the Introduction, on the
apparently weak role of income and wealth in explaining health outcomes.
Turning to nominees (regressions III and IV of Table 5), we find no effect of the number
of years of nominations on longevity. This is consistent with the result of Redelmeier &
Singh (2001a), who show that controlling for exposures that cumulate over time, such as
total films, and total nominations, has a negligible impact on their estimate of the
longevity effect of winning an Oscar. The positive co-efficient implies that, if anything,
more years of nominations are associated with shorter lifespans. Perhaps consistent with
this, some research in social psychology suggests that the well-being of those who just
miss out on a prize is reduced by the tendency to think about what might have been
(Medvec, Gilovich & Madey, 1995).
This paper might be viewed as an attempt to move forward from the contradictory Oscar
results of Redelmeier & Singh (2001a,b) and Miskie et al (2003). Redelmeier & Singh's
(2001b) own account of their mixed findings rests upon the idea that behavioral factors
21
may be obscuring the underlying effect of social status on longevity: while actors are
highly visible and must preserve their image, screenwriters live a life of anonymity,
which permits a far wider range of behavior. There seems reason to be cautious of such
an explanation, however, for the average estimated lifespan of all screenwriters (both
winners and nominees) exceeds the equivalent estimate for all actors (76.9 v. 76.8), and
the theory does not explain why Oscar-winning screenwriters supposedly engage in
behavior more deleterious to health than do other screenwriters. Nevertheless, were
behavioral influences the true culprit, we would argue that our study is less susceptible to
such factors. So far as we know, academics are not renowned for the mixture of drugs,
drink, sex, violence, monstrous egos, gangsterism, speed, and madness that Davey Smith
(2001) argues characterizes the lives of Hollywood directors.
5 Conclusion
This paper finds that Nobel Prize winners go on to have longer lives than scientists who
are merely nominated. Although it seems sensible to treat our results cautiously, they are
consistent with some form of link between status and longevity. We considered a sample
of 524 of the world's top scientists from the first half of the 20th century. These scientists
made contributions of such significance to their disciplines that they were nominated at
least once for the Nobel Prizes in either Physics or Chemistry. We set ourselves the
seemingly demanding task of finding a systematic difference in the longevity between
scientists who had actually won the Nobel Prize and those who had only been
nominated.11
Two forms of empirical test are explored in the paper. First, the simplest evidence comes
from within-country matched tests. These are done by pairing winners with nominees
drawn solely from the same nation or group. Our matched nominees were born in
approximately the same year as the winning scientist and were alive when their matched
winner was awarded the Prize. For the USA, for example, Nobel Prize winners live 2.08
11 It is perhaps worth recording that when we began this exercise we were doubtful that, once corrections had been made, there would be a discernible effect in the data.
22
years longer than matched American nominees. For Germany, the figure is an extra 1.30
years of life. For Europeans, it is 0.69 years.
Second, semi-parametric Cox survival estimations are used. After controlling for other
factors -- most significantly the possibility of reverse causation from longevity to winning
a Nobel Prize -- the paper’s best estimate is that winners live approximately two years
longer than do nominees. Tests amongst the winners reveal no relationship between the
real value of the Prize and longevity. Status, rather than money, appears to be responsible
for our effect.
It might be argued that an approximately two-year gain in lifespan from winning a Nobel
Prize is a small number of extra years. However, the controls here are extraordinarily
successful scientists. By any usual standard, all are high-status individuals. If the idea that
social status improves lifespan is truly correct, the size of the effect may in a practical
sense be larger in a more normal population of people.
23
References Adams, P., M.D. Hurd, D. McFadden, A. Merrill & T. Ribeiro (2003): Healthy, Wealthy,
and Wise? Tests for Direct Causal Paths Between Health and Socioeconomic Status, Journal of Econometrics 112, 3-56.
Adda, J., T. Chandola & M.G. Marmot (2003): Socio-economic Status and Health: Causality and Pathways, Journal of Econometrics 112, 57-63.
Adler, N.E., T. Boyce, M.A. Chesney, S. Cohen, S. Folkman, R.L. Kahn & S.L. Syme (1993): Socioeconomic Status and Health: The Challenge of the Gradient, American Psychologist 49, 15-24.
Adler, N.E. & J.M. Ostrove (1999): Socioeconomic Status and Health: What We Know and What We Don't, Annals of the New York Academy of Sciences 896, 3-15.
Ball, S., C. Eckel, P.J. Grossman & W. Zame (2001): Status in Markets, Quarterly Journal of Economics 116(1), 161-188.
Becker, G.S., K.M. Murphy & I. Werning (2005): The Equilibrium Distribution of Income and the Market for Status, Journal of Political Economy 113(2), 282-310.
Clark, A.E. & A.J. Oswald (1998): Comparison-Concave Utility and Following Behaviour in Social and Economic Settings, Journal of Public Economics, 70, 133-150.
Cox, D.R. (1972): Regression Models and Life Tables, Journal of the Royal Statistical Society Series B 34, 187-220.
Crawford, E. (2002): The Nobel Population 1901-1950: A Census of the Nominators and Nominees for the Prizes in Physics and Chemistry, Universal Academy Press, Tokyo.
Cutler, D., A. Deaton, & A. Lleras-Muney (2006): The Determinants of Mortality, Journal of Economic Perspectives 20(3), 97-120.
Davey Smith, G. (2001): Death in Hollywood: Any Relation Between Self Worth and Mortality is Uncertain, British Medical Journal 323, 1441-1442.
Deaton, A. (2003): Health, Inequality, and Economic Development, Journal of Economic Literature 41(1), 113-158.
Falk, A, B.S. Hanson, S.O. Isacsson & P.O. Ostergren (1992): Job Strain and Mortality in Elderly Men: Social Network, Support, and Influence as Buffers, American Journal of Public Health 82(8), 1136-1139.
Ferrie, J.E., M.J. Shipley, G. Davey Smith, S.A. Stansfeld & M.G. Marmot (2002): Change in Health Inequalities Among British Civil Servants: the Whitehall II Study, Journal of Epidemiology and Community Health 56, 922-926.
Fershtman, C., K.M. Murphy & Y. Weiss (1996): Social Status, Education and Growth, Journal of Political Economy 104, 108-132.
Frank, R.H. (1985): The Demand for Unobservable and Other Nonpositional Goods, American Economic Review 75, 101-116.
Frey, B.S. (2005): Knight Fever: Towards An Economics of Awards, CESifo Working Paper 1468.
Frijters, P., J.P. Haisken-DeNew, & M.A. Shields (2005a): Socio-Economic Status, Health Shocks, Life Satisfaction and Mortality: Evidence from an Increasing Mixed Proportional Hazards Model, Discussion Paper 496, Centre for Economic Policy Research, Australian National University.
Frijters, P., J.P. Haisken-DeNew, & M.A. Shields (2005b): The Causal Effect of Income
24
on Health: Evidence from German Reunification, Journal of Health Economics 24, 997-1017.
Gardner, J. & A.J. Oswald (2004): How is Mortality Affected by Money, Marriage, and Stress?, Journal of Health Economics 23, 1181-1207.
Gravelle, H. & M. Sutton (2006): Income, Relative Income, and Self-Reported Health in Britain 1979-2000. University of York, CHE Research Paper 10.
Johnson, J.V. & E.M. Hall (1988): Job Strain, Work Place, Social Support and Cardiovascular Disease: A Cross-Sectional Study of a Random Sample of the Swedish Working Population, American Journal of Public Health 78(10), 1336-1342.
Karasek, R. & T. Theorell (1990): Healthy Work: Stress, Productivity and the Reconstruction of Working Life, Basic Books, New York.
Kitagawa, E.M. & P.M. Hauser (1973): Differential Mortality in the United States: A Study in Socioeconomic Epidemiology, Harvard University Press, Cambridge MA.
Kunz-Ebrecht, S.R., C. Kirschbaum & A. Steptoe (2004): Work Stress, Socioeconomic Status and Neuroendocrine Activation over the Working Day, Social Science and Medicine 58, 1523-1530.
Layard, R. (1980): Human Satisfactions and Public Policy, Economic Journal 90, 737-750.
Lleras-Muney, A. (2005): The Relationship Between Education and Adult Mortality in the United States, Review of Economic Studies 72(1), 189-221.
Luft, H.S. (1975): The Impact of Poor Health on Earnings, Review of Economics and Statistics, 57(1), 43-57.
Marmot, M.G. (2004): The Status Syndrome: How Social Standing Affects Our Health and Longevity, Owl Books, New York.
Marmot, M.G., G. Rose & P.J.S. Hamilton (1978): Employment Grade and Coronary Heart Disease in British Civil Servants, Journal of Epidemiology and Community Health 32(4), 244-249.
Marmot, M.G. & M.J. Shipley (1996): Do Socioeconomic Differences in Mortality Persist After Retirement? 25 Year Follow Up of Civil Servants from the First Whitehall Study, British Medical Journal 313, 1177-1180.
Marmot, M.G., M.J. Shipley & G. Rose (1984): Inequalities in Death -- Specific Explanations of a General Pattern?, Lancet 323, 1003-1006.
Marmot, M.G., G. Davey Smith, S. Stansfeld, C. Patel, F. North, J. Head, I. White, E. Brunner & A. Feeney (1991): Health Inequalities Among British Civil Servants: the Whitehall II Study, Lancet 337, 1387-1393.
Medvec, V.H., T. Gilovich & S.F. Madey (1995): When Less is More - Counterfactual Thinking and Satisfaction among Olympic Medalists, Journal of Personality and Social Psychology 69(4), 603-610.
Meer, J., D. Miller & H. Rosen (2003): Exploring the Health-Wealth Nexus, Journal of Health Economics 22, 713-730.
Miskie, B., S. Near & R. Hegele (2003): Survival in Academy Award-Winning Actors and Actresses, Annals of Internal Medicine 138(1), 77-78.
Miller, D.L., & C. Paxson (2006): Relative Income, Race, and Mortality, Journal of Health Economics 25(5), 979-1003.
Oswald, A.J., & N. Powdthavee (2007): Obesity, Unhappiness, and the Challenge of Affluence: Theory and Evidence, Economic Journal, forthcoming.
25
Poggendorff, J.C. (1863): Biographisch-Literarisches Handwö rterbuch der Exakten Naturwissenschaften, Johann Ambrosius Barth, Leipzig.
Putnam, R.D. (2000): Bowling Alone: The Collapse and Revival of American Community, Simon & Schuster, New York.
Rablen, M.D. (2006): Relativity, Rank and the Utility of Income, University of Warwick working paper; Economic Journal, forthcoming.
Redelmeier, D.A. & S.M. Singh (2001a): Survival in Academy Award-Winning Actors and Actresses, Annals of Internal Medicine 134, 955-962.
Redelmeier, D.A. & S.M. Singh (2001b): Longevity of Screenwriters Who Win an Academy Award: Longitudinal Study, British Medical Journal 323, 1491-1496.
Reid, D.D., G.Z. Brett, P.J.S. Hamilton, R.J. Jarrett, H. Keen & G. Rose (1974): Cardiorespiratory Disease and Diabetes Among Middle-Aged Male Civil Servants: A Study of Screening and Intervention, Lancet 303, 469-473.
Sapolsky, R. (1993): Endocrinology Alfresco: Psychoendocrine Studies of Wild Baboons, Recent Progress in Hormone Research 48, 437-468.
Shively, C.A. (2000): Social Status, Stress and Health in Female Monkeys, in A.R. Tarlov & R.F St Peter (Eds.), The Society and Population Health Reader - A State and Community Perspective, The New Press, New York.
Smith, J.P. (1998): Socioeconomic Status and Health, American Economic Review 88(2), 192-196.
Smith, J.P. (1999): Healthy Bodies and Thick Wallets: The Dual Relation Between Health and Economic Status, Journal of Economic Perspectives 13(2), 145-166.
Smith, J.P. (2005): Unraveling the SES-Health Connection, Population & Development Review 30, 108-132.
Snyder, S.E. & W.N. Evans (2006): The Effect of Income on Mortality: Evidence from the Social Security Notch, Review of Economics and Statistics 88(3), 482-495.
Stansfeld, S.A., J. Head, R. Fuhrer, M.J. Shipley & M.G. Marmot (1999): Work Characteristics Predict Psychiatric Disorder: Prospective Results from the Whitehall II Study, Occupational and Environmental Medicine 15, 302-307.
Steptoe, A., S. Kunz-Ebrecht, N. Owen, P.J. Feldman, A. Rumley, G.D.O. Lowe & M.G. Marmot (2003a): Influence of Socioeconomic Status and Job Control on Plasma Fibrogen Responses To Acute Mental Stress, Psychosomatic Medicine 65(1), 137-144.
Steptoe, A., S. Kunz-Ebrecht, N. Owen, P.J. Feldman, G. Willemsen, C. Kirschbaum & M.G. Marmot (2003b): Socioeconomic Status and Stress-Related Biological Responses Over the Working Day, Psychosomatic Medicine 65(3), 461-470.
Steptoe, A. & M.G. Marmot (2005): Socioeconomic Status and Coronary Heart Disease: A Psychobiological Perspective. In L.J. White (Ed.), Aging, Health and Public Policy, Population Council, New York.
Sylvestre, M.P., E. Huszti & J.A. Hanley (2006): Do Oscar Winners Live Longer Than Less Successful Peers? A Re-analysis of the Evidence, Annals of Internal Medicine 145(5), 361-363.
Van Rossum, C.T.M., M.J. Shipley, H. Van de Mheen, D.E. Grobbee & M.G. Marmot (2000): Employment Grade Differences in Cause Specific Mortality. A 25 Year Follow Up of Civil Servants from the First Whitehall Study, Journal of Epidemiology and Community Health 54(3), 178-184.

26
Weinberg, B.A. & D.W. Galenson (2005): Creative Careers: The Life Cycles of Nobel Laureates in Economics, NBER Working Paper 11799, National Bureau of Economic Research.
Wilkinson, R. (2000): Mind the Gap: Hierarchies, Health and Human Evolution, Weidenfeld & Nicolson, London.
27
Tables
Table 1: Means and Standard Deviations
Table 2: Extra Years of Life from Winning (A Matching Test) Window
(Years) Matched
Winners (#) Conditional Test
Diff. (Years) Unconditional Test Diff.
(Years) USA* 3 30 2.08 4.64 Germany* 3 38 1.30 2.45 EU* 5 102 0.69 1.36 All 3 135 0.33 1.38
⎟⎠⎞⎜
⎝⎛
y nationalit swinner'ofonly are controls
*All 13 125 0.99 -
Physics* 3 77 0.04 0.83 Chemistry* 5 79 1.35 2.75 * Each winner is matched only with controls from the same nationality, continent or scientific discipline as specified.
Characteristics Winners(n = 135)
Nominees(n = 389)
Chemistry(n = 296)
Physics (n = 262)
Mean year of birth 1881 (19.4)
1875 (21.3)
1876 (21.1)
1876 (21.1)
Mean lifespan 77.16 75.80 75.62 76.51 Mean age at first nomination 43.36
(9.12) 53.14 (12.4)
51.77 (12.7)
48.52 (12.0)
Mean age of winning 50.76 (10.2)
N/A 52.56 (9.47)
48.74 (10.4)
Mean number of years nominated 5.32 (3.95)
2.93 (3.27)
3.43 (3.68)
4.08 (3.90)
US nationality (%) 22.2 26.0 24.7 24.8 European nationality (%) 74.8 70.0 72.6 70.2
28
Table 3: Probability-of-Death Equations (Time-Zero: Year of Birth) Fixed Covariates Time-Varying Covariates
I II III IV
% Mortality 95% Conf. % Mortality 95% Conf % Mortality 95% Conf % Mortality 95% Conf
Winner -32.4*** (-46;-15) -33.6*** (-48;-16) -25.3** (-41;-5.9) -25.7** (-42;-5.6)
Age at 1st nomination -3.4*** (-4.5;-2.3) -3.5*** (-4.7;-2.4) -3.2*** (-4.3;-2.1) -3.4*** (-4.6;-2.2)
Birth year -1.6*** (-2.3;1.0) -1.7*** (-2.4;-1.0) -1.6*** (-2.2;-0.9) -1.6*** (-2.3;-0.9)
Chemistry 25.2** (3.7;51) 25.8** (4.1;52) 23.9** (2.6;49) 24.5** (3.1;50)
Years nominated (#) -0.8 (-3.6;2.0) -1.3 (-4.0;1.5)
Exposed to radiation 275.9** (7.4;1,216) 236.1* (-3.5;1,071)
Committed suicide 1,351*** (214;6,606) 1,235*** (190;6,041)
Country Dummies USA -28.6*** (-43;-10) -28.6*** (-43;-10) -27.8*** (-43;-9.0) -27.9*** (-43;-9.0)
France -38.4*** (-54;-18) -38.2*** (-54;-17) -36.8*** (-53;-15) -36.6*** (-53;-15) Note: *** denotes significance at 1%, ** at 5%, and * at 10%.
29
Table 4: Probability-of-Death Equations (Time-Zero: Year of First Nomination) Fixed Covariates Time-Varying Covariates
I II III IV
% Mortality 95% Conf. % Mortality 95% Conf % Mortality 95% Conf % Mortality 95% Conf
Winner -28.7*** (-43;-11) -28.9*** (-44;-9.9) -20.6** (-36;-0.2) -20.4* (-37;0.9)
Age at 1st nomination 9.3*** (8.2;10) 9.3*** (8.1;10) 9.5*** (8.4;11) 9.4*** (8.3;11)
Year of 1st nomination -1.6*** (-2.2;-0.9) -1.6*** (-2.3;-0.9) -1.5*** (-2.2;-0.9) -1.6*** (-2.3;-0.9)
Chemistry 29.1*** (6.7;56) 29.9*** (7.4;57) 27.8** (5.7;55) 28.9*** (6.4;56)
Years nominated (#) -1.0 (-3.7;1.8) -1.5 (-4.2;1.3)
Exposed to radiation 193.0* (-17;930) 166.2 (-24;835)
Committed suicide 407.0 (-35;3,850) 369.7 (-40;3,555)
Country Dummies USA -28.6*** (-43;-10) -28.8*** (-44;-10) -27.8*** (-43;-8.8) -28.1*** (-43;-9.2) France -38.1*** (-54;-17) -37.9*** (-54;-17) -36.5*** (-53;-15) -36.4*** (-53;-14) Belgium 186.8* (-0.3;725) 187.6** (0.0;727) 196.3** (3.1;752) 196.5** (3.1;753) Note: *** denotes significance at 1%, ** at 5%, and * at 10%.
30
Table 5: Probability-of-Death Equations by Winner/Nominee Winners Only Nominees Only
I II III IV
% Mortality 95% Conf. % Mortality 95% Conf % Mortality 95% Conf % Mortality 95% Conf
Years Nominated (#) -2.7 (-7.8;2.8) -3.4 (-8.6;2.1) 0.7 (-2.7;4.4) 0.8 (-2.7;4.4)
Age at 1st nomination -3.3** (-5.9;-0.6) -4.3*** (-7.1;-1.4) -3.2*** (-4.5;-1.9) -3.2*** (-4.5;-1.9)
Birth Year -1.9* (-3.7;-0.1) -2.4** (-4.3;-0.4) -1.4*** (-2.2;-0.6) -1.4*** (-2.2;-0.6)
Fraction of Prize Won 35.3 (-69;482) 35.5 (-69;485) Total Prize Value 0.8 (-1.2;2.8) 0.7 (-1.3;2.7) Prize Money -0.4 (-2.5;1.6) -0.5 (-2.6;1.6) Chemistry 35.5 (-8.1;100) 24.6** (0.2;55) 24.0* (-0.3;54)
Exposed to radiation 188.9* (-17;905) Committed suicide 773.0** (14;6,595) 24,308*** (2,089;272,025)
Country Dummies USA -34.4*** (-50;-14) -35.2*** (-50;-15)
France -42.8*** (-58;-21) -43.0*** (-58;-22)
Italy 22,640*** (1,236;388,140) 23,197*** (1,256;400,019) Note: *** denotes significance at 1%, ** at 5%, and * at 10%.
Related Documents