कीय भ ू मम जल बोड जऱ संसाधन, नदी विकास और गंगा संरण मंाऱय भारत सरकार Central Ground Water Board Ministry of Water Resources, River Development and Ganga Rejuvenation Government of India AQUIFER MAPPING REPORT Warud and Morshi Talukas, Amravati District, Maharashtra (Part-I) मय े, नागऩ ु र Central Region, Nagpur

Welcome message from author
This document is posted to help you gain knowledge. Please leave a comment to let me know what you think about it! Share it to your friends and learn new things together.
Transcript
कें द्रीय भूमम जल बोर्ड जऱ संसाधन, नदी विकास और गंगा संरक्षण मंत्राऱय
भारत सरकार
Central Ground Water Board Ministry of Water Resources, River Development and Ganga
Rejuvenation Government of India
AQUIFER MAPPING REPORT
Warud and Morshi Talukas, Amravati District,
Maharashtra
(Part-I)
मध्य क्षेत्र, नागऩुर Central Region, Nagpur
भारत सरकार
Government of India
जल संसाधन, नदी विकास एिं गंगा संरक्षण मंत्रालय Ministry of Water Resources, River Development &
Ganga Rejuvenation
केन्द्रीय भूवम जल बोर्ड CENTRAL GROUND WATER BOARD
Report on Aquifer Maps and
Ground Water Management Plans
िरुर् तथा मोर्शी
तालुका, वजला अमरािती,
महाराष्ट्र WARUD AND MORSHI Talukas, AMRAVATI District, Maharashtra
मध्य क्षते्र, नागपरु / Central Region, Nagpur
जून 2017 /June 2017
जलभतृ नक्र्श ेतथा भजूल प्रबंधन योजना पर सवंक्षप्त ररपोर्ड
PART-I
Aquifer Maps And Ground Water Management Plans, Warud And Morshi Taluka, Amravati District, Maharashtra, AAP, 2012-13
PART-I
AQUIFER MAPS AND GROUND WATER MANAGEMENT PLANS,
WARUD AND MORSHI TALUKA, AMRAVATI DISTRICT,
MAHARASHTRA
CONTRIBUTORS’
Principal Authors Dr. Bhushan R. Lamsoge : Senior Hydrogeologist/ Scientist-D J. R. Verma : Scientist-D Kartik P. Dongre : Scientist -C
Supervision & Guidance
D. Subba Rao : Regional Director Dr. P .K. Jain : Supdtg. Hydrogeologist
Hydrogeology, GIS maps and Management Plan
J. R. Verma : Scientist-D Dr. Bhushan R. Lamsoge : Senior Hydrogeologist/ Scientist-D Rahul R. Shende : Assistant Hydrogeologist Kartik P. Dongre : Scientist -C
Groundwater Exploration
Kartik P. Dongre : Scientist -C Vijesh V. K. : Junior Hydrogeologist/ Scientist-B M. R. K. Reddy : Junior Hydrogeologist /Scientist-B Abhay Nivasarkar Junior Hydrogeologist /Scientist-D
Chemical Analysis
Dr. Devsharan Verma : Scientist B (Chemist) Dr. Rajni Kant Sharma : Scientist B (Chemist) T. Dinesh Kumar : Assistant Chemist
Aquifer Maps And Ground Water Management Plans, Warud And Morshi Taluka, Amravati District, Maharashtra, AAP, 2012-13
PART-I
AQUIFER MAPS AND GROUND WATER MANAGEMENT PLANS,
WARUD AND MORSHI TALUKA, AMRAVATI DISTRICT,
MAHARASHTRA
CONTENTS
1 INTRODUCTION ..................................................................................................................... 1 1.1 Objective and Scope ................................................................................................................ 1 1.2 Approach and Methodology .................................................................................................... 2 1.3 Study area ................................................................................................................................ 2 1.4 Data Adequacy and Data Gap Analysis: ................................................................................... 3 1.5 Data Gap Identification ............................................................................................................ 4 1.6 Rainfall And Climate ................................................................................................................. 4 1.7 Physiography ............................................................................................................................ 6 1.8 Geomorphology ....................................................................................................................... 7 1.9 Land Use, Soil, Land Use, Agriculture, Irrigation and Cropping Pattern .................................. 7 1.10 Hydrology and Drainage: ......................................................................................................... 9 1.11 Prevailing Water Conservation and Recharge Practices ........................................................ 10
2 DATA COLLECTION AND GENERATION .................................................................................. 11 2.1 Data Collection and Compilation ........................................................................................... 11 2.2 Data Generation ..................................................................................................................... 11
3 Data Interpretation, Integration and Aquifer Mapping.......................................................... 17 3.1 Geology .................................................................................................................................. 17 3.2 Hydrogeology ......................................................................................................................... 18 3.3 Geophysical Survey (VES) ....................................................................................................... 20 3.4 Ground Water Dynamics ........................................................................................................ 25 3.5 Ground Water Quality ............................................................................................................ 40 3.6 3-D and 2-D Aquifer Disposition ............................................................................................ 43 3.7 Aquifer Characteristics ........................................................................................................... 47
4 Ground Water Resources ..................................................................................................... 52 4.1 Ground Water Resources – Aquifer-I ..................................................................................... 52 4.2 Ground Water Resources – Aquifer-II .................................................................................... 54
5 GROUND WATER RELATED ISSUES ........................................................................................ 55 5.1 Orange/Sweet lime Cultivation as a Cash Crop ..................................................................... 55 5.2 Over Exploitation of Ground Water ....................................................................................... 56 5.3 Limited Aquifer thickness and Water scarcity ....................................................................... 57 5.4 Traditional and Micro Irrigation Techniques ......................................................................... 57
6 MANAGEMENT STRATEGIES ................................................................................................. 59 6.1 Aquifer Management Plan for Warud Taluka ........................................................................ 59 6.2 Aquifer Management Plan for Morshi Taluka ....................................................................... 65 6.3 Sum-up ................................................................................................................................... 67
LIST OF FIGURES Fig. 1.1a & b: Index & Administrative map, Warud and Morshi Taluka, Amravati District ..................... 3
Fig 1.2: Locations of Existing Exploratory Wells and Ground Water Monitoring Wells. ......................... 4
Fig. 1.3: Physiography, Warud and Morshi taluka, Amravati district ...................................................... 6
Aquifer Maps And Ground Water Management Plans, Warud And Morshi Taluka, Amravati District, Maharashtra, AAP, 2012-13
Fig. 1.4: Geomorphology, Warud and Morshi taluka, Amravati district .................................................. 7
Fig. 1.5: Landuse, Warud and Morshi taluka, Amravati district............................................................... 8
Fig. 1.6: Soil, Warud and Morshi taluka, Amravati district ...................................................................... 9
Fig. 1.7: Drainage, Warud and Morshi taluka, Amravati district ........................................................... 10
Fig.2.1: Locations of Exploratory Wells Ground Water Monitoring Wells & VES .................................. 12
Fig.2.2: Locations of Micro Level Hydrogeological Data Acquisition Wells ........................................... 13
Fig.2.3: Soil Infiltration tests Plots, Warud and Morshi taluka, Amravati district. ................................ 17
Fig. 3.1: Geology with basaltic flows, Warud and Morshi taluka, Amravati district .............................. 18
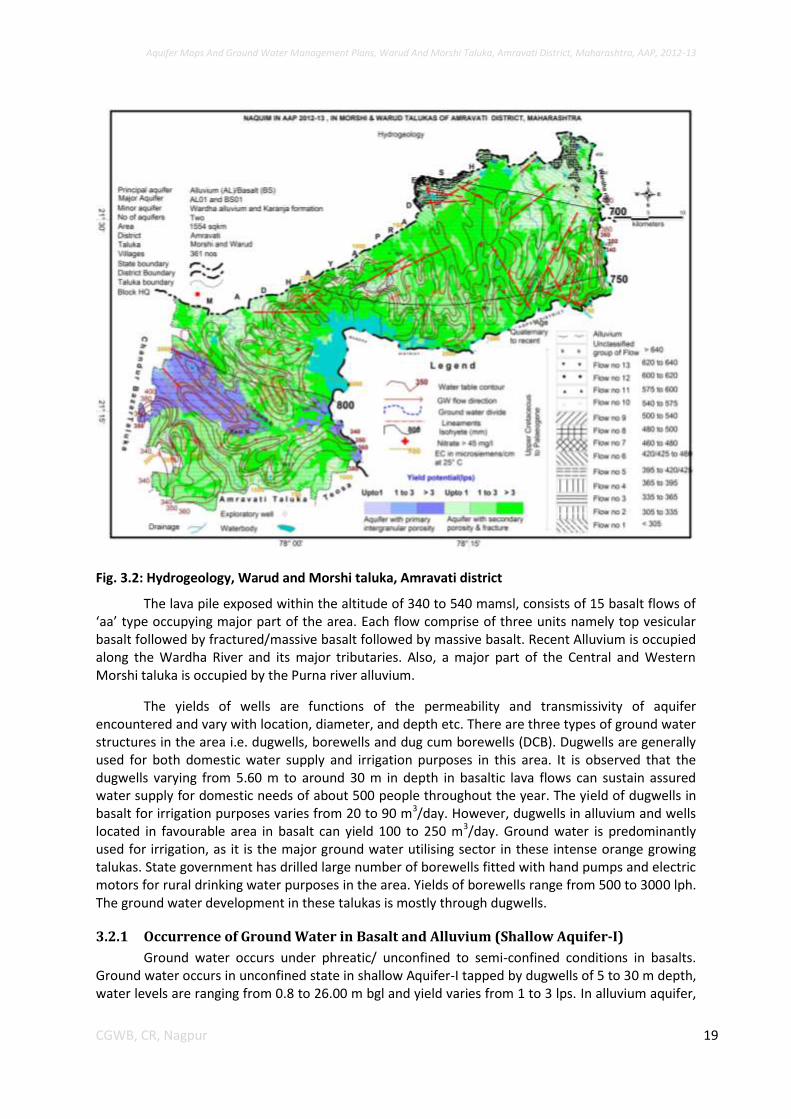
Fig. 3.2: Hydrogeology, Warud and Morshi taluka, Amravati district ................................................... 19
Fig. 3.3: Locations of geophysical surveys (VES), Warud and Morshi taluka, Amravati district ............ 20
Fig. 3.4: Distribution of Resistivity for First Layer .................................................................................. 21
Fig. 3.5: Distribution of Resistivity for Second Layer ............................................................................. 22
Fig. 3.6: Distribution of Resistivity for third Layer ................................................................................. 22
Fig. 3.7: Distribution of Resistivity for forth Layer ................................................................................. 23
Fig. 3.8: Distribution of Resistivity for fifth Layer .................................................................................. 24
Fig. 3.9: Distribution of Transverse Resistance ...................................................................................... 24
Fig. 3.10: Distribution of Longitudinal Conductance ............................................................................. 25
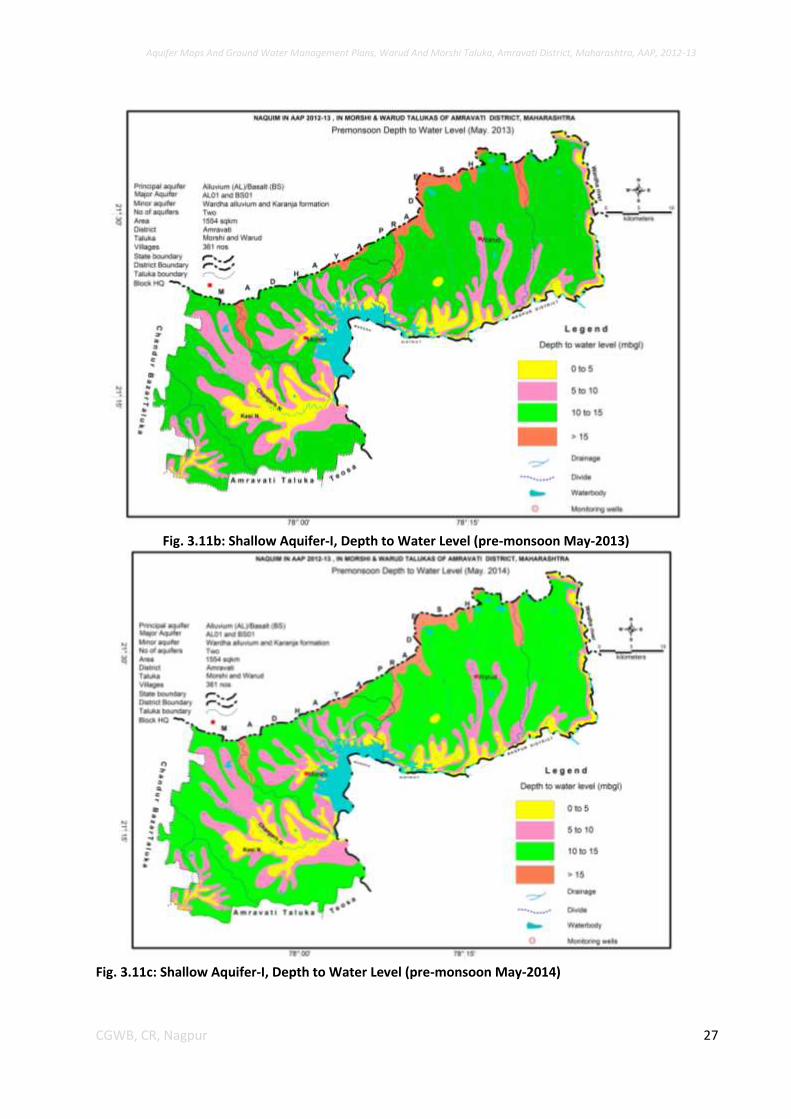
Fig. 3.11b: Shallow Aquifer-I, Depth to Water Level (pre-monsoon May-2013) ................................... 27
Fig. 3.11c: Shallow Aquifer-I, Depth to Water Level (pre-monsoon May-2014) ................................... 27
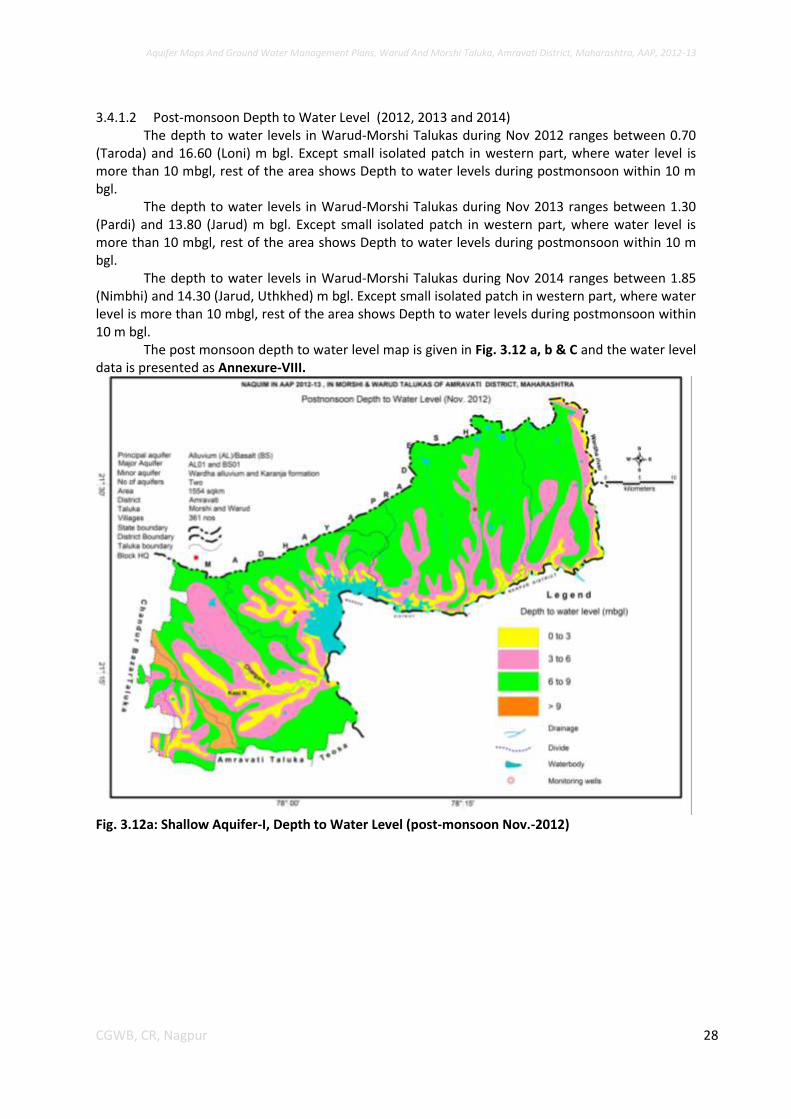
Fig. 3.12a: Shallow Aquifer-I, Depth to Water Level (post-monsoon Nov.-2012) ................................. 28
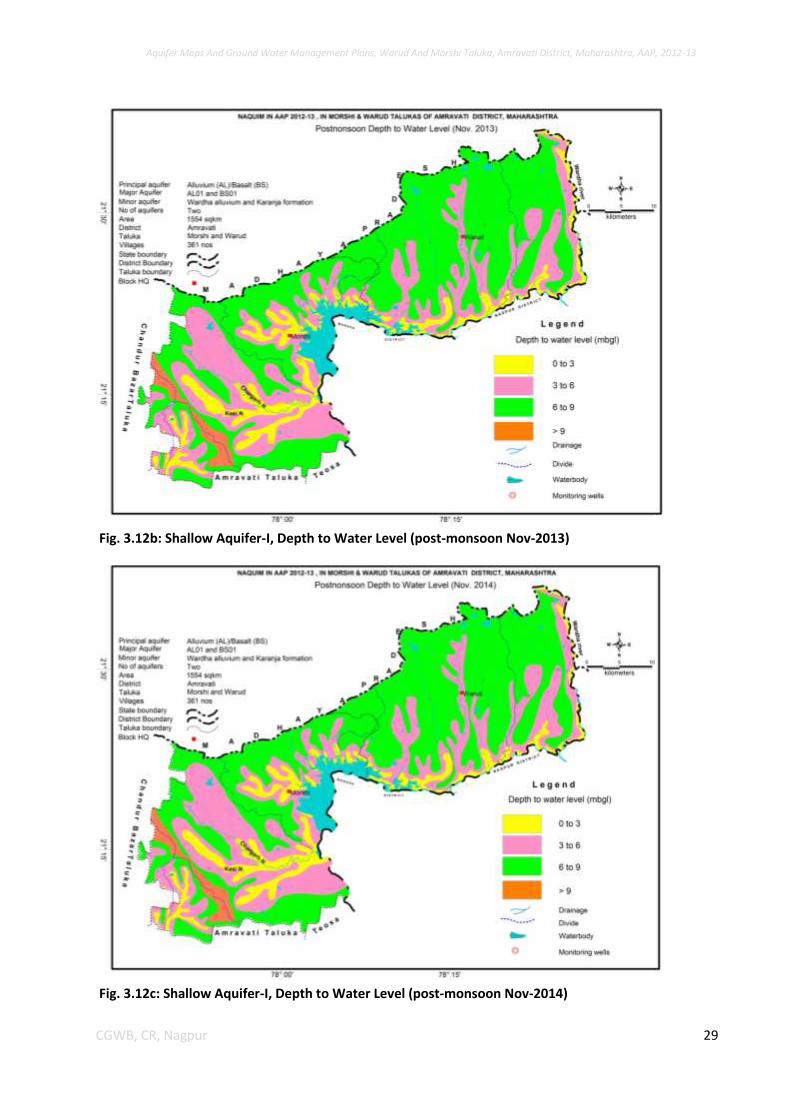
Fig. 3.12b: Shallow Aquifer-I, Depth to Water Level (post-monsoon Nov-2013) .................................. 29
Fig. 3.12c: Shallow Aquifer-I, Depth to Water Level (post-monsoon Nov-2014) .................................. 29
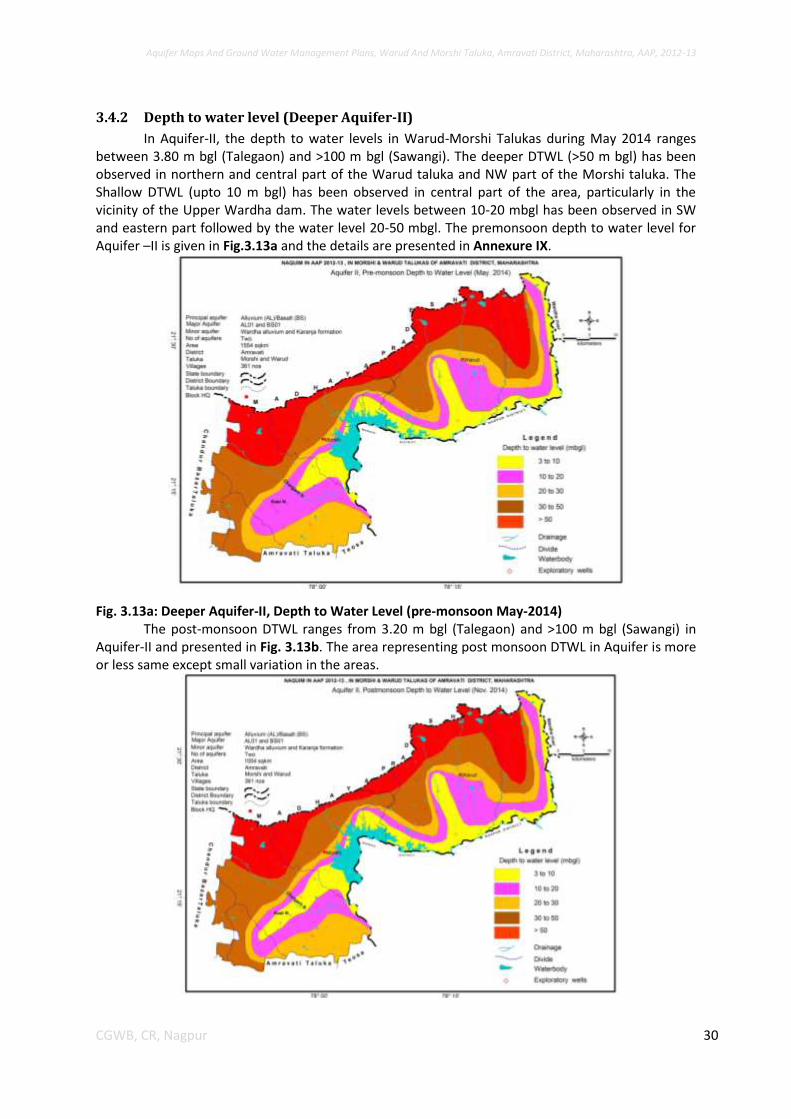
Fig. 3.13a: Deeper Aquifer-II, Depth to Water Level (pre-monsoon May-2014) ................................... 30
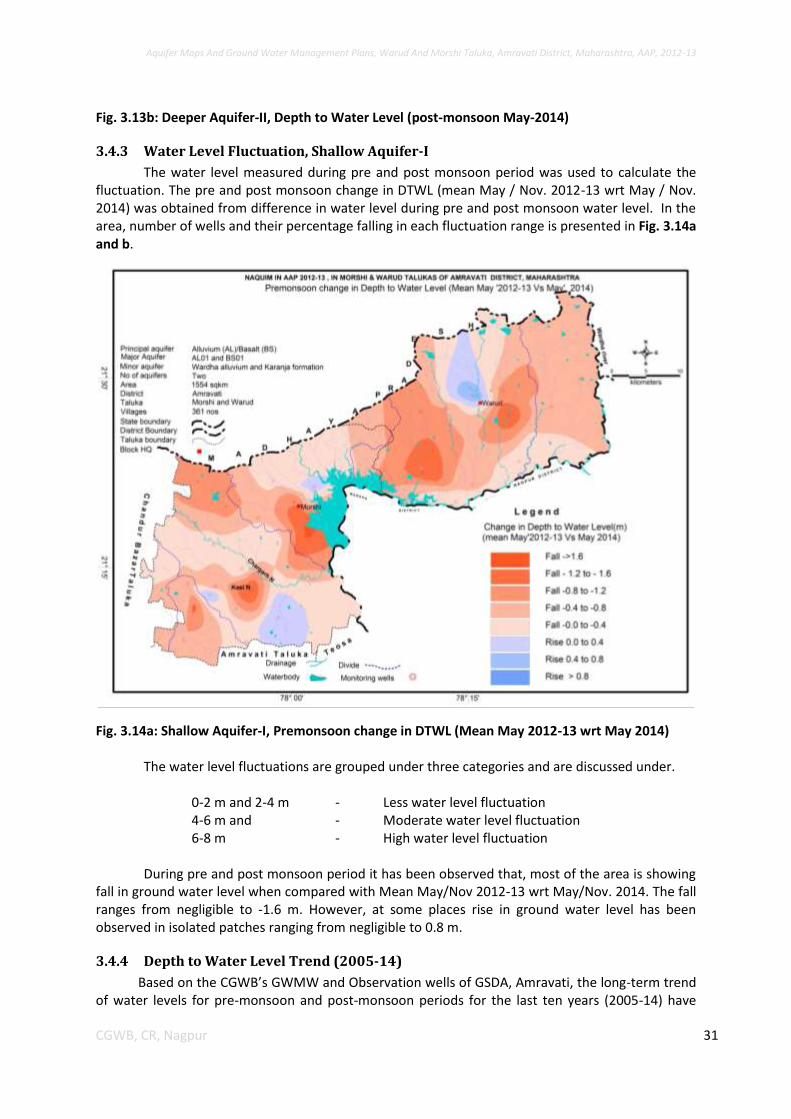
Fig. 3.13b: Deeper Aquifer-II, Depth to Water Level (post-monsoon May-2014) ................................. 31
Fig. 3.14a: Shallow Aquifer-I, Premonsoon change in DTWL (Mean May 2012-13 wrt May 2014) ...... 31
Fig 3.15: Decadal Pre -monsoon decadal ground water level trend (May 2005- May 14) .................... 33
Fig 3.15: Decadal Post -monsoon decadal ground water level trend (Nov 2005 - Nov 14) ................... 34
Fig. 3.17: Ground water flow, Warud and Morshi taluka, Amravati district ......................................... 40
Fig. 3.18: Ground water quality, Aquifer-I, Warud and Morshi taluka, Amravati district ..................... 42
Fig. 3.19: Aquifer-II, Iso conductivity, Warud and Morshi taluka, Amravati district ............................. 43
Fig. 3.20: 3-D Fence diagram, Warud and Morshi taluka, Amravati district .......................................... 44
Fig. 3.21: Schematic 3-D Aquifer Disposition, Warud and Morshi taluka, Amravati district ................. 44
Fig. 3.22 (a): Lithological section A-A’, Warud and Morshi taluka, Amravati district ............................ 45
Fig. 3.22 (b): Lithological section B-B’, Warud and Morshi taluka, Amravati district ............................ 46
Fig. 3.22 (c): Lithological section C-C’, Warud and Morshi taluka, Amravati district ............................. 46
Fig. 3.22 (d): Lithological section D-D’, Warud and Morshi taluka, Amravati district ........................... 47
Fig. 3.23: Depth of occurrence & fractured rock thickness of Aquifer-I (shallow), Warud and Morshi
taluka, Amravati district ......................................................................................................... 49
Fig. 3.24: Aquifer-I (shallow), Yield potential, Warud and Morshi taluka, Amravati district ................. 50
Fig. 3.25: Aquifer-II (deeper), Isopach depicting Depth of occurrence & fractured rock thickness,
Warud and Morshi taluka, Amravati district .......................................................................... 50
Fig. 3.26: Aquifer-II (deeper), Yield potential, Warud and Morshi taluka, Amravati district ................. 51
Fig. 3.27: Aquifer group thickness of I and II (fractured rock thickness), Warud and Morshi taluka,
Amravati district ..................................................................................................................... 51
Aquifer Maps And Ground Water Management Plans, Warud And Morshi Taluka, Amravati District, Maharashtra, AAP, 2012-13
Fig.4.1: Season wise recharge from various sources, Warud and Morshi taluka, Amravati district ..... 53
Fig. 5.1: Orange/Sweet lime cultivation, Warud and Morshi taluka, Amravati district ......................... 55
Fig. 5.2: Change in stage of ground water development, Warud and Morshi taluka, Amravati district56
Fig. 5.3: Change in ground water draft, Warud and Morshi taluka, Amravati district .......................... 57
Fig. 5.4: Ground water availability and draft, Warud and Morshi taluka, Amravati district ................. 57
Fig. 5.5: Daily month wise water requirement for an orange tree (after PKV, 2009) ........................... 58
Fig. 5.6: Year wise water requirement for an orange tree (after PKV, 2009) ........................................ 58
Fig. 6.1- Supply side intervention -proposed Artificial Recharge Structures, Warud and Morshi taluka,
Amravati district ..................................................................................................................... 60
Fig. 6.2a- Demand side intervention- area proposed to be covered under drip irrigation, Warud and
Morshi taluka, Amravati district ............................................................................................. 60
Fig. 6.2b- Demand side intervention- double cropped area, Warud and Morshi taluka, Amravati
district ..................................................................................................................................... 61
Annexure-VI: Detailed Data of Soil Infiltration Tests, Warud and Morshi taluka, Amravati district ..... 87
LIST OF TABLES Table 1.1: Data Adequacy and Data Gap Analysis ................................................................................... 4
Table 1.2: Long term rainfall analysis, Warud and Morshi taluka, Amravati district. ............................. 5
Table 1.3: Annual Rainfall Data of 10 years, Taluka Warud and Morshi (in mm) .................................... 5
Table 1.4a: Land Use, Agriculture and Irrigation (fig. in sq.km) .............................................................. 8
Table 1.4b: Taluk wise area under different crops (fig. in sq.km) ........................................................... 8
Table 1.5: Abstract irrigation projects, Warud and Morshi taluka, Amravati district ............................. 9
Table 2.1: Salient Features of Infiltration Tests ..................................................................................... 13
Table 3.1: Generalized Geological sequence, Warud and Morshi taluka, Amravati district ................. 18
Table 3.3 Aquifer Characteristic of Warud and Morshi Taluka, Amravati district ................................. 47
Table 4.1: Ground Water Recharge Worthy Areas for Resource Estimation ........................................ 52
Table 4.2: Recharge components evaluated Ground Water Resources Estimation .............................. 53
Table 4.3 Ground water resources, Aquifer-I (Shallow, weathered/jointed Basalt), Warud and Morshi
taluka (2013) ........................................................................................................................... 54
Table 4.4: Ground Water Resources of Aquifer-II (Deep, fractured basalt) .......................................... 54
Table 5.1: Daily month wise water requirement (lit per day per tree) for an orange tree upto 10 years
by drip irrigation (after PKV, 2009) ......................................................................................... 58
Table 8.1: Aquifer Management Plan of Warud and Morshi Taluka, Amravati district ........................ 62
LIST OF ANNEXURES Annexure-I Details of Medium, Bigger Minor and Minor irrigation projects (>100 ha), Warud and
Morshi taluka, Amravati district ............................................................................................. 69
Annexure-II Salient Features of Ground water exploration in Morshi and Warud taluka, Amravati
district. .................................................................................................................................... 73
Annexure-III Details of GW monitoring wells and KOWs in Morshi and Warud taluka, Amravati
district. .................................................................................................................................... 74
Annexure-IV A Aquifer-I, Ground water quality of Morshi and Warud taluka, Amravati district .......... 76
Annexure-IV B Aquifer-II, Ground water quality of Morshi and Warud taluka, Amravati district ......... 78

Aquifer Maps And Ground Water Management Plans, Warud And Morshi Taluka, Amravati District, Maharashtra, AAP, 2012-13
Annexure-V Details of micro-level wells in Morshi and Warud taluka, Amravati district. ..................... 79
Annexure-VII VES Results, Morshi and Warud taluka, Amravati District ............................................... 96
Annexure-VIII Aquifer-I, Depth to water level data Warud and Morshi taluka, Amravati district ...... 103
Annexure-IX Aquifer-II, Depth to water level Morshi and Warud taluka, Amravati district ................ 104
Annexure-X Aquifer-I, Pre and Post Monsoon water level trend (2006-15), Morshi and Warud taluka,
Amravati district. .................................................................................................................. 104
Annexure XI Location of proposed Percolation tanks in Morshi and Warud taluka, Amravati district 105
Annexure XII Location of proposed check dam in Morshi and Warud taluka, Amravati district ......... 107
Annexure XIII Location of Recharge Shaft, Morshi and Warud taluka, Amravati district .................... 110
Aquifer Maps And Ground Water Management Plans, Warud And Morshi Taluka, Amravati District, Maharashtra, AAP, 2012-13
1 CGWB, CR, Nagpur
AQUIFER MAPS AND GROUND WATER MANAGEMENT PLANS,
WARUD AND MORSHI TALUKA, AMRAVATI DISTRICT,
MAHARASHTRA
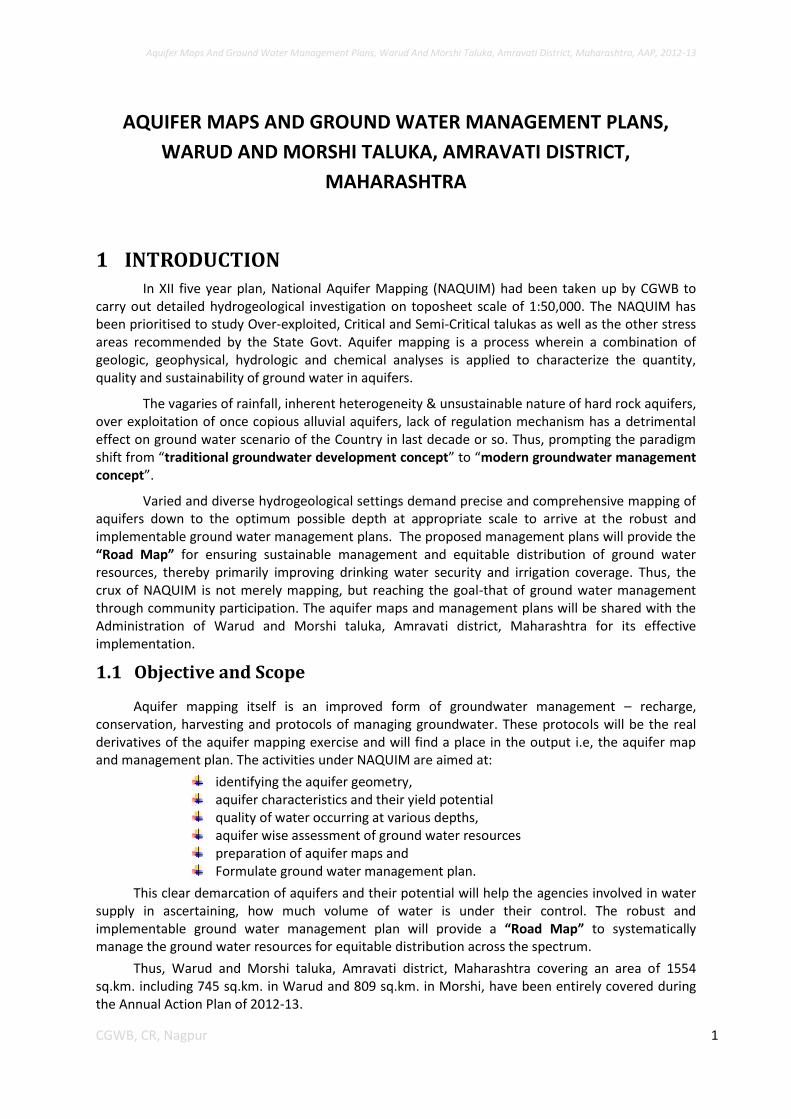
1 INTRODUCTION In XII five year plan, National Aquifer Mapping (NAQUIM) had been taken up by CGWB to
carry out detailed hydrogeological investigation on toposheet scale of 1:50,000. The NAQUIM has been prioritised to study Over-exploited, Critical and Semi-Critical talukas as well as the other stress areas recommended by the State Govt. Aquifer mapping is a process wherein a combination of geologic, geophysical, hydrologic and chemical analyses is applied to characterize the quantity, quality and sustainability of ground water in aquifers.
The vagaries of rainfall, inherent heterogeneity & unsustainable nature of hard rock aquifers, over exploitation of once copious alluvial aquifers, lack of regulation mechanism has a detrimental effect on ground water scenario of the Country in last decade or so. Thus, prompting the paradigm shift from “traditional groundwater development concept” to “modern groundwater management concept”.
Varied and diverse hydrogeological settings demand precise and comprehensive mapping of aquifers down to the optimum possible depth at appropriate scale to arrive at the robust and implementable ground water management plans. The proposed management plans will provide the “Road Map” for ensuring sustainable management and equitable distribution of ground water resources, thereby primarily improving drinking water security and irrigation coverage. Thus, the crux of NAQUIM is not merely mapping, but reaching the goal-that of ground water management through community participation. The aquifer maps and management plans will be shared with the Administration of Warud and Morshi taluka, Amravati district, Maharashtra for its effective implementation.
1.1 Objective and Scope
Aquifer mapping itself is an improved form of groundwater management – recharge, conservation, harvesting and protocols of managing groundwater. These protocols will be the real derivatives of the aquifer mapping exercise and will find a place in the output i.e, the aquifer map and management plan. The activities under NAQUIM are aimed at:
identifying the aquifer geometry, aquifer characteristics and their yield potential quality of water occurring at various depths, aquifer wise assessment of ground water resources preparation of aquifer maps and Formulate ground water management plan.
This clear demarcation of aquifers and their potential will help the agencies involved in water supply in ascertaining, how much volume of water is under their control. The robust and implementable ground water management plan will provide a “Road Map” to systematically manage the ground water resources for equitable distribution across the spectrum.
Thus, Warud and Morshi taluka, Amravati district, Maharashtra covering an area of 1554 sq.km. including 745 sq.km. in Warud and 809 sq.km. in Morshi, have been entirely covered during the Annual Action Plan of 2012-13.
Aquifer Maps And Ground Water Management Plans, Warud And Morshi Taluka, Amravati District, Maharashtra, AAP, 2012-13
2 CGWB, CR, Nagpur
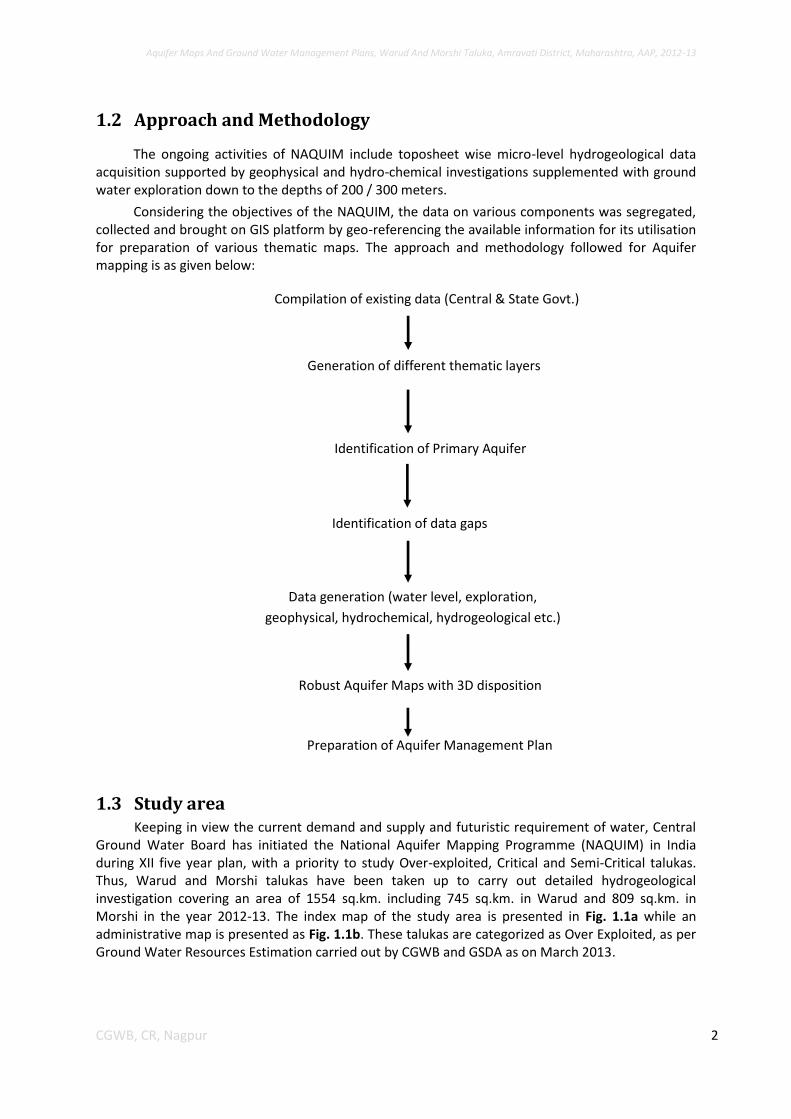
Compilation of existing data (Central & State Govt.)
Identification of Primary Aquifer
Data generation (water level, exploration,
geophysical, hydrochemical, hydrogeological etc.)
Identification of data gaps
Robust Aquifer Maps with 3D disposition
Generation of different thematic layers
Preparation of Aquifer Management Plan
1.2 Approach and Methodology
The ongoing activities of NAQUIM include toposheet wise micro-level hydrogeological data acquisition supported by geophysical and hydro-chemical investigations supplemented with ground water exploration down to the depths of 200 / 300 meters.
Considering the objectives of the NAQUIM, the data on various components was segregated, collected and brought on GIS platform by geo-referencing the available information for its utilisation for preparation of various thematic maps. The approach and methodology followed for Aquifer mapping is as given below:
1.3 Study area Keeping in view the current demand and supply and futuristic requirement of water, Central
Ground Water Board has initiated the National Aquifer Mapping Programme (NAQUIM) in India during XII five year plan, with a priority to study Over-exploited, Critical and Semi-Critical talukas. Thus, Warud and Morshi talukas have been taken up to carry out detailed hydrogeological investigation covering an area of 1554 sq.km. including 745 sq.km. in Warud and 809 sq.km. in Morshi in the year 2012-13. The index map of the study area is presented in Fig. 1.1a while an administrative map is presented as Fig. 1.1b. These talukas are categorized as Over Exploited, as per Ground Water Resources Estimation carried out by CGWB and GSDA as on March 2013.
Aquifer Maps And Ground Water Management Plans, Warud And Morshi Taluka, Amravati District, Maharashtra, AAP, 2012-13
3 CGWB, CR, Nagpur
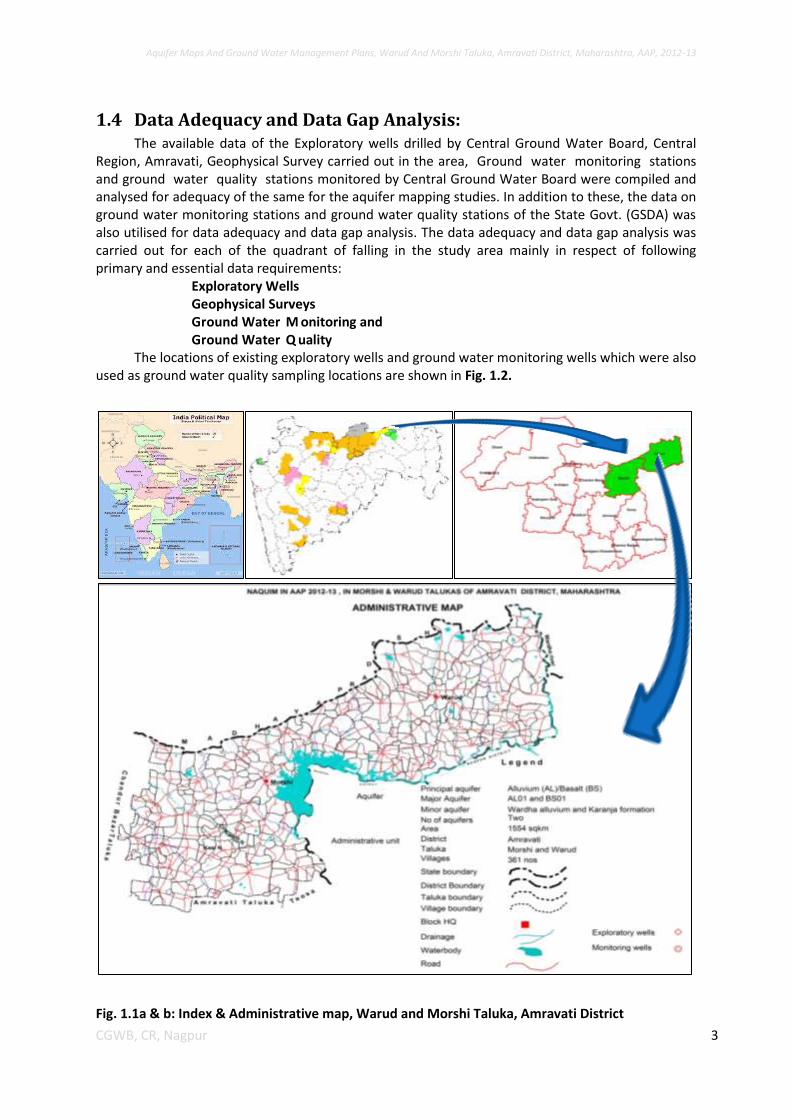
1.4 Data Adequacy and Data Gap Analysis: The available data of the Exploratory wells drilled by Central Ground Water Board, Central
Region, Amravati, Geophysical Survey carried out in the area, Ground water monitoring stations and ground water quality stations monitored by Central Ground Water Board were compiled and analysed for adequacy of the same for the aquifer mapping studies. In addition to these, the data on ground water monitoring stations and ground water quality stations of the State Govt. (GSDA) was also utilised for data adequacy and data gap analysis. The data adequacy and data gap analysis was carried out for each of the quadrant of falling in the study area mainly in respect of following primary and essential data requirements:
Exploratory Wells Geophysical Surveys Ground Water M onitoring and Ground Water Q uality
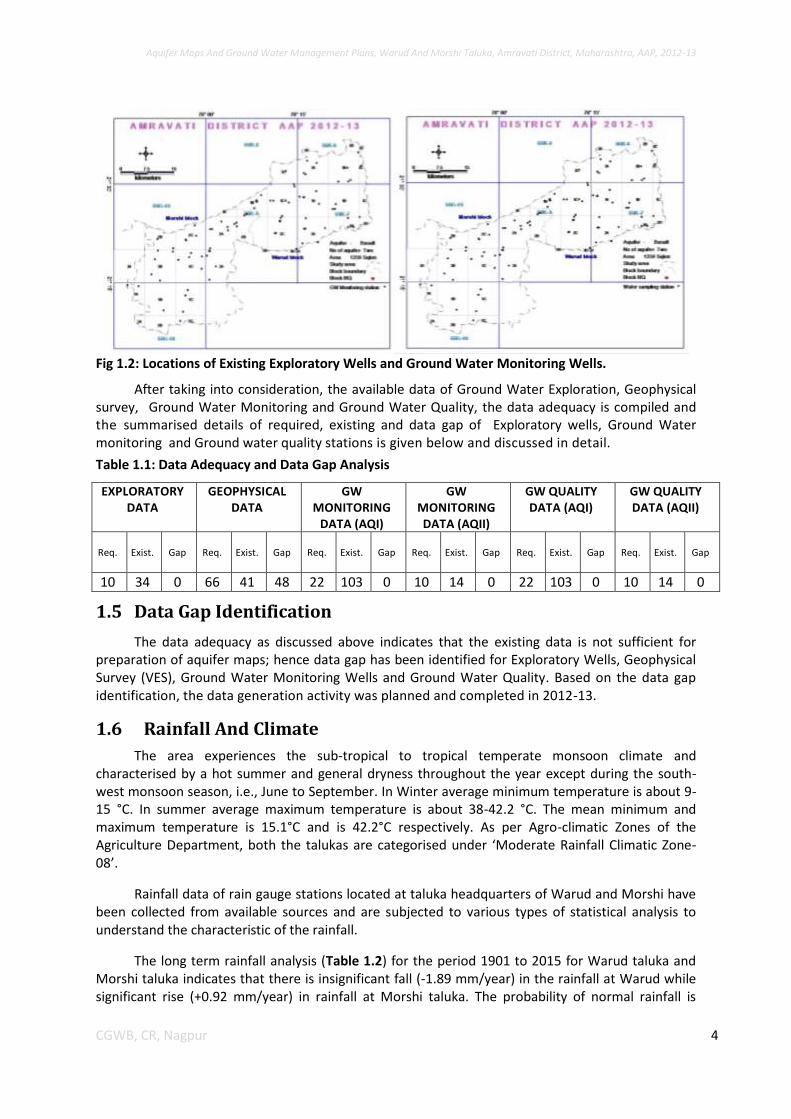
The locations of existing exploratory wells and ground water monitoring wells which were also used as ground water quality sampling locations are shown in Fig. 1.2.
Fig. 1.1a & b: Index & Administrative map, Warud and Morshi Taluka, Amravati District
Aquifer Maps And Ground Water Management Plans, Warud And Morshi Taluka, Amravati District, Maharashtra, AAP, 2012-13
4 CGWB, CR, Nagpur
Fig 1.2: Locations of Existing Exploratory Wells and Ground Water Monitoring Wells.
After taking into consideration, the available data of Ground Water Exploration, Geophysical survey, Ground Water Monitoring and Ground Water Quality, the data adequacy is compiled and the summarised details of required, existing and data gap of Exploratory wells, Ground Water monitoring and Ground water quality stations is given below and discussed in detail.
Table 1.1: Data Adequacy and Data Gap Analysis
1.5 Data Gap Identification
The data adequacy as discussed above indicates that the existing data is not sufficient for preparation of aquifer maps; hence data gap has been identified for Exploratory Wells, Geophysical Survey (VES), Ground Water Monitoring Wells and Ground Water Quality. Based on the data gap identification, the data generation activity was planned and completed in 2012-13.
1.6 Rainfall And Climate
The area experiences the sub-tropical to tropical temperate monsoon climate and characterised by a hot summer and general dryness throughout the year except during the south-west monsoon season, i.e., June to September. In Winter average minimum temperature is about 9-15 °C. In summer average maximum temperature is about 38-42.2 °C. The mean minimum and maximum temperature is 15.1°C and is 42.2°C respectively. As per Agro-climatic Zones of the Agriculture Department, both the talukas are categorised under ‘Moderate Rainfall Climatic Zone-08’.
Rainfall data of rain gauge stations located at taluka headquarters of Warud and Morshi have been collected from available sources and are subjected to various types of statistical analysis to understand the characteristic of the rainfall.
The long term rainfall analysis (Table 1.2) for the period 1901 to 2015 for Warud taluka and Morshi taluka indicates that there is insignificant fall (-1.89 mm/year) in the rainfall at Warud while significant rise (+0.92 mm/year) in rainfall at Morshi taluka. The probability of normal rainfall is
EXPLORATORY DATA
GEOPHYSICAL DATA
GW MONITORING
DATA (AQI)
GW MONITORING DATA (AQII)
GW QUALITY DATA (AQI)
GW QUALITY DATA (AQII)
Req. Exist. Gap Req. Exist. Gap Req. Exist. Gap Req. Exist. Gap Req. Exist. Gap Req. Exist. Gap
10 34 0 66 41 48 22 103 0 10 14 0 22 103 0 10 14 0
Aquifer Maps And Ground Water Management Plans, Warud And Morshi Taluka, Amravati District, Maharashtra, AAP, 2012-13
5 CGWB, CR, Nagpur
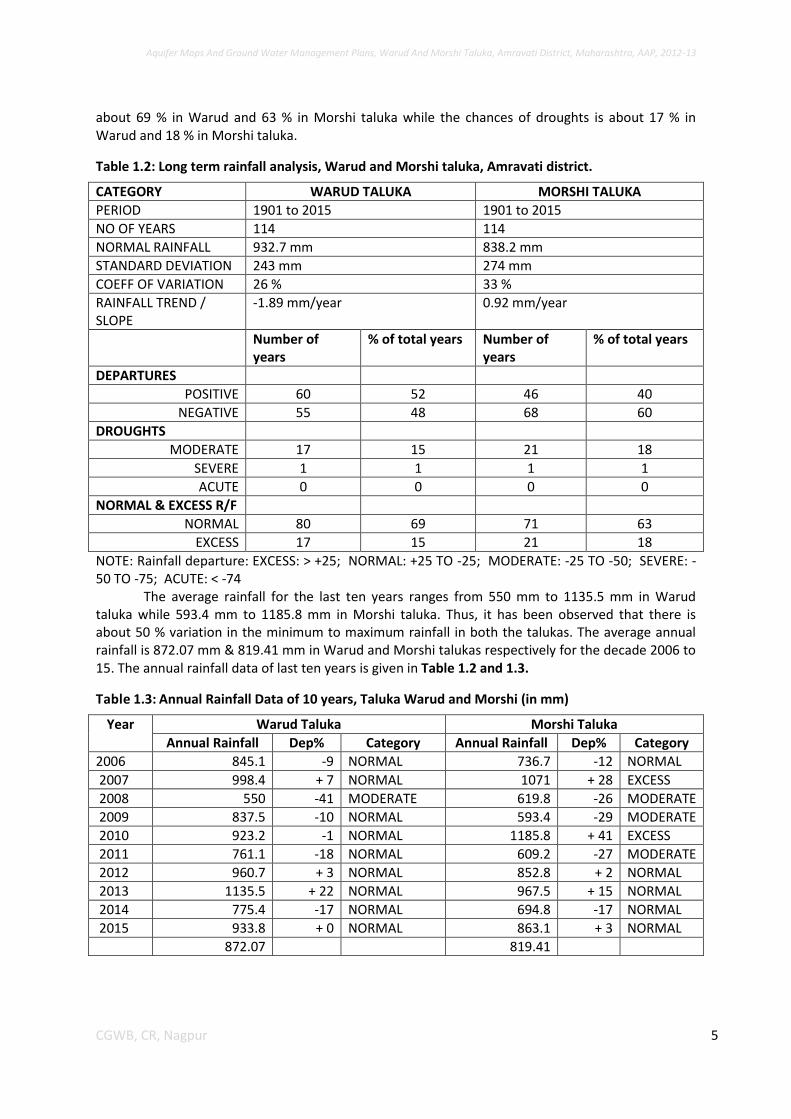
about 69 % in Warud and 63 % in Morshi taluka while the chances of droughts is about 17 % in Warud and 18 % in Morshi taluka.
Table 1.2: Long term rainfall analysis, Warud and Morshi taluka, Amravati district.
CATEGORY WARUD TALUKA MORSHI TALUKA
PERIOD 1901 to 2015 1901 to 2015
NO OF YEARS 114 114
NORMAL RAINFALL 932.7 mm 838.2 mm
STANDARD DEVIATION 243 mm 274 mm
COEFF OF VARIATION 26 % 33 %
RAINFALL TREND / SLOPE
-1.89 mm/year 0.92 mm/year
Number of years
% of total years Number of years
% of total years
DEPARTURES
POSITIVE 60 52 46 40
NEGATIVE 55 48 68 60
DROUGHTS
MODERATE 17 15 21 18
SEVERE 1 1 1 1
ACUTE 0 0 0 0
NORMAL & EXCESS R/F
NORMAL 80 69 71 63
EXCESS 17 15 21 18
NOTE: Rainfall departure: EXCESS: > +25; NORMAL: +25 TO -25; MODERATE: -25 TO -50; SEVERE: -50 TO -75; ACUTE: < -74
The average rainfall for the last ten years ranges from 550 mm to 1135.5 mm in Warud taluka while 593.4 mm to 1185.8 mm in Morshi taluka. Thus, it has been observed that there is about 50 % variation in the minimum to maximum rainfall in both the talukas. The average annual rainfall is 872.07 mm & 819.41 mm in Warud and Morshi talukas respectively for the decade 2006 to 15. The annual rainfall data of last ten years is given in Table 1.2 and 1.3.
Table 1.3: Annual Rainfall Data of 10 years, Taluka Warud and Morshi (in mm)
Year Warud Taluka Morshi Taluka
Annual Rainfall Dep% Category Annual Rainfall Dep% Category
2006 845.1 -9 NORMAL 736.7 -12 NORMAL
2007 998.4 + 7 NORMAL 1071 + 28 EXCESS
2008 550 -41 MODERATE 619.8 -26 MODERATE
2009 837.5 -10 NORMAL 593.4 -29 MODERATE
2010 923.2 -1 NORMAL 1185.8 + 41 EXCESS
2011 761.1 -18 NORMAL 609.2 -27 MODERATE
2012 960.7 + 3 NORMAL 852.8 + 2 NORMAL
2013 1135.5 + 22 NORMAL 967.5 + 15 NORMAL
2014 775.4 -17 NORMAL 694.8 -17 NORMAL
2015 933.8 + 0 NORMAL 863.1 + 3 NORMAL
872.07 819.41

Aquifer Maps And Ground Water Management Plans, Warud And Morshi Taluka, Amravati District, Maharashtra, AAP, 2012-13
6 CGWB, CR, Nagpur
1.7 Physiography The area can be broadly divided into three physiographic units i.e., the Melghat Hill range, the
plain area of the Paynghat and flood plain. The Melghat hills are made up of Gawilgarh hills, which are a part of the Satpura hill ranges and occupied northern part of Morshi and Warud talukas. The elevation in the area range between 340-540 mamsl. The physiography of the area is shown in Fig. 1.3.
Fig. 1.3: Physiography, Warud and Morshi taluka, Amravati district
Aquifer Maps And Ground Water Management Plans, Warud And Morshi Taluka, Amravati District, Maharashtra, AAP, 2012-13
7 CGWB, CR, Nagpur
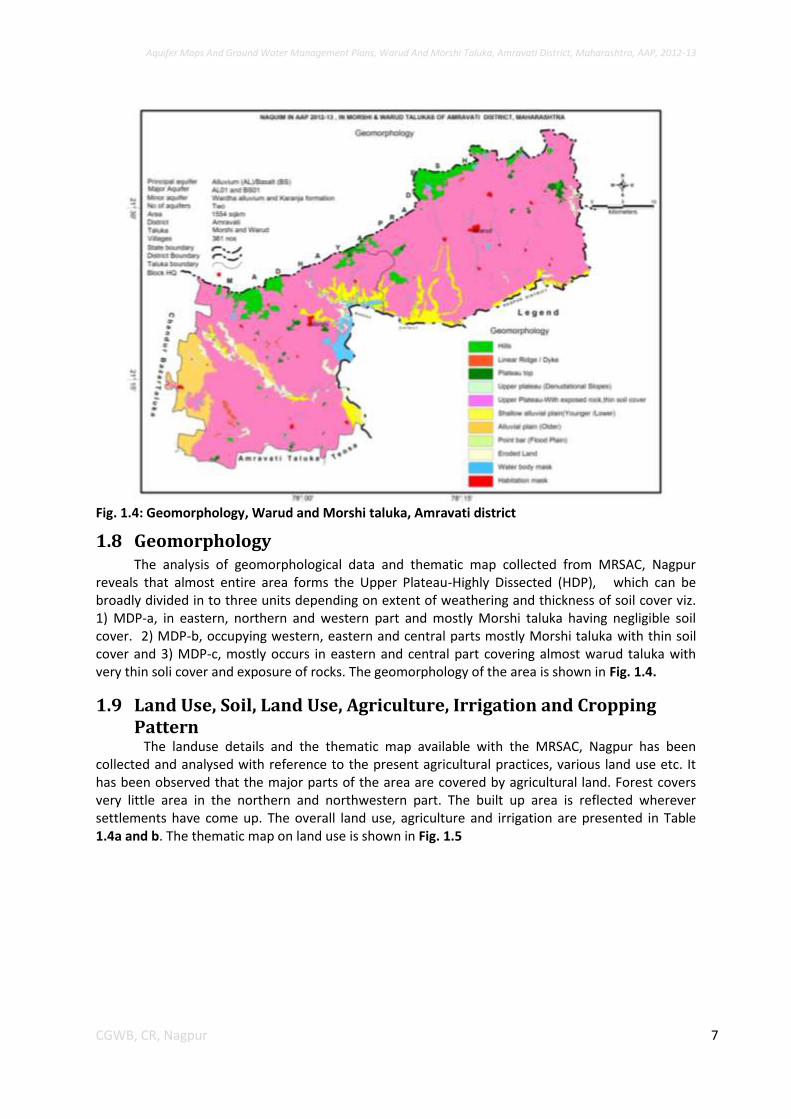
Fig. 1.4: Geomorphology, Warud and Morshi taluka, Amravati district
1.8 Geomorphology The analysis of geomorphological data and thematic map collected from MRSAC, Nagpur
reveals that almost entire area forms the Upper Plateau-Highly Dissected (HDP), which can be broadly divided in to three units depending on extent of weathering and thickness of soil cover viz. 1) MDP-a, in eastern, northern and western part and mostly Morshi taluka having negligible soil cover. 2) MDP-b, occupying western, eastern and central parts mostly Morshi taluka with thin soil cover and 3) MDP-c, mostly occurs in eastern and central part covering almost warud taluka with very thin soli cover and exposure of rocks. The geomorphology of the area is shown in Fig. 1.4.
1.9 Land Use, Soil, Land Use, Agriculture, Irrigation and Cropping Pattern
The landuse details and the thematic map available with the MRSAC, Nagpur has been collected and analysed with reference to the present agricultural practices, various land use etc. It has been observed that the major parts of the area are covered by agricultural land. Forest covers very little area in the northern and northwestern part. The built up area is reflected wherever settlements have come up. The overall land use, agriculture and irrigation are presented in Table 1.4a and b. The thematic map on land use is shown in Fig. 1.5
Aquifer Maps And Ground Water Management Plans, Warud And Morshi Taluka, Amravati District, Maharashtra, AAP, 2012-13
8 CGWB, CR, Nagpur
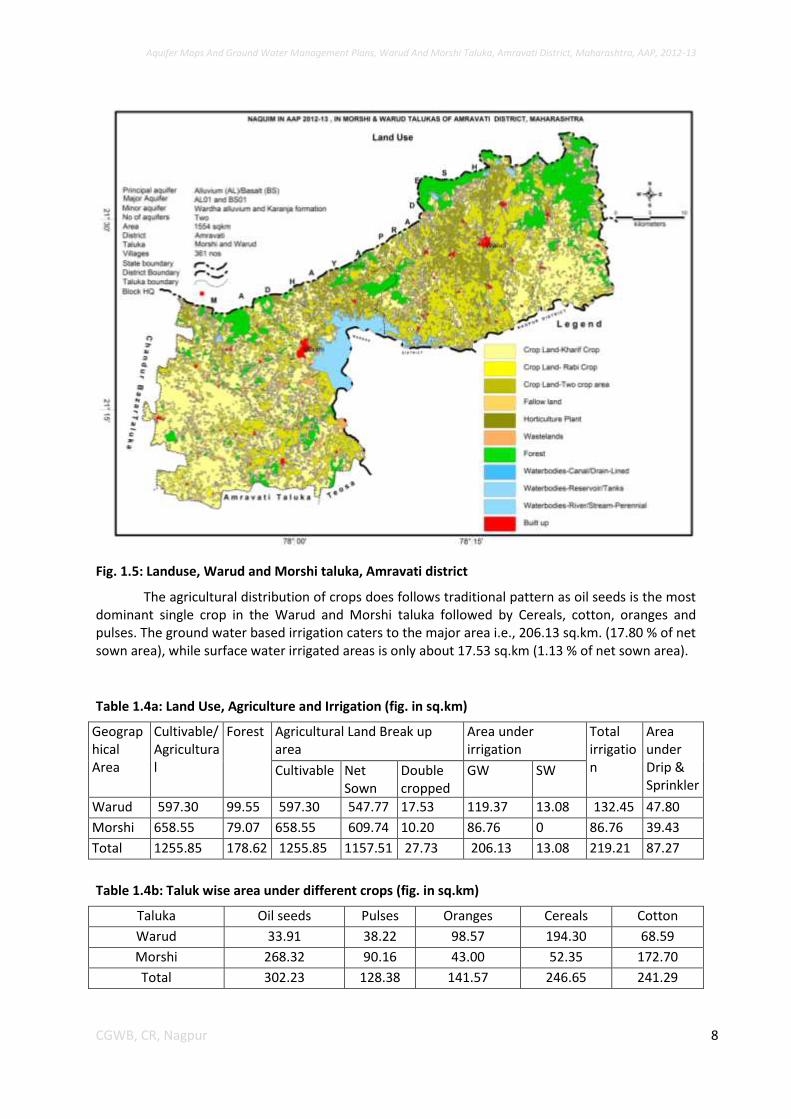
Fig. 1.5: Landuse, Warud and Morshi taluka, Amravati district
The agricultural distribution of crops does follows traditional pattern as oil seeds is the most dominant single crop in the Warud and Morshi taluka followed by Cereals, cotton, oranges and pulses. The ground water based irrigation caters to the major area i.e., 206.13 sq.km. (17.80 % of net sown area), while surface water irrigated areas is only about 17.53 sq.km (1.13 % of net sown area).
Table 1.4a: Land Use, Agriculture and Irrigation (fig. in sq.km)
Geographical Area
Cultivable/ Agricultural
Forest Agricultural Land Break up area
Area under irrigation
Total irrigation
Area under Drip & Sprinkler
Cultivable Net Sown
Double cropped
GW SW
Warud 597.30 99.55 597.30 547.77 17.53 119.37 13.08 132.45 47.80
Morshi 658.55 79.07 658.55 609.74 10.20 86.76 0 86.76 39.43
Total 1255.85 178.62 1255.85 1157.51 27.73 206.13 13.08 219.21 87.27
Table 1.4b: Taluk wise area under different crops (fig. in sq.km)
Taluka Oil seeds Pulses Oranges Cereals Cotton
Warud 33.91 38.22 98.57 194.30 68.59
Morshi 268.32 90.16 43.00 52.35 172.70
Total 302.23 128.38 141.57 246.65 241.29
Aquifer Maps And Ground Water Management Plans, Warud And Morshi Taluka, Amravati District, Maharashtra, AAP, 2012-13
9 CGWB, CR, Nagpur
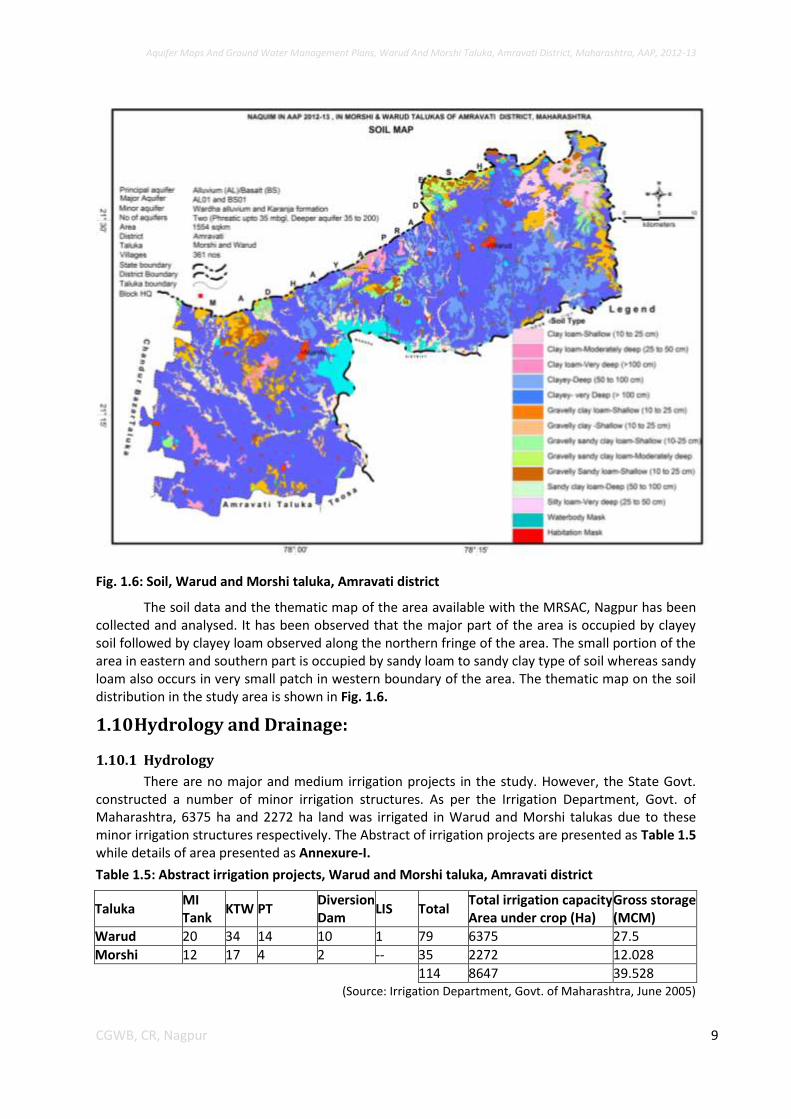
Fig. 1.6: Soil, Warud and Morshi taluka, Amravati district
The soil data and the thematic map of the area available with the MRSAC, Nagpur has been collected and analysed. It has been observed that the major part of the area is occupied by clayey soil followed by clayey loam observed along the northern fringe of the area. The small portion of the area in eastern and southern part is occupied by sandy loam to sandy clay type of soil whereas sandy loam also occurs in very small patch in western boundary of the area. The thematic map on the soil distribution in the study area is shown in Fig. 1.6.
1.10 Hydrology and Drainage:
1.10.1 Hydrology
There are no major and medium irrigation projects in the study. However, the State Govt. constructed a number of minor irrigation structures. As per the Irrigation Department, Govt. of Maharashtra, 6375 ha and 2272 ha land was irrigated in Warud and Morshi talukas due to these minor irrigation structures respectively. The Abstract of irrigation projects are presented as Table 1.5 while details of area presented as Annexure-I.
Table 1.5: Abstract irrigation projects, Warud and Morshi taluka, Amravati district
Taluka MI Tank
KTW PT Diversion Dam
LIS Total Total irrigation capacity Area under crop (Ha)
Gross storage (MCM)
Warud 20 34 14 10 1 79 6375 27.5
Morshi 12 17 4 2 -- 35 2272 12.028
114 8647 39.528 (Source: Irrigation Department, Govt. of Maharashtra, June 2005)
Aquifer Maps And Ground Water Management Plans, Warud And Morshi Taluka, Amravati District, Maharashtra, AAP, 2012-13
10 CGWB, CR, Nagpur
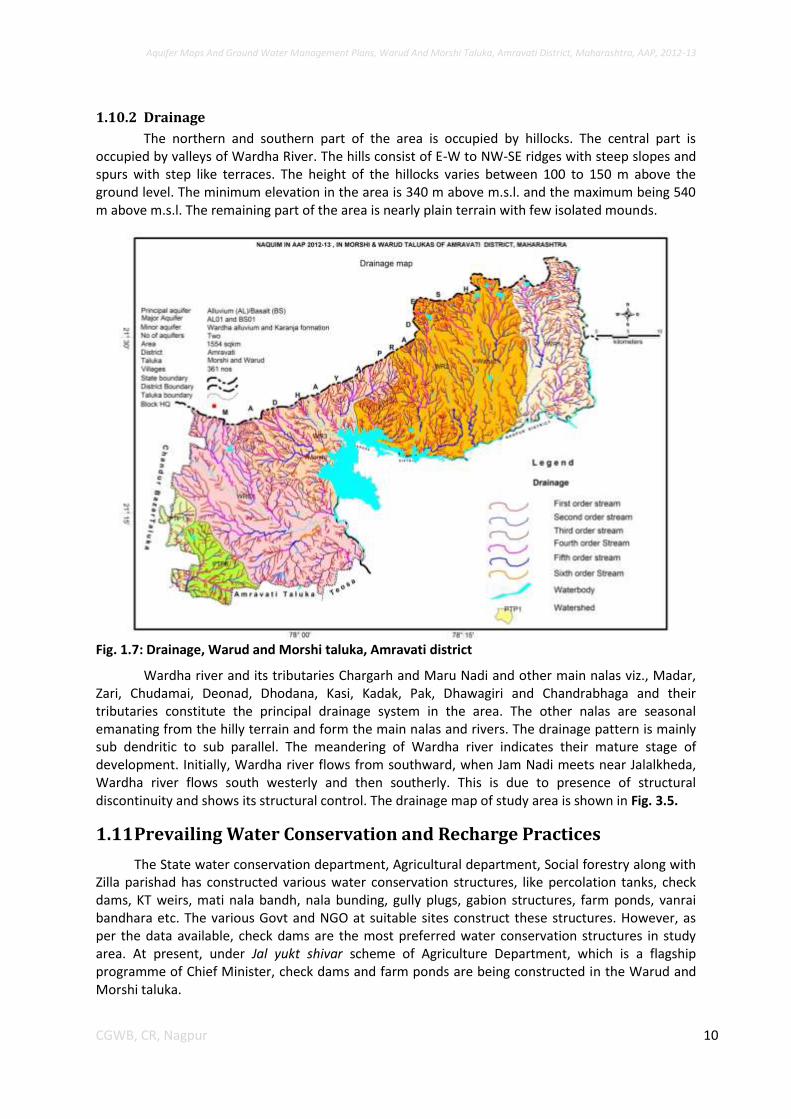
1.10.2 Drainage
The northern and southern part of the area is occupied by hillocks. The central part is occupied by valleys of Wardha River. The hills consist of E-W to NW-SE ridges with steep slopes and spurs with step like terraces. The height of the hillocks varies between 100 to 150 m above the ground level. The minimum elevation in the area is 340 m above m.s.l. and the maximum being 540 m above m.s.l. The remaining part of the area is nearly plain terrain with few isolated mounds.
Fig. 1.7: Drainage, Warud and Morshi taluka, Amravati district
Wardha river and its tributaries Chargarh and Maru Nadi and other main nalas viz., Madar, Zari, Chudamai, Deonad, Dhodana, Kasi, Kadak, Pak, Dhawagiri and Chandrabhaga and their tributaries constitute the principal drainage system in the area. The other nalas are seasonal emanating from the hilly terrain and form the main nalas and rivers. The drainage pattern is mainly sub dendritic to sub parallel. The meandering of Wardha river indicates their mature stage of development. Initially, Wardha river flows from southward, when Jam Nadi meets near Jalalkheda, Wardha river flows south westerly and then southerly. This is due to presence of structural discontinuity and shows its structural control. The drainage map of study area is shown in Fig. 3.5.
1.11 Prevailing Water Conservation and Recharge Practices
The State water conservation department, Agricultural department, Social forestry along with Zilla parishad has constructed various water conservation structures, like percolation tanks, check dams, KT weirs, mati nala bandh, nala bunding, gully plugs, gabion structures, farm ponds, vanrai bandhara etc. The various Govt and NGO at suitable sites construct these structures. However, as per the data available, check dams are the most preferred water conservation structures in study area. At present, under Jal yukt shivar scheme of Agriculture Department, which is a flagship programme of Chief Minister, check dams and farm ponds are being constructed in the Warud and Morshi taluka.
Aquifer Maps And Ground Water Management Plans, Warud And Morshi Taluka, Amravati District, Maharashtra, AAP, 2012-13
11 CGWB, CR, Nagpur
2 DATA COLLECTION AND GENERATION
The primary data such as water levels, quality, and lithological inputs were available with CGWB as well as GSDA, Govt. of Maharashtra has been collected and utilised as baseline data. However, the ancillary data such as numbers of ground water abstraction structures, irrigation facilities, rainfall etc., have been collected from the various State govt. departments and compiled.
2.1 Data Collection and Compilation
The data collection and compilation for various components was carried out as given below. i. Hydrogeological Data – Current and historical water levels along with water level
trend data from 103 monitoring wells in Warud & Morshi taluka representing Aquifer-I. The water levels of 34 exploratory wells in Warud & Morshi taluka representing Aquifer-II were also collected and compiled.
ii. Hydrochemical Data - Ground water quality data from 34 monitoring wells in Warud & Morshi taluka representing Aquifer-I and data of 14 exploratory wells in Warud & Morshi taluka representing Aquifer-II were also collected and compiled.
iii. Exploratory Drilling – Ground water exploration data of 13 existing exploratory wells in Warud and Morshi talukas were complied.
iv. Geophysical Data – The weathered zone resistivity and weathered zone thickness data from CGWB were complied. In all 175 (71 and 104 VES during 2006-07 and 2012-13 respectively) Vertical Electrical Soundings (VES) were conducted.
v. Hydrology Data – Data on various irrigation projects, their utilisation status, number of ground water abstraction structures and area irrigated from Irrigation department were compiled.
vi. Hydrometeorological Data - Long term rainfall data for each of the taluka from IMD and Dept. of Agriculture were complied.
vii. Water Conservation Structures – Numbers, type and storage potential of water conservation structures prevailing in the area from Dept. of Agriculture, ZP, Social forestry etc. were complied.
viii. Cropping Pattern Data – Data on prevailing cropping pattern from Agriculture Dept. were complied.
2.2 Data Generation After taking into consideration, the data available with CGWB on Ground Water Exploration,
Geophysical survey, Ground Water Monitoring Wells (GWMW) and Ground Water Quality, the data adequacy were compiled. The requirement, availability and gap of major data inputs i.e., exploratory wells, geophysical data, GWMW and ground water quality data are detailed in the Table 1.1. Based on Data Gap Analysis, all the necessary data was generated as discussed below.
2.2.1 Ground Water Exploration
As seen from Table-1.1, exploratory drilling was required at 10 locations. The drilling at these sites was done down to targeted depth by deploying three rigs i.e., DTH-REL-06/119, DTH/LMP-87/77 and, DTH-LMP-87/74 to assess the lithological disposition of shallow aquifer (Aquifer-I) and deeper aquifer (Aquifer-II). Ground water exploration down to the depth of 200 m bgl in Warud and Morshi has been taken up where the data gap exists and accordingly total 21 wells were constructed including 11 EW + 2 OB in Morshi & 5 EW + 3 OW in Warud have been constructed. The details of aquifers encountered are discussed in successive chapter. The locations of exploratory wells are shown in Fig. 2.1. The details of existing and newly constructed exploratory and observation wells is given in Annexure-II.
Aquifer Maps And Ground Water Management Plans, Warud And Morshi Taluka, Amravati District, Maharashtra, AAP, 2012-13
12 CGWB, CR, Nagpur
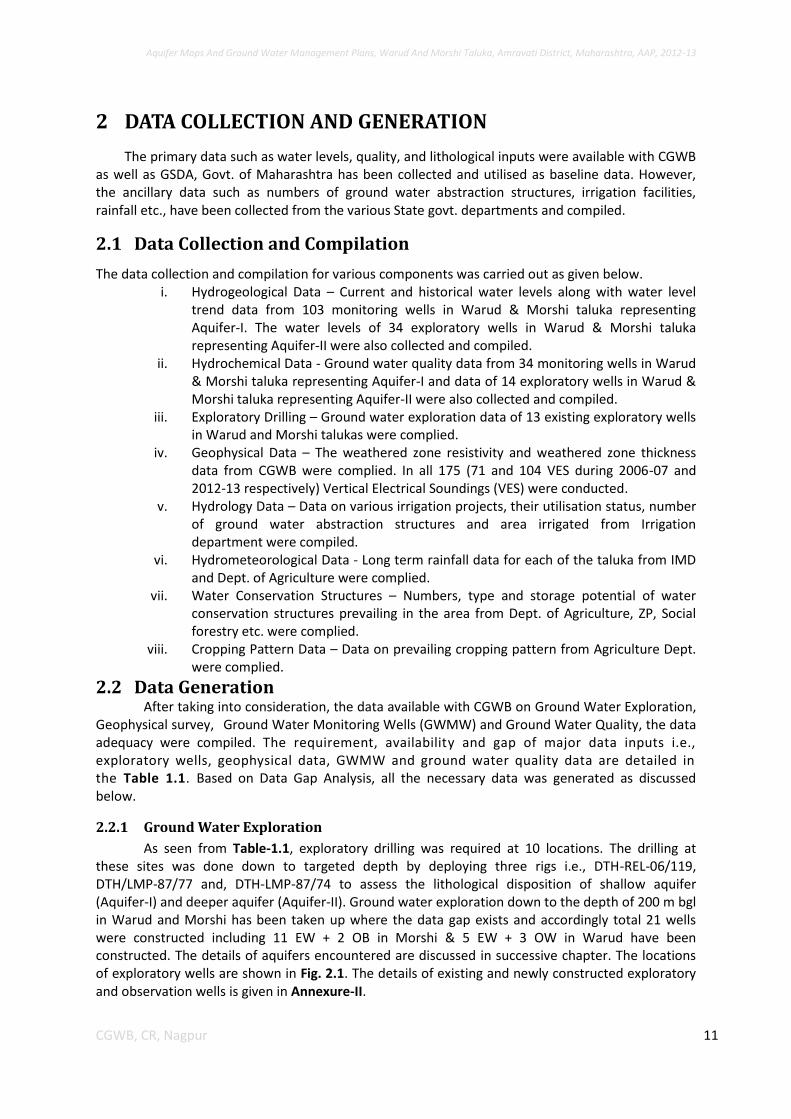
2.2.2 Ground Water Monitoring Wells
As observed from Table-1.1, GWMW’s were required at 22 locations for Aquifer-I and Aquifer-II correspondingly 103 key observation wells (KOW) were established and 34 EW were monitored in addition to the existing GWMW to assess the ground water scenario of shallow & deeper aquifer (Aquifer-I & II) of the area. Alos, 104 VES were also conducted in the area. The locations of KOW’s, EW’s and VES are shown in Fig. 2.1. The details of existing and newly established GWMW/KOW’s are given in Annexure-III.
Fig.2.1: Locations of Exploratory Wells Ground Water Monitoring Wells & VES
2.2.3 Ground Water Quality
As observed from Table-1.1, GWMW’s were required at 22 locations for Aquifer-I and
Aquifer-II correspondingly 103 key observation wells (KOW) were established and 34 EW were
monitored in addition to the existing GWMW to assess the ground water quality of shallow & deeper
aquifer (Aquifer-I, & II) of the area. The details of chemical analysis of existing and newly established
GWMW/KOW’s are given in Annexure-IVA and B.
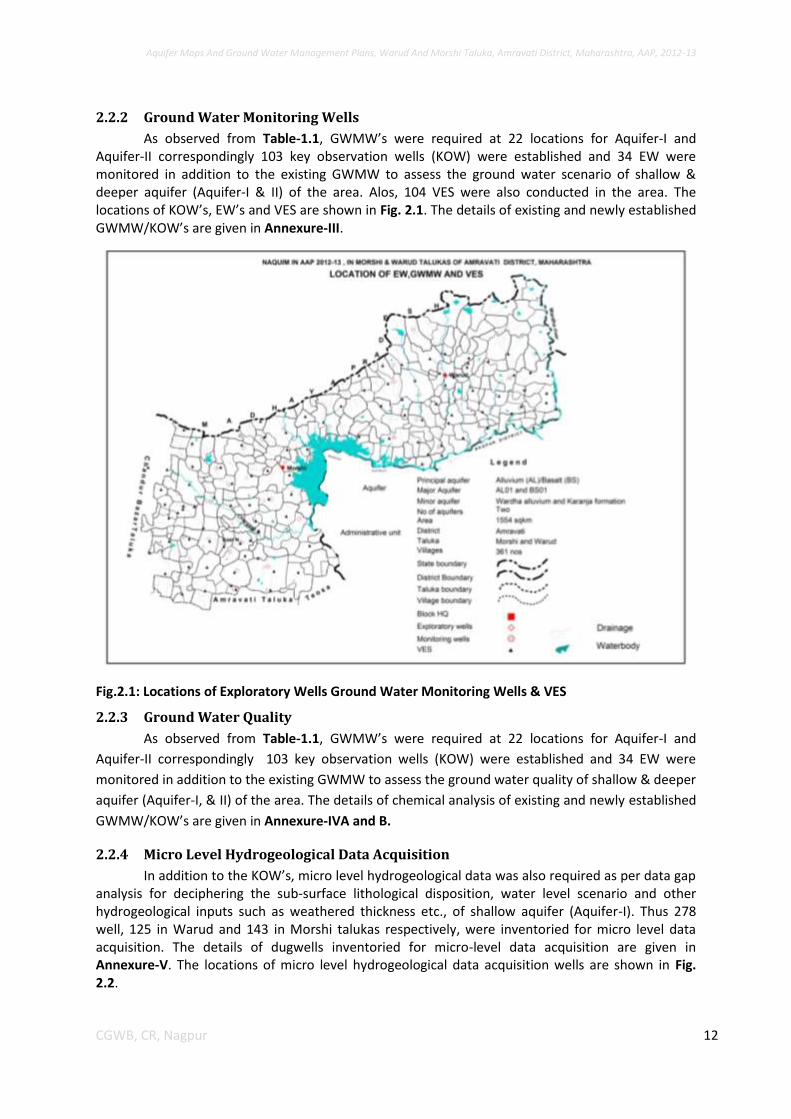
2.2.4 Micro Level Hydrogeological Data Acquisition
In addition to the KOW’s, micro level hydrogeological data was also required as per data gap analysis for deciphering the sub-surface lithological disposition, water level scenario and other hydrogeological inputs such as weathered thickness etc., of shallow aquifer (Aquifer-I). Thus 278 well, 125 in Warud and 143 in Morshi talukas respectively, were inventoried for micro level data acquisition. The details of dugwells inventoried for micro-level data acquisition are given in Annexure-V. The locations of micro level hydrogeological data acquisition wells are shown in Fig. 2.2.
Aquifer Maps And Ground Water Management Plans, Warud And Morshi Taluka, Amravati District, Maharashtra, AAP, 2012-13
13 CGWB, CR, Nagpur
Fig.2.2: Locations of Micro Level Hydrogeological Data Acquisition Wells
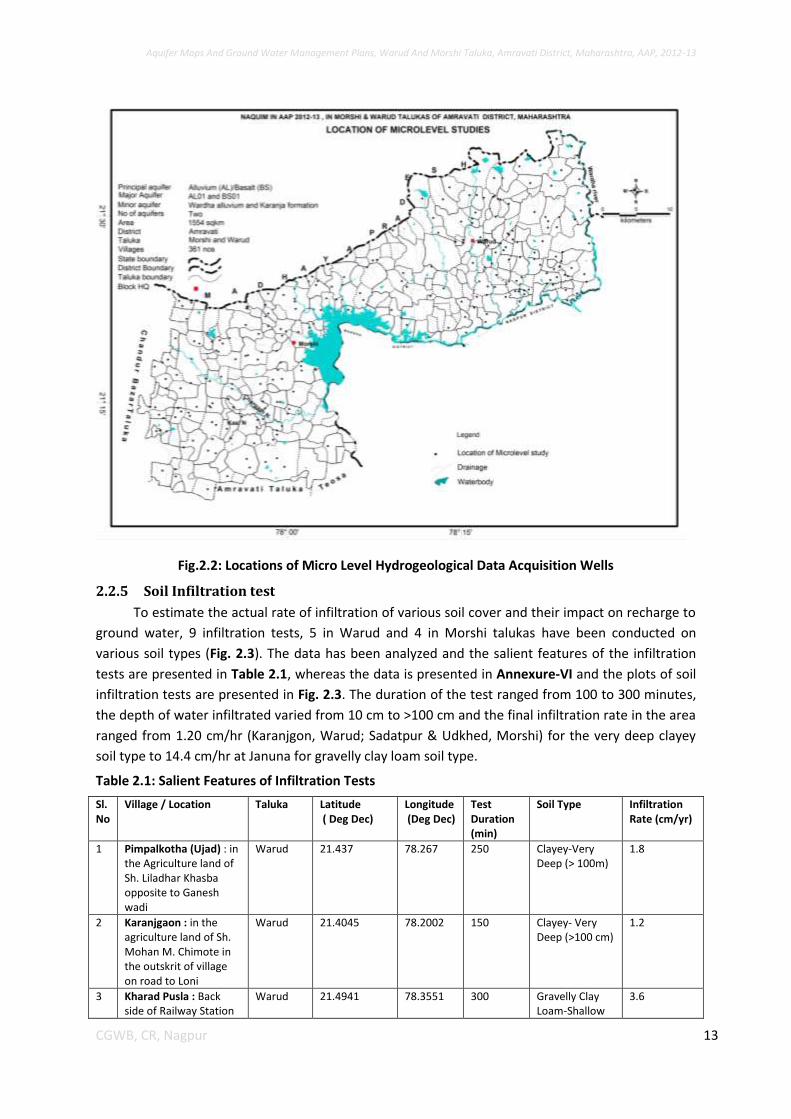
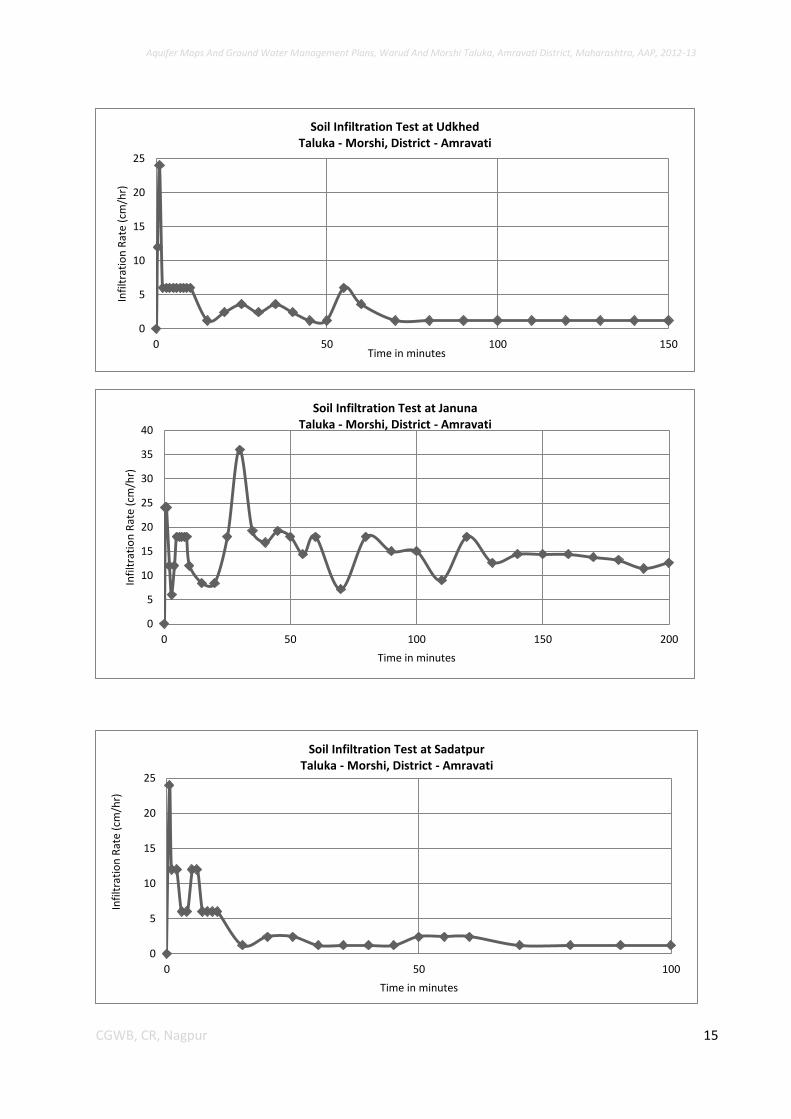
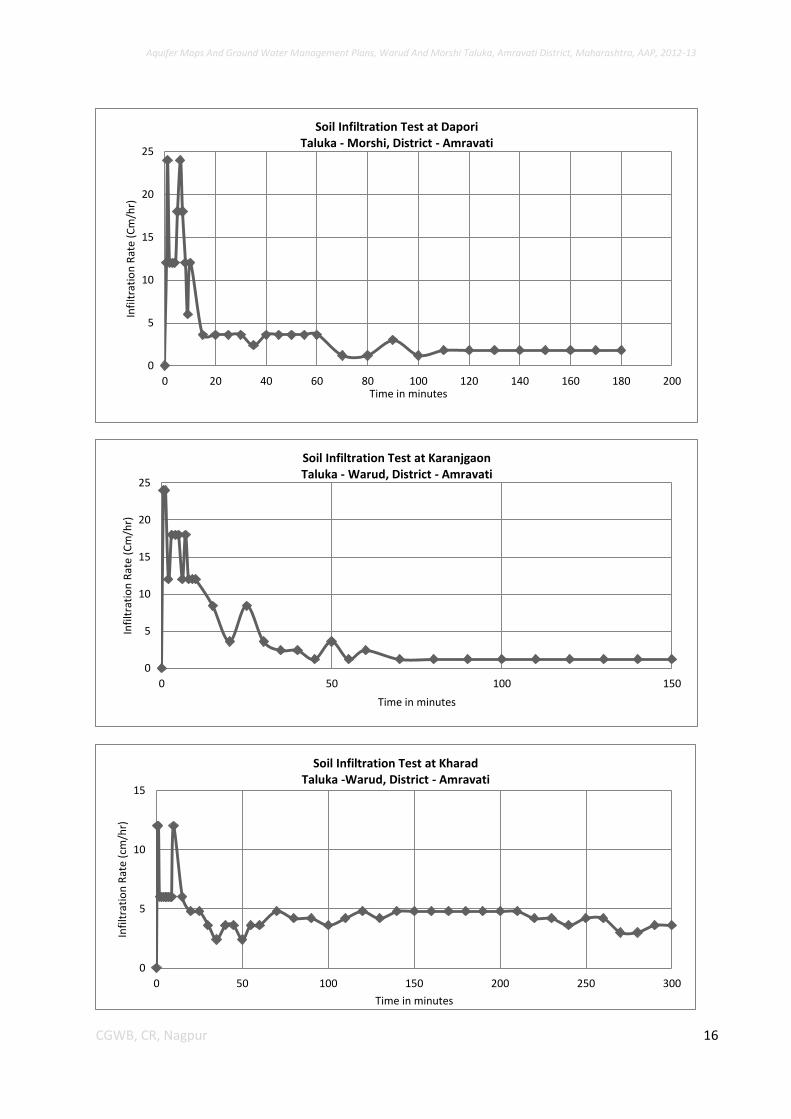
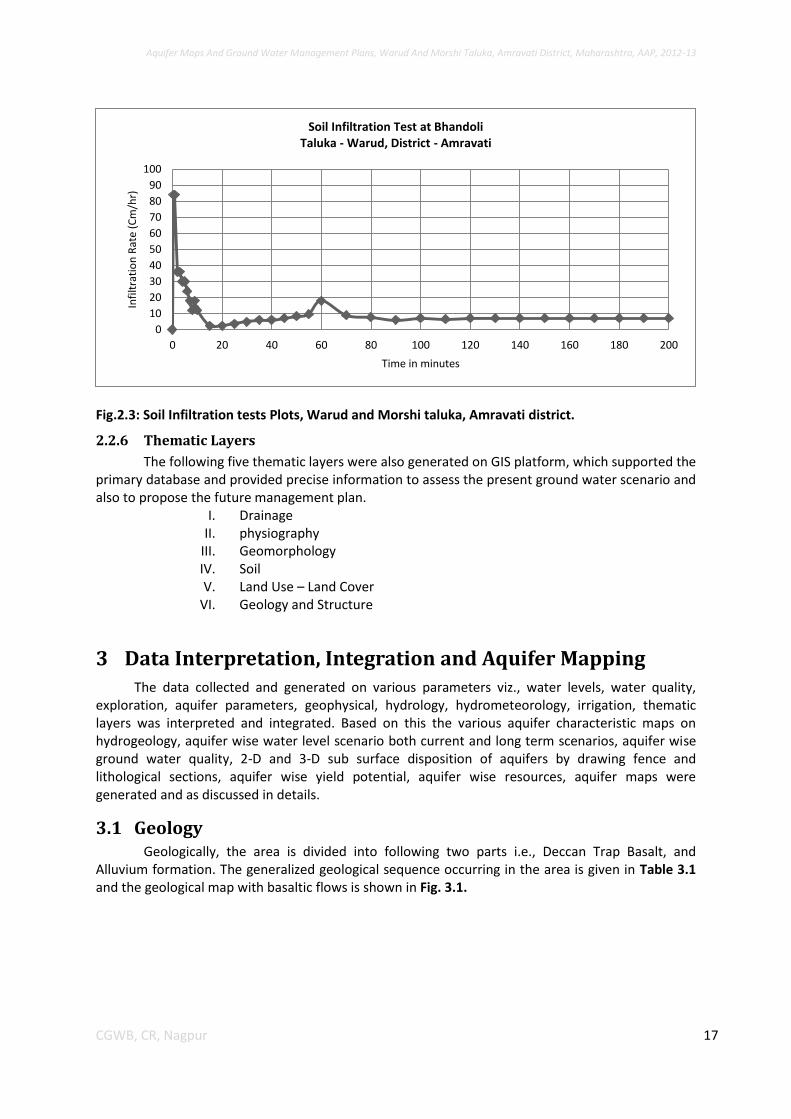
2.2.5 Soil Infiltration test
To estimate the actual rate of infiltration of various soil cover and their impact on recharge to
ground water, 9 infiltration tests, 5 in Warud and 4 in Morshi talukas have been conducted on
various soil types (Fig. 2.3). The data has been analyzed and the salient features of the infiltration
tests are presented in Table 2.1, whereas the data is presented in Annexure-VI and the plots of soil
infiltration tests are presented in Fig. 2.3. The duration of the test ranged from 100 to 300 minutes,
the depth of water infiltrated varied from 10 cm to >100 cm and the final infiltration rate in the area
ranged from 1.20 cm/hr (Karanjgon, Warud; Sadatpur & Udkhed, Morshi) for the very deep clayey
soil type to 14.4 cm/hr at Januna for gravelly clay loam soil type.
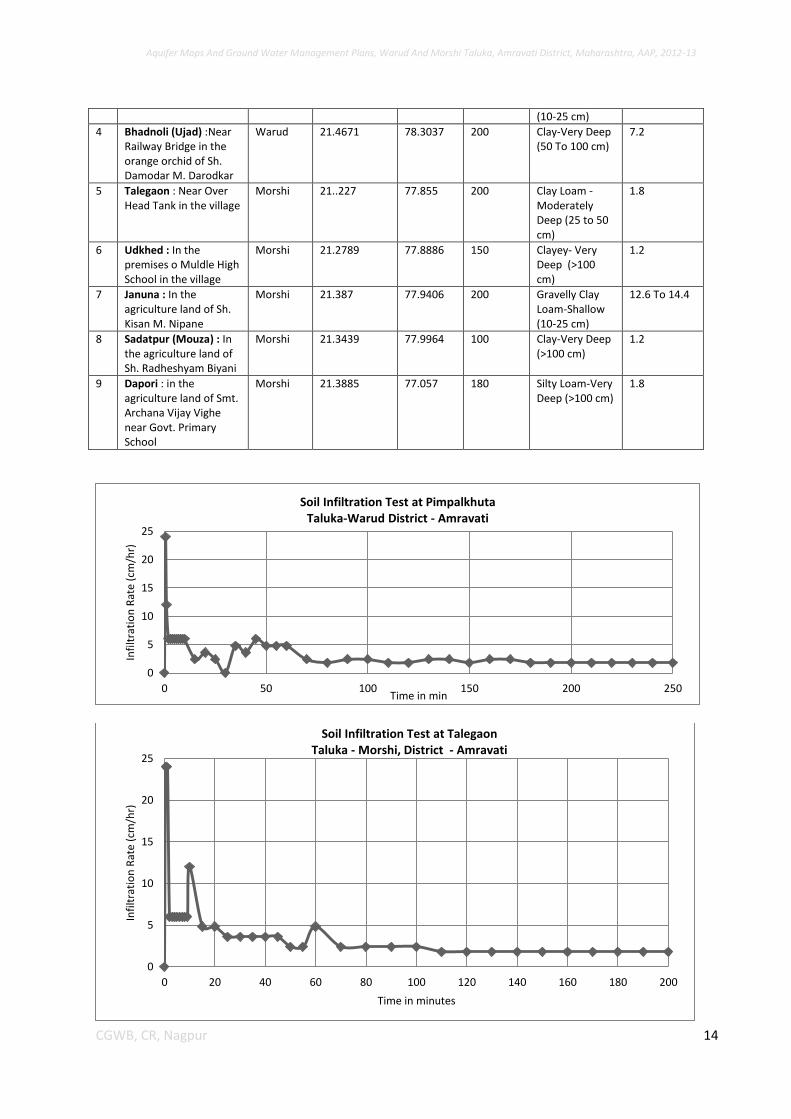
Table 2.1: Salient Features of Infiltration Tests
Sl. No
Village / Location Taluka Latitude ( Deg Dec)
Longitude (Deg Dec)
Test Duration (min)
Soil Type Infiltration Rate (cm/yr)
1 Pimpalkotha (Ujad) : in the Agriculture land of Sh. Liladhar Khasba opposite to Ganesh wadi
Warud 21.437 78.267 250 Clayey-Very Deep (> 100m)
1.8
2 Karanjgaon : in the agriculture land of Sh. Mohan M. Chimote in the outskrit of village on road to Loni
Warud 21.4045 78.2002 150 Clayey- Very Deep (>100 cm)
1.2
3 Kharad Pusla : Back side of Railway Station
Warud 21.4941 78.3551 300 Gravelly Clay Loam-Shallow
3.6
Aquifer Maps And Ground Water Management Plans, Warud And Morshi Taluka, Amravati District, Maharashtra, AAP, 2012-13
14 CGWB, CR, Nagpur
(10-25 cm)
4 Bhadnoli (Ujad) :Near Railway Bridge in the orange orchid of Sh. Damodar M. Darodkar
Warud 21.4671 78.3037 200 Clay-Very Deep (50 To 100 cm)
7.2
5 Talegaon : Near Over Head Tank in the village
Morshi 21..227 77.855 200 Clay Loam - Moderately Deep (25 to 50 cm)
1.8
6 Udkhed : In the premises o Muldle High School in the village
Morshi 21.2789 77.8886 150 Clayey- Very Deep (>100 cm)
1.2
7 Januna : In the agriculture land of Sh. Kisan M. Nipane
Morshi 21.387 77.9406 200 Gravelly Clay Loam-Shallow (10-25 cm)
12.6 To 14.4
8 Sadatpur (Mouza) : In the agriculture land of Sh. Radheshyam Biyani
Morshi 21.3439 77.9964 100 Clay-Very Deep (>100 cm)
1.2
9 Dapori : in the agriculture land of Smt. Archana Vijay Vighe near Govt. Primary School
Morshi 21.3885 77.057 180 Silty Loam-Very Deep (>100 cm)
1.8
0
5
10
15
20
25
0 50 100 150 200 250
Infi
ltra
tio
n R
ate
(cm
/hr)
Time in min
Soil Infiltration Test at Pimpalkhuta Taluka-Warud District - Amravati
0
5
10
15
20
25
0 20 40 60 80 100 120 140 160 180 200
Infi
ltra
tio
n R
ate
(cm
/hr)
Time in minutes
Soil Infiltration Test at Talegaon Taluka - Morshi, District - Amravati
Aquifer Maps And Ground Water Management Plans, Warud And Morshi Taluka, Amravati District, Maharashtra, AAP, 2012-13
15 CGWB, CR, Nagpur
0
5
10
15
20
25
0 50 100 150
Infi
ltra
tio
n R
ate
(cm
/hr)
Time in minutes
Soil Infiltration Test at Udkhed Taluka - Morshi, District - Amravati
0
5
10
15
20
25
30
35
40
0 50 100 150 200
Infi
ltra
tio
n R
ate
(cm
/hr)
Time in minutes
Soil Infiltration Test at Januna Taluka - Morshi, District - Amravati
0
5
10
15
20
25
0 50 100
Infi
ltra
tio
n R
ate
(cm
/hr)
Time in minutes
Soil Infiltration Test at Sadatpur Taluka - Morshi, District - Amravati
Aquifer Maps And Ground Water Management Plans, Warud And Morshi Taluka, Amravati District, Maharashtra, AAP, 2012-13
16 CGWB, CR, Nagpur
0
5
10
15
20
25
0 20 40 60 80 100 120 140 160 180 200
Infi
ltra
tio
n R
ate
(Cm
/hr)
Time in minutes
Soil Infiltration Test at Dapori Taluka - Morshi, District - Amravati
0
5
10
15
20
25
0 50 100 150
Infi
ltra
tio
n R
ate
(Cm
/hr)
Time in minutes
Soil Infiltration Test at Karanjgaon Taluka - Warud, District - Amravati
0
5
10
15
0 50 100 150 200 250 300
Infi
ltra
tio
n R
ate
(cm
/hr)
Time in minutes
Soil Infiltration Test at Kharad Taluka -Warud, District - Amravati
Aquifer Maps And Ground Water Management Plans, Warud And Morshi Taluka, Amravati District, Maharashtra, AAP, 2012-13
17 CGWB, CR, Nagpur
Fig.2.3: Soil Infiltration tests Plots, Warud and Morshi taluka, Amravati district.
2.2.6 Thematic Layers
The following five thematic layers were also generated on GIS platform, which supported the primary database and provided precise information to assess the present ground water scenario and also to propose the future management plan.
I. Drainage II. physiography
III. Geomorphology IV. Soil V. Land Use – Land Cover
VI. Geology and Structure
3 Data Interpretation, Integration and Aquifer Mapping The data collected and generated on various parameters viz., water levels, water quality,
exploration, aquifer parameters, geophysical, hydrology, hydrometeorology, irrigation, thematic layers was interpreted and integrated. Based on this the various aquifer characteristic maps on hydrogeology, aquifer wise water level scenario both current and long term scenarios, aquifer wise ground water quality, 2-D and 3-D sub surface disposition of aquifers by drawing fence and lithological sections, aquifer wise yield potential, aquifer wise resources, aquifer maps were generated and as discussed in details.
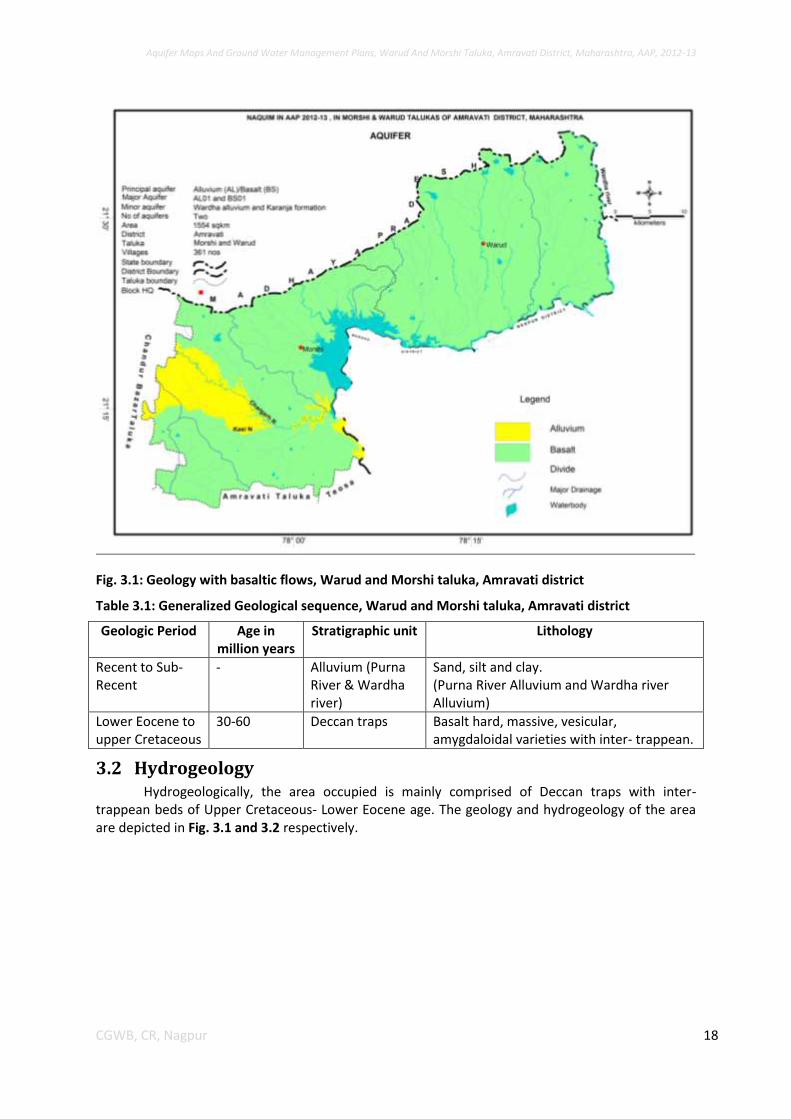
3.1 Geology Geologically, the area is divided into following two parts i.e., Deccan Trap Basalt, and
Alluvium formation. The generalized geological sequence occurring in the area is given in Table 3.1 and the geological map with basaltic flows is shown in Fig. 3.1.
0
10
20
30
40
50
60
70
80
90
100
0 20 40 60 80 100 120 140 160 180 200
Infi
ltra
tio
n R
ate
(Cm
/hr)
Time in minutes
Soil Infiltration Test at Bhandoli Taluka - Warud, District - Amravati
Aquifer Maps And Ground Water Management Plans, Warud And Morshi Taluka, Amravati District, Maharashtra, AAP, 2012-13
18 CGWB, CR, Nagpur
Fig. 3.1: Geology with basaltic flows, Warud and Morshi taluka, Amravati district
Table 3.1: Generalized Geological sequence, Warud and Morshi taluka, Amravati district
Geologic Period Age in million years
Stratigraphic unit Lithology
Recent to Sub-Recent
- Alluvium (Purna River & Wardha river)
Sand, silt and clay. (Purna River Alluvium and Wardha river Alluvium)
Lower Eocene to upper Cretaceous
30-60 Deccan traps Basalt hard, massive, vesicular, amygdaloidal varieties with inter- trappean.
3.2 Hydrogeology Hydrogeologically, the area occupied is mainly comprised of Deccan traps with inter-
trappean beds of Upper Cretaceous- Lower Eocene age. The geology and hydrogeology of the area are depicted in Fig. 3.1 and 3.2 respectively.
Aquifer Maps And Ground Water Management Plans, Warud And Morshi Taluka, Amravati District, Maharashtra, AAP, 2012-13
19 CGWB, CR, Nagpur
Fig. 3.2: Hydrogeology, Warud and Morshi taluka, Amravati district
The lava pile exposed within the altitude of 340 to 540 mamsl, consists of 15 basalt flows of ‘aa’ type occupying major part of the area. Each flow comprise of three units namely top vesicular basalt followed by fractured/massive basalt followed by massive basalt. Recent Alluvium is occupied along the Wardha River and its major tributaries. Also, a major part of the Central and Western Morshi taluka is occupied by the Purna river alluvium.
The yields of wells are functions of the permeability and transmissivity of aquifer encountered and vary with location, diameter, and depth etc. There are three types of ground water structures in the area i.e. dugwells, borewells and dug cum borewells (DCB). Dugwells are generally used for both domestic water supply and irrigation purposes in this area. It is observed that the dugwells varying from 5.60 m to around 30 m in depth in basaltic lava flows can sustain assured water supply for domestic needs of about 500 people throughout the year. The yield of dugwells in basalt for irrigation purposes varies from 20 to 90 m3/day. However, dugwells in alluvium and wells located in favourable area in basalt can yield 100 to 250 m3/day. Ground water is predominantly used for irrigation, as it is the major ground water utilising sector in these intense orange growing talukas. State government has drilled large number of borewells fitted with hand pumps and electric motors for rural drinking water purposes in the area. Yields of borewells range from 500 to 3000 lph. The ground water development in these talukas is mostly through dugwells.
3.2.1 Occurrence of Ground Water in Basalt and Alluvium (Shallow Aquifer-I)
Ground water occurs under phreatic/ unconfined to semi-confined conditions in basalts. Ground water occurs in unconfined state in shallow Aquifer-I tapped by dugwells of 5 to 30 m depth, water levels are ranging from 0.8 to 26.00 m bgl and yield varies from 1 to 3 lps. In alluvium aquifer,
Aquifer Maps And Ground Water Management Plans, Warud And Morshi Taluka, Amravati District, Maharashtra, AAP, 2012-13
20 CGWB, CR, Nagpur
ground water occurs in unconfined condition, observed in southwestern part of Morshi taluka. The aquifer generally occurs in the depth of 25 to 35 mbgl.
3.2.2 Occurrence of Ground Water in Basalt (Deeper Aquifer-II)
The deeper aquifer-II is also present and only observed in Basaltic terrain which is being tapped by borewells and it occurs to the depth <160 m bgl i.e., 30 to 200 mbgl, whereas the water level ranges from 6 to 30 m bgl with yield of 50 to 150 lpm.
3.3 Geophysical Survey (VES) Electrical resistivity surveys were carried out in these areas, to identify the ground water
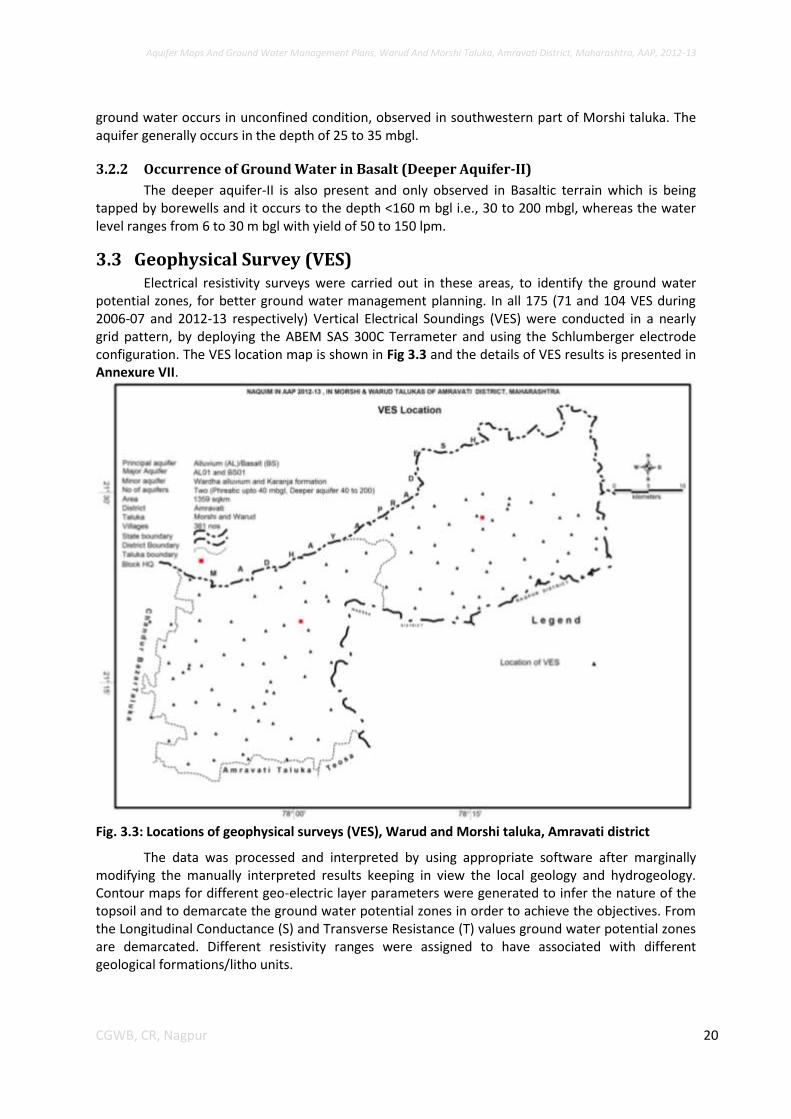
potential zones, for better ground water management planning. In all 175 (71 and 104 VES during 2006-07 and 2012-13 respectively) Vertical Electrical Soundings (VES) were conducted in a nearly grid pattern, by deploying the ABEM SAS 300C Terrameter and using the Schlumberger electrode configuration. The VES location map is shown in Fig 3.3 and the details of VES results is presented in Annexure VII.
Fig. 3.3: Locations of geophysical surveys (VES), Warud and Morshi taluka, Amravati district
The data was processed and interpreted by using appropriate software after marginally modifying the manually interpreted results keeping in view the local geology and hydrogeology. Contour maps for different geo-electric layer parameters were generated to infer the nature of the topsoil and to demarcate the ground water potential zones in order to achieve the objectives. From the Longitudinal Conductance (S) and Transverse Resistance (T) values ground water potential zones are demarcated. Different resistivity ranges were assigned to have associated with different geological formations/litho units.
Aquifer Maps And Ground Water Management Plans, Warud And Morshi Taluka, Amravati District, Maharashtra, AAP, 2012-13
21 CGWB, CR, Nagpur
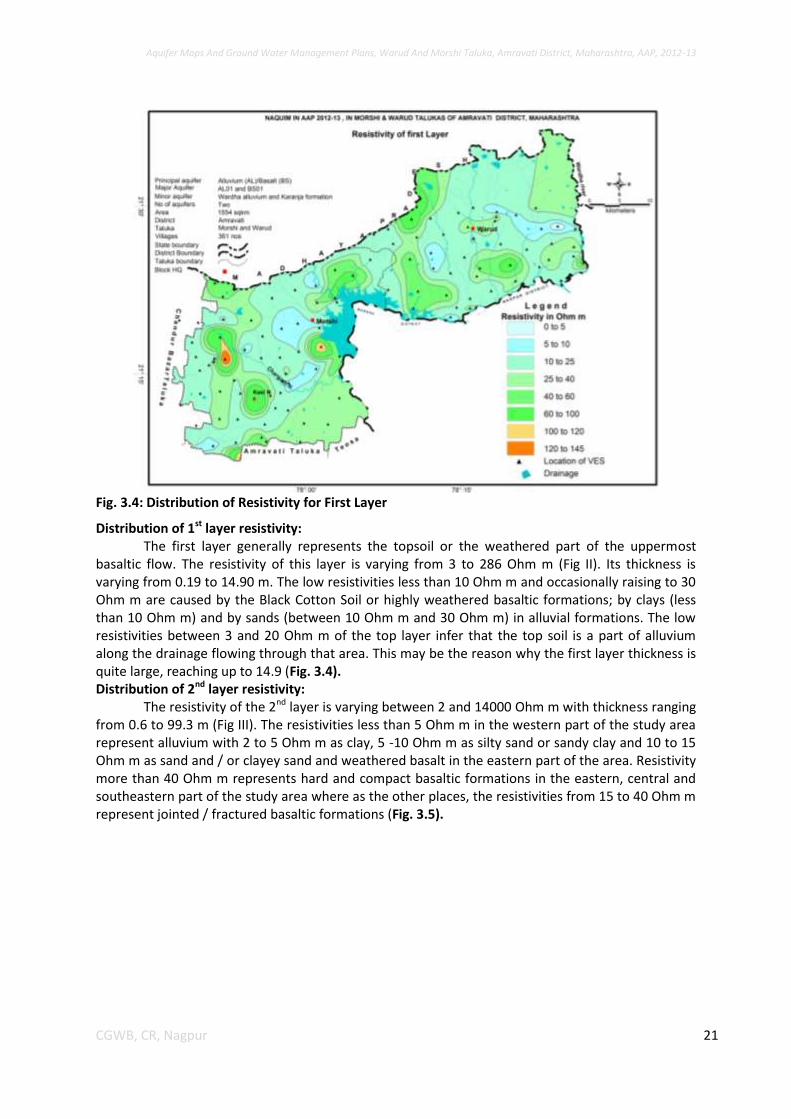
Fig. 3.4: Distribution of Resistivity for First Layer
Distribution of 1st layer resistivity: The first layer generally represents the topsoil or the weathered part of the uppermost
basaltic flow. The resistivity of this layer is varying from 3 to 286 Ohm m (Fig II). Its thickness is varying from 0.19 to 14.90 m. The low resistivities less than 10 Ohm m and occasionally raising to 30 Ohm m are caused by the Black Cotton Soil or highly weathered basaltic formations; by clays (less than 10 Ohm m) and by sands (between 10 Ohm m and 30 Ohm m) in alluvial formations. The low resistivities between 3 and 20 Ohm m of the top layer infer that the top soil is a part of alluvium along the drainage flowing through that area. This may be the reason why the first layer thickness is quite large, reaching up to 14.9 (Fig. 3.4). Distribution of 2nd layer resistivity:
The resistivity of the 2nd layer is varying between 2 and 14000 Ohm m with thickness ranging from 0.6 to 99.3 m (Fig III). The resistivities less than 5 Ohm m in the western part of the study area represent alluvium with 2 to 5 Ohm m as clay, 5 -10 Ohm m as silty sand or sandy clay and 10 to 15 Ohm m as sand and / or clayey sand and weathered basalt in the eastern part of the area. Resistivity more than 40 Ohm m represents hard and compact basaltic formations in the eastern, central and southeastern part of the study area where as the other places, the resistivities from 15 to 40 Ohm m represent jointed / fractured basaltic formations (Fig. 3.5).
Aquifer Maps And Ground Water Management Plans, Warud And Morshi Taluka, Amravati District, Maharashtra, AAP, 2012-13
22 CGWB, CR, Nagpur
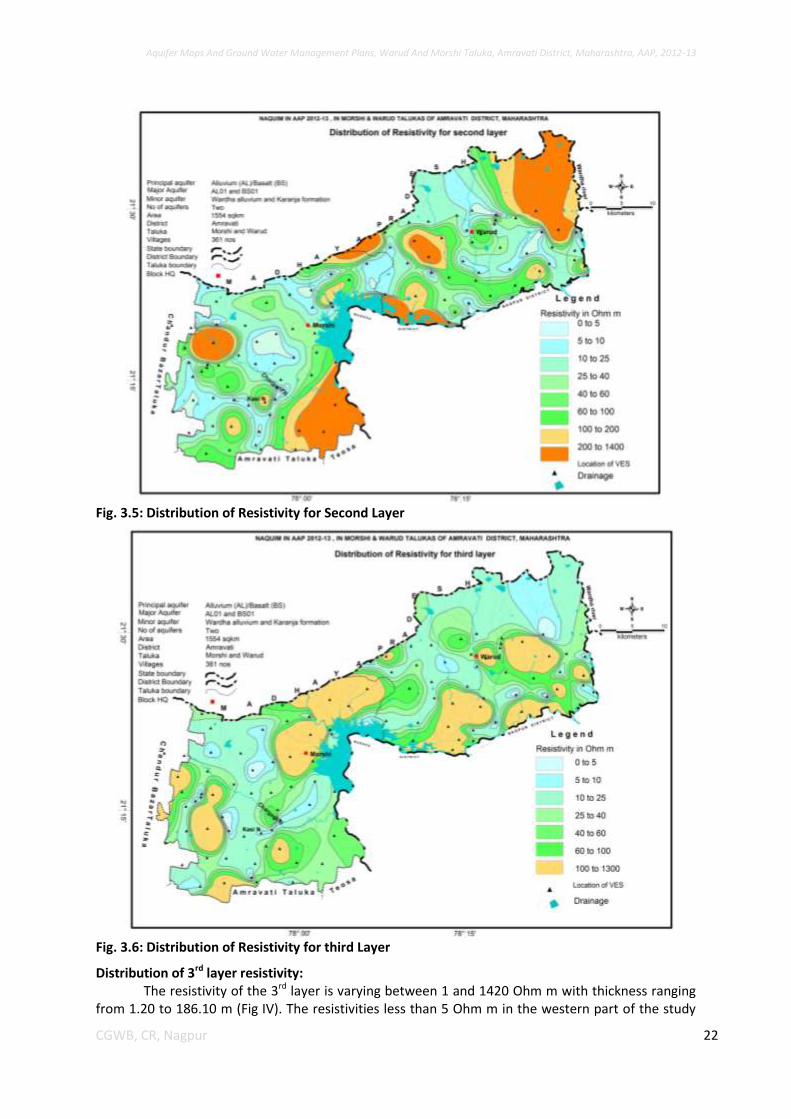
Fig. 3.5: Distribution of Resistivity for Second Layer
Fig. 3.6: Distribution of Resistivity for third Layer
Distribution of 3rd layer resistivity: The resistivity of the 3rd layer is varying between 1 and 1420 Ohm m with thickness ranging
from 1.20 to 186.10 m (Fig IV). The resistivities less than 5 Ohm m in the western part of the study
Aquifer Maps And Ground Water Management Plans, Warud And Morshi Taluka, Amravati District, Maharashtra, AAP, 2012-13
23 CGWB, CR, Nagpur
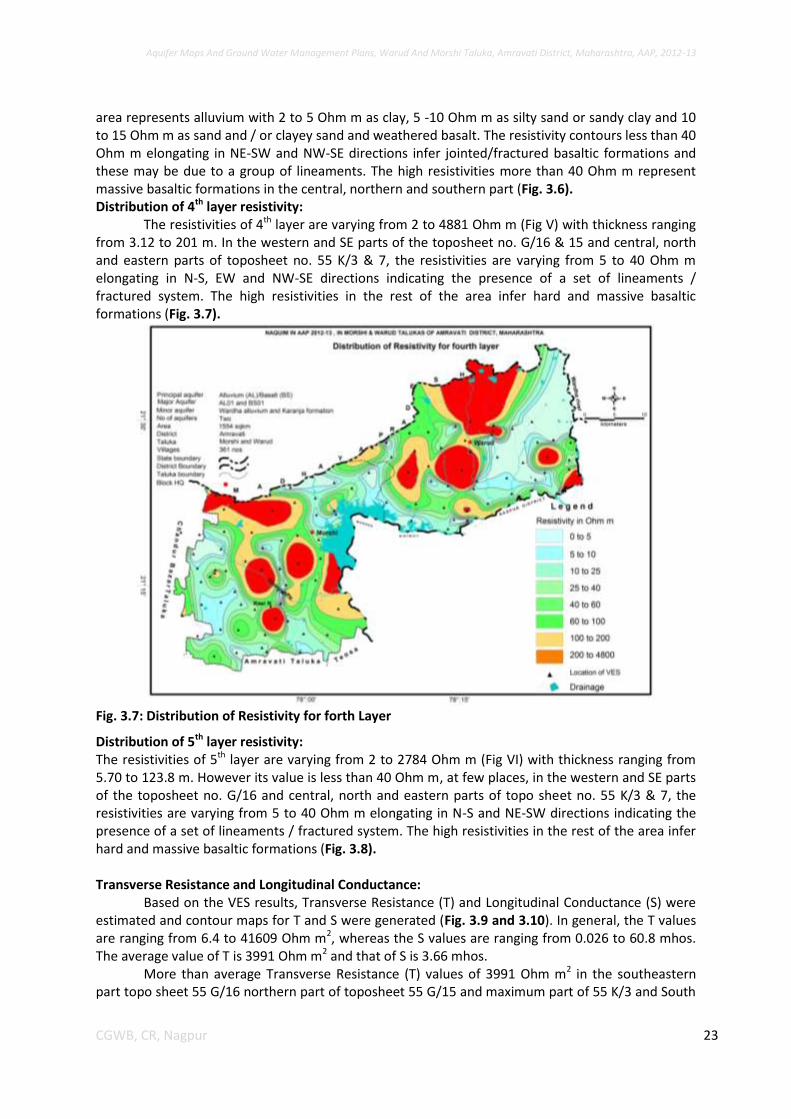
area represents alluvium with 2 to 5 Ohm m as clay, 5 -10 Ohm m as silty sand or sandy clay and 10 to 15 Ohm m as sand and / or clayey sand and weathered basalt. The resistivity contours less than 40 Ohm m elongating in NE-SW and NW-SE directions infer jointed/fractured basaltic formations and these may be due to a group of lineaments. The high resistivities more than 40 Ohm m represent massive basaltic formations in the central, northern and southern part (Fig. 3.6). Distribution of 4th layer resistivity:
The resistivities of 4th layer are varying from 2 to 4881 Ohm m (Fig V) with thickness ranging from 3.12 to 201 m. In the western and SE parts of the toposheet no. G/16 & 15 and central, north and eastern parts of toposheet no. 55 K/3 & 7, the resistivities are varying from 5 to 40 Ohm m elongating in N-S, EW and NW-SE directions indicating the presence of a set of lineaments / fractured system. The high resistivities in the rest of the area infer hard and massive basaltic formations (Fig. 3.7).
Fig. 3.7: Distribution of Resistivity for forth Layer
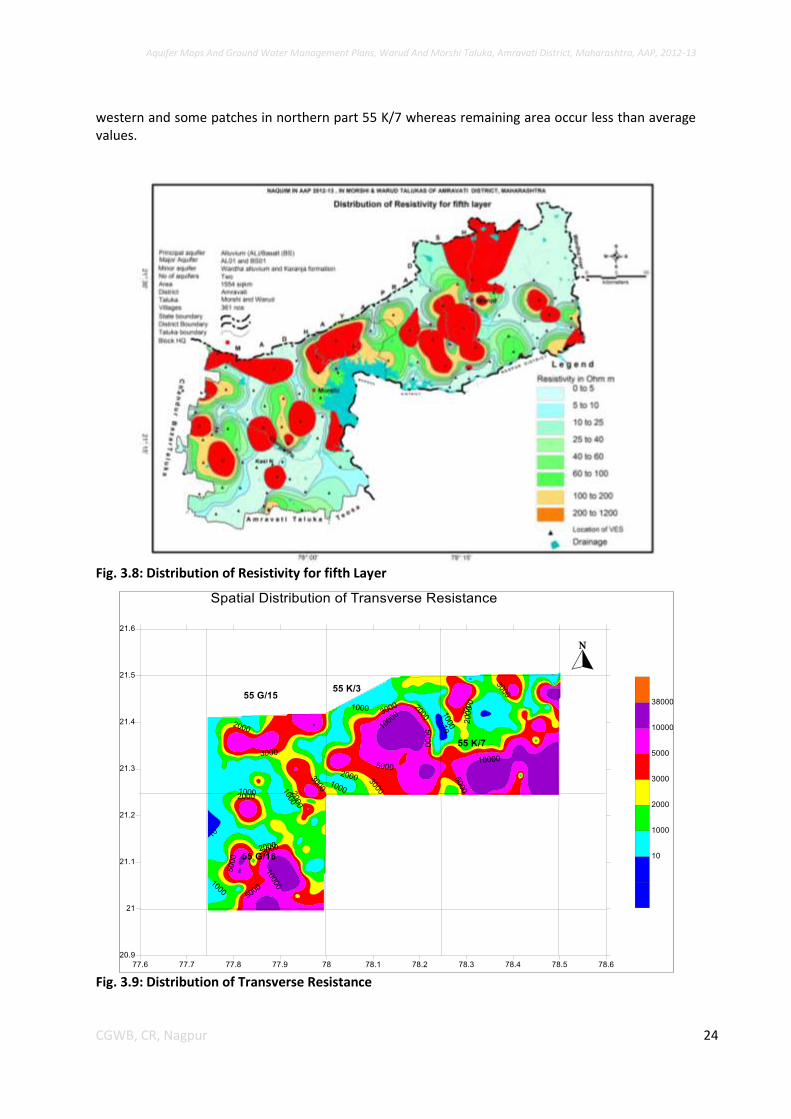
Distribution of 5th layer resistivity: The resistivities of 5th layer are varying from 2 to 2784 Ohm m (Fig VI) with thickness ranging from 5.70 to 123.8 m. However its value is less than 40 Ohm m, at few places, in the western and SE parts of the toposheet no. G/16 and central, north and eastern parts of topo sheet no. 55 K/3 & 7, the resistivities are varying from 5 to 40 Ohm m elongating in N-S and NE-SW directions indicating the presence of a set of lineaments / fractured system. The high resistivities in the rest of the area infer hard and massive basaltic formations (Fig. 3.8). Transverse Resistance and Longitudinal Conductance:
Based on the VES results, Transverse Resistance (T) and Longitudinal Conductance (S) were estimated and contour maps for T and S were generated (Fig. 3.9 and 3.10). In general, the T values are ranging from 6.4 to 41609 Ohm m2, whereas the S values are ranging from 0.026 to 60.8 mhos. The average value of T is 3991 Ohm m2 and that of S is 3.66 mhos.
More than average Transverse Resistance (T) values of 3991 Ohm m2 in the southeastern part topo sheet 55 G/16 northern part of toposheet 55 G/15 and maximum part of 55 K/3 and South
Aquifer Maps And Ground Water Management Plans, Warud And Morshi Taluka, Amravati District, Maharashtra, AAP, 2012-13
24 CGWB, CR, Nagpur
western and some patches in northern part 55 K/7 whereas remaining area occur less than average values.
Fig. 3.8: Distribution of Resistivity for fifth Layer
Fig. 3.9: Distribution of Transverse Resistance
Aquifer Maps And Ground Water Management Plans, Warud And Morshi Taluka, Amravati District, Maharashtra, AAP, 2012-13
25 CGWB, CR, Nagpur
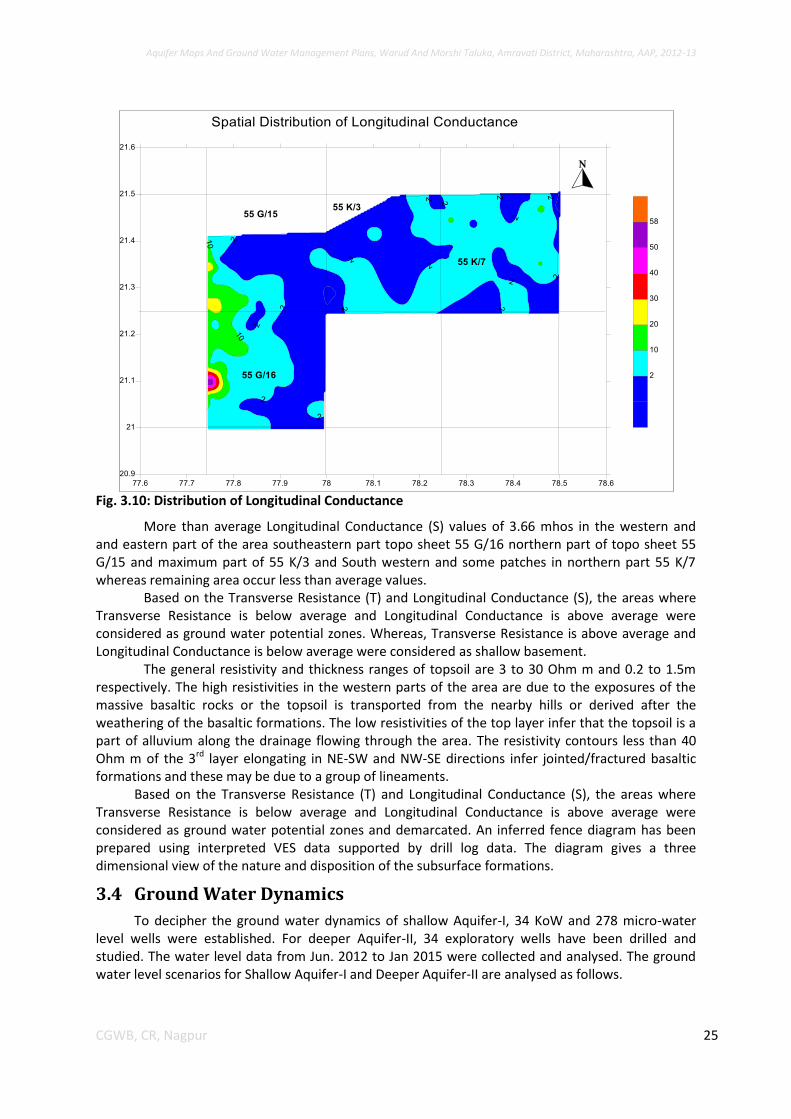
Fig. 3.10: Distribution of Longitudinal Conductance
More than average Longitudinal Conductance (S) values of 3.66 mhos in the western and and eastern part of the area southeastern part topo sheet 55 G/16 northern part of topo sheet 55 G/15 and maximum part of 55 K/3 and South western and some patches in northern part 55 K/7 whereas remaining area occur less than average values.
Based on the Transverse Resistance (T) and Longitudinal Conductance (S), the areas where Transverse Resistance is below average and Longitudinal Conductance is above average were considered as ground water potential zones. Whereas, Transverse Resistance is above average and Longitudinal Conductance is below average were considered as shallow basement.
The general resistivity and thickness ranges of topsoil are 3 to 30 Ohm m and 0.2 to 1.5m respectively. The high resistivities in the western parts of the area are due to the exposures of the massive basaltic rocks or the topsoil is transported from the nearby hills or derived after the weathering of the basaltic formations. The low resistivities of the top layer infer that the topsoil is a part of alluvium along the drainage flowing through the area. The resistivity contours less than 40 Ohm m of the 3rd layer elongating in NE-SW and NW-SE directions infer jointed/fractured basaltic formations and these may be due to a group of lineaments.
Based on the Transverse Resistance (T) and Longitudinal Conductance (S), the areas where Transverse Resistance is below average and Longitudinal Conductance is above average were considered as ground water potential zones and demarcated. An inferred fence diagram has been prepared using interpreted VES data supported by drill log data. The diagram gives a three dimensional view of the nature and disposition of the subsurface formations.
3.4 Ground Water Dynamics
To decipher the ground water dynamics of shallow Aquifer-I, 34 KoW and 278 micro-water level wells were established. For deeper Aquifer-II, 34 exploratory wells have been drilled and studied. The water level data from Jun. 2012 to Jan 2015 were collected and analysed. The ground water level scenarios for Shallow Aquifer-I and Deeper Aquifer-II are analysed as follows.
Aquifer Maps And Ground Water Management Plans, Warud And Morshi Taluka, Amravati District, Maharashtra, AAP, 2012-13
26 CGWB, CR, Nagpur
3.4.1 Depth to water level (Shallow Aquifer-I)
To understand the depth to water level scenario in Warud and Morshi Talukas, water level measurement from all the key observation wells (KOW) were carried out in the month of May and November. The pre and post monsoon data collected from these KOWs along with data collected by CGWB and GSDA, GoM from there network monitoring stations have been used to ascertain the water level scenario and preparation of depth to water level maps of the area.
3.4.1.1 Pre-monsoon Depth to Water Level (2012, 2013 and 2014)
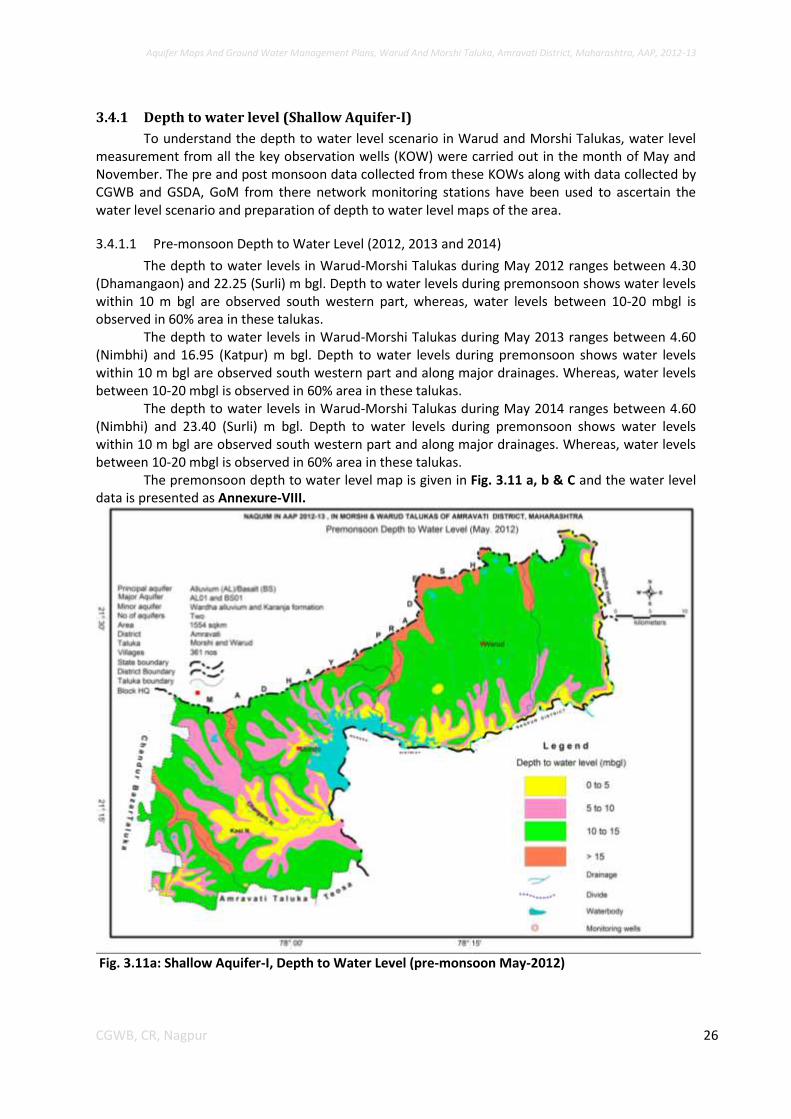
The depth to water levels in Warud-Morshi Talukas during May 2012 ranges between 4.30 (Dhamangaon) and 22.25 (Surli) m bgl. Depth to water levels during premonsoon shows water levels within 10 m bgl are observed south western part, whereas, water levels between 10-20 mbgl is observed in 60% area in these talukas.
The depth to water levels in Warud-Morshi Talukas during May 2013 ranges between 4.60 (Nimbhi) and 16.95 (Katpur) m bgl. Depth to water levels during premonsoon shows water levels within 10 m bgl are observed south western part and along major drainages. Whereas, water levels between 10-20 mbgl is observed in 60% area in these talukas.
The depth to water levels in Warud-Morshi Talukas during May 2014 ranges between 4.60 (Nimbhi) and 23.40 (Surli) m bgl. Depth to water levels during premonsoon shows water levels within 10 m bgl are observed south western part and along major drainages. Whereas, water levels between 10-20 mbgl is observed in 60% area in these talukas.
The premonsoon depth to water level map is given in Fig. 3.11 a, b & C and the water level data is presented as Annexure-VIII.
Fig. 3.11a: Shallow Aquifer-I, Depth to Water Level (pre-monsoon May-2012)
Aquifer Maps And Ground Water Management Plans, Warud And Morshi Taluka, Amravati District, Maharashtra, AAP, 2012-13
27 CGWB, CR, Nagpur
Fig. 3.11b: Shallow Aquifer-I, Depth to Water Level (pre-monsoon May-2013)
Fig. 3.11c: Shallow Aquifer-I, Depth to Water Level (pre-monsoon May-2014)
Aquifer Maps And Ground Water Management Plans, Warud And Morshi Taluka, Amravati District, Maharashtra, AAP, 2012-13
28 CGWB, CR, Nagpur
3.4.1.2 Post-monsoon Depth to Water Level (2012, 2013 and 2014) The depth to water levels in Warud-Morshi Talukas during Nov 2012 ranges between 0.70
(Taroda) and 16.60 (Loni) m bgl. Except small isolated patch in western part, where water level is more than 10 mbgl, rest of the area shows Depth to water levels during postmonsoon within 10 m bgl.
The depth to water levels in Warud-Morshi Talukas during Nov 2013 ranges between 1.30 (Pardi) and 13.80 (Jarud) m bgl. Except small isolated patch in western part, where water level is more than 10 mbgl, rest of the area shows Depth to water levels during postmonsoon within 10 m bgl.
The depth to water levels in Warud-Morshi Talukas during Nov 2014 ranges between 1.85 (Nimbhi) and 14.30 (Jarud, Uthkhed) m bgl. Except small isolated patch in western part, where water level is more than 10 mbgl, rest of the area shows Depth to water levels during postmonsoon within 10 m bgl.
The post monsoon depth to water level map is given in Fig. 3.12 a, b & C and the water level data is presented as Annexure-VIII.
Fig. 3.12a: Shallow Aquifer-I, Depth to Water Level (post-monsoon Nov.-2012)
Aquifer Maps And Ground Water Management Plans, Warud And Morshi Taluka, Amravati District, Maharashtra, AAP, 2012-13
29 CGWB, CR, Nagpur
Fig. 3.12b: Shallow Aquifer-I, Depth to Water Level (post-monsoon Nov-2013)
Fig. 3.12c: Shallow Aquifer-I, Depth to Water Level (post-monsoon Nov-2014)
Aquifer Maps And Ground Water Management Plans, Warud And Morshi Taluka, Amravati District, Maharashtra, AAP, 2012-13
30 CGWB, CR, Nagpur
3.4.2 Depth to water level (Deeper Aquifer-II)
In Aquifer-II, the depth to water levels in Warud-Morshi Talukas during May 2014 ranges between 3.80 m bgl (Talegaon) and >100 m bgl (Sawangi). The deeper DTWL (>50 m bgl) has been observed in northern and central part of the Warud taluka and NW part of the Morshi taluka. The Shallow DTWL (upto 10 m bgl) has been observed in central part of the area, particularly in the vicinity of the Upper Wardha dam. The water levels between 10-20 mbgl has been observed in SW and eastern part followed by the water level 20-50 mbgl. The premonsoon depth to water level for Aquifer –II is given in Fig.3.13a and the details are presented in Annexure IX.
Fig. 3.13a: Deeper Aquifer-II, Depth to Water Level (pre-monsoon May-2014) The post-monsoon DTWL ranges from 3.20 m bgl (Talegaon) and >100 m bgl (Sawangi) in
Aquifer-II and presented in Fig. 3.13b. The area representing post monsoon DTWL in Aquifer is more or less same except small variation in the areas.
Aquifer Maps And Ground Water Management Plans, Warud And Morshi Taluka, Amravati District, Maharashtra, AAP, 2012-13
31 CGWB, CR, Nagpur
Fig. 3.13b: Deeper Aquifer-II, Depth to Water Level (post-monsoon May-2014)
3.4.3 Water Level Fluctuation, Shallow Aquifer-I
The water level measured during pre and post monsoon period was used to calculate the fluctuation. The pre and post monsoon change in DTWL (mean May / Nov. 2012-13 wrt May / Nov. 2014) was obtained from difference in water level during pre and post monsoon water level. In the area, number of wells and their percentage falling in each fluctuation range is presented in Fig. 3.14a and b.
Fig. 3.14a: Shallow Aquifer-I, Premonsoon change in DTWL (Mean May 2012-13 wrt May 2014) The water level fluctuations are grouped under three categories and are discussed under.
0-2 m and 2-4 m - Less water level fluctuation
4-6 m and - Moderate water level fluctuation 6-8 m - High water level fluctuation
During pre and post monsoon period it has been observed that, most of the area is showing fall in ground water level when compared with Mean May/Nov 2012-13 wrt May/Nov. 2014. The fall ranges from negligible to -1.6 m. However, at some places rise in ground water level has been observed in isolated patches ranging from negligible to 0.8 m.
3.4.4 Depth to Water Level Trend (2005-14)
Based on the CGWB’s GWMW and Observation wells of GSDA, Amravati, the long-term trend of water levels for pre-monsoon and post-monsoon periods for the last ten years (2005-14) have
Aquifer Maps And Ground Water Management Plans, Warud And Morshi Taluka, Amravati District, Maharashtra, AAP, 2012-13
32 CGWB, CR, Nagpur
been computed. The long term water level datat of 18 GWMW of CGWB and 36 OB Wells of GSDA has been utilised. The maps depicting the special variation in long-term water level trend in pre and post monsoon is presented as Fig 3.15 and 3.16 respectively. The data is presented in Annexure X.
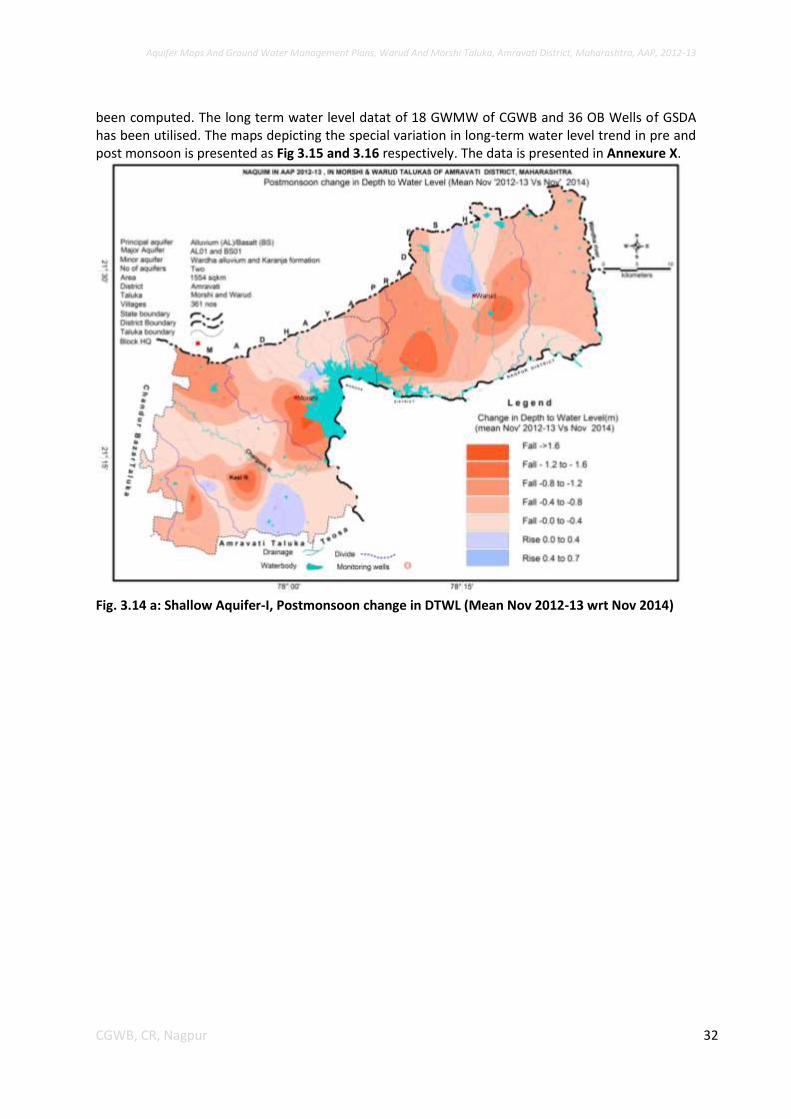
Fig. 3.14 a: Shallow Aquifer-I, Postmonsoon change in DTWL (Mean Nov 2012-13 wrt Nov 2014)
Aquifer Maps And Ground Water Management Plans, Warud And Morshi Taluka, Amravati District, Maharashtra, AAP, 2012-13
33 CGWB, CR, Nagpur
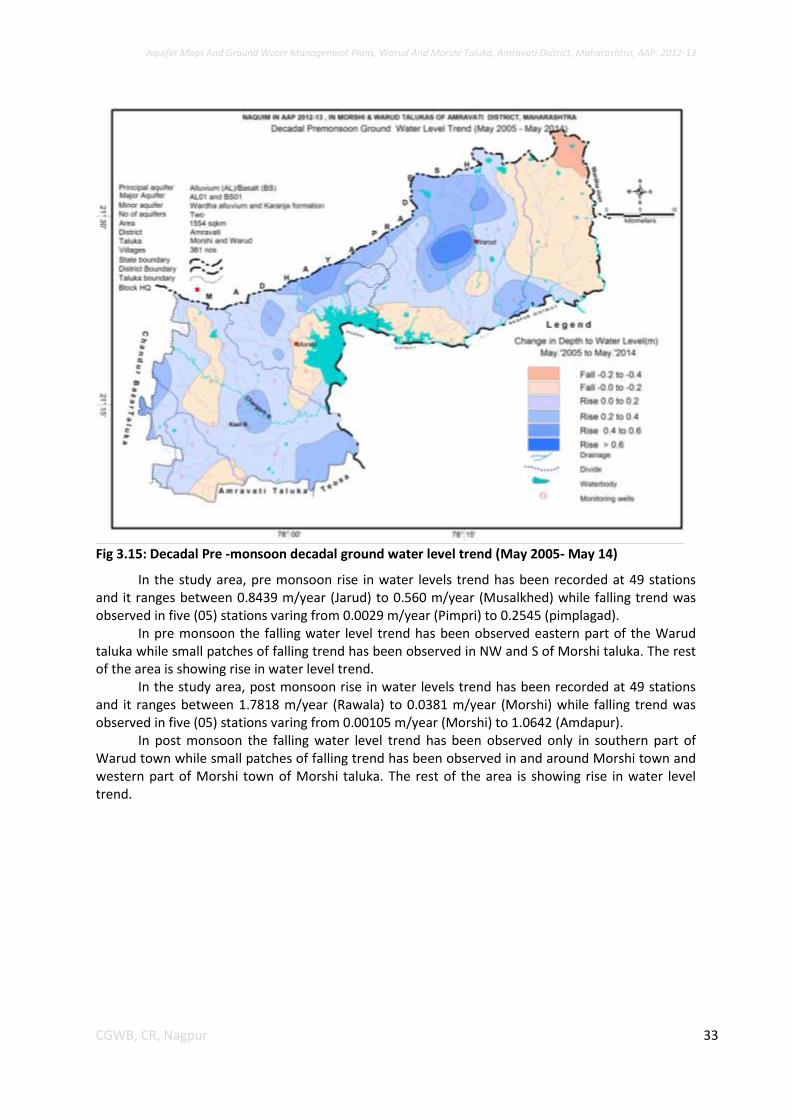
Fig 3.15: Decadal Pre -monsoon decadal ground water level trend (May 2005- May 14)
In the study area, pre monsoon rise in water levels trend has been recorded at 49 stations and it ranges between 0.8439 m/year (Jarud) to 0.560 m/year (Musalkhed) while falling trend was observed in five (05) stations varing from 0.0029 m/year (Pimpri) to 0.2545 (pimplagad).
In pre monsoon the falling water level trend has been observed eastern part of the Warud taluka while small patches of falling trend has been observed in NW and S of Morshi taluka. The rest of the area is showing rise in water level trend.
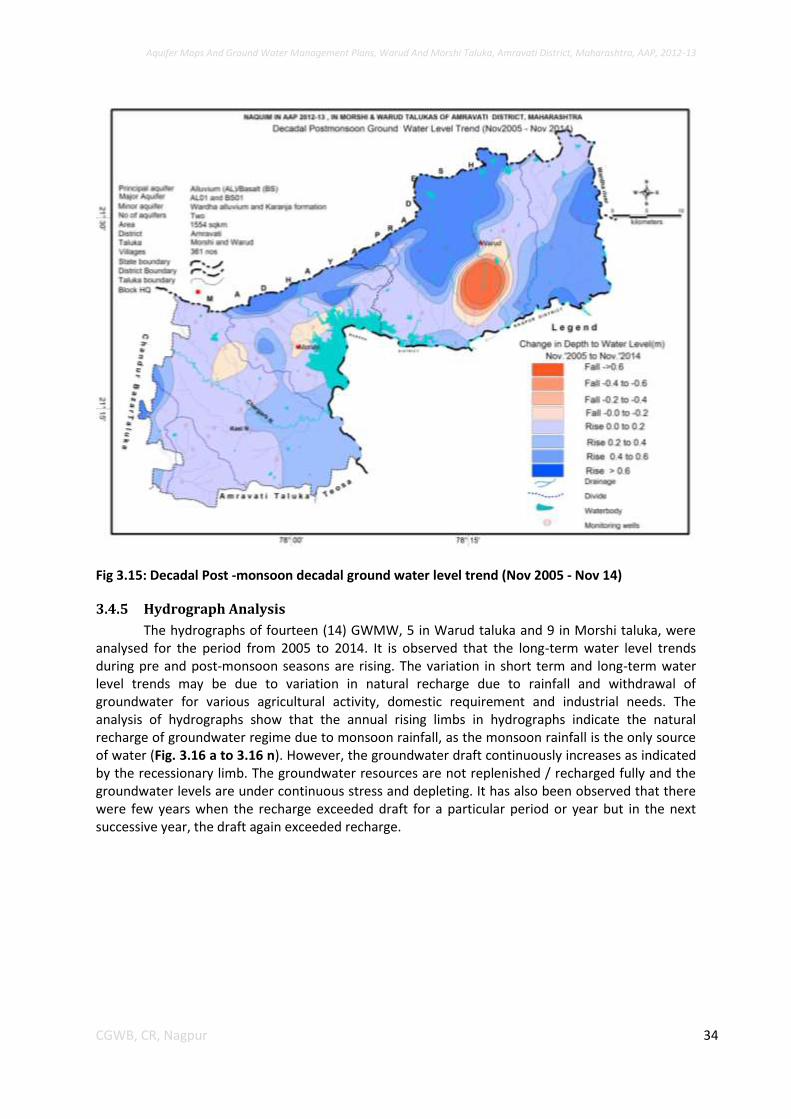
In the study area, post monsoon rise in water levels trend has been recorded at 49 stations and it ranges between 1.7818 m/year (Rawala) to 0.0381 m/year (Morshi) while falling trend was observed in five (05) stations varing from 0.00105 m/year (Morshi) to 1.0642 (Amdapur).
In post monsoon the falling water level trend has been observed only in southern part of Warud town while small patches of falling trend has been observed in and around Morshi town and western part of Morshi town of Morshi taluka. The rest of the area is showing rise in water level trend.
Aquifer Maps And Ground Water Management Plans, Warud And Morshi Taluka, Amravati District, Maharashtra, AAP, 2012-13
34 CGWB, CR, Nagpur
Fig 3.15: Decadal Post -monsoon decadal ground water level trend (Nov 2005 - Nov 14)
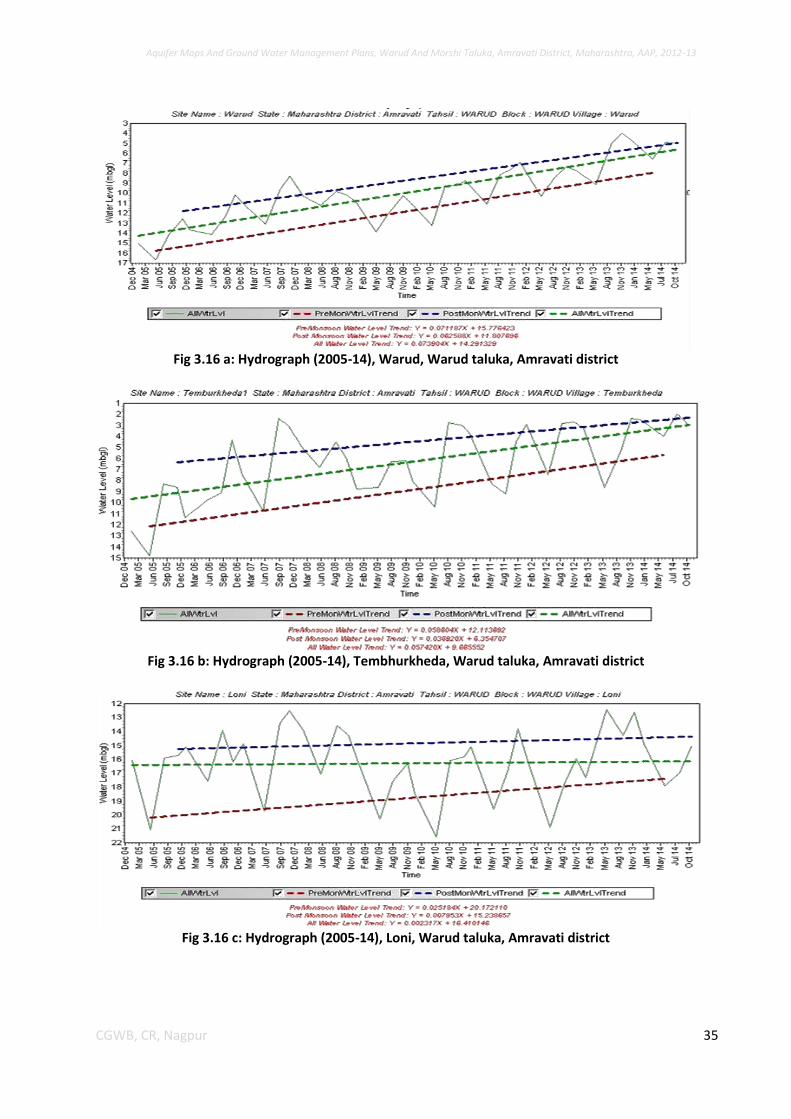
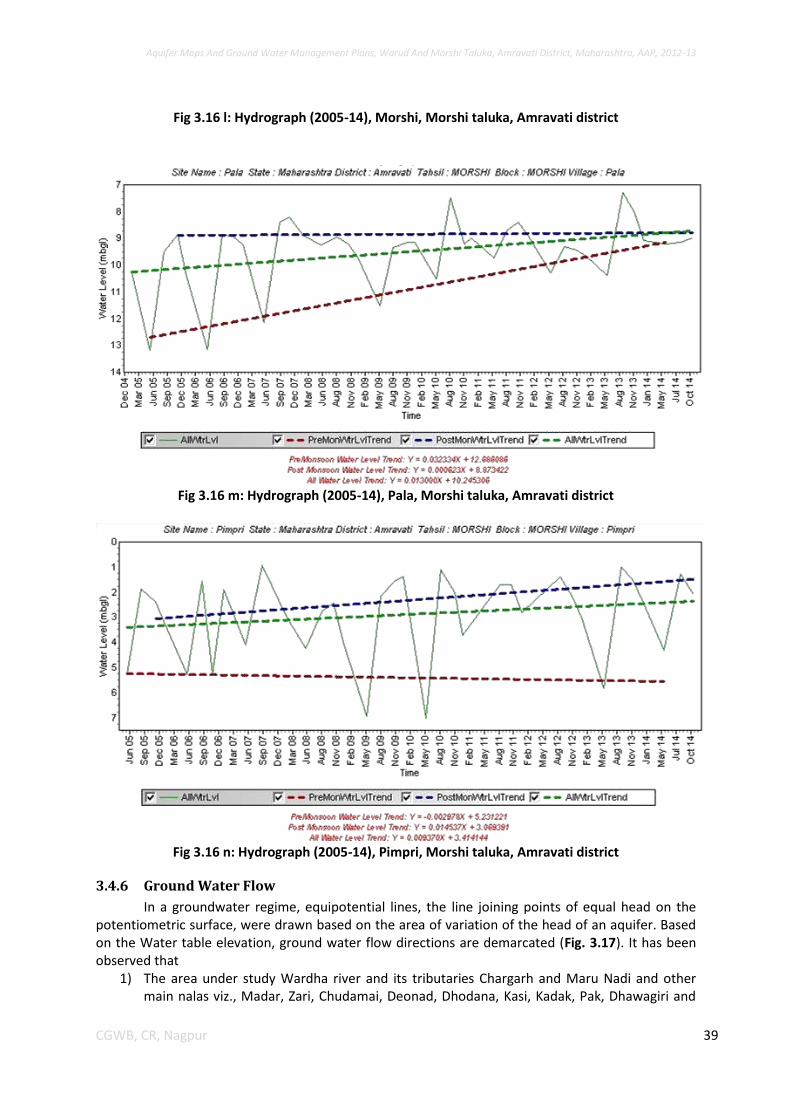
3.4.5 Hydrograph Analysis
The hydrographs of fourteen (14) GWMW, 5 in Warud taluka and 9 in Morshi taluka, were analysed for the period from 2005 to 2014. It is observed that the long-term water level trends during pre and post-monsoon seasons are rising. The variation in short term and long-term water level trends may be due to variation in natural recharge due to rainfall and withdrawal of groundwater for various agricultural activity, domestic requirement and industrial needs. The analysis of hydrographs show that the annual rising limbs in hydrographs indicate the natural recharge of groundwater regime due to monsoon rainfall, as the monsoon rainfall is the only source of water (Fig. 3.16 a to 3.16 n). However, the groundwater draft continuously increases as indicated by the recessionary limb. The groundwater resources are not replenished / recharged fully and the groundwater levels are under continuous stress and depleting. It has also been observed that there were few years when the recharge exceeded draft for a particular period or year but in the next successive year, the draft again exceeded recharge.
Aquifer Maps And Ground Water Management Plans, Warud And Morshi Taluka, Amravati District, Maharashtra, AAP, 2012-13
35 CGWB, CR, Nagpur
Fig 3.16 a: Hydrograph (2005-14), Warud, Warud taluka, Amravati district
Fig 3.16 b: Hydrograph (2005-14), Tembhurkheda, Warud taluka, Amravati district
Fig 3.16 c: Hydrograph (2005-14), Loni, Warud taluka, Amravati district
Aquifer Maps And Ground Water Management Plans, Warud And Morshi Taluka, Amravati District, Maharashtra, AAP, 2012-13
36 CGWB, CR, Nagpur
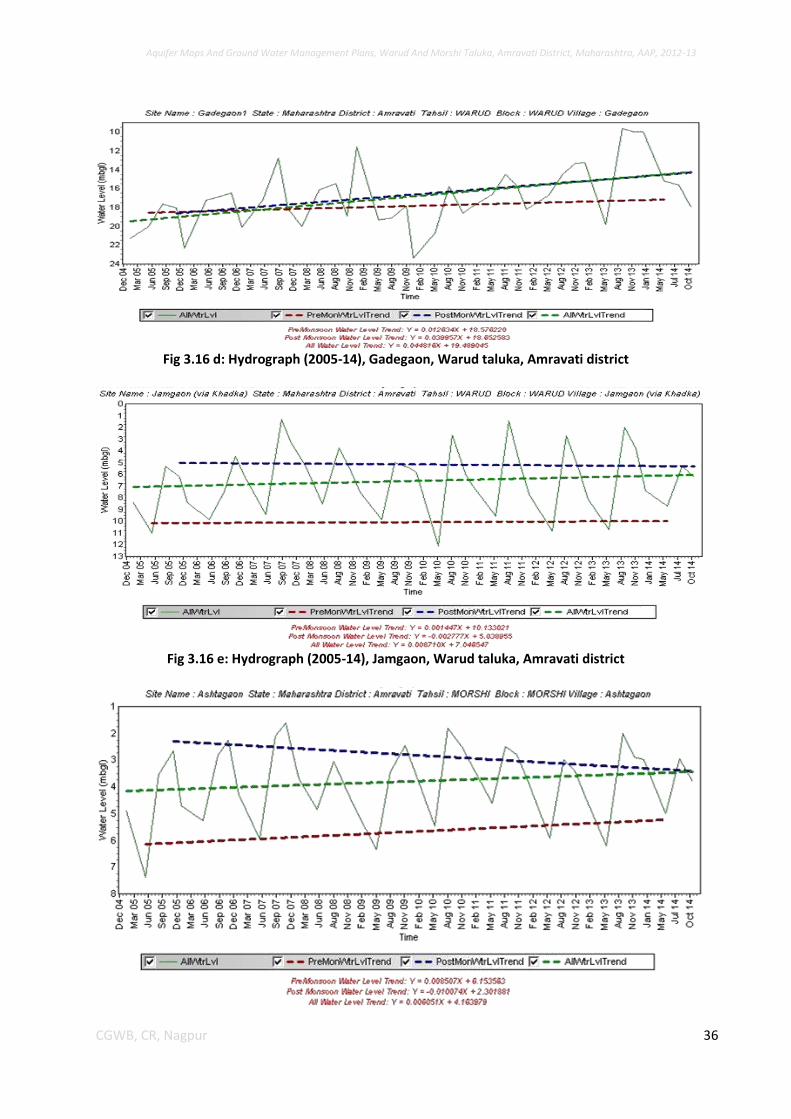
Fig 3.16 d: Hydrograph (2005-14), Gadegaon, Warud taluka, Amravati district
Fig 3.16 e: Hydrograph (2005-14), Jamgaon, Warud taluka, Amravati district
Aquifer Maps And Ground Water Management Plans, Warud And Morshi Taluka, Amravati District, Maharashtra, AAP, 2012-13
37 CGWB, CR, Nagpur
Fig 3.16 f: Hydrograph (2005-14), Ashtgaon, Morshi taluka, Amravati district
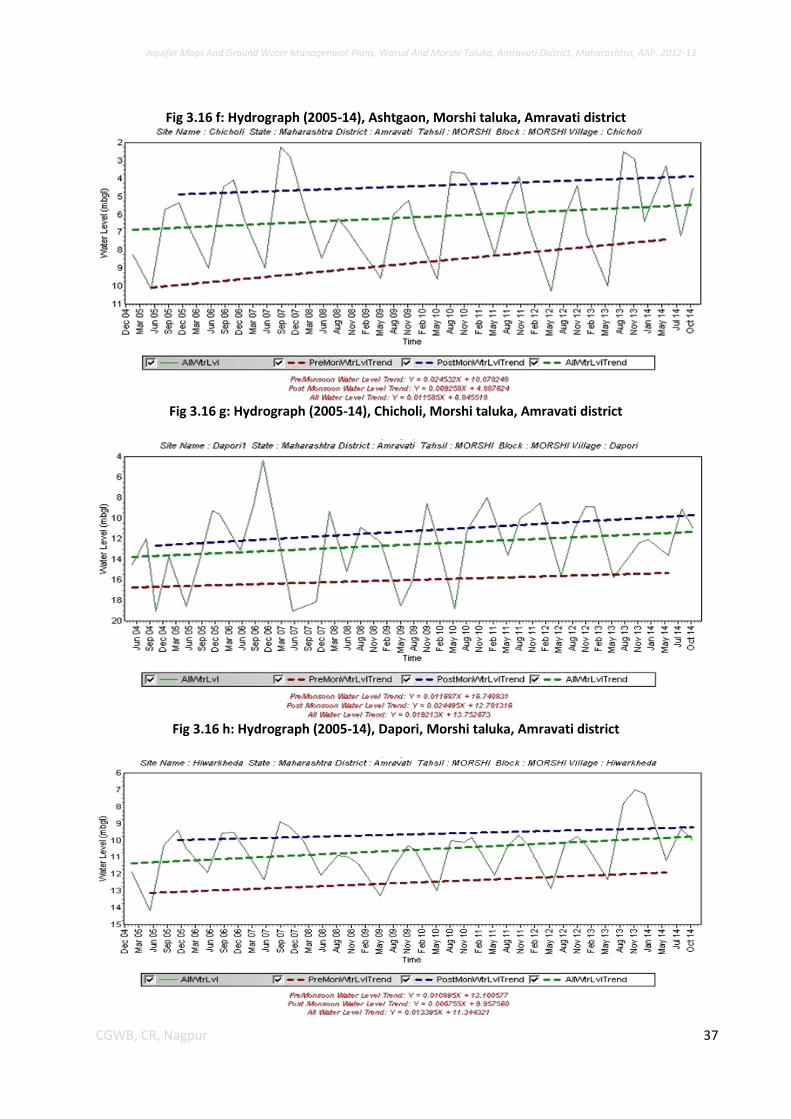
Fig 3.16 g: Hydrograph (2005-14), Chicholi, Morshi taluka, Amravati district
Fig 3.16 h: Hydrograph (2005-14), Dapori, Morshi taluka, Amravati district
Aquifer Maps And Ground Water Management Plans, Warud And Morshi Taluka, Amravati District, Maharashtra, AAP, 2012-13
38 CGWB, CR, Nagpur
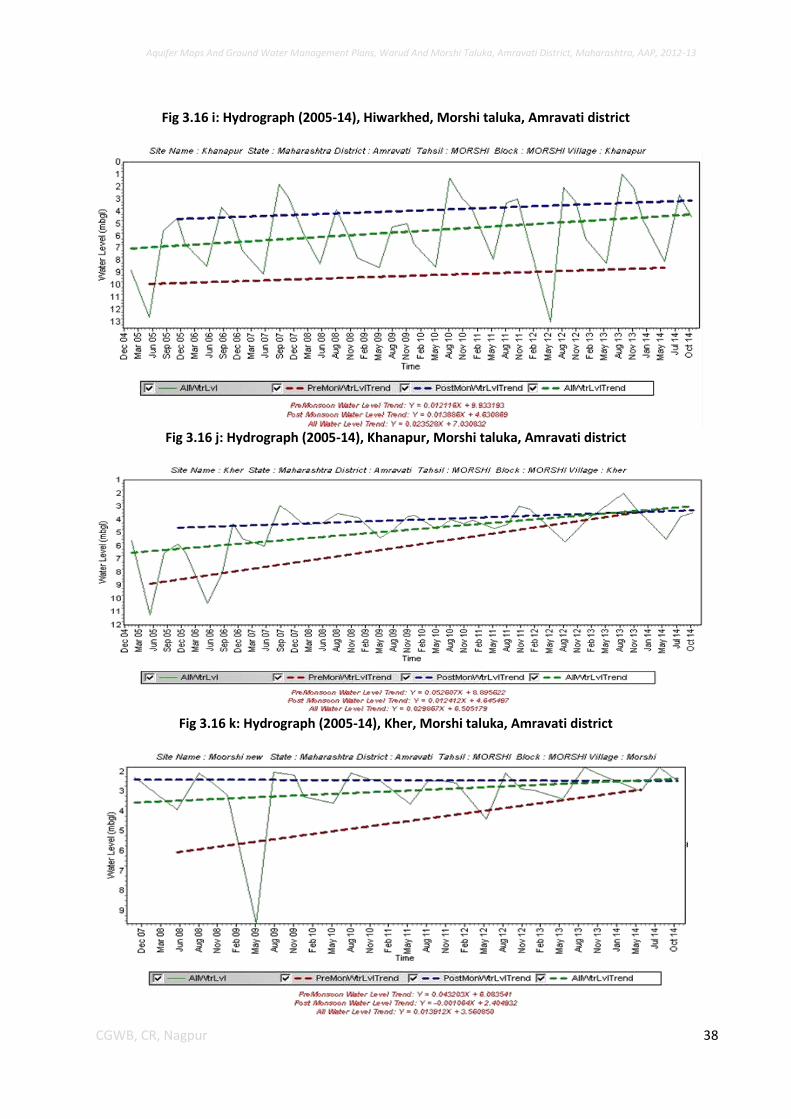
Fig 3.16 i: Hydrograph (2005-14), Hiwarkhed, Morshi taluka, Amravati district
Fig 3.16 j: Hydrograph (2005-14), Khanapur, Morshi taluka, Amravati district
Fig 3.16 k: Hydrograph (2005-14), Kher, Morshi taluka, Amravati district
Aquifer Maps And Ground Water Management Plans, Warud And Morshi Taluka, Amravati District, Maharashtra, AAP, 2012-13
39 CGWB, CR, Nagpur
Fig 3.16 l: Hydrograph (2005-14), Morshi, Morshi taluka, Amravati district
Fig 3.16 m: Hydrograph (2005-14), Pala, Morshi taluka, Amravati district
Fig 3.16 n: Hydrograph (2005-14), Pimpri, Morshi taluka, Amravati district
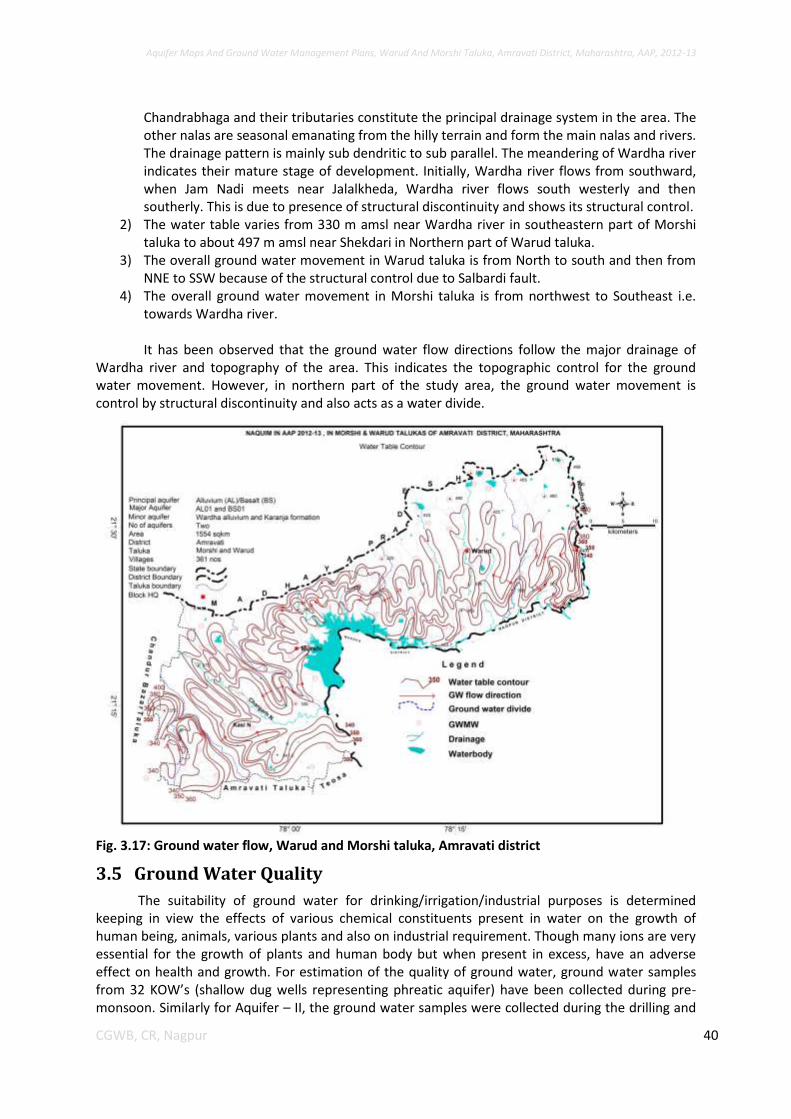
3.4.6 Ground Water Flow
In a groundwater regime, equipotential lines, the line joining points of equal head on the potentiometric surface, were drawn based on the area of variation of the head of an aquifer. Based on the Water table elevation, ground water flow directions are demarcated (Fig. 3.17). It has been observed that
1) The area under study Wardha river and its tributaries Chargarh and Maru Nadi and other main nalas viz., Madar, Zari, Chudamai, Deonad, Dhodana, Kasi, Kadak, Pak, Dhawagiri and
Aquifer Maps And Ground Water Management Plans, Warud And Morshi Taluka, Amravati District, Maharashtra, AAP, 2012-13
40 CGWB, CR, Nagpur
Chandrabhaga and their tributaries constitute the principal drainage system in the area. The other nalas are seasonal emanating from the hilly terrain and form the main nalas and rivers. The drainage pattern is mainly sub dendritic to sub parallel. The meandering of Wardha river indicates their mature stage of development. Initially, Wardha river flows from southward, when Jam Nadi meets near Jalalkheda, Wardha river flows south westerly and then southerly. This is due to presence of structural discontinuity and shows its structural control.
2) The water table varies from 330 m amsl near Wardha river in southeastern part of Morshi taluka to about 497 m amsl near Shekdari in Northern part of Warud taluka.
3) The overall ground water movement in Warud taluka is from North to south and then from NNE to SSW because of the structural control due to Salbardi fault.
4) The overall ground water movement in Morshi taluka is from northwest to Southeast i.e. towards Wardha river.
It has been observed that the ground water flow directions follow the major drainage of
Wardha river and topography of the area. This indicates the topographic control for the ground water movement. However, in northern part of the study area, the ground water movement is control by structural discontinuity and also acts as a water divide.
Fig. 3.17: Ground water flow, Warud and Morshi taluka, Amravati district
3.5 Ground Water Quality
The suitability of ground water for drinking/irrigation/industrial purposes is determined keeping in view the effects of various chemical constituents present in water on the growth of human being, animals, various plants and also on industrial requirement. Though many ions are very essential for the growth of plants and human body but when present in excess, have an adverse effect on health and growth. For estimation of the quality of ground water, ground water samples from 32 KOW’s (shallow dug wells representing phreatic aquifer) have been collected during pre-monsoon. Similarly for Aquifer – II, the ground water samples were collected during the drilling and
Aquifer Maps And Ground Water Management Plans, Warud And Morshi Taluka, Amravati District, Maharashtra, AAP, 2012-13
41 CGWB, CR, Nagpur
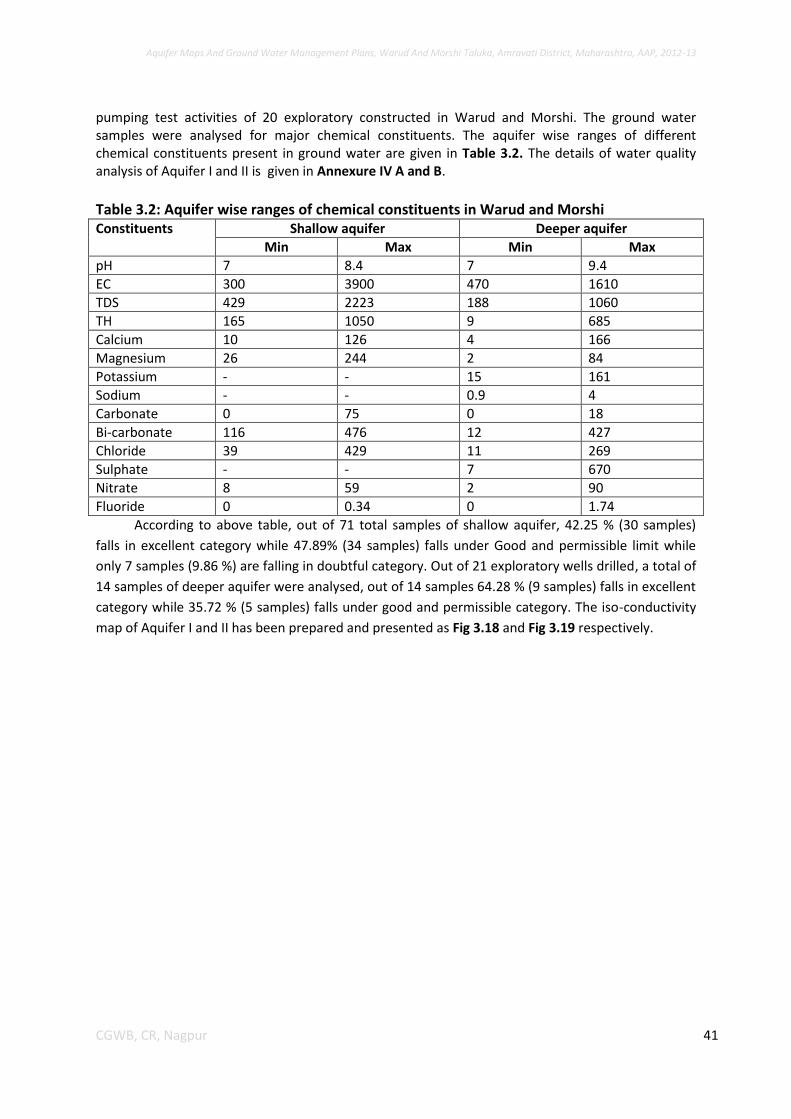
pumping test activities of 20 exploratory constructed in Warud and Morshi. The ground water samples were analysed for major chemical constituents. The aquifer wise ranges of different chemical constituents present in ground water are given in Table 3.2. The details of water quality analysis of Aquifer I and II is given in Annexure IV A and B.
Table 3.2: Aquifer wise ranges of chemical constituents in Warud and Morshi Constituents Shallow aquifer Deeper aquifer
Min Max Min Max
pH 7 8.4 7 9.4
EC 300 3900 470 1610
TDS 429 2223 188 1060
TH 165 1050 9 685
Calcium 10 126 4 166
Magnesium 26 244 2 84
Potassium - - 15 161
Sodium - - 0.9 4
Carbonate 0 75 0 18
Bi-carbonate 116 476 12 427
Chloride 39 429 11 269
Sulphate - - 7 670
Nitrate 8 59 2 90
Fluoride 0 0.34 0 1.74
According to above table, out of 71 total samples of shallow aquifer, 42.25 % (30 samples)
falls in excellent category while 47.89% (34 samples) falls under Good and permissible limit while
only 7 samples (9.86 %) are falling in doubtful category. Out of 21 exploratory wells drilled, a total of
14 samples of deeper aquifer were analysed, out of 14 samples 64.28 % (9 samples) falls in excellent
category while 35.72 % (5 samples) falls under good and permissible category. The iso-conductivity
map of Aquifer I and II has been prepared and presented as Fig 3.18 and Fig 3.19 respectively.
Aquifer Maps And Ground Water Management Plans, Warud And Morshi Taluka, Amravati District, Maharashtra, AAP, 2012-13
42 CGWB, CR, Nagpur
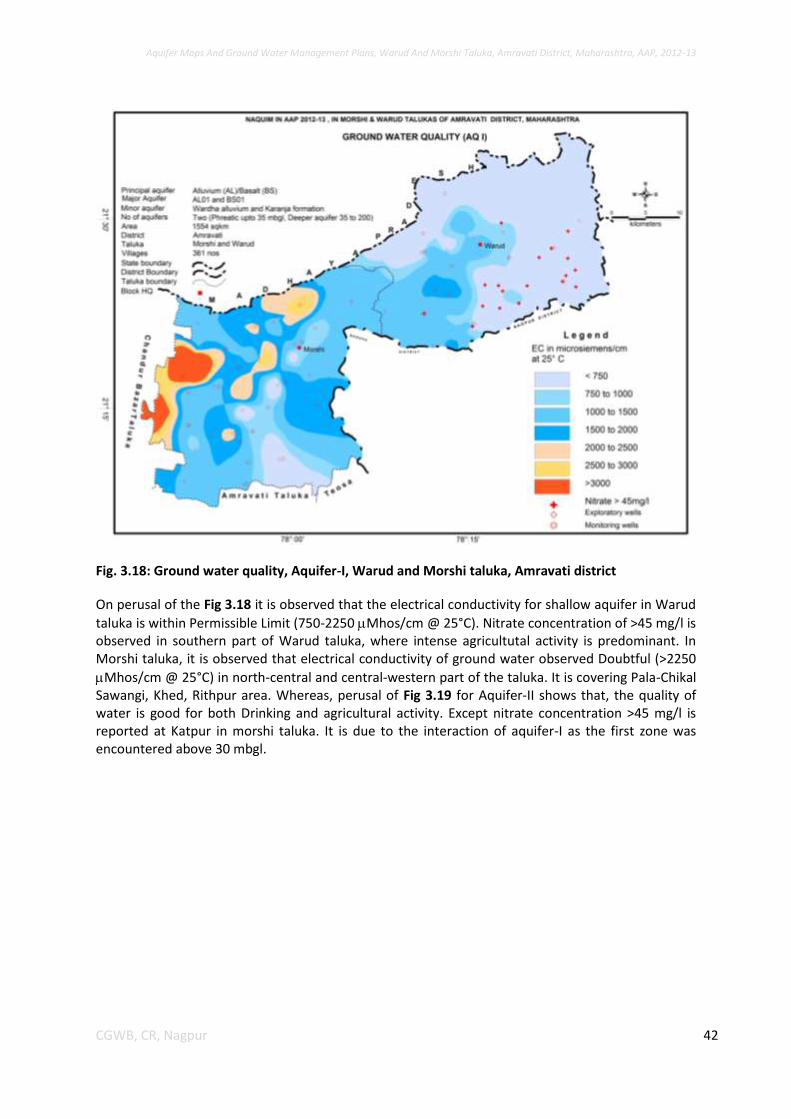
Fig. 3.18: Ground water quality, Aquifer-I, Warud and Morshi taluka, Amravati district
On perusal of the Fig 3.18 it is observed that the electrical conductivity for shallow aquifer in Warud
taluka is within Permissible Limit (750-2250 Mhos/cm @ 25°C). Nitrate concentration of >45 mg/l is observed in southern part of Warud taluka, where intense agricultutal activity is predominant. In Morshi taluka, it is observed that electrical conductivity of ground water observed Doubtful (>2250
Mhos/cm @ 25°C) in north-central and central-western part of the taluka. It is covering Pala-Chikal Sawangi, Khed, Rithpur area. Whereas, perusal of Fig 3.19 for Aquifer-II shows that, the quality of water is good for both Drinking and agricultural activity. Except nitrate concentration >45 mg/l is reported at Katpur in morshi taluka. It is due to the interaction of aquifer-I as the first zone was encountered above 30 mbgl.
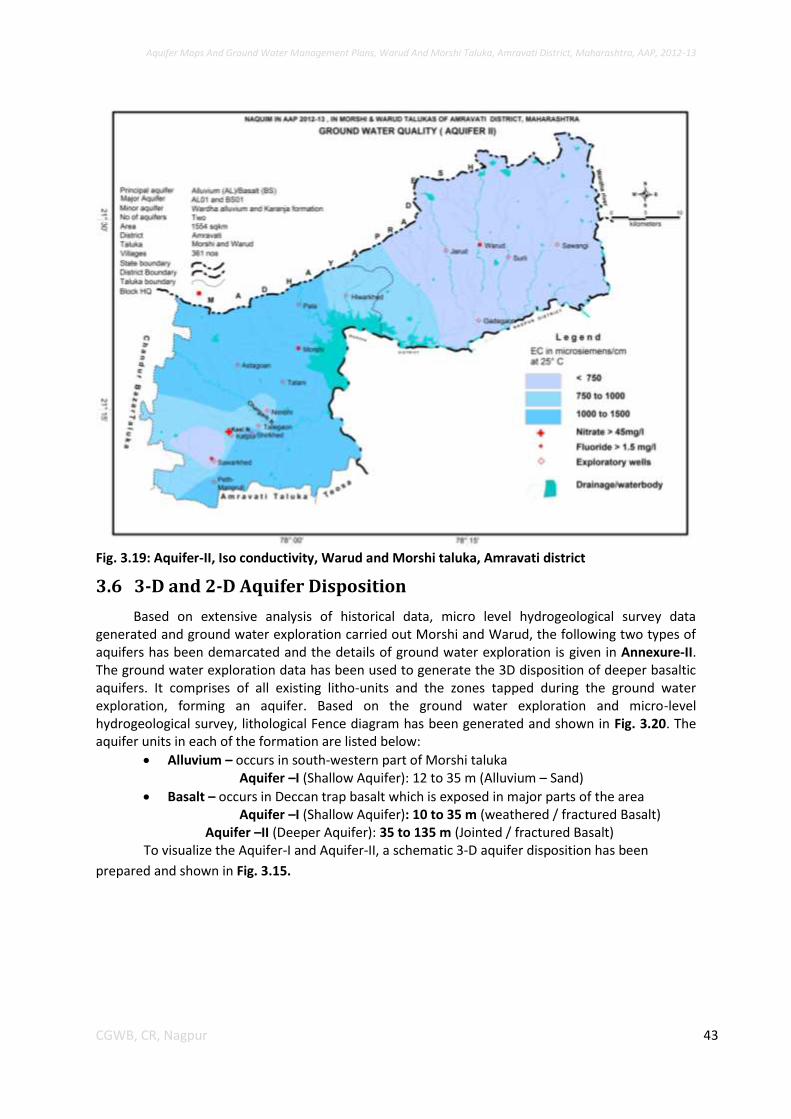
Aquifer Maps And Ground Water Management Plans, Warud And Morshi Taluka, Amravati District, Maharashtra, AAP, 2012-13
43 CGWB, CR, Nagpur
Fig. 3.19: Aquifer-II, Iso conductivity, Warud and Morshi taluka, Amravati district
3.6 3-D and 2-D Aquifer Disposition
Based on extensive analysis of historical data, micro level hydrogeological survey data generated and ground water exploration carried out Morshi and Warud, the following two types of aquifers has been demarcated and the details of ground water exploration is given in Annexure-II. The ground water exploration data has been used to generate the 3D disposition of deeper basaltic aquifers. It comprises of all existing litho-units and the zones tapped during the ground water exploration, forming an aquifer. Based on the ground water exploration and micro-level hydrogeological survey, lithological Fence diagram has been generated and shown in Fig. 3.20. The aquifer units in each of the formation are listed below:
Alluvium – occurs in south-western part of Morshi taluka Aquifer –I (Shallow Aquifer): 12 to 35 m (Alluvium – Sand)
Basalt – occurs in Deccan trap basalt which is exposed in major parts of the area Aquifer –I (Shallow Aquifer): 10 to 35 m (weathered / fractured Basalt)
Aquifer –II (Deeper Aquifer): 35 to 135 m (Jointed / fractured Basalt) To visualize the Aquifer-I and Aquifer-II, a schematic 3-D aquifer disposition has been
prepared and shown in Fig. 3.15.
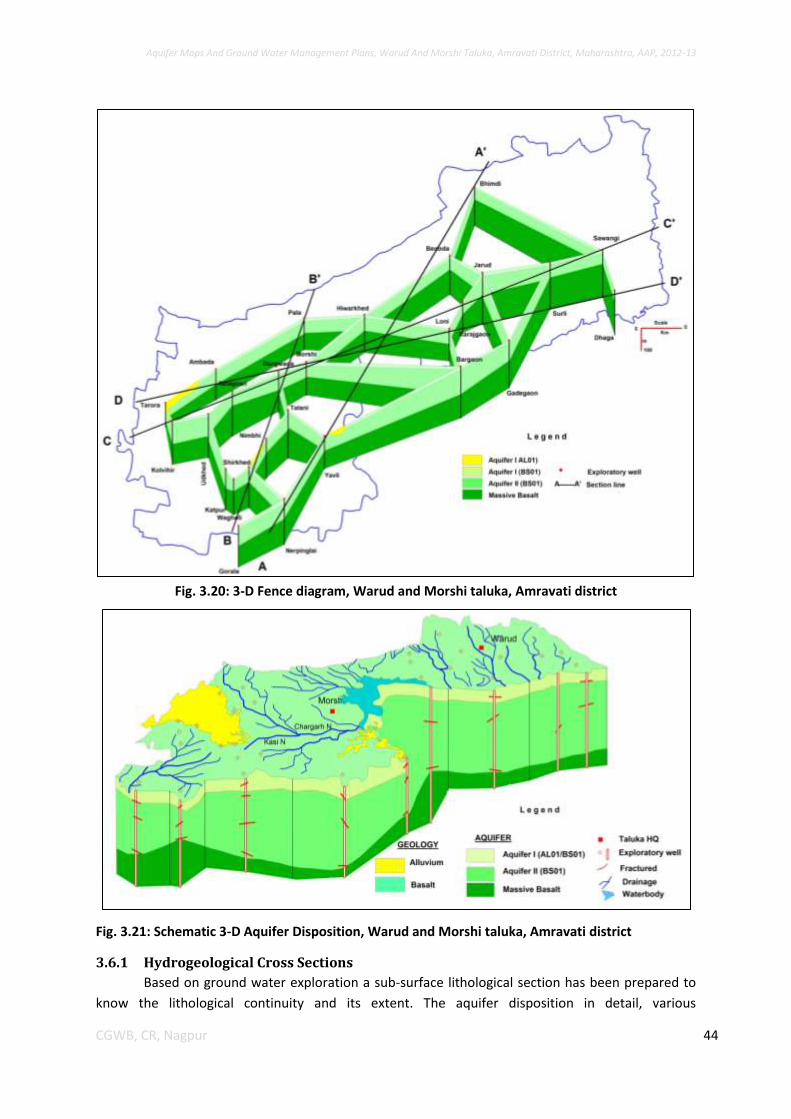
Aquifer Maps And Ground Water Management Plans, Warud And Morshi Taluka, Amravati District, Maharashtra, AAP, 2012-13
44 CGWB, CR, Nagpur
Fig. 3.20: 3-D Fence diagram, Warud and Morshi taluka, Amravati district
Fig. 3.21: Schematic 3-D Aquifer Disposition, Warud and Morshi taluka, Amravati district
3.6.1 Hydrogeological Cross Sections
Based on ground water exploration a sub-surface lithological section has been prepared to
know the lithological continuity and its extent. The aquifer disposition in detail, various
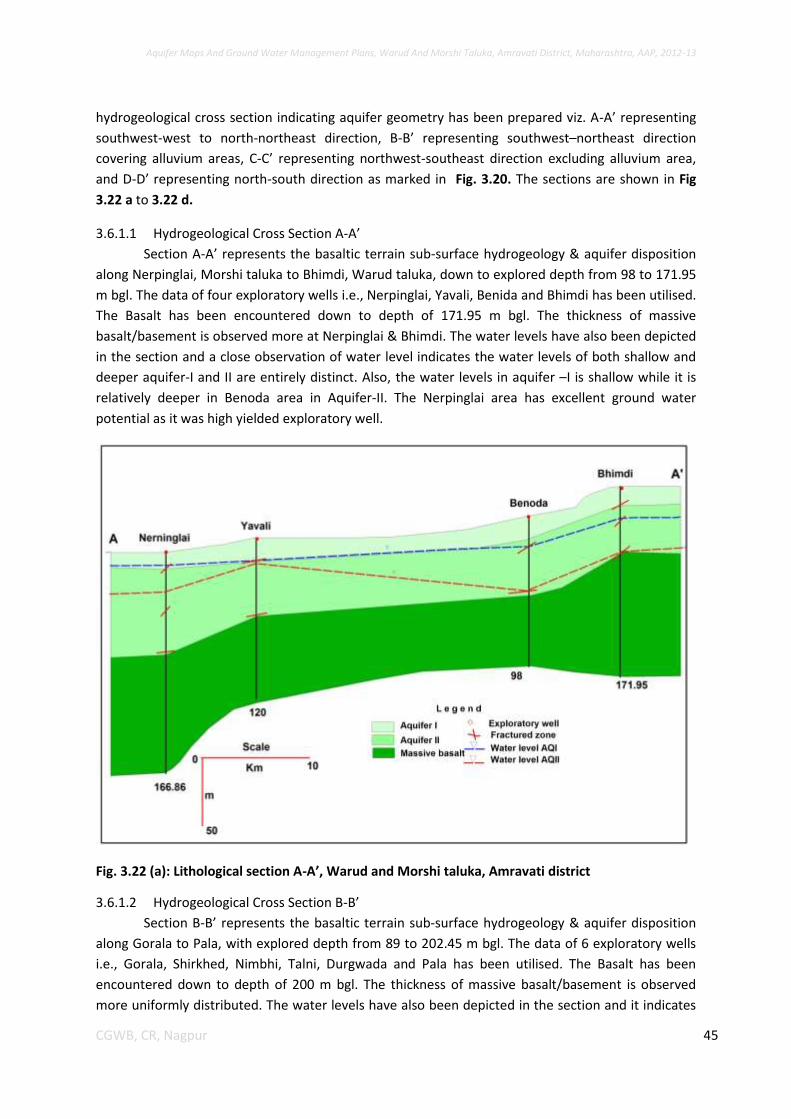
Aquifer Maps And Ground Water Management Plans, Warud And Morshi Taluka, Amravati District, Maharashtra, AAP, 2012-13
45 CGWB, CR, Nagpur
hydrogeological cross section indicating aquifer geometry has been prepared viz. A-A’ representing
southwest-west to north-northeast direction, B-B’ representing southwest–northeast direction
covering alluvium areas, C-C’ representing northwest-southeast direction excluding alluvium area,
and D-D’ representing north-south direction as marked in Fig. 3.20. The sections are shown in Fig
3.22 a to 3.22 d.
3.6.1.1 Hydrogeological Cross Section A-A’
Section A-A’ represents the basaltic terrain sub-surface hydrogeology & aquifer disposition
along Nerpinglai, Morshi taluka to Bhimdi, Warud taluka, down to explored depth from 98 to 171.95
m bgl. The data of four exploratory wells i.e., Nerpinglai, Yavali, Benida and Bhimdi has been utilised.
The Basalt has been encountered down to depth of 171.95 m bgl. The thickness of massive
basalt/basement is observed more at Nerpinglai & Bhimdi. The water levels have also been depicted
in the section and a close observation of water level indicates the water levels of both shallow and
deeper aquifer-I and II are entirely distinct. Also, the water levels in aquifer –I is shallow while it is
relatively deeper in Benoda area in Aquifer-II. The Nerpinglai area has excellent ground water
potential as it was high yielded exploratory well.
Fig. 3.22 (a): Lithological section A-A’, Warud and Morshi taluka, Amravati district
3.6.1.2 Hydrogeological Cross Section B-B’
Section B-B’ represents the basaltic terrain sub-surface hydrogeology & aquifer disposition
along Gorala to Pala, with explored depth from 89 to 202.45 m bgl. The data of 6 exploratory wells
i.e., Gorala, Shirkhed, Nimbhi, Talni, Durgwada and Pala has been utilised. The Basalt has been
encountered down to depth of 200 m bgl. The thickness of massive basalt/basement is observed
more uniformly distributed. The water levels have also been depicted in the section and it indicates
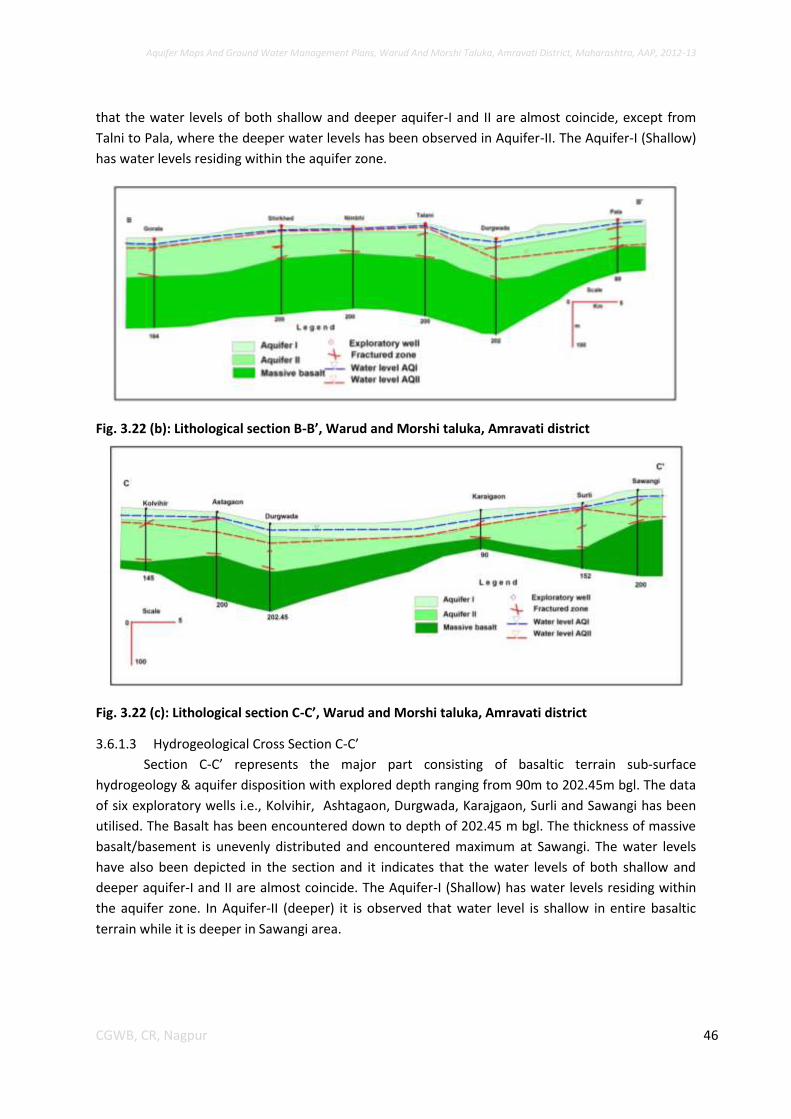
Aquifer Maps And Ground Water Management Plans, Warud And Morshi Taluka, Amravati District, Maharashtra, AAP, 2012-13
46 CGWB, CR, Nagpur
that the water levels of both shallow and deeper aquifer-I and II are almost coincide, except from
Talni to Pala, where the deeper water levels has been observed in Aquifer-II. The Aquifer-I (Shallow)
has water levels residing within the aquifer zone.
Fig. 3.22 (b): Lithological section B-B’, Warud and Morshi taluka, Amravati district
Fig. 3.22 (c): Lithological section C-C’, Warud and Morshi taluka, Amravati district
3.6.1.3 Hydrogeological Cross Section C-C’
Section C-C’ represents the major part consisting of basaltic terrain sub-surface
hydrogeology & aquifer disposition with explored depth ranging from 90m to 202.45m bgl. The data
of six exploratory wells i.e., Kolvihir, Ashtagaon, Durgwada, Karajgaon, Surli and Sawangi has been
utilised. The Basalt has been encountered down to depth of 202.45 m bgl. The thickness of massive
basalt/basement is unevenly distributed and encountered maximum at Sawangi. The water levels
have also been depicted in the section and it indicates that the water levels of both shallow and
deeper aquifer-I and II are almost coincide. The Aquifer-I (Shallow) has water levels residing within
the aquifer zone. In Aquifer-II (deeper) it is observed that water level is shallow in entire basaltic
terrain while it is deeper in Sawangi area.
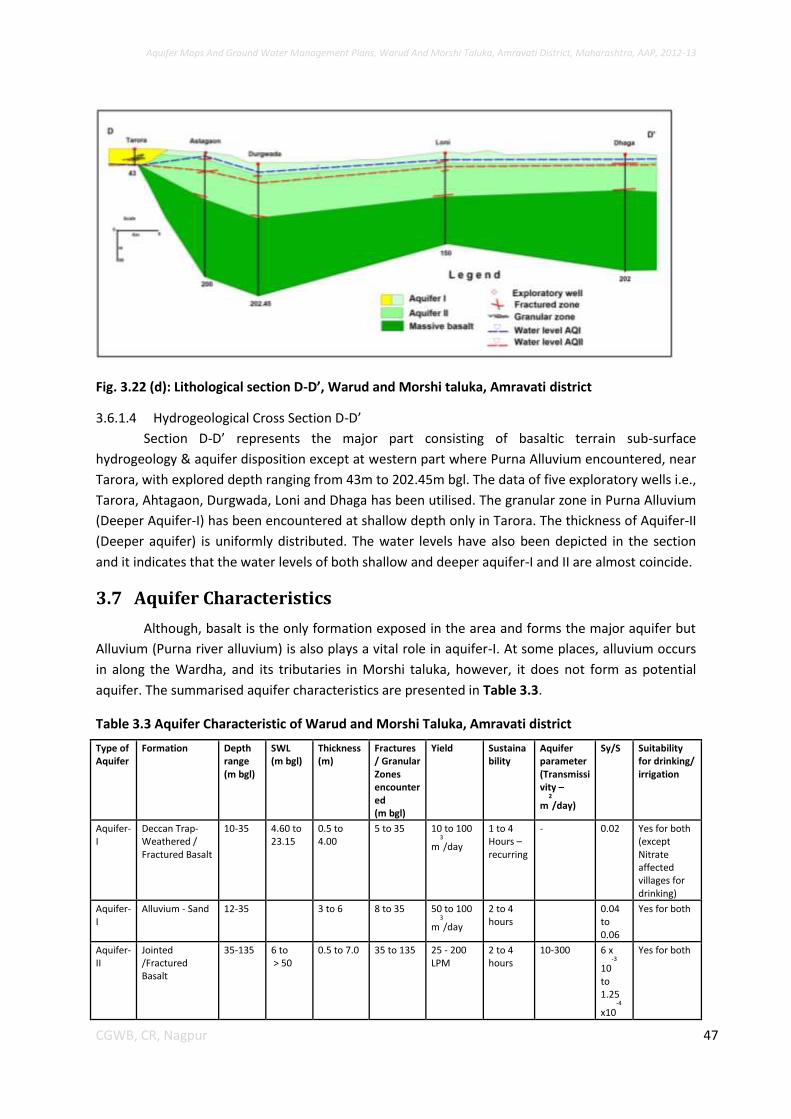
Aquifer Maps And Ground Water Management Plans, Warud And Morshi Taluka, Amravati District, Maharashtra, AAP, 2012-13
47 CGWB, CR, Nagpur
Fig. 3.22 (d): Lithological section D-D’, Warud and Morshi taluka, Amravati district
3.6.1.4 Hydrogeological Cross Section D-D’
Section D-D’ represents the major part consisting of basaltic terrain sub-surface
hydrogeology & aquifer disposition except at western part where Purna Alluvium encountered, near
Tarora, with explored depth ranging from 43m to 202.45m bgl. The data of five exploratory wells i.e.,
Tarora, Ahtagaon, Durgwada, Loni and Dhaga has been utilised. The granular zone in Purna Alluvium
(Deeper Aquifer-I) has been encountered at shallow depth only in Tarora. The thickness of Aquifer-II
(Deeper aquifer) is uniformly distributed. The water levels have also been depicted in the section
and it indicates that the water levels of both shallow and deeper aquifer-I and II are almost coincide.
3.7 Aquifer Characteristics
Although, basalt is the only formation exposed in the area and forms the major aquifer but
Alluvium (Purna river alluvium) is also plays a vital role in aquifer-I. At some places, alluvium occurs
in along the Wardha, and its tributaries in Morshi taluka, however, it does not form as potential
aquifer. The summarised aquifer characteristics are presented in Table 3.3.
Table 3.3 Aquifer Characteristic of Warud and Morshi Taluka, Amravati district
Type of Aquifer
Formation Depth range (m bgl)
SWL (m bgl)
Thickness (m)
Fractures / Granular Zones encountered (m bgl)
Yield Sustainability
Aquifer parameter (Transmissivity –
m2
/day)
Sy/S Suitability for drinking/ irrigation
Aquifer-I
Deccan Trap- Weathered / Fractured Basalt
10-35 4.60 to 23.15
0.5 to 4.00
5 to 35 10 to 100
m3
/day
1 to 4 Hours – recurring
- 0.02 Yes for both (except Nitrate affected villages for drinking)
Aquifer-I
Alluvium - Sand 12-35 3 to 6 8 to 35 50 to 100
m3
/day
2 to 4 hours
0.04 to 0.06
Yes for both
Aquifer-II
Jointed /Fractured Basalt
35-135 6 to > 50
0.5 to 7.0 35 to 135 25 - 200 LPM
2 to 4 hours
10-300 6 x
10-3
to 1.25
x10-4
Yes for both
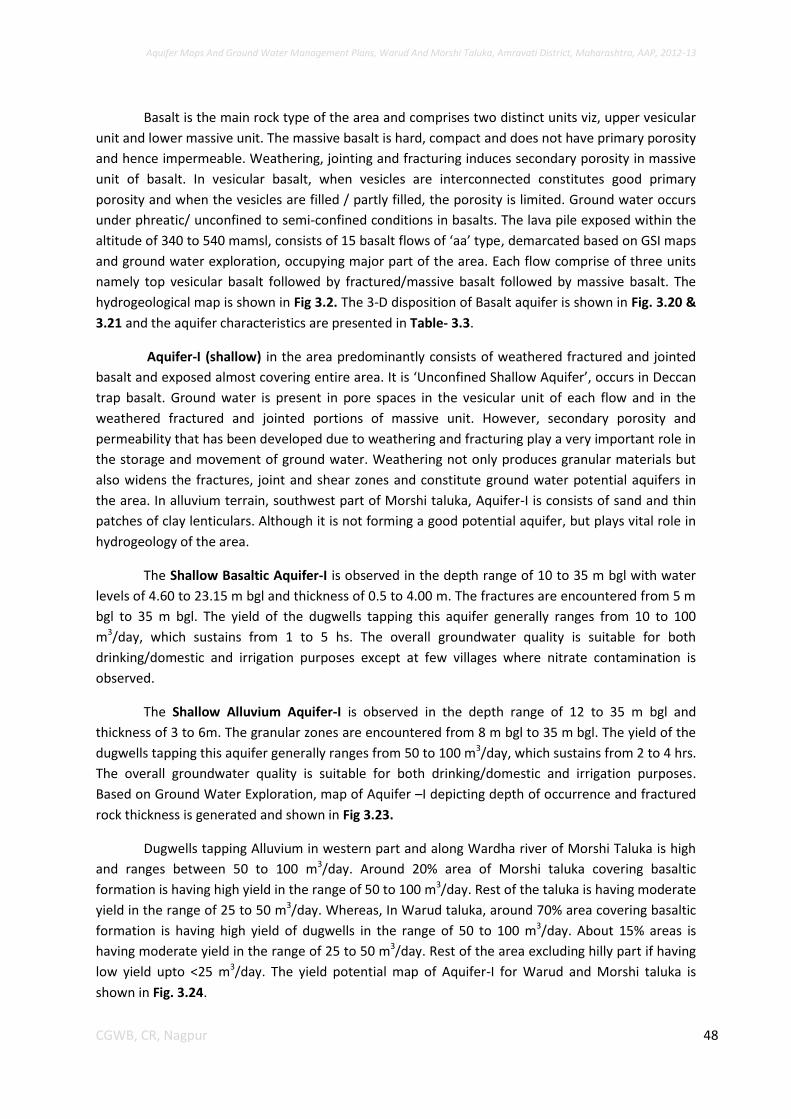
Aquifer Maps And Ground Water Management Plans, Warud And Morshi Taluka, Amravati District, Maharashtra, AAP, 2012-13
48 CGWB, CR, Nagpur
Basalt is the main rock type of the area and comprises two distinct units viz, upper vesicular
unit and lower massive unit. The massive basalt is hard, compact and does not have primary porosity
and hence impermeable. Weathering, jointing and fracturing induces secondary porosity in massive
unit of basalt. In vesicular basalt, when vesicles are interconnected constitutes good primary
porosity and when the vesicles are filled / partly filled, the porosity is limited. Ground water occurs
under phreatic/ unconfined to semi-confined conditions in basalts. The lava pile exposed within the
altitude of 340 to 540 mamsl, consists of 15 basalt flows of ‘aa’ type, demarcated based on GSI maps
and ground water exploration, occupying major part of the area. Each flow comprise of three units
namely top vesicular basalt followed by fractured/massive basalt followed by massive basalt. The
hydrogeological map is shown in Fig 3.2. The 3-D disposition of Basalt aquifer is shown in Fig. 3.20 &
3.21 and the aquifer characteristics are presented in Table- 3.3.
Aquifer-I (shallow) in the area predominantly consists of weathered fractured and jointed
basalt and exposed almost covering entire area. It is ‘Unconfined Shallow Aquifer’, occurs in Deccan
trap basalt. Ground water is present in pore spaces in the vesicular unit of each flow and in the
weathered fractured and jointed portions of massive unit. However, secondary porosity and
permeability that has been developed due to weathering and fracturing play a very important role in
the storage and movement of ground water. Weathering not only produces granular materials but
also widens the fractures, joint and shear zones and constitute ground water potential aquifers in
the area. In alluvium terrain, southwest part of Morshi taluka, Aquifer-I is consists of sand and thin
patches of clay lenticulars. Although it is not forming a good potential aquifer, but plays vital role in
hydrogeology of the area.
The Shallow Basaltic Aquifer-I is observed in the depth range of 10 to 35 m bgl with water
levels of 4.60 to 23.15 m bgl and thickness of 0.5 to 4.00 m. The fractures are encountered from 5 m
bgl to 35 m bgl. The yield of the dugwells tapping this aquifer generally ranges from 10 to 100
m3/day, which sustains from 1 to 5 hs. The overall groundwater quality is suitable for both
drinking/domestic and irrigation purposes except at few villages where nitrate contamination is
observed.
The Shallow Alluvium Aquifer-I is observed in the depth range of 12 to 35 m bgl and
thickness of 3 to 6m. The granular zones are encountered from 8 m bgl to 35 m bgl. The yield of the
dugwells tapping this aquifer generally ranges from 50 to 100 m3/day, which sustains from 2 to 4 hrs.
The overall groundwater quality is suitable for both drinking/domestic and irrigation purposes.
Based on Ground Water Exploration, map of Aquifer –I depicting depth of occurrence and fractured
rock thickness is generated and shown in Fig 3.23.
Dugwells tapping Alluvium in western part and along Wardha river of Morshi Taluka is high
and ranges between 50 to 100 m3/day. Around 20% area of Morshi taluka covering basaltic
formation is having high yield in the range of 50 to 100 m3/day. Rest of the taluka is having moderate
yield in the range of 25 to 50 m3/day. Whereas, In Warud taluka, around 70% area covering basaltic
formation is having high yield of dugwells in the range of 50 to 100 m3/day. About 15% areas is
having moderate yield in the range of 25 to 50 m3/day. Rest of the area excluding hilly part if having
low yield upto <25 m3/day. The yield potential map of Aquifer-I for Warud and Morshi taluka is
shown in Fig. 3.24.
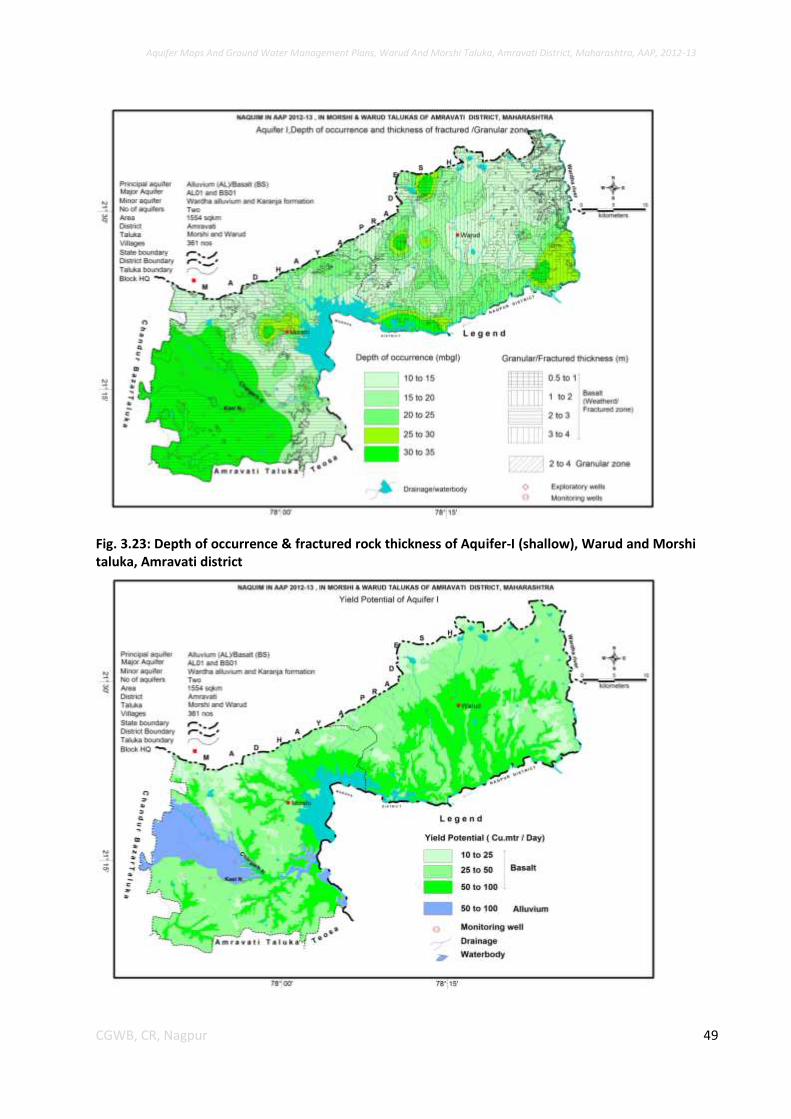
Aquifer Maps And Ground Water Management Plans, Warud And Morshi Taluka, Amravati District, Maharashtra, AAP, 2012-13
49 CGWB, CR, Nagpur
Fig. 3.23: Depth of occurrence & fractured rock thickness of Aquifer-I (shallow), Warud and Morshi taluka, Amravati district
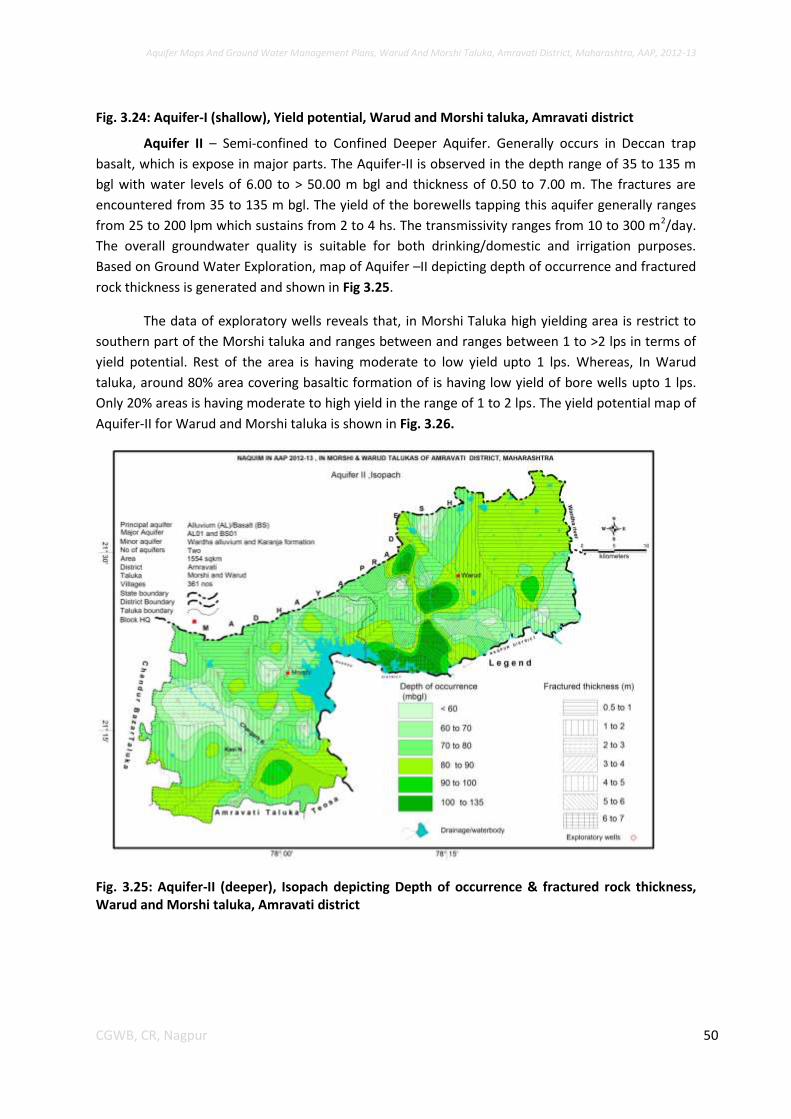
Aquifer Maps And Ground Water Management Plans, Warud And Morshi Taluka, Amravati District, Maharashtra, AAP, 2012-13
50 CGWB, CR, Nagpur
Fig. 3.24: Aquifer-I (shallow), Yield potential, Warud and Morshi taluka, Amravati district
Aquifer II – Semi-confined to Confined Deeper Aquifer. Generally occurs in Deccan trap
basalt, which is expose in major parts. The Aquifer-II is observed in the depth range of 35 to 135 m
bgl with water levels of 6.00 to > 50.00 m bgl and thickness of 0.50 to 7.00 m. The fractures are
encountered from 35 to 135 m bgl. The yield of the borewells tapping this aquifer generally ranges
from 25 to 200 lpm which sustains from 2 to 4 hs. The transmissivity ranges from 10 to 300 m2/day.
The overall groundwater quality is suitable for both drinking/domestic and irrigation purposes.
Based on Ground Water Exploration, map of Aquifer –II depicting depth of occurrence and fractured
rock thickness is generated and shown in Fig 3.25.
The data of exploratory wells reveals that, in Morshi Taluka high yielding area is restrict to
southern part of the Morshi taluka and ranges between and ranges between 1 to >2 lps in terms of
yield potential. Rest of the area is having moderate to low yield upto 1 lps. Whereas, In Warud
taluka, around 80% area covering basaltic formation of is having low yield of bore wells upto 1 lps.
Only 20% areas is having moderate to high yield in the range of 1 to 2 lps. The yield potential map of
Aquifer-II for Warud and Morshi taluka is shown in Fig. 3.26.
Fig. 3.25: Aquifer-II (deeper), Isopach depicting Depth of occurrence & fractured rock thickness, Warud and Morshi taluka, Amravati district
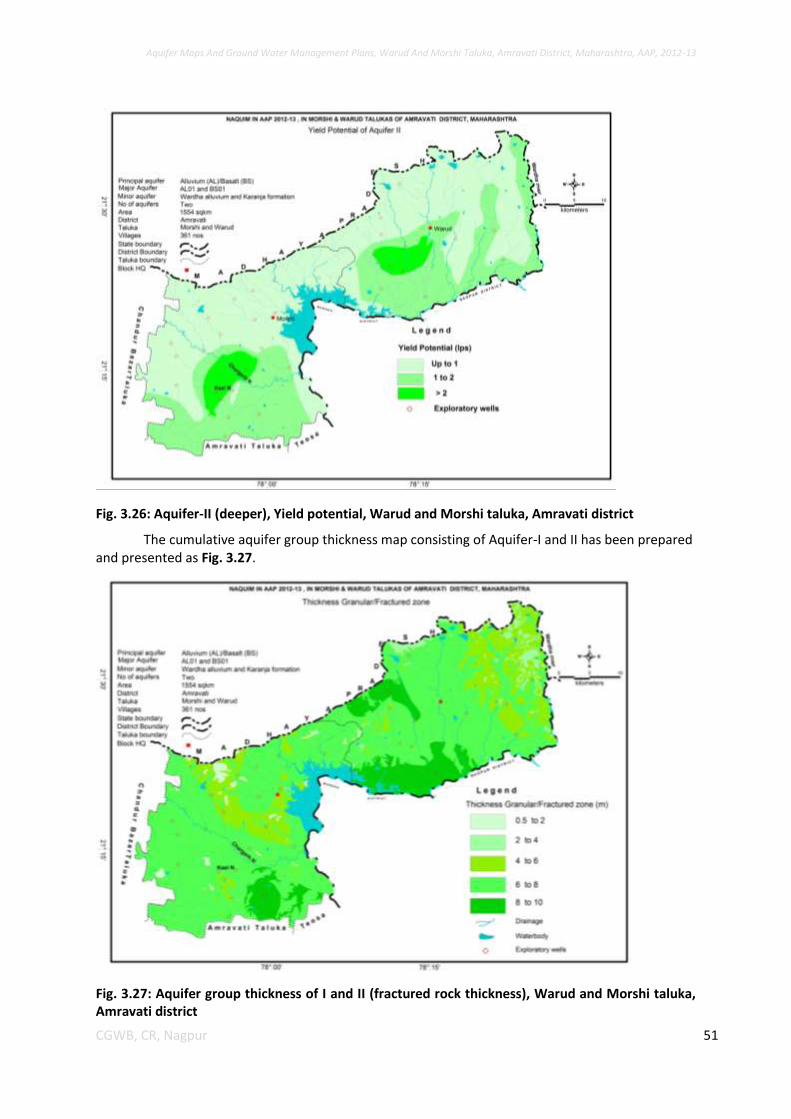
Aquifer Maps And Ground Water Management Plans, Warud And Morshi Taluka, Amravati District, Maharashtra, AAP, 2012-13
51 CGWB, CR, Nagpur
Fig. 3.26: Aquifer-II (deeper), Yield potential, Warud and Morshi taluka, Amravati district
The cumulative aquifer group thickness map consisting of Aquifer-I and II has been prepared and presented as Fig. 3.27.
Fig. 3.27: Aquifer group thickness of I and II (fractured rock thickness), Warud and Morshi taluka, Amravati district
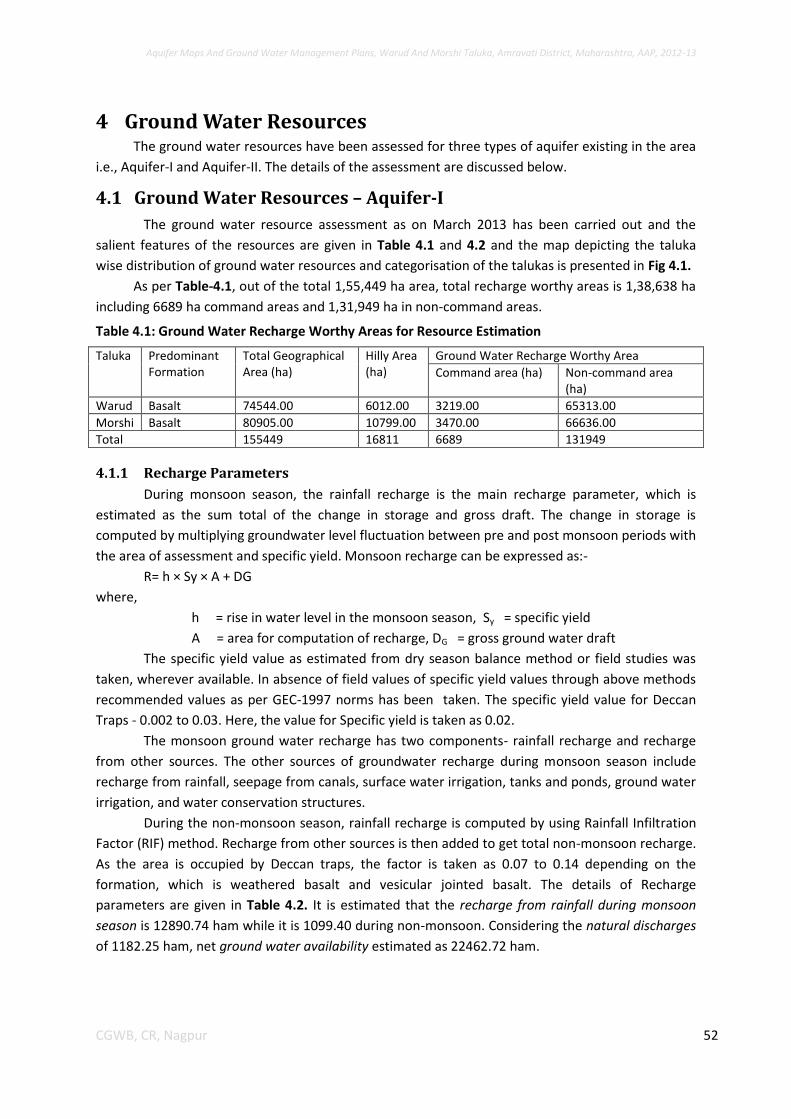
Aquifer Maps And Ground Water Management Plans, Warud And Morshi Taluka, Amravati District, Maharashtra, AAP, 2012-13
52 CGWB, CR, Nagpur
4 Ground Water Resources The ground water resources have been assessed for three types of aquifer existing in the area
i.e., Aquifer-I and Aquifer-II. The details of the assessment are discussed below.
4.1 Ground Water Resources – Aquifer-I
The ground water resource assessment as on March 2013 has been carried out and the
salient features of the resources are given in Table 4.1 and 4.2 and the map depicting the taluka
wise distribution of ground water resources and categorisation of the talukas is presented in Fig 4.1.
As per Table-4.1, out of the total 1,55,449 ha area, total recharge worthy areas is 1,38,638 ha
including 6689 ha command areas and 1,31,949 ha in non-command areas.
Table 4.1: Ground Water Recharge Worthy Areas for Resource Estimation
Taluka Predominant Formation
Total Geographical Area (ha)
Hilly Area (ha)
Ground Water Recharge Worthy Area
Command area (ha) Non-command area (ha)
Warud Basalt 74544.00 6012.00 3219.00 65313.00
Morshi Basalt 80905.00 10799.00 3470.00 66636.00
Total 155449 16811 6689 131949
4.1.1 Recharge Parameters
During monsoon season, the rainfall recharge is the main recharge parameter, which is
estimated as the sum total of the change in storage and gross draft. The change in storage is
computed by multiplying groundwater level fluctuation between pre and post monsoon periods with
the area of assessment and specific yield. Monsoon recharge can be expressed as:-
R= h × Sy × A + DG
where,
h = rise in water level in the monsoon season, Sy = specific yield
A = area for computation of recharge, DG = gross ground water draft
The specific yield value as estimated from dry season balance method or field studies was
taken, wherever available. In absence of field values of specific yield values through above methods
recommended values as per GEC-1997 norms has been taken. The specific yield value for Deccan
Traps - 0.002 to 0.03. Here, the value for Specific yield is taken as 0.02.
The monsoon ground water recharge has two components- rainfall recharge and recharge
from other sources. The other sources of groundwater recharge during monsoon season include
recharge from rainfall, seepage from canals, surface water irrigation, tanks and ponds, ground water
irrigation, and water conservation structures.
During the non-monsoon season, rainfall recharge is computed by using Rainfall Infiltration
Factor (RIF) method. Recharge from other sources is then added to get total non-monsoon recharge.
As the area is occupied by Deccan traps, the factor is taken as 0.07 to 0.14 depending on the
formation, which is weathered basalt and vesicular jointed basalt. The details of Recharge
parameters are given in Table 4.2. It is estimated that the recharge from rainfall during monsoon
season is 12890.74 ham while it is 1099.40 during non-monsoon. Considering the natural discharges
of 1182.25 ham, net ground water availability estimated as 22462.72 ham.
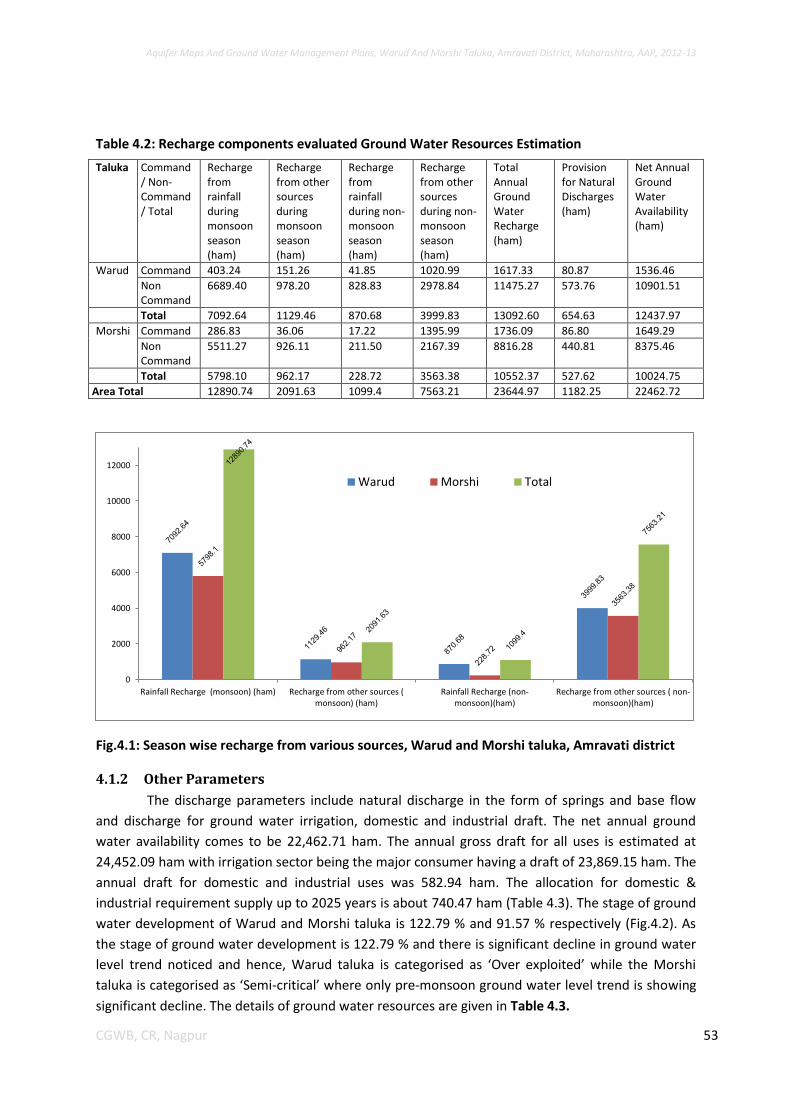
Aquifer Maps And Ground Water Management Plans, Warud And Morshi Taluka, Amravati District, Maharashtra, AAP, 2012-13
53 CGWB, CR, Nagpur
Table 4.2: Recharge components evaluated Ground Water Resources Estimation
Taluka Command / Non-Command / Total
Recharge from rainfall during monsoon season (ham)
Recharge from other sources during monsoon season (ham)
Recharge from rainfall during non-monsoon season (ham)
Recharge from other sources during non-monsoon season (ham)
Total Annual Ground Water Recharge (ham)
Provision for Natural Discharges (ham)
Net Annual Ground Water Availability (ham)
Warud Command 403.24 151.26 41.85 1020.99 1617.33 80.87 1536.46
Non Command
6689.40 978.20 828.83 2978.84 11475.27 573.76 10901.51
Total 7092.64 1129.46 870.68 3999.83 13092.60 654.63 12437.97
Morshi Command 286.83 36.06 17.22 1395.99 1736.09 86.80 1649.29
Non Command
5511.27 926.11 211.50 2167.39 8816.28 440.81 8375.46
Total 5798.10 962.17 228.72 3563.38 10552.37 527.62 10024.75
Area Total 12890.74 2091.63 1099.4 7563.21 23644.97 1182.25 22462.72
Fig.4.1: Season wise recharge from various sources, Warud and Morshi taluka, Amravati district
4.1.2 Other Parameters
The discharge parameters include natural discharge in the form of springs and base flow
and discharge for ground water irrigation, domestic and industrial draft. The net annual ground
water availability comes to be 22,462.71 ham. The annual gross draft for all uses is estimated at
24,452.09 ham with irrigation sector being the major consumer having a draft of 23,869.15 ham. The
annual draft for domestic and industrial uses was 582.94 ham. The allocation for domestic &
industrial requirement supply up to 2025 years is about 740.47 ham (Table 4.3). The stage of ground
water development of Warud and Morshi taluka is 122.79 % and 91.57 % respectively (Fig.4.2). As
the stage of ground water development is 122.79 % and there is significant decline in ground water
level trend noticed and hence, Warud taluka is categorised as ‘Over exploited’ while the Morshi
taluka is categorised as ‘Semi-critical’ where only pre-monsoon ground water level trend is showing
significant decline. The details of ground water resources are given in Table 4.3.
0
2000
4000
6000
8000
10000
12000
Rainfall Recharge (monsoon) (ham) Recharge from other sources (monsoon) (ham)
Rainfall Recharge (non-monsoon)(ham)
Recharge from other sources ( non-monsoon)(ham)
Warud Morshi Total
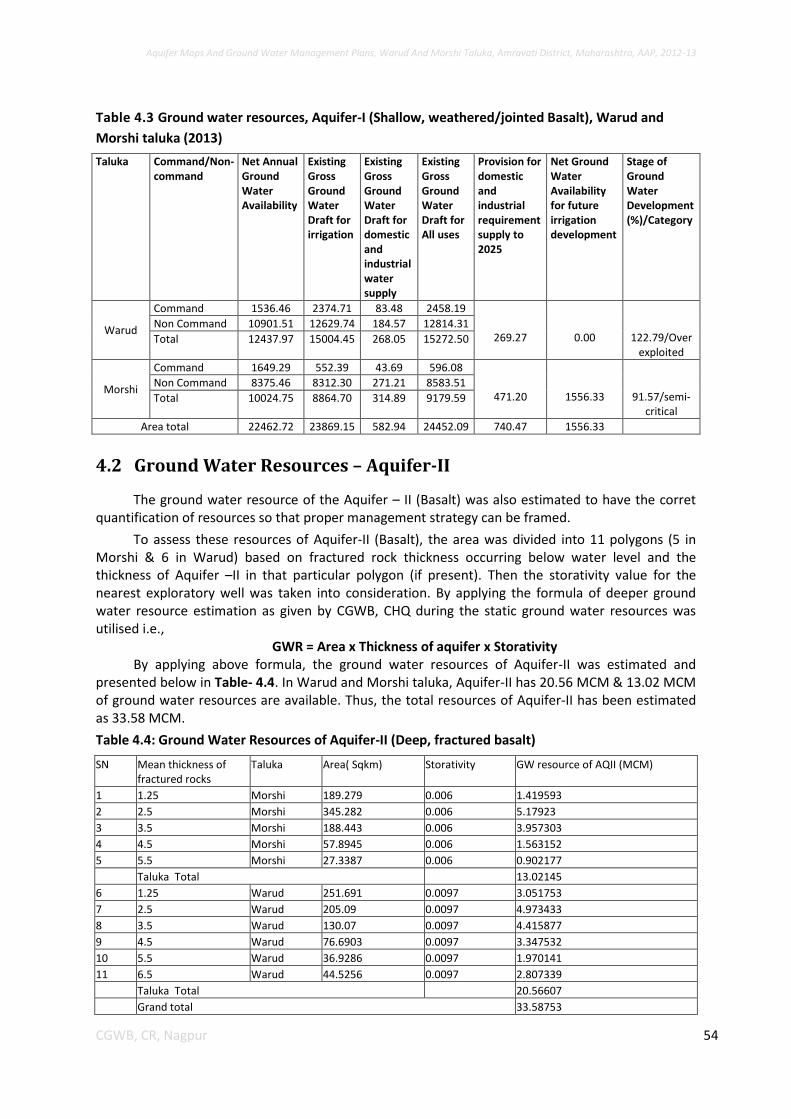
Aquifer Maps And Ground Water Management Plans, Warud And Morshi Taluka, Amravati District, Maharashtra, AAP, 2012-13
54 CGWB, CR, Nagpur
Table 4.3 Ground water resources, Aquifer-I (Shallow, weathered/jointed Basalt), Warud and
Morshi taluka (2013)
Taluka Command/Non-command
Net Annual Ground Water Availability
Existing Gross Ground Water Draft for irrigation
Existing Gross Ground Water Draft for domestic and industrial water supply
Existing Gross Ground Water Draft for All uses
Provision for domestic and industrial requirement supply to 2025
Net Ground Water Availability for future irrigation development
Stage of Ground Water Development (%)/Category
Warud
Command 1536.46 2374.71 83.48 2458.19
269.27
0.00
122.79/Over exploited
Non Command 10901.51 12629.74 184.57 12814.31
Total 12437.97 15004.45 268.05 15272.50
Morshi
Command 1649.29 552.39 43.69 596.08
471.20
1556.33
91.57/semi-critical
Non Command 8375.46 8312.30 271.21 8583.51
Total 10024.75 8864.70 314.89 9179.59
Area total 22462.72 23869.15 582.94 24452.09 740.47 1556.33
4.2 Ground Water Resources – Aquifer-II
The ground water resource of the Aquifer – II (Basalt) was also estimated to have the corret quantification of resources so that proper management strategy can be framed.
To assess these resources of Aquifer-II (Basalt), the area was divided into 11 polygons (5 in Morshi & 6 in Warud) based on fractured rock thickness occurring below water level and the thickness of Aquifer –II in that particular polygon (if present). Then the storativity value for the nearest exploratory well was taken into consideration. By applying the formula of deeper ground water resource estimation as given by CGWB, CHQ during the static ground water resources was utilised i.e.,
GWR = Area x Thickness of aquifer x Storativity By applying above formula, the ground water resources of Aquifer-II was estimated and
presented below in Table- 4.4. In Warud and Morshi taluka, Aquifer-II has 20.56 MCM & 13.02 MCM of ground water resources are available. Thus, the total resources of Aquifer-II has been estimated as 33.58 MCM.
Table 4.4: Ground Water Resources of Aquifer-II (Deep, fractured basalt)
SN Mean thickness of fractured rocks
Taluka Area( Sqkm) Storativity GW resource of AQII (MCM)
1 1.25 Morshi 189.279 0.006 1.419593
2 2.5 Morshi 345.282 0.006 5.17923
3 3.5 Morshi 188.443 0.006 3.957303
4 4.5 Morshi 57.8945 0.006 1.563152
5 5.5 Morshi 27.3387 0.006 0.902177
Taluka Total 13.02145
6 1.25 Warud 251.691 0.0097 3.051753
7 2.5 Warud 205.09 0.0097 4.973433
8 3.5 Warud 130.07 0.0097 4.415877
9 4.5 Warud 76.6903 0.0097 3.347532
10 5.5 Warud 36.9286 0.0097 1.970141
11 6.5 Warud 44.5256 0.0097 2.807339
Taluka Total 20.56607
Grand total 33.58753
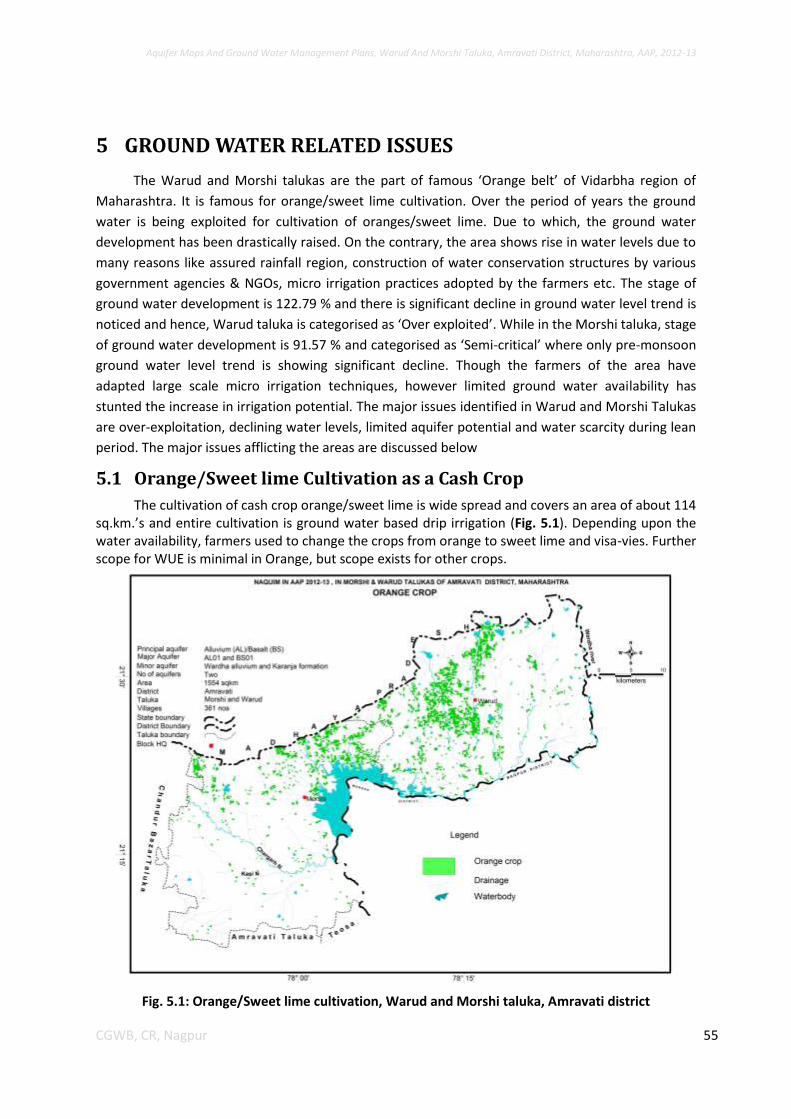
Aquifer Maps And Ground Water Management Plans, Warud And Morshi Taluka, Amravati District, Maharashtra, AAP, 2012-13
55 CGWB, CR, Nagpur
5 GROUND WATER RELATED ISSUES
The Warud and Morshi talukas are the part of famous ‘Orange belt’ of Vidarbha region of
Maharashtra. It is famous for orange/sweet lime cultivation. Over the period of years the ground
water is being exploited for cultivation of oranges/sweet lime. Due to which, the ground water
development has been drastically raised. On the contrary, the area shows rise in water levels due to
many reasons like assured rainfall region, construction of water conservation structures by various
government agencies & NGOs, micro irrigation practices adopted by the farmers etc. The stage of
ground water development is 122.79 % and there is significant decline in ground water level trend is
noticed and hence, Warud taluka is categorised as ‘Over exploited’. While in the Morshi taluka, stage
of ground water development is 91.57 % and categorised as ‘Semi-critical’ where only pre-monsoon
ground water level trend is showing significant decline. Though the farmers of the area have
adapted large scale micro irrigation techniques, however limited ground water availability has
stunted the increase in irrigation potential. The major issues identified in Warud and Morshi Talukas
are over-exploitation, declining water levels, limited aquifer potential and water scarcity during lean
period. The major issues afflicting the areas are discussed below
5.1 Orange/Sweet lime Cultivation as a Cash Crop
The cultivation of cash crop orange/sweet lime is wide spread and covers an area of about 114 sq.km.’s and entire cultivation is ground water based drip irrigation (Fig. 5.1). Depending upon the water availability, farmers used to change the crops from orange to sweet lime and visa-vies. Further scope for WUE is minimal in Orange, but scope exists for other crops.
Fig. 5.1: Orange/Sweet lime cultivation, Warud and Morshi taluka, Amravati district
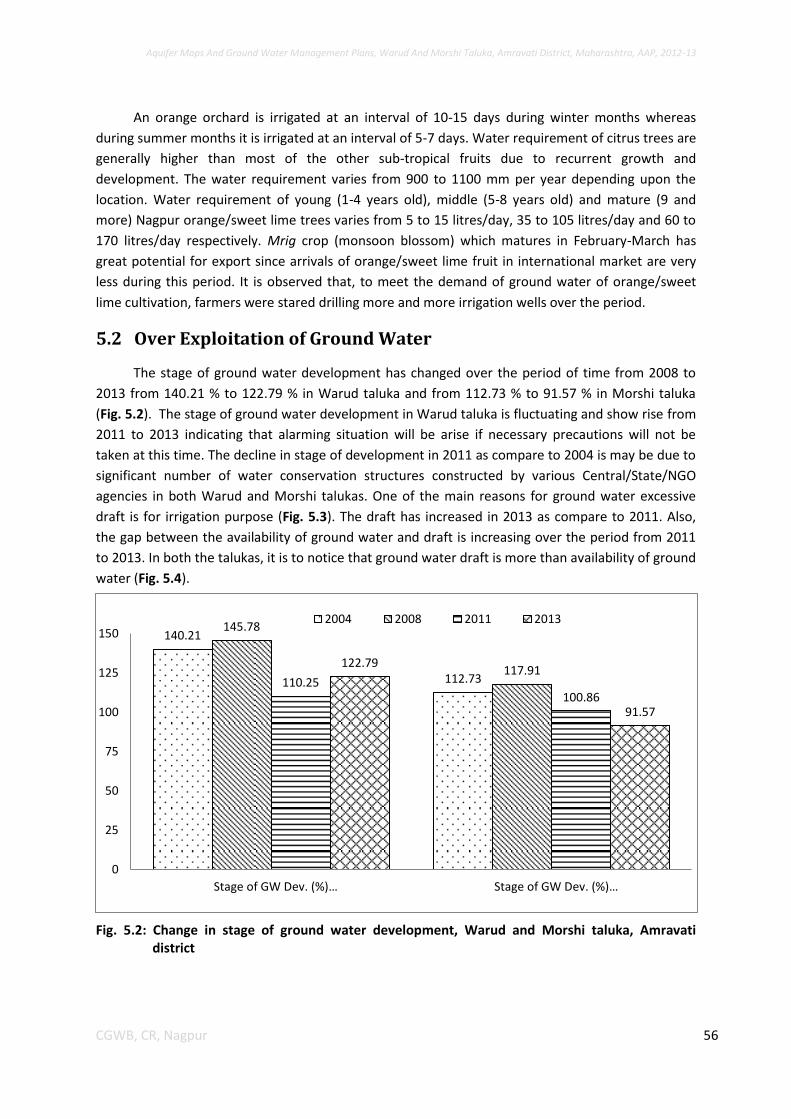
Aquifer Maps And Ground Water Management Plans, Warud And Morshi Taluka, Amravati District, Maharashtra, AAP, 2012-13
56 CGWB, CR, Nagpur
An orange orchard is irrigated at an interval of 10-15 days during winter months whereas
during summer months it is irrigated at an interval of 5-7 days. Water requirement of citrus trees are
generally higher than most of the other sub-tropical fruits due to recurrent growth and
development. The water requirement varies from 900 to 1100 mm per year depending upon the
location. Water requirement of young (1-4 years old), middle (5-8 years old) and mature (9 and
more) Nagpur orange/sweet lime trees varies from 5 to 15 litres/day, 35 to 105 litres/day and 60 to
170 litres/day respectively. Mrig crop (monsoon blossom) which matures in February-March has
great potential for export since arrivals of orange/sweet lime fruit in international market are very
less during this period. It is observed that, to meet the demand of ground water of orange/sweet
lime cultivation, farmers were stared drilling more and more irrigation wells over the period.
5.2 Over Exploitation of Ground Water
The stage of ground water development has changed over the period of time from 2008 to
2013 from 140.21 % to 122.79 % in Warud taluka and from 112.73 % to 91.57 % in Morshi taluka
(Fig. 5.2). The stage of ground water development in Warud taluka is fluctuating and show rise from
2011 to 2013 indicating that alarming situation will be arise if necessary precautions will not be
taken at this time. The decline in stage of development in 2011 as compare to 2004 is may be due to
significant number of water conservation structures constructed by various Central/State/NGO
agencies in both Warud and Morshi talukas. One of the main reasons for ground water excessive
draft is for irrigation purpose (Fig. 5.3). The draft has increased in 2013 as compare to 2011. Also,
the gap between the availability of ground water and draft is increasing over the period from 2011
to 2013. In both the talukas, it is to notice that ground water draft is more than availability of ground
water (Fig. 5.4).
Fig. 5.2: Change in stage of ground water development, Warud and Morshi taluka, Amravati district
140.21
112.73
145.78
117.91 110.25
100.86
122.79
91.57
0
25
50
75
100
125
150
Stage of GW Dev. (%)… Stage of GW Dev. (%)…
2004 2008 2011 2013
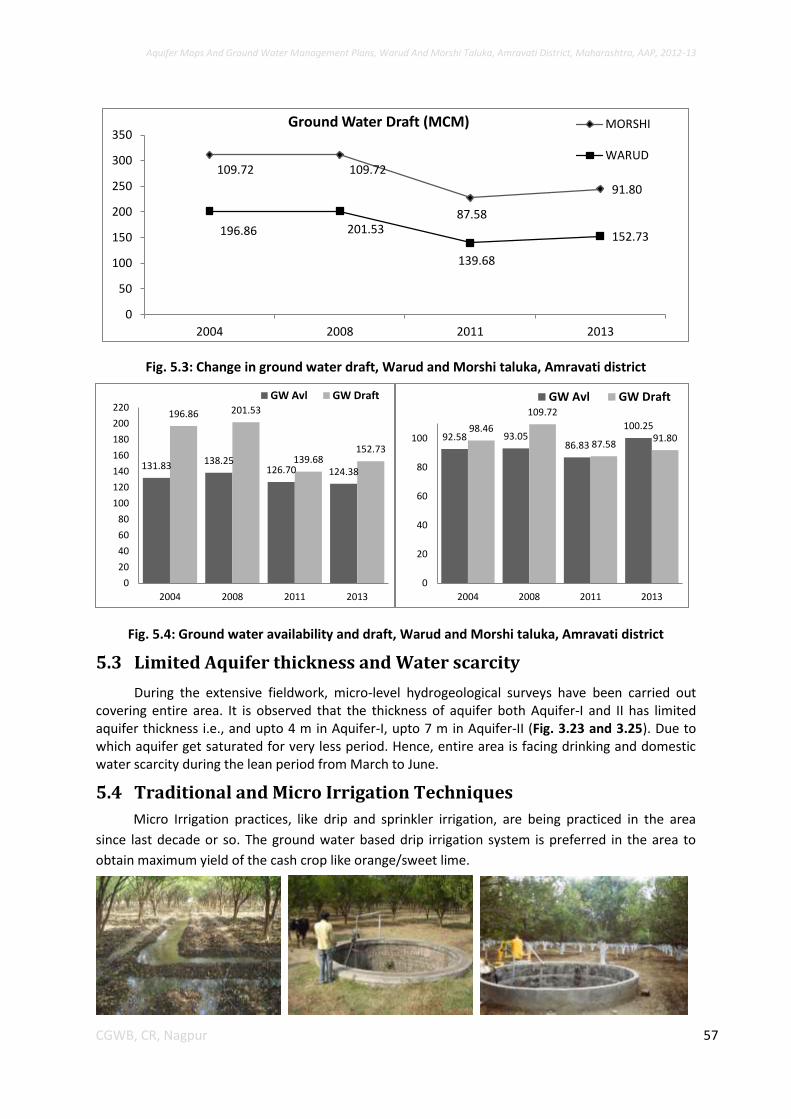
Aquifer Maps And Ground Water Management Plans, Warud And Morshi Taluka, Amravati District, Maharashtra, AAP, 2012-13
57 CGWB, CR, Nagpur
Fig. 5.3: Change in ground water draft, Warud and Morshi taluka, Amravati district
Fig. 5.4: Ground water availability and draft, Warud and Morshi taluka, Amravati district
5.3 Limited Aquifer thickness and Water scarcity
During the extensive fieldwork, micro-level hydrogeological surveys have been carried out covering entire area. It is observed that the thickness of aquifer both Aquifer-I and II has limited aquifer thickness i.e., and upto 4 m in Aquifer-I, upto 7 m in Aquifer-II (Fig. 3.23 and 3.25). Due to which aquifer get saturated for very less period. Hence, entire area is facing drinking and domestic water scarcity during the lean period from March to June.
5.4 Traditional and Micro Irrigation Techniques
Micro Irrigation practices, like drip and sprinkler irrigation, are being practiced in the area
since last decade or so. The ground water based drip irrigation system is preferred in the area to
obtain maximum yield of the cash crop like orange/sweet lime.
196.86 201.53
139.68
152.73
109.72 109.72
87.58
91.80
0
50
100
150
200
250
300
350
2004 2008 2011 2013
Ground Water Draft (MCM) MORSHI
WARUD
131.83 138.25 126.70 124.38
196.86 201.53
139.68 152.73
0
20
40
60
80
100
120
140
160
180
200
220
2004 2008 2011 2013
GW Avl GW Draft
92.58 93.05 86.83
100.25 98.46
109.72
87.58 91.80
0
20
40
60
80
100
2004 2008 2011 2013
GW Avl GW Draft
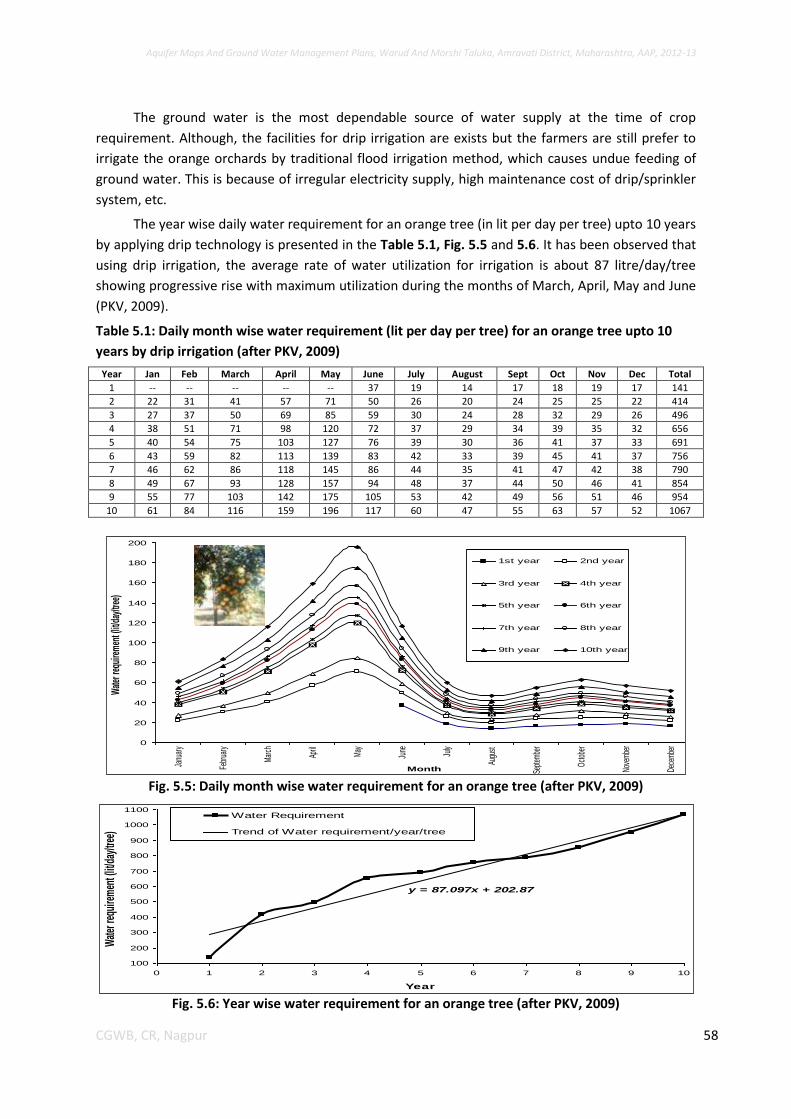
Aquifer Maps And Ground Water Management Plans, Warud And Morshi Taluka, Amravati District, Maharashtra, AAP, 2012-13
58 CGWB, CR, Nagpur
The ground water is the most dependable source of water supply at the time of crop
requirement. Although, the facilities for drip irrigation are exists but the farmers are still prefer to
irrigate the orange orchards by traditional flood irrigation method, which causes undue feeding of
ground water. This is because of irregular electricity supply, high maintenance cost of drip/sprinkler
system, etc.
The year wise daily water requirement for an orange tree (in lit per day per tree) upto 10 years
by applying drip technology is presented in the Table 5.1, Fig. 5.5 and 5.6. It has been observed that
using drip irrigation, the average rate of water utilization for irrigation is about 87 litre/day/tree
showing progressive rise with maximum utilization during the months of March, April, May and June
(PKV, 2009).
Table 5.1: Daily month wise water requirement (lit per day per tree) for an orange tree upto 10
years by drip irrigation (after PKV, 2009)
Year Jan Feb March April May June July August Sept Oct Nov Dec Total
1 -- -- -- -- -- 37 19 14 17 18 19 17 141
2 22 31 41 57 71 50 26 20 24 25 25 22 414
3 27 37 50 69 85 59 30 24 28 32 29 26 496
4 38 51 71 98 120 72 37 29 34 39 35 32 656
5 40 54 75 103 127 76 39 30 36 41 37 33 691
6 43 59 82 113 139 83 42 33 39 45 41 37 756
7 46 62 86 118 145 86 44 35 41 47 42 38 790
8 49 67 93 128 157 94 48 37 44 50 46 41 854
9 55 77 103 142 175 105 53 42 49 56 51 46 954
10 61 84 116 159 196 117 60 47 55 63 57 52 1067
Fig. 5.5: Daily month wise water requirement for an orange tree (after PKV, 2009)
Fig. 5.6: Year wise water requirement for an orange tree (after PKV, 2009)
Year-wise Monthly Water Requirement for an Orange Tree
0
20
40
60
80
100
120
140
160
180
200
Janu
ary
Febr
uary
Mar
ch
April
May
June July
Augu
st
Sept
embe
r
Oct
ober
Nove
mbe
r
Dece
mbe
r
Month
Wat
er re
quire
men
t (lit
/day
/tree
)
1st year 2nd year
3rd year 4th year
5th year 6th year
7th year 8th year
9th year 10th year
Year-wise Water Requirement for an Orange Tree
y = 87.097x + 202.87
100
200
300
400
500
600
700
800
900
1000
1100
0 1 2 3 4 5 6 7 8 9 10
Year
Wat
er re
quire
men
t (lit
/day
/tree
)
Water Requirement
Trend of Water requirement/year/tree
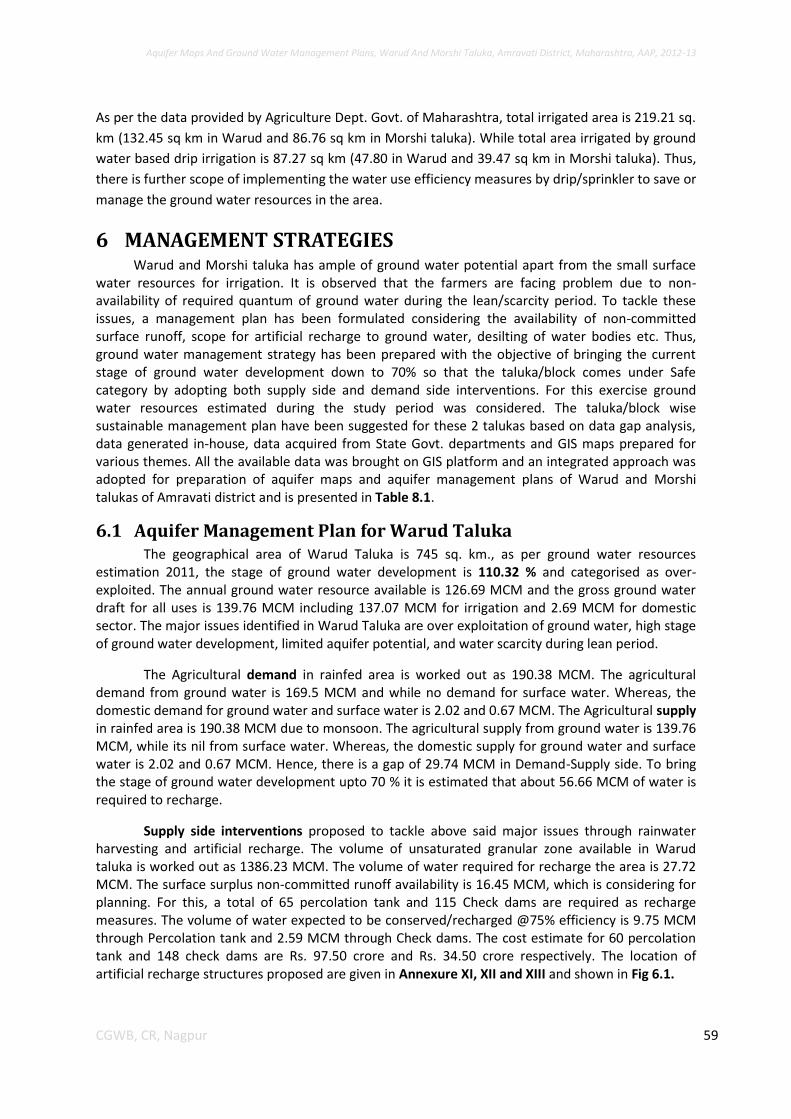
Aquifer Maps And Ground Water Management Plans, Warud And Morshi Taluka, Amravati District, Maharashtra, AAP, 2012-13
59 CGWB, CR, Nagpur
As per the data provided by Agriculture Dept. Govt. of Maharashtra, total irrigated area is 219.21 sq.
km (132.45 sq km in Warud and 86.76 sq km in Morshi taluka). While total area irrigated by ground
water based drip irrigation is 87.27 sq km (47.80 in Warud and 39.47 sq km in Morshi taluka). Thus,
there is further scope of implementing the water use efficiency measures by drip/sprinkler to save or
manage the ground water resources in the area.
6 MANAGEMENT STRATEGIES Warud and Morshi taluka has ample of ground water potential apart from the small surface
water resources for irrigation. It is observed that the farmers are facing problem due to non-availability of required quantum of ground water during the lean/scarcity period. To tackle these issues, a management plan has been formulated considering the availability of non-committed surface runoff, scope for artificial recharge to ground water, desilting of water bodies etc. Thus, ground water management strategy has been prepared with the objective of bringing the current stage of ground water development down to 70% so that the taluka/block comes under Safe category by adopting both supply side and demand side interventions. For this exercise ground water resources estimated during the study period was considered. The taluka/block wise sustainable management plan have been suggested for these 2 talukas based on data gap analysis, data generated in-house, data acquired from State Govt. departments and GIS maps prepared for various themes. All the available data was brought on GIS platform and an integrated approach was adopted for preparation of aquifer maps and aquifer management plans of Warud and Morshi talukas of Amravati district and is presented in Table 8.1.
6.1 Aquifer Management Plan for Warud Taluka The geographical area of Warud Taluka is 745 sq. km., as per ground water resources
estimation 2011, the stage of ground water development is 110.32 % and categorised as over-exploited. The annual ground water resource available is 126.69 MCM and the gross ground water draft for all uses is 139.76 MCM including 137.07 MCM for irrigation and 2.69 MCM for domestic sector. The major issues identified in Warud Taluka are over exploitation of ground water, high stage of ground water development, limited aquifer potential, and water scarcity during lean period.
The Agricultural demand in rainfed area is worked out as 190.38 MCM. The agricultural demand from ground water is 169.5 MCM and while no demand for surface water. Whereas, the domestic demand for ground water and surface water is 2.02 and 0.67 MCM. The Agricultural supply in rainfed area is 190.38 MCM due to monsoon. The agricultural supply from ground water is 139.76 MCM, while its nil from surface water. Whereas, the domestic supply for ground water and surface water is 2.02 and 0.67 MCM. Hence, there is a gap of 29.74 MCM in Demand-Supply side. To bring the stage of ground water development upto 70 % it is estimated that about 56.66 MCM of water is required to recharge.
Supply side interventions proposed to tackle above said major issues through rainwater harvesting and artificial recharge. The volume of unsaturated granular zone available in Warud taluka is worked out as 1386.23 MCM. The volume of water required for recharge the area is 27.72 MCM. The surface surplus non-committed runoff availability is 16.45 MCM, which is considering for planning. For this, a total of 65 percolation tank and 115 Check dams are required as recharge measures. The volume of water expected to be conserved/recharged @75% efficiency is 9.75 MCM through Percolation tank and 2.59 MCM through Check dams. The cost estimate for 60 percolation tank and 148 check dams are Rs. 97.50 crore and Rs. 34.50 crore respectively. The location of artificial recharge structures proposed are given in Annexure XI, XII and XIII and shown in Fig 6.1.
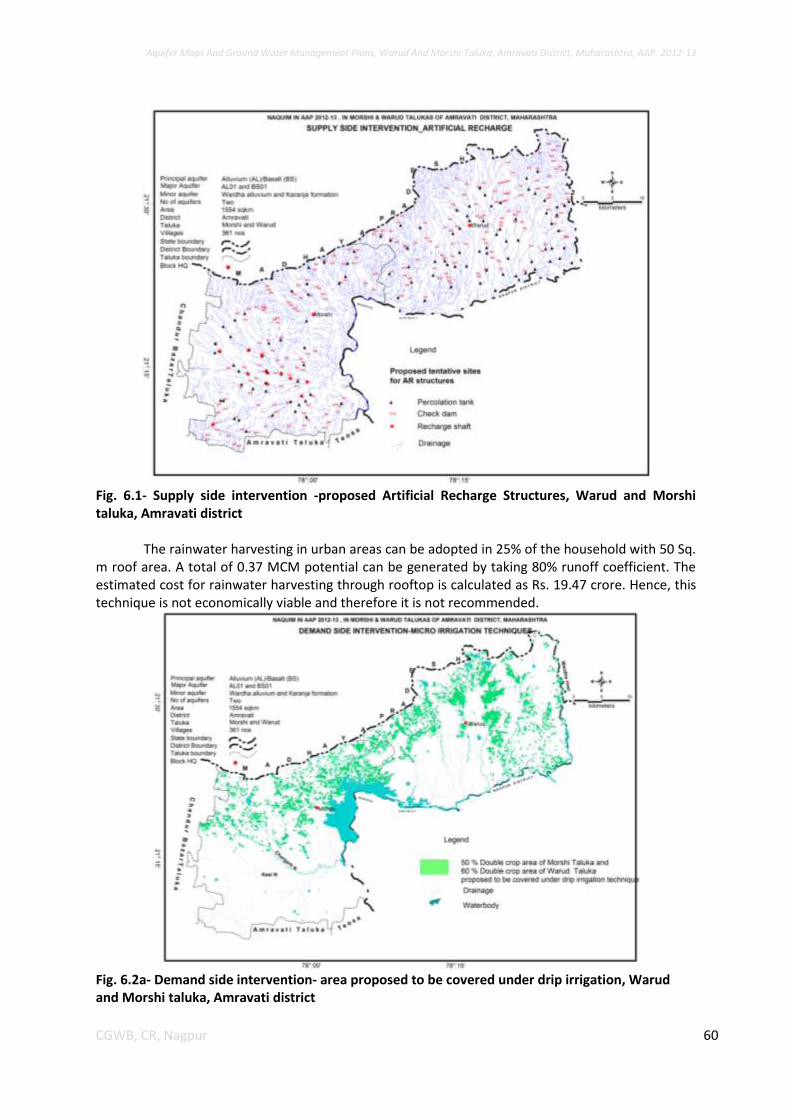
Aquifer Maps And Ground Water Management Plans, Warud And Morshi Taluka, Amravati District, Maharashtra, AAP, 2012-13
60 CGWB, CR, Nagpur
Fig. 6.1- Supply side intervention -proposed Artificial Recharge Structures, Warud and Morshi taluka, Amravati district
The rainwater harvesting in urban areas can be adopted in 25% of the household with 50 Sq.
m roof area. A total of 0.37 MCM potential can be generated by taking 80% runoff coefficient. The estimated cost for rainwater harvesting through rooftop is calculated as Rs. 19.47 crore. Hence, this technique is not economically viable and therefore it is not recommended.
Fig. 6.2a- Demand side intervention- area proposed to be covered under drip irrigation, Warud and Morshi taluka, Amravati district
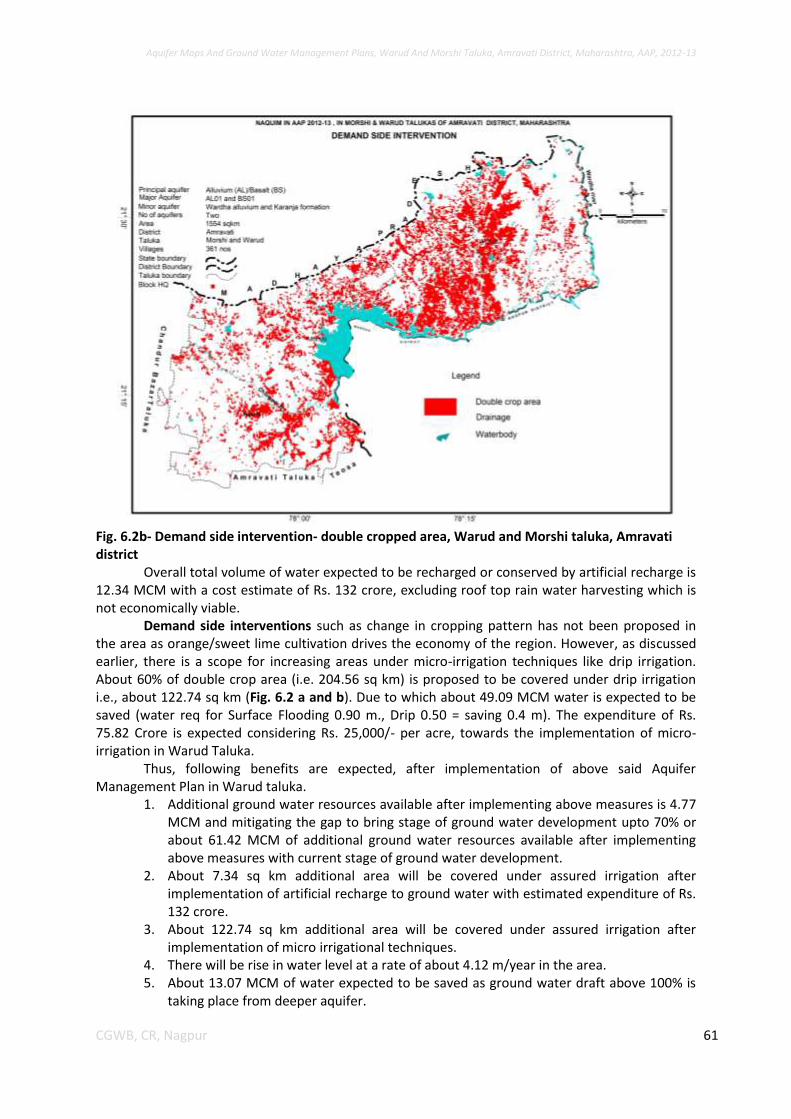
Aquifer Maps And Ground Water Management Plans, Warud And Morshi Taluka, Amravati District, Maharashtra, AAP, 2012-13
61 CGWB, CR, Nagpur
Fig. 6.2b- Demand side intervention- double cropped area, Warud and Morshi taluka, Amravati district
Overall total volume of water expected to be recharged or conserved by artificial recharge is 12.34 MCM with a cost estimate of Rs. 132 crore, excluding roof top rain water harvesting which is not economically viable.
Demand side interventions such as change in cropping pattern has not been proposed in the area as orange/sweet lime cultivation drives the economy of the region. However, as discussed earlier, there is a scope for increasing areas under micro-irrigation techniques like drip irrigation. About 60% of double crop area (i.e. 204.56 sq km) is proposed to be covered under drip irrigation i.e., about 122.74 sq km (Fig. 6.2 a and b). Due to which about 49.09 MCM water is expected to be saved (water req for Surface Flooding 0.90 m., Drip 0.50 = saving 0.4 m). The expenditure of Rs. 75.82 Crore is expected considering Rs. 25,000/- per acre, towards the implementation of micro-irrigation in Warud Taluka.
Thus, following benefits are expected, after implementation of above said Aquifer Management Plan in Warud taluka.
1. Additional ground water resources available after implementing above measures is 4.77 MCM and mitigating the gap to bring stage of ground water development upto 70% or about 61.42 MCM of additional ground water resources available after implementing above measures with current stage of ground water development.
2. About 7.34 sq km additional area will be covered under assured irrigation after implementation of artificial recharge to ground water with estimated expenditure of Rs. 132 crore.
3. About 122.74 sq km additional area will be covered under assured irrigation after implementation of micro irrigational techniques.
4. There will be rise in water level at a rate of about 4.12 m/year in the area. 5. About 13.07 MCM of water expected to be saved as ground water draft above 100% is
taking place from deeper aquifer.
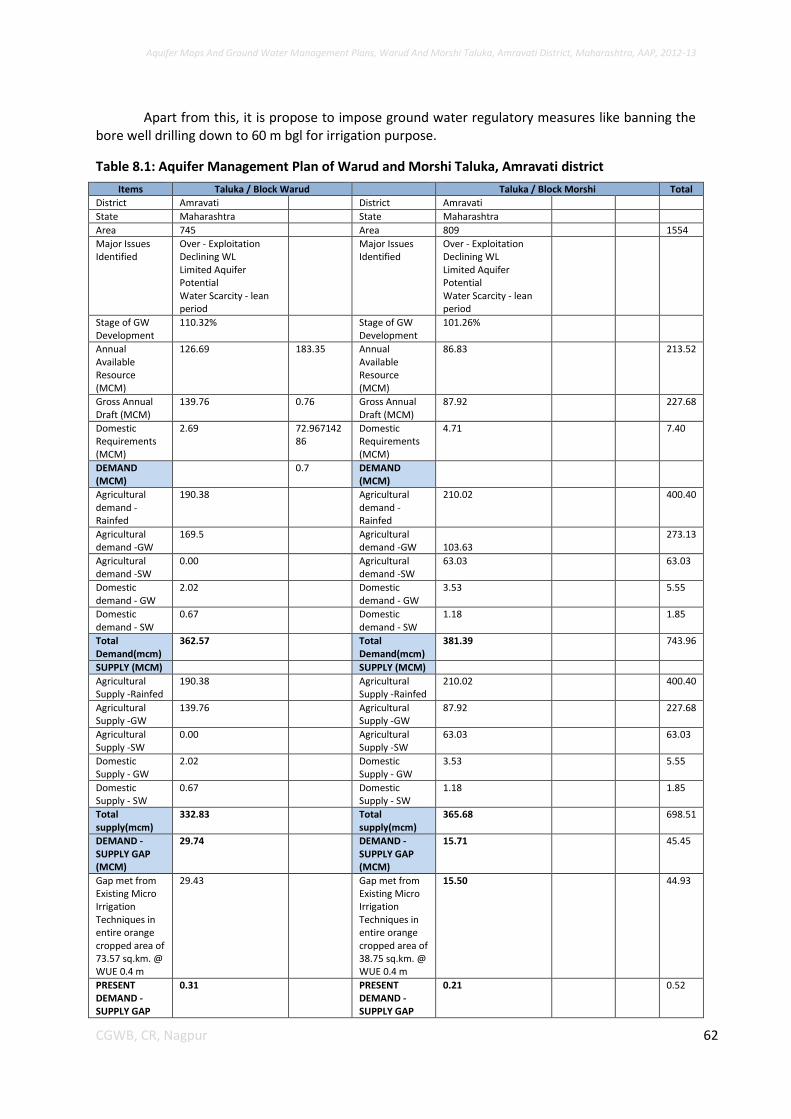
Aquifer Maps And Ground Water Management Plans, Warud And Morshi Taluka, Amravati District, Maharashtra, AAP, 2012-13
62 CGWB, CR, Nagpur
Apart from this, it is propose to impose ground water regulatory measures like banning the bore well drilling down to 60 m bgl for irrigation purpose.
Table 8.1: Aquifer Management Plan of Warud and Morshi Taluka, Amravati district
Items Taluka / Block Warud Taluka / Block Morshi Total
District Amravati District Amravati
State Maharashtra State Maharashtra
Area 745 Area 809 1554
Major Issues Identified
Over - Exploitation Declining WL Limited Aquifer Potential Water Scarcity - lean period
Major Issues Identified
Over - Exploitation Declining WL Limited Aquifer Potential Water Scarcity - lean period
Stage of GW Development
110.32% Stage of GW Development
101.26%
Annual Available Resource (MCM)
126.69 183.35 Annual Available Resource (MCM)
86.83 213.52
Gross Annual Draft (MCM)
139.76 0.76 Gross Annual Draft (MCM)
87.92 227.68
Domestic Requirements (MCM)
2.69 72.96714286
Domestic Requirements (MCM)
4.71 7.40
DEMAND (MCM)
0.7 DEMAND (MCM)
Agricultural demand -Rainfed
190.38 Agricultural demand -Rainfed
210.02 400.40
Agricultural demand -GW
169.5 Agricultural demand -GW 103.63
273.13
Agricultural demand -SW
0.00 Agricultural demand -SW
63.03 63.03
Domestic demand - GW
2.02 Domestic demand - GW
3.53 5.55
Domestic demand - SW
0.67 Domestic demand - SW
1.18 1.85
Total Demand(mcm)
362.57 Total Demand(mcm)
381.39
743.96
SUPPLY (MCM) SUPPLY (MCM)
Agricultural Supply -Rainfed
190.38 Agricultural Supply -Rainfed
210.02
400.40
Agricultural Supply -GW
139.76 Agricultural Supply -GW
87.92
227.68
Agricultural Supply -SW
0.00 Agricultural Supply -SW
63.03
63.03
Domestic Supply - GW
2.02 Domestic Supply - GW
3.53
5.55
Domestic Supply - SW
0.67 Domestic Supply - SW
1.18
1.85
Total supply(mcm)
332.83 Total supply(mcm)
365.68 698.51
DEMAND - SUPPLY GAP (MCM)
29.74 DEMAND - SUPPLY GAP (MCM)
15.71 45.45
Gap met from Existing Micro Irrigation Techniques in entire orange cropped area of 73.57 sq.km. @ WUE 0.4 m
29.43 Gap met from Existing Micro Irrigation Techniques in entire orange cropped area of 38.75 sq.km. @ WUE 0.4 m
15.50 44.93
PRESENT DEMAND - SUPPLY GAP
0.31 PRESENT DEMAND - SUPPLY GAP
0.21 0.52
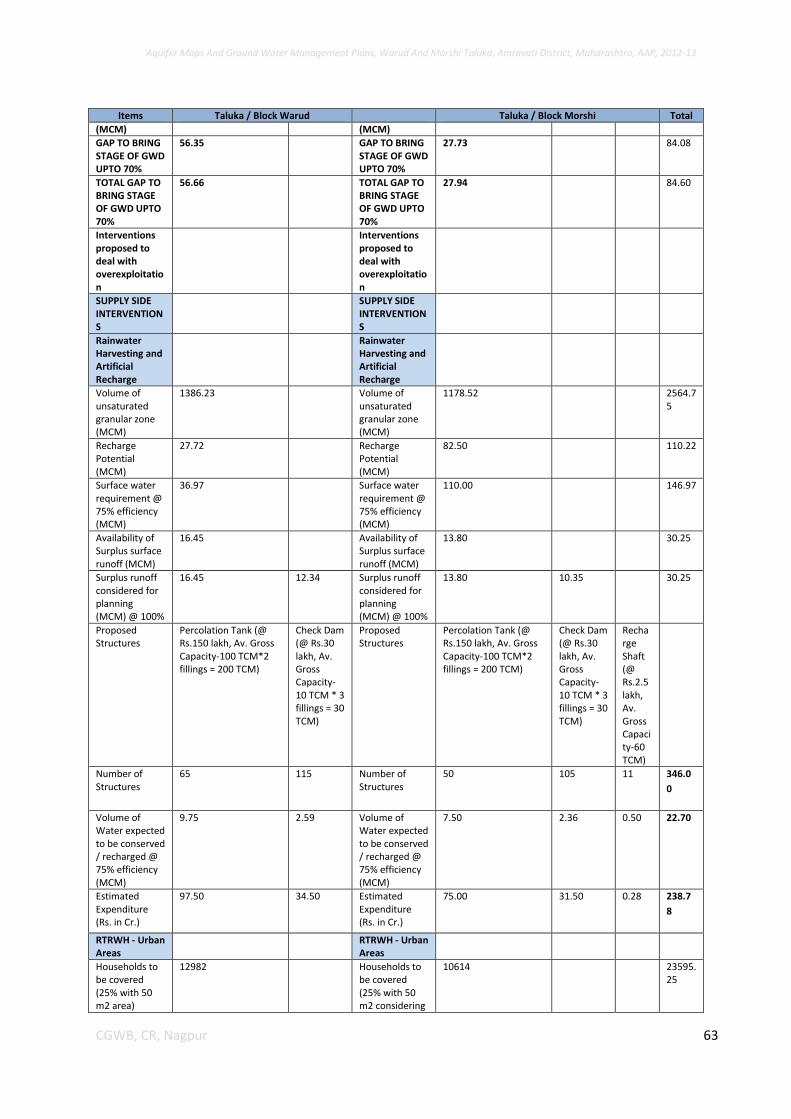
Aquifer Maps And Ground Water Management Plans, Warud And Morshi Taluka, Amravati District, Maharashtra, AAP, 2012-13
63 CGWB, CR, Nagpur
Items Taluka / Block Warud Taluka / Block Morshi Total
(MCM) (MCM)
GAP TO BRING STAGE OF GWD UPTO 70%
56.35 GAP TO BRING STAGE OF GWD UPTO 70%
27.73 84.08
TOTAL GAP TO BRING STAGE OF GWD UPTO 70%
56.66 TOTAL GAP TO BRING STAGE OF GWD UPTO 70%
27.94 84.60
Interventions proposed to deal with overexploitation
Interventions proposed to deal with overexploitation
SUPPLY SIDE INTERVENTIONS
SUPPLY SIDE INTERVENTIONS
Rainwater Harvesting and Artificial Recharge
Rainwater Harvesting and Artificial Recharge
Volume of unsaturated granular zone (MCM)
1386.23 Volume of unsaturated granular zone (MCM)
1178.52 2564.75
Recharge Potential (MCM)
27.72 Recharge Potential (MCM)
82.50 110.22
Surface water requirement @ 75% efficiency (MCM)
36.97 Surface water requirement @ 75% efficiency (MCM)
110.00 146.97
Availability of Surplus surface runoff (MCM)
16.45 Availability of Surplus surface runoff (MCM)
13.80 30.25
Surplus runoff considered for planning (MCM) @ 100%
16.45 12.34 Surplus runoff considered for planning (MCM) @ 100%
13.80 10.35 30.25
Proposed Structures
Percolation Tank (@ Rs.150 lakh, Av. Gross Capacity-100 TCM*2 fillings = 200 TCM)
Check Dam (@ Rs.30 lakh, Av. Gross Capacity-10 TCM * 3 fillings = 30 TCM)
Proposed Structures
Percolation Tank (@ Rs.150 lakh, Av. Gross Capacity-100 TCM*2 fillings = 200 TCM)
Check Dam (@ Rs.30 lakh, Av. Gross Capacity-10 TCM * 3 fillings = 30 TCM)
Recharge Shaft (@ Rs.2.5 lakh, Av. Gross Capacity-60 TCM)
Number of Structures
65 115 Number of Structures
50 105 11 346.0
0
Volume of Water expected to be conserved / recharged @ 75% efficiency (MCM)
9.75 2.59 Volume of Water expected to be conserved / recharged @ 75% efficiency (MCM)
7.50 2.36 0.50 22.70
Estimated Expenditure (Rs. in Cr.)
97.50 34.50 Estimated Expenditure (Rs. in Cr.)
75.00 31.50 0.28 238.7
8
RTRWH - Urban Areas
RTRWH - Urban Areas
Households to be covered (25% with 50 m2 area)
12982 Households to be covered (25% with 50 m2 considering
10614 23595.25
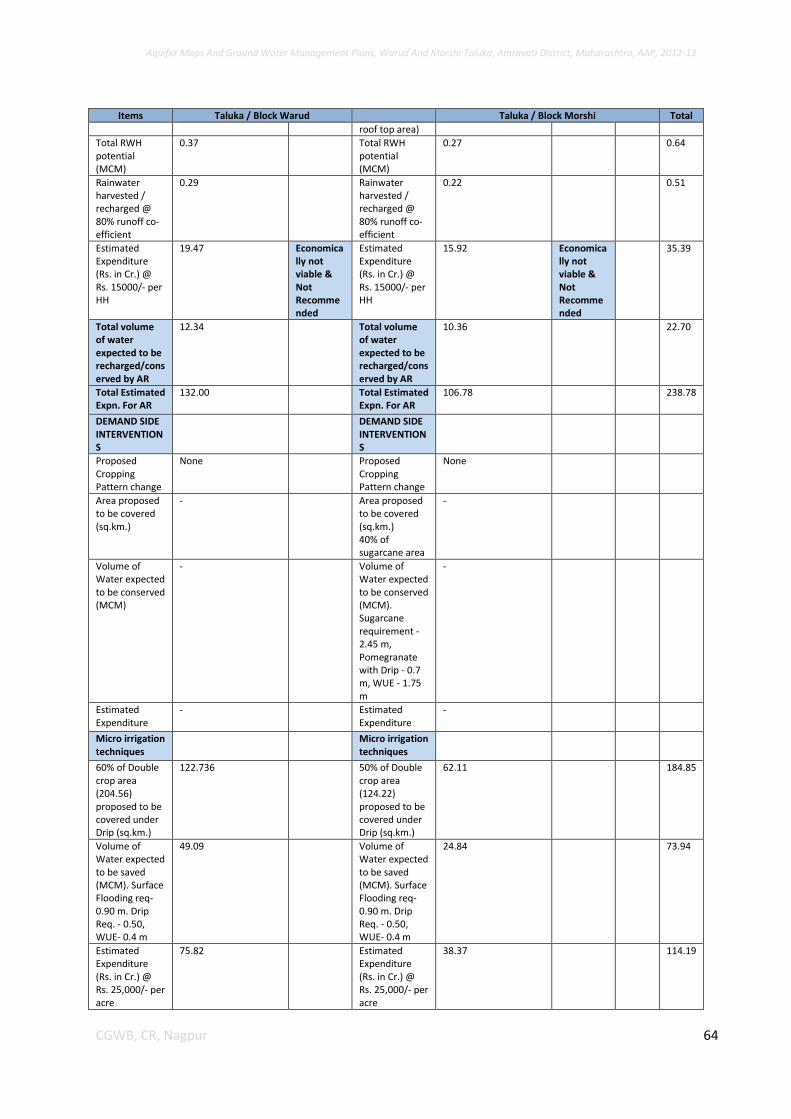
Aquifer Maps And Ground Water Management Plans, Warud And Morshi Taluka, Amravati District, Maharashtra, AAP, 2012-13
64 CGWB, CR, Nagpur
Items Taluka / Block Warud Taluka / Block Morshi Total
roof top area)
Total RWH potential (MCM)
0.37 Total RWH potential (MCM)
0.27 0.64
Rainwater harvested / recharged @ 80% runoff co-efficient
0.29 Rainwater harvested / recharged @ 80% runoff co-efficient
0.22 0.51
Estimated Expenditure (Rs. in Cr.) @ Rs. 15000/- per HH
19.47 Economically not viable & Not Recommended
Estimated Expenditure (Rs. in Cr.) @ Rs. 15000/- per HH
15.92 Economically not viable & Not Recommended
35.39
Total volume of water expected to be recharged/conserved by AR
12.34 Total volume of water expected to be recharged/conserved by AR
10.36 22.70
Total Estimated Expn. For AR
132.00 Total Estimated Expn. For AR
106.78 238.78
DEMAND SIDE INTERVENTIONS
DEMAND SIDE INTERVENTIONS
Proposed Cropping Pattern change
None Proposed Cropping Pattern change
None
Area proposed to be covered (sq.km.)
- Area proposed to be covered (sq.km.) 40% of sugarcane area
-
Volume of Water expected to be conserved (MCM)
- Volume of Water expected to be conserved (MCM). Sugarcane requirement - 2.45 m, Pomegranate with Drip - 0.7 m, WUE - 1.75 m
-
Estimated Expenditure
- Estimated Expenditure
-
Micro irrigation techniques
Micro irrigation techniques
60% of Double crop area (204.56) proposed to be covered under Drip (sq.km.)
122.736 50% of Double crop area (124.22) proposed to be covered under Drip (sq.km.)
62.11 184.85
Volume of Water expected to be saved (MCM). Surface Flooding req- 0.90 m. Drip Req. - 0.50, WUE- 0.4 m
49.09 Volume of Water expected to be saved (MCM). Surface Flooding req- 0.90 m. Drip Req. - 0.50, WUE- 0.4 m
24.84 73.94
Estimated Expenditure (Rs. in Cr.) @ Rs. 25,000/- per acre
75.82 Estimated Expenditure (Rs. in Cr.) @ Rs. 25,000/- per acre
38.37 114.19
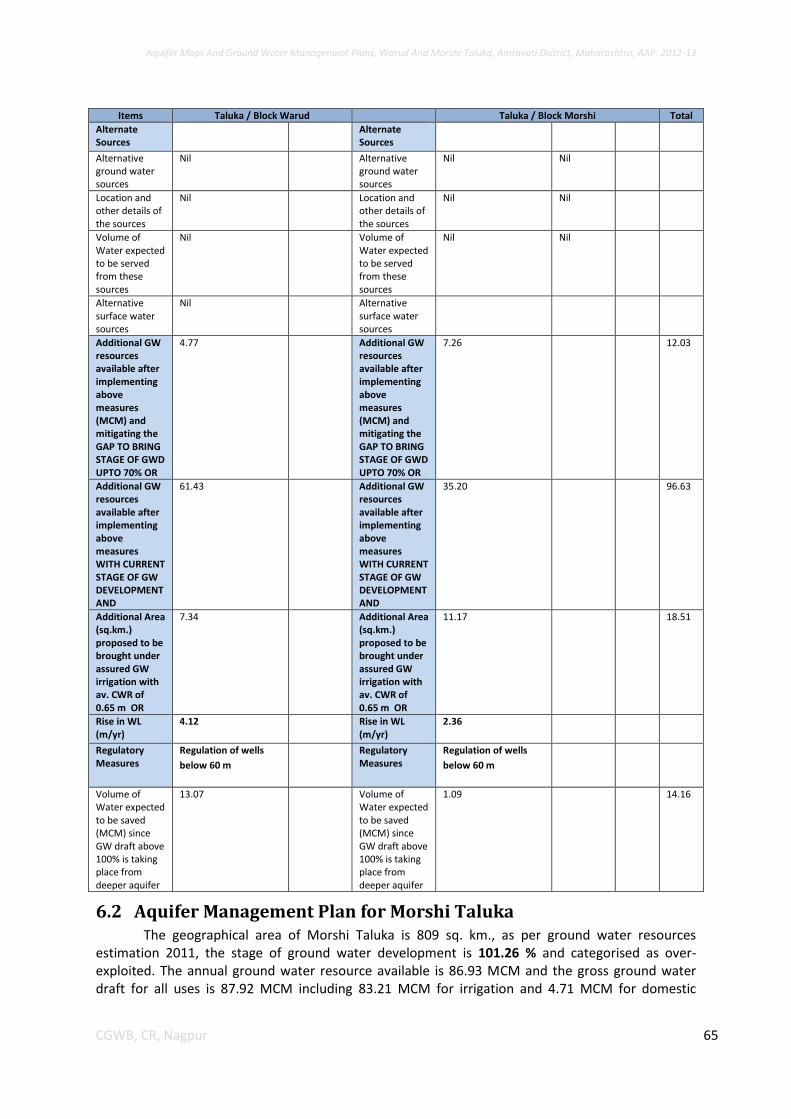
Aquifer Maps And Ground Water Management Plans, Warud And Morshi Taluka, Amravati District, Maharashtra, AAP, 2012-13
65 CGWB, CR, Nagpur
Items Taluka / Block Warud Taluka / Block Morshi Total
Alternate Sources
Alternate Sources
Alternative ground water sources
Nil Alternative ground water sources
Nil Nil
Location and other details of the sources
Nil Location and other details of the sources
Nil Nil
Volume of Water expected to be served from these sources
Nil Volume of Water expected to be served from these sources
Nil Nil
Alternative surface water sources
Nil Alternative surface water sources
Additional GW resources available after implementing above measures (MCM) and mitigating the GAP TO BRING STAGE OF GWD UPTO 70% OR
4.77 Additional GW resources available after implementing above measures (MCM) and mitigating the GAP TO BRING STAGE OF GWD UPTO 70% OR
7.26 12.03
Additional GW resources available after implementing above measures WITH CURRENT STAGE OF GW DEVELOPMENT AND
61.43 Additional GW resources available after implementing above measures WITH CURRENT STAGE OF GW DEVELOPMENT AND
35.20 96.63
Additional Area (sq.km.) proposed to be brought under assured GW irrigation with av. CWR of 0.65 m OR
7.34 Additional Area (sq.km.) proposed to be brought under assured GW irrigation with av. CWR of 0.65 m OR
11.17 18.51
Rise in WL (m/yr)
4.12 Rise in WL (m/yr)
2.36
Regulatory Measures
Regulation of wells
below 60 m
Regulatory Measures
Regulation of wells
below 60 m
Volume of Water expected to be saved (MCM) since GW draft above 100% is taking place from deeper aquifer
13.07 Volume of Water expected to be saved (MCM) since GW draft above 100% is taking place from deeper aquifer
1.09
14.16
6.2 Aquifer Management Plan for Morshi Taluka The geographical area of Morshi Taluka is 809 sq. km., as per ground water resources
estimation 2011, the stage of ground water development is 101.26 % and categorised as over-exploited. The annual ground water resource available is 86.93 MCM and the gross ground water draft for all uses is 87.92 MCM including 83.21 MCM for irrigation and 4.71 MCM for domestic
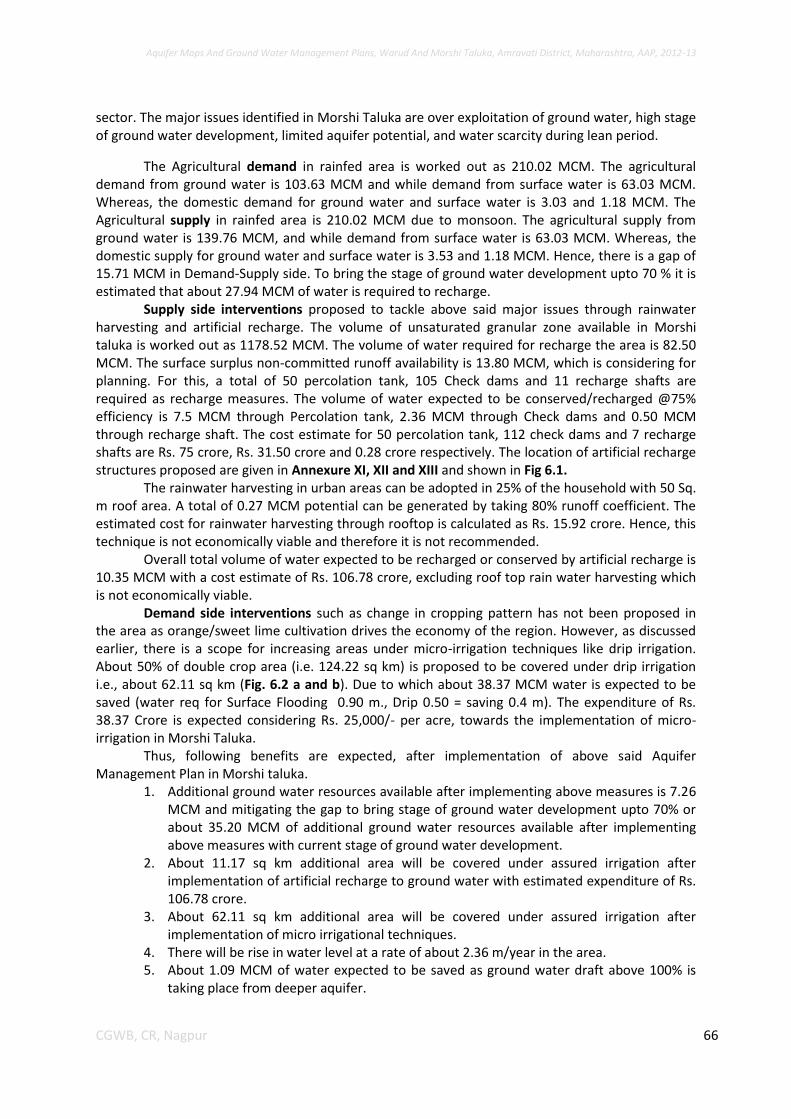
Aquifer Maps And Ground Water Management Plans, Warud And Morshi Taluka, Amravati District, Maharashtra, AAP, 2012-13
66 CGWB, CR, Nagpur
sector. The major issues identified in Morshi Taluka are over exploitation of ground water, high stage of ground water development, limited aquifer potential, and water scarcity during lean period.
The Agricultural demand in rainfed area is worked out as 210.02 MCM. The agricultural demand from ground water is 103.63 MCM and while demand from surface water is 63.03 MCM. Whereas, the domestic demand for ground water and surface water is 3.03 and 1.18 MCM. The Agricultural supply in rainfed area is 210.02 MCM due to monsoon. The agricultural supply from ground water is 139.76 MCM, and while demand from surface water is 63.03 MCM. Whereas, the domestic supply for ground water and surface water is 3.53 and 1.18 MCM. Hence, there is a gap of 15.71 MCM in Demand-Supply side. To bring the stage of ground water development upto 70 % it is estimated that about 27.94 MCM of water is required to recharge.
Supply side interventions proposed to tackle above said major issues through rainwater harvesting and artificial recharge. The volume of unsaturated granular zone available in Morshi taluka is worked out as 1178.52 MCM. The volume of water required for recharge the area is 82.50 MCM. The surface surplus non-committed runoff availability is 13.80 MCM, which is considering for planning. For this, a total of 50 percolation tank, 105 Check dams and 11 recharge shafts are required as recharge measures. The volume of water expected to be conserved/recharged @75% efficiency is 7.5 MCM through Percolation tank, 2.36 MCM through Check dams and 0.50 MCM through recharge shaft. The cost estimate for 50 percolation tank, 112 check dams and 7 recharge shafts are Rs. 75 crore, Rs. 31.50 crore and 0.28 crore respectively. The location of artificial recharge structures proposed are given in Annexure XI, XII and XIII and shown in Fig 6.1.
The rainwater harvesting in urban areas can be adopted in 25% of the household with 50 Sq. m roof area. A total of 0.27 MCM potential can be generated by taking 80% runoff coefficient. The estimated cost for rainwater harvesting through rooftop is calculated as Rs. 15.92 crore. Hence, this technique is not economically viable and therefore it is not recommended.
Overall total volume of water expected to be recharged or conserved by artificial recharge is 10.35 MCM with a cost estimate of Rs. 106.78 crore, excluding roof top rain water harvesting which is not economically viable.
Demand side interventions such as change in cropping pattern has not been proposed in the area as orange/sweet lime cultivation drives the economy of the region. However, as discussed earlier, there is a scope for increasing areas under micro-irrigation techniques like drip irrigation. About 50% of double crop area (i.e. 124.22 sq km) is proposed to be covered under drip irrigation i.e., about 62.11 sq km (Fig. 6.2 a and b). Due to which about 38.37 MCM water is expected to be saved (water req for Surface Flooding 0.90 m., Drip 0.50 = saving 0.4 m). The expenditure of Rs. 38.37 Crore is expected considering Rs. 25,000/- per acre, towards the implementation of micro-irrigation in Morshi Taluka.
Thus, following benefits are expected, after implementation of above said Aquifer Management Plan in Morshi taluka.
1. Additional ground water resources available after implementing above measures is 7.26 MCM and mitigating the gap to bring stage of ground water development upto 70% or about 35.20 MCM of additional ground water resources available after implementing above measures with current stage of ground water development.
2. About 11.17 sq km additional area will be covered under assured irrigation after implementation of artificial recharge to ground water with estimated expenditure of Rs. 106.78 crore.
3. About 62.11 sq km additional area will be covered under assured irrigation after implementation of micro irrigational techniques.
4. There will be rise in water level at a rate of about 2.36 m/year in the area. 5. About 1.09 MCM of water expected to be saved as ground water draft above 100% is
taking place from deeper aquifer.
Aquifer Maps And Ground Water Management Plans, Warud And Morshi Taluka, Amravati District, Maharashtra, AAP, 2012-13
67 CGWB, CR, Nagpur
Apart from this, it is propose to impose ground water regulatory measures like banning the bore well drilling down to 60 m bgl for irrigation purpose.
6.3 Sum-up A thorough study was carried out based on data gap analysis, data generated in-house, data
acquired from State Govt. departments and GIS maps prepared for various themes. All the available data was brought on GIS platform and an integrated approach was adopted for preparation of aquifer maps and aquifer management plans of Warud and Morshi taluka of Amravati district.
The study area is spanning over 1554 sq.km., out of which 745 sq.km. falling in Warud and 809 sq. km. in Morshi taluka. Geologically, the area is occupied entirely by Basalt, however, Purna Alluvium is observed in western part of the Morshi taluka. Over exploitation of ground water, declining of ground water levels, limited aquifer thickness and, water scarcity during lean period are the major issues in the area. The stage of ground water development is 110.32 % in Warud and 101.26 % in Morshi taluka. The farmers are using traditional farming & irrigation methods (rainfed & flood irrigation) for oil seed, pulses, cereals, cotton etc. However, for orange/sweet lime orchards they have adopted micro irrigation techniques like drip irrigation. At present, there is scope for introducing the drip irrigation in double crop irrigated area.
The overall quality of ground water is found suitable for drinking, domestic, and irrigation purposes, except at few places, except in Aquifer-II nitrate concentration >45 mg/l is reported at Katpur in morshi taluka. It is may be due to the interaction of aquifer-I as the first zone was encountered above 30 mbgl. Nitrate concentration of >45 mg/l is observed in southern part of Warud taluka, where intense agricultural activity is predominant. Rest of the parameters is within permissible limit.
It is recommended that the occurrence of red bole beds in local hydrogeological conditions should be consider as the red boles in basaltic terrain plays major role.
Ground water management plan has been prepared for Aquifer I (Weathered and jointed fracture Basalt and granular zones of Purna alluvium), Aquifer II (Jointed and Fractured Basalt) with the objective of bringing the current stage of ground water development down to 70% by adopting supply side and demand interventions. There is gap of 29.74 MCM and 15.71 MCM between demand and supply in Warud and Morshi taluka respectively. As a part of supply side interventions, feasible artificial recharge, water conservation measures like, percolation tank, check dam, recharge shaft, depending on the source water availability in the taluka, are recommended. Also, as demand side interventions, 184.85 sq km double crop area( 122.74 & 62.11 sq km in Warud and Morshi taluka) has been identified for micro irrigation techniques like drip irrigation.
1. Additional ground water resources available after implementing above measures is 12.03 MCM (4.77 MCM in Warud taluka and 7.26 MCM in Morshi taluka) mitigating the gap to bring stage of gwd upto 70%. In other terms, about 96.63 MCM (61.43 MCM in Warud taluka and 35.20 MCM in Morshi taluka) of additional ground water resources available after implementing recommended measures with current stage of ground water development.
2. About 18.51 sq km (7.34 sq km in Warud taluka and 11.17 MCM in Morshi taluka) additional area will be covered under assured irrigation after implementation of artificial recharge to ground water with estimated expenditure of 238.78 crore (Rs. 132 crore in Warud taluka and 106.78 crore in Morshi taluka).
3. About 184.85 sq km area (122.74 sq km in Warud and 62.11 sq km in Morshi taluka) additional area will be covered under assured irrigation after implementation of micro irrigational techniques with estimated expenditure of 114.19 crore (Rs. 75.82 crore in Warud taluka and 38.37 crore in Morshi taluka)..
4. There will be rise in water level in both the talukas at a rate of about 4.12 m/year in Warud taluka and 2.36 m in Morshi taluka.
Aquifer Maps And Ground Water Management Plans, Warud And Morshi Taluka, Amravati District, Maharashtra, AAP, 2012-13
68 CGWB, CR, Nagpur
5. About 14.16 MCM (13.07 MCM in Warud taluka and 1.09 MCM in Morshi taluka) water expected to be saved as ground water draft above 100% is taking place from deeper aquifer.
These interventions also need to be supported by regulation of deeper aquifer and hence it is recommended to regulate/ban deeper tubewells/borewells of more than 60 m depth in these talukas, so that the deeper ground water resources are protected for future generation and also
serve as ground water sanctuary in times of distress/drought and shall be used as sanctuary for drinking water supply. IEC activities and capacity building activities needs to be aggressively propagated to establish the institutional framework for participatory groundwater management.
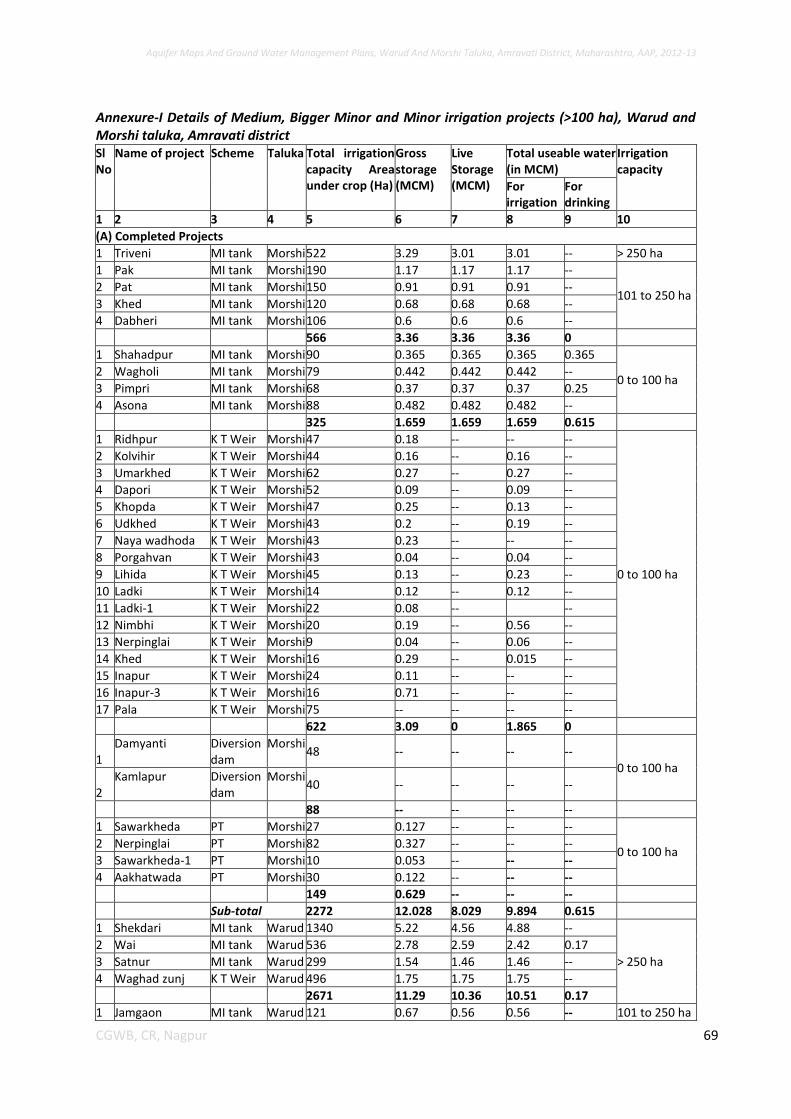
Aquifer Maps And Ground Water Management Plans, Warud And Morshi Taluka, Amravati District, Maharashtra, AAP, 2012-13
69 CGWB, CR, Nagpur
Annexure-I Details of Medium, Bigger Minor and Minor irrigation projects (>100 ha), Warud and Morshi taluka, Amravati district Sl No
Name of project Scheme Taluka Total irrigation capacity Area under crop (Ha)
Gross storage (MCM)
Live Storage (MCM)
Total useable water (in MCM)
Irrigation capacity
For irrigation
For drinking
1 2 3 4 5 6 7 8 9 10
(A) Completed Projects
1 Triveni MI tank Morshi 522 3.29 3.01 3.01 -- > 250 ha
1 Pak MI tank Morshi 190 1.17 1.17 1.17 --
101 to 250 ha 2 Pat MI tank Morshi 150 0.91 0.91 0.91 --
3 Khed MI tank Morshi 120 0.68 0.68 0.68 --
4 Dabheri MI tank Morshi 106 0.6 0.6 0.6 --
566 3.36 3.36 3.36 0
1 Shahadpur MI tank Morshi 90 0.365 0.365 0.365 0.365
0 to 100 ha 2 Wagholi MI tank Morshi 79 0.442 0.442 0.442 --
3 Pimpri MI tank Morshi 68 0.37 0.37 0.37 0.25
4 Asona MI tank Morshi 88 0.482 0.482 0.482 --
325 1.659 1.659 1.659 0.615
1 Ridhpur K T Weir Morshi 47 0.18 -- -- --
0 to 100 ha
2 Kolvihir K T Weir Morshi 44 0.16 -- 0.16 --
3 Umarkhed K T Weir Morshi 62 0.27 -- 0.27 --
4 Dapori K T Weir Morshi 52 0.09 -- 0.09 --
5 Khopda K T Weir Morshi 47 0.25 -- 0.13 --
6 Udkhed K T Weir Morshi 43 0.2 -- 0.19 --
7 Naya wadhoda K T Weir Morshi 43 0.23 -- -- --
8 Porgahvan K T Weir Morshi 43 0.04 -- 0.04 --
9 Lihida K T Weir Morshi 45 0.13 -- 0.23 --
10 Ladki K T Weir Morshi 14 0.12 -- 0.12 --
11 Ladki-1 K T Weir Morshi 22 0.08 -- --
12 Nimbhi K T Weir Morshi 20 0.19 -- 0.56 --
13 Nerpinglai K T Weir Morshi 9 0.04 -- 0.06 --
14 Khed K T Weir Morshi 16 0.29 -- 0.015 --
15 Inapur K T Weir Morshi 24 0.11 -- -- --
16 Inapur-3 K T Weir Morshi 16 0.71 -- -- --
17 Pala K T Weir Morshi 75 -- -- -- --
622 3.09 0 1.865 0
1 Damyanti Diversion
dam Morshi
48 -- -- -- -- 0 to 100 ha
2 Kamlapur Diversion
dam Morshi
40 -- -- -- --
88 -- -- -- --
1 Sawarkheda PT Morshi 27 0.127 -- -- --
0 to 100 ha 2 Nerpinglai PT Morshi 82 0.327 -- -- --
3 Sawarkheda-1 PT Morshi 10 0.053 -- -- --
4 Aakhatwada PT Morshi 30 0.122 -- -- --
149 0.629 -- -- --
Sub-total 2272 12.028 8.029 9.894 0.615
1 Shekdari MI tank Warud 1340 5.22 4.56 4.88 --
> 250 ha
2 Wai MI tank Warud 536 2.78 2.59 2.42 0.17
3 Satnur MI tank Warud 299 1.54 1.46 1.46 --
4 Waghad zunj K T Weir Warud 496 1.75 1.75 1.75 --
2671 11.29 10.36 10.51 0.17
1 Jamgaon MI tank Warud 121 0.67 0.56 0.56 -- 101 to 250 ha
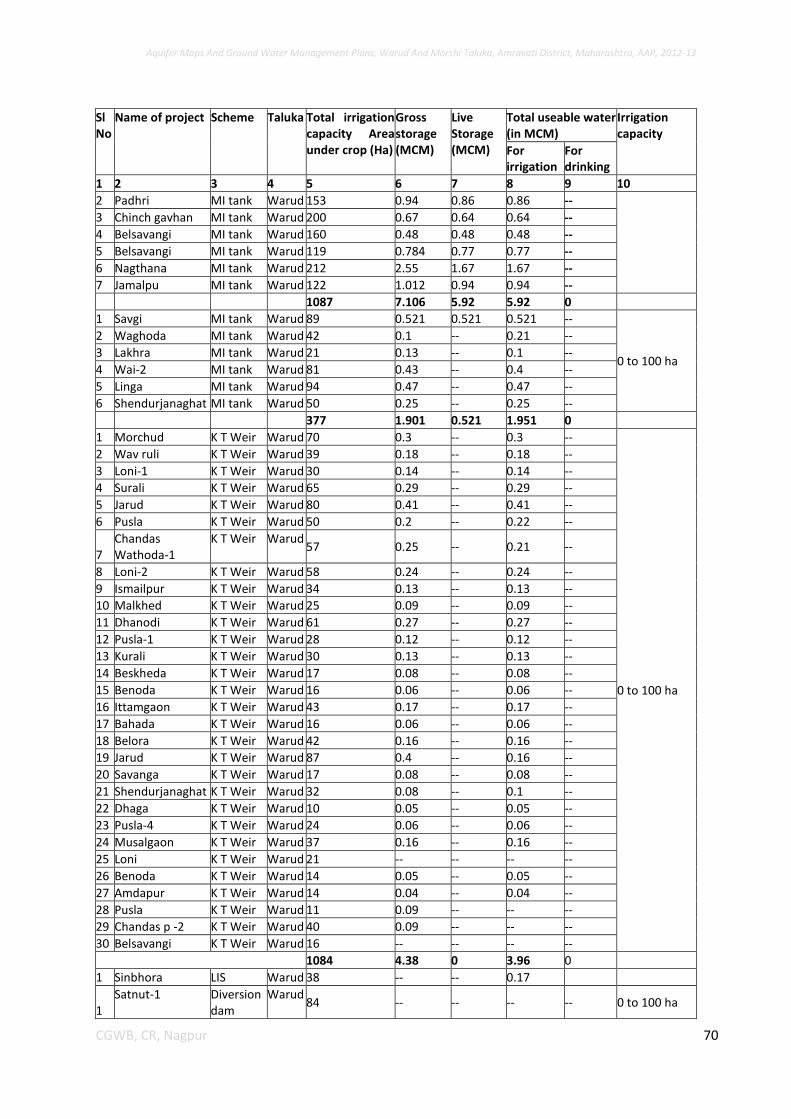
Aquifer Maps And Ground Water Management Plans, Warud And Morshi Taluka, Amravati District, Maharashtra, AAP, 2012-13
70 CGWB, CR, Nagpur
Sl No
Name of project Scheme Taluka Total irrigation capacity Area under crop (Ha)
Gross storage (MCM)
Live Storage (MCM)
Total useable water (in MCM)
Irrigation capacity
For irrigation
For drinking
1 2 3 4 5 6 7 8 9 10
2 Padhri MI tank Warud 153 0.94 0.86 0.86 --
3 Chinch gavhan MI tank Warud 200 0.67 0.64 0.64 --
4 Belsavangi MI tank Warud 160 0.48 0.48 0.48 --
5 Belsavangi MI tank Warud 119 0.784 0.77 0.77 --
6 Nagthana MI tank Warud 212 2.55 1.67 1.67 --
7 Jamalpu MI tank Warud 122 1.012 0.94 0.94 --
1087 7.106 5.92 5.92 0
1 Savgi MI tank Warud 89 0.521 0.521 0.521 --
0 to 100 ha
2 Waghoda MI tank Warud 42 0.1 -- 0.21 --
3 Lakhra MI tank Warud 21 0.13 -- 0.1 --
4 Wai-2 MI tank Warud 81 0.43 -- 0.4 --
5 Linga MI tank Warud 94 0.47 -- 0.47 --
6 Shendurjanaghat MI tank Warud 50 0.25 -- 0.25 --
377 1.901 0.521 1.951 0
1 Morchud K T Weir Warud 70 0.3 -- 0.3 --
0 to 100 ha
2 Wav ruli K T Weir Warud 39 0.18 -- 0.18 --
3 Loni-1 K T Weir Warud 30 0.14 -- 0.14 --
4 Surali K T Weir Warud 65 0.29 -- 0.29 --
5 Jarud K T Weir Warud 80 0.41 -- 0.41 --
6 Pusla K T Weir Warud 50 0.2 -- 0.22 --
7 Chandas Wathoda-1
K T Weir Warud 57 0.25 -- 0.21 --
8 Loni-2 K T Weir Warud 58 0.24 -- 0.24 --
9 Ismailpur K T Weir Warud 34 0.13 -- 0.13 --
10 Malkhed K T Weir Warud 25 0.09 -- 0.09 --
11 Dhanodi K T Weir Warud 61 0.27 -- 0.27 --
12 Pusla-1 K T Weir Warud 28 0.12 -- 0.12 --
13 Kurali K T Weir Warud 30 0.13 -- 0.13 --
14 Beskheda K T Weir Warud 17 0.08 -- 0.08 --
15 Benoda K T Weir Warud 16 0.06 -- 0.06 --
16 Ittamgaon K T Weir Warud 43 0.17 -- 0.17 --
17 Bahada K T Weir Warud 16 0.06 -- 0.06 --
18 Belora K T Weir Warud 42 0.16 -- 0.16 --
19 Jarud K T Weir Warud 87 0.4 -- 0.16 --
20 Savanga K T Weir Warud 17 0.08 -- 0.08 --
21 Shendurjanaghat K T Weir Warud 32 0.08 -- 0.1 --
22 Dhaga K T Weir Warud 10 0.05 -- 0.05 --
23 Pusla-4 K T Weir Warud 24 0.06 -- 0.06 --
24 Musalgaon K T Weir Warud 37 0.16 -- 0.16 --
25 Loni K T Weir Warud 21 -- -- -- --
26 Benoda K T Weir Warud 14 0.05 -- 0.05 --
27 Amdapur K T Weir Warud 14 0.04 -- 0.04 --
28 Pusla K T Weir Warud 11 0.09 -- -- --
29 Chandas p -2 K T Weir Warud 40 0.09 -- -- --
30 Belsavangi K T Weir Warud 16 -- -- -- --
1084 4.38 0 3.96 0
1 Sinbhora LIS Warud 38 -- -- 0.17
1 Satnut-1 Diversion
dam Warud
84 -- -- -- -- 0 to 100 ha
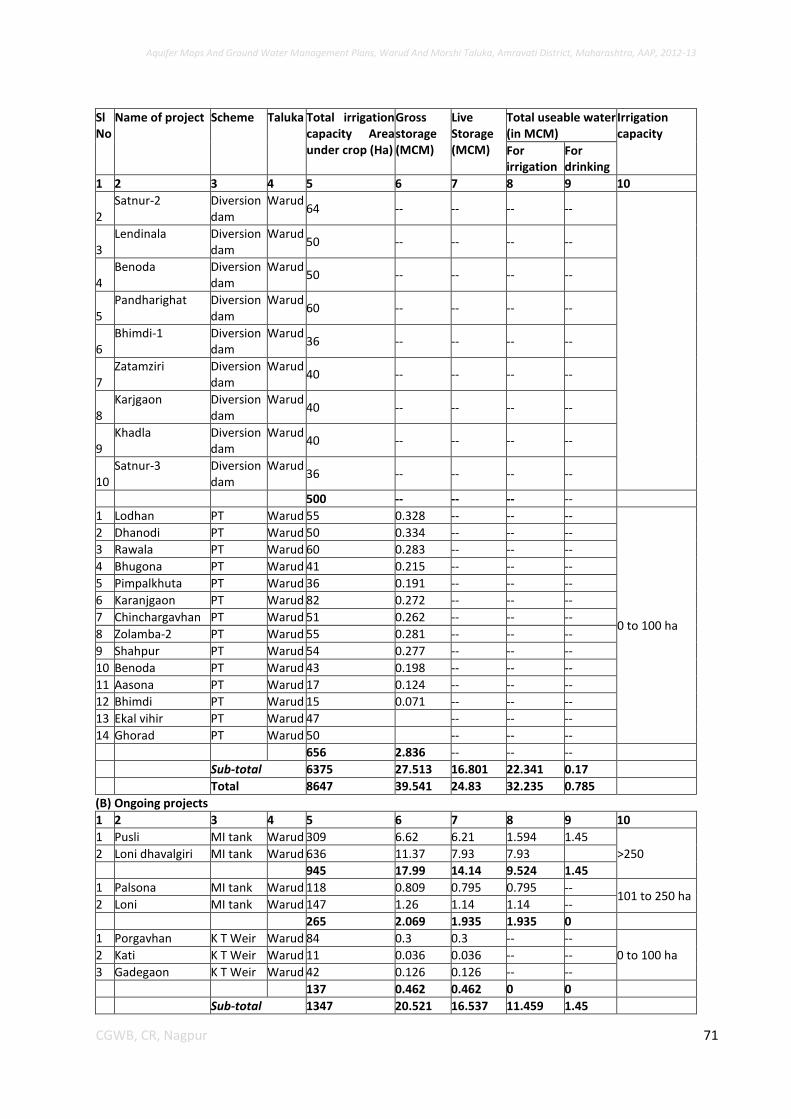
Aquifer Maps And Ground Water Management Plans, Warud And Morshi Taluka, Amravati District, Maharashtra, AAP, 2012-13
71 CGWB, CR, Nagpur
Sl No
Name of project Scheme Taluka Total irrigation capacity Area under crop (Ha)
Gross storage (MCM)
Live Storage (MCM)
Total useable water (in MCM)
Irrigation capacity
For irrigation
For drinking
1 2 3 4 5 6 7 8 9 10
2 Satnur-2 Diversion
dam Warud
64 -- -- -- --
3 Lendinala Diversion
dam Warud
50 -- -- -- --
4 Benoda Diversion
dam Warud
50 -- -- -- --
5 Pandharighat Diversion
dam Warud
60 -- -- -- --
6 Bhimdi-1 Diversion
dam Warud
36 -- -- -- --
7 Zatamziri Diversion
dam Warud
40 -- -- -- --
8 Karjgaon Diversion
dam Warud
40 -- -- -- --
9 Khadla Diversion
dam Warud
40 -- -- -- --
10 Satnur-3 Diversion
dam Warud
36 -- -- -- --
500 -- -- -- --
1 Lodhan PT Warud 55 0.328 -- -- --
0 to 100 ha
2 Dhanodi PT Warud 50 0.334 -- -- --
3 Rawala PT Warud 60 0.283 -- -- --
4 Bhugona PT Warud 41 0.215 -- -- --
5 Pimpalkhuta PT Warud 36 0.191 -- -- --
6 Karanjgaon PT Warud 82 0.272 -- -- --
7 Chinchargavhan PT Warud 51 0.262 -- -- --
8 Zolamba-2 PT Warud 55 0.281 -- -- --
9 Shahpur PT Warud 54 0.277 -- -- --
10 Benoda PT Warud 43 0.198 -- -- --
11 Aasona PT Warud 17 0.124 -- -- --
12 Bhimdi PT Warud 15 0.071 -- -- --
13 Ekal vihir PT Warud 47 -- -- --
14 Ghorad PT Warud 50 -- -- --
656 2.836 -- -- --
Sub-total 6375 27.513 16.801 22.341 0.17
Total 8647 39.541 24.83 32.235 0.785
(B) Ongoing projects
1 2 3 4 5 6 7 8 9 10
1 Pusli MI tank Warud 309 6.62 6.21 1.594 1.45
>250 2 Loni dhavalgiri MI tank Warud 636 11.37 7.93 7.93
945 17.99 14.14 9.524 1.45
1 Palsona MI tank Warud 118 0.809 0.795 0.795 -- 101 to 250 ha
2 Loni MI tank Warud 147 1.26 1.14 1.14 --
265 2.069 1.935 1.935 0
1 Porgavhan K T Weir Warud 84 0.3 0.3 -- --
0 to 100 ha 2 Kati K T Weir Warud 11 0.036 0.036 -- --
3 Gadegaon K T Weir Warud 42 0.126 0.126 -- --
137 0.462 0.462 0 0
Sub-total 1347 20.521 16.537 11.459 1.45
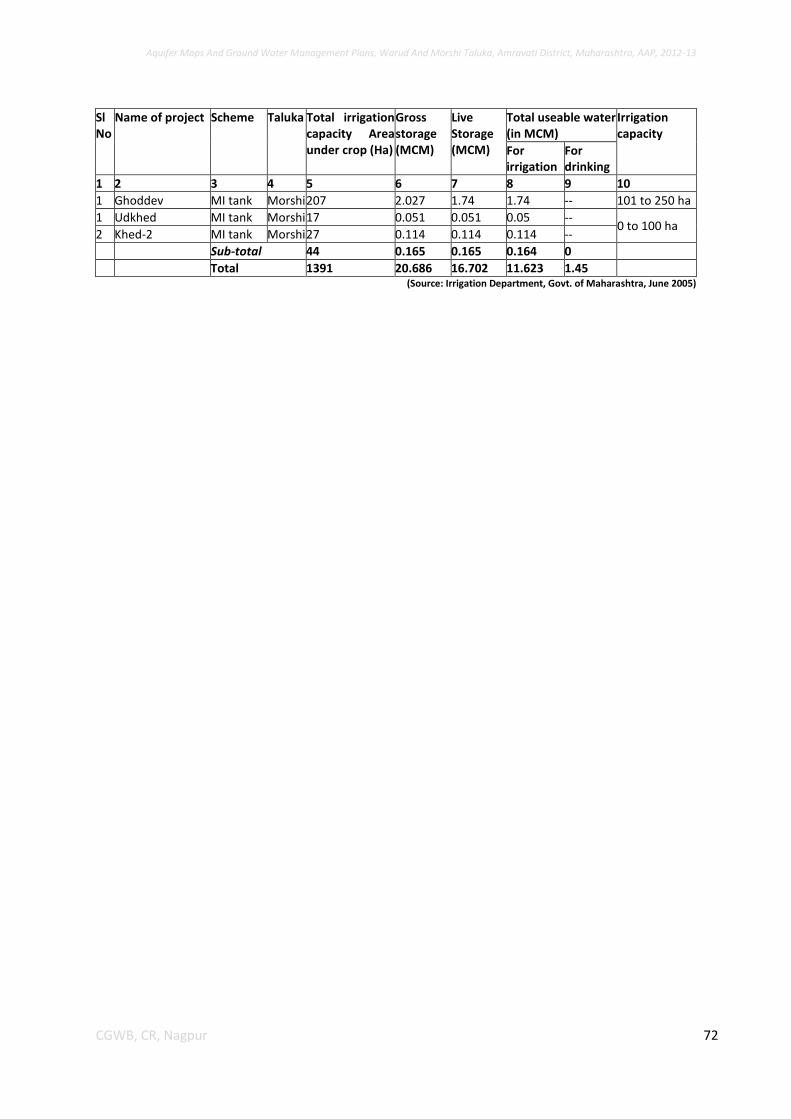
Aquifer Maps And Ground Water Management Plans, Warud And Morshi Taluka, Amravati District, Maharashtra, AAP, 2012-13
72 CGWB, CR, Nagpur
Sl No
Name of project Scheme Taluka Total irrigation capacity Area under crop (Ha)
Gross storage (MCM)
Live Storage (MCM)
Total useable water (in MCM)
Irrigation capacity
For irrigation
For drinking
1 2 3 4 5 6 7 8 9 10
1 Ghoddev MI tank Morshi 207 2.027 1.74 1.74 -- 101 to 250 ha
1 Udkhed MI tank Morshi 17 0.051 0.051 0.05 -- 0 to 100 ha
2 Khed-2 MI tank Morshi 27 0.114 0.114 0.114 --
Sub-total 44 0.165 0.165 0.164 0
Total 1391 20.686 16.702 11.623 1.45 (Source: Irrigation Department, Govt. of Maharashtra, June 2005)
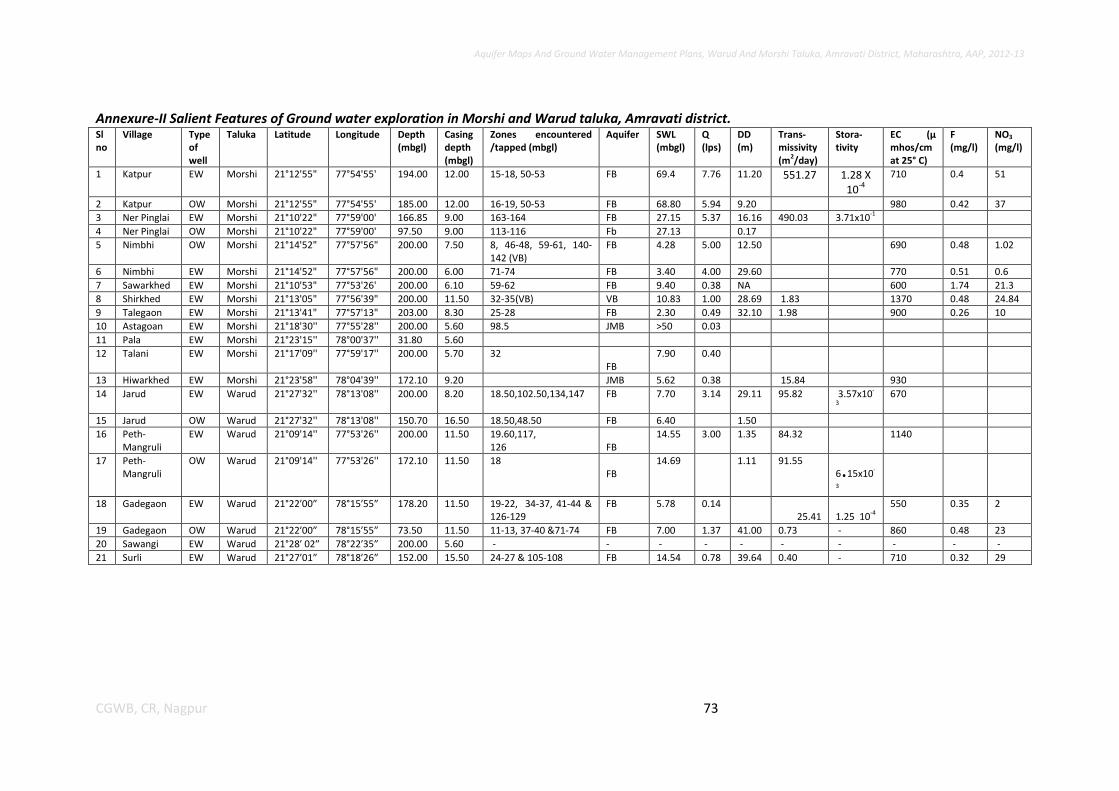
Aquifer Maps And Ground Water Management Plans, Warud And Morshi Taluka, Amravati District, Maharashtra, AAP, 2012-13
73 CGWB, CR, Nagpur
Annexure-II Salient Features of Ground water exploration in Morshi and Warud taluka, Amravati district. Sl no
Village Type of well
Taluka Latitude Longitude Depth (mbgl)
Casing depth (mbgl)
Zones encountered /tapped (mbgl)
Aquifer SWL (mbgl)
Q (lps)
DD (m)
Trans-missivity (m2/day)
Stora-tivity
EC (µ mhos/cm at 25° C)
F (mg/l)
NO3 (mg/l)
1 Katpur EW Morshi 21°12'55" 77°54'55' 194.00 12.00 15-18, 50-53 FB 69.4 7.76 11.20 551.27 1.28 X 10
-4
710 0.4 51
2 Katpur OW Morshi 21°12'55" 77°54'55' 185.00 12.00 16-19, 50-53 FB 68.80 5.94 9.20 980 0.42 37
3 Ner Pinglai EW Morshi 21°10'22" 77°59'00' 166.85 9.00 163-164 FB 27.15 5.37 16.16 490.03 3.71x10⁻¹
4 Ner Pinglai OW Morshi 21°10'22" 77°59'00' 97.50 9.00 113-116 Fb 27.13 0.17
5 Nimbhi OW Morshi 21°14'52" 77°57'56" 200.00 7.50 8, 46-48, 59-61, 140-142 (VB)
FB 4.28 5.00 12.50 690 0.48 1.02
6 Nimbhi EW Morshi 21°14'52" 77°57'56" 200.00 6.00 71-74 FB 3.40 4.00 29.60 770 0.51 0.6
7 Sawarkhed EW Morshi 21°10'53" 77°53'26' 200.00 6.10 59-62 FB 9.40 0.38 NA 600 1.74 21.3
8 Shirkhed EW Morshi 21°13'05" 77°56'39" 200.00 11.50 32-35(VB) VB 10.83 1.00 28.69 1.83 1370 0.48 24.84
9 Talegaon EW Morshi 21°13'41" 77°57'13" 203.00 8.30 25-28 FB 2.30 0.49 32.10 1.98 900 0.26 10
10 Astagoan EW Morshi 21°18'30'' 77°55'28'' 200.00 5.60 98.5 JMB >50 0.03
11 Pala EW Morshi 21°23'15'' 78°00'37'' 31.80 5.60
12 Talani EW Morshi 21°17'09'' 77°59'17'' 200.00 5.70 32 FB
7.90 0.40
13 Hiwarkhed EW Morshi 21°23'58'' 78°04'39'' 172.10 9.20 JMB 5.62 0.38 15.84 930
14 Jarud EW Warud 21°27'32'' 78°13'08'' 200.00 8.20 18.50,102.50,134,147 FB 7.70 3.14 29.11 95.82 3.57x10-
3 670
15 Jarud OW Warud 21°27'32'' 78°13'08'' 150.70 16.50 18.50,48.50 FB 6.40 1.50
16 Peth- Mangruli
EW Warud 21°09'14'' 77°53'26'' 200.00 11.50 19.60,117, 126
FB
14.55 3.00 1.35 84.32 1140
17 Peth- Mangruli
OW Warud 21°09'14'' 77°53'26'' 172.10 11.50 18 FB
14.69 1.11 91.55 6.15x10-
3
18 Gadegaon EW Warud 21°22′00″ 78°15′55″ 178.20 11.50 19-22, 34-37, 41-44 & 126-129
FB 5.78 0.14 25.41 1.25 10-4
550 0.35 2
19 Gadegaon OW Warud 21°22′00″ 78°15′55″ 73.50 11.50 11-13, 37-40 &71-74 FB 7.00 1.37 41.00 0.73 - 860 0.48 23
20 Sawangi EW Warud 21°28′ 02″ 78°22′35″ 200.00 5.60 - - - - - - - - - -
21 Surli EW Warud 21°27′01″ 78°18′26″ 152.00 15.50 24-27 & 105-108 FB 14.54 0.78 39.64 0.40 - 710 0.32 29
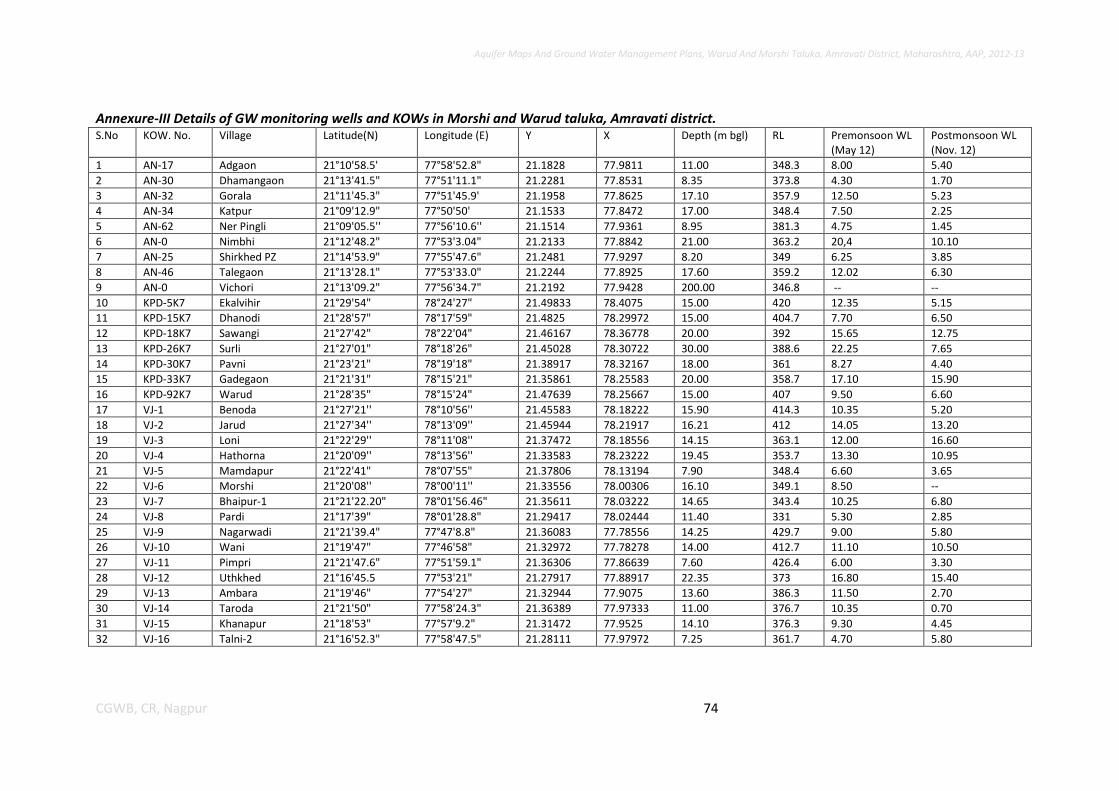
Aquifer Maps And Ground Water Management Plans, Warud And Morshi Taluka, Amravati District, Maharashtra, AAP, 2012-13
74 CGWB, CR, Nagpur
Annexure-III Details of GW monitoring wells and KOWs in Morshi and Warud taluka, Amravati district. S.No KOW. No. Village Latitude(N) Longitude (E) Y X Depth (m bgl) RL Premonsoon WL
(May 12) Postmonsoon WL (Nov. 12)
1 AN-17 Adgaon 21°10'58.5' 77°58'52.8" 21.1828 77.9811 11.00 348.3 8.00 5.40
2 AN-30 Dhamangaon 21°13'41.5" 77°51'11.1" 21.2281 77.8531 8.35 373.8 4.30 1.70
3 AN-32 Gorala 21°11'45.3" 77°51'45.9' 21.1958 77.8625 17.10 357.9 12.50 5.23
4 AN-34 Katpur 21°09'12.9" 77°50'50' 21.1533 77.8472 17.00 348.4 7.50 2.25
5 AN-62 Ner Pingli 21°09'05.5'' 77°56'10.6'' 21.1514 77.9361 8.95 381.3 4.75 1.45
6 AN-0 Nimbhi 21°12'48.2" 77°53'3.04" 21.2133 77.8842 21.00 363.2 20,4 10.10
7 AN-25 Shirkhed PZ 21°14'53.9" 77°55'47.6" 21.2481 77.9297 8.20 349 6.25 3.85
8 AN-46 Talegaon 21°13'28.1" 77°53'33.0" 21.2244 77.8925 17.60 359.2 12.02 6.30
9 AN-0 Vichori 21°13'09.2" 77°56'34.7" 21.2192 77.9428 200.00 346.8 -- --
10 KPD-5K7 Ekalvihir 21°29'54" 78°24'27" 21.49833 78.4075 15.00 420 12.35 5.15
11 KPD-15K7 Dhanodi 21°28'57" 78°17'59" 21.4825 78.29972 15.00 404.7 7.70 6.50
12 KPD-18K7 Sawangi 21°27'42" 78°22'04" 21.46167 78.36778 20.00 392 15.65 12.75
13 KPD-26K7 Surli 21°27'01" 78°18'26" 21.45028 78.30722 30.00 388.6 22.25 7.65
14 KPD-30K7 Pavni 21°23'21" 78°19'18" 21.38917 78.32167 18.00 361 8.27 4.40
15 KPD-33K7 Gadegaon 21°21'31" 78°15'21" 21.35861 78.25583 20.00 358.7 17.10 15.90
16 KPD-92K7 Warud 21°28'35" 78°15'24" 21.47639 78.25667 15.00 407 9.50 6.60
17 VJ-1 Benoda 21°27'21'' 78°10'56'' 21.45583 78.18222 15.90 414.3 10.35 5.20
18 VJ-2 Jarud 21°27'34'' 78°13'09'' 21.45944 78.21917 16.21 412 14.05 13.20
19 VJ-3 Loni 21°22'29'' 78°11'08'' 21.37472 78.18556 14.15 363.1 12.00 16.60
20 VJ-4 Hathorna 21°20'09'' 78°13'56'' 21.33583 78.23222 19.45 353.7 13.30 10.95
21 VJ-5 Mamdapur 21°22'41" 78°07'55" 21.37806 78.13194 7.90 348.4 6.60 3.65
22 VJ-6 Morshi 21°20'08'' 78°00'11'' 21.33556 78.00306 16.10 349.1 8.50 --
23 VJ-7 Bhaipur-1 21°21'22.20" 78°01'56.46" 21.35611 78.03222 14.65 343.4 10.25 6.80
24 VJ-8 Pardi 21°17'39" 78°01'28.8" 21.29417 78.02444 11.40 331 5.30 2.85
25 VJ-9 Nagarwadi 21°21'39.4" 77°47'8.8" 21.36083 77.78556 14.25 429.7 9.00 5.80
26 VJ-10 Wani 21°19'47" 77°46'58" 21.32972 77.78278 14.00 412.7 11.10 10.50
27 VJ-11 Pimpri 21°21'47.6" 77°51'59.1" 21.36306 77.86639 7.60 426.4 6.00 3.30
28 VJ-12 Uthkhed 21°16'45.5 77°53'21" 21.27917 77.88917 22.35 373 16.80 15.40
29 VJ-13 Ambara 21°19'46" 77°54'27" 21.32944 77.9075 13.60 386.3 11.50 2.70
30 VJ-14 Taroda 21°21'50" 77°58'24.3" 21.36389 77.97333 11.00 376.7 10.35 0.70
31 VJ-15 Khanapur 21°18'53" 77°57'9.2" 21.31472 77.9525 14.10 376.3 9.30 4.45
32 VJ-16 Talni-2 21°16'52.3" 77°58'47.5" 21.28111 77.97972 7.25 361.7 4.70 5.80

Aquifer Maps And Ground Water Management Plans, Warud And Morshi Taluka, Amravati District, Maharashtra, AAP, 2012-13
75 CGWB, CR, Nagpur
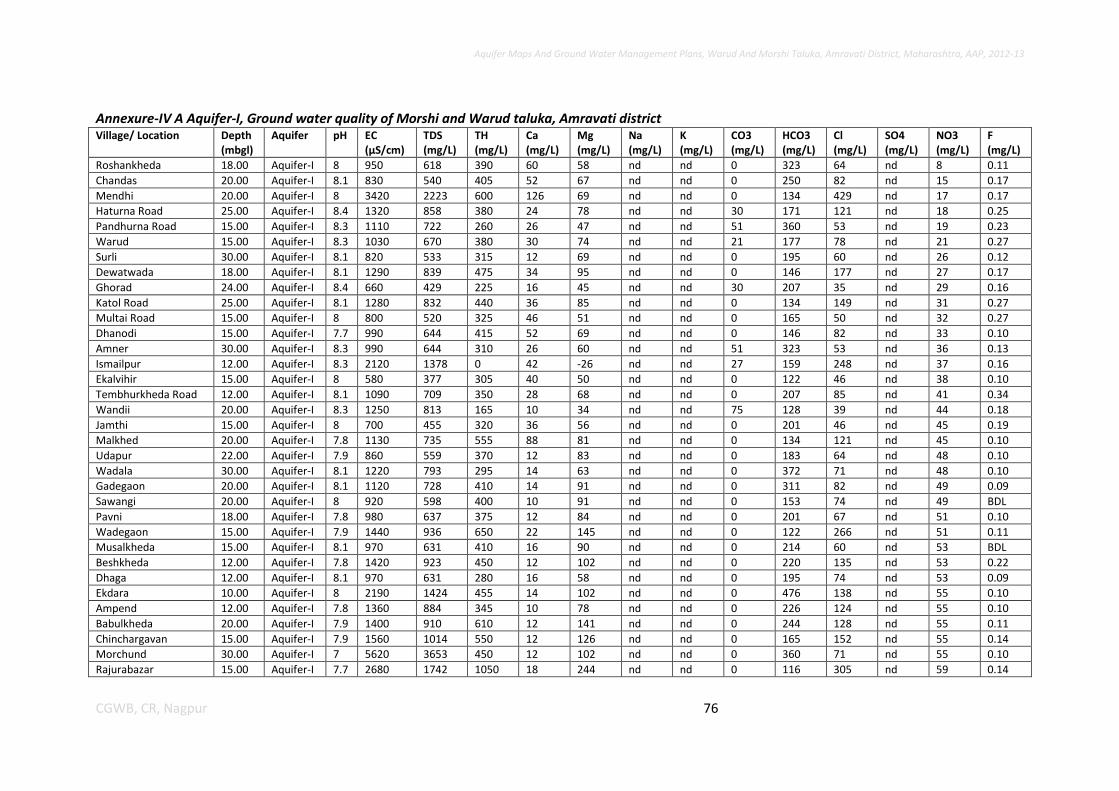
Aquifer Maps And Ground Water Management Plans, Warud And Morshi Taluka, Amravati District, Maharashtra, AAP, 2012-13
76 CGWB, CR, Nagpur
Annexure-IV A Aquifer-I, Ground water quality of Morshi and Warud taluka, Amravati district Village/ Location Depth
(mbgl) Aquifer pH EC
(µS/cm) TDS (mg/L)
TH (mg/L)
Ca (mg/L)
Mg (mg/L)
Na (mg/L)
K (mg/L)
CO3 (mg/L)
HCO3 (mg/L)
Cl (mg/L)
SO4 (mg/L)
NO3 (mg/L)
F (mg/L)
Roshankheda 18.00 Aquifer-I 8 950 618 390 60 58 nd nd 0 323 64 nd 8 0.11
Chandas 20.00 Aquifer-I 8.1 830 540 405 52 67 nd nd 0 250 82 nd 15 0.17
Mendhi 20.00 Aquifer-I 8 3420 2223 600 126 69 nd nd 0 134 429 nd 17 0.17
Haturna Road 25.00 Aquifer-I 8.4 1320 858 380 24 78 nd nd 30 171 121 nd 18 0.25
Pandhurna Road 15.00 Aquifer-I 8.3 1110 722 260 26 47 nd nd 51 360 53 nd 19 0.23
Warud 15.00 Aquifer-I 8.3 1030 670 380 30 74 nd nd 21 177 78 nd 21 0.27
Surli 30.00 Aquifer-I 8.1 820 533 315 12 69 nd nd 0 195 60 nd 26 0.12
Dewatwada 18.00 Aquifer-I 8.1 1290 839 475 34 95 nd nd 0 146 177 nd 27 0.17
Ghorad 24.00 Aquifer-I 8.4 660 429 225 16 45 nd nd 30 207 35 nd 29 0.16
Katol Road 25.00 Aquifer-I 8.1 1280 832 440 36 85 nd nd 0 134 149 nd 31 0.27
Multai Road 15.00 Aquifer-I 8 800 520 325 46 51 nd nd 0 165 50 nd 32 0.27
Dhanodi 15.00 Aquifer-I 7.7 990 644 415 52 69 nd nd 0 146 82 nd 33 0.10
Amner 30.00 Aquifer-I 8.3 990 644 310 26 60 nd nd 51 323 53 nd 36 0.13
Ismailpur 12.00 Aquifer-I 8.3 2120 1378 0 42 -26 nd nd 27 159 248 nd 37 0.16
Ekalvihir 15.00 Aquifer-I 8 580 377 305 40 50 nd nd 0 122 46 nd 38 0.10
Tembhurkheda Road 12.00 Aquifer-I 8.1 1090 709 350 28 68 nd nd 0 207 85 nd 41 0.34
Wandii 20.00 Aquifer-I 8.3 1250 813 165 10 34 nd nd 75 128 39 nd 44 0.18
Jamthi 15.00 Aquifer-I 8 700 455 320 36 56 nd nd 0 201 46 nd 45 0.19
Malkhed 20.00 Aquifer-I 7.8 1130 735 555 88 81 nd nd 0 134 121 nd 45 0.10
Udapur 22.00 Aquifer-I 7.9 860 559 370 12 83 nd nd 0 183 64 nd 48 0.10
Wadala 30.00 Aquifer-I 8.1 1220 793 295 14 63 nd nd 0 372 71 nd 48 0.10
Gadegaon 20.00 Aquifer-I 8.1 1120 728 410 14 91 nd nd 0 311 82 nd 49 0.09
Sawangi 20.00 Aquifer-I 8 920 598 400 10 91 nd nd 0 153 74 nd 49 BDL
Pavni 18.00 Aquifer-I 7.8 980 637 375 12 84 nd nd 0 201 67 nd 51 0.10
Wadegaon 15.00 Aquifer-I 7.9 1440 936 650 22 145 nd nd 0 122 266 nd 51 0.11
Musalkheda 15.00 Aquifer-I 8.1 970 631 410 16 90 nd nd 0 214 60 nd 53 BDL
Beshkheda 12.00 Aquifer-I 7.8 1420 923 450 12 102 nd nd 0 220 135 nd 53 0.22
Dhaga 12.00 Aquifer-I 8.1 970 631 280 16 58 nd nd 0 195 74 nd 53 0.09
Ekdara 10.00 Aquifer-I 8 2190 1424 455 14 102 nd nd 0 476 138 nd 55 0.10
Ampend 12.00 Aquifer-I 7.8 1360 884 345 10 78 nd nd 0 226 124 nd 55 0.10
Babulkheda 20.00 Aquifer-I 7.9 1400 910 610 12 141 nd nd 0 244 128 nd 55 0.11
Chinchargavan 15.00 Aquifer-I 7.9 1560 1014 550 12 126 nd nd 0 165 152 nd 55 0.14
Morchund 30.00 Aquifer-I 7 5620 3653 450 12 102 nd nd 0 360 71 nd 55 0.10
Rajurabazar 15.00 Aquifer-I 7.7 2680 1742 1050 18 244 nd nd 0 116 305 nd 59 0.14

Aquifer Maps And Ground Water Management Plans, Warud And Morshi Taluka, Amravati District, Maharashtra, AAP, 2012-13
77 CGWB, CR, Nagpur
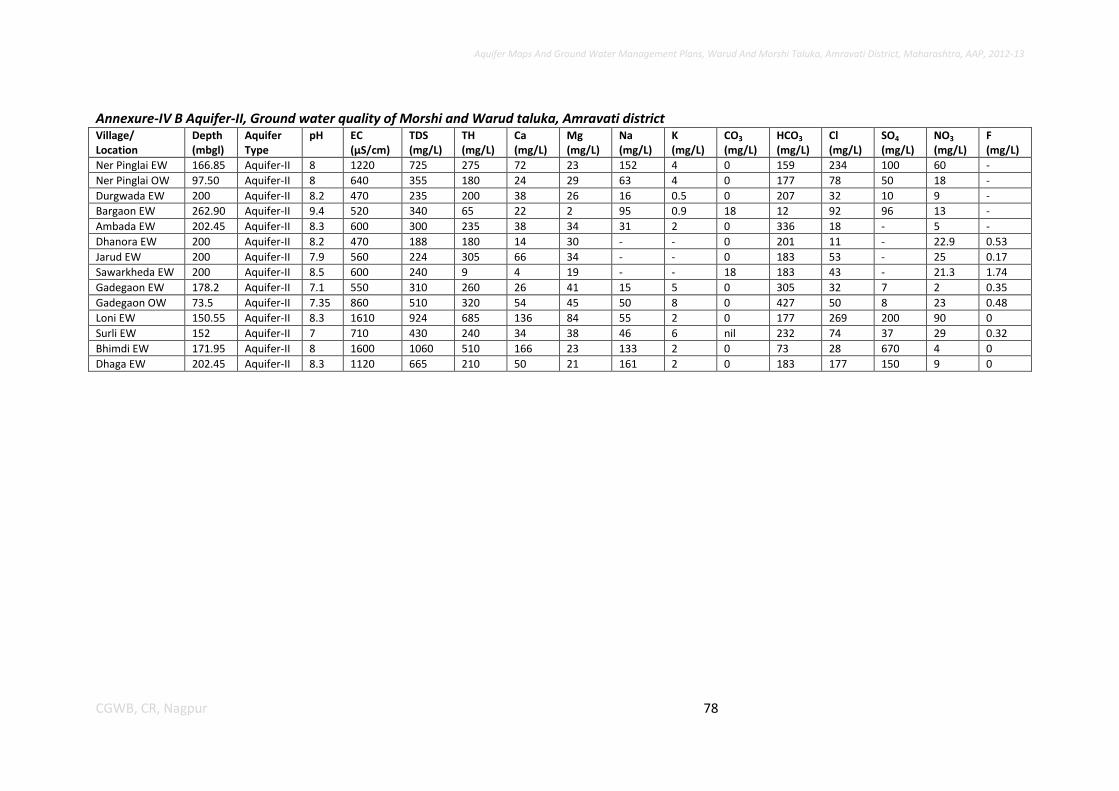
Aquifer Maps And Ground Water Management Plans, Warud And Morshi Taluka, Amravati District, Maharashtra, AAP, 2012-13
78 CGWB, CR, Nagpur
Annexure-IV B Aquifer-II, Ground water quality of Morshi and Warud taluka, Amravati district Village/ Location
Depth (mbgl)
Aquifer Type
pH EC (µS/cm)
TDS (mg/L)
TH (mg/L)
Ca (mg/L)
Mg (mg/L)
Na (mg/L)
K (mg/L)
CO3
(mg/L) HCO3
(mg/L) Cl (mg/L)
SO4
(mg/L) NO3
(mg/L) F (mg/L)
Ner Pinglai EW 166.85 Aquifer-II 8 1220 725 275 72 23 152 4 0 159 234 100 60 -
Ner Pinglai OW 97.50 Aquifer-II 8 640 355 180 24 29 63 4 0 177 78 50 18 -
Durgwada EW 200 Aquifer-II 8.2 470 235 200 38 26 16 0.5 0 207 32 10 9 -
Bargaon EW 262.90 Aquifer-II 9.4 520 340 65 22 2 95 0.9 18 12 92 96 13 -
Ambada EW 202.45 Aquifer-II 8.3 600 300 235 38 34 31 2 0 336 18 - 5 -
Dhanora EW 200 Aquifer-II 8.2 470 188 180 14 30 - - 0 201 11 - 22.9 0.53
Jarud EW 200 Aquifer-II 7.9 560 224 305 66 34 - - 0 183 53 - 25 0.17
Sawarkheda EW 200 Aquifer-II 8.5 600 240 9 4 19 - - 18 183 43 - 21.3 1.74
Gadegaon EW 178.2 Aquifer-II 7.1 550 310 260 26 41 15 5 0 305 32 7 2 0.35
Gadegaon OW 73.5 Aquifer-II 7.35 860 510 320 54 45 50 8 0 427 50 8 23 0.48
Loni EW 150.55 Aquifer-II 8.3 1610 924 685 136 84 55 2 0 177 269 200 90 0
Surli EW 152 Aquifer-II 7 710 430 240 34 38 46 6 nil 232 74 37 29 0.32
Bhimdi EW 171.95 Aquifer-II 8 1600 1060 510 166 23 133 2 0 73 28 670 4 0
Dhaga EW 202.45 Aquifer-II 8.3 1120 665 210 50 21 161 2 0 183 177 150 9 0
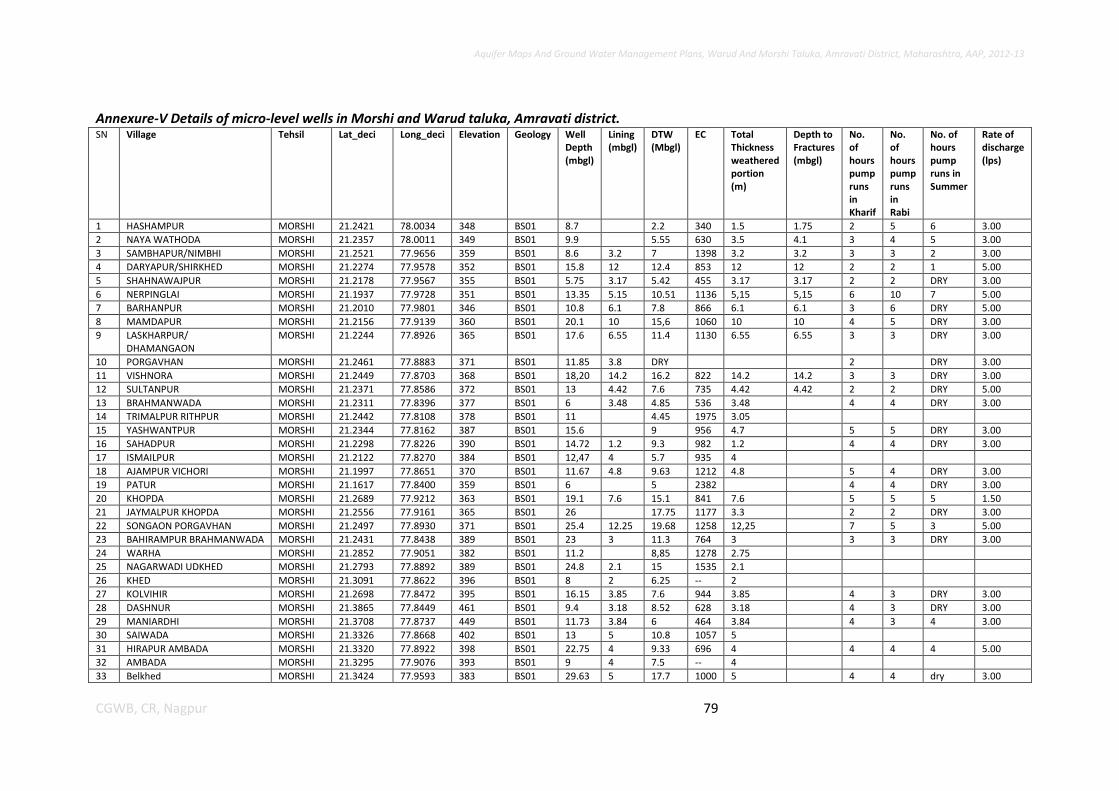
Aquifer Maps And Ground Water Management Plans, Warud And Morshi Taluka, Amravati District, Maharashtra, AAP, 2012-13
79 CGWB, CR, Nagpur
Annexure-V Details of micro-level wells in Morshi and Warud taluka, Amravati district. SN Village Tehsil Lat_deci Long_deci Elevation Geology Well
Depth (mbgl)
Lining (mbgl)
DTW (Mbgl)
EC Total Thickness weathered portion (m)
Depth to Fractures (mbgl)
No. of hours pump runs in Kharif
No. of hours pump runs in Rabi
No. of hours pump runs in Summer
Rate of discharge (lps)
1 HASHAMPUR MORSHI 21.2421 78.0034 348 BS01 8.7 2.2 340 1.5 1.75 2 5 6 3.00
2 NAYA WATHODA MORSHI 21.2357 78.0011 349 BS01 9.9 5.55 630 3.5 4.1 3 4 5 3.00
3 SAMBHAPUR/NIMBHI MORSHI 21.2521 77.9656 359 BS01 8.6 3.2 7 1398 3.2 3.2 3 3 2 3.00
4 DARYAPUR/SHIRKHED MORSHI 21.2274 77.9578 352 BS01 15.8 12 12.4 853 12 12 2 2 1 5.00
5 SHAHNAWAJPUR MORSHI 21.2178 77.9567 355 BS01 5.75 3.17 5.42 455 3.17 3.17 2 2 DRY 3.00
6 NERPINGLAI MORSHI 21.1937 77.9728 351 BS01 13.35 5.15 10.51 1136 5,15 5,15 6 10 7 5.00
7 BARHANPUR MORSHI 21.2010 77.9801 346 BS01 10.8 6.1 7.8 866 6.1 6.1 3 6 DRY 5.00
8 MAMDAPUR MORSHI 21.2156 77.9139 360 BS01 20.1 10 15,6 1060 10 10 4 5 DRY 3.00
9 LASKHARPUR/ DHAMANGAON
MORSHI 21.2244 77.8926 365 BS01 17.6 6.55 11.4 1130 6.55 6.55 3 3 DRY 3.00
10 PORGAVHAN MORSHI 21.2461 77.8883 371 BS01 11.85 3.8 DRY 2 DRY 3.00
11 VISHNORA MORSHI 21.2449 77.8703 368 BS01 18,20 14.2 16.2 822 14.2 14.2 3 3 DRY 3.00
12 SULTANPUR MORSHI 21.2371 77.8586 372 BS01 13 4.42 7.6 735 4.42 4.42 2 2 DRY 5.00
13 BRAHMANWADA MORSHI 21.2311 77.8396 377 BS01 6 3.48 4.85 536 3.48 4 4 DRY 3.00
14 TRIMALPUR RITHPUR MORSHI 21.2442 77.8108 378 BS01 11 4.45 1975 3.05
15 YASHWANTPUR MORSHI 21.2344 77.8162 387 BS01 15.6 9 956 4.7 5 5 DRY 3.00
16 SAHADPUR MORSHI 21.2298 77.8226 390 BS01 14.72 1.2 9.3 982 1.2 4 4 DRY 3.00
17 ISMAILPUR MORSHI 21.2122 77.8270 384 BS01 12,47 4 5.7 935 4
18 AJAMPUR VICHORI MORSHI 21.1997 77.8651 370 BS01 11.67 4.8 9.63 1212 4.8 5 4 DRY 3.00
19 PATUR MORSHI 21.1617 77.8400 359 BS01 6 5 2382 4 4 DRY 3.00
20 KHOPDA MORSHI 21.2689 77.9212 363 BS01 19.1 7.6 15.1 841 7.6 5 5 5 1.50
21 JAYMALPUR KHOPDA MORSHI 21.2556 77.9161 365 BS01 26 17.75 1177 3.3 2 2 DRY 3.00
22 SONGAON PORGAVHAN MORSHI 21.2497 77.8930 371 BS01 25.4 12.25 19.68 1258 12,25 7 5 3 5.00
23 BAHIRAMPUR BRAHMANWADA MORSHI 21.2431 77.8438 389 BS01 23 3 11.3 764 3 3 3 DRY 3.00
24 WARHA MORSHI 21.2852 77.9051 382 BS01 11.2 8,85 1278 2.75
25 NAGARWADI UDKHED MORSHI 21.2793 77.8892 389 BS01 24.8 2.1 15 1535 2.1
26 KHED MORSHI 21.3091 77.8622 396 BS01 8 2 6.25 -- 2
27 KOLVIHIR MORSHI 21.2698 77.8472 395 BS01 16.15 3.85 7.6 944 3.85 4 3 DRY 3.00
28 DASHNUR MORSHI 21.3865 77.8449 461 BS01 9.4 3.18 8.52 628 3.18 4 3 DRY 3.00
29 MANIARDHI MORSHI 21.3708 77.8737 449 BS01 11.73 3.84 6 464 3.84 4 3 4 3.00
30 SAIWADA MORSHI 21.3326 77.8668 402 BS01 13 5 10.8 1057 5
31 HIRAPUR AMBADA MORSHI 21.3320 77.8922 398 BS01 22.75 4 9.33 696 4 4 4 4 5.00
32 AMBADA MORSHI 21.3295 77.9076 393 BS01 9 4 7.5 -- 4
33 Belkhed MORSHI 21.3424 77.9593 383 BS01 29.63 5 17.7 1000 5 4 4 dry 3.00
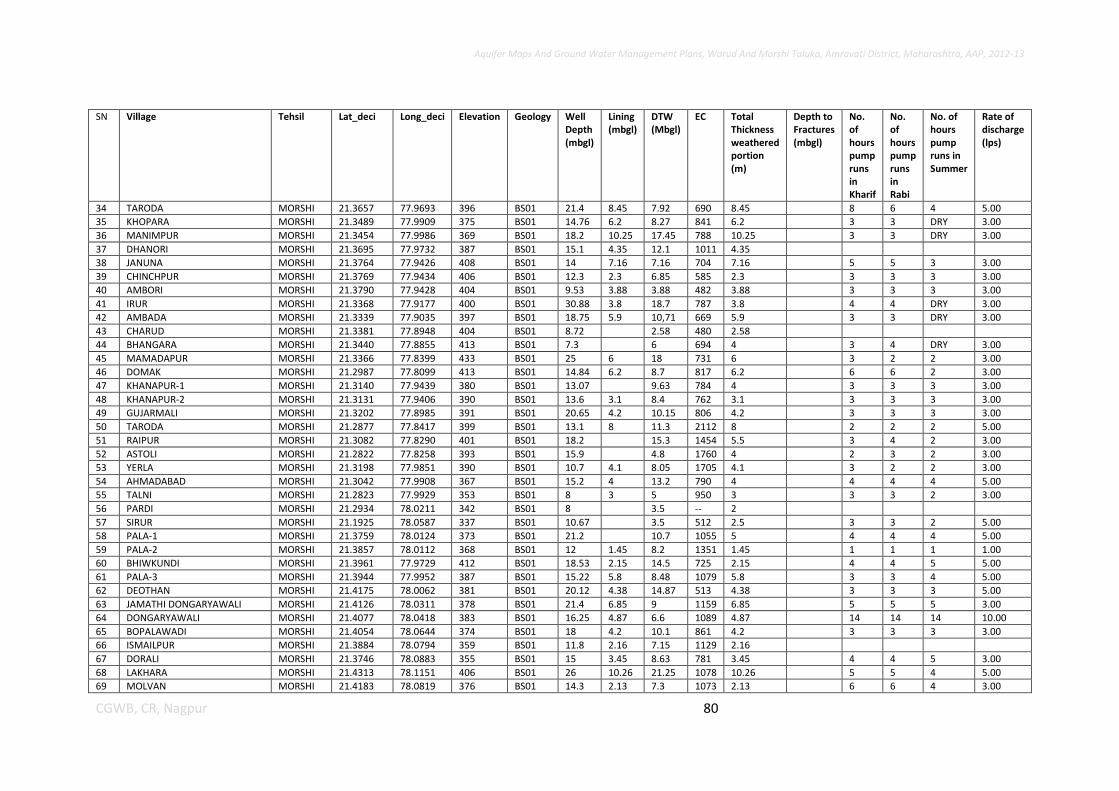
Aquifer Maps And Ground Water Management Plans, Warud And Morshi Taluka, Amravati District, Maharashtra, AAP, 2012-13
80 CGWB, CR, Nagpur
SN Village Tehsil Lat_deci Long_deci Elevation Geology Well Depth (mbgl)
Lining (mbgl)
DTW (Mbgl)
EC Total Thickness weathered portion (m)
Depth to Fractures (mbgl)
No. of hours pump runs in Kharif
No. of hours pump runs in Rabi
No. of hours pump runs in Summer
Rate of discharge (lps)
34 TARODA MORSHI 21.3657 77.9693 396 BS01 21.4 8.45 7.92 690 8.45 8 6 4 5.00
35 KHOPARA MORSHI 21.3489 77.9909 375 BS01 14.76 6.2 8.27 841 6.2 3 3 DRY 3.00
36 MANIMPUR MORSHI 21.3454 77.9986 369 BS01 18.2 10.25 17.45 788 10.25 3 3 DRY 3.00
37 DHANORI MORSHI 21.3695 77.9732 387 BS01 15.1 4.35 12.1 1011 4.35
38 JANUNA MORSHI 21.3764 77.9426 408 BS01 14 7.16 7.16 704 7.16 5 5 3 3.00
39 CHINCHPUR MORSHI 21.3769 77.9434 406 BS01 12.3 2.3 6.85 585 2.3 3 3 3 3.00
40 AMBORI MORSHI 21.3790 77.9428 404 BS01 9.53 3.88 3.88 482 3.88 3 3 3 3.00
41 IRUR MORSHI 21.3368 77.9177 400 BS01 30.88 3.8 18.7 787 3.8 4 4 DRY 3.00
42 AMBADA MORSHI 21.3339 77.9035 397 BS01 18.75 5.9 10,71 669 5.9 3 3 DRY 3.00
43 CHARUD MORSHI 21.3381 77.8948 404 BS01 8.72 2.58 480 2.58
44 BHANGARA MORSHI 21.3440 77.8855 413 BS01 7.3 6 694 4 3 4 DRY 3.00
45 MAMADAPUR MORSHI 21.3366 77.8399 433 BS01 25 6 18 731 6 3 2 2 3.00
46 DOMAK MORSHI 21.2987 77.8099 413 BS01 14.84 6.2 8.7 817 6.2 6 6 2 3.00
47 KHANAPUR-1 MORSHI 21.3140 77.9439 380 BS01 13.07 9.63 784 4 3 3 3 3.00
48 KHANAPUR-2 MORSHI 21.3131 77.9406 390 BS01 13.6 3.1 8.4 762 3.1 3 3 3 3.00
49 GUJARMALI MORSHI 21.3202 77.8985 391 BS01 20.65 4.2 10.15 806 4.2 3 3 3 3.00
50 TARODA MORSHI 21.2877 77.8417 399 BS01 13.1 8 11.3 2112 8 2 2 2 5.00
51 RAIPUR MORSHI 21.3082 77.8290 401 BS01 18.2 15.3 1454 5.5 3 4 2 3.00
52 ASTOLI MORSHI 21.2822 77.8258 393 BS01 15.9 4.8 1760 4 2 3 2 3.00
53 YERLA MORSHI 21.3198 77.9851 390 BS01 10.7 4.1 8.05 1705 4.1 3 2 2 3.00
54 AHMADABAD MORSHI 21.3042 77.9908 367 BS01 15.2 4 13.2 790 4 4 4 4 5.00
55 TALNI MORSHI 21.2823 77.9929 353 BS01 8 3 5 950 3 3 3 2 3.00
56 PARDI MORSHI 21.2934 78.0211 342 BS01 8 3.5 -- 2
57 SIRUR MORSHI 21.1925 78.0587 337 BS01 10.67 3.5 512 2.5 3 3 2 5.00
58 PALA-1 MORSHI 21.3759 78.0124 373 BS01 21.2 10.7 1055 5 4 4 4 5.00
59 PALA-2 MORSHI 21.3857 78.0112 368 BS01 12 1.45 8.2 1351 1.45 1 1 1 1.00
60 BHIWKUNDI MORSHI 21.3961 77.9729 412 BS01 18.53 2.15 14.5 725 2.15 4 4 5 5.00
61 PALA-3 MORSHI 21.3944 77.9952 387 BS01 15.22 5.8 8.48 1079 5.8 3 3 4 5.00
62 DEOTHAN MORSHI 21.4175 78.0062 381 BS01 20.12 4.38 14.87 513 4.38 3 3 3 5.00
63 JAMATHI DONGARYAWALI MORSHI 21.4126 78.0311 378 BS01 21.4 6.85 9 1159 6.85 5 5 5 3.00
64 DONGARYAWALI MORSHI 21.4077 78.0418 383 BS01 16.25 4.87 6.6 1089 4.87 14 14 14 10.00
65 BOPALAWADI MORSHI 21.4054 78.0644 374 BS01 18 4.2 10.1 861 4.2 3 3 3 3.00
66 ISMAILPUR MORSHI 21.3884 78.0794 359 BS01 11.8 2.16 7.15 1129 2.16
67 DORALI MORSHI 21.3746 78.0883 355 BS01 15 3.45 8.63 781 3.45 4 4 5 3.00
68 LAKHARA MORSHI 21.4313 78.1151 406 BS01 26 10.26 21.25 1078 10.26 5 5 4 5.00
69 MOLVAN MORSHI 21.4183 78.0819 376 BS01 14.3 2.13 7.3 1073 2.13 6 6 4 3.00

Aquifer Maps And Ground Water Management Plans, Warud And Morshi Taluka, Amravati District, Maharashtra, AAP, 2012-13
81 CGWB, CR, Nagpur
SN Village Tehsil Lat_deci Long_deci Elevation Geology Well Depth (mbgl)
Lining (mbgl)
DTW (Mbgl)
EC Total Thickness weathered portion (m)
Depth to Fractures (mbgl)
No. of hours pump runs in Kharif
No. of hours pump runs in Rabi
No. of hours pump runs in Summer
Rate of discharge (lps)
70 Sirajgaon MORSHI 21.1347 77.8861 404 BS01 18.2 7.25 15.6 1170 7.25
71 Gorala MORSHI 21.1639 77.9464 423 BS01 8.95 4.1 5.1 450 4.1
72 Ghorgohan MORSHI 21.1828 77.8978 429 BS01 12.3 1.75 7.1 570 1.75
73 Ner Pingli MORSHI 21.1711 77.9692 370 BS01 11 3 9.4 1450 3
74 Rohankhed MORSHI 21.1864 77.8867 396 BS01 10.9 3.8 8.9 850 3.8
75 Akhatwara MORSHI 21.2078 77.9856 361 BS01 15.4 6.7 13.95 1050 6.7
76 Lihidha MORSHI 21.2192 77.9928 336 BS01 11.2 8 9.05 1360 8
77 Shirkhed MORSHI 21.2319 77.9353 356 BS01 6.7 5 5.1 1780 5
78 Lehegaon MORSHI 21.1961 77.9531 365 BS01 9 8 7.7 1960 8
79 Saverkhed MORSHI 21.1753 77.9422 374 BS01 12 3 9.65 970 3
80 Bilapur MORSHI 21.1522 77.9144 389 BS01 9.55 5.35 Dry 1160 5.35
81 NanduraPinglai MORSHI 21.1762 77.9854 379 BS01 7.5 2.3 Dry 590 2.3
82 Kekatpur MORSHI 21.2133 77.9854 374 BS01 12 4.5 9.65 700 4.5
83 Nerpiglai MORSHI 21.1647 77.9964 383 BS01 11 2.35 9.75 570 2.35
84 Nimbhi MORSHI 21.2444 77.9228 365 BS01 8.2 4.1 6.65 630 4.1
85 Wagoli MORSHI 21.2028 77.9197 381 BS01 19.15 4.2 16.85 1150 4.2
86 Inapur MORSHI 21.2428 77.9683 350 BS01 8.2 5.6 5.6 2050 5.6
87 Porgohan MORSHI 21.2442 77.8906 383 BS01 8 5.5 Dry 1280 5.5
88 Khopri (Shirkhed) MORSHI 21.2286 77.9656 354 BS01 19.2 11.2 13.9 930 11.2
89 Dabheri MORSHI 21.2133 77.8175 403 BS01 11.95 3.9 6.75 NA 3.9
90 Katpur MORSHI 21.2017 77.8931 BS01 21 7 20.4 1120 7
91 BrahmanwadaDeve MORSHI 21.2386 77.8481 416 BS01 14.25 1.55 4.5 1680 1.55
92 Dmamangaon MORSHI 21.2208 77.8981 371 BS01 21 8 1280 8
93 Rithpur MORSHI 21.2447 77.8031 411 BS01 14.7 9.4 10.15 1350 9.4
94 Talegaon MORSHI 21.2328 77.8606 387 BS01 9.35 3 4.7 1200 3
95 Barhanpur MORSHI 21.2125 77.8125 388 BS01 13.1 5.95 10.6 1640 5.95
96 Vichori MORSHI 21.1908 77.8514 387 BS01 17.1 3.1 13.1 840 3.1
97 Sirasgaon-II MORSHI 21.1367 77.8972 381 BS01 15.2 9.1 11.49 1600 9.1
98 Adgaon MORSHI 21.1519 77.8403 361 BS01 17 7 7.95 2100 7
99 Katsur MORSHI 21.1597 77.8211 354 BS01 9.8 3.8 4 4200 3.8
100 HIWARKHED MORSHI 21.3886 78.0711 359 BS01 16 5.65 15.75 1110 5.65
101 BELONA MORSHI 21.3969 78.1050 350 BS01 16 5.8 13.7 1440 5.8
102 DAPORI-2 MORSHI 21.3764 78.0622 350 BS01 14 6.5 11.15 1100 6.5
103 DONGAR YAVLI-2 MORSHI 21.4075 78.0794 364 BS01 13 5.25 9.25 790 5.25
104 GODDEV MORSHI 21.4189 78.0364 396 BS01 12 4.3 10.5 1110 4.3
105 MORSHI MORSHI 21.3450 78.0164 360 BS01 16 8.5 8.5 1420 8.5
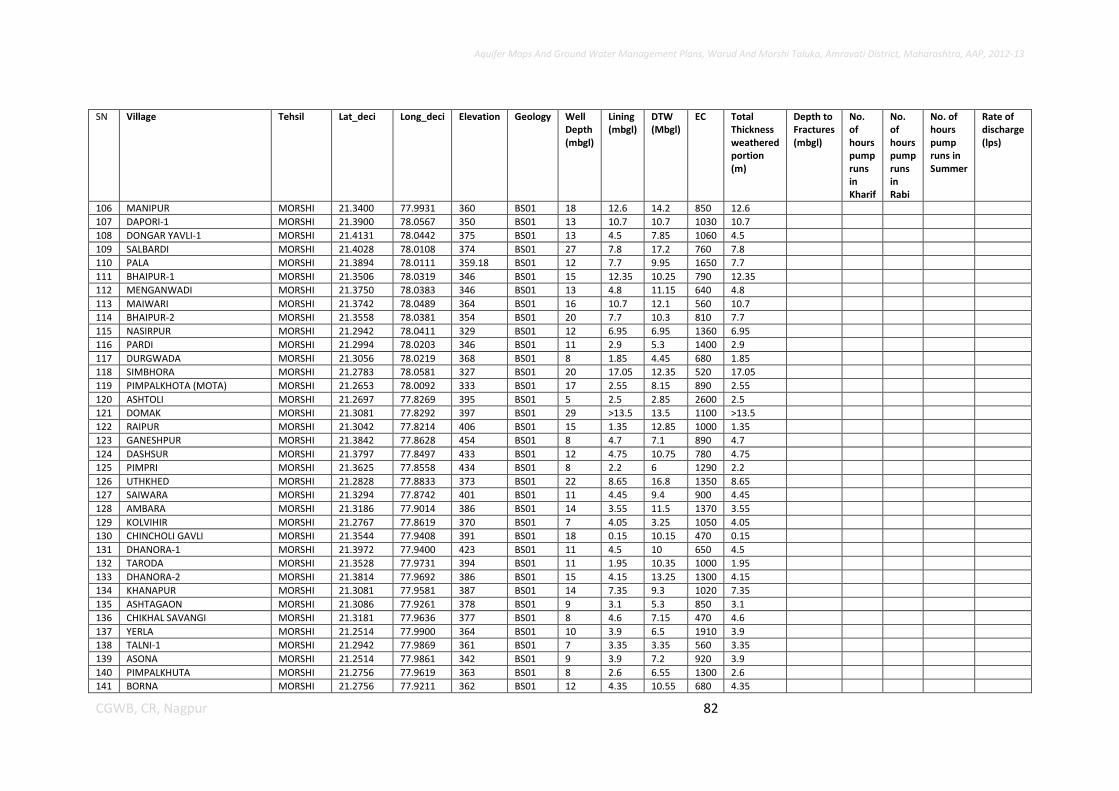
Aquifer Maps And Ground Water Management Plans, Warud And Morshi Taluka, Amravati District, Maharashtra, AAP, 2012-13
82 CGWB, CR, Nagpur
SN Village Tehsil Lat_deci Long_deci Elevation Geology Well Depth (mbgl)
Lining (mbgl)
DTW (Mbgl)
EC Total Thickness weathered portion (m)
Depth to Fractures (mbgl)
No. of hours pump runs in Kharif
No. of hours pump runs in Rabi
No. of hours pump runs in Summer
Rate of discharge (lps)
106 MANIPUR MORSHI 21.3400 77.9931 360 BS01 18 12.6 14.2 850 12.6
107 DAPORI-1 MORSHI 21.3900 78.0567 350 BS01 13 10.7 10.7 1030 10.7
108 DONGAR YAVLI-1 MORSHI 21.4131 78.0442 375 BS01 13 4.5 7.85 1060 4.5
109 SALBARDI MORSHI 21.4028 78.0108 374 BS01 27 7.8 17.2 760 7.8
110 PALA MORSHI 21.3894 78.0111 359.18 BS01 12 7.7 9.95 1650 7.7
111 BHAIPUR-1 MORSHI 21.3506 78.0319 346 BS01 15 12.35 10.25 790 12.35
112 MENGANWADI MORSHI 21.3750 78.0383 346 BS01 13 4.8 11.15 640 4.8
113 MAIWARI MORSHI 21.3742 78.0489 364 BS01 16 10.7 12.1 560 10.7
114 BHAIPUR-2 MORSHI 21.3558 78.0381 354 BS01 20 7.7 10.3 810 7.7
115 NASIRPUR MORSHI 21.2942 78.0411 329 BS01 12 6.95 6.95 1360 6.95
116 PARDI MORSHI 21.2994 78.0203 346 BS01 11 2.9 5.3 1400 2.9
117 DURGWADA MORSHI 21.3056 78.0219 368 BS01 8 1.85 4.45 680 1.85
118 SIMBHORA MORSHI 21.2783 78.0581 327 BS01 20 17.05 12.35 520 17.05
119 PIMPALKHOTA (MOTA) MORSHI 21.2653 78.0092 333 BS01 17 2.55 8.15 890 2.55
120 ASHTOLI MORSHI 21.2697 77.8269 395 BS01 5 2.5 2.85 2600 2.5
121 DOMAK MORSHI 21.3081 77.8292 397 BS01 29 >13.5 13.5 1100 >13.5
122 RAIPUR MORSHI 21.3042 77.8214 406 BS01 15 1.35 12.85 1000 1.35
123 GANESHPUR MORSHI 21.3842 77.8628 454 BS01 8 4.7 7.1 890 4.7
124 DASHSUR MORSHI 21.3797 77.8497 433 BS01 12 4.75 10.75 780 4.75
125 PIMPRI MORSHI 21.3625 77.8558 434 BS01 8 2.2 6 1290 2.2
126 UTHKHED MORSHI 21.2828 77.8833 373 BS01 22 8.65 16.8 1350 8.65
127 SAIWARA MORSHI 21.3294 77.8742 401 BS01 11 4.45 9.4 900 4.45
128 AMBARA MORSHI 21.3186 77.9014 386 BS01 14 3.55 11.5 1370 3.55
129 KOLVIHIR MORSHI 21.2767 77.8619 370 BS01 7 4.05 3.25 1050 4.05
130 CHINCHOLI GAVLI MORSHI 21.3544 77.9408 391 BS01 18 0.15 10.15 470 0.15
131 DHANORA-1 MORSHI 21.3972 77.9400 423 BS01 11 4.5 10 650 4.5
132 TARODA MORSHI 21.3528 77.9731 394 BS01 11 1.95 10.35 1000 1.95
133 DHANORA-2 MORSHI 21.3814 77.9692 386 BS01 15 4.15 13.25 1300 4.15
134 KHANAPUR MORSHI 21.3081 77.9581 387 BS01 14 7.35 9.3 1020 7.35
135 ASHTAGAON MORSHI 21.3086 77.9261 378 BS01 9 3.1 5.3 850 3.1
136 CHIKHAL SAVANGI MORSHI 21.3181 77.9636 377 BS01 8 4.6 7.15 470 4.6
137 YERLA MORSHI 21.2514 77.9900 364 BS01 10 3.9 6.5 1910 3.9
138 TALNI-1 MORSHI 21.2942 77.9869 361 BS01 7 3.35 3.35 560 3.35
139 ASONA MORSHI 21.2514 77.9861 342 BS01 9 3.9 7.2 920 3.9
140 PIMPALKHUTA MORSHI 21.2756 77.9619 363 BS01 8 2.6 6.55 1300 2.6
141 BORNA MORSHI 21.2756 77.9211 362 BS01 12 4.35 10.55 680 4.35
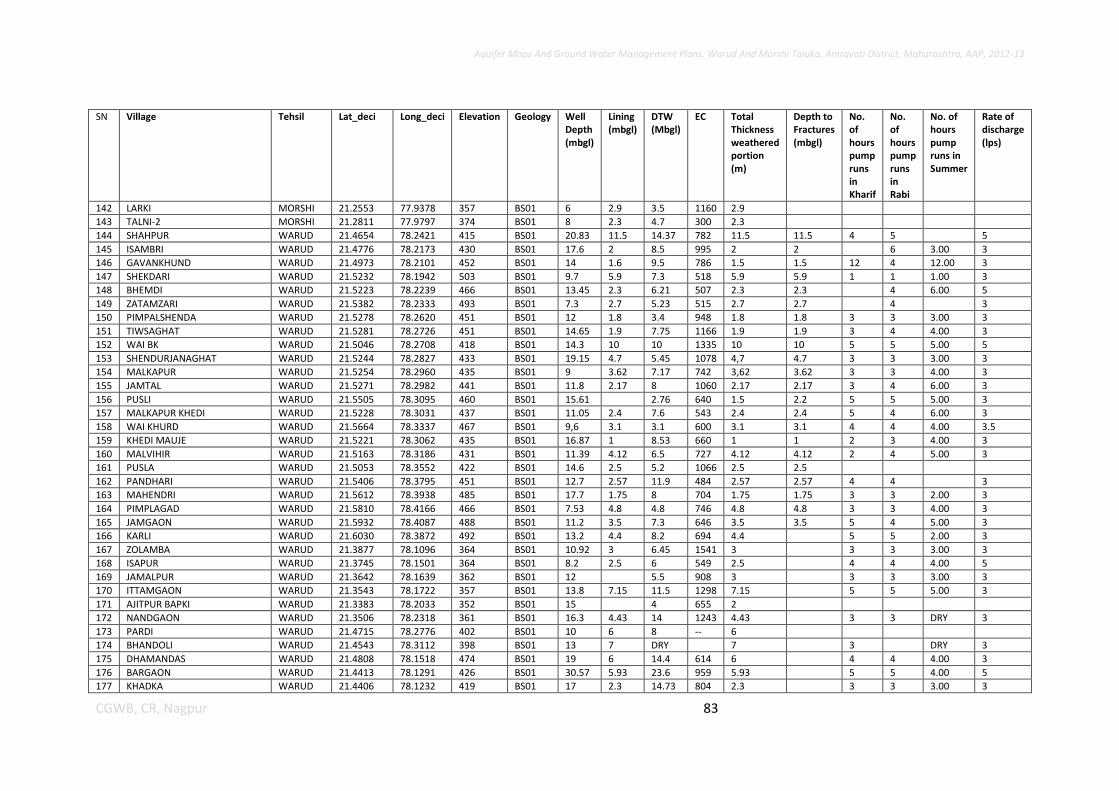
Aquifer Maps And Ground Water Management Plans, Warud And Morshi Taluka, Amravati District, Maharashtra, AAP, 2012-13
83 CGWB, CR, Nagpur
SN Village Tehsil Lat_deci Long_deci Elevation Geology Well Depth (mbgl)
Lining (mbgl)
DTW (Mbgl)
EC Total Thickness weathered portion (m)
Depth to Fractures (mbgl)
No. of hours pump runs in Kharif
No. of hours pump runs in Rabi
No. of hours pump runs in Summer
Rate of discharge (lps)
142 LARKI MORSHI 21.2553 77.9378 357 BS01 6 2.9 3.5 1160 2.9
143 TALNI-2 MORSHI 21.2811 77.9797 374 BS01 8 2.3 4.7 300 2.3
144 SHAHPUR WARUD 21.4654 78.2421 415 BS01 20.83 11.5 14.37 782 11.5 11.5 4 5 5
145 ISAMBRI WARUD 21.4776 78.2173 430 BS01 17.6 2 8.5 995 2 2 6 3.00 3
146 GAVANKHUND WARUD 21.4973 78.2101 452 BS01 14 1.6 9.5 786 1.5 1.5 12 4 12.00 3
147 SHEKDARI WARUD 21.5232 78.1942 503 BS01 9.7 5.9 7.3 518 5.9 5.9 1 1 1.00 3
148 BHEMDI WARUD 21.5223 78.2239 466 BS01 13.45 2.3 6.21 507 2.3 2.3 4 6.00 5
149 ZATAMZARI WARUD 21.5382 78.2333 493 BS01 7.3 2.7 5.23 515 2.7 2.7 4 3
150 PIMPALSHENDA WARUD 21.5278 78.2620 451 BS01 12 1.8 3.4 948 1.8 1.8 3 3 3.00 3
151 TIWSAGHAT WARUD 21.5281 78.2726 451 BS01 14.65 1.9 7.75 1166 1.9 1.9 3 4 4.00 3
152 WAI BK WARUD 21.5046 78.2708 418 BS01 14.3 10 10 1335 10 10 5 5 5.00 5
153 SHENDURJANAGHAT WARUD 21.5244 78.2827 433 BS01 19.15 4.7 5.45 1078 4,7 4.7 3 3 3.00 3
154 MALKAPUR WARUD 21.5254 78.2960 435 BS01 9 3.62 7.17 742 3,62 3.62 3 3 4.00 3
155 JAMTAL WARUD 21.5271 78.2982 441 BS01 11.8 2.17 8 1060 2.17 2.17 3 4 6.00 3
156 PUSLI WARUD 21.5505 78.3095 460 BS01 15.61 2.76 640 1.5 2.2 5 5 5.00 3
157 MALKAPUR KHEDI WARUD 21.5228 78.3031 437 BS01 11.05 2.4 7.6 543 2.4 2.4 5 4 6.00 3
158 WAI KHURD WARUD 21.5664 78.3337 467 BS01 9,6 3.1 3.1 600 3.1 3.1 4 4 4.00 3.5
159 KHEDI MAUJE WARUD 21.5221 78.3062 435 BS01 16.87 1 8.53 660 1 1 2 3 4.00 3
160 MALVIHIR WARUD 21.5163 78.3186 431 BS01 11.39 4.12 6.5 727 4.12 4.12 2 4 5.00 3
161 PUSLA WARUD 21.5053 78.3552 422 BS01 14.6 2.5 5.2 1066 2.5 2.5
162 PANDHARI WARUD 21.5406 78.3795 451 BS01 12.7 2.57 11.9 484 2.57 2.57 4 4 3
163 MAHENDRI WARUD 21.5612 78.3938 485 BS01 17.7 1.75 8 704 1.75 1.75 3 3 2.00 3
164 PIMPLAGAD WARUD 21.5810 78.4166 466 BS01 7.53 4.8 4.8 746 4.8 4.8 3 3 4.00 3
165 JAMGAON WARUD 21.5932 78.4087 488 BS01 11.2 3.5 7.3 646 3.5 3.5 5 4 5.00 3
166 KARLI WARUD 21.6030 78.3872 492 BS01 13.2 4.4 8.2 694 4.4 5 5 2.00 3
167 ZOLAMBA WARUD 21.3877 78.1096 364 BS01 10.92 3 6.45 1541 3 3 3 3.00 3
168 ISAPUR WARUD 21.3745 78.1501 364 BS01 8.2 2.5 6 549 2.5 4 4 4.00 5
169 JAMALPUR WARUD 21.3642 78.1639 362 BS01 12 5.5 908 3 3 3 3.00 3
170 ITTAMGAON WARUD 21.3543 78.1722 357 BS01 13.8 7.15 11.5 1298 7.15 5 5 5.00 3
171 AJITPUR BAPKI WARUD 21.3383 78.2033 352 BS01 15 4 655 2
172 NANDGAON WARUD 21.3506 78.2318 361 BS01 16.3 4.43 14 1243 4.43 3 3 DRY 3
173 PARDI WARUD 21.4715 78.2776 402 BS01 10 6 8 -- 6
174 BHANDOLI WARUD 21.4543 78.3112 398 BS01 13 7 DRY 7 3 DRY 3
175 DHAMANDAS WARUD 21.4808 78.1518 474 BS01 19 6 14.4 614 6 4 4 4.00 3
176 BARGAON WARUD 21.4413 78.1291 426 BS01 30.57 5.93 23.6 959 5.93 5 5 4.00 5
177 KHADKA WARUD 21.4406 78.1232 419 BS01 17 2.3 14.73 804 2.3 3 3 3.00 3
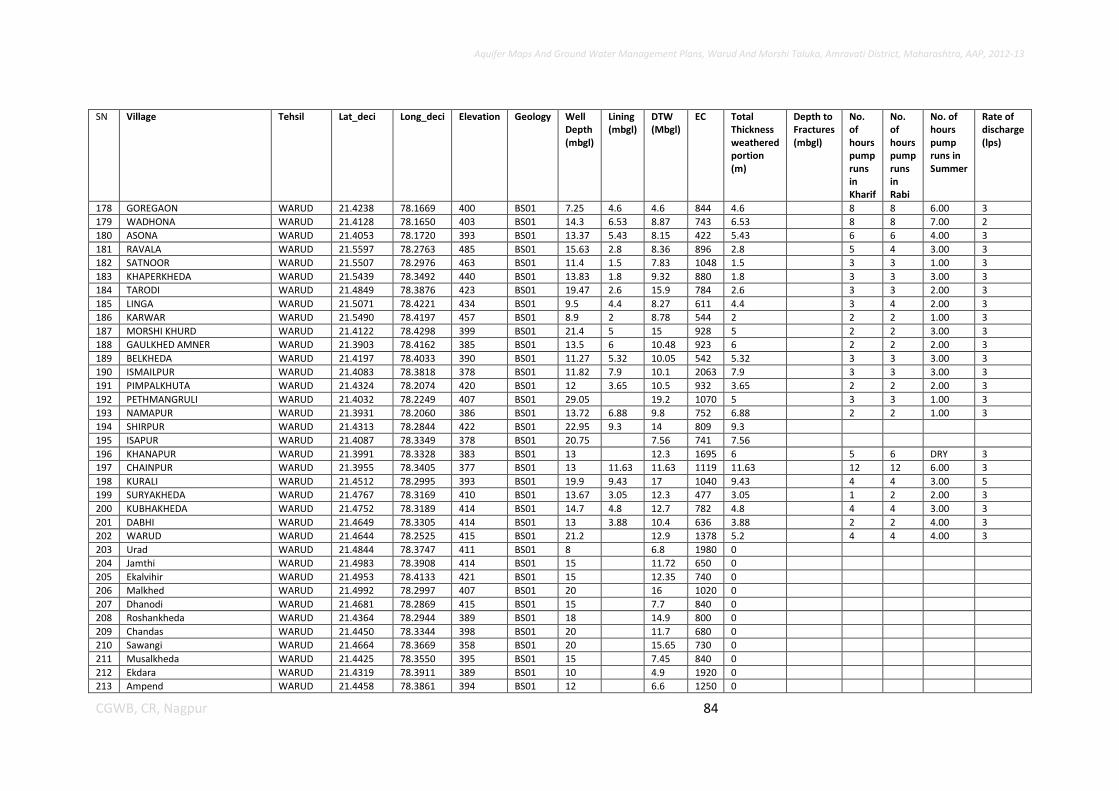
Aquifer Maps And Ground Water Management Plans, Warud And Morshi Taluka, Amravati District, Maharashtra, AAP, 2012-13
84 CGWB, CR, Nagpur
SN Village Tehsil Lat_deci Long_deci Elevation Geology Well Depth (mbgl)
Lining (mbgl)
DTW (Mbgl)
EC Total Thickness weathered portion (m)
Depth to Fractures (mbgl)
No. of hours pump runs in Kharif
No. of hours pump runs in Rabi
No. of hours pump runs in Summer
Rate of discharge (lps)
178 GOREGAON WARUD 21.4238 78.1669 400 BS01 7.25 4.6 4.6 844 4.6 8 8 6.00 3
179 WADHONA WARUD 21.4128 78.1650 403 BS01 14.3 6.53 8.87 743 6.53 8 8 7.00 2
180 ASONA WARUD 21.4053 78.1720 393 BS01 13.37 5.43 8.15 422 5.43 6 6 4.00 3
181 RAVALA WARUD 21.5597 78.2763 485 BS01 15.63 2.8 8.36 896 2.8 5 4 3.00 3
182 SATNOOR WARUD 21.5507 78.2976 463 BS01 11.4 1.5 7.83 1048 1.5 3 3 1.00 3
183 KHAPERKHEDA WARUD 21.5439 78.3492 440 BS01 13.83 1.8 9.32 880 1.8 3 3 3.00 3
184 TARODI WARUD 21.4849 78.3876 423 BS01 19.47 2.6 15.9 784 2.6 3 3 2.00 3
185 LINGA WARUD 21.5071 78.4221 434 BS01 9.5 4.4 8.27 611 4.4 3 4 2.00 3
186 KARWAR WARUD 21.5490 78.4197 457 BS01 8.9 2 8.78 544 2 2 2 1.00 3
187 MORSHI KHURD WARUD 21.4122 78.4298 399 BS01 21.4 5 15 928 5 2 2 3.00 3
188 GAULKHED AMNER WARUD 21.3903 78.4162 385 BS01 13.5 6 10.48 923 6 2 2 2.00 3
189 BELKHEDA WARUD 21.4197 78.4033 390 BS01 11.27 5.32 10.05 542 5.32 3 3 3.00 3
190 ISMAILPUR WARUD 21.4083 78.3818 378 BS01 11.82 7.9 10.1 2063 7.9 3 3 3.00 3
191 PIMPALKHUTA WARUD 21.4324 78.2074 420 BS01 12 3.65 10.5 932 3.65 2 2 2.00 3
192 PETHMANGRULI WARUD 21.4032 78.2249 407 BS01 29.05 19.2 1070 5 3 3 1.00 3
193 NAMAPUR WARUD 21.3931 78.2060 386 BS01 13.72 6.88 9.8 752 6.88 2 2 1.00 3
194 SHIRPUR WARUD 21.4313 78.2844 422 BS01 22.95 9.3 14 809 9.3
195 ISAPUR WARUD 21.4087 78.3349 378 BS01 20.75 7.56 741 7.56
196 KHANAPUR WARUD 21.3991 78.3328 383 BS01 13 12.3 1695 6 5 6 DRY 3
197 CHAINPUR WARUD 21.3955 78.3405 377 BS01 13 11.63 11.63 1119 11.63 12 12 6.00 3
198 KURALI WARUD 21.4512 78.2995 393 BS01 19.9 9.43 17 1040 9.43 4 4 3.00 5
199 SURYAKHEDA WARUD 21.4767 78.3169 410 BS01 13.67 3.05 12.3 477 3.05 1 2 2.00 3
200 KUBHAKHEDA WARUD 21.4752 78.3189 414 BS01 14.7 4.8 12.7 782 4.8 4 4 3.00 3
201 DABHI WARUD 21.4649 78.3305 414 BS01 13 3.88 10.4 636 3.88 2 2 4.00 3
202 WARUD WARUD 21.4644 78.2525 415 BS01 21.2 12.9 1378 5.2 4 4 4.00 3
203 Urad WARUD 21.4844 78.3747 411 BS01 8 6.8 1980 0
204 Jamthi WARUD 21.4983 78.3908 414 BS01 15 11.72 650 0
205 Ekalvihir WARUD 21.4953 78.4133 421 BS01 15 12.35 740 0
206 Malkhed WARUD 21.4992 78.2997 407 BS01 20 16 1020 0
207 Dhanodi WARUD 21.4681 78.2869 415 BS01 15 7.7 840 0
208 Roshankheda WARUD 21.4364 78.2944 389 BS01 18 14.9 800 0
209 Chandas WARUD 21.4450 78.3344 398 BS01 20 11.7 680 0
210 Sawangi WARUD 21.4664 78.3669 358 BS01 20 15.65 730 0
211 Musalkheda WARUD 21.4425 78.3550 395 BS01 15 7.45 840 0
212 Ekdara WARUD 21.4319 78.3911 389 BS01 10 4.9 1920 0
213 Ampend WARUD 21.4458 78.3861 394 BS01 12 6.6 1250 0
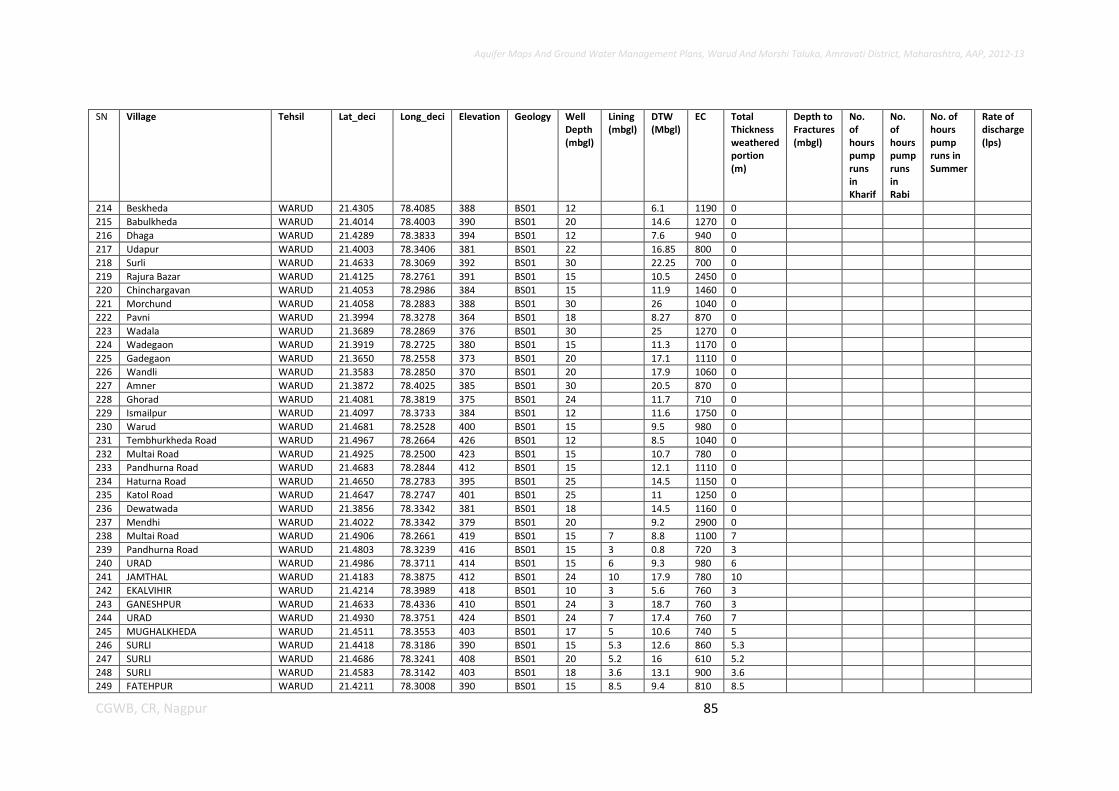
Aquifer Maps And Ground Water Management Plans, Warud And Morshi Taluka, Amravati District, Maharashtra, AAP, 2012-13
85 CGWB, CR, Nagpur
SN Village Tehsil Lat_deci Long_deci Elevation Geology Well Depth (mbgl)
Lining (mbgl)
DTW (Mbgl)
EC Total Thickness weathered portion (m)
Depth to Fractures (mbgl)
No. of hours pump runs in Kharif
No. of hours pump runs in Rabi
No. of hours pump runs in Summer
Rate of discharge (lps)
214 Beskheda WARUD 21.4305 78.4085 388 BS01 12 6.1 1190 0
215 Babulkheda WARUD 21.4014 78.4003 390 BS01 20 14.6 1270 0
216 Dhaga WARUD 21.4289 78.3833 394 BS01 12 7.6 940 0
217 Udapur WARUD 21.4003 78.3406 381 BS01 22 16.85 800 0
218 Surli WARUD 21.4633 78.3069 392 BS01 30 22.25 700 0
219 Rajura Bazar WARUD 21.4125 78.2761 391 BS01 15 10.5 2450 0
220 Chinchargavan WARUD 21.4053 78.2986 384 BS01 15 11.9 1460 0
221 Morchund WARUD 21.4058 78.2883 388 BS01 30 26 1040 0
222 Pavni WARUD 21.3994 78.3278 364 BS01 18 8.27 870 0
223 Wadala WARUD 21.3689 78.2869 376 BS01 30 25 1270 0
224 Wadegaon WARUD 21.3919 78.2725 380 BS01 15 11.3 1170 0
225 Gadegaon WARUD 21.3650 78.2558 373 BS01 20 17.1 1110 0
226 Wandli WARUD 21.3583 78.2850 370 BS01 20 17.9 1060 0
227 Amner WARUD 21.3872 78.4025 385 BS01 30 20.5 870 0
228 Ghorad WARUD 21.4081 78.3819 375 BS01 24 11.7 710 0
229 Ismailpur WARUD 21.4097 78.3733 384 BS01 12 11.6 1750 0
230 Warud WARUD 21.4681 78.2528 400 BS01 15 9.5 980 0
231 Tembhurkheda Road WARUD 21.4967 78.2664 426 BS01 12 8.5 1040 0
232 Multai Road WARUD 21.4925 78.2500 423 BS01 15 10.7 780 0
233 Pandhurna Road WARUD 21.4683 78.2844 412 BS01 15 12.1 1110 0
234 Haturna Road WARUD 21.4650 78.2783 395 BS01 25 14.5 1150 0
235 Katol Road WARUD 21.4647 78.2747 401 BS01 25 11 1250 0
236 Dewatwada WARUD 21.3856 78.3342 381 BS01 18 14.5 1160 0
237 Mendhi WARUD 21.4022 78.3342 379 BS01 20 9.2 2900 0
238 Multai Road WARUD 21.4906 78.2661 419 BS01 15 7 8.8 1100 7
239 Pandhurna Road WARUD 21.4803 78.3239 416 BS01 15 3 0.8 720 3
240 URAD WARUD 21.4986 78.3711 414 BS01 15 6 9.3 980 6
241 JAMTHAL WARUD 21.4183 78.3875 412 BS01 24 10 17.9 780 10
242 EKALVIHIR WARUD 21.4214 78.3989 418 BS01 10 3 5.6 760 3
243 GANESHPUR WARUD 21.4633 78.4336 410 BS01 24 3 18.7 760 3
244 URAD WARUD 21.4930 78.3751 424 BS01 24 7 17.4 760 7
245 MUGHALKHEDA WARUD 21.4511 78.3553 403 BS01 17 5 10.6 740 5
246 SURLI WARUD 21.4418 78.3186 390 BS01 15 5.3 12.6 860 5.3
247 SURLI WARUD 21.4686 78.3241 408 BS01 20 5.2 16 610 5.2
248 SURLI WARUD 21.4583 78.3142 403 BS01 18 3.6 13.1 900 3.6
249 FATEHPUR WARUD 21.4211 78.3008 390 BS01 15 8.5 9.4 810 8.5
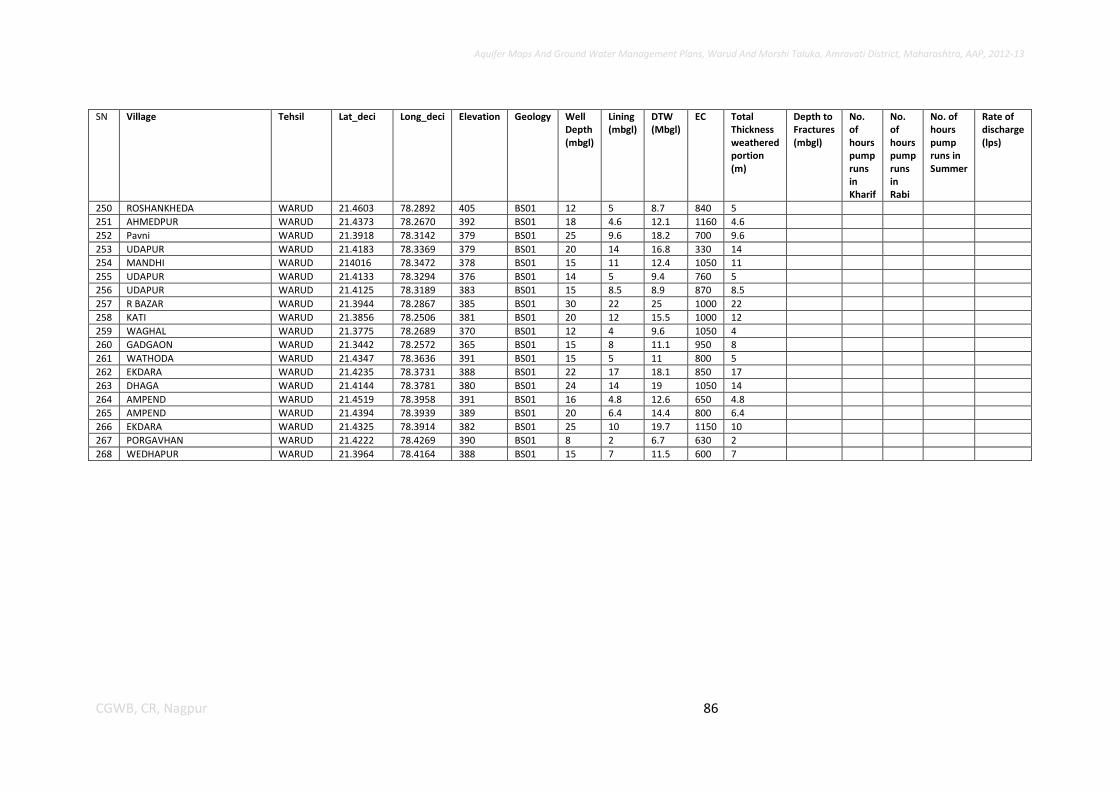
Aquifer Maps And Ground Water Management Plans, Warud And Morshi Taluka, Amravati District, Maharashtra, AAP, 2012-13
86 CGWB, CR, Nagpur
SN Village Tehsil Lat_deci Long_deci Elevation Geology Well Depth (mbgl)
Lining (mbgl)
DTW (Mbgl)
EC Total Thickness weathered portion (m)
Depth to Fractures (mbgl)
No. of hours pump runs in Kharif
No. of hours pump runs in Rabi
No. of hours pump runs in Summer
Rate of discharge (lps)
250 ROSHANKHEDA WARUD 21.4603 78.2892 405 BS01 12 5 8.7 840 5
251 AHMEDPUR WARUD 21.4373 78.2670 392 BS01 18 4.6 12.1 1160 4.6
252 Pavni WARUD 21.3918 78.3142 379 BS01 25 9.6 18.2 700 9.6
253 UDAPUR WARUD 21.4183 78.3369 379 BS01 20 14 16.8 330 14
254 MANDHI WARUD 214016 78.3472 378 BS01 15 11 12.4 1050 11
255 UDAPUR WARUD 21.4133 78.3294 376 BS01 14 5 9.4 760 5
256 UDAPUR WARUD 21.4125 78.3189 383 BS01 15 8.5 8.9 870 8.5
257 R BAZAR WARUD 21.3944 78.2867 385 BS01 30 22 25 1000 22
258 KATI WARUD 21.3856 78.2506 381 BS01 20 12 15.5 1000 12
259 WAGHAL WARUD 21.3775 78.2689 370 BS01 12 4 9.6 1050 4
260 GADGAON WARUD 21.3442 78.2572 365 BS01 15 8 11.1 950 8
261 WATHODA WARUD 21.4347 78.3636 391 BS01 15 5 11 800 5
262 EKDARA WARUD 21.4235 78.3731 388 BS01 22 17 18.1 850 17
263 DHAGA WARUD 21.4144 78.3781 380 BS01 24 14 19 1050 14
264 AMPEND WARUD 21.4519 78.3958 391 BS01 16 4.8 12.6 650 4.8
265 AMPEND WARUD 21.4394 78.3939 389 BS01 20 6.4 14.4 800 6.4
266 EKDARA WARUD 21.4325 78.3914 382 BS01 25 10 19.7 1150 10
267 PORGAVHAN WARUD 21.4222 78.4269 390 BS01 8 2 6.7 630 2
268 WEDHAPUR WARUD 21.3964 78.4164 388 BS01 15 7 11.5 600 7
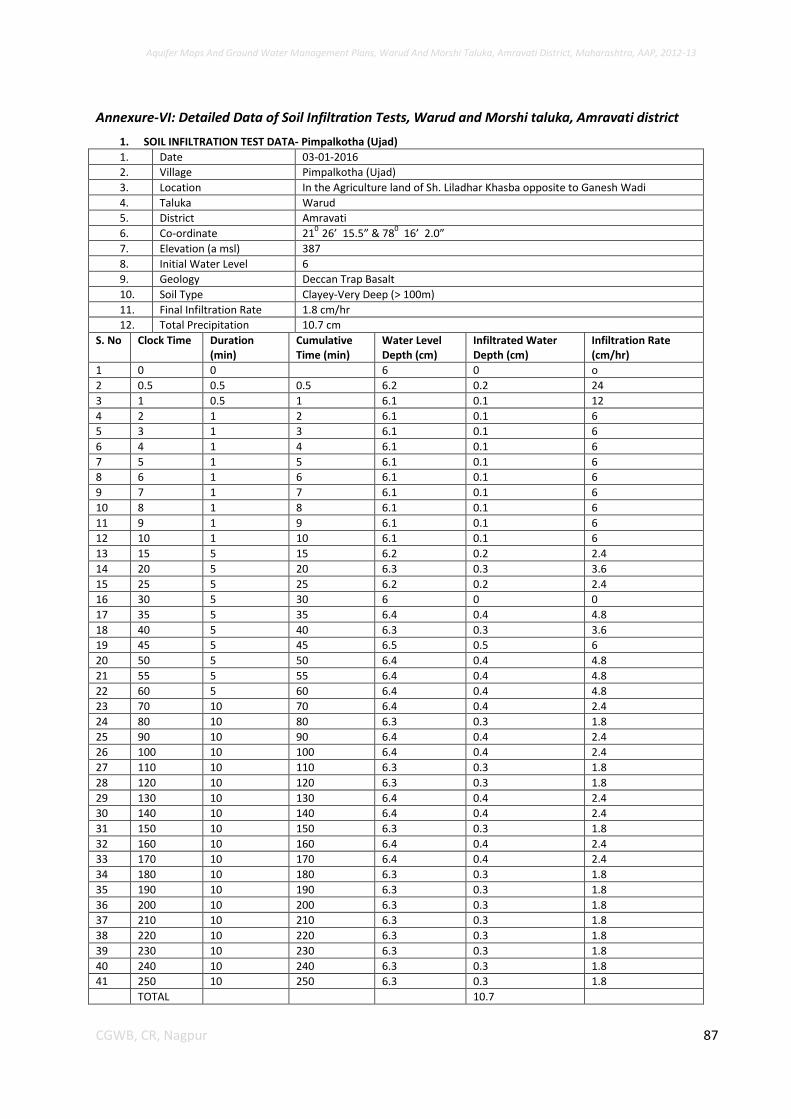
Aquifer Maps And Ground Water Management Plans, Warud And Morshi Taluka, Amravati District, Maharashtra, AAP, 2012-13
87 CGWB, CR, Nagpur
Annexure-VI: Detailed Data of Soil Infiltration Tests, Warud and Morshi taluka, Amravati district
1. SOIL INFILTRATION TEST DATA- Pimpalkotha (Ujad)
1. Date 03-01-2016
2. Village Pimpalkotha (Ujad)
3. Location In the Agriculture land of Sh. Liladhar Khasba opposite to Ganesh Wadi
4. Taluka Warud
5. District Amravati
6. Co-ordinate 210
26’ 15.5” & 780 16’ 2.0”
7. Elevation (a msl) 387
8. Initial Water Level 6
9. Geology Deccan Trap Basalt
10. Soil Type Clayey-Very Deep (> 100m)
11. Final Infiltration Rate 1.8 cm/hr
12. Total Precipitation 10.7 cm
S. No Clock Time Duration (min)
Cumulative Time (min)
Water Level Depth (cm)
Infiltrated Water Depth (cm)
Infiltration Rate (cm/hr)
1 0 0 6 0 o
2 0.5 0.5 0.5 6.2 0.2 24
3 1 0.5 1 6.1 0.1 12
4 2 1 2 6.1 0.1 6
5 3 1 3 6.1 0.1 6
6 4 1 4 6.1 0.1 6
7 5 1 5 6.1 0.1 6
8 6 1 6 6.1 0.1 6
9 7 1 7 6.1 0.1 6
10 8 1 8 6.1 0.1 6
11 9 1 9 6.1 0.1 6
12 10 1 10 6.1 0.1 6
13 15 5 15 6.2 0.2 2.4
14 20 5 20 6.3 0.3 3.6
15 25 5 25 6.2 0.2 2.4
16 30 5 30 6 0 0
17 35 5 35 6.4 0.4 4.8
18 40 5 40 6.3 0.3 3.6
19 45 5 45 6.5 0.5 6
20 50 5 50 6.4 0.4 4.8
21 55 5 55 6.4 0.4 4.8
22 60 5 60 6.4 0.4 4.8
23 70 10 70 6.4 0.4 2.4
24 80 10 80 6.3 0.3 1.8
25 90 10 90 6.4 0.4 2.4
26 100 10 100 6.4 0.4 2.4
27 110 10 110 6.3 0.3 1.8
28 120 10 120 6.3 0.3 1.8
29 130 10 130 6.4 0.4 2.4
30 140 10 140 6.4 0.4 2.4
31 150 10 150 6.3 0.3 1.8
32 160 10 160 6.4 0.4 2.4
33 170 10 170 6.4 0.4 2.4
34 180 10 180 6.3 0.3 1.8
35 190 10 190 6.3 0.3 1.8
36 200 10 200 6.3 0.3 1.8
37 210 10 210 6.3 0.3 1.8
38 220 10 220 6.3 0.3 1.8
39 230 10 230 6.3 0.3 1.8
40 240 10 240 6.3 0.3 1.8
41 250 10 250 6.3 0.3 1.8
TOTAL 10.7
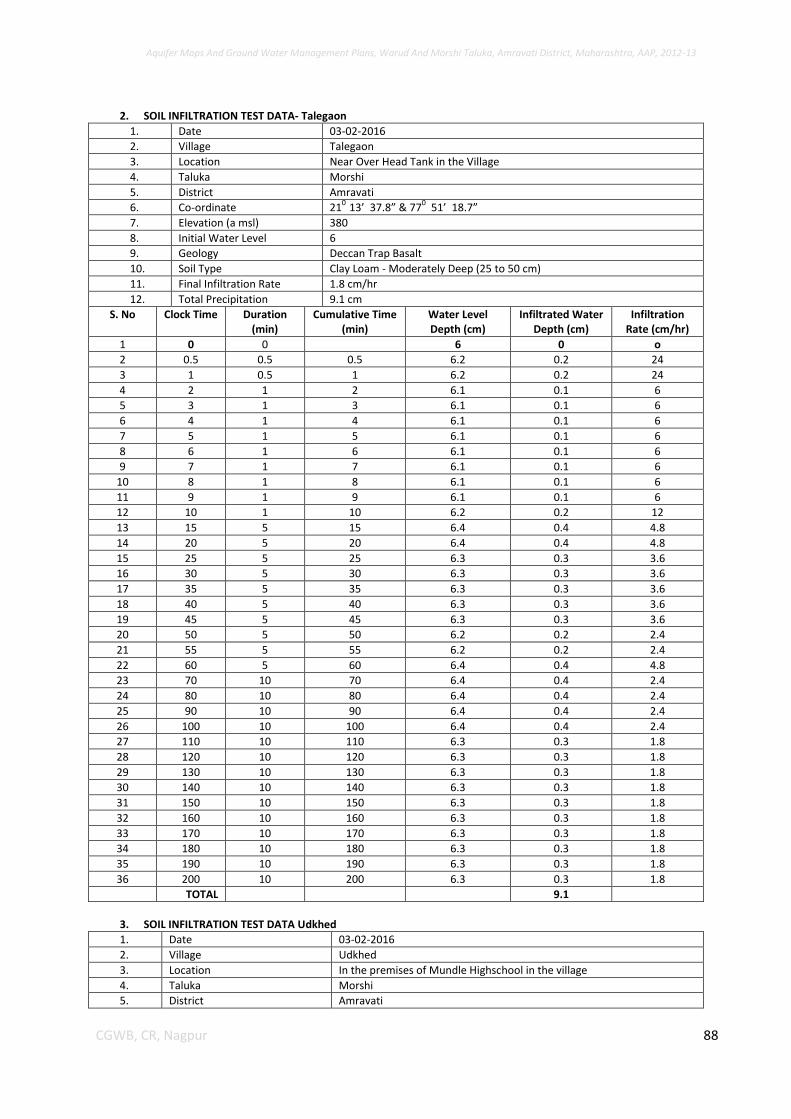
Aquifer Maps And Ground Water Management Plans, Warud And Morshi Taluka, Amravati District, Maharashtra, AAP, 2012-13
88 CGWB, CR, Nagpur
2. SOIL INFILTRATION TEST DATA- Talegaon
1. Date 03-02-2016
2. Village Talegaon
3. Location Near Over Head Tank in the Village
4. Taluka Morshi
5. District Amravati
6. Co-ordinate 210
13’ 37.8” & 770 51’ 18.7”
7. Elevation (a msl) 380
8. Initial Water Level 6
9. Geology Deccan Trap Basalt
10. Soil Type Clay Loam - Moderately Deep (25 to 50 cm)
11. Final Infiltration Rate 1.8 cm/hr
12. Total Precipitation 9.1 cm
S. No Clock Time Duration (min)
Cumulative Time (min)
Water Level Depth (cm)
Infiltrated Water Depth (cm)
Infiltration Rate (cm/hr)
1 0 0 6 0 o
2 0.5 0.5 0.5 6.2 0.2 24
3 1 0.5 1 6.2 0.2 24
4 2 1 2 6.1 0.1 6
5 3 1 3 6.1 0.1 6
6 4 1 4 6.1 0.1 6
7 5 1 5 6.1 0.1 6
8 6 1 6 6.1 0.1 6
9 7 1 7 6.1 0.1 6
10 8 1 8 6.1 0.1 6
11 9 1 9 6.1 0.1 6
12 10 1 10 6.2 0.2 12
13 15 5 15 6.4 0.4 4.8
14 20 5 20 6.4 0.4 4.8
15 25 5 25 6.3 0.3 3.6
16 30 5 30 6.3 0.3 3.6
17 35 5 35 6.3 0.3 3.6
18 40 5 40 6.3 0.3 3.6
19 45 5 45 6.3 0.3 3.6
20 50 5 50 6.2 0.2 2.4
21 55 5 55 6.2 0.2 2.4
22 60 5 60 6.4 0.4 4.8
23 70 10 70 6.4 0.4 2.4
24 80 10 80 6.4 0.4 2.4
25 90 10 90 6.4 0.4 2.4
26 100 10 100 6.4 0.4 2.4
27 110 10 110 6.3 0.3 1.8
28 120 10 120 6.3 0.3 1.8
29 130 10 130 6.3 0.3 1.8
30 140 10 140 6.3 0.3 1.8
31 150 10 150 6.3 0.3 1.8
32 160 10 160 6.3 0.3 1.8
33 170 10 170 6.3 0.3 1.8
34 180 10 180 6.3 0.3 1.8
35 190 10 190 6.3 0.3 1.8
36 200 10 200 6.3 0.3 1.8
TOTAL 9.1
3. SOIL INFILTRATION TEST DATA Udkhed
1. Date 03-02-2016
2. Village Udkhed
3. Location In the premises of Mundle Highschool in the village
4. Taluka Morshi
5. District Amravati
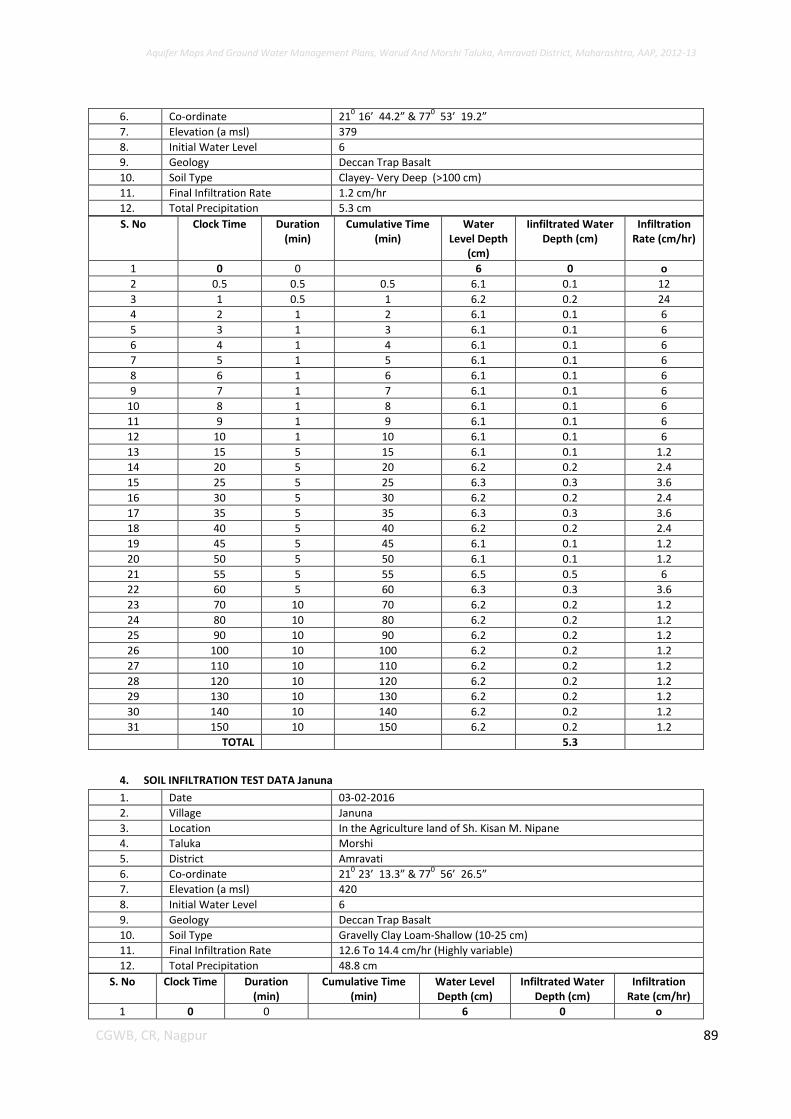
Aquifer Maps And Ground Water Management Plans, Warud And Morshi Taluka, Amravati District, Maharashtra, AAP, 2012-13
89 CGWB, CR, Nagpur
6. Co-ordinate 210
16’ 44.2” & 770 53’ 19.2”
7. Elevation (a msl) 379
8. Initial Water Level 6
9. Geology Deccan Trap Basalt
10. Soil Type Clayey- Very Deep (>100 cm)
11. Final Infiltration Rate 1.2 cm/hr
12. Total Precipitation 5.3 cm
S. No Clock Time Duration (min)
Cumulative Time (min)
Water Level Depth
(cm)
Iinfiltrated Water Depth (cm)
Infiltration Rate (cm/hr)
1 0 0 6 0 o
2 0.5 0.5 0.5 6.1 0.1 12
3 1 0.5 1 6.2 0.2 24
4 2 1 2 6.1 0.1 6
5 3 1 3 6.1 0.1 6
6 4 1 4 6.1 0.1 6
7 5 1 5 6.1 0.1 6
8 6 1 6 6.1 0.1 6
9 7 1 7 6.1 0.1 6
10 8 1 8 6.1 0.1 6
11 9 1 9 6.1 0.1 6
12 10 1 10 6.1 0.1 6
13 15 5 15 6.1 0.1 1.2
14 20 5 20 6.2 0.2 2.4
15 25 5 25 6.3 0.3 3.6
16 30 5 30 6.2 0.2 2.4
17 35 5 35 6.3 0.3 3.6
18 40 5 40 6.2 0.2 2.4
19 45 5 45 6.1 0.1 1.2
20 50 5 50 6.1 0.1 1.2
21 55 5 55 6.5 0.5 6
22 60 5 60 6.3 0.3 3.6
23 70 10 70 6.2 0.2 1.2
24 80 10 80 6.2 0.2 1.2
25 90 10 90 6.2 0.2 1.2
26 100 10 100 6.2 0.2 1.2
27 110 10 110 6.2 0.2 1.2
28 120 10 120 6.2 0.2 1.2
29 130 10 130 6.2 0.2 1.2
30 140 10 140 6.2 0.2 1.2
31 150 10 150 6.2 0.2 1.2
TOTAL 5.3
4. SOIL INFILTRATION TEST DATA Januna
1. Date 03-02-2016
2. Village Januna
3. Location In the Agriculture land of Sh. Kisan M. Nipane
4. Taluka Morshi
5. District Amravati
6. Co-ordinate 210
23’ 13.3” & 770 56’ 26.5”
7. Elevation (a msl) 420
8. Initial Water Level 6
9. Geology Deccan Trap Basalt
10. Soil Type Gravelly Clay Loam-Shallow (10-25 cm)
11. Final Infiltration Rate 12.6 To 14.4 cm/hr (Highly variable)
12. Total Precipitation 48.8 cm
S. No Clock Time Duration (min)
Cumulative Time (min)
Water Level Depth (cm)
Infiltrated Water Depth (cm)
Infiltration Rate (cm/hr)
1 0 0 6 0 o
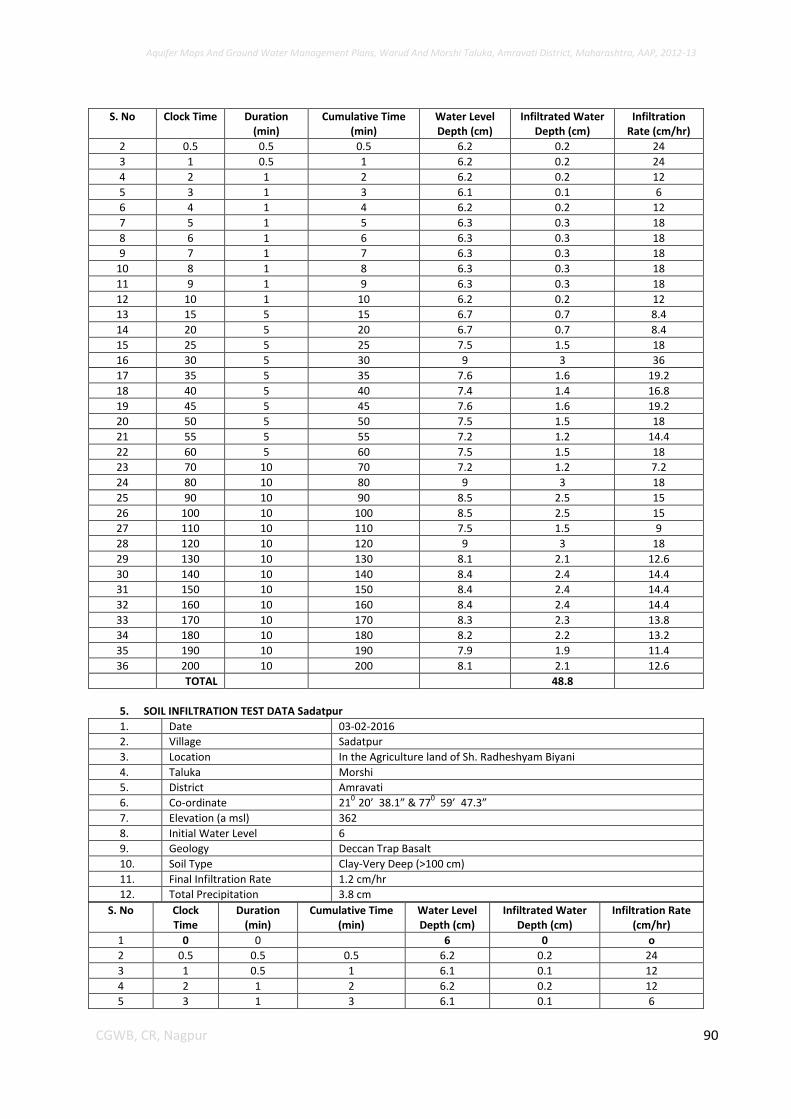
Aquifer Maps And Ground Water Management Plans, Warud And Morshi Taluka, Amravati District, Maharashtra, AAP, 2012-13
90 CGWB, CR, Nagpur
S. No Clock Time Duration (min)
Cumulative Time (min)
Water Level Depth (cm)
Infiltrated Water Depth (cm)
Infiltration Rate (cm/hr)
2 0.5 0.5 0.5 6.2 0.2 24
3 1 0.5 1 6.2 0.2 24
4 2 1 2 6.2 0.2 12
5 3 1 3 6.1 0.1 6
6 4 1 4 6.2 0.2 12
7 5 1 5 6.3 0.3 18
8 6 1 6 6.3 0.3 18
9 7 1 7 6.3 0.3 18
10 8 1 8 6.3 0.3 18
11 9 1 9 6.3 0.3 18
12 10 1 10 6.2 0.2 12
13 15 5 15 6.7 0.7 8.4
14 20 5 20 6.7 0.7 8.4
15 25 5 25 7.5 1.5 18
16 30 5 30 9 3 36
17 35 5 35 7.6 1.6 19.2
18 40 5 40 7.4 1.4 16.8
19 45 5 45 7.6 1.6 19.2
20 50 5 50 7.5 1.5 18
21 55 5 55 7.2 1.2 14.4
22 60 5 60 7.5 1.5 18
23 70 10 70 7.2 1.2 7.2
24 80 10 80 9 3 18
25 90 10 90 8.5 2.5 15
26 100 10 100 8.5 2.5 15
27 110 10 110 7.5 1.5 9
28 120 10 120 9 3 18
29 130 10 130 8.1 2.1 12.6
30 140 10 140 8.4 2.4 14.4
31 150 10 150 8.4 2.4 14.4
32 160 10 160 8.4 2.4 14.4
33 170 10 170 8.3 2.3 13.8
34 180 10 180 8.2 2.2 13.2
35 190 10 190 7.9 1.9 11.4
36 200 10 200 8.1 2.1 12.6
TOTAL 48.8
5. SOIL INFILTRATION TEST DATA Sadatpur
1. Date 03-02-2016
2. Village Sadatpur
3. Location In the Agriculture land of Sh. Radheshyam Biyani
4. Taluka Morshi
5. District Amravati
6. Co-ordinate 210
20’ 38.1” & 770 59’ 47.3”
7. Elevation (a msl) 362
8. Initial Water Level 6
9. Geology Deccan Trap Basalt
10. Soil Type Clay-Very Deep (>100 cm)
11. Final Infiltration Rate 1.2 cm/hr
12. Total Precipitation 3.8 cm
S. No Clock Time
Duration (min)
Cumulative Time (min)
Water Level Depth (cm)
Infiltrated Water Depth (cm)
Infiltration Rate (cm/hr)
1 0 0 6 0 o
2 0.5 0.5 0.5 6.2 0.2 24
3 1 0.5 1 6.1 0.1 12
4 2 1 2 6.2 0.2 12
5 3 1 3 6.1 0.1 6
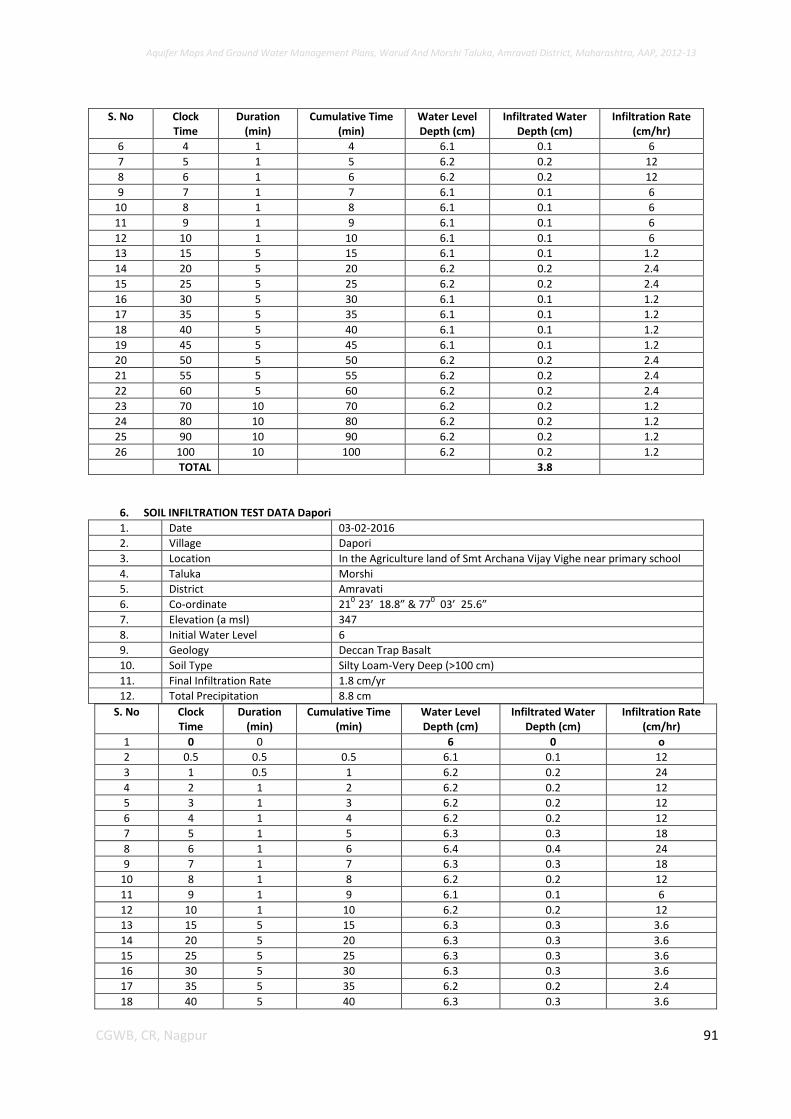
Aquifer Maps And Ground Water Management Plans, Warud And Morshi Taluka, Amravati District, Maharashtra, AAP, 2012-13
91 CGWB, CR, Nagpur
S. No Clock Time
Duration (min)
Cumulative Time (min)
Water Level Depth (cm)
Infiltrated Water Depth (cm)
Infiltration Rate (cm/hr)
6 4 1 4 6.1 0.1 6
7 5 1 5 6.2 0.2 12
8 6 1 6 6.2 0.2 12
9 7 1 7 6.1 0.1 6
10 8 1 8 6.1 0.1 6
11 9 1 9 6.1 0.1 6
12 10 1 10 6.1 0.1 6
13 15 5 15 6.1 0.1 1.2
14 20 5 20 6.2 0.2 2.4
15 25 5 25 6.2 0.2 2.4
16 30 5 30 6.1 0.1 1.2
17 35 5 35 6.1 0.1 1.2
18 40 5 40 6.1 0.1 1.2
19 45 5 45 6.1 0.1 1.2
20 50 5 50 6.2 0.2 2.4
21 55 5 55 6.2 0.2 2.4
22 60 5 60 6.2 0.2 2.4
23 70 10 70 6.2 0.2 1.2
24 80 10 80 6.2 0.2 1.2
25 90 10 90 6.2 0.2 1.2
26 100 10 100 6.2 0.2 1.2
TOTAL 3.8
6. SOIL INFILTRATION TEST DATA Dapori
1. Date 03-02-2016
2. Village Dapori
3. Location In the Agriculture land of Smt Archana Vijay Vighe near primary school
4. Taluka Morshi
5. District Amravati
6. Co-ordinate 210
23’ 18.8” & 770 03’ 25.6”
7. Elevation (a msl) 347
8. Initial Water Level 6
9. Geology Deccan Trap Basalt
10. Soil Type Silty Loam-Very Deep (>100 cm)
11. Final Infiltration Rate 1.8 cm/yr
12. Total Precipitation 8.8 cm
S. No Clock Time
Duration (min)
Cumulative Time (min)
Water Level Depth (cm)
Infiltrated Water Depth (cm)
Infiltration Rate (cm/hr)
1 0 0 6 0 o
2 0.5 0.5 0.5 6.1 0.1 12
3 1 0.5 1 6.2 0.2 24
4 2 1 2 6.2 0.2 12
5 3 1 3 6.2 0.2 12
6 4 1 4 6.2 0.2 12
7 5 1 5 6.3 0.3 18
8 6 1 6 6.4 0.4 24
9 7 1 7 6.3 0.3 18
10 8 1 8 6.2 0.2 12
11 9 1 9 6.1 0.1 6
12 10 1 10 6.2 0.2 12
13 15 5 15 6.3 0.3 3.6
14 20 5 20 6.3 0.3 3.6
15 25 5 25 6.3 0.3 3.6
16 30 5 30 6.3 0.3 3.6
17 35 5 35 6.2 0.2 2.4
18 40 5 40 6.3 0.3 3.6
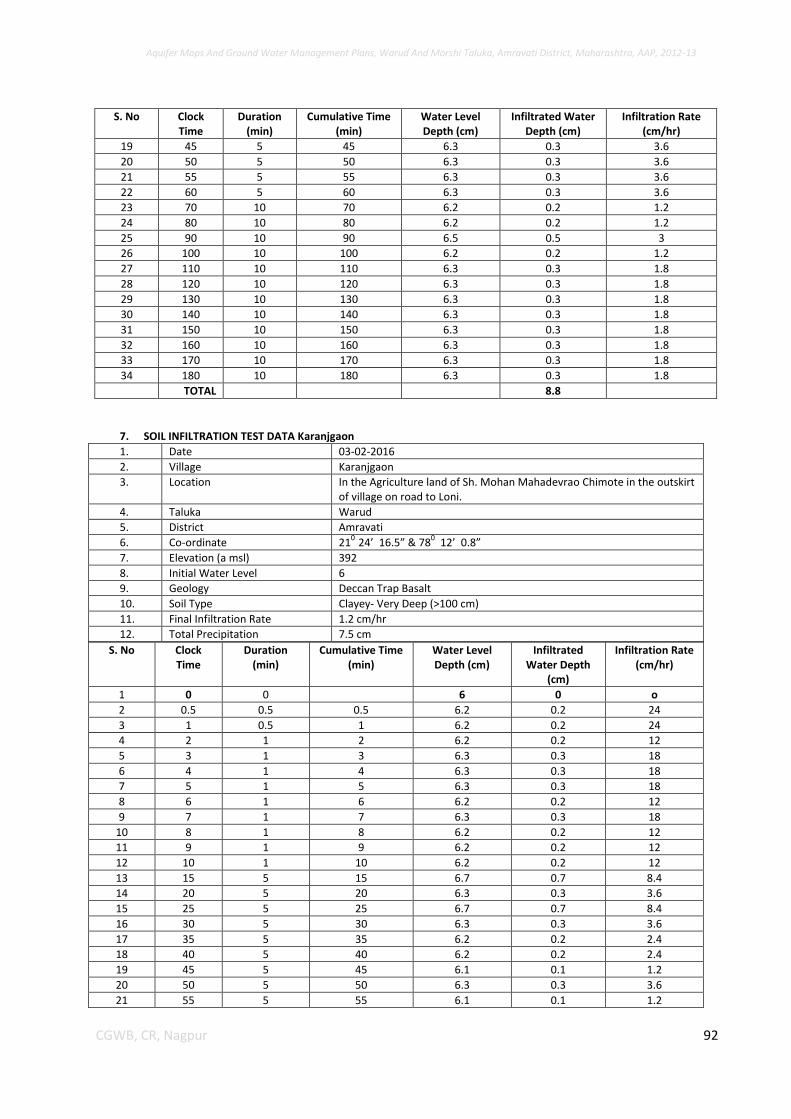
Aquifer Maps And Ground Water Management Plans, Warud And Morshi Taluka, Amravati District, Maharashtra, AAP, 2012-13
92 CGWB, CR, Nagpur
S. No Clock Time
Duration (min)
Cumulative Time (min)
Water Level Depth (cm)
Infiltrated Water Depth (cm)
Infiltration Rate (cm/hr)
19 45 5 45 6.3 0.3 3.6
20 50 5 50 6.3 0.3 3.6
21 55 5 55 6.3 0.3 3.6
22 60 5 60 6.3 0.3 3.6
23 70 10 70 6.2 0.2 1.2
24 80 10 80 6.2 0.2 1.2
25 90 10 90 6.5 0.5 3
26 100 10 100 6.2 0.2 1.2
27 110 10 110 6.3 0.3 1.8
28 120 10 120 6.3 0.3 1.8
29 130 10 130 6.3 0.3 1.8
30 140 10 140 6.3 0.3 1.8
31 150 10 150 6.3 0.3 1.8
32 160 10 160 6.3 0.3 1.8
33 170 10 170 6.3 0.3 1.8
34 180 10 180 6.3 0.3 1.8
TOTAL 8.8
7. SOIL INFILTRATION TEST DATA Karanjgaon
1. Date 03-02-2016
2. Village Karanjgaon
3. Location In the Agriculture land of Sh. Mohan Mahadevrao Chimote in the outskirt of village on road to Loni.
4. Taluka Warud
5. District Amravati
6. Co-ordinate 210
24’ 16.5” & 780 12’ 0.8”
7. Elevation (a msl) 392
8. Initial Water Level 6
9. Geology Deccan Trap Basalt
10. Soil Type Clayey- Very Deep (>100 cm)
11. Final Infiltration Rate 1.2 cm/hr
12. Total Precipitation 7.5 cm
S. No Clock Time
Duration (min)
Cumulative Time (min)
Water Level Depth (cm)
Infiltrated Water Depth
(cm)
Infiltration Rate (cm/hr)
1 0 0 6 0 o
2 0.5 0.5 0.5 6.2 0.2 24
3 1 0.5 1 6.2 0.2 24
4 2 1 2 6.2 0.2 12
5 3 1 3 6.3 0.3 18
6 4 1 4 6.3 0.3 18
7 5 1 5 6.3 0.3 18
8 6 1 6 6.2 0.2 12
9 7 1 7 6.3 0.3 18
10 8 1 8 6.2 0.2 12
11 9 1 9 6.2 0.2 12
12 10 1 10 6.2 0.2 12
13 15 5 15 6.7 0.7 8.4
14 20 5 20 6.3 0.3 3.6
15 25 5 25 6.7 0.7 8.4
16 30 5 30 6.3 0.3 3.6
17 35 5 35 6.2 0.2 2.4
18 40 5 40 6.2 0.2 2.4
19 45 5 45 6.1 0.1 1.2
20 50 5 50 6.3 0.3 3.6
21 55 5 55 6.1 0.1 1.2
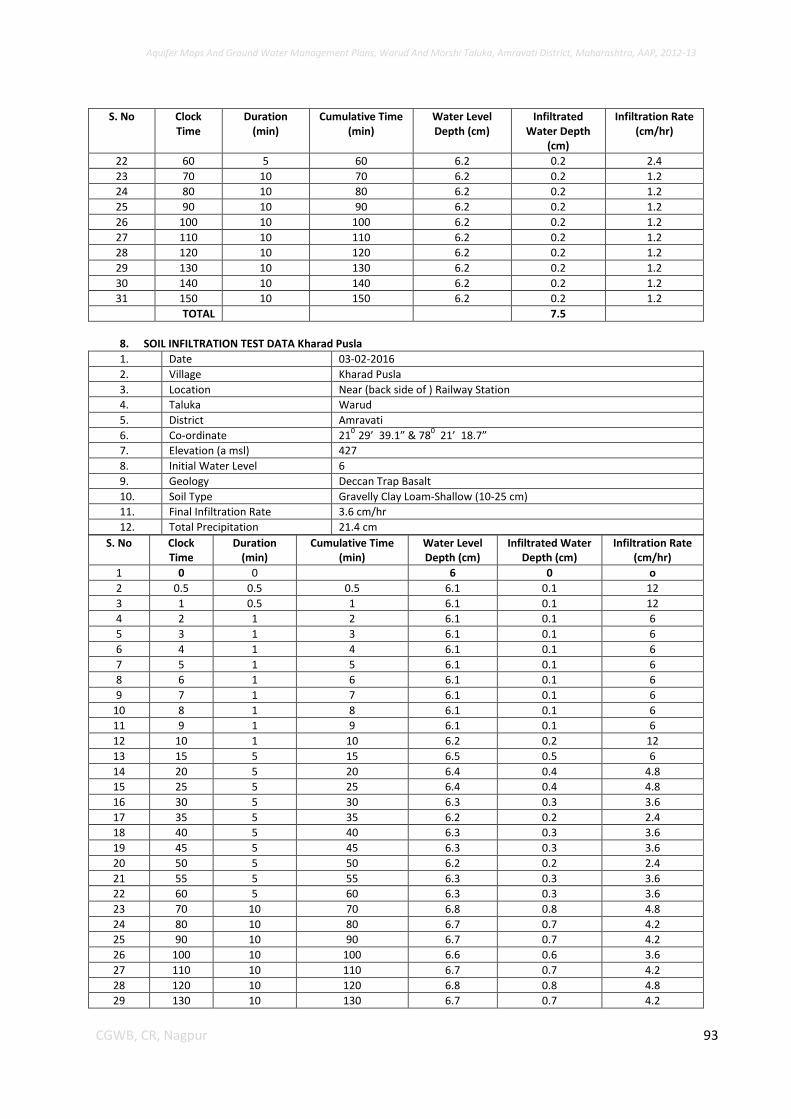
Aquifer Maps And Ground Water Management Plans, Warud And Morshi Taluka, Amravati District, Maharashtra, AAP, 2012-13
93 CGWB, CR, Nagpur
S. No Clock Time
Duration (min)
Cumulative Time (min)
Water Level Depth (cm)
Infiltrated Water Depth
(cm)
Infiltration Rate (cm/hr)
22 60 5 60 6.2 0.2 2.4
23 70 10 70 6.2 0.2 1.2
24 80 10 80 6.2 0.2 1.2
25 90 10 90 6.2 0.2 1.2
26 100 10 100 6.2 0.2 1.2
27 110 10 110 6.2 0.2 1.2
28 120 10 120 6.2 0.2 1.2
29 130 10 130 6.2 0.2 1.2
30 140 10 140 6.2 0.2 1.2
31 150 10 150 6.2 0.2 1.2
TOTAL 7.5
8. SOIL INFILTRATION TEST DATA Kharad Pusla
1. Date 03-02-2016
2. Village Kharad Pusla
3. Location Near (back side of ) Railway Station
4. Taluka Warud
5. District Amravati
6. Co-ordinate 210
29’ 39.1” & 780 21’ 18.7”
7. Elevation (a msl) 427
8. Initial Water Level 6
9. Geology Deccan Trap Basalt
10. Soil Type Gravelly Clay Loam-Shallow (10-25 cm)
11. Final Infiltration Rate 3.6 cm/hr
12. Total Precipitation 21.4 cm
S. No Clock Time
Duration (min)
Cumulative Time (min)
Water Level Depth (cm)
Infiltrated Water Depth (cm)
Infiltration Rate (cm/hr)
1 0 0 6 0 o
2 0.5 0.5 0.5 6.1 0.1 12
3 1 0.5 1 6.1 0.1 12
4 2 1 2 6.1 0.1 6
5 3 1 3 6.1 0.1 6
6 4 1 4 6.1 0.1 6
7 5 1 5 6.1 0.1 6
8 6 1 6 6.1 0.1 6
9 7 1 7 6.1 0.1 6
10 8 1 8 6.1 0.1 6
11 9 1 9 6.1 0.1 6
12 10 1 10 6.2 0.2 12
13 15 5 15 6.5 0.5 6
14 20 5 20 6.4 0.4 4.8
15 25 5 25 6.4 0.4 4.8
16 30 5 30 6.3 0.3 3.6
17 35 5 35 6.2 0.2 2.4
18 40 5 40 6.3 0.3 3.6
19 45 5 45 6.3 0.3 3.6
20 50 5 50 6.2 0.2 2.4
21 55 5 55 6.3 0.3 3.6
22 60 5 60 6.3 0.3 3.6
23 70 10 70 6.8 0.8 4.8
24 80 10 80 6.7 0.7 4.2
25 90 10 90 6.7 0.7 4.2
26 100 10 100 6.6 0.6 3.6
27 110 10 110 6.7 0.7 4.2
28 120 10 120 6.8 0.8 4.8
29 130 10 130 6.7 0.7 4.2
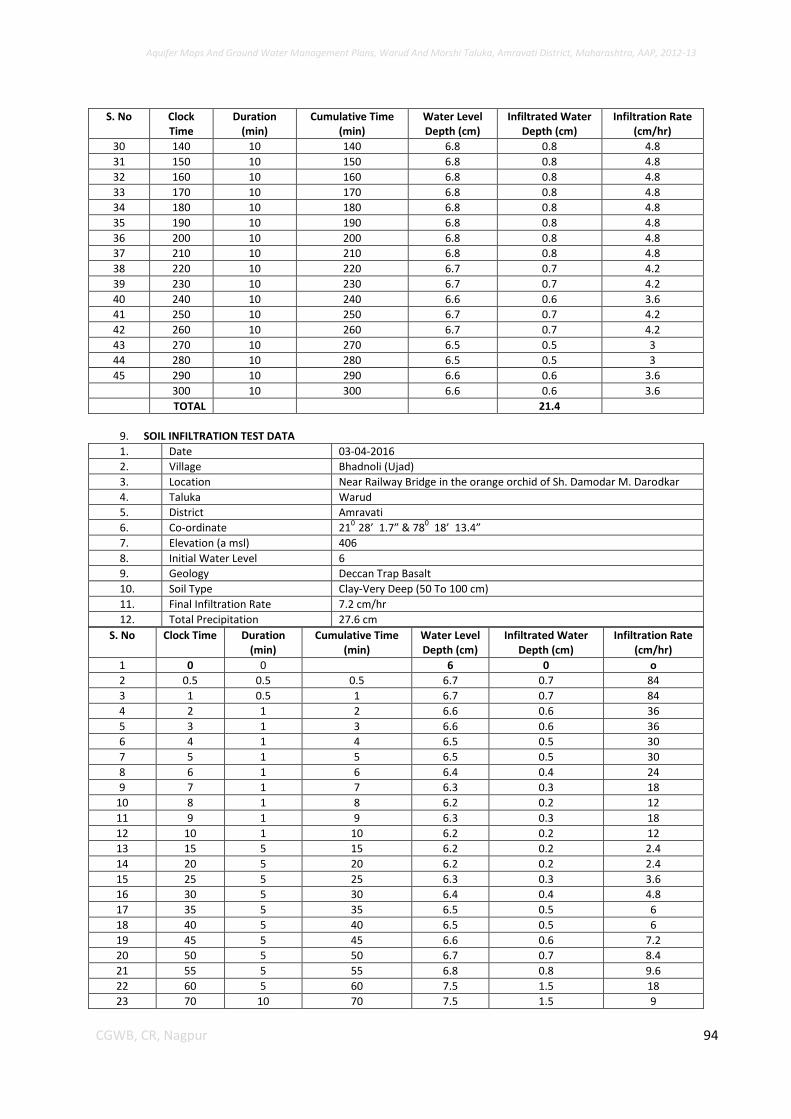
Aquifer Maps And Ground Water Management Plans, Warud And Morshi Taluka, Amravati District, Maharashtra, AAP, 2012-13
94 CGWB, CR, Nagpur
S. No Clock Time
Duration (min)
Cumulative Time (min)
Water Level Depth (cm)
Infiltrated Water Depth (cm)
Infiltration Rate (cm/hr)
30 140 10 140 6.8 0.8 4.8
31 150 10 150 6.8 0.8 4.8
32 160 10 160 6.8 0.8 4.8
33 170 10 170 6.8 0.8 4.8
34 180 10 180 6.8 0.8 4.8
35 190 10 190 6.8 0.8 4.8
36 200 10 200 6.8 0.8 4.8
37 210 10 210 6.8 0.8 4.8
38 220 10 220 6.7 0.7 4.2
39 230 10 230 6.7 0.7 4.2
40 240 10 240 6.6 0.6 3.6
41 250 10 250 6.7 0.7 4.2
42 260 10 260 6.7 0.7 4.2
43 270 10 270 6.5 0.5 3
44 280 10 280 6.5 0.5 3
45 290 10 290 6.6 0.6 3.6
300 10 300 6.6 0.6 3.6
TOTAL 21.4
9. SOIL INFILTRATION TEST DATA
1. Date 03-04-2016
2. Village Bhadnoli (Ujad)
3. Location Near Railway Bridge in the orange orchid of Sh. Damodar M. Darodkar
4. Taluka Warud
5. District Amravati
6. Co-ordinate 210
28’ 1.7” & 780 18’ 13.4”
7. Elevation (a msl) 406
8. Initial Water Level 6
9. Geology Deccan Trap Basalt
10. Soil Type Clay-Very Deep (50 To 100 cm)
11. Final Infiltration Rate 7.2 cm/hr
12. Total Precipitation 27.6 cm
S. No Clock Time Duration (min)
Cumulative Time (min)
Water Level Depth (cm)
Infiltrated Water Depth (cm)
Infiltration Rate (cm/hr)
1 0 0 6 0 o
2 0.5 0.5 0.5 6.7 0.7 84
3 1 0.5 1 6.7 0.7 84
4 2 1 2 6.6 0.6 36
5 3 1 3 6.6 0.6 36
6 4 1 4 6.5 0.5 30
7 5 1 5 6.5 0.5 30
8 6 1 6 6.4 0.4 24
9 7 1 7 6.3 0.3 18
10 8 1 8 6.2 0.2 12
11 9 1 9 6.3 0.3 18
12 10 1 10 6.2 0.2 12
13 15 5 15 6.2 0.2 2.4
14 20 5 20 6.2 0.2 2.4
15 25 5 25 6.3 0.3 3.6
16 30 5 30 6.4 0.4 4.8
17 35 5 35 6.5 0.5 6
18 40 5 40 6.5 0.5 6
19 45 5 45 6.6 0.6 7.2
20 50 5 50 6.7 0.7 8.4
21 55 5 55 6.8 0.8 9.6
22 60 5 60 7.5 1.5 18
23 70 10 70 7.5 1.5 9
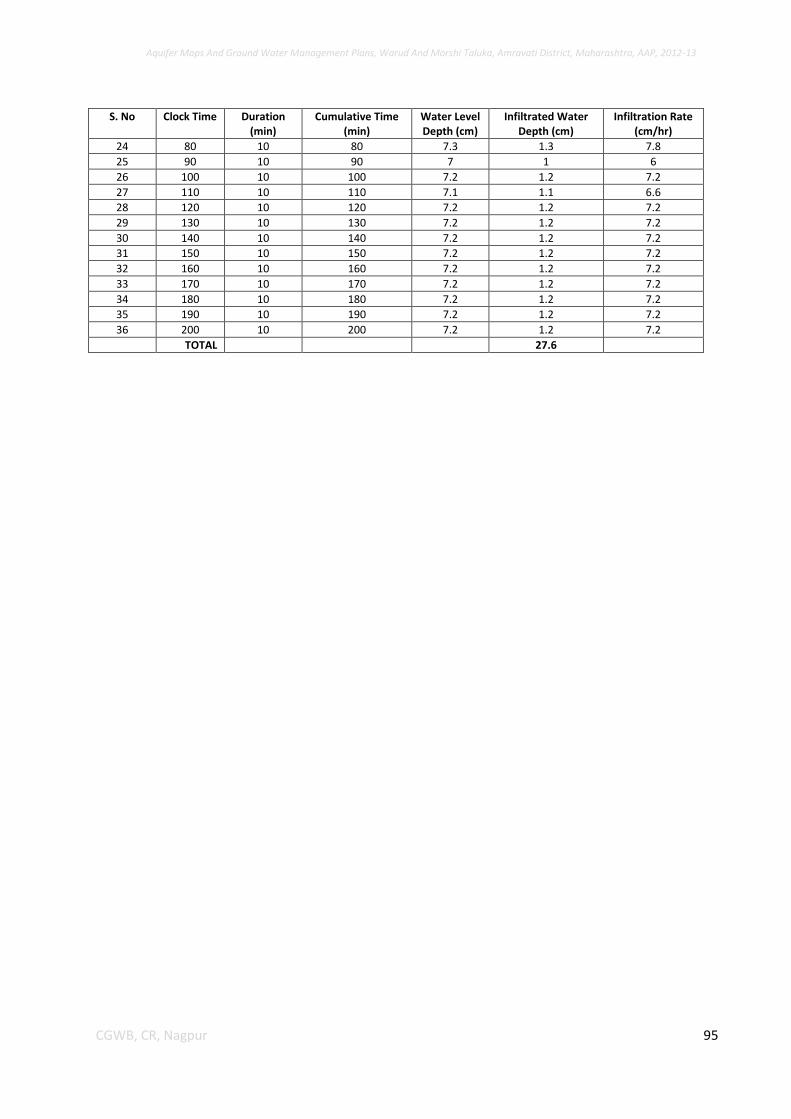
Aquifer Maps And Ground Water Management Plans, Warud And Morshi Taluka, Amravati District, Maharashtra, AAP, 2012-13
95 CGWB, CR, Nagpur
S. No Clock Time Duration (min)
Cumulative Time (min)
Water Level Depth (cm)
Infiltrated Water Depth (cm)
Infiltration Rate (cm/hr)
24 80 10 80 7.3 1.3 7.8
25 90 10 90 7 1 6
26 100 10 100 7.2 1.2 7.2
27 110 10 110 7.1 1.1 6.6
28 120 10 120 7.2 1.2 7.2
29 130 10 130 7.2 1.2 7.2
30 140 10 140 7.2 1.2 7.2
31 150 10 150 7.2 1.2 7.2
32 160 10 160 7.2 1.2 7.2
33 170 10 170 7.2 1.2 7.2
34 180 10 180 7.2 1.2 7.2
35 190 10 190 7.2 1.2 7.2
36 200 10 200 7.2 1.2 7.2
TOTAL 27.6
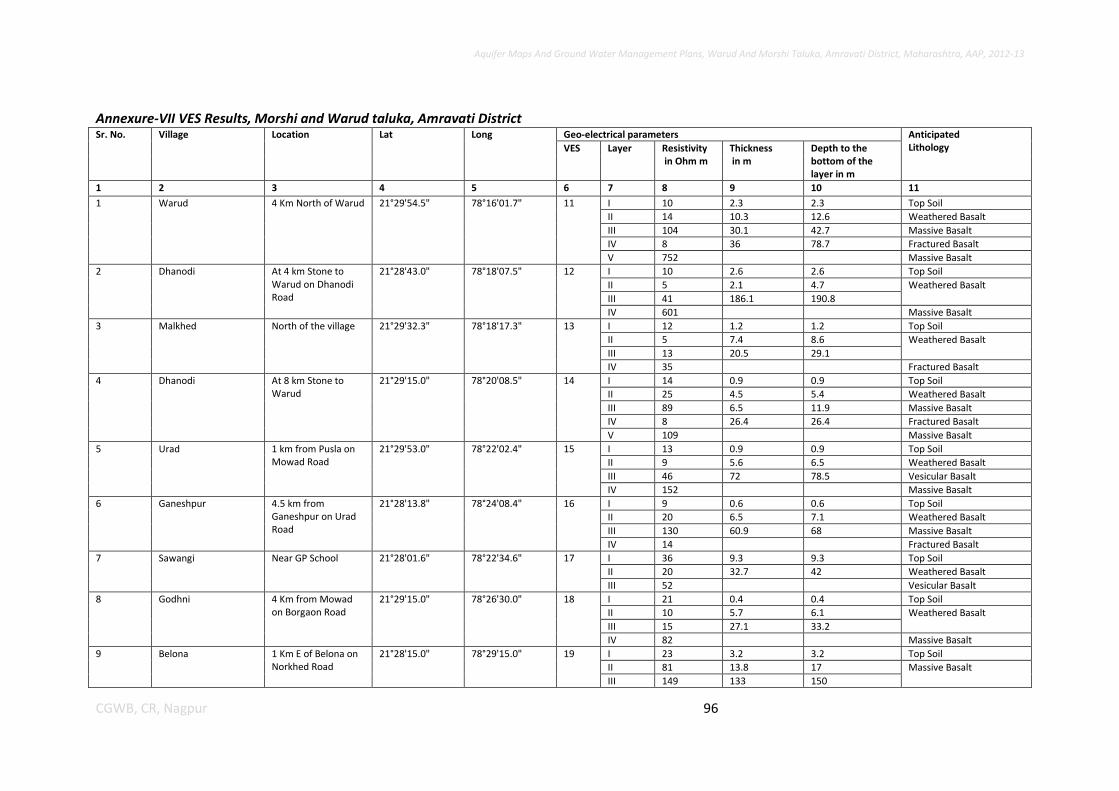
Aquifer Maps And Ground Water Management Plans, Warud And Morshi Taluka, Amravati District, Maharashtra, AAP, 2012-13
96 CGWB, CR, Nagpur
Annexure-VII VES Results, Morshi and Warud taluka, Amravati District Sr. No. Village Location Lat Long Geo-electrical parameters Anticipated
Lithology VES Layer Resistivity in Ohm m
Thickness in m
Depth to the bottom of the layer in m
1 2 3 4 5 6 7 8 9 10 11
1 Warud 4 Km North of Warud 21°29'54.5" 78°16'01.7" 11 I 10 2.3 2.3 Top Soil
II 14 10.3 12.6 Weathered Basalt
III 104 30.1 42.7 Massive Basalt
IV 8 36 78.7 Fractured Basalt
V 752 Massive Basalt
2 Dhanodi At 4 km Stone to Warud on Dhanodi Road
21°28'43.0" 78°18'07.5" 12 I 10 2.6 2.6 Top Soil
II 5 2.1 4.7 Weathered Basalt
III 41 186.1 190.8
IV 601 Massive Basalt
3 Malkhed North of the village 21°29'32.3" 78°18'17.3" 13 I 12 1.2 1.2 Top Soil
II 5 7.4 8.6 Weathered Basalt
III 13 20.5 29.1
IV 35 Fractured Basalt
4 Dhanodi At 8 km Stone to Warud
21°29'15.0" 78°20'08.5" 14 I 14 0.9 0.9 Top Soil
II 25 4.5 5.4 Weathered Basalt
III 89 6.5 11.9 Massive Basalt
IV 8 26.4 26.4 Fractured Basalt
V 109 Massive Basalt
5 Urad 1 km from Pusla on Mowad Road
21°29'53.0" 78°22'02.4" 15 I 13 0.9 0.9 Top Soil
II 9 5.6 6.5 Weathered Basalt
III 46 72 78.5 Vesicular Basalt
IV 152 Massive Basalt
6 Ganeshpur 4.5 km from Ganeshpur on Urad Road
21°28'13.8" 78°24'08.4" 16 I 9 0.6 0.6 Top Soil
II 20 6.5 7.1 Weathered Basalt
III 130 60.9 68 Massive Basalt
IV 14 Fractured Basalt
7 Sawangi Near GP School 21°28'01.6" 78°22'34.6" 17 I 36 9.3 9.3 Top Soil
II 20 32.7 42 Weathered Basalt
III 52 Vesicular Basalt
8 Godhni 4 Km from Mowad on Borgaon Road
21°29'15.0" 78°26'30.0" 18 I 21 0.4 0.4 Top Soil
II 10 5.7 6.1 Weathered Basalt
III 15 27.1 33.2
IV 82 Massive Basalt
9 Belona 1 Km E of Belona on Norkhed Road
21°28'15.0" 78°29'15.0" 19 I 23 3.2 3.2 Top Soil
II 81 13.8 17 Massive Basalt
III 149 133 150
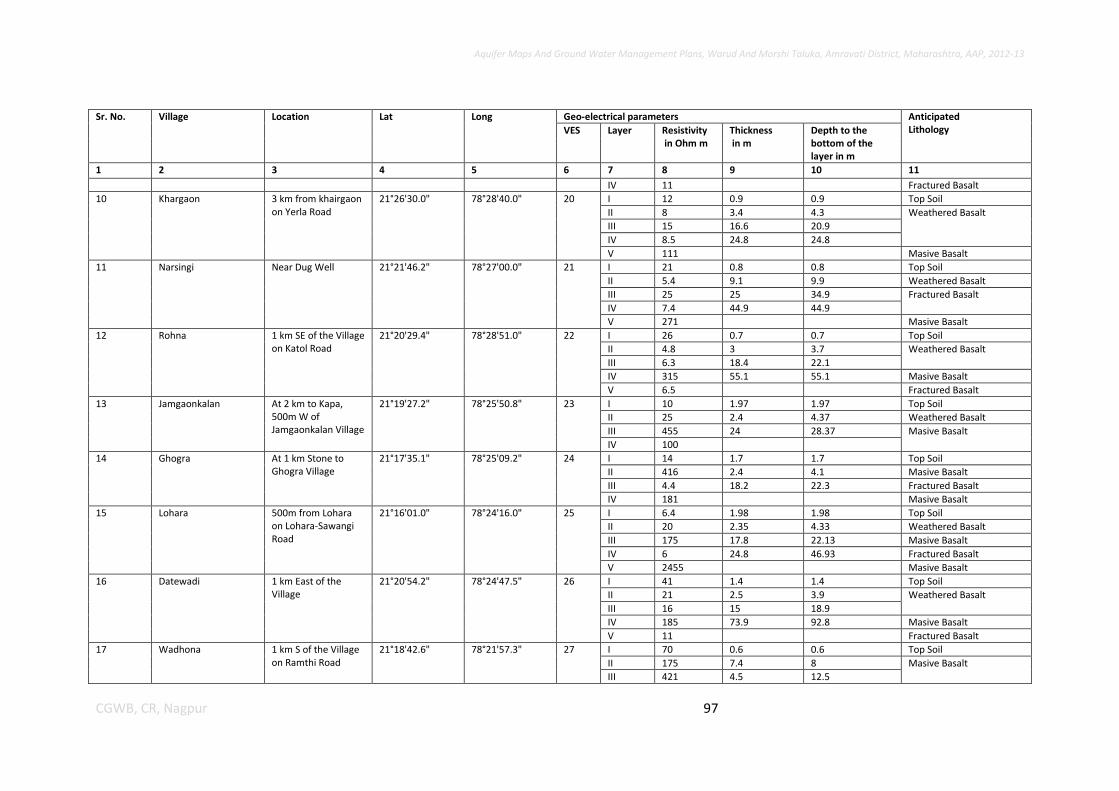
Aquifer Maps And Ground Water Management Plans, Warud And Morshi Taluka, Amravati District, Maharashtra, AAP, 2012-13
97 CGWB, CR, Nagpur
Sr. No. Village Location Lat Long Geo-electrical parameters Anticipated Lithology VES Layer Resistivity
in Ohm m Thickness in m
Depth to the bottom of the layer in m
1 2 3 4 5 6 7 8 9 10 11
IV 11 Fractured Basalt
10 Khargaon 3 km from khairgaon on Yerla Road
21°26'30.0" 78°28'40.0" 20 I 12 0.9 0.9 Top Soil
II 8 3.4 4.3 Weathered Basalt
III 15 16.6 20.9
IV 8.5 24.8 24.8
V 111 Masive Basalt
11 Narsingi Near Dug Well 21°21'46.2" 78°27'00.0" 21 I 21 0.8 0.8 Top Soil
II 5.4 9.1 9.9 Weathered Basalt
III 25 25 34.9 Fractured Basalt
IV 7.4 44.9 44.9
V 271 Masive Basalt
12 Rohna 1 km SE of the Village on Katol Road
21°20'29.4" 78°28'51.0" 22 I 26 0.7 0.7 Top Soil
II 4.8 3 3.7 Weathered Basalt
III 6.3 18.4 22.1
IV 315 55.1 55.1 Masive Basalt
V 6.5 Fractured Basalt
13 Jamgaonkalan At 2 km to Kapa, 500m W of Jamgaonkalan Village
21°19'27.2" 78°25'50.8" 23 I 10 1.97 1.97 Top Soil
II 25 2.4 4.37 Weathered Basalt
III 455 24 28.37 Masive Basalt
IV 100
14 Ghogra At 1 km Stone to Ghogra Village
21°17'35.1" 78°25'09.2" 24 I 14 1.7 1.7 Top Soil
II 416 2.4 4.1 Masive Basalt
III 4.4 18.2 22.3 Fractured Basalt
IV 181 Masive Basalt
15 Lohara 500m from Lohara on Lohara-Sawangi Road
21°16'01.0" 78°24'16.0" 25 I 6.4 1.98 1.98 Top Soil
II 20 2.35 4.33 Weathered Basalt
III 175 17.8 22.13 Masive Basalt
IV 6 24.8 46.93 Fractured Basalt
V 2455 Masive Basalt
16 Datewadi 1 km East of the Village
21°20'54.2" 78°24'47.5" 26 I 41 1.4 1.4 Top Soil
II 21 2.5 3.9 Weathered Basalt
III 16 15 18.9
IV 185 73.9 92.8 Masive Basalt
V 11 Fractured Basalt
17 Wadhona 1 km S of the Village on Ramthi Road
21°18'42.6" 78°21'57.3" 27 I 70 0.6 0.6 Top Soil
II 175 7.4 8 Masive Basalt
III 421 4.5 12.5
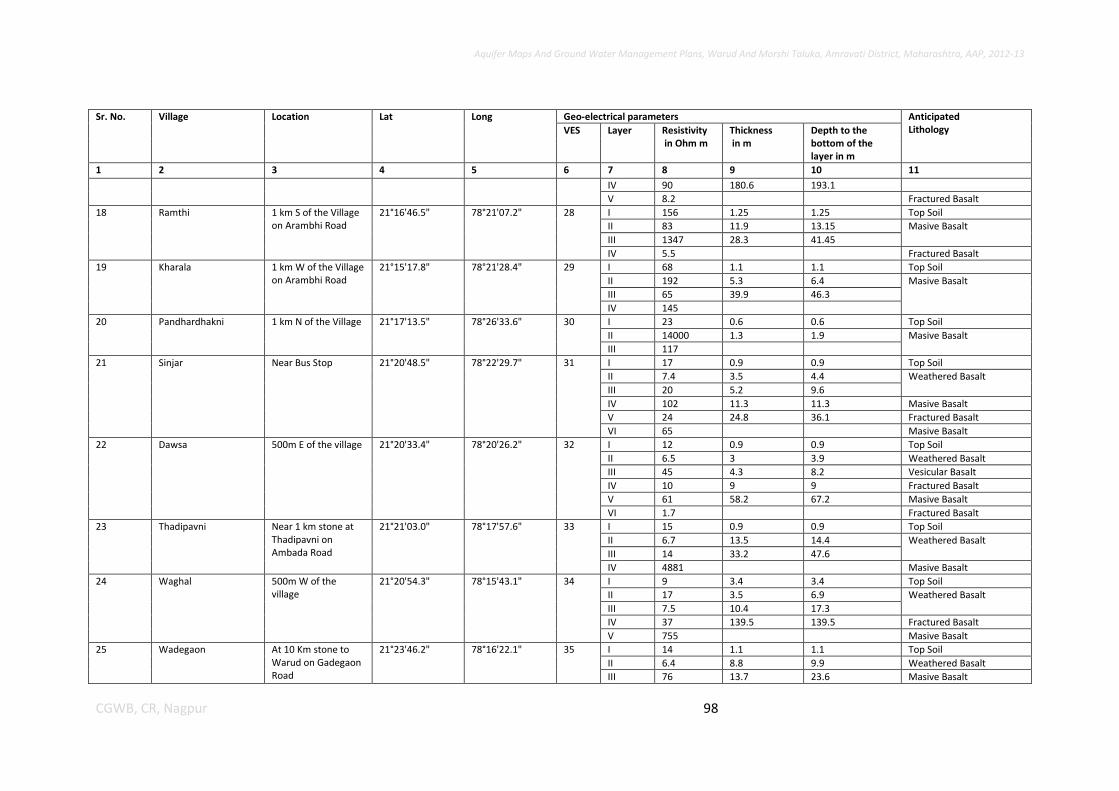
Aquifer Maps And Ground Water Management Plans, Warud And Morshi Taluka, Amravati District, Maharashtra, AAP, 2012-13
98 CGWB, CR, Nagpur
Sr. No. Village Location Lat Long Geo-electrical parameters Anticipated Lithology VES Layer Resistivity
in Ohm m Thickness in m
Depth to the bottom of the layer in m
1 2 3 4 5 6 7 8 9 10 11
IV 90 180.6 193.1
V 8.2 Fractured Basalt
18 Ramthi 1 km S of the Village on Arambhi Road
21°16'46.5" 78°21'07.2" 28 I 156 1.25 1.25 Top Soil
II 83 11.9 13.15 Masive Basalt
III 1347 28.3 41.45
IV 5.5 Fractured Basalt
19 Kharala 1 km W of the Village on Arambhi Road
21°15'17.8" 78°21'28.4" 29 I 68 1.1 1.1 Top Soil
II 192 5.3 6.4 Masive Basalt
III 65 39.9 46.3
IV 145
20 Pandhardhakni 1 km N of the Village 21°17'13.5" 78°26'33.6" 30 I 23 0.6 0.6 Top Soil
II 14000 1.3 1.9 Masive Basalt
III 117
21 Sinjar Near Bus Stop 21°20'48.5" 78°22'29.7" 31 I 17 0.9 0.9 Top Soil
II 7.4 3.5 4.4 Weathered Basalt
III 20 5.2 9.6
IV 102 11.3 11.3 Masive Basalt
V 24 24.8 36.1 Fractured Basalt
VI 65 Masive Basalt
22 Dawsa 500m E of the village 21°20'33.4" 78°20'26.2" 32 I 12 0.9 0.9 Top Soil
II 6.5 3 3.9 Weathered Basalt
III 45 4.3 8.2 Vesicular Basalt
IV 10 9 9 Fractured Basalt
V 61 58.2 67.2 Masive Basalt
VI 1.7 Fractured Basalt
23 Thadipavni Near 1 km stone at Thadipavni on Ambada Road
21°21'03.0" 78°17'57.6" 33 I 15 0.9 0.9 Top Soil
II 6.7 13.5 14.4 Weathered Basalt
III 14 33.2 47.6
IV 4881 Masive Basalt
24 Waghal 500m W of the village
21°20'54.3" 78°15'43.1" 34 I 9 3.4 3.4 Top Soil
II 17 3.5 6.9 Weathered Basalt
III 7.5 10.4 17.3
IV 37 139.5 139.5 Fractured Basalt
V 755 Masive Basalt
25 Wadegaon At 10 Km stone to Warud on Gadegaon Road
21°23'46.2" 78°16'22.1" 35 I 14 1.1 1.1 Top Soil
II 6.4 8.8 9.9 Weathered Basalt
III 76 13.7 23.6 Masive Basalt
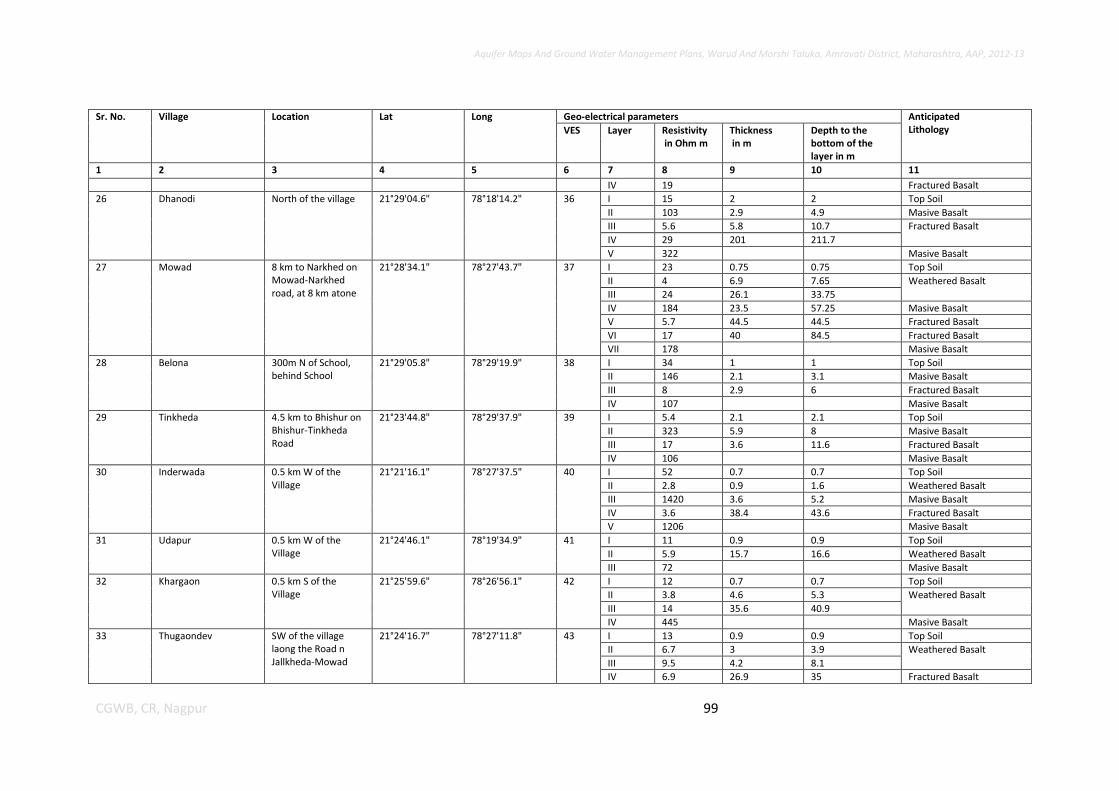
Aquifer Maps And Ground Water Management Plans, Warud And Morshi Taluka, Amravati District, Maharashtra, AAP, 2012-13
99 CGWB, CR, Nagpur
Sr. No. Village Location Lat Long Geo-electrical parameters Anticipated Lithology VES Layer Resistivity
in Ohm m Thickness in m
Depth to the bottom of the layer in m
1 2 3 4 5 6 7 8 9 10 11
IV 19 Fractured Basalt
26 Dhanodi North of the village 21°29'04.6" 78°18'14.2" 36 I 15 2 2 Top Soil
II 103 2.9 4.9 Masive Basalt
III 5.6 5.8 10.7 Fractured Basalt
IV 29 201 211.7
V 322 Masive Basalt
27 Mowad 8 km to Narkhed on Mowad-Narkhed road, at 8 km atone
21°28'34.1" 78°27'43.7" 37 I 23 0.75 0.75 Top Soil
II 4 6.9 7.65 Weathered Basalt
III 24 26.1 33.75
IV 184 23.5 57.25 Masive Basalt
V 5.7 44.5 44.5 Fractured Basalt
VI 17 40 84.5 Fractured Basalt
VII 178 Masive Basalt
28 Belona 300m N of School, behind School
21°29'05.8" 78°29'19.9" 38 I 34 1 1 Top Soil
II 146 2.1 3.1 Masive Basalt
III 8 2.9 6 Fractured Basalt
IV 107 Masive Basalt
29 Tinkheda 4.5 km to Bhishur on Bhishur-Tinkheda Road
21°23'44.8" 78°29'37.9" 39 I 5.4 2.1 2.1 Top Soil
II 323 5.9 8 Masive Basalt
III 17 3.6 11.6 Fractured Basalt
IV 106 Masive Basalt
30 Inderwada 0.5 km W of the Village
21°21'16.1" 78°27'37.5" 40 I 52 0.7 0.7 Top Soil
II 2.8 0.9 1.6 Weathered Basalt
III 1420 3.6 5.2 Masive Basalt
IV 3.6 38.4 43.6 Fractured Basalt
V 1206 Masive Basalt
31 Udapur 0.5 km W of the Village
21°24'46.1" 78°19'34.9" 41 I 11 0.9 0.9 Top Soil
II 5.9 15.7 16.6 Weathered Basalt
III 72 Masive Basalt
32 Khargaon 0.5 km S of the Village
21°25'59.6" 78°26'56.1" 42 I 12 0.7 0.7 Top Soil
II 3.8 4.6 5.3 Weathered Basalt
III 14 35.6 40.9
IV 445 Masive Basalt
33 Thugaondev SW of the village laong the Road n Jallkheda-Mowad
21°24'16.7" 78°27'11.8" 43 I 13 0.9 0.9 Top Soil
II 6.7 3 3.9 Weathered Basalt
III 9.5 4.2 8.1
IV 6.9 26.9 35 Fractured Basalt
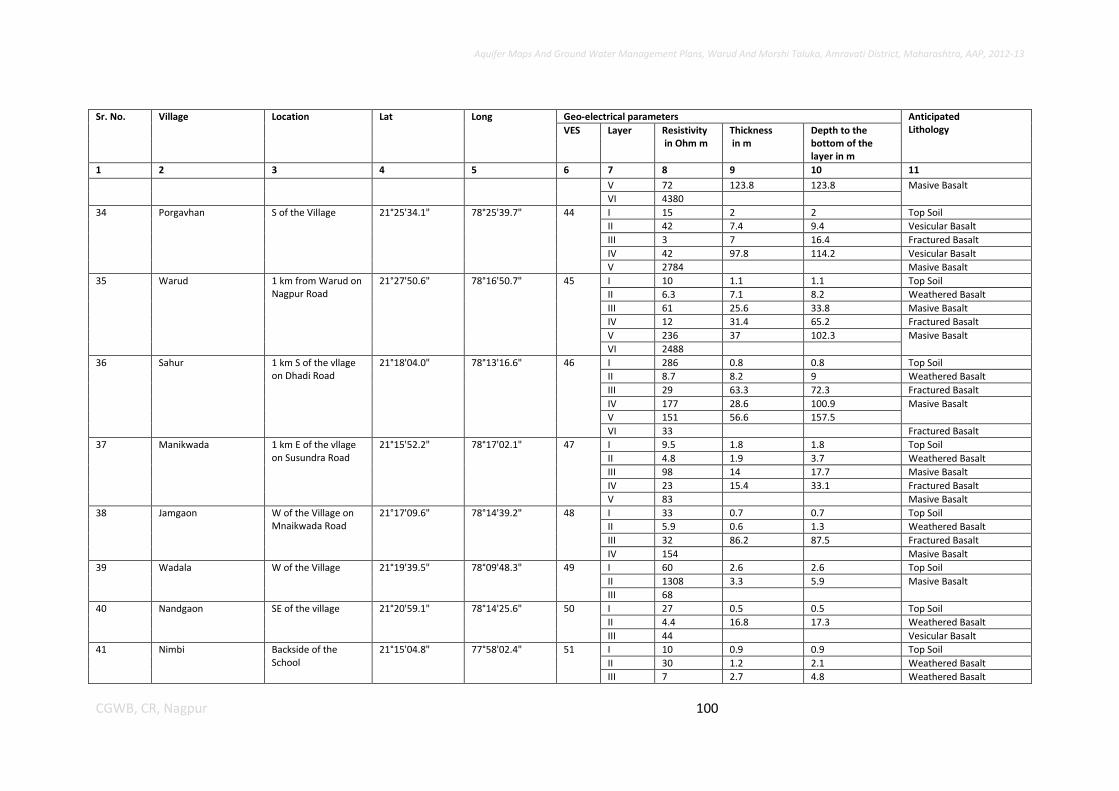
Aquifer Maps And Ground Water Management Plans, Warud And Morshi Taluka, Amravati District, Maharashtra, AAP, 2012-13
100 CGWB, CR, Nagpur
Sr. No. Village Location Lat Long Geo-electrical parameters Anticipated Lithology VES Layer Resistivity
in Ohm m Thickness in m
Depth to the bottom of the layer in m
1 2 3 4 5 6 7 8 9 10 11
V 72 123.8 123.8 Masive Basalt
VI 4380
34 Porgavhan S of the Village 21°25'34.1" 78°25'39.7" 44 I 15 2 2 Top Soil
II 42 7.4 9.4 Vesicular Basalt
III 3 7 16.4 Fractured Basalt
IV 42 97.8 114.2 Vesicular Basalt
V 2784 Masive Basalt
35 Warud 1 km from Warud on Nagpur Road
21°27'50.6" 78°16'50.7" 45 I 10 1.1 1.1 Top Soil
II 6.3 7.1 8.2 Weathered Basalt
III 61 25.6 33.8 Masive Basalt
IV 12 31.4 65.2 Fractured Basalt
V 236 37 102.3 Masive Basalt
VI 2488
36 Sahur 1 km S of the vllage on Dhadi Road
21°18'04.0" 78°13'16.6" 46 I 286 0.8 0.8 Top Soil
II 8.7 8.2 9 Weathered Basalt
III 29 63.3 72.3 Fractured Basalt
IV 177 28.6 100.9 Masive Basalt
V 151 56.6 157.5
VI 33 Fractured Basalt
37 Manikwada 1 km E of the vllage on Susundra Road
21°15'52.2" 78°17'02.1" 47 I 9.5 1.8 1.8 Top Soil
II 4.8 1.9 3.7 Weathered Basalt
III 98 14 17.7 Masive Basalt
IV 23 15.4 33.1 Fractured Basalt
V 83 Masive Basalt
38 Jamgaon W of the Village on Mnaikwada Road
21°17'09.6" 78°14'39.2" 48 I 33 0.7 0.7 Top Soil
II 5.9 0.6 1.3 Weathered Basalt
III 32 86.2 87.5 Fractured Basalt
IV 154 Masive Basalt
39 Wadala W of the Village 21°19'39.5" 78°09'48.3" 49 I 60 2.6 2.6 Top Soil
II 1308 3.3 5.9 Masive Basalt
III 68
40 Nandgaon SE of the village 21°20'59.1" 78°14'25.6" 50 I 27 0.5 0.5 Top Soil
II 4.4 16.8 17.3 Weathered Basalt
III 44 Vesicular Basalt
41 Nimbi Backside of the School
21°15'04.8" 77°58'02.4" 51 I 10 0.9 0.9 Top Soil
II 30 1.2 2.1 Weathered Basalt
III 7 2.7 4.8 Weathered Basalt
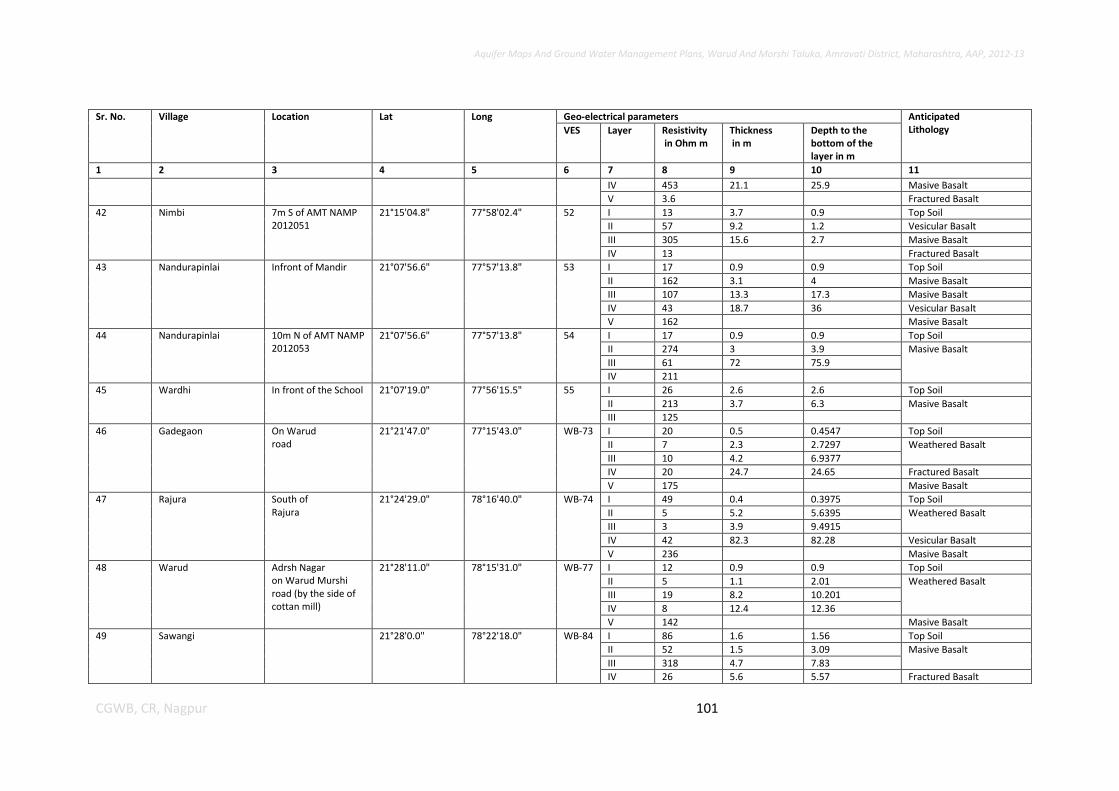
Aquifer Maps And Ground Water Management Plans, Warud And Morshi Taluka, Amravati District, Maharashtra, AAP, 2012-13
101 CGWB, CR, Nagpur
Sr. No. Village Location Lat Long Geo-electrical parameters Anticipated Lithology VES Layer Resistivity
in Ohm m Thickness in m
Depth to the bottom of the layer in m
1 2 3 4 5 6 7 8 9 10 11
IV 453 21.1 25.9 Masive Basalt
V 3.6 Fractured Basalt
42 Nimbi 7m S of AMT NAMP 2012051
21°15'04.8" 77°58'02.4" 52 I 13 3.7 0.9 Top Soil
II 57 9.2 1.2 Vesicular Basalt
III 305 15.6 2.7 Masive Basalt
IV 13 Fractured Basalt
43 Nandurapinlai Infront of Mandir 21°07'56.6" 77°57'13.8" 53 I 17 0.9 0.9 Top Soil
II 162 3.1 4 Masive Basalt
III 107 13.3 17.3 Masive Basalt
IV 43 18.7 36 Vesicular Basalt
V 162 Masive Basalt
44 Nandurapinlai 10m N of AMT NAMP 2012053
21°07'56.6" 77°57'13.8" 54 I 17 0.9 0.9 Top Soil
II 274 3 3.9 Masive Basalt
III 61 72 75.9
IV 211
45 Wardhi In front of the School 21°07'19.0" 77°56'15.5" 55 I 26 2.6 2.6 Top Soil
II 213 3.7 6.3 Masive Basalt
III 125
46 Gadegaon On Warud road
21°21'47.0" 77°15'43.0" WB-73 I 20 0.5 0.4547 Top Soil
II 7 2.3 2.7297 Weathered Basalt
III 10 4.2 6.9377
IV 20 24.7 24.65 Fractured Basalt
V 175 Masive Basalt
47 Rajura South of Rajura
21°24'29.0" 78°16'40.0" WB-74 I 49 0.4 0.3975 Top Soil
II 5 5.2 5.6395 Weathered Basalt
III 3 3.9 9.4915
IV 42 82.3 82.28 Vesicular Basalt
V 236 Masive Basalt
48 Warud Adrsh Nagar on Warud Murshi road (by the side of cottan mill)
21°28'11.0" 78°15'31.0" WB-77 I 12 0.9 0.9 Top Soil
II 5 1.1 2.01 Weathered Basalt
III 19 8.2 10.201
IV 8 12.4 12.36
V 142 Masive Basalt
49 Sawangi 21°28'0.0" 78°22'18.0" WB-84 I 86 1.6 1.56 Top Soil
II 52 1.5 3.09 Masive Basalt
III 318 4.7 7.83
IV 26 5.6 5.57 Fractured Basalt
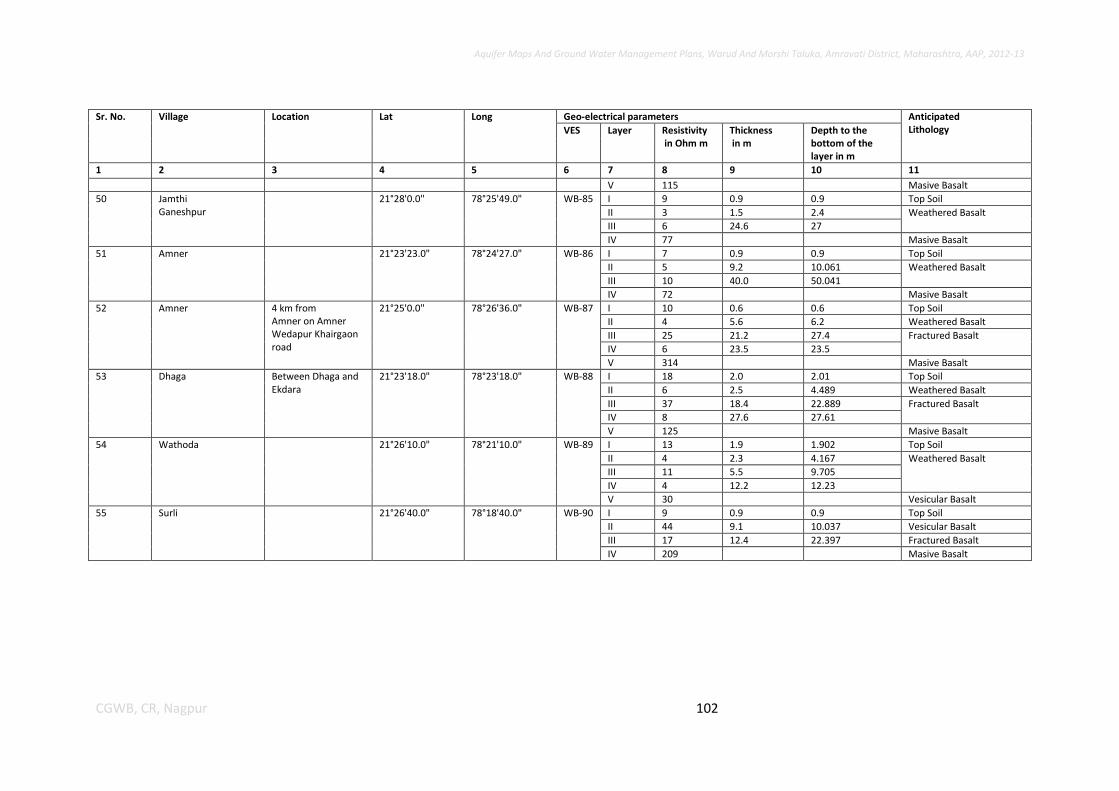
Aquifer Maps And Ground Water Management Plans, Warud And Morshi Taluka, Amravati District, Maharashtra, AAP, 2012-13
102 CGWB, CR, Nagpur
Sr. No. Village Location Lat Long Geo-electrical parameters Anticipated Lithology VES Layer Resistivity
in Ohm m Thickness in m
Depth to the bottom of the layer in m
1 2 3 4 5 6 7 8 9 10 11
V 115 Masive Basalt
50 Jamthi Ganeshpur
21°28'0.0" 78°25'49.0" WB-85 I 9 0.9 0.9 Top Soil
II 3 1.5 2.4 Weathered Basalt
III 6 24.6 27
IV 77 Masive Basalt
51 Amner 21°23'23.0" 78°24'27.0" WB-86 I 7 0.9 0.9 Top Soil
II 5 9.2 10.061 Weathered Basalt
III 10 40.0 50.041
IV 72 Masive Basalt
52 Amner 4 km from Amner on Amner Wedapur Khairgaon road
21°25'0.0" 78°26'36.0" WB-87 I 10 0.6 0.6 Top Soil
II 4 5.6 6.2 Weathered Basalt
III 25 21.2 27.4 Fractured Basalt
IV 6 23.5 23.5
V 314 Masive Basalt
53 Dhaga Between Dhaga and Ekdara
21°23'18.0" 78°23'18.0" WB-88 I 18 2.0 2.01 Top Soil
II 6 2.5 4.489 Weathered Basalt
III 37 18.4 22.889 Fractured Basalt
IV 8 27.6 27.61
V 125 Masive Basalt
54 Wathoda 21°26'10.0" 78°21'10.0" WB-89 I 13 1.9 1.902 Top Soil
II 4 2.3 4.167 Weathered Basalt
III 11 5.5 9.705
IV 4 12.2 12.23
V 30 Vesicular Basalt
55 Surli 21°26'40.0" 78°18'40.0" WB-90 I 9 0.9 0.9 Top Soil
II 44 9.1 10.037 Vesicular Basalt
III 17 12.4 22.397 Fractured Basalt
IV 209 Masive Basalt
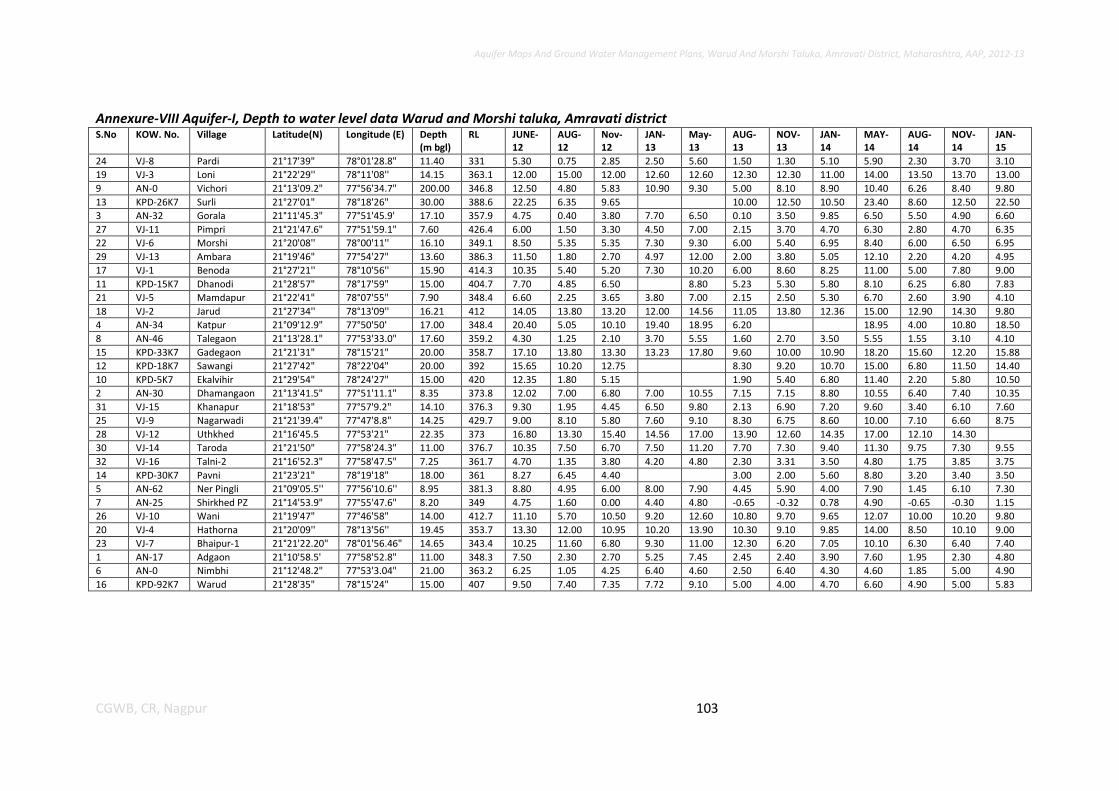
Aquifer Maps And Ground Water Management Plans, Warud And Morshi Taluka, Amravati District, Maharashtra, AAP, 2012-13
103 CGWB, CR, Nagpur
Annexure-VIII Aquifer-I, Depth to water level data Warud and Morshi taluka, Amravati district S.No KOW. No. Village Latitude(N) Longitude (E) Depth
(m bgl) RL JUNE-
12 AUG-12
Nov-12
JAN-13
May-13
AUG-13
NOV-13
JAN-14
MAY-14
AUG-14
NOV-14
JAN-15
24 VJ-8 Pardi 21°17'39" 78°01'28.8" 11.40 331 5.30 0.75 2.85 2.50 5.60 1.50 1.30 5.10 5.90 2.30 3.70 3.10
19 VJ-3 Loni 21°22'29'' 78°11'08'' 14.15 363.1 12.00 15.00 12.00 12.60 12.60 12.30 12.30 11.00 14.00 13.50 13.70 13.00
9 AN-0 Vichori 21°13'09.2" 77°56'34.7" 200.00 346.8 12.50 4.80 5.83 10.90 9.30 5.00 8.10 8.90 10.40 6.26 8.40 9.80
13 KPD-26K7 Surli 21°27'01" 78°18'26" 30.00 388.6 22.25 6.35 9.65 10.00 12.50 10.50 23.40 8.60 12.50 22.50
3 AN-32 Gorala 21°11'45.3" 77°51'45.9' 17.10 357.9 4.75 0.40 3.80 7.70 6.50 0.10 3.50 9.85 6.50 5.50 4.90 6.60
27 VJ-11 Pimpri 21°21'47.6" 77°51'59.1" 7.60 426.4 6.00 1.50 3.30 4.50 7.00 2.15 3.70 4.70 6.30 2.80 4.70 6.35
22 VJ-6 Morshi 21°20'08'' 78°00'11'' 16.10 349.1 8.50 5.35 5.35 7.30 9.30 6.00 5.40 6.95 8.40 6.00 6.50 6.95
29 VJ-13 Ambara 21°19'46" 77°54'27" 13.60 386.3 11.50 1.80 2.70 4.97 12.00 2.00 3.80 5.05 12.10 2.20 4.20 4.95
17 VJ-1 Benoda 21°27'21'' 78°10'56'' 15.90 414.3 10.35 5.40 5.20 7.30 10.20 6.00 8.60 8.25 11.00 5.00 7.80 9.00
11 KPD-15K7 Dhanodi 21°28'57" 78°17'59" 15.00 404.7 7.70 4.85 6.50 8.80 5.23 5.30 5.80 8.10 6.25 6.80 7.83
21 VJ-5 Mamdapur 21°22'41" 78°07'55" 7.90 348.4 6.60 2.25 3.65 3.80 7.00 2.15 2.50 5.30 6.70 2.60 3.90 4.10
18 VJ-2 Jarud 21°27'34'' 78°13'09'' 16.21 412 14.05 13.80 13.20 12.00 14.56 11.05 13.80 12.36 15.00 12.90 14.30 9.80
4 AN-34 Katpur 21°09'12.9" 77°50'50' 17.00 348.4 20.40 5.05 10.10 19.40 18.95 6.20 18.95 4.00 10.80 18.50
8 AN-46 Talegaon 21°13'28.1" 77°53'33.0" 17.60 359.2 4.30 1.25 2.10 3.70 5.55 1.60 2.70 3.50 5.55 1.55 3.10 4.10
15 KPD-33K7 Gadegaon 21°21'31" 78°15'21" 20.00 358.7 17.10 13.80 13.30 13.23 17.80 9.60 10.00 10.90 18.20 15.60 12.20 15.88
12 KPD-18K7 Sawangi 21°27'42" 78°22'04" 20.00 392 15.65 10.20 12.75 8.30 9.20 10.70 15.00 6.80 11.50 14.40
10 KPD-5K7 Ekalvihir 21°29'54" 78°24'27" 15.00 420 12.35 1.80 5.15 1.90 5.40 6.80 11.40 2.20 5.80 10.50
2 AN-30 Dhamangaon 21°13'41.5" 77°51'11.1" 8.35 373.8 12.02 7.00 6.80 7.00 10.55 7.15 7.15 8.80 10.55 6.40 7.40 10.35
31 VJ-15 Khanapur 21°18'53" 77°57'9.2" 14.10 376.3 9.30 1.95 4.45 6.50 9.80 2.13 6.90 7.20 9.60 3.40 6.10 7.60
25 VJ-9 Nagarwadi 21°21'39.4" 77°47'8.8" 14.25 429.7 9.00 8.10 5.80 7.60 9.10 8.30 6.75 8.60 10.00 7.10 6.60 8.75
28 VJ-12 Uthkhed 21°16'45.5 77°53'21" 22.35 373 16.80 13.30 15.40 14.56 17.00 13.90 12.60 14.35 17.00 12.10 14.30
30 VJ-14 Taroda 21°21'50" 77°58'24.3" 11.00 376.7 10.35 7.50 6.70 7.50 11.20 7.70 7.30 9.40 11.30 9.75 7.30 9.55
32 VJ-16 Talni-2 21°16'52.3" 77°58'47.5" 7.25 361.7 4.70 1.35 3.80 4.20 4.80 2.30 3.31 3.50 4.80 1.75 3.85 3.75
14 KPD-30K7 Pavni 21°23'21" 78°19'18" 18.00 361 8.27 6.45 4.40 3.00 2.00 5.60 8.80 3.20 3.40 3.50
5 AN-62 Ner Pingli 21°09'05.5'' 77°56'10.6'' 8.95 381.3 8.80 4.95 6.00 8.00 7.90 4.45 5.90 4.00 7.90 1.45 6.10 7.30
7 AN-25 Shirkhed PZ 21°14'53.9" 77°55'47.6" 8.20 349 4.75 1.60 0.00 4.40 4.80 -0.65 -0.32 0.78 4.90 -0.65 -0.30 1.15
26 VJ-10 Wani 21°19'47" 77°46'58" 14.00 412.7 11.10 5.70 10.50 9.20 12.60 10.80 9.70 9.65 12.07 10.00 10.20 9.80
20 VJ-4 Hathorna 21°20'09'' 78°13'56'' 19.45 353.7 13.30 12.00 10.95 10.20 13.90 10.30 9.10 9.85 14.00 8.50 10.10 9.00
23 VJ-7 Bhaipur-1 21°21'22.20" 78°01'56.46" 14.65 343.4 10.25 11.60 6.80 9.30 11.00 12.30 6.20 7.05 10.10 6.30 6.40 7.40
1 AN-17 Adgaon 21°10'58.5' 77°58'52.8" 11.00 348.3 7.50 2.30 2.70 5.25 7.45 2.45 2.40 3.90 7.60 1.95 2.30 4.80
6 AN-0 Nimbhi 21°12'48.2" 77°53'3.04" 21.00 363.2 6.25 1.05 4.25 6.40 4.60 2.50 6.40 4.30 4.60 1.85 5.00 4.90
16 KPD-92K7 Warud 21°28'35" 78°15'24" 15.00 407 9.50 7.40 7.35 7.72 9.10 5.00 4.00 4.70 6.60 4.90 5.00 5.83
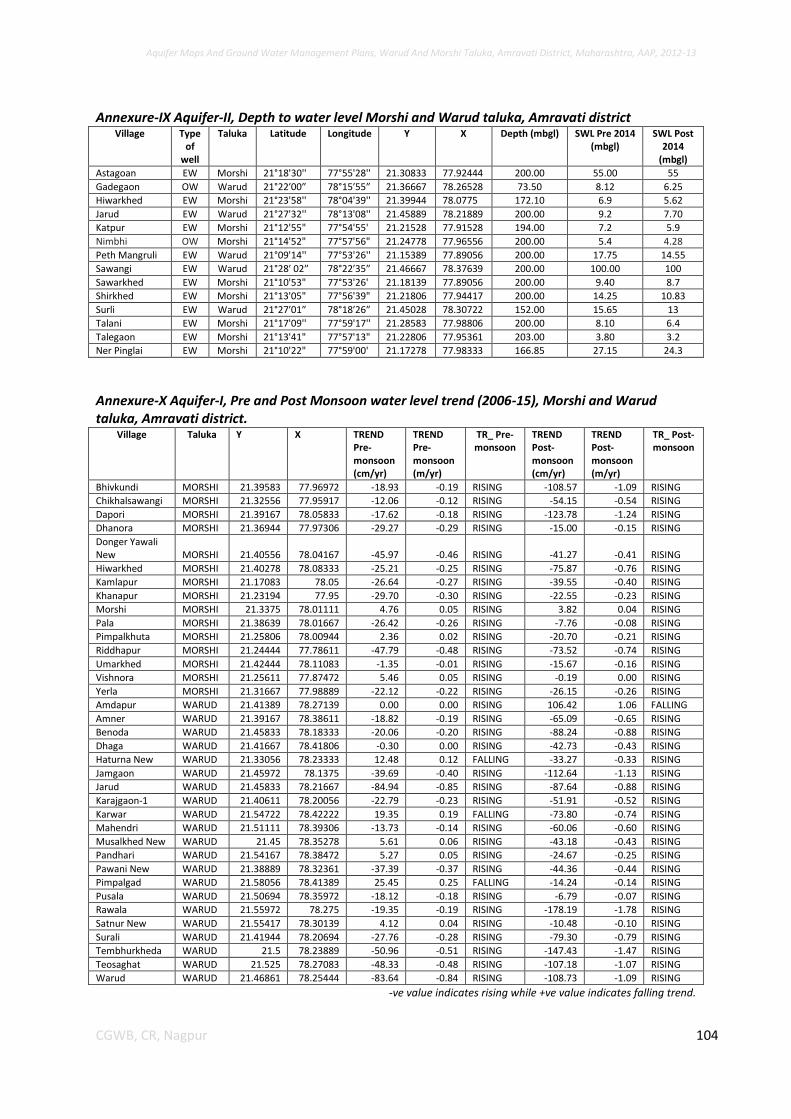
Aquifer Maps And Ground Water Management Plans, Warud And Morshi Taluka, Amravati District, Maharashtra, AAP, 2012-13
104 CGWB, CR, Nagpur
Annexure-IX Aquifer-II, Depth to water level Morshi and Warud taluka, Amravati district Village Type
of well
Taluka Latitude Longitude Y X Depth (mbgl) SWL Pre 2014 (mbgl)
SWL Post 2014
(mbgl)
Astagoan EW Morshi 21°18'30'' 77°55'28'' 21.30833 77.92444 200.00 55.00 55
Gadegaon OW Warud 21°22′00″ 78°15′55″ 21.36667 78.26528 73.50 8.12 6.25
Hiwarkhed EW Morshi 21°23'58'' 78°04'39'' 21.39944 78.0775 172.10 6.9 5.62
Jarud EW Warud 21°27'32'' 78°13'08'' 21.45889 78.21889 200.00 9.2 7.70
Katpur EW Morshi 21°12'55" 77°54'55' 21.21528 77.91528 194.00 7.2 5.9
Nimbhi OW Morshi 21°14'52" 77°57'56" 21.24778 77.96556 200.00 5.4 4.28
Peth Mangruli EW Warud 21°09'14'' 77°53'26'' 21.15389 77.89056 200.00 17.75 14.55
Sawangi EW Warud 21°28′ 02″ 78°22′35″ 21.46667 78.37639 200.00 100.00 100
Sawarkhed EW Morshi 21°10'53" 77°53'26' 21.18139 77.89056 200.00 9.40 8.7
Shirkhed EW Morshi 21°13'05" 77°56'39" 21.21806 77.94417 200.00 14.25 10.83
Surli EW Warud 21°27′01″ 78°18′26″ 21.45028 78.30722 152.00 15.65 13
Talani EW Morshi 21°17'09'' 77°59'17'' 21.28583 77.98806 200.00 8.10 6.4
Talegaon EW Morshi 21°13'41" 77°57'13" 21.22806 77.95361 203.00 3.80 3.2
Ner Pinglai EW Morshi 21°10'22" 77°59'00' 21.17278 77.98333 166.85 27.15 24.3
Annexure-X Aquifer-I, Pre and Post Monsoon water level trend (2006-15), Morshi and Warud taluka, Amravati district.
Village Taluka Y X TREND Pre-monsoon (cm/yr)
TREND Pre-monsoon (m/yr)
TR_ Pre-monsoon
TREND Post-monsoon (cm/yr)
TREND Post-monsoon (m/yr)
TR_ Post-monsoon
Bhivkundi MORSHI 21.39583 77.96972 -18.93 -0.19 RISING -108.57 -1.09 RISING
Chikhalsawangi MORSHI 21.32556 77.95917 -12.06 -0.12 RISING -54.15 -0.54 RISING
Dapori MORSHI 21.39167 78.05833 -17.62 -0.18 RISING -123.78 -1.24 RISING
Dhanora MORSHI 21.36944 77.97306 -29.27 -0.29 RISING -15.00 -0.15 RISING
Donger Yawali New MORSHI 21.40556 78.04167 -45.97 -0.46 RISING -41.27 -0.41 RISING
Hiwarkhed MORSHI 21.40278 78.08333 -25.21 -0.25 RISING -75.87 -0.76 RISING
Kamlapur MORSHI 21.17083 78.05 -26.64 -0.27 RISING -39.55 -0.40 RISING
Khanapur MORSHI 21.23194 77.95 -29.70 -0.30 RISING -22.55 -0.23 RISING
Morshi MORSHI 21.3375 78.01111 4.76 0.05 RISING 3.82 0.04 RISING
Pala MORSHI 21.38639 78.01667 -26.42 -0.26 RISING -7.76 -0.08 RISING
Pimpalkhuta MORSHI 21.25806 78.00944 2.36 0.02 RISING -20.70 -0.21 RISING
Riddhapur MORSHI 21.24444 77.78611 -47.79 -0.48 RISING -73.52 -0.74 RISING
Umarkhed MORSHI 21.42444 78.11083 -1.35 -0.01 RISING -15.67 -0.16 RISING
Vishnora MORSHI 21.25611 77.87472 5.46 0.05 RISING -0.19 0.00 RISING
Yerla MORSHI 21.31667 77.98889 -22.12 -0.22 RISING -26.15 -0.26 RISING
Amdapur WARUD 21.41389 78.27139 0.00 0.00 RISING 106.42 1.06 FALLING
Amner WARUD 21.39167 78.38611 -18.82 -0.19 RISING -65.09 -0.65 RISING
Benoda WARUD 21.45833 78.18333 -20.06 -0.20 RISING -88.24 -0.88 RISING
Dhaga WARUD 21.41667 78.41806 -0.30 0.00 RISING -42.73 -0.43 RISING
Haturna New WARUD 21.33056 78.23333 12.48 0.12 FALLING -33.27 -0.33 RISING
Jamgaon WARUD 21.45972 78.1375 -39.69 -0.40 RISING -112.64 -1.13 RISING
Jarud WARUD 21.45833 78.21667 -84.94 -0.85 RISING -87.64 -0.88 RISING
Karajgaon-1 WARUD 21.40611 78.20056 -22.79 -0.23 RISING -51.91 -0.52 RISING
Karwar WARUD 21.54722 78.42222 19.35 0.19 FALLING -73.80 -0.74 RISING
Mahendri WARUD 21.51111 78.39306 -13.73 -0.14 RISING -60.06 -0.60 RISING
Musalkhed New WARUD 21.45 78.35278 5.61 0.06 RISING -43.18 -0.43 RISING
Pandhari WARUD 21.54167 78.38472 5.27 0.05 RISING -24.67 -0.25 RISING
Pawani New WARUD 21.38889 78.32361 -37.39 -0.37 RISING -44.36 -0.44 RISING
Pimpalgad WARUD 21.58056 78.41389 25.45 0.25 FALLING -14.24 -0.14 RISING
Pusala WARUD 21.50694 78.35972 -18.12 -0.18 RISING -6.79 -0.07 RISING
Rawala WARUD 21.55972 78.275 -19.35 -0.19 RISING -178.19 -1.78 RISING
Satnur New WARUD 21.55417 78.30139 4.12 0.04 RISING -10.48 -0.10 RISING
Surali WARUD 21.41944 78.20694 -27.76 -0.28 RISING -79.30 -0.79 RISING
Tembhurkheda WARUD 21.5 78.23889 -50.96 -0.51 RISING -147.43 -1.47 RISING
Teosaghat WARUD 21.525 78.27083 -48.33 -0.48 RISING -107.18 -1.07 RISING
Warud WARUD 21.46861 78.25444 -83.64 -0.84 RISING -108.73 -1.09 RISING
-ve value indicates rising while +ve value indicates falling trend.
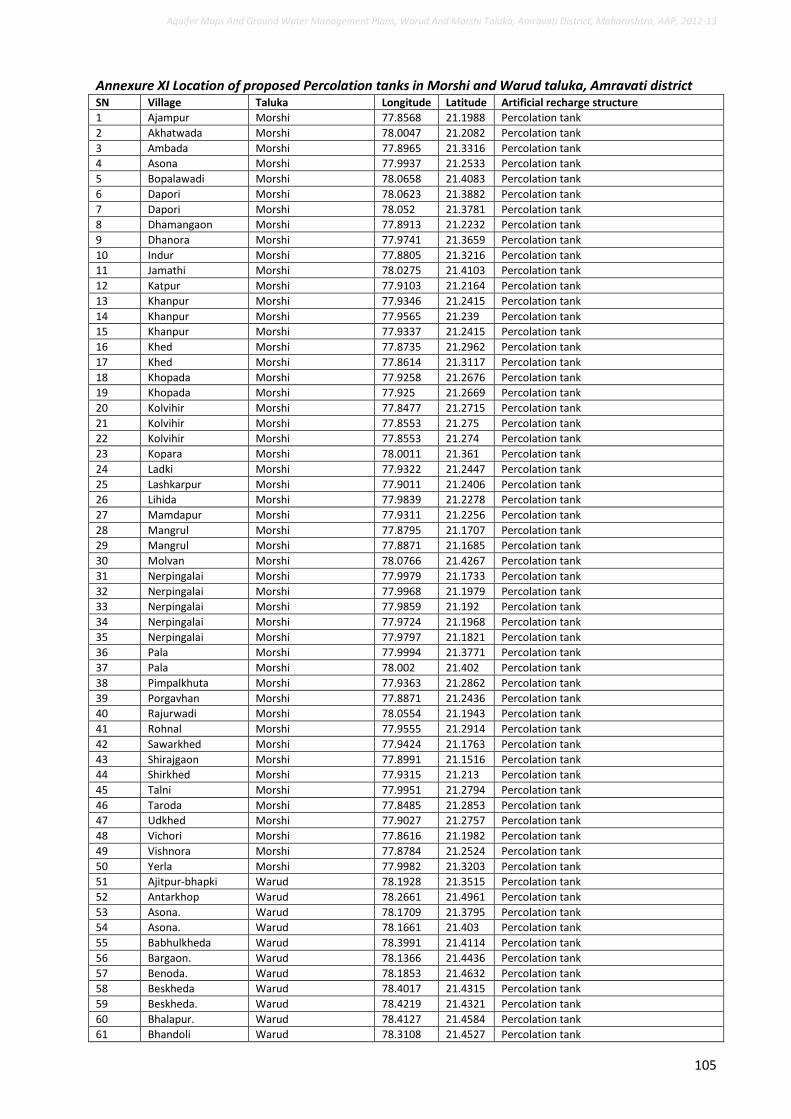
Aquifer Maps And Ground Water Management Plans, Warud And Morshi Taluka, Amravati District, Maharashtra, AAP, 2012-13
105
Annexure XI Location of proposed Percolation tanks in Morshi and Warud taluka, Amravati district SN Village Taluka Longitude Latitude Artificial recharge structure
1 Ajampur Morshi 77.8568 21.1988 Percolation tank
2 Akhatwada Morshi 78.0047 21.2082 Percolation tank
3 Ambada Morshi 77.8965 21.3316 Percolation tank
4 Asona Morshi 77.9937 21.2533 Percolation tank
5 Bopalawadi Morshi 78.0658 21.4083 Percolation tank
6 Dapori Morshi 78.0623 21.3882 Percolation tank
7 Dapori Morshi 78.052 21.3781 Percolation tank
8 Dhamangaon Morshi 77.8913 21.2232 Percolation tank
9 Dhanora Morshi 77.9741 21.3659 Percolation tank
10 Indur Morshi 77.8805 21.3216 Percolation tank
11 Jamathi Morshi 78.0275 21.4103 Percolation tank
12 Katpur Morshi 77.9103 21.2164 Percolation tank
13 Khanpur Morshi 77.9346 21.2415 Percolation tank
14 Khanpur Morshi 77.9565 21.239 Percolation tank
15 Khanpur Morshi 77.9337 21.2415 Percolation tank
16 Khed Morshi 77.8735 21.2962 Percolation tank
17 Khed Morshi 77.8614 21.3117 Percolation tank
18 Khopada Morshi 77.9258 21.2676 Percolation tank
19 Khopada Morshi 77.925 21.2669 Percolation tank
20 Kolvihir Morshi 77.8477 21.2715 Percolation tank
21 Kolvihir Morshi 77.8553 21.275 Percolation tank
22 Kolvihir Morshi 77.8553 21.274 Percolation tank
23 Kopara Morshi 78.0011 21.361 Percolation tank
24 Ladki Morshi 77.9322 21.2447 Percolation tank
25 Lashkarpur Morshi 77.9011 21.2406 Percolation tank
26 Lihida Morshi 77.9839 21.2278 Percolation tank
27 Mamdapur Morshi 77.9311 21.2256 Percolation tank
28 Mangrul Morshi 77.8795 21.1707 Percolation tank
29 Mangrul Morshi 77.8871 21.1685 Percolation tank
30 Molvan Morshi 78.0766 21.4267 Percolation tank
31 Nerpingalai Morshi 77.9979 21.1733 Percolation tank
32 Nerpingalai Morshi 77.9968 21.1979 Percolation tank
33 Nerpingalai Morshi 77.9859 21.192 Percolation tank
34 Nerpingalai Morshi 77.9724 21.1968 Percolation tank
35 Nerpingalai Morshi 77.9797 21.1821 Percolation tank
36 Pala Morshi 77.9994 21.3771 Percolation tank
37 Pala Morshi 78.002 21.402 Percolation tank
38 Pimpalkhuta Morshi 77.9363 21.2862 Percolation tank
39 Porgavhan Morshi 77.8871 21.2436 Percolation tank
40 Rajurwadi Morshi 78.0554 21.1943 Percolation tank
41 Rohnal Morshi 77.9555 21.2914 Percolation tank
42 Sawarkhed Morshi 77.9424 21.1763 Percolation tank
43 Shirajgaon Morshi 77.8991 21.1516 Percolation tank
44 Shirkhed Morshi 77.9315 21.213 Percolation tank
45 Talni Morshi 77.9951 21.2794 Percolation tank
46 Taroda Morshi 77.8485 21.2853 Percolation tank
47 Udkhed Morshi 77.9027 21.2757 Percolation tank
48 Vichori Morshi 77.8616 21.1982 Percolation tank
49 Vishnora Morshi 77.8784 21.2524 Percolation tank
50 Yerla Morshi 77.9982 21.3203 Percolation tank
51 Ajitpur-bhapki Warud 78.1928 21.3515 Percolation tank
52 Antarkhop Warud 78.2661 21.4961 Percolation tank
53 Asona. Warud 78.1709 21.3795 Percolation tank
54 Asona. Warud 78.1661 21.403 Percolation tank
55 Babhulkheda Warud 78.3991 21.4114 Percolation tank
56 Bargaon. Warud 78.1366 21.4436 Percolation tank
57 Benoda. Warud 78.1853 21.4632 Percolation tank
58 Beskheda Warud 78.4017 21.4315 Percolation tank
59 Beskheda. Warud 78.4219 21.4321 Percolation tank
60 Bhalapur. Warud 78.4127 21.4584 Percolation tank
61 Bhandoli Warud 78.3108 21.4527 Percolation tank
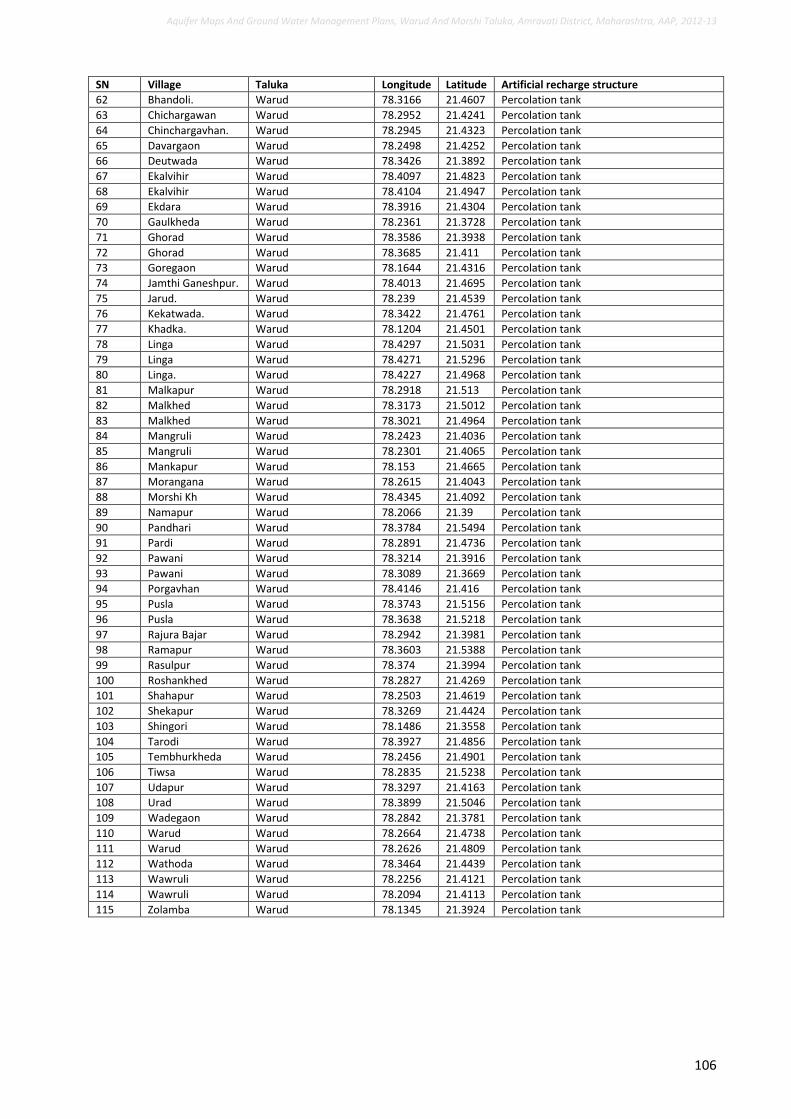
Aquifer Maps And Ground Water Management Plans, Warud And Morshi Taluka, Amravati District, Maharashtra, AAP, 2012-13
106
SN Village Taluka Longitude Latitude Artificial recharge structure
62 Bhandoli. Warud 78.3166 21.4607 Percolation tank
63 Chichargawan Warud 78.2952 21.4241 Percolation tank
64 Chinchargavhan. Warud 78.2945 21.4323 Percolation tank
65 Davargaon Warud 78.2498 21.4252 Percolation tank
66 Deutwada Warud 78.3426 21.3892 Percolation tank
67 Ekalvihir Warud 78.4097 21.4823 Percolation tank
68 Ekalvihir Warud 78.4104 21.4947 Percolation tank
69 Ekdara Warud 78.3916 21.4304 Percolation tank
70 Gaulkheda Warud 78.2361 21.3728 Percolation tank
71 Ghorad Warud 78.3586 21.3938 Percolation tank
72 Ghorad Warud 78.3685 21.411 Percolation tank
73 Goregaon Warud 78.1644 21.4316 Percolation tank
74 Jamthi Ganeshpur. Warud 78.4013 21.4695 Percolation tank
75 Jarud. Warud 78.239 21.4539 Percolation tank
76 Kekatwada. Warud 78.3422 21.4761 Percolation tank
77 Khadka. Warud 78.1204 21.4501 Percolation tank
78 Linga Warud 78.4297 21.5031 Percolation tank
79 Linga Warud 78.4271 21.5296 Percolation tank
80 Linga. Warud 78.4227 21.4968 Percolation tank
81 Malkapur Warud 78.2918 21.513 Percolation tank
82 Malkhed Warud 78.3173 21.5012 Percolation tank
83 Malkhed Warud 78.3021 21.4964 Percolation tank
84 Mangruli Warud 78.2423 21.4036 Percolation tank
85 Mangruli Warud 78.2301 21.4065 Percolation tank
86 Mankapur Warud 78.153 21.4665 Percolation tank
87 Morangana Warud 78.2615 21.4043 Percolation tank
88 Morshi Kh Warud 78.4345 21.4092 Percolation tank
89 Namapur Warud 78.2066 21.39 Percolation tank
90 Pandhari Warud 78.3784 21.5494 Percolation tank
91 Pardi Warud 78.2891 21.4736 Percolation tank
92 Pawani Warud 78.3214 21.3916 Percolation tank
93 Pawani Warud 78.3089 21.3669 Percolation tank
94 Porgavhan Warud 78.4146 21.416 Percolation tank
95 Pusla Warud 78.3743 21.5156 Percolation tank
96 Pusla Warud 78.3638 21.5218 Percolation tank
97 Rajura Bajar Warud 78.2942 21.3981 Percolation tank
98 Ramapur Warud 78.3603 21.5388 Percolation tank
99 Rasulpur Warud 78.374 21.3994 Percolation tank
100 Roshankhed Warud 78.2827 21.4269 Percolation tank
101 Shahapur Warud 78.2503 21.4619 Percolation tank
102 Shekapur Warud 78.3269 21.4424 Percolation tank
103 Shingori Warud 78.1486 21.3558 Percolation tank
104 Tarodi Warud 78.3927 21.4856 Percolation tank
105 Tembhurkheda Warud 78.2456 21.4901 Percolation tank
106 Tiwsa Warud 78.2835 21.5238 Percolation tank
107 Udapur Warud 78.3297 21.4163 Percolation tank
108 Urad Warud 78.3899 21.5046 Percolation tank
109 Wadegaon Warud 78.2842 21.3781 Percolation tank
110 Warud Warud 78.2664 21.4738 Percolation tank
111 Warud Warud 78.2626 21.4809 Percolation tank
112 Wathoda Warud 78.3464 21.4439 Percolation tank
113 Wawruli Warud 78.2256 21.4121 Percolation tank
114 Wawruli Warud 78.2094 21.4113 Percolation tank
115 Zolamba Warud 78.1345 21.3924 Percolation tank
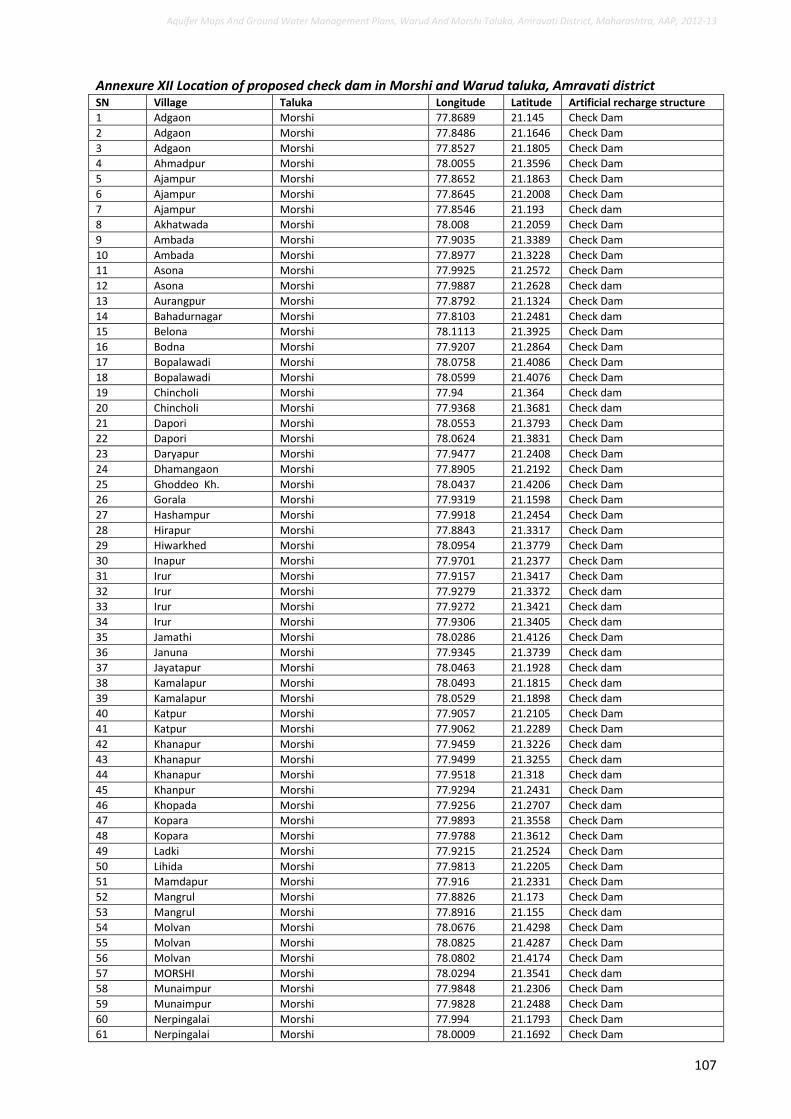
Aquifer Maps And Ground Water Management Plans, Warud And Morshi Taluka, Amravati District, Maharashtra, AAP, 2012-13
107
Annexure XII Location of proposed check dam in Morshi and Warud taluka, Amravati district SN Village Taluka Longitude Latitude Artificial recharge structure
1 Adgaon Morshi 77.8689 21.145 Check Dam
2 Adgaon Morshi 77.8486 21.1646 Check Dam
3 Adgaon Morshi 77.8527 21.1805 Check Dam
4 Ahmadpur Morshi 78.0055 21.3596 Check Dam
5 Ajampur Morshi 77.8652 21.1863 Check Dam
6 Ajampur Morshi 77.8645 21.2008 Check Dam
7 Ajampur Morshi 77.8546 21.193 Check dam
8 Akhatwada Morshi 78.008 21.2059 Check Dam
9 Ambada Morshi 77.9035 21.3389 Check Dam
10 Ambada Morshi 77.8977 21.3228 Check Dam
11 Asona Morshi 77.9925 21.2572 Check Dam
12 Asona Morshi 77.9887 21.2628 Check dam
13 Aurangpur Morshi 77.8792 21.1324 Check Dam
14 Bahadurnagar Morshi 77.8103 21.2481 Check dam
15 Belona Morshi 78.1113 21.3925 Check Dam
16 Bodna Morshi 77.9207 21.2864 Check Dam
17 Bopalawadi Morshi 78.0758 21.4086 Check Dam
18 Bopalawadi Morshi 78.0599 21.4076 Check Dam
19 Chincholi Morshi 77.94 21.364 Check dam
20 Chincholi Morshi 77.9368 21.3681 Check dam
21 Dapori Morshi 78.0553 21.3793 Check Dam
22 Dapori Morshi 78.0624 21.3831 Check Dam
23 Daryapur Morshi 77.9477 21.2408 Check Dam
24 Dhamangaon Morshi 77.8905 21.2192 Check Dam
25 Ghoddeo Kh. Morshi 78.0437 21.4206 Check Dam
26 Gorala Morshi 77.9319 21.1598 Check Dam
27 Hashampur Morshi 77.9918 21.2454 Check Dam
28 Hirapur Morshi 77.8843 21.3317 Check Dam
29 Hiwarkhed Morshi 78.0954 21.3779 Check Dam
30 Inapur Morshi 77.9701 21.2377 Check Dam
31 Irur Morshi 77.9157 21.3417 Check Dam
32 Irur Morshi 77.9279 21.3372 Check dam
33 Irur Morshi 77.9272 21.3421 Check dam
34 Irur Morshi 77.9306 21.3405 Check dam
35 Jamathi Morshi 78.0286 21.4126 Check Dam
36 Januna Morshi 77.9345 21.3739 Check dam
37 Jayatapur Morshi 78.0463 21.1928 Check dam
38 Kamalapur Morshi 78.0493 21.1815 Check dam
39 Kamalapur Morshi 78.0529 21.1898 Check dam
40 Katpur Morshi 77.9057 21.2105 Check Dam
41 Katpur Morshi 77.9062 21.2289 Check Dam
42 Khanapur Morshi 77.9459 21.3226 Check dam
43 Khanapur Morshi 77.9499 21.3255 Check dam
44 Khanapur Morshi 77.9518 21.318 Check dam
45 Khanpur Morshi 77.9294 21.2431 Check Dam
46 Khopada Morshi 77.9256 21.2707 Check dam
47 Kopara Morshi 77.9893 21.3558 Check Dam
48 Kopara Morshi 77.9788 21.3612 Check Dam
49 Ladki Morshi 77.9215 21.2524 Check Dam
50 Lihida Morshi 77.9813 21.2205 Check Dam
51 Mamdapur Morshi 77.916 21.2331 Check Dam
52 Mangrul Morshi 77.8826 21.173 Check Dam
53 Mangrul Morshi 77.8916 21.155 Check dam
54 Molvan Morshi 78.0676 21.4298 Check Dam
55 Molvan Morshi 78.0825 21.4287 Check Dam
56 Molvan Morshi 78.0802 21.4174 Check Dam
57 MORSHI Morshi 78.0294 21.3541 Check dam
58 Munaimpur Morshi 77.9848 21.2306 Check Dam
59 Munaimpur Morshi 77.9828 21.2488 Check Dam
60 Nerpingalai Morshi 77.994 21.1793 Check Dam
61 Nerpingalai Morshi 78.0009 21.1692 Check Dam
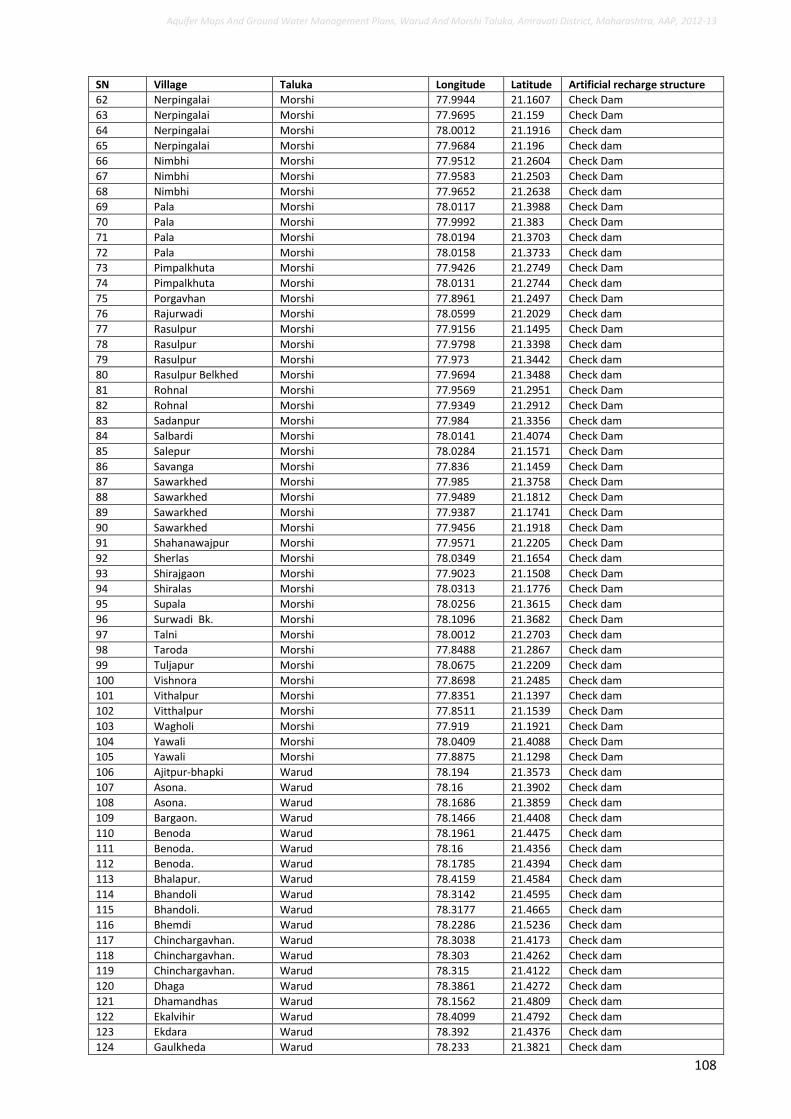
Aquifer Maps And Ground Water Management Plans, Warud And Morshi Taluka, Amravati District, Maharashtra, AAP, 2012-13
108
SN Village Taluka Longitude Latitude Artificial recharge structure
62 Nerpingalai Morshi 77.9944 21.1607 Check Dam
63 Nerpingalai Morshi 77.9695 21.159 Check Dam
64 Nerpingalai Morshi 78.0012 21.1916 Check dam
65 Nerpingalai Morshi 77.9684 21.196 Check dam
66 Nimbhi Morshi 77.9512 21.2604 Check Dam
67 Nimbhi Morshi 77.9583 21.2503 Check Dam
68 Nimbhi Morshi 77.9652 21.2638 Check dam
69 Pala Morshi 78.0117 21.3988 Check Dam
70 Pala Morshi 77.9992 21.383 Check Dam
71 Pala Morshi 78.0194 21.3703 Check dam
72 Pala Morshi 78.0158 21.3733 Check dam
73 Pimpalkhuta Morshi 77.9426 21.2749 Check Dam
74 Pimpalkhuta Morshi 78.0131 21.2744 Check dam
75 Porgavhan Morshi 77.8961 21.2497 Check Dam
76 Rajurwadi Morshi 78.0599 21.2029 Check dam
77 Rasulpur Morshi 77.9156 21.1495 Check Dam
78 Rasulpur Morshi 77.9798 21.3398 Check dam
79 Rasulpur Morshi 77.973 21.3442 Check dam
80 Rasulpur Belkhed Morshi 77.9694 21.3488 Check dam
81 Rohnal Morshi 77.9569 21.2951 Check Dam
82 Rohnal Morshi 77.9349 21.2912 Check Dam
83 Sadanpur Morshi 77.984 21.3356 Check dam
84 Salbardi Morshi 78.0141 21.4074 Check Dam
85 Salepur Morshi 78.0284 21.1571 Check Dam
86 Savanga Morshi 77.836 21.1459 Check Dam
87 Sawarkhed Morshi 77.985 21.3758 Check Dam
88 Sawarkhed Morshi 77.9489 21.1812 Check Dam
89 Sawarkhed Morshi 77.9387 21.1741 Check Dam
90 Sawarkhed Morshi 77.9456 21.1918 Check Dam
91 Shahanawajpur Morshi 77.9571 21.2205 Check Dam
92 Sherlas Morshi 78.0349 21.1654 Check dam
93 Shirajgaon Morshi 77.9023 21.1508 Check Dam
94 Shiralas Morshi 78.0313 21.1776 Check Dam
95 Supala Morshi 78.0256 21.3615 Check dam
96 Surwadi Bk. Morshi 78.1096 21.3682 Check Dam
97 Talni Morshi 78.0012 21.2703 Check dam
98 Taroda Morshi 77.8488 21.2867 Check dam
99 Tuljapur Morshi 78.0675 21.2209 Check dam
100 Vishnora Morshi 77.8698 21.2485 Check dam
101 Vithalpur Morshi 77.8351 21.1397 Check dam
102 Vitthalpur Morshi 77.8511 21.1539 Check Dam
103 Wagholi Morshi 77.919 21.1921 Check Dam
104 Yawali Morshi 78.0409 21.4088 Check Dam
105 Yawali Morshi 77.8875 21.1298 Check Dam
106 Ajitpur-bhapki Warud 78.194 21.3573 Check dam
107 Asona. Warud 78.16 21.3902 Check dam
108 Asona. Warud 78.1686 21.3859 Check dam
109 Bargaon. Warud 78.1466 21.4408 Check dam
110 Benoda Warud 78.1961 21.4475 Check dam
111 Benoda. Warud 78.16 21.4356 Check dam
112 Benoda. Warud 78.1785 21.4394 Check dam
113 Bhalapur. Warud 78.4159 21.4584 Check dam
114 Bhandoli Warud 78.3142 21.4595 Check dam
115 Bhandoli. Warud 78.3177 21.4665 Check dam
116 Bhemdi Warud 78.2286 21.5236 Check dam
117 Chinchargavhan. Warud 78.3038 21.4173 Check dam
118 Chinchargavhan. Warud 78.303 21.4262 Check dam
119 Chinchargavhan. Warud 78.315 21.4122 Check dam
120 Dhaga Warud 78.3861 21.4272 Check dam
121 Dhamandhas Warud 78.1562 21.4809 Check dam
122 Ekalvihir Warud 78.4099 21.4792 Check dam
123 Ekdara Warud 78.392 21.4376 Check dam
124 Gaulkheda Warud 78.233 21.3821 Check dam
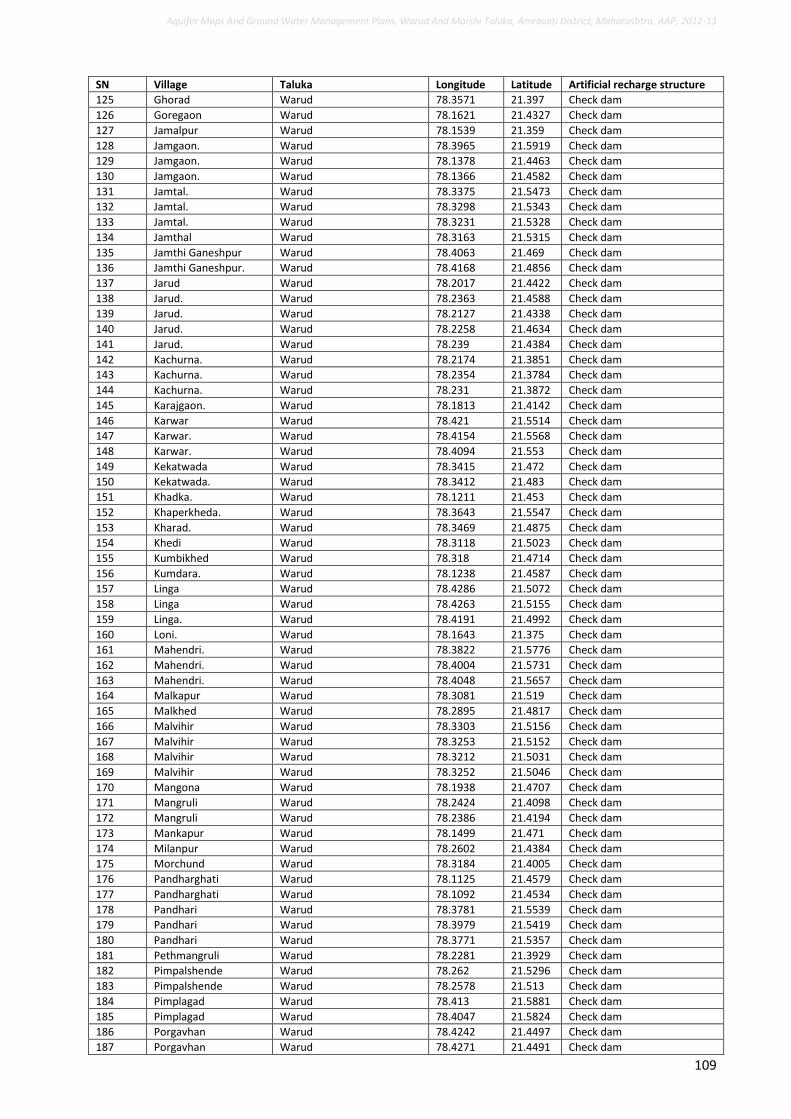
Aquifer Maps And Ground Water Management Plans, Warud And Morshi Taluka, Amravati District, Maharashtra, AAP, 2012-13
109
SN Village Taluka Longitude Latitude Artificial recharge structure
125 Ghorad Warud 78.3571 21.397 Check dam
126 Goregaon Warud 78.1621 21.4327 Check dam
127 Jamalpur Warud 78.1539 21.359 Check dam
128 Jamgaon. Warud 78.3965 21.5919 Check dam
129 Jamgaon. Warud 78.1378 21.4463 Check dam
130 Jamgaon. Warud 78.1366 21.4582 Check dam
131 Jamtal. Warud 78.3375 21.5473 Check dam
132 Jamtal. Warud 78.3298 21.5343 Check dam
133 Jamtal. Warud 78.3231 21.5328 Check dam
134 Jamthal Warud 78.3163 21.5315 Check dam
135 Jamthi Ganeshpur Warud 78.4063 21.469 Check dam
136 Jamthi Ganeshpur. Warud 78.4168 21.4856 Check dam
137 Jarud Warud 78.2017 21.4422 Check dam
138 Jarud. Warud 78.2363 21.4588 Check dam
139 Jarud. Warud 78.2127 21.4338 Check dam
140 Jarud. Warud 78.2258 21.4634 Check dam
141 Jarud. Warud 78.239 21.4384 Check dam
142 Kachurna. Warud 78.2174 21.3851 Check dam
143 Kachurna. Warud 78.2354 21.3784 Check dam
144 Kachurna. Warud 78.231 21.3872 Check dam
145 Karajgaon. Warud 78.1813 21.4142 Check dam
146 Karwar Warud 78.421 21.5514 Check dam
147 Karwar. Warud 78.4154 21.5568 Check dam
148 Karwar. Warud 78.4094 21.553 Check dam
149 Kekatwada Warud 78.3415 21.472 Check dam
150 Kekatwada. Warud 78.3412 21.483 Check dam
151 Khadka. Warud 78.1211 21.453 Check dam
152 Khaperkheda. Warud 78.3643 21.5547 Check dam
153 Kharad. Warud 78.3469 21.4875 Check dam
154 Khedi Warud 78.3118 21.5023 Check dam
155 Kumbikhed Warud 78.318 21.4714 Check dam
156 Kumdara. Warud 78.1238 21.4587 Check dam
157 Linga Warud 78.4286 21.5072 Check dam
158 Linga Warud 78.4263 21.5155 Check dam
159 Linga. Warud 78.4191 21.4992 Check dam
160 Loni. Warud 78.1643 21.375 Check dam
161 Mahendri. Warud 78.3822 21.5776 Check dam
162 Mahendri. Warud 78.4004 21.5731 Check dam
163 Mahendri. Warud 78.4048 21.5657 Check dam
164 Malkapur Warud 78.3081 21.519 Check dam
165 Malkhed Warud 78.2895 21.4817 Check dam
166 Malvihir Warud 78.3303 21.5156 Check dam
167 Malvihir Warud 78.3253 21.5152 Check dam
168 Malvihir Warud 78.3212 21.5031 Check dam
169 Malvihir Warud 78.3252 21.5046 Check dam
170 Mangona Warud 78.1938 21.4707 Check dam
171 Mangruli Warud 78.2424 21.4098 Check dam
172 Mangruli Warud 78.2386 21.4194 Check dam
173 Mankapur Warud 78.1499 21.471 Check dam
174 Milanpur Warud 78.2602 21.4384 Check dam
175 Morchund Warud 78.3184 21.4005 Check dam
176 Pandharghati Warud 78.1125 21.4579 Check dam
177 Pandharghati Warud 78.1092 21.4534 Check dam
178 Pandhari Warud 78.3781 21.5539 Check dam
179 Pandhari Warud 78.3979 21.5419 Check dam
180 Pandhari Warud 78.3771 21.5357 Check dam
181 Pethmangruli Warud 78.2281 21.3929 Check dam
182 Pimpalshende Warud 78.262 21.5296 Check dam
183 Pimpalshende Warud 78.2578 21.513 Check dam
184 Pimplagad Warud 78.413 21.5881 Check dam
185 Pimplagad Warud 78.4047 21.5824 Check dam
186 Porgavhan Warud 78.4242 21.4497 Check dam
187 Porgavhan Warud 78.4271 21.4491 Check dam
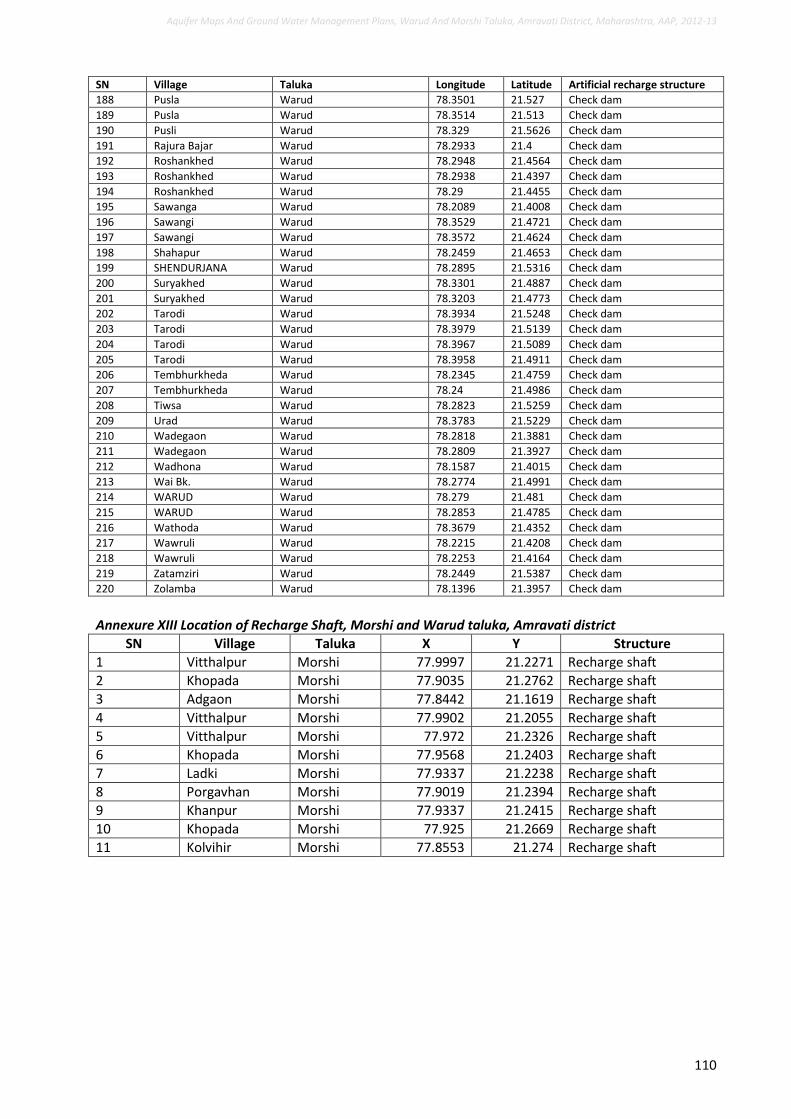
Aquifer Maps And Ground Water Management Plans, Warud And Morshi Taluka, Amravati District, Maharashtra, AAP, 2012-13
110
SN Village Taluka Longitude Latitude Artificial recharge structure
188 Pusla Warud 78.3501 21.527 Check dam
189 Pusla Warud 78.3514 21.513 Check dam
190 Pusli Warud 78.329 21.5626 Check dam
191 Rajura Bajar Warud 78.2933 21.4 Check dam
192 Roshankhed Warud 78.2948 21.4564 Check dam
193 Roshankhed Warud 78.2938 21.4397 Check dam
194 Roshankhed Warud 78.29 21.4455 Check dam
195 Sawanga Warud 78.2089 21.4008 Check dam
196 Sawangi Warud 78.3529 21.4721 Check dam
197 Sawangi Warud 78.3572 21.4624 Check dam
198 Shahapur Warud 78.2459 21.4653 Check dam
199 SHENDURJANA Warud 78.2895 21.5316 Check dam
200 Suryakhed Warud 78.3301 21.4887 Check dam
201 Suryakhed Warud 78.3203 21.4773 Check dam
202 Tarodi Warud 78.3934 21.5248 Check dam
203 Tarodi Warud 78.3979 21.5139 Check dam
204 Tarodi Warud 78.3967 21.5089 Check dam
205 Tarodi Warud 78.3958 21.4911 Check dam
206 Tembhurkheda Warud 78.2345 21.4759 Check dam
207 Tembhurkheda Warud 78.24 21.4986 Check dam
208 Tiwsa Warud 78.2823 21.5259 Check dam
209 Urad Warud 78.3783 21.5229 Check dam
210 Wadegaon Warud 78.2818 21.3881 Check dam
211 Wadegaon Warud 78.2809 21.3927 Check dam
212 Wadhona Warud 78.1587 21.4015 Check dam
213 Wai Bk. Warud 78.2774 21.4991 Check dam
214 WARUD Warud 78.279 21.481 Check dam
215 WARUD Warud 78.2853 21.4785 Check dam
216 Wathoda Warud 78.3679 21.4352 Check dam
217 Wawruli Warud 78.2215 21.4208 Check dam
218 Wawruli Warud 78.2253 21.4164 Check dam
219 Zatamziri Warud 78.2449 21.5387 Check dam
220 Zolamba Warud 78.1396 21.3957 Check dam
Annexure XIII Location of Recharge Shaft, Morshi and Warud taluka, Amravati district
SN Village Taluka X Y Structure
1 Vitthalpur Morshi 77.9997 21.2271 Recharge shaft
2 Khopada Morshi 77.9035 21.2762 Recharge shaft
3 Adgaon Morshi 77.8442 21.1619 Recharge shaft
4 Vitthalpur Morshi 77.9902 21.2055 Recharge shaft
5 Vitthalpur Morshi 77.972 21.2326 Recharge shaft
6 Khopada Morshi 77.9568 21.2403 Recharge shaft
7 Ladki Morshi 77.9337 21.2238 Recharge shaft
8 Porgavhan Morshi 77.9019 21.2394 Recharge shaft
9 Khanpur Morshi 77.9337 21.2415 Recharge shaft
10 Khopada Morshi 77.925 21.2669 Recharge shaft
11 Kolvihir Morshi 77.8553 21.274 Recharge shaft

Related Documents