Research Article Morphometry Governs the Dynamics of a Drainage Basin: Analysis and Implications Atrayee Biswas, 1 Dipanjan Das Majumdar, 2 and Sayandeep Banerjee 3 1 Department of Geography, University of Calcutta, 35 B. C. Road, Kolkata 700 019, India 2 Department of Remote Sensing and GIS, Vidyasagar University, Medinipur 721 102, India 3 Department of Geology, St. Xavier’s College (Autonomous), 5 Mahapalika Marg, Mumbai 400001, India Correspondence should be addressed to Atrayee Biswas; [email protected] Received 11 February 2014; Accepted 13 March 2014; Published 7 May 2014 Academic Editor: Biswajeet Pradhan Copyright © 2014 Atrayee Biswas et al. is is an open access article distributed under the Creative Commons Attribution License, which permits unrestricted use, distribution, and reproduction in any medium, provided the original work is properly cited. Mountainous rivers are the most significant source of water supply in the Himalayan provinces of India. e drainage basin dynamics of these rivers are controlled by the tectonomorphic parameters, which include both surface and subsurface characteristics of a basin. To understand the drainage basin dynamics and their usefulness in watershed prioritisation and management in terms of soil erosion studies and groundwater potential assessment and flood hazard risk reduction in mountainous rivers, morphometric analysis of a Himalayan River (Supin River) basin has been taken as a case study. e entire Supin River basin has been subdivided into 27 subwatersheds and 36 morphometric parameters have been calculated under four broad categories: drainage network, basin geometry, drainage texture, and relief characteristics, each of which is further grouped into five different clusters having similar morphometric properties. e various morphometric parameters have been correlated with each other to understand their underlying relationship and control over the basin hydrogeomorphology. e result thus generated provides adequate knowledge base required for decision making during strategic planning and delineation of prioritised hazard management zones in mountainous terrains. 1. Introduction Morphometry is the measurement and mathematical analysis of the configuration of the earth’s surface and of the shape and dimension of its landforms [1]. e form and structure of drainage basins and their associated drainage networks are described by their morphometric parameters. Morphometric properties of a drainage basin are quantitative attributes of the landscape that are derived from the terrain or elevation surface and drainage network within a drainage basin. Appli- cation of quantitative techniques in morphometric analysis of drainage basins was initially undertaken by Horton et al. [2–8] from topographic maps using manual methods. Remote sensing and Geographical Information System (GIS) techniques are increasingly being used for morpho- metric analysis of drainage basins throughout the world [9– 13]. Quantitative techniques have been applied to study the morphometric properties of different drainage basins in India [14–23]. Several authors have studied morphometric proper- ties of drainage basins as indicators of structural influence on drainage development and neotectonic activity [24–27]. In many studies morphometric analysis has been used to assess the groundwater potentiality of the basins and to locate suitable sites for construction of check dams and artificial recharge structures [28–32]. Watershed prioritisation based on morphometric characteristics has also been carried out and aids in the mapping of high flood potential and erosion prone zones [33–37]. Present study bridges the connection between surface morphometry and subsurface geology of a drainage basin to produce effective information as a part of basin management. So the objective of the present research is to study the mor- phometric parameters of Supin River basin and to identify the influence of the underlying geology on the morphometric parameters of the basin and finally to generate a substantial knowledge base regarding the relationship between surface Hindawi Publishing Corporation Geography Journal Volume 2014, Article ID 927176, 14 pages http://dx.doi.org/10.1155/2014/927176

Welcome message from author
This document is posted to help you gain knowledge. Please leave a comment to let me know what you think about it! Share it to your friends and learn new things together.
Transcript
Research ArticleMorphometry Governs the Dynamics ofa Drainage Basin Analysis and Implications
Atrayee Biswas1 Dipanjan Das Majumdar2 and Sayandeep Banerjee3
1 Department of Geography University of Calcutta 35 B C Road Kolkata 700 019 India2Department of Remote Sensing and GIS Vidyasagar University Medinipur 721 102 India3 Department of Geology St Xavierrsquos College (Autonomous) 5 Mahapalika Marg Mumbai 400001 India
Correspondence should be addressed to Atrayee Biswas adpbiswasgmailcom
Received 11 February 2014 Accepted 13 March 2014 Published 7 May 2014
Academic Editor Biswajeet Pradhan
Copyright copy 2014 Atrayee Biswas et alThis is an open access article distributed under the Creative Commons Attribution Licensewhich permits unrestricted use distribution and reproduction in any medium provided the original work is properly cited
Mountainous rivers are the most significant source of water supply in the Himalayan provinces of India The drainagebasin dynamics of these rivers are controlled by the tectonomorphic parameters which include both surface and subsurfacecharacteristics of a basin To understand the drainage basin dynamics and their usefulness in watershed prioritisation andmanagement in terms of soil erosion studies and groundwater potential assessment and flood hazard risk reduction inmountainousrivers morphometric analysis of a Himalayan River (Supin River) basin has been taken as a case studyThe entire Supin River basinhas been subdivided into 27 subwatersheds and 36 morphometric parameters have been calculated under four broad categoriesdrainage network basin geometry drainage texture and relief characteristics each of which is further grouped into five differentclusters having similar morphometric properties The various morphometric parameters have been correlated with each otherto understand their underlying relationship and control over the basin hydrogeomorphology The result thus generated providesadequate knowledge base required for decisionmaking during strategic planning and delineation of prioritised hazardmanagementzones in mountainous terrains
1 Introduction
Morphometry is themeasurement andmathematical analysisof the configuration of the earthrsquos surface and of the shapeand dimension of its landforms [1] The form and structureof drainage basins and their associated drainage networks aredescribed by their morphometric parameters Morphometricproperties of a drainage basin are quantitative attributes ofthe landscape that are derived from the terrain or elevationsurface and drainage network within a drainage basin Appli-cation of quantitative techniques in morphometric analysisof drainage basins was initially undertaken by Horton et al[2ndash8] from topographic maps using manual methods
Remote sensing and Geographical Information System(GIS) techniques are increasingly being used for morpho-metric analysis of drainage basins throughout the world [9ndash13] Quantitative techniques have been applied to study themorphometric properties of different drainage basins in India
[14ndash23] Several authors have studied morphometric proper-ties of drainage basins as indicators of structural influenceon drainage development and neotectonic activity [24ndash27]In many studies morphometric analysis has been used toassess the groundwater potentiality of the basins and to locatesuitable sites for construction of check dams and artificialrecharge structures [28ndash32] Watershed prioritisation basedon morphometric characteristics has also been carried outand aids in the mapping of high flood potential and erosionprone zones [33ndash37]
Present study bridges the connection between surfacemorphometry and subsurface geology of a drainage basin toproduce effective information as a part of basinmanagementSo the objective of the present research is to study the mor-phometric parameters of Supin River basin and to identifythe influence of the underlying geology on themorphometricparameters of the basin and finally to generate a substantialknowledge base regarding the relationship between surface
Hindawi Publishing CorporationGeography JournalVolume 2014 Article ID 927176 14 pageshttpdxdoiorg1011552014927176
2 Geography Journal
morphometry and subsurface lithology for integrated basinmanagement
2 Drainage Basin Setup
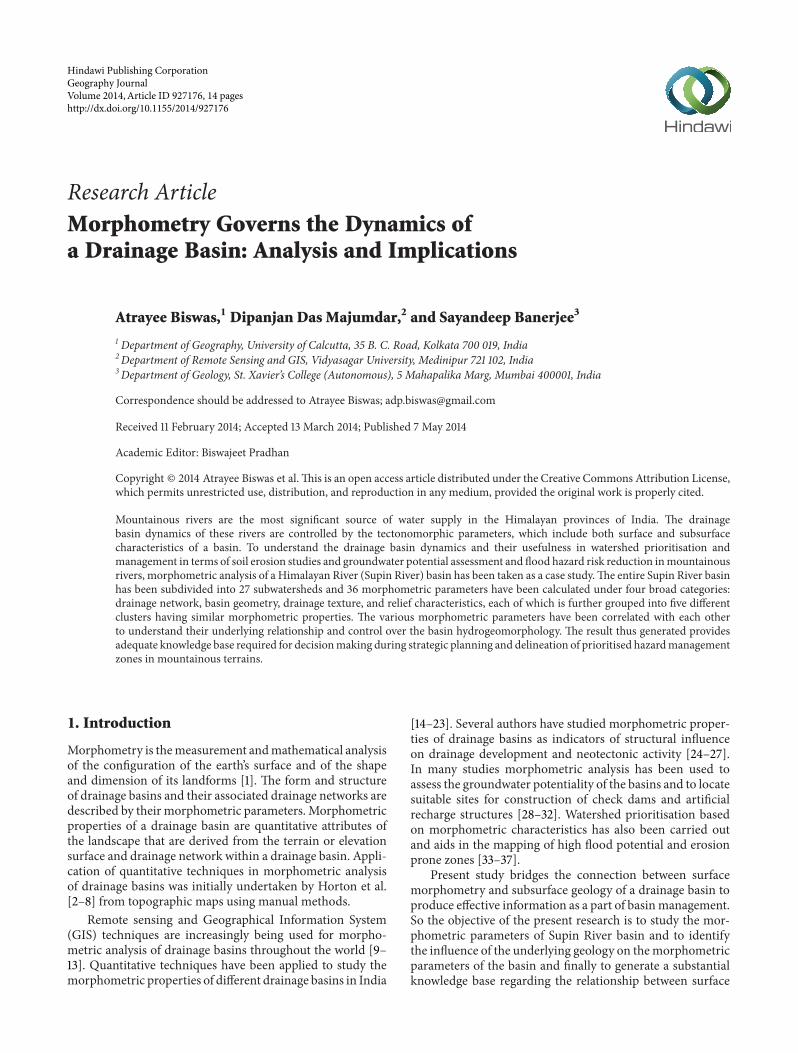
The Supin River basin is located in Uttarkashi district ofUttarakhand (Figure 1) and situated between 78∘101015840ndash78∘381015840Eand 31∘001015840ndash31∘041015840N The tributaries of Supin River suchas Har Ki Dun Gad Borasu Gad and Ruinsara Gad arefed by Jamdar glacier (Figure 2(a)) The basin covers anarea of 56541 km2 and has a perimeter of 19047 km Thestudy area has three climatic zones subtropical (1500ndash1700m) temperate (1700ndash3500m) and alpine (gt3500m)The region receives heavy snowfall between November andMarch The rainfall varies from 1000 to 1500mm annually
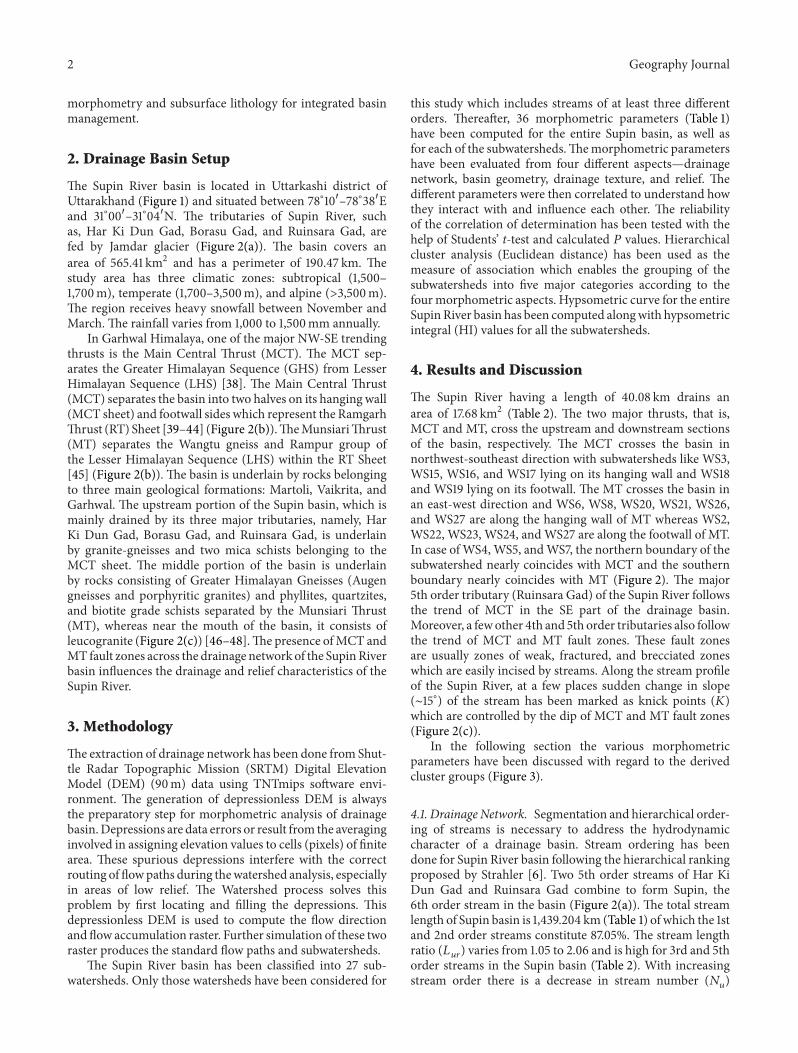
In Garhwal Himalaya one of the major NW-SE trendingthrusts is the Main Central Thrust (MCT) The MCT sep-arates the Greater Himalayan Sequence (GHS) from LesserHimalayan Sequence (LHS) [38] The Main Central Thrust(MCT) separates the basin into two halves on its hanging wall(MCT sheet) and footwall sides which represent the RamgarhThrust (RT) Sheet [39ndash44] (Figure 2(b))TheMunsiariThrust(MT) separates the Wangtu gneiss and Rampur group ofthe Lesser Himalayan Sequence (LHS) within the RT Sheet[45] (Figure 2(b)) The basin is underlain by rocks belongingto three main geological formations Martoli Vaikrita andGarhwal The upstream portion of the Supin basin which ismainly drained by its three major tributaries namely HarKi Dun Gad Borasu Gad and Ruinsara Gad is underlainby granite-gneisses and two mica schists belonging to theMCT sheet The middle portion of the basin is underlainby rocks consisting of Greater Himalayan Gneisses (Augengneisses and porphyritic granites) and phyllites quartzitesand biotite grade schists separated by the Munsiari Thrust(MT) whereas near the mouth of the basin it consists ofleucogranite (Figure 2(c)) [46ndash48]The presence ofMCT andMT fault zones across the drainage network of the SupinRiverbasin influences the drainage and relief characteristics of theSupin River
3 Methodology
Theextraction of drainage network has been done from Shut-tle Radar Topographic Mission (SRTM) Digital ElevationModel (DEM) (90m) data using TNTmips software envi-ronment The generation of depressionless DEM is alwaysthe preparatory step for morphometric analysis of drainagebasinDepressions are data errors or result from the averaginginvolved in assigning elevation values to cells (pixels) of finitearea These spurious depressions interfere with the correctrouting of flowpaths during thewatershed analysis especiallyin areas of low relief The Watershed process solves thisproblem by first locating and filling the depressions Thisdepressionless DEM is used to compute the flow directionand flow accumulation raster Further simulation of these tworaster produces the standard flow paths and subwatersheds
The Supin River basin has been classified into 27 sub-watersheds Only those watersheds have been considered for
this study which includes streams of at least three differentorders Thereafter 36 morphometric parameters (Table 1)have been computed for the entire Supin basin as well asfor each of the subwatershedsThemorphometric parametershave been evaluated from four different aspectsmdashdrainagenetwork basin geometry drainage texture and relief Thedifferent parameters were then correlated to understand howthey interact with and influence each other The reliabilityof the correlation of determination has been tested with thehelp of Studentsrsquo t-test and calculated 119875 values Hierarchicalcluster analysis (Euclidean distance) has been used as themeasure of association which enables the grouping of thesubwatersheds into five major categories according to thefourmorphometric aspects Hypsometric curve for the entireSupinRiver basin has been computed alongwith hypsometricintegral (HI) values for all the subwatersheds
4 Results and Discussion
The Supin River having a length of 4008 km drains anarea of 1768 km2 (Table 2) The two major thrusts that isMCT and MT cross the upstream and downstream sectionsof the basin respectively The MCT crosses the basin innorthwest-southeast direction with subwatersheds like WS3WS15 WS16 and WS17 lying on its hanging wall and WS18and WS19 lying on its footwall The MT crosses the basin inan east-west direction and WS6 WS8 WS20 WS21 WS26and WS27 are along the hanging wall of MT whereas WS2WS22 WS23 WS24 andWS27 are along the footwall of MTIn case ofWS4WS5 andWS7 the northern boundary of thesubwatershed nearly coincides with MCT and the southernboundary nearly coincides with MT (Figure 2) The major5th order tributary (Ruinsara Gad) of the Supin River followsthe trend of MCT in the SE part of the drainage basinMoreover a fewother 4th and 5th order tributaries also followthe trend of MCT and MT fault zones These fault zonesare usually zones of weak fractured and brecciated zoneswhich are easily incised by streams Along the stream profileof the Supin River at a few places sudden change in slope(sim15∘) of the stream has been marked as knick points (119870)which are controlled by the dip of MCT and MT fault zones(Figure 2(c))
In the following section the various morphometricparameters have been discussed with regard to the derivedcluster groups (Figure 3)
41 Drainage Network Segmentation and hierarchical order-ing of streams is necessary to address the hydrodynamiccharacter of a drainage basin Stream ordering has beendone for Supin River basin following the hierarchical rankingproposed by Strahler [6] Two 5th order streams of Har KiDun Gad and Ruinsara Gad combine to form Supin the6th order stream in the basin (Figure 2(a)) The total streamlength of Supin basin is 1439204 km (Table 1) of which the 1stand 2nd order streams constitute 8705 The stream lengthratio (119871
119906119903) varies from 105 to 206 and is high for 3rd and 5th
order streams in the Supin basin (Table 2) With increasingstream order there is a decrease in stream number (119873
119906)
Geography Journal 3
India
0 375 750 1500
(km)
70∘0998400E 80∘0998400E 90∘0998400E 100∘0998400E 110∘0998400E
70∘0998400E 80∘0998400E 90∘0998400E 100∘0998400E 110∘0998400E
10∘ 0
998400 N20
∘ 0998400 N
30∘ 0
998400 N
10∘ 0
998400 N20
∘ 0998400 N
30∘ 0
998400 N
(a)
Uttarakhand
0 45 90 180(km)
77∘20998400E 78∘40998400E 80∘0998400E 81∘20998400E
77∘20998400E 78∘40998400E 80∘0998400E 81∘20998400E
29∘ 0
998400N
30∘ 0
998400N
31∘ 0
998400 N
29∘ 0
998400N
30∘ 0
998400N
31∘ 0
998400 N
(b)
Uttarkashi
0 20 40 80
(km)
78∘0998400E 78∘40998400E 79∘20998400E
78∘0998400E 78∘40998400E 79∘20998400E
30∘ 3
0998400 N31
∘ 0998400 N
31∘ 3
0998400 N
30∘ 3
0998400 N31
∘ 0998400 N
31∘ 3
0998400 N
(c)
0 25 5 75 10
(km)78∘16998400E 78∘24998400E 78∘32998400E
78∘16998400E 78∘24998400E 78∘32998400E
31∘ 1
4998400 N31
∘ 10998400 N
31∘ 5
998400 N31
∘ 0998400 N
31∘ 1
4998400N
31∘ 1
0998400 N31
∘ 5998400 N
78∘37998400E
WS
WS
WS
WS
WS
WS
WS
WS
WS
WSWS
WS
WS
WSWS
WSWS
WS
WSWS
WS
WS
WS
WS
WS
WS
WS
(d)
Figure 1 Location map of Supin River basin having an area of 565406 km2 and a perimeter of 190466 km (a) Uttarakhand state in India(b) Uttarkashi district in Uttarakhand state (c) Supin River basin in Uttarkashi district (d) Subwatersheds (27) in Supin River basin
4 Geography Journal
0 25 5 75 10(km)
78∘16998400E 78∘24998400E 78∘32998400E
78∘16998400E 78∘24998400E 78∘32998400E31
∘ 14998400 6
998400998400N
31∘ 1
0998400 N31
∘ 5998400 N
31∘ 0
998400 13998400998400
N
31∘ 1
4998400 6998400998400
N31
∘ 10998400 N
31∘ 5
998400 N31
∘ 0998400 1
3998400998400N
1st order2nd order3rd order
4th order5th order6th order(Supin River)
(a)
MCT
MT
63531500
78∘16998400E 78∘24998400E 78∘32998400E
78∘16998400E 78∘24998400E 78∘32998400E 78∘3799840022998400998400E
31∘ 1
0998400 N31
∘ 5998400 N
31∘ 0
998400 13998400998400
N
0 25 5 7510(km)
31∘ 1
4998400 6998400998400
N
31∘ 1
0998400 N31
∘ 5998400 N
31∘ 1
4998400 6998400998400
N
Heights (m)
(b)
0 10 20 30 400
1
2
3
4
5
Distance (km)
Elev
atio
n (k
m)
MCT
MT
Downstream Upstream
B
A
Kyanite-sillimanite-garnet bearing two mica schistAugen-gneiss and porphyritic granitesMylonitized quartz porphyry
K
K
K
78∘15998400E 78∘30998400E
(c)
Figure 2 (a) Stream orders of Supin River basin (ranked according to Strahler [6]) (b) Elevation map of Supin River basin showing faultboundariesmdashMain CentralThrust (MCT) across the upstream section andMunsiariThrust (MT) across the downstream section of the SupinRiver basin (c) A cross sectional profile along the Supin River showing the approximate disposition of lithology (adopted from Valdiya andKumar et al [46 47]) Knick points are marked as K
and a simultaneous increase in mean stream length (119871119906119903119898
)(Table 2) The RHO coefficient (120588) and bifurcation ratio (119877
119887)
values for Supin basin range from 062ndash210 (Table 1) and 2 to514 (Table 2) respectively
The variation of 119871119906119903between successive stream orders of
Supin River basin is due to the greater number of streamsbelonging to lower orders indicating that the basin is stillin its youthful stage of development (Table 2) High 119877
119887
values in subwatersheds belonging to C2 and C5 (Table 3)indicate structural control on the development of drainagenetwork The 120588 value signifies the storage capacity of a basinand determines the relationship between drainage densityand physiographic development of the basin Subwatersheds
belonging to C4 and C5 (Table 3 Figure 3(a)) having highvalues of 120588 are at a greater risk of being eroded by the excessdischarge during flood
42 Basin Geometry Basin shape is controlled by structurelithology relief and precipitation and varies from narrowelongated forms with irregular basin perimeter to circularor semicircular forms Circularity ratio (119877
119888) of Supin basin
ranges from 030 to 056 (Table 1) with high values in WS1WS4 WS8 WS9 WS12 WS17 WS21 WS23 and WS24and low values in WS7 WS10 WS11 WS16 and WS22(Figure 4(a)) High values of form ratio (119877
119891) and elongation
Geography Journal 5
Table 1 Morphometric parameters calculated for Supin River basin from four aspectsmdashdrainage network basin geometry drainage textureand relief characteristics
Sl No Morphometric parameters Formulae Reference Result (range)Drainage network
1 Stream order (119878119906
) Hierarchical rank [4] 1 to 62 Stream number (119873
119906
) 119873119906
= 1198731
+ 1198732
+ sdot sdot sdot + 119873119899
[3] 8783 Stream length (119871
119906
) km 119871119906
= 1198711
+ 1198712
+ sdot sdot sdot + 119871119899
[6] 1439204 Stream length Ratio (119871
119906119903
) 119871119906119903
= 119871119906
119871119906minus1
[6] 105ndash2065 Mean stream length ratio (119871
119906119903119898
) Σ119871119906119903
[3] 3186 Mean bifurcation ratio (119877
119887
) 119877119887
= 119873119906
119873119906+1
[6] 133ndash5337 Main channel length (119862
119897
) km 54528 Minimum aerial distance (119860
119889119898
) km 43769 Channel index (119862
119894
) 119862119894
= 119862119897
119860119889119898
[49] 12510 Rho coefficient (120588) 120588 = 119871
119906119903
119877119887
[3] 062ndash210Basin Geometry
11 Basin length (119871119887
) km [7] 441412 Basin area (119860) km2 [7] 5654113 Basin perimeter (119875) km [7] 1904714 Form ratio (119865
119891
) 119865119891
= 119860119871119887
2 [2] 004ndash07315 Elongation ratio (119877
119890
) 119877119890
= 2119871119887
lowast (119860120587)05 [7] 022ndash097
16 Texture ratio (119877119905
) 119877119905
= 1198731
119875 [7] 027ndash18817 Circularity ratio (119877
119888
) 119877119888
= 41205871198601198752 [49] 030ndash056
18 Drainage texture (119863119905
) 119863119905
= 119873119906
119875 [3] 044ndash25519 Compactness coefficient (119862
119888
) 119862119888
= 02841 lowast 11987511986005 [50] 134ndash184
20 Fitness ratio (119877119891
) 119877119891
= 119862119897
119875 [51] 19221 Wandering ratio (119877
119908
) 119877119908
= 119862119897
119871119887
[52] 60122 Watershed eccentricity (120591) 120591 = [(|119871 cm
2
minus119882cm2
|)]05
119882cm [53] 088Drainage texture analysis
23 Stream frequency (119865119904
) 119865119904
= 119873119906
119860 [2] 153ndash29024 Drainage density (119863
119889
) km kms2 119863119889
= 119871119906
119860 [2] 192ndash30625 Constant of channel maintenance (119862) (kms2km) 119862 = 1119863
119889
[7] 033ndash05226 Drainage intensity (119863
119894
) 119863119894
= 119865119904
119863119889
[54] 079ndash11127 Infiltration number (119868
119891
) 119868119891
= 119865119904
lowast 119863119889
[54] 294ndash86128 Length of overland flow (119871
119892
) km 119871119892
= 1198602 lowast 119871119906
[3] 016ndash026Relief characteristics
29 Height of basin mouth (119911) m 154330 Maximum height of the basin (119885) m 583931 Total basin relief (119867) m 119867 = 119885 minus 119911 [4] 429632 Relief ratio (119877
ℎ
) 119877ℎ
= 119867119871119887
[7] 007ndash04433 Absolute relief (119877
119886
) m 583935 Ruggedness number (119877
119899
) 119877119899
= 119863119889
lowast (1198671000) [6] 302ndash64436 Dissection index (119863
119894119904
) 119863119894119904
= 119867119877119886
[55] 027ndash061
Table 2 Stream order-wise frequency distribution of number of streams along with their mean stream length drainage area and bifurcationratio
Stream order(119904119906
)Number ofstreams (119873
119906
)Mean stream
length (km) (119871119904119898
)Stream length ratio
(119871119906119903
)Drainage area
(km2)Bifurcation ratio
(119877119887
)1 677 285 349052 155 299 105 10029 4373 36 615 206 5032 4314 7 1160 189 1590 5145 2 2323 200 2246 3506 1 4008 173 1768 200
6 Geography Journal
6
5
4
3
2
1
0
Dist
ance
Watersheds
WS1
WS1
2W
S14
WS4
WS6
WS8
WS2
6W
S24
WS1
0W
S3W
S9W
S15
WS1
9W
S20
WS1
1W
S2W
S13
WS1
7W
S16
WS2
7W
S23
WS5
WS2
1W
S7W
S18
WS2
5W
S22
Cluster 1
Cluster 2
Cluster 3
Cluster 4
Cluster 5
(a)
6
7
5
4
3
2
1
0
Dist
ance
Watersheds
WS1
WS9
WS2
0W
S2W
S6W
S4W
S8W
S24
WS2
6W
S17
WS1
8W
S23
WS2
5W
S3W
S15
WS1
9W
S5W
S21
WS7
WS1
0W
S14
WS1
1W
S12
WS1
3W
S16
WS2
2W
S27
Cluster 1
Cluster 2
Cluster 3
Cluster 4
Cluster 5
(b)
6
7
5
4
3
2
1
0
Dist
ance
Watersheds
WS1
WS8
WS1
0W
S19
WS6
WS2
3W
S17
WS2
4W
S27
WS1
8W
S2W
S20
WS4
WS2
1W
S7W
S16
WS9
WS1
3W
S25
WS1
5W
S3W
S5W
S11
WS2
2W
S12
WS2
6W
S14
Cluster 1
Cluster 2
Cluster 3
Cluster 4
Cluster 5
(c)
6
5
4
3
2
1
0
Dist
ance
Watersheds
WS1
WS7
WS1
6W
S17
WS3
WS5
WS4
WS9
WS2
2W
S23
WS2
5W
S27
WS2
WS6
WS8
WS1
8W
S10
WS1
1W
S12
WS1
3W
S14
WS1
5W
S20
WS1
9W
S21
WS2
4W
S26
Cluster 1
Cluster 2
Cluster 3
Cluster 4
Cluster 5
(d)
Figure 3 Dendrogram showing groups having similar properties (a) related to drainage network (b) related to basin geometry (c) relatedto drainage texture analysis and (d) related to relief characteristics
ratio (119877119890) are found in WS3 WS5 WS17 WS19 WS21 WS23
and WS25 whereas low values are found in WS11 WS12WS13 WS14 and WS16 (Figures 4(b) and 4(c)) The relativespacing of channels in a drainage basin is expressed bytexture ratio (119877
119905) and drainage texture (119863
119905) The 119877
119905and 119863
119905
values of Supin basin range from 027 to 188 and 044 to255 respectively (Table 1) High values of 119863
119905are found in
subwatersheds located in the upper reaches of the basinwhereas low 119863
119905values are found in subwatersheds located
near the mouth of the basin (Figure 4(d))
119877119888bears a strong negative relationship with compactness
coefficient (119862119888) whereas 119865
119891has a positive relationship with
119877119890(Table 4) [28] Low values of 119877
119888(C4 and C5) (Table 3
Figure 3(b)) are associated with high relief and steep slopesand imply the youthful nature of these subwatersheds Thesubwatersheds belonging to C1 C2 and C3 (Figure 3(b))having high values of 119877
119888 119865119891 119877119890 119877119905 and 119863
119905and low values
of 119862119888are more circular in shape than those belonging to C4
and C5 (Table 3) Although the circular subwatersheds aremore efficient in the discharge of run-off [56] they are at
Geography Journal 7
0 25 5 7510(km)
78∘16998400E 78∘24998400E 78∘32998400E
78∘16998400E 78∘24998400E 78∘32998400E
31∘ 1
4998400 6998400998400
N31
∘ 10998400 N
31∘ 5
998400 N
31∘ 1
4998400 6998400998400
N31
∘ 10998400 N
31∘ 5
998400 N
31∘ 0
998400 13998400998400
N
78∘3799840022998400998400E
030ndash035036ndash041042ndash047
048ndash053054ndash059
(a)
0 25 5 7510(km)
78∘16998400E 78∘24998400E 78∘32998400E
78∘16998400E 78∘24998400E 78∘32998400E
31∘ 1
4998400 6998400998400
N31
∘ 10998400 N
31∘ 5
998400 N
31∘ 1
4998400 6998400998400
N31
∘ 10998400 N
31∘ 5
998400 N
31∘ 0
998400 13998400998400
N
78∘3799840022998400998400E
003ndash017018ndash032033ndash047
048ndash062063ndash076
(b)
0 25 5 7510(km)
78∘16998400E 78∘24998400E 78∘32998400E
78∘16998400E 78∘24998400E 78∘32998400E
31∘ 1
4998400 6998400998400
N31
∘ 10998400 N
31∘ 5
998400 N
31∘ 1
4998400 6998400998400
N31
∘ 10998400 N
31∘ 5
998400 N
31∘ 0
998400 13998400998400
N
78∘3799840022998400998400E
020ndash035036ndash051052ndash067
068ndash083084ndash099
(c)
0 25 5 7510(km)
78∘16998400E 78∘24998400E 78∘32998400E
78∘16998400E 78∘24998400E 78∘32998400E
31∘ 1
4998400 6998400998400
N31
∘ 10998400 N
31∘ 5
998400 N
31∘ 1
4998400 6998400998400
N31
∘ 10998400 N
31∘ 5
998400 N
31∘ 0
998400 13998400998400
N
78∘3799840022998400998400E
Very lowLowModerate
HighVery high
(d)
Figure 4 Map showing response of various basin geometry parameters in subwatersheds of Supin River basin (a) Circularity ratio (119877119888
) (b)Form ratio (119865
119891
) (c) Elongation ratio (119877119890
) (d) Drainage texture (119863119905
)
greater risk from flood hazard because they have a very shortlag time and high peak flows than the elongated basins [57]The elongated subwatersheds on the other hand have lowside flow for shorter duration and high main flow for longerduration and are less susceptible to flood hazard
43 Drainage Texture Analysis Texture indicates the amountof landscape dissection by a channel network and includesstream frequency (119865
119904) drainage density (119863
119889) constant of
channel maintenance (119862) length of overland flow (119871119892) and
infiltration number (119868119891) High values of 119865
119904and 119863
119889are found
in WS3 WS5 WS11 WS14 WS22 and WS25 whereas lowvalues of 119865
119904and 119863
119889are found in WS1 WS6 WS18 WS23
andWS27 (Figures 5(a) and 5(b))The119862 value of Supin basinvaries from 033 to 052 (Table 1)The 119871
119892value of Supin basin
ranges from 016 to 026 and 119868119891value ranges from 294 to 861
(Table 1) Low 119871119892values and high 119868
119891values are found inWS3
WS5 WS11 WS12 WS14 and WS22 (Figures 5(c) and 5(d))which have corresponding high 119865
119904and 119863
119889values (Figures
5(a) and 5(b))119865119904and119863
119889provide a numericalmeasurement of landscape
dissection and run-off potential [16] and bears a nega-tive relationship with 119871
119892and 119868
119891(Table 4) Subwatersheds
belonging to C3 C4 and C5 (Table 3 Figure 3(c)) withlow values of 119871
119892and 119862 have developed numerous drainage
lines on the surface The high values of 119865119904and 119863
119889in these
subwatershedsmaybe due to high relief steep slopes and alsolow permeability of the underlying rocks
44 Relief Characteristics The relief properties in morpho-metric analysis bring into consideration the influence ofaspect and height over a large basin area Relief ratio (119877
ℎ)
ruggedness number (119877119899) and dissection index (119863
119894119904) indicate
the erosion potential of the processes operating within a
8 Geography Journal
Table3
Detailedresultof
hierarchical
cluste
ranalysisforfour
morph
ometric
prop
ertie
sof
SupinRiverbasin
(drainagenetwork
basin
geom
etryd
rainagetextureanalysis
andrelief
characteris
tics)
Drainagen
etwork
ClusterID
Num
bero
fstre
am(119873119906
)To
talstre
amleng
th(K
m)
Meanstr
eam
leng
thratio
(119871119906119903119898
)Bifurcationratio
(119877119887
)Rh
ocoefficient(120588)
C13233
5425
298
294
107
C22400
3903
280
327
090
C36700
10514
291
270
108
C41250
1980
259
200
127
C52850
4877
449
335
136
Basin
geom
etry
ClusterID
Form
ratio
(119865119891
)Shapefactor
Elon
gatio
nratio
(119877119890
)Texturer
atio
(119877119905
)Circularity
ratio
(119877119888
)Drainagetexture
(119863119905
)Com
pactness
Coefficient(119862119888
)C1
035
312
066
099
047
128
147
C2057
179
085
061
047
079
147
C3056
187
084
136
042
183
157
C4007
1599
030
099
037
128
169
C5017
917
044
048
036
065
169
Drainagetexture
ClusterID
Stream
frequ
ency
(119865119904
)Drainaged
ensity(119863119889
)Con
stant
ofchannel
maintenance
(119862)
drainage
intensity
(119863119894
)Infiltrationnu
mber
(119868119891
)Leng
thof
overland
flow(119871119892
)C1
223
216
046
103
482
023
C218
9215
047
088
410
023
C3241
253
040
095
611
020
C4281
298
034
094
838
017
C5238
289
035
083
686
017
Reliefcharacteristics
ClusterID
Reliefratio
(119877ℎ
)Diss
ectio
nindex(119863119894119904
)Gradientratio
(119877119892
)Ru
ggednessnu
mber
(119877119899
)C1
026
047
024
495
C2035
043
042
353
C3029
030
041
351
C4010
032
011
452
C5029
044
017
561
Geography Journal 9
0 25 5 7510(km)
78∘16998400E 78∘24998400E 78∘32998400E
78∘16998400E 78∘24998400E 78∘32998400E
31∘ 1
4998400 6998400998400
N31
∘ 10998400 N
31∘ 5
998400 N
31∘ 1
4998400 6998400998400
N31
∘ 10998400 N
31∘ 5
998400 N
31∘ 0
998400 13998400998400
N
78∘3799840022998400998400E
153ndash180181ndash208209ndash236
237ndash264265ndash292
(a)
0 25 5 7510(km)
78∘16998400E 78∘24998400E 78∘32998400E
78∘16998400E 78∘24998400E 78∘32998400E
31∘ 1
4998400 6998400998400
N31
∘ 10998400 N
31∘ 5
998400 N
31∘ 1
4998400 6998400998400
N31
∘ 10998400 N
31∘ 5
998400 N31
∘ 0998400 1
3998400998400N
78∘3799840022998400998400E
193ndash215216ndash239240ndash263
264ndash287288ndash311
(b)
0 25 5 7510(km)
78∘16998400E 78∘24998400E 78∘32998400E
78∘16998400E 78∘24998400E 78∘32998400E
31∘ 1
4998400 6998400998400
N31
∘ 10998400 N
31∘ 5
998400 N
31∘ 1
4998400 6998400998400
N31
∘ 10998400 N
31∘ 5
998400 N
31∘ 0
998400 13998400998400
N
78∘3799840022998400998400E
016ndash018019ndash021022ndash024
025ndash027028ndash030
(c)
0 25 5 7510(km)
78∘16998400E 78∘24998400E 78∘32998400E
31∘ 1
4998400 6998400998400
N31
∘ 10998400 N
31∘ 5
998400 N
31∘ 1
4998400 6998400998400
N31
∘ 10998400 N
31∘ 5
998400 N
31∘ 0
998400 13998400998400
N
78∘16998400E 78∘24998400E 78∘32998400E 78∘3799840022998400998400E
294ndash407408ndash521522ndash635
636ndash749750ndash863
(d)
Figure 5 Map showing response of various drainage texture parameters in subwatersheds of Supin River basin (a) Stream Frequency (119865119904
)(b) Drainage Density (119863
119889
) (c) Length of overland flow (119871119892
) (d) Infiltration Number (119868119891
)
drainage basin The total basin relief (Z-z) of Supin basin is4296m (Table 1) The 119877
ℎvalue of Supin basin ranges from
007ndash044 with high values in WS2 WS5 WS17 WS19 WS21WS23WS24WS25WS26 andWS27 and low values inWS1WS9WS10WS11WS12WS13 andWS14 (Figure 6(a))Highvalues of119877
119899and119863
119894119904are found inWS3WS4WS5WS7WS9
WS19 and WS20 which indicates the steepness of slope andhigh degree of dissection of these subwatersheds whereaslow values are found in WS10 WS11 WS12 WS13 and WS14(Figures 6(b) and 6(c)) 119877
ℎis related to the channel gradient
and has a negative relationship with basin length (Table 4)Subwatersheds having high values of 119863
119905(C3 in Figure 3(b))
also have high values of 119877119899(C1 and C5 in Figure 3(d)) since
119877119899has a positive correlation with119863
119905(Table 4)The low119863
119894119904of
Supin basin (027ndash061) indicates that the basin is moderatelydissected (Table 1)
45 Hypsometry Analysis Hypsometric curve of a drainagebasin represents the relative proportion of watershed areabelow or above a given elevation It is a measure of theerosional state or geomorphic age of a drainage basin as itrepresents the mass of drainage basin remaining above abasal plane of reference Convex hypsometric curves indicateyouthful stage S-shaped curves indicate a mature stageand concave curves indicate peneplain stage [5] Here thehypsometric curve has been treated as a cumulative proba-bility distribution and statistical moments have been used todescribe the curve quantitatively [58]The hypsometric curvehas been derived by fitting a 5th order polynomial functionwhich is as follows
119891 (119909) = 1198600+ 1198601lowast 119909 + 119860
2lowast 1199092
+ 1198603lowast 1199093
+ 1198604lowast 1199094
+ 1198605lowast 1199095
(1)
10 Geography Journal
78∘16998400E 78∘24998400E 78∘32998400E
78∘16998400E 78∘24998400E 78∘32998400E
31∘ 1
4998400 6998400998400
N31
∘ 10998400 N
31∘ 5
998400 N
31∘ 1
4998400 6998400998400
N31
∘ 10998400 N
31∘ 5
998400 N
31∘ 0
998400 13998400998400
N
78∘3799840022998400998400E
070ndash014015ndash022023ndash030
031ndash038039ndash046
0 25 5 7510(km)
(a)
78∘16998400E 78∘24998400E 78∘32998400E
78∘16998400E 78∘24998400E 78∘32998400E
31∘ 1
4998400 6998400998400
N31
∘ 10998400 N
31∘ 5
998400 N
31∘ 1
4998400 6998400998400
N31
∘ 10998400 N
31∘ 5
998400 N
31∘ 0
998400 13998400998400
N
78∘3799840022998400998400E
30ndash368369ndash437438ndash506
507ndash575576ndash644
0 25 5 7510(km)
(b)
78∘16998400E 78∘24998400E 78∘32998400E
78∘16998400E 78∘24998400E 78∘32998400E
31∘ 1
4998400 6998400998400
N31
∘ 10998400 N
31∘ 5
998400 N
31∘ 1
4998400 6998400998400
N31
∘ 10998400 N
31∘ 5
998400 N
31∘ 0
998400 13998400998400
N
78∘3799840022998400998400E
025ndash032033ndash040041ndash048
049ndash056057ndash064
0 25 5 7510(km)
(c)
Figure 6 Map showing response of various parameters of relief characteristics in subwatersheds of Supin River basin (a) Relief Ratio (119877ℎ
)(b) Ruggedness Number (119877
119899
) (c) Dissection Index (119863119894119904
)
Table 4 Linear correlation among selected morphometric parameters of Supin River basin along with the calculated 119905 and corresponding Pvalues
Variables (119909axismdash119910axis) Linear equation 1199032
|119905| P valueCircularity ratiomdashcompactness coefficient y = minus05024x + 12084 098 3574 0Form ratiomdashelongation ratio y = 10564x + 02624 097 2985 0Drainage densitymdashstream frequency y = 08838x + 04434 069 754 689E minus 08Constant of channel maintenancemdashstream frequency y = minus48551x + 43025 071 786 327E minus 08Constant of channel maintenancemdashdrainage density y = minus60512x + 49628 098 3768 0Length of overland flowmdashstream frequency y = minus00733x + 03741 071 786 327E minus 08Length of overland flowmdashdrainage density y = minus00812x + 04065 098 3768 0Infiltration numbermdashdrainage density y = 02144x + 12349 092 1690 333E minus 15Number of streams of all ordermdashdrainage texture y = 0021x + 05454 094 1911 222E minus 16Relief ratiomdashbasin length y = minus44247x + 20059 082 1053 113E minus 10Drainage texturemdashruggedness number y = 16296x + 25781 066 691 305E minus 07
Geography Journal 11
10
09
08
07
06
05
04
03
02
01
0000 01 02 03 04 05 06 07 08 09 10
Relat
ive h
eigh
t (hH
)
Relative area (aA)
HI = 058
Parameters Value Standard errorA0A1
A2
A3A4
A5
10062721minus044984000446
minus204E minus 04minus367E minus 07142E minus 08
07324901358600083
207E minus 04224E minus 06879E minus 09
Adjusted R2 = 099953
Reduced 1205942 = 287256E minus 5
(a)
78∘12998400E 78∘16998400E 78∘20998400E 78∘24998400E 78∘28998400E 78∘32998400E 78∘36998400E
78∘12998400E 78∘16998400E 78∘20998400E 78∘24998400E 78∘28998400E 78∘32998400E 78∘36998400E
31∘ 1
2998400 N31
∘ 8998400 N
31∘ 4
998400 N31
∘ 0998400 N
31∘ 1
2998400 N31
∘ 8998400 N
31∘ 4
998400 N31
∘ 0998400 N
Hypsometric integralHypsometry
036ndash040041ndash047048ndash051
052ndash055056ndash062
WS27
19 WS
1 WS2 WS
3 WS
4 WS
5 WS
6 WS
7 WS
8 WS
9 WS
10 WS11 WS
12 WS
13 WS
14 WS15 WS
16 WS
17 WS
18 WS
20 WS
21 WS
22 WS23 WS
24 WS
25 WS
26 WS
(b)
Figure 7 Analysis of hypsometric integral (HI) as an index of basin maturity (a) Hypsometric curve of Supin River basin along with theestimated coefficients of 5th order polynomial function (b) Thematic map showing the variation of Hypsometric Integral (HI) among thesubwatersheds of Supin River basin
12 Geography Journal
The estimated coefficients are 1198600 1198601 1198602 1198603 1198604 and 119860
5
which can be obtained from regression of the hypsometriccurve (Figure 7(a)) The statistical moments of hypsometriccurve include skewness of the hypsometric curve (minus0474)kurtosis of the hypsometric curve (2495) skewness of thehypsometric density function (minus0413) and kurtosis of thehypsometric density function (2392) These are collectivelyknown as the derived parameters of hypsometric curve Thearea below the hypsometric curve is known as the hypsomet-ric integral (HI) and is calculated using the following formula
HI = (119898 minus 119897)
(ℎ minus 119897)
(2)
where HI is hypsometric integral 119898 is mean elevation ℎ ismaximumelevation and 119897 isminimumelevationHI has beencalculated for all the subwatersheds of Supin River basinTheconvex hypsometric curve (Figure 7(a)) of Supin River basinshows HI value of 058 The HI values for the subwatershedsrange from 036 to 062 (Figure 7(b))
The derived parameters of hypsometric curve are sen-sitive to subtle changes in overall basin slope and basindevelopment as the mass is removed by erosion over a longgeological time period [59] Present study shows that headward development of the main stream and its tributariesproduce high values for hypsometric skewness [59] On theother hand the density function of the curve is closely relatedto rates of change in overall basin slope and tendency towardgeomorphic equilibrium [59] Density skewness interpretsthe behaviour of slope change in the basin Positive valueof density skewness is an indication of fluvial dominanceover the landforms of this regionHypsometric Kurtosis valueconfirms that erosional processes are dominant on both theupper and lower reaches of the basin [60] Mid basin slopeis moderate as the density Kurtosis value is platykurtic innature The HI value of Supin basin (058) indicates thatthe basin is at a youthful stage of development [6] A fewsubwatersheds showing low HI values (Figure 7(b)) haveattained relatively mature stage and are in a state of reachingdynamic equilibrium Most of the subwatersheds showinghigh HI are located on the hanging wall of MCT and MT(Figures 2(b) and 7(b)) which also indicate a subsurfacecontrol on the maturity of the Supin River basin
5 Conclusion
There is a structural influence on drainage developmentwith trellised pattern being the dominant drainage patternChannel extension in this mountainous region takes placemainly through headward erosion which is characteristicof basins in early mature stage of development The areais well drained by the 1st and 2nd order streams havinghighest drainage area which produces a rugged terrainmoderately dissected by deep incised valleys The high reliefandmoderate permeability of the surface in relatively circularsubwatersheds with high circularity ratio generates high run-offs which make these subwatersheds more susceptible tofloods soil erosion and debris flow In a few elongated sub-watersheds the management of flood flow is easier because of
the low side flow for shorter duration and smaller peak flowsfor longer duration
Fourth and 5th order streams flowing along regional faultzones may generate landslides due to increase in the level oferosion In addition an increase in the incision of the streamsalong the weak and fractured fault zones results in increase inthe sediment load of the streams which in turn may triggerflash floods Sudden topographic breaks along the 6th orderstream profile of the basin at multiple places influence thetectonomorphic landforms developed along Supin River
The significance of studying morphometric properties ofSupin basin lies in the fact that it will help in future watershedmanagement and hazard management studies Due to themountainous nature of the terrain the region suffers fromfrequent flash floods and landslides Hence such type of stud-ies will provide knowledge and database for decision makingfor strategic planning and delineation of prioritised hazardmanagement zones Through understanding of the relationbetween the basin morphometry and subsurface structurethe authors conclude that the lower middle portion of thebasin underlain by Lesser Himalayan schists and granitesare likely to have high groundwater potential which may beharnessed to help the people of the nearby villages Moreoverit may also help in assessing the groundwater potential ofthe region and delineating effective water harvesting sitesThese morphometric techniques may be applied to othermountainous river basins around the globe Morphometricanalysis thus has a wider significance in watershed priori-tisation and management soil erosion studies groundwaterpotential assessment and flood hazard risk reduction in theSupin watershed that forms an important tributary of theTons River basin
Conflict of Interests
The authors declare that there is no conflict of interestsregarding the publication of this paper
Acknowledgments
Assistance from the postgraduate students of the Depart-ment of Geography University of Calcutta during fieldwork was gratefully acknowledged Infrastructural facilitieswere provided by the Department of Geology University ofCalcutta and the Remote Sensing amp GIS Department of theVidyasagar University Thanks are due to Professor SunandoBandyopadhyay Department of Geography University ofCalcutta Comments from the anonymous reviewers aregratefully acknowledged
References
[1] J I Clarke ldquoMorphometry from mapsrdquo in Essays in Geomor-phology G H Dury Ed pp 235ndash274 Elsevier New York NYUSA 1966
[2] R E Horton ldquoDrainage basin characteristicsrdquo Transactions ofAmerican Geophysics Union vol 13 pp 350ndash361 1932
Geography Journal 13
[3] R E Horton ldquoErosional development of streams and theirdrainage basins hydrophysical approach to quantitative mor-phologyrdquoGeological Society of America Bulletin vol 56 pp 275ndash370 1945
[4] A N Strahler ldquoHypsometric analysis of erosional topographyrdquoBulletin of the Geological Society of America vol 63 pp 1117ndash1142 1952
[5] A N Strahler ldquoQuantitative analysis of watershed geomorphol-ogyrdquo Transactions of American Geophysics Union vol 38 pp913ndash920 1957
[6] A N Strahler ldquoQuantitative geomorphology of drainage basinand channel networksrdquo inHandbook of Applied Hydrology V TChow Ed McGraw Hill New York NY USA 1964
[7] S A Schumm ldquoEvolution of drainage systems and slopes inbadlands at Perth Amboy New Jerseyrdquo Bulletin of the GeologicalSociety of America vol 67 pp 597ndash646 1956
[8] R J Chorley andMAMorgan ldquoComparison ofmorphometricfeatures UnakaMountains Tennessee andNorth Carolina andDartmoor EnglandrdquoGeological Society of America Bulletin vol73 no 1 pp 17ndash34 1962
[9] P W Williams ldquoMorphometric analysis of polygonal karst inNew GuineardquoGeological Society of America Bulletin vol 83 no3 pp 761ndash796 1972
[10] L M Mesa ldquoMorphometric analysis of a subtropical Andeanbasin (Tucuman Argentina)rdquo Environmental Geology vol 50no 8 pp 1235ndash1242 2006
[11] P Lyew-Ayee H A Viles and G E Tucker ldquoThe use of GIS-based digital morphometric techniques in the study of cockpitkarstrdquo Earth Surface Processes and Landforms vol 32 no 2 pp165ndash179 2007
[12] T B Altin and B N Altin ldquoDevelopment and morphometry ofdrainage network in volcanic terrain Central Anatolia TurkeyrdquoGeomorphology vol 125 no 4 pp 485ndash503 2011
[13] M Buccolini L Coco C Cappadonia and E RotiglianoldquoRelationships between a new slope morphometric index andcalanchi erosion in northern Sicily Italyrdquo Geomorphology vol149-150 pp 41ndash48 2012
[14] S S Vittala S Govindaih and H H Gowda ldquoMorphometricanalysis of sub-watershed in the Pavada area of Tumkur districtSouth India using remote sensing and GIS techniquesrdquo Journalof Indian Society of Remote Sensing vol 32 no 4 pp 351ndash3622004
[15] R Chopra R D Dhiman and P K Sharma ldquoMorphometricanalysis of sub-watersheds in Gurdaspur district Punjab usingremote sensing and GIS techniquesrdquo Journal of Indian Society ofRemote Sensing vol 33 no 4 pp 531ndash539 2005
[16] H Vijith and R Sateesh ldquoGIS based morphometric analysis oftwomajor upland sub-watersheds ofMeenachil river in KeralardquoJournal of the Indian Society of Remote Sensing vol 34 no 2 pp181ndash185 2006
[17] M Rudraiah S Govindaiah and S S Vittala ldquoMorphometryusing remote sensing and GIS techniques in the sub-basins ofKagna river basin Gulburga district Karnataka Indiardquo Journalof the Indian Society of Remote Sensing vol 36 no 4 pp 351ndash360 2008
[18] M Bagyaraj and B Gurugnanam ldquoSignificance of morphom-etry studies soil characteristics erosion phenomena and land-form processes using remote Sensing and GIS for KodaikanalHills a global biodiversity hotpot in Western Ghats DindigulDistrict Tamil Nadu South Indiardquo Research Journal of Environ-mental and Earth Sciences vol 3 no 3 pp 221ndash233 2011
[19] I Malik S Bhat and N A Kuchay ldquoWatershed based drainagemorphometric analysis of Lidder catchment in Kashmir valleyusing Geographical Information Systemrdquo Recent Research inScience and Technology vol 3 no 4 pp 118ndash126 2011
[20] J Thomas S Joseph K P Thrivikramji and G Abe ldquoMor-phometric analysis of the drainage system and its hydrologicalimplications in the rain shadow regions Kerala Indiardquo Journalof Geographical Sciences vol 21 no 6 pp 1077ndash1088 2011
[21] N S Magesh K V Jitheshlal N Chandrasekar and K V JinildquoGIS based morphometric evaluation of Chimmini andMupilywatersheds parts of Western Ghats Thrissur District KeralaIndiardquo Earth Science Information vol 5 no 2 pp 111ndash121 2012
[22] P Singh J K Thakur and U C Singh ldquoMorphometric analysisof Morar River Basin Madhya Pradesh India using remotesensing and GIS techniquesrdquo Environmental Earth Science vol68 no 7 pp 1967ndash1977 2012
[23] K Pareta and U Pareta ldquoQuantitative geomorphological analy-sis of a watershed of Ravi River Basin HP Indiardquo InternationalJournal of Remote Sensing and GIS vol 1 no 1 pp 41ndash56 2012
[24] S K Nag and S Chakraborty ldquoInfluence of rock types andstructures in the development of drainage network in hard rockareardquo Journal of Indian Society of Remote Sensing vol 31 no 1pp 25ndash35 2003
[25] J D Das Y Shujat and A K Saraf ldquoSpatial technologiesin deriving the morphotectonic characteristics of tectonicallyactive Western Tripura Region Northeast Indiardquo Journal of theIndian Society of Remote Sensing vol 39 no 2 pp 249ndash258 2011
[26] R Bali K K Agarwal S Nawaz Ali S K Rastogi andK Krishna ldquoDrainage morphometry of Himalayan Glacio-fluvial basin India hydrologic and neotectonic implicationsrdquoEnvironmental Earth Sciences vol 66 no 4 pp 1163ndash1174 2012
[27] A Demoulin ldquoBasin and river profile morphometry a newindex with a high potential for relative dating of tectonic upliftrdquoGeomorphology vol 126 no 1-2 pp 97ndash107 2011
[28] P D Sreedevi K Subrahmanyam and S Ahmed ldquoThe sig-nificance of morphometric analysis for obtaining groundwaterpotential zones in a structurally controlled terrainrdquo Environ-mental Geology vol 47 no 3 pp 412ndash420 2005
[29] K Narendra and K N Rao ldquoMorphometry of theMeghadrigedda watershed Visakhapatnam District AndhraPradesh using GIS and Resourcesat datardquo Journal of IndianSociety of Remote Sensing vol 34 no 2 pp 102ndash110 2006
[30] KAvinash K S Jayappa andBDeepika ldquoPrioritization of sub-basins based on geomorphology and morphometricanalysisusing remote sensing and geographic informationsystem (GIS)techniquesrdquo Geocarto International vol 26 no 7 pp 569ndash5922011
[31] A Mishra D P Dubey and R N Tiwari ldquoMorphometricanalysis of Tons basin Rewa District Madhya Pradesh basedon watershed approachrdquo Earth Science India vol 4 no 3 pp171ndash180 2011
[32] I Jasmin and P Mallikarjuna ldquoMorphometric analysis ofAraniar river basin using remote sensing and geographicalinformation system in the assessment of groundwater poten-tialrdquo Arab Journal of Geosciences vol 6 no 10 pp 3683ndash36922013
[33] A Javed M Y Khanday and S Rais ldquoWatershed prioritizationusing morphometric and land useland cover parameters aremote sensing and GIS based approachrdquo Journal of the Geo-logical Society of India vol 78 no 1 pp 63ndash75 2011
14 Geography Journal
[34] P C Patton and V R Baker ldquoMorphometry and floods in smalldrainage basins subject to diverse hydrogeomorphic controlsrdquoWater Resources Research vol 12 no 5 pp 941ndash952 1976
[35] M Diakakis ldquoA method for flood hazard mapping based onbasin morphometry application in two catchments in GreecerdquoNatural Hazards vol 56 no 3 pp 803ndash814 2011
[36] H B Wakode D Dutta V R Desai K Baier and R AzzamldquoMorphometric analysis of the upper catchment of Kosi Riverusing GIS techniquesrdquo Arabian Journal of Geosciences vol 6no 2 pp 395ndash408 2011
[37] S A Romshoo S A Bhat and I Rashid ldquoGeoinformatics forassessing the morphometric control on hydrological responseat watershed scale in the Upper Indus basinrdquo Journal of EarthSystem Science vol 121 no 3 pp 659ndash686 2012
[38] A Yin ldquoCenozoic tectonic evolution of the Himalayan orogenas constrained by along-strike variation of structural geometryexhumation history and foreland sedimentationrdquoEarth-ScienceReviews vol 76 no 1-2 pp 1ndash131 2006
[39] K S Valdiya Geology of the Kumaon Lesser Himalaya WadiaInstitute of Himalaya Uttarakhand India 1980
[40] P Srivastava and G Mitra ldquoThrust geometries and deep struc-ture of the outer and lesser Himalaya Kumaon and Garhwal(India) implications for evolution of the Himalayan fold-and-thrust beltrdquo Tectonics vol 13 no 1 pp 89ndash109 1994
[41] P G DeCelles G E Gehrels J Quade and T P Ojha ldquoEocene-early Miocene foreland basin development and the history ofHimalayan thrusting western and central NepalrdquoTectonics vol17 no 5 pp 741ndash765 1998
[42] P G DeCelles D M Robinson and G Zandt ldquoImplicationsof shortening in the Himalayan fold-thrust belt for uplift of theTibetan Plateaurdquo Tectonics vol 21 no 6 pp 1ndash25 2002
[43] O N Pearson and P G DeCelles ldquoStructural geologyand regional tectonic significance of the Ramgarh thrustHimalayan fold-thrust belt of Nepalrdquo Tectonics vol 24 no 4Article ID TC4008 pp 1ndash26 2005
[44] N McQuarrie D Robinson S Long et al ldquoPreliminarystratigraphic and structural architecture of Bhutan implicationsfor the along strike architecture of theHimalayan systemrdquoEarthand Planetary Science Letters vol 272 no 1-2 pp 105ndash117 2008
[45] J C Vannay and BGrasemann ldquoHimalayan invertedmetamor-phism and syn-convergence extension as a consequence of ageneral shear extrusionrdquo Geological Magazine vol 138 no 3pp 253ndash276 2001
[46] K S Valdiya ldquoReactivation of terrane-defining boundarythrusts in central sector of the Himalaya implicationsrdquo CurrentScience vol 81 no 11 pp 1418ndash1431 2001
[47] R Kumar S K Ghosh R K Mazari and S J SangodeldquoTectonic impact on the fluvial deposits of Plio-PleistoceneHimalayan foreland basin Indiardquo SedimentaryGeology vol 158no 3-4 pp 209ndash234 2003
[48] H K Sachan M J Kohn A Saxena and S L Corrie ldquoTheMalari leucogranite Garhwal Himalaya Northern India chem-istry age and tectonic implicationsrdquo Bulletin of the GeologicalSociety of America vol 122 no 11-12 pp 1865ndash1876 2010
[49] J E Mueller ldquoAn introduction to the hydraulic and topographicsinuosity indexesrdquo Annals of the Association of American Geog-raphers vol 58 no 2 pp 371ndash385 1968
[50] H Gravelius Flusskunde Goschenrsquosche VerlagshandlungBerlin Germany 1941
[51] M A Melton An Analysis of the Relations among Elementsof Climate Surface Properties and Geomorphology ColumbiaUniversity New York NY USA 1957
[52] J S Smart and A J Surkan ldquoThe relation between mainstreamlength and area in drainage basinsrdquo Water Resources Researchvol 3 no 4 pp 963ndash974 1967
[53] P E Black ldquoHydrograph responses to geomorphic modelwatershed characteristics and precipitation variablesrdquo Journal ofHydrology vol 17 no 4 pp 309ndash329 1972
[54] A Faniran ldquoThe index of drainage intensity -a provisional newdrainage factorrdquo Australian Journal of Science vol 31 pp 328ndash330 1968
[55] S Singh and A Dubey Geo-environmental Planning of Water-sheds in India vol 28 Chugh Allahabad India 1994
[56] S Singh and M C Singh ldquoMorphometric analysis of Kanharriver basinrdquo National Geographical Journal of India vol 43 no1 pp 31ndash43 1997
[57] D Waugh Geography An Integrated Approach Nelson NewYork NY USA 1995
[58] J M Harlin ldquoStatistical moments of the hypsometric curve andits density functionrdquo Journal of the International Association forMathematical Geology vol 10 no 1 pp 59ndash72 1978
[59] J M Harlin ldquoThe effect of precipitation variability on drainagebasin morphometryrdquo American Journal of Science vol 280 no8 pp 812ndash825 1980
[60] W Luo ldquoQuantifying groundwater-sapping landforms witha hypsometric techniquerdquo Journal of Geophysical Research EPlanets vol 105 no 1 pp 1685ndash1694 2000
Submit your manuscripts athttpwwwhindawicom
Child Development Research
Hindawi Publishing Corporationhttpwwwhindawicom Volume 2014
Education Research International
Hindawi Publishing Corporationhttpwwwhindawicom Volume 2014
Biomedical EducationJournal of
Hindawi Publishing Corporationhttpwwwhindawicom Volume 2014
Hindawi Publishing Corporationhttpwwwhindawicom Volume 2014
Psychiatry Journal
ArchaeologyJournal of
Hindawi Publishing Corporationhttpwwwhindawicom Volume 2014
Hindawi Publishing Corporationhttpwwwhindawicom Volume 2014
AnthropologyJournal of
Hindawi Publishing Corporationhttpwwwhindawicom Volume 2014
Research and TreatmentSchizophrenia
Hindawi Publishing Corporationhttpwwwhindawicom Volume 2014
Urban Studies Research
Population ResearchInternational Journal of
Hindawi Publishing Corporationhttpwwwhindawicom Volume 2014
CriminologyJournal of
Hindawi Publishing Corporationhttpwwwhindawicom Volume 2014
Aging ResearchJournal of
Hindawi Publishing Corporationhttpwwwhindawicom Volume 2014
Hindawi Publishing Corporationhttpwwwhindawicom Volume 2014
NursingResearch and Practice
Current Gerontologyamp Geriatrics Research
Hindawi Publishing Corporationhttpwwwhindawicom
Volume 2014
Sleep DisordersHindawi Publishing Corporationhttpwwwhindawicom Volume 2014
AddictionJournal of
Hindawi Publishing Corporationhttpwwwhindawicom Volume 2014
Depression Research and TreatmentHindawi Publishing Corporationhttpwwwhindawicom Volume 2014
Hindawi Publishing Corporationhttpwwwhindawicom Volume 2014
Geography Journal
Hindawi Publishing Corporationhttpwwwhindawicom Volume 2014
Research and TreatmentAutism
Hindawi Publishing Corporationhttpwwwhindawicom Volume 2014
Economics Research International
2 Geography Journal
morphometry and subsurface lithology for integrated basinmanagement
2 Drainage Basin Setup
The Supin River basin is located in Uttarkashi district ofUttarakhand (Figure 1) and situated between 78∘101015840ndash78∘381015840Eand 31∘001015840ndash31∘041015840N The tributaries of Supin River suchas Har Ki Dun Gad Borasu Gad and Ruinsara Gad arefed by Jamdar glacier (Figure 2(a)) The basin covers anarea of 56541 km2 and has a perimeter of 19047 km Thestudy area has three climatic zones subtropical (1500ndash1700m) temperate (1700ndash3500m) and alpine (gt3500m)The region receives heavy snowfall between November andMarch The rainfall varies from 1000 to 1500mm annually
In Garhwal Himalaya one of the major NW-SE trendingthrusts is the Main Central Thrust (MCT) The MCT sep-arates the Greater Himalayan Sequence (GHS) from LesserHimalayan Sequence (LHS) [38] The Main Central Thrust(MCT) separates the basin into two halves on its hanging wall(MCT sheet) and footwall sides which represent the RamgarhThrust (RT) Sheet [39ndash44] (Figure 2(b))TheMunsiariThrust(MT) separates the Wangtu gneiss and Rampur group ofthe Lesser Himalayan Sequence (LHS) within the RT Sheet[45] (Figure 2(b)) The basin is underlain by rocks belongingto three main geological formations Martoli Vaikrita andGarhwal The upstream portion of the Supin basin which ismainly drained by its three major tributaries namely HarKi Dun Gad Borasu Gad and Ruinsara Gad is underlainby granite-gneisses and two mica schists belonging to theMCT sheet The middle portion of the basin is underlainby rocks consisting of Greater Himalayan Gneisses (Augengneisses and porphyritic granites) and phyllites quartzitesand biotite grade schists separated by the Munsiari Thrust(MT) whereas near the mouth of the basin it consists ofleucogranite (Figure 2(c)) [46ndash48]The presence ofMCT andMT fault zones across the drainage network of the SupinRiverbasin influences the drainage and relief characteristics of theSupin River
3 Methodology
Theextraction of drainage network has been done from Shut-tle Radar Topographic Mission (SRTM) Digital ElevationModel (DEM) (90m) data using TNTmips software envi-ronment The generation of depressionless DEM is alwaysthe preparatory step for morphometric analysis of drainagebasinDepressions are data errors or result from the averaginginvolved in assigning elevation values to cells (pixels) of finitearea These spurious depressions interfere with the correctrouting of flowpaths during thewatershed analysis especiallyin areas of low relief The Watershed process solves thisproblem by first locating and filling the depressions Thisdepressionless DEM is used to compute the flow directionand flow accumulation raster Further simulation of these tworaster produces the standard flow paths and subwatersheds
The Supin River basin has been classified into 27 sub-watersheds Only those watersheds have been considered for
this study which includes streams of at least three differentorders Thereafter 36 morphometric parameters (Table 1)have been computed for the entire Supin basin as well asfor each of the subwatershedsThemorphometric parametershave been evaluated from four different aspectsmdashdrainagenetwork basin geometry drainage texture and relief Thedifferent parameters were then correlated to understand howthey interact with and influence each other The reliabilityof the correlation of determination has been tested with thehelp of Studentsrsquo t-test and calculated 119875 values Hierarchicalcluster analysis (Euclidean distance) has been used as themeasure of association which enables the grouping of thesubwatersheds into five major categories according to thefourmorphometric aspects Hypsometric curve for the entireSupinRiver basin has been computed alongwith hypsometricintegral (HI) values for all the subwatersheds
4 Results and Discussion
The Supin River having a length of 4008 km drains anarea of 1768 km2 (Table 2) The two major thrusts that isMCT and MT cross the upstream and downstream sectionsof the basin respectively The MCT crosses the basin innorthwest-southeast direction with subwatersheds like WS3WS15 WS16 and WS17 lying on its hanging wall and WS18and WS19 lying on its footwall The MT crosses the basin inan east-west direction and WS6 WS8 WS20 WS21 WS26and WS27 are along the hanging wall of MT whereas WS2WS22 WS23 WS24 andWS27 are along the footwall of MTIn case ofWS4WS5 andWS7 the northern boundary of thesubwatershed nearly coincides with MCT and the southernboundary nearly coincides with MT (Figure 2) The major5th order tributary (Ruinsara Gad) of the Supin River followsthe trend of MCT in the SE part of the drainage basinMoreover a fewother 4th and 5th order tributaries also followthe trend of MCT and MT fault zones These fault zonesare usually zones of weak fractured and brecciated zoneswhich are easily incised by streams Along the stream profileof the Supin River at a few places sudden change in slope(sim15∘) of the stream has been marked as knick points (119870)which are controlled by the dip of MCT and MT fault zones(Figure 2(c))
In the following section the various morphometricparameters have been discussed with regard to the derivedcluster groups (Figure 3)
41 Drainage Network Segmentation and hierarchical order-ing of streams is necessary to address the hydrodynamiccharacter of a drainage basin Stream ordering has beendone for Supin River basin following the hierarchical rankingproposed by Strahler [6] Two 5th order streams of Har KiDun Gad and Ruinsara Gad combine to form Supin the6th order stream in the basin (Figure 2(a)) The total streamlength of Supin basin is 1439204 km (Table 1) of which the 1stand 2nd order streams constitute 8705 The stream lengthratio (119871
119906119903) varies from 105 to 206 and is high for 3rd and 5th
order streams in the Supin basin (Table 2) With increasingstream order there is a decrease in stream number (119873
119906)
Geography Journal 3
India
0 375 750 1500
(km)
70∘0998400E 80∘0998400E 90∘0998400E 100∘0998400E 110∘0998400E
70∘0998400E 80∘0998400E 90∘0998400E 100∘0998400E 110∘0998400E
10∘ 0
998400 N20
∘ 0998400 N
30∘ 0
998400 N
10∘ 0
998400 N20
∘ 0998400 N
30∘ 0
998400 N
(a)
Uttarakhand
0 45 90 180(km)
77∘20998400E 78∘40998400E 80∘0998400E 81∘20998400E
77∘20998400E 78∘40998400E 80∘0998400E 81∘20998400E
29∘ 0
998400N
30∘ 0
998400N
31∘ 0
998400 N
29∘ 0
998400N
30∘ 0
998400N
31∘ 0
998400 N
(b)
Uttarkashi
0 20 40 80
(km)
78∘0998400E 78∘40998400E 79∘20998400E
78∘0998400E 78∘40998400E 79∘20998400E
30∘ 3
0998400 N31
∘ 0998400 N
31∘ 3
0998400 N
30∘ 3
0998400 N31
∘ 0998400 N
31∘ 3
0998400 N
(c)
0 25 5 75 10
(km)78∘16998400E 78∘24998400E 78∘32998400E
78∘16998400E 78∘24998400E 78∘32998400E
31∘ 1
4998400 N31
∘ 10998400 N
31∘ 5
998400 N31
∘ 0998400 N
31∘ 1
4998400N
31∘ 1
0998400 N31
∘ 5998400 N
78∘37998400E
WS
WS
WS
WS
WS
WS
WS
WS
WS
WSWS
WS
WS
WSWS
WSWS
WS
WSWS
WS
WS
WS
WS
WS
WS
WS
(d)
Figure 1 Location map of Supin River basin having an area of 565406 km2 and a perimeter of 190466 km (a) Uttarakhand state in India(b) Uttarkashi district in Uttarakhand state (c) Supin River basin in Uttarkashi district (d) Subwatersheds (27) in Supin River basin
4 Geography Journal
0 25 5 75 10(km)
78∘16998400E 78∘24998400E 78∘32998400E
78∘16998400E 78∘24998400E 78∘32998400E31
∘ 14998400 6
998400998400N
31∘ 1
0998400 N31
∘ 5998400 N
31∘ 0
998400 13998400998400
N
31∘ 1
4998400 6998400998400
N31
∘ 10998400 N
31∘ 5
998400 N31
∘ 0998400 1
3998400998400N
1st order2nd order3rd order
4th order5th order6th order(Supin River)
(a)
MCT
MT
63531500
78∘16998400E 78∘24998400E 78∘32998400E
78∘16998400E 78∘24998400E 78∘32998400E 78∘3799840022998400998400E
31∘ 1
0998400 N31
∘ 5998400 N
31∘ 0
998400 13998400998400
N
0 25 5 7510(km)
31∘ 1
4998400 6998400998400
N
31∘ 1
0998400 N31
∘ 5998400 N
31∘ 1
4998400 6998400998400
N
Heights (m)
(b)
0 10 20 30 400
1
2
3
4
5
Distance (km)
Elev
atio
n (k
m)
MCT
MT
Downstream Upstream
B
A
Kyanite-sillimanite-garnet bearing two mica schistAugen-gneiss and porphyritic granitesMylonitized quartz porphyry
K
K
K
78∘15998400E 78∘30998400E
(c)
Figure 2 (a) Stream orders of Supin River basin (ranked according to Strahler [6]) (b) Elevation map of Supin River basin showing faultboundariesmdashMain CentralThrust (MCT) across the upstream section andMunsiariThrust (MT) across the downstream section of the SupinRiver basin (c) A cross sectional profile along the Supin River showing the approximate disposition of lithology (adopted from Valdiya andKumar et al [46 47]) Knick points are marked as K
and a simultaneous increase in mean stream length (119871119906119903119898
)(Table 2) The RHO coefficient (120588) and bifurcation ratio (119877
119887)
values for Supin basin range from 062ndash210 (Table 1) and 2 to514 (Table 2) respectively
The variation of 119871119906119903between successive stream orders of
Supin River basin is due to the greater number of streamsbelonging to lower orders indicating that the basin is stillin its youthful stage of development (Table 2) High 119877
119887
values in subwatersheds belonging to C2 and C5 (Table 3)indicate structural control on the development of drainagenetwork The 120588 value signifies the storage capacity of a basinand determines the relationship between drainage densityand physiographic development of the basin Subwatersheds
belonging to C4 and C5 (Table 3 Figure 3(a)) having highvalues of 120588 are at a greater risk of being eroded by the excessdischarge during flood
42 Basin Geometry Basin shape is controlled by structurelithology relief and precipitation and varies from narrowelongated forms with irregular basin perimeter to circularor semicircular forms Circularity ratio (119877
119888) of Supin basin
ranges from 030 to 056 (Table 1) with high values in WS1WS4 WS8 WS9 WS12 WS17 WS21 WS23 and WS24and low values in WS7 WS10 WS11 WS16 and WS22(Figure 4(a)) High values of form ratio (119877
119891) and elongation
Geography Journal 5
Table 1 Morphometric parameters calculated for Supin River basin from four aspectsmdashdrainage network basin geometry drainage textureand relief characteristics
Sl No Morphometric parameters Formulae Reference Result (range)Drainage network
1 Stream order (119878119906
) Hierarchical rank [4] 1 to 62 Stream number (119873
119906
) 119873119906
= 1198731
+ 1198732
+ sdot sdot sdot + 119873119899
[3] 8783 Stream length (119871
119906
) km 119871119906
= 1198711
+ 1198712
+ sdot sdot sdot + 119871119899
[6] 1439204 Stream length Ratio (119871
119906119903
) 119871119906119903
= 119871119906
119871119906minus1
[6] 105ndash2065 Mean stream length ratio (119871
119906119903119898
) Σ119871119906119903
[3] 3186 Mean bifurcation ratio (119877
119887
) 119877119887
= 119873119906
119873119906+1
[6] 133ndash5337 Main channel length (119862
119897
) km 54528 Minimum aerial distance (119860
119889119898
) km 43769 Channel index (119862
119894
) 119862119894
= 119862119897
119860119889119898
[49] 12510 Rho coefficient (120588) 120588 = 119871
119906119903
119877119887
[3] 062ndash210Basin Geometry
11 Basin length (119871119887
) km [7] 441412 Basin area (119860) km2 [7] 5654113 Basin perimeter (119875) km [7] 1904714 Form ratio (119865
119891
) 119865119891
= 119860119871119887
2 [2] 004ndash07315 Elongation ratio (119877
119890
) 119877119890
= 2119871119887
lowast (119860120587)05 [7] 022ndash097
16 Texture ratio (119877119905
) 119877119905
= 1198731
119875 [7] 027ndash18817 Circularity ratio (119877
119888
) 119877119888
= 41205871198601198752 [49] 030ndash056
18 Drainage texture (119863119905
) 119863119905
= 119873119906
119875 [3] 044ndash25519 Compactness coefficient (119862
119888
) 119862119888
= 02841 lowast 11987511986005 [50] 134ndash184
20 Fitness ratio (119877119891
) 119877119891
= 119862119897
119875 [51] 19221 Wandering ratio (119877
119908
) 119877119908
= 119862119897
119871119887
[52] 60122 Watershed eccentricity (120591) 120591 = [(|119871 cm
2
minus119882cm2
|)]05
119882cm [53] 088Drainage texture analysis
23 Stream frequency (119865119904
) 119865119904
= 119873119906
119860 [2] 153ndash29024 Drainage density (119863
119889
) km kms2 119863119889
= 119871119906
119860 [2] 192ndash30625 Constant of channel maintenance (119862) (kms2km) 119862 = 1119863
119889
[7] 033ndash05226 Drainage intensity (119863
119894
) 119863119894
= 119865119904
119863119889
[54] 079ndash11127 Infiltration number (119868
119891
) 119868119891
= 119865119904
lowast 119863119889
[54] 294ndash86128 Length of overland flow (119871
119892
) km 119871119892
= 1198602 lowast 119871119906
[3] 016ndash026Relief characteristics
29 Height of basin mouth (119911) m 154330 Maximum height of the basin (119885) m 583931 Total basin relief (119867) m 119867 = 119885 minus 119911 [4] 429632 Relief ratio (119877
ℎ
) 119877ℎ
= 119867119871119887
[7] 007ndash04433 Absolute relief (119877
119886
) m 583935 Ruggedness number (119877
119899
) 119877119899
= 119863119889
lowast (1198671000) [6] 302ndash64436 Dissection index (119863
119894119904
) 119863119894119904
= 119867119877119886
[55] 027ndash061
Table 2 Stream order-wise frequency distribution of number of streams along with their mean stream length drainage area and bifurcationratio
Stream order(119904119906
)Number ofstreams (119873
119906
)Mean stream
length (km) (119871119904119898
)Stream length ratio
(119871119906119903
)Drainage area
(km2)Bifurcation ratio
(119877119887
)1 677 285 349052 155 299 105 10029 4373 36 615 206 5032 4314 7 1160 189 1590 5145 2 2323 200 2246 3506 1 4008 173 1768 200
6 Geography Journal
6
5
4
3
2
1
0
Dist
ance
Watersheds
WS1
WS1
2W
S14
WS4
WS6
WS8
WS2
6W
S24
WS1
0W
S3W
S9W
S15
WS1
9W
S20
WS1
1W
S2W
S13
WS1
7W
S16
WS2
7W
S23
WS5
WS2
1W
S7W
S18
WS2
5W
S22
Cluster 1
Cluster 2
Cluster 3
Cluster 4
Cluster 5
(a)
6
7
5
4
3
2
1
0
Dist
ance
Watersheds
WS1
WS9
WS2
0W
S2W
S6W
S4W
S8W
S24
WS2
6W
S17
WS1
8W
S23
WS2
5W
S3W
S15
WS1
9W
S5W
S21
WS7
WS1
0W
S14
WS1
1W
S12
WS1
3W
S16
WS2
2W
S27
Cluster 1
Cluster 2
Cluster 3
Cluster 4
Cluster 5
(b)
6
7
5
4
3
2
1
0
Dist
ance
Watersheds
WS1
WS8
WS1
0W
S19
WS6
WS2
3W
S17
WS2
4W
S27
WS1
8W
S2W
S20
WS4
WS2
1W
S7W
S16
WS9
WS1
3W
S25
WS1
5W
S3W
S5W
S11
WS2
2W
S12
WS2
6W
S14
Cluster 1
Cluster 2
Cluster 3
Cluster 4
Cluster 5
(c)
6
5
4
3
2
1
0
Dist
ance
Watersheds
WS1
WS7
WS1
6W
S17
WS3
WS5
WS4
WS9
WS2
2W
S23
WS2
5W
S27
WS2
WS6
WS8
WS1
8W
S10
WS1
1W
S12
WS1
3W
S14
WS1
5W
S20
WS1
9W
S21
WS2
4W
S26
Cluster 1
Cluster 2
Cluster 3
Cluster 4
Cluster 5
(d)
Figure 3 Dendrogram showing groups having similar properties (a) related to drainage network (b) related to basin geometry (c) relatedto drainage texture analysis and (d) related to relief characteristics
ratio (119877119890) are found in WS3 WS5 WS17 WS19 WS21 WS23
and WS25 whereas low values are found in WS11 WS12WS13 WS14 and WS16 (Figures 4(b) and 4(c)) The relativespacing of channels in a drainage basin is expressed bytexture ratio (119877
119905) and drainage texture (119863
119905) The 119877
119905and 119863
119905
values of Supin basin range from 027 to 188 and 044 to255 respectively (Table 1) High values of 119863
119905are found in
subwatersheds located in the upper reaches of the basinwhereas low 119863
119905values are found in subwatersheds located
near the mouth of the basin (Figure 4(d))
119877119888bears a strong negative relationship with compactness
coefficient (119862119888) whereas 119865
119891has a positive relationship with
119877119890(Table 4) [28] Low values of 119877
119888(C4 and C5) (Table 3
Figure 3(b)) are associated with high relief and steep slopesand imply the youthful nature of these subwatersheds Thesubwatersheds belonging to C1 C2 and C3 (Figure 3(b))having high values of 119877
119888 119865119891 119877119890 119877119905 and 119863
119905and low values
of 119862119888are more circular in shape than those belonging to C4
and C5 (Table 3) Although the circular subwatersheds aremore efficient in the discharge of run-off [56] they are at
Geography Journal 7
0 25 5 7510(km)
78∘16998400E 78∘24998400E 78∘32998400E
78∘16998400E 78∘24998400E 78∘32998400E
31∘ 1
4998400 6998400998400
N31
∘ 10998400 N
31∘ 5
998400 N
31∘ 1
4998400 6998400998400
N31
∘ 10998400 N
31∘ 5
998400 N
31∘ 0
998400 13998400998400
N
78∘3799840022998400998400E
030ndash035036ndash041042ndash047
048ndash053054ndash059
(a)
0 25 5 7510(km)
78∘16998400E 78∘24998400E 78∘32998400E
78∘16998400E 78∘24998400E 78∘32998400E
31∘ 1
4998400 6998400998400
N31
∘ 10998400 N
31∘ 5
998400 N
31∘ 1
4998400 6998400998400
N31
∘ 10998400 N
31∘ 5
998400 N
31∘ 0
998400 13998400998400
N
78∘3799840022998400998400E
003ndash017018ndash032033ndash047
048ndash062063ndash076
(b)
0 25 5 7510(km)
78∘16998400E 78∘24998400E 78∘32998400E
78∘16998400E 78∘24998400E 78∘32998400E
31∘ 1
4998400 6998400998400
N31
∘ 10998400 N
31∘ 5
998400 N
31∘ 1
4998400 6998400998400
N31
∘ 10998400 N
31∘ 5
998400 N
31∘ 0
998400 13998400998400
N
78∘3799840022998400998400E
020ndash035036ndash051052ndash067
068ndash083084ndash099
(c)
0 25 5 7510(km)
78∘16998400E 78∘24998400E 78∘32998400E
78∘16998400E 78∘24998400E 78∘32998400E
31∘ 1
4998400 6998400998400
N31
∘ 10998400 N
31∘ 5
998400 N
31∘ 1
4998400 6998400998400
N31
∘ 10998400 N
31∘ 5
998400 N
31∘ 0
998400 13998400998400
N
78∘3799840022998400998400E
Very lowLowModerate
HighVery high
(d)
Figure 4 Map showing response of various basin geometry parameters in subwatersheds of Supin River basin (a) Circularity ratio (119877119888
) (b)Form ratio (119865
119891
) (c) Elongation ratio (119877119890
) (d) Drainage texture (119863119905
)
greater risk from flood hazard because they have a very shortlag time and high peak flows than the elongated basins [57]The elongated subwatersheds on the other hand have lowside flow for shorter duration and high main flow for longerduration and are less susceptible to flood hazard
43 Drainage Texture Analysis Texture indicates the amountof landscape dissection by a channel network and includesstream frequency (119865
119904) drainage density (119863
119889) constant of
channel maintenance (119862) length of overland flow (119871119892) and
infiltration number (119868119891) High values of 119865
119904and 119863
119889are found
in WS3 WS5 WS11 WS14 WS22 and WS25 whereas lowvalues of 119865
119904and 119863
119889are found in WS1 WS6 WS18 WS23
andWS27 (Figures 5(a) and 5(b))The119862 value of Supin basinvaries from 033 to 052 (Table 1)The 119871
119892value of Supin basin
ranges from 016 to 026 and 119868119891value ranges from 294 to 861
(Table 1) Low 119871119892values and high 119868
119891values are found inWS3
WS5 WS11 WS12 WS14 and WS22 (Figures 5(c) and 5(d))which have corresponding high 119865
119904and 119863
119889values (Figures
5(a) and 5(b))119865119904and119863
119889provide a numericalmeasurement of landscape
dissection and run-off potential [16] and bears a nega-tive relationship with 119871
119892and 119868
119891(Table 4) Subwatersheds
belonging to C3 C4 and C5 (Table 3 Figure 3(c)) withlow values of 119871
119892and 119862 have developed numerous drainage
lines on the surface The high values of 119865119904and 119863
119889in these
subwatershedsmaybe due to high relief steep slopes and alsolow permeability of the underlying rocks
44 Relief Characteristics The relief properties in morpho-metric analysis bring into consideration the influence ofaspect and height over a large basin area Relief ratio (119877
ℎ)
ruggedness number (119877119899) and dissection index (119863
119894119904) indicate
the erosion potential of the processes operating within a
8 Geography Journal
Table3
Detailedresultof
hierarchical
cluste
ranalysisforfour
morph
ometric
prop
ertie
sof
SupinRiverbasin
(drainagenetwork
basin
geom
etryd
rainagetextureanalysis
andrelief
characteris
tics)
Drainagen
etwork
ClusterID
Num
bero
fstre
am(119873119906
)To
talstre
amleng
th(K
m)
Meanstr
eam
leng
thratio
(119871119906119903119898
)Bifurcationratio
(119877119887
)Rh
ocoefficient(120588)
C13233
5425
298
294
107
C22400
3903
280
327
090
C36700
10514
291
270
108
C41250
1980
259
200
127
C52850
4877
449
335
136
Basin
geom
etry
ClusterID
Form
ratio
(119865119891
)Shapefactor
Elon
gatio
nratio
(119877119890
)Texturer
atio
(119877119905
)Circularity
ratio
(119877119888
)Drainagetexture
(119863119905
)Com
pactness
Coefficient(119862119888
)C1
035
312
066
099
047
128
147
C2057
179
085
061
047
079
147
C3056
187
084
136
042
183
157
C4007
1599
030
099
037
128
169
C5017
917
044
048
036
065
169
Drainagetexture
ClusterID
Stream
frequ
ency
(119865119904
)Drainaged
ensity(119863119889
)Con
stant
ofchannel
maintenance
(119862)
drainage
intensity
(119863119894
)Infiltrationnu
mber
(119868119891
)Leng
thof
overland
flow(119871119892
)C1
223
216
046
103
482
023
C218
9215
047
088
410
023
C3241
253
040
095
611
020
C4281
298
034
094
838
017
C5238
289
035
083
686
017
Reliefcharacteristics
ClusterID
Reliefratio
(119877ℎ
)Diss
ectio
nindex(119863119894119904
)Gradientratio
(119877119892
)Ru
ggednessnu
mber
(119877119899
)C1
026
047
024
495
C2035
043
042
353
C3029
030
041
351
C4010
032
011
452
C5029
044
017
561
Geography Journal 9
0 25 5 7510(km)
78∘16998400E 78∘24998400E 78∘32998400E
78∘16998400E 78∘24998400E 78∘32998400E
31∘ 1
4998400 6998400998400
N31
∘ 10998400 N
31∘ 5
998400 N
31∘ 1
4998400 6998400998400
N31
∘ 10998400 N
31∘ 5
998400 N
31∘ 0
998400 13998400998400
N
78∘3799840022998400998400E
153ndash180181ndash208209ndash236
237ndash264265ndash292
(a)
0 25 5 7510(km)
78∘16998400E 78∘24998400E 78∘32998400E
78∘16998400E 78∘24998400E 78∘32998400E
31∘ 1
4998400 6998400998400
N31
∘ 10998400 N
31∘ 5
998400 N
31∘ 1
4998400 6998400998400
N31
∘ 10998400 N
31∘ 5
998400 N31
∘ 0998400 1
3998400998400N
78∘3799840022998400998400E
193ndash215216ndash239240ndash263
264ndash287288ndash311
(b)
0 25 5 7510(km)
78∘16998400E 78∘24998400E 78∘32998400E
78∘16998400E 78∘24998400E 78∘32998400E
31∘ 1
4998400 6998400998400
N31
∘ 10998400 N
31∘ 5
998400 N
31∘ 1
4998400 6998400998400
N31
∘ 10998400 N
31∘ 5
998400 N
31∘ 0
998400 13998400998400
N
78∘3799840022998400998400E
016ndash018019ndash021022ndash024
025ndash027028ndash030
(c)
0 25 5 7510(km)
78∘16998400E 78∘24998400E 78∘32998400E
31∘ 1
4998400 6998400998400
N31
∘ 10998400 N
31∘ 5
998400 N
31∘ 1
4998400 6998400998400
N31
∘ 10998400 N
31∘ 5
998400 N
31∘ 0
998400 13998400998400
N
78∘16998400E 78∘24998400E 78∘32998400E 78∘3799840022998400998400E
294ndash407408ndash521522ndash635
636ndash749750ndash863
(d)
Figure 5 Map showing response of various drainage texture parameters in subwatersheds of Supin River basin (a) Stream Frequency (119865119904
)(b) Drainage Density (119863
119889
) (c) Length of overland flow (119871119892
) (d) Infiltration Number (119868119891
)
drainage basin The total basin relief (Z-z) of Supin basin is4296m (Table 1) The 119877
ℎvalue of Supin basin ranges from
007ndash044 with high values in WS2 WS5 WS17 WS19 WS21WS23WS24WS25WS26 andWS27 and low values inWS1WS9WS10WS11WS12WS13 andWS14 (Figure 6(a))Highvalues of119877
119899and119863
119894119904are found inWS3WS4WS5WS7WS9
WS19 and WS20 which indicates the steepness of slope andhigh degree of dissection of these subwatersheds whereaslow values are found in WS10 WS11 WS12 WS13 and WS14(Figures 6(b) and 6(c)) 119877
ℎis related to the channel gradient
and has a negative relationship with basin length (Table 4)Subwatersheds having high values of 119863
119905(C3 in Figure 3(b))
also have high values of 119877119899(C1 and C5 in Figure 3(d)) since
119877119899has a positive correlation with119863
119905(Table 4)The low119863
119894119904of
Supin basin (027ndash061) indicates that the basin is moderatelydissected (Table 1)
45 Hypsometry Analysis Hypsometric curve of a drainagebasin represents the relative proportion of watershed areabelow or above a given elevation It is a measure of theerosional state or geomorphic age of a drainage basin as itrepresents the mass of drainage basin remaining above abasal plane of reference Convex hypsometric curves indicateyouthful stage S-shaped curves indicate a mature stageand concave curves indicate peneplain stage [5] Here thehypsometric curve has been treated as a cumulative proba-bility distribution and statistical moments have been used todescribe the curve quantitatively [58]The hypsometric curvehas been derived by fitting a 5th order polynomial functionwhich is as follows
119891 (119909) = 1198600+ 1198601lowast 119909 + 119860
2lowast 1199092
+ 1198603lowast 1199093
+ 1198604lowast 1199094
+ 1198605lowast 1199095
(1)
10 Geography Journal
78∘16998400E 78∘24998400E 78∘32998400E
78∘16998400E 78∘24998400E 78∘32998400E
31∘ 1
4998400 6998400998400
N31
∘ 10998400 N
31∘ 5
998400 N
31∘ 1
4998400 6998400998400
N31
∘ 10998400 N
31∘ 5
998400 N
31∘ 0
998400 13998400998400
N
78∘3799840022998400998400E
070ndash014015ndash022023ndash030
031ndash038039ndash046
0 25 5 7510(km)
(a)
78∘16998400E 78∘24998400E 78∘32998400E
78∘16998400E 78∘24998400E 78∘32998400E
31∘ 1
4998400 6998400998400
N31
∘ 10998400 N
31∘ 5
998400 N
31∘ 1
4998400 6998400998400
N31
∘ 10998400 N
31∘ 5
998400 N
31∘ 0
998400 13998400998400
N
78∘3799840022998400998400E
30ndash368369ndash437438ndash506
507ndash575576ndash644
0 25 5 7510(km)
(b)
78∘16998400E 78∘24998400E 78∘32998400E
78∘16998400E 78∘24998400E 78∘32998400E
31∘ 1
4998400 6998400998400
N31
∘ 10998400 N
31∘ 5
998400 N
31∘ 1
4998400 6998400998400
N31
∘ 10998400 N
31∘ 5
998400 N
31∘ 0
998400 13998400998400
N
78∘3799840022998400998400E
025ndash032033ndash040041ndash048
049ndash056057ndash064
0 25 5 7510(km)
(c)
Figure 6 Map showing response of various parameters of relief characteristics in subwatersheds of Supin River basin (a) Relief Ratio (119877ℎ
)(b) Ruggedness Number (119877
119899
) (c) Dissection Index (119863119894119904
)
Table 4 Linear correlation among selected morphometric parameters of Supin River basin along with the calculated 119905 and corresponding Pvalues
Variables (119909axismdash119910axis) Linear equation 1199032
|119905| P valueCircularity ratiomdashcompactness coefficient y = minus05024x + 12084 098 3574 0Form ratiomdashelongation ratio y = 10564x + 02624 097 2985 0Drainage densitymdashstream frequency y = 08838x + 04434 069 754 689E minus 08Constant of channel maintenancemdashstream frequency y = minus48551x + 43025 071 786 327E minus 08Constant of channel maintenancemdashdrainage density y = minus60512x + 49628 098 3768 0Length of overland flowmdashstream frequency y = minus00733x + 03741 071 786 327E minus 08Length of overland flowmdashdrainage density y = minus00812x + 04065 098 3768 0Infiltration numbermdashdrainage density y = 02144x + 12349 092 1690 333E minus 15Number of streams of all ordermdashdrainage texture y = 0021x + 05454 094 1911 222E minus 16Relief ratiomdashbasin length y = minus44247x + 20059 082 1053 113E minus 10Drainage texturemdashruggedness number y = 16296x + 25781 066 691 305E minus 07
Geography Journal 11
10
09
08
07
06
05
04
03
02
01
0000 01 02 03 04 05 06 07 08 09 10
Relat
ive h
eigh
t (hH
)
Relative area (aA)
HI = 058
Parameters Value Standard errorA0A1
A2
A3A4
A5
10062721minus044984000446
minus204E minus 04minus367E minus 07142E minus 08
07324901358600083
207E minus 04224E minus 06879E minus 09
Adjusted R2 = 099953
Reduced 1205942 = 287256E minus 5
(a)
78∘12998400E 78∘16998400E 78∘20998400E 78∘24998400E 78∘28998400E 78∘32998400E 78∘36998400E
78∘12998400E 78∘16998400E 78∘20998400E 78∘24998400E 78∘28998400E 78∘32998400E 78∘36998400E
31∘ 1
2998400 N31
∘ 8998400 N
31∘ 4
998400 N31
∘ 0998400 N
31∘ 1
2998400 N31
∘ 8998400 N
31∘ 4
998400 N31
∘ 0998400 N
Hypsometric integralHypsometry
036ndash040041ndash047048ndash051
052ndash055056ndash062
WS27
19 WS
1 WS2 WS
3 WS
4 WS
5 WS
6 WS
7 WS
8 WS
9 WS
10 WS11 WS
12 WS
13 WS
14 WS15 WS
16 WS
17 WS
18 WS
20 WS
21 WS
22 WS23 WS
24 WS
25 WS
26 WS
(b)
Figure 7 Analysis of hypsometric integral (HI) as an index of basin maturity (a) Hypsometric curve of Supin River basin along with theestimated coefficients of 5th order polynomial function (b) Thematic map showing the variation of Hypsometric Integral (HI) among thesubwatersheds of Supin River basin
12 Geography Journal
The estimated coefficients are 1198600 1198601 1198602 1198603 1198604 and 119860
5
which can be obtained from regression of the hypsometriccurve (Figure 7(a)) The statistical moments of hypsometriccurve include skewness of the hypsometric curve (minus0474)kurtosis of the hypsometric curve (2495) skewness of thehypsometric density function (minus0413) and kurtosis of thehypsometric density function (2392) These are collectivelyknown as the derived parameters of hypsometric curve Thearea below the hypsometric curve is known as the hypsomet-ric integral (HI) and is calculated using the following formula
HI = (119898 minus 119897)
(ℎ minus 119897)
(2)
where HI is hypsometric integral 119898 is mean elevation ℎ ismaximumelevation and 119897 isminimumelevationHI has beencalculated for all the subwatersheds of Supin River basinTheconvex hypsometric curve (Figure 7(a)) of Supin River basinshows HI value of 058 The HI values for the subwatershedsrange from 036 to 062 (Figure 7(b))
The derived parameters of hypsometric curve are sen-sitive to subtle changes in overall basin slope and basindevelopment as the mass is removed by erosion over a longgeological time period [59] Present study shows that headward development of the main stream and its tributariesproduce high values for hypsometric skewness [59] On theother hand the density function of the curve is closely relatedto rates of change in overall basin slope and tendency towardgeomorphic equilibrium [59] Density skewness interpretsthe behaviour of slope change in the basin Positive valueof density skewness is an indication of fluvial dominanceover the landforms of this regionHypsometric Kurtosis valueconfirms that erosional processes are dominant on both theupper and lower reaches of the basin [60] Mid basin slopeis moderate as the density Kurtosis value is platykurtic innature The HI value of Supin basin (058) indicates thatthe basin is at a youthful stage of development [6] A fewsubwatersheds showing low HI values (Figure 7(b)) haveattained relatively mature stage and are in a state of reachingdynamic equilibrium Most of the subwatersheds showinghigh HI are located on the hanging wall of MCT and MT(Figures 2(b) and 7(b)) which also indicate a subsurfacecontrol on the maturity of the Supin River basin
5 Conclusion
There is a structural influence on drainage developmentwith trellised pattern being the dominant drainage patternChannel extension in this mountainous region takes placemainly through headward erosion which is characteristicof basins in early mature stage of development The areais well drained by the 1st and 2nd order streams havinghighest drainage area which produces a rugged terrainmoderately dissected by deep incised valleys The high reliefandmoderate permeability of the surface in relatively circularsubwatersheds with high circularity ratio generates high run-offs which make these subwatersheds more susceptible tofloods soil erosion and debris flow In a few elongated sub-watersheds the management of flood flow is easier because of
the low side flow for shorter duration and smaller peak flowsfor longer duration
Fourth and 5th order streams flowing along regional faultzones may generate landslides due to increase in the level oferosion In addition an increase in the incision of the streamsalong the weak and fractured fault zones results in increase inthe sediment load of the streams which in turn may triggerflash floods Sudden topographic breaks along the 6th orderstream profile of the basin at multiple places influence thetectonomorphic landforms developed along Supin River
The significance of studying morphometric properties ofSupin basin lies in the fact that it will help in future watershedmanagement and hazard management studies Due to themountainous nature of the terrain the region suffers fromfrequent flash floods and landslides Hence such type of stud-ies will provide knowledge and database for decision makingfor strategic planning and delineation of prioritised hazardmanagement zones Through understanding of the relationbetween the basin morphometry and subsurface structurethe authors conclude that the lower middle portion of thebasin underlain by Lesser Himalayan schists and granitesare likely to have high groundwater potential which may beharnessed to help the people of the nearby villages Moreoverit may also help in assessing the groundwater potential ofthe region and delineating effective water harvesting sitesThese morphometric techniques may be applied to othermountainous river basins around the globe Morphometricanalysis thus has a wider significance in watershed priori-tisation and management soil erosion studies groundwaterpotential assessment and flood hazard risk reduction in theSupin watershed that forms an important tributary of theTons River basin
Conflict of Interests
The authors declare that there is no conflict of interestsregarding the publication of this paper
Acknowledgments
Assistance from the postgraduate students of the Depart-ment of Geography University of Calcutta during fieldwork was gratefully acknowledged Infrastructural facilitieswere provided by the Department of Geology University ofCalcutta and the Remote Sensing amp GIS Department of theVidyasagar University Thanks are due to Professor SunandoBandyopadhyay Department of Geography University ofCalcutta Comments from the anonymous reviewers aregratefully acknowledged
References
[1] J I Clarke ldquoMorphometry from mapsrdquo in Essays in Geomor-phology G H Dury Ed pp 235ndash274 Elsevier New York NYUSA 1966
[2] R E Horton ldquoDrainage basin characteristicsrdquo Transactions ofAmerican Geophysics Union vol 13 pp 350ndash361 1932
Geography Journal 13
[3] R E Horton ldquoErosional development of streams and theirdrainage basins hydrophysical approach to quantitative mor-phologyrdquoGeological Society of America Bulletin vol 56 pp 275ndash370 1945
[4] A N Strahler ldquoHypsometric analysis of erosional topographyrdquoBulletin of the Geological Society of America vol 63 pp 1117ndash1142 1952
[5] A N Strahler ldquoQuantitative analysis of watershed geomorphol-ogyrdquo Transactions of American Geophysics Union vol 38 pp913ndash920 1957
[6] A N Strahler ldquoQuantitative geomorphology of drainage basinand channel networksrdquo inHandbook of Applied Hydrology V TChow Ed McGraw Hill New York NY USA 1964
[7] S A Schumm ldquoEvolution of drainage systems and slopes inbadlands at Perth Amboy New Jerseyrdquo Bulletin of the GeologicalSociety of America vol 67 pp 597ndash646 1956
[8] R J Chorley andMAMorgan ldquoComparison ofmorphometricfeatures UnakaMountains Tennessee andNorth Carolina andDartmoor EnglandrdquoGeological Society of America Bulletin vol73 no 1 pp 17ndash34 1962
[9] P W Williams ldquoMorphometric analysis of polygonal karst inNew GuineardquoGeological Society of America Bulletin vol 83 no3 pp 761ndash796 1972
[10] L M Mesa ldquoMorphometric analysis of a subtropical Andeanbasin (Tucuman Argentina)rdquo Environmental Geology vol 50no 8 pp 1235ndash1242 2006
[11] P Lyew-Ayee H A Viles and G E Tucker ldquoThe use of GIS-based digital morphometric techniques in the study of cockpitkarstrdquo Earth Surface Processes and Landforms vol 32 no 2 pp165ndash179 2007
[12] T B Altin and B N Altin ldquoDevelopment and morphometry ofdrainage network in volcanic terrain Central Anatolia TurkeyrdquoGeomorphology vol 125 no 4 pp 485ndash503 2011
[13] M Buccolini L Coco C Cappadonia and E RotiglianoldquoRelationships between a new slope morphometric index andcalanchi erosion in northern Sicily Italyrdquo Geomorphology vol149-150 pp 41ndash48 2012
[14] S S Vittala S Govindaih and H H Gowda ldquoMorphometricanalysis of sub-watershed in the Pavada area of Tumkur districtSouth India using remote sensing and GIS techniquesrdquo Journalof Indian Society of Remote Sensing vol 32 no 4 pp 351ndash3622004
[15] R Chopra R D Dhiman and P K Sharma ldquoMorphometricanalysis of sub-watersheds in Gurdaspur district Punjab usingremote sensing and GIS techniquesrdquo Journal of Indian Society ofRemote Sensing vol 33 no 4 pp 531ndash539 2005
[16] H Vijith and R Sateesh ldquoGIS based morphometric analysis oftwomajor upland sub-watersheds ofMeenachil river in KeralardquoJournal of the Indian Society of Remote Sensing vol 34 no 2 pp181ndash185 2006
[17] M Rudraiah S Govindaiah and S S Vittala ldquoMorphometryusing remote sensing and GIS techniques in the sub-basins ofKagna river basin Gulburga district Karnataka Indiardquo Journalof the Indian Society of Remote Sensing vol 36 no 4 pp 351ndash360 2008
[18] M Bagyaraj and B Gurugnanam ldquoSignificance of morphom-etry studies soil characteristics erosion phenomena and land-form processes using remote Sensing and GIS for KodaikanalHills a global biodiversity hotpot in Western Ghats DindigulDistrict Tamil Nadu South Indiardquo Research Journal of Environ-mental and Earth Sciences vol 3 no 3 pp 221ndash233 2011
[19] I Malik S Bhat and N A Kuchay ldquoWatershed based drainagemorphometric analysis of Lidder catchment in Kashmir valleyusing Geographical Information Systemrdquo Recent Research inScience and Technology vol 3 no 4 pp 118ndash126 2011
[20] J Thomas S Joseph K P Thrivikramji and G Abe ldquoMor-phometric analysis of the drainage system and its hydrologicalimplications in the rain shadow regions Kerala Indiardquo Journalof Geographical Sciences vol 21 no 6 pp 1077ndash1088 2011
[21] N S Magesh K V Jitheshlal N Chandrasekar and K V JinildquoGIS based morphometric evaluation of Chimmini andMupilywatersheds parts of Western Ghats Thrissur District KeralaIndiardquo Earth Science Information vol 5 no 2 pp 111ndash121 2012
[22] P Singh J K Thakur and U C Singh ldquoMorphometric analysisof Morar River Basin Madhya Pradesh India using remotesensing and GIS techniquesrdquo Environmental Earth Science vol68 no 7 pp 1967ndash1977 2012
[23] K Pareta and U Pareta ldquoQuantitative geomorphological analy-sis of a watershed of Ravi River Basin HP Indiardquo InternationalJournal of Remote Sensing and GIS vol 1 no 1 pp 41ndash56 2012
[24] S K Nag and S Chakraborty ldquoInfluence of rock types andstructures in the development of drainage network in hard rockareardquo Journal of Indian Society of Remote Sensing vol 31 no 1pp 25ndash35 2003
[25] J D Das Y Shujat and A K Saraf ldquoSpatial technologiesin deriving the morphotectonic characteristics of tectonicallyactive Western Tripura Region Northeast Indiardquo Journal of theIndian Society of Remote Sensing vol 39 no 2 pp 249ndash258 2011
[26] R Bali K K Agarwal S Nawaz Ali S K Rastogi andK Krishna ldquoDrainage morphometry of Himalayan Glacio-fluvial basin India hydrologic and neotectonic implicationsrdquoEnvironmental Earth Sciences vol 66 no 4 pp 1163ndash1174 2012
[27] A Demoulin ldquoBasin and river profile morphometry a newindex with a high potential for relative dating of tectonic upliftrdquoGeomorphology vol 126 no 1-2 pp 97ndash107 2011
[28] P D Sreedevi K Subrahmanyam and S Ahmed ldquoThe sig-nificance of morphometric analysis for obtaining groundwaterpotential zones in a structurally controlled terrainrdquo Environ-mental Geology vol 47 no 3 pp 412ndash420 2005
[29] K Narendra and K N Rao ldquoMorphometry of theMeghadrigedda watershed Visakhapatnam District AndhraPradesh using GIS and Resourcesat datardquo Journal of IndianSociety of Remote Sensing vol 34 no 2 pp 102ndash110 2006
[30] KAvinash K S Jayappa andBDeepika ldquoPrioritization of sub-basins based on geomorphology and morphometricanalysisusing remote sensing and geographic informationsystem (GIS)techniquesrdquo Geocarto International vol 26 no 7 pp 569ndash5922011
[31] A Mishra D P Dubey and R N Tiwari ldquoMorphometricanalysis of Tons basin Rewa District Madhya Pradesh basedon watershed approachrdquo Earth Science India vol 4 no 3 pp171ndash180 2011
[32] I Jasmin and P Mallikarjuna ldquoMorphometric analysis ofAraniar river basin using remote sensing and geographicalinformation system in the assessment of groundwater poten-tialrdquo Arab Journal of Geosciences vol 6 no 10 pp 3683ndash36922013
[33] A Javed M Y Khanday and S Rais ldquoWatershed prioritizationusing morphometric and land useland cover parameters aremote sensing and GIS based approachrdquo Journal of the Geo-logical Society of India vol 78 no 1 pp 63ndash75 2011
14 Geography Journal
[34] P C Patton and V R Baker ldquoMorphometry and floods in smalldrainage basins subject to diverse hydrogeomorphic controlsrdquoWater Resources Research vol 12 no 5 pp 941ndash952 1976
[35] M Diakakis ldquoA method for flood hazard mapping based onbasin morphometry application in two catchments in GreecerdquoNatural Hazards vol 56 no 3 pp 803ndash814 2011
[36] H B Wakode D Dutta V R Desai K Baier and R AzzamldquoMorphometric analysis of the upper catchment of Kosi Riverusing GIS techniquesrdquo Arabian Journal of Geosciences vol 6no 2 pp 395ndash408 2011
[37] S A Romshoo S A Bhat and I Rashid ldquoGeoinformatics forassessing the morphometric control on hydrological responseat watershed scale in the Upper Indus basinrdquo Journal of EarthSystem Science vol 121 no 3 pp 659ndash686 2012
[38] A Yin ldquoCenozoic tectonic evolution of the Himalayan orogenas constrained by along-strike variation of structural geometryexhumation history and foreland sedimentationrdquoEarth-ScienceReviews vol 76 no 1-2 pp 1ndash131 2006
[39] K S Valdiya Geology of the Kumaon Lesser Himalaya WadiaInstitute of Himalaya Uttarakhand India 1980
[40] P Srivastava and G Mitra ldquoThrust geometries and deep struc-ture of the outer and lesser Himalaya Kumaon and Garhwal(India) implications for evolution of the Himalayan fold-and-thrust beltrdquo Tectonics vol 13 no 1 pp 89ndash109 1994
[41] P G DeCelles G E Gehrels J Quade and T P Ojha ldquoEocene-early Miocene foreland basin development and the history ofHimalayan thrusting western and central NepalrdquoTectonics vol17 no 5 pp 741ndash765 1998
[42] P G DeCelles D M Robinson and G Zandt ldquoImplicationsof shortening in the Himalayan fold-thrust belt for uplift of theTibetan Plateaurdquo Tectonics vol 21 no 6 pp 1ndash25 2002
[43] O N Pearson and P G DeCelles ldquoStructural geologyand regional tectonic significance of the Ramgarh thrustHimalayan fold-thrust belt of Nepalrdquo Tectonics vol 24 no 4Article ID TC4008 pp 1ndash26 2005
[44] N McQuarrie D Robinson S Long et al ldquoPreliminarystratigraphic and structural architecture of Bhutan implicationsfor the along strike architecture of theHimalayan systemrdquoEarthand Planetary Science Letters vol 272 no 1-2 pp 105ndash117 2008
[45] J C Vannay and BGrasemann ldquoHimalayan invertedmetamor-phism and syn-convergence extension as a consequence of ageneral shear extrusionrdquo Geological Magazine vol 138 no 3pp 253ndash276 2001
[46] K S Valdiya ldquoReactivation of terrane-defining boundarythrusts in central sector of the Himalaya implicationsrdquo CurrentScience vol 81 no 11 pp 1418ndash1431 2001
[47] R Kumar S K Ghosh R K Mazari and S J SangodeldquoTectonic impact on the fluvial deposits of Plio-PleistoceneHimalayan foreland basin Indiardquo SedimentaryGeology vol 158no 3-4 pp 209ndash234 2003
[48] H K Sachan M J Kohn A Saxena and S L Corrie ldquoTheMalari leucogranite Garhwal Himalaya Northern India chem-istry age and tectonic implicationsrdquo Bulletin of the GeologicalSociety of America vol 122 no 11-12 pp 1865ndash1876 2010
[49] J E Mueller ldquoAn introduction to the hydraulic and topographicsinuosity indexesrdquo Annals of the Association of American Geog-raphers vol 58 no 2 pp 371ndash385 1968
[50] H Gravelius Flusskunde Goschenrsquosche VerlagshandlungBerlin Germany 1941
[51] M A Melton An Analysis of the Relations among Elementsof Climate Surface Properties and Geomorphology ColumbiaUniversity New York NY USA 1957
[52] J S Smart and A J Surkan ldquoThe relation between mainstreamlength and area in drainage basinsrdquo Water Resources Researchvol 3 no 4 pp 963ndash974 1967
[53] P E Black ldquoHydrograph responses to geomorphic modelwatershed characteristics and precipitation variablesrdquo Journal ofHydrology vol 17 no 4 pp 309ndash329 1972
[54] A Faniran ldquoThe index of drainage intensity -a provisional newdrainage factorrdquo Australian Journal of Science vol 31 pp 328ndash330 1968
[55] S Singh and A Dubey Geo-environmental Planning of Water-sheds in India vol 28 Chugh Allahabad India 1994
[56] S Singh and M C Singh ldquoMorphometric analysis of Kanharriver basinrdquo National Geographical Journal of India vol 43 no1 pp 31ndash43 1997
[57] D Waugh Geography An Integrated Approach Nelson NewYork NY USA 1995
[58] J M Harlin ldquoStatistical moments of the hypsometric curve andits density functionrdquo Journal of the International Association forMathematical Geology vol 10 no 1 pp 59ndash72 1978
[59] J M Harlin ldquoThe effect of precipitation variability on drainagebasin morphometryrdquo American Journal of Science vol 280 no8 pp 812ndash825 1980
[60] W Luo ldquoQuantifying groundwater-sapping landforms witha hypsometric techniquerdquo Journal of Geophysical Research EPlanets vol 105 no 1 pp 1685ndash1694 2000
Submit your manuscripts athttpwwwhindawicom
Child Development Research
Hindawi Publishing Corporationhttpwwwhindawicom Volume 2014
Education Research International
Hindawi Publishing Corporationhttpwwwhindawicom Volume 2014
Biomedical EducationJournal of
Hindawi Publishing Corporationhttpwwwhindawicom Volume 2014
Hindawi Publishing Corporationhttpwwwhindawicom Volume 2014
Psychiatry Journal
ArchaeologyJournal of
Hindawi Publishing Corporationhttpwwwhindawicom Volume 2014
Hindawi Publishing Corporationhttpwwwhindawicom Volume 2014
AnthropologyJournal of
Hindawi Publishing Corporationhttpwwwhindawicom Volume 2014
Research and TreatmentSchizophrenia
Hindawi Publishing Corporationhttpwwwhindawicom Volume 2014
Urban Studies Research
Population ResearchInternational Journal of
Hindawi Publishing Corporationhttpwwwhindawicom Volume 2014
CriminologyJournal of
Hindawi Publishing Corporationhttpwwwhindawicom Volume 2014
Aging ResearchJournal of
Hindawi Publishing Corporationhttpwwwhindawicom Volume 2014
Hindawi Publishing Corporationhttpwwwhindawicom Volume 2014
NursingResearch and Practice
Current Gerontologyamp Geriatrics Research
Hindawi Publishing Corporationhttpwwwhindawicom
Volume 2014
Sleep DisordersHindawi Publishing Corporationhttpwwwhindawicom Volume 2014
AddictionJournal of
Hindawi Publishing Corporationhttpwwwhindawicom Volume 2014
Depression Research and TreatmentHindawi Publishing Corporationhttpwwwhindawicom Volume 2014
Hindawi Publishing Corporationhttpwwwhindawicom Volume 2014
Geography Journal
Hindawi Publishing Corporationhttpwwwhindawicom Volume 2014
Research and TreatmentAutism
Hindawi Publishing Corporationhttpwwwhindawicom Volume 2014
Economics Research International
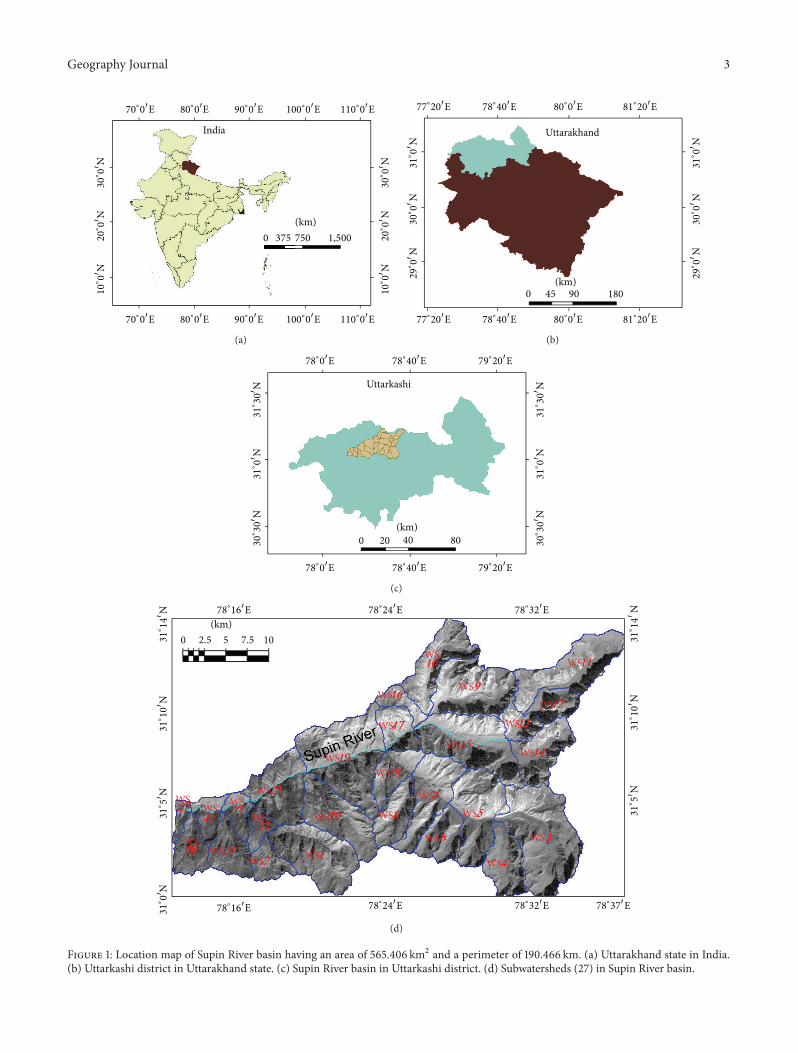
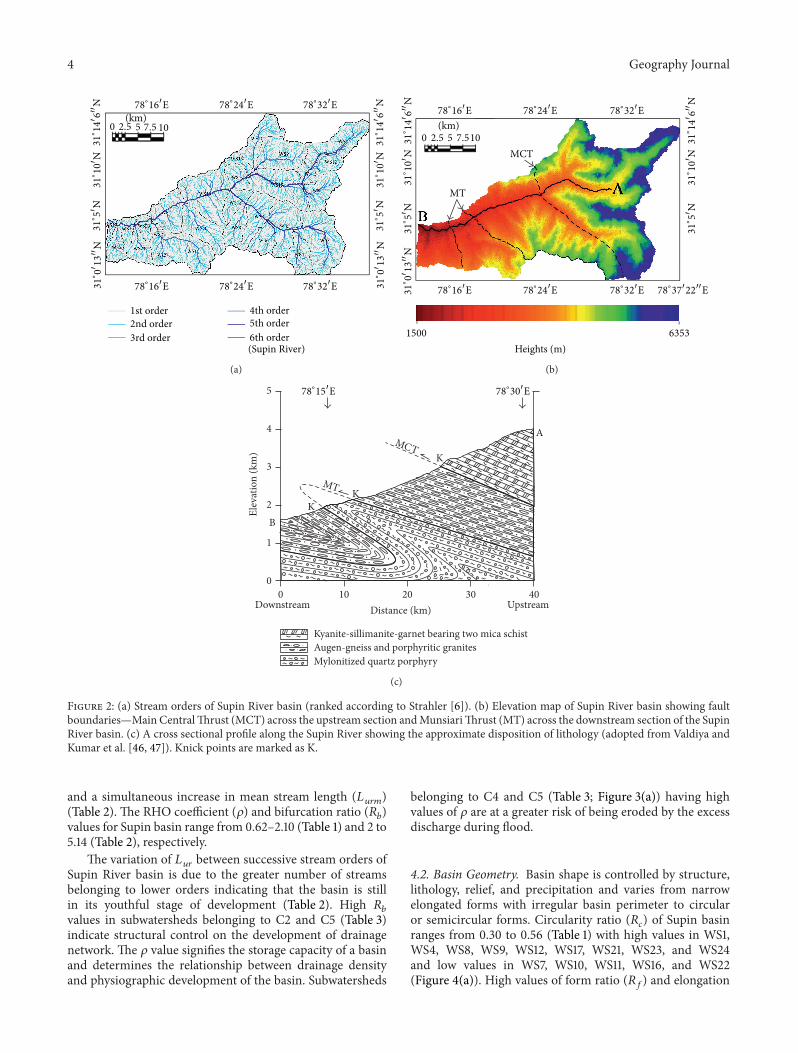
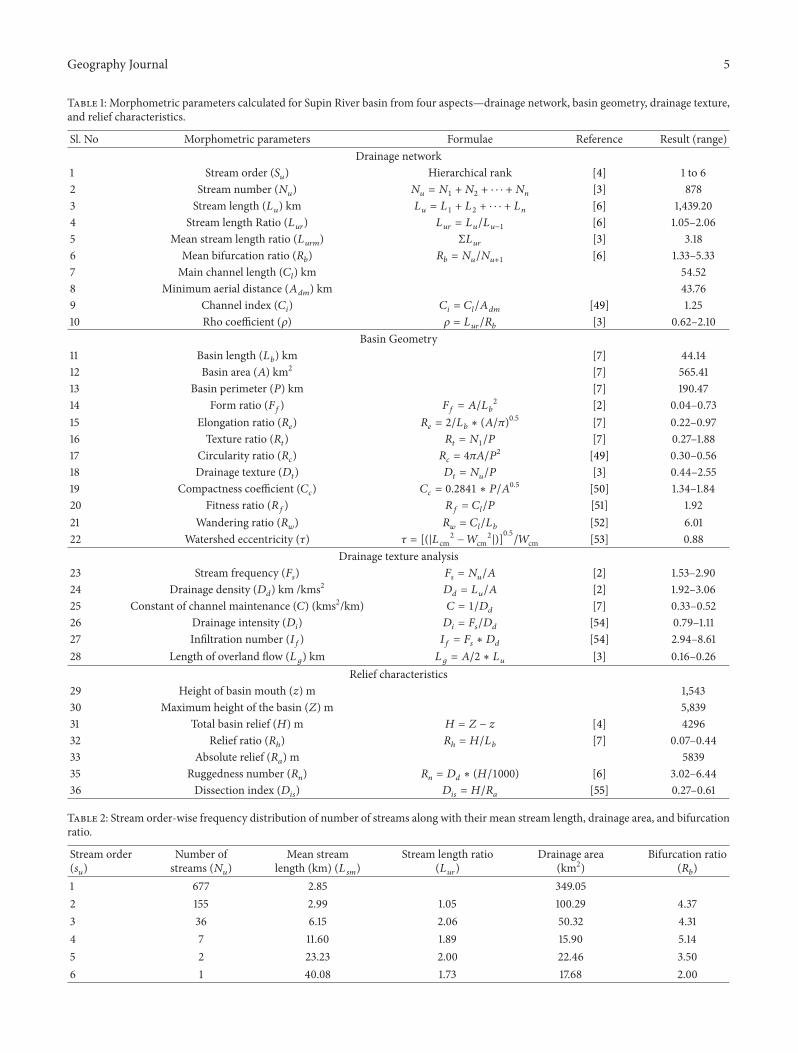
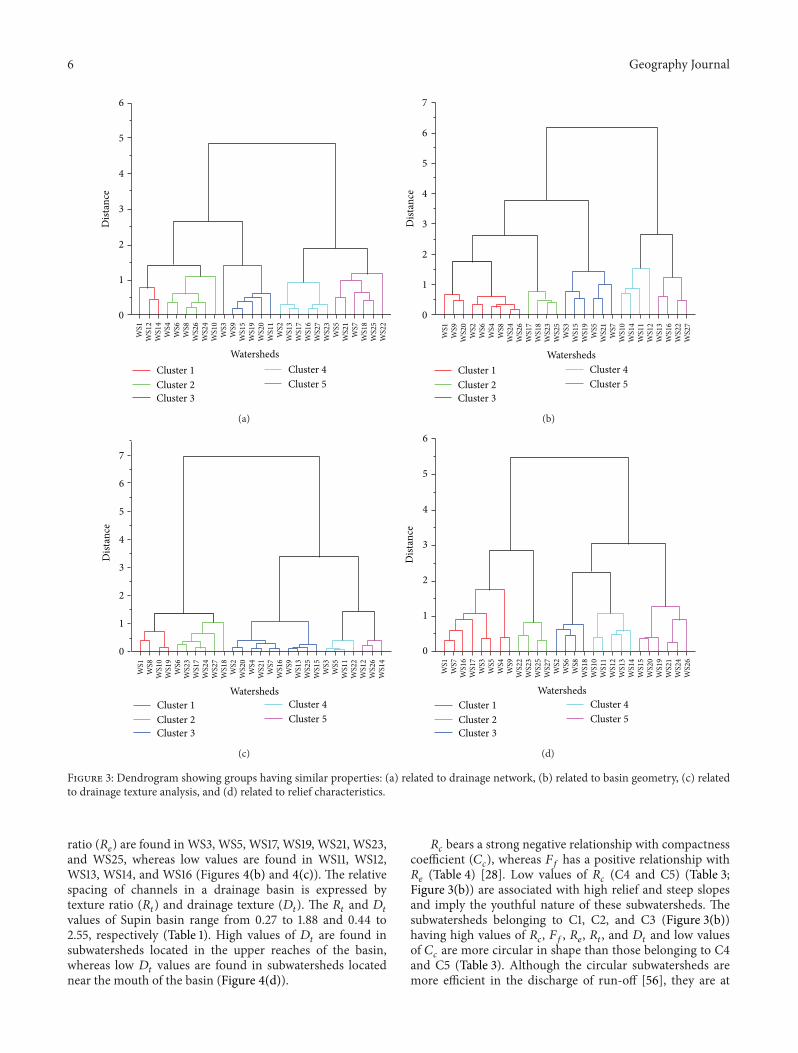
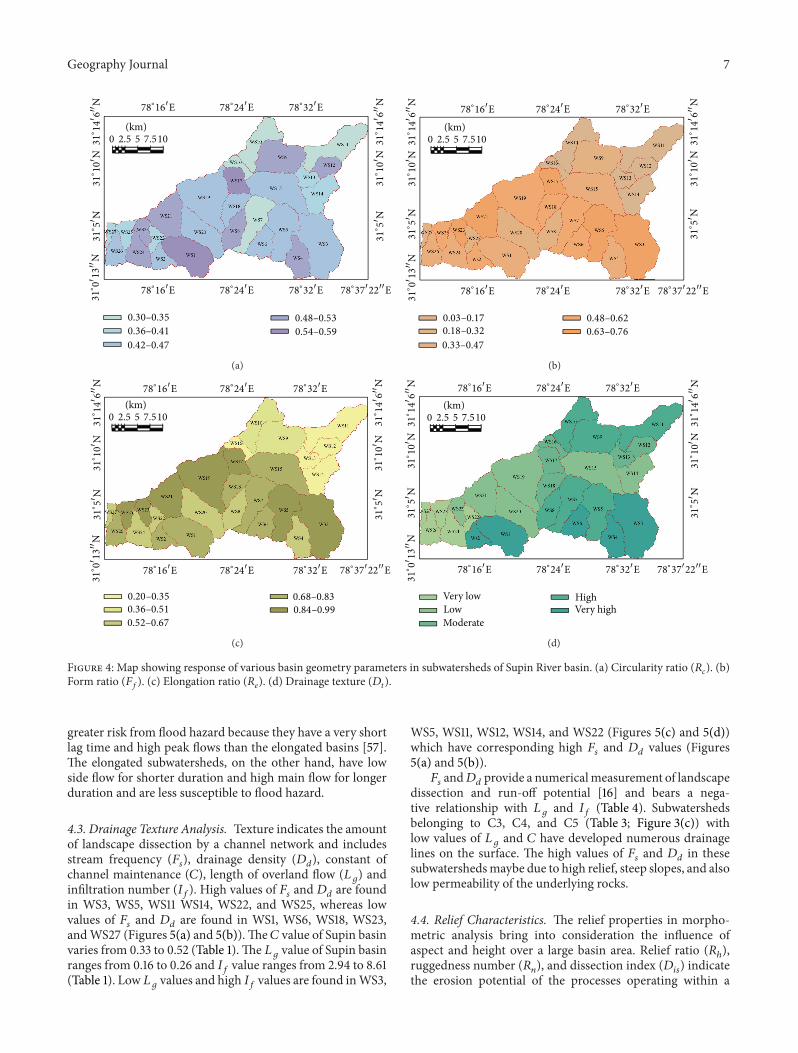
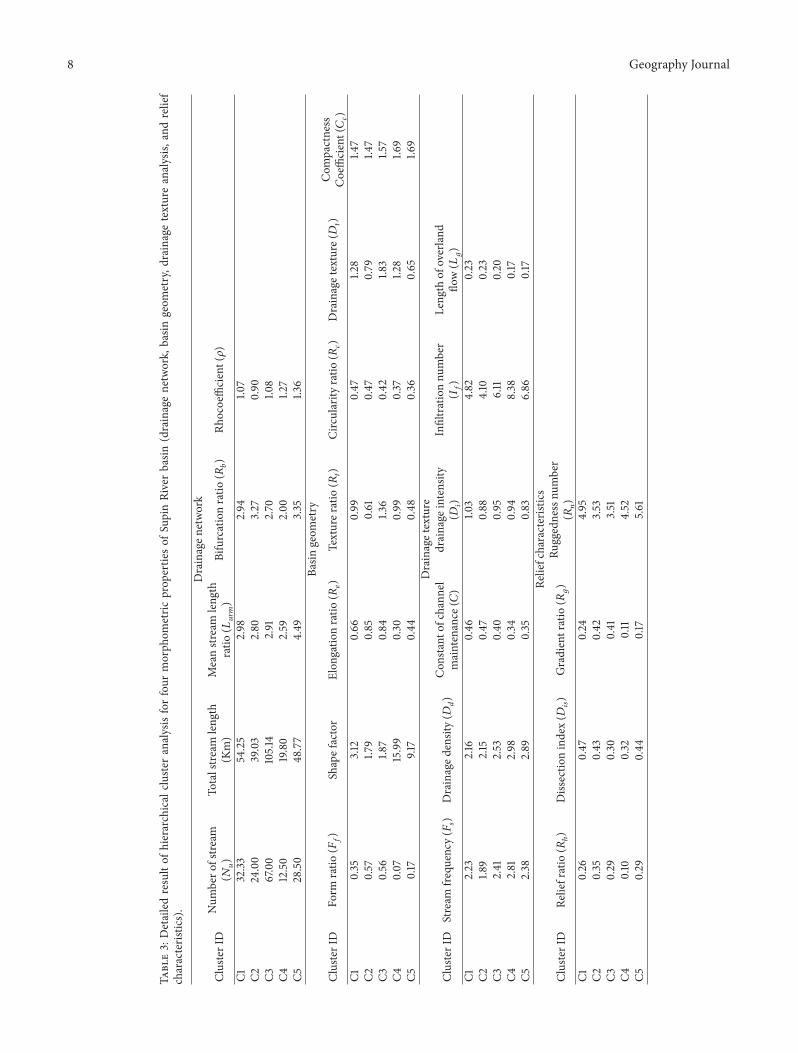
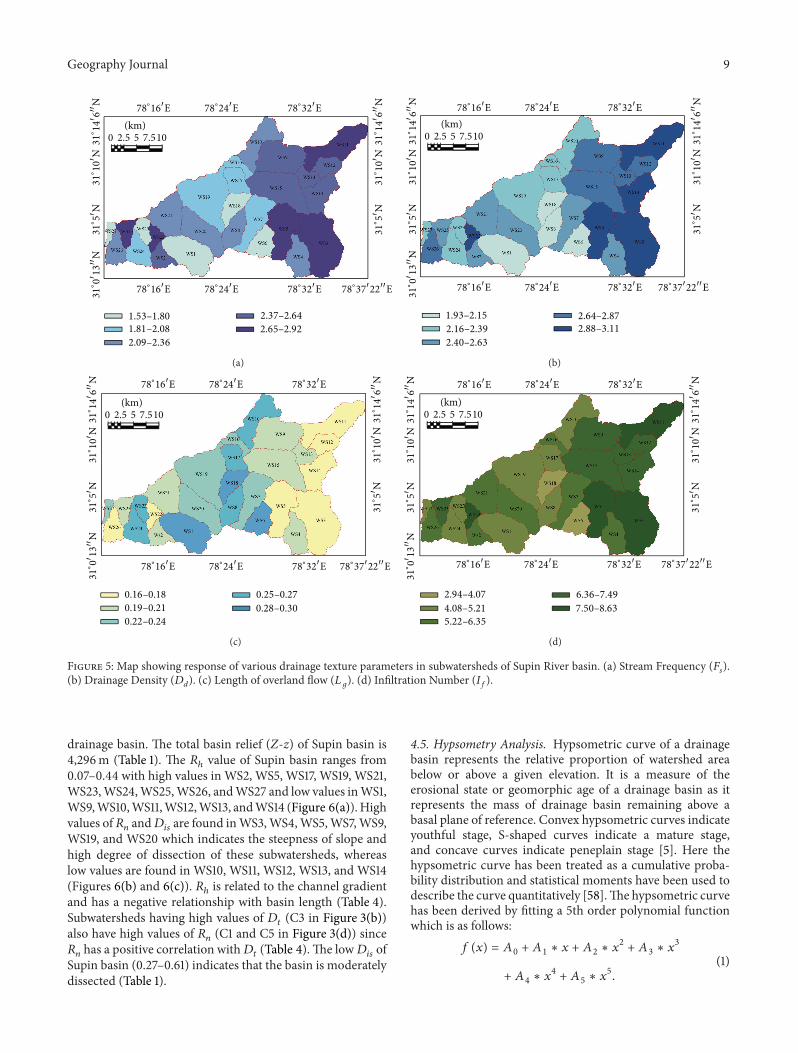
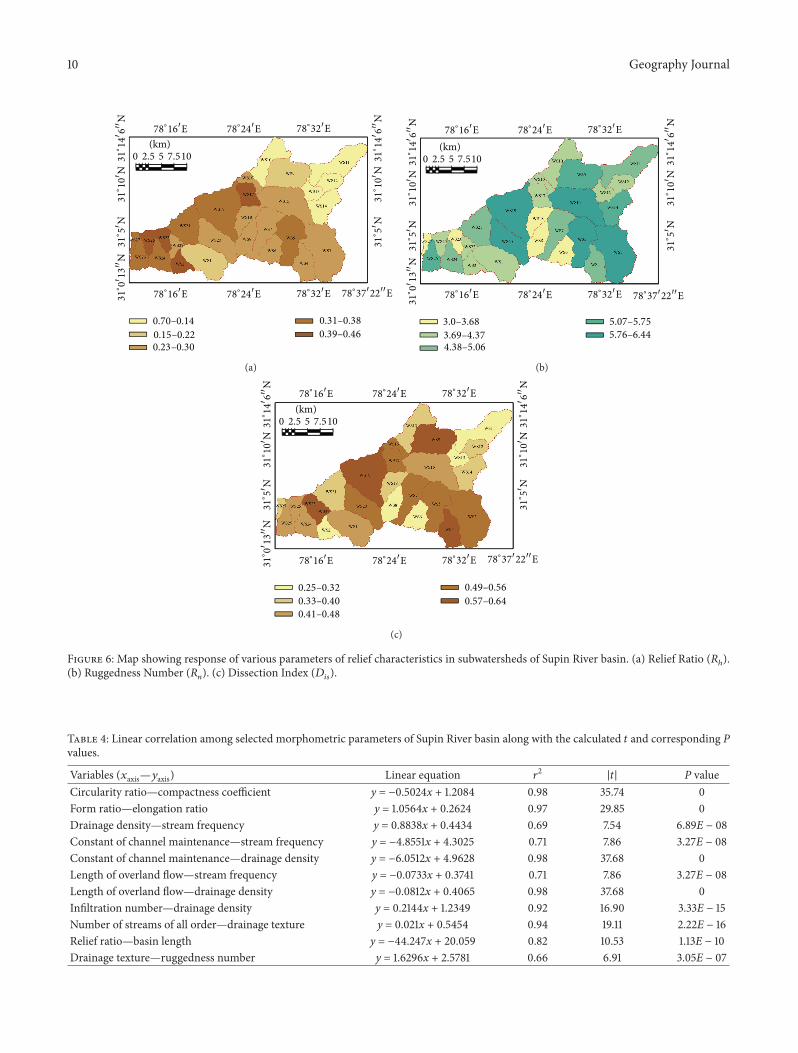
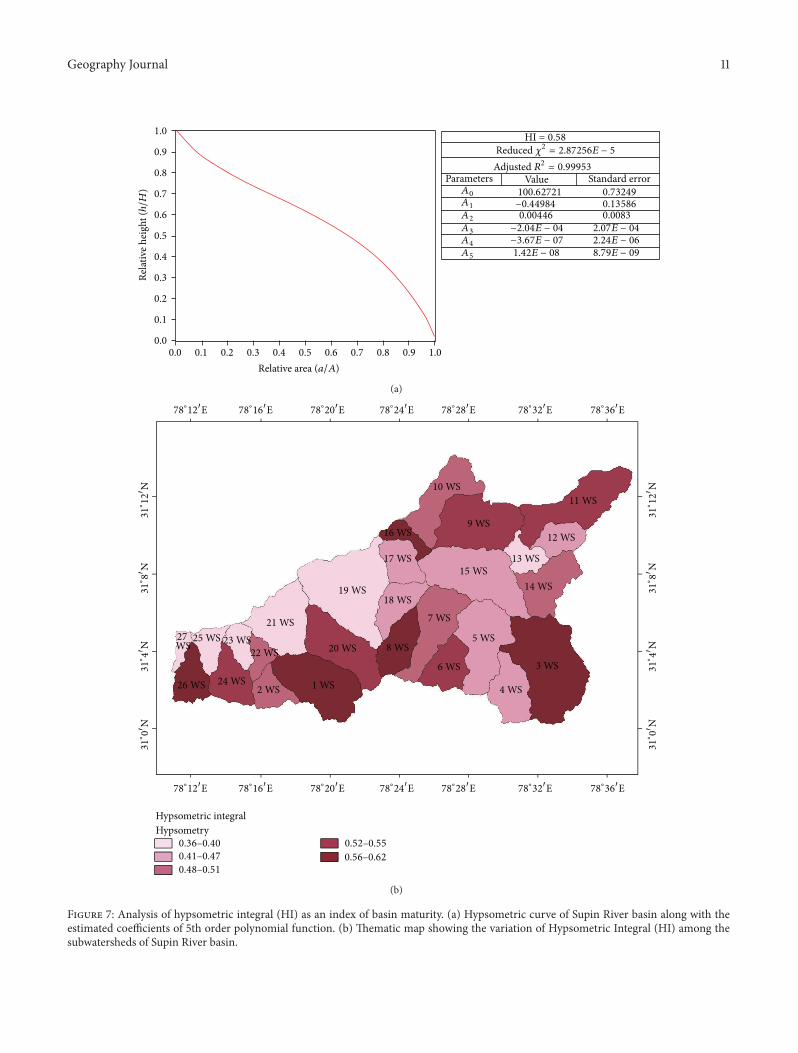
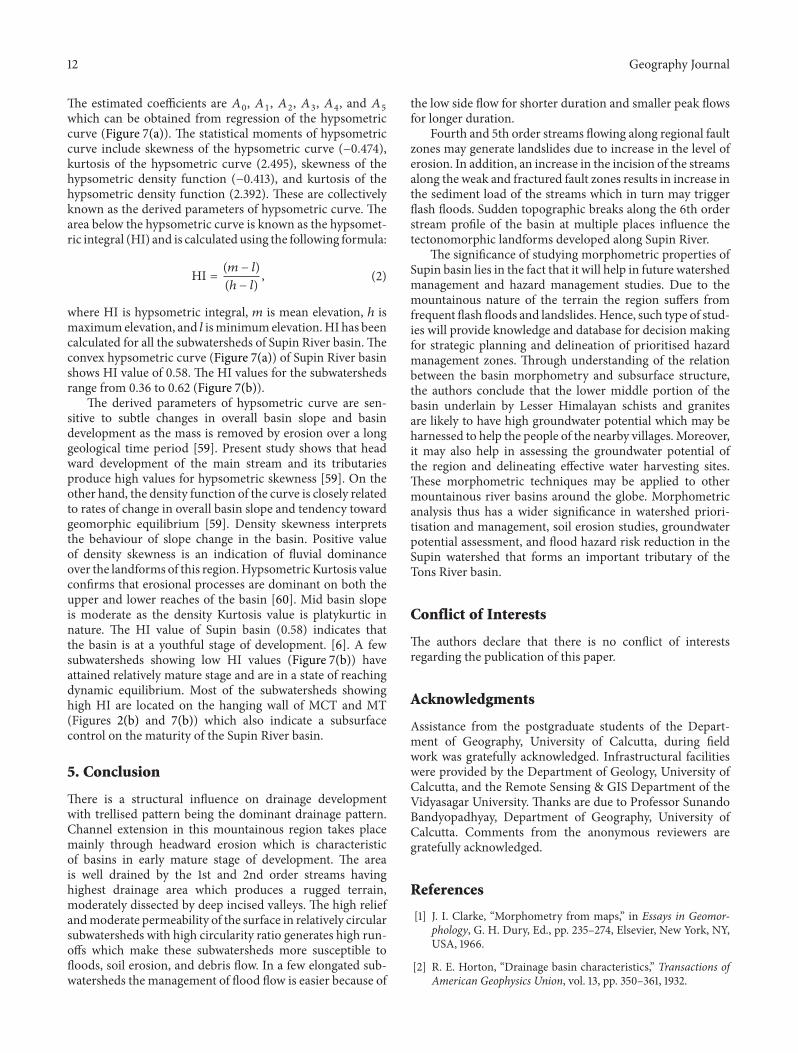
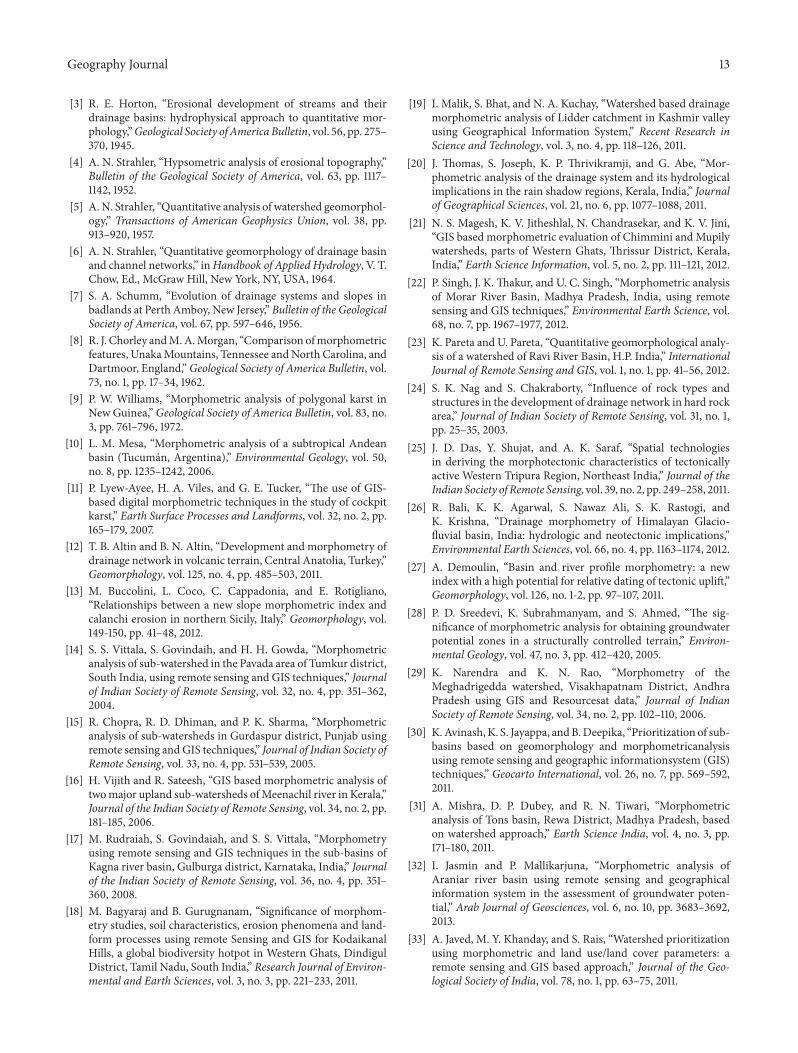
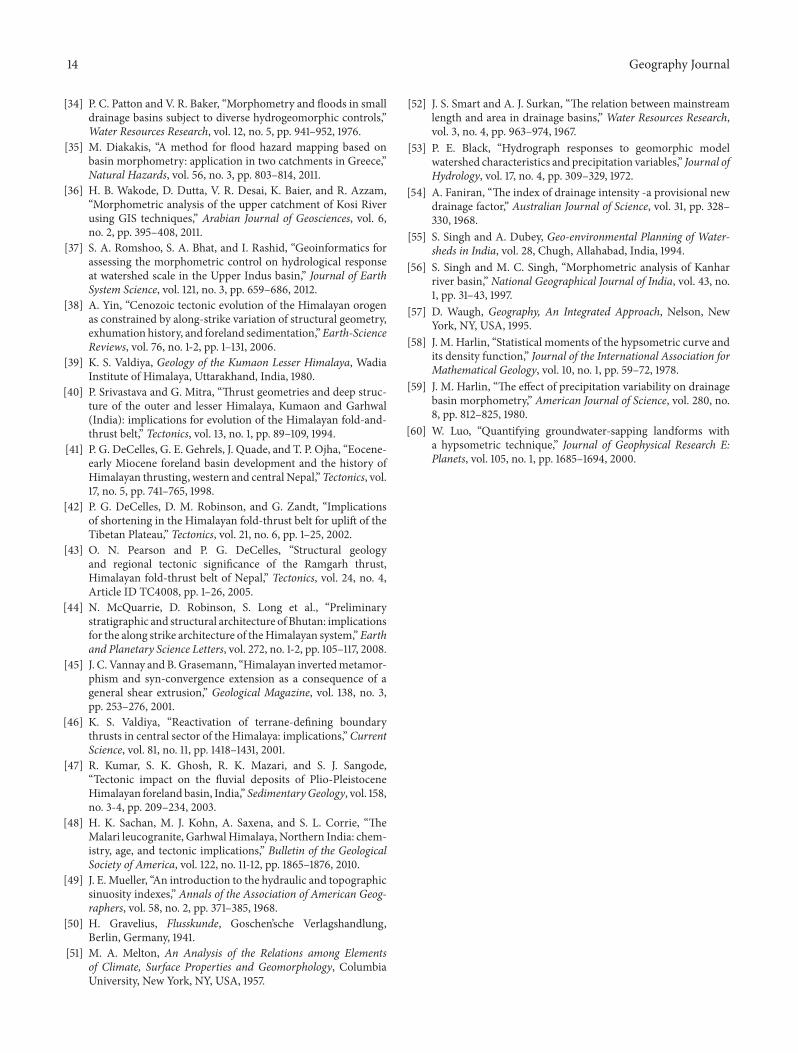
Related Documents


![Morphometry and Floods in Small Drainage Basins Subjectto … · 2018. 12. 15. · measurem'ents of drainage basin morphology were illustrated by Horton [1945] and Langbein et al.](https://static.cupdf.com/doc/110x72/5fd451a424a02c432f5f9b9e/morphometry-and-floods-in-small-drainage-basins-subjectto-2018-12-15-measurements.jpg)