Cloud Publications International Journal of Advanced Remote Sensing and GIS 2013, Volume 2, Issue 1, pp. 59-69, Article ID Tech-58 ISSN 2320 - 0243 ____________________________________________________________________________________________________ Morphometric Analysis of Tandava River Basin, Andhra Pradesh, India G. Ashenafi Tolessa, P. Jagadeeswara Rao and N. Victor Babu Department of Geo-Engineering, College of Engineering (A), Andhra University, Visakhapatnam, Andhra Pradesh, India Correspondence should be addressed to G. Ashenafi Tolessa, [email protected] Publication Date: 29 March 2013 Article Link: http://technical.cloud-journals.com/index.php/IJARSG/article/view/Tech-58 Copyright © 2013 G. Ashenafi Tolessa, P. Jagadeeswara Rao and N. Victor Babu. This is an open access article distributed under the Creative Commons Attribution License, which permits unrestricted use, distribution, and reproduction in any medium, provided the original work is properly cited. Abstract The seasonal abrupt flood event in the Tandava River Basin was the major loss for socio- economic infrastructure. The main objective of this study is to characterize the Morphometric parameters of Tandava River Basin (TRB) which depicted on toposheets 65; K/5, K/6, K/7, K/10 and K/11 with scale 1:50,000 were used for Morphometrical analysis. In this study, morphometric parameters were delineated through onscreen digitization on topographic map in ArcGIS-9.3. The TRB is covering about 1283 Km 2 consists of hills, valleys and plains. The longest flow path was calculated and found to be 83.360 Km. The study reveals that; such information derived from GIS would be very useful in practicing water management activity and designing of water harvesting project with minimum cost, efforts and time in reducing rates of natural degradation in the basin. Keywords Morphometry, Tandava River Basin, Drainage Characteristic, Sub-Basins 1. Introduction Morphometric study has got its foundation from stream flow analysis. Morisawa [1], who observed that stream flow, can be expressed as a general function of geomorphology of a sub-basin. The assertion still stand valid following Jain and Sinha [2], Okoko and Olujimi [3] and Ifabiyi [4] who reported that the geomorphic characteristics of a drainage basins play a key-role in controlling the basins hydrology. Morphometric analysis is a bit very advantageous for the study of minor (intermittent) river like Tandava River Basin and hence this study is intended to present the characteristic of Tandava River Basin (TRB) by following scientific formula and procedures. 2. Study Area The area of study is bounded in between latitudes 17 0 20’N to 17 0 50`N and longitudes 82 0 20`E to 82 0 40’ E. It forms part of Survey of India Toposheets 65 K/5, K/6, K/7, K/10 and K/11 and covers an area of 1283 Km 2 . Major part of the area is in Visakhapatnam district but adjacent part of East Godavari district is also included to see the total morphometry of the drainage basin (Figure1). Open Access Research Article

Welcome message from author
This document is posted to help you gain knowledge. Please leave a comment to let me know what you think about it! Share it to your friends and learn new things together.
Transcript
Cloud Publications
International Journal of Advanced Remote Sensing and GIS 2013, Volume 2, Issue 1, pp. 59-69, Article ID Tech-58 ISSN 2320 - 0243 ____________________________________________________________________________________________________
Morphometric Analysis of Tandava River Basin, Andhra Pradesh,
India
G. Ashenafi Tolessa, P. Jagadeeswara Rao and N. Victor Babu
Department of Geo-Engineering, College of Engineering (A), Andhra University, Visakhapatnam, Andhra
Pradesh, India
Correspondence should be addressed to G. Ashenafi Tolessa, [email protected]
Publication Date: 29 March 2013
Article Link: http://technical.cloud-journals.com/index.php/IJARSG/article/view/Tech-58
Copyright © 2013 G. Ashenafi Tolessa, P. Jagadeeswara Rao and N. Victor Babu. This is an open access article
distributed under the Creative Commons Attribution License, which permits unrestricted use, distribution, and
reproduction in any medium, provided the original work is properly cited.
Abstract The seasonal abrupt flood event in the Tandava River Basin was the major loss for socio-
economic infrastructure. The main objective of this study is to characterize the Morphometric
parameters of Tandava River Basin (TRB) which depicted on toposheets 65; K/5, K/6, K/7, K/10 and
K/11 with scale 1:50,000 were used for Morphometrical analysis. In this study, morphometric
parameters were delineated through onscreen digitization on topographic map in ArcGIS-9.3. The
TRB is covering about 1283 Km2 consists of hills, valleys and plains. The longest flow path was
calculated and found to be 83.360 Km. The study reveals that; such information derived from GIS
would be very useful in practicing water management activity and designing of water harvesting
project with minimum cost, efforts and time in reducing rates of natural degradation in the basin.
Keywords Morphometry, Tandava River Basin, Drainage Characteristic, Sub-Basins
1. Introduction
Morphometric study has got its foundation from stream flow analysis. Morisawa [1], who observed that
stream flow, can be expressed as a general function of geomorphology of a sub-basin. The assertion
still stand valid following Jain and Sinha [2], Okoko and Olujimi [3] and Ifabiyi [4] who reported that the
geomorphic characteristics of a drainage basins play a key-role in controlling the basins hydrology.
Morphometric analysis is a bit very advantageous for the study of minor (intermittent) river like
Tandava River Basin and hence this study is intended to present the characteristic of Tandava River
Basin (TRB) by following scientific formula and procedures.
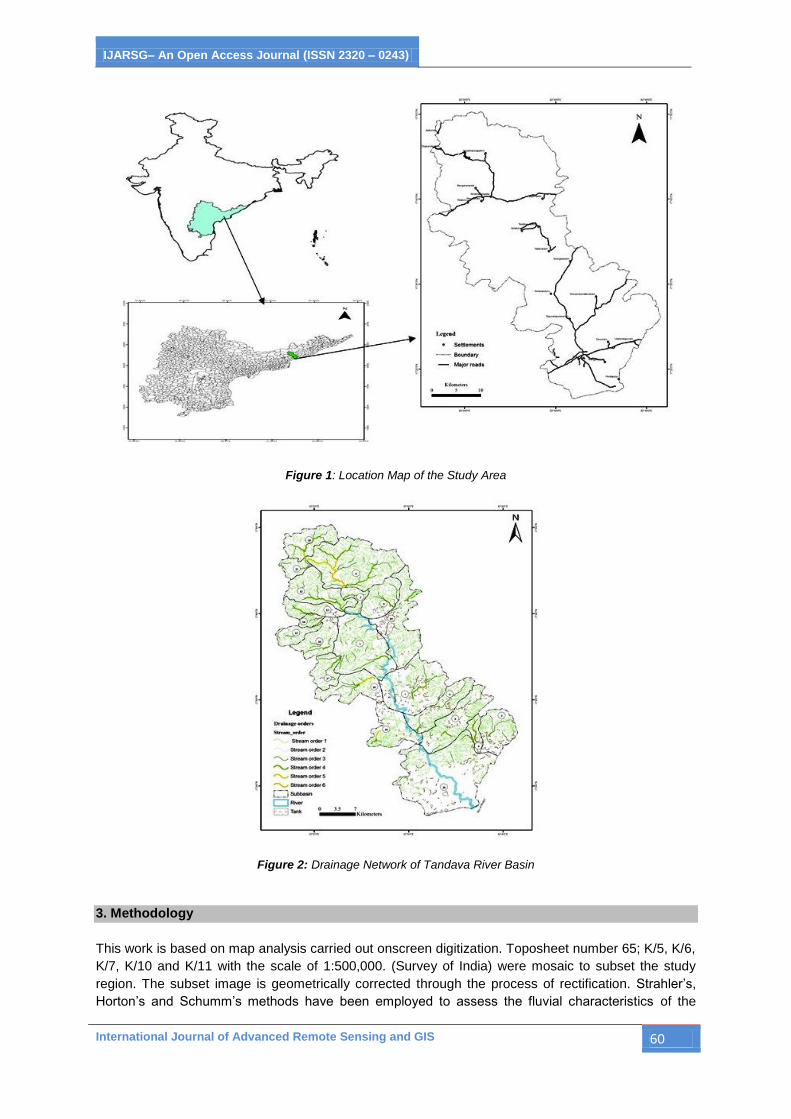
2. Study Area
The area of study is bounded in between latitudes 17020’N to 17
050`N and longitudes 82
020`E to
82040’ E. It forms part of Survey of India Toposheets 65 K/5, K/6, K/7, K/10 and K/11 and covers an
area of 1283 Km2. Major part of the area is in Visakhapatnam district but adjacent part of East
Godavari district is also included to see the total morphometry of the drainage basin (Figure1).
Open Access Research Article
IJARSG– An Open Access Journal (ISSN 2320 – 0243)
International Journal of Advanced Remote Sensing and GIS 60
Figure 1: Location Map of the Study Area
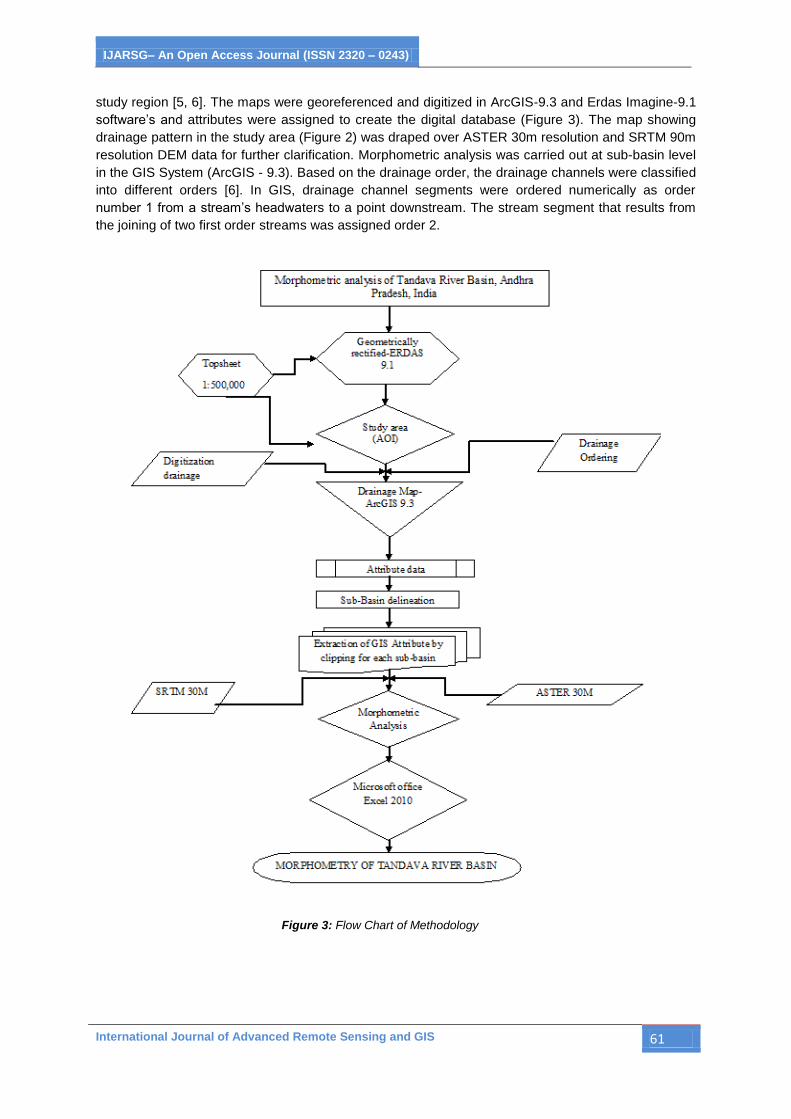
Figure 2: Drainage Network of Tandava River Basin
3. Methodology
This work is based on map analysis carried out onscreen digitization. Toposheet number 65; K/5, K/6,
K/7, K/10 and K/11 with the scale of 1:500,000. (Survey of India) were mosaic to subset the study
region. The subset image is geometrically corrected through the process of rectification. Strahler’s,
Horton’s and Schumm’s methods have been employed to assess the fluvial characteristics of the
IJARSG– An Open Access Journal (ISSN 2320 – 0243)
International Journal of Advanced Remote Sensing and GIS 61
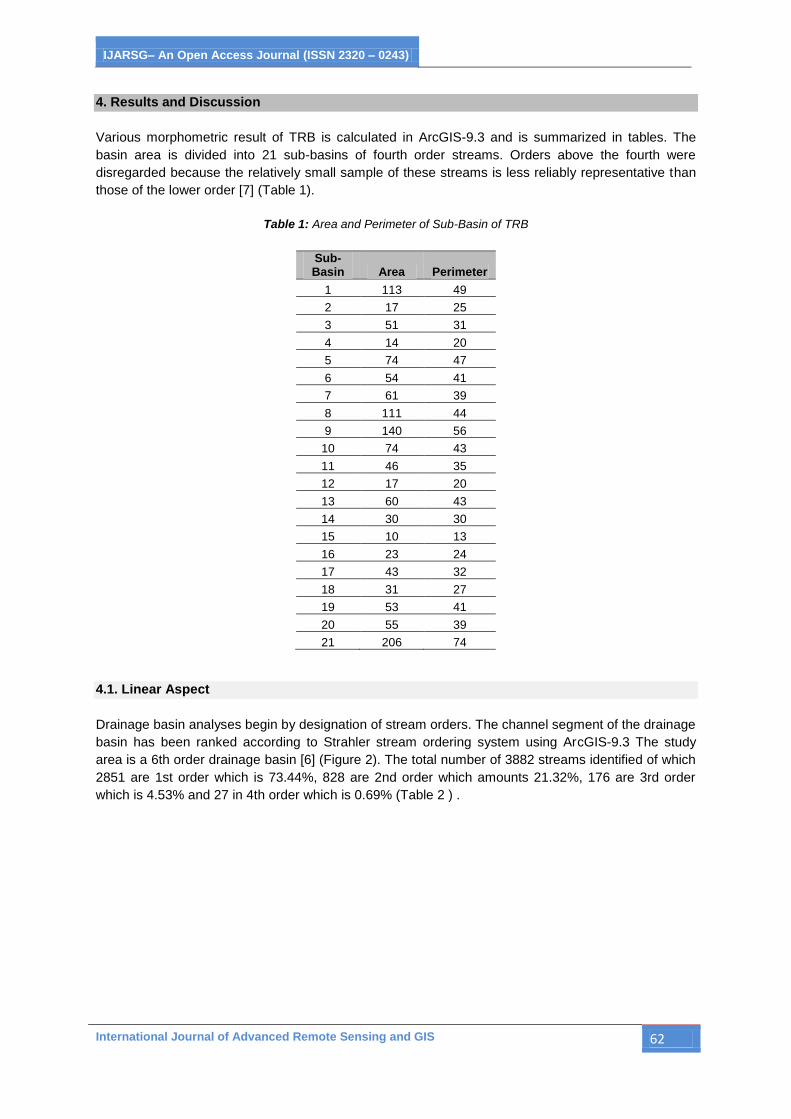
study region [5, 6]. The maps were georeferenced and digitized in ArcGIS-9.3 and Erdas Imagine-9.1
software’s and attributes were assigned to create the digital database (Figure 3). The map showing
drainage pattern in the study area (Figure 2) was draped over ASTER 30m resolution and SRTM 90m
resolution DEM data for further clarification. Morphometric analysis was carried out at sub-basin level
in the GIS System (ArcGIS - 9.3). Based on the drainage order, the drainage channels were classified
into different orders [6]. In GIS, drainage channel segments were ordered numerically as order
number 1 from a stream’s headwaters to a point downstream. The stream segment that results from
the joining of two first order streams was assigned order 2.
Figure 3: Flow Chart of Methodology
IJARSG– An Open Access Journal (ISSN 2320 – 0243)
International Journal of Advanced Remote Sensing and GIS 62
4. Results and Discussion
Various morphometric result of TRB is calculated in ArcGIS-9.3 and is summarized in tables. The
basin area is divided into 21 sub-basins of fourth order streams. Orders above the fourth were
disregarded because the relatively small sample of these streams is less reliably representative than
those of the lower order [7] (Table 1).
Table 1: Area and Perimeter of Sub-Basin of TRB
Sub-Basin Area Perimeter
1 113 49
2 17 25
3 51 31
4 14 20
5 74 47
6 54 41
7 61 39
8 111 44
9 140 56
10 74 43
11 46 35
12 17 20
13 60 43
14 30 30
15 10 13
16 23 24
17 43 32
18 31 27
19 53 41
20 55 39
21 206 74
4.1. Linear Aspect
Drainage basin analyses begin by designation of stream orders. The channel segment of the drainage
basin has been ranked according to Strahler stream ordering system using ArcGIS-9.3 The study
area is a 6th order drainage basin [6] (Figure 2). The total number of 3882 streams identified of which
2851 are 1st order which is 73.44%, 828 are 2nd order which amounts 21.32%, 176 are 3rd order
which is 4.53% and 27 in 4th order which is 0.69% (Table 2 ) .
IJARSG– An Open Access Journal (ISSN 2320 – 0243)
International Journal of Advanced Remote Sensing and GIS 63
Table 2: Number of Streams in Each Order in Each Sub-Basin
Sub-Basin No.
Number of Streams in Each Order
N1 N2 N3 N4 N
1 277 67 25 1 370
2 55 15 5 1 76
3 100 23 6 1 130
4 38 13 4 1 56
5 243 51 12 1 307
6 146 179 12 1 338
7 171 47 9 1 228
8 383 89 22 3 497
9 97 25 5 1 128
10 109 23 6 2 140
11 42 9 4 2 57
12 164 41 11 1 217
13 65 18 5 1 89
14 31 7 3 1 42
15 68 23 6 1 98
16 103 23 6 1 133
17 79 17 4 1 101
18 97 29 9 2 137
19 126 30 6 2 164
20 266 56 9 1 332
21 191 43 7 1 242
Total Streams 2851 828 176 27 3882
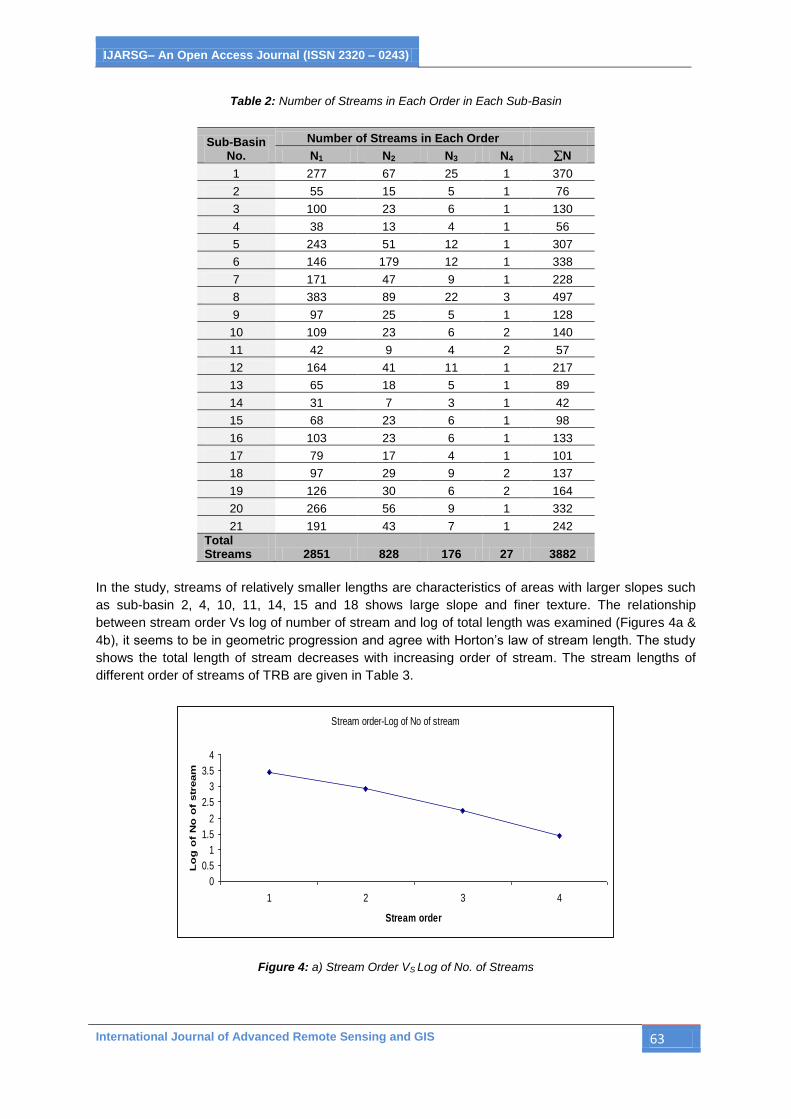
In the study, streams of relatively smaller lengths are characteristics of areas with larger slopes such
as sub-basin 2, 4, 10, 11, 14, 15 and 18 shows large slope and finer texture. The relationship
between stream order Vs log of number of stream and log of total length was examined (Figures 4a &
4b), it seems to be in geometric progression and agree with Horton’s law of stream length. The study
shows the total length of stream decreases with increasing order of stream. The stream lengths of
different order of streams of TRB are given in Table 3.
Stream order-Log of No of stream
0
0.5
1
1.5
2
2.5
3
3.5
4
1 2 3 4
Stream order
Lo
g o
f N
o o
f str
eam
Figure 4: a) Stream Order VS Log of No. of Streams
IJARSG– An Open Access Journal (ISSN 2320 – 0243)
International Journal of Advanced Remote Sensing and GIS 64
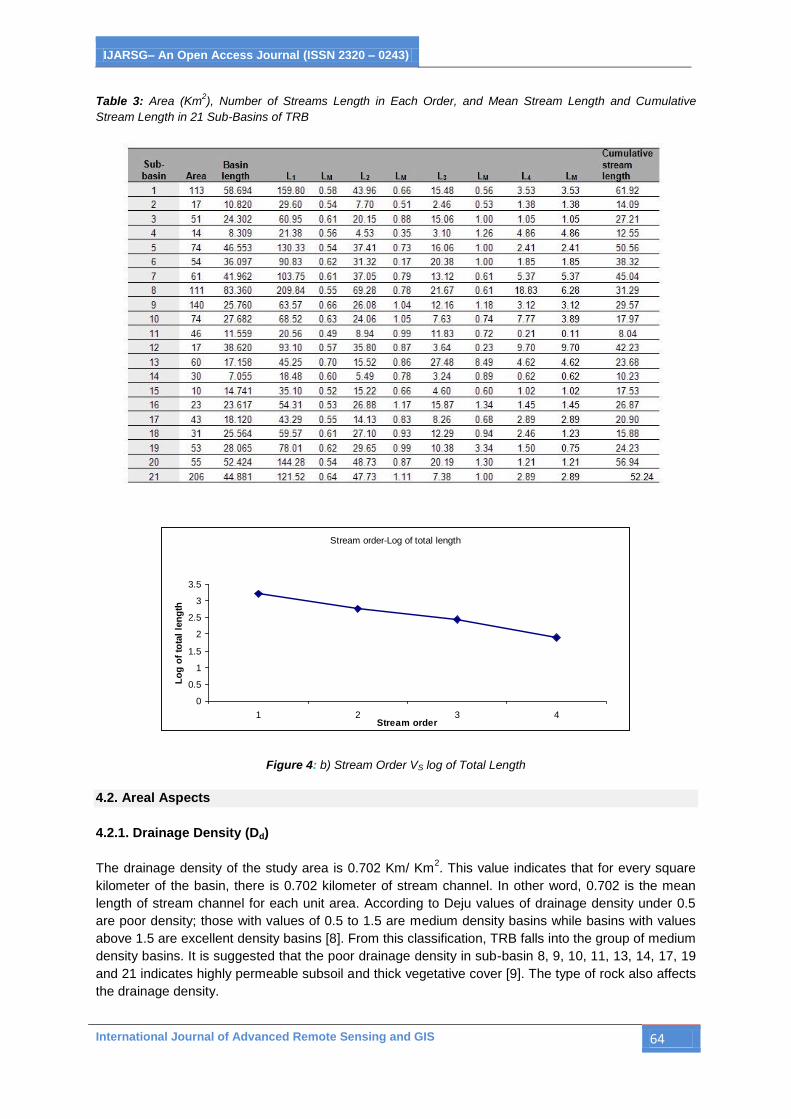
Table 3: Area (Km2), Number of Streams Length in Each Order, and Mean Stream Length and Cumulative
Stream Length in 21 Sub-Basins of TRB
Stream order-Log of total length
0
0.5
1
1.5
2
2.5
3
3.5
1 2 3 4Stream order
Lo
g o
f to
tal
len
gth
Figure 4: b) Stream Order VS log of Total Length
4.2. Areal Aspects
4.2.1. Drainage Density (Dd)
The drainage density of the study area is 0.702 Km/ Km2. This value indicates that for every square
kilometer of the basin, there is 0.702 kilometer of stream channel. In other word, 0.702 is the mean
length of stream channel for each unit area. According to Deju values of drainage density under 0.5
are poor density; those with values of 0.5 to 1.5 are medium density basins while basins with values
above 1.5 are excellent density basins [8]. From this classification, TRB falls into the group of medium
density basins. It is suggested that the poor drainage density in sub-basin 8, 9, 10, 11, 13, 14, 17, 19
and 21 indicates highly permeable subsoil and thick vegetative cover [9]. The type of rock also affects
the drainage density.
IJARSG– An Open Access Journal (ISSN 2320 – 0243)
International Journal of Advanced Remote Sensing and GIS 65
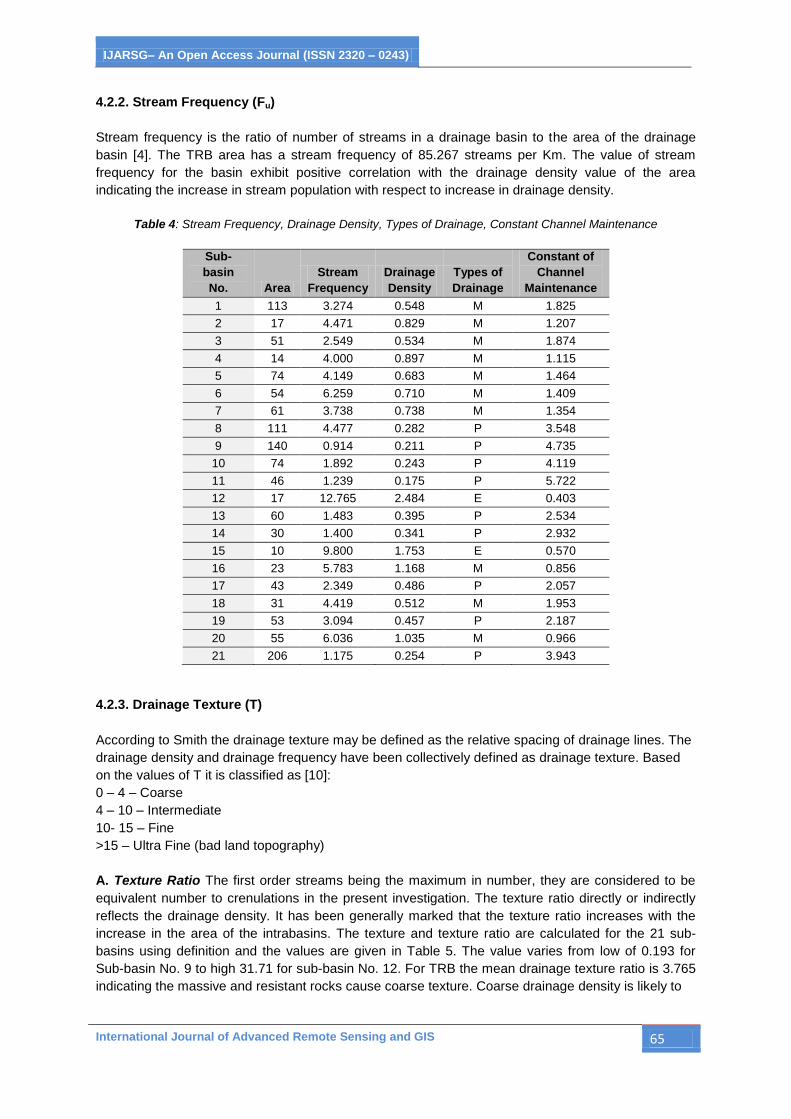
4.2.2. Stream Frequency (Fu)
Stream frequency is the ratio of number of streams in a drainage basin to the area of the drainage
basin [4]. The TRB area has a stream frequency of 85.267 streams per Km. The value of stream
frequency for the basin exhibit positive correlation with the drainage density value of the area
indicating the increase in stream population with respect to increase in drainage density.
Table 4: Stream Frequency, Drainage Density, Types of Drainage, Constant Channel Maintenance
Sub-
basin
No. Area
Stream
Frequency
Drainage
Density
Types of
Drainage
Constant of
Channel
Maintenance
1 113 3.274 0.548 M 1.825
2 17 4.471 0.829 M 1.207
3 51 2.549 0.534 M 1.874
4 14 4.000 0.897 M 1.115
5 74 4.149 0.683 M 1.464
6 54 6.259 0.710 M 1.409
7 61 3.738 0.738 M 1.354
8 111 4.477 0.282 P 3.548
9 140 0.914 0.211 P 4.735
10 74 1.892 0.243 P 4.119
11 46 1.239 0.175 P 5.722
12 17 12.765 2.484 E 0.403
13 60 1.483 0.395 P 2.534
14 30 1.400 0.341 P 2.932
15 10 9.800 1.753 E 0.570
16 23 5.783 1.168 M 0.856
17 43 2.349 0.486 P 2.057
18 31 4.419 0.512 M 1.953
19 53 3.094 0.457 P 2.187
20 55 6.036 1.035 M 0.966
21 206 1.175 0.254 P 3.943
4.2.3. Drainage Texture (T)
According to Smith the drainage texture may be defined as the relative spacing of drainage lines. The
drainage density and drainage frequency have been collectively defined as drainage texture. Based
on the values of T it is classified as [10]:
0 – 4 – Coarse
4 – 10 – Intermediate
10- 15 – Fine
>15 – Ultra Fine (bad land topography)
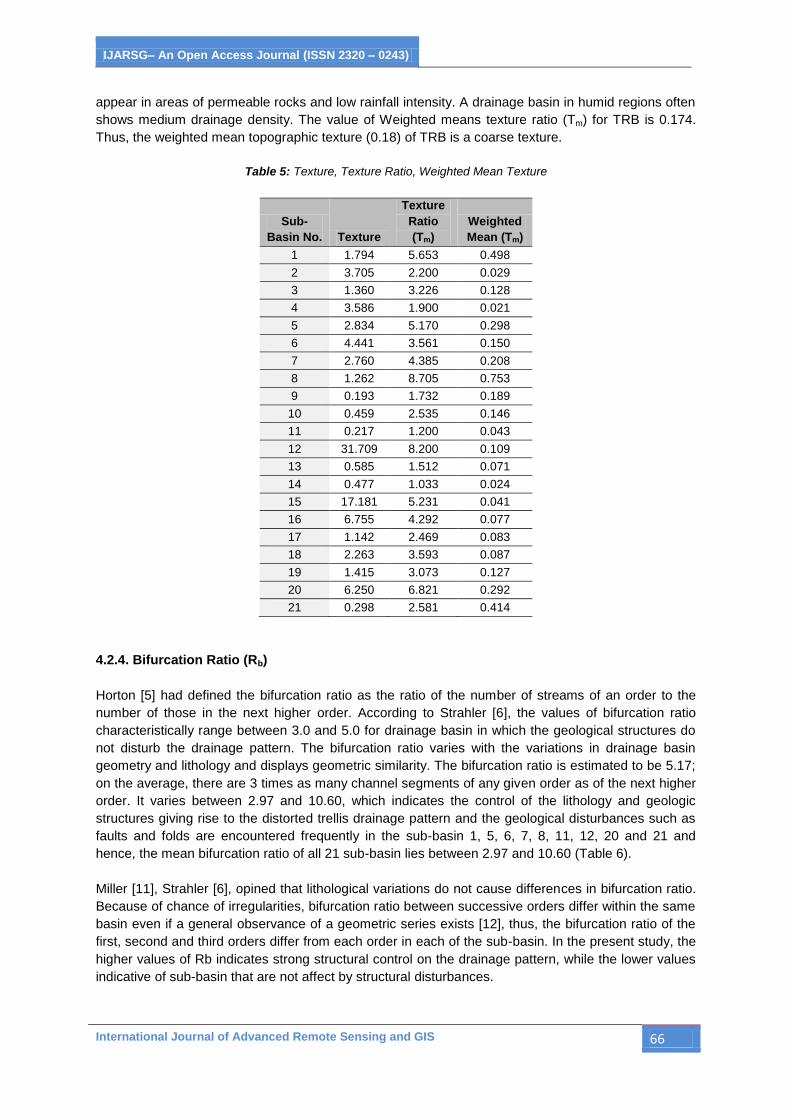
A. Texture Ratio The first order streams being the maximum in number, they are considered to be
equivalent number to crenulations in the present investigation. The texture ratio directly or indirectly
reflects the drainage density. It has been generally marked that the texture ratio increases with the
increase in the area of the intrabasins. The texture and texture ratio are calculated for the 21 sub-
basins using definition and the values are given in Table 5. The value varies from low of 0.193 for
Sub-basin No. 9 to high 31.71 for sub-basin No. 12. For TRB the mean drainage texture ratio is 3.765
indicating the massive and resistant rocks cause coarse texture. Coarse drainage density is likely to
IJARSG– An Open Access Journal (ISSN 2320 – 0243)
International Journal of Advanced Remote Sensing and GIS 66
appear in areas of permeable rocks and low rainfall intensity. A drainage basin in humid regions often
shows medium drainage density. The value of Weighted means texture ratio (Tm) for TRB is 0.174.
Thus, the weighted mean topographic texture (0.18) of TRB is a coarse texture.
Table 5: Texture, Texture Ratio, Weighted Mean Texture
Sub-
Basin No. Texture
Texture
Ratio
(Tm)
Weighted
Mean (Tm)
1 1.794 5.653 0.498
2 3.705 2.200 0.029
3 1.360 3.226 0.128
4 3.586 1.900 0.021
5 2.834 5.170 0.298
6 4.441 3.561 0.150
7 2.760 4.385 0.208
8 1.262 8.705 0.753
9 0.193 1.732 0.189
10 0.459 2.535 0.146
11 0.217 1.200 0.043
12 31.709 8.200 0.109
13 0.585 1.512 0.071
14 0.477 1.033 0.024
15 17.181 5.231 0.041
16 6.755 4.292 0.077
17 1.142 2.469 0.083
18 2.263 3.593 0.087
19 1.415 3.073 0.127
20 6.250 6.821 0.292
21 0.298 2.581 0.414
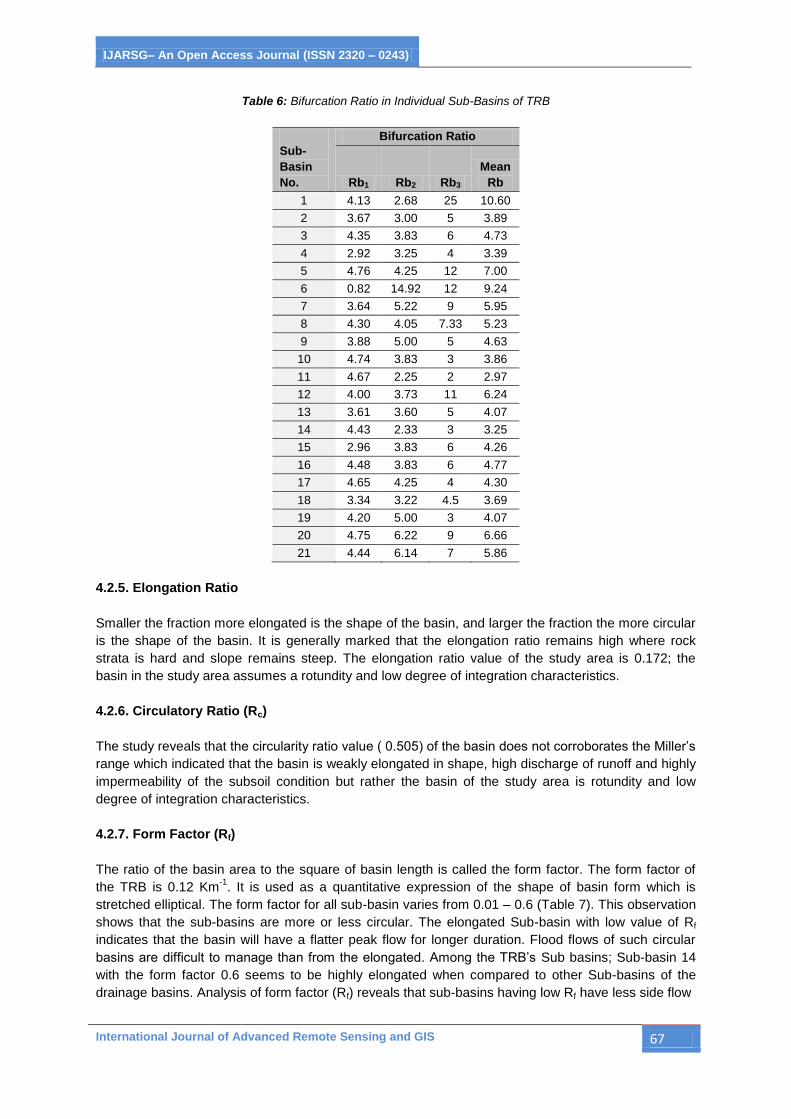
4.2.4. Bifurcation Ratio (Rb)
Horton [5] had defined the bifurcation ratio as the ratio of the number of streams of an order to the
number of those in the next higher order. According to Strahler [6], the values of bifurcation ratio
characteristically range between 3.0 and 5.0 for drainage basin in which the geological structures do
not disturb the drainage pattern. The bifurcation ratio varies with the variations in drainage basin
geometry and lithology and displays geometric similarity. The bifurcation ratio is estimated to be 5.17;
on the average, there are 3 times as many channel segments of any given order as of the next higher
order. It varies between 2.97 and 10.60, which indicates the control of the lithology and geologic
structures giving rise to the distorted trellis drainage pattern and the geological disturbances such as
faults and folds are encountered frequently in the sub-basin 1, 5, 6, 7, 8, 11, 12, 20 and 21 and
hence, the mean bifurcation ratio of all 21 sub-basin lies between 2.97 and 10.60 (Table 6).
Miller [11], Strahler [6], opined that lithological variations do not cause differences in bifurcation ratio.
Because of chance of irregularities, bifurcation ratio between successive orders differ within the same
basin even if a general observance of a geometric series exists [12], thus, the bifurcation ratio of the
first, second and third orders differ from each order in each of the sub-basin. In the present study, the
higher values of Rb indicates strong structural control on the drainage pattern, while the lower values
indicative of sub-basin that are not affect by structural disturbances.
IJARSG– An Open Access Journal (ISSN 2320 – 0243)
International Journal of Advanced Remote Sensing and GIS 67
Table 6: Bifurcation Ratio in Individual Sub-Basins of TRB
Sub-
Basin
No.
Bifurcation Ratio
Rb1 Rb2 Rb3
Mean
Rb
1 4.13 2.68 25 10.60
2 3.67 3.00 5 3.89
3 4.35 3.83 6 4.73
4 2.92 3.25 4 3.39
5 4.76 4.25 12 7.00
6 0.82 14.92 12 9.24
7 3.64 5.22 9 5.95
8 4.30 4.05 7.33 5.23
9 3.88 5.00 5 4.63
10 4.74 3.83 3 3.86
11 4.67 2.25 2 2.97
12 4.00 3.73 11 6.24
13 3.61 3.60 5 4.07
14 4.43 2.33 3 3.25
15 2.96 3.83 6 4.26
16 4.48 3.83 6 4.77
17 4.65 4.25 4 4.30
18 3.34 3.22 4.5 3.69
19 4.20 5.00 3 4.07
20 4.75 6.22 9 6.66
21 4.44 6.14 7 5.86
4.2.5. Elongation Ratio
Smaller the fraction more elongated is the shape of the basin, and larger the fraction the more circular
is the shape of the basin. It is generally marked that the elongation ratio remains high where rock
strata is hard and slope remains steep. The elongation ratio value of the study area is 0.172; the
basin in the study area assumes a rotundity and low degree of integration characteristics.
4.2.6. Circulatory Ratio (Rc)
The study reveals that the circularity ratio value ( 0.505) of the basin does not corroborates the Miller’s
range which indicated that the basin is weakly elongated in shape, high discharge of runoff and highly
impermeability of the subsoil condition but rather the basin of the study area is rotundity and low
degree of integration characteristics.
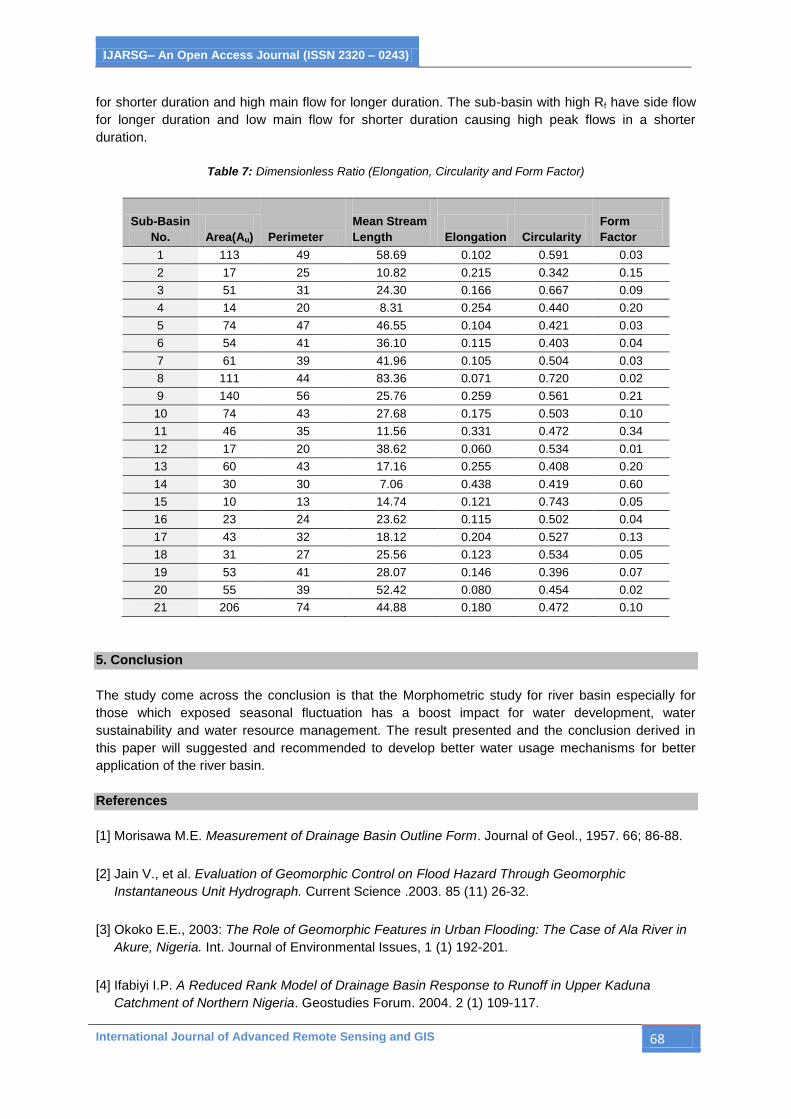
4.2.7. Form Factor (Rf)
The ratio of the basin area to the square of basin length is called the form factor. The form factor of
the TRB is 0.12 Km-1
. It is used as a quantitative expression of the shape of basin form which is
stretched elliptical. The form factor for all sub-basin varies from 0.01 – 0.6 (Table 7). This observation
shows that the sub-basins are more or less circular. The elongated Sub-basin with low value of Rf
indicates that the basin will have a flatter peak flow for longer duration. Flood flows of such circular
basins are difficult to manage than from the elongated. Among the TRB’s Sub basins; Sub-basin 14
with the form factor 0.6 seems to be highly elongated when compared to other Sub-basins of the
drainage basins. Analysis of form factor (Rf) reveals that sub-basins having low Rf have less side flow
IJARSG– An Open Access Journal (ISSN 2320 – 0243)
International Journal of Advanced Remote Sensing and GIS 68
for shorter duration and high main flow for longer duration. The sub-basin with high Rf have side flow
for longer duration and low main flow for shorter duration causing high peak flows in a shorter
duration.
Table 7: Dimensionless Ratio (Elongation, Circularity and Form Factor)
Sub-Basin
No.
Area(Au) Perimeter
Mean Stream
Length
Elongation
Circularity
Form
Factor
1 113 49 58.69 0.102 0.591 0.03
2 17 25 10.82 0.215 0.342 0.15
3 51 31 24.30 0.166 0.667 0.09
4 14 20 8.31 0.254 0.440 0.20
5 74 47 46.55 0.104 0.421 0.03
6 54 41 36.10 0.115 0.403 0.04
7 61 39 41.96 0.105 0.504 0.03
8 111 44 83.36 0.071 0.720 0.02
9 140 56 25.76 0.259 0.561 0.21
10 74 43 27.68 0.175 0.503 0.10
11 46 35 11.56 0.331 0.472 0.34
12 17 20 38.62 0.060 0.534 0.01
13 60 43 17.16 0.255 0.408 0.20
14 30 30 7.06 0.438 0.419 0.60
15 10 13 14.74 0.121 0.743 0.05
16 23 24 23.62 0.115 0.502 0.04
17 43 32 18.12 0.204 0.527 0.13
18 31 27 25.56 0.123 0.534 0.05
19 53 41 28.07 0.146 0.396 0.07
20 55 39 52.42 0.080 0.454 0.02
21 206 74 44.88 0.180 0.472 0.10
5. Conclusion
The study come across the conclusion is that the Morphometric study for river basin especially for
those which exposed seasonal fluctuation has a boost impact for water development, water
sustainability and water resource management. The result presented and the conclusion derived in
this paper will suggested and recommended to develop better water usage mechanisms for better
application of the river basin.
References
[1] Morisawa M.E. Measurement of Drainage Basin Outline Form. Journal of Geol., 1957. 66; 86-88.
[2] Jain V., et al. Evaluation of Geomorphic Control on Flood Hazard Through Geomorphic
Instantaneous Unit Hydrograph. Current Science .2003. 85 (11) 26-32.
[3] Okoko E.E., 2003: The Role of Geomorphic Features in Urban Flooding: The Case of Ala River in
Akure, Nigeria. Int. Journal of Environmental Issues, 1 (1) 192-201.
[4] Ifabiyi I.P. A Reduced Rank Model of Drainage Basin Response to Runoff in Upper Kaduna
Catchment of Northern Nigeria. Geostudies Forum. 2004. 2 (1) 109-117.
IJARSG– An Open Access Journal (ISSN 2320 – 0243)
International Journal of Advanced Remote Sensing and GIS 69
[5] Horton R.E. Erosional Development of Streams and Their Drainage Basins: Hydro Physical
Approach to Quantitative Morphology. Geol. Soc. Am. Bull. 1945. 56: 275-370.
[6] Strahler A.H, 1964: Quantitative Geomorphology of Drainage Basins and Channel Networks.
Handbook of Applied Hydrology, McGraw Hill Book Company, New York, 4-39/4-76.
[7] Strahler A.N. Hypsometric (Area – Altitude) Analysis of Erosional Topography. Geol. Soc. Amer.
Bull., 1952. 63; 117-142.
[8] Deju A. Raul, 1971: Regional Hydrology Fundamentals. Gordon & Breach Publishing Group,
Newark, New Jersey, United States 204.
[9] Nag S.K. Morphometric Analysis Using Remote Sensing Techniques in the Chaka Sub basin
Purulia District, West Bengal. J. Indian Soc. Remote Sensing. 1998. 26; 6976.
[10] Smith K.G. Standards for Grading Texture of Erosional Topography. Am J Sci. 1950. 248;
655668.
[11] Miller V.C., 1953: A Quantitative Geomorphic Study of Drainage Basin Characteristics in the
Clinch Mountain Area, Virginia and Tennessee. NR Technical Report 3, Office Naval Research
Project.
[12] Schumm S.A. The Evolution of Drainage Systems and Slopes in Badlands at Perth Amboy, New
Jersey, Geol. Soc. Amer. Bull., 1956. 67: 597-646.
Related Documents