Morphology of Red Blood Cells: A new pathological marker Organized by Debasish Sarkar, Associate Professor Department of Chemical Engineering University of Calcutta Organized by CUChEAA

Welcome message from author
This document is posted to help you gain knowledge. Please leave a comment to let me know what you think about it! Share it to your friends and learn new things together.
Transcript

Morphology of Red Blood Cells: A new pathological marker
Organized by
Debasish Sarkar, Associate Professor
Department of Chemical Engineering
University of Calcutta
Organized byCUChEAA
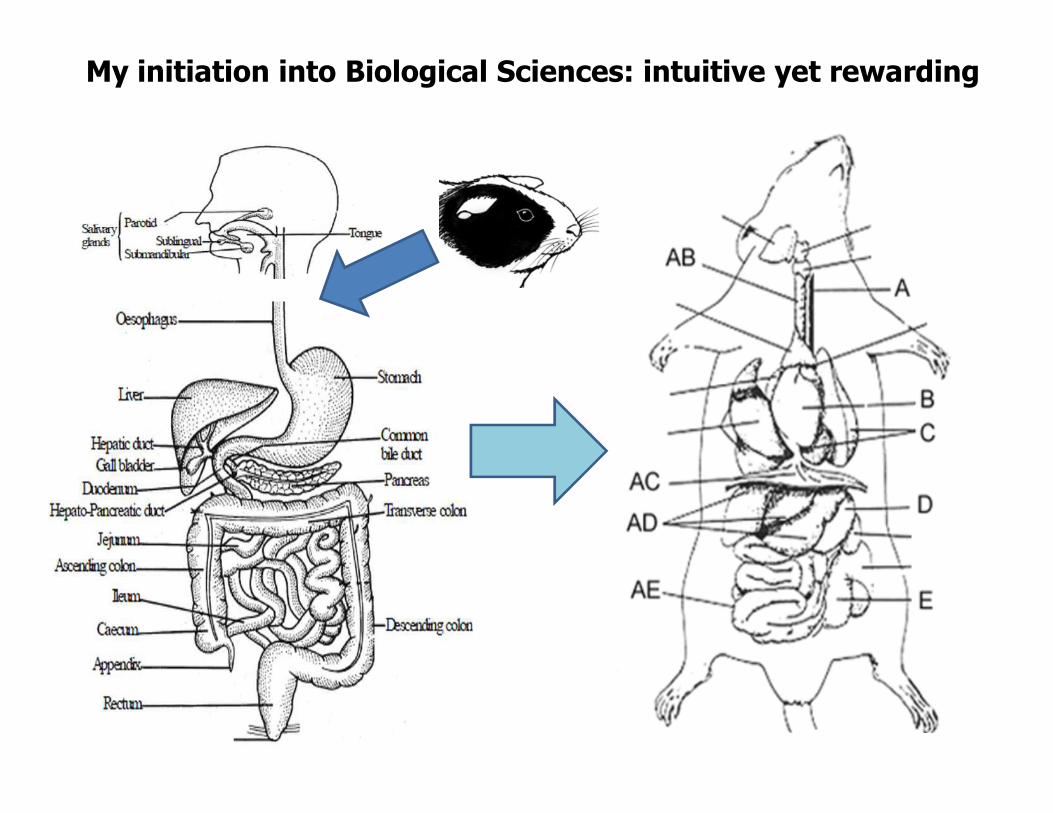
My initiation into Biological Sciences: intuitive yet rewarding

Fast forward 15 years
Let’s model some cell population!
My earliest interpretation of a cell
And finally, my research started.
Intermediate (and improving)
Concepts further refined

Overview of Erythrocyte/RBC membrane
Protein: 50%; Phospholipid: 20%Cholesterol: 20%; Carbohydrate: 10%
What it looks like
Composition
Cholesterol: 20%; Carbohydrate: 10%
Overview of structural design
Structural details

Morphologically altered erythrocytes
Transformation majorlyinvolves dysfunction ofproteins
� Spectrin
� Ankyrin
� Band 3
� Protein 4.2
Major morphological types
(a) Normal discocyte(b) Echinocyte (with thorny projections)(c) Stomatocyte (with irregular central
stomata)(d) Spherocyte (sphere-shaped)
Mutually exclusive pathways

Importance of morphological study
� RBC morphology acts as a pathological index for several diseases
� Hemoglobinopathies
� Membranopathies
� Infectious diseases
� Inflammatory diseases
� Congenital diseases CANCER
ANAEMIA
ANAEMIA
DIABETES MELLITUS
DIABETES MELLITUSSCD
SCD
PKAN
SNAKE BITE
� Study of RBC morphology is necessary in
� Neonatology
� Cytoskeletal studies
� Membrane composition studies
� Drug interaction studies for research
� Clinical and screening purpose
ANAEMIA
DIABETES MELLITUSSCDPKAN
RENAL DISEASES
SNAKE BITE
SNAKE BITE
Thalassemia

Example of morphological alterations
Dengue (echinocytes) Leukemia (stomatocytes)Patamatamku et al., Asian Biomedicine 11 (2017) 49 - 53 Ohsaka et al., NKGZ 52 (1989) 7-17
7
COVID-19 (echinocytes) Low cholesterol (stomatocytes)
Lakhdari et al., medRxiv 2020Andolfo et al., AJH 91 (2018) 107-121

Measurement of population morphology: Orthodox approach
MICROSCOPIC ANALYSIS
� Laborious
� Subjected to personal bias
� Repeated counting is necessary
Glass (coverslip or slide) induced echinocytosisConfocal microscopy image echinocytosis
Outcome: Qualitative report
Confocal microscopy image
Remedy: Optical measurements based on LASER scattering (Flow cytometry)

FLOW CYTOMETER
• Cells suspended in a fluid• One cell at a time through a laser beam• Tens of thousands of cells rapidly processed• Regular applications in basic research, clinical practice, and clinical trials

ii MSxMI ∑=
Outline: From Flow Cytometry to population morphology
Outcomes of Flow Cytometry Microscopic image
MI: Morphological Index
ii∑
A Morphological scale
Distribution parameters
(mean, median, std. dev., etc.)
Black box/regression
model
Rapid morphological
assay
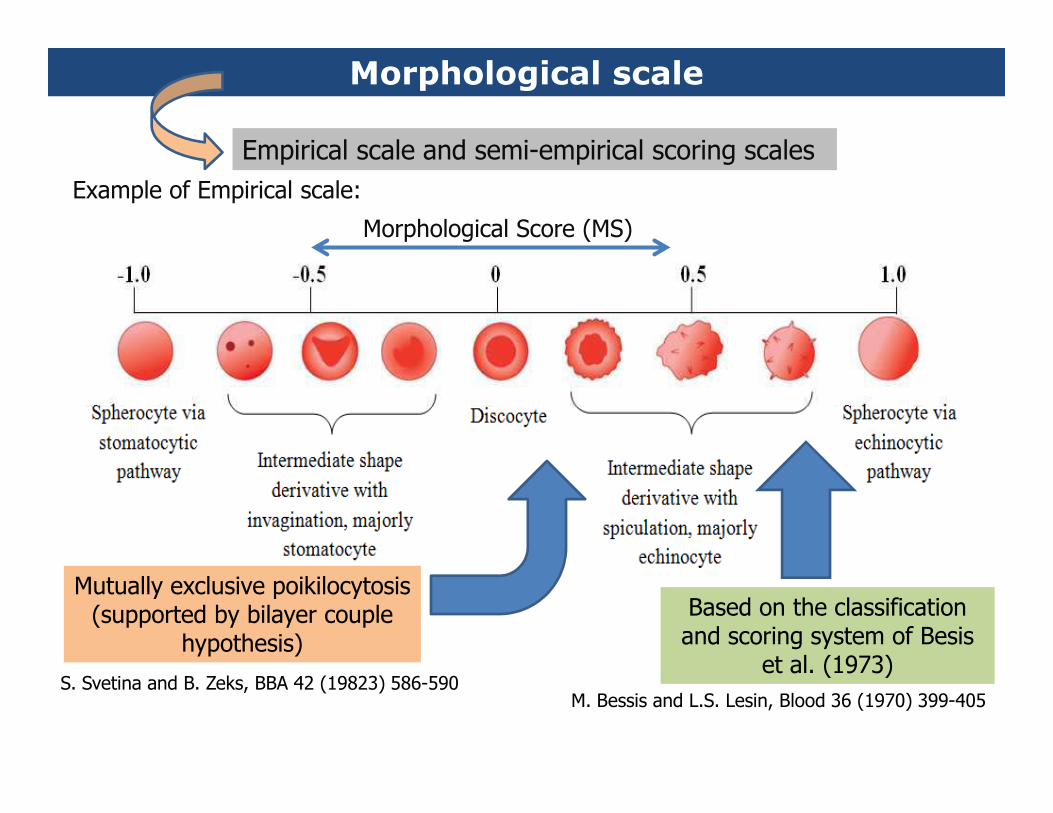
Morphological scale
Empirical scale and semi-empirical scoring scales
Example of Empirical scale:
Morphological Score (MS)
Based on the classification and scoring system of Besis
et al. (1973)
Mutually exclusive poikilocytosis(supported by bilayer couple
hypothesis)
S. Svetina and B. Zeks, BBA 42 (19823) 586-590M. Bessis and L.S. Lesin, Blood 36 (1970) 399-405

Work on empirical scoring scale
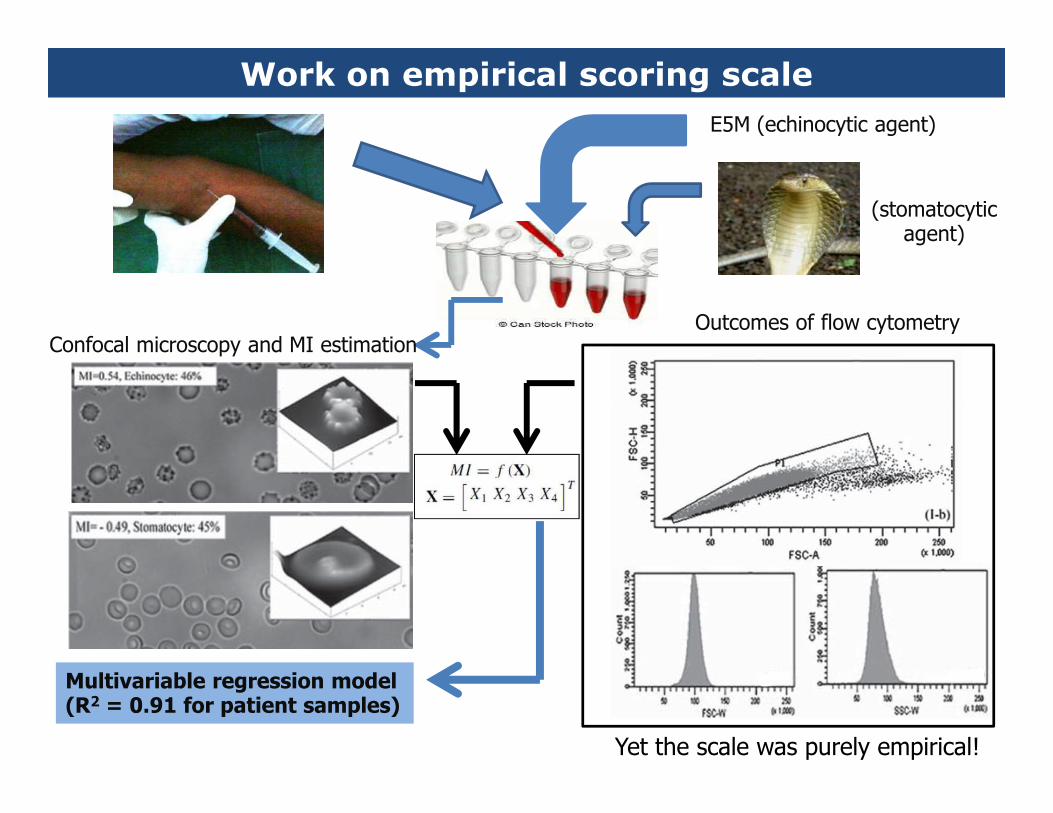
Work on empirical scoring scale
E5M (echinocytic agent)
(stomatocytic agent)
Confocal microscopy and MI estimationOutcomes of flow cytometry
Work on empirical scoring scale
Multivariable regression model(R2 = 0.91 for patient samples)
Yet the scale was purely empirical!
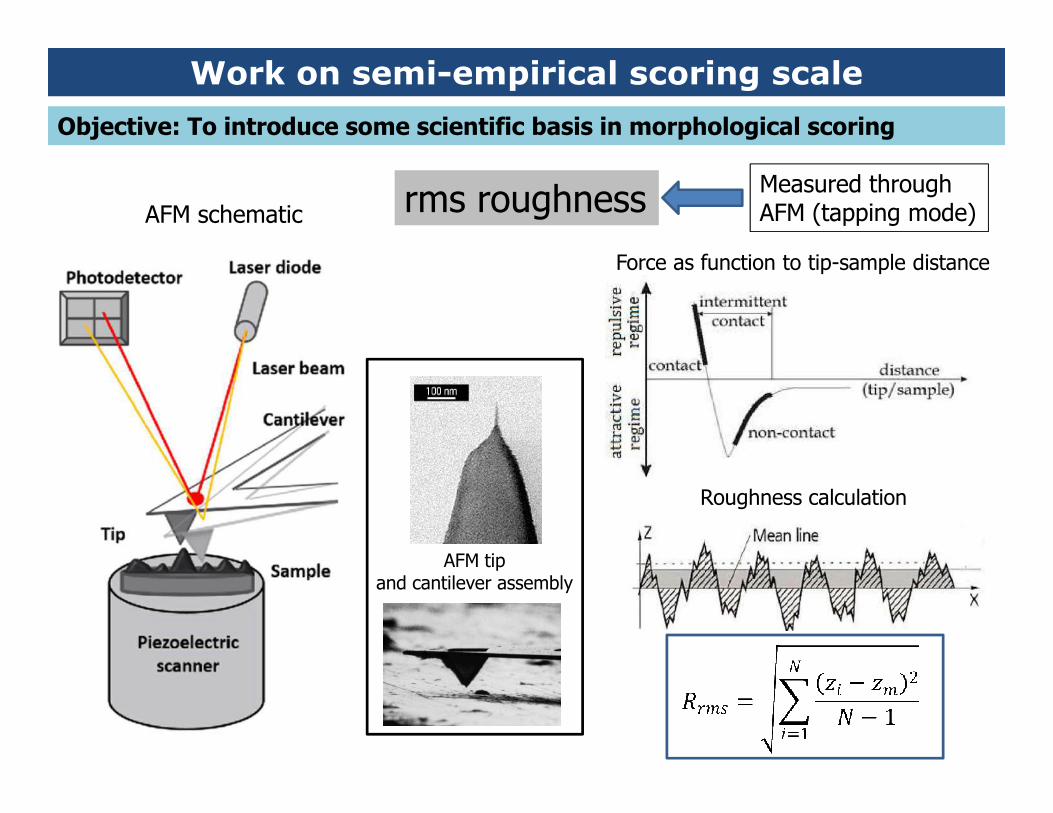
Work on semi-empirical scoring scale
Objective: To introduce some scientific basis in morphological scoring
rms roughnessMeasured throughAFM (tapping mode)AFM schematic
Force as function to tip-sample distance
AFM tip and cantilever assembly
Roughness calculation

10
12 Rrms, MD = 8.11SD = 1.69skewness = 1.13
Work on semi-empirical scoring scale
Roughness measurement of erythrocyte
Our work: Rrms was repeatedly (n = 13) estimated over 1.0 × 1.0 µm2
Girasole et
al. (2007)
Background:
No. of cells0 1 2 3 4 5 6 7 8 9 10 11
Rrm
s, M
D (nm
)
0
2
4
6
8
10
12Rrms, MD = 8.50SD = 0.59skewness = 0.28
Box Index0 1 2 3 4 5 6 7 8 9 10 11 12 13 14
Rrm
s (nm
)
0
2
4
6
8estimated over 1.0 × 1.0 µm2
rms roughness of four morphotypes

Designing the semi-empirical scale
Baseline data set of cell and box position averaged rms
roughness
Intermediate scale: X(i)Motive: MSD = 0
Intermediate scale: Y(i)Motive: to induce symmetry
Final MS scaleThrough normalization of Y(i)
Sem
i-em
piric
al M
S s
cale
0.0
0.5
1.0
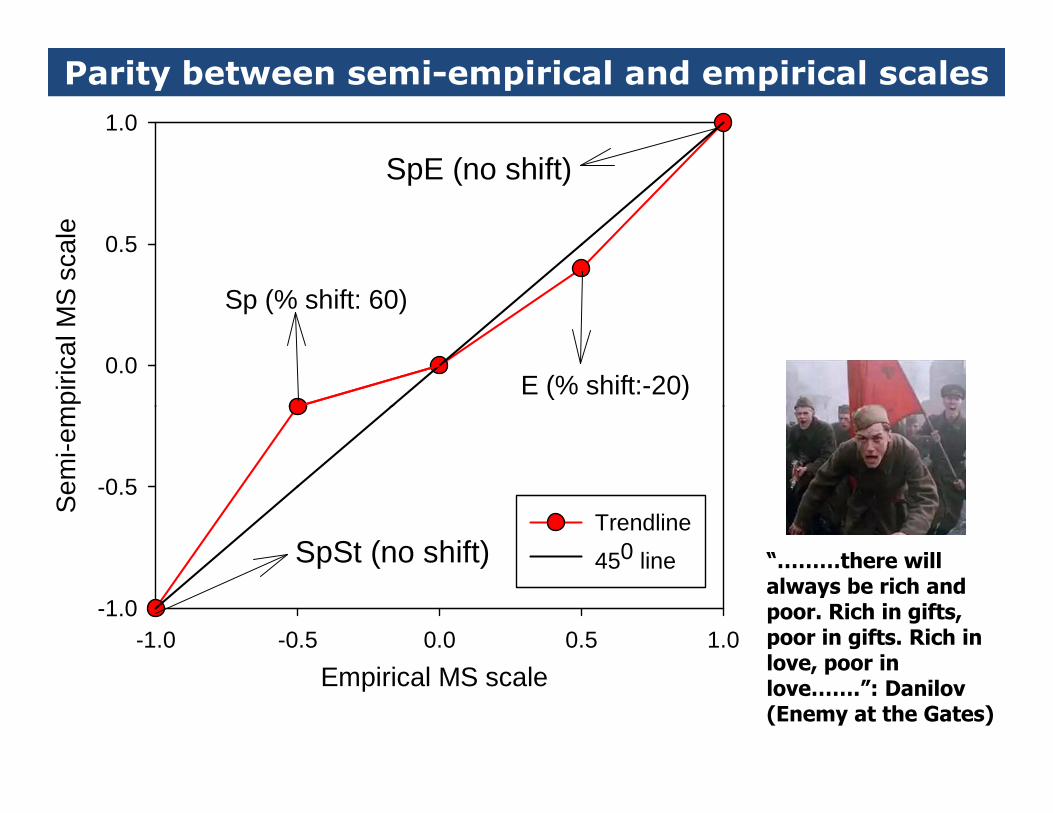
Sp (% shift: 60)
E (% shift:-20)
SpE (no shift)
Parity between semi-empirical and empirical scales
Empirical MS scale -1.0 -0.5 0.0 0.5 1.0
Sem
i-em
piric
al M
S s
cale
-1.0
-0.5
Trendline
450 lineSpSt (no shift) “………there will always be rich and poor. Rich in gifts, poor in gifts. Rich in love, poor in love…….”: Danilov (Enemy at the Gates)
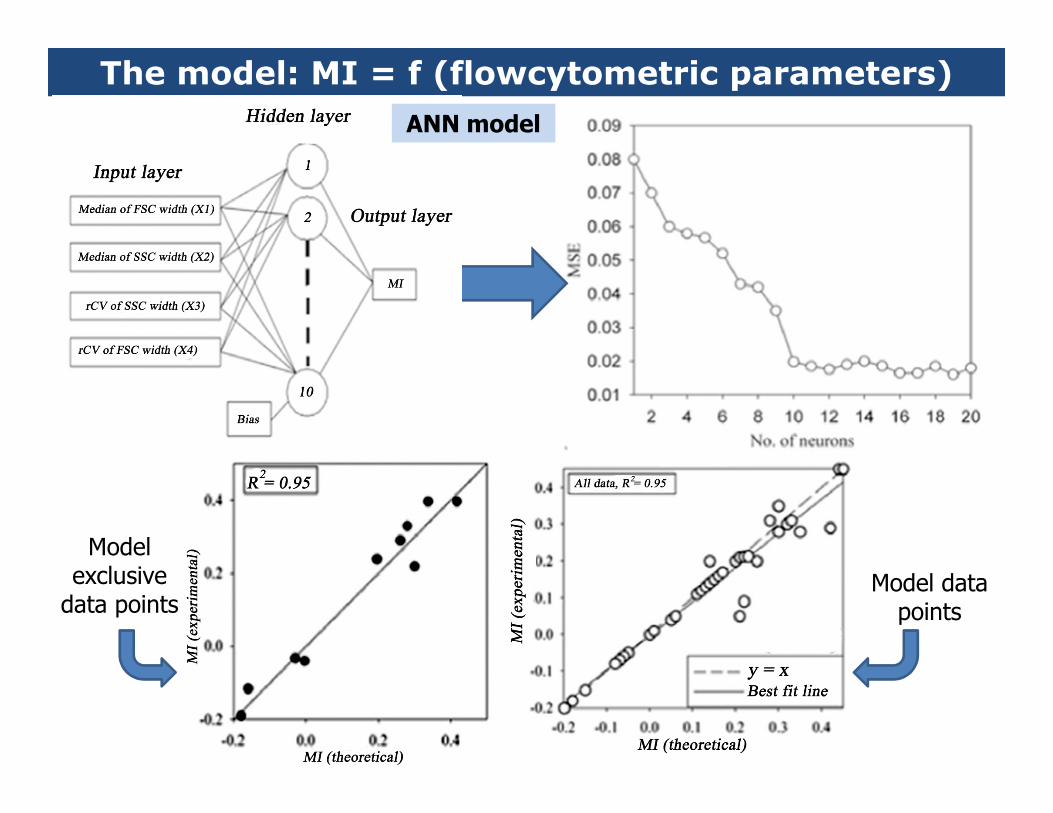
The model: MI = f (flowcytometric parameters)
ANN model
Model data points
Model exclusivedata points

Model application: CA patients
Confocal Imaging Flowcytometry (width distribution) Parity plot
Results of correlation study: Hematological parameters and MI
CBC parameters:1. TLC 2. HCT3. MCV 4. PLT
Best Intra-group correlation Correlation with MI

Leftovers of empiricity
The problem lies in the scanning protocol
Study by Girasole et al. (2007) Our report (2016)
Choice of fixed scan size was purely empirical; Rrms increases with scan area
• Variation reported by Girasole et al (2007) • Assumption of Area = 1.0 ×1.0 µm2
Hint about “Self Organization” of Rrms

Self-Organization
Self-organization, also called (in the social
sciences) spontaneous order, is a process where some form
of overall order arises from local interactions between parts
of an initially disordered system.
Source: Wikipedia
Framework to describe self-organization
Scaling parameters of Rrms vs. scan size: baseline data for morphological score.

Power law and self organization
Power law in distribution:P(x) ~ x-n
(n: fractal dimension)
Power law with positive exponent: y(x) ~ xHf
and Fd = 3-Hf
The scaling relation

Trimming down the empirical basis
Increasing size of scan elements: 0.25 to 20 µm2
Distribution of Rrms for 0. 5 × 0. 5 µm2
Cell-to-cell
variations of Rrms, MD

Trimming down the empirical basis
Self similarity in our work
Perfectly self similar
• Confidence Interval of Hf for four morphotypes > 95%
• Fd scale: Sp > E > D > St

MS scales and parity
But our Danilov is dead……

Findings
Model: ANN Model formulation data: MI from confocal imaging and flowcytometric data. Outcomes: MI = f (flowcytometric parameters)
The best modelThe least accurate
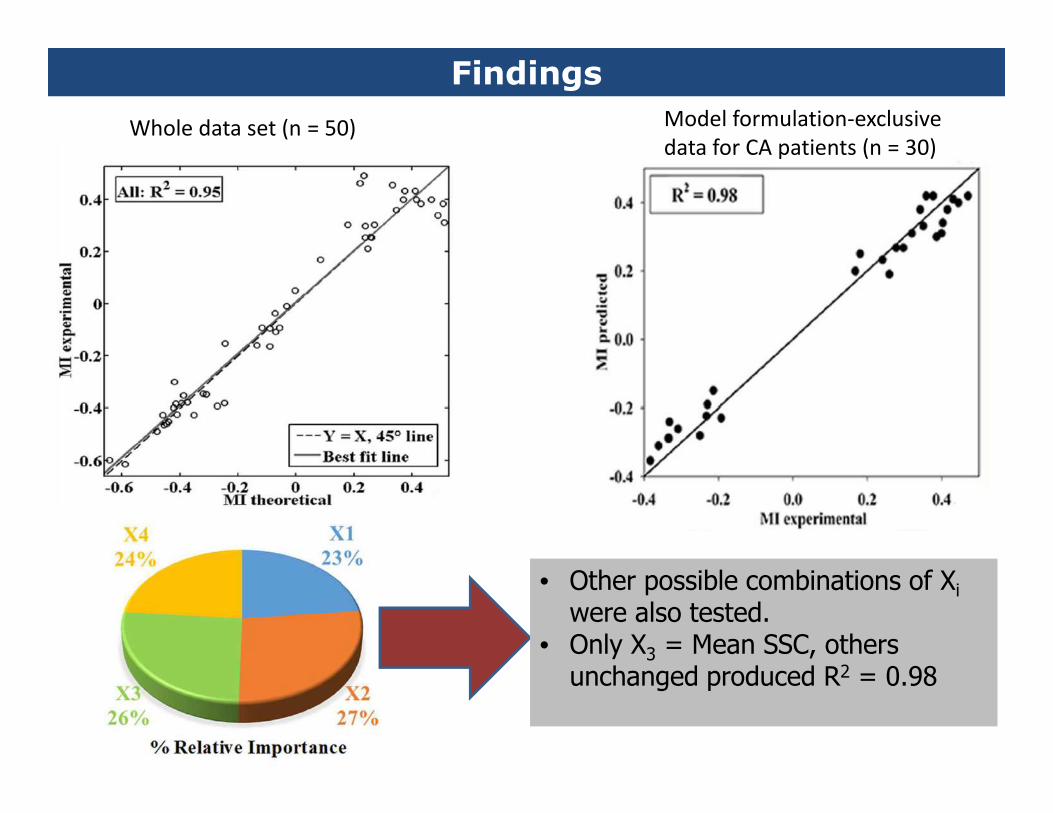
Findings
Whole data set (n = 50) Model formulation-exclusive
data for CA patients (n = 30)
• Other possible combinations of Xiwere also tested.
• Only X3 = Mean SSC, others unchanged produced R2 = 0.98
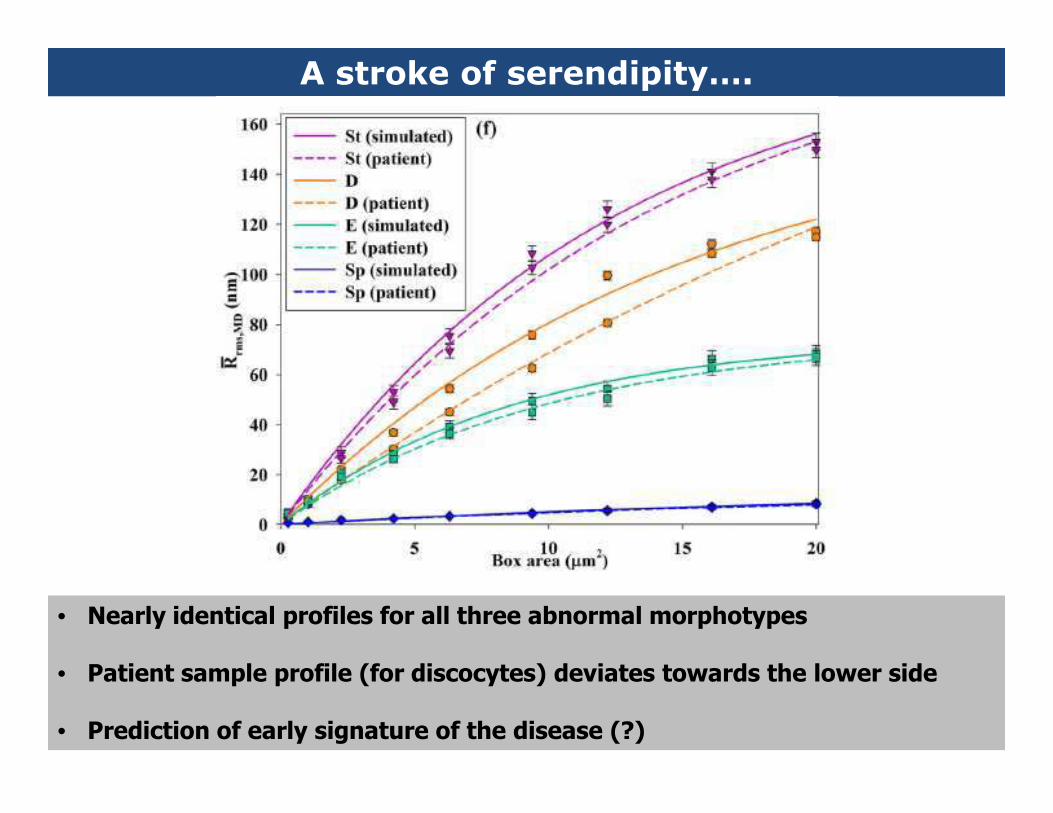
A stroke of serendipity….
• Nearly identical profiles for all three abnormal morphotypes
• Patient sample profile (for discocytes) deviates towards the lower side
• Prediction of early signature of the disease (?)

Some of our other works related to hematology….
Soft Matter 14 (2018) 7335-7346.
Related Documents