Past, Present and Future: Morphology and Dynamics of Rivermouth Lagoons in Westland, New Zealand A thesis submitted in partial fulfilment of the requirements for the Degree of Master of Science in Geography at the University of Canterbury Claire L. Kain Department of Geography University of Canterbury Christchurch, 2009

Welcome message from author
This document is posted to help you gain knowledge. Please leave a comment to let me know what you think about it! Share it to your friends and learn new things together.
Transcript
Past, Present and Future:
Morphology and Dynamics of
Rivermouth Lagoons
in Westland, New Zealand
A thesis submitted in partial fulfilment of the
requirements for the Degree of
Master of Science in Geography
at the
University of Canterbury
Claire L. Kain
Department of Geography
University of Canterbury
Christchurch, 2009
ii
ABSTRACT
Coastal wetlands and rivermouth lagoons are dynamic systems, which respond rapidly
to sea-level, tectonic, meteorological, anthropogenic and other synergistic drivers. This
research used a multi-disciplinary approach to investigate two representative West
Coast lagoon systems (Totara Lagoon and the Shearer Swamp-Waikoriri Lagoon
Complex) in order to document their present-day geomorphology and determine the
development and processes acting on these systems over historical time. This
information was then used to predict their future under varying climate, development
and management pressures. In addition to adding to the West Coast knowledge base, the
findings of this research are applicable to similar systems elsewhere in New Zealand
and internationally.
This investigation used a multidisciplinary approach to investigate the dynamics,
structure, development and active processes in the two study systems. Techniques to
document current hydrology and topography included hydrological records of water
level, temperature and conductivity, and Global Navigation Satellite Surveys (GNSS).
Outlet dynamics over a decadal scale were investigated through temporal aerial
photograph analysis, and sediment core analyses showed changes occurring over longer
timescales.
Significant differences in morphology and dynamics were observed between Totara
Lagoon and Waikoriri Lagoon, with the former being much larger, more stable, and less
dynamic in terms of dune morphology and outlet migratory patterns. Hydrologically,
Totara Lagoon is currently in an estuarine phase, and experiences significant tidal
inflows, which demonstrates the connectivity between definitions of coastal lagoons and
estuaries. Waikoriri Lagoon is freshwater, and can be described as a hapua-type system,
but exhibits very different river flow and barrier composition to East Coast examples.
Sediment core analyses from Shearer Swamp and northern Totara Lagoon showed little
change over a decadal to centennial scale, but evidence of a change in margin dynamics
in response to farming and stabilisation of adjacent dune ridges was observed in Shearer

iii
Swamp. Results suggest landward migration of the southern end of Totara Lagoon
occurred over this timeframe.
The future of these systems depends on the interaction between climate and
anthropogenic (including management) factors. A conceptual model of process and
response suggests three possible resultant scenarios: lagoon loss, natural lagoon, or
artificially modified lagoon.
A significant finding of this research is the recognition that some systems exist on a
continuum between a hapua and an estuary, switching hydrological states through time
while maintaining consistent morphology. In addition, the importance of barrier
permeability in hapua formation is highlighted, and the term ‘sandy hapua’ introduced
to distinguish these low-flow systems with low barrier permeability from the typical
mixed sand and gravel examples documented on the East Coast.
These findings enhance scientific understanding of rivermouth lagoon systems, and
demonstrate the wide spectrum of conditions under which they may form. This process-
based understanding is important from a coastal management perspective as concerns of
human induced climate change and accelerated sea level rise grow.
iv
TABLE OF CONTENTS
Abstract ii
Table of Contents iv
List of Figures viii
List of Tables xii
Acknowledgements xiii
CHAPTER ONE: INTRODUCTION 1
1.1. Thesis statement 1
1.2. Conceptual context 2
1.2.1. Coastal lagoons on high energy coasts 3
1.2.2. Hapua 8
1.2.3. Evolution and development of coastal lagoons 13
1.2.4. Hydrology of coastal lagoons 18
1.2.5. Morphodynamics in the coastal environment 21
1.2.6. Reconstructing past environments in coastal settings 24
1.2.7. Coastal management 28
1.2.8. Research gap 33
1.3. Reseach objectives 35
1.4. Thesis structure 36
CHAPTER TWO: STUDY AREA 38
2.1. Introduction 38
2.2. Geology and soils 40
2.3. Climate 42
2.4. Marine environment 43
2.5. Sediment supply 47
2.6. Site descriptions 47
2.6.1. Totara Lagoon 47
2.6.2. Shearer Swamp-Waikoriri Lagoon Complex 48
2.7. Hydrology 50
2.8. Anthropogenic influence and management 51
2.9. Observational site descriptions and field conditions 54
v
2.9.1. Totara Lagoon 54
2.9.2. Shearer Swamp-Waikoriri Lagoon Complex 57
2.10. Summary 59
CHAPTER THREE: METHODOLOGY 60
3.1. Introduction 60
3.2. Recent geomorphology 61
3.2.1. Topographic survey principles and practices 61
Data collection 62
Data Processing 66
GIS analysis 66
Limitations and errors 67
3.2.2. Aerial photograph analysis: principles and practices 68
Data collection and orthorectification 69
Analysis of lagoon change 70
Limitations and errors 70
3.2.3. Hydrological principles and practices 72
Data collection 73
Analysis of data 76
Limitations and errors 76
3.3. Methods of assessing development over historical time 77
3.3.1. Sediment cores 77
Method 77
Limitations and errors 80
3.3.2. Percent organics principles and practices 80
Method 83
3.4. Summary 86
CHAPTER FOUR: EXISTING GEOMORPHOLOGY AND HYDROLOGY 89
4.1. Introduction 89
4.2. Totara Lagoon 90
4.2.1. Topography from GNSS survey 90
4.2.2. Water level and character records 98
4.3. Shearer Swamp-Waikoriri Lagoon Complex 103
4.3.1. Topography from GNSS survey 103
4.3.2. Water level and character records 107
4.4. Interpretation and qualitative results 112
vi
4.4.1. Totara Lagoon 112
4.4.2. Shearer Swamp-Waikoriri Lagoon Complex 116
4.4.3. Comparison of Totara Lagoon and Waikoriri Lagoon 119
4.5. Summary 120
CHAPTER FIVE: OUTLET AND CHANNEL MIGRATION 1948 - 2006 122
5.1. Introduction 122
5.2. Totara Lagoon 123
5.2.1. Changes in outlet and channel position 123
Outlet position 123
Channel utilisation 125
Vegetation and features of interest 126
5.3. Shearer Swamp-Waikoriri Lagoon Complex 131
5.3.1. Changes in Waikoriri Lagoon and surrounding area 131
5.4. Interpretation and discussion of outlet dynamics 138
5.4.1. Totara Lagoon 138
5.4.2. Waikoriri Lagoon 140
5.4.3. Comparison of Totara Lagoon and Waikoriri Lagoon 141
5.4.4. Limitations and errors 142
5.5. Summary 142
CHAPTER SIX: DEVELOPMENT OVER DECADES TO CENTURIES 144
6.1. Introduction 144
6.2. Stratigraphy and sediment texture 144
6.2.1. Totara Lagoon 144
6.2.2. Shearer Swamp-Waikoriri Lagoon Complex 149
6.3. Interpretation and discussion 152
6.3.1. Totara Lagoon 152
6.3.2. Shearer Swamp 154
6.3.3. Limitations and errors 155
6.4. Summary
156
vii
CHAPTER SEVEN: INTEGRATED DISCUSSION AND MANAGEMENT
IMPLICATIONS 157
7.1. Introduction 157
7.2. Comparison of Totara Lagoon and Waikoriri Lagoon 158
7.3. Morphodynamic classification of coastal lagoons 160
7.3.1. The hapua-estuary continuum 161
7.4. Conceptual models of hapua dynamics 164
7.4.1. Comparisons with East Coast hapua 164
7.4.2. The issue of barrier permeability 167
7.5. Morphodynamic development of Totara Lagoon and the Shearer Swamp-
Waikoriri Lagoon Complex 170
7.5.1. Long term development of the study area 170
7.5.2. Potential response under changing climate and management scenarios 172
7.6. Summary 180
CHAPTER EIGHT: CONCLUSIONS 182
8.1. Summary of main findings 183
8.1.1. Description of current topography, observed geomorphology, and
hydrology 183
8.1.2. Outlet dynamics on a decadal scale 185
8.1.3. Development over historical time 186
8.1.4. The future of these systems 187
8.2. Limitations to this investigation and suggested areas for future research 188
References 190
Appendices 205
Appendix 1: List of important points in GNSS surveys 205
Appendix 2: Details of aerial photographs used 206
Appendix 3: Details of water level recorder locations, elevations and recording
periods 207
Appendix 4: Sediment core locations 207
Appendix 5: Grain size distribution graphs 208
vii
LIST OF FIGURES
Figure 1.1. River mouth classification according to the dominant process agents of
waves, tides, and rivers 4
Figure 1.2. Schematic sediment budget and storage equation for a mixed sand-gravel
river/beach/lagoon system. From Kirk (1991) 9
Figure 1.3. Cycle of river mouth behaviour and outlet migration posited by Todd (1992,
p. 212). 11
Figure 1.4. Descriptive model of mixed sand and gravel lagoon/spit/barrier processes.
(From Kirk, 1991) 12
Figure 1.5. Descriptive model of hapua behaviour illustrating the relationship between
marine and fluvial driving forces. (From Hart, 1999) 13
Figure 1.6. Definitions of spatial and temporal scales involved in coastal evolution.
(From Cowell and Thom, 1994) 15
Figure 1.7. The complex interaction of processes which control evolutionary processes
in a lagoon. (From Carter and Woodroffe, 1994) 15
Figure 1.8. The Okarito Lagoon locality. (From Nichol et al., 2007) 28
Figure 1.9. Schematic representation of theoretical practices recommended bywhen
assessing the impact of inlet relocation. (From Vila-Concejo et al., 2004) 31
Figure 1.10. Flowchart showing the hierarchy of management of the coastal
environment in New Zealand under the RMA. (From MfE, 2008a) 33
Figure 2.1. Location map showing the study sites in relation to New Zealand, each other
and the township of Ross 39
viii
Figure 2.2. The tectonic setting of New Zealand. (Adapted from Cochran et al., 2007) 41
Figure 2.3. The approximate location of the subtropical convergence. (From Neale et
al., 2007) 43
Figure 2.4. Undersea landform features of the West Coast. (From Neale et al., 2007) 45
Figure 2.5. The structure of the canyon network off the coast of Westland. (From Neale
et al., 2007) 45
Figure 2.6. The ocean currents of the West Coast region. (From Neale et al., 2007) 46
Figure 2.7. Location maps showing Totara Lagoon and the Shearer Swamp-Waikoriri
Lagoon Complex 49
Figure 2.8. Aerial photograph of the Shearer Swamp-Waikoriri Lagoon complex
showing the location of the old tramway and the artificial overflow channel known
locally as ‘The Causeway’. 54
Figure 2.9. Photographs showing the conditions surrounding Totara Lagoon. 56
Figure 2.10. Photographs showing the conditions at Shearer Swamp and Waikoriri
Lagoon 58
Figure 3.1. Location maps showing the surveyed areas in Totara Lagoon and the
Shearer Swamp-Waikoriri Lagoon Complex 64
Figure 3.2. Photographs showing the base station setup at Ross Cemetery, and
surveying at Totara South 65
Figure 3.3. Photographs showing the water level recorder set up at the field sites. 75
Figure 3.4. Locations of the water monitoring sites in Totara Lagoon and Waikoriri
Creek 75
Figure 3.5. Locations of sediment cores taken from Totara Lagoon and Shearer Swamp 79
Figure 3.6 Photographs showing the coring process 79
ix
Figure 3.7. The Udden-Wentworth scale for grain sizes (From Lewis and McConchie,
2004)
82
Figure 3.8. Summary flowchart of the methods employed in this project, the timeframes
to which they apply, and the information provided by each technique. 88
Figure 4.1. DEM of Totara South. Surveyed December 1st – 8th 2008. 93
Figure 4.2. Cross sectional profiles of the Totara Lagoon/Totara River channel 94
Figure 4.3. DEM of Totara Central survey area. Surveyed December 5th 2008. 95
Figure 4.4. Totara Central dune profiles 95
Figure 4.5. DEM of the Totara Central North survey area, surveyed December 6th 2008 96
Figure 4.6. Cross sectional profiles of the Totara Central North survey area 96
Figure 4.7. DEM of the Totara North survey area, surveyed December 7th and 8th 2008 97
Figure 4.8. Profiles across the dunes and channel surface at Totara North 97
Figure 4.9. Short term water records taken between November 29th and December 8th
2008 across three sites in Totara Lagoon. The tidal cycle (1 m height) for the survey
week is superimposed on the conductivity and water level graphs 101
Figure 4.10. Long term water records taken at Totara Central North between September
2008 and March 2009. 102
Figure 4.11. DEM showing the topography of Waikoriri Lagoon and the western
margin of Shearer Swamp. Surveyed December 9th to 14th 2008 105
Figure 4.12. Cross sectional profiles of the Waikoriri Lagoon channel 105
Figure 4.13. Cross sectional profiles of the relic dune ridges along the western margin
of Shearer Swamp 106
Figure 4.14. DEM of a small section of the south-eastern margin of Shearer Swamp,
along Waikoriri Creek. Surveyed December 13th 2008. 106
x
Figure 4.15. An excerpt from the long term water depth record of Waikoriri Bridge,
taken September 23rd to 30th 2008. Water level variations during this period were not
tidally influenced.
109
Figure 4.16. Short term water records taken over three sites in Waikoriri Creek and the
western margin of Shearer Swamp, December 8th – 15th 2008. 110
Figure 4.17. Long term water records taken at Waikoriri Bridge between September
2008 and March 2009. 111
Figure 4.18. Changes in the configuration of the Totara Lagoon outlet between
December 2008 and March 2009 115
Figure 4.19. Photographs showing the changes in Waikoriri Lagoon following the
breach in November 2008. 119
Figure 5.1 Totara Lagoon aerial images 1948-2005, areas outside of the lagoon have
been cropped. 128
Figure 5.2 Digitisations of Totara Lagoon over time from aerial photographs. Outlet
position is circled in red. 129
Figure 5.3 Disused channels of Totara Lagoon. Those in the left half of the picture
were abandoned some time prior to the 1948 aerial photograph. 130
Figure 5.4 Summary of outlet positions of Totara Lagoon 1948 to 2005. 130
Figure 5.5 Aerial photographs of Waikoriri Lagoon, showing Bold Head Road to the
landward side of the lagoon and the ‘Causeway’ next to the road. 134
Figure 5.6 Digitisations of Waikoriri Lagoon from aerial photographs, 1948 – 2006.
Outlet position is circled in red 135
Figure 5.7 Summary of outlet positions in Waikoriri Lagoon, 1948 to 2006. 136
Figure 5.8. Wave climate at each end of Totara Lagoon. 137
Figure 6.1. Sediment core taken from Totara North. Photograph: Marney Brosnan 146
Figure 6.2. Sediment core taken from Totara South. Photograph: Marney Brosnan 146
xi
Figure 6.3. Graphic log of the stratigraphy and sediment character from the Totara
North sediment core.
147
Figure 6.4. Graphic log of the stratigraphy and sediment character from the Totara
South sediment core. 147
Figure 6.5. Results of grain size analysis for Totara North, showing mean grain size and
degree of sorting for each sample depth 148
Figure 6.6. Results of grain size analysis for Totara South, showing mean grain size and
degree of sorting for each sample depth. 148
Figure 6.7. Percentage of organic matter for samples taken from Totara Lagoon cores 149
Figure 6.8. Sediment core taken from Shearer Swamp. Photograph: Marney Brosnan 150
Figure 6.9. Graphic log of the stratigraphy and sediment character from the Shearer
Swamp sediment core 150
Figure 6.10. Results of grain size analysis for Shearer Swamp, showing mean grain size
and degree of sorting for each sample depth 151
Figure 6.11. Percentage of organic matter at each sample depth for the Shearer Swamp
core. 152
Figure 7.1. Schematic representation of the relationship between barrier permeability,
mean river flow and tidal regime in selected South Island hapua 169
Figure 7.2. Photograph showing the eroding landward margin of Totara Lagoon at the
southern end of the system. This is representative of conditions along the first 2 km of
the lagoon channel. 175
Figure 7.3. Flowchart depicting the response of a hapua to climate and anthropogenic
influences 179

xii
LIST OF TABLES
Table 3.1. Details of GNSS surveys across both field sites. 65
Table 3.2. Electrical conductivity ranges of different water types (From
waterwatch.org.au) 73
Table 3.3. Sorting classes. 84
Table 5.1. Offset of the Totara Lagoon outlet, measured north from the point at which
the Totara River meets the coast. 124
Table 5.2. Outlet offset and change in surface area of Waikoriri Lagoon between
surveys. 133
Table 6.1. The percentage of each sediment sample from Totara Lagoon greater than
1000 µm, which was removed prior to laser sizer grain size analysis. 146
Table 6.2. Percentage of each sediment sample from Shearer Swamp greater than 1000
µm in diameter, which was removed prior to laser sizer analysis. 151
xiii
ACKNOWLEDGEMENTS
This thesis is the product of a lot of hard work, collaboration, and coffee. Thank you to
the numerous people who have helped in various ways over the year, without you all
this project could not have been successfully completed.
Firstly, an enormous thank you to my supervisor, Dr. Deirdre Hart. Your passion for
coastal geography and perpetually willing provision of your time and energies has been
greatly appreciated. Thank you also for always encouraging me to challenge myself and
take hold of academic opportunities.
To Lady Diana Isaac and the Isaac Wildlife Trust, a sincere thank you. I am honoured to
have been this year’s recipient of the Sir Neil Isaaac Scholarship in Geography and
Environmental Science, and am very grateful for the financial assistance it provided.
Thank you also to the New Zealand Coastal Society for providing research funding in
the form of the NZCS Masters Research Scholarship, and for giving me the opportunity
to present my research at the Coasts and Ports Conference earlier this year.
I am very grateful for the excellent support and access to field equipment provided by
the Geography Department. In particular, I would like to thank Justin Harrison and Nick
Key for training, field assistance, technical advice – and Nick, thanks for always being
able to fix the stuff I break. To Paul Bealing, thank you for all your time and effort
working with me and my huge haphazard datset in GIS. I have learnt an amazing
amount from this process. Thank you also to Dr. Catherine Reid and Chris Grimshaw
in the Geology Department, for the use of your equipment and for sharing your
expertise.
To those awesome people who didn’t mind traipsing through swamps on the West Coast
to help me out with my field work – thank you: particularly Cameron Kain, Edward
Wright and Simon Hall.
I am grateful for the help of the numerous friendly West Coast locals, who were very
generous with both information and hospitality. From Bold Head Rd: Kathy Gilbert,
xiv
Annie Hughes and Ted Brennan. Thank you to the staff of DOC Hokitika; to Don Neale
and Ron van Mierlo for field information, and Jackie Breen for generously spending her
time helping me with aerial photographs.
To my Masters colleagues in the Geography department, thanks for the friendship and
the laughs.
I sincerely thank my friends and family for their love and support this year. In
particular, Ed and Kreepa deserve a mention for putting up with me both at uni and
outside of it. To Jackie, thank you for being there and for being you.
Finally, extra special thanks must go to Mum, Dad and Cameron for their unconditional
love and support, and for always managing to muster some interest in ‘all this uni
business’.
1
CHAPTER ONE
Introduction
1.1 Thesis statement
Coastal wetlands and river mouth lagoons are dynamic, active environments that can
respond rapidly to changes in climate, sea level, tectonic and anthropogenic drivers.
This is particularly true of those on the West Coast of New Zealand’s South Island,
where a high energy coastal marine environment, extreme weather patterns and high
sediment load from nearby mountains contribute to continual, and often rapid, changes
in these systems. As such, it is important to understand the local coastal environment in
order to effectively manage it, especially as concerns of human induced climate change
and accelerated sea level rise grow.
Very little coastal process and management research has been undertaken previously on
the West Coast, and consequently the coastal history and processes of the region are not
currently documented or understood to the level required for making effective coastal
management decisions and plans. The purpose of this research is to investigate two
representative coastal systems in the West Coast region; Totara Lagoon and Shearer
Swamp/Waikoriri Lagoon, with the aim of documenting their development over recent
centuries and their present-day topography and dynamics. This information will then be
used to predict their future under changing climate, development and management
scenarios. In addition to adding to the West Coast knowledge base, it is important that
the scientific and management models presented in this research are applicable to
similar systems elsewhere in New Zealand and globally.
A multidisciplinary approach will be used to investigate the evolution, structure and
acting processes operating in two case study lagoons. Techniques to be employed
include the use of Global Navigation Satellite Surveys (GNSS), sediment core analyses,
water level monitoring, temporal aerial photograph analysis, and conceptual predictive
modelling. The use of these different and complementary techniques allows a robust

2
and coherent set of results from which to construct historical and predict future
evolution of these complex lagoon systems.
This chapter introduces the context of this research in terms of national and
international literature on coastal lagoons and their morphodynamic evolution. Gaps in
existing research are highlighted. This is followed by the definition of the specific
objectives of this research and their relationship within the knowledge gaps. Finally, a
synopsis of the structure of this thesis and individual chapter contents are provided.
1.2 Conceptual context
As complex, dynamic environments, coastal lagoon and wetland systems are difficult to
investigate, understand and predict changes in. This project employs a multidisciplinary
methodological framework to provide a comprehensive and robust documentation of
changes and processes in two representative West Coast systems through historical time
and the present day. A range of geological, hydrodynamic and survey techniques will be
employed to achieve this. These techniques have been widely applied in previous
research both nationally and internationally, and studies using these techniques
individually and in concert will be reviewed as part of this project.
The coastal environment and related processes have been the subject of increasing
amounts of research over the past 50 years. As technology has advanced, so too has the
scope and detail of studies and hence our understanding of the coastal environment.
This research has been summarised and detailed in a number of review papers published
in recent decades (e.g. Thom and Short, 2006; Stephenson and Brander, 2003, 2004;
Hesp et al., 1999; Hume et al., 1992). Textbooks dealing solely with the subject of
coastal geomorphology have become common and include Kjerfve (1994), Carter and
Woodroffe (1994), Komar (1998), Short (1999), Bird (2003), Woodroffe (2003), and
Masselink and Hughes (2003). This chapter will provide a comprehensive overview of
both New Zealand and international literature on the subtopic of coastal lagoons, their
morphodynamics and their coastal evolution. In addition to published literature, many
unpublished theses and reports related to coastal processes and industry exist, some of
which are included and others of which are omitted from this review due to availability
and access constraints.
Chapter One: Introduction
3
1.2.1 Coastal lagoons on high energy coasts
The term ‘coastal lagoon’ applies to a wide range of coastal waterbodies that can have
significant differences in morphology and dynamics. Coastal lagoons occur in micro-
and meso-tidal environments worldwide, the form they take depending on the balance
between marine and fluvial processes and sediment input (Cooper, 1994). The defining
characteristics of coastal lagoons are therefore broad, which leads to discrepancies in
estimates of lagoon spread and frequency worldwide. Estimates suggest lagoons border
approximately 13% of the world’s coastlines (Barnes, 1980 p. 1).
In the context of this study, the term coastal lagoon refers to a body of water occurring
at a river mouth and running approximately shore-parallel, in temperate and high
latitude regions. Coastal lagoons are globally common; they can exhibit a wide range of
geomorphological characteristics and structures, and can range in salinity from
essentially freshwater to hypersaline (Kjerfve, 1994; Kirk and Lauder, 2000). Most
lagoons are considered to be short-term features on a geological time-scale, as they form
and subsequently evolve and infill within relatively short periods (Cooper, 1994).
Barnes (1980) suggests the majority of lagoons exist for less than 1000 years, but that
lifespan increases with size.
Coastal lagoons are different from estuaries, and Kjerfve (1994) identifies several key
factors in identifying coastal lagoons: they are usually oriented parallel to the shore,
separated from the ocean by a barrier while remaining connected by one or more
restricted inlets, and are seldom more than a few metres deep. Most existing coastal
lagoons formed during the Pleistocene or Holocene as sea levels rose and marine
processes caused barriers to grow (Barnes, 1980; Kjerfve, 1994). Lagoons, estuaries and
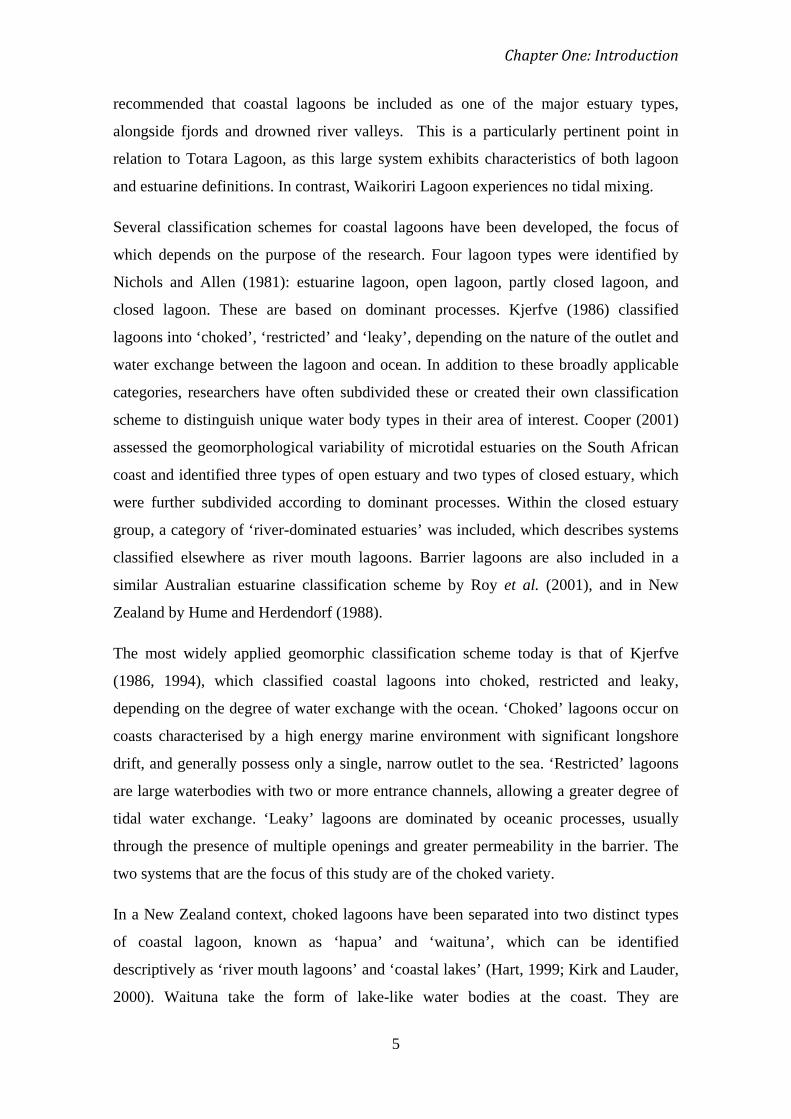
deltas are all coastal features which form at river mouths; the difference lies in the
dominant process acting on the system (Hart, 2007) (Figure 1.1). Coastal lagoons form
in a wave-dominated environment, estuaries are dominated by tidal cycles, and deltas by
fluvial processes.

4
Figure 1.1. River mouth classification according to the dominant process agents of
waves, tides, and rivers. Sourced from Hart (2007), p. 927
Early research surrounding coastal lagoons focused on understanding processes of
coastal lagoon formation, identification of defining characteristics, and the development
of classification schemes within which to group water bodies of similar geomorphology.
Coastal lagoons were described by Phleger (1969) and defined by Kjerfve (1994 p. 2) as
“an inland body of water, usually oriented parallel to the coast, separated from the
ocean by a barrier, connected to the ocean by one or more restricted inlets, and having
depths which seldom exceed a couple of metres”. This still applies in modern
definitions; however, later definitions often include reference to sediment deposition
and littoral drift (Kjerfve, 1986; Kjerfve, 1994; Cooper, 1994). The identification and
classification of coastal lagoons is further complicated by the overlap between
definitions of lagoons and estuaries, the latter being similar coastal systems but which
are tidally dominated (Kjerfve, 1986). Cameron and Pritchard (1963 p. 306) define an
estuary as “a semi-enclosed coastal body of water having a free connection with the
open sea and within which the sea-water is measurably diluted with fresh water
deriving from land drainage”. When comparing this with the description of a coastal
lagoon presented above, these are not entirely separate concepts, but rather a continuum
along which the degree of ocean water exchange determines the water body type.
Coastal lagoons are included as a type of estuary in some literature. Kjerfve (1986),
whose coastal lagoon classification system is still the most widely used today,
Wave-dominated
Tide-dominated
River-dominated
Estuaries
Deltas
Hapua Lagoons
Chapter One: Introduction
5
recommended that coastal lagoons be included as one of the major estuary types,
alongside fjords and drowned river valleys. This is a particularly pertinent point in
relation to Totara Lagoon, as this large system exhibits characteristics of both lagoon
and estuarine definitions. In contrast, Waikoriri Lagoon experiences no tidal mixing.
Several classification schemes for coastal lagoons have been developed, the focus of
which depends on the purpose of the research. Four lagoon types were identified by
Nichols and Allen (1981): estuarine lagoon, open lagoon, partly closed lagoon, and
closed lagoon. These are based on dominant processes. Kjerfve (1986) classified
lagoons into ‘choked’, ‘restricted’ and ‘leaky’, depending on the nature of the outlet and
water exchange between the lagoon and ocean. In addition to these broadly applicable
categories, researchers have often subdivided these or created their own classification
scheme to distinguish unique water body types in their area of interest. Cooper (2001)
assessed the geomorphological variability of microtidal estuaries on the South African
coast and identified three types of open estuary and two types of closed estuary, which
were further subdivided according to dominant processes. Within the closed estuary
group, a category of ‘river-dominated estuaries’ was included, which describes systems
classified elsewhere as river mouth lagoons. Barrier lagoons are also included in a
similar Australian estuarine classification scheme by Roy et al. (2001), and in New
Zealand by Hume and Herdendorf (1988).
The most widely applied geomorphic classification scheme today is that of Kjerfve
(1986, 1994), which classified coastal lagoons into choked, restricted and leaky,
depending on the degree of water exchange with the ocean. ‘Choked’ lagoons occur on
coasts characterised by a high energy marine environment with significant longshore
drift, and generally possess only a single, narrow outlet to the sea. ‘Restricted’ lagoons
are large waterbodies with two or more entrance channels, allowing a greater degree of
tidal water exchange. ‘Leaky’ lagoons are dominated by oceanic processes, usually
through the presence of multiple openings and greater permeability in the barrier. The
two systems that are the focus of this study are of the choked variety.
In a New Zealand context, choked lagoons have been separated into two distinct types
of coastal lagoon, known as ‘hapua’ and ‘waituna’, which can be identified
descriptively as ‘river mouth lagoons’ and ‘coastal lakes’ (Hart, 1999; Kirk and Lauder,
2000). Waituna take the form of lake-like water bodies at the coast. They are
6
predominantly brackish to freshwater, with only one restricted opening to the ocean, so
ocean water exchange is usually unidirectional and in an outward direction, and tidal
influence is minimal (Kirk and Lauder, 2000). Most waituna form in depressions left
between the outwash fans of major Quaternary rivers (Kirk and Lauder, 2000). The term
‘hapua’ has been applied to describe the two lagoon systems throughout this study,
which could also be classified as ‘barrier lagoons’ or ‘river-dominated estuaries’
according to other classification schemes.
Later research has branched out from rigid classifications of coastal systems, become
more holistic and increasingly focused on drivers of change and links between
formation, sediment processes and hydrology (e.g. Fitzgerald and van Heteren, 1999;
Cooper, 2000; Hart and Bryan, 2008). In recent years, a more multidisciplinary
approach has often been taken in coastal research, through which more robust and
coherent data has been achieved (e.g. Horrocks et al., 2008; Nichol et al., 2007; Allard
et al., 2009). From these results, models of coastal behaviour have been developed to
better understand processes and response. The problem of terminology remains,
however, and continues to present challenges in describing complex coastal systems and
their behaviour, as is the case in the present study.
Kirk (1991) investigates the development of the Rakaia rivermouth, a hapua-type
lagoon system, and its response to changes in fluvial and marine processes, which is
then applied in the context of a water resource planning model. The lagoon system was
found to be very sensitive to changes in the connected fluvial and marine environments,
including changes in land-use affecting catchment hydrology and sediment supply.
Dramatic land-use change has occurred in the catchments of Totara Lagoon and
Waikoriri Lagoon over historical time, and this model is evaluated as part of this study
in Chapter 7.
Carter et al. (1989) assess the difference in coastal lagoon dynamics and evolution
under differing relative sea level regimes using case studies from Ireland
(approximately stationary relative sea level) and Nova Scotia (rapidly rising relative sea
level). The Irish sequences show smooth changes, whereas the Canadian sequences
fluctuate rapidly between terrestrial and marine environments. These fluctuations are
not concluded to be a response to sea level oscillations, but rather evidence of ‘life
cycle’ changes in lagoon barriers. This study highlights the importance of recognising
Chapter One: Introduction
7
the lagoon barriers as part of a stochastic process controlled by sea level and sediment
supply, rather than taking these apparent changes at face value.
Following this, Orford and Carter (1995) investigated the driving forces of changes in a
gravel barrier in Nova Scotia, concluding that there is an important mesoscale decadal
forcing occurring, upon which the effects of microscale events (e.g. storms, tropical
cyclone remnants) are superimposed. The positive feedback loop existing between
relative sea level, sediment supply and barrier dynamics is apparent in this and other
long term studies of morphological change and their driving factors. Another example is
Jennings et al. (1998), who investigated the Holocene evolution of a gravel barrier,
concluding that sea level fluctuations caused changes in local sediment supply and thus
barrier dynamics. Once again, the interdependence is evident between different
processes exerting control on lagoon geomorphology, meaning change is not only
driven directly by these forcing factors, but indirectly through a complex network of
feedback loops.
River mouth lagoons, and hapua in particular, have been studied intensely in New
Zealand’s South Island. Kirk and Lauder (2000) compiled a report of significant coastal
lagoon systems on the east coast of the South Island, and categorised these into hapua
and waituna. The need for accurate data on sedimentation rates in these systems is
highlighted in a management context. Kirk (1991) describes a distinctive sequence of
behaviour for the Rakaia river mouth, which is a moderately sized river discharging at a
wave dominated, mixed sand and gravel coast. This behaviour sequence can be applied
to similar systems elsewhere and is characterised by the growth of a barrier across the
river mouth in response to littoral drift, followed by freshwater lagoon development
behind this coarse barrier. The lagoon mouth migrates in response to changes in river
flow and sediment processes, which will be discussed further in Section 1.2.2. Further
research surrounding the dynamics of river mouth lagoons on high energy, mixed sand
and gravel coasts is presented by Hart (2007, 2009). Research into similar systems on
sandy or other types of coasts is lacking, and it would be valuable to assess the
applicability of these models to similar systems on such coastlines.
8
1.2.2 Hapua
The two lagoons studied in this project may be described as hapua type systems. Hapua
usually occur at the mouths of braided, gravel-bearing rivers, and form as long, narrow
waterbodies oriented parallel to the shore. They are predominantly fresh water and are
separated from the ocean by a narrow barrier of coarse sediments, which forms as a
consequence of strong longshore drift resulting in an offset river mouth (Hart, 1999;
Kirk and Lauder, 2000). They typically form on high-energy coasts where marine
processes are dominant over fluvial processes, and are thus common in New Zealand
yet are not well documented in international literature (Hart, 2007). Hapua generally
possess a single, semi-stable opening and are not subject to significant tidal inflows and
outflows. During flood events the barrier may be breached to form new or multiple
openings; however, these are only temporary (Todd, 1992; Hart, 1999; Hart, 2007).
Pre-requisite conditions for hapua formation include a microtidal regime (with tidal
ranges of less than 2 m), high-energy wave climate and strong longshore drift. They
occur at the mouths of ‘small’ rivers, i.e. those that carry insufficient sediment to
prevent erosion by the sea of the coastline at their mouth, and usually occur on
coastlines experiencing long-term net erosion but may also form on stable coasts (Kirk
and Lauder, 2000). The formation of the lagoon begins with the creation of a sediment
barrier along the beach in front of the rivermouth, due to erosion and reworking of cliff
and river sediments by longshore currents. This occurs when waves approach sub-
parallel to the beach, which moves material along it at the angle of approach, creating a
longshore barrier which encloses the lagoon (Barnes, 1980). In the case of hapua, this
barrier causes the rivermouth to be offset, and a depression created between the barrier
and the land behind becomes the lagoon channel (Kirk, 1991; Todd, 1992) (Figure 1).
Chapter One: Introduction
9
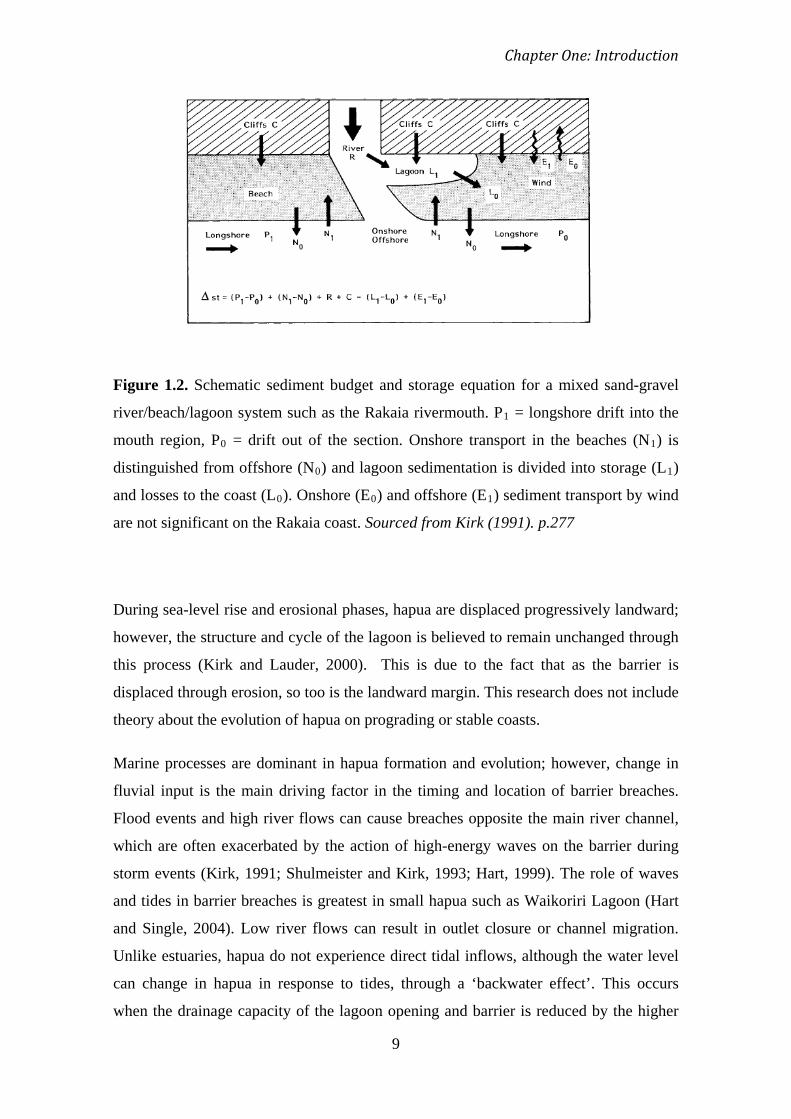
Figure 1.2. Schematic sediment budget and storage equation for a mixed sand-gravel
river/beach/lagoon system such as the Rakaia rivermouth. P1 = longshore drift into the
mouth region, P0 = drift out of the section. Onshore transport in the beaches (N1) is
distinguished from offshore (N0) and lagoon sedimentation is divided into storage (L1)
and losses to the coast (L0). Onshore (E0) and offshore (E1
) sediment transport by wind
are not significant on the Rakaia coast. Sourced from Kirk (1991). p.277
During sea-level rise and erosional phases, hapua are displaced progressively landward;
however, the structure and cycle of the lagoon is believed to remain unchanged through
this process (Kirk and Lauder, 2000). This is due to the fact that as the barrier is
displaced through erosion, so too is the landward margin. This research does not include
theory about the evolution of hapua on prograding or stable coasts.
Marine processes are dominant in hapua formation and evolution; however, change in
fluvial input is the main driving factor in the timing and location of barrier breaches.
Flood events and high river flows can cause breaches opposite the main river channel,
which are often exacerbated by the action of high-energy waves on the barrier during
storm events (Kirk, 1991; Shulmeister and Kirk, 1993; Hart, 1999). The role of waves
and tides in barrier breaches is greatest in small hapua such as Waikoriri Lagoon (Hart
and Single, 2004). Low river flows can result in outlet closure or channel migration.
Unlike estuaries, hapua do not experience direct tidal inflows, although the water level
can change in hapua in response to tides, through a ‘backwater effect’. This occurs
when the drainage capacity of the lagoon opening and barrier is reduced by the higher
10
water levels outside, and the water level inside the lagoon rises temporarily in response
(Smith, 1995; Hart, 1999; Hart, 2007).
The permeability of the barrier is extremely important in hapua dynamics, as it controls
the degree of throughflow between the lagoon water body and the ocean and determines
the state of the outlet in response to varying river flows and wave action (Kirk, 1991;
Todd, 1992; Hart, 1999). However, it is not the sole controlling factor, as the amount of
throughflow between the lagoon and the ocean is also dependent on the hydraulic head
between the lagoon and ocean water body. If river base flow is less than the barrier
seepage capacity, there will be no outlet present. For a permanent outlet to be
maintained, the base flow of the river must be many times the seepage capacity of the
barrier. In between these two extremes, the outlet is more mobile and may open and
close frequently in response to changes in river flow (Hart, 1999, 2007). Barrier
permeability can vary widely between hapua, and at different places, levels, and
conditions along a single barrier (Hart, 1999).
Research into hapua dynamics and responses has centred on South Island, East Coast
rivers, although the cycles and models described for these systems may be applicable to
similar systems elsewhere. A distinctive process of gradual river mouth offset and
lagoon development following a major flood event has emerged from these studies.
Marine processes are generally dominant in hapua dynamics, but during a large flood
event fluvial processes dominate and the barrier is breached adjacent to the main river
channel. The flooded river injects a large amount of sediment into the system at this
point, in the form of a subtidal delta (Kirk, 1991; Todd, 1992). Following the flood,
marine processes once again dominate, and this sediment is pushed landward by wave
action and transported by longshore drift. A barrier forms across the rivermouth, which
causes the mouth to become offset and the channel becomes diagonally oriented across
the barrier. As the barrier grows and becomes more stable, water becomes increasingly
trapped and the size of the lagoon increases. As the water body grows, the outlet
migrates in response to the changing dynamics of the system. This cycle continues until
the barrier is once again breached at the river mouth by a flood event, resulting in the
bypass of the existing lagoon and the start of a new cycle (Kirk, 1991; Todd, 1992).
This sequence of changes is illustrated in Figure 1.3.
Models of hapua behaviour

Chapter One: Introduction
11
Figure 1.3. Cycle of river mouth behaviour and outlet migration posited by Todd (1992,
p. 212).
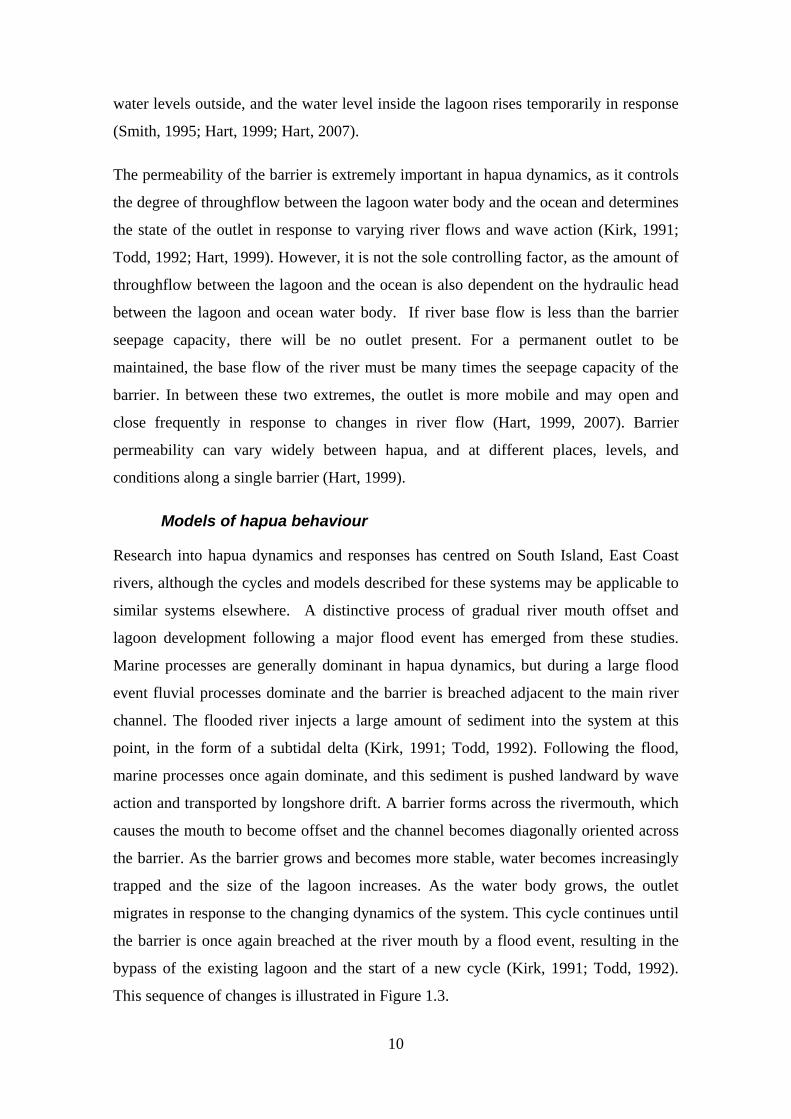
This sequence of events can be linked to numerical parameters of a specific system and
a model created to predict the behaviour of a system at a given river flow. It is important
to note that although the following model is based on river flow, marine processes
remain the dominant driving factor of lagoon formation, and fluvial processes dominate
solely during large flood events in the initiation of barrier breaches at the river mouth. A
resource management model for the behaviour of the Rakaia River mouth is presented
in Figure 1.4. For this particular system, the outlet is closed at low river flows, and
possesses a single, migrating opening at more typical river flows. The threshold for a
breach at the river mouth is defined as the mean annual flood flow (200 m3 s-1 for this
particular system), resulting in lagoon truncation and the injection of a large sediment
flux at the coast. Although this model is designed specifically for this system, the
general dynamics are transferable to other hapua. Not all stages may occur in every
hapua, and other stages which are not described here may occur (Hart and Single,
2004).
12
Figure 1.4. Descriptive model of mixed sand and gravel lagoon/spit/barrier processes.
Threshold values are set for the Rakaia as functions of river discharge. Sourced from
Kirk (1991), Figure 6. p. 285.
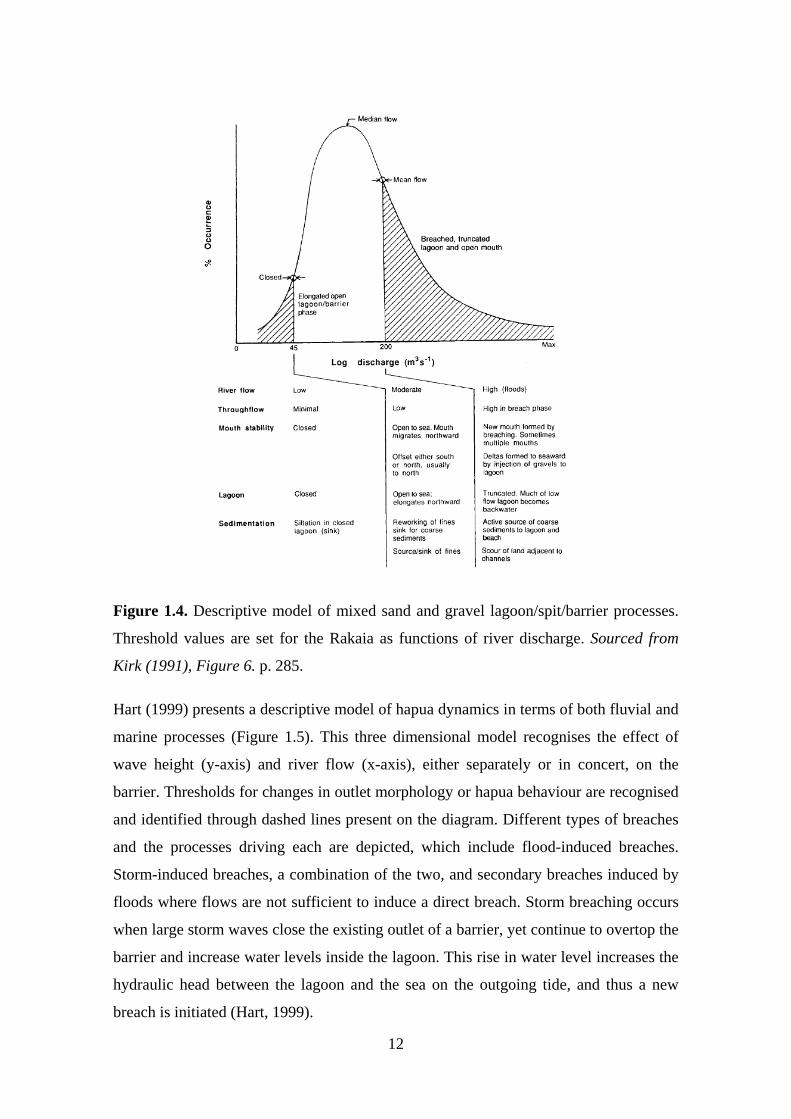
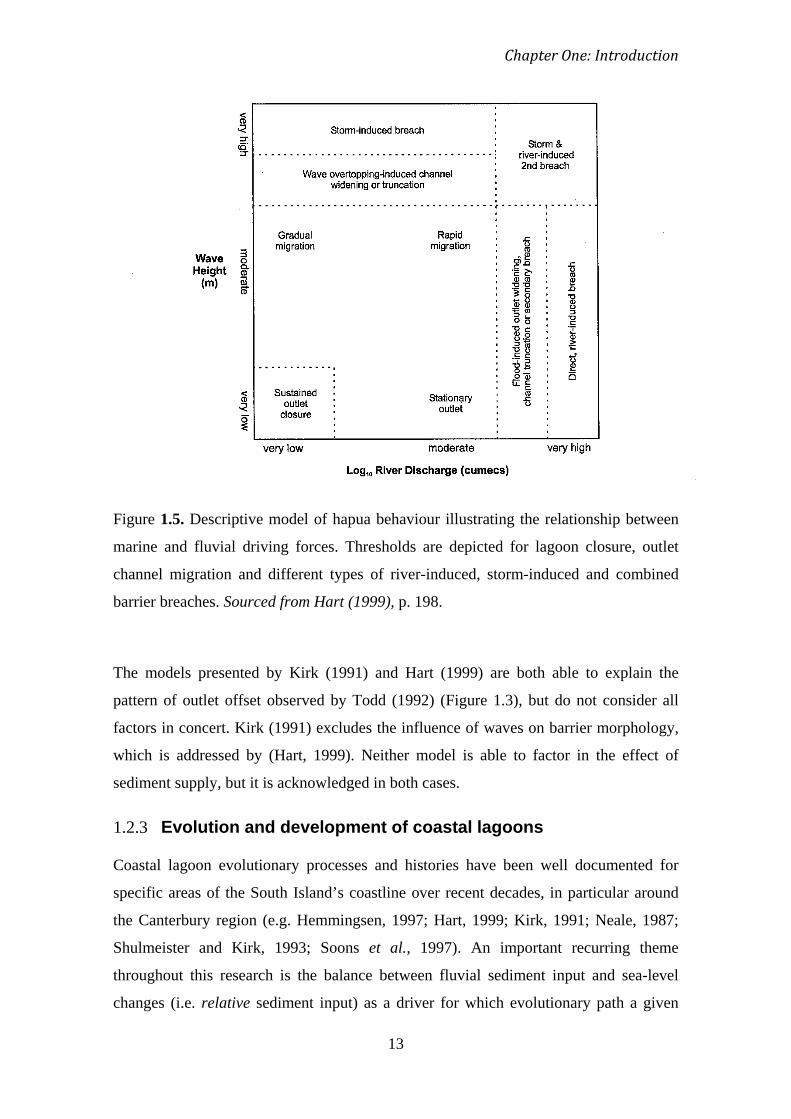
Hart (1999) presents a descriptive model of hapua dynamics in terms of both fluvial and
marine processes (Figure 1.5). This three dimensional model recognises the effect of
wave height (y-axis) and river flow (x-axis), either separately or in concert, on the
barrier. Thresholds for changes in outlet morphology or hapua behaviour are recognised
and identified through dashed lines present on the diagram. Different types of breaches
and the processes driving each are depicted, which include flood-induced breaches.
Storm-induced breaches, a combination of the two, and secondary breaches induced by
floods where flows are not sufficient to induce a direct breach. Storm breaching occurs
when large storm waves close the existing outlet of a barrier, yet continue to overtop the
barrier and increase water levels inside the lagoon. This rise in water level increases the
hydraulic head between the lagoon and the sea on the outgoing tide, and thus a new
breach is initiated (Hart, 1999).
Chapter One: Introduction
13
Figure 1.5. Descriptive model of hapua behaviour illustrating the relationship between
marine and fluvial driving forces. Thresholds are depicted for lagoon closure, outlet
channel migration and different types of river-induced, storm-induced and combined
barrier breaches. Sourced from Hart (1999), p. 198.
The models presented by Kirk (1991) and Hart (1999) are both able to explain the
pattern of outlet offset observed by Todd (1992) (Figure 1.3), but do not consider all
factors in concert. Kirk (1991) excludes the influence of waves on barrier morphology,
which is addressed by (Hart, 1999). Neither model is able to factor in the effect of
sediment supply, but it is acknowledged in both cases.
1.2.3 Evolution and development of coastal lagoons
Coastal lagoon evolutionary processes and histories have been well documented for
specific areas of the South Island’s coastline over recent decades, in particular around
the Canterbury region (e.g. Hemmingsen, 1997; Hart, 1999; Kirk, 1991; Neale, 1987;
Shulmeister and Kirk, 1993; Soons et al., 1997). An important recurring theme
throughout this research is the balance between fluvial sediment input and sea-level
changes (i.e. relative sediment input) as a driver for which evolutionary path a given
14
coastal feature takes and its inherent lifespan. Where the sedimentation rate exceeds
sea-level rise in a lagoon, it will infill within a short time span; whereas if the opposite
occurs the lagoon will deepen and water volume will increase (Kirk and Lauder, 2000).
This has important implications for the management of coastal areas; for example,
catchment land use change may accelerate coastal infilling and lagoon loss, or river
mouth dredging and modification may have the opposite effect. As such it is critical to
understand the processes occurring in each individual setting in order to effectively
manage it. For example, catchment land-use change may accelerate coastal infilling and
lagoon loss, whereas river mouth dredging and modification may slow infilling.
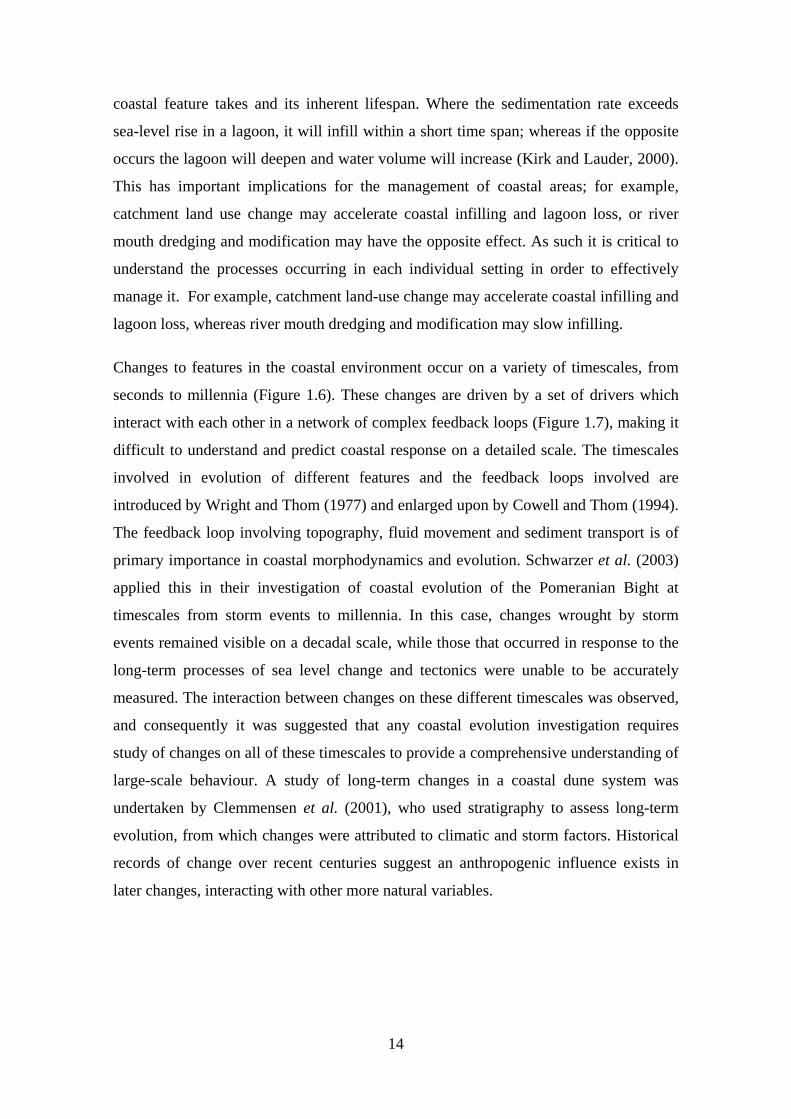
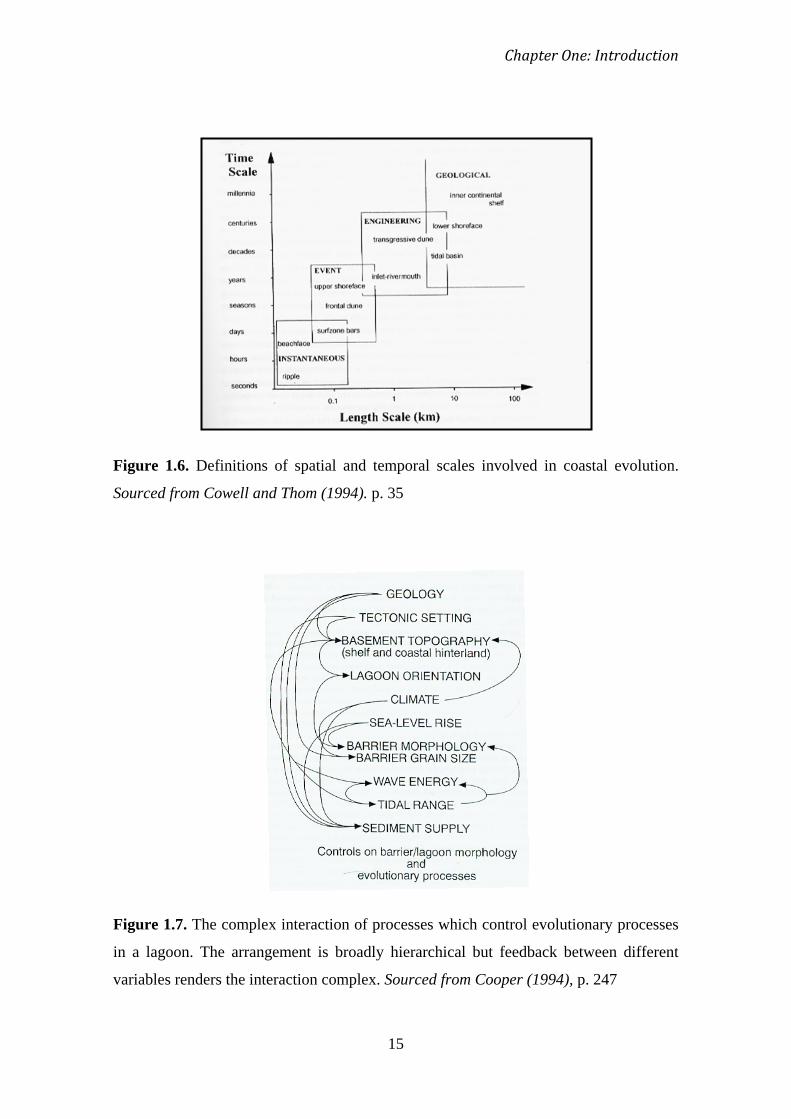
Changes to features in the coastal environment occur on a variety of timescales, from
seconds to millennia (Figure 1.6). These changes are driven by a set of drivers which
interact with each other in a network of complex feedback loops (Figure 1.7), making it
difficult to understand and predict coastal response on a detailed scale. The timescales
involved in evolution of different features and the feedback loops involved are
introduced by Wright and Thom (1977) and enlarged upon by Cowell and Thom (1994).
The feedback loop involving topography, fluid movement and sediment transport is of
primary importance in coastal morphodynamics and evolution. Schwarzer et al. (2003)
applied this in their investigation of coastal evolution of the Pomeranian Bight at
timescales from storm events to millennia. In this case, changes wrought by storm
events remained visible on a decadal scale, while those that occurred in response to the
long-term processes of sea level change and tectonics were unable to be accurately
measured. The interaction between changes on these different timescales was observed,
and consequently it was suggested that any coastal evolution investigation requires
study of changes on all of these timescales to provide a comprehensive understanding of
large-scale behaviour. A study of long-term changes in a coastal dune system was
undertaken by Clemmensen et al. (2001), who used stratigraphy to assess long-term
evolution, from which changes were attributed to climatic and storm factors. Historical
records of change over recent centuries suggest an anthropogenic influence exists in
later changes, interacting with other more natural variables.
Chapter One: Introduction
15
Figure 1.6. Definitions of spatial and temporal scales involved in coastal evolution.
Sourced from Cowell and Thom (1994). p. 35
Figure 1.7. The complex interaction of processes which control evolutionary processes
in a lagoon. The arrangement is broadly hierarchical but feedback between different
variables renders the interaction complex. Sourced from Cooper (1994), p. 247
16
As a consequence of the enormity of the timescales and factors involved, research
generally focuses on a single timescale or driving process, while recognising the
importance of multiple processes and long-term change in a modelling and management
context. Many such studies have been performed both internationally and within New
Zealand. Studies which have focused on millennial-scale changes include Shulmeister
and Kirk (1993), Meadows (2001) and Hemmingsen (1997). Shulmeister and Kirk
(1993) investigated the evolution of a mixed sand and gravel barrier in Canterbury, New
Zealand through Holocene sea level fluctuations and by stratigraphic analysis,
determined the coast’s rivers were trapped behind a barrier that was emplaced as sea
level rose. The authors suggest this scenario is likely in other transgressive contexts
where coastal sediment is generally unconsolidated, rather than being restricted to
barriers of mixed sand and gravel type.
Meadows (2001) uses case studies from southern Africa to study the relationship
between environmental changes during the Quaternary and evolution of coastal features
during that period. Landscapes in this study were influenced not only by the dynamic
climate, but by the impacts of human interference, the authors noting that it can be
difficult to distinguish which is the dominant forcing factor. They concluded that the
paleoenvironmental insights into solely climate induced change allowed later
anthropogenic influence to be identified, which is very useful from a coastal
management perspective.
Process-focused approaches to coastal evolution assessment and prediction potentially
provide a more useful perspective on coastal changes, as by studying a key process
rather than the individual factors driving it, a more complete record of change is gained.
As the processes of sediment transport and hydrodynamics are part of the feedback loop
influencing topography and form (Cooper, 1994), these are the two primary foci of this
type of research. Cooper et al. (2001) use a sediment budget approach to predict coastal
evolution in southern England, which is achieved through defining discrete littoral cells
and identifying sediment sources, inputs and outputs, and sinks. The authors suggest
this ‘top-down’ approach to modelling coastal geomorphology is a superior approach to
other physical and hydrodynamic modelling techniques, which work on inputs of small
scale process data (i.e. ‘bottom-up’). With this approach, links are maintained between
Chapter One: Introduction
17
the interacting coastal processes on many spatial and temporal scales, allowing a variety
of management scenarios to be trialled.
A large volume of research exists surrounding decadal scale shoreline and coastal
changes in response to sea level, sedimentation and anthropogenic drivers.
Understanding changes and processes on this scale is enormously important for coastal
resource management and developmental planning. In addition to changes in sediment
supply and relative sea level, coastal changes have been documented to respond to
decadal-scale climate oscillations (e.g. El Niño Southern Oscillation Index, ENSO).
Documentation of shoreline change using remote sensing and aerial photographic
techniques has been popular and applied in a variety of settings. Romagnoli et al.
(2006) assessed shoreline change over a 60 year period on an active island volcano,
where new sediment was frequently supplied from eruptions. From these shoreline
changes, spatial and temporal trends of erosion and accretion were identified and
sediment redistribution paths were inferred. The need for concurrent data regarding
nearshore currents was highlighted, as it is required to explain and understand transport
processes leading to spatial trends of erosion and accretion. In this case, no direct
current related data was available, but processes and direction were inferred from
coastal morphology and meteorological data.
Battiau-Queney et al. (2003) performed a similar shoreline analysis to assess the
sediment budget and mobility on a sandy coast in France over a 50 year period. In
addition to the decadal-scale shoreline evolution, topographic surveys and profiles over
much smaller timescales were also considered. In some cases along this coast, unusual
patterns of erosion and accretion occurred, which could be explained by the depletion of
sand reserves that had accumulated during the marine transgression following the LGM
(Paskoff, 1998). Once again, this demonstrates the interplay between processes on a
variety of timescales, which must be considered holistically if a complete picture of
changes and operational processes is to be gained.
Solomon (2005) mapped shoreline change over a 49 year period to assess coastal hazard
zones, calculate sediment budgets, and investigate the spatial and temporal variability of
these changes in a Canadian delta. A database of coastal retreat rates was constructed,
which was then used for coastal management and development purposes. Importantly,
18
several areas exposed to heavy winds were identified as stable, which was due to the
effects of increased sediment supply creating protective bars and mudflats.
The relationship between sea level rise and sediment supply in a salt marsh was
investigated by Hastlett et al. (2003). No increase in vertical accretion occurred despite
increased sediment supply; rather the extra sediment was deposited on the fringes of the
marsh in the form of lateral accretion. This is believed to reflect general trends in salt
marsh response to sea level and sediment drivers. Similarly, the spatial and temporal
scales of change in inlet geometry and morphology in a Russian estuary were
investigated by Behrens et al. (2009), including the response of the estuary to ENSO
induced climate oscillations. These large scale climate oscillations were shown to have
a significant indirect effect on inlet morphology, by affecting meteorological patterns
and thus hydrodynamics and sediment transport patterns. In addition, inlets that were
more curved were found to have a much higher risk of closure at all times.
Allard et al. (2009) investigated millenial-scale variability in a wave-dominated estuary
(which could also be termed ‘coastal lagoon’), using a thorough combination of cores,
high-resolution seismic and bathymetric surveys. Initially, an open estuary was present,
which then became progressively more enclosed and infilled. This was related to
changes in sea-level over the Holocene, and subsequent changes in sediment supply,
wave and tidal energy further exacerbated the infill process. This is an important study
in terms of estuary-lagoon dynamics, as it demonstrates the continuum between the two
states: in this case, a decrease in tidal energy and an increase in wave energy meant this
system moved from a tidally-dominated estuary to a wave-dominated system,
contributing to the formation of the lagoon. Once again, the interaction and feedback
loops between a variety of driving factors on differing timescales (sediment supply,
marine environment, and sea level) is apparent in the evolution of this system.
1.2.4 Hydrology of coastal lagoons
By definition, coastal lagoons are not tidally dominated (Barnes, 1980; Hart, 1999;
Kjerfve, 1994; Kirk and Lauder, 2000), and in particular; hapua, according to their
strictest definition, experience no tidal influxes or salinity gradients. There may,
however, be variations in salinity and water quality derived from land drainage and
evaporation processes (Kjerfve and Magill, 1989). Circulation and water exchanges in
Chapter One: Introduction
19
coastal lagoons are driven by a complex set of factors, including weather, wind, sea
level and heat and water exchange with the atmosphere (Kjerfve and Magill, 1989).
Typically, coastal lagoons are shallow, with depths of only a few metres. Consequently,
the water column is generally well mixed and no vertical stratification of temperature or
salinity occurs (Barnes, 1980; Smith, 1981; Kjerfve and Magill, 1989). The main
geomorphological factors influencing the hydrology of a lagoon are inlet size and shape,
water depth and lagoon orientation to prevailing winds (Smith, 1994). The balance
between freshwater (fluvial or rainwater) input and marine influence is the primary
control in the case of the systems studied here.
A large volume of research surrounding hydrology of coastal water bodies has been
undertaken globally, although much of this relates to estuaries or deltas rather than
coastal lagoons specifically. Despite this, some of these findings can be applied to
coastal lagoons, especially in the case of Totara Lagoon, which currently experiences a
substantial degree of tidal influence, so perhaps could be described as being in an
estuarine phase.
The degree of tidal influence occurring in an estuary, the form and behaviour of the tidal
wave, and the depth to the saltwater intrusion penetrates depends heavily on channel
morphology and river flow. Blanton et al. (2002) investigated the tidal current dynamics
in a long, shallow estuary, finding that the tidal waves were distorted and asymmetrical.
This finding is in agreement with earlier studies (Speer and Aubrey, 1985; Wang et al.,
1999) all of which recognise the relationship between channel morphology and current
flow. Slope of the channel bed can also cause tidal current asymmetry, as the energy
required for the current to move upstream on the incoming tide is greater than required
on the down-hill outgoing tide in this type of situation. Tidal intrusion also relates to
river flow, as described by Vaz et al. (2005), who modelled salinity and temperature
gradients, matched with field data inputs, in an estuarine channel. Results showed that
in periods of low river flow, the channel was tidally dominated, but was dominated by
freshwater flow in periods of high river volume. The tidal wave also changed shape as it
propagated up the channel, becoming distorted by channel geometry and bathymetry.
The relationship between saltwater penetration, mouth morphology and river flow is
further illustrated in the case of the Senegal River delta (Isupova and Mikhailov, 2008),
which was a large delta that became blocked off by longshore drift and formed an
20
estuary, part of which is now becoming a lagoon. The construction of a dam upstream
decreased the flow reaching the river mouth, which is now subject to greater tidal
influence than previously experienced. This saltwater propagation is exacerbated by the
low gradient of the river surface. Although these changes in morphology were generated
by human-induced change upstream, this is a good example of the flow-on effect that
was wrought by a decrease in river flow. This affected longshore sediment deposition
and hydraulics of the river mouth, consequently altering the local morphology.
Hapua, and choked lagoons in general, experience very little or no tidal influence,
acting as a true river outlet. Thus, the hydrology of these lagoons is driven by river flow
(Kirk, 1991; Hart, 2007). This is due to their structure, which is typically a single,
narrow channel through which they exchange water with the ocean (Barnes, 1980;
Fernandes et al., 2004). This channel acts as a hydraulic filter, which dampens or
eliminates tidally driven water level oscillations within the lagoon (Kjerfve and Magill,
1989; Fernandes et al., 2004). This effect is explored by Fernandes et al. (2004), who
combined hourly measurements of water elevation with a tidal simulation model in a
choked lagoon in Brazil. Findings suggested that the narrow channel limited the
amplitude of tidal oscillations within the lagoon to between 1 and 11% of those in the
outside ocean, and the ability of the channel to filter these fluctuations varied seasonally
and in response to volume of river flow. Lower frequency sub-tidal oscillations (on an
approximately fortnightly period) occurred in response to synoptic forcing, and these
tended to propagate further into the lagoon than the higher frequency tidal oscillations.
As well as enhancing understanding of tidal hydraulics in choked lagoon systems,
studies such as this can provide important data that can contribute to predicting future
changes in lagoon morphology.
Changes in water temperature and salinity structure can occur on a variety of different
timescales in response to storm events or increased evaporation. Smith (1981)
investigated heat exchange in a Florida lagoon, concluding that during summer, the
dominant forcing factor is the absorption of solar radiation controlled by cloud cover.
The temperature of the water responded to various other meteorological forcing factors
throughout the other seasons. Temperature results presented by Vaz et al. (2005)
showed that water temperature in the system studied was closely related to spring/neap
tidal cycles and river flow, exhibiting a strong horizontal gradient with water transport.
Chapter One: Introduction
21
This is likely to be absent or less pronounced in systems that exhibit a greater degree of
mixing.
1.2.5 Morphodynamics in the coastal environment
This research is based on the fundamentals of morphodynamics and conceptual
modelling of hapua dynamics. The study of coastal environments can be performed
either directly, through real time measurements of the acting processes, or indirectly
through the study of topographic features, structures, and sediment textures (Carter and
Woodroffe, 1994). The term morphodynamics refers to the use of these two approaches
in concert, thus relating process and form within a single study (Carter and Woodroffe,
1994), and is the approach used in this study. Morphodynamic theory as it relates to
coastal evolution is thoroughly discussed in several key coastal textbooks (e.g. Cowell
and Thom, 1994; Masselink and Hughes, 2003; Woodroffe, 2003).
Coastal morphodynamics can be defined as “the mutual adjustment of topography and
fluid dynamics involving sediment transport” (Wright and Thom, 1977 p. 412), and
results in the processes and changes described as coastal evolution. These evolutionary
changes operate through a series of feedback loops which exist between the topography
of the system and the influence of fluid dynamics on sediment transport, which in turn
results in morphological change (Carter and Woodroffe, 1994). The morphodynamics
approach allows each component or process involved in a system (e.g. a coastal lagoon)
to be studied individually, yet the context of each within the system as a whole is
maintained. This is a particularly useful concept for studies of rivermouth lagoon
environments, due to their complexity of processes and related response (Figure 1.7).
The evolution of coastal features is complex and does not follow a specific formula or
respond in a linear fashion to forcing factors. Each system is constrained by boundary
conditions and the cycle of evolutionary changes taking place is bound by the principle
of Markovian Inheritence, by which the product of previous changes (i.e. antecedent
topography and hydrology) provides the initial conditions upon which future
evolutionary processes build (Cowell and Thom, 1994). Coastal landforms can evolve
on timescales of hours to millennia, in response to the highly varied time periods of
forcing factors, such as weather events, climate changes, tectonic forcing, and sediment
supply (Carter and Woodroffe, 1994) (Figure 1.6). The interaction and interdependence
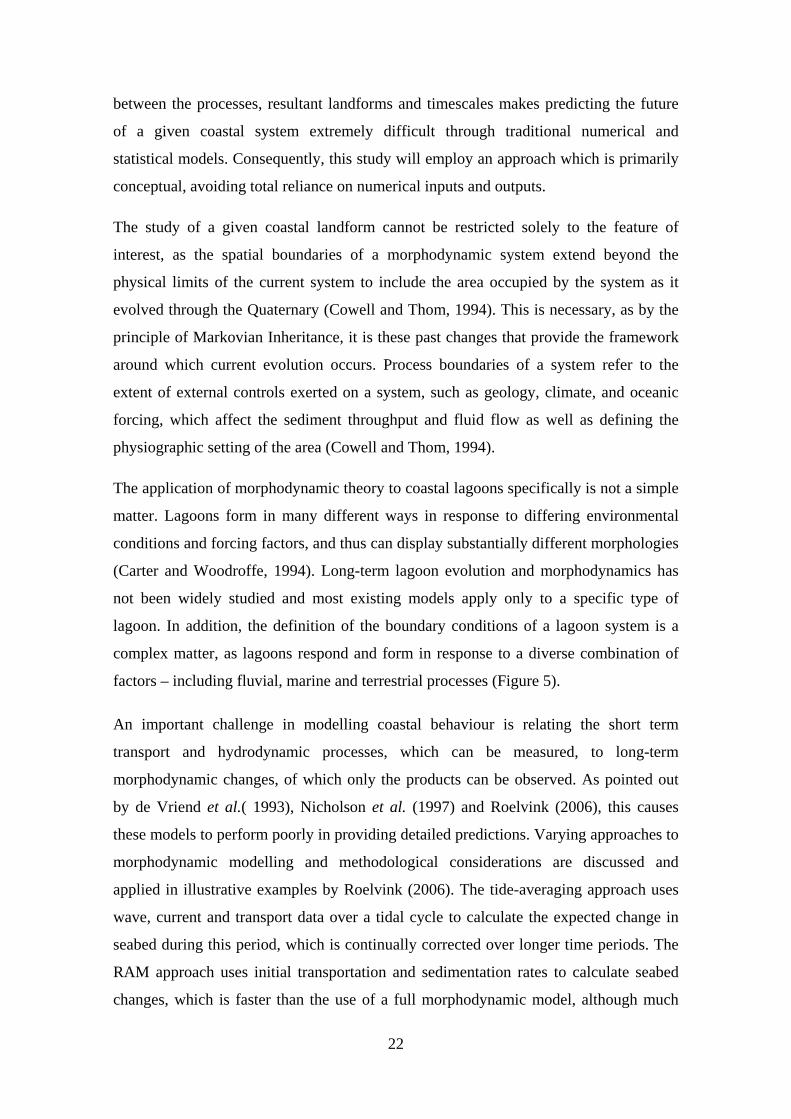
22
between the processes, resultant landforms and timescales makes predicting the future
of a given coastal system extremely difficult through traditional numerical and
statistical models. Consequently, this study will employ an approach which is primarily
conceptual, avoiding total reliance on numerical inputs and outputs.
The study of a given coastal landform cannot be restricted solely to the feature of
interest, as the spatial boundaries of a morphodynamic system extend beyond the
physical limits of the current system to include the area occupied by the system as it
evolved through the Quaternary (Cowell and Thom, 1994). This is necessary, as by the
principle of Markovian Inheritance, it is these past changes that provide the framework
around which current evolution occurs. Process boundaries of a system refer to the
extent of external controls exerted on a system, such as geology, climate, and oceanic
forcing, which affect the sediment throughput and fluid flow as well as defining the
physiographic setting of the area (Cowell and Thom, 1994).
The application of morphodynamic theory to coastal lagoons specifically is not a simple
matter. Lagoons form in many different ways in response to differing environmental
conditions and forcing factors, and thus can display substantially different morphologies
(Carter and Woodroffe, 1994). Long-term lagoon evolution and morphodynamics has
not been widely studied and most existing models apply only to a specific type of
lagoon. In addition, the definition of the boundary conditions of a lagoon system is a
complex matter, as lagoons respond and form in response to a diverse combination of
factors – including fluvial, marine and terrestrial processes (Figure 5).
An important challenge in modelling coastal behaviour is relating the short term
transport and hydrodynamic processes, which can be measured, to long-term
morphodynamic changes, of which only the products can be observed. As pointed out
by de Vriend et al.( 1993), Nicholson et al. (1997) and Roelvink (2006), this causes
these models to perform poorly in providing detailed predictions. Varying approaches to
morphodynamic modelling and methodological considerations are discussed and
applied in illustrative examples by Roelvink (2006). The tide-averaging approach uses
wave, current and transport data over a tidal cycle to calculate the expected change in
seabed during this period, which is continually corrected over longer time periods. The
RAM approach uses initial transportation and sedimentation rates to calculate seabed
changes, which is faster than the use of a full morphodynamic model, although much
Chapter One: Introduction
23
less accurate. However, neither of the aforementioned methods perform well with
varying input conditions. The parallel online approach recognises that input conditions
may vary substantially, and thus performs several simulations using different conditions
simultaneously, updating the bathymetry from an average of these simulations.
Hart (2009) deals specifically with morphodynamics of river mouth lagoons on high
energy coasts, which is of particular interest to this study. Rather than numerically
modelling changes in particular systems, a conceptual model of interactions between
hydrodynamics, sediment supply and transport, and drivers of barrier morphology is
presented.
A problem highlighted in all research pertaining to morphodynamic modelling is that of
accuracy and verification of results or predictions arising from the numerical
calculations. The nature of modelling to predict future change means that until the
predicted change takes place, or otherwise, the model cannot be deemed ultimately
accurate. The use of models to explore and simulate the operation of contemporary
processes in natural science can be an important tool if used wisely, and while
accounting for limitations and quality of data required for parameterisation. However,
the extent of their value as a predictive tool is still under debate (e.g. Oreskes et al.,
1994; Cooper and Pilkey, 2004a, 2004b).
Morphodynamic study of a given coastal area does not have to rely solely on numerical
models, although without these the result produced is conceptual (but potentially more
honest and appropriate) rather than a quantified prediction of rate and volume of
change. Povilanskas et al. (2009) describes the morphodynamic trends of a Russian
dune ridge through the Holocene, concluding that the dune ridge has flattened over time
in response to exhaustion of sediment supply, vegetation loss and human intervention.
While not a quantified measure of change, these sorts of observations are hugely
important for coastal management decisions.
Integrated models are another form of conceptual models that are popular in coastal
management literature, as they encompass the dynamic and multi-influence nature of
the coastal environment. The development and implementation considerations of using
an integrated model is described by Capobianco et al. (1999), and will be discussed
further in later sections. Cooper and Pilkey (2004a, 2004b) discuss the problem of the
24
numerical model inaccuracy and point out several workable alternatives to the use of
these models. Alternatives to the mathematical modelling of beaches are presented in
these papers, and in particular aspersions are cast on the use of the Bruun Rule to
predict shoreline retreat in response to sea level rise. Although these papers pertain
specifically to models for beaches, the principles of the alternatives presented can be
applied to the modelling of other coastal features as well. These include looking at
changes on neighbouring beaches with similar characteristics, using past experience on
the beach in question, using a composite approach, ‘go slow-go soft’ management
strategies (i.e. gently experiment), and to predict nothing (Cooper and Pilkey, 2004b).
The authors highlight the importance of recognising that future sequences of events are
unique, and thus predictions based on past and present observations may not be valid.
1.2.6 Reconstructing past environments in coastal settings
Coastal lagoons are believed to be short-lived features on a geological timescale (e.g.
Cooper, 1994) and much research has focused on documenting changes in these
sensitive systems in order to understand changes in climate, sea level and other driving
factors. This usually entails a multidisciplinary study of the environment in question,
and may include studies of stratigraphy, sedimentology and ecology from cores,
bathymetry, hydrology, geophysical profiling and surveying. From the study of
sedimentology and microfossils in coastal sediment cores, the environment at the time
of deposition can be inferred. Changes in the system over time can be constructed, and
conclusions made regarding the processes responsible for this change. This can be
applied to studies of relatively recent change (in the order of decades to centuries), or
longer term change (centuries to millennia). Changes in coastal environments are
particularly useful in studies of paleoseismology, as changes in relative sea level can be
used to infer vertical displacement (either through subsidence/uplift or sedimentary
compaction) resulting from a seismic event (Cochran et al., 2007). Although the aim of
this project is not specifically to assess seismic activity, the goal is still to investigate
and document environmental change over time and the techniques are applicable in
multiple research contexts. In addition, the coastal plain upon which Shearer Swamp
and Totara Lagoon are situated is subject to large-scale tectonic disturbance associated
with the nearby Alpine Fault.
Chapter One: Introduction
25
International studies that have used these techniques to assess landscape evolution and
morphology in the coastal zone include Clemmensen et al. (2001), Haslett et al. (2003)
and Allard et al. (2009), all of whom applied a multidisciplinary and holistic approach.
Clemmensen et al. (2001) investigated the evolution of a coastal dune system in
Denmark over the Holocene period, and the interaction between natural and
anthropogenic drivers on its development. Changes in the dune system in response to
climate change were documented from stratigraphic analysis of sediment cores, and a
clear signal of human-induced change in dynamics was identified following increased
habitation of the area. Haslett et al. (2003) assessed changes in salt marsh sedimentation
in western France over a 120 year period, and related patterns of depositional/erosional
change related to specific driving factors. The findings of Allard et al. (2009), discussed
in section 1.2.3, are also pertinent here.
Paleoseismological studies and those relating to relative sea level have been undertaken
in coastal environments worldwide, which highlight regional tectonic climate and
seismic events as important drivers of change in the local coastal environment.
Mathewes and Clague (1994) investigated relative sea level changes associated with co-
seismic subsidence and uplift in British Columbia. Microfossil analysis was able to
show periods of rapid change in salinity (and thus relative sea level), related to large
earthquakes. This technique can detect small amounts of change that leaves no
lithostratigraphic signature, which demonstrates the sensitivity of the coastal zone to
changes in relative sea level, and would also be valuable in contexts outside of
seismology. Similarly, Zong et al. (2003) used analysis of sediment cores from a salt-
marsh to assess land subsidence. In this case, gradual subsidence had caused a bog
environment to be flooded by the sea, creating a salt-marsh environment. The authors
point out the possibility that other drivers might cause a coincident change in relative
sea level, and that factors such as sediment mixing and hydrological change may also
cause changes in microfossil assemblages. This is in agreement with Yabe et al. (2004)
and Sawai et al. (2004), both of whom used similar processes to document
paleoenvironmental changes along the Japanese coast and pointed out the considerable
difficulty in breaking down the individual causes of that change and quantifying the
effect of each. Nelson et al. (1998) investigated the history of relative sea level change
in an American estuary, and also challenges the assumption that every large change in a
microfossil assemblage reflects local subsidence. The authors posit that instead, some of
26
these horizons could be related to hydrodynamic changes in the estuary or tsunami
deposits. It could be suggested that some of the uncertainty surrounding studies such as
these would be lessened by further research into the local hydrodynamics and sediment
supply, such as the techniques being employed in this study.
There has been a significant volume of research undertaken in New Zealand using
coastal environments for paleoenvironmental reconstruction, detection of seismic events
and to document the tectonic history of an area. This research has focused on mainly
tectonically active areas of the North Island. Chague-Goff et al. (2002) and Hayward et
al. (2004) used microfossil analysis primarily to detect seismic events and associated
tsunamics.
Several studies aiming to document climatic change and coastal system development
over the Holocene have been undertaken elsewhere in New Zealand. Horrocks et al.
(2000a, 2000b) used sedimentological and microfossil analyses from cores taken in a
coastal swamp environment to document the development of that swamp throughout the
Holocene sea level and climate changes. The changes inferred from these analyses were
consistent with the New Zealand sea level curve presented by Gibb (1986). Hicks and
Nichol performed a similar analysis of a wetland, documenting the succession from a
transitional-marine environment, to brackish, to freshwater swamp. Changes in
depositional energy are apparent in this transition, and there are clear indications of
human impacts in terms of vegetation change related to deforestation. This research has
direct relevance to the study of Shearer Swamp, which formed during the same period
and was likely subject to similar processes. These studies are significant in terms of
documenting sea level change throughout the Holocene, as well as providing insights
into the development of coastal wetlands that can be applied to similar systems in less
advanced stages of infill.
The environmental history of Okarito Lagoon, a large estuarine inlet situated in
Westland to the south of Shearer Swamp (Figure 1.8), was documented by Goff et al.
(2001) and the geomorphology deemed to be controlled by local seismic activity. Goff
et al. (2004) and Nichol et al. (2007) used a multidisciplinary approach, similar to that
of this study, to document the changes in the lagoon over recent geological time and
detect possible tsunami inundation horizons. This work is particularly significant, due to
the proximity of Okarito Lagoon to the field sites in this project, and the fact that they
Chapter One: Introduction
27
too are subject to large-scale tectonic disturbance from the nearby Southern Alps.
Results of this research suggest the area experienced two large tsunamis in recent
geological time (one in 1826, and another dated at 630-455 years before present),
corresponding to known ruptures of the neighbouring Alpine Fault. The findings of
Nichol et al. (2007) are subject to some debate, as some researchers believe these may
be storm deposits rather than tsunami deposits (Professor James Shulmeister, University
of Canterbury, pers. comm.). In addition, the inherent problems with interpreting and
connecting results, and extrapolating them outside of the immediate sampling area are
highlighted.
Also in South Westland, Wells and Goff (2009) investigated dune ridge formation in the
area to determine the history of seismic events in the area. Findings suggest that a
period of coastal progradation occurred within 50 years of each large tectonic
disturbance in the area over the past 800 years. Individual earthquake events resulted in
the delivery of a sediment pulse to the coast, which then contributed to the formation of
coastal features in the region.
It is clear from this collective research that a multidisciplinary approach, or at least the
use of more than one technique is preferable to a single-analysis study, and provides the
most complete and complementary record of environmental change.
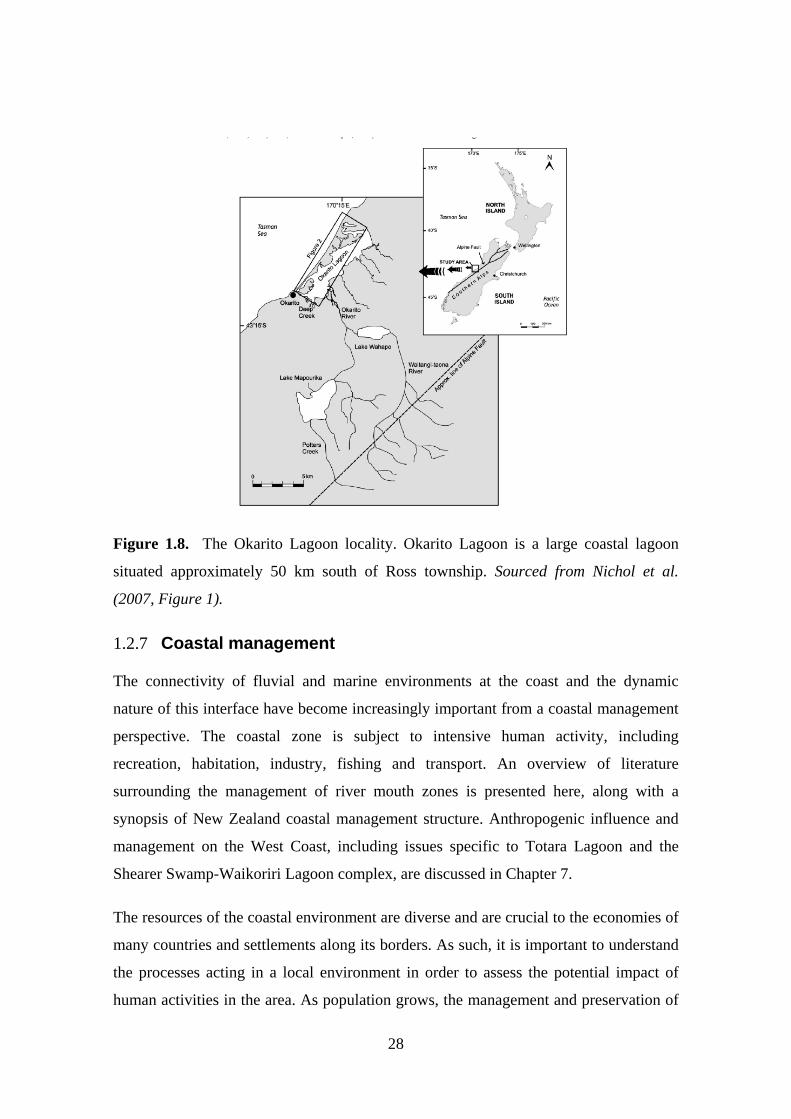
28
Figure 1.8. The Okarito Lagoon locality. Okarito Lagoon is a large coastal lagoon
situated approximately 50 km south of Ross township. Sourced from Nichol et al.
(2007, Figure 1).
1.2.7 Coastal management
The connectivity of fluvial and marine environments at the coast and the dynamic
nature of this interface have become increasingly important from a coastal management
perspective. The coastal zone is subject to intensive human activity, including
recreation, habitation, industry, fishing and transport. An overview of literature
surrounding the management of river mouth zones is presented here, along with a
synopsis of New Zealand coastal management structure. Anthropogenic influence and
management on the West Coast, including issues specific to Totara Lagoon and the
Shearer Swamp-Waikoriri Lagoon complex, are discussed in Chapter 7.
The resources of the coastal environment are diverse and are crucial to the economies of
many countries and settlements along its borders. As such, it is important to understand
the processes acting in a local environment in order to assess the potential impact of
human activities in the area. As population grows, the management and preservation of
Chapter One: Introduction
29
these resources becomes more important and more difficult as conflicting viewpoints
emerge. The concept of ‘Integrated Coastal Management’ is what drives management
strategies and resource division in most developed countries, and aims to balance the
different needs of the public, industries and developers in the coastal zone. This concept
is reviewed in an international context by Nichols (1999), who concludes that this
system is likely to result in degradation of the environment at the expense of economy
(and has already occurred in some areas), and that alternative resource management
systems need to be explored.
Internationally, management of dynamic coastal features is moving increasingly away
from engineered structures (so called ‘hard-protection’ measures, such as sea walls and
jetties) to ‘soft-protection’ works in order to prevent erosion of the coastline or
undesirable river mouth migration. This involves techniques such as artificially
redistributing sediment to renourish an eroding area, or creating a barrier breach to
move the outlet of a lagoon or estuary. These measures are viewed as less damaging to
the environment as they do not constrain the processes of nature, but modify the
environment to work with these processes, or at least reduce their undesirable effects.
This approach was discussed by Gao and Collins (1995), which they termed the ‘design
with nature’ principle. The equilibrium between different active processes and
characteristics of the coastal system needs to be understood, from which a workable
management strategy is constructed that does not interfere with this equilibrium. Two
criteria are stated to manage human impact on the system: human impact must not
destroy the processes through which equilibrium is maintained, and the rate of any
human-induced change must not exceed the rate at which this type of change would
occur via long-term, natural processes. This principle can work well in areas that have a
long history of monitoring and which are inherently relatively stable, but it is difficult to
apply in very dynamic systems that display a large range of behaviours and are not well
researched. In addition, this does not account for factors such as sea level rise, which
may render historical observations of system behaviour obsolete for the purpose of
predicting long-term system response.
In terms of estuaries and lagoons, outlet position and morphology is the primary
characteristic of concern to coastal managers. As well as directly affecting access, river
flow and water volume, the outlet character affects water quality and ecology of the
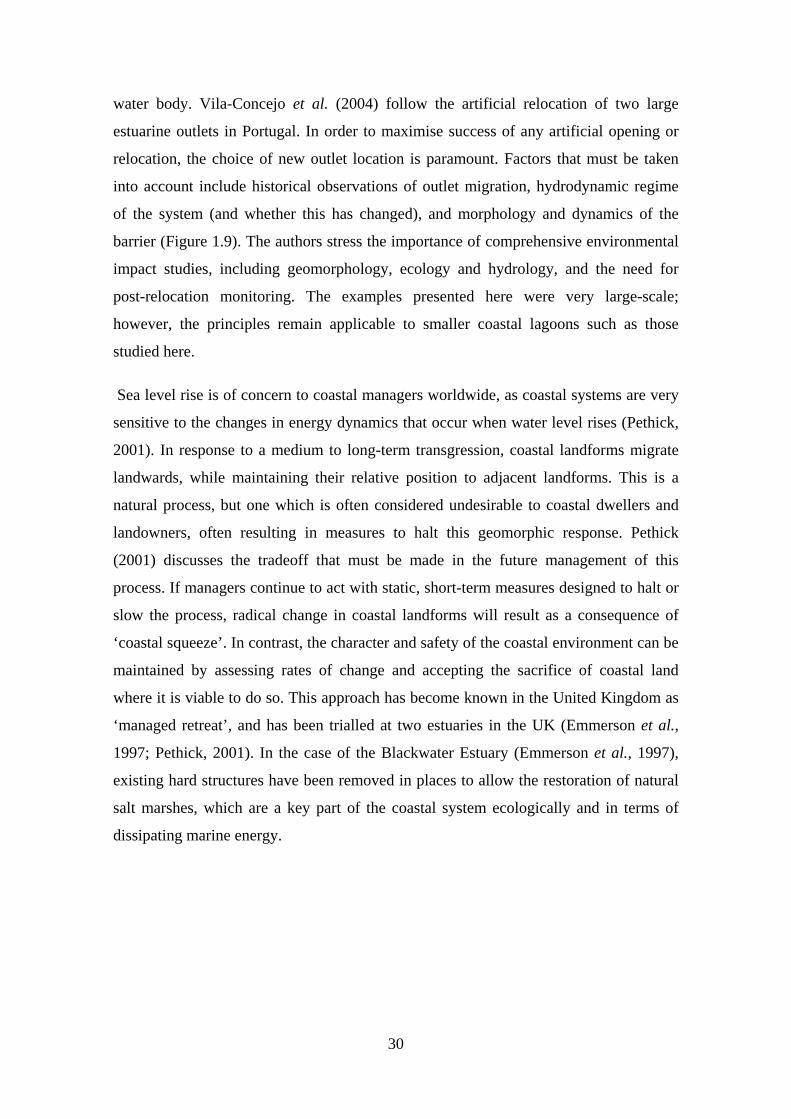
30
water body. Vila-Concejo et al. (2004) follow the artificial relocation of two large
estuarine outlets in Portugal. In order to maximise success of any artificial opening or
relocation, the choice of new outlet location is paramount. Factors that must be taken
into account include historical observations of outlet migration, hydrodynamic regime
of the system (and whether this has changed), and morphology and dynamics of the
barrier (Figure 1.9). The authors stress the importance of comprehensive environmental
impact studies, including geomorphology, ecology and hydrology, and the need for
post-relocation monitoring. The examples presented here were very large-scale;
however, the principles remain applicable to smaller coastal lagoons such as those
studied here.
Sea level rise is of concern to coastal managers worldwide, as coastal systems are very
sensitive to the changes in energy dynamics that occur when water level rises (Pethick,
2001). In response to a medium to long-term transgression, coastal landforms migrate
landwards, while maintaining their relative position to adjacent landforms. This is a
natural process, but one which is often considered undesirable to coastal dwellers and
landowners, often resulting in measures to halt this geomorphic response. Pethick
(2001) discusses the tradeoff that must be made in the future management of this
process. If managers continue to act with static, short-term measures designed to halt or
slow the process, radical change in coastal landforms will result as a consequence of
‘coastal squeeze’. In contrast, the character and safety of the coastal environment can be
maintained by assessing rates of change and accepting the sacrifice of coastal land
where it is viable to do so. This approach has become known in the United Kingdom as
‘managed retreat’, and has been trialled at two estuaries in the UK (Emmerson et al.,
1997; Pethick, 2001). In the case of the Blackwater Estuary (Emmerson et al., 1997),
existing hard structures have been removed in places to allow the restoration of natural
salt marshes, which are a key part of the coastal system ecologically and in terms of
dissipating marine energy.
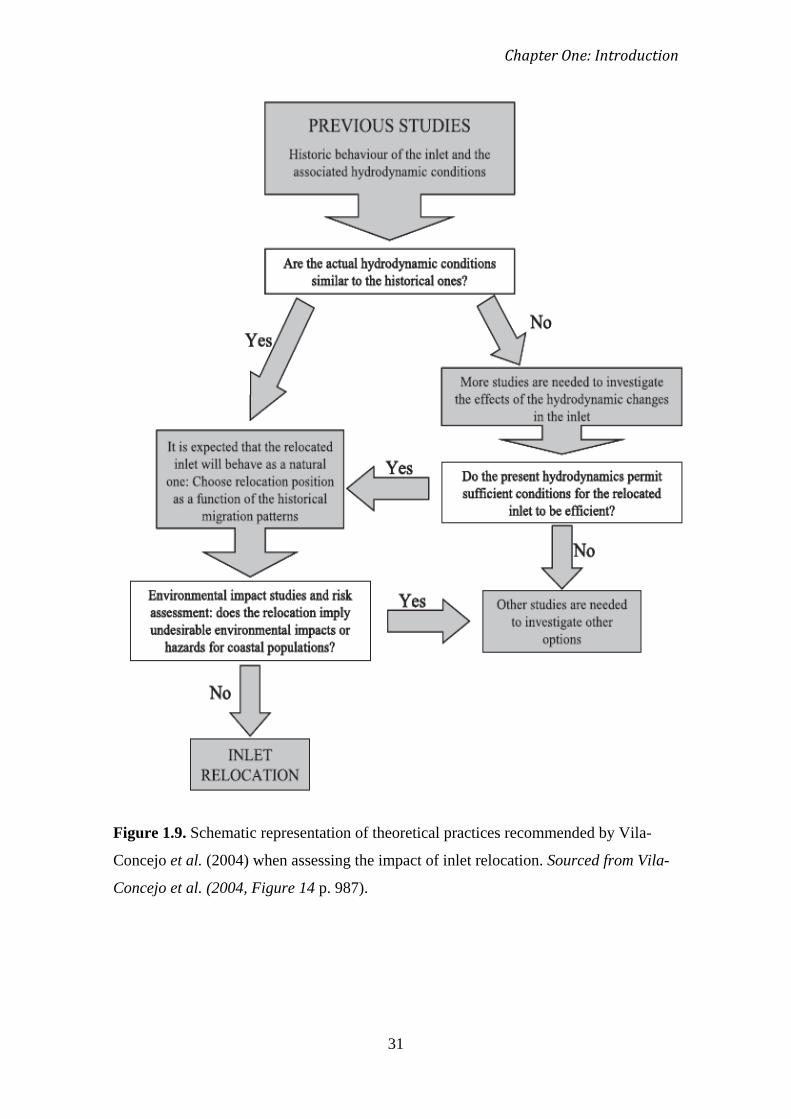
Chapter One: Introduction
31
Figure 1.9. Schematic representation of theoretical practices recommended by Vila-
Concejo et al. (2004) when assessing the impact of inlet relocation. Sourced from Vila-
Concejo et al. (2004, Figure 14 p. 987).
32
In a New Zealand context, coastal management is extremely important, due to the
country’s large coastal perimeter. Hart and Bryan (2008) use case studies of two very
different types of coastal systems, which experience different wave and sediment
conditions, to highlight the need for system and area-specific management strategies
and associated background information of processes and form. In terms of coastal
lagoon management, researchers commonly recognise the importance of connections
between the lagoon and the adjacent marine area and river catchment, both of which
must be considered when assessing potential environmental impact (Kirk, 1991; Hart
and Bryan, 2007; Hart, 2009b). The greatest issue surrounding hapua management
relates to artificial opening of the lagoon mouth, either to protect neighbouring
communities from flooding, or to promote recreational use (Kirk and Lauder, 2000).
Further discussion of coastal management in relation to hapua is presented in Chapter 7.
Coastal management in New Zealand is directed by a hierarchy of statutes ultimately
controlled by the national Resource Management Act 1991 (RMA) and working down
to local council level. The RMA was designed to provide guidelines surrounding the
management of natural resources and promote their sustainable use and development.
This applies to coastal, catchment and atmospheric environments, and was introduced to
standardise environmental management in New Zealand and replace numerous separate
overlapping and, therefore, confusing pieces of legislation. The natural character of
coastal environments and their surrounds, including rivers and wetlands, is recognised
as an issue of national importance.
Management framework in New Zealand
Alongside the RMA, the New Zealand Coastal Policy Statement (NZCPS) was
introduced in 1994, which pertains specifically to the coastal zone and acts as a link
between the RMA and regional coastal management plans which have been formulated
to work in conjunction. The NZCPS provides more practical, detailed information
surrounding the application of RMA guidelines in regional coastal plans and the
enforcement of local laws in the coastal environment. Below the national level, the
regional council is responsible for managing the natural resources of the area, which is
usually performed separately for the coastal area, catchment zone and other areas. The
management hierarchy structure for the Canterbury region is detailed in Hart (2009b)
(Figure 1.10), and is more complex than that of the West Coast region. This regional
Chapter One: Introduction
33
management scheme is not well integrated, and Hart (2009) points out that the potential
is there for a regional governing body to develop an integrated scheme if they choose.
For hapua and coastal wetlands this would be the ideal scenario, as often these systems
are influenced more by processes in their connected catchment or marine area than by
those acting in the immediate area (Kirk, 1991; Hart, 2009).
Figure 1.10. Flowchart showing the hierarchy of management of the coastal
environment in New Zealand under the RMA. Sourced from MfE (2008b), Figure 6.1
pp. 61
1.2.8 Research gap
Coastal research as a discipline has advanced hugely in recent decades, both nationally
and internationally. Hapua-type coastal lagoons have been reported to be rare globally
yet common in New Zealand and existing research is centred mainly on the east coast of
the South Island. As such, there is enormous scope for further research into these
systems elsewhere, to gain a greater understanding of their dynamics and the processes
that form them. This knowledge is necessary for the purpose of management and
development of coastal areas, and for issues such as water resource management and
concerns of climate change and sea level rise. There is also a necessity to investigate the
parallels between hapua-type lagoons and other types of lagoons, in particular those
defined as estuaries or estuarine lagoons.
34
The West Coast region represents a major research gap in terms of New Zealand coastal
research, and consequently the processes and coastal history of the region are not
documented or understood to the level required in making coastal management
decisions. The coastline of the West Coast is particularly dynamic due to the extreme
climate and sedimentation processes in the region and, as such, there is a lot of scope to
investigate these processes and draw from the results implications of major benefit to
local government and management organisations.
Research surrounding coastal geomorphology and management has been sadly lacking
on the West Coast, primarily due to budget and access constraints. Much of the existing
research was undertaken by government organisations or private companies or
individuals, often as part of consent applications or land and industry development and
is thus not readily available. The Department of Conservation (DOC) and West Coast
Regional Council (WCRC) have commissioned much of the coastal research to date.
The majority of river mouth outlets and coastal wetlands in the region have been
generally documented and classified (e.g. WCRC, 2000); however, few have been
studied in depth.
Chapter One: Introduction
35
1.3 Research objectives
Arising from this literature review, the primary objective of this thesis is to explore the
geomorphology of two rivermouth lagoon systems in the West Coast region and
determine their historical development, present day structure and dynamics in order to
predict their future under changing climate, development and management scenarios. In
addition, to advance New Zealand and international understanding of rivermouth lagoon
systems by producing scientific and management models that are widely applicable to
this type of environment.
These aims can be broken into several distinct objectives applicable to both field areas,
which are as follows:
• To document their current topography and structure,
• To explain their current hydrology,
• To understand their development through historical time and relate this to the
current state of each system,
• To analyse the processes driving these changes in geomorphology,
• To explore factors likely to influence changes in these systems over the
following 100 years and determine how each system might respond to these
drivers individually and collectively,
• To develop a conceptual model of process and response that can be used to
predict future changes of each system and which is applicable to similar settings
elsewhere.
36
1.4 Thesis structure
The purpose and objectives of this research have been presented in this chapter, along
with a conceptual context and theoretical background to the study. Previous research
was presented and discussed. Research was reviewed and divided according to the
objectives of this project, with research pertaining to present day coastal processes and
form presented first, followed by paleoenvironmental research. There are significant
gaps in this research body, which have been identified and form the rationale for this
particular project.
Chapter 2 provides a comprehensive overview and background of the study area and
setting: explaining regional climate, hydrology, geology, sediment supply and a review
of previous local research and history. This is important background and context, and
provides a reference point for interpreting the developmental history of these systems
and making predictions regarding future system geomorphology.
The following chapters present the methodology employed in the project and the
subsequent results achieved. Chapter 3 is dedicated to methodology, and Chapters 4, 5
and 6 present the results. These chapters are sectioned by time period and field site.
Current geomorphology (Chapter 4) is investigated through the use of GNSS
topographic surveys and water level records are used to investigate the hydrology. Past
changes of these sites are determined through the analysis of sediment cores for
sediment character and texture, the results of which are presented in Chapter 6.
Interpretations of these results are presented at the end of each chapter.
Chapter 7 is dedicated to an integrated discussion of these results. The present
geomorphology and hydrodynamic functioning will be interpreted with reference to
existing models of hapua dynamics, and linkages between past process and present form
will be explored. Linkages between driving factors and form will be discussed and these
systems will be classified in the context of coastal lagoon and estuarine literature. From
these results, a conceptual model of lagoon process and response will be applied to
these systems and their future will be explored and compared under different climate
and management scenarios. Issues currently faced by the local and regional authorities
in managing these important areas will be identified and discussed.
Chapter One: Introduction
37
The main findings and implications are summarised and reviewed in Chapter 8, the final
chapter. Also presented are limitations to the application of results from this study, and
limitations of the methodological approaches employed. Areas for further research are
identified.
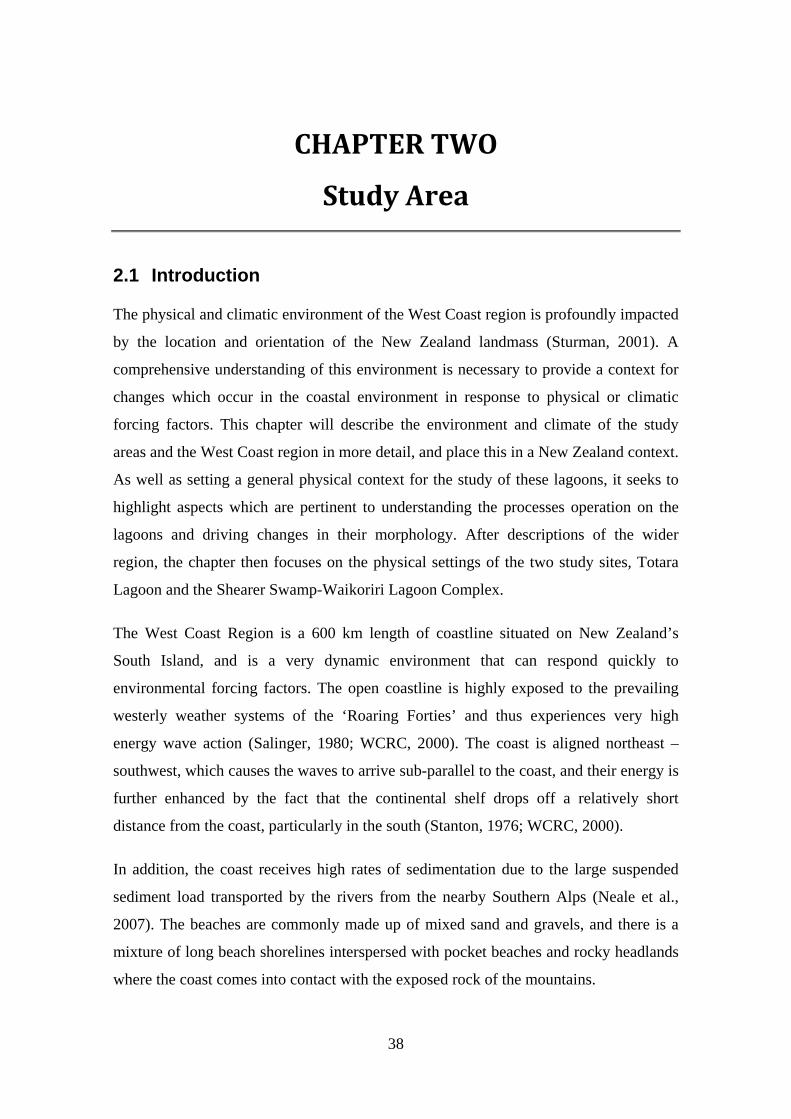
38
CHAPTER TWO
Study Area
2.1 Introduction
The physical and climatic environment of the West Coast region is profoundly impacted
by the location and orientation of the New Zealand landmass (Sturman, 2001). A
comprehensive understanding of this environment is necessary to provide a context for
changes which occur in the coastal environment in response to physical or climatic
forcing factors. This chapter will describe the environment and climate of the study
areas and the West Coast region in more detail, and place this in a New Zealand context.
As well as setting a general physical context for the study of these lagoons, it seeks to
highlight aspects which are pertinent to understanding the processes operation on the
lagoons and driving changes in their morphology. After descriptions of the wider
region, the chapter then focuses on the physical settings of the two study sites, Totara
Lagoon and the Shearer Swamp-Waikoriri Lagoon Complex.
The West Coast Region is a 600 km length of coastline situated on New Zealand’s
South Island, and is a very dynamic environment that can respond quickly to
environmental forcing factors. The open coastline is highly exposed to the prevailing
westerly weather systems of the ‘Roaring Forties’ and thus experiences very high
energy wave action (Salinger, 1980; WCRC, 2000). The coast is aligned northeast –
southwest, which causes the waves to arrive sub-parallel to the coast, and their energy is
further enhanced by the fact that the continental shelf drops off a relatively short
distance from the coast, particularly in the south (Stanton, 1976; WCRC, 2000).
In addition, the coast receives high rates of sedimentation due to the large suspended
sediment load transported by the rivers from the nearby Southern Alps (Neale et al.,
2007). The beaches are commonly made up of mixed sand and gravels, and there is a
mixture of long beach shorelines interspersed with pocket beaches and rocky headlands
where the coast comes into contact with the exposed rock of the mountains.
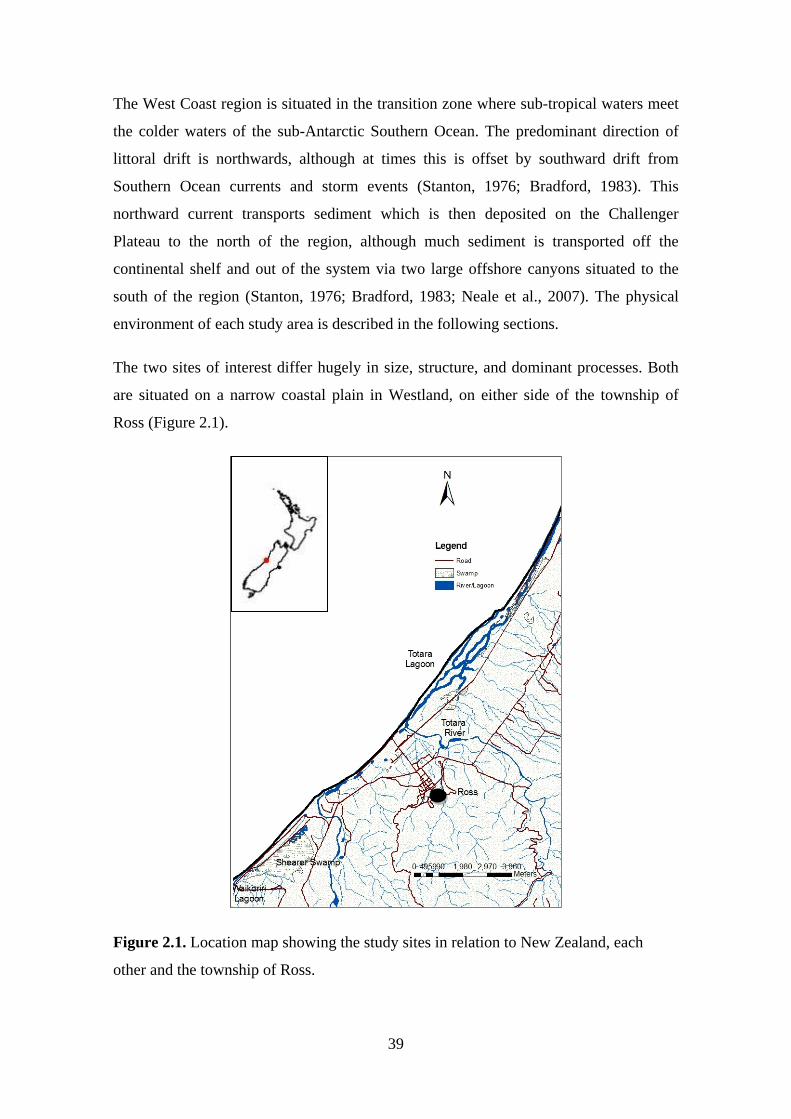
39
The West Coast region is situated in the transition zone where sub-tropical waters meet
the colder waters of the sub-Antarctic Southern Ocean. The predominant direction of
littoral drift is northwards, although at times this is offset by southward drift from
Southern Ocean currents and storm events (Stanton, 1976; Bradford, 1983). This
northward current transports sediment which is then deposited on the Challenger
Plateau to the north of the region, although much sediment is transported off the
continental shelf and out of the system via two large offshore canyons situated to the
south of the region (Stanton, 1976; Bradford, 1983; Neale et al., 2007). The physical
environment of each study area is described in the following sections.
The two sites of interest differ hugely in size, structure, and dominant processes. Both
are situated on a narrow coastal plain in Westland, on either side of the township of
Ross (Figure 2.1).
Figure 2.1. Location map showing the study sites in relation to New Zealand, each
other and the township of Ross.
Chapter Two: Study Area
40
2.2 Geology and soils
The geology and geomorphology of an area are the present imprint of past processes
and the base upon which future processes act and landforms develop (Cowell and
Thom, 1994). The West Coast is an area of high tectonic activity due to the close
proximity of the Alpine Fault system and the Southern Alps, which are the result of the
oblique convergence of the Australian and Pacific tectonic plates (Suggate et al., 1978;
Goff et al., 2001). The Australian Plate is being subducted obliquely beneath the Pacific
Plate in New Zealand’s southwest corner (the Puysegur Subduction Zone) and the
opposite is occurring to the East of the North Island (Hikurangi Subduction Zone)
(Figure 2.3). The Alpine Fault system connects these two zones and runs the length of
the South Island in a single, right-lateral oblique slip fault. Consequently, the adjacent
Westland region is subject to significant, ongoing tectonic disturbance (Goff et al.,
2001; Neale et al., 2007). The Southern Alps consist largely of easily erodible schists,
which are subject to intense compression and shear along the Alpine Fault. Uplift rates
of approximately 6-7 mm.yr-1 and horizontal displacement of 30-40 mm yr-1
The basement geology of the West Coast region is between 300 and 450 million years
old and formed as part of the ocean sediments of Gondwana (Marton, 2004). These are
exposed in occasional places, but are generally overlain by younger, sedimentary
sequences. The specific area surrounding Totara Lagoon and Shearer Swamp is
dominated by glacial outwash fans and moraine belts, remnants of the last glacial period
(Suggate et al., 1978; DOC, 2003; DOC, 2007). The Otiran Glaciation occurred in the
region between 12 000 and 22 000 years ago, during which time sea level was between
100 and 200m lower than present and glaciers extended well beyond the present
coastline south of Hokitika (Soons and Selby, 1992).
interacting
with large and frequent rain events leads to heavy erosion of these schists and a large
sediment flux to the coast (Suggate et al., 1978; Goff et al., 2001).
41
Figure 2.2. The tectonic setting of New Zealand. The alpine fault can be seen running
the length of the South Island, and Westland is situated north of the Puysegur
Subduction Zone. The study area is depicted by the black square. Modified from
Cochran et al. (2007), Figure 1, p. 1131
Shearer Swamp is situated upon a coastal plain comprised of fluvio-glacial gravels and
sands related to the Otiran glaciation, and coastal deposits (DOC, 2003). Following the
glacial retreat at the end of the Otiran Glaciation and subsequent sea level rise, the
existing low-lying land was drowned during the early Holocene. The resulting coastal
embayment has been subject to uplift events and infilling, leading to the development of
the current swamp and lagoon system (Hart and Single, 2004). The current coastal plain
is very narrow, and is bounded by the Rangitoto Range to the east, and smaller hills to
the north and south. Bold Head, a distinctive moraine bluff, lies at the southern
boundary of the system. The deposits of this plain are poorly consolidated and easily
erodible, and the sediments consist of schists, greywacke, granite, quartz and
serpentinite, brought down from the nearby Southern Alps (Suggate et al., 1978). Soils
have been identified as mostly Kini organic soils, with more recent Karangarua gley
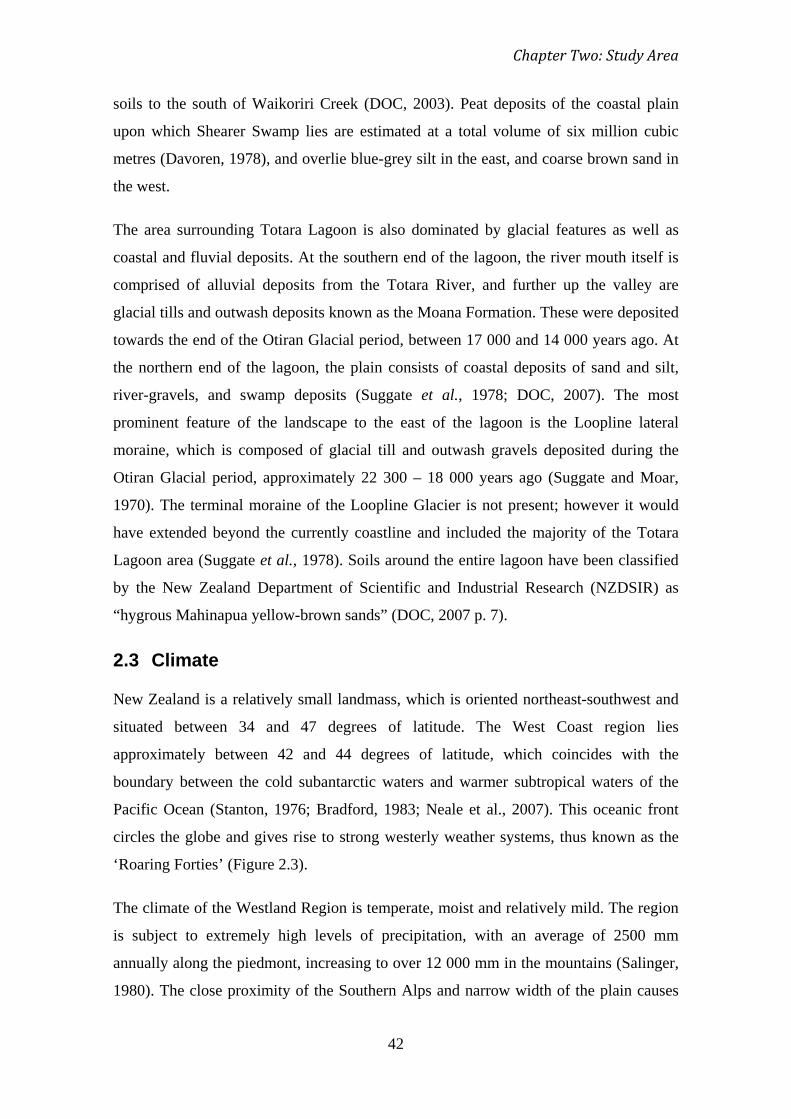
Chapter Two: Study Area
42
soils to the south of Waikoriri Creek (DOC, 2003). Peat deposits of the coastal plain
upon which Shearer Swamp lies are estimated at a total volume of six million cubic
metres (Davoren, 1978), and overlie blue-grey silt in the east, and coarse brown sand in
the west.
The area surrounding Totara Lagoon is also dominated by glacial features as well as
coastal and fluvial deposits. At the southern end of the lagoon, the river mouth itself is
comprised of alluvial deposits from the Totara River, and further up the valley are
glacial tills and outwash deposits known as the Moana Formation. These were deposited
towards the end of the Otiran Glacial period, between 17 000 and 14 000 years ago. At
the northern end of the lagoon, the plain consists of coastal deposits of sand and silt,
river-gravels, and swamp deposits (Suggate et al., 1978; DOC, 2007). The most
prominent feature of the landscape to the east of the lagoon is the Loopline lateral
moraine, which is composed of glacial till and outwash gravels deposited during the
Otiran Glacial period, approximately 22 300 – 18 000 years ago (Suggate and Moar,
1970). The terminal moraine of the Loopline Glacier is not present; however it would
have extended beyond the currently coastline and included the majority of the Totara
Lagoon area (Suggate et al., 1978). Soils around the entire lagoon have been classified
by the New Zealand Department of Scientific and Industrial Research (NZDSIR) as
“hygrous Mahinapua yellow-brown sands” (DOC, 2007 p. 7).
2.3 Climate
New Zealand is a relatively small landmass, which is oriented northeast-southwest and
situated between 34 and 47 degrees of latitude. The West Coast region lies
approximately between 42 and 44 degrees of latitude, which coincides with the
boundary between the cold subantarctic waters and warmer subtropical waters of the
Pacific Ocean (Stanton, 1976; Bradford, 1983; Neale et al., 2007). This oceanic front
circles the globe and gives rise to strong westerly weather systems, thus known as the
‘Roaring Forties’ (Figure 2.3).
The climate of the Westland Region is temperate, moist and relatively mild. The region
is subject to extremely high levels of precipitation, with an average of 2500 mm
annually along the piedmont, increasing to over 12 000 mm in the mountains (Salinger,
1980). The close proximity of the Southern Alps and narrow width of the plain causes
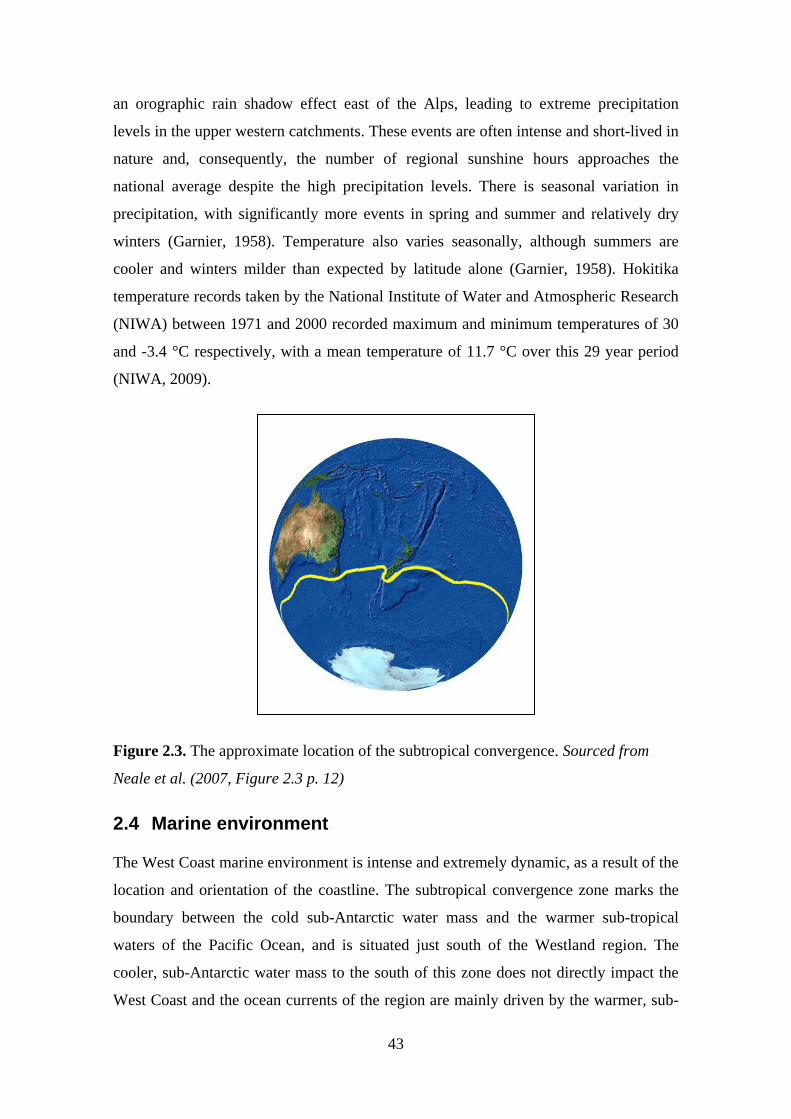
43
an orographic rain shadow effect east of the Alps, leading to extreme precipitation
levels in the upper western catchments. These events are often intense and short-lived in
nature and, consequently, the number of regional sunshine hours approaches the
national average despite the high precipitation levels. There is seasonal variation in
precipitation, with significantly more events in spring and summer and relatively dry
winters (Garnier, 1958). Temperature also varies seasonally, although summers are
cooler and winters milder than expected by latitude alone (Garnier, 1958). Hokitika
temperature records taken by the National Institute of Water and Atmospheric Research
(NIWA) between 1971 and 2000 recorded maximum and minimum temperatures of 30
and -3.4 °C respectively, with a mean temperature of 11.7 °C over this 29 year period
(NIWA, 2009).
Figure 2.3. The approximate location of the subtropical convergence. Sourced from
Neale et al. (2007, Figure 2.3 p. 12)
2.4 Marine environment
The West Coast marine environment is intense and extremely dynamic, as a result of the
location and orientation of the coastline. The subtropical convergence zone marks the
boundary between the cold sub-Antarctic water mass and the warmer sub-tropical
waters of the Pacific Ocean, and is situated just south of the Westland region. The
cooler, sub-Antarctic water mass to the south of this zone does not directly impact the
West Coast and the ocean currents of the region are mainly driven by the warmer, sub-
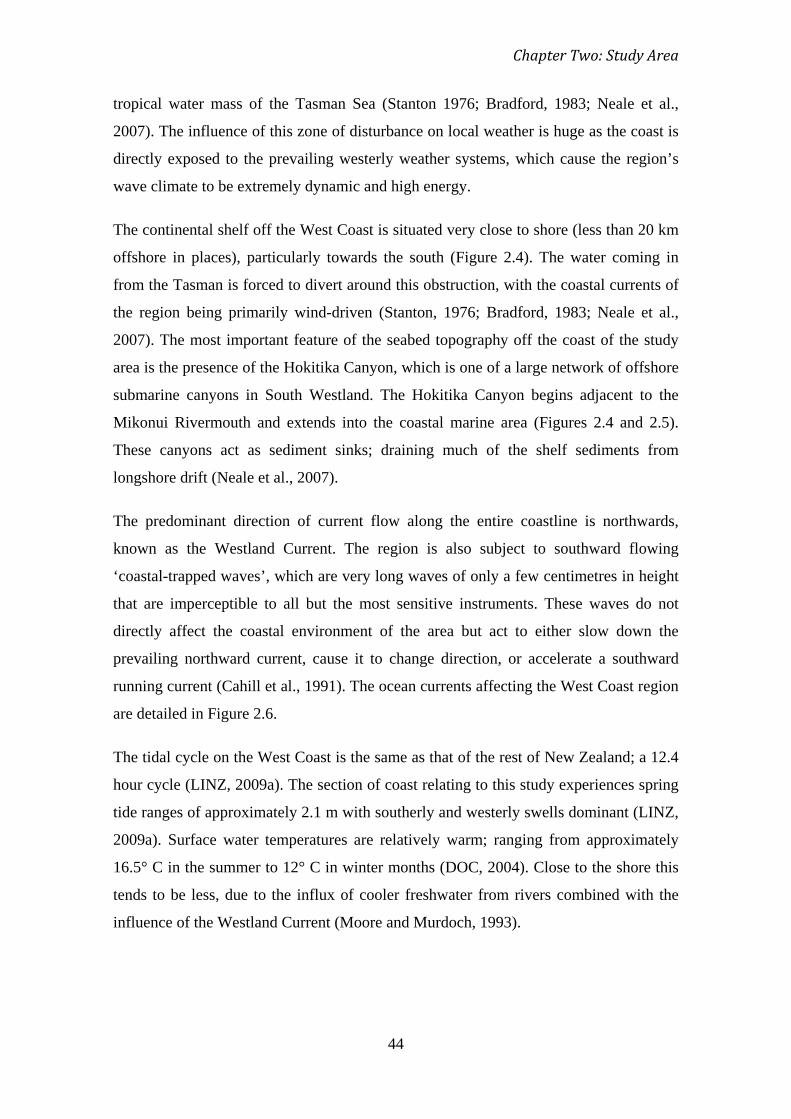
Chapter Two: Study Area
44
tropical water mass of the Tasman Sea (Stanton 1976; Bradford, 1983; Neale et al.,
2007). The influence of this zone of disturbance on local weather is huge as the coast is
directly exposed to the prevailing westerly weather systems, which cause the region’s
wave climate to be extremely dynamic and high energy.
The continental shelf off the West Coast is situated very close to shore (less than 20 km
offshore in places), particularly towards the south (Figure 2.4). The water coming in
from the Tasman is forced to divert around this obstruction, with the coastal currents of
the region being primarily wind-driven (Stanton, 1976; Bradford, 1983; Neale et al.,
2007). The most important feature of the seabed topography off the coast of the study
area is the presence of the Hokitika Canyon, which is one of a large network of offshore
submarine canyons in South Westland. The Hokitika Canyon begins adjacent to the
Mikonui Rivermouth and extends into the coastal marine area (Figures 2.4 and 2.5).
These canyons act as sediment sinks; draining much of the shelf sediments from
longshore drift (Neale et al., 2007).
The predominant direction of current flow along the entire coastline is northwards,
known as the Westland Current. The region is also subject to southward flowing
‘coastal-trapped waves’, which are very long waves of only a few centimetres in height
that are imperceptible to all but the most sensitive instruments. These waves do not
directly affect the coastal environment of the area but act to either slow down the
prevailing northward current, cause it to change direction, or accelerate a southward
running current (Cahill et al., 1991). The ocean currents affecting the West Coast region
are detailed in Figure 2.6.
The tidal cycle on the West Coast is the same as that of the rest of New Zealand; a 12.4
hour cycle (LINZ, 2009a). The section of coast relating to this study experiences spring
tide ranges of approximately 2.1 m with southerly and westerly swells dominant (LINZ,
2009a). Surface water temperatures are relatively warm; ranging from approximately
16.5° C in the summer to 12° C in winter months (DOC, 2004). Close to the shore this
tends to be less, due to the influx of cooler freshwater from rivers combined with the
influence of the Westland Current (Moore and Murdoch, 1993).
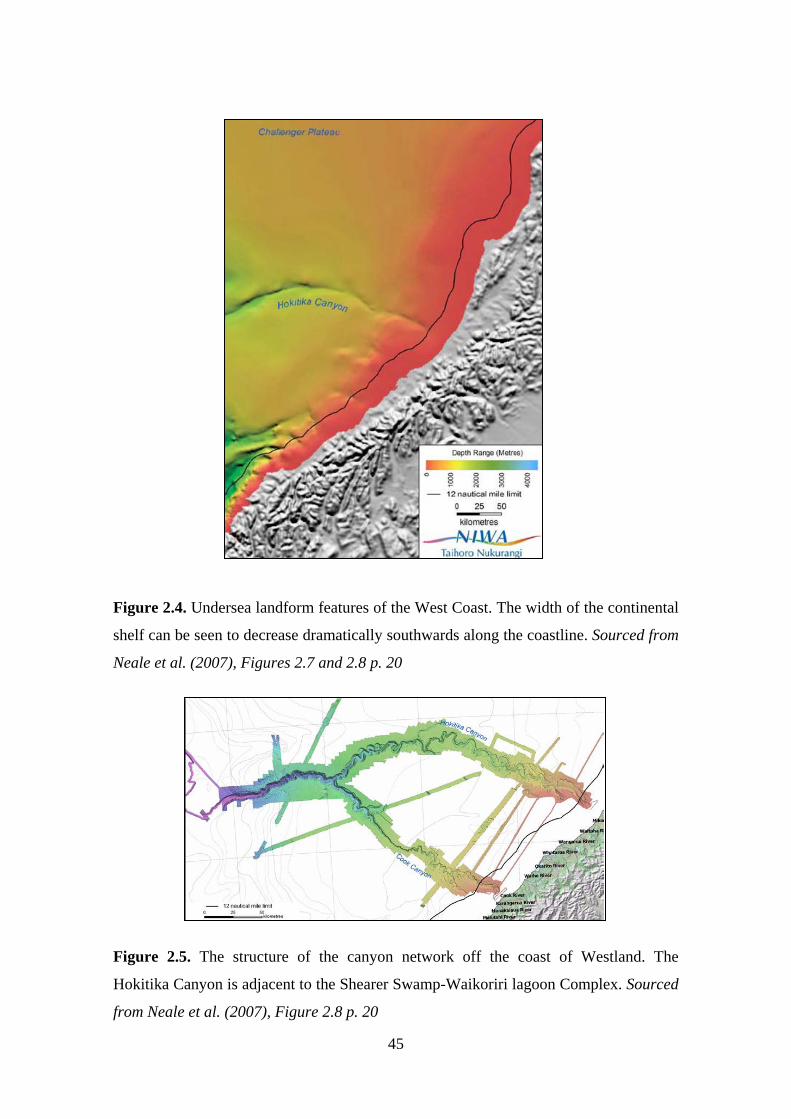
45
Figure 2.4. Undersea landform features of the West Coast. The width of the continental
shelf can be seen to decrease dramatically southwards along the coastline. Sourced from
Neale et al. (2007), Figures 2.7 and 2.8 p. 20
Figure 2.5. The structure of the canyon network off the coast of Westland. The
Hokitika Canyon is adjacent to the Shearer Swamp-Waikoriri lagoon Complex. Sourced
from Neale et al. (2007), Figure 2.8 p. 20
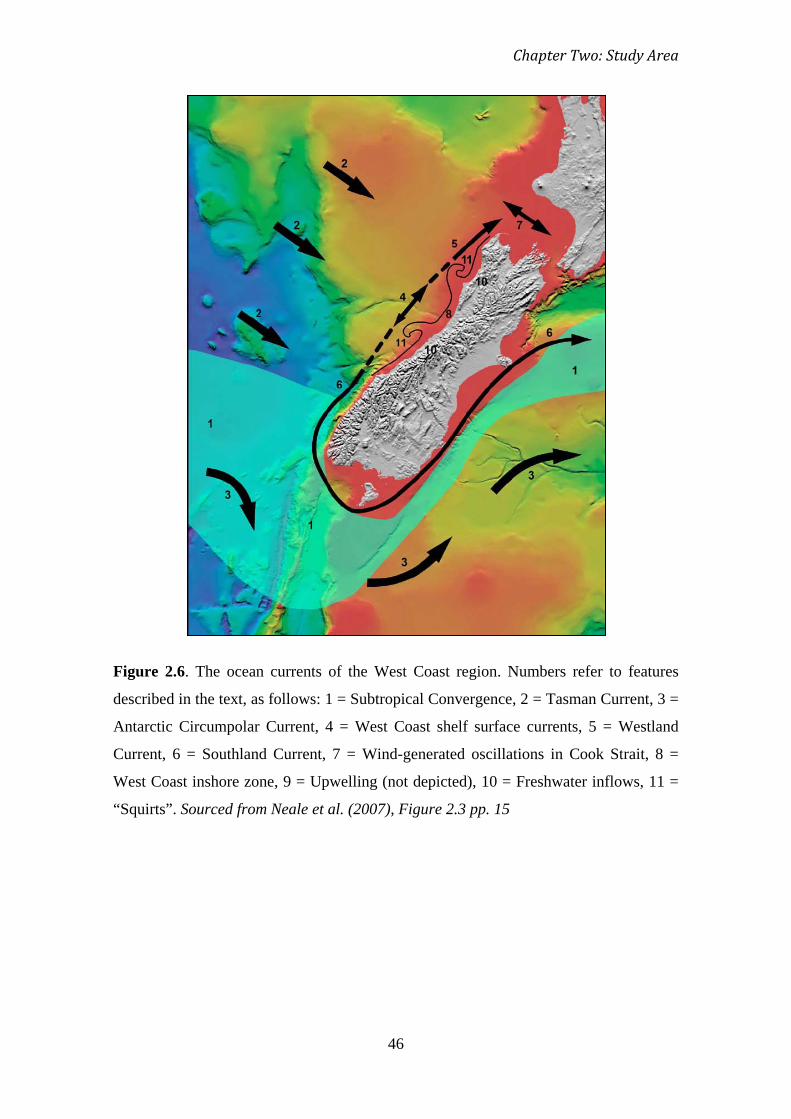
Chapter Two: Study Area
46
Figure 2.6. The ocean currents of the West Coast region. Numbers refer to features
described in the text, as follows: 1 = Subtropical Convergence, 2 = Tasman Current, 3 =
Antarctic Circumpolar Current, 4 = West Coast shelf surface currents, 5 = Westland
Current, 6 = Southland Current, 7 = Wind-generated oscillations in Cook Strait, 8 =
West Coast inshore zone, 9 = Upwelling (not depicted), 10 = Freshwater inflows, 11 =
“Squirts”. Sourced from Neale et al. (2007), Figure 2.3 pp. 15
47
2.5 Sediment supply
The nature of West Coast weather systems and geology mean that southern and central
West Coast rivers have extremely high sediment loads, which have been placed
amongst the largest in the country by NIWA suspended sediment discharge models.
This high sediment load causes large amounts of sediment to accumulate on the beaches
and the continental shelf. In the area surrounding these sites, much of the sediment
reaching the continental shelf is captured and removed from the system via the Hokitika
canyon system. The coastline is oriented south-east to north-west in this region, and the
net drift direction is northwards. The net rate of this transport is calculated at 240 000 ±
10 000 m3 yr-1
Swamps act as natural sediment sinks, and over geological time are inclined to infill
(Woodroffe, 2003). Shearer Swamp is consistent with this, and a large volume of
sediment is deposited in the system from the catchment area of the contributing streams.
Most of the sediment originates from large slips that have occurred in the upper
catchment and washed down tributary streams in recent years. This process is
accelerated through the removal of this sediment and creation of unconsolidated stop-
banks from landslide debris to protect farmland, which are then disturbed and
remobilised by subsequent flood events.
, of which 93% is sand and gravel (Gibb, 1987).
2.6 Site descriptions
2.6.1 Totara Lagoon
Totara Lagoon is a much larger, more permanent lagoon system than Waikoriri, and
stretches 10 km northwards from the Totara rivermouth at Ross (Figure 2.7). It is a
long, narrow, hapua-type lagoon, with the water surface covering approximately 100 ha
(Neale et al., 2007; DOC, 2007). It is fed predominantly by the Totara River, which
currently discharges at the southern extremity of the lagoon, although the mouth has
been displaced varying distances along the 10 km long channel at times. There are also
a number of smaller creeks which feed into the lagoon further north, which are: Gows
Creek, Woolhouse Creek, Rocky Creek and Camp Creek. There is a significant tidal
influence in this waterbody, extending several kilometres up the channel. Totara Lagoon
is separated from the sea by a sandy beach and low sand dunes, which become steeper
and more heavily vegetated towards the north end of the lagoon. There is evidence of
Chapter Two: Study Area
48
dune blowouts in many places along the barrier, up to and for a distance past the current
northern extremity of the waterbody.
2.6.2 The Shearer Swamp-Waikoriri Lagoon Complex
Shearer Swamp is a large, freshwater wetland that occupies 135 ha on a narrow coastal
plain south of the township of Ross (Figure 2.7). The Department of Conservation
(DOC) have classified the swamp as a combination of wetland classes, including fen,
swamp, bog, pakihi, and coastal lagoon (DOC, 2003). It is low-lying (less than 3m
above sea level) and slopes from east to west, making the western edge closer to the
water table (Hart and Single, 2004). The wetland is bounded by two small streams:
Granite Creek and Waikoriri Creek on the southern and western sides, and by
Ferguson’s Bush (through which State Highway 6 runs) on the northern side. These two
creeks meet at the south-west corner of the swamp, approximately 100m inland from
the sea, and drain through Waikoriri Lagoon. Shearer Swamp is heavily vegetated with
flaxes and coprosma shrubs, with large pockets of well developed podocarp trees along
the southern and eastern margins. Sediment in the swamp area consists of muds and
peat, the latter being recorded to a maximum depth of 3.5 m (Davoren, 1978).
Waikoriri Lagoon is part of the same system as Shearer Swamp, and forms the outlet to
the sea that drains the wetland (Figure 2.7). It is a small hapua-type lagoon, which
extends up to 4 km northwards from the confluence of Granite and Waikoriri Creek.
The lagoon occupies a swale behind the beach and foredune, and is separated from
Shearer Swamp by a series of low-lying sand dunes. On the seaward side of the lagoon,
the barrier is between 20 and 80 m wide, and consists predominantly of coarse sand
with a small percentage of gravel and fine sand (Hart and Single, 2004). Waikoriri
Lagoon is not a stable, permanent feature, being constantly in a state of change ranging
between its maximum extent of approximately 2 km to being present as an empty
channel at the back of the beach. The causes of this variability are a combination of
natural processes, such as storm events, and anthropogenic influence and management.
Marine processes (i.e. wave energy acting on the barrier and outlet) are the dominant
factor in this lagoon, as the Westland region has an extremely high energy marine
environment, and there is relatively little fluvial input from Granite and Waikoriri
Creeks.
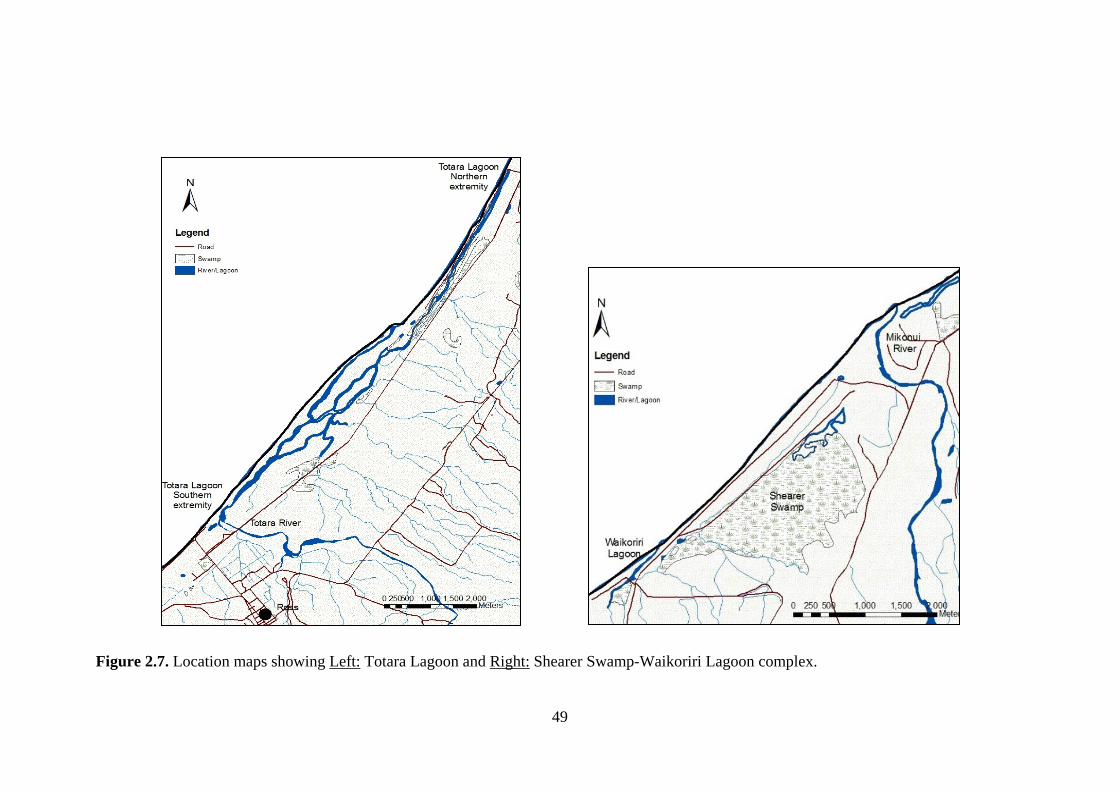
49
Figure 2.7. Location maps showing Left: Totara Lagoon and Right: Shearer Swamp-Waikoriri Lagoon complex.
Chapter Two: Study Area
50
2.7 Hydrology
Totara Lagoon is a very large system and as such, exhibits complex hydrology. The
catchment area of the lagoon itself is approximately 13 563 ha, of which forty percent
lies at an altitude of less than 100 m (DOC, 2007). The main water source for the lagoon
is the Totara River, which currently discharges at the southern extremity of the lagoon
but the opening of which can migrate up to several kilometres northwards from this
point. Seven streams have been identified and mapped by DOC as contributing to the
middle and northern reaches of Totara Lagoon, including Gows Creek, Stenhouse
Creek, Woolhouse Creek, Camp Creek, and Rocky Creek. These streams drain an area
of private land in the hills to the east, and their margins are now well vegetated with
flax and gorse (DOC, 2007). In addition, water enters the system through numerous
smaller streams and seepage zones from adjoining swamps to the west. The water in
Totara Lagoon is brackish, as a result of tidal influence at the river mouth which extends
several kilometres up the channels. This results in long residence times for water in the
northern end of the Totara Lagoon system.
The hydrological regime of Shearer Swamp and Waikoriri Lagoon is not fully
documented or understood and, in particular, questions surround the degree of
hydrological connectedness between the northern and southern ends of the swamp.
Water enters the main swamp system from rain and streams or subsurface flow (namely
Dickey Creek, Granite Creek, and Ferguson’s Creek), which bring water from the hills
to the east and north of the swamp. Water is also brought from the south by Waikoriri
Creek and Pearn Brook, although these do not travel through the main area of the
swamp. The swamp drains from east to west, into Waikoriri Creek (the western
boundary of the true swamp), which then flows south and discharges into the sea
through Waikoriri Lagoon. At the northern end of the swamp a now-blocked channel
formerly provided drainage into the Mikonui Rivermouth, particularly during floods. It
has been posited that rather than a single drainage network culminating in discharge
through Waikoriri Lagoon, the swamp may be separated into two distinct hydrological
areas by a topographical divide, with the southern areas draining through the lagoon,
and the northern areas draining into the Mikonui River (DOC, 2003). This is supported
by field observations following a recent barrier breach event, when water levels
remained high in the northern area although they dropped dramatically to the south. The
51
natural hydrology of this system has been influenced by farming and development in the
surrounding areas and higher in the catchment, and through artificial openings of the
Waikoriri Lagoon barrier. These will be discussed further in the following sections.
Marine processes are clearly the dominant process agents in Waikoriri Lagoon. There is
a small fluvial outflow from the mouth of Waikoriri Creek, which discharges into the
high energy West Coast marine environment. It is suggested that the Waikoriri Lagoon
barrier is of low permeability (due to the abundance of fine sediment and lack of
gravel), which would allow an outlet channel to be maintained at most times despite the
small fluvial outflow (Hart and Single, 2004).
2.8 Anthropogenic influence and management
Totara Lagoon has also been subject to significant anthropogenic influence throughout
historical times. There is no historical documentation of Maori use of the area, but it is
likely that the wealth of food sources and natural resources were put to use. Since
March 1983, the lagoon area has been owned and protected by the New Zealand
Wildlife Service and the Wetland Acclimitisation Society, through the formation of the
‘Totara Lagoon Wildlife Management Reserve’. The area is now managed by DOC,
although some islands, such as Frenchies Island and Tui Island, are privately owned.
The adjoining land to the west is also farmed, as is a thin strip of land on the eastern
bank of the waterbody’s northern reaches.
Totara Lagoon’s long history of significant anthropogenic disturbance dates back to the
1870s. Prior to the construction of a highway between Ross and Hokitika (1871-1873),
a boat down Mahinapua Creek, then overland, followed by another boat down the
lagoon was the main route of transport between the two towns. From 1865, a small
settlement was situated at the northern end of the lagoon to service this route, and
another appeared at the southern end (DOC, 2007). In addition to the large-scale mining
operations occurring in Ross during the gold-rush years of the 1870s, mining occurred
in the areas adjoining the lagoon. The glacial outwash terraces on the eastern side of
Totara Lagoon were mined in parts, and the beach sands in direct line with these areas
to the west of the lagoon were also mined for gold between 1872 and 1878 (DOC,
2007). Mining of the black sands on the beaches to the west of the lagoon has continued
intermittently until the present day. A modern mining company is currently operating
Chapter Two: Study Area
52
southeast of the Totara River mouth, and at times discharge from this operation causes
mineral output and staining of the rocks at the river mouth/southern end of the lagoon.
Clearance and drainage of the adjoining land for farming has modified the natural
hydrology of the lagoon, particularly in the north, where large areas of swamp have
been, and continue to be, drained. The presence of cattle grazing up to the lagoon edges
in some places has caused degradation of the vegetation and sediments at the margins,
and accelerated dune erosion (DOC, 2007). Dune erosion is also exacerbated by
recreational motorcyclists and four wheel drive enthusiasts who make frequent use of
the beach, particularly at the northern end. In addition, the lagoon area is popular for
whitebaiting, fishing, and game bird hunting. Like Waikoriri Lagoon, historical
anecdotes suggest that the lagoon has been subject to artificial opening of the mouth at
the southern end to facilitate whitebait migration. The mouth of Totara Lagoon is
currently situated directly opposite the main coastal river channel, where it has been
artificially maintained via sediment removal over recent years.
Like Totara Lagoon, Shearer Swamp and Waikoriri Lagoon have been the subject of
significant anthropogenic influence over historical times. The main body of Shearer
Swamp north of the Waikoriri Creek boundary is currently Crown owned land and
managed by DOC. Farmland to the west of the swamp and south of Waikoriri Creek is
privately owned, and is bounded to the north by Ferguson’s Bush Scenic Reserve.
Shearer Swamp itself is recognised and listed as a wetland of national importance by
DOC. Prior to European settlement, the swamp was of significance to local Maori for
hunting and gathering (DOC, 2003). In historical times the surrounding hills were
heavily logged for native timbers, which took place until the late 1960s, and a tramway
to service this industry was constructed on the seaward (western) swamp boundary
(DOC, 2003) (Figure 2.7). The remains of this tramway are still present today, with
deep channels running either side. It is accessible to the public and functions as a
walkway. This logging and subsequent sediment disturbance and change in catchment
characteristics hugely impacted the sediment supply and modified the natural hydrology
of the swamp, as did the development of the surrounding areas as farmland. The
construction of Bold Head Road, which runs alongside the swamp between the seaward
and anterior dune ridges, does not directly affect the swamp or adjoining creeks/lagoon
system, but the creek is potentially somewhat constrained by the Waikoriri Creek bridge
53
in the southeast corner of the swamp. Similarly, the construction of power pylons on the
farmed dune ridges seaward of the swamp had little or no effect on the system.
Land clearance and channel realignment in Granite Creek north and west of the swamp
occurred during farming development, and drainage of these areas has led to a build up
of sediment in the lower reaches of Waikoriri Creek (Hart and Single, 2004). However,
this has been partially buffered by high water levels in Waikoriri Creek/Waikoriri
Lagoon, and a large margin of podocarp and coprosma vegetation along the creek. The
removal of sediment from Granite Creek to create stop-banks, thus accelerating the
transport of large volumes of sediment to the coast, has had the effect of accelerating the
formation processes of Waikoriri Lagoon (Hart and Single, 2004). At the northern end
of the swamp, the natural drainage channel into the Mikonui River mouth has been
blocked by a causeway to access power pylons. Until relatively recent times, this was
still open via a culvert beneath Bold Head Road; however, this is no longer the case.
During the early part of the 20th
The most heavily investigated and debated form of anthropogenic influence in this area
surrounds the position of the Waikoriri Lagoon opening, and the question of whether or
not it should be artificially controlled. Historical accounts of this issue suggest the
barrier was at times breached artificially in response to high water levels threatening
roads and farmland, and to facilitate recreational activities such as whitebaiting. This
dilemma was particularly evident during a flood event in January 2004, when elevated
water levels persisted for six days without a natural breach occurring and it was decided
to artificially open the lagoon. As a result, the water levels in the swamp and creeks
rapidly decreased and the lagoon drained. This had catastrophic consequences for the
affected ecosystems, and the need for and optimum position of any subsequent openings
related to flood mitigation is an ongoing debate.
century, a drainage channel known as ‘The Causeway’
was constructed and linked Shearer Swamp with Waikoriri Lagoon through the seaward
dune system. This no longer functions, although the channel still exists as far as Bold
Head Road (Figure 2.8). In addition to this work, farmers of the time planted flax along
the seaward dune ridge, to the east of the road, as a stabilising measure.
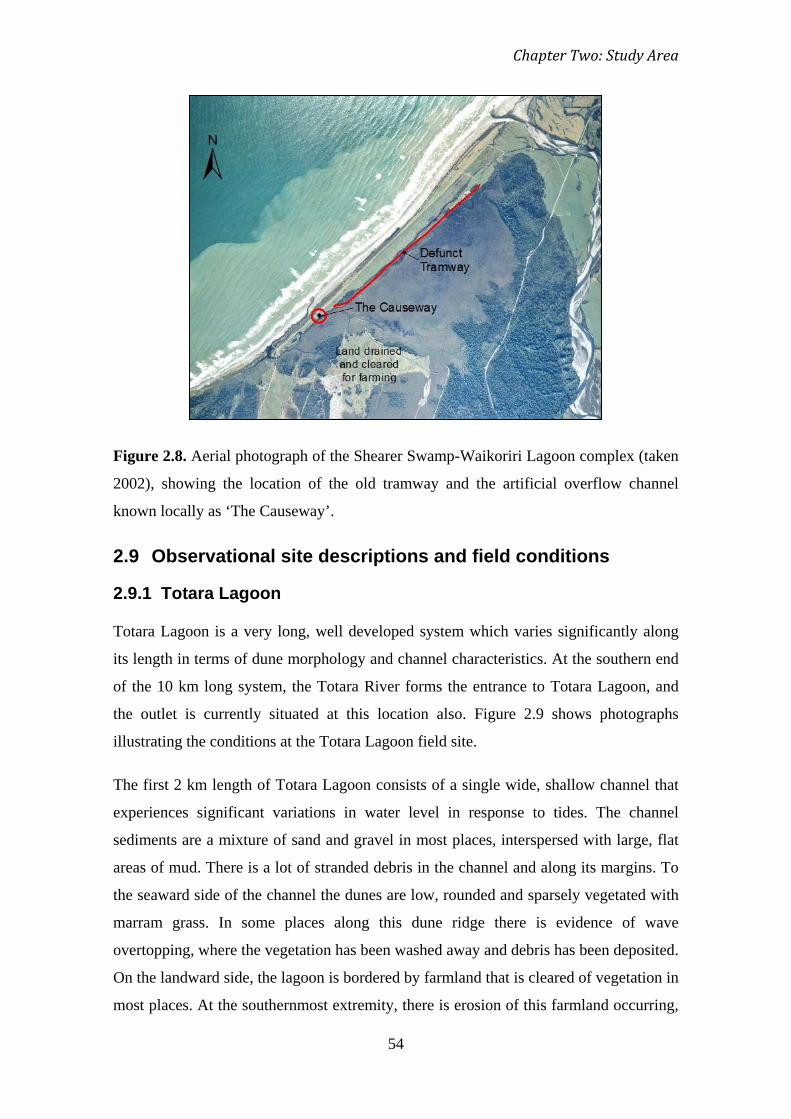
Chapter Two: Study Area
54
Figure 2.8. Aerial photograph of the Shearer Swamp-Waikoriri Lagoon complex (taken
2002), showing the location of the old tramway and the artificial overflow channel
known locally as ‘The Causeway’.
2.9 Observational site descriptions and field conditions
2.9.1 Totara Lagoon
Totara Lagoon is a very long, well developed system which varies significantly along
its length in terms of dune morphology and channel characteristics. At the southern end
of the 10 km long system, the Totara River forms the entrance to Totara Lagoon, and
the outlet is currently situated at this location also. Figure 2.9 shows photographs
illustrating the conditions at the Totara Lagoon field site.
The first 2 km length of Totara Lagoon consists of a single wide, shallow channel that
experiences significant variations in water level in response to tides. The channel
sediments are a mixture of sand and gravel in most places, interspersed with large, flat
areas of mud. There is a lot of stranded debris in the channel and along its margins. To
the seaward side of the channel the dunes are low, rounded and sparsely vegetated with
marram grass. In some places along this dune ridge there is evidence of wave
overtopping, where the vegetation has been washed away and debris has been deposited.
On the landward side, the lagoon is bordered by farmland that is cleared of vegetation in
most places. At the southernmost extremity, there is erosion of this farmland occurring,
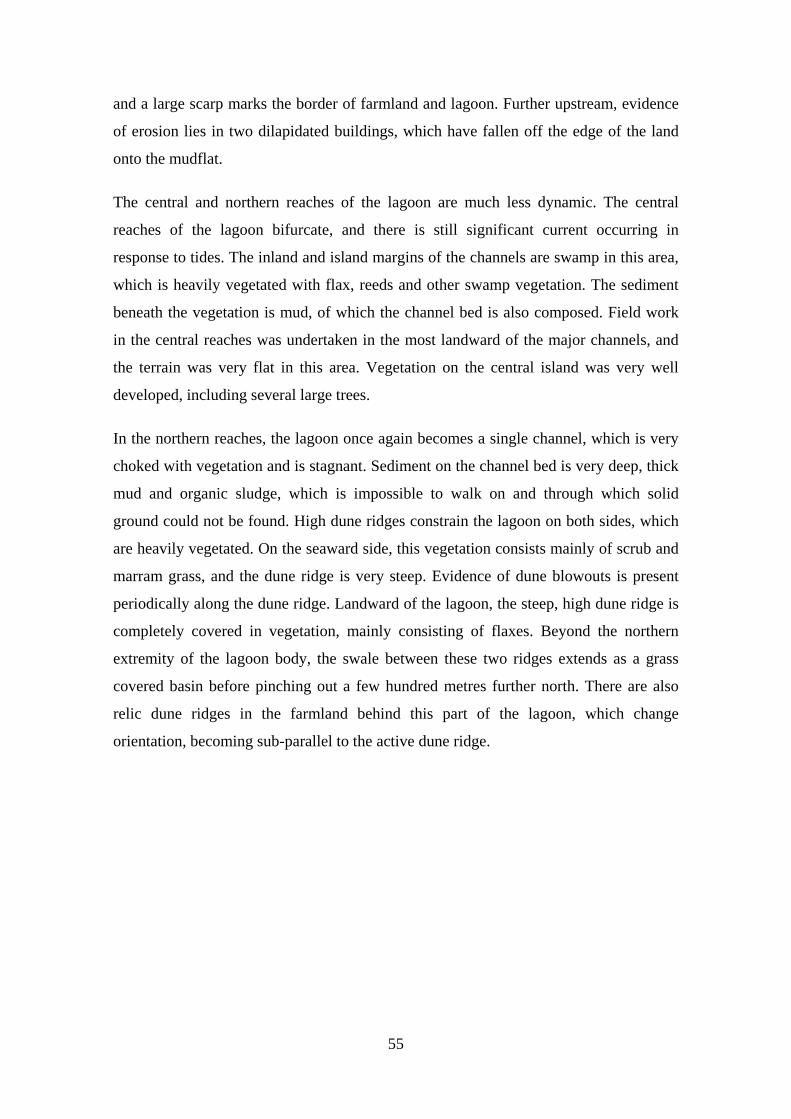
55
and a large scarp marks the border of farmland and lagoon. Further upstream, evidence
of erosion lies in two dilapidated buildings, which have fallen off the edge of the land
onto the mudflat.
The central and northern reaches of the lagoon are much less dynamic. The central
reaches of the lagoon bifurcate, and there is still significant current occurring in
response to tides. The inland and island margins of the channels are swamp in this area,
which is heavily vegetated with flax, reeds and other swamp vegetation. The sediment
beneath the vegetation is mud, of which the channel bed is also composed. Field work
in the central reaches was undertaken in the most landward of the major channels, and
the terrain was very flat in this area. Vegetation on the central island was very well
developed, including several large trees.
In the northern reaches, the lagoon once again becomes a single channel, which is very
choked with vegetation and is stagnant. Sediment on the channel bed is very deep, thick
mud and organic sludge, which is impossible to walk on and through which solid
ground could not be found. High dune ridges constrain the lagoon on both sides, which
are heavily vegetated. On the seaward side, this vegetation consists mainly of scrub and
marram grass, and the dune ridge is very steep. Evidence of dune blowouts is present
periodically along the dune ridge. Landward of the lagoon, the steep, high dune ridge is
completely covered in vegetation, mainly consisting of flaxes. Beyond the northern
extremity of the lagoon body, the swale between these two ridges extends as a grass
covered basin before pinching out a few hundred metres further north. There are also
relic dune ridges in the farmland behind this part of the lagoon, which change
orientation, becoming sub-parallel to the active dune ridge.
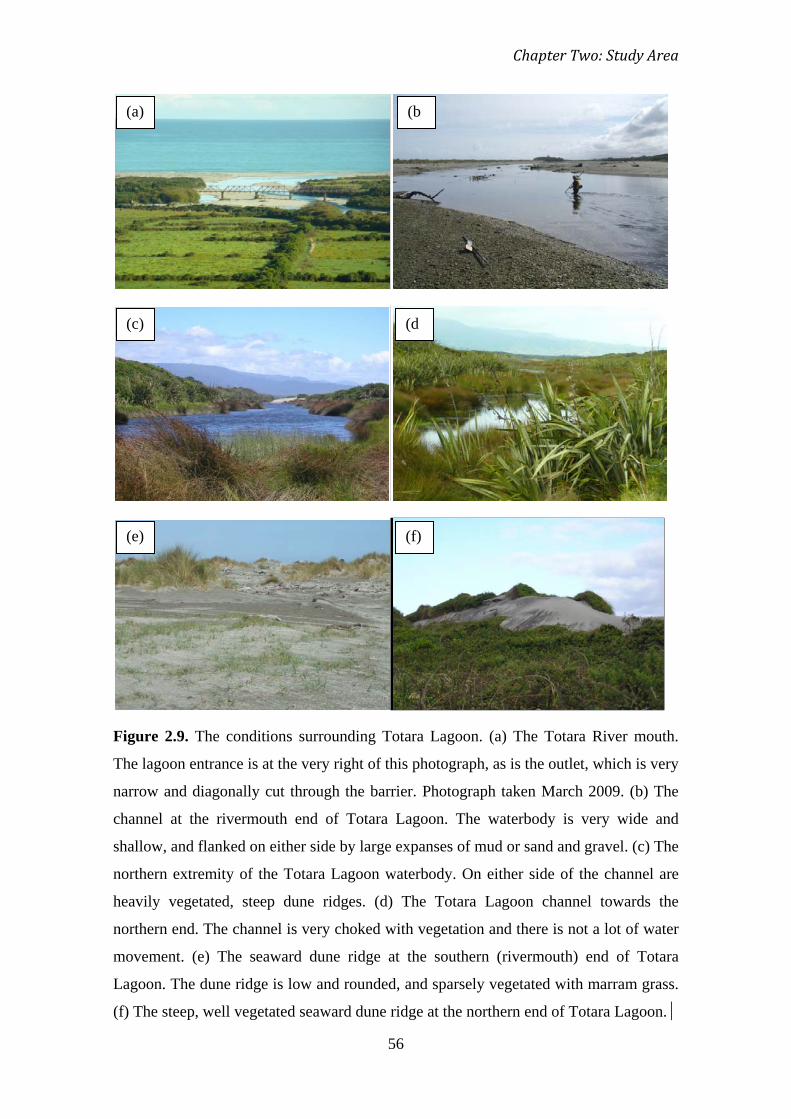
Chapter Two: Study Area
56
Figure 2.9. The conditions surrounding Totara Lagoon. (a) The Totara River mouth.
The lagoon entrance is at the very right of this photograph, as is the outlet, which is very
narrow and diagonally cut through the barrier. Photograph taken March 2009. (b) The
channel at the rivermouth end of Totara Lagoon. The waterbody is very wide and
shallow, and flanked on either side by large expanses of mud or sand and gravel. (c) The
northern extremity of the Totara Lagoon waterbody. On either side of the channel are
heavily vegetated, steep dune ridges. (d) The Totara Lagoon channel towards the
northern end. The channel is very choked with vegetation and there is not a lot of water
movement. (e) The seaward dune ridge at the southern (rivermouth) end of Totara
Lagoon. The dune ridge is low and rounded, and sparsely vegetated with marram grass.
(f) The steep, well vegetated seaward dune ridge at the northern end of Totara Lagoon. Fig
(a)
(b
(c)
(d
(e)
(f)
57
2.9.2 Shearer Swamp-Waikoriri Lagoon complex
The conditions in the interior of Shearer Swamp meant that the swampland itself was
inaccessible. The swamp is surrounded by creeks which are very deep, muddy and
choked with vegetation in parts, creating access problems. Beyond these, the swamp is
mostly covered with tall flaxes and grasses, making navigation difficult. In the northern
section of the swamp, a large expanse of water covers the area, which is open in some
places (making travel by boat possible), and choked with reeds or covered by thick
moss in other places. It is a very hazardous environment, as at times what appears to be
solid ground is in fact a mat of vegetation covering very deep water. In the higher,
eastern areas of the swamp, the ground is harder and scrubby vegetation has developed.
The environment of Shearer Swamp is depicted in Figure 2.10 (a) – (c).
Waikoriri Lagoon is a much smaller, more dynamic system that Totara Lagoon. The
outlet is much more mobile, and is currently situated at the southern end of the system.
The rapid movement of this outlet is evident in the scarps cut into the beach, and the
outlet was observed at several different positions over the study period. The lagoon
channel is narrow, and is situated between a very low, rounded barrier on the seaward
side, and a taller dune ridge on the landward side. The floor of the channel is composed
mostly of the same sand as the beach, with some mud and gravel. The beach itself is
covered by a lot of debris (evidence of the high energy wave environment) and the
barrier seaward of the lagoon is mostly bare of vegetation. Some patches of marram
grass are apparent, but these are not well developed; even less so than the dunes at the
southern end of Totara Lagoon. The landward dune ridge is very stable and heavily
vegetated, to the point where access across it is constrained to several paths maintained
by locals. Between this ridge and the swamp edge is farmland, and the sand of the relic
dune ridges beneath can clearly be seen in the paddocks in places. Photographs of
Waikoriri Lagoon are presented in Figure 2.10 (d) – (f).
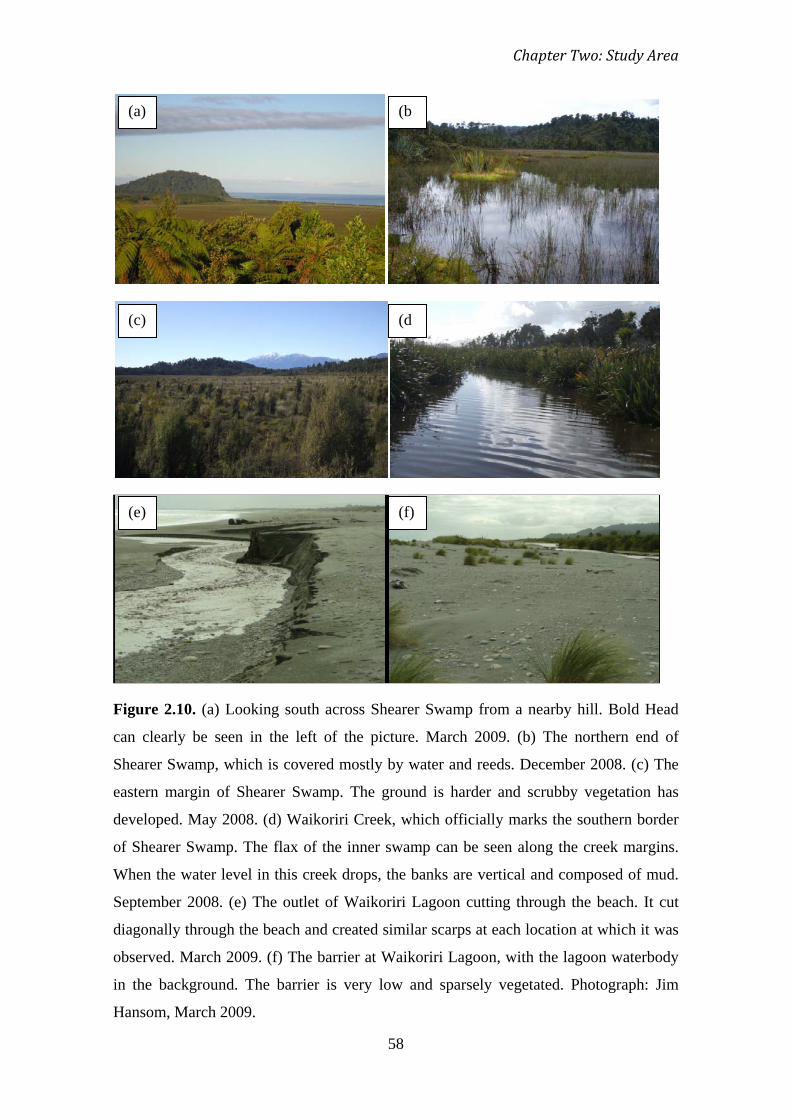
Chapter Two: Study Area
58
Figure 2.10. (a) Looking south across Shearer Swamp from a nearby hill. Bold Head
can clearly be seen in the left of the picture. March 2009. (b) The northern end of
Shearer Swamp, which is covered mostly by water and reeds. December 2008. (c) The
eastern margin of Shearer Swamp. The ground is harder and scrubby vegetation has
developed. May 2008. (d) Waikoriri Creek, which officially marks the southern border
of Shearer Swamp. The flax of the inner swamp can be seen along the creek margins.
When the water level in this creek drops, the banks are vertical and composed of mud.
September 2008. (e) The outlet of Waikoriri Lagoon cutting through the beach. It cut
diagonally through the beach and created similar scarps at each location at which it was
observed. March 2009. (f) The barrier at Waikoriri Lagoon, with the lagoon waterbody
in the background. The barrier is very low and sparsely vegetated. Photograph: Jim
Hansom, March 2009.
(a)
(b
(c)
(d
(e)
(f)
59
2.10 Summary
This chapter detailed the environment of the study sites to provide a context for this
study in terms of morphology, hydrology and climatic factors. The West Coast region is
a very high energy environment, experiencing heavy rainfall, frequent westerly storms
and a high energy wave environment, all of which interact to affect the coastal
environment. Climate is generally mild on the West Coast, experiencing neither extreme
hot nor cold temperatures. The two systems under investigation share the same coastal
plain, which is composed mainly of paraglacial deposits related to the Otiran glaciation.
The catchments of these systems extend up into the Southern Alps, and bring down
large amounts of granite and schist to the coast. The marine circulation is driven by the
subtropical convergence, which occurs at approximately this latitude. The predominant
current affecting these systems is the northerly flowing Westland Current, and the net
direction of littoral drift is northwards as a result.
Totara Lagoon is a much larger system than Waikoriri, and is fed predominantly by the
Totara River from the south. It is well flushed in the south and bounded by low,
rounded dunes, becoming narrower and choked in the north with dunes becoming
progressively steeper and more vegetated. Anthropogenic influence on the system has
occurred through mining operations, dredging and spoils dumping over historical time,
and drainage of adjacent wetland for farming. The construction of a railway to service
the mining industry has impacted drainage between the lagoon and adjacent swampland.
Shearer Swamp is a large, freshwater wetland that occupies 135 ha, and is bounded by
two small streams: Granite Creek and Waikoriri Creek on the southern and western
sides, and by a well-developed area of native bush to the north. It is heavily vegetated
with flaxes, and consists of muds and peat. Waikoriri Lagoon is part of the same
system, forming the outlet to the sea that drains the wetland. It is a smaller, much more
dynamic system than Totara Lagoon. The lagoon occupies a swale behind the beach and
foredune, and is separated from Shearer Swamp by a series of low-lying, farmed dune
ridges. Sediment supply and hydrology of the system has been heavily affected by
swamp drainage for farming, and changes in sediment supply related to stop banking, in
addition to artificial outlet breaching of the lagoon barrier. This study will seek to
understand and explain the similarities and differences between these two systems in
terms of processes and morphology.
60
CHAPTER THREE
Methodology
3.1 Introduction
Due to their dynamism and multiple facets, coastal features and environments are
difficult to investigate, often requiring a combination of techniques to capture a
comprehensive set of data. Recent advances in technology have made the study of
coastal environments much more accessible, allowing data collection on far greater
spatial and temporal scales. This chapter discusses the individual techniques used in this
study and details the way in which they are applied. Firstly, the methodology employed
to document the current and recent geomorphology is presented in Section 3.2, followed
by techniques pertaining to the development of the study sites over recent centuries in
Section 3.3. Each of these two major sections begins with a review of the principles and
techniques involved in the methodology, followed by details of the method as applied in
this study.
Fieldwork was undertaken over two main periods. Ground surveying and short-term
water level recording was performed during the period December 1st – 16th 2008. This is
important to note, as these coastal systems are very dynamic and can change
substantially in response to seasonal weather trends and random storm events. During
this period, a single storm occurred on December 6th. Sediment cores were taken on a
second visit during the period March 2nd – 7th 2009. Fieldwork included visual
observations and photographs of the field sites, including outlet position, form, and any
other features of interest. A third site visit took place over March 20th – 22nd. No
quantitative measures were taken during this time, but observations about the lagoons
and outlet position and form were made.
Chapter Three: Methodology
61
3.2 Recent Geomorphology
3.2.1 Topographic Survey Principles and Practices
Ground surveys of the topography of a given area and its features remains one of the
fundamental tools for understanding its geomorphology and processes, and for
monitoring changes in coastal landforms over time. In the past, surveys were performed
with a total station, which although potentially very accurate, can be a time consuming
task that is spatially restrictive and labour intensive. With the advent of GPS and GNSS
systems, and subsequent GIS analysis packages, surveying has become applicable on a
larger spatial scale and in greater detail. Data collection by ground survey techniques
remains more labour intensive than remote methods such as aerial or satellite imagery
analyses (e.g. LIDAR), which are superior for analysing large areas of coastline, but
these may require validation and calibration by associated ground surveys (Pranzini,
2007).
Data collected from GPS ground surveys can be used to create a topographic map of the
survey area, or a digital elevation model (DEM), a three dimensional digital
representation of the topography and landforms. The method employed to achieve this
is critical to the accuracy and applicability of the resulting model. Survey data is in the
form of ‘points’, that is; individual points taken along a transect or surrounding a
feature, which must be converted into a continuous surface by the process of
interpolation (Andrews et al., 2002). Interpolation uses the characteristics of the points
collected to fill in the areas between the points, which can be achieved in several
different ways. Commonly used methods of gridding are kriging, inverse distance
weighted, nearest neighbour and spline (Andrews et al., 2002). There is no set formula
for determining which method will yield the most accurate DEM, and often several
methods of interpolation, grid size, and sampling density need to be explored and
compared.
Another method of producing a three dimensional model is by use of a triangulated
irregular network (TIN), which triangulates adjacent points to create a continuous
surface. This method works particularly well when survey data is irregular rather than
collected along a grid, and when a relatively good density of points is achieved (Lo and
Yeung, 2006). A TIN is not based on a grid and as it merely involves forming planes
between data points, no interpolation is required (Andrews et al., 2002; Kumler, 1994).

Chapter Three: Methodology
62
Consequently, the resulting model is not considered a DEM in the strictest definition of
the word (Andrews et al., 2002); however, for the purposes of this study they can be
considered the same and the three dimensional models presented in Chapter 5 will be
referred to as DEMs.
Data
Ground surveys of representative sections of each site using a Trimble R8 GNSS system
were undertaken over a 2 week period in early December 2008. The scale and nature of
the field sites and access constraints did not allow surveying of the entirety of the
systems. Four representative areas along the length of Totara Lagoon were surveyed in
detail: the river mouth extremity, the northern extremity, and two sections along the
central reaches of the lagoon channel. These sections were chosen to provide
approximately evenly spaced snapshots of the topography of Totara Lagoon along its 10
km length, from which trends of change in terms of distance from the outlet could be
inferred. The river mouth end was particularly important, as this is currently where the
lagoon discharges. The entire dry channel of Waikoriri Lagoon, as far as the recently
abandoned opening, was surveyed, and the adjacent area between the lagoon and the
western edge of Shearer Swamp was also surveyed. Sample elevation points
surrounding Shearer Swamp were also taken (Figure 3.1). Details of surveyed areas are
presented in Table 3.1.
Collection
Surveying was undertaken using a Trimble R8 GNSS. Several geodetic markers
maintained by Land Information New Zealand (LINZ) exist in the area and were
initially considered as locations for the GNSS base station. However, no consistent
signal was achieved between the base and the rovers at any of these locations. The base
station was set up on a high point at Ross Cemetery, which overlooked the entire coastal
plain of interest and from which a consistent signal could be achieved at both study sites
via a repeater (Figure 3.1) (Appendix 1). Surveys were undertaken using the NZGD
2000 Hokitika Circuit map grid. Surveying was performed on foot, with rovers attached
to researchers’ backpacks, recording their position and elevation at 5 second intervals
using the ‘continuous topo’ function. A strong signal was achieved over most of the
study area, and this was surveyed using Real Time Kinematics (RTK), which yields
very accurate positions that are calculated in the field rather than requiring extensive
post-survey correction. This option works well where there are few obstructions
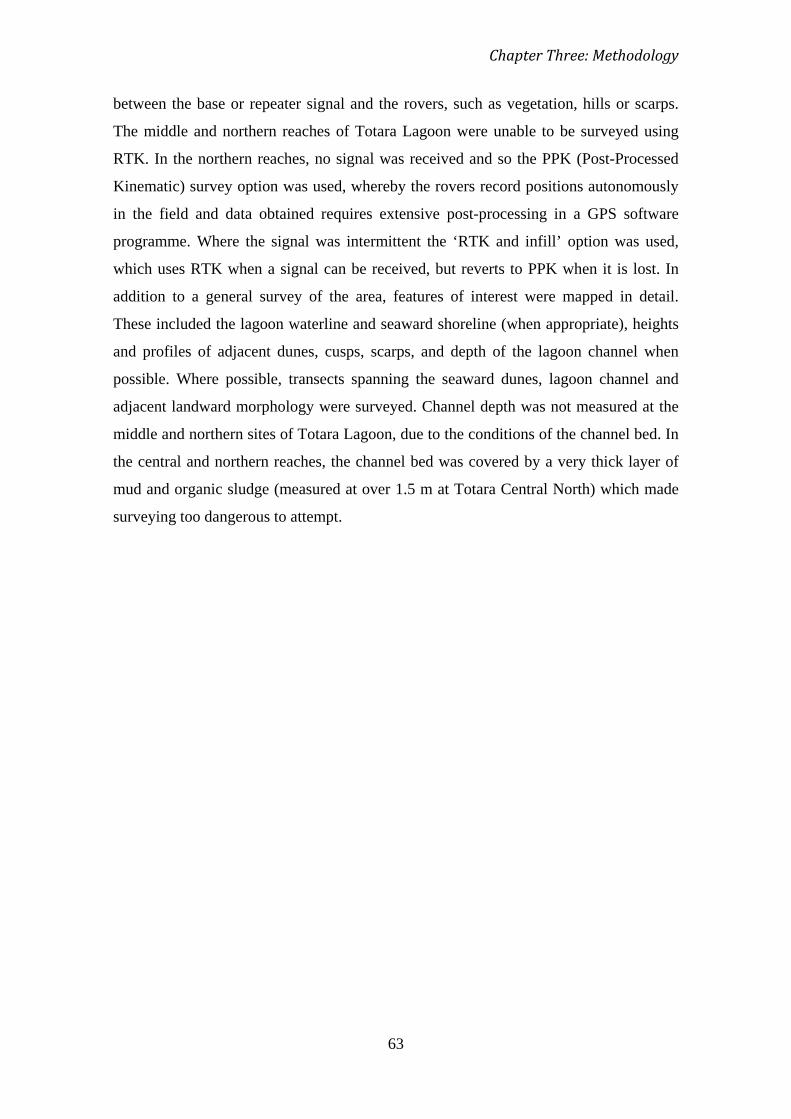
Chapter Three: Methodology
63
between the base or repeater signal and the rovers, such as vegetation, hills or scarps.
The middle and northern reaches of Totara Lagoon were unable to be surveyed using
RTK. In the northern reaches, no signal was received and so the PPK (Post-Processed
Kinematic) survey option was used, whereby the rovers record positions autonomously
in the field and data obtained requires extensive post-processing in a GPS software
programme. Where the signal was intermittent the ‘RTK and infill’ option was used,
which uses RTK when a signal can be received, but reverts to PPK when it is lost. In
addition to a general survey of the area, features of interest were mapped in detail.
These included the lagoon waterline and seaward shoreline (when appropriate), heights
and profiles of adjacent dunes, cusps, scarps, and depth of the lagoon channel when
possible. Where possible, transects spanning the seaward dunes, lagoon channel and
adjacent landward morphology were surveyed. Channel depth was not measured at the
middle and northern sites of Totara Lagoon, due to the conditions of the channel bed. In
the central and northern reaches, the channel bed was covered by a very thick layer of
mud and organic sludge (measured at over 1.5 m at Totara Central North) which made
surveying too dangerous to attempt.
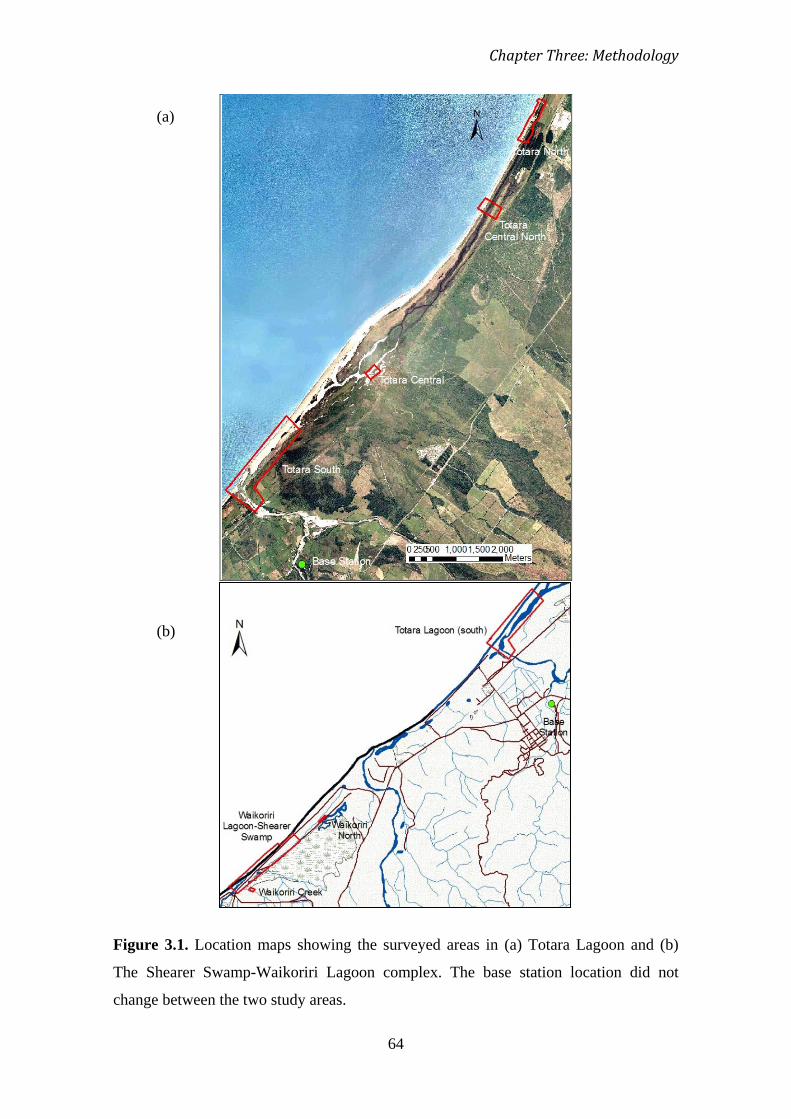
Chapter Three: Methodology
64
Figure 3.1. Location maps showing the surveyed areas in (a) Totara Lagoon and (b)
The Shearer Swamp-Waikoriri Lagoon complex. The base station location did not
change between the two study areas.
(a)
(b)

Chapter Three: Methodology
65
Figure 3.2. Left: Base station receiver set up at Ross Cemetery. Right
: Surveying the
river mouth end of Totara Lagoon.
Table 3.1. Details of GNSS surveys across both field sites.
Location Number of
Points Spatial Extent (m2 Survey method )
Totara South 7693 367 231 RTK
Totara Central 1513 12 920 RTK and infill
Totara Central North 1988 63 459 RTK and infill
Totara North 7276 188 456 PPK
Waikoriri Lagoon/ western
margin of Shearer Swamp 11 529 552 044 RTK
Southern margin of Shearer
Swamp 556 1 857 RTK and infill
Chapter Three: Methodology
66
Data collected in the field was transferred from the GNSS hand units to a laptop and
converted to ASCII format using the Trimble Geomatics Office programme. An initial
three dimensional model of the data was produced in Terramodel 10.4, which allowed
erroneous data points and other anomalies to be identified. These were located and
removed in the associated Microsoft excel file. Due to the position of the base station on
an unknown point (i.e. not a LINZ geodetic marker), the base position required
correction before data in the field could be corrected. This was achieved by constructing
a baseline between the base station location and the location of the LINZ base station in
Hokitika, following which the data collected in the field was then adjusted based on the
corrected base station position. The ASCII files were later transformed for ArcGIS
analysis into shapefiles (.shp), database files (.dbf), and ArcView database index files
(.shx).
Data Processing
Following correction and file conversion, the data was imported into ArcGIS as a single
large dataset covering both field sites. Firstly, the entire dataset required correction for
field surveyor heights, which had created systematic errors in elevation. Due to the
general thoroughness of surveying and density of points in each survey section, the TIN
method produced the most representative DEM of the study site. Kriging and Inverse-
distance-weighted interpolation methods were also trialled, but these resulted in
inaccurate representations and smoothing of features such as scarps and steep dunes.
Following the DEM construction, a number of erroneous points of negative elevation
were identified and removed in ArcGIS and the model redrawn. Because the TIN
method creates triangular planes between adjacent points, there was potential for areas
of incorrect interpolation where point density was low and when points across large
distances between survey sites were triangulated. To remedy this problem and reduce
error, polygons were constructed around each survey area to eliminate outlying points
and create individual DEMs of Waikoriri Lagoon and the adjacent dune ridges, Totara
South, Totara Central, Totara Central North, and Totara North.
GIS Analysis
The DEMs were then compared to photographs of the morphology to assess the degree
to which the areas were accurately represented by the models. Due to the complexity of
the dunes in the northern reaches of Totara Lagoon, a degree of inaccuracy was
Chapter Three: Methodology
67
accepted and noted. The DEMs were then visually assessed in conjunction with field
notes and photographs taken while surveying, and features of interest identified. From
this DEM, several profiles were graphed across the seaward dune ridges adjacent to
Totara and Waikoriri Lagoons and across the relic dune ridges between Waikoriri
Lagoon and Shearer Swamp. These are two dimensional cross-sections oriented parallel
to the dune crest, which allow differences in dune heights steepness and morphology
between different profile locations to be quantified.
The extent and accuracy of the point network covering the survey area is constrained by
accessibility. Where researchers were unable to thoroughly cover a feature, the DEM of
that feature is inaccurate due to the triangulation of insufficient points. This applies
specifically to the lagoon channel in the middle and northern reaches of Totara Lagoon,
and to some areas of the dunes surrounding both Totara Lagoon and Waikoriri Lagoon.
The muddy nature of the lagoon channel bed and swampy margins in some places was a
safety issue, and thus surveys extend only as far as the water edge, meaning the surface
in the centre of the Totara Lagoon central and northern DEMs signifies the elevation of
the water surface, rather than the channel morphology. This was not an issue in
Waikoriri Lagoon, where the channel was dry during surveying, or in Totara South,
where the channel could be waded. Heights of well established dune ridges were
underestimated in places, due to large amounts of vegetation preventing accurate
surveying of the crest. This occurred in the landward dunes of Waikoriri Lagoon, and in
the northern reaches of Totara Lagoon on both sides. Areas that have been affected by
these access issues are highlighted in the following chapter. This does not affect profile
constructions or volumetric analyses, as these are based on surveyed transects of actual
point data, rather than relying on the interpolation of the DEM.
Limitations and errors
One limitation of surveys in this area is the lack of accessible and accurate geodetic
markers. Not only did this provide a problem in choosing a location for the base station,
but it made post-processing of the data more difficult. To tie the vertical dimensions of
the DEM to local mean sea level, at least 4 of these known points were required, which
was not possible to obtain in the area. Consequently, the initial survey results were in
terms of height above a global ellipsoid, meaning elevation data could be used in a
relative form but not in terms of absolute elevation above mean sea level. As a solution

Chapter Three: Methodology
68
to this problem, an approximation of sea level elevation in the area was calculated from
the geodetic marker information provided by LINZ, which gives elevation above mean
sea level for each marker. The sea level elevations at each marker location were
averaged to provide a linear approximation of mean sea level elevation over the entire
survey area, then the difference was applied to the entire ArcGIS dataset. This is not
ideal, as it does not account for the elliptical nature of the Earth’s surface; however, due
to the close proximity of the survey areas this has a minimal effect on results.
3.2.2 Aerial photograph Analysis: Principles and practices
The use of aerial photography to assess coastal change over time has been practiced and
refined for over fifty years. Early photographs were simple black and white images of
low resolution, which then moved to higher resolution black and white pictures and the
introduction of stereographic pairs. Colour photographs became accessible from the
1980s (Lewis and McConchie, 1994). Stereo pairs of images can be used to look at the
topography of the area in the photograph and construct topographic contours, and are
useful in cartography, management and planning, vegetation and species distribution
mapping, and to detect large scale geological features that are difficult to map from the
ground (Lewis and McConchie, 1994; Andrews et al., 2002). Aerial photographs can be
taken either vertically or obliquely, of which vertical photographs are the most useful
for scientific mapping purposes.
The use of aerial photographs for mapping shoreline change and changes in vegetation
cover in coastal areas is a well established method that has been applied and refined
over the past 70 years by coastal planners, engineers and scientists (Boak and Turner,
2005). More recently, satellite imagery has started to replace aerial photography as the
primary method of collecting this type of data where budgets and coverage allow.
However, aerial photographs remain a relatively cheap and simple-to-analyse record of
historical change in coastal zones.
Significant distortions exist in aerial photographs, which must be corrected prior to their
use for mapping purposes. This correction process is known as orthorectification. This
distortion includes radial distortion (which increases with distance from the
photographic centre); relief distortion from topographic variation; tilt and pitch changes
of the aircraft; lens distortion in older photographs; and scale variations resulting from
Chapter Three: Methodology
69
altitude changes along the flight line (Gorman et al., 1998; Boak and Turner, 2005; Al-
Tahir and Ali, 2004). Because coastal areas are generally flat, relief distortion is
negligible and can usually be ignored (Al-Tahir and Ali, 2004).
This study utilises a collection of aerial photographs taken between 1948 and the
present day, with the aim of documenting changes in outlet migration and visual
changes in the systems over this period. Photographs sourced were taken on an
approximately decadal time scale and covered the following years: 1948, 1963, 1972,
1976, 1981, 1986, 2002, 2005 and 2006. Images from 1988 onwards are high resolution
colour photographs. Further details of the images used are presented in Appendix 2. The
pre-2005 photographs were obtained in hard copy and subsequently scanned at a
resolution of 700 dpi and saved as digital (.jpg) files for GIS analysis. Due to the large
spatial extent of the study sites, several photographs were required to cover the whole
area.
Data collection and orthorectification
The photographs obtained in hard copy were unorthorectified, and for the Totara
Lagoon site this was performed in ENVI by georeferencing each photograph to 2
orthorectified digital images produced by LINZ (2002) (Area J33 – Kaniere, LINZ,
2009b). Georeferencing involved matching several visible and stable points (referred to
as control points) on the orthorectified images to those same points in the other images,
then warping the distorted image to fit the orthorectified reference images. These
orthorectified images obtained from LINZ covered the Totara Lagoon area, and were
high resolution colour photographs taken in 2002. For the Shearer Swamp-Waikoriri
Lagoon complex no orthorectified images were available, but the 2002 image (the
clearest and highest resolution image available of the area) was georeferenced to a GIS
shapefile of roads in the area (NZ 1:50 000 topographic survey). From this, images
taken in earlier years were georeferenced and warped to control points located on the
2002 image using ENVI, by the same process as used for Totara Lagoon images. Due to
the dynamic nature of the coastal zone and the lack of visible engineered structures in
the study areas, control points were usually road intersections, bridges, or lone
buildings. At least 4 control points were located on each image, a sufficient number to
provide a satisfactory orthorectification, and these were distributed as evenly as possible
across the entire image. As a part of this process, the images were spatially referenced

Chapter Three: Methodology
70
to the New Zealand Map Grid (NZMG) datum, allowing results to be quantified
spatially in terms of location and distance in metres.
No further preparation was necessary for the Waikoriri Lagoon images prior to the
following analysis, as only a single image from each survey period was required to
cover the entire lagoon area. Totara Lagoon required between 2 and 5 images from each
survey to cover the entire lagoon. In order to create a single georeferenced image of the
lagoon for each survey, the mosaicking tool in ENVI was used to stitch the individual
images together while maintaining their position in coordinate space. For this to be
effective, and to minimise error, the images needed to overlap approximately 30% with
adjacent images.
The final images of each site were compared visually and qualitative changes in outlet
position and channel structure across the study period were noted. A digital
representation of the lagoon area and shoreline position for each survey year were
created in ENVI using the ‘Region of Interest’ tool, then the resulting polygon/line files
were exported into ArcGIS as shapefiles for further spatial analysis. The outlet offset
was measured in metres from the Totara River mouth for Totara Lagoon, and from the
Waikoriri-Granite Creek confluence in the case of Waikoriri Lagoon. The surface area
of Waikoriri Lagoon at each survey was calculated in ArcGIS from the individual
digitisation polygons. This was not performed for Totara Lagoon, due to the size of the
lagoon and the large errors that would be introduced as a consequence.
Analysis of lagoon change
This process was fraught with challenges in the orthorectification/georeferencing
process, due to the nature of the study sites and poor quality of some photographs. In
common practice, photographs are orthorectified and georeferenced in separate
processes, using a combination of digital techniques and collection of control points in
the field. This was not possible for either Totara Lagoon or Waikoriri Lagoon, due to
access constraints in the field and lack of features such as buildings, roads and
prominent rocky areas that could act as GCPs. The roads in the area also underwent
several realignments and upgrade works over the period covered by the surveys,
meaning even road intersection positions were sometimes not accurate enough for this
Limitations and errors
Chapter Three: Methodology
71
purpose. The dynamic coastal nature of these sites also meant that features in the
immediate vicinity of the lagoon were very changeable and thus not suitable as GCPs.
For Totara Lagoon, GCPs were clustered landward of the lagoon in most cases. Some
stable patches of vegetation were able to be used in later photographs, but these were
not visible at a suitable resolution in earlier images. To obtain the most accurate result
from this process, GCPs should be distributed across the entire image, particularly the
area of interest. This was not possible in the beach area or where ocean covered a large
part of the photograph. This was of particular concern in the 1976 images, where the
scale was so small that individual photographs covered only the lagoon area. A large
portion of the potential error in the georeferencing process for Totara Lagoon arose
from human interpretation of features and accuracy (related to photograph resolution).
This was more problematic for the earlier images. Parameters such as pixel size, tone,
texture, shade, shape and position are important considerations for the researcher
performing the analysis (Boak and Turner, 2005; Dahdouh-Guebas et al., 2006).
The georeferencing process for Waikoriri Lagoon was further complicated by the
absence of an existing orthorectified, georeferenced image from which to reference
other raw images. The GIS road file that was used to reference the 2002 image was
sourced from the NZ Topographic survey 1:50 000 data, which is accurate to ±22 m
horizontally and ±5 m vertically (LINZ, 2008). This introduced a large source of
potential error, which was then compounded by the same error sources as occurred in
the Totara Lagoon images.
Once again, human interpretation and manual errors could have arisen during the
digitisation of the lagoon process from the orthorectified images. In order to minimise
these errors in the quantitative results, measurements of outlet position were made
directly from the photographs rather than from the digitisations. In addition, the exact
dimensions of the lagoon and outlet position fluctuate in response to tidal and weather
factors, so quantitative data relating to outlet position and lagoon surface area were
rounded to approximate values (nearest 50 m).
A common error noted in aerial photograph analysis is the issue of vertical displacement
(Gorman et al., 1998; Dahdouh-Guebas et al., 2006); however, this was not a concern
for either of these study sites as all terrain was low relief. Although the error sources
Chapter Three: Methodology
72
discussed here appear significant, the magnitude of the changes in outlet position and
lagoon structure means that they are relatively inconsequential.
3.2.3 Hydrological Principles and Practices
The hydrology of a coastal waterbody is a very important aspect of its overall dynamics.
The hydrological regime of a coastal lagoon is a function of system morphology, fluvial
input, marine conditions and other factors such as ecology and land-use in the
surrounding area (Kirk, 1991). Data on water pressure (which is then converted to water
depth), conductivity and water temperature are three commonly measured variables,
which provide valuable information on the hydrological dynamics of the system.
As technology has advanced, these variables can be measured increasingly easily and at
a greater spatial and temporal resolution. Often, conductivity and temperature are
measured both horizontally and vertically within a waterbody to assess stratification and
apply complex numerical models. For the purposes of this study, the aim was to assess
broad trends rather than gain high resolution data for modelling, so data was not
collected to this level of detail.
Conductivity is the degree to which a substance is able to conduct electricity which, in
the case of water, is a function of the concentration of dissolved ions (salts such as
chlorides, sulphates, carbonates, sodium, magnesium, potassium). As such, conductivity
can be used as a proxy for determining the salinity of the water body (e.g. Fernandes et
al., 2004, Lucas et al., 2006). In waterways, electrical conductivity can be affected by
soil composition, land-use characteristics and runoff, flow rate of the water,
groundwater inflows, temperature, and evaporation/dilution (Lucas et al., 2006). The
salinity of a coastal lagoon is an important parameter, as it provides information about
the degree of water exchange between the ocean and the lagoon, or the balance between
fluvial inputs and marine influence (Kirk, 1991). It is important to note, however, that
conductivity is not necessarily a direct measure of marine influence in all cases, as some
of the measured conductivity may be due to one of the above factors. In these studies,
the patterns and degree of change above the baseline conductivity for each site were the
factors assessed. It is possible to calculate the absolute salinity from conductivity and
temperature data, but this was not deemed necessary for the purposes of this study.
Electrical conductivity ranges of common water systems are presented in Table 3.2.
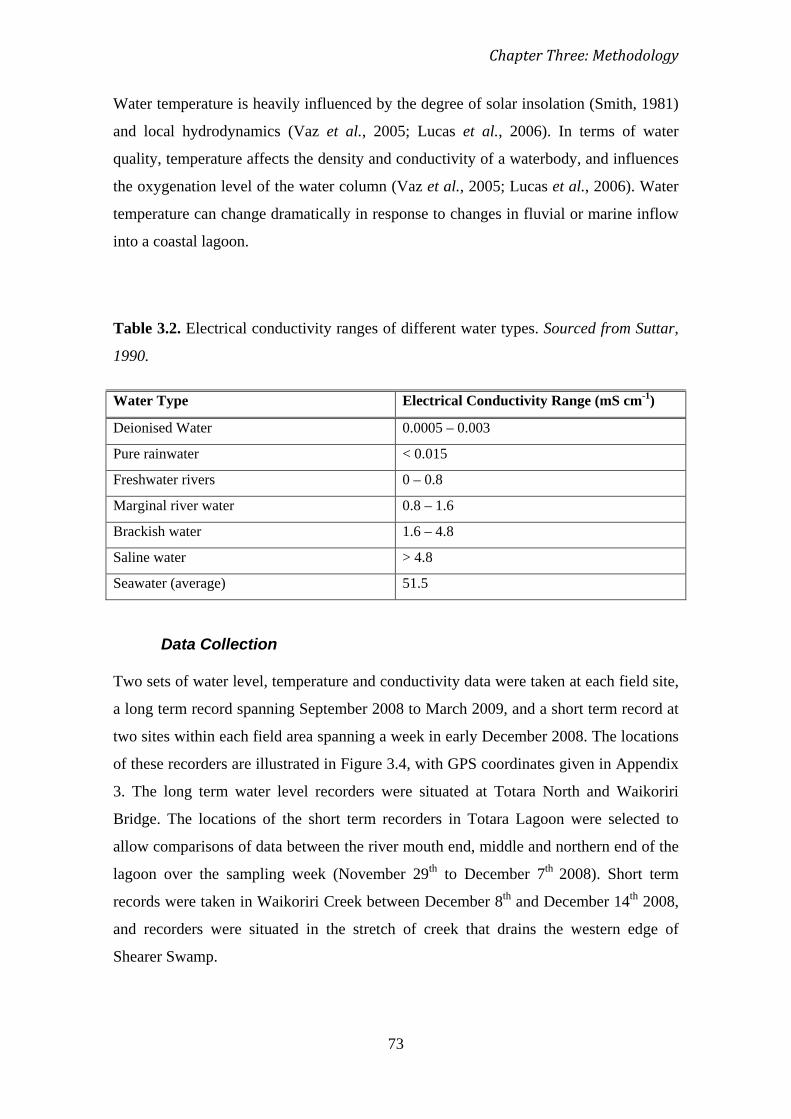
Chapter Three: Methodology
73
Water temperature is heavily influenced by the degree of solar insolation (Smith, 1981)
and local hydrodynamics (Vaz et al., 2005; Lucas et al., 2006). In terms of water
quality, temperature affects the density and conductivity of a waterbody, and influences
the oxygenation level of the water column (Vaz et al., 2005; Lucas et al., 2006). Water
temperature can change dramatically in response to changes in fluvial or marine inflow
into a coastal lagoon.
Table 3.2. Electrical conductivity ranges of different water types. Sourced from Suttar,
1990.
Water Type Electrical Conductivity Range (mS cm-1
Deionised Water
)
0.0005 – 0.003
Pure rainwater < 0.015
Freshwater rivers 0 – 0.8
Marginal river water 0.8 – 1.6
Brackish water 1.6 – 4.8
Saline water > 4.8
Seawater (average) 51.5
Two sets of water level, temperature and conductivity data were taken at each field site,
a long term record spanning September 2008 to March 2009, and a short term record at
two sites within each field area spanning a week in early December 2008. The locations
of these recorders are illustrated in Figure 3.4, with GPS coordinates given in Appendix
3. The long term water level recorders were situated at Totara North and Waikoriri
Bridge. The locations of the short term recorders in Totara Lagoon were selected to
allow comparisons of data between the river mouth end, middle and northern end of the
lagoon over the sampling week (November 29
Data Collection
th to December 7th 2008). Short term
records were taken in Waikoriri Creek between December 8th and December 14th 2008,
and recorders were situated in the stretch of creek that drains the western edge of
Shearer Swamp.

Chapter Three: Methodology
74
Short term records were taken using two XR-620-CTDm water level recorders,
manufactured by Richard Brankner Research Ltd (RBR, 2009)., which recorded water
pressure (deciBars), temperature (° C) and conductivity (mS cm-1
Long term records were taken using two CT2X water level recorders (INW, 2009),
which also recorded water pressure (psi), temperature (° C) and conductivity (µS cm
) at ten minute
intervals for the entire sampling period. These were mounted on a metal support which
rested on the bed of the channel at the deepest point (Figure 3.3). The distance between
the channel bed and the recording equipment was 200 mm.
-1
No official weather monitoring station was available in close proximity to these study
sites to provide measurements of barometric pressure from which to correct water level
pressure results. This was achieved by using PT2X-BV barometric pressure sensor,
which was mounted on a nearby building on Bold Head Rd. This data was used to
correct both short and long term water pressure data from both sites.
)
at ten minute intervals over the sampling period. These were mounted vertically,
attached to a warratah (Figure 3.3) which was driven into the soft mud of the channel
bed in the case of Totara North. The Waikoriri Bridge recorder was initially mounted on
the south-west corner of the bridge buttress, but in early November the creek drained
suddenly through a breach in the Waikoriri Lagoon barrier approximately 100 m
downstream, leaving the recorder out of the water and above the high water mark. This
was rectified in early December, when the recorder was moved approximately 10 m
downstream and mounted on the pole of a retaining wall on the northern bank of the
stream.
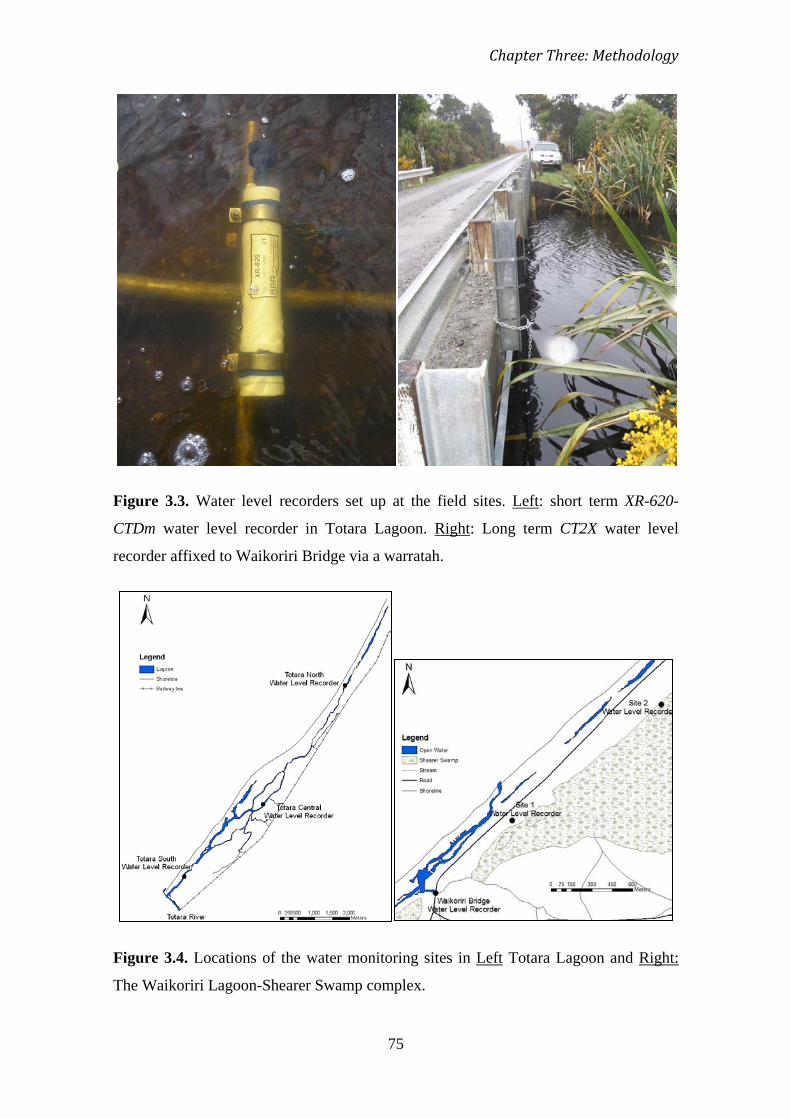
Chapter Three: Methodology
75
Figure 3.3. Water level recorders set up at the field sites. Left: short term XR-620-
CTDm water level recorder in Totara Lagoon. Right
: Long term CT2X water level
recorder affixed to Waikoriri Bridge via a warratah.
Figure 3.4. Locations of the water monitoring sites in Left Totara Lagoon and Right:
The Waikoriri Lagoon-Shearer Swamp complex.

Chapter Three: Methodology
76
Data for pressure, temperature and conductivity obtained from the recorders was first
downloaded and opened using RBR software for the XR-620-CTDm loggers and
Aquasoft for the CT2X loggers. Barometric pressure corrections were performed for the
long term pressure records by the Aquasoft software. All records were then exported
into Microsoft Excel for further analysis.
Analysis of Data
Units of measurement were standardised across all records, with pressure measurements
converted into Bars and conductivity measurements converted to mS cm -1. Short term
pressure records were then manually corrected for air pressure by subtracting the
recorded barometric pressure from the water pressure measurement. All water pressure
data was then converted to mmH2O and the measured distance from the channel bed to
the recording equipment was added to all data entries, thus giving the absolute water
depth. All data that was recorded while the equipment was out of the water (both before
and after the sampling period and when it was removed briefly for maintenance during
the sampling period) was removed prior to analysing the corrected data. These periods
were identified by water level measurements in the vicinity of 0.0 mmH2
Data was then graphed over time to assess trends in these parameters and to compare
measurements across sites within each field area. Data from the long term records
matching the time period of the short term records from each field site was extracted for
these comparisons, in addition to assessing the complete long term records. Maximum,
minimum and mean values were calculated for each parameter from each recording site.
In the case of Waikoriri Bridge, the record was split into two time periods: September to
November, and December to March. Data from these two time periods could not be
directly connected because the recorder location changed following the draining of
Waikoriri Creek.
O. In the case
of the Waikoriri Bridge long term recorder, this included removing the data for most of
November and early December.
The dataset taken from Waikoriri Bridge is subject to the greatest degree of systematic
error. As well as removing the data from when the water level recorder was out of the
water, the water depth from the bed to the surface cannot be calculated. This is because
Limitations and Errors
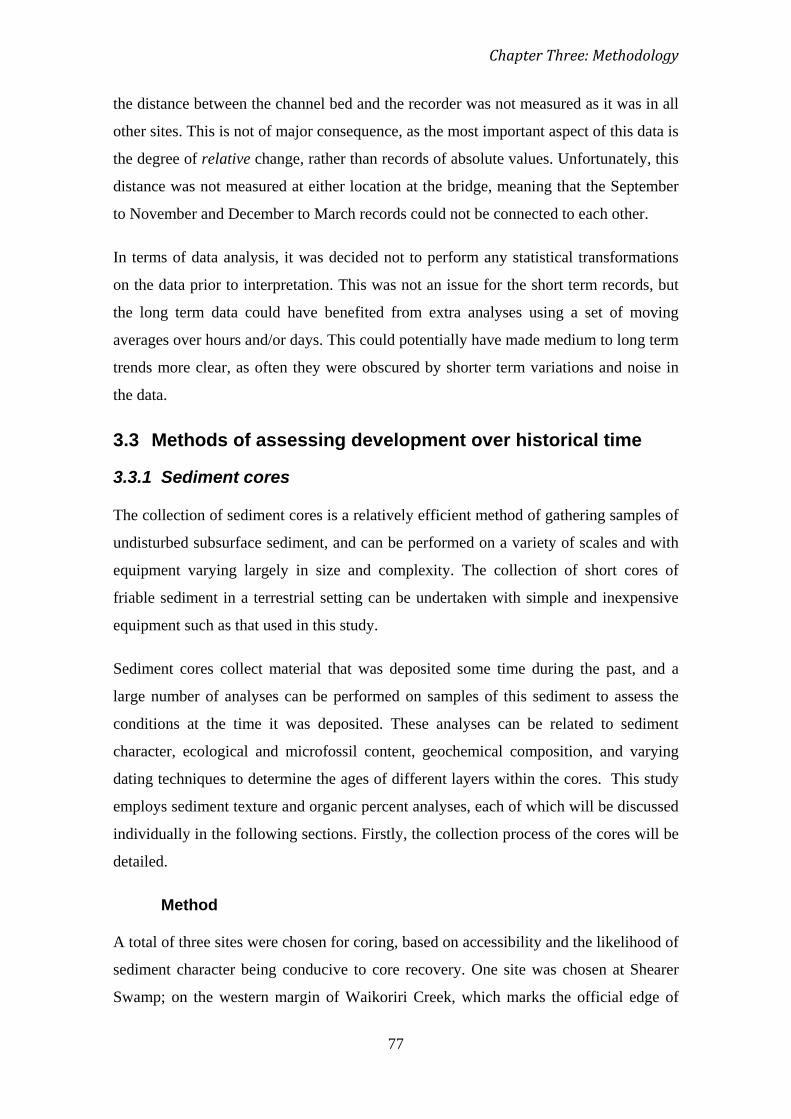
Chapter Three: Methodology
77
the distance between the channel bed and the recorder was not measured as it was in all
other sites. This is not of major consequence, as the most important aspect of this data is
the degree of relative change, rather than records of absolute values. Unfortunately, this
distance was not measured at either location at the bridge, meaning that the September
to November and December to March records could not be connected to each other.
In terms of data analysis, it was decided not to perform any statistical transformations
on the data prior to interpretation. This was not an issue for the short term records, but
the long term data could have benefited from extra analyses using a set of moving
averages over hours and/or days. This could potentially have made medium to long term
trends more clear, as often they were obscured by shorter term variations and noise in
the data.
3.3 Methods of assessing development over historical time
3.3.1 Sediment cores
The collection of sediment cores is a relatively efficient method of gathering samples of
undisturbed subsurface sediment, and can be performed on a variety of scales and with
equipment varying largely in size and complexity. The collection of short cores of
friable sediment in a terrestrial setting can be undertaken with simple and inexpensive
equipment such as that used in this study.
Sediment cores collect material that was deposited some time during the past, and a
large number of analyses can be performed on samples of this sediment to assess the
conditions at the time it was deposited. These analyses can be related to sediment
character, ecological and microfossil content, geochemical composition, and varying
dating techniques to determine the ages of different layers within the cores. This study
employs sediment texture and organic percent analyses, each of which will be discussed
individually in the following sections. Firstly, the collection process of the cores will be
detailed.
Method
A total of three sites were chosen for coring, based on accessibility and the likelihood of
sediment character being conducive to core recovery. One site was chosen at Shearer
Swamp; on the western margin of Waikoriri Creek, which marks the official edge of
Chapter Three: Methodology
78
Shearer Swamp. Due to the muddy nature of Waikoriri Creek and equipment
constraints, access to the more central reaches of the swamp was not possible. Two sites
were sampled on the eastern, landward edges of Totara Lagoon; at the northern and
southern ends respectively. Locations were documented using a handheld GPS unit
(Figure 3.5) (Appendix 4). Due to the gravelly nature of sediments at the confluence of
the lagoon and the Totara River, the southern core was taken approximately 2 km up the
channel from this point.
Cores were collected with a hammer corer, which is a form of gravity corer comprised
of a 1.5 m metal tube which is driven into the sediment by the manual operation of a
heavy piston on the top (Figure 3.6). Several cores were taken from each site at intervals
of 2 to 5 m to ensure the consistent character and lateral continuity of the observed
sedimentary units. Surface sediments were infiltrated by roots in the top several
centimetres, which were discarded prior to sampling. The depth of cores was
constrained by the presence of coarse sand layers at all three sites, which prevented the
hammer corer from penetrating further. Core compaction was estimated by measuring
the difference between hole depth and core length. Once recovered from the ground,
cores were ejected from the core tube into plastic half-round tubes and shrink wrapped
for ease of transport and to prevent contamination (Figure 3.6). In the laboratory, cores
were split lengthwise using copper wire and stored in a refrigerator. Cores were
photographed and stratigraphy was examined and logged prior to sub-sampling for the
analyses in the following sections. A single, representative core from each of the three
sites was used for stratigraphic logs and analyses.

Chapter Three: Methodology
79
Figure 3.5. Locations of sediment cores taken from (a) Totara Lagoon and (b) Shearer
Swamp.
Figure 3.6. Left: Photograph showing the process of taking a sediment core from
Shearer Swamp with a hammer corer. Right: Ejecting the core into a plastic tube
following collection.
(a)
(b)
Chapter Three: Methodology
80
Limitations and errors
The primary limitation in the collection of cores for this project was the inability to
collect longer cores from a larger number of locations, due to equipment and time
constraints. The diverse nature of sediment types in these environments made selection
of equipment difficult, as each type of corer performs best in a relatively specific type of
sediment. Initially a vibracorer was to be used, as this would work well in wetland and
more sandy areas; however practical constraints meant that it could not be transported
into the field sites. The hammer corer was simpler to use and was suited to the peat and
mud layers of Shearer Swamp and lower Totara Lagoon. However, the presence of sand
layers below depths of 0.5 m in all cores precluded the collection of longer cores. In
addition to this issue, the very soft surface sediments of Shearer Swamp and northern
Totara Lagoon were unable to be sampled, as the corer relies on resistance from the
sediment to push the piston up inside the tube, and so the sediment was pushed to the
side rather than forming part of the core sample. This limitation could not be quantified,
but does not affect the integrity of the core as a whole. A similar source of error is that
of core compaction, which was calculated for each core as the difference between core
length and hole depth. This difference results not entirely from the compaction of
unconsolidated or poorly consolidated sediments in the sample, but also from the
possible loss of downcore material in a similar manner to that of the soft surface
sediments.
3.3.2 Sediment texture analysis
Sediment texture is a broad term that describes the character of sediment, and includes
parameters such as grain size distribution, shape, sphericity, roundness and rollability
(Lewis and McConchie, 1994). These attributes are a function of the distribution of
energy in the depositional environment, the type of transport processes and the
timeframe within which they operate on the sediment, and character of the source rocks.
Thus results of sediment texture analysis can be used to infer the type of depositional
environment (Lewis and McConchie, 1994).
Each of the above attributes can be measured individually via separate techniques, but
sediment analysis is often restricted to size determination. The standard descriptive
grain size scale is the Udden-Wentworth scale, which is presented in Figure 3.7 with
associated phi and millimetre conversions. Particle size is difficult to define in absolute
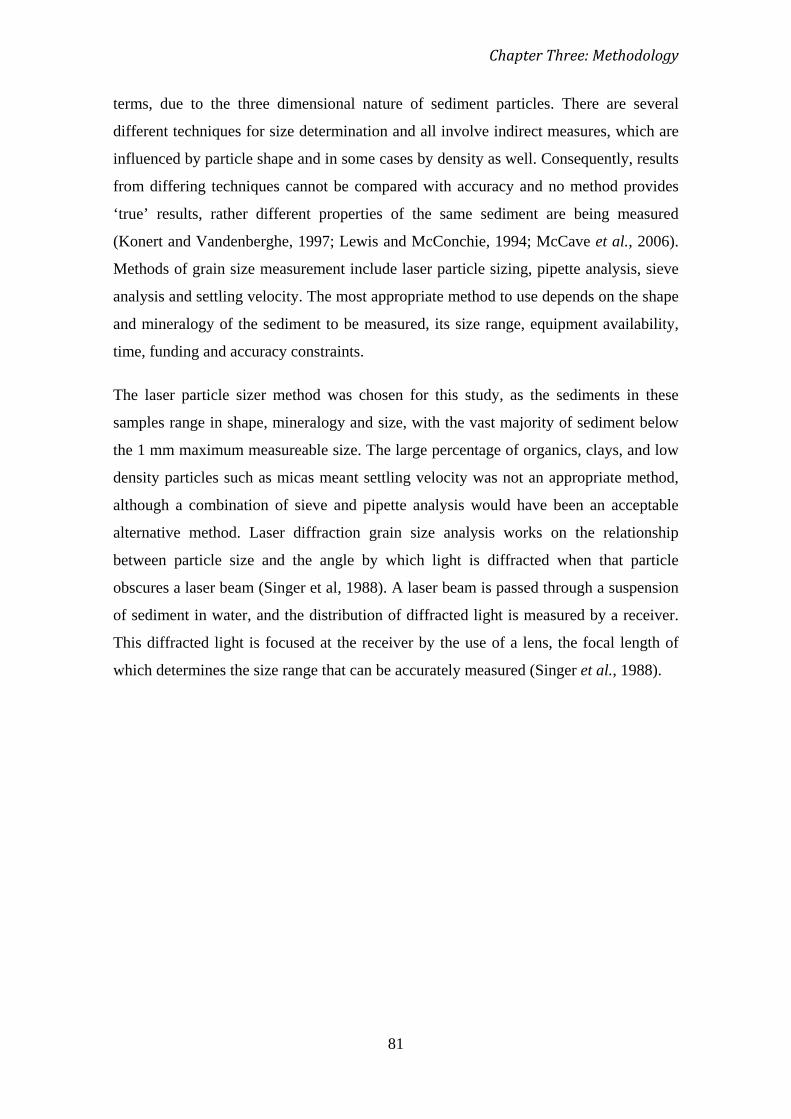
Chapter Three: Methodology
81
terms, due to the three dimensional nature of sediment particles. There are several
different techniques for size determination and all involve indirect measures, which are
influenced by particle shape and in some cases by density as well. Consequently, results
from differing techniques cannot be compared with accuracy and no method provides
‘true’ results, rather different properties of the same sediment are being measured
(Konert and Vandenberghe, 1997; Lewis and McConchie, 1994; McCave et al., 2006).
Methods of grain size measurement include laser particle sizing, pipette analysis, sieve
analysis and settling velocity. The most appropriate method to use depends on the shape
and mineralogy of the sediment to be measured, its size range, equipment availability,
time, funding and accuracy constraints.
The laser particle sizer method was chosen for this study, as the sediments in these
samples range in shape, mineralogy and size, with the vast majority of sediment below
the 1 mm maximum measureable size. The large percentage of organics, clays, and low
density particles such as micas meant settling velocity was not an appropriate method,
although a combination of sieve and pipette analysis would have been an acceptable
alternative method. Laser diffraction grain size analysis works on the relationship
between particle size and the angle by which light is diffracted when that particle
obscures a laser beam (Singer et al, 1988). A laser beam is passed through a suspension
of sediment in water, and the distribution of diffracted light is measured by a receiver.
This diffracted light is focused at the receiver by the use of a lens, the focal length of
which determines the size range that can be accurately measured (Singer et al., 1988).
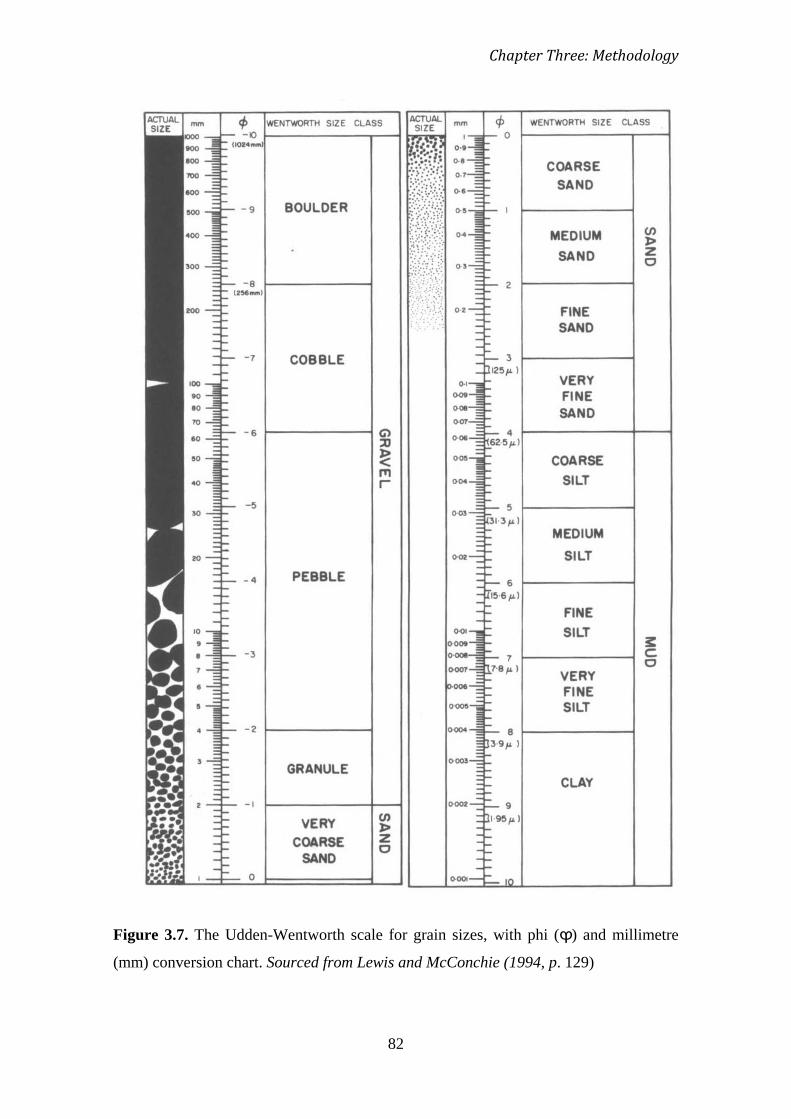
Chapter Three: Methodology
82
Figure 3.7. The Udden-Wentworth scale for grain sizes, with phi (ϕ) and millimetre
(mm) conversion chart. Sourced from Lewis and McConchie (1994, p. 129)
Chapter Three: Methodology
83
Method
A total of three cores were taken from each site, and one representative core was chosen
for analysis from each. Cores were consistent within sites in terms of observed
stratigraphy. A total of 12 samples, 4 from each core, were taken for grain size analysis.
These were sampled from depths of 30, 150, 300, and 450 mm. Samples were oven
dried at 50 °C overnight, then dry sieved through a 1 mm sieve to remove material too
coarse to be analysed by the laser sizer unit. No further pre-treatment of samples was
performed. A Micromeritics Saturn Digisizer 5200 was used in the grain size analysis,
capable of measuring particles from 0.0001 to 1.0 mm in equivalent spherical diameter
(Micromeritics, 2009a). Samples of approximately 1 cm3
Statistical analyses on these results were performed to obtain the maximum, minimum
and mean grain size (µm), standard deviation, mode of the sample distributions. The
standard deviation provides a measure of the degree of sorting of the sample (Folk,
1974). For coarse, sandy samples (Samples, 8, 10, and 12), the second and third runs
were disregarded. This was necessary because the data obtained was clearly erroneous,
giving distributions clustered around the very low end of the scale (0.0001 mm). This is
likely due to the weight of the particles causing them to sink more easily, thus not being
read by the machine after the first run. The grain size figures of each sample were
correlated to the Udden-Wentworth grain size chart.
were fed slowly into the
machine until a beam obscuration of between 13 and 20% was reached. The volume of
sediment this required increased with coarser samples. The machine then passed a laser
beam through the suspended sample at 10 different angles and measured the diffraction
pattern obtained. Each sample was run through the machine three times, and the results
averaged to provide the final distribution. The distributions are calculated automatically
from the diffraction patterns using Mie Theory, which states that the intensity of the
light reaching the receptor is a function of particle size, focal length of the lens, angle
and wavelength (Micromeritics, 2009b).
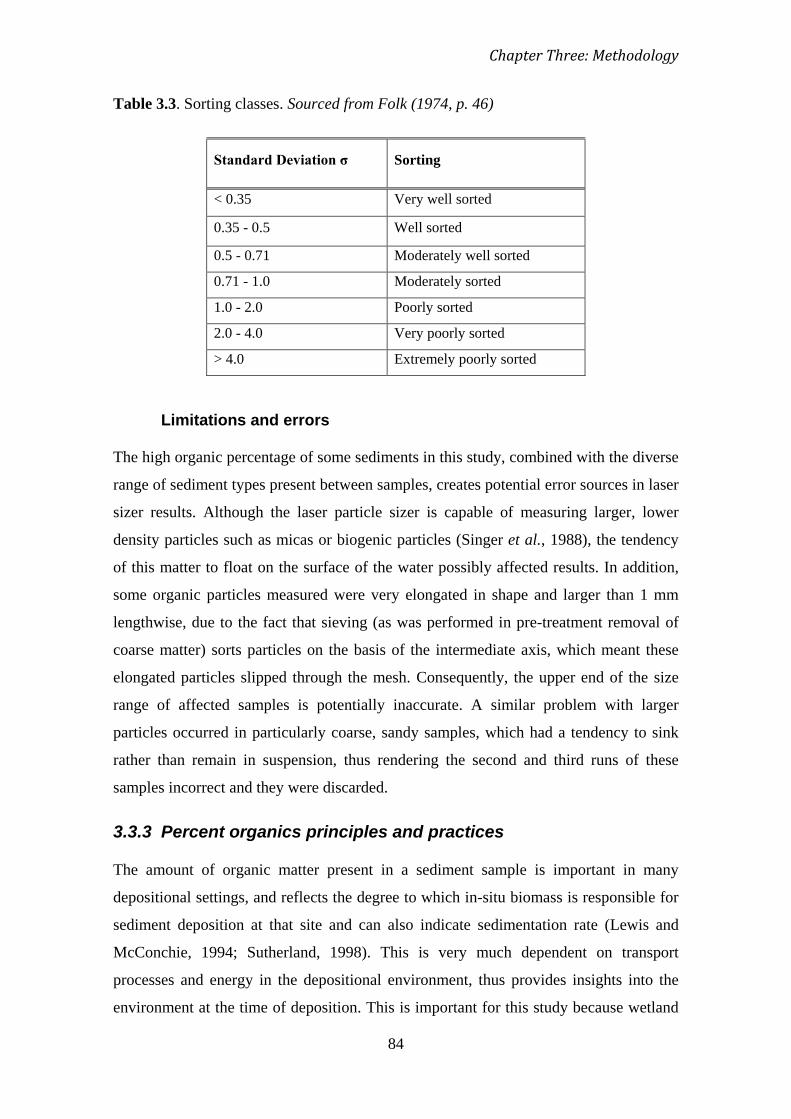
Chapter Three: Methodology
84
Table 3.3. Sorting classes. Sourced from Folk (1974, p. 46)
Standard Deviation σ Sorting
< 0.35 Very well sorted
0.35 - 0.5 Well sorted
0.5 - 0.71 Moderately well sorted
0.71 - 1.0 Moderately sorted
1.0 - 2.0 Poorly sorted
2.0 - 4.0 Very poorly sorted
> 4.0 Extremely poorly sorted
Limitations and errors
The high organic percentage of some sediments in this study, combined with the diverse
range of sediment types present between samples, creates potential error sources in laser
sizer results. Although the laser particle sizer is capable of measuring larger, lower
density particles such as micas or biogenic particles (Singer et al., 1988), the tendency
of this matter to float on the surface of the water possibly affected results. In addition,
some organic particles measured were very elongated in shape and larger than 1 mm
lengthwise, due to the fact that sieving (as was performed in pre-treatment removal of
coarse matter) sorts particles on the basis of the intermediate axis, which meant these
elongated particles slipped through the mesh. Consequently, the upper end of the size
range of affected samples is potentially inaccurate. A similar problem with larger
particles occurred in particularly coarse, sandy samples, which had a tendency to sink
rather than remain in suspension, thus rendering the second and third runs of these
samples incorrect and they were discarded.
3.3.3 Percent organics principles and practices
The amount of organic matter present in a sediment sample is important in many
depositional settings, and reflects the degree to which in-situ biomass is responsible for
sediment deposition at that site and can also indicate sedimentation rate (Lewis and
McConchie, 1994; Sutherland, 1998). This is very much dependent on transport
processes and energy in the depositional environment, thus provides insights into the
environment at the time of deposition. This is important for this study because wetland
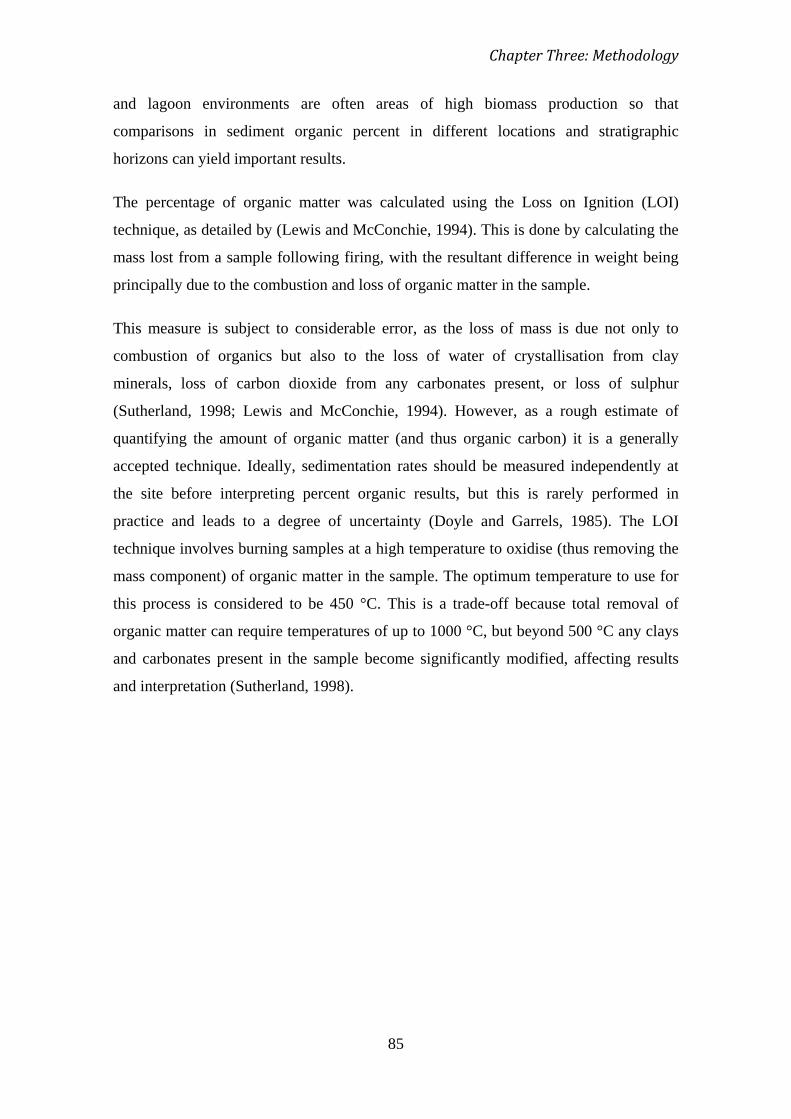
Chapter Three: Methodology
85
and lagoon environments are often areas of high biomass production so that
comparisons in sediment organic percent in different locations and stratigraphic
horizons can yield important results.
The percentage of organic matter was calculated using the Loss on Ignition (LOI)
technique, as detailed by (Lewis and McConchie, 1994). This is done by calculating the
mass lost from a sample following firing, with the resultant difference in weight being
principally due to the combustion and loss of organic matter in the sample.
This measure is subject to considerable error, as the loss of mass is due not only to
combustion of organics but also to the loss of water of crystallisation from clay
minerals, loss of carbon dioxide from any carbonates present, or loss of sulphur
(Sutherland, 1998; Lewis and McConchie, 1994). However, as a rough estimate of
quantifying the amount of organic matter (and thus organic carbon) it is a generally
accepted technique. Ideally, sedimentation rates should be measured independently at
the site before interpreting percent organic results, but this is rarely performed in
practice and leads to a degree of uncertainty (Doyle and Garrels, 1985). The LOI
technique involves burning samples at a high temperature to oxidise (thus removing the
mass component) of organic matter in the sample. The optimum temperature to use for
this process is considered to be 450 °C. This is a trade-off because total removal of
organic matter can require temperatures of up to 1000 °C, but beyond 500 °C any clays
and carbonates present in the sample become significantly modified, affecting results
and interpretation (Sutherland, 1998).
Chapter Three: Methodology
86
Method
Twelve samples were processed for LOI analysis and were taken from the sediment
cores. Four subsamples of approximately 1 cm3
3.4 Summary
were taken from each core, at the same
depths sampled for diatom analyses (30, 150, 300 and 450 mm below the surface).
Samples were oven dried for 24 hours at a temperature of 105 °C. This removes
moisture from the sample prior to initial weighing. The mass of each dried sample
(weighed in a crucible of known mass) was determined to an accuracy of 0.01 g, and
then samples were placed in a muffle furnace at 450 °C for 18 hours. Potential for cross
contamination is acknowledged, as when sizeable portions of organic matter are present
and thus oxidised, ash particles can float between containers in the furnace and affect
mass changes. Following removal from the furnace, the crucibles were left to cool to
room temperature before weighing again. The difference in mass of each sample
between initial weight and weight following ignition was then converted into a
percentage of total sample weight.
This chapter detailed the methodology employed in this study, first detailing the
principles and theory of each technique, followed by the processes followed in this
particular project. A summary flowchart illustrating the timeframes to which each
method pertains, and the results gained by each type of analysis is presented below
(Figure 3.8).
Techniques employed to assess the present geomorphology includes GNSS surveys of
representative sections of Totara Lagoon and the Shearer Swamp-Waikoriri Lagoon
Complex. Digital Elevation Models of the surveyed areas were constructed using
ArcGIS, which were then analysed for trends in topography and dune shape, height and
steepness. The hydrology of the two systems was investigated over a week-long period,
during which measurements of conductivity, water temperature and water level were
made at ten minute intervals at three sites within Totara Lagoon and three sites within
Waikoriri Creek.
Decadal-scale dynamics of Totara Lagoon and Waikoriri Lagoon were investigated
through analysis of aerial photographs, covering the period from 1948 to 2006.
Photographs were orthorectified and georeferenced to the New Zealand Map Grid
Chapter Three: Methodology
87
(NZMG) datum, and digitisations of the lagoon channel configuration and outlet
position were created using ENVI and ArcGIS software programmes. From these,
measurements of outlet offset and rates of outlet migration were calculated and trends in
outlet migration inferred.
Sediment cores and associated analyses were used to investigate the development of
selected areas of each system over a longer time period, covering up to 150 years. Cores
were taken from two sites in Totara Lagoon (north and south) and one site from Shearer
Swamp. Core stratigraphy was logged, and sediment texture analyses were conducted
using a Micromeritics Saturn Digisizer 5200 for selected core depths. Organic
percentage of samples was also measured using the Loss on Ignition technique.
The results gained from these techniques and analyses are presented in the following
three chapters.

Chapter Three: Methodology
88
Figure 3.8. Summary flowchart of the methods employed in this project, the timeframes to which they apply, and the information provided by
each technique.
Timeframe of Change
Days to months
Hydrological monitoring
Conductivity(Salinity)
Degree of tidal influence
Water depth
Water temperature
GNSS survey Current topography
Years to decadesAerial
photograph analysis
Outlet migration
Channel structure
Decades to centuries Sediment cores
Sediment texture analysis
Energy of past environment
Loss on ignition Organic percent of sediment

60
CHAPTER THREE
Methodology
3.1 Introduction
Due to their dynamism and multiple facets, coastal features and environments are
difficult to investigate, often requiring a combination of techniques to capture a
comprehensive set of data. Recent advances in technology have made the study of
coastal environments much more accessible, allowing data collection on far greater
spatial and temporal scales. This chapter discusses the individual techniques used in this
study and details the way in which they are applied. Firstly, the methodology employed
to document the current and recent geomorphology is presented in Section 3.2, followed
by techniques pertaining to the development of the study sites over recent centuries in
Section 3.3. Each of these two major sections begins with a review of the principles and
techniques involved in the methodology, followed by details of the method as applied in
this study.
Fieldwork was undertaken over two main periods. Ground surveying and short-term
water level recording was performed during the period December 1st – 16th 2008. This is
important to note, as these coastal systems are very dynamic and can change
substantially in response to seasonal weather trends and random storm events. During
this period, a single storm occurred on December 6th. Sediment cores were taken on a
second visit during the period March 2nd – 7th 2009. Fieldwork included visual
observations and photographs of the field sites, including outlet position, form, and any
other features of interest. A third site visit took place over March 20th – 22nd. No
quantitative measures were taken during this time, but observations about the lagoons
and outlet position and form were made.
61
3.2 Recent geomorphology
3.2.1 Topographic survey principles and practices
Ground surveys of the topography of a given area and its features remains one of the
fundamental tools for understanding its geomorphology and processes, and for
monitoring changes in coastal landforms over time. In the past, surveys were performed
with a total station, which although potentially very accurate, can be a time consuming
task that is spatially restrictive and labour intensive. With the advent of GPS and GNSS
systems, and subsequent GIS analysis packages, surveying has become applicable on a
larger spatial scale and in greater detail. Data collection by ground survey techniques
remains more labour intensive than remote methods such as aerial or satellite imagery
analyses (e.g. LIDAR), which are superior for analysing large areas of coastline, but
these may require validation and calibration by associated ground surveys (Pranzini,
2007).
Data collected from GPS ground surveys can be used to create a topographic map of the
survey area, or a digital elevation model (DEM), a three dimensional digital
representation of the topography and landforms. The method employed to achieve this
is critical to the accuracy and applicability of the resulting model. Survey data is in the
form of ‘points’, that is; individual points taken along a transect or surrounding a
feature, which must be converted into a continuous surface by the process of
interpolation (Andrews et al., 2002). Interpolation uses the characteristics of the points
collected to fill in the areas between the points, which can be achieved in several
different ways. Commonly used methods of gridding are kriging, inverse distance
weighted, nearest neighbour and spline (Andrews et al., 2002). There is no set formula
for determining which method will yield the most accurate DEM, and often several
methods of interpolation, grid size, and sampling density need to be explored and
compared.
Another method of producing a three dimensional model is by use of a triangulated
irregular network (TIN), which triangulates adjacent points to create a continuous
surface. This method works particularly well when survey data is irregular rather than
collected along a grid, and when a relatively good density of points is achieved (Lo and
Yeung, 2006). A TIN is not based on a grid and as it merely involves forming planes
between data points, no interpolation is required (Andrews et al., 2002; Kumler, 1994).
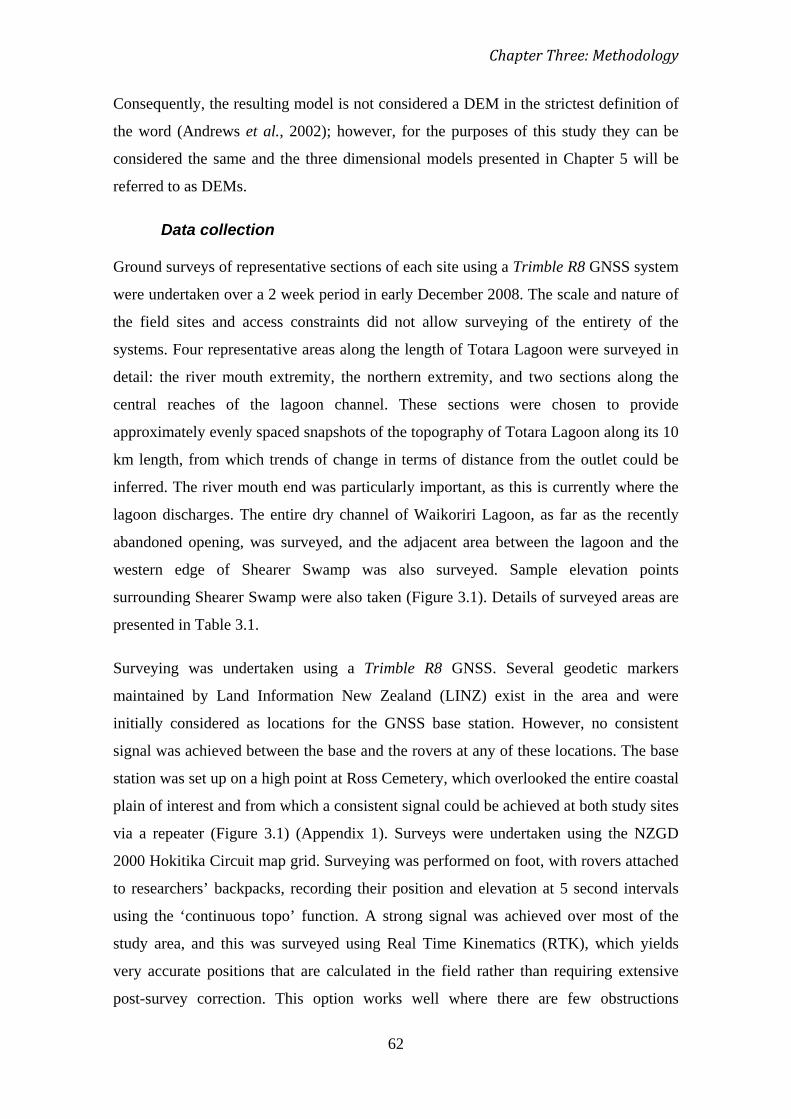
Chapter Three: Methodology
62
Consequently, the resulting model is not considered a DEM in the strictest definition of
the word (Andrews et al., 2002); however, for the purposes of this study they can be
considered the same and the three dimensional models presented in Chapter 5 will be
referred to as DEMs.
Data
Ground surveys of representative sections of each site using a Trimble R8 GNSS system
were undertaken over a 2 week period in early December 2008. The scale and nature of
the field sites and access constraints did not allow surveying of the entirety of the
systems. Four representative areas along the length of Totara Lagoon were surveyed in
detail: the river mouth extremity, the northern extremity, and two sections along the
central reaches of the lagoon channel. These sections were chosen to provide
approximately evenly spaced snapshots of the topography of Totara Lagoon along its 10
km length, from which trends of change in terms of distance from the outlet could be
inferred. The river mouth end was particularly important, as this is currently where the
lagoon discharges. The entire dry channel of Waikoriri Lagoon, as far as the recently
abandoned opening, was surveyed, and the adjacent area between the lagoon and the
western edge of Shearer Swamp was also surveyed. Sample elevation points
surrounding Shearer Swamp were also taken (Figure 3.1). Details of surveyed areas are
presented in Table 3.1.
collection
Surveying was undertaken using a Trimble R8 GNSS. Several geodetic markers
maintained by Land Information New Zealand (LINZ) exist in the area and were
initially considered as locations for the GNSS base station. However, no consistent
signal was achieved between the base and the rovers at any of these locations. The base
station was set up on a high point at Ross Cemetery, which overlooked the entire coastal
plain of interest and from which a consistent signal could be achieved at both study sites
via a repeater (Figure 3.1) (Appendix 1). Surveys were undertaken using the NZGD
2000 Hokitika Circuit map grid. Surveying was performed on foot, with rovers attached
to researchers’ backpacks, recording their position and elevation at 5 second intervals
using the ‘continuous topo’ function. A strong signal was achieved over most of the
study area, and this was surveyed using Real Time Kinematics (RTK), which yields
very accurate positions that are calculated in the field rather than requiring extensive
post-survey correction. This option works well where there are few obstructions
63
between the base or repeater signal and the rovers, such as vegetation, hills or scarps.
The middle and northern reaches of Totara Lagoon were unable to be surveyed using
RTK. In the northern reaches, no signal was received and so the PPK (Post-Processed
Kinematic) survey option was used, whereby the rovers record positions autonomously
in the field and data obtained requires extensive post-processing in a GPS software
programme. Where the signal was intermittent the ‘RTK and infill’ option was used,
which uses RTK when a signal can be received, but reverts to PPK when it is lost. In
addition to a general survey of the area, features of interest were mapped in detail.
These included the lagoon waterline and seaward shoreline (when appropriate), heights
and profiles of adjacent dunes, cusps, scarps, and depth of the lagoon channel when
possible. Where possible, transects spanning the seaward dunes, lagoon channel and
adjacent landward morphology were surveyed. Channel depth was not measured at the
middle and northern sites of Totara Lagoon, due to the conditions of the channel bed. In
the central and northern reaches, the channel bed was covered by a very thick layer of
mud and organic sludge (measured at over 1.5 m at Totara Central North) which made
surveying too dangerous to attempt.

Chapter Three: Methodology
64
Figure 3.1. Location maps showing the surveyed areas in (a) Totara Lagoon and (b)
The Shearer Swamp-Waikoriri Lagoon complex. The base station location did not
change between the two study areas.
(a)
(b)
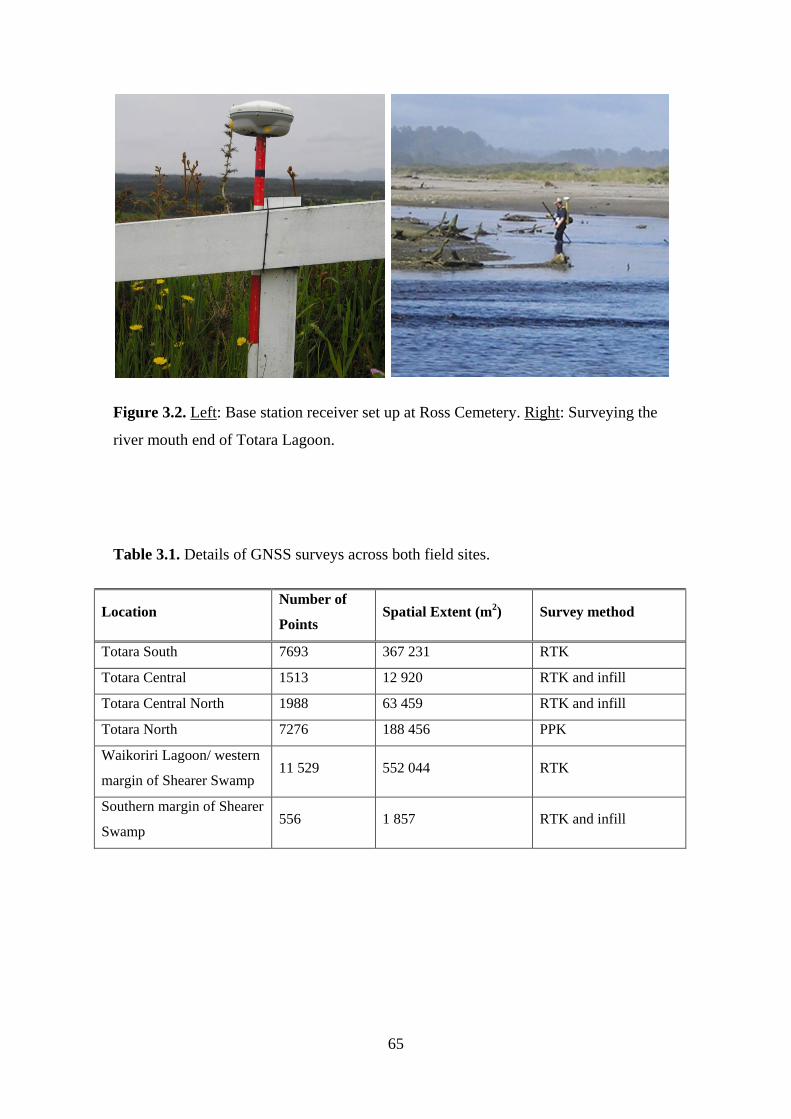
65
Figure 3.2. Left: Base station receiver set up at Ross Cemetery. Right
: Surveying the
river mouth end of Totara Lagoon.
Table 3.1. Details of GNSS surveys across both field sites.
Location Number of
Points Spatial Extent (m2 Survey method )
Totara South 7693 367 231 RTK
Totara Central 1513 12 920 RTK and infill
Totara Central North 1988 63 459 RTK and infill
Totara North 7276 188 456 PPK
Waikoriri Lagoon/ western
margin of Shearer Swamp 11 529 552 044 RTK
Southern margin of Shearer
Swamp 556 1 857 RTK and infill

Chapter Three: Methodology
66
Data collected in the field was transferred from the GNSS hand units to a laptop and
converted to ASCII format using the Trimble Geomatics Office programme. An initial
three dimensional model of the data was produced in Terramodel 10.4, which allowed
erroneous data points and other anomalies to be identified. These were located and
removed in the associated Microsoft excel file. Due to the position of the base station on
an unknown point (i.e. not a LINZ geodetic marker), the base position required
correction before data in the field could be corrected. This was achieved by constructing
a baseline between the base station location and the location of the LINZ base station in
Hokitika, following which the data collected in the field was then adjusted based on the
corrected base station position. The ASCII files were later transformed for ArcGIS
analysis into shapefiles (.shp), database files (.dbf), and ArcView database index files
(.shx).
Data processing
Following correction and file conversion, the data was imported into ArcGIS as a single
large dataset covering both field sites. Firstly, the entire dataset required correction for
field surveyor heights, which had created systematic errors in elevation. Due to the
general thoroughness of surveying and density of points in each survey section, the TIN
method produced the most representative DEM of the study site. Kriging and Inverse-
distance-weighted interpolation methods were also trialled, but these resulted in
inaccurate representations and smoothing of features such as scarps and steep dunes.
Following the DEM construction, a number of erroneous points of negative elevation
were identified and removed in ArcGIS and the model redrawn. Because the TIN
method creates triangular planes between adjacent points, there was potential for areas
of incorrect interpolation where point density was low and when points across large
distances between survey sites were triangulated. To remedy this problem and reduce
error, polygons were constructed around each survey area to eliminate outlying points
and create individual DEMs of Waikoriri Lagoon and the adjacent dune ridges, Totara
South, Totara Central, Totara Central North, and Totara North.
GIS analysis
The DEMs were then compared to photographs of the morphology to assess the degree
to which the areas were accurately represented by the models. Due to the complexity of
the dunes in the northern reaches of Totara Lagoon, a degree of inaccuracy was
67
accepted and noted. The DEMs were then visually assessed in conjunction with field
notes and photographs taken while surveying, and features of interest identified. From
this DEM, several profiles were graphed across the seaward dune ridges adjacent to
Totara and Waikoriri Lagoons and across the relic dune ridges between Waikoriri
Lagoon and Shearer Swamp. These are two dimensional cross-sections oriented parallel
to the dune crest, which allow differences in dune heights steepness and morphology
between different profile locations to be quantified.
The extent and accuracy of the point network covering the survey area is constrained by
accessibility. Where researchers were unable to thoroughly cover a feature, the DEM of
that feature is inaccurate due to the triangulation of insufficient points. This applies
specifically to the lagoon channel in the middle and northern reaches of Totara Lagoon,
and to some areas of the dunes surrounding both Totara Lagoon and Waikoriri Lagoon.
The muddy nature of the lagoon channel bed and swampy margins in some places was a
safety issue, and thus surveys extend only as far as the water edge, meaning the surface
in the centre of the Totara Lagoon central and northern DEMs signifies the elevation of
the water surface, rather than the channel morphology. This was not an issue in
Waikoriri Lagoon, where the channel was dry during surveying, or in Totara South,
where the channel could be waded. Heights of well established dune ridges were
underestimated in places, due to large amounts of vegetation preventing accurate
surveying of the crest. This occurred in the landward dunes of Waikoriri Lagoon, and in
the northern reaches of Totara Lagoon on both sides. Areas that have been affected by
these access issues are highlighted in the following chapter. This does not affect profile
constructions or volumetric analyses, as these are based on surveyed transects of actual
point data, rather than relying on the interpolation of the DEM.
Limitations and errors
One limitation of surveys in this area is the lack of accessible and accurate geodetic
markers. Not only did this provide a problem in choosing a location for the base station,
but it made post-processing of the data more difficult. To tie the vertical dimensions of
the DEM to local mean sea level, at least 4 of these known points were required, which
was not possible to obtain in the area. Consequently, the initial survey results were in
terms of height above a global ellipsoid, meaning elevation data could be used in a
relative form but not in terms of absolute elevation above mean sea level. As a solution
Chapter Three: Methodology
68
to this problem, an approximation of sea level elevation in the area was calculated from
the geodetic marker information provided by LINZ, which gives elevation above mean
sea level for each marker. The sea level elevations at each marker location were
averaged to provide a linear approximation of mean sea level elevation over the entire
survey area, then the difference was applied to the entire ArcGIS dataset. This is not
ideal, as it does not account for the elliptical nature of the Earth’s surface; however, due
to the close proximity of the survey areas this has a minimal effect on results.
3.2.2 Aerial photograph analysis: principles and practices
The use of aerial photography to assess coastal change over time has been practiced and
refined for over fifty years. Early photographs were simple black and white images of
low resolution, which then moved to higher resolution black and white pictures and the
introduction of stereographic pairs. Colour photographs became accessible from the
1980s (Lewis and McConchie, 1994). Stereo pairs of images can be used to look at the
topography of the area in the photograph and construct topographic contours, and are
useful in cartography, management and planning, vegetation and species distribution
mapping, and to detect large scale geological features that are difficult to map from the
ground (Lewis and McConchie, 1994; Andrews et al., 2002). Aerial photographs can be
taken either vertically or obliquely, of which vertical photographs are the most useful
for scientific mapping purposes.
The use of aerial photographs for mapping shoreline change and changes in vegetation
cover in coastal areas is a well established method that has been applied and refined
over the past 70 years by coastal planners, engineers and scientists (Boak and Turner,
2005). More recently, satellite imagery has started to replace aerial photography as the
primary method of collecting this type of data where budgets and coverage allow.
However, aerial photographs remain a relatively cheap and simple-to-analyse record of
historical change in coastal zones.
Significant distortions exist in aerial photographs, which must be corrected prior to their
use for mapping purposes. This correction process is known as orthorectification. This
distortion includes radial distortion (which increases with distance from the
photographic centre); relief distortion from topographic variation; tilt and pitch changes
of the aircraft; lens distortion in older photographs; and scale variations resulting from
69
altitude changes along the flight line (Gorman et al., 1998; Boak and Turner, 2005; Al-
Tahir and Ali, 2004). Because coastal areas are generally flat, relief distortion is
negligible and can usually be ignored (Al-Tahir and Ali, 2004).
This study utilises a collection of aerial photographs taken between 1948 and the
present day, with the aim of documenting changes in outlet migration and visual
changes in the systems over this period. Photographs sourced were taken on an
approximately decadal time scale and covered the following years: 1948, 1963, 1972,
1976, 1981, 1986, 2002, 2005 and 2006. Images from 1988 onwards are high resolution
colour photographs. Further details of the images used are presented in Appendix 2. The
pre-2005 photographs were obtained in hard copy and subsequently scanned at a
resolution of 700 dpi and saved as digital (.jpg) files for GIS analysis. Due to the large
spatial extent of the study sites, several photographs were required to cover the whole
area.
Data collection and orthorectification
The photographs obtained in hard copy were unorthorectified, and for the Totara
Lagoon site this was performed in ENVI by georeferencing each photograph to 2
orthorectified digital images produced by LINZ (2002) (Area J33 – Kaniere, LINZ,
2009b). Georeferencing involved matching several visible and stable points (referred to
as control points) on the orthorectified images to those same points in the other images,
then warping the distorted image to fit the orthorectified reference images. These
orthorectified images obtained from LINZ covered the Totara Lagoon area, and were
high resolution colour photographs taken in 2002. For the Shearer Swamp-Waikoriri
Lagoon complex no orthorectified images were available, but the 2002 image (the
clearest and highest resolution image available of the area) was georeferenced to a GIS
shapefile of roads in the area (NZ 1:50 000 topographic survey). From this, images
taken in earlier years were georeferenced and warped to control points located on the
2002 image using ENVI, by the same process as used for Totara Lagoon images. Due to
the dynamic nature of the coastal zone and the lack of visible engineered structures in
the study areas, control points were usually road intersections, bridges, or lone
buildings. At least 4 control points were located on each image, a sufficient number to
provide a satisfactory orthorectification, and these were distributed as evenly as possible
across the entire image. As a part of this process, the images were spatially referenced
Chapter Three: Methodology
70
to the New Zealand Map Grid (NZMG) datum, allowing results to be quantified
spatially in terms of location and distance in metres.
No further preparation was necessary for the Waikoriri Lagoon images prior to the
following analysis, as only a single image from each survey period was required to
cover the entire lagoon area. Totara Lagoon required between 2 and 5 images from each
survey to cover the entire lagoon. In order to create a single georeferenced image of the
lagoon for each survey, the mosaicking tool in ENVI was used to stitch the individual
images together while maintaining their position in coordinate space. For this to be
effective, and to minimise error, the images needed to overlap approximately 30% with
adjacent images.
The final images of each site were compared visually and qualitative changes in outlet
position and channel structure across the study period were noted. A digital
representation of the lagoon area and shoreline position for each survey year were
created in ENVI using the ‘Region of Interest’ tool, then the resulting polygon/line files
were exported into ArcGIS as shapefiles for further spatial analysis. The outlet offset
was measured in metres from the Totara River mouth for Totara Lagoon, and from the
Waikoriri-Granite Creek confluence in the case of Waikoriri Lagoon. The surface area
of Waikoriri Lagoon at each survey was calculated in ArcGIS from the individual
digitisation polygons. This was not performed for Totara Lagoon, due to the size of the
lagoon and the large errors that would be introduced as a consequence.
Analysis of lagoon change
This process was fraught with challenges in the orthorectification/georeferencing
process, due to the nature of the study sites and poor quality of some photographs. In
common practice, photographs are orthorectified and georeferenced in separate
processes, using a combination of digital techniques and collection of control points in
the field. This was not possible for either Totara Lagoon or Waikoriri Lagoon, due to
access constraints in the field and lack of features such as buildings, roads and
prominent rocky areas that could act as GCPs. The roads in the area also underwent
several realignments and upgrade works over the period covered by the surveys,
meaning even road intersection positions were sometimes not accurate enough for this
Limitations and errors
71
purpose. The dynamic coastal nature of these sites also meant that features in the
immediate vicinity of the lagoon were very changeable and thus not suitable as GCPs.
For Totara Lagoon, GCPs were clustered landward of the lagoon in most cases. Some
stable patches of vegetation were able to be used in later photographs, but these were
not visible at a suitable resolution in earlier images. To obtain the most accurate result
from this process, GCPs should be distributed across the entire image, particularly the
area of interest. This was not possible in the beach area or where ocean covered a large
part of the photograph. This was of particular concern in the 1976 images, where the
scale was so small that individual photographs covered only the lagoon area. A large
portion of the potential error in the georeferencing process for Totara Lagoon arose
from human interpretation of features and accuracy (related to photograph resolution).
This was more problematic for the earlier images. Parameters such as pixel size, tone,
texture, shade, shape and position are important considerations for the researcher
performing the analysis (Boak and Turner, 2005; Dahdouh-Guebas et al., 2006).
The georeferencing process for Waikoriri Lagoon was further complicated by the
absence of an existing orthorectified, georeferenced image from which to reference
other raw images. The GIS road file that was used to reference the 2002 image was
sourced from the NZ Topographic survey 1:50 000 data, which is accurate to ±22 m
horizontally and ±5 m vertically (LINZ, 2008). This introduced a large source of
potential error, which was then compounded by the same error sources as occurred in
the Totara Lagoon images.
Once again, human interpretation and manual errors could have arisen during the
digitisation of the lagoon process from the orthorectified images. In order to minimise
these errors in the quantitative results, measurements of outlet position were made
directly from the photographs rather than from the digitisations. In addition, the exact
dimensions of the lagoon and outlet position fluctuate in response to tidal and weather
factors, so quantitative data relating to outlet position and lagoon surface area were
rounded to approximate values (nearest 50 m).
A common error noted in aerial photograph analysis is the issue of vertical displacement
(Gorman et al., 1998; Dahdouh-Guebas et al., 2006); however, this was not a concern
for either of these study sites as all terrain was low relief. Although the error sources

Chapter Three: Methodology
72
discussed here appear significant, the magnitude of the changes in outlet position and
lagoon structure means that they are relatively inconsequential.
3.2.3 Hydrological principles and practices
The hydrology of a coastal waterbody is a very important aspect of its overall dynamics.
The hydrological regime of a coastal lagoon is a function of system morphology, fluvial
input, marine conditions and other factors such as ecology and land-use in the
surrounding area (Kirk, 1991). Data on water pressure (which is then converted to water
depth), conductivity and water temperature are three commonly measured variables,
which provide valuable information on the hydrological dynamics of the system.
As technology has advanced, these variables can be measured increasingly easily and at
a greater spatial and temporal resolution. Often, conductivity and temperature are
measured both horizontally and vertically within a waterbody to assess stratification and
apply complex numerical models. For the purposes of this study, the aim was to assess
broad trends rather than gain high resolution data for modelling, so data was not
collected to this level of detail.
Conductivity is the degree to which a substance is able to conduct electricity which, in
the case of water, is a function of the concentration of dissolved ions (salts such as
chlorides, sulphates, carbonates, sodium, magnesium, potassium). As such, conductivity
can be used as a proxy for determining the salinity of the water body (e.g. Fernandes et
al., 2004, Lucas et al., 2006). In waterways, electrical conductivity can be affected by
soil composition, land-use characteristics and runoff, flow rate of the water,
groundwater inflows, temperature, and evaporation/dilution (Lucas et al., 2006). The
salinity of a coastal lagoon is an important parameter, as it provides information about
the degree of water exchange between the ocean and the lagoon, or the balance between
fluvial inputs and marine influence (Kirk, 1991). It is important to note, however, that
conductivity is not necessarily a direct measure of marine influence in all cases, as some
of the measured conductivity may be due to one of the above factors. In these studies,
the patterns and degree of change above the baseline conductivity for each site were the
factors assessed. It is possible to calculate the absolute salinity from conductivity and
temperature data, but this was not deemed necessary for the purposes of this study.
Electrical conductivity ranges of common water systems are presented in Table 3.2.
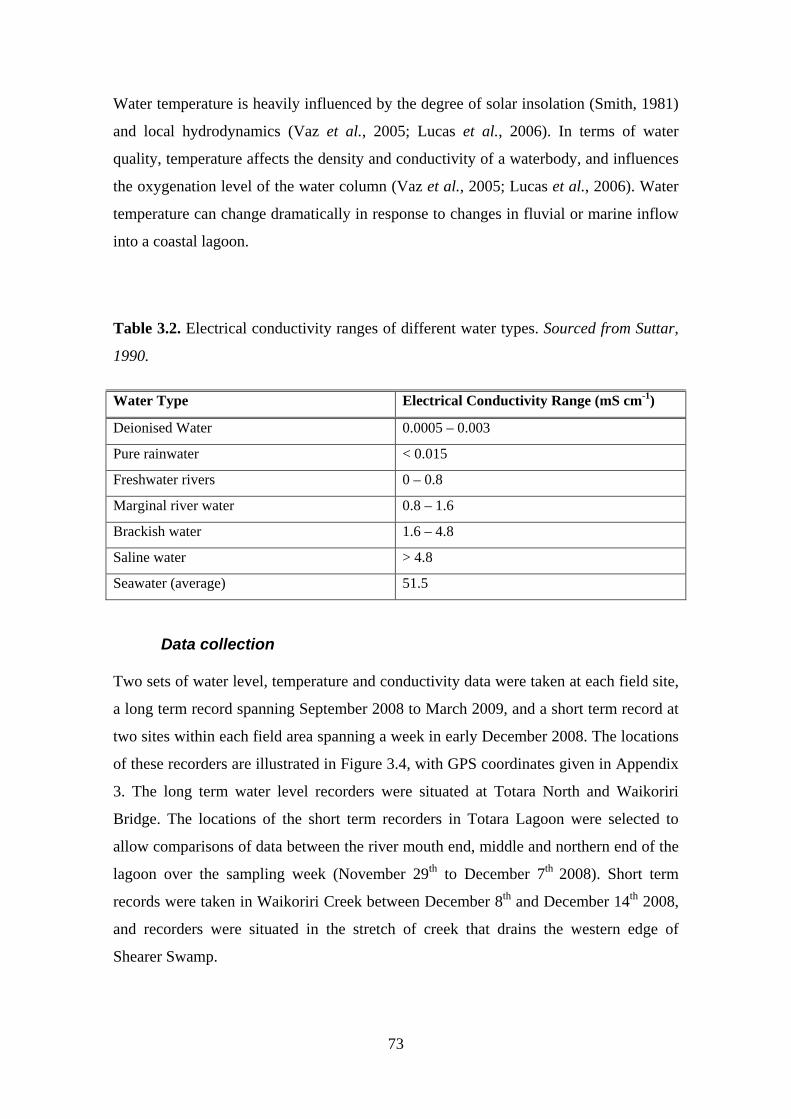
73
Water temperature is heavily influenced by the degree of solar insolation (Smith, 1981)
and local hydrodynamics (Vaz et al., 2005; Lucas et al., 2006). In terms of water
quality, temperature affects the density and conductivity of a waterbody, and influences
the oxygenation level of the water column (Vaz et al., 2005; Lucas et al., 2006). Water
temperature can change dramatically in response to changes in fluvial or marine inflow
into a coastal lagoon.
Table 3.2. Electrical conductivity ranges of different water types. Sourced from Suttar,
1990.
Water Type Electrical Conductivity Range (mS cm-1
Deionised Water
)
0.0005 – 0.003
Pure rainwater < 0.015
Freshwater rivers 0 – 0.8
Marginal river water 0.8 – 1.6
Brackish water 1.6 – 4.8
Saline water > 4.8
Seawater (average) 51.5
Two sets of water level, temperature and conductivity data were taken at each field site,
a long term record spanning September 2008 to March 2009, and a short term record at
two sites within each field area spanning a week in early December 2008. The locations
of these recorders are illustrated in Figure 3.4, with GPS coordinates given in Appendix
3. The long term water level recorders were situated at Totara North and Waikoriri
Bridge. The locations of the short term recorders in Totara Lagoon were selected to
allow comparisons of data between the river mouth end, middle and northern end of the
lagoon over the sampling week (November 29
Data collection
th to December 7th 2008). Short term
records were taken in Waikoriri Creek between December 8th and December 14th 2008,
and recorders were situated in the stretch of creek that drains the western edge of
Shearer Swamp.
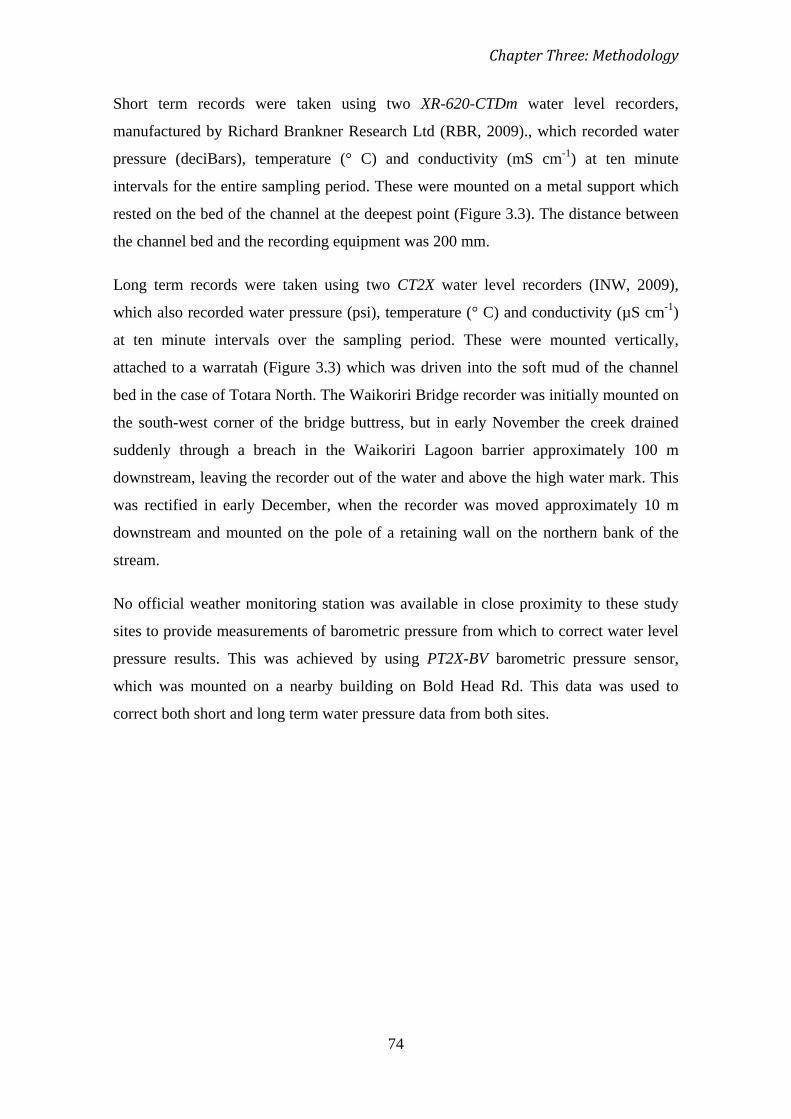
Chapter Three: Methodology
74
Short term records were taken using two XR-620-CTDm water level recorders,
manufactured by Richard Brankner Research Ltd (RBR, 2009)., which recorded water
pressure (deciBars), temperature (° C) and conductivity (mS cm-1
Long term records were taken using two CT2X water level recorders (INW, 2009),
which also recorded water pressure (psi), temperature (° C) and conductivity (µS cm
) at ten minute
intervals for the entire sampling period. These were mounted on a metal support which
rested on the bed of the channel at the deepest point (Figure 3.3). The distance between
the channel bed and the recording equipment was 200 mm.
-1
No official weather monitoring station was available in close proximity to these study
sites to provide measurements of barometric pressure from which to correct water level
pressure results. This was achieved by using PT2X-BV barometric pressure sensor,
which was mounted on a nearby building on Bold Head Rd. This data was used to
correct both short and long term water pressure data from both sites.
)
at ten minute intervals over the sampling period. These were mounted vertically,
attached to a warratah (Figure 3.3) which was driven into the soft mud of the channel
bed in the case of Totara North. The Waikoriri Bridge recorder was initially mounted on
the south-west corner of the bridge buttress, but in early November the creek drained
suddenly through a breach in the Waikoriri Lagoon barrier approximately 100 m
downstream, leaving the recorder out of the water and above the high water mark. This
was rectified in early December, when the recorder was moved approximately 10 m
downstream and mounted on the pole of a retaining wall on the northern bank of the
stream.
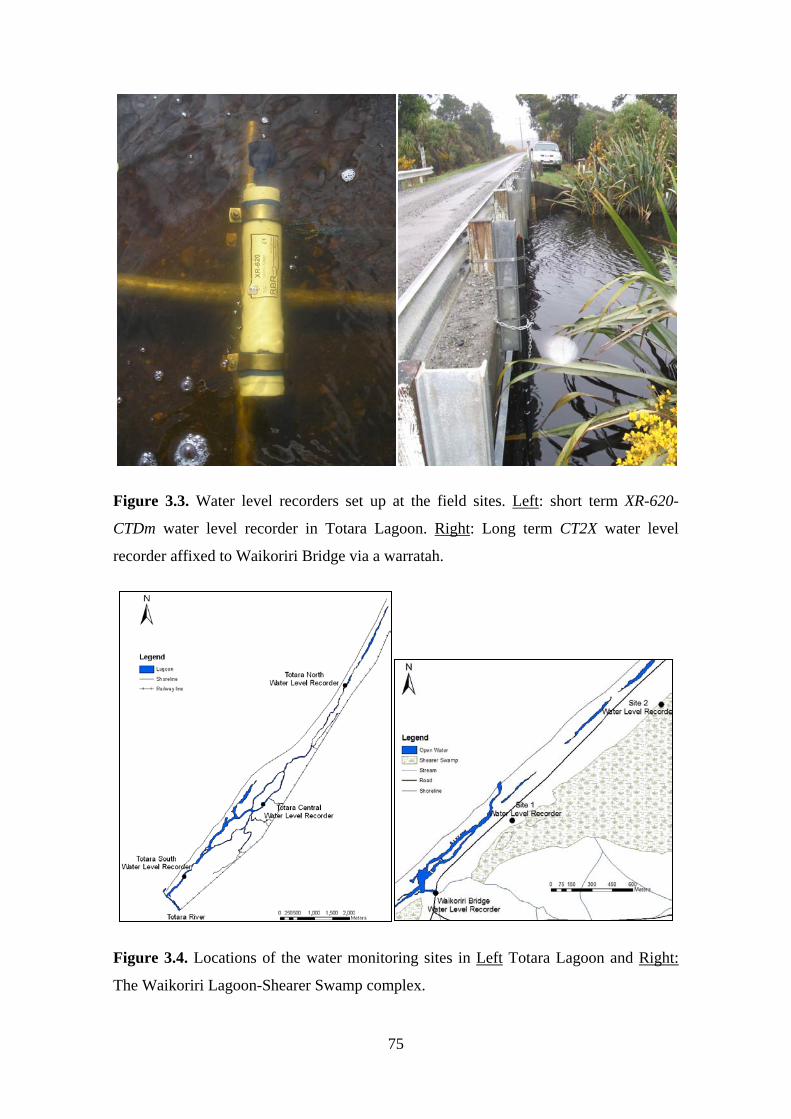
75
Figure 3.3. Water level recorders set up at the field sites. Left: short term XR-620-
CTDm water level recorder in Totara Lagoon. Right
: Long term CT2X water level
recorder affixed to Waikoriri Bridge via a warratah.
Figure 3.4. Locations of the water monitoring sites in Left Totara Lagoon and Right:
The Waikoriri Lagoon-Shearer Swamp complex.
Chapter Three: Methodology
76
Data for pressure, temperature and conductivity obtained from the recorders was first
downloaded and opened using RBR software for the XR-620-CTDm loggers and
Aquasoft for the CT2X loggers. Barometric pressure corrections were performed for the
long term pressure records by the Aquasoft software. All records were then exported
into Microsoft Excel for further analysis.
Analysis of data
Units of measurement were standardised across all records, with pressure measurements
converted into Bars and conductivity measurements converted to mS cm -1. Short term
pressure records were then manually corrected for air pressure by subtracting the
recorded barometric pressure from the water pressure measurement. All water pressure
data was then converted to mmH2O and the measured distance from the channel bed to
the recording equipment was added to all data entries, thus giving the absolute water
depth. All data that was recorded while the equipment was out of the water (both before
and after the sampling period and when it was removed briefly for maintenance during
the sampling period) was removed prior to analysing the corrected data. These periods
were identified by water level measurements in the vicinity of 0.0 mmH2
Data was then graphed over time to assess trends in these parameters and to compare
measurements across sites within each field area. Data from the long term records
matching the time period of the short term records from each field site was extracted for
these comparisons, in addition to assessing the complete long term records. Maximum,
minimum and mean values were calculated for each parameter from each recording site.
In the case of Waikoriri Bridge, the record was split into two time periods: September to
November, and December to March. Data from these two time periods could not be
directly connected because the recorder location changed following the draining of
Waikoriri Creek.
O. In the case
of the Waikoriri Bridge long term recorder, this included removing the data for most of
November and early December.
The dataset taken from Waikoriri Bridge is subject to the greatest degree of systematic
error. As well as removing the data from when the water level recorder was out of the
water, the water depth from the bed to the surface cannot be calculated. This is because
Limitations and errors
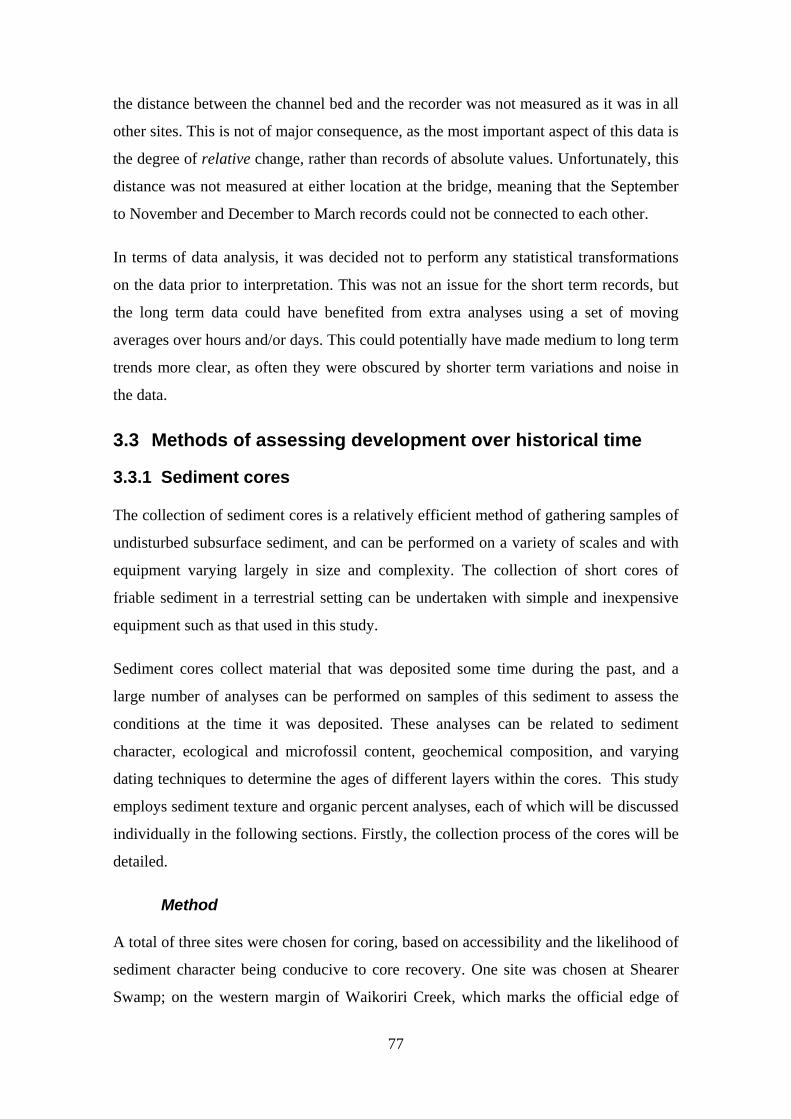
77
the distance between the channel bed and the recorder was not measured as it was in all
other sites. This is not of major consequence, as the most important aspect of this data is
the degree of relative change, rather than records of absolute values. Unfortunately, this
distance was not measured at either location at the bridge, meaning that the September
to November and December to March records could not be connected to each other.
In terms of data analysis, it was decided not to perform any statistical transformations
on the data prior to interpretation. This was not an issue for the short term records, but
the long term data could have benefited from extra analyses using a set of moving
averages over hours and/or days. This could potentially have made medium to long term
trends more clear, as often they were obscured by shorter term variations and noise in
the data.
3.3 Methods of assessing development over historical time
3.3.1 Sediment cores
The collection of sediment cores is a relatively efficient method of gathering samples of
undisturbed subsurface sediment, and can be performed on a variety of scales and with
equipment varying largely in size and complexity. The collection of short cores of
friable sediment in a terrestrial setting can be undertaken with simple and inexpensive
equipment such as that used in this study.
Sediment cores collect material that was deposited some time during the past, and a
large number of analyses can be performed on samples of this sediment to assess the
conditions at the time it was deposited. These analyses can be related to sediment
character, ecological and microfossil content, geochemical composition, and varying
dating techniques to determine the ages of different layers within the cores. This study
employs sediment texture and organic percent analyses, each of which will be discussed
individually in the following sections. Firstly, the collection process of the cores will be
detailed.
Method
A total of three sites were chosen for coring, based on accessibility and the likelihood of
sediment character being conducive to core recovery. One site was chosen at Shearer
Swamp; on the western margin of Waikoriri Creek, which marks the official edge of

Chapter Three: Methodology
78
Shearer Swamp. Due to the muddy nature of Waikoriri Creek and equipment
constraints, access to the more central reaches of the swamp was not possible. Two sites
were sampled on the eastern, landward edges of Totara Lagoon; at the northern and
southern ends respectively. Locations were documented using a handheld GPS unit
(Figure 3.5) (Appendix 4). Due to the gravelly nature of sediments at the confluence of
the lagoon and the Totara River, the southern core was taken approximately 2 km up the
channel from this point.
Cores were collected with a hammer corer, which is a form of gravity corer comprised
of a 1.5 m metal tube which is driven into the sediment by the manual operation of a
heavy piston on the top (Figure 3.6). Several cores were taken from each site at intervals
of 2 to 5 m to ensure the consistent character and lateral continuity of the observed
sedimentary units. Surface sediments were infiltrated by roots in the top several
centimetres, which were discarded prior to sampling. The depth of cores was
constrained by the presence of coarse sand layers at all three sites, which prevented the
hammer corer from penetrating further. Core compaction was estimated by measuring
the difference between hole depth and core length. Once recovered from the ground,
cores were ejected from the core tube into plastic half-round tubes and shrink wrapped
for ease of transport and to prevent contamination (Figure 3.6). In the laboratory, cores
were split lengthwise using copper wire and stored in a refrigerator. Cores were
photographed and stratigraphy was examined and logged prior to sub-sampling for the
analyses in the following sections. A single, representative core from each of the three
sites was used for stratigraphic logs and analyses.
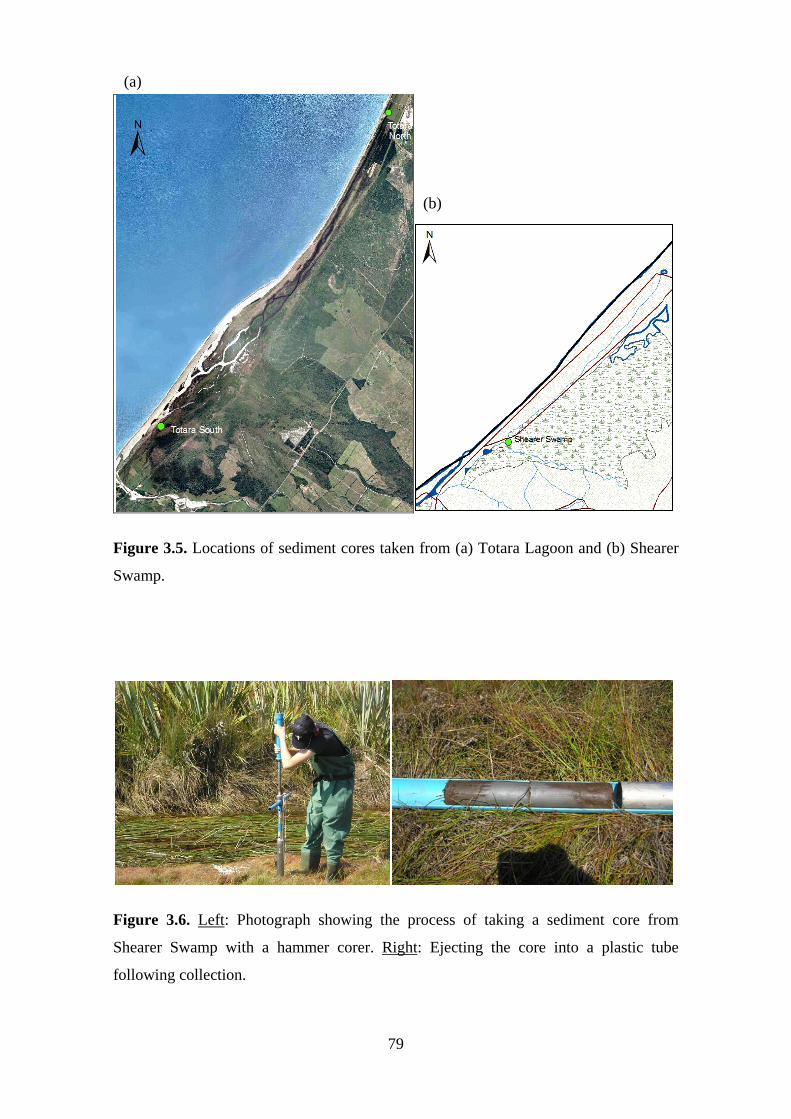
79
Figure 3.5. Locations of sediment cores taken from (a) Totara Lagoon and (b) Shearer
Swamp.
Figure 3.6. Left: Photograph showing the process of taking a sediment core from
Shearer Swamp with a hammer corer. Right: Ejecting the core into a plastic tube
following collection.
(a)
(b)

Chapter Three: Methodology
80
Limitations and errors
The primary limitation in the collection of cores for this project was the inability to
collect longer cores from a larger number of locations, due to equipment and time
constraints. The diverse nature of sediment types in these environments made selection
of equipment difficult, as each type of corer performs best in a relatively specific type of
sediment. Initially a vibracorer was to be used, as this would work well in wetland and
more sandy areas; however practical constraints meant that it could not be transported
into the field sites. The hammer corer was simpler to use and was suited to the peat and
mud layers of Shearer Swamp and lower Totara Lagoon. However, the presence of sand
layers below depths of 0.5 m in all cores precluded the collection of longer cores. In
addition to this issue, the very soft surface sediments of Shearer Swamp and northern
Totara Lagoon were unable to be sampled, as the corer relies on resistance from the
sediment to push the piston up inside the tube, and so the sediment was pushed to the
side rather than forming part of the core sample. This limitation could not be quantified,
but does not affect the integrity of the core as a whole. A similar source of error is that
of core compaction, which was calculated for each core as the difference between core
length and hole depth. This difference results not entirely from the compaction of
unconsolidated or poorly consolidated sediments in the sample, but also from the
possible loss of downcore material in a similar manner to that of the soft surface
sediments.
3.3.2 Sediment texture analysis
Sediment texture is a broad term that describes the character of sediment, and includes
parameters such as grain size distribution, shape, sphericity, roundness and rollability
(Lewis and McConchie, 1994). These attributes are a function of the distribution of
energy in the depositional environment, the type of transport processes and the
timeframe within which they operate on the sediment, and character of the source rocks.
Thus results of sediment texture analysis can be used to infer the type of depositional
environment (Lewis and McConchie, 1994).
Each of the above attributes can be measured individually via separate techniques, but
sediment analysis is often restricted to size determination. The standard descriptive
grain size scale is the Udden-Wentworth scale, which is presented in Figure 3.7 with
associated phi and millimetre conversions. Particle size is difficult to define in absolute
81
terms, due to the three dimensional nature of sediment particles. There are several
different techniques for size determination and all involve indirect measures, which are
influenced by particle shape and in some cases by density as well. Consequently, results
from differing techniques cannot be compared with accuracy and no method provides
‘true’ results, rather different properties of the same sediment are being measured
(Konert and Vandenberghe, 1997; Lewis and McConchie, 1994; McCave et al., 2006).
Methods of grain size measurement include laser particle sizing, pipette analysis, sieve
analysis and settling velocity. The most appropriate method to use depends on the shape
and mineralogy of the sediment to be measured, its size range, equipment availability,
time, funding and accuracy constraints.
The laser particle sizer method was chosen for this study, as the sediments in these
samples range in shape, mineralogy and size, with the vast majority of sediment below
the 1 mm maximum measureable size. The large percentage of organics, clays, and low
density particles such as micas meant settling velocity was not an appropriate method,
although a combination of sieve and pipette analysis would have been an acceptable
alternative method. Laser diffraction grain size analysis works on the relationship
between particle size and the angle by which light is diffracted when that particle
obscures a laser beam (Singer et al, 1988). A laser beam is passed through a suspension
of sediment in water, and the distribution of diffracted light is measured by a receiver.
This diffracted light is focused at the receiver by the use of a lens, the focal length of
which determines the size range that can be accurately measured (Singer et al., 1988).

Chapter Three: Methodology
82
Figure 3.7. The Udden-Wentworth scale for grain sizes, with phi (ϕ) and millimetre
(mm) conversion chart. Sourced from Lewis and McConchie (1994, p. 129)
83
Method
A total of three cores were taken from each site, and one representative core was chosen
for analysis from each. Cores were consistent within sites in terms of observed
stratigraphy. A total of 12 samples, 4 from each core, were taken for grain size analysis.
These were sampled from depths of 30, 150, 300, and 450 mm. Samples were oven
dried at 50 °C overnight, then dry sieved through a 1 mm sieve to remove material too
coarse to be analysed by the laser sizer unit. No further pre-treatment of samples was
performed. A Micromeritics Saturn Digisizer 5200 was used in the grain size analysis,
capable of measuring particles from 0.0001 to 1.0 mm in equivalent spherical diameter
(Micromeritics, 2009a). Samples of approximately 1 cm3
Statistical analyses on these results were performed to obtain the maximum, minimum
and mean grain size (µm), standard deviation, mode of the sample distributions. The
standard deviation provides a measure of the degree of sorting of the sample (Folk,
1974). For coarse, sandy samples (Samples, 8, 10, and 12), the second and third runs
were disregarded. This was necessary because the data obtained was clearly erroneous,
giving distributions clustered around the very low end of the scale (0.0001 mm). This is
likely due to the weight of the particles causing them to sink more easily, thus not being
read by the machine after the first run. The grain size figures of each sample were
correlated to the Udden-Wentworth grain size chart.
were fed slowly into the
machine until a beam obscuration of between 13 and 20% was reached. The volume of
sediment this required increased with coarser samples. The machine then passed a laser
beam through the suspended sample at 10 different angles and measured the diffraction
pattern obtained. Each sample was run through the machine three times, and the results
averaged to provide the final distribution. The distributions are calculated automatically
from the diffraction patterns using Mie Theory, which states that the intensity of the
light reaching the receptor is a function of particle size, focal length of the lens, angle
and wavelength (Micromeritics, 2009b).

Chapter Three: Methodology
84
Table 3.3. Sorting classes. Sourced from Folk (1974, p. 46)
Standard Deviation σ Sorting
< 0.35 Very well sorted
0.35 - 0.5 Well sorted
0.5 - 0.71 Moderately well sorted
0.71 - 1.0 Moderately sorted
1.0 - 2.0 Poorly sorted
2.0 - 4.0 Very poorly sorted
> 4.0 Extremely poorly sorted
Limitations and errors
The high organic percentage of some sediments in this study, combined with the diverse
range of sediment types present between samples, creates potential error sources in laser
sizer results. Although the laser particle sizer is capable of measuring larger, lower
density particles such as micas or biogenic particles (Singer et al., 1988), the tendency
of this matter to float on the surface of the water possibly affected results. In addition,
some organic particles measured were very elongated in shape and larger than 1 mm
lengthwise, due to the fact that sieving (as was performed in pre-treatment removal of
coarse matter) sorts particles on the basis of the intermediate axis, which meant these
elongated particles slipped through the mesh. Consequently, the upper end of the size
range of affected samples is potentially inaccurate. A similar problem with larger
particles occurred in particularly coarse, sandy samples, which had a tendency to sink
rather than remain in suspension, thus rendering the second and third runs of these
samples incorrect and they were discarded.
3.3.3 Percent organics principles and practices
The amount of organic matter present in a sediment sample is important in many
depositional settings, and reflects the degree to which in-situ biomass is responsible for
sediment deposition at that site and can also indicate sedimentation rate (Lewis and
McConchie, 1994; Sutherland, 1998). This is very much dependent on transport
processes and energy in the depositional environment, thus provides insights into the
environment at the time of deposition. This is important for this study because wetland
85
and lagoon environments are often areas of high biomass production so that
comparisons in sediment organic percent in different locations and stratigraphic
horizons can yield important results.
The percentage of organic matter was calculated using the Loss on Ignition (LOI)
technique, as detailed by (Lewis and McConchie, 1994). This is done by calculating the
mass lost from a sample following firing, with the resultant difference in weight being
principally due to the combustion and loss of organic matter in the sample.
This measure is subject to considerable error, as the loss of mass is due not only to
combustion of organics but also to the loss of water of crystallisation from clay
minerals, loss of carbon dioxide from any carbonates present, or loss of sulphur
(Sutherland, 1998; Lewis and McConchie, 1994). However, as a rough estimate of
quantifying the amount of organic matter (and thus organic carbon) it is a generally
accepted technique. Ideally, sedimentation rates should be measured independently at
the site before interpreting percent organic results, but this is rarely performed in
practice and leads to a degree of uncertainty (Doyle and Garrels, 1985). The LOI
technique involves burning samples at a high temperature to oxidise (thus removing the
mass component) of organic matter in the sample. The optimum temperature to use for
this process is considered to be 450 °C. This is a trade-off because total removal of
organic matter can require temperatures of up to 1000 °C, but beyond 500 °C any clays
and carbonates present in the sample become significantly modified, affecting results
and interpretation (Sutherland, 1998).

Chapter Three: Methodology
86
Method
Twelve samples were processed for LOI analysis and were taken from the sediment
cores. Four subsamples of approximately 1 cm3
3.4 Summary
were taken from each core, at the same
depths sampled for diatom analyses (30, 150, 300 and 450 mm below the surface).
Samples were oven dried for 24 hours at a temperature of 105 °C. This removes
moisture from the sample prior to initial weighing. The mass of each dried sample
(weighed in a crucible of known mass) was determined to an accuracy of 0.01 g, and
then samples were placed in a muffle furnace at 450 °C for 18 hours. Potential for cross
contamination is acknowledged, as when sizeable portions of organic matter are present
and thus oxidised, ash particles can float between containers in the furnace and affect
mass changes. Following removal from the furnace, the crucibles were left to cool to
room temperature before weighing again. The difference in mass of each sample
between initial weight and weight following ignition was then converted into a
percentage of total sample weight.
This chapter detailed the methodology employed in this study, first detailing the
principles and theory of each technique, followed by the processes followed in this
particular project. A summary flowchart illustrating the timeframes to which each
method pertains, and the results gained by each type of analysis is presented below
(Figure 3.8).
Techniques employed to assess the present geomorphology includes GNSS surveys of
representative sections of Totara Lagoon and the Shearer Swamp-Waikoriri Lagoon
Complex. Digital Elevation Models of the surveyed areas were constructed using
ArcGIS, which were then analysed for trends in topography and dune shape, height and
steepness. The hydrology of the two systems was investigated over a week-long period,
during which measurements of conductivity, water temperature and water level were
made at ten minute intervals at three sites within Totara Lagoon and three sites within
Waikoriri Creek.
Decadal-scale dynamics of Totara Lagoon and Waikoriri Lagoon were investigated
through analysis of aerial photographs, covering the period from 1948 to 2006.
Photographs were orthorectified and georeferenced to the New Zealand Map Grid
87
(NZMG) datum, and digitisations of the lagoon channel configuration and outlet
position were created using ENVI and ArcGIS software programmes. From these,
measurements of outlet offset and rates of outlet migration were calculated and trends in
outlet migration inferred.
Sediment cores and associated analyses were used to investigate the development of
selected areas of each system over a longer time period, covering up to 150 years. Cores
were taken from two sites in Totara Lagoon (north and south) and one site from Shearer
Swamp. Core stratigraphy was logged, and sediment texture analyses were conducted
using a Micromeritics Saturn Digisizer 5200 for selected core depths. Organic
percentage of samples was also measured using the Loss on Ignition technique.
The results gained from these techniques and analyses are presented in the following
three chapters.
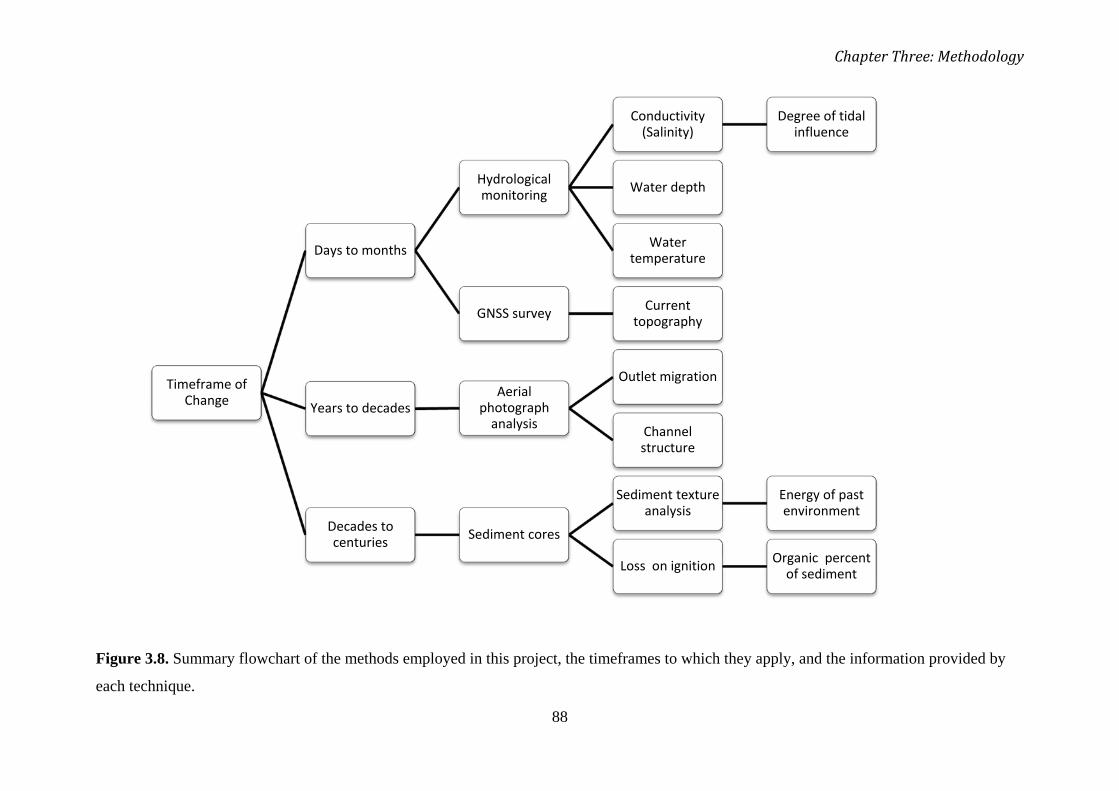
Chapter Three: Methodology
88
Figure 3.8. Summary flowchart of the methods employed in this project, the timeframes to which they apply, and the information provided by
each technique.
Timeframe of Change
Days to months
Hydrological monitoring
Conductivity(Salinity)
Degree of tidal influence
Water depth
Water temperature
GNSS survey Current topography
Years to decadesAerial
photograph analysis
Outlet migration
Channel structure
Decades to centuries Sediment cores
Sediment texture analysis
Energy of past environment
Loss on ignition Organic percent of sediment
89
CHAPTER FOUR
Existing Geomorphology and Hydrology
4.1 Introduction
The results of this investigation are separated into three chapters, according to the time
period to which each set of results relates. Results pertaining to the present day
geomorphology and hydrology of the study sites are presented in this chapter. This
includes: digital elevation models (DEMs) of representative sections of each lagoon’s
topography, profiles across the lagoon channels and adjacent dune ridges, and
measurements of water level, temperature and conductivity. Most data presented in this
chapter was collected over a two week period in early December 2008, thus represents a
snapshot of conditions at the time of surveying. The exception to this is the long term
records of water character, which were taken over a six month period from September
2008.
Results from Totara Lagoon are presented in Section 4.2, and those of the Shearer
Swamp-Waikoriri Lagoon complex in section 4.3. A discussion and interpretation of the
results for each site is presented in section 4.4, including a comparison of the two sites
in terms of geomorphology and hydrology. An integrated discussion of results for the
two sites is reserved for Chapter 7, following the presentation of results from aerial
photograph analysis in Chapter 5 and results of sediment cores and associated analyses
in Chapter 6.
The following research objectives are addressed by this chapter:
• To document the current topography and structure of representative sections of
each study site through GPS surveys and DEM creation,
• To investigate the hydrology of Totara Lagoon and Shearer Swamp in terms of
water level, temperature and conductivity measurements over both short and
longer timescales,
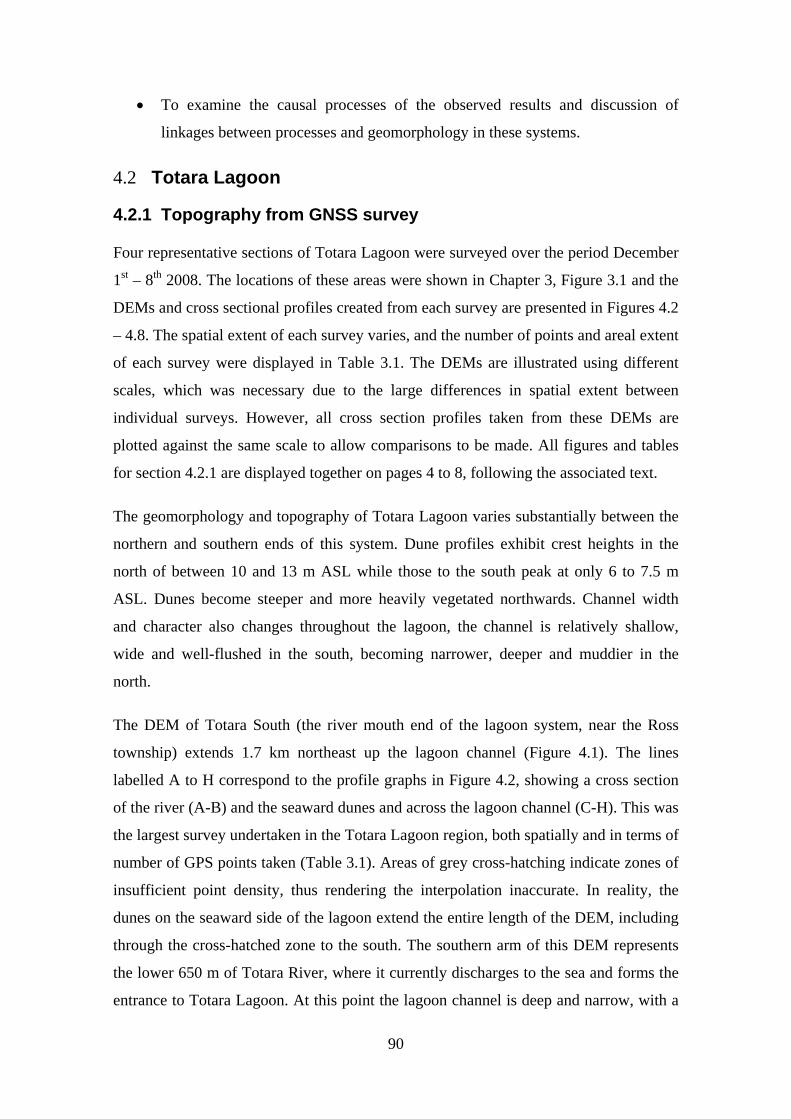
90
• To examine the causal processes of the observed results and discussion of
linkages between processes and geomorphology in these systems.
4.2 Totara Lagoon
4.2.1 Topography from GNSS survey
Four representative sections of Totara Lagoon were surveyed over the period December
1st – 8th
The geomorphology and topography of Totara Lagoon varies substantially between the
northern and southern ends of this system. Dune profiles exhibit crest heights in the
north of between 10 and 13 m ASL while those to the south peak at only 6 to 7.5 m
ASL. Dunes become steeper and more heavily vegetated northwards. Channel width
and character also changes throughout the lagoon, the channel is relatively shallow,
wide and well-flushed in the south, becoming narrower, deeper and muddier in the
north.
2008. The locations of these areas were shown in Chapter 3, Figure 3.1 and the
DEMs and cross sectional profiles created from each survey are presented in Figures 4.2
– 4.8. The spatial extent of each survey varies, and the number of points and areal extent
of each survey were displayed in Table 3.1. The DEMs are illustrated using different
scales, which was necessary due to the large differences in spatial extent between
individual surveys. However, all cross section profiles taken from these DEMs are
plotted against the same scale to allow comparisons to be made. All figures and tables
for section 4.2.1 are displayed together on pages 4 to 8, following the associated text.
The DEM of Totara South (the river mouth end of the lagoon system, near the Ross
township) extends 1.7 km northeast up the lagoon channel (Figure 4.1). The lines
labelled A to H correspond to the profile graphs in Figure 4.2, showing a cross section
of the river (A-B) and the seaward dunes and across the lagoon channel (C-H). This was
the largest survey undertaken in the Totara Lagoon region, both spatially and in terms of
number of GPS points taken (Table 3.1). Areas of grey cross-hatching indicate zones of
insufficient point density, thus rendering the interpolation inaccurate. In reality, the
dunes on the seaward side of the lagoon extend the entire length of the DEM, including
through the cross-hatched zone to the south. The southern arm of this DEM represents
the lower 650 m of Totara River, where it currently discharges to the sea and forms the
entrance to Totara Lagoon. At this point the lagoon channel is deep and narrow, with a
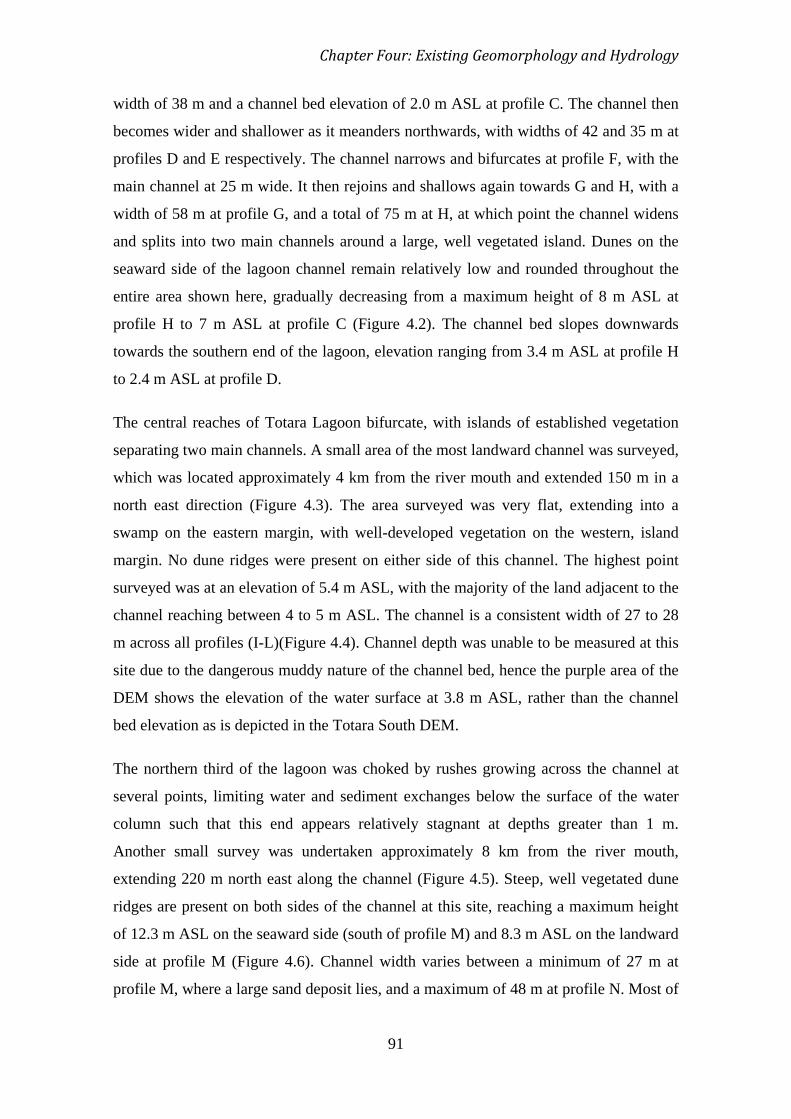
Chapter Four: Existing Geomorphology and Hydrology
91
width of 38 m and a channel bed elevation of 2.0 m ASL at profile C. The channel then
becomes wider and shallower as it meanders northwards, with widths of 42 and 35 m at
profiles D and E respectively. The channel narrows and bifurcates at profile F, with the
main channel at 25 m wide. It then rejoins and shallows again towards G and H, with a
width of 58 m at profile G, and a total of 75 m at H, at which point the channel widens
and splits into two main channels around a large, well vegetated island. Dunes on the
seaward side of the lagoon channel remain relatively low and rounded throughout the
entire area shown here, gradually decreasing from a maximum height of 8 m ASL at
profile H to 7 m ASL at profile C (Figure 4.2). The channel bed slopes downwards
towards the southern end of the lagoon, elevation ranging from 3.4 m ASL at profile H
to 2.4 m ASL at profile D.
The central reaches of Totara Lagoon bifurcate, with islands of established vegetation
separating two main channels. A small area of the most landward channel was surveyed,
which was located approximately 4 km from the river mouth and extended 150 m in a
north east direction (Figure 4.3). The area surveyed was very flat, extending into a
swamp on the eastern margin, with well-developed vegetation on the western, island
margin. No dune ridges were present on either side of this channel. The highest point
surveyed was at an elevation of 5.4 m ASL, with the majority of the land adjacent to the
channel reaching between 4 to 5 m ASL. The channel is a consistent width of 27 to 28
m across all profiles (I-L)(Figure 4.4). Channel depth was unable to be measured at this
site due to the dangerous muddy nature of the channel bed, hence the purple area of the
DEM shows the elevation of the water surface at 3.8 m ASL, rather than the channel
bed elevation as is depicted in the Totara South DEM.
The northern third of the lagoon was choked by rushes growing across the channel at
several points, limiting water and sediment exchanges below the surface of the water
column such that this end appears relatively stagnant at depths greater than 1 m.
Another small survey was undertaken approximately 8 km from the river mouth,
extending 220 m north east along the channel (Figure 4.5). Steep, well vegetated dune
ridges are present on both sides of the channel at this site, reaching a maximum height
of 12.3 m ASL on the seaward side (south of profile M) and 8.3 m ASL on the landward
side at profile M (Figure 4.6). Channel width varies between a minimum of 27 m at
profile M, where a large sand deposit lies, and a maximum of 48 m at profile N. Most of
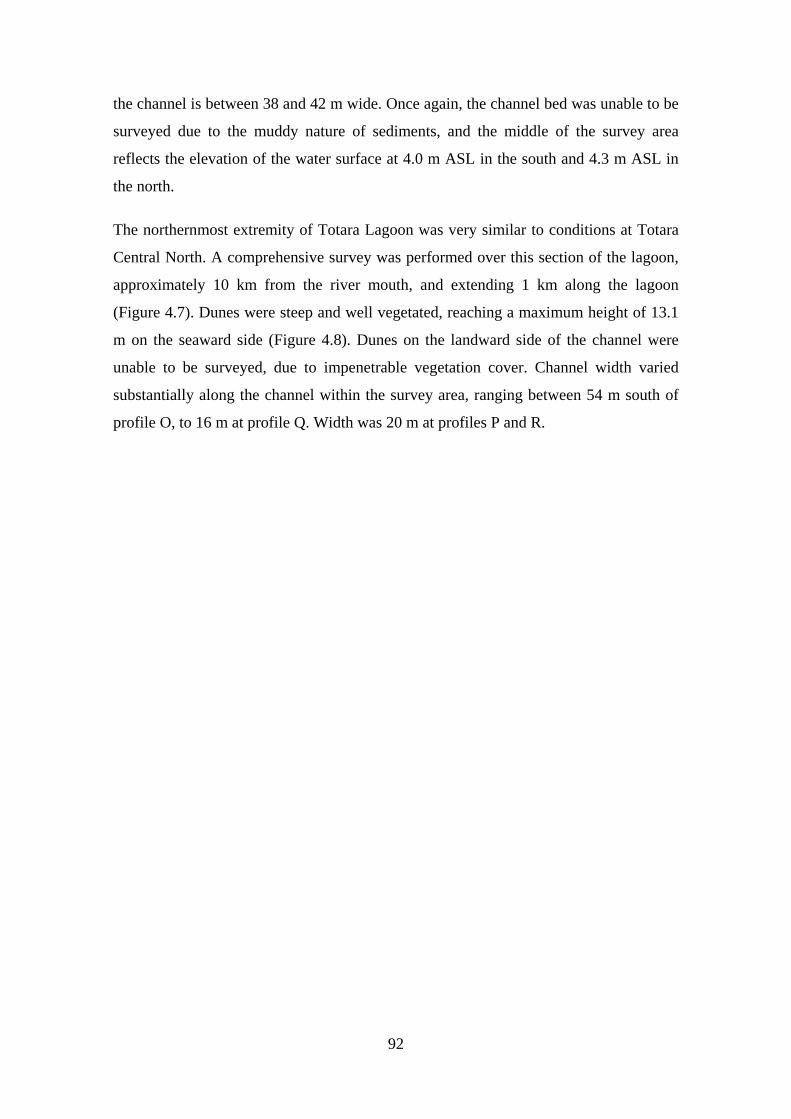
92
the channel is between 38 and 42 m wide. Once again, the channel bed was unable to be
surveyed due to the muddy nature of sediments, and the middle of the survey area
reflects the elevation of the water surface at 4.0 m ASL in the south and 4.3 m ASL in
the north.
The northernmost extremity of Totara Lagoon was very similar to conditions at Totara
Central North. A comprehensive survey was performed over this section of the lagoon,
approximately 10 km from the river mouth, and extending 1 km along the lagoon
(Figure 4.7). Dunes were steep and well vegetated, reaching a maximum height of 13.1
m on the seaward side (Figure 4.8). Dunes on the landward side of the channel were
unable to be surveyed, due to impenetrable vegetation cover. Channel width varied
substantially along the channel within the survey area, ranging between 54 m south of
profile O, to 16 m at profile Q. Width was 20 m at profiles P and R.
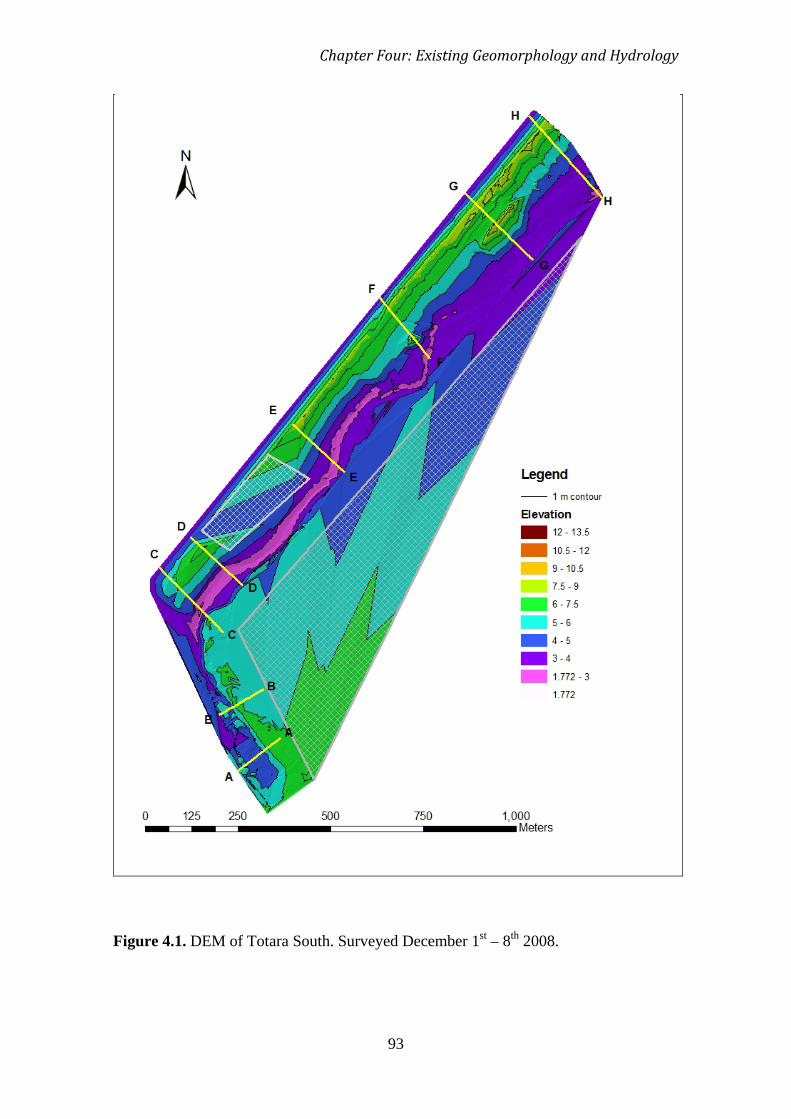
Chapter Four: Existing Geomorphology and Hydrology
93
Figure 4.1. DEM of Totara South. Surveyed December 1st – 8th 2008.
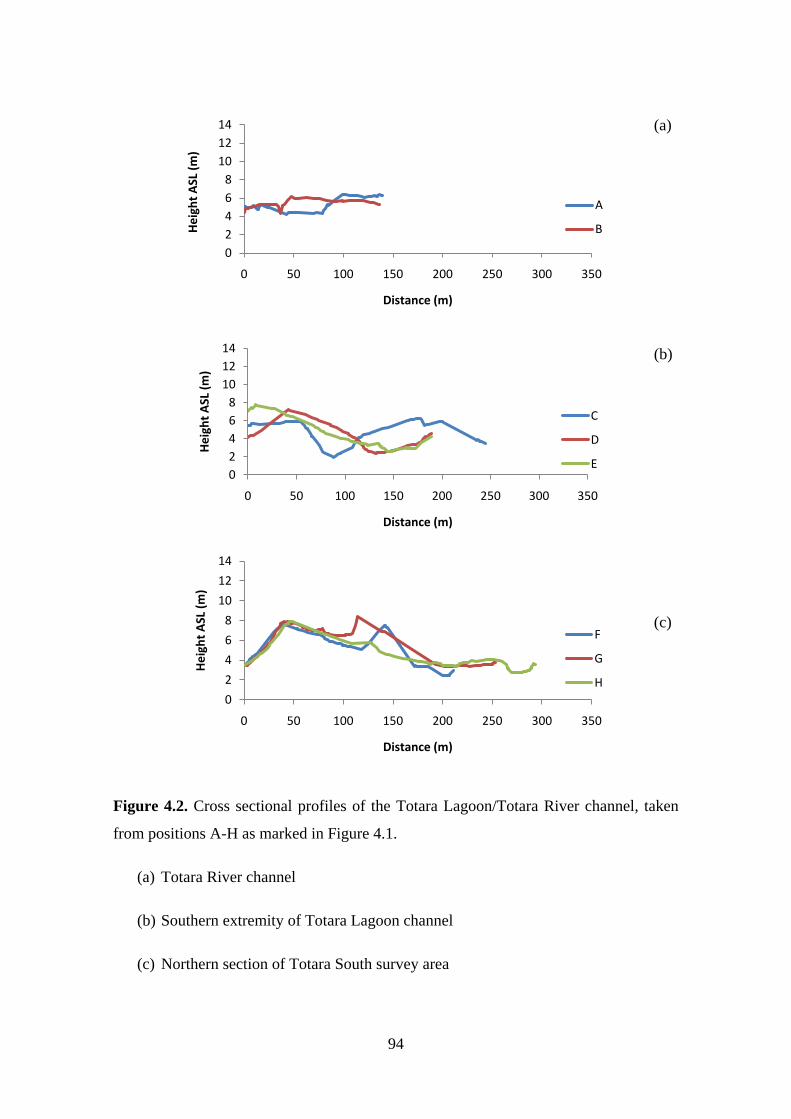
94
Figure 4.2. Cross sectional profiles of the Totara Lagoon/Totara River channel, taken
from positions A-H as marked in Figure 4.1.
(a) Totara River channel
(b) Southern extremity of Totara Lagoon channel
(c) Northern section of Totara South survey area
02468
101214
0 50 100 150 200 250 300 350
Hei
ght A
SL (m
)
Distance (m)
A
B
02468
101214
0 50 100 150 200 250 300 350
Hei
ght A
SL (m
)
Distance (m)
C
D
E
0
2
4
6
8
10
12
14
0 50 100 150 200 250 300 350
Hei
ght A
SL (m
)
Distance (m)
F
G
H
(a)
(b)
(c)
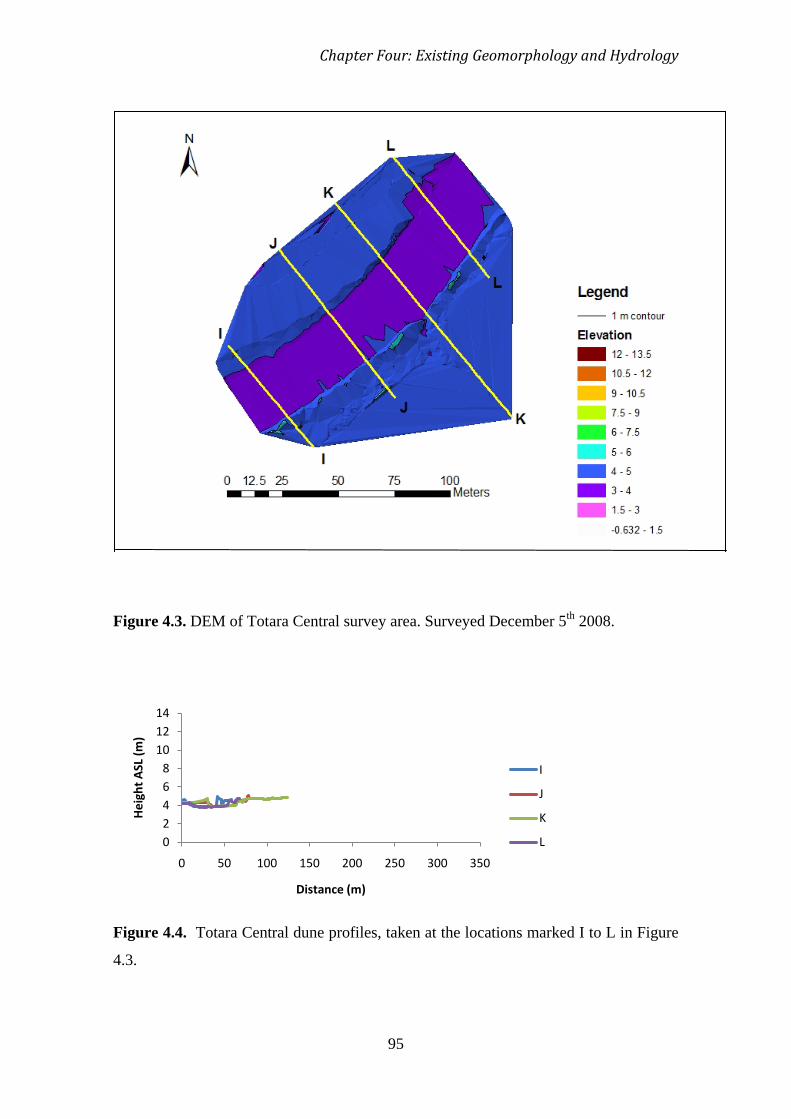
Chapter Four: Existing Geomorphology and Hydrology
95
Figure 4.3. DEM of Totara Central survey area. Surveyed December 5th
2008.
Figure 4.4. Totara Central dune profiles, taken at the locations marked I to L in Figure
4.3.
02468
101214
0 50 100 150 200 250 300 350
Hei
ght A
SL (m
)
Distance (m)
I
J
K
L
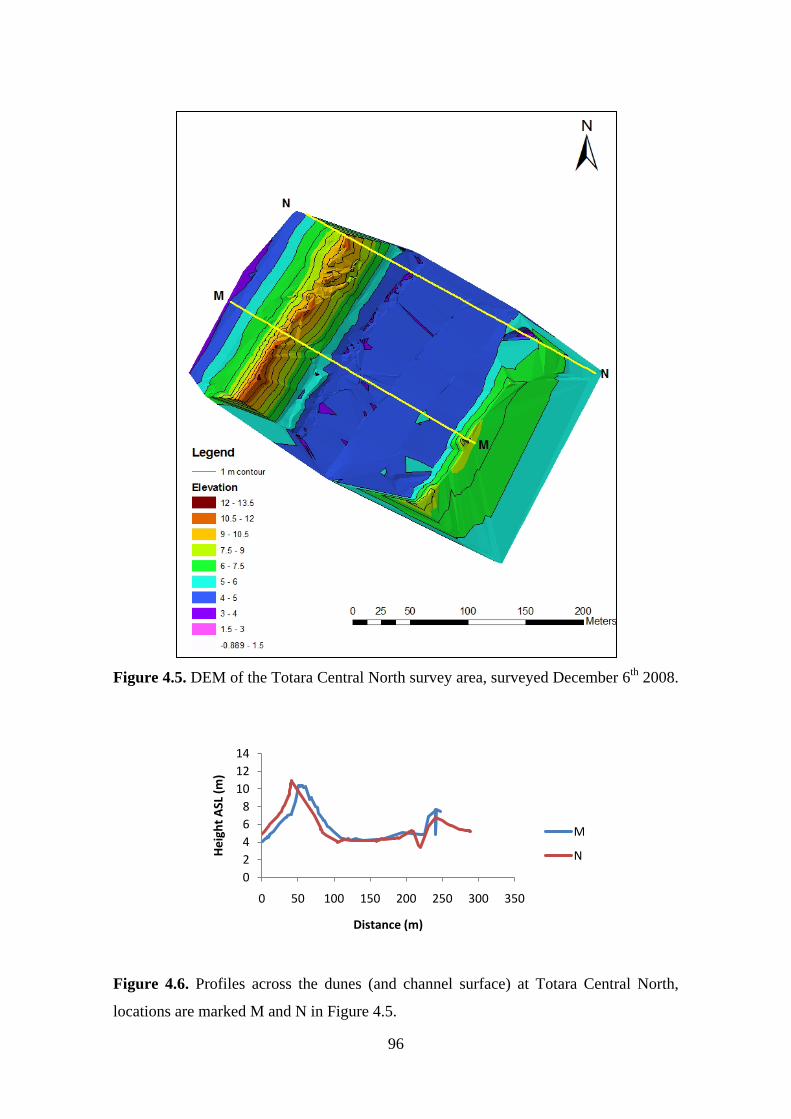
96
Figure 4.5. DEM of the Totara Central North survey area, surveyed December 6th
2008.
Figure 4.6. Profiles across the dunes (and channel surface) at Totara Central North,
locations are marked M and N in Figure 4.5.
02468
101214
0 50 100 150 200 250 300 350
Hei
ght A
SL (m
)
Distance (m)
M
N
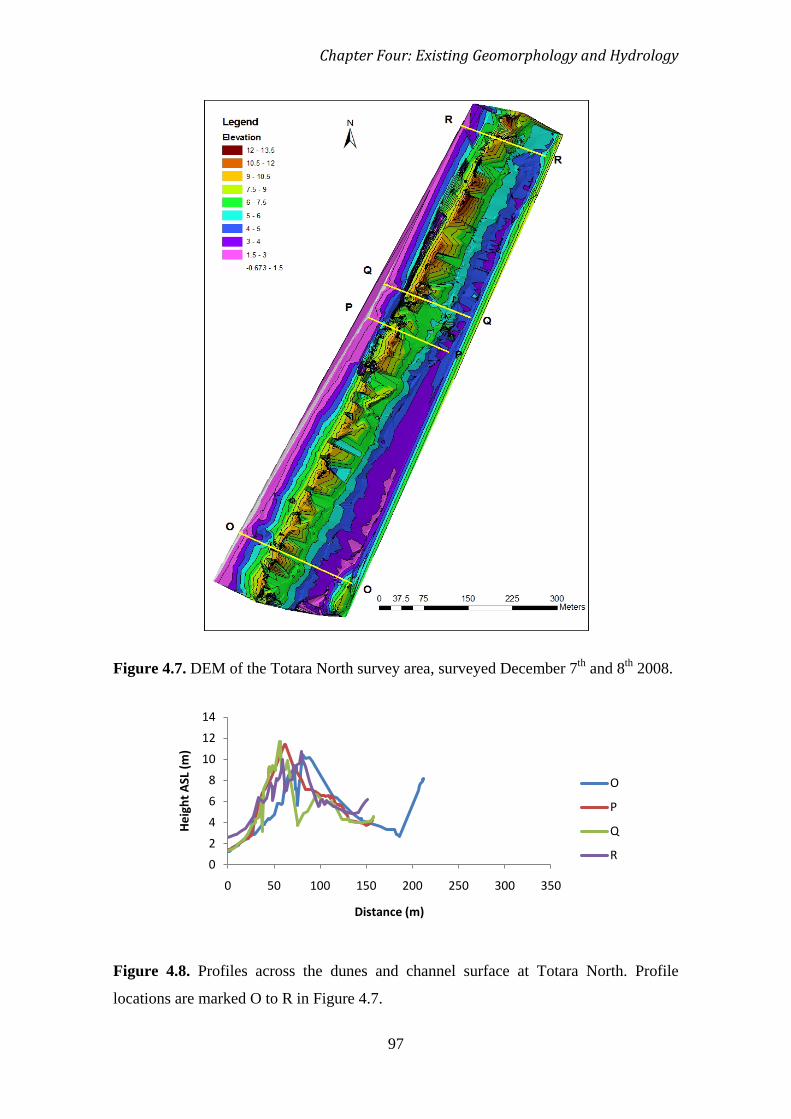
Chapter Four: Existing Geomorphology and Hydrology
97
Figure 4.7. DEM of the Totara North survey area, surveyed December 7th and 8th
2008.
Figure 4.8. Profiles across the dunes and channel surface at Totara North. Profile
locations are marked O to R in Figure 4.7.
0
2
4
6
8
10
12
14
0 50 100 150 200 250 300 350
Hei
ght A
SL (m
)
Distance (m)
O
P
Q
R
98
4.2.2 Water level and character records
Water level, temperature and conductivity measurements were taken at two sites in
Totara Lagoon over the period of December 1st – 7th 2008. A longer term record was
taken at the northern end, spanning a 6 month period from September 2008 - March
2009. Locations of these water level recorders were displayed in Chapter 3, Figure 3.4,
and the sites will be referred to as Totara South, Totara Central and Totara North. In
addition to the complete long term record at Totara North, data for the period December
1st to 7th
Water level
2008 was extracted from this record and presented with the data for Totara
Central and South, to provide a comparison of water characteristics between different
areas of the lagoon.
Water level variation at both Totara South and Totara Central follows the tidal cycle
(Figure 4.9). There is both a temporal lag and dampening of the effect of tidal cycle
variation on water level from south to north along the lagoon. The maximum water level
at Totara Central is reached approximately 90 minutes after that at Totara South. There
is also an evident tidal current asymmetry, whereby the water level increases much
faster on the incoming tide than it decreases on the outgoing tide. This is most distinct at
Totara Central. The tidal influence is more pronounced at Totara South, with the
variation between peak and lowest levels much more extreme than at Totara Central.
Maximum and minimum recorded water level values at Totara South were 1942 and
391.6 mm, with a mean of 945.9 mm. Totara Central recorded a maximum and
minimum of 1565 and 714.9 mm, with a mean of 916.6 mm. Water level at Totara
North over this period was much more stable than at the other two sites, with only
extremely slight peaks marking the high tides over the first five days: the variation
between maximum and minimum recorded values was small, from 1929 to 1387 mm,
with a mean water level of 1485 mm. The maximum water level was reached on
December 5th
The long term record from Totara North showed a much greater degree of variation,
ranging from a maximum of 2830 mm to a minimum recorded value of 563.9 mm, with
a mean water level of 1485 mm (Figure 4.10). The mean over the 6 month period was
at all three sites in response to a large storm event and consequent river
flood.
Chapter Four: Existing Geomorphology and Hydrology
99
1527 mm. The water level varied significantly on timescales of days to weeks, with two
particularly high water level events occurring in late October and late February.
Water temperature
Temperature in the lagoon varied significantly between the locations and temporally
within each individual record (Figure 4.9). The record at Totara South showed the
greatest variation in temperature, ranging from a maximum of 21.5 °C to a minimum of
12.5 °C. The mean temperature over the study period was 15.6 °C. There is a loose
diurnal trend. Water temperature at Totara Central follows the same pattern as that of
Totara South, but is subject to less extreme values; ranging between 19.3 and 12.8 °C
with a mean of 16.1 °C. The northern end of Totara Lagoon was generally 2 – 3 °C
warmer than Totara Central and Totara South, the exceptions being a during the late
afternoon of December 3rd and again December 6th
The long term record at Totara North shows a clear seasonal trend, with temperatures
increasing over the summer months of December, January and early February and
decreasing again in late February and early March (Figure 4.10). Temperatures ranged
between a maximum of 26.5 °C, which was achieved in mid-January, and a minimum of
10.0 °C in early September. The mean water temperature over this six month period was
18.3 °C.
. The mean water temperature at the
northern site over the short term study period was 17.5 °C, with maximum and
minimum recorded temperatures of 20.6 and 14.5 °C respectively.
Conductivity
Conductivity in Totara Lagoon decreased significantly in terms of variability and
absolute values with distance from the lagoon entrance (Figure 4.9). At Totara South
conductivity varied largely with tidal cycle, from a maximum of 33.9 mS cm-1 to a
minimum of 0.181 mS cm-1. The mean value over the study period was 6.97 mS cm-1.
This pattern was repeated at Totara Central, although the maxima reached were much
reduced and shorter in duration, and there was a time lag of approximately one hour
between Totara South and Totara Central. Conductivity at Totara Central ranged
between 16.0 and 0.414 mS cm-1 with a mean of 1.35 mS cm-1. Both these sites
experienced a period of consistently very low conductivity over the period December 5th

100
to 7th. Totara North exhibited consistently low conductivity throughout the December
study period, with a maximum and minimum of 1.05 and 0.111 mS cm -1 respectively,
and a mean of 0.712 mS cm -1. This changed little over the longer monitoring period
(Figure 4.10), with only 2 occasions on which the conductivity rose above 2.5 mS cm -1,
reaching a maximum of 2.83 mS cm -1 in late February. Minimum and mean values for
this period were 0.564 and 1.55 mS cm -1
.
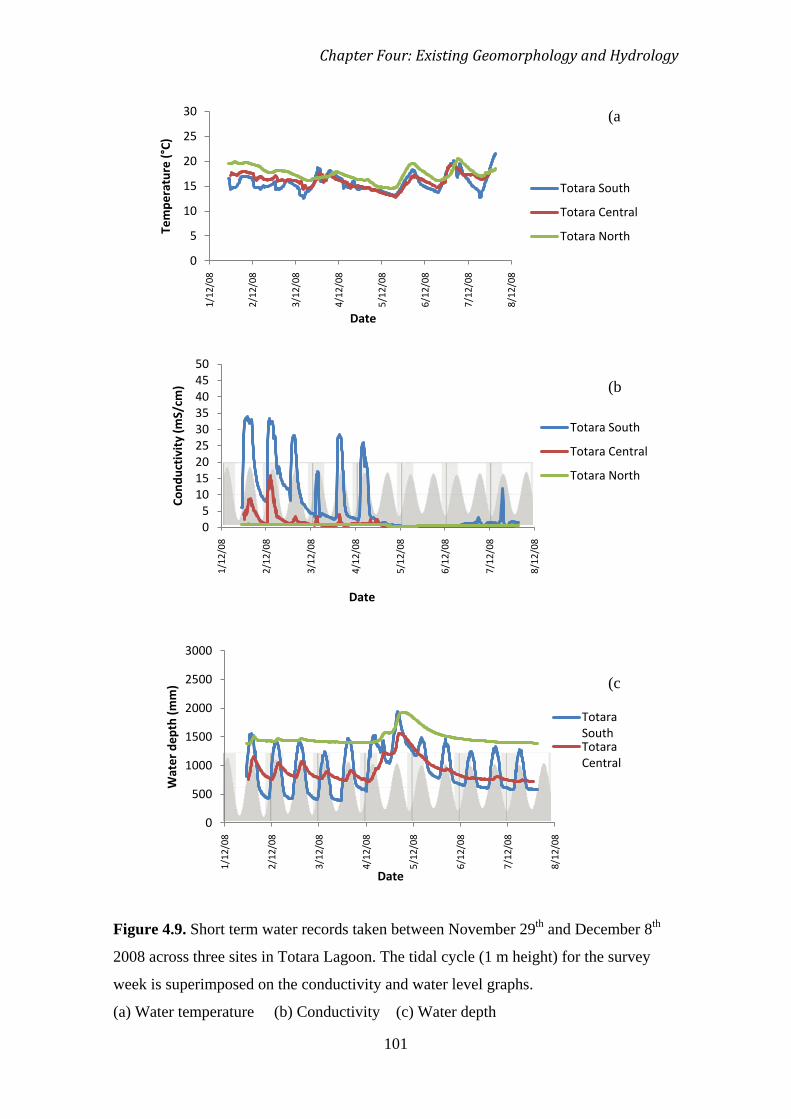
Chapter Four: Existing Geomorphology and Hydrology
101
Figure 4.9. Short term water records taken between November 29th and December 8th
2008 across three sites in Totara Lagoon. The tidal cycle (1 m height) for the survey
week is superimposed on the conductivity and water level graphs.
(a) Water temperature (b) Conductivity (c) Water depth
0
5
10
15
20
25
30
1/12
/08
2/12
/08
3/12
/08
4/12
/08
5/12
/08
6/12
/08
7/12
/08
8/12
/08
Tem
pera
ture
(°C)
Date
Totara South
Totara Central
Totara North
05
101520253035404550
1/12
/08
2/12
/08
3/12
/08
4/12
/08
5/12
/08
6/12
/08
7/12
/08
8/12
/08
Cond
ucti
vity
(mS/
cm)
Date
Totara South
Totara Central
Totara North
0
500
1000
1500
2000
2500
3000
1/12
/08
2/12
/08
3/12
/08
4/12
/08
5/12
/08
6/12
/08
7/12
/08
8/12
/08
Wat
er d
epth
(mm
)
Date
Totara SouthTotara Central
(c
(b
(a
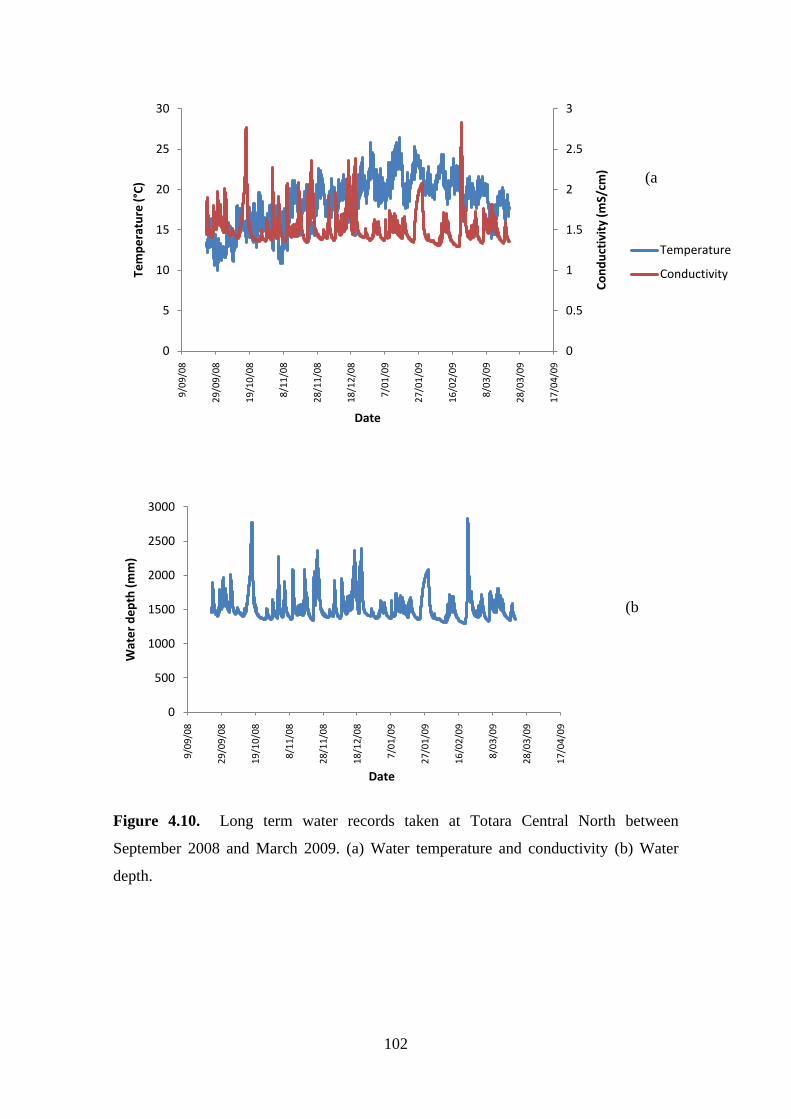
102
Figure 4.10. Long term water records taken at Totara Central North between
September 2008 and March 2009. (a) Water temperature and conductivity (b) Water
depth.
0
0.5
1
1.5
2
2.5
3
0
5
10
15
20
25
30
9/09
/08
29/0
9/08
19/1
0/08
8/11
/08
28/1
1/08
18/1
2/08
7/01
/09
27/0
1/09
16/0
2/09
8/03
/09
28/0
3/09
17/0
4/09
Cond
ucti
vity
(mS/
cm)
Tem
pera
ture
(°C)
Date
Temperature
Conductivity
0
500
1000
1500
2000
2500
3000
9/09
/08
29/0
9/08
19/1
0/08
8/11
/08
28/1
1/08
18/1
2/08
7/01
/09
27/0
1/09
16/0
2/09
8/03
/09
28/0
3/09
17/0
4/09
Wat
er d
epth
(mm
)
Date
(a
(b
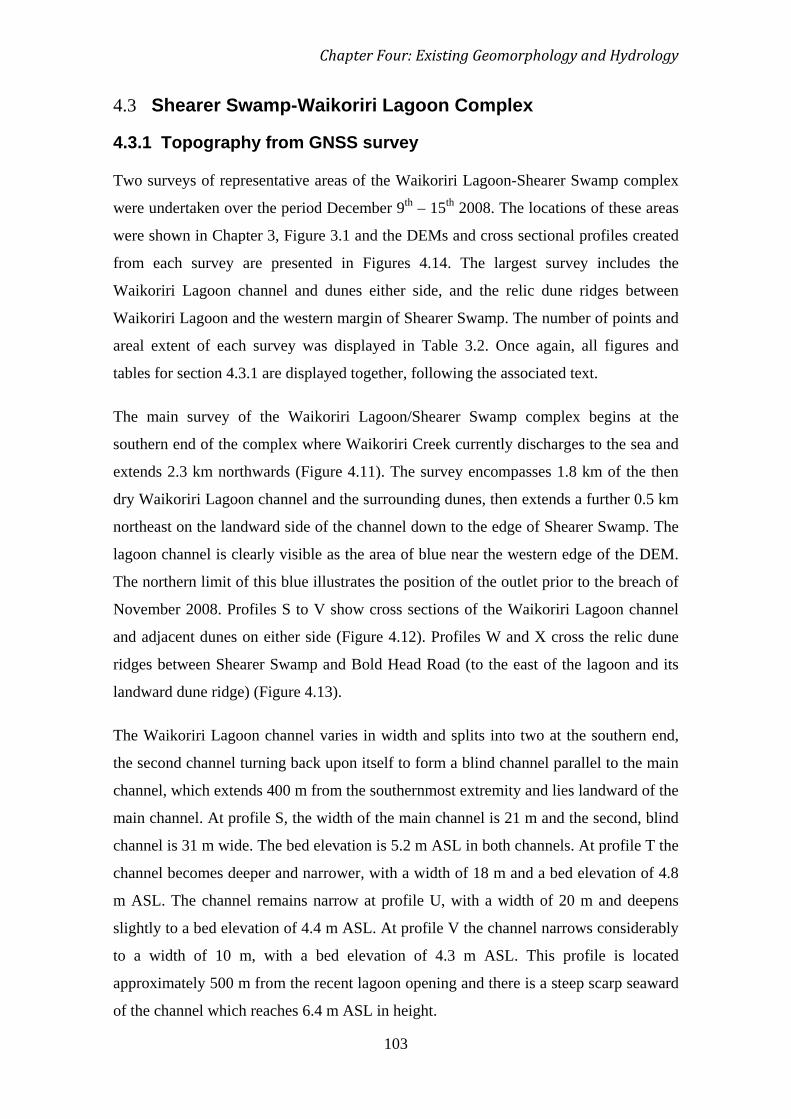
Chapter Four: Existing Geomorphology and Hydrology
103
4.3 Shearer Swamp-Waikoriri Lagoon Complex
4.3.1 Topography from GNSS survey
Two surveys of representative areas of the Waikoriri Lagoon-Shearer Swamp complex
were undertaken over the period December 9th – 15th
The main survey of the Waikoriri Lagoon/Shearer Swamp complex begins at the
southern end of the complex where Waikoriri Creek currently discharges to the sea and
extends 2.3 km northwards (Figure 4.11). The survey encompasses 1.8 km of the then
dry Waikoriri Lagoon channel and the surrounding dunes, then extends a further 0.5 km
northeast on the landward side of the channel down to the edge of Shearer Swamp. The
lagoon channel is clearly visible as the area of blue near the western edge of the DEM.
The northern limit of this blue illustrates the position of the outlet prior to the breach of
November 2008. Profiles S to V show cross sections of the Waikoriri Lagoon channel
and adjacent dunes on either side (Figure 4.12). Profiles W and X cross the relic dune
ridges between Shearer Swamp and Bold Head Road (to the east of the lagoon and its
landward dune ridge) (Figure 4.13).
2008. The locations of these areas
were shown in Chapter 3, Figure 3.1 and the DEMs and cross sectional profiles created
from each survey are presented in Figures 4.14. The largest survey includes the
Waikoriri Lagoon channel and dunes either side, and the relic dune ridges between
Waikoriri Lagoon and the western margin of Shearer Swamp. The number of points and
areal extent of each survey was displayed in Table 3.2. Once again, all figures and
tables for section 4.3.1 are displayed together, following the associated text.
The Waikoriri Lagoon channel varies in width and splits into two at the southern end,
the second channel turning back upon itself to form a blind channel parallel to the main
channel, which extends 400 m from the southernmost extremity and lies landward of the
main channel. At profile S, the width of the main channel is 21 m and the second, blind
channel is 31 m wide. The bed elevation is 5.2 m ASL in both channels. At profile T the
channel becomes deeper and narrower, with a width of 18 m and a bed elevation of 4.8
m ASL. The channel remains narrow at profile U, with a width of 20 m and deepens
slightly to a bed elevation of 4.4 m ASL. At profile V the channel narrows considerably
to a width of 10 m, with a bed elevation of 4.3 m ASL. This profile is located
approximately 500 m from the recent lagoon opening and there is a steep scarp seaward
of the channel which reaches 6.4 m ASL in height.
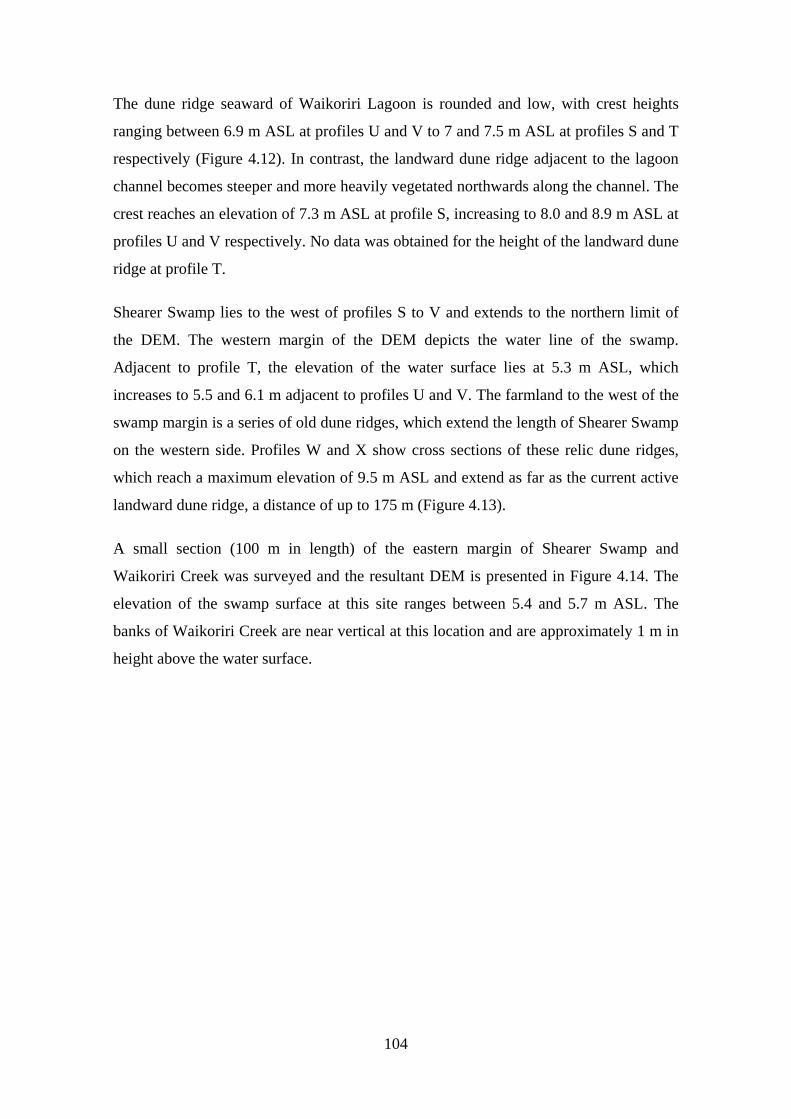
104
The dune ridge seaward of Waikoriri Lagoon is rounded and low, with crest heights
ranging between 6.9 m ASL at profiles U and V to 7 and 7.5 m ASL at profiles S and T
respectively (Figure 4.12). In contrast, the landward dune ridge adjacent to the lagoon
channel becomes steeper and more heavily vegetated northwards along the channel. The
crest reaches an elevation of 7.3 m ASL at profile S, increasing to 8.0 and 8.9 m ASL at
profiles U and V respectively. No data was obtained for the height of the landward dune
ridge at profile T.
Shearer Swamp lies to the west of profiles S to V and extends to the northern limit of
the DEM. The western margin of the DEM depicts the water line of the swamp.
Adjacent to profile T, the elevation of the water surface lies at 5.3 m ASL, which
increases to 5.5 and 6.1 m adjacent to profiles U and V. The farmland to the west of the
swamp margin is a series of old dune ridges, which extend the length of Shearer Swamp
on the western side. Profiles W and X show cross sections of these relic dune ridges,
which reach a maximum elevation of 9.5 m ASL and extend as far as the current active
landward dune ridge, a distance of up to 175 m (Figure 4.13).
A small section (100 m in length) of the eastern margin of Shearer Swamp and
Waikoriri Creek was surveyed and the resultant DEM is presented in Figure 4.14. The
elevation of the swamp surface at this site ranges between 5.4 and 5.7 m ASL. The
banks of Waikoriri Creek are near vertical at this location and are approximately 1 m in
height above the water surface.
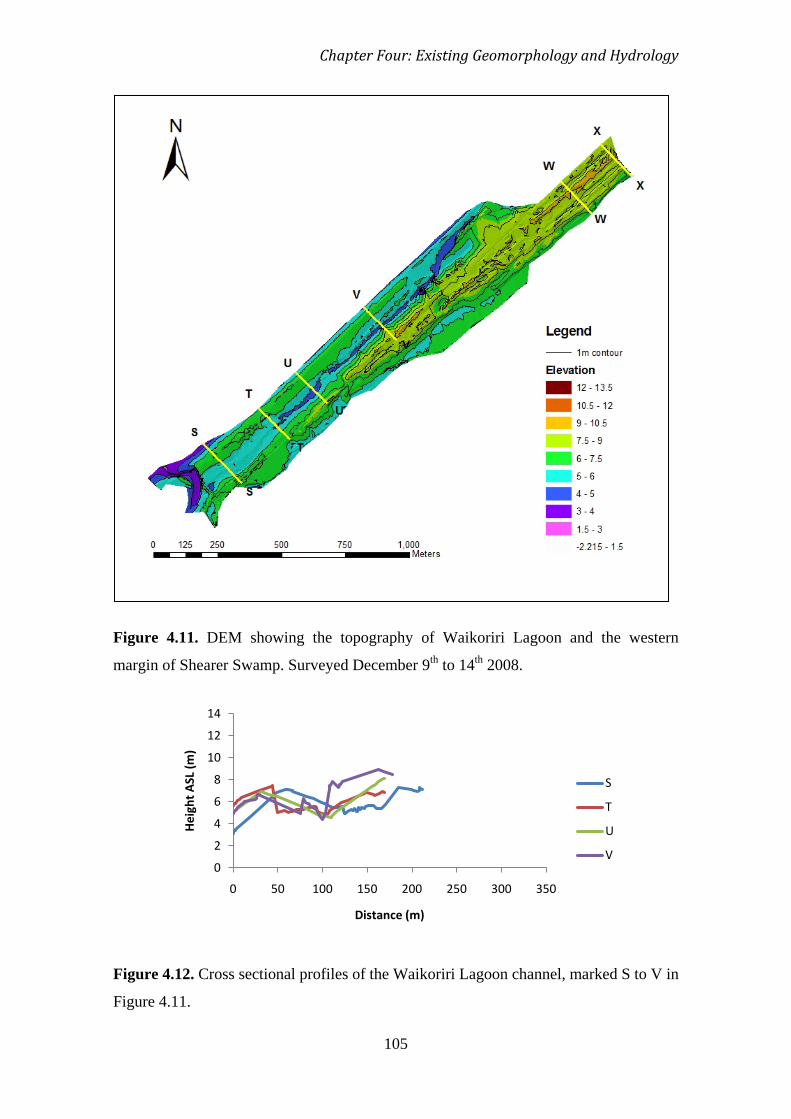
Chapter Four: Existing Geomorphology and Hydrology
105
Figure 4.11. DEM showing the topography of Waikoriri Lagoon and the western
margin of Shearer Swamp. Surveyed December 9th to 14th
2008.
Figure 4.12. Cross sectional profiles of the Waikoriri Lagoon channel, marked S to V in
Figure 4.11.
0
2
4
6
8
10
12
14
0 50 100 150 200 250 300 350
Hei
ght A
SL (m
)
Distance (m)
S
T
U
V
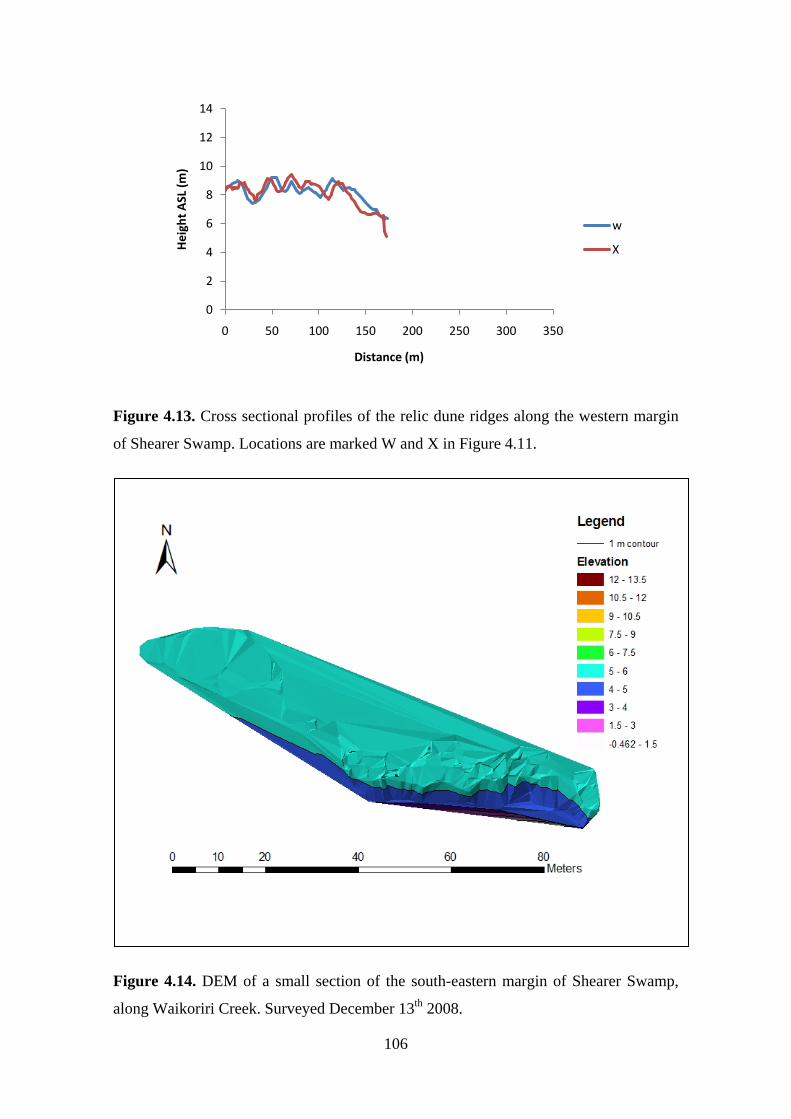
106
Figure 4.13. Cross sectional profiles of the relic dune ridges along the western margin
of Shearer Swamp. Locations are marked W and X in Figure 4.11.
Figure 4.14. DEM of a small section of the south-eastern margin of Shearer Swamp,
along Waikoriri Creek. Surveyed December 13th 2008.
0
2
4
6
8
10
12
14
0 50 100 150 200 250 300 350
Hei
ght A
SL (m
)
Distance (m)
w
X
Chapter Four: Existing Geomorphology and Hydrology
107
4.3.2 Water level and character records
Water level, temperature and conductivity measurements were taken at two sites in
Waikoriri Creek on the western edge of Shearer Swamp over the period of December 8th
– 15th 2008. Like Totara Lagoon, a longer term record was taken in Waikoriri Creek
under the Bold Head Road bridge at the southwest corner of Shearer Swamp. This
record spans a 6 month period from September 2008 - March 2009. Locations of these
water level recorders were displayed in Chapter 3, Figure 3.4, and the sites will be
referred to as Site 1, Site 2 and Waikoriri Bridge. Once again, data from the long term
record for the period December 8th-15th
Water level
was extracted and plotted with the short term
records to provide a comparison of water character at different locations within
Waikoriri Creek.
Absolute water level varied significantly between locations within Waikoriri Creek, but
the same general trend of a rapid rise water level at the beginning of the study period
followed by a gradual decline was common to all three sites (Figure 4.16). Following
the stabilisation of water level after this decrease, Waikoriri Bridge and Site 1 showed a
tidal influence in water level changes. This was very prominent at Waikoriri Bridge,
where the water level changed by up to 1000 mm between low and high tide. Maximum
and minimum recorded values were 1179 and 281.9 mm respectively, with a mean of
406.6 mm. The tidal signal was dampened at Site 1, with water level varying by a
maximum of 550 mm over a tidal cycle. Water depth at Site 1 ranged between 1891 and
1113 mm, with a mean value of 1325 mm. Water level at Site 2 was subject to less
variation and was not influenced by tidal cycles at all, and ranged from a maximum of
902.8 mm to a minimum of 649.6 mm, with a mean level of 745.4 mm.
Results from the long term record at Waikoriri Bridge are divided into two time periods;
September to November 2008 and December 2008 to March 2009, as the recorder was
out of the water from early November until early December. When it was returned to
the water in early December 2008 the location was slightly downstream from the
bridge, thus the results from these two separate records cannot be directly connected.
Between September and November 2008 the water level showed several spikes on a
weekly timescale, decreasing over October before spiking again prior to drainage of the
creek in early November (Figure 4.17). No water level variation in response to the tidal
108
cycle was observed (Figure 4.15). The maximum recorded water level over this period
was 1465 mm with a mean of 937 mm. The minimum recorded value was 7 mm, which
was recorded as the creek drained and the recorder became exposed. Water level
showed a much greater level of variation between December and March, increasing and
decreasing up to 700 mm on scales of days to weeks. A comparatively long period of
stable high water level (approximately 1450 mm) occurred in January, before spiking to
the maximum recorded level of 1780 mm and promptly dropping back to base level.
The mean water level over this period was 804 mm.
Water temperature
Water temperature showed a very clear pattern of diurnal change in all three sites
(Figure 4.16). The temperature at Site 1 and Waikoriri Bridge remained consistently the
same throughout the entire period. Temperatures at these two sites ranged between a
maximum of 17.9 °C and a minimum of 13.0 °C, with a mean of 15.4 °C. The record
from Site 2 followed the same temporal trend, but remained between 1 and 3 °C warmer
than Site 1 and Waikoriri Bridge at all times during the study period. Water at Site 2
ranged between 20.4 and 14.9 °C, with a mean of 18.1 °C.
The long term record at Waikoriri Bridge showed a seasonal trend, reaching warmest
temperatures over the summer months of December and January (Figure 4.17). The
maximum temperature recorded was 20.3 °C, which occurred several times in late
January, with a minimum of 9.4 °C recorded overnight in late September. The mean
temperature over the study period was 15.2 °C. Temperatures were much cooler over
the September to November period (maximum of 16.7 °C and mean of 12.4 °C) than
over December to March (minimum of 12.2 °C and mean of 16.5 °C). There was a
diurnal trend in temperature, overlain by a longer, synoptic trend. A period of
consistently warm temperatures and less variation coincided with the recorded period of
high water level in February.
Conductivity
Conductivity was extremely low at all three sites for the majority of the study period,
remaining close to zero at Sites 1 and 2 for the entire duration (Figure 4.16). Values
ranged between 0.01 and 0.06 mS cm-1 at Site 1 and between 0.02 and 0.04 mS cm-1 at
Site 2. The mean value for both sites was 0.03 mS cm-1. Waikoriri Bridge experienced
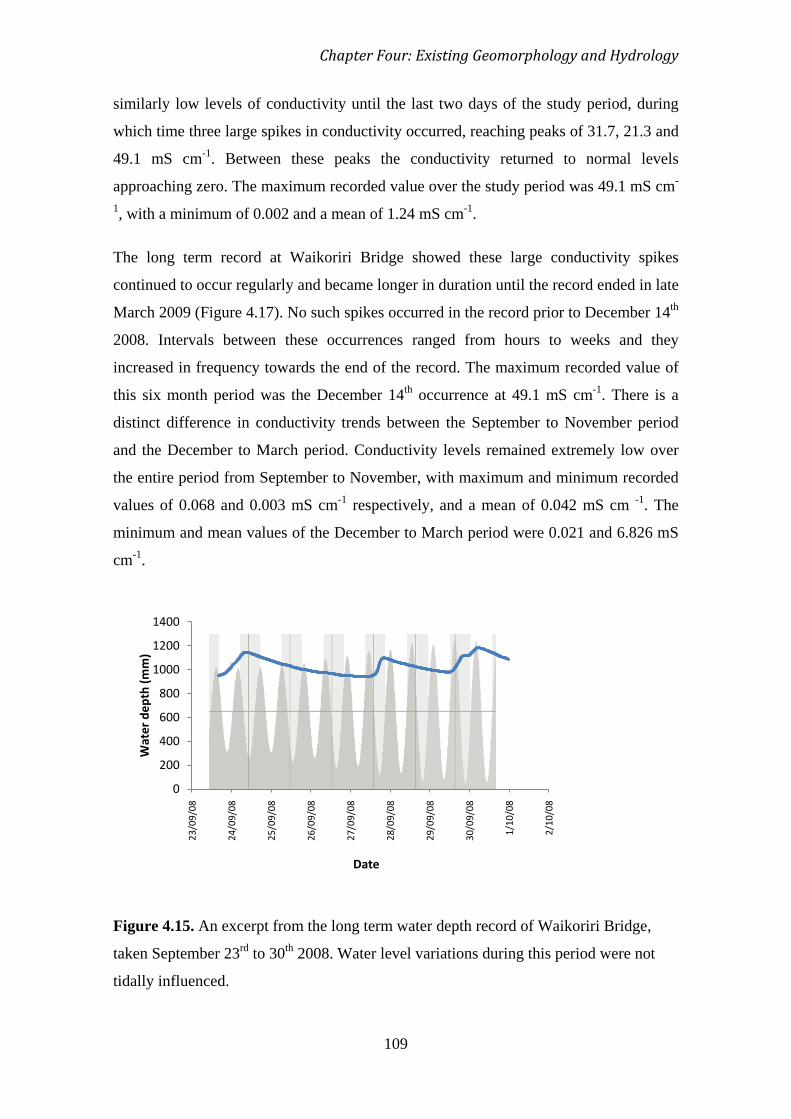
Chapter Four: Existing Geomorphology and Hydrology
109
similarly low levels of conductivity until the last two days of the study period, during
which time three large spikes in conductivity occurred, reaching peaks of 31.7, 21.3 and
49.1 mS cm-1. Between these peaks the conductivity returned to normal levels
approaching zero. The maximum recorded value over the study period was 49.1 mS cm-
1, with a minimum of 0.002 and a mean of 1.24 mS cm-1
The long term record at Waikoriri Bridge showed these large conductivity spikes
continued to occur regularly and became longer in duration until the record ended in late
March 2009 (Figure 4.17). No such spikes occurred in the record prior to December 14
.
th
2008. Intervals between these occurrences ranged from hours to weeks and they
increased in frequency towards the end of the record. The maximum recorded value of
this six month period was the December 14th occurrence at 49.1 mS cm-1. There is a
distinct difference in conductivity trends between the September to November period
and the December to March period. Conductivity levels remained extremely low over
the entire period from September to November, with maximum and minimum recorded
values of 0.068 and 0.003 mS cm-1 respectively, and a mean of 0.042 mS cm -1. The
minimum and mean values of the December to March period were 0.021 and 6.826 mS
cm-1
.
Figure 4.15. An excerpt from the long term water depth record of Waikoriri Bridge,
taken September 23rd to 30th 2008. Water level variations during this period were not
tidally influenced.
0
200
400
600
800
1000
1200
1400
23/0
9/08
24/0
9/08
25/0
9/08
26/0
9/08
27/0
9/08
28/0
9/08
29/0
9/08
30/0
9/08
1/10
/08
2/10
/08
Wat
er d
epth
(mm
)
Date
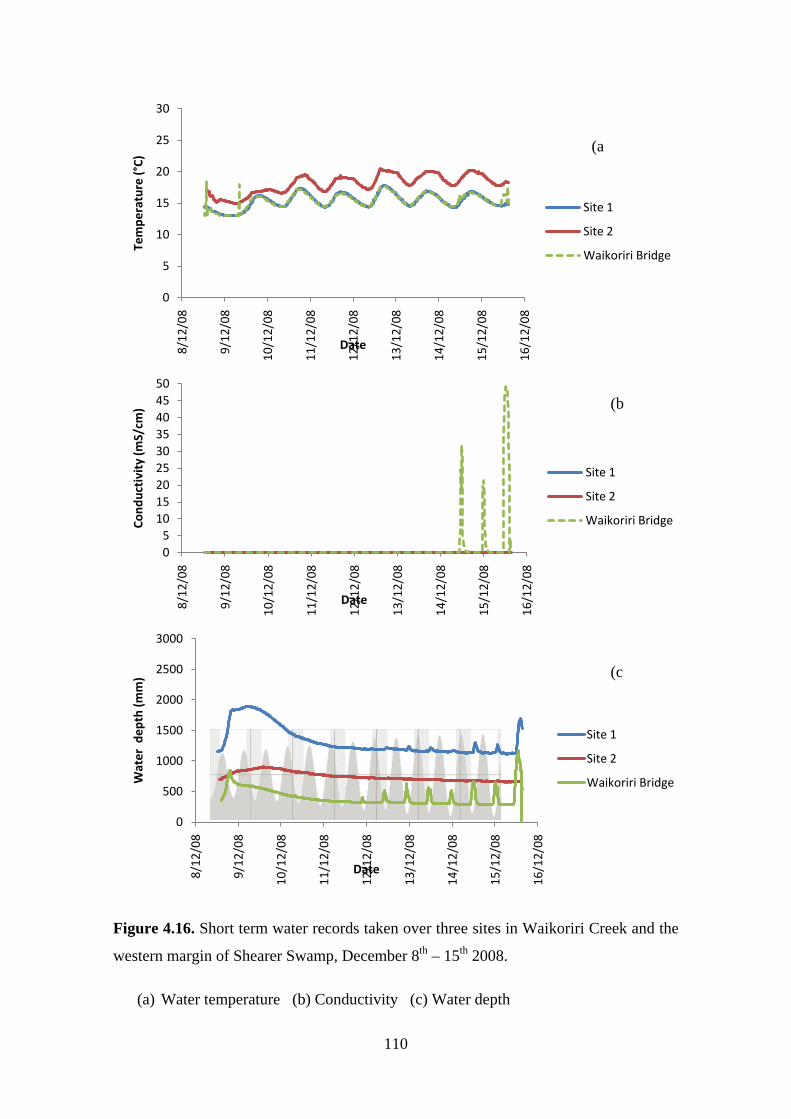
110
Figure 4.16. Short term water records taken over three sites in Waikoriri Creek and the
western margin of Shearer Swamp, December 8th – 15th
(a) Water temperature (b) Conductivity (c) Water depth
2008.
0
5
10
15
20
25
30
8/12
/08
9/12
/08
10/1
2/08
11/1
2/08
12/1
2/08
13/1
2/08
14/1
2/08
15/1
2/08
16/1
2/08
Tem
pera
ture
(°C)
Date
Site 1
Site 2
Waikoriri Bridge
05
101520253035404550
8/12
/08
9/12
/08
10/1
2/08
11/1
2/08
12/1
2/08
13/1
2/08
14/1
2/08
15/1
2/08
16/1
2/08
Cond
ucti
vity
(mS/
cm)
Date
Site 1
Site 2
Waikoriri Bridge
0
500
1000
1500
2000
2500
3000
8/12
/08
9/12
/08
10/1
2/08
11/1
2/08
12/1
2/08
13/1
2/08
14/1
2/08
15/1
2/08
16/1
2/08
Wat
er d
epth
(mm
)
Date
Site 1
Site 2
Waikoriri Bridge
(a
(b
(c

Chapter Four: Existing Geomorphology and Hydrology
111
Figure 4.17. Long term water records taken at Waikoriri Bridge between September
2008 and March 2009. Data from November and early December 2008 has been
removed. (a) Water temperature and conductivity. (b) Water depth
0
5
10
15
20
25
30
35
40
45
50
0
5
10
15
20
25
9/09
/08
29/0
9/08
19/1
0/08
8/11
/08
28/1
1/08
18/1
2/08
7/01
/09
27/0
1/09
16/0
2/09
8/03
/09
28/0
3/09
17/0
4/09
Cond
ucit
ivit
y (m
S/cm
)
Tem
pera
ture
(°C)
Date
Temperature
Conductivity
0
500
1000
1500
2000
2500
3000
9/09
/200
8
29/0
9/20
08
19/1
0/20
08
8/11
/200
8
28/1
1/20
08
18/1
2/20
08
7/01
/200
9
27/0
1/20
09
16/0
2/20
09
8/03
/200
9
28/0
3/20
09
17/0
4/20
09
Wat
er d
epth
(mm
)
Date
(b
(a
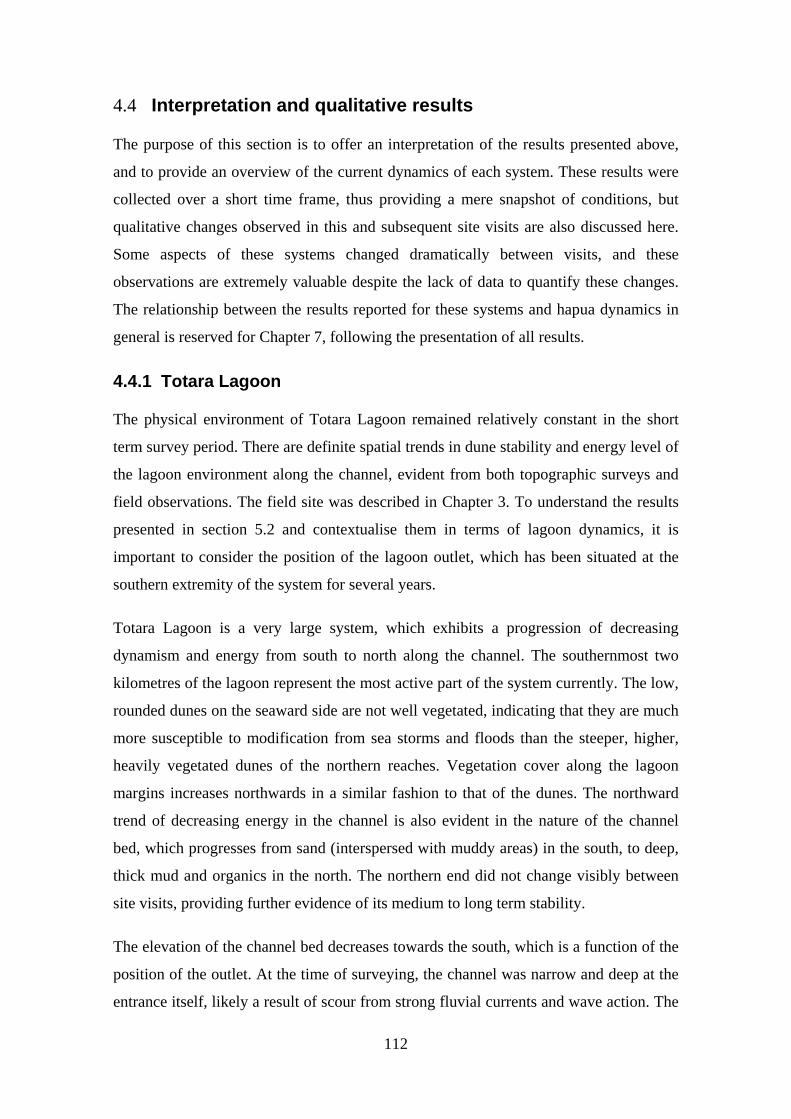
112
4.4 Interpretation and qualitative results
The purpose of this section is to offer an interpretation of the results presented above,
and to provide an overview of the current dynamics of each system. These results were
collected over a short time frame, thus providing a mere snapshot of conditions, but
qualitative changes observed in this and subsequent site visits are also discussed here.
Some aspects of these systems changed dramatically between visits, and these
observations are extremely valuable despite the lack of data to quantify these changes.
The relationship between the results reported for these systems and hapua dynamics in
general is reserved for Chapter 7, following the presentation of all results.
4.4.1 Totara Lagoon
The physical environment of Totara Lagoon remained relatively constant in the short
term survey period. There are definite spatial trends in dune stability and energy level of
the lagoon environment along the channel, evident from both topographic surveys and
field observations. The field site was described in Chapter 3. To understand the results
presented in section 5.2 and contextualise them in terms of lagoon dynamics, it is
important to consider the position of the lagoon outlet, which has been situated at the
southern extremity of the system for several years.
Totara Lagoon is a very large system, which exhibits a progression of decreasing
dynamism and energy from south to north along the channel. The southernmost two
kilometres of the lagoon represent the most active part of the system currently. The low,
rounded dunes on the seaward side are not well vegetated, indicating that they are much
more susceptible to modification from sea storms and floods than the steeper, higher,
heavily vegetated dunes of the northern reaches. Vegetation cover along the lagoon
margins increases northwards in a similar fashion to that of the dunes. The northward
trend of decreasing energy in the channel is also evident in the nature of the channel
bed, which progresses from sand (interspersed with muddy areas) in the south, to deep,
thick mud and organics in the north. The northern end did not change visibly between
site visits, providing further evidence of its medium to long term stability.
The elevation of the channel bed decreases towards the south, which is a function of the
position of the outlet. At the time of surveying, the channel was narrow and deep at the
entrance itself, likely a result of scour from strong fluvial currents and wave action. The
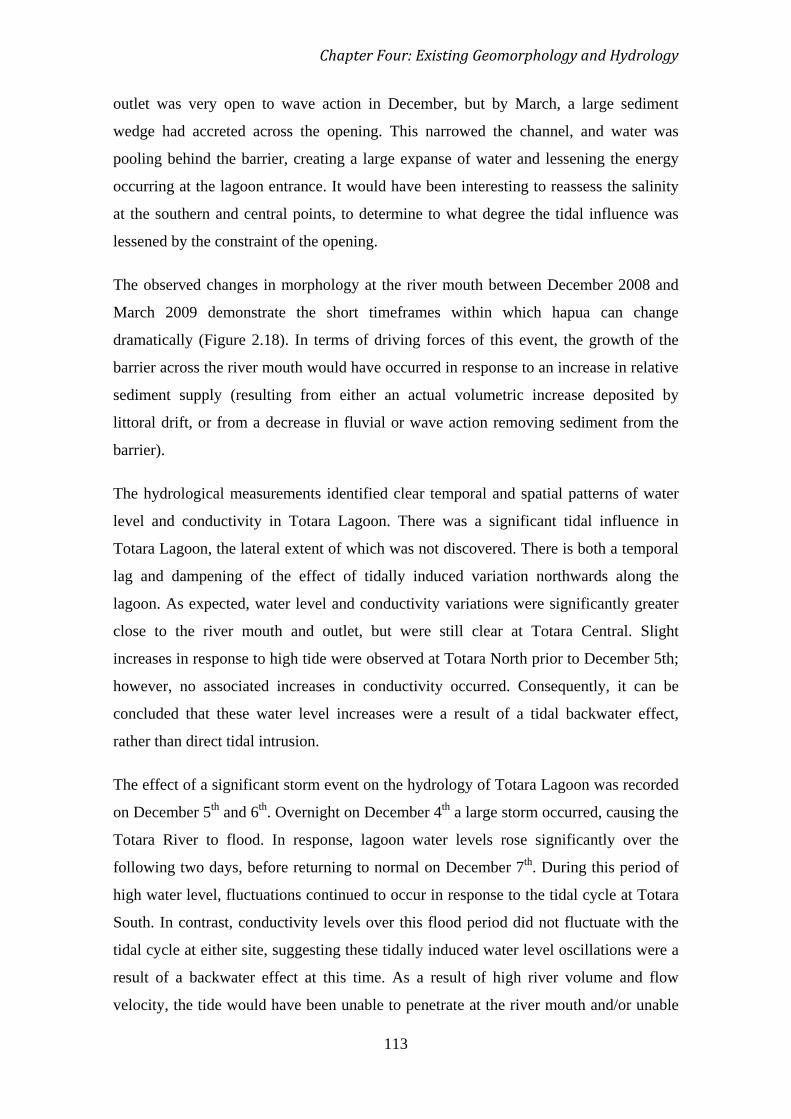
Chapter Four: Existing Geomorphology and Hydrology
113
outlet was very open to wave action in December, but by March, a large sediment
wedge had accreted across the opening. This narrowed the channel, and water was
pooling behind the barrier, creating a large expanse of water and lessening the energy
occurring at the lagoon entrance. It would have been interesting to reassess the salinity
at the southern and central points, to determine to what degree the tidal influence was
lessened by the constraint of the opening.
The observed changes in morphology at the river mouth between December 2008 and
March 2009 demonstrate the short timeframes within which hapua can change
dramatically (Figure 2.18). In terms of driving forces of this event, the growth of the
barrier across the river mouth would have occurred in response to an increase in relative
sediment supply (resulting from either an actual volumetric increase deposited by
littoral drift, or from a decrease in fluvial or wave action removing sediment from the
barrier).
The hydrological measurements identified clear temporal and spatial patterns of water
level and conductivity in Totara Lagoon. There was a significant tidal influence in
Totara Lagoon, the lateral extent of which was not discovered. There is both a temporal
lag and dampening of the effect of tidally induced variation northwards along the
lagoon. As expected, water level and conductivity variations were significantly greater
close to the river mouth and outlet, but were still clear at Totara Central. Slight
increases in response to high tide were observed at Totara North prior to December 5th;
however, no associated increases in conductivity occurred. Consequently, it can be
concluded that these water level increases were a result of a tidal backwater effect,
rather than direct tidal intrusion.
The effect of a significant storm event on the hydrology of Totara Lagoon was recorded
on December 5th and 6th. Overnight on December 4th a large storm occurred, causing the
Totara River to flood. In response, lagoon water levels rose significantly over the
following two days, before returning to normal on December 7th. During this period of
high water level, fluctuations continued to occur in response to the tidal cycle at Totara
South. In contrast, conductivity levels over this flood period did not fluctuate with the
tidal cycle at either site, suggesting these tidally induced water level oscillations were a
result of a backwater effect at this time. As a result of high river volume and flow
velocity, the tide would have been unable to penetrate at the river mouth and/or unable
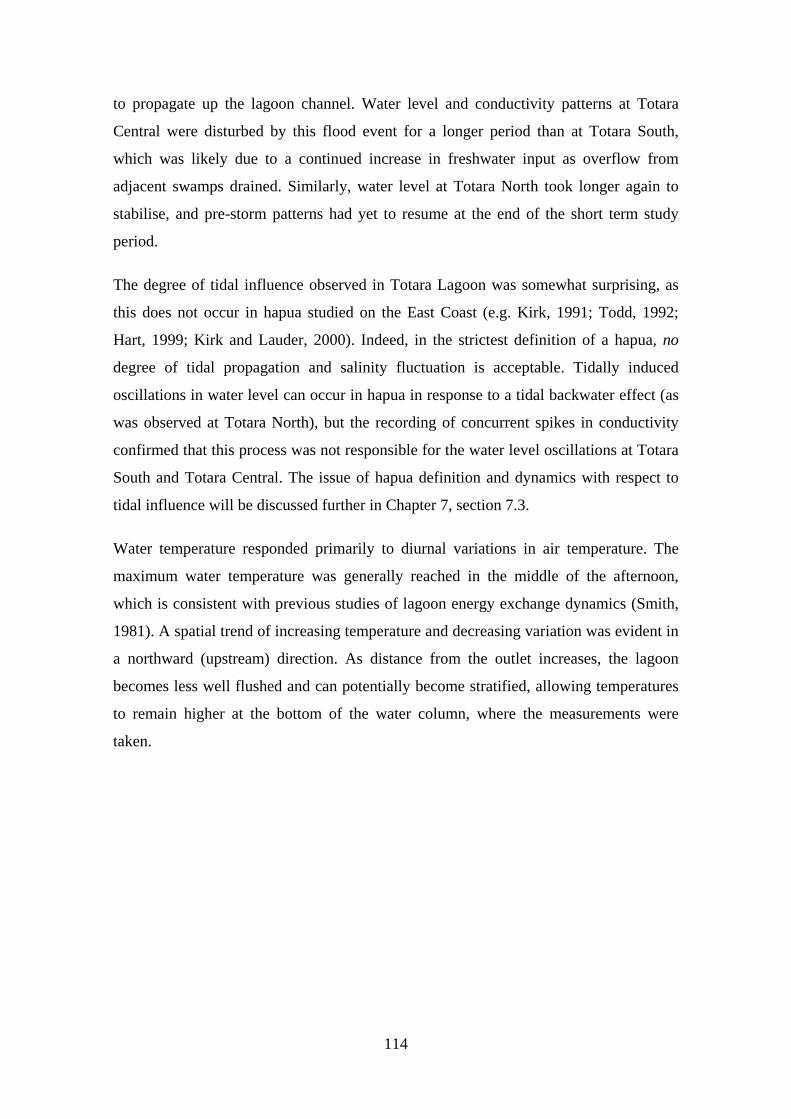
114
to propagate up the lagoon channel. Water level and conductivity patterns at Totara
Central were disturbed by this flood event for a longer period than at Totara South,
which was likely due to a continued increase in freshwater input as overflow from
adjacent swamps drained. Similarly, water level at Totara North took longer again to
stabilise, and pre-storm patterns had yet to resume at the end of the short term study
period.
The degree of tidal influence observed in Totara Lagoon was somewhat surprising, as
this does not occur in hapua studied on the East Coast (e.g. Kirk, 1991; Todd, 1992;
Hart, 1999; Kirk and Lauder, 2000). Indeed, in the strictest definition of a hapua, no
degree of tidal propagation and salinity fluctuation is acceptable. Tidally induced
oscillations in water level can occur in hapua in response to a tidal backwater effect (as
was observed at Totara North), but the recording of concurrent spikes in conductivity
confirmed that this process was not responsible for the water level oscillations at Totara
South and Totara Central. The issue of hapua definition and dynamics with respect to
tidal influence will be discussed further in Chapter 7, section 7.3.
Water temperature responded primarily to diurnal variations in air temperature. The
maximum water temperature was generally reached in the middle of the afternoon,
which is consistent with previous studies of lagoon energy exchange dynamics (Smith,
1981). A spatial trend of increasing temperature and decreasing variation was evident in
a northward (upstream) direction. As distance from the outlet increases, the lagoon
becomes less well flushed and can potentially become stratified, allowing temperatures
to remain higher at the bottom of the water column, where the measurements were
taken.
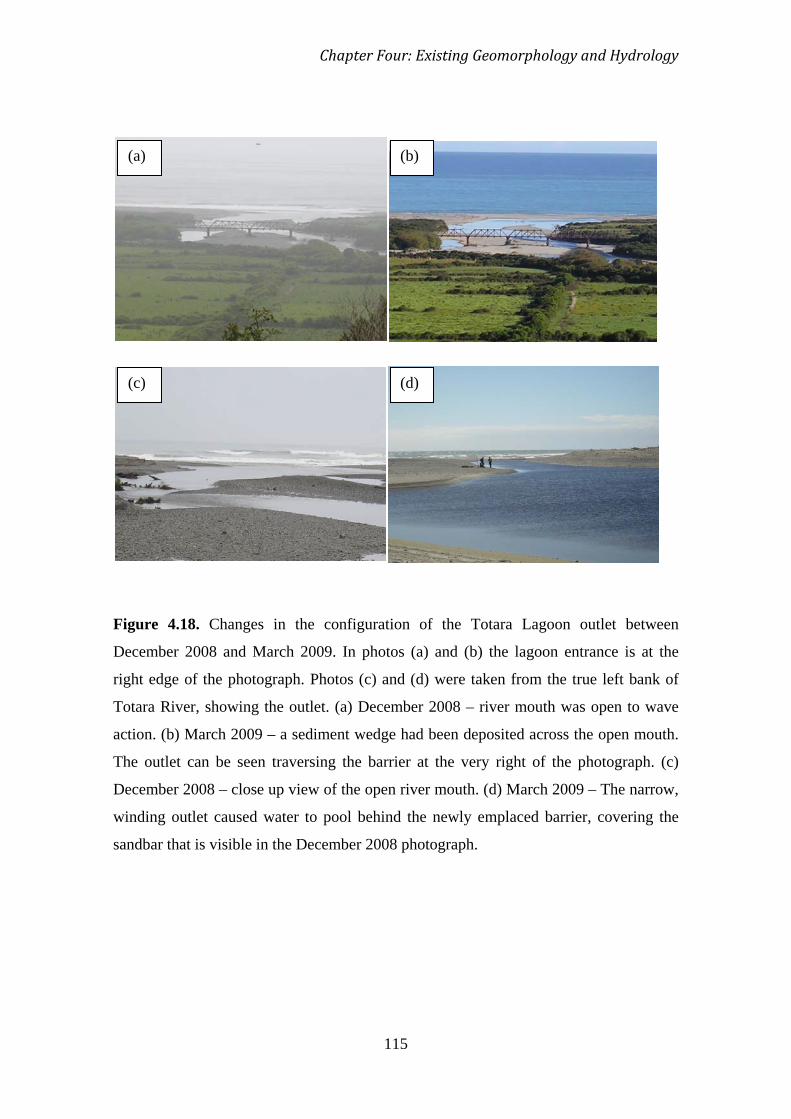
Chapter Four: Existing Geomorphology and Hydrology
115
Figure 4.18. Changes in the configuration of the Totara Lagoon outlet between
December 2008 and March 2009. In photos (a) and (b) the lagoon entrance is at the
right edge of the photograph. Photos (c) and (d) were taken from the true left bank of
Totara River, showing the outlet. (a) December 2008 – river mouth was open to wave
action. (b) March 2009 – a sediment wedge had been deposited across the open mouth.
The outlet can be seen traversing the barrier at the very right of the photograph. (c)
December 2008 – close up view of the open river mouth. (d) March 2009 – The narrow,
winding outlet caused water to pool behind the newly emplaced barrier, covering the
sandbar that is visible in the December 2008 photograph.
(a) (b)
(d) (c)
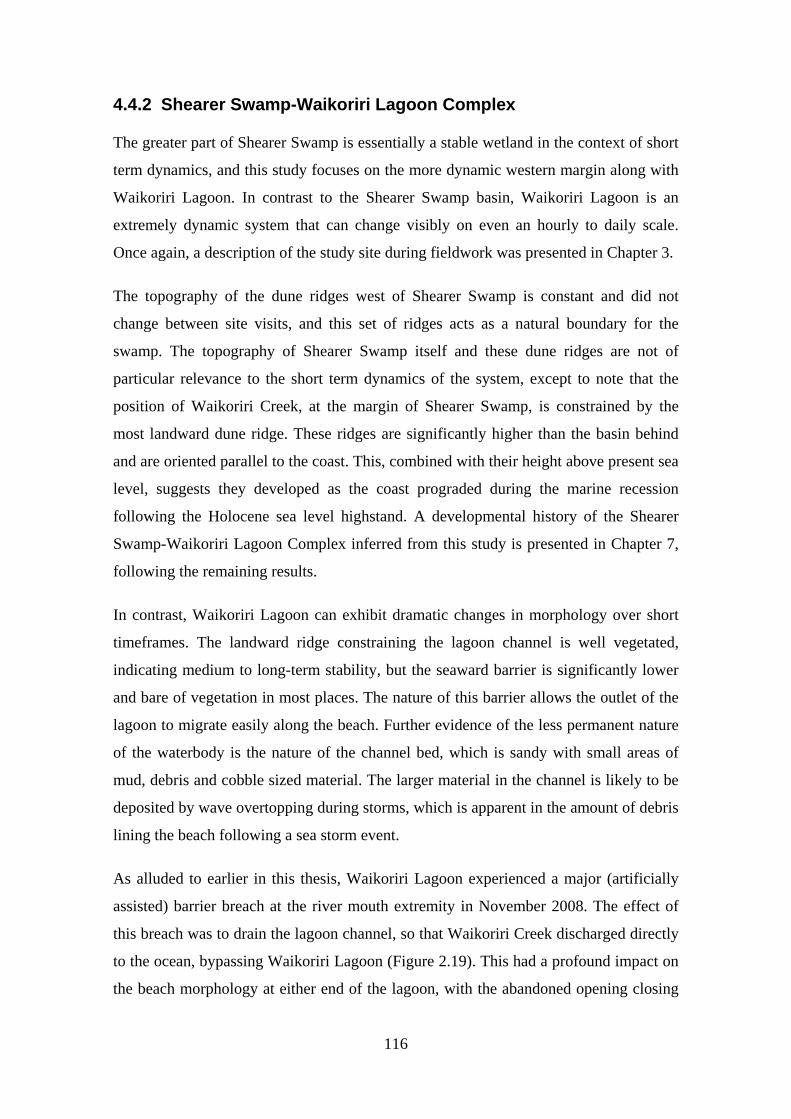
116
4.4.2 Shearer Swamp-Waikoriri Lagoon Complex
The greater part of Shearer Swamp is essentially a stable wetland in the context of short
term dynamics, and this study focuses on the more dynamic western margin along with
Waikoriri Lagoon. In contrast to the Shearer Swamp basin, Waikoriri Lagoon is an
extremely dynamic system that can change visibly on even an hourly to daily scale.
Once again, a description of the study site during fieldwork was presented in Chapter 3.
The topography of the dune ridges west of Shearer Swamp is constant and did not
change between site visits, and this set of ridges acts as a natural boundary for the
swamp. The topography of Shearer Swamp itself and these dune ridges are not of
particular relevance to the short term dynamics of the system, except to note that the
position of Waikoriri Creek, at the margin of Shearer Swamp, is constrained by the
most landward dune ridge. These ridges are significantly higher than the basin behind
and are oriented parallel to the coast. This, combined with their height above present sea
level, suggests they developed as the coast prograded during the marine recession
following the Holocene sea level highstand. A developmental history of the Shearer
Swamp-Waikoriri Lagoon Complex inferred from this study is presented in Chapter 7,
following the remaining results.
In contrast, Waikoriri Lagoon can exhibit dramatic changes in morphology over short
timeframes. The landward ridge constraining the lagoon channel is well vegetated,
indicating medium to long-term stability, but the seaward barrier is significantly lower
and bare of vegetation in most places. The nature of this barrier allows the outlet of the
lagoon to migrate easily along the beach. Further evidence of the less permanent nature
of the waterbody is the nature of the channel bed, which is sandy with small areas of
mud, debris and cobble sized material. The larger material in the channel is likely to be
deposited by wave overtopping during storms, which is apparent in the amount of debris
lining the beach following a sea storm event.
As alluded to earlier in this thesis, Waikoriri Lagoon experienced a major (artificially
assisted) barrier breach at the river mouth extremity in November 2008. The effect of
this breach was to drain the lagoon channel, so that Waikoriri Creek discharged directly
to the ocean, bypassing Waikoriri Lagoon (Figure 2.19). This had a profound impact on
the beach morphology at either end of the lagoon, with the abandoned opening closing
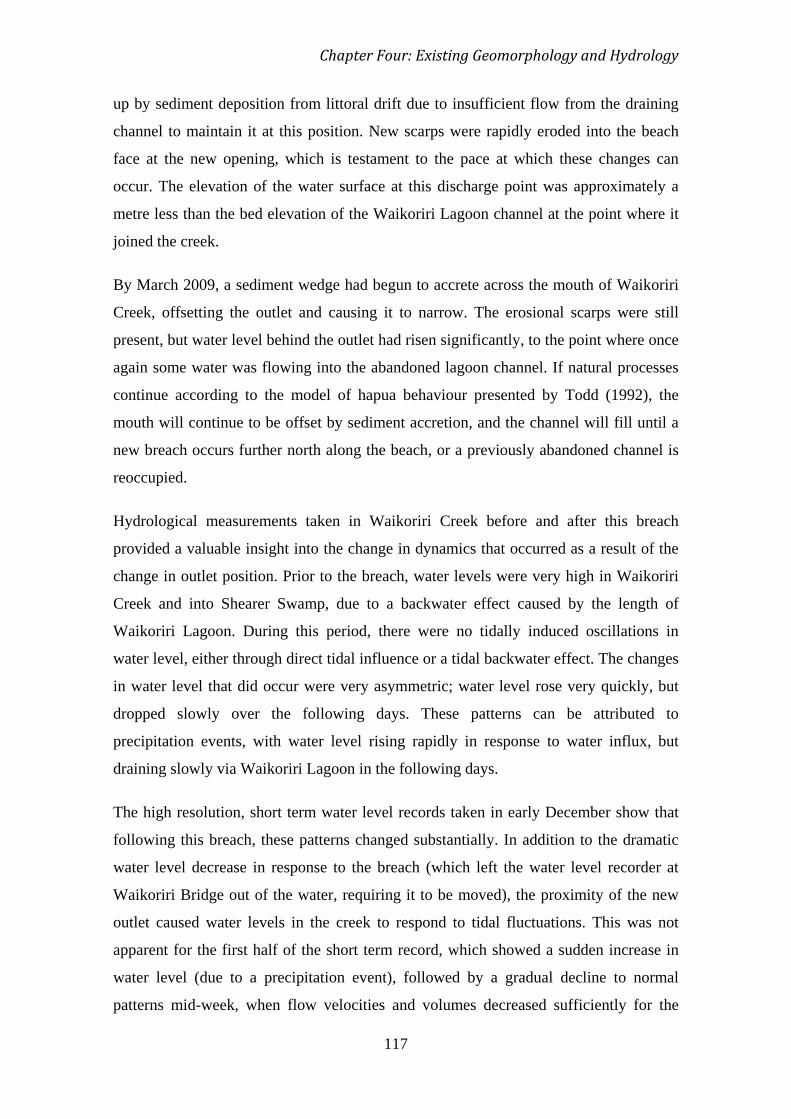
Chapter Four: Existing Geomorphology and Hydrology
117
up by sediment deposition from littoral drift due to insufficient flow from the draining
channel to maintain it at this position. New scarps were rapidly eroded into the beach
face at the new opening, which is testament to the pace at which these changes can
occur. The elevation of the water surface at this discharge point was approximately a
metre less than the bed elevation of the Waikoriri Lagoon channel at the point where it
joined the creek.
By March 2009, a sediment wedge had begun to accrete across the mouth of Waikoriri
Creek, offsetting the outlet and causing it to narrow. The erosional scarps were still
present, but water level behind the outlet had risen significantly, to the point where once
again some water was flowing into the abandoned lagoon channel. If natural processes
continue according to the model of hapua behaviour presented by Todd (1992), the
mouth will continue to be offset by sediment accretion, and the channel will fill until a
new breach occurs further north along the beach, or a previously abandoned channel is
reoccupied.
Hydrological measurements taken in Waikoriri Creek before and after this breach
provided a valuable insight into the change in dynamics that occurred as a result of the
change in outlet position. Prior to the breach, water levels were very high in Waikoriri
Creek and into Shearer Swamp, due to a backwater effect caused by the length of
Waikoriri Lagoon. During this period, there were no tidally induced oscillations in
water level, either through direct tidal influence or a tidal backwater effect. The changes
in water level that did occur were very asymmetric; water level rose very quickly, but
dropped slowly over the following days. These patterns can be attributed to
precipitation events, with water level rising rapidly in response to water influx, but
draining slowly via Waikoriri Lagoon in the following days.
The high resolution, short term water level records taken in early December show that
following this breach, these patterns changed substantially. In addition to the dramatic
water level decrease in response to the breach (which left the water level recorder at
Waikoriri Bridge out of the water, requiring it to be moved), the proximity of the new
outlet caused water levels in the creek to respond to tidal fluctuations. This was not
apparent for the first half of the short term record, which showed a sudden increase in
water level (due to a precipitation event), followed by a gradual decline to normal
patterns mid-week, when flow velocities and volumes decreased sufficiently for the
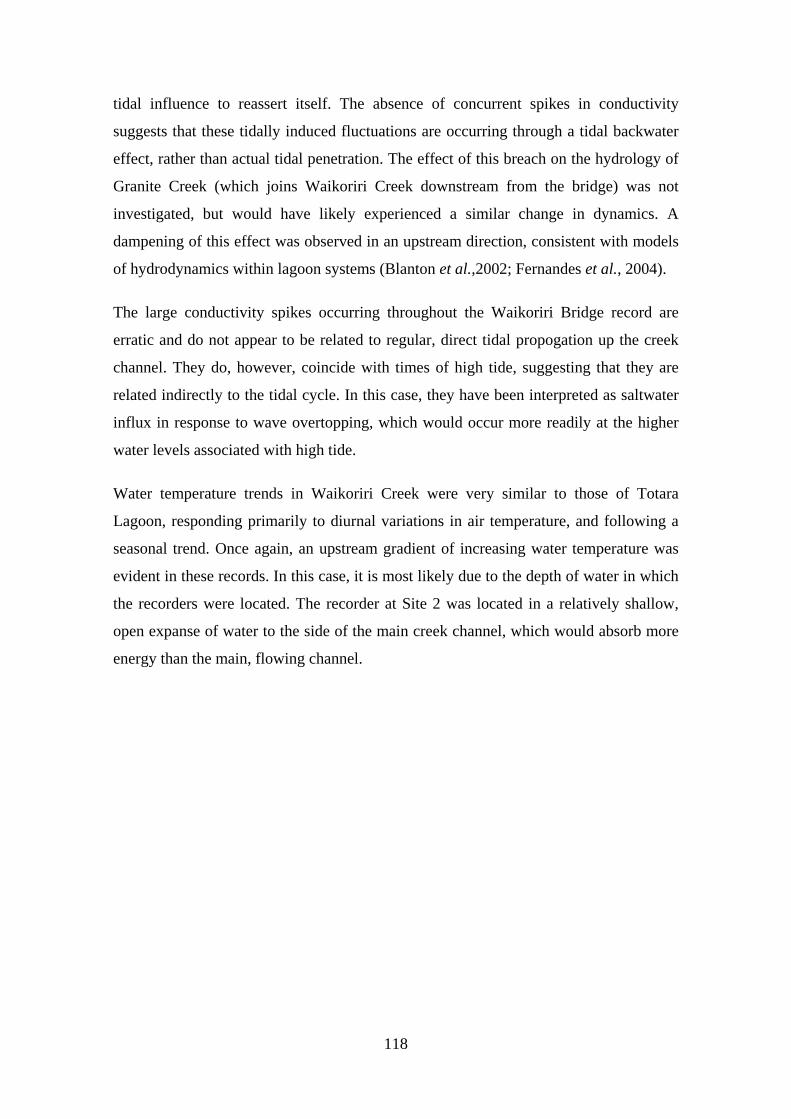
118
tidal influence to reassert itself. The absence of concurrent spikes in conductivity
suggests that these tidally induced fluctuations are occurring through a tidal backwater
effect, rather than actual tidal penetration. The effect of this breach on the hydrology of
Granite Creek (which joins Waikoriri Creek downstream from the bridge) was not
investigated, but would have likely experienced a similar change in dynamics. A
dampening of this effect was observed in an upstream direction, consistent with models
of hydrodynamics within lagoon systems (Blanton et al.,2002; Fernandes et al., 2004).
The large conductivity spikes occurring throughout the Waikoriri Bridge record are
erratic and do not appear to be related to regular, direct tidal propogation up the creek
channel. They do, however, coincide with times of high tide, suggesting that they are
related indirectly to the tidal cycle. In this case, they have been interpreted as saltwater
influx in response to wave overtopping, which would occur more readily at the higher
water levels associated with high tide.
Water temperature trends in Waikoriri Creek were very similar to those of Totara
Lagoon, responding primarily to diurnal variations in air temperature, and following a
seasonal trend. Once again, an upstream gradient of increasing water temperature was
evident in these records. In this case, it is most likely due to the depth of water in which
the recorders were located. The recorder at Site 2 was located in a relatively shallow,
open expanse of water to the side of the main creek channel, which would absorb more
energy than the main, flowing channel.
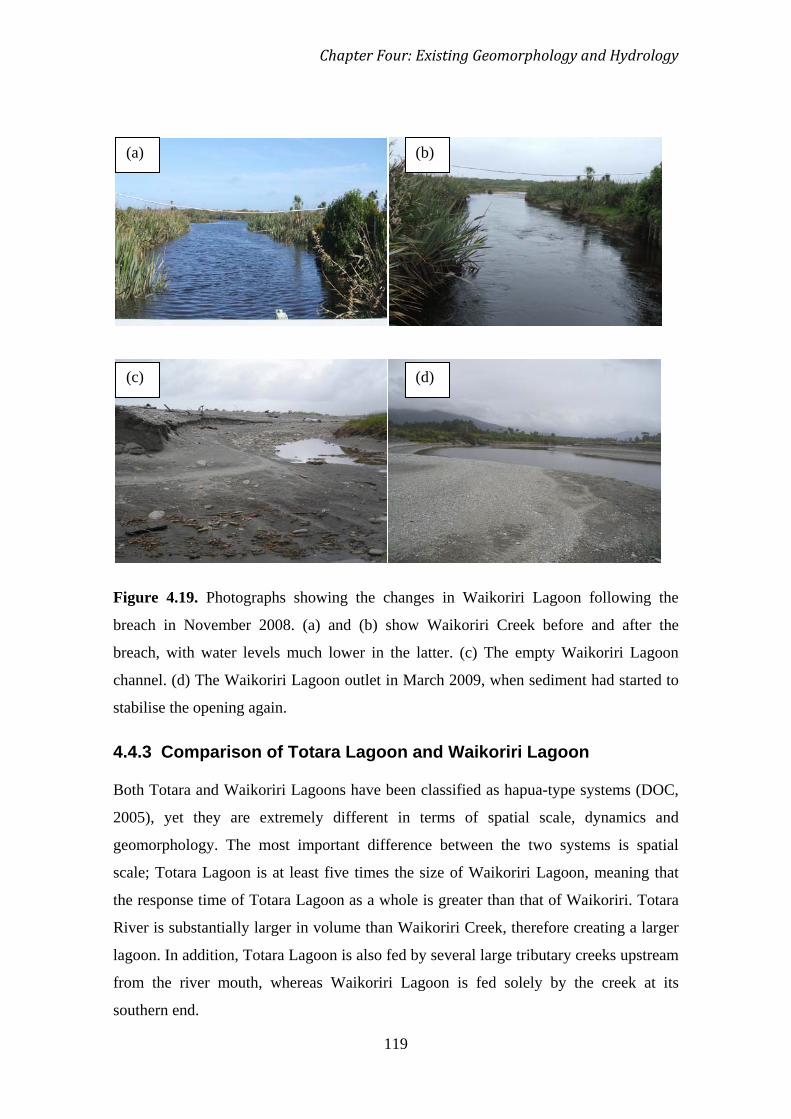
Chapter Four: Existing Geomorphology and Hydrology
119
Figure 4.19. Photographs showing the changes in Waikoriri Lagoon following the
breach in November 2008. (a) and (b) show Waikoriri Creek before and after the
breach, with water levels much lower in the latter. (c) The empty Waikoriri Lagoon
channel. (d) The Waikoriri Lagoon outlet in March 2009, when sediment had started to
stabilise the opening again.
4.4.3 Comparison of Totara Lagoon and Waikoriri Lagoon
Both Totara and Waikoriri Lagoons have been classified as hapua-type systems (DOC,
2005), yet they are extremely different in terms of spatial scale, dynamics and
geomorphology. The most important difference between the two systems is spatial
scale; Totara Lagoon is at least five times the size of Waikoriri Lagoon, meaning that
the response time of Totara Lagoon as a whole is greater than that of Waikoriri. Totara
River is substantially larger in volume than Waikoriri Creek, therefore creating a larger
lagoon. In addition, Totara Lagoon is also fed by several large tributary creeks upstream
from the river mouth, whereas Waikoriri Lagoon is fed solely by the creek at its
southern end.
(a) (b)
(c) (d)

120
The level of stability of the two systems differs largely, and this is apparent in the
morphology of the channels and the barriers, as well as field observations of vegetation
and other indicators. The length and volume of Totara Lagoon allows it to absorb the
effects of things like flood events more readily than a smaller system like Waikoriri
Lagoon. Moreover, Totara Lagoon is able to survive despite a sustained river mouth
outlet position, whereas Waikoriri Lagoon drains in response to such an outlet position.
The changes in conditions along the channel also vary between systems. Totara Lagoon
exhibits a substantial gradient of decreasing energy and increasing vegetation from
south to north, but Waikoriri Lagoon retains similar characteristics along its entire
length, suggesting a more dynamic and less developed regime.
Hydrologically, although these systems are both described as hapua, only Waikoriri
Lagoon currently fits that definition exactly. In contrast to Totara Lagoon, Waikoriri
Creek experienced no direct tidal intrusion at any stage of the study period. Another
significant difference existed between the water temperature trends of the two systems.
Waikoriri Creek responded almost exclusively to even, diurnal variations in air
temperature in the short term record, while the record of Totara Lagoon was overprinted
by some other factor driving variation. The diurnal trend was present, as was the spatial
trend of increasing temperature upstream, but a lot more noise was apparent in the data.
Part of this discrepancy in the earlier part of the Totara Lagoon record can be explained
by the influence of the December 4th
4.5 Summary
storm, which would have disrupted normal flow
and temperature patterns in the lagoon. However, despite these apparently large
differences, both systems generally exhibited similar spatial trends hydraulically, as
would be expected in a comparison of two hapua, regardless of their size.
This chapter described the current geomorphology and hydrological regime of Totara
Lagoon and the Shearer Swamp-Waikoriri Lagoon Complex, and presented the results
of GNSS surveys and water records of the two sites. DEMs of representative sections of
each site illustrated the topography, and water depth, conductivity and water
temperature records were used to explain the hydrology.
Totara Lagoon varied significantly in terms of both morphology and structure along its
10 km length. The system was much more dynamic and active at the river mouth
Chapter Four: Existing Geomorphology and Hydrology
121
(current outlet) end, constrained by low rounded dunes and subject to a significant
degree of tidal intrusion. The central sections were flat and swampy, but the channel
still experienced direct saltwater intrusion related to the tidal cycle. Further north, dunes
became steep and heavily vegetated, indicating a relatively high level of system stability
at this end. Water level was generally unaffected by tidal influence at this position;
however at times a backwater effect was observed.
Waikoriri Lagoon was much more dynamic than Totara Lagoon, which is a result of its
much smaller size and lesser degree of development and stability. Shearer Swamp and
the inactive dune ridges to the west are very stable in the short term, and act merely to
constrain the position of Waikoriri Creek. The hydrology of Waikoriri Creek upstream
from the lagoon is determined by the position of the lagoon outlet. When the outlet was
offset by 1.5 km, the water level in the creek was high, and no tidal influence was
detected. A breach at the creek mouth subsequently drained the lagoon, and water levels
dropped dramatically in the creek behind also. In addition, water levels in the creek
began responding to tidal oscillations via a backwater effect, which became
progressively dampened in an upstream direction.
Differences in dynamics and stability between the two lagoons will be further examined
over decadal timescales in Chapter 5, which examines outlet migration patterns over a
59 year period.
122
CHAPTER FIVE
Outlet and Channel Migration
1948 – 2006
5.1 Introduction
A detailed record of outlet migration and changes in lagoon channel structure is
fundamental to understanding the dynamics of any given hapua system. This chapter
presents the results of aerial photograph analyses for both Totara Lagoon and Waikoriri
Lagoon, undertaken using photographs from eight different survey years spanning a
time period of 59 years, and aims to document changes in these systems on
approximately a decadal scale. In some cases, photographs spanning a lesser time gap
were available, allowing a comparison over less than decadal timescales. Two different
approaches were taken to these analyses. Firstly, a visual comparison of lagoon
structure, area and outlet position was made between photographs and the changes
described. Secondly, quantitative measures of change in outlet position and lagoon
length were made in ArcGis and, where a clear progression could be seen, net rates of
change in outlet position were calculated. It is important to note that aerial photographs
represent snapshots of change, from which net changes can be inferred. Other changes
between survey years may have occurred that are unrecorded.
This chapter is divided into two main sections; with results pertaining to Totara Lagoon
presented in Section 5.2 and those of Waikoriri Lagoon in Section 5.3. A discussion and
interpretation of findings is presented in section 5.4. This chapter addresses the
following research objectives:
• To compare aerial photographs taken over a 59 year period and examine
temporal changes in outlet position, lagoon structure and other features of
interest in each system,
123
• To provide quantitative measures of outlet change and quantify approximate
rates of change where possible,
• To identify and explain trends in outlet migration and channel utilisation,
• To determine the driving forces of observed changes and system dynamics.
5.2 Totara Lagoon
Eight separate surveys were available covering the Totara Lagoon area, covering a 57
year period between 1948 and 2005. Details of the survey runs, years and photographs
utilised are displayed in Appendix 1. Several photographs from each survey were
required to cover the entire lagoon area, and mosaics of each survey set are displayed in
Figure 5.1. Digitisations of the lagoon structure during each survey period are presented
in Figure 5.2 and outlet positions are marked. These have been divided into five
sections, A to E, for the purposes of presenting results and descriptions of change.
5.2.1 Changes in outlet and channel position
Outlet position
The position of the lagoon outlet varied significantly over the entire survey period, and
fluctuated between 0 and 5800 m from the river mouth (Table 5.1, Figure 5.2). It
remained within sections A and B in every year surveyed except 1988, when it migrated
as far as section C. It was common for the lagoon to discharge at the point where the
Totara River meets the coast, as was the case in 1972, 2002 and 2005. In 1948 the outlet
position was only a short distance upstream from this point. There has been a degree of
anthropogenic control on the position of the outlet in recent years, which may be
responsible for the lack of outlet migration between 2002 and 2005. The outlet reached
its maximum recorded offset of 5800 m in 1988, when it was situated towards the upper
end of section C. Following this, no data was available until 2002, when the discharge
point had returned to the Totara River mouth and the outlet was artificially managed,
meaning no inferences can be made about Totara Lagoon’s natural dynamics beyond
1988.
Migration of the outlet appears to follow a general northward (upstream) progression
along the lagoon channel between 1972 and 1988, when the photographs are available at
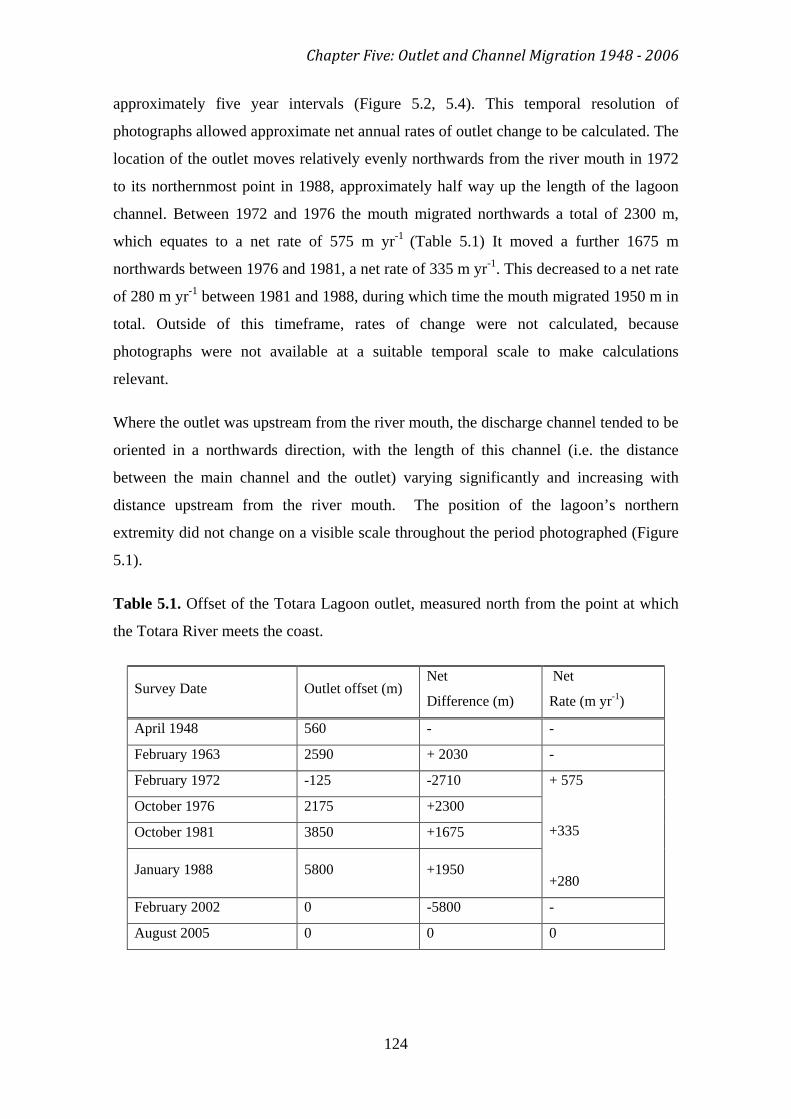
Chapter Five: Outlet and Channel Migration 1948 - 2006
124
approximately five year intervals (Figure 5.2, 5.4). This temporal resolution of
photographs allowed approximate net annual rates of outlet change to be calculated. The
location of the outlet moves relatively evenly northwards from the river mouth in 1972
to its northernmost point in 1988, approximately half way up the length of the lagoon
channel. Between 1972 and 1976 the mouth migrated northwards a total of 2300 m,
which equates to a net rate of 575 m yr-1 (Table 5.1) It moved a further 1675 m
northwards between 1976 and 1981, a net rate of 335 m yr-1. This decreased to a net rate
of 280 m yr-1
Where the outlet was upstream from the river mouth, the discharge channel tended to be
oriented in a northwards direction, with the length of this channel (i.e. the distance
between the main channel and the outlet) varying significantly and increasing with
distance upstream from the river mouth. The position of the lagoon’s northern
extremity did not change on a visible scale throughout the period photographed (Figure
5.1).
between 1981 and 1988, during which time the mouth migrated 1950 m in
total. Outside of this timeframe, rates of change were not calculated, because
photographs were not available at a suitable temporal scale to make calculations
relevant.
Table 5.1. Offset of the Totara Lagoon outlet, measured north from the point at which
the Totara River meets the coast.
Survey Date Outlet offset (m) Net
Difference (m)
Net
Rate (m yr-1
April 1948
)
560 - -
February 1963 2590 + 2030 -
February 1972 -125 -2710 + 575
+335
+280
October 1976 2175 +2300
October 1981 3850 +1675
January 1988 5800 +1950
February 2002 0 -5800 -
August 2005 0 0 0
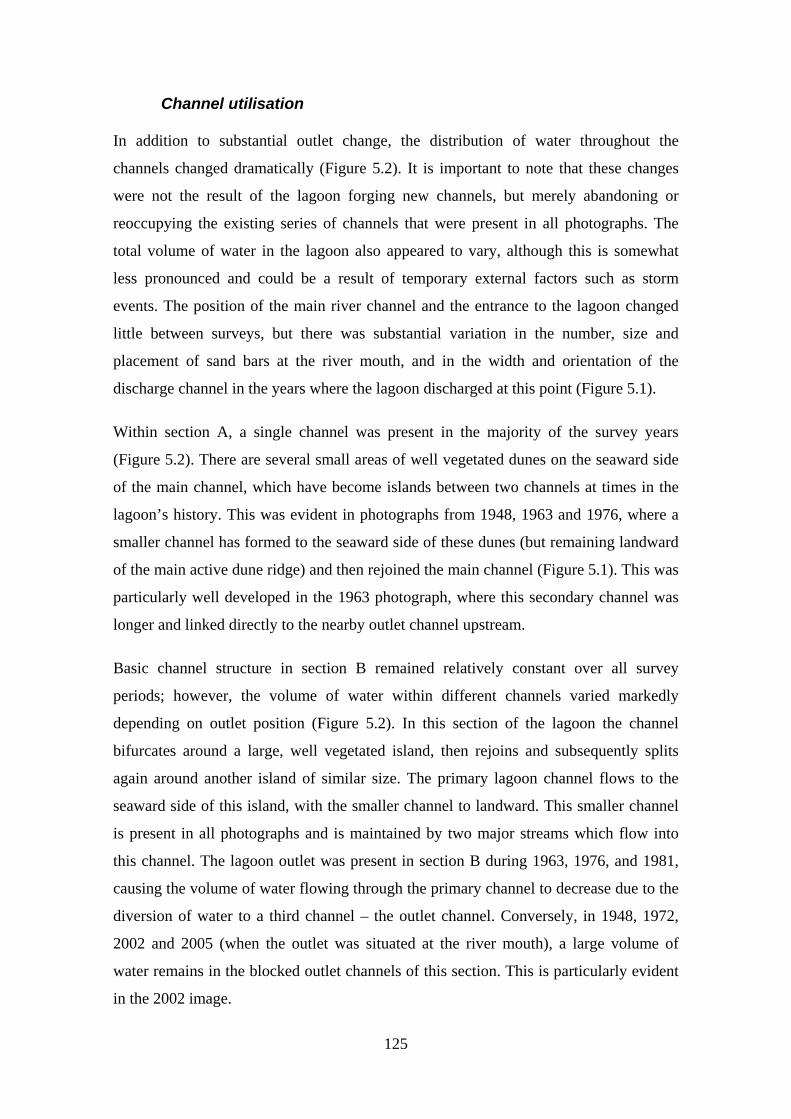
125
Channel utilisation
In addition to substantial outlet change, the distribution of water throughout the
channels changed dramatically (Figure 5.2). It is important to note that these changes
were not the result of the lagoon forging new channels, but merely abandoning or
reoccupying the existing series of channels that were present in all photographs. The
total volume of water in the lagoon also appeared to vary, although this is somewhat
less pronounced and could be a result of temporary external factors such as storm
events. The position of the main river channel and the entrance to the lagoon changed
little between surveys, but there was substantial variation in the number, size and
placement of sand bars at the river mouth, and in the width and orientation of the
discharge channel in the years where the lagoon discharged at this point (Figure 5.1).
Within section A, a single channel was present in the majority of the survey years
(Figure 5.2). There are several small areas of well vegetated dunes on the seaward side
of the main channel, which have become islands between two channels at times in the
lagoon’s history. This was evident in photographs from 1948, 1963 and 1976, where a
smaller channel has formed to the seaward side of these dunes (but remaining landward
of the main active dune ridge) and then rejoined the main channel (Figure 5.1). This was
particularly well developed in the 1963 photograph, where this secondary channel was
longer and linked directly to the nearby outlet channel upstream.
Basic channel structure in section B remained relatively constant over all survey
periods; however, the volume of water within different channels varied markedly
depending on outlet position (Figure 5.2). In this section of the lagoon the channel
bifurcates around a large, well vegetated island, then rejoins and subsequently splits
again around another island of similar size. The primary lagoon channel flows to the
seaward side of this island, with the smaller channel to landward. This smaller channel
is present in all photographs and is maintained by two major streams which flow into
this channel. The lagoon outlet was present in section B during 1963, 1976, and 1981,
causing the volume of water flowing through the primary channel to decrease due to the
diversion of water to a third channel – the outlet channel. Conversely, in 1948, 1972,
2002 and 2005 (when the outlet was situated at the river mouth), a large volume of
water remains in the blocked outlet channels of this section. This is particularly evident
in the 2002 image.

Chapter Five: Outlet and Channel Migration 1948 - 2006
126
Section C was the most variable part of the lagoon in terms of channel utilisation,
despite the fact that the outlet only reached as far as this in 1988. Within this section,
the channel splits around an island, rejoins, and splits again for the final time. Channels
on both sides of the two islands contained water in the following years: 1948, 1972,
1988, and 2005 (Figure 5.1). In 1976 and 1981 there is only a single water-carrying
channel within this entire section, and in both 1963 and 2005 the lagoon exhibits only a
single channel following the first island. Periods of high water content and full channel
occupation tend to coincide with a river mouth outlet position (Figure 5.2).
Channel occupation and area of the water surface appear relatively constant throughout
all images in sections D and E. The lagoon is reduced to a single, choked channel
throughout the length of these sections, and there is no change in the position of this
channel over the study period (Figure 5.2). This could be due in part to the presence of a
major stream which flows from an adjoining area of swampland and feeds the upper
lagoon at the boundary of sections C and D. No data is available for section E from the
1948 photographs. Total surface area of the lagoon appears to be greatest in 2002,
followed by 1972 and 1948. 1981 and 1976 exhibit the smallest total surface areas.
Vegetation and features of interest
The distribution of vegetation in the immediate lagoon area changed little over the study
period, although scrub cover on the islands in section C and D was much more
developed in the 2005 photograph than in the 1948 image. There are several smaller
empty channels running across these islands and other flatter, non-vegetated areas that
appear to be flood washover areas. Larger channels abandoned prior to the 1948
photograph are clearly visible as areas bare of vegetation in sections A and B, which
become progressively more grassed over in each successive photograph (Figure 5.3).
The old railway line that runs along the landward side of the lagoon is a distinct
landmark visible in all photographs and was used as a baseline for aerial photograph
analysis (Figure 5.1, 5.2). This feature consists of an artificially constructed raised bank
upon which the railway line sits. This is likely to obstruct natural drainage flow and
limit adjustment between the lagoon and the swampy areas landward of the railway line.
Drainage through this boundary is directed through several large streams, which are

127
constrained artificially by culverts and bridges as they pass through the bank.
Consequently, their position does not change over this 58 year period.
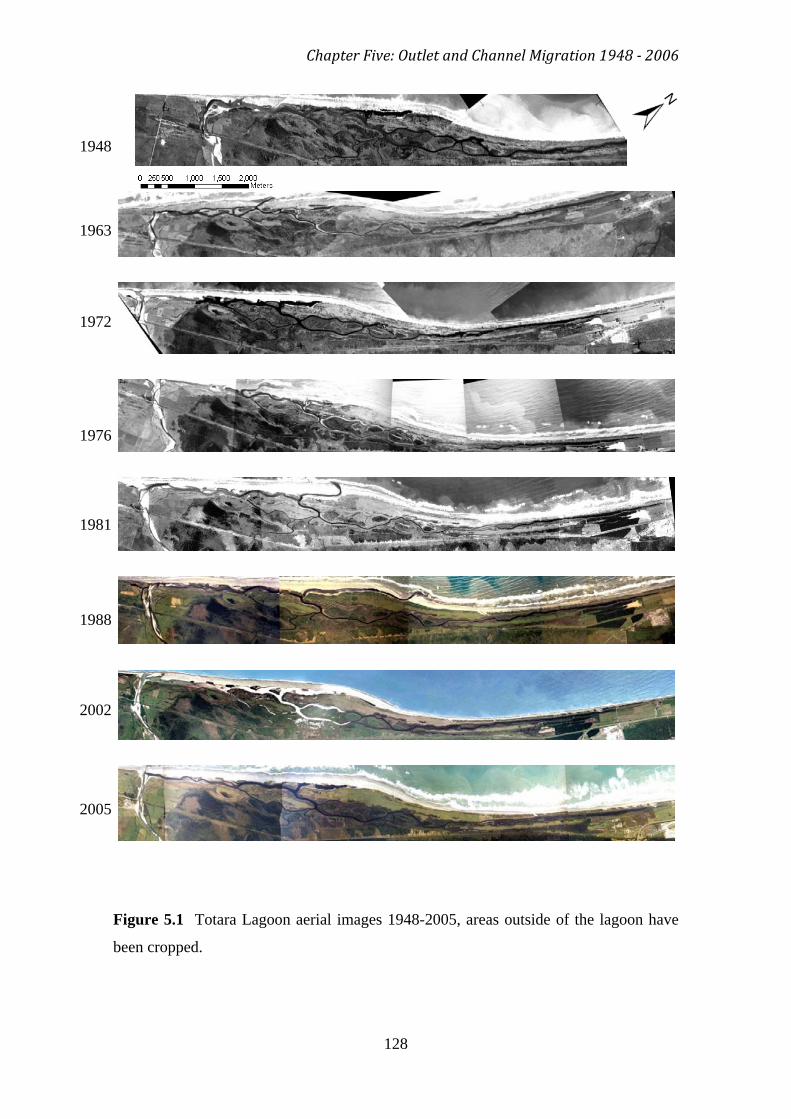
Chapter Five: Outlet and Channel Migration 1948 - 2006
128
Figure 5.1 Totara Lagoon aerial images 1948-2005, areas outside of the lagoon have
been cropped.
1948
1963
1972
1976
1981
1988
2002
2005
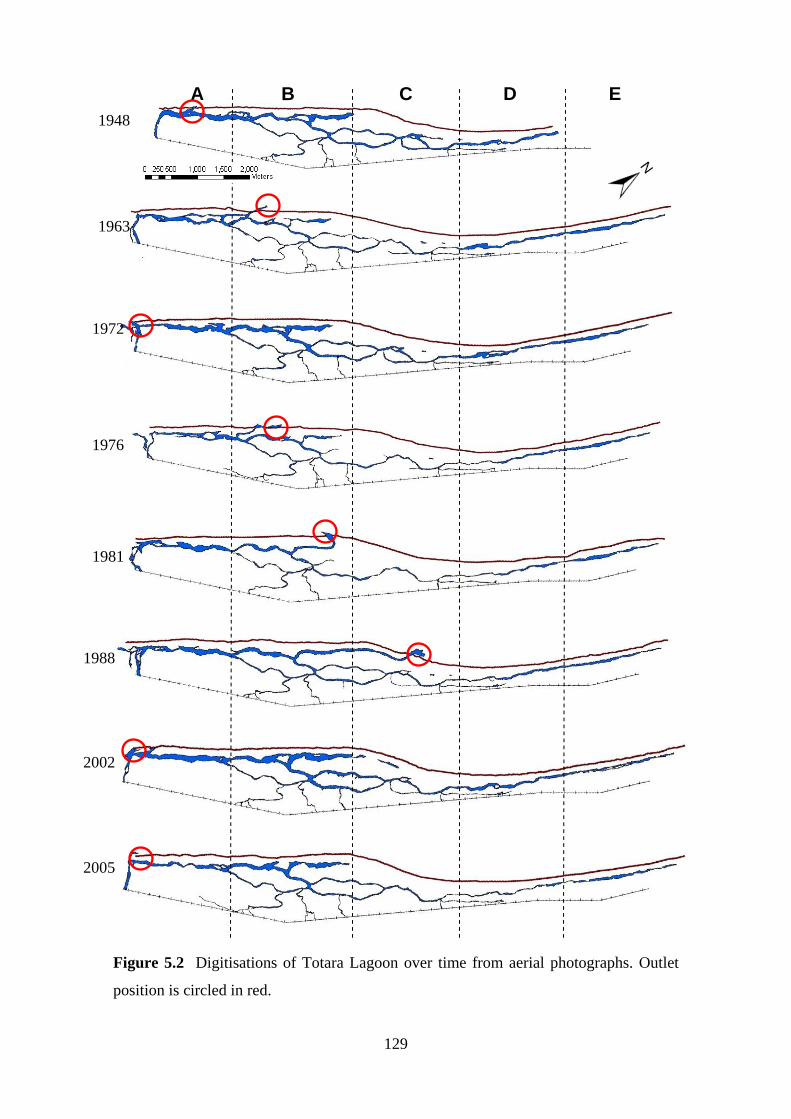
129
Figure 5.2 Digitisations of Totara Lagoon over time from aerial photographs. Outlet
position is circled in red.
A D B C E 1948
1963
1972
1976
1981
1988
2002
2005
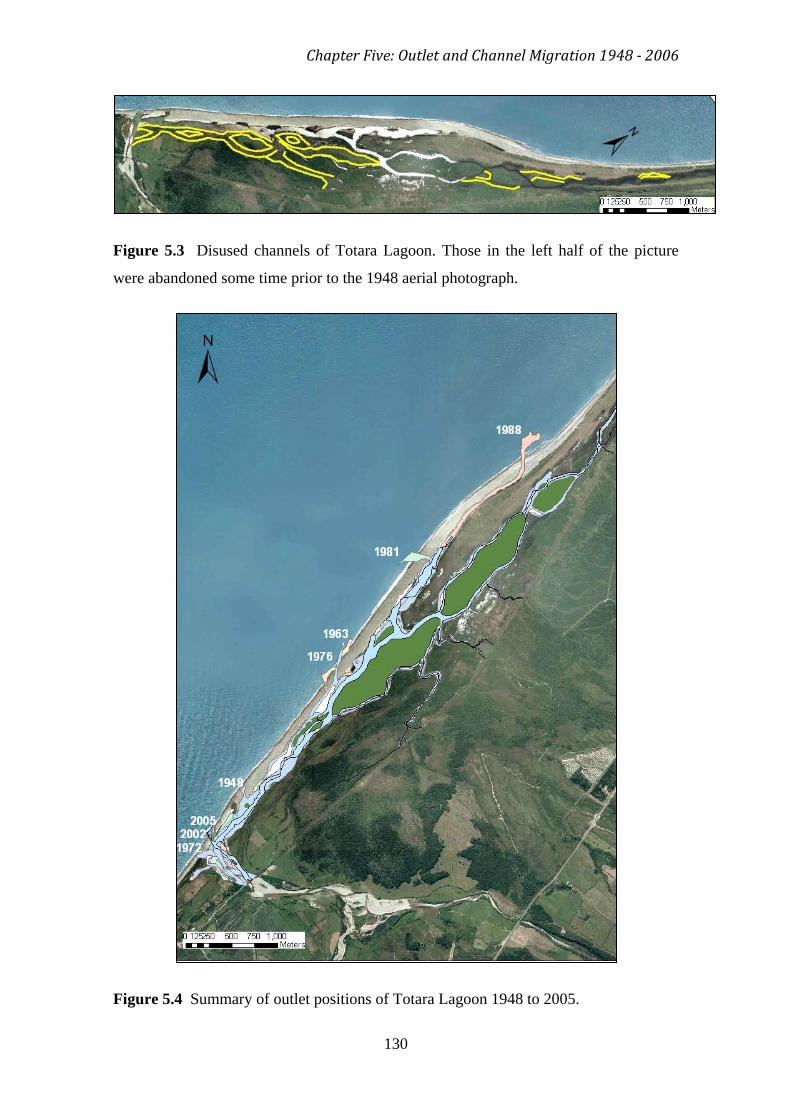
Chapter Five: Outlet and Channel Migration 1948 - 2006
130
Figure 5.3 Disused channels of Totara Lagoon. Those in the left half of the picture
were abandoned some time prior to the 1948 aerial photograph.
Figure 5.4 Summary of outlet positions of Totara Lagoon 1948 to 2005.
131
5.3 Shearer Swamp-Waikoriri Lagoon Complex
Photographs spanning a 58 year period from 1948 to 2006 were analysed to explore
temporal and spatial changes in extent and structure of Waikoriri Lagoon. Images from
nine separate surveys during this time period were available, from which digitisations of
the lagoon were made for each individual survey year in ArcGIS. Snapshots from
photographs are displayed in Figure 5.5 along with individual digitisations of the lagoon
area for each survey year in Figure 5.6.
5.3.1 Changes in Waikoriri Lagoon and surrounding area
Waikoriri Lagoon is a small, very dynamic hapua which shows a pattern of outlet
migration northwards along the beach, interspersed with periods where the outlet
returns to the point at which the combined Waikoriri and Granite Creeks intersect and
reach the coast (Figure 5.6). The outlet was situated at this location (or marginally
northwards of it) in the following surveys: 1948, 1972, 1976, 1981 and 1988. Between
1948 and 1976 the outlet offset fluctuated between 120 and 560 m, before increasing
five times in length in the five years between 1976 and 1981 (Table 5.2). The lagoon
was at least 900 m long in the remainder of the photographs, except for a single
recorded return to 150 m in length in 1988. The lagoon outlet reached its maximum
offset of 2500 m in the 2002 photograph, before retreating 1600 m to a distance of 900
m up the coast by the 2006 survey, halving the lagoon length since 2002 (Table 5.2).
Evidence for the shift of the outlet in a north – south direction was apparent in the
photographs from 1972 and 2006, where there was still remnant water present in the
abandoned channel to the north of the outlet (Figure 5.5). In both these cases, the
photograph from four years previously clearly shows the outlet position at the point to
which the remnant water reaches. In 1972, the outlet was situated a mere 120 m north of
the confluence, but water was present in the channel up to 610 m north of this discharge
point. At the time of the 2006 photograph, the channel north of the outlet contained
water for a distance of 1520 m. At times water has also backed up at the Granite Creek-
Waikoriri Creek confluence, causing a wide channel to form along Granite Creek to the
south of the lagoon entrance. This is particularly evident in 1948, 1972, 1981 and 2006.
The outlet position in 1981 and 1986 is approximately the same as in 2006, suggesting a
tendency for the lagoon to discharge at this point. The lagoon appears to have remained
Chapter Five: Outlet and Channel Migration 1948 - 2006
132
relatively stable over the period 1981 – 1986, as the outlet is in the same position during
both these images. Due to the tendency for Waikoriri Lagoon outlet to migrate over
short timescales (i.e. timescales shorter than those covered by these aerial photographs),
no calculations were made of the rate of change of the outlet between survey years.
The surface area of water and shape of the lagoon varied significantly across the study
period (Table 5.2). In most cases the area of the water surface correlates with the length
of the lagoon. The greatest surface area measured was 56 500 m2, which occurred in the
2002 photograph; also the period of greatest length. This trend was also apparent in
2006 and 1981, the next largest years in terms of both length and surface area. 1972
presents as a distinct anomaly, possessing a surface area of 30 500 m2
In the two latest photographs the lagoon splits into two channels at the southern end,
separated by a low, sparsely vegetated sand bar (Figure 5.5, 5.6). Rather than this being
a case of two inlet channels, the landward channel is filled by water flowing out of the
main channel then back in the opposite direction parallel to the main channel. This is a
blind channel which is terminated at the point where it is crossed by a raised walkway
alongside Waikoriri Creek. In earlier photographs this channel forms part of the
outward-flowing main channel, which is wider along this section in 1948, 1963, 1972
and 1981.
but with a mouth
offset of only 120 m. The lagoon was at its smallest during 1976 and 1988. It is
important to note however, that water surface area can be affected by factors such as
rainfall and tides, and thus is only a rough estimate of lagoon size and is not necessarily
indicative of the average conditions around the time the photograph was taken. No data
was available for the 1948 or 1986 aerial photographs, as the resolution did not allow
the channel to be mapped with sufficient accuracy.
Beach width also appears to vary spatially and temporally across the different
photographs. The wet-dry line was used as a proxy for the shoreline position when
creating the digitisations from the images. Beach width opposite the Waikoriri Creek-
Granite Creek confluence appeared greatest between 1963 and 1988, decreasing
significantly in width in the later images (2002 and 2005). A wedge of sediment
accreting around the outlet is clearly visible as a ‘bulge’ in the position of the wet-dry
line in many of the photographs.
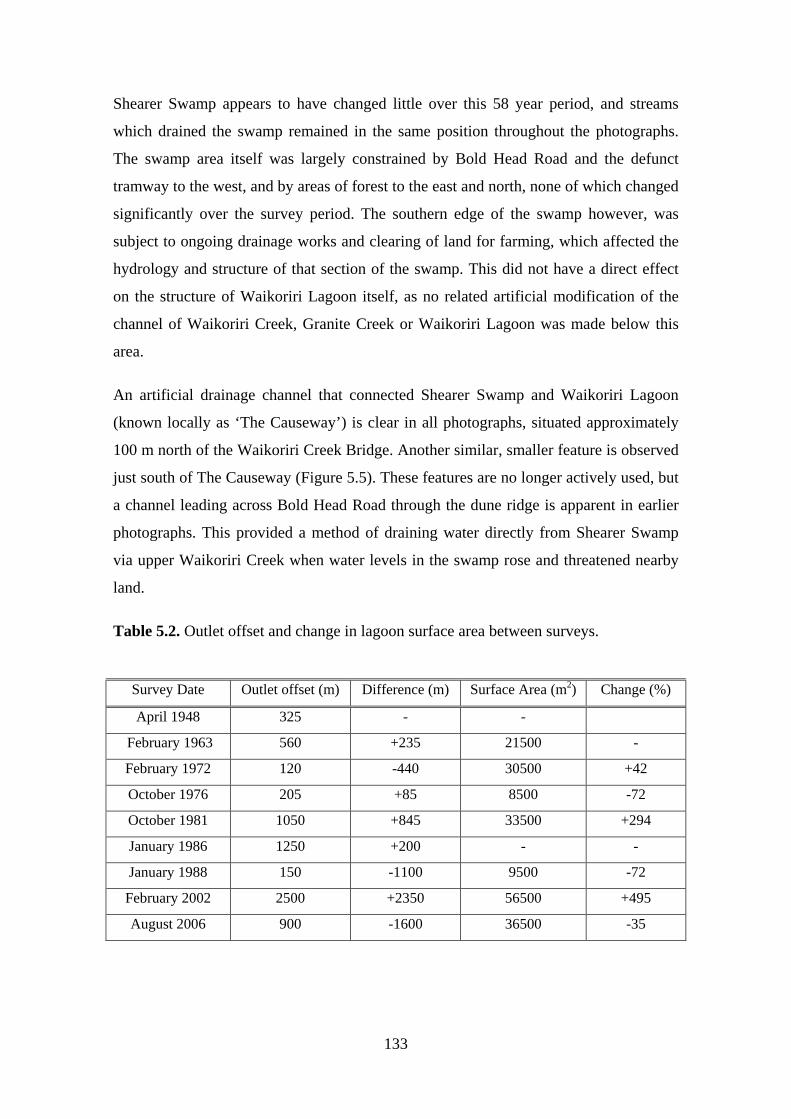
133
Shearer Swamp appears to have changed little over this 58 year period, and streams
which drained the swamp remained in the same position throughout the photographs.
The swamp area itself was largely constrained by Bold Head Road and the defunct
tramway to the west, and by areas of forest to the east and north, none of which changed
significantly over the survey period. The southern edge of the swamp however, was
subject to ongoing drainage works and clearing of land for farming, which affected the
hydrology and structure of that section of the swamp. This did not have a direct effect
on the structure of Waikoriri Lagoon itself, as no related artificial modification of the
channel of Waikoriri Creek, Granite Creek or Waikoriri Lagoon was made below this
area.
An artificial drainage channel that connected Shearer Swamp and Waikoriri Lagoon
(known locally as ‘The Causeway’) is clear in all photographs, situated approximately
100 m north of the Waikoriri Creek Bridge. Another similar, smaller feature is observed
just south of The Causeway (Figure 5.5). These features are no longer actively used, but
a channel leading across Bold Head Road through the dune ridge is apparent in earlier
photographs. This provided a method of draining water directly from Shearer Swamp
via upper Waikoriri Creek when water levels in the swamp rose and threatened nearby
land.
Table 5.2. Outlet offset and change in lagoon surface area between surveys.
Survey Date Outlet offset (m) Difference (m) Surface Area (m2 Change (%) )
April 1948 325 - -
February 1963 560 +235 21500 -
February 1972 120 -440 30500 +42
October 1976 205 +85 8500 -72
October 1981 1050 +845 33500 +294
January 1986 1250 +200 - -
January 1988 150 -1100 9500 -72
February 2002 2500 +2350 56500 +495
August 2006 900 -1600 36500 -35

Chapter Five: Outlet and Channel Migration 1948 - 2006
134
Figure 5.5 Aerial photographs of Waikoriri Lagoon, showing Bold Head Road to the
landward side of the lagoon and the ‘Causeway’ next to the road.
1948
1963
1972
1976
1981
1986
1988
2002
2006
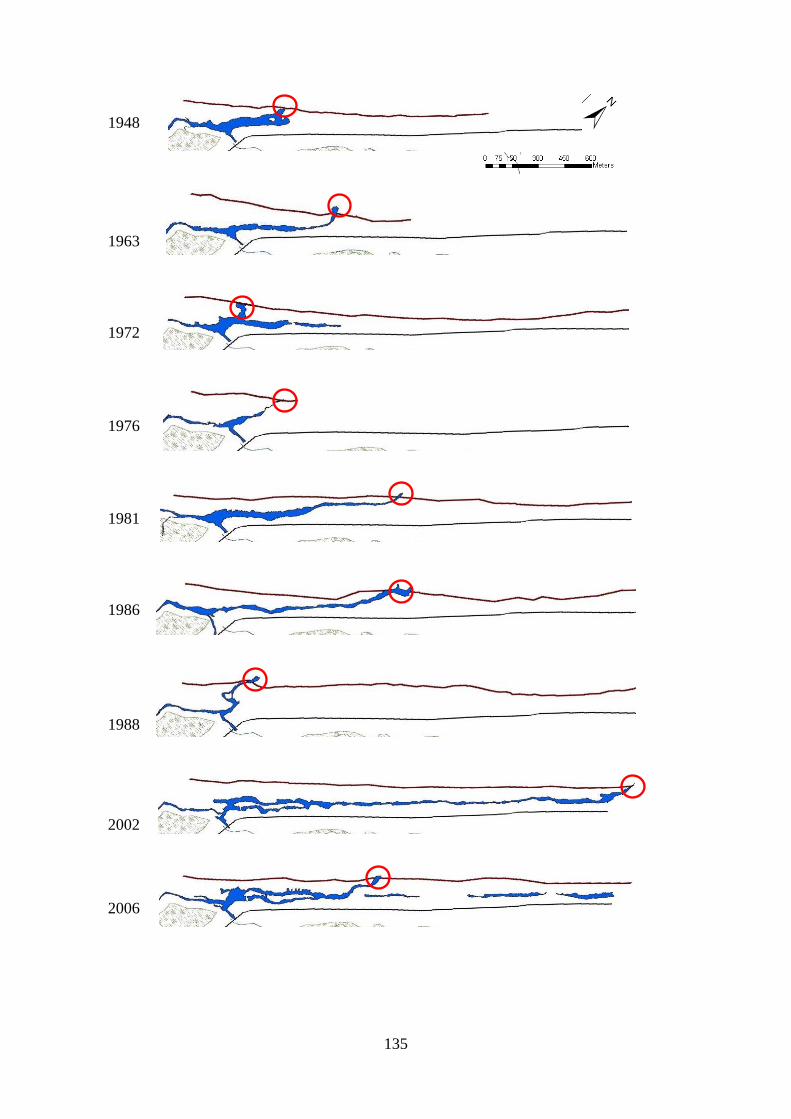
135
1948
1963
1972
1976
1981
1986
1988
2002
2006
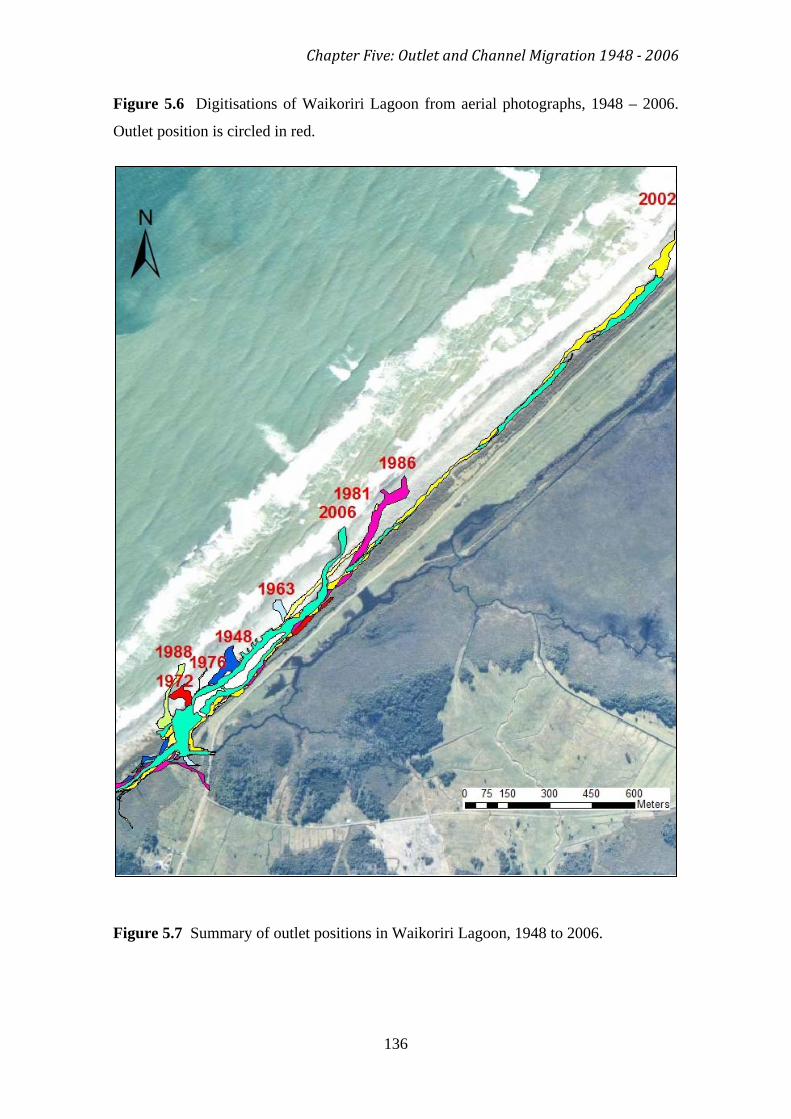
Chapter Five: Outlet and Channel Migration 1948 - 2006
136
Figure 5.6 Digitisations of Waikoriri Lagoon from aerial photographs, 1948 – 2006.
Outlet position is circled in red.
Figure 5.7 Summary of outlet positions in Waikoriri Lagoon, 1948 to 2006.
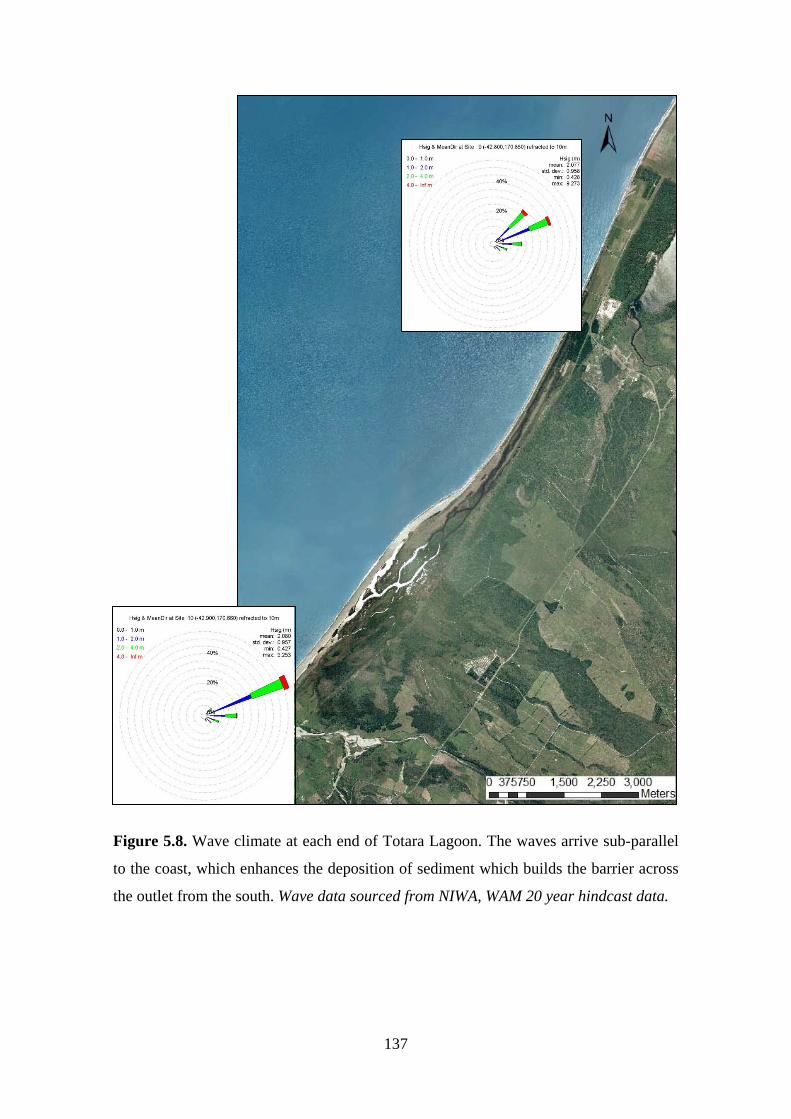
137
Figure 5.8. Wave climate at each end of Totara Lagoon. The waves arrive sub-parallel
to the coast, which enhances the deposition of sediment which builds the barrier across
the outlet from the south. Wave data sourced from NIWA, WAM 20 year hindcast data.

Chapter Five: Outlet and Channel Migration 1948 - 2006
138
5.4 Interpretation and discussion of outlet dynamics
This section aims to provide an interpretation of the results presented here, and to
discuss the dynamics of Totara Lagoon and Waikoriri Lagoon with respect to outlet
migration. A comparison of the two lagoons is presented here in terms of outlet
dynamics, but a discussion of these systems with detailed reference to existing models
of hapua dynamics is reserved for Chapter 7. This allows all results to be presented and
integrated into a single discussion of dynamics and development within these and
similar systems over all timeframes studied within this project.
5.4.1 Totara Lagoon
Throughout most of the study period (1948 – 1988), the outlet of Totara Lagoon was
not artificially managed, allowing a natural pattern of outlet migration to occur. The
results from 1972 to 1988 are particularly important here, as they are of a suitable
temporal resolution to show this pattern clearly and accurately. The outlet was exhibited
a net displacement progressively northwards across this timeframe, which is consistent
with the model of hapua dynamics presented by Todd (1992). On the West Coast the
predominant direction of littoral drift is northwards, which has caused this pattern of
northerly offset, and also caused the outlet channel to be orientated diagonally through
the barrier in a northwards direction, which is evident in most photographs and
digitisations. This is enhanced by the north-easterly direction of wave approach, which
means waves approach sub-parallel to the coast along the length of the system (Figure
5.8). The exception to this discharge channel orientation is that of 1988, where the
channel curves back upon itself to discharge facing south. It is unclear whether this was
the average condition of the outlet during that period, or whether it was a temporary
situation at the time of photography.
The outlet appears to migrate steadily and consistently northwards until 1988, but it is
unclear whether this was a gradual, steady process or whether the outlet ‘jumped’
between positions. This could be caused by the existence of low passages through the
seaward dune ridge, such as areas of dune blowouts or old abandoned outlet channels.
Outlet position appears to have a significant effect on lagoon channel structure and
water volume, particularly in the central reaches. At times where the outlet was situated
at the river mouth there was a greater volume of water present in the lagoon, and thus
139
greater channel utilisation. This is due to a fluvial backwater effect (Hart, 2007),
whereby water is flowing into the lagoon at the southern end via Totara River, but as
this is also the only discharge point for the lagoon, water level increases along its length
in response. Several of the central channels remained throughout every photograph,
which is a consequence of the position of several primary creeks which discharge into
them. The position of these creeks is constrained by the railway embankment landward
of the lagoon, which forms a very inflexible and well vegetated barrier between the
swampland and lagoon. The abandonment of the channel network visible at the southern
end of the lagoon (Figure 5.3) could potentially be related to the construction of this
barrier and drainage of swampland for faming in historical times. Prior to these events,
there would have been a margin of adjustment between the lagoon and swampland
behind it, and drainage would have occurred through a larger network of creeks than
those which are now artificially amalgamated and directed through this barrier at
arbitrarily constructed points. Conversely, it could potentially be related to migration of
the entire lagoon system in response to coastal progradation or fluvial change prior to
these events, but the former scenario is more probable due to the lack of vegetation
present in these old channels compared with that of the islands in the central reaches.
The total length of Totara Lagoon did not change over the study period, which is due to
the sheer size of the lagoon and the large capacity to absorb changes in water supply and
distribution through its many channels, by increasing the water volume in active
channels or by reoccupying disused channels. The central reaches of the lagoon acted as
a buffer zone in this process, with little change occurring in lagoon structure at the
southern and northern ends. The stability and vegetation cover of the dunes, as
discussed in the previous chapter, helps prevent the barrier from breaching at multiple
or new positions. This is a positive feedback loop, as the lack of breaching allows the
vegetation to develop, and the vegetation stabilises the barrier and reduces the
likelihood of further breaching. Despite the fact that no change in length occurred over
this 58 year period, there is clear evidence that the lagoon has continued further north at
some time prior to 1948, as a dry, grassed-over channel exists between the two dune
ridges extending a further 200 m.
It is unclear to what degree the structure of Totara Lagoon is constrained by the
presence of the railway line to the east of the lagoon, and how the lagoon has been
Chapter Five: Outlet and Channel Migration 1948 - 2006
140
affected by the drainage and farming of adjacent swampland to the east of the railway.
The clearing of this area can be followed through the photographs from 1948 onwards,
but no consequent structural changes were evident over this timeframe.
5.4.2 Waikoriri Lagoon
Data and digitisations of Waikoriri Lagoon show that it has changed dramatically in
terms of length and structure over the period surveyed. Due to the dynamism of this
small hapua, it is likely that significant unrecorded change in outlet position and water
volume occurred between these photographs as well, meaning that calculations of rates
of outlet migration, such as were made for Totara Lagoon, would be false
representations of change.
There is a history of artificial breaches in the Waikoriri Lagoon barrier at the point
where Waikoriri Creek reaches the coast, some of which are responsible for the
observed migration of the Waikoriri Lagoon mouth in some photographs. A managed
breach was initiated prior to the 1988 photograph (when the outlet is situated at the
south) and again in 2004 in response to a flood event threatening nearby land and
infrastructure. This accounts for the movement in outlet position from the northern
extremity in the 2002 photograph, to the more southerly position in 2006. As noted by
Hart and Single (2004), the lagoon has been artificially opened at the southern extremity
many times since the late 1800s, and the mouth is shown at the southern position in
maps of the area from 1897 and 1981. Although there is an extensive history of artificial
outlet change in the southerly direction, the natural migration of Waikoriri Lagoon’s
outlet position northward follows the pattern depicted by Kirk (1992), whereby littoral
drift (northward in this case) causes a sediment wedge to build over the mouth which
causes it to migrate along the beach in this direction.
Although there was no direct effect on Waikoriri Lagoon itself during the clearing and
drainage of swampland upstream from the lagoon over recent decades, the hydrology
and sediment supply to the lagoon via Waikoriri and Granite Creeks has been
influenced indirectly. The channels of these creeks have been realigned by local farmers
in some areas, and stop-banks of unconsolidated material from nearby slips have been
constructed along the margins of Granite Creek. This sediment tends to become
remobilised during flood events and is carried downstream to be deposited at the coast.
141
This sediment build-up alters the drainage patterns of the network of creeks that
ultimately drain Shearer Swamp and form the lagoon.
5.4.3 Comparison of Totara Lagoon and Waikoriri Lagoon
As discussed in Chapter 4, the spatial scales of Totara Lagoon and Waikoriri Lagoon
are very different, and consequently, so are the spatial and temporal scales of outlet
migration. Aerial photograph analysis of outlet change works well with Totara Lagoon,
as it most likely captures a relatively complete record of change in the outlet position. In
the case of Waikoriri Lagoon, the record is much less complete, as the outlet has been
observed to migrate on much smaller scales than those recorded by the aerial
photograph surveys. As a consequence, any calculation of rate of outlet migration
would be very artificial, so was not attempted.
The level of stability of the barrier is very important in terms of outlet dynamics. The
barrier at Waikoriri Lagoon is much less stable than that of Totara Lagoon, which is
more heavily vegetated with higher dunes. As a result, there is much more scope for the
position of the Waikoriri Lagoon outlet to migrate, as it is less constrained by vegetation
and topography.
The permanence of the lagoon bodies is very different. In the case of Totara Lagoon, the
waterbody remains consistently present and approximately the same size throughout the
entire study period. It remains a complete, connected water body while the outlet
migrates. Waikoriri Lagoon fluctuates hugely in size in response to the offset of the
outlet, essentially draining completely when the outlet position is at the southern
extremity. Unlike Totara Lagoon, water is very rarely present north of the outlet
position, and if it is present, is not connected to the rest of the lagoon body. Rather than
being a part of the lagoon, it is merely pools of water trapped behind the barrier that
have yet to evaporate. Once again, it is important to note that Waikoriri Lagoon has no
tributary streams north of the mother creek to feed the lagoon channel, unlike Totara
Lagoon, which is fed in the north by several large streams.
The physical configuration of the lagoons varies enormously in more than spatial scale.
The photographic record shows Totara Lagoon has retained a multi-channel
configuration for the past 60 years, whereas Waikoriri Lagoon is usually restricted to a
single, shallow channel. Combined with the sheer size difference of the lagoons, this

Chapter Five: Outlet and Channel Migration 1948 - 2006
142
has implications in terms of their differing abilities to absorb changes in water volume
in response to storm events, thus contributing to the difference in temporal dynamics.
Ultimately, the differences in outlet position and dynamic regime between these two
systems are a function of many interacting variables, which will be discussed further in
later chapters.
5.4.4 Limitations and errors
Significant limitations exist in the use of these aerial photographs, particularly in terms
of the numeric calculations of outlet position. The main methodological concerns and
errors introduced in the orthorectification and georeferencing processes were detailed in
Chapter 4; however the ways in which these have affected the specific results are
discussed here.
The primary limitation in this context is that aerial photographs record only the
conditions at the exact moment the image was taken. This is only of minor concern
when mapping lagoon water surface and outlet position, but means the calculations of
offset and surface area are net and approximate only. No calculations of changes in
beach width could be made, as the margins of error created by tidal and weather-related
water level variations were too great. Larger absolute errors exist in the Totara Lagoon
photographs, due to the need for mosaicking of several images to cover the entire area.
The exact magnitude of error present varies between years and lagoon area, depending
on the quality of orthorectification of each individual photograph and the mosaicking
process. In terms of outlet position, measurements were rounded and can be considered
accurate to within 50 m (± 25 m).
5.5 Summary
This chapter presented the results of outlet migration and channel structure in Totara
Lagoon and Waikoriri Lagoon, gained from analysis of aerial photographs taken
between 1948 and 2006. The net change in outlet position between survey periods was
measured, and visual observations of change noted.
Both systems exhibited northward offsets of the outlet position, reaching a maximum of
5800 m from the river mouth in Totara Lagoon, and 2500 m in Waikoriri Lagoon. Rates
143
of outlet migration were calculated to be between 0 and 575 m yr-1
Variations in channel structure were small in Totara Lagoon, but significant changes did
occur in the auxiliary channels of the central reaches. Lagoon surface area appeared to
correlate negatively with outlet offset (i.e. the surface area of water in the channels is
greatest when the outlet is situated at the river mouth). In contrast to Totara Lagoon,
Waikoriri Lagoon drained completely when a breach occurred at the river mouth, and
the channel was restricted to a single conduit along its entire length in all photographs.
for Totara Lagoon,
but were not calculated for Waikoriri Lagoon due to its tendency to migrate on
timescales shorter than those captured by these aerial photographs.
The differences in outlet dynamics between these two systems were related to
differences in spatial scale and level of development of the seaward barrier. This,
combined with hydrological factors and channel morphology, means Totara Lagoon is
inherently more stable and subject to less variation than Waikoriri Lagoon.
144
CHAPTER SIX
Development over Decades to Centuries
6.1 Introduction
This focus of this chapter is the results of the sediment coring and associated analyses,
providing a detailed record of the nature of the subsurface sediment at three locations:
one in Shearer Swamp and one each at the southern and northern ends of Totara Lagoon
respectively. Stratigraphic logs of each core are displayed, followed by the results of
sediment texture and percent organics analyses of individual sediment facies from
within each core. Once again, results pertaining to Totara Lagoon are presented in
section 6.2, followed by those of the Shearer Swamp-Waikoriri Lagoon Complex in
section 6.3. Results from each technique are presented individually within each site
section. An interpretation of the changes in depositional environment within each core
is presented in Section 6.4.
This chapter addresses the following research objectives:
• To determine how the depositional environments of specific sites within Totara
Lagoon and Shearer Swamp have developed over historical time and relate this
to the current state and dynamics of each system,
• To understand the processes driving these changes in depositional environment.
6.2 Stratigraphy and sediment texture
6.2.1 Totara Lagoon
Sediment size was measured using a Micromeritics Saturn Digisizer 5200 laser particle
sizer capable of measuring grains up to 1000 µm in diameter, and the percentage by
weight of each sample above this cut-off value is displayed in Table 6.1. The degree of
sorting of each sample was calculated from its grain size distribution and interpreted
according to categories presented in Chapter 3, Table 3.3. Individual sediment
distribution graphs are presented in Appendix 5.
145
The substrate at the northern end of Totara Lagoon was relatively sandy (Figures 6.1,
6.3). Sediments between the surface and 0.3 m depth consisted of organic-rich dark-
brown mud. Underneath this layer was a unit of dark-brown, muddy, medium-grained
sand with occasional wood fragments. A gradational contact occurred between this unit
and a grey, medium- to coarse-grained quartz sand layer between 0.26 and 0.33 m
below the surface. This unit was underlain by a sharply contacting brown-grey fine-
grained sand layer at a depth of 0.45 m below the surface. All units had high moisture
content.
At a depth of 0.03 m the mean grain size of sediment was 124 µm and it was extremely
poorly sorted, with a standard deviation (σ) of 71.3 (Figure 6.5). Organic content at this
depth was very high, at 41% (Figure 6.7). At 0.15 m the mean grain size increased to
281 µm and σ = 1.1, corresponding to a poorly sorted, medium grained sand, with an
organic level of 5%. Mean grain size continued to increase down-core, and was 294 µm
at 0.3 m below the surface. Sediment was once again poorly sorted at this depth, σ =
2.0, and organic content was 0%. The mean grain size at 0.5 m was 434 µm with a very
low organic content of 0.7%. This sample was very poorly sorted, σ = 2.3.
Relative to the cores from Totara north, the southern end of Totara Lagoon presented a
comparatively simple stratigraphy (Figures 6.2, 6.4). Surface sediments were organic-
rich medium-brown mud, with a gradational contact at a depth of 0.08 m below the
surface between the top layer and a similar unit of brown mud beneath. The latter
contained occasional wood fragments and was underlain at a depth of 0.43 m below the
surface by a medium-brown, very poorly-sorted, coarse-grained sand and fine gravel
layer. The thickness of this layer is unknown as it continued beneath the maximum core
depth. Once again, all units had high moisture content.
Sediment was fine grained and extremely poorly sorted at a depth of 0.03 m below the
surface, with a mean grain size of 45 µm and σ = 4.5 (Figure 6.6). Organic content at
this depth was 10% (Figure 6.7). Samples were analysed from depths of 0.15 and 0.3 m,
both of which were part of the same brown mud unit. Mean grain size at these depths
was 27 and 29 µm respectively, and the sorting of this layer decreased from σ = 2.8
(very poorly sorted) at 0.15 m depth to σ = 1.7 (poorly sorted) at 0.3 m depth. Measures
of organic content varied markedly between these sampling depths, from 7.0% at 0.15
m to 3.8% at 0.3 m below the surface. There was a large change in sediment character
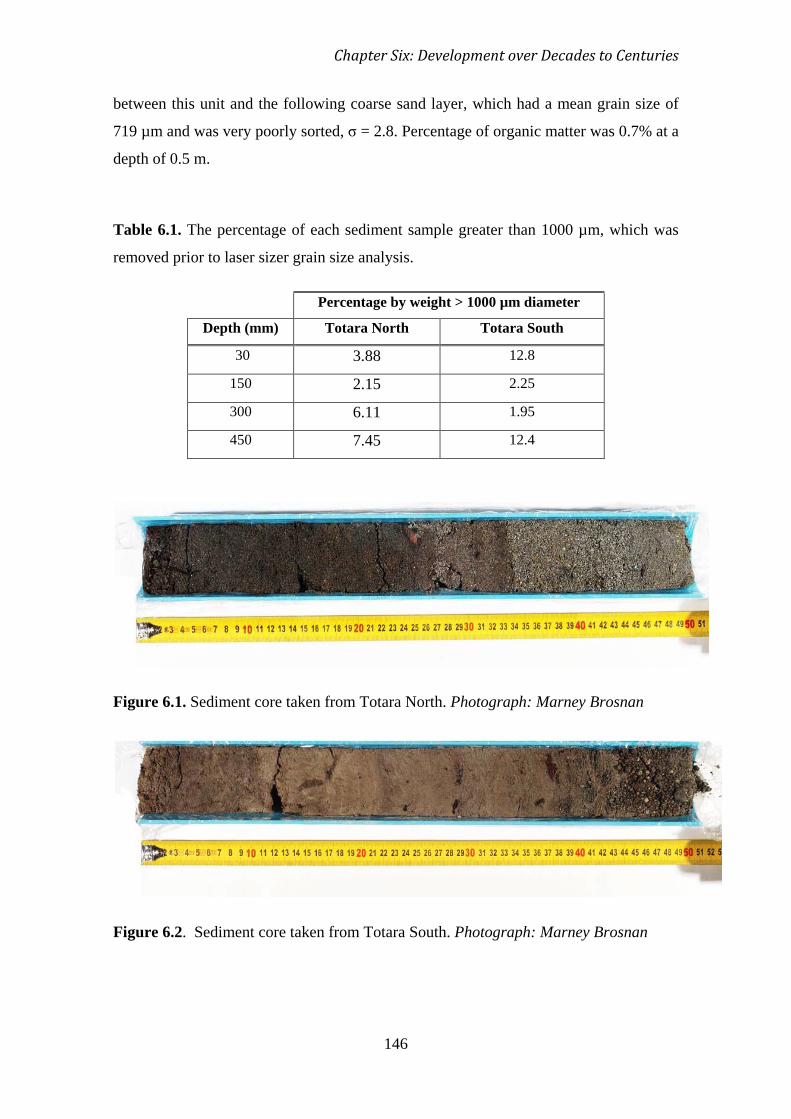
Chapter Six: Development over Decades to Centuries
146
between this unit and the following coarse sand layer, which had a mean grain size of
719 µm and was very poorly sorted, σ = 2.8. Percentage of organic matter was 0.7% at a
depth of 0.5 m.
Table 6.1. The percentage of each sediment sample greater than 1000 µm, which was
removed prior to laser sizer grain size analysis.
Percentage by weight > 1000 µm diameter
Depth (mm) Totara North Totara South
30 3.88 12.8
150 2.15 2.25
300 6.11 1.95
450 7.45 12.4
Figure 6.1. Sediment core taken from Totara North. Photograph: Marney Brosnan
Figure 6.2. Sediment core taken from Totara South. Photograph: Marney Brosnan
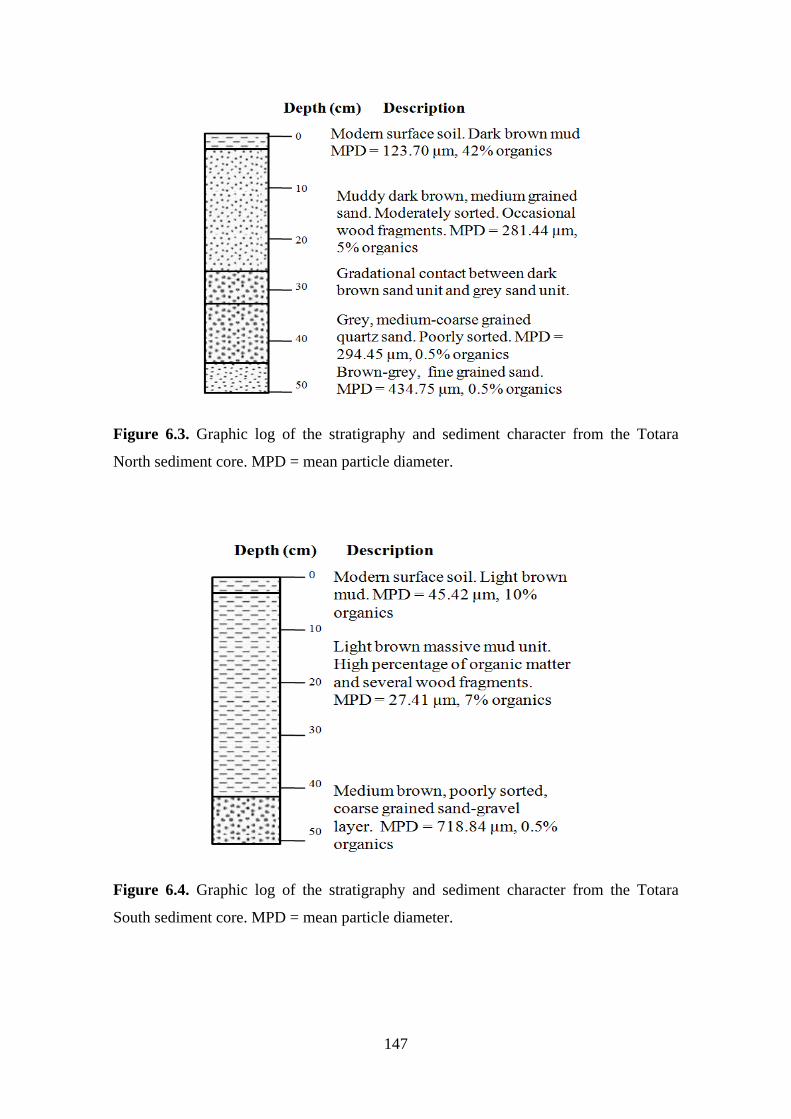
147
Figure 6.3. Graphic log of the stratigraphy and sediment character from the Totara
North sediment core. MPD = mean particle diameter.
Figure 6.4. Graphic log of the stratigraphy and sediment character from the Totara
South sediment core. MPD = mean particle diameter.
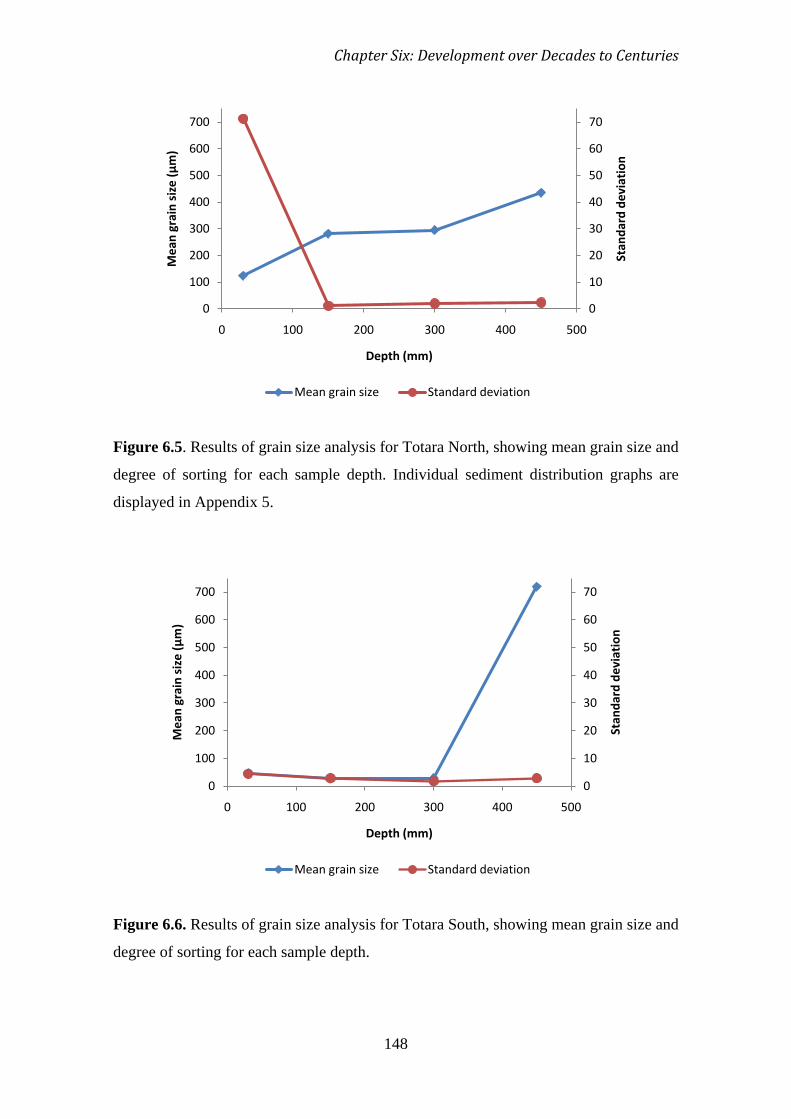
Chapter Six: Development over Decades to Centuries
148
Figure 6.5. Results of grain size analysis for Totara North, showing mean grain size and
degree of sorting for each sample depth. Individual sediment distribution graphs are
displayed in Appendix 5.
Figure 6.6. Results of grain size analysis for Totara South, showing mean grain size and
degree of sorting for each sample depth.
0
10
20
30
40
50
60
70
0
100
200
300
400
500
600
700
0 100 200 300 400 500
Stan
dard
dev
iati
on
Mea
n gr
ain
size
(µm
)
Depth (mm)
Mean grain size Standard deviation
0
10
20
30
40
50
60
70
0
100
200
300
400
500
600
700
0 100 200 300 400 500
Stan
dard
dev
iati
on
Mea
n gr
ain
size
(µm
)
Depth (mm)
Mean grain size Standard deviation
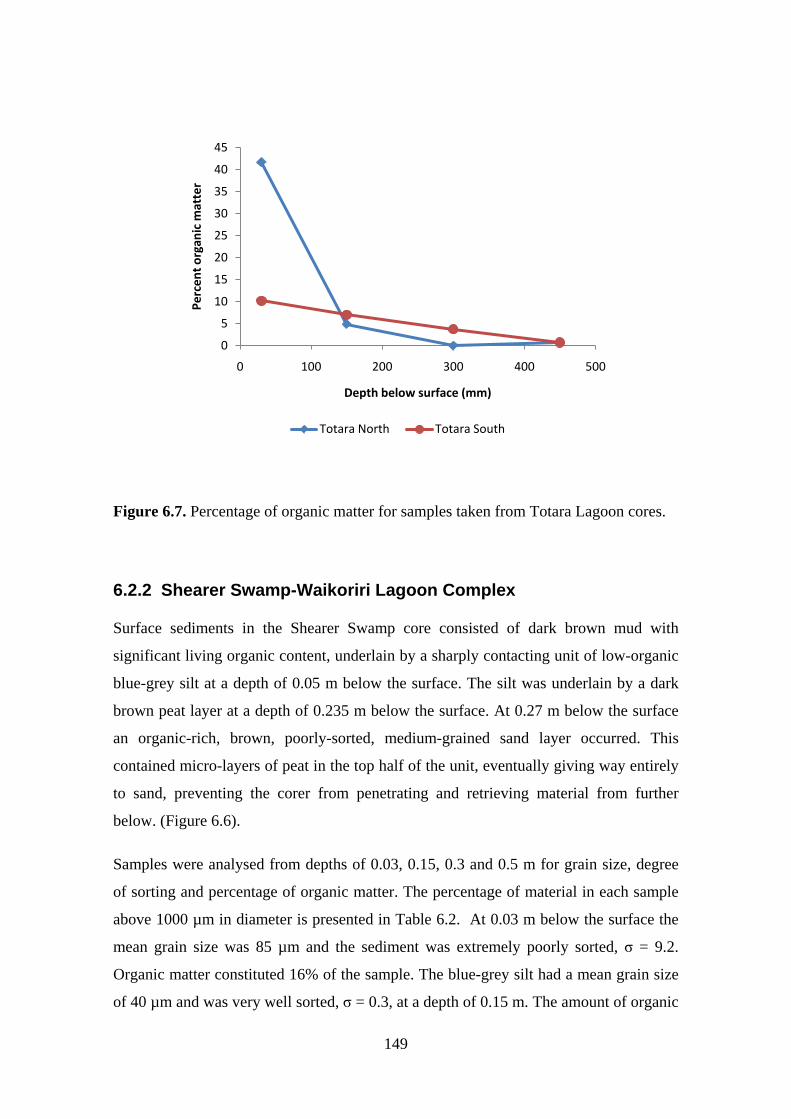
149
Figure 6.7. Percentage of organic matter for samples taken from Totara Lagoon cores.
6.2.2 Shearer Swamp-Waikoriri Lagoon Complex
Surface sediments in the Shearer Swamp core consisted of dark brown mud with
significant living organic content, underlain by a sharply contacting unit of low-organic
blue-grey silt at a depth of 0.05 m below the surface. The silt was underlain by a dark
brown peat layer at a depth of 0.235 m below the surface. At 0.27 m below the surface
an organic-rich, brown, poorly-sorted, medium-grained sand layer occurred. This
contained micro-layers of peat in the top half of the unit, eventually giving way entirely
to sand, preventing the corer from penetrating and retrieving material from further
below. (Figure 6.6).
Samples were analysed from depths of 0.03, 0.15, 0.3 and 0.5 m for grain size, degree
of sorting and percentage of organic matter. The percentage of material in each sample
above 1000 µm in diameter is presented in Table 6.2. At 0.03 m below the surface the
mean grain size was 85 µm and the sediment was extremely poorly sorted, σ = 9.2.
Organic matter constituted 16% of the sample. The blue-grey silt had a mean grain size
of 40 µm and was very well sorted, σ = 0.3, at a depth of 0.15 m. The amount of organic
0
5
10
15
20
25
30
35
40
45
0 100 200 300 400 500
Perc
ent o
rgan
ic m
atte
r
Depth below surface (mm)
Totara North Totara South
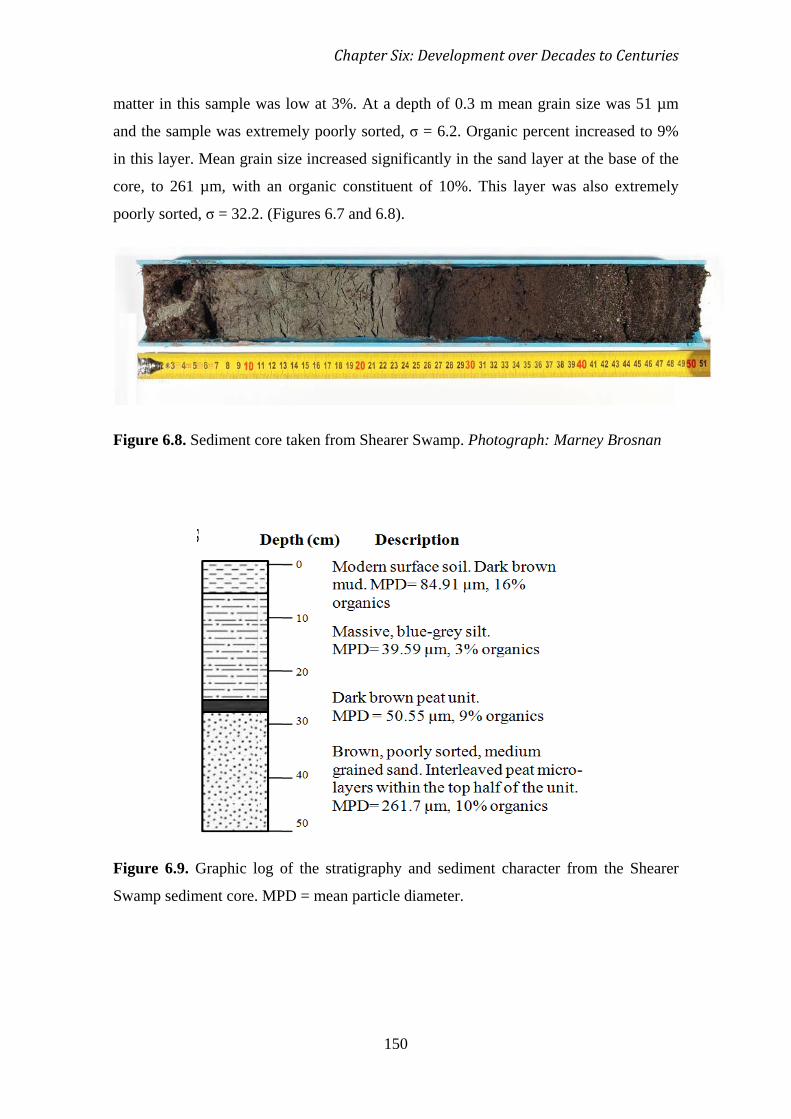
Chapter Six: Development over Decades to Centuries
150
matter in this sample was low at 3%. At a depth of 0.3 m mean grain size was 51 µm
and the sample was extremely poorly sorted, σ = 6.2. Organic percent increased to 9%
in this layer. Mean grain size increased significantly in the sand layer at the base of the
core, to 261 µm, with an organic constituent of 10%. This layer was also extremely
poorly sorted, σ = 32.2. (Figures 6.7 and 6.8).
Figure 6.8. Sediment core taken from Shearer Swamp. Photograph: Marney Brosnan
Figure 6.9. Graphic log of the stratigraphy and sediment character from the Shearer
Swamp sediment core. MPD = mean particle diameter.
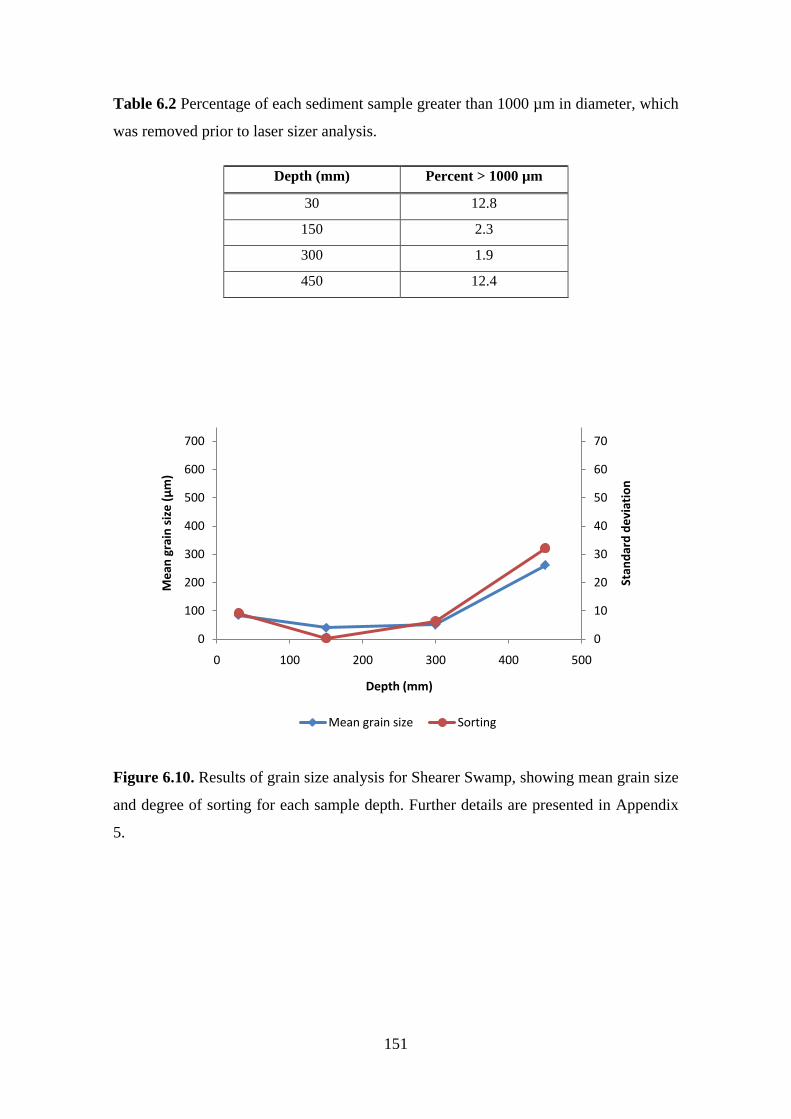
151
Table 6.2 Percentage of each sediment sample greater than 1000 µm in diameter, which
was removed prior to laser sizer analysis.
Depth (mm) Percent > 1000 µm
30 12.8
150 2.3
300 1.9
450 12.4
Figure 6.10. Results of grain size analysis for Shearer Swamp, showing mean grain size
and degree of sorting for each sample depth. Further details are presented in Appendix
5.
0
10
20
30
40
50
60
70
0
100
200
300
400
500
600
700
0 100 200 300 400 500
Stan
dard
dev
iati
on
Mea
n gr
ain
size
(µm
)
Depth (mm)
Mean grain size Sorting
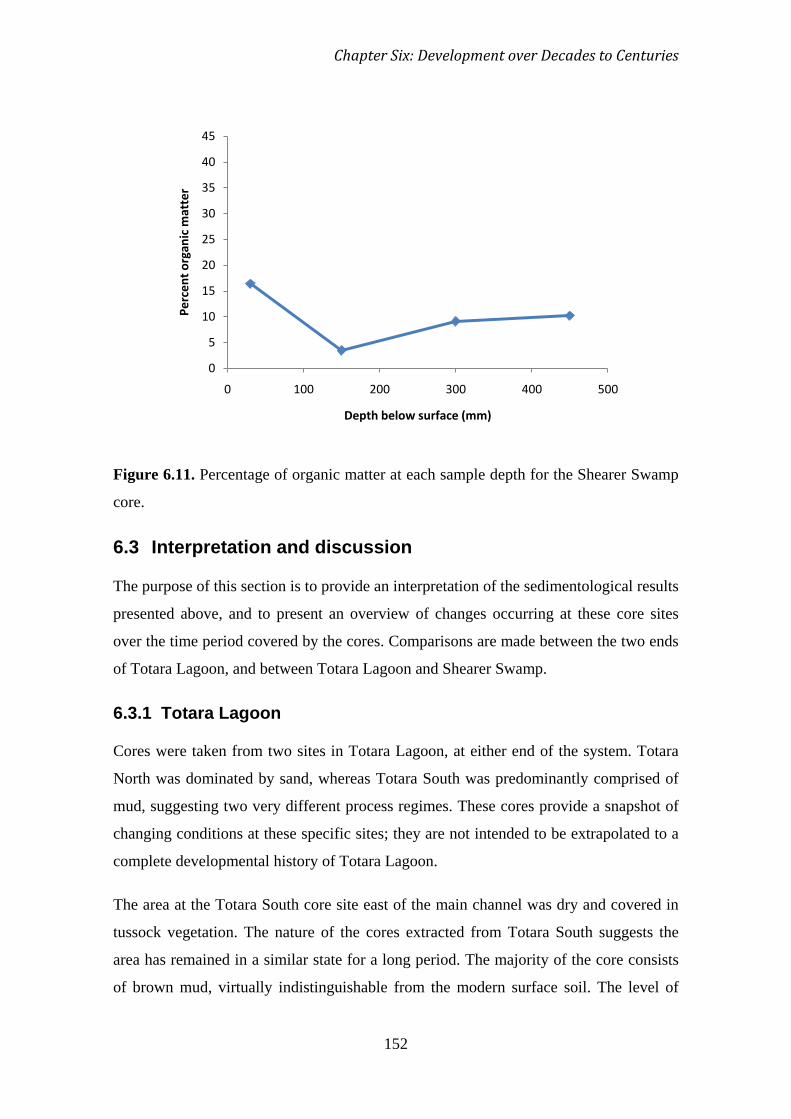
Chapter Six: Development over Decades to Centuries
152
Figure 6.11. Percentage of organic matter at each sample depth for the Shearer Swamp
core.
6.3 Interpretation and discussion
The purpose of this section is to provide an interpretation of the sedimentological results
presented above, and to present an overview of changes occurring at these core sites
over the time period covered by the cores. Comparisons are made between the two ends
of Totara Lagoon, and between Totara Lagoon and Shearer Swamp.
6.3.1 Totara Lagoon
Cores were taken from two sites in Totara Lagoon, at either end of the system. Totara
North was dominated by sand, whereas Totara South was predominantly comprised of
mud, suggesting two very different process regimes. These cores provide a snapshot of
changing conditions at these specific sites; they are not intended to be extrapolated to a
complete developmental history of Totara Lagoon.
The area at the Totara South core site east of the main channel was dry and covered in
tussock vegetation. The nature of the cores extracted from Totara South suggests the
area has remained in a similar state for a long period. The majority of the core consists
of brown mud, virtually indistinguishable from the modern surface soil. The level of
0
5
10
15
20
25
30
35
40
45
0 100 200 300 400 500
Perc
ent o
rgan
ic m
atte
r
Depth below surface (mm)
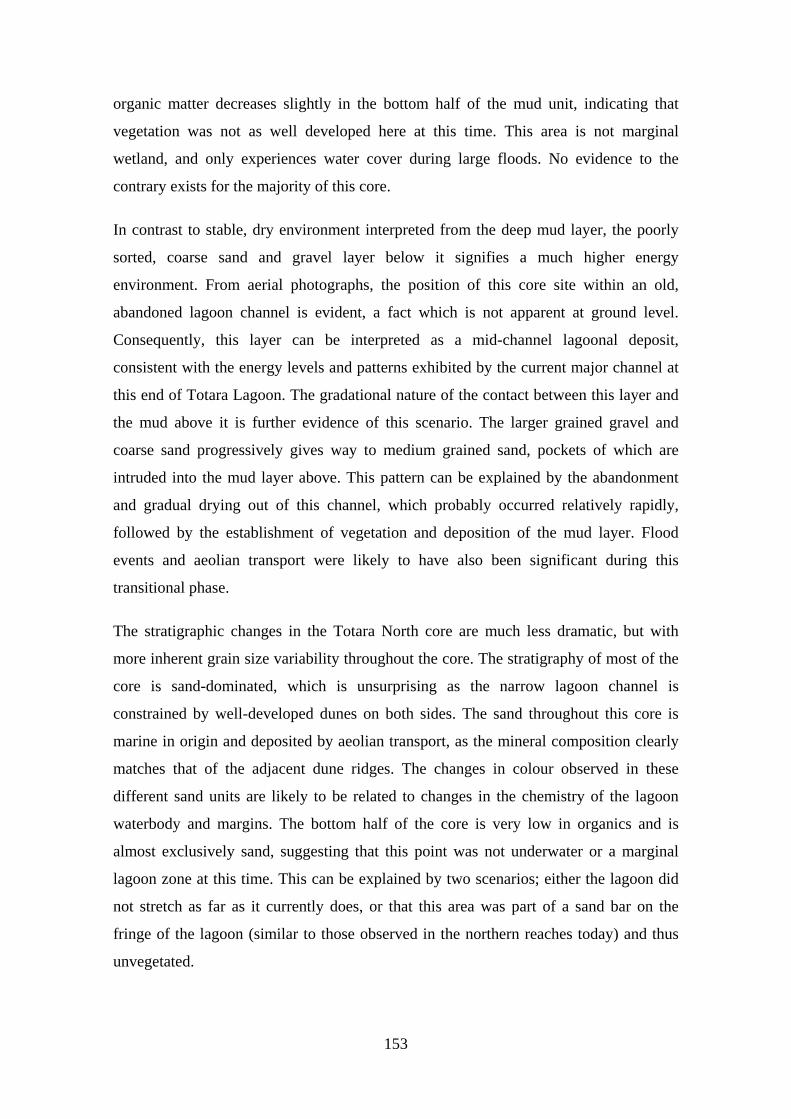
153
organic matter decreases slightly in the bottom half of the mud unit, indicating that
vegetation was not as well developed here at this time. This area is not marginal
wetland, and only experiences water cover during large floods. No evidence to the
contrary exists for the majority of this core.
In contrast to stable, dry environment interpreted from the deep mud layer, the poorly
sorted, coarse sand and gravel layer below it signifies a much higher energy
environment. From aerial photographs, the position of this core site within an old,
abandoned lagoon channel is evident, a fact which is not apparent at ground level.
Consequently, this layer can be interpreted as a mid-channel lagoonal deposit,
consistent with the energy levels and patterns exhibited by the current major channel at
this end of Totara Lagoon. The gradational nature of the contact between this layer and
the mud above it is further evidence of this scenario. The larger grained gravel and
coarse sand progressively gives way to medium grained sand, pockets of which are
intruded into the mud layer above. This pattern can be explained by the abandonment
and gradual drying out of this channel, which probably occurred relatively rapidly,
followed by the establishment of vegetation and deposition of the mud layer. Flood
events and aeolian transport were likely to have also been significant during this
transitional phase.
The stratigraphic changes in the Totara North core are much less dramatic, but with
more inherent grain size variability throughout the core. The stratigraphy of most of the
core is sand-dominated, which is unsurprising as the narrow lagoon channel is
constrained by well-developed dunes on both sides. The sand throughout this core is
marine in origin and deposited by aeolian transport, as the mineral composition clearly
matches that of the adjacent dune ridges. The changes in colour observed in these
different sand units are likely to be related to changes in the chemistry of the lagoon
waterbody and margins. The bottom half of the core is very low in organics and is
almost exclusively sand, suggesting that this point was not underwater or a marginal
lagoon zone at this time. This can be explained by two scenarios; either the lagoon did
not stretch as far as it currently does, or that this area was part of a sand bar on the
fringe of the lagoon (similar to those observed in the northern reaches today) and thus
unvegetated.
Chapter Six: Development over Decades to Centuries
154
The overlying muddy sand layer can be interpreted as a definitive increase in lagoon
influence. The sand within this layer would still have been wind-blown from nearby
dunes, but the mud indicates that this area was now at the margin of a low-energy water
body. The increase in organic content is likely to be a result of developing marginal
vegetation. This unit underlies the modern surface sediment, which is extremely
organic-rich. This is a result of decaying swamp surface vegetation and the high
biological productivity of the lagoon water column, as the site is currently situated at the
water edge and is frequently submerged.
6.3.2 Shearer Swamp
A progressive change in energy levels and exposure is evident from the Shearer Swamp
core. Results from this site are not indicative of conditions over the entire swamp, but
provide a snapshot of changes occurring at the swamp margin, which is the most
dynamic area of the swamp, and the point of greatest interest to this study.
The basal unit of this core, comprised of interleaved peat and sand layers, is likely a
result of a wetland environment subject to significant aeolian sand deposition from
nearby dunes. This suggests the wetland was already developed and the margin situated
at approximately this point for the duration of the time period covered by this core. The
interpretation of the sand as wind-deposited is due to the close proximity of the relic
dune ridges, and the fact that there are high-organic peat layers interleaved with the
sand. This suggests that there was vegetation present on the surface of the sediment at
the time of deposition, and peat would not have been able to accumulate had the sand
layer been a result of marine or fluvial processes. The adjacent dune ridges are currently
farmed, thus covered with grass and other vegetation, but it is likely that they were less
well vegetated at the time this layer was deposited.
Above the previous unit lies a layer of pure peat. This represents a low-energy wetland
deposit, unaffected by aeolian sand transport or fluvial influence. This is likely a result
of the stabilisation, or slight migration, of the swamp margin, combined with
stabilisation of the adjacent dune ridges. The conversion of the relic dune ridges into
farmland would have substantially reduced the volume of windblown sand, and this
combined with the further growth of swamp vegetation would have allowed this peat
deposit to form.
155
The massive, low-organic silt layer is indicative of an increase in energy conditions at
this site, following the deposition of the peat layer below it. This silt is of fluvial origin,
and the current proximity of Waikoriri Creek to the coring site suggests that the creek
may have flowed over this area at the time of the silt deposition. The consistent, fine
grain size implies a fluvial environment such as this creek is currently, with relatively
low but constant flow velocities. The low organic content of this unit indicates a low
degree of biological productivity in the water column at the time.
The preceding unit is overlain by the modern surface soil, which is an organic-rich mud.
The creek had migrated eastwards of this point following the deposition of the
underlying silt layer, and swamp vegetation and grasses have grown on the surface.
Decay of this vegetation has led to the organic-rich nature of this layer, which is typical
of swamp deposits. The mud is likely to have been emplaced during flood events, when
water pools on the swamp surface and suspended sediment settles out.
6.3.3 Limitations and errors
The primary limitation of the coring investigations within this project is spatial scale.
Ideally, several cores from each system would have been taken at different locations,
and then they would have been correlated to show an overall picture of change for the
entire system. Due to equipment and access constraints, only a snapshot of change at a
few isolated sites could be investigated. The numerical errors (discussed in Chapter 3)
that arose from coring technique and sediment character are negligible in terms of
describing the broad changes in depositional environment evident in these cores, and
have been disregarded in this chapter.
The use of the Loss on Ignition (LOI) technique to measure the amount of organic
carbon in a sediment sample has been the subject of much debate, and many researchers
consider it to be so fraught with error that results are unreliable (Doyle and Garrels,
1985; Sutherland, 1998). As a result, interpretations presented here from LOI results
should be treated with caution and do not aim to provide absolute quantitative measures
of total organic content in the sediment samples. These results have instead been used as
a loose proxy for vegetation cover and/or water column productivity, in order to make
comparisons between sediment units and infer the local environment at the time of
deposition. The tendency for LOI to produce incomparable results between samples of

Chapter Six: Development over Decades to Centuries
156
differing grain size is acknowledged (Sutherland, 1998), but is likely to be of little
consequence in this context of interpretation.
6.4 Summary
This chapter presented the results of sediment core stratigraphy and sediment analyses
from two sites at Totara Lagoon, and one site at the western margin of Shearer Swamp.
The aim of these analyses was to investigate the changes in depositional environment at
these sites over historical timeframes (in isolation from one another) and examine the
relationship between these changes and current system dynamics.
The Totara South site exhibited a dramatic transition from a very poorly sorted, coarse
grained sand and gravel layer at the very bottom of the core, to a massive consistent
mud unit for the remainder. This represented the abandonment and gradual drying out
of a large channel, followed by the stabilisation and vegetation of the area.
The core recovered from Totara North was dominated by wind-blown sand, transported
from the adjacent dunes. The lower half of the core consisted of medium grained sand
units, shifting to a muddy sand layer and organic soil above, and increasing in organic
content upcore. This represents a shift from open, unvegetated sand bar type conditions,
to a greater degree of lagoon influence at this specific location.
The core site at Shearer Swamp has undergone a series of changes in depositional
conditions, while maintaining a position at the swamp margin for the entirety of the
time period represented by the core. A medium grained sand unit, resulting from aeolian
transport of sand from nearby dunes, gives way to a unit of highly-organic peat, which
represents a shift to wetland conditions. A unit of massive, low-organic silt overlies this,
suggesting Waikoriri Creek ran over this site for a time, before the transition to the
current muddy, well vegetated surface soil typical of wetland systems.
157
CHAPTER SEVEN
Integrated Discussion and Management
Implications
7.1 Introduction
The previous three chapters presented the results of this research, first documenting the
current geomorphology and hydrology of the study systems, followed by their
development over timeframes of decades to centuries. Each of these chapters possesses
an interpretation and related discussion of the chapter findings presented, and this
information will not be reproduced here. The purpose of this chapter is to bring together
these results; providing a complete picture of the development of the coastal plain
shared by Totara Lagoon and the Shearer Swamp-Waikoriri Lagoon Complex, and
discussing the morphology of these coastal systems in the context of national and
international research. Potential response of these systems to differing future pressures
is examined in a conceptual manner, and the management implications of this are
discussed.
Firstly, an integrated discussion of the results of this investigation is presented in
section 7.2, highlighting the similarities and differences between Totara and Waikoriri
Lagoons. The definitions and classification schemes pertaining to coastal lagoons and
estuaries are discussed in section 7.3, and the systems researched here are placed in this
context. Existing models of hapua dynamics developed in relation to East Coast systems
are evaluated in terms of applicability to the more sandy West Coast systems in Section
7.4, and the importance of considering barrier permeability is highlighted. Section 7.5
discusses the past development of these systems in the context of morphodynamic
theory and seeks to predict the response of these systems over the next century under
differing climatic factors and management pressures. A conceptual model depicts the
response of a sandy hapua-type system to differences in forcing factors, including
differing management regimes.
158
This chapter addresses following research objectives:
• to understand these West Coast systems in the context of existing
morphodynamic classification schemes,
• to analyse the processes driving changes in geomorphology within the study
systems,
• to explore factors likely to influence their development over the next 100
years,
• to develop a model to predict their response to differences in these forcing
factors, and
• to apply this model in the context of management of hapua type systems.
7.2 Comparison of Totara Lagoon and Waikoriri Lagoon
The results of this investigation have been previously interpreted in detail and discussed
in isolation within each chapter, and will not be repeated here. This section will discuss
the implications of these results as a whole, and briefly compare Totara Lagoon and
Waikoriri Lagoon over the entire time period covered by the preceding three chapters.
The study of processes on varying timescales is very important from a morphodynamic
perspective, due to the complex nature of feedback loops that exist between processes
on a variety of spatial and temporal scales.
The primary observation of results from all timescales is the importance of spatial scale
in determining system response time. From both aerial photograph results on a decadal
scale and field observations on a monthly to weekly scale, the difference in temporal
dynamics between the two systems is glaringly apparent. Outlet position was more
variable, and a greater degree of morphological change was observed in Waikoriri
Lagoon than in Totara Lagoon. The same pattern of hapua outlet dynamics occurred in
both systems, but it occurred much faster in Waikoriri Lagoon.
From the combination of all results gathered, Totara Lagoon can be described as a very
large, stable rivermouth lagoon system that exhibits large scale morphological change
Chapter Seven: Integrated Discussion and Management Implications
159
on a decadal scale, and experiences smaller, spatially restricted changes in morphology
on scales of days to months. Large scale morphological changes take the form of
changes in outlet position, channel structure and water cover, whereas the majority of
small scale change is centred at the outlet position. The morphological structure of the
lagoon is relatively constant, but hydrologically, the lagoon switches between an
estuarine phase (experiencing tidal inflows) and a hapua-like, freshwater phase. This
conclusion was reached from a combination of topographic surveys of dune
morphology, field and aerial photograph observations of spatial trends in vegetation
development, sediment core analysis, and aerial photograph analysis of outlet and
channel changes. There were no conflicting conclusions from individual sets of results,
rather each set of results confirmed aspects of other sets, and results built upon each
other to provide a comprehensive picture of the temporal and spatial scale of lagoon
dynamics. Totara Lagoon displays a strong trend of decreasing energy with distance
from the river mouth, both morphologically and hydraulically.
In contrast, Waikoriri Lagoon can be described as a very small, dynamic hapua-type
lagoon system that experiences large scale morphological change on scales of months to
years, and experiences small scale morphological changes on scales of hours to weeks.
The patterns of morphological change are similar to Totara Lagoon, but exist on a
smaller scale. Hydrologically, the two systems exhibit very different dynamics, which is
a consequence of their differing size, stability and boundary conditions. In the case of
Waikoriri Lagoon, coring data cannot be used to infer lagoon conditions, as the core
location was in Shearer Swamp. Conditions at Waikoriri Lagoon itself were not
conducive to core extraction, due to the dynamic nature of the system and position right
on the beach.
The issue of defining boundary conditions of these lagoon systems is a complex matter,
and the balance of factors contributing to these systems is very different between Totara
Lagoon and Waikoriri Lagoon. In the case of Totara Lagoon, the lagoon itself is the
most prominent feature when considering the system as a whole, including the river and
catchment and adjacent swamp. On the contrary, Waikoriri Lagoon is a very small
feature relative to Shearer Swamp behind, and the catchment dynamics are very
different as a result of the influence of Shearer Swamp.
160
Despite the physical differences just highlighted, the patterns of behaviour and
processes in these systems are very similar to each other and to accepted models of
hapua behaviour (Kirk, 1991; Todd, 1992; Hart, 2007). However, Totara Lagoon
appears to be generally more stable than a typical hapua. The differences in temporal
dynamics between Totara Lagoon and Waikoriri Lagoon can be explained by the
disparity in size between the two systems, as system stability and response time
increases proportionally with size in systems of similar morphology. Consequently,
behaviour patterns in these systems can be considered consistent with hapua dynamics
in general and representative of West Coast sandy-hapua systems.
7.3 Morphodynamic classification of coastal lagoons
Terminology and classification schemes of coastal systems and landforms have been
well developed and discussed in literature for over 50 years, but the definition and
classification of coastal lagoon systems is still somewhat uncertain. The purpose of the
present research was not to disassemble or modify existing definitions or classification
schemes, but to examine them in detail to provide a context within which to understand
the dynamics and processes occurring in the lagoon systems under study, and compare
them with similar systems elsewhere.
The systems examined here fit adequately into the general, non-specific definitions of
coastal lagoons and their sub-types, discussed in Chapter 1, that are based primarily on
morphology (e.g. Phleger, 1969; Kjerfve, 1986), but uncertainties arise when
hydrological parameters are introduced into the definition. The issue of tidal influence
and terminology with respect to these systems is of significant importance to this study
and will be discussed in the following section.
In addition to the actual physical parameters involved, the terminology used to describe
coastal lagoons and estuaries varies hugely across international literature, and
consequently has been the subject of much debate (Tagliapietra et al., 2009). For
example, ‘hapua’ is a term of solely local (New Zealand) usage, and is not used globally
to describe similar systems. Therefore, the exact terminology used to describe a given
system in the literature is not likely to be of primary importance to the reader. More
crucial is the need to describe the dynamics and dominant processes acting on a system,
Chapter Seven: Integrated Discussion and Management Implications
161
in order for the reader to understand the nature of the system and classify it to
themselves in the context of their local terminology.
7.3.1 The hapua-estuary continuum
The classification of coastal lagoon and estuary systems has been the subject of
continued debate over recent decades. As discussed in Chapter 1, the definitions of an
estuary compared with a coastal lagoon are very similar, and are not always mutually
exclusive. Existing classification systems are based on the hydrology and morphology
of the system, which are inherently related and interconnected on a variety of
timescales, and are constantly changing as a result. Consequently, there is a large
number of sub-classifications within the overarching term ‘estuary’ or ‘coastal lagoon’
and in many cases the definitions and terms overlap. In the context of this argument,
these terms are discussed for the case of wave-dominated coasts and barrier-enclosed
systems only, as both Totara Lagoon and Waikoriri Lagoon are of this nature.
The connectivity between these definitions and the overlap at their boundaries is
particularly apparent in the case of Totara Lagoon, which has been previously classified
as a hapua (Neale et al., 2007, DOC, 2005). In terms of barrier structure and outlet
behaviour this is an accurate classification. The environment is wave dominated, with a
strong northward littoral drift, and the pattern of barrier formation, mouth offset and
barrier breaching presented by Todd (1992) clearly occurs in this system. The
conflicting factor in this case is the significant tidal influence that currently occurs in the
system. By definition, hapua possess a true outlet, experiencing no tidal inflow or
saltwater prism (Kirk, 1991; Hart, 2007), although water levels in the lagoon can be
affected indirectly by a tidal backwater effect. As discussed in Chapter 5, the water level
and conductivity records from Totara Lagoon clearly indicate the presence of inflows
and outflows in response to tides, which suggests that, hydraulically, this system should
currently be defined as an estuary rather than a hapua-type lagoon. Despite this, the
structure and morphological behaviour of the system remains more closely related to
that of other hapua than to systems classified as wave-dominated or river-dominated
estuaries. This observation raises the question of which should be the ultimate defining
factor – morphology or hydrology. This research suggests that although these terms are
mutually exclusive, a waterbody can switch between the two states at different times,
and in this case should be referred to as a rivermouth lagoon, followed by the qualifying
162
term of ‘estuarine phase’ (tidal ingress occurring) or ‘hapua-phase’ (no tidal prism, i.e.
freshwater).
Another question arises as to the cause of this significant tidal influence during an
estuarine phase. As evidenced by aerial photograph analysis and field visits, the outlet is
currently (and has remained for the past few years) situated at the river mouth, in a state
of ‘primary breach’ according to the model of hapua behaviour presented by Todd
(1992) and Hart (1999). Field observations suggest that if this was not artificially
maintained, the barrier would grow across the outlet, causing it to migrate as in the past.
The Totara River is not a large river, and the mean flow is not sufficient to naturally
maintain a primary breach. As a consequence of this weak fluvial output combined with
the high energy marine environment, tidal flows are able to penetrate at the mouth and
propagate up the channel. It is important to note, however, that the evidence of a
substantial tidal prism in Totara Lagoon was collected over a single week, thus may not
be representative of conditions over a longer timeframe. At the time of these
observations, the mouth was very open to wave exposure, and no sediment wedge had
built across it. Several months later the channel was still in essentially the same
position, but it was narrower and oriented diagonally through the barrier, as a large
sediment wedge had accreted across the mouth. It is likely that at this time, there would
have been significantly less tidal intrusion into the main lagoon channel.
The position of the outlet at the river mouth likely contributed significantly to the ability
of the tide to penetrate into the lagoon. The channel at the point where the river, lagoon
and sea met was very deep and was subject to scour from current activity, meaning the
channel bed elevation was not above sea level. In addition, the direction of wave
approach versus the orientation of the lagoon outlet is important. At the river mouth,
wave approach is predominantly southwest and at an oblique angle to the outlet,
oriented almost directly into the lagoon entrance at this point, which enhances saltwater
influx. Aerial photograph evidence shows the when the outlet was offset, it was almost
exclusively orientated diagonally northwards, so waves did not directly approach the
outlet frequently. In addition, the outlet channel would likely have been subject to less
scour and thus less subject to tidal intrusion.
In reality, the concepts of hapua and wave-dominated estuaries or lagoons are closely
related, and both respond to fluvial input, marine climate and sediment supply. The
Chapter Seven: Integrated Discussion and Management Implications
163
morphology and hydrology which is exhibited by any river mouth system is a function
of the balance between these three factors, and a change in any one of them can affect
this balance and cause the system to effectively change state. The observations
described above support the idea that river mouth behaviour is a three dimensional
continuum (Hart, 2007), and that although hapua are essentially freshwater lagoon
systems in most cases, they can be subject to tidal influence in response to a change in
conditions. The point at which a system should no longer be termed a hapua has not
been specifically defined, and if adhering strictly to terminology used in previous
research, any degree of regular tidal intrusion within such a system excludes it (Hart,
1999; Kirk and Lauder, 2000, Hart, 2007). A paradox lies in the fact that although a
system like Totara Lagoon can be experiencing a significant tidal influence (potentially
described as an estuarine phase), the system remains wave-dominated rather than
tidally-dominated, thus fitting neither the strictest definition of a hapua nor that of a true
estuary.
Not all definitions of estuary focus on tides; many focus on dilution of seawater by
freshwater derived from rivers/land drainage. The various classification schemes of
estuaries and lagoons from international literature were examined in Chapter 1, and one
of particular relevance to this study is that of Hume and Herdendorf (1988). This is a
detailed scheme pertaining to all types of coastal landforms, in which coastal lagoons
are classified as part of the overarching estuary section. The systems here fit into this
classification as ‘river mouth estuaries’, which are further subdivided into three types,
two of which are spit-lagoons. The difference between these two types of spit lagoons is
tidal influence. A Type 9 spit-lagoon occurs on sandy coasts and experiences a tidal
influence, while Type 10 is a hapua-type lagoon with a coarser grained barrier and no
tidal prism. The systems studied here possess characteristics of both these types, and
Totara Lagoon demonstrates the transition back and forth between them, while still
ultimately maintaining the title ‘spit-lagoon’, which is an accurate description of
morphology and process dynamics.
Kirk (1991) disagrees with this classification of hapua as a form of estuary, with
particular reference to Hume and Herdendorf (1988), as a common factor to all
definitions of an estuary is the requirement for seawater to be present in the system; a
factor which is clearly absent in a hapua-type lagoon. This research suggests that rather
164
than treating hapua-type lagoons as a type of estuary, they should be placed on a
continuum with estuaries, included in an overarching classification of coastal lagoons.
However, it is important to note that although all hapua are coastal lagoons, not all
estuaries can be classified as coastal lagoons. Within such a scheme, there is greater
provision for a systems such as Totara Lagoon and the Ashley River mouth (Kirk and
Lauder, 2000), which function in the transition zone between an estuary and a hapua
and exhibit characteristics of both. This makes the connection between estuaries and
hapua, while recognising that one system can switch between the two hydrological
states while maintaining the same basic morphological structure.
The classification of rivermouth lagoons within an overarching estuarine classification
scheme has also occurred internationally. The depiction of a river-dominated estuary by
Cooper (2001) in South African systems, and that of a barrier lagoon by Roy et al
(2001) for Australian rivermouth environments, both describe systems that are
morphologically similar to hapua. In many ways, these definitions share more
commonalities with the West Coast systems, as they are based on empirical evidence
from a variety of barrier types, rather than being restricted to coarse barrier systems.
7.4 Conceptual models of hapua dynamics
Early models of hapua dynamics focus on river volume and flow patterns as the primary
driving force of hapua behaviour (e.g. Kirk, 1991; Todd, 1992). The importance of
wave energy in affecting barrier morphology and thus hapua dynamics has been well
documented in subsequent research (Hart, 1999, 2007). The two hapua systems studied
here represent two extremes of spatial scale, yet are by and large representative of the
morphology of hapua-type systems across the West Coast. These can be considered
functionally the same in terms of long term morphology and behaviour within this
theoretical discussion, and will no longer be discussed as separate systems in this
section but referred to in the plural.
7.4.1 Comparisons with East Coast hapua
National research surrounding hapua dynamics has centred on the East Coast of the
South Island, where hapua-type systems have developed under similar conditions to
those on the West Coast, but with some important differences. Both coasts experience a
high energy wave environment and strong littoral drift, but East Coast hapua are
Chapter Seven: Integrated Discussion and Management Implications
165
restricted to beaches of mixed sand and gravel composition, and form in rivers of higher
flow rates than those in Westland. One further difference between the East Coast
environment compared to the West Coast is tidal regime. The tidal range on the East
Coast is microtidal, with tidal ranges of between 1 and 2 m, while the West Coast
experiences a mesotidal regime, with variations of between 2 and 4 m (NIWA). The
region under study here experiences the lower end of the mesotidal zone, with variations
of just over 2 m. The difference in tidal regime between the East and West Coasts is not
dramatic, but the combination of a low river flow, exposed outlet/river mouth, and a
slightly larger tidal influence could explain the significant degree of tidal influence
observed in Totara Lagoon.
The findings of this research are generally in agreement with existing models of hapua
behaviour patterns in response to changes in river flow, but the details of these models
are often very different to the observations of West Coast systems. On the surface, the
patterns of outlet migration and natural breaching observed in these systems appear to
correlate well with the models of Todd (1992), Kirk (1991) and Hart (1999), as
presented in Chapter 1. However, despite appearances, the set of conditions that gives
rise to the accepted behaviour patterns in these sandy hapua can be very different to
those predicted by these models. This is due to their basis in observations of East Coast
hapua, which possess coarser, mixed sand and gravel barriers.
The importance of wave processes in hapua behaviour is a key point presented by Hart
(2007), and this is also true of West Coast conditions. Field observations throughout this
investigation suggest that the model presented by Hart (1999) can be applied to the
sandy barriers of West Coast systems also, although the numerical values of low,
moderate and high river flow are very much lower. Not all coarse-barrier systems
exhibit every type of behaviour, and the same is true for sandy West Coast systems
In terms of system boundaries, there are significant differences in the land adjacent to
the lagoon systems between coasts. West Coast systems are generally more complex
and connected to adjacent land via wetland systems, whereas East Coast systems often
currently have no connecting wetlands. These wetlands serve several functions in West
Coast systems; draining into the lagoon from multiple locations, and acting as a buffer
zone for water and sediment storage between the catchment and the lagoon system.
Without these wetlands attached, the behaviour of East Coast systems in response to
166
catchment dynamics is almost entirely river-dependent. It is important to note, however,
that most East Coast hapua once did have connecting wetlands, but these have been
progressively drained and cleared for land development.
A clear difference observed between East Coast and West Coast systems is the direction
of outlet migration. In both cases, the net littoral drift is northwards, but on the East
Coast the outlet position will sometimes migrate south of the river mouth (Kirk, 1991).
This was not observed in West Coast systems even once during the 59 year aerial
photograph record.
Flood duration in West Coast rivers is much shorter than in those on the East Coast, due
to the narrow coastal plain and steep terrain behind. Periods of high river flow and
sediment discharge last in the order of hours to a few days, and as a result, intense flood
related pressure on lagoon outlet morphology is not sustained for long periods, and the
system regains an equilibrium state in a much shorter time than on the East Coast. This
difference is further increased by the disparity in feeder river sizes between typical
systems on the two coasts. The actual volume of sediment delivered to a lagoon by
larger, East Coast rivers during a flood can be far greater than the small, West Coast
lagoon-feeding rivers.
As presented in Chapter 1, Figures 1.2 and 1.4, Kirk (1991) discussed hapua behaviour
in terms of a sediment budget and variations in river flow. One important point in this
paper that somewhat contrasts with West Coast observations is the assumption that
nourishment of the barrier occurs largely via sediment discharge from the primary river
feeding the lagoon. This is certainly true of coarse barriers, as coarse sediment cannot
be transported far from the source by way of littoral drift, but is less true of sandy
hapua. West Coast hapua form at the end of rivers that can be considered small, both in
terms of flow volume and sediment load. Most of the material that forms the barriers of
these hapua is sand that has been transported by littoral drift from larger rivers further
along the coast, or reworked from the long expanse of beach sediment.
Chapter Seven: Integrated Discussion and Management Implications
167
7.4.2 The issue of barrier permeability
As previously discussed, the behaviour of the West Coast systems investigated here
correlates relatively well with existing East Coast models of behaviour patterns and
outlet migration, but the relationship between river flow and hapua formation and outlet
maintenance thresholds are very different between the two coasts. This disparity in
threshold levels can be attributed to differences in barrier permeability and stability,
both of which dramatically affect outlet dynamics. Barrier permeability determines the
degree of percolation through the barrier and thus the ease of which lagoon water level
rises sufficiently high to breach the barrier (Todd, 1992). Permeability is a function of
grain size and degree of sorting; the coarser the material and the better the level of
sorting, the more permeable the barrier (Todd, 1992). Consequently, the coarse and
poorly sorted nature of East Coast mixed sand and gravel barriers means they are much
more permeable than the sandy barriers of West Coast hapua.
As a result of the sandy and less permeable nature of the West Coast barriers, hapua are
able to sustain permanent outlets at the mouths of much smaller rivers than their East
Coast counterparts, and maintain a similar pattern of outlet migration and breaching
despite some very small fluvial inflows. In addition, the sandy nature of West Coast
barriers renders them more stable and conducive to vegetation growth than the coarser
East Coast beaches, which are often bare or scantily vegetated with marram grass. As
discussed in Chapters 5 and 6, vegetation cover has a further stabilising effect on outlet
migration, as it is less likely for a breach to occur in a heavily vegetated section of the
barrier.
Barrier permeability has been acknowledged in previous literature as a very important
determinant in river mouth functioning (Kirk, 1991; Todd, 1992; Hart, 1999, 2007), but
barrier composition (mixed sand and gravel versus predominantly sand) has not been
investigated in the context of hapua formation and dynamics. As research has been
centred on East Coast systems of similar barrier composition, mixed sand and gravel
type barriers have been considered the norm for hapua type systems. One exception to
this standard morphology in East Coast systems is the Hurunui river mouth, which is of
intermediate grain size and permeability (i.e. between the mixed sand and gravel nature
of most East Coast barriers and the sandy West Coast barriers) (Smith, 1995). Kirk
(1991) also pointed out that a large volume of silt and fine sand is transported
168
downriver, in this case the Rakaia River, which can substantially reduce the
permeability of these essentially coarse grained barriers.
Another consequence of high barrier permeability is that high rates of throughflow
between the lagoon and the barrier can result in a tendency to easily breach the barrier
when water levels in the river and lagoon rise (Kirk, 1991). This leads to instability in
the barrier and frequent outlet migration, as observed in East Coast examples (e.g.
Rakaia, Opihi). In contrast, the sandy and stable nature of the West Coast barriers
promotes less variable outlet migration. This supports the suggestion put forward in
Chapter 6 that the outlets of West Coast hapua may skip between old abandoned outlet
channels more frequently than they exhibit a steadily migrating pattern or forge new
breaches.
A significant finding that emerged from this present research is that hapua-type lagoons
can form in very different environments to those found on the East Coast. The very
existence of these systems on the West Coast, and Waikoriri Lagoon in particular,
demonstrates the wide spectrum of conditions under which hapua can form. The
existence of these low-river-flow systems demonstrates that the absolute flow volume
and velocity, and the type of sediment transported by the river are not of primary
importance; rather it is the balance of these two factors with the nature of the barrier that
is paramount. Several key parameters remain necessary for the formation of a hapua-
type system over other river mouth systems such as deltas or estuaries, which are: a
high energy, wave dominated environment, and strong longshore drift and sediment
transport. These conditions are necessary for the formation and maintenance of a
barrier behind which the lagoon waterbody can form, and are responsible for the pattern
of outlet migration central to the formative mechanism and behaviour of hapua. These
coastal marine conditions are common to both coasts of New Zealand’s South Island. A
schematic diagram illustrating the variety of conditions under which New Zealand
hapua have formed is presented in Figure 7.1.
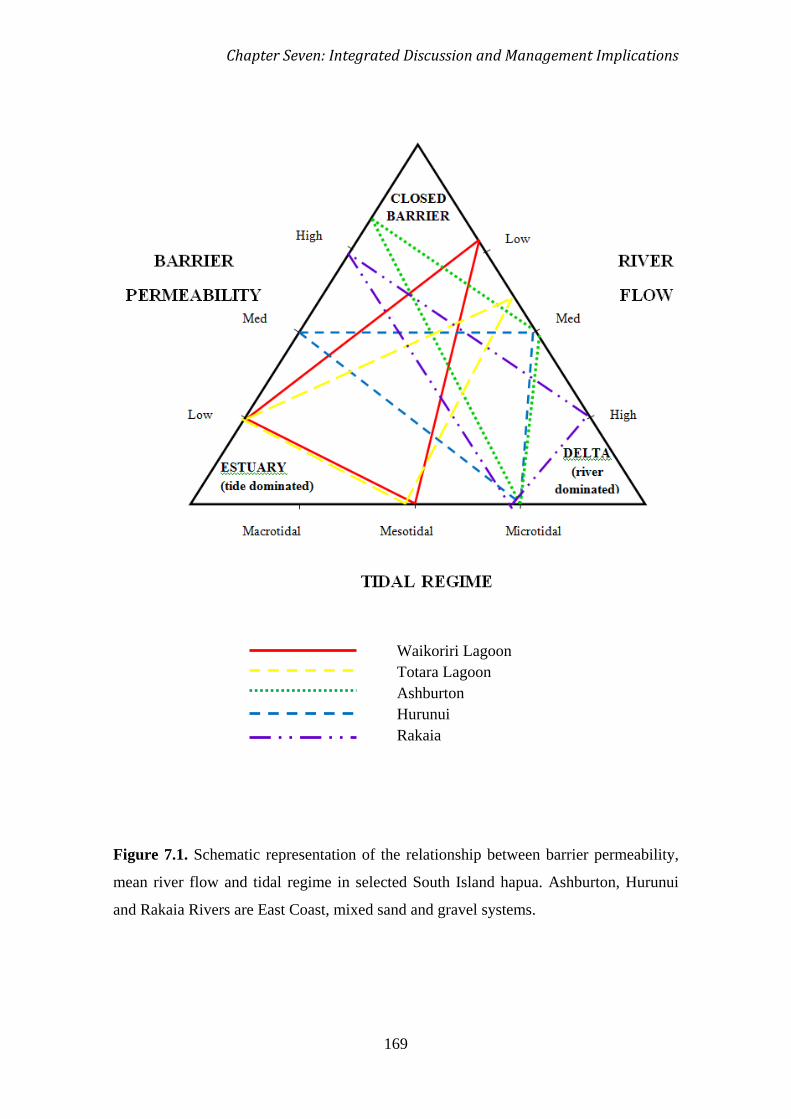
Chapter Seven: Integrated Discussion and Management Implications
169
Figure 7.1. Schematic representation of the relationship between barrier permeability,
mean river flow and tidal regime in selected South Island hapua. Ashburton, Hurunui
and Rakaia Rivers are East Coast, mixed sand and gravel systems.
Waikoriri Lagoon Totara Lagoon Ashburton Hurunui Rakaia
170
7.5 Morphodynamic development in Totara Lagoon and the Shearer Swamp-Waikoriri Lagoon Complex
Coastal lagoons are complex, dynamic systems that respond to a large number of
driving factors which interact with each other on a variety of timescales. The
multidisciplinary approach used in this study is based on the theory of
morphodynamics, discussed in Chapter 1, which is defined by Wright and Thom (1977,
p. 412) as “the mutual adjustment of topography and fluid dynamics involving sediment
transport”. This is the fundamental framework behind coastal evolution, stating that the
developmental path taken by a landform is a function of antecedent morphology,
hydrology and sediment supply.
The nature of hapua and the way in which they develop are a function of past
geomorphology and processes within an area, by the principle of Markovian Inheritance
(Cowell and Thom, 1994), as discussed in Chapter 1. The focus of this research is on
the short term development and changes within these two systems and in those that are
similar as a whole. However, to understand the development of these systems on a
decadal to centennial scale, and make confident predictions of future response to
changes in driving factors, the long term coastal development of the area must be
considered.
7.5.1 Long term development of the study area
Totara Lagoon and the Shearer Swamp-Waikoriri Lagoon Complex share the same
coastal plain, which developed over the late Holocene, following the sea level highstand
approximately 6000 years ago. The presence of a marine-cut cliff in the Loopline
terminal moraine, extending behind Totara Lagoon and along past the Mikonui River (at
the north end of the Shearer Swamp-Waikoriri Lagoon Complex), indicates that this
was the position of the coastline at this highstand, with several embayments existing
between cliffed areas. Therefore, the age of all surface landforms between this cliff and
the current coastline can be inferred to be less than 6000 years.
At the point of highest sea level, the area that is now Shearer Swamp would have been a
coastal embayment, constrained on three sides by hills. Following sea level fall (and
potentially compounded by tectonic uplift), the area would have become an estuary.
During this period, the large amount of sediment transported from the nearby mountains
Chapter Seven: Integrated Discussion and Management Implications
171
would have led to coastal progradation, which further enhanced the evolutionary
process initiated by falling sea level. It is likely that at this time the system was still
essentially wave-dominated, as the orientation of the coast to westerly systems was the
same as present. This argument is supported by the presence of the series of relic dune
ridges at the western margin of Shearer Swamp. These would have been the result of the
combination of a heavy sediment load to the coast and high wave energy creating a
barrier, similar to the processes occurring today. Behind the most landward of these
dune ridges, it is likely that the system underwent a progression from an open estuarine
system to a lagoon system, becoming increasingly closed to the ocean as relative sea
level fell and the coast prograded. These relic dune ridges are composed of sand of a
similar nature to the current active dune ridge, suggesting that processes very similar to
the current conditions were operating. Assuming offshore circulation patterns and thus
direction of littoral drift were similar to present, there is a distinct possibility that a
hapua may have formed, drained or infilled, and reformed between these disused
barriers several times during this period of coastal evolution. The transformation of the
area into swampland was likely to be very recent in terms of geological time, as it
would not have occurred until the area became completely cut off from marine
influence behind the inactive dune ridges.
This progression from open coastal embayment to freshwater wetland also represents a
change in energy levels within the system. Currently, no large waterways discharge into
Shearer Swamp; the Mikonui River flows just northwards of the swamp boundary, and
the Waitaha River flows south of Bold Head. These rivers could have avulsed
substantially over the late Holocene, which could also help account for the ultimate
development Shearer Swamp.
The evolutionary succession presented here is based on the developmental sequence
posited by Roy et al. (1994) for the development of coastal lagoons and estuaries on
wave-dominated coasts in response to marine regression. This succession has been
confirmed for several similar systems in New Zealand (Hicks and Nichol, 2007;
Horrocks et al., 2000). Many questions remain surrounding the exact developmental
sequence of Shearer Swamp, which would require a substantial amount of further
research to clarify.
172
A similar developmental succession likely occurred further up the coast behind the
current location of Totara Lagoon. The marine cut cliff extends most of the length of the
lagoon, in front of which was swampland similar to that of Shearer Swamp, present
during historical times. Once again, rows of inactive dune ridges extend approximately
100 m inland from the current coastline. These dune ridges, and those of Shearer
Swamp, are generally parallel to each other and to the current coastline, indicating that
this section of coastline remained relatively straight for most of the Holocene
development.
An exception to this trend of parallel dune ridge development occurs at the northern
extremity of Totara Lagoon and for several hundred metres beyond. Here, the dune
ridges are oriented towards the current coastline, at an angle of approximately 30° from
the standard direction of the dunes and the marine cut cliff. These ridges pinch out when
they meet the current active dune ridge approximately 100 m north of the lagoon
extremity. This change in dune orientation, and thus coastline configuration, would
have resulted from changing sediment supply and wave approach dynamics along this
stretch of coastline. The vast majority of sediment that reaches the system currently is
injected via the Totara River and Mikonui River, and transported north via littoral drift.
This pattern is unlikely to have changed in recent geological time, as the driving oceanic
circulation patterns are driven by seabed topography (Stanton, 1976; Bradford, 1983),
which remains essentially unchanged over this timeframe.
One potential mechanism for this change is the idea of a ‘hinge point’ around which this
section of coast has rotated during progradation (Dr. Jim Hansom, University of
Glasgow, 20th
7.5.2 Potential response under changing climate and management scenarios
March 2009. pers. comm.). The growth of the central area of Totara
Lagoon (and tendency for the lagoon to discharge here) could have acted as a sediment
trap for sediment brought northwards by littoral drift. As a result, the stretch of coastline
northwards of this area would have received comparatively less sediment, and wave
approach direction would also be affected as a result of the coastline curvature.
As such dynamic systems controlled by a complex network of interacting factors, the
response of these hapua to changes in climate conditions, catchment dynamics and
management pressures is difficult to predict. Ultimately, it is the balance between these
Chapter Seven: Integrated Discussion and Management Implications
173
multidirectional pressures that determines the morphological and hydrological state of
the system and determines what, if any, transformations will take place. The
anthropogenic factors that have influenced these systems historically were discussed in
Chapter 3.
A flowchart of process and response is presented in Figure 7.3, which illustrates the
hierarchy and interaction between factors likely to influence these systems over the next
century. Three possibilities of lagoon state are presented: lagoon loss (i.e. no lagoon
present), natural lagoon, or artificially modified lagoon. It is important to note that these
are very broad descriptions only, and there are many possible morphological and
hydrological states within each of these categories.
Climate
The effect of climate change on coastal systems is of particular concern internationally,
operating through sea level rise and changes in weather patterns. The ultimate change in
coastal morphology that results from these factors depends on how changes are
managed once they occur.
change and coastal lagoons
Sea level rise alone leads to a long term erosional trend at the affected coastline,
provided this is not counterbalanced by increased sediment supply (Pethick, 2001). This
is already a chronic problem along much of the Westland coast (Neale et al., 2007;
Ishikawa, 2008), although a few small sections have been recently accreting. Climate
change is expected to result in an increase in frequency and intensity of westerly
weather systems in the Westland region (MfE, 2008a). A consequence of this increase
in weather intensity is that more sediment will be transported to the coast from the
upper catchment. However, this will not be distributed evenly along the coastline,
further adding to spatial disparities in erosion and accretion trends.
As stated by morphodynamic theory, the actual response of the system depends on the
balance and direction of feedback operating between antecedent topography, sediment
supply, and fluid dynamics, including sea level and fluvial processes (Cowell and
Thom, 1994). This is of primary importance in the future development of these systems,
as the predicted response of climate change on the West Coast is to affect both sea level
and sediment supply. The importance of investigating both these controlling factors
174
when considering long term changes in barrier morphology is highlighted by Orford and
Carter (1995) and Carter (1989).
Totara Lagoon and the Shearer Swamp-Waikoriri Lagoon Complex are highly likely to
be affected by sea level rise and erosion of the seaward barrier over the next century. In
a natural, unconstrained lagoon system, this would result in rollback of the barrier and
landward migration of the entire hapua system, while maintaining essentially the same
morphological form (Pethick, 2001). There is evidence of this already occurring in the
southern half of Totara Lagoon, with a low, wide seaward barrier and heavily eroded
farmland on the landward margin of the lagoon channel (Figure 7.2). This pattern of
morphological change is currently restricted to the southern reaches of Totara Lagoon,
which is unsurprising as it is the most active section of the lagoon and thus has a faster
response time. As discussed in earlier chapters, the central reaches of Totara Lagoon
exhibit a large degree of variation in channel utilisation, which would likely absorb any
such changes occurring in this section of the lagoon and prevent large scale changes at
the landward margin. In addition, the landward margin of the central reaches is wetland,
which is much more able to deal with such dynamic changes than the rigid, eroding
farmland in the south. The northern section of the lagoon will respond last to any large
scale changes in morphology in the southern and central reaches. Both seaward and
landward barriers are much more stable here, and are unlikely to change significantly
over the next century. Sea level rise and increased storminess will likely be manifested
in increased wave overtopping and dune blowouts along the entire system, including in
the northern reaches.
Interestingly, the aerial photograph and coring results show evidence of a seaward
migration of the southern end of Totara Lagoon in relatively recent history (sometime
prior to 1948). This was interpreted as a response to land use change, but the
morphological imprint of these old channels could be very important antecedent
conditions for future development and migration of the southern end of the lagoon and
the mouth of the Totara River.
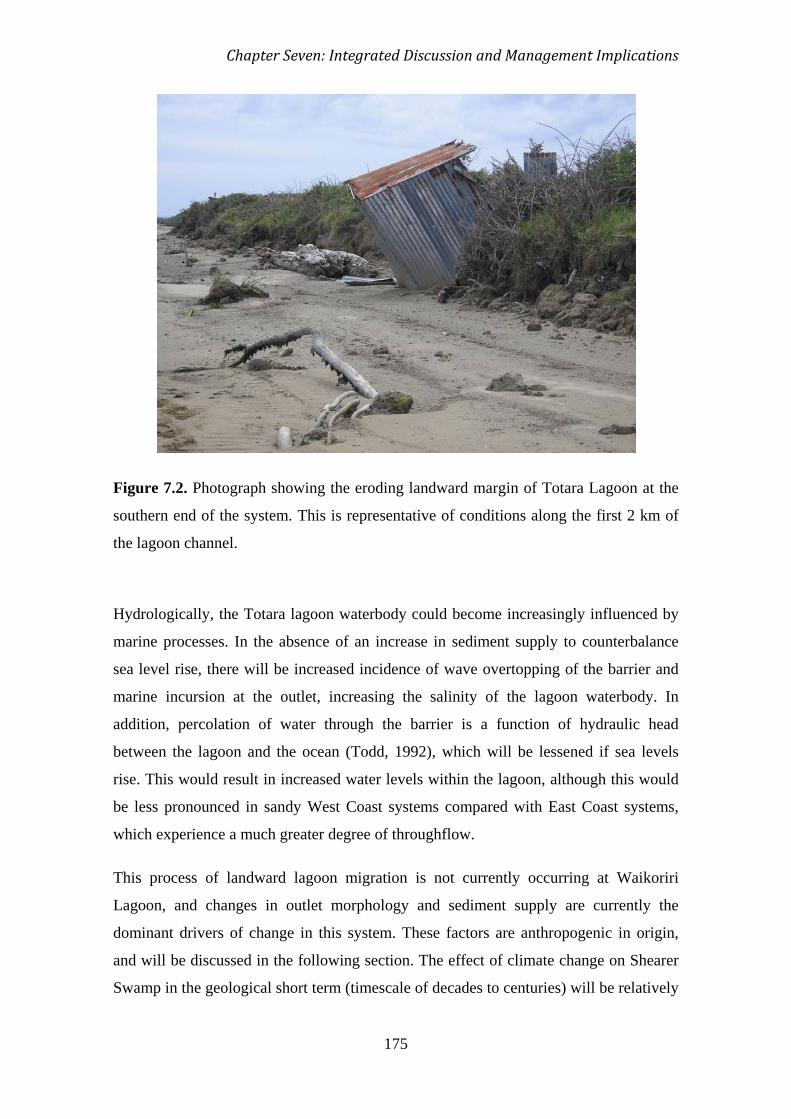
Chapter Seven: Integrated Discussion and Management Implications
175
Figure 7.2. Photograph showing the eroding landward margin of Totara Lagoon at the
southern end of the system. This is representative of conditions along the first 2 km of
the lagoon channel.
Hydrologically, the Totara lagoon waterbody could become increasingly influenced by
marine processes. In the absence of an increase in sediment supply to counterbalance
sea level rise, there will be increased incidence of wave overtopping of the barrier and
marine incursion at the outlet, increasing the salinity of the lagoon waterbody. In
addition, percolation of water through the barrier is a function of hydraulic head
between the lagoon and the ocean (Todd, 1992), which will be lessened if sea levels
rise. This would result in increased water levels within the lagoon, although this would
be less pronounced in sandy West Coast systems compared with East Coast systems,
which experience a much greater degree of throughflow.
This process of landward lagoon migration is not currently occurring at Waikoriri
Lagoon, and changes in outlet morphology and sediment supply are currently the
dominant drivers of change in this system. These factors are anthropogenic in origin,
and will be discussed in the following section. The effect of climate change on Shearer
Swamp in the geological short term (timescale of decades to centuries) will be relatively
176
small. Sea level rise will not affect the swamp itself in terms of saltwater intrusion, as
the western margin is situated 200 m from the coast, behind Waikoriri Lagoon and a set
of old dune ridges. However, it could affect it indirectly through alteration of the level
and character of the water table. Moreover, the effect of increased weather intensity
would take the form of increased water storage and sedimentation rates in the swamp,
thus a faster rate of infilling.
The landward margins of Totara Lagoon and Waikoriri Lagoon are not currently heavily
constrained by infrastructure or engineering works. Although the land is farmed, the
future development of the lagoon depends on the management regime. Natural
processes could be allowed to prevail, resulting in the sequence of changes presented
above. The interaction of these processes with anthropogenic forcing factors is
discussed below, along with the consequences of differing management responses.
Management response
The management response to observed morphological change is central to the
preservation or degradation of these lagoon systems under continuing pressure from
external factors. Existing coastal management schemes are often spatially and
temporally restrictive, often constrained to short term solutions (less than 50 years) and
pertaining only to a narrow part of the coastal zone, rather than taking a holistic view
that includes marine factors and catchment dynamics. The findings of this research
support the idea of an integrated coastal and catchment management plan, an idea which
is raised by Hart (2009).
Aside from the general concerns of overarching management programmes, the
immediate physical response to the events discussed in the previous section is of major
importance to the future of these lagoon systems. In the case of barrier rollback and
lagoon migration, there are several measures that can be taken. The most natural of
these is the concept of ‘managed retreat’, whereby loss of adjacent land is accepted as a
consequence of coastal migration and the system is allowed to naturally migrate
landwards and maintain its morphology, as the coastal energy gradient is maintained
(Emmerson et al., 1997; Pethick, 2001). In the case of Westland lagoons, this is the
most desirable solution from the perspectives of lagoon preservation and hazard
management, due to the low population density of the area, small funding base and lack
Chapter Seven: Integrated Discussion and Management Implications
177
of structural development along lagoon margins. The loss of adjacent land could be
significant for those affected, but cheap compared to the cost of protecting that land, in
terms of both dollar amount and in degradation of the lagoon environment.
Other management strategies for mitigating the effects of erosion range in extent of
interference with natural processes and result in varying degrees of change in lagoon
morphology. Hard structures such as rock walls and revetments have commonly been
used on the West Coast to combat erosion (Kain, 2008; Ishikawa, 2008), but these are
currently absent from the eroding channel in Totara Lagoon. These measures are totally
impractical in this situation due to the length of affected area, financial cost and most of
all because of cost to the lagoon environment. If they were to be used in such a system,
the result would be eventual loss of the lagoon system, with the seaward barrier
becoming eroded from both sides and unable to migrate landwards. This behaviour of
morphological change and loss of the natural coastal sequence in response to hard
engineering has been termed ‘coastal squeeze’ by Pethick (2001)(Figure 7.3). Soft
measures of erosion mitigation involve the artificial redistribution of sediment (e.g.
beach nourishment), but the benefit of this in such an isolated, natural and
unconstrained area as Westland is not great. In addition, it is not particularly viable on
the West Coast due to budgetary constraints and the large quantities of sediment and
coastline involved.
Outlet management in Totara Lagoon and Waikoriri Lagoon
The artificial management of the lagoon outlet has been, and continues to be, the
primary anthropogenic influence in both Totara Lagoon and Waikoriri Lagoon. The
response of these systems to artificial management of the outlet position and
configuration is very different, as a result of the large difference in spatial extent
between the two systems. The response of the Shearer Swamp-Waikoriri Lagoon
system to an artificial breach was well documented during the study period, the results
of which are very useful from a management perspective.
There are varying methods and degrees of artificial outlet management, from full outlet
relocation via a new breach, to management of an existing channel. The frequency and
scale of any intervention is very system dependent. Evidence from the breach at
Waikoriri Lagoon in November 2008 demonstrates the importance of carefully
178
choosing the position of a new breach to accomplish the desired result with as little
disruption to the hydrology and ecology of the system as possible. As previously
discussed, the position of this breach at the primary breach location caused the lagoon
waterbody to drain entirely, rather than merely reducing water levels in the lagoon and
swamp behind to an acceptable level. This conclusion is in agreement with Vila-
Concejo et al. (2004), who stressed the importance of impact-assessment studies prior
to undertaking outlet relocation, and the need for post-relocation monitoring to
determine the efficacy of the method decided upon.
From models of hapua dynamics and empirical observations, if an artificial breach
becomes necessary, it should not be undertaken at the position of primary breach (i.e.
directly opposite the river mouth). A breach upstream from this point and oriented on a
slight diagonal through the barrier in the direction of littoral drift is likely to result in the
least disturbance to the hydrological patterns and ecology of the system. The initiation
of a new breach in the barrier in response to flooding or the threat of flooding of
adjacent land is referred to here as ‘threshold management’ (Figure 7.3). This is usually
only performed as a last resort to lower water levels, if the lagoon has failed to breach
naturally, and further increases in water level are deemed to be hazardous to property
and/or life. This has been the rationale behind the irregular, historical record of artificial
breaches in Waikoriri Lagoon in particular.
The conditions at Totara Lagoon appear to contradict the argument against artificially
maintaining a breach opposite the river mouth. As discussed in previous chapters, the
outlet is currently situated at the river mouth without significant morphological effect
on the system. However, the hydrological effects of this outlet position in terms of tidal
dynamics have been observed. Ultimately, this further supports the idea that each
system must be treated individually in terms of developing an outlet management plan.
The need for artificial management of the outlets of Totara Lagoon and Waikoriri
Lagoon is likely to continue to be an issue over the next century. This research suggests
that the best way to deal with this is with regular monitoring and small interventions
when necessary to preserve land and infrastructure, rather than waiting for a large flood
event to prompt emergency breaching measures. These ‘threshold’ breaches tend to be
far more devastating for the system as a whole and for the connecting areas, as no time
provision is made for system adjustment.
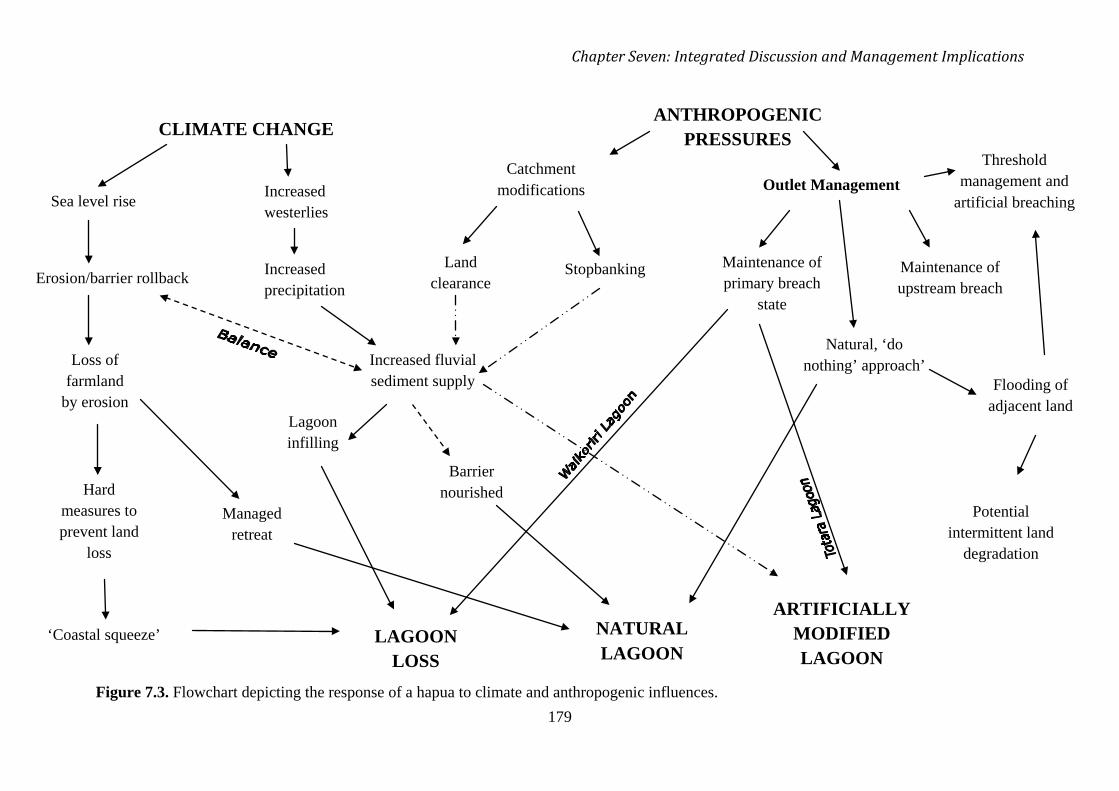
Chapter Seven: Integrated Discussion and Management Implications
179
Figure 7.3. Flowchart depicting the response of a hapua to climate and anthropogenic influences.
CLIMATE CHANGE ANTHROPOGENIC
PRESSURES
Increased westerlies
Sea level rise
Erosion/barrier rollback Increased precipitation
Increased fluvial sediment supply
Lagoon infilling
Loss of farmland
by erosion
Hard measures to prevent land
loss
‘Coastal squeeze’
Managed retreat
Catchment modifications
Barrier nourished
Land clearance
Stopbanking
Outlet Management
LAGOON LOSS
NATURAL LAGOON
Threshold management and
artificial breaching
Maintenance of upstream breach
Maintenance of primary breach
state
Natural, ‘do nothing’ approach’
Flooding of adjacent land
Potential intermittent land
degradation
ARTIFICIALLY MODIFIED LAGOON
180
7.6 Summary
The purpose of this chapter was to provide an integrated discussion of the results, presented
in the previous three chapters, and to assess the characteristics of these systems relative to
existing models of hapua dynamics. The development of Totara Lagoon and the Shearer
Swamp-Waikoriri Lagoon Complex was discussed, and the future development of these
lagoons in response to changes in physical factors and management pressures was examined
from a morphological perspective.
In the context of system dynamics, Totara Lagoon and Waikoriri Lagoon differ greatly in
terms of spatial scale and response time, yet the patterns of outlet migration and barrier
dynamics they exhibit appear consistent with existing models of hapua dynamics.
Hydrologically, only Waikoriri Lagoon can be classified as a hapua, as the tidal inflows
observed in Totara Lagoon exclude it by definition. Instead, Totara Lagoon appears to be in
an estuarine phase. This is evidence of the continuum between hapua and estuaries, with
systems such as Totara Lagoon functioning in the centre of this continuum and switching
between states at different times in response to changes in conditions.
The importance of barrier permeability in determining river flow thresholds for outlet
maintenance was highlighted. West Coast barriers are comprised primarily of sand, in
contrast to East Coast systems, which typically consist of mixed sand and gravel.
Consequently, on the West Coast, hapua are able to maintain a permanent outlet at the
mouths of rivers that have much smaller flow volumes than their East Coast counterparts.
Aspects likely to influence these systems over the next century include those induced by
climate change, such as sea level rise and increased storminess, and anthropogenic factors
such as catchment modifications and outlet management. These factors interact on a variety
of temporal scales, and three broad potential responses could result depending on the
direction and magnitude of these interactions: lagoon loss, natural lagoon present, or
artificially modified lagoon present.
The primary pressure in terms of anthropogenic influence and management concern in these
West Coast systems is the issue of artificial outlet management. Outlet management
strategies include the natural, ‘do nothing’ approach, regular maintenance of the outlet, or
‘threshold’ breaching, which involves artificially breaching the barrier when water levels
reach a level deemed hazardous. The choice of position for any artificial breach is paramount,
Chapter Seven: Integrated Discussion and Management Implications
181
and it is suggested that if it is unavoidable, a breach should be performed upstream from the
river mouth and be orientated on a slight diagonal through the barrier in the direction of
littoral drift. This results in the least disturbance to system hydrology and ecology. The best
way to deal with the issue artificial outlet management is through regular monitoring and
small interventions when necessary, rather than managing the outlet purely through
emergency measures.
182
CHAPTER EIGHT
Conclusions
Coastal lagoon and wetland systems are complex and dynamic environments,
responding rapidly to a complex network of climatic, tectonic, anthropogenic and other
synergistic drivers. The purpose of this thesis was to investigate two such systems in the
Westland Region; Totara Lagoon and the Shearer Swamp-Waikoriri Lagoon Complex,
using a multidisciplinary methodological framework to investigate active processes and
document changes in these systems over historical time. This information was then
used to predict future developmental changes under differing climate and management
pressures; information which is a valuable aid in coastal management decisions. The
approach used in this research is highly transferable, and the findings and questions
raised are applicable to other similar systems elsewhere in New Zealand and
internationally.
The primary objectives of this thesis with respect to the two study sites were:
• To document their current topography and structure,
• To explain their current hydrology,
• To understand their development over historical time and relate this to the
current state of each system,
• To analyse the processes driving these changes in geomorphology,
• To explore factors likely to influence changes in these systems over the
following 100 years and determine how each system might respond to these
drivers individually and collectively,
• To develop a conceptual model of process and response that can be used to
predict future changes of each system and which is applicable to similar settings
elsewhere.
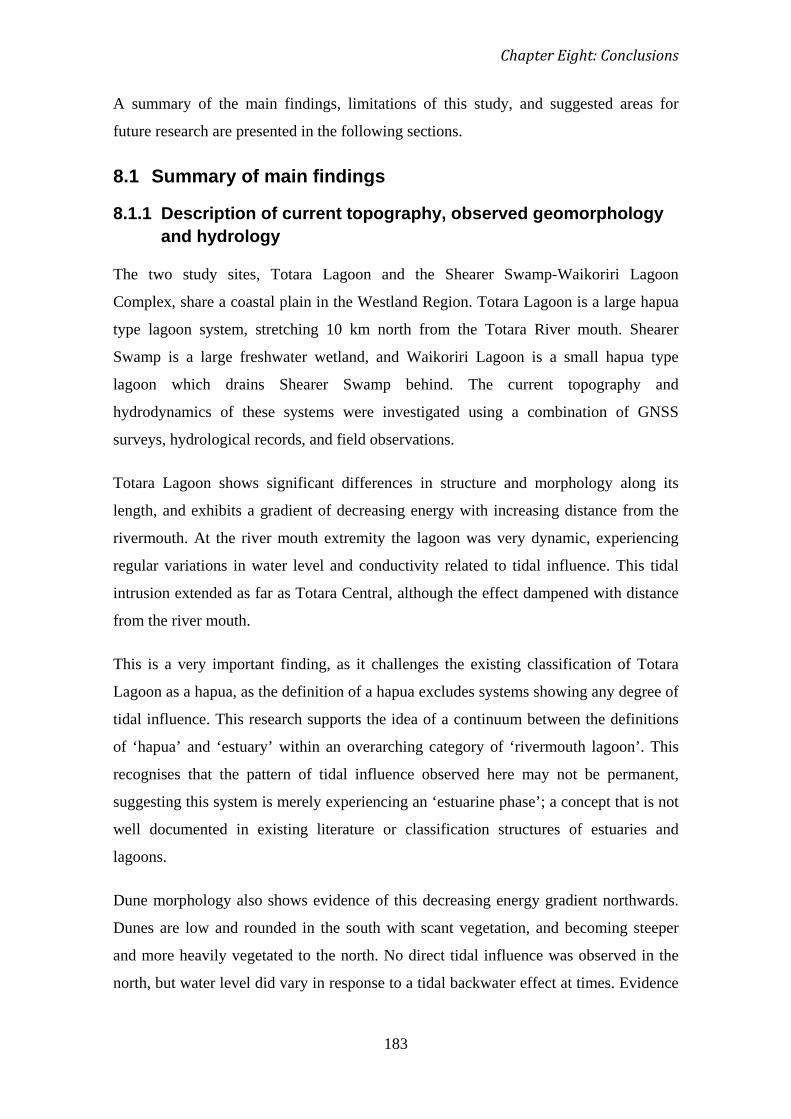
Chapter Eight: Conclusions
183
A summary of the main findings, limitations of this study, and suggested areas for
future research are presented in the following sections.
8.1 Summary of main findings
8.1.1 Description of current topography, observed geomorphology and hydrology
The two study sites, Totara Lagoon and the Shearer Swamp-Waikoriri Lagoon
Complex, share a coastal plain in the Westland Region. Totara Lagoon is a large hapua
type lagoon system, stretching 10 km north from the Totara River mouth. Shearer
Swamp is a large freshwater wetland, and Waikoriri Lagoon is a small hapua type
lagoon which drains Shearer Swamp behind. The current topography and
hydrodynamics of these systems were investigated using a combination of GNSS
surveys, hydrological records, and field observations.
Totara Lagoon shows significant differences in structure and morphology along its
length, and exhibits a gradient of decreasing energy with increasing distance from the
rivermouth. At the river mouth extremity the lagoon was very dynamic, experiencing
regular variations in water level and conductivity related to tidal influence. This tidal
intrusion extended as far as Totara Central, although the effect dampened with distance
from the river mouth.
This is a very important finding, as it challenges the existing classification of Totara
Lagoon as a hapua, as the definition of a hapua excludes systems showing any degree of
tidal influence. This research supports the idea of a continuum between the definitions
of ‘hapua’ and ‘estuary’ within an overarching category of ‘rivermouth lagoon’. This
recognises that the pattern of tidal influence observed here may not be permanent,
suggesting this system is merely experiencing an ‘estuarine phase’; a concept that is not
well documented in existing literature or classification structures of estuaries and
lagoons.
Dune morphology also shows evidence of this decreasing energy gradient northwards.
Dunes are low and rounded in the south with scant vegetation, and becoming steeper
and more heavily vegetated to the north. No direct tidal influence was observed in the
north, but water level did vary in response to a tidal backwater effect at times. Evidence
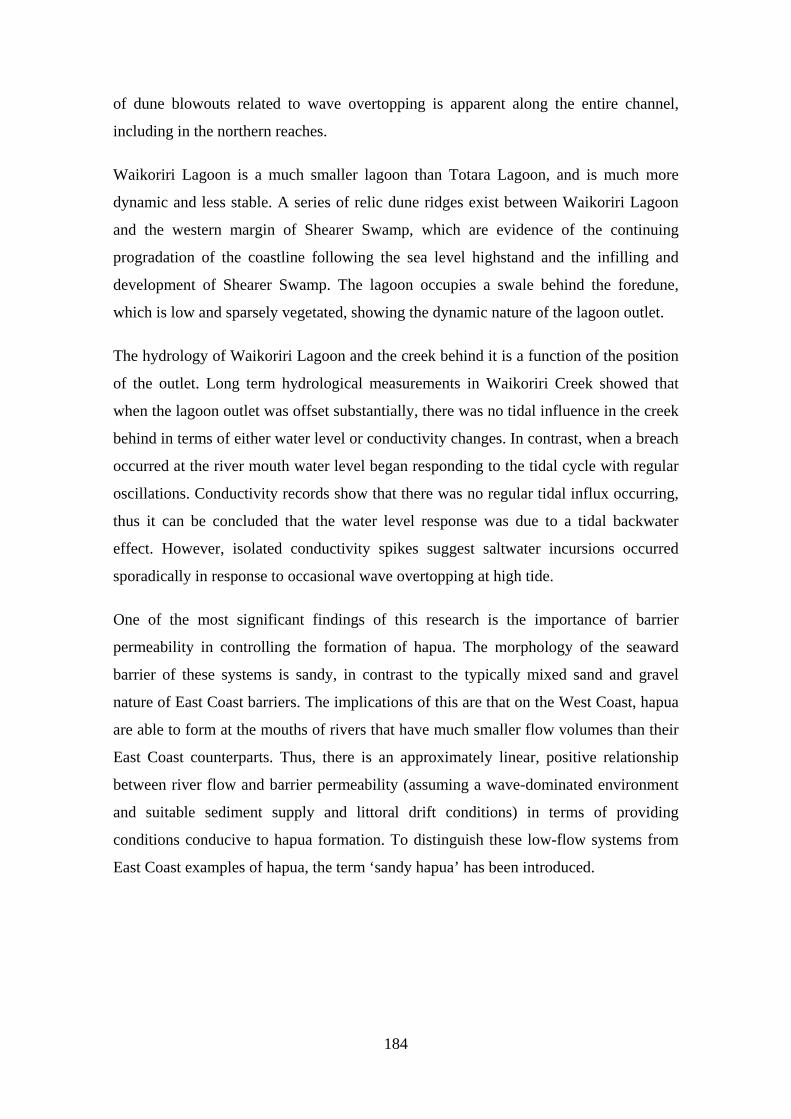
184
of dune blowouts related to wave overtopping is apparent along the entire channel,
including in the northern reaches.
Waikoriri Lagoon is a much smaller lagoon than Totara Lagoon, and is much more
dynamic and less stable. A series of relic dune ridges exist between Waikoriri Lagoon
and the western margin of Shearer Swamp, which are evidence of the continuing
progradation of the coastline following the sea level highstand and the infilling and
development of Shearer Swamp. The lagoon occupies a swale behind the foredune,
which is low and sparsely vegetated, showing the dynamic nature of the lagoon outlet.
The hydrology of Waikoriri Lagoon and the creek behind it is a function of the position
of the outlet. Long term hydrological measurements in Waikoriri Creek showed that
when the lagoon outlet was offset substantially, there was no tidal influence in the creek
behind in terms of either water level or conductivity changes. In contrast, when a breach
occurred at the river mouth water level began responding to the tidal cycle with regular
oscillations. Conductivity records show that there was no regular tidal influx occurring,
thus it can be concluded that the water level response was due to a tidal backwater
effect. However, isolated conductivity spikes suggest saltwater incursions occurred
sporadically in response to occasional wave overtopping at high tide.
One of the most significant findings of this research is the importance of barrier
permeability in controlling the formation of hapua. The morphology of the seaward
barrier of these systems is sandy, in contrast to the typically mixed sand and gravel
nature of East Coast barriers. The implications of this are that on the West Coast, hapua
are able to form at the mouths of rivers that have much smaller flow volumes than their
East Coast counterparts. Thus, there is an approximately linear, positive relationship
between river flow and barrier permeability (assuming a wave-dominated environment
and suitable sediment supply and littoral drift conditions) in terms of providing
conditions conducive to hapua formation. To distinguish these low-flow systems from
East Coast examples of hapua, the term ‘sandy hapua’ has been introduced.
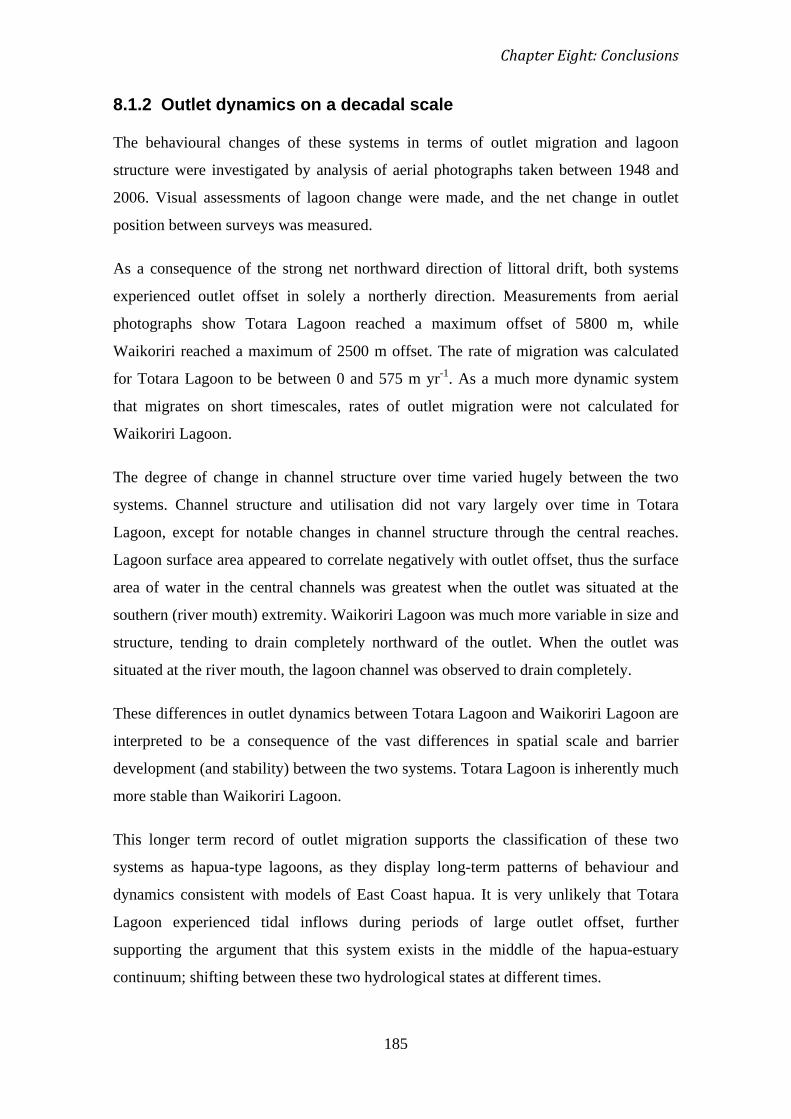
Chapter Eight: Conclusions
185
8.1.2 Outlet dynamics on a decadal scale
The behavioural changes of these systems in terms of outlet migration and lagoon
structure were investigated by analysis of aerial photographs taken between 1948 and
2006. Visual assessments of lagoon change were made, and the net change in outlet
position between surveys was measured.
As a consequence of the strong net northward direction of littoral drift, both systems
experienced outlet offset in solely a northerly direction. Measurements from aerial
photographs show Totara Lagoon reached a maximum offset of 5800 m, while
Waikoriri reached a maximum of 2500 m offset. The rate of migration was calculated
for Totara Lagoon to be between 0 and 575 m yr-1
The degree of change in channel structure over time varied hugely between the two
systems. Channel structure and utilisation did not vary largely over time in Totara
Lagoon, except for notable changes in channel structure through the central reaches.
Lagoon surface area appeared to correlate negatively with outlet offset, thus the surface
area of water in the central channels was greatest when the outlet was situated at the
southern (river mouth) extremity. Waikoriri Lagoon was much more variable in size and
structure, tending to drain completely northward of the outlet. When the outlet was
situated at the river mouth, the lagoon channel was observed to drain completely.
. As a much more dynamic system
that migrates on short timescales, rates of outlet migration were not calculated for
Waikoriri Lagoon.
These differences in outlet dynamics between Totara Lagoon and Waikoriri Lagoon are
interpreted to be a consequence of the vast differences in spatial scale and barrier
development (and stability) between the two systems. Totara Lagoon is inherently much
more stable than Waikoriri Lagoon.
This longer term record of outlet migration supports the classification of these two
systems as hapua-type lagoons, as they display long-term patterns of behaviour and
dynamics consistent with models of East Coast hapua. It is very unlikely that Totara
Lagoon experienced tidal inflows during periods of large outlet offset, further
supporting the argument that this system exists in the middle of the hapua-estuary
continuum; shifting between these two hydrological states at different times.

186
8.1.3 Development over historical time
Snapshots of dynamics occurring at specific locations in these systems over a longer
timescale was investigated using sediment cores, from one site in Shearer Swamp and
two sites in Totara Lagoon. Stratigraphy, sediment texture and organic percent analyses
were used to investigate changes in depositional environment at these sites over time
and examine the relationship between these changes and system dynamics.
The core from Totara South showed a dramatic transition from a coarse sand and gravel
layer at the bottom, to a massive mud unit for the remainder of the core. Combined with
aerial photograph observations, this was interpreted as representative of the
abandonment of a large channel, which then dried out and became stable and vegetated.
The coarse nature of the bottom layer suggests that this was deposited mid-channel in a
large channel similar to the southern section of Totara Lagoon today.
The core from Totara North exhibited a more gradual change from sand dominated to
muddy sand, to organic mud, and increased in organic content up the core. This
sequence has been interpreted as a shift from open, unvegetated (possibly sand bar)
conditions, to a lagoon margin environment. This interpretation is very spatially
restrictive, and is unlikely to be due to large-scale changes in the lagoon environment,
as the northern end of the lagoon has been observed to be very stable and unchanging
from field observations and aerial photograph analysis.
A series of changes in depositional conditions occurred at the Shearer Swamp core site,
which was situated on the swamp margin. Peat layers in the lower half of the core
suggest the site was well developed swamp for the entire duration, and the presence of a
silt layer above this represents a period of migration of Waikoriri Creek. The most
important observation from this core is the decreasing amount of wind-transported sand
present in the core, representative of the increasing vegetation cover (related to land-use
change in the form of farming) of the dune ridges adjacent to the swamp. This
demonstrates the potential for changes in surrounding areas to impact dynamics within a
complex coastal system, which is very important from a coastal management
perspective.
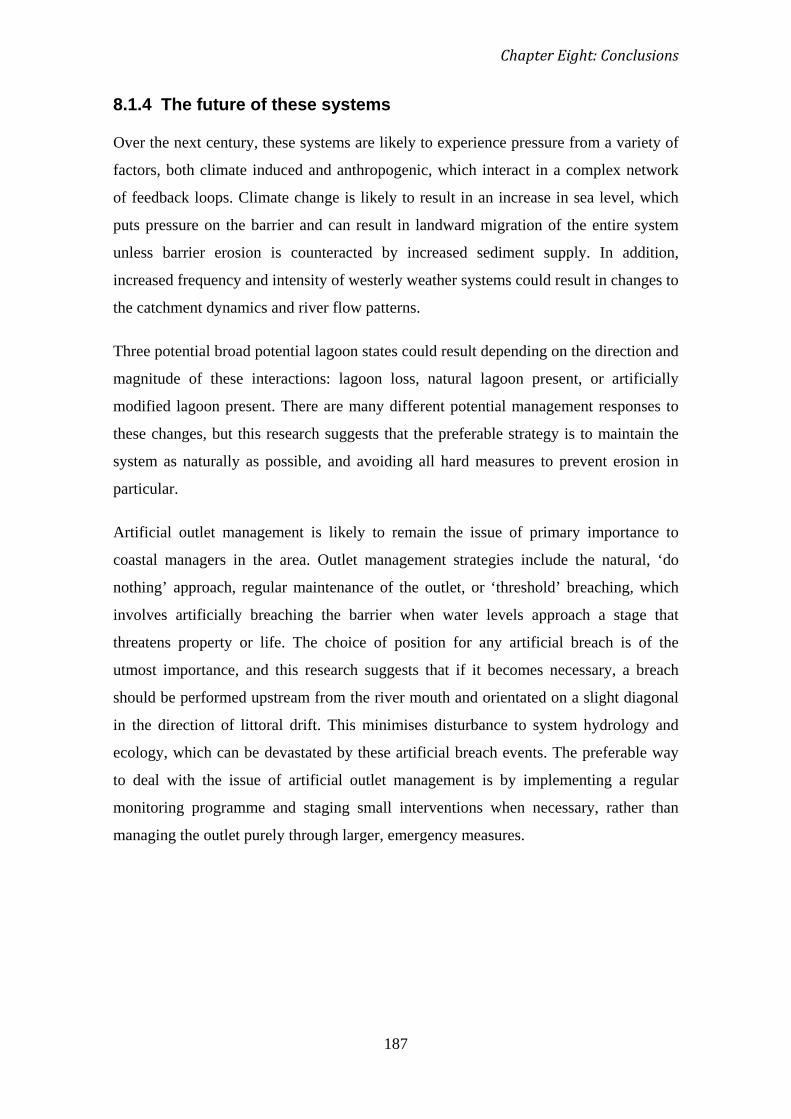
Chapter Eight: Conclusions
187
8.1.4 The future of these systems
Over the next century, these systems are likely to experience pressure from a variety of
factors, both climate induced and anthropogenic, which interact in a complex network
of feedback loops. Climate change is likely to result in an increase in sea level, which
puts pressure on the barrier and can result in landward migration of the entire system
unless barrier erosion is counteracted by increased sediment supply. In addition,
increased frequency and intensity of westerly weather systems could result in changes to
the catchment dynamics and river flow patterns.
Three potential broad potential lagoon states could result depending on the direction and
magnitude of these interactions: lagoon loss, natural lagoon present, or artificially
modified lagoon present. There are many different potential management responses to
these changes, but this research suggests that the preferable strategy is to maintain the
system as naturally as possible, and avoiding all hard measures to prevent erosion in
particular.
Artificial outlet management is likely to remain the issue of primary importance to
coastal managers in the area. Outlet management strategies include the natural, ‘do
nothing’ approach, regular maintenance of the outlet, or ‘threshold’ breaching, which
involves artificially breaching the barrier when water levels approach a stage that
threatens property or life. The choice of position for any artificial breach is of the
utmost importance, and this research suggests that if it becomes necessary, a breach
should be performed upstream from the river mouth and orientated on a slight diagonal
in the direction of littoral drift. This minimises disturbance to system hydrology and
ecology, which can be devastated by these artificial breach events. The preferable way
to deal with the issue of artificial outlet management is by implementing a regular
monitoring programme and staging small interventions when necessary, rather than
managing the outlet purely through larger, emergency measures.
188
8.2 Limitations to this investigation and suggested areas for future research
The greatest limitations to this study lie in spatial and temporal scale. In many cases,
results gained were a snapshot of conditions at the time of monitoring, and benefit could
be gained from performing some of them over a larger scale and for a longer time
period.
This is particularly true of the hydrological measurements in Totara Lagoon, which
have challenged the existing classification of Totara Lagoon as a hapua, and suggested
it should be positioned in the centre of a continuum between hapua and estuaries, which
acknowledges its ability to change between states. Further research could address the
hydrodynamics in this lagoon in greater detail and at a higher spatial resolution, and
enormous benefit would be gained in long term salinity and water level measurements
in the southern section of the lagoon. Combined with regular observations of outlet
morphology, the relationship between outlet configuration and channel hydrology could
be investigated, and the reasons behind the hydrological results in this study could be
better understood. Further research is required into these ‘in-between’ systems such as
Totara Lagoon and the Ashley River, which may be more common than previously
realised. Previous research has focused mainly on pure hapua systems, or pure estuary
systems, rather than on those that switch between the two modes.
Sediment coring showed evidence of significant changes in energy levels at the
locations surveyed, but these were also spatially restrictive and limited to a small
timeframe. Understanding of the long term development of this coastal plain and these
systems could be enhanced by the use of geophysical techniques, such as Ground
Penetrating Radar, to assess the subsurface morphology. In addition, microfossil
analysis of longer sediment cores would be beneficial to determine the salinity of
observed layers, and thus infer the degree of tidal influence at the time of deposition.
This was initially to be performed on the sediment cores collected here, but equipment
and time constraints prevailed.
In terms of coastal management of systems like Totara Lagoon and Waikoriri Lagoon,
the most important tool for decision making is data gained through coastal monitoring.
As well as aiding decision making, it would provide valuable ongoing data that would
Chapter Eight: Conclusions
189
facilitate greater scientific understanding of this locally common, yet globally quite rare,
type of coastal lagoon.
Finally, it is important to recognise the ever-evolving nature of scientific research and
the need to understand the relationship between past morphology and dynamics to better
understand those of the present. There is a need for long term studies of coastal
environments and their dynamics to aid in the quest to understand and predict the
potential effects of climate change in this sensitive, and very important, environment.
This would be particularly beneficial in the Westland region, where funding is limited,
yet science could benefit greatly from the study of a rich coastal environment that is
relatively unconstrained by engineering and infrastructure.
190
REFERENCES
Allard, J., Chaumillon, E., & Fenies, H. (2009). A synthesis of morphological
evolutions and Holocene stratigraphy of a wave-dominated estuary: The Arcachon
lagoon, SW France. Continental Shelf Research, 29(8), pp. 957-969.
Al-Tahir, R. and Ali, A. 2004. Assessing land cover changes in the coastal zone using
aerial photography. Surveying and Land Information Science. 54(2), pp. 107-112
Andrews, B.D., Gares, P.A. and Colby, J.D. (2002). Techniques for GIS modeling of
coastal dunes. Geomorphology, 48, pp. 289-308
Baldock, T., Weir, F., & Hughes, M. (2008). Morphodynamic evolution of a coastal
lagoon entrance during swash overwash. Geomorphology, 95(3-4), pp. 398-411.
Barnes, R.S.K. (1980). Coastal Lagoons. Cambridge University Press, Cambridge.
Battiau-Queney, Y., Billet, J., Chaverot, S., & Lanoy-Ratel, P. (2003). Recent shoreline
mobility and geomorphologic evolution of macrotidal sandy beaches in the north of
France. Marine Geology, 194(1-2), pp. 31-45.
Behrens, D., Bombardelli, F., Largier, J., & Twohy, E. (2009). Characterization of time
and spatial scales of a migrating rivermouth. Geophysical Research Letters, 36(9),
L09402.
Blanton, J., Lin, G., & Elston, S. (2002). Tidal current asymmetry in shallow estuaries
and tidal creeks. Continental Shelf Research, 22(11-13), pp. 1731-1743.
References
191
Boak, E.H. and Turner, I.L. (2005). Shoreline definition and detection: A review.
Journal of Coastal Research, 21(4) pp. 688-703.
Bradford, J.M. (1983). Physical and chemical oceanographic observations off Westland,
New Zealand, June 1979. New Zealand Journal of Marine and Freshwater Research,
17, pp. 71-81
Cameron, W.M. and Pritchard, D.W. (1963). Estuaries. In: M.N. Hill (ed.) The Sea, 2.
John Wiley & Sons, pp. 306-324.
Capobianco, M., DeVriend, H., Nicholls, R., & Stive, M. (1999). Coastal area impact
and vulnerability assessment: the point of view of a morphodynamic modeller. Journal
of Coastal Research, 15(3), pp. 701-716.
Carter, R., Forbes, C., Jennings, S., Orford, J., Shaw, J., & Taylor, R. (1989). Barrier
and lagoon coast evolution under differing relative sea-level regimes: examples from
Ireland and Nova Scotia. Marine Geology, 88(3-4), pp. 221-242.
Carter, R.W.G, & Woodroffe, C.D. (1994). Coastal evolution: Late Quaternary
shoreline morphodynamics: Cambridge University Press, Cambridge.
Chague-Goff, C., Dawson, S., Goff, J., Zachariasen, J., Berryman, K., Garnett, D., et al.
(2002). A tsunami (ca. 6300 years BP) and other Holocene environmental changes,
northern Hawke's Bay, New Zealand. Sedimentary Geology, 150(1-2), pp. 89-102.
Clemmensen, L., Pye, K., Murray, A., & Heinemeier, J. (2001). Sedimentology,
stratigraphy and landscape evolution of a Holocene coastal dune system, Lodbjerg, NW
Jutland, Denmark. Sedimentology, 48(1), pp. 3-27.
Cochran, U., Hannah, M., Harper, M., Van Dissen, R., Berryman, K., & Begg, J.
(2007). Detection of large, Holocene earthquakes using diatom analysis of coastal
sedimentary sequences, Wellington, New Zealand. Quaternary Science Reviews, 26(7-
8), pp. 1129-1147.
Cooper, J. (1994). Lagoons and microtidal coasts. In: R.W.G. Carter and C.D.
Woodroffe (eds.) Coastal evolution: Late Quaternary shoreline morphodynamics.
Cambridge University Press, Cambridge, pp. 219–265.
Cooper, N., Hooke, J., & Bray, M. (2001). Predicting coastal evolution using a sediment
budget approach: a case study from southern England. Ocean & Coastal Management,
44(11), pp. 711-728.
Cooper, J. (2001). Geomorphological variability among microtidal estuaries from the
wave-dominated South African coast. Geomorphology, 40(1-2), pp. 99-122.
Cooper, N., Hooke, J., & Bray, M. (2001). Predicting coastal evolution using a sediment
budget approach: a case study from southern England. Ocean & Coastal Management,
44(11), pp. 711-728.
Cooper, J.A.G. and Pilkey, O.H. (2004a). Sea level rise and Shoreline retreat: Time to
abandon the Bruun Rule. Global and Planetary Change, 43(3-4) pp. 157-171
Cooper, J.A.G, & Pilkey, O.H (2004b). Alternatives to the mathematical modeling of
beaches. Journal of Coastal Research, 20(3), pp. 641-644.
Cowell, P., & Thom, B. (1994). Morphodynamics of coastal evolution. In: R.W.G.
Carter and C.D. Woodroffe (eds.) Coastal evolution: Late Quaternary shoreline
morphodynamics, pp. 33–86.
Dahdouh-Guebas, F., Verheyden, A., Kairo, J.G., Jayatissa, L.P. and Koedam, N.
(2006). Capacity building in tropical coastal recourse monitoring in developing
countries: A re-appreciation of the oldest remote sensing method. International Journal
of Sustainable Development and World Ecology, 13(1) pp. 62-76.

References
193
Davoren, A. (1978) A survey of New Zealand Peat Resources. Hamilton Science Centre,
Water and Soil Division, Ministry of Works and Development, Hamilton.
de Vriend, H. J., Capobianco, M., Chesher, T., de Swart, H. E., Latteux, B., & Stive, M.
J. F. (1993). Approaches to long-term modelling of coastal morphology: A review.
Coastal Engineering, 21(1-3), pp. 225-269.
Doyle, L.J., Garrels, R.M. (1985). What does percent organic carbon in sediments
measure? Geo-Marine Letters, 5. pp. 51-53.
Emmerson, R. H. C., Manatunge, J. M. A., Macleod, C. L., & Lester, J. N. (1997). Tidal
exchanges between Orplands managed retreat site and the Blackwater Estuary, Essex.
Journal of the Chartered Institution of Water and Environmental Management, 11(5),
pp. 363-372.
Fernandes, E. H. L., Mariño-Tapia, I., Dyer, K. R., & Möller, O. O. (2004). The
attenuation of tidal and subtidal oscillations in the Patos Lagoon estuary. Ocean
Dynamics, 54(3-4), pp. 348-359.
Fitzgerald, D. M., & Van Heteren, S. (1999). Classification of paraglacial barrier
systems: Coastal New England, USA. Sedimentology, 46(6), pp. 1083-1108.
Folk, R.L., (1974). Petrology of Sedimentary Rocks. Hemphill
Publishing Co., Austin, TX, 182pp.
Garnier, B. (1958). The climate of New Zealand: a geographic survey: E. Arnold.
Gao, S., & Collins, M. (1995). On the physical aspects of the ‘design with
nature’principle in coastal management. Ocean and Coastal Management, 26(2), pp.
163-175.
Gibb, J.G. (1978). Rates of coastal erosion and accretion in New Zealand. New Zealand
Journal of Marine and Freshwater Science, 12(4) pp.429-456.
Gibb, J.G. (1986). A New Zealand regional Holocene eustatic sea-level curve and its
application to determination of vertical tectonic movements. Royal Society of New
Zealand Bulletin, 24, pp. 377-395.
Gibb J G (1987). A coastal hazard management plan for Hokitika. Water and Soil
Technical Publication No. 29, National Water and Soil Conservation Authority,
Ministry of Works and Development (NWASCA,MWD), 44 pp.
Glew, J., Smol, J., & Last, W. (2001). Sediment core collection and extrusion. Tracking
environmental change using lake sediments, 1, 73–106.
Goff, J., Nichol, S., & Chagué-Goff, C. (2001). Environmental changes in Okarito
Lagoon, Westland. DOC Science Internal Series, 3, 30p.
Gorman, L., Morang, A., & Larson, R. (1998). Monitoring the coastal environment; part
IV: mapping, shoreline changes, and bathymetric analysis. Journal of Coastal Research,
pp. 61-92.
Hart, D.E. (1999). Dynamics of mixed sand and gravel river mouth lagoons: Hapua.
Unpublished MSc (Geogr) Thesis, University of Canterbury, Christchurch, 221
Hart, D.E. (2007). River-mouth lagoon dynamics on mixed sand and gravel barrier
coasts. Journal of Coastal Research, SI 50, pp. 927–931.
Hart, D.E. (2009a). Morphodynamics of non-estuarine rivermouth lagoons on high-
energy coasts. Journal of Coastal Research, SI 56. In press.
Hart, D.E. (2009b). River mouth lagoon science and management. In: Williams, A.T.
and Metcalf, A. Beach management principles and practice. pp. 267-280
References
195
Hart, D.E, and Bryan, K. (2008). New Zealand coastal system boundaries, connections
and management. New Zealand Geographer, 64(2), pp. 129-143.
Hart, D.E. and Single, M.B. (2004). Evolution, dynamics and management of Waikoriri
Lagoon, Bold Head, Westland, New Zealand. Report to the Westland District Council.
23 pp.
Haslett, S., Cundy, A., Davies, C., Powell, E., & Croudace, I. (2003). Salt marsh
sedimentation over the past c. 120 years along the West Cotentin Coast of Normandy
(France): Relationship to sea-level rise and sediment supply. Journal of Coastal
Research, 19(3). pp. 609-620.
Hayward, B., Cochran, U., Southall, K., Wiggins, E., Grenfell, H., Sabaa, A., et al.
(2004). Micropalaeontological evidence for the Holocene earthquake history of the
eastern Bay of Plenty, New Zealand, and a new index for determining the land elevation
record. Quaternary Science Reviews, 23(14-15), pp. 1651-1667.
Hemmingsen, M. (1997). The coastal geomorphology of Te Waihora (Lake Ellesmere).
Unpublished MA (Geogr) Thesis, University of Canterbury, Christchurch. 206.
Hesp, P., Shepherd, M., & Parnell, K. (1999). Coastal geomorphology in New Zealand,
1989-99. Progress in physical geography, 23(4), p. 501.
Hicks, H., & Nichol, S. (2007). A marine to freshwater sediment succession from
Kowhai Beach wetland, Northland: implications for Holocene sea level. Journal of the
Royal Society of New Zealand, 37(3), pp. 91-107.
Horrocks, M., Ogden, J., Nichol, S., Alloway, B., & Sutton, D. (2000). A Late
Quaternary palynological and sedimentological record from two coastal swamps at
southern Kaitoke, Great Barrier Island, New Zealand, Journal of the Royal Society of
New Zealand, 30(1), pp. 49-68.
Horrocks, M., Ogden, J., Nichol, S., Alloway, B., & Sutton, D. (2000). Palynology,
sedimentology and environmental significance of Holocene swamps at northern
Kaitoke, Great Barrier Island, New Zealand. Journal of the Royal Society of New
Zealand, 30(1), pp. 27-47.
Horrocks, M., Smith, I., Nichol, S., Shane, P., & Jackman, G. (2008). Field survey,
sedimentology and plant microfossil analysis of sediment cores from possible
cultivation sites at Tolaga Bay, eastern North Island, New Zealand. Journal of the Royal
Society of New Zealand, 38(3), 131-147.
Hume, T., Bell, R., de Lange, W., Healy, T., Hicks, D., & Kirk, R. (1992). Coastal
oceanography and sedimentology in New Zealand, 1967-91. New Zealand Journal of
Marine and Freshwater Research, 26, pp. 1-36.
Hume, T., & Herdendorf, C. (1988). A geomorphic classification of estuaries and its
application to coastal resource management—a New Zealand example. Ocean and
Shoreline Management, 11, pp. 249-274.
INW (2009). Technical specification sheet: CT2X long term water level recorder.
Accessed September 15th
Ishikawa, R. (2008). Historical shoreline change and beach morphodynamics at
Rapahoe Bay, West Coast, New Zealand. Unpublished MSc (Geogr) Thesis, University
of Canterbury, Christchurch.
2009 from www.inwusa.com/pdfs/ct2x.pdf
Isupova, M. V., & Mikhailov, V. N. (2008). Hydrological and morphological processes
in Senegal River mouth area. Water Resources, 35(1), pp. 30-42.
Jennings, S., Orford, J., Canti, M., Devoy, R., & Straker, V. (1998). The role of relative
sea-level rise and changing sediment supply on Holocene gravel barrier development:
the example of Porlock, Somerset, UK. The Holocene, 8(2), p. 165.
References
197
Kain, C. L. (2008). Towards a Framework of Monitoring and Analysis for the Coastal
Environment of the West Coast Region, New Zealand. Honours research paper
prepared for GEOG409 and the West Coast Regional Council, 11p.
Kirk, R. (1991). River-beach interaction on mixed sand and gravel coasts: a geomorphic
model for water resource planning. Applied Geography, 11, pp. 267-287.
Kirk, R.M. and Lauder, G.A. (2000). Significant coastal lagoon system in the South
Island, New Zealand. Coastal Processes and lagoon mouth closure. Science for
Conservation 146 pp. 47
Kjerfve, B. (1986). Comparative oceanography of coastal lagoons. In: Wolfe, D.A. (ed.)
Estuarine Variability. Academic Press, New York. pp. 63-81
Kjerfve, B., & Magill, K. (1989). Geographic and hydrodynamic characteristics of
shallow coastal lagoons. Marine Geology, 88(3-4), pp. 187-199.
Kjerfve, B. (1994). Coastal lagoon processes. Elsevier Oceanography Series, 60, 577.
Komar, P.D. (1998) Beach processes and sedimentation. Prentice Hall, Upper Saddle
River, N.J. 544 pp.
Konert, M., & Vandenberghe, J. (1997). Comparison of laser grain size analysis with
pipette and sieve analysis: A solution for the underestimation of the clay fraction.
Sedimentology, 44(3), pp. 523-535.
Kumler, M. P. (1994). An intensive comparison of triangulated irregular networks
(TINs) and digital elevation models (DEMs). Cartographica, 31(2), pp. 1-99.
Land Information New Zealand, LINZ (2009a). Tidal information. Accessed September
24th 2009 from www.linz.govt.nz/hydro/tidal-info/index.aspx
Land Information New Zealand, LINZ (2009b) Aerial photograph database. Accessed
January 15th
Lewis, D., & McConchie, D. (1994). Analytical sedimentology. Chapman & Hall, New
York.
2009 from www.linz.govt.nz/topography/aerial-images/nzmg-non-
geo/apj33
Lo, C.P. and Yeung, A.K.W. (2007). Concepts and Techniques of Geographic
Information Systems, Second Edition. Pearson Education Inc, New Jersey.
Lucas, L. V., Sereno, D. M., Burau, J. R., Schraga, T. S., Lopez, C. B., Stacey, M. T., et
al. (2006). Intradaily variability of water quality in a shallow tidal lagoon: Mechanisms
and implications. Estuaries and Coasts, 29(5), pp. 711-730.
Masselink, G., & Hughes, M. (2003). Introduction to coastal processes and
geomorphology: Hodder Arnold, London, 354 pp.
Mathewes, R., & Clague, J. (1994). Detection of large prehistoric earthquakes in the
Pacific Northwest by microfossil analysis. Science, 264(5159), p. 688.
McCave, I. N., Hall, I. R., & Bianchi, G. G. (2006). Laser vs. settling velocity
differences in silt grainsize measurements: Estimation of palaeocurrent vigour.
Sedimentology, 53(4), pp. 919-928.
Meadows, M. (2001). The role of Quaternary environmental change in the evolution of
landscapes: case studies from southern Africa. Catena, 42(1), pp. 39-57.
Micromeritics (2009a) Datasheet: Saturn Digisizer 5200. Accessed September 15th,
2009 from www.micromeritics.com/Product-Showcase/Saturn-DigiSizer-5200.aspx
References
199
Micromeritics (2009b) Technical specifications: Saturn Digisizer 5200. Accessed
September 15th
Ministry for the Environment (2008a). Climate Change Effects and Impacts
Assessment: A Guidance Manual for Local Government in New Zealand. 2nd Edition.
Ministry for the Environment, Wellington. 149 pp.
2009 from
www.micromeritics.com/Repository/Files/saturn5205techniqueoverview_0.pdf
Ministry for the Environment (2008b). Coastal Hazards and Climate Change. A
Guidance Manual for Local Government in New Zealand. 2nd edition. Revised by
Ramsay, D, and Bell, R. (NIWA). Prepared for Ministry for the Environment,
Wellington. 127 pp.
Moar, N.T. and McKellar, I.C. (2001) Interglacial vegetation in South Westland, South
Island, New Zealand. New Zealand Journal of Geology and Geophysics vol 44(1), pp
17-24.
Moore M.I. Murdoch R.C. (1993). Physical and biological observations of coastal
squirts under non–upwelling conditions. Journal of Geophysical Research, 98(C11 ):
20043–20061
Neale, D. (1987). Longshore sediment transport in a mixed sand and gravel foreshore,
South Canterbury. Unpublished MSc (Geogr) Thesis, University of Canterbury, 243.
Neale, D.M., Pindur, N.B., Reedy, M.C. and Watson, B. (2007) The West Coast Marine
and Coastal Environment: An Initial Report for the West Coast Marine Protection
Forum. Hokitika: West Coast Marine Protection Forum, 236p.
Nelson, A., Ota, Y., Umitsu, M., Kashima, K., & Matsushima, Y. (1998). Seismic or
hydrodynamic control of rapid late-Holocene sea-level rises in southern coastal Oregon,
USA? The Holocene, 8(3), p. 287.
Nichol, S., Goff, J., Devoy, R., Chague-Goff, C., Hayward, B., & James, I. (2007).
Lagoon subsidence and tsunami on the West Coast of New Zealand. Sedimentary
Geology, 200(3-4), pp. 248-262.
Nichols, K. (1999). Coming to terms with "Integrated Coastal Management": Problems
of meaning and method in a new arena of resource regulation. Professional
Geographer, 51(3), pp. 388-399.
Nichols, M., & Allen, G. (1981). Sedimentary processes in coastal lagoons. UNESCO
Technical Papers in Marine Science (UNESCO).
Nicholson, J., Broker, I., Roelvink, J. A., Price, D., Tanguy, J. M., & Moreno, L.
(1997). Intercomparison of coastal area morphodynamic models. Coastal Engineering,
31(1-4), pp. 97-123.
NIWA (2009) New Zealand Regional Climate Summaries. Accessed September 21st
Oreskes, N., Shrader-Frechette, K., & Belitz, K. (1994). Verification, validation, and
confirmation of numerical models in the earth sciences. Science, 263(5147), p. 641.
2009 from www.niwa.co.nz/education-and-training/schools/resources/climate/summary
Orford, J. D., & Carter, R. W. G. (1995). Examination of mesoscale forcing of a swash-
aligned, gravel barrier from Nova Scotia. Marine Geology, 126(1-4), pp. 201-211.
Orford, J.D., Carter, R.W.G. and Jennings, S.C. (1996). Control domains
andmorphological phases in gravel-dominated coastal barriers of Nova Scotia. Journal
of Coastal Research, 12(3) pp. 589-604.
Paskoff, R. (1998). Possible consequences on coastal environments of the foreseeable
sea level rise of the coming decades. Consequences possibles sur les milieux littoraux
de l'elevation du niveau de la mer prevue pour les prochaines decennies(600), pp. 233-
248.
References
201
Pethick, J. (2001). Coastal management and sea-level rise. Catena, 42(2-4), pp. 307-
322.
Povilanskas, R., Baghdasarian, H., Arakelyan, S., Satkunas, J., & Taminskas, J. (2009).
Secular morphodynamic trends of the Holocene dune ridge on the Curonian Spit
(Lithuania/Russia). Journal of Coastal Research, 25(1), pp. 209-215.
Pranzini, E. (2007). Airborne LIDAR survey applied to the analysis of the historical
evolution of the Arno River delta (Italy). Journal of Coastal Research, SI 50.
Richard Brankner Research (RBR) Datasheet: XR 620 short term water level recorder.
Accessed October 2nd 2009 from www.rbr-global.com/products/XR-420_620.htm#XR-
620
Roelvink, J. (2006). Coastal morphodynamic evolution techniques. Coastal
Engineering, 53(2-3), pp. 277-287.
Romagnoli, C., Mancini, F. and Brunelli, R. (2006). Historical shoreline changes at
anactive island volcano: Stromboli, Italy. Journal of Coastal Research, 22 (4) pp.739-
749
Roy, P., Williams, R., Jones, A., Yassini, I., Gibbs, P., Coates, B., et al. (2001).
Structure and function of south-east Australian estuaries. Estuarine, Coastal and Shelf
Science, 53(3), pp. 351-384.
Salinger, M. J. (1980). New Zealand climate: I. Precipitation patterns. Monthly Weather
Review, 108(11), pp. 1892-1904.
Salinger, M. J. (1980). New Zealand climate: II. Temperature patterns. Monthly
Weather Review, 108(11), pp. 1905-1912.
Sawai, Y., Horton, B., & Nagumo, T. (2004). The development of a diatom-based
transfer function along the Pacific coast of eastern Hokkaido, northern Japan—an aid in
paleoseismic studies of the Kuril subduction zone. Quaternary Science Reviews, 23(23-
24), pp. 2467-2483.
Schwarzer, K., Diesing, M., Larson, M., Niedermeyer, R., Schumacher, W., &
Furmanczyk, K. (2003). Coastline evolution at different time scales: examples from the
Pomeranian Bight, southern Baltic Sea. Marine Geology, 194(1-2), pp. 79-101.
Short, A.D. (1999). Handbook of beach and shoreface morphodynamics. John Wiley,
New York.
Shulmeister, J., and Kirk, R.M. (1993). Evolution of mixed sand and gravel barrier
systems in North Canterbury, New Zealand, during Holocene sea-level rise and
stillstand. Sedimentary Geology, 87 pp. 215-235.
Singer, J. K., Anderson, J. B., Ledbetter, M. T., McCave, I. N., Jones, K. P. N., &
Wright, R. (1988). An assessment of analytical techniques for the size analysis of fine-
grained sediments. Journal of Sedimentary Petrology, 58(3), pp. 534-543.
Smith, N.P. (1981). Local energy exchanges in a shallow, coastal lagoon: summer
conditions. Atmosphere-Ocean 19(4). pp. 307-319.
Smith, S.J. (1995). Morphodynamics of the Hurunui River Mouth, North Canterbury.
Unpublished MA (Geogr) Thesis, University of Canterbury, Christchurch.
Solomon, S.M. (2005). Spatial and temporal variability of shoreline change in
theBeaufort-Mackenzie region, northwest territories, Canada. Geo-Marine Letters, 25
pp. 127-137.
Soons J. M. and Selby M. J. (eds.) (1982). Landforms of New Zealand. 2nd ed.
Longman Paul, Auckland, 531 pp.
References
203
Soons, J. M., Shulmeister, J., & Holt, S. (1997). The Holocene evolution of a well
nourished gravelly barrier and lagoon complex, Kaitorete 'Spit', Canterbury, New
Zealand. Marine Geology, 138(1-2), pp. 69-90.
Speer, P., & Aubrey, D. (1985). A study of non-linear tidal propagation in shallow
inlet/estuarine systems, Part II: Theory. Estuarine, Coastal and Shelf Science, 21(2), pp.
207-224.
Stanton, B.R. (1976). Circulation and hydrology off the West Coast of the South Island,
New Zealand. New Zealand Journal of Marine and Freshwater Research, 10(3), pp.
445-467.
Stephenson, W., & Brander, R. (2003). Coastal geomorphology into the twenty-first
century. Progress in Physical Geography, 27(4), pp. 607-624.
Stephenson, W., & Brander, R. (2004). Coastal geomorphology. Progress in Physical
Geography, 28(4), 569-580.
Sturman, A. (2001). Local and Regional Weather and Climate. In: A. Sturman and R.
Spronken-Smith (eds.) The Physical Environment; A New Zealand Perspective. Oxford
University Press, Victoria.
Suggate, R.P., Stevens, G.R., Te Punga, R.P. (1978). The Geology of New Zealand:
Wellington, Government Printer, 820 pp.
Suggate, R., & Moar, N. (1970). Revision of the chronology of the Late Otira Glacial.
New Zealand Journal of Geology and Geophysics, 13, pp. 742-746.
Sutherland, R. A. (1998). Loss-on-ignition estimates of Organic Matter and
relationships to Organic Carbon in fluvial bed sediments. Hydrobiologia, 389(1-3), pp.
153-167.
Suttar, S. (1990). Ribbons of blue handbook. Scitech, Victoria.
Tagliapietra, D., Sigovini, M., & Ghirardini, A. V. (2009). A review of terms and
definitions to categorise estuaries, lagoons and associated environments. Marine and
Freshwater Research, 60(6), pp. 497-509.
Thom, B., & Short, A. (2006). Introduction: Australian coastal geomorphology, 1984-
2004. Journal of Coastal Research, 22(1), 1-10.
Todd, D.J. (1992). River mouth and coastal processes of the Ashburton river mouth. In:
Dons, T. and Stringer, D. (eds.) Natural Resources of the Ashburton River and
Catchment. Canterbury Regional Council Report 92(36) pp. 208-234.
van Mierlo, R. (2003) Shearer Swamp survey report. Department of Conservation,
Wellington.
van Mierlo, R. (2007) Totara Lagoon survey report. Department of Conservation,
Wellington.
Vaz, N., Dias, J. M., Leitão, P., & Martins, I. (2005). Horizontal patterns of water
temperature and salinity in an estuarine tidal channel: Ria de Aveiro. Ocean Dynamics,
55(5-6), pp. 416-429.
Vila-Concejo, A., Ferreira, O., Morris, B. D., Matias, A., & Dias, J. M. A. (2004).
Lessons from inlet relocation: Examples from Southern Portugal. Coastal Engineering,
51(10), pp. 967-990.
Wang, Y. P., Zhang, R., & Gao, S. (1999). Velocity variations in salt marsh creeks,
Jiangsu, China. Journal of Coastal Research, 15(2), pp. 471-477.
Wells, A., & Goff, J. (2009). Coastal dunes in Westland, New Zealand, provide a record
of paleoseismic activity on the Alpine fault. Geology, 35(8), p. 731.
References
205
Woodroffe, C.D. (2003) Coasts: Form, Process and Evolution. Cambridge: Cambridge
University Press, 623pp.
Wright, L., & Thom, B. (1977). Coastal depositional landforms: a morphodynamic
approach. Progress in Physical Geography, 1(3), pp. 412-459.
Yabe, H., Yasui, S., Urabe, A., & Takahama, N. (2004). Holocene paleoenvironmental
changes inferred from the diatom records of the Echigo Plain, central Japan. Quaternary
International, 115, pp. 117-130.
Zong, Y., Shennan, I., Combellick, R., Hamilton, S., & Rutherford, M. (2003).
Microfossil evidence for land movements associated with the AD 1964 Alaska
earthquake. The Holocene, 13(1), p. 7.
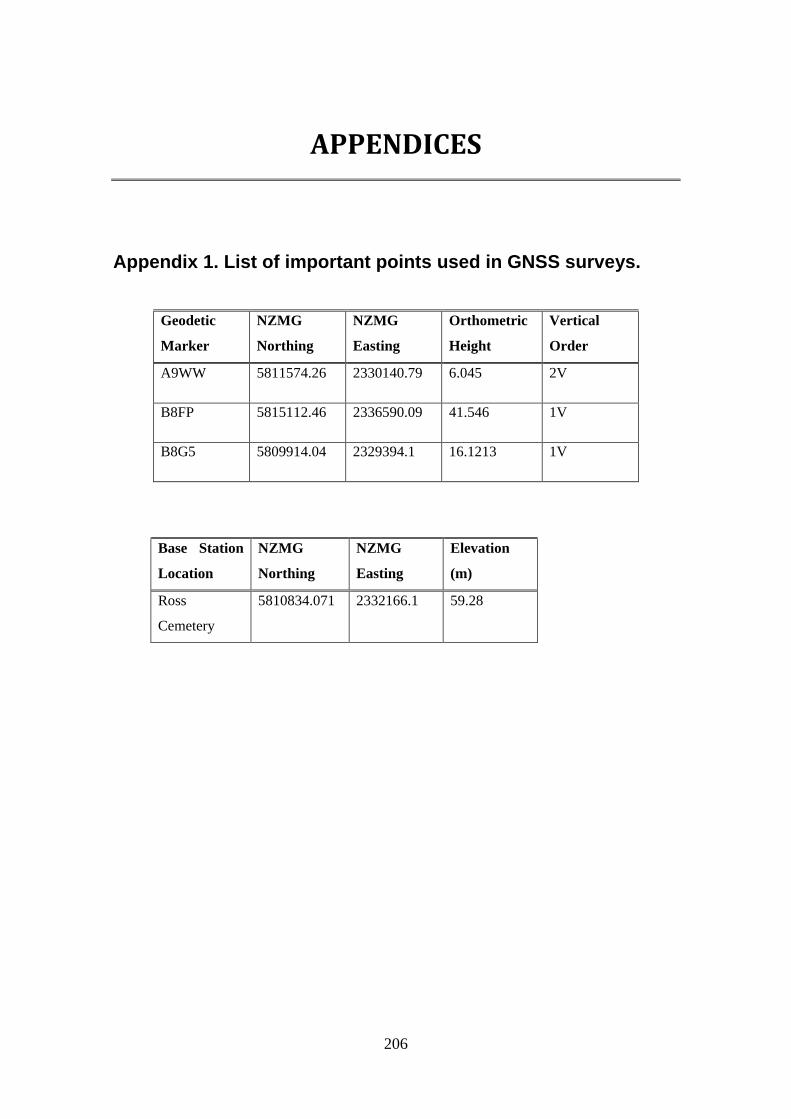
206
APPENDICES
Appendix 1. List of important points used in GNSS surveys.
Geodetic
Marker
NZMG
Northing
NZMG
Easting
Orthometric
Height
Vertical
Order
A9WW 5811574.26
2330140.79
6.045
2V
B8FP 5815112.46
2336590.09
41.546
1V
B8G5 5809914.04
2329394.1
16.1213
1V
Base Station
Location
NZMG
Northing
NZMG
Easting
Elevation
(m)
Ross
Cemetery
5810834.071 2332166.1 59.28

Appendices
207
Appendix 2. Details of aerial photographs used. Date Survey Number Scale Run and Frame Area covered
12/04/1948 SN 508 1:16000
1448-2 Totara Lagoon 1449-2
1450-2 1453-4 Waikoriri Lagoon
28/02/1963 SN 1542
3688-3 Totara Lagoon 3688-5
3689-3 3689-8 Waikoriri Lagoon
18/02/1972 SN 3509
4566-2 Totara Lagoon 4567-3
4568-3 4570-1 Waikoriri Lagoon
4/10/1976 SN 2977
H3-2
Totara Lagoon I1-1 I2-2 I3-2 J1-2 K2-2 Waikoriri Lagoon
18/10/1981 SN 5940 1:25000
A-1
Totara Lagoon A-3 A-4 A-5 C-11 Waikoriri Lagoon
1986 SN 8585
B-2 Totara Lagoon C-1
C-2 D-1 Waikoriri Lagoon
15/01/1988 SN 8922c 1:15000
W-13 Waikoriri Lagoon X-3
Totara Lagoon X-5 X-7 X-9
14/02/2002 SN 30003 1:50000 4-189 Waikoriri Lagoon LINZ j33a, j33c Totara Lagoon
15/05/2002 SN 12755D 1:15000 A-03 Waikoriri Lagoon
28/08/2005 SN 12947 1:25000
08-07
Totara Lagoon 08-08 08-09 08-10 08-11
2/08/2006 SN 13023B 1:25000 01-01 Waikoriri Lagoon
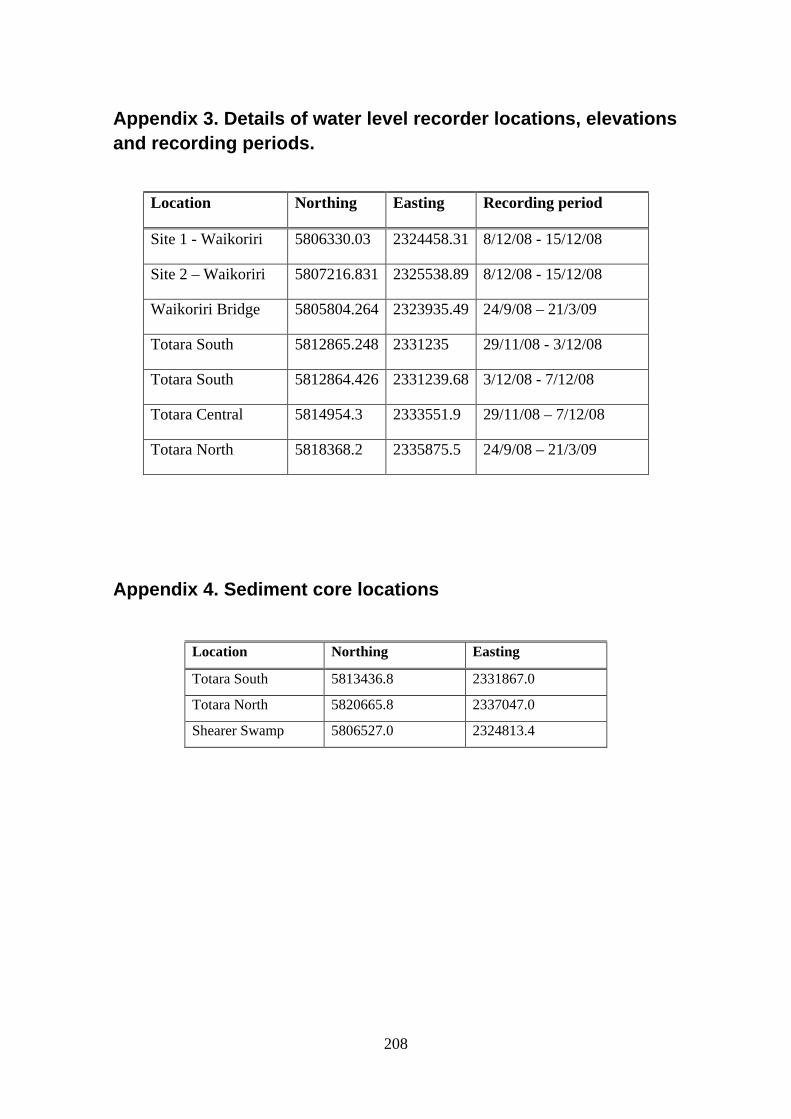
208
Appendix 3. Details of water level recorder locations, elevations and recording periods.
Location Northing Easting Recording period
Site 1 - Waikoriri 5806330.03 2324458.31 8/12/08 - 15/12/08
Site 2 – Waikoriri 5807216.831 2325538.89 8/12/08 - 15/12/08
Waikoriri Bridge 5805804.264 2323935.49 24/9/08 – 21/3/09
Totara South 5812865.248 2331235 29/11/08 - 3/12/08
Totara South 5812864.426 2331239.68 3/12/08 - 7/12/08
Totara Central 5814954.3 2333551.9 29/11/08 – 7/12/08
Totara North 5818368.2 2335875.5 24/9/08 – 21/3/09
Appendix 4. Sediment core locations
Location Northing Easting
Totara South 5813436.8 2331867.0
Totara North 5820665.8 2337047.0
Shearer Swamp 5806527.0 2324813.4
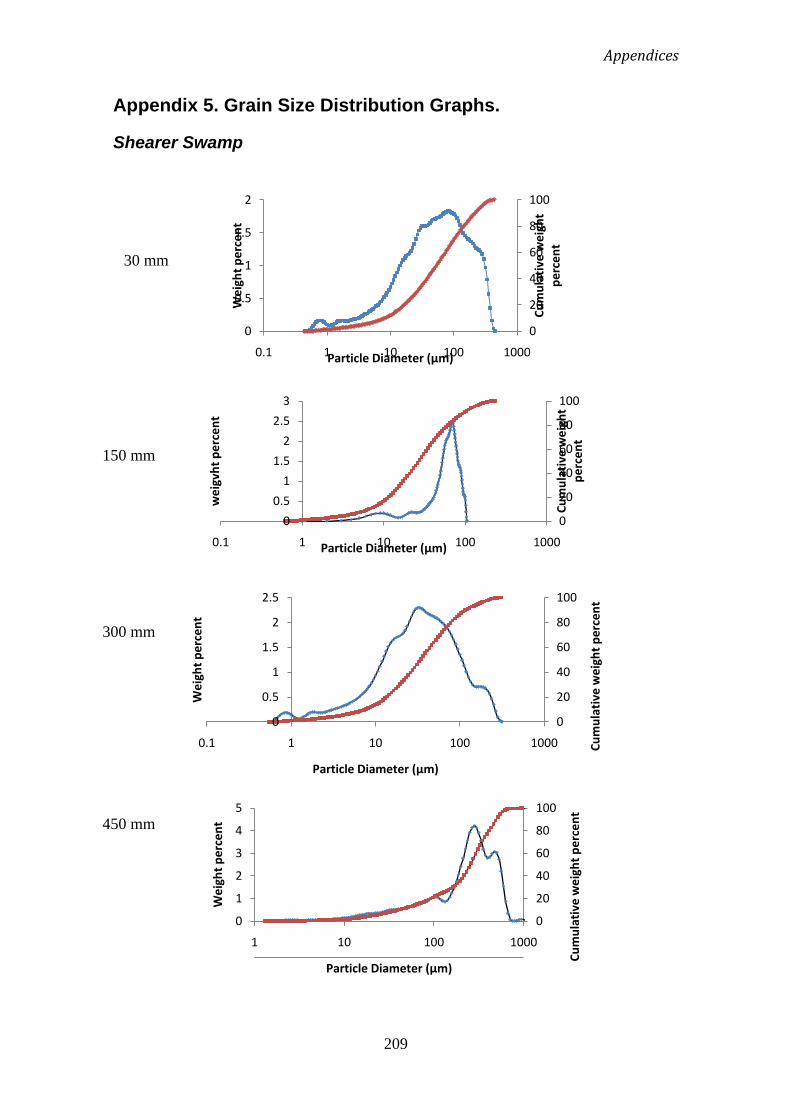
Appendices
209
Appendix 5. Grain Size Distribution Graphs.
Shearer Swamp
0
20
40
60
80
100
0
0.5
1
1.5
2
0.1 1 10 100 1000
Cum
ulat
ive
wei
ght
perc
ent
Wei
ght p
erce
nt
Particle Diameter (µm)
0
20
40
60
80
100
0
0.5
1
1.5
2
2.5
3
0.1 1 10 100 1000Cu
mul
ativ
e w
eigh
t pe
rcen
t
wei
gvht
per
cent
Particle Diameter (µm)
0
20
40
60
80
100
0
0.5
1
1.5
2
2.5
0.1 1 10 100 1000 Cum
ulat
ive
wei
ght p
erce
nt
Wei
ght p
erce
nt
Particle Diameter (µm)
0
20
40
60
80
100
0
1
2
3
4
5
1 10 100 1000
Cum
ulat
ive
wei
ght p
erce
nt
Wei
ght p
erce
nt
Particle Diameter (µm)
30 mm
450 mm
300 mm
150 mm

210
Totara South
0
20
40
60
80
100
00.5
11.5
22.5
3
0.1 1 10 100 1000
Cum
ulat
ive
wei
ght
perc
ent
Wei
ght p
erce
nt
Particle Diameter (µm)
0
20
40
60
80
100
00.5
11.5
22.5
3
0.1 1 10 100 1000
Cum
ulat
ive
wei
ght
perc
ent
Wei
ght p
erce
nt
Particle Diameter (µm)
0
20
40
60
80
100
0
0.5
1
1.5
2
2.5
0.001 0.01 0.1 1 10 100 1000
Cum
ulat
ive
wei
ght
perc
ent
Wei
ght p
erce
nt
Particle Diameter (µm)
0
20
40
60
80
100
0
2
4
6
8
1 10 100 1000
Cum
ulat
ive
wei
ght
perc
ent
Wei
ght p
erce
nt
Particle Diameter (µm)
450 mm
300 mm
150 mm
30 mm
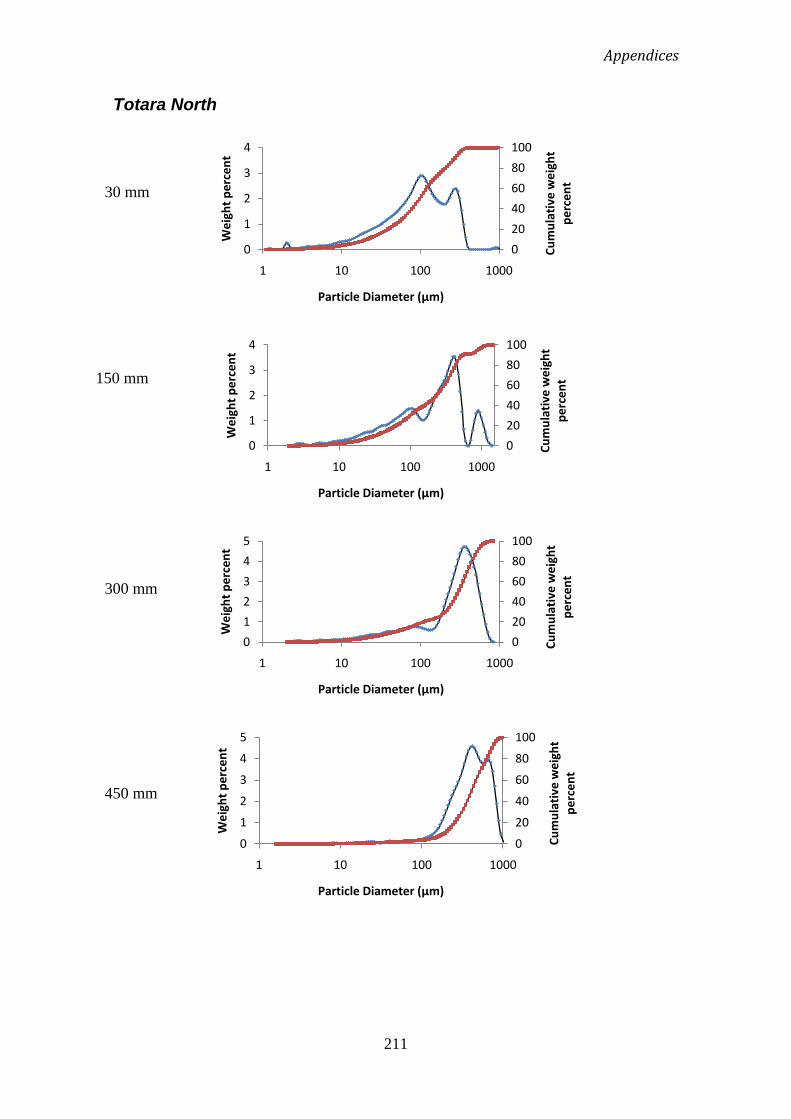
Appendices
211
Totara North
0
20
40
60
80
100
0
1
2
3
4
1 10 100 1000
Cum
ulat
ive
wei
ght
perc
ent
Wei
ght p
erce
nt
Particle Diameter (µm)
0
20
40
60
80
100
0
1
2
3
4
1 10 100 1000
Cum
ulat
ive
wei
ght
perc
ent
Wei
ght p
erce
nt
Particle Diameter (µm)
0
20
40
60
80
100
0
1
2
3
4
5
1 10 100 1000
Cum
ulat
ive
wei
ght
perc
ent
Wei
ght p
erce
nt
Particle Diameter (µm)
0
20
40
60
80
100
0
1
2
3
4
5
1 10 100 1000
Cum
ulat
ive
wei
ght
perc
ent
Wei
ght p
erce
nt
Particle Diameter (µm)
450 mm
30 mm
150 mm
300 mm
Related Documents