Morphological features and mechanical behavior of one- and two-phase polymeric materials simulated by molecular dynamics Ricardo Simo ˜es a,b, * , Anto ´nio M. Cunha a , Witold Brostow b a Department of Polymer Engineering, University of Minho, Campus de Azurem, 4800-058 Guimara ˜es, Portugal b Laboratory of Advanced Polymers and Optimized Materials (LAPOM), University of North Texas, Denton, TX 76203-5310, USA Received 13 July 2004; received in revised form 28 August 2004; accepted 29 August 2004 Available online 11 September 2004 Abstract Single phase amorphous polymeric materials and two-phase polymer liquid crystals (PLCs) have been created on the computer and their behavior simulated using molecular dynamics. An external force was applied on the material and its response computed along time. The influence of several parameters was investigated, such as the concentration of the rigid LC second phase and the existence of regions of different orientation across the thickness of the material. A simplified 3-region model, such as that used to model the skin-core structure resulting from injection molding, was used. The influence of the relative size of each region with different properties was determined. Thicker skin regions increase the rigidity of the material, due to their higher orientation in the direction of force application. The concentration of the reinforcing LC second phase has a similar effect, also resulting in a more brittle behavior. The simulations have provided a better understanding of these phenomena. A method for calculating the true stress during simulation of computer-generated materials (CGMs) is proposed. The true stress behavior was found to differ qualitatively from the engineering stress when the structure of the material allows for considerable changes in cross- sectional area at large-scale deformation. q 2004 Elsevier Ltd. All rights reserved. Keywords: Molecular dynamics; Modeling and simulation; Polymers 1. Introduction Computer simulations have been previously employed to study a variety of phenomena occurring at the molecular level in polymeric materials [1–3]. These simulations aim at characterizing the behavior and performance of both single- phase amorphous polymers and two-phase polymer liquid crystals (PLCs) under an external uniaxial tensile force. The present paper reports on results from a simple model for addressing the behavior of the typical skin-core microstruc- ture resulting from some processing methods for thermo- plastics. More complex models are proposed and will be applied in future simulations. Polymer liquid crystals are typically copolymers con- sisting of rigid liquid crystalline (LC) sequences combined with flexible sequences [4] and exhibit a series of improved properties when compared to other polymers [5–7]. Due to the complexity of their behavior, they have been con- comitantly studied by statistical mechanics [8,9], viscoe- lastic models [10–12], and experimental methods [4–7]. However, these research methods have not been able to provide complete answers to some of the pertinent questions about the properties and behavior of these materials. Computer simulations of PLCs can provide information from which those answers might emerge. Injection molding (IM) is one of the most important processing technologies for thermoplastic materials, namely for parts with a complex geometry. It involves the material flow under high shear and extensional stress fields and high cooling rates that subject the material to a complex thermomechanical environment. Due to all these effects, thermoplastic IM parts exhibit an array of morphological 0032-3861/$ - see front matter q 2004 Elsevier Ltd. All rights reserved. doi:10.1016/j.polymer.2004.08.063 Polymer 45 (2004) 7767–7777 www.elsevier.com/locate/polymer * Corresponding author. Address: Department of Polymer Engineering, University of Minho, Campus de Azurem, 4800-058 Guimara ˜es, Portugal. Tel.: C351-253510320; fax: C351-253510339. E-mail addresses: [email protected] (R. Simo ˜es), amcunha@ dep.uminho.pt (A.M. Cunha), [email protected] (W. Brostow).

Welcome message from author
This document is posted to help you gain knowledge. Please leave a comment to let me know what you think about it! Share it to your friends and learn new things together.
Transcript
Morphological features and mechanical behavior of one- and two-phase
polymeric materials simulated by molecular dynamics
Ricardo Simoesa,b,*, Antonio M. Cunhaa, Witold Brostowb
aDepartment of Polymer Engineering, University of Minho, Campus de Azurem, 4800-058 Guimaraes, PortugalbLaboratory of Advanced Polymers and Optimized Materials (LAPOM), University of North Texas, Denton, TX 76203-5310, USA
Received 13 July 2004; received in revised form 28 August 2004; accepted 29 August 2004
Available online 11 September 2004
Abstract
Single phase amorphous polymeric materials and two-phase polymer liquid crystals (PLCs) have been created on the computer and their
behavior simulated using molecular dynamics. An external force was applied on the material and its response computed along time. The
influence of several parameters was investigated, such as the concentration of the rigid LC second phase and the existence of regions of
different orientation across the thickness of the material.
A simplified 3-region model, such as that used to model the skin-core structure resulting from injection molding, was used. The influence
of the relative size of each region with different properties was determined. Thicker skin regions increase the rigidity of the material, due to
their higher orientation in the direction of force application. The concentration of the reinforcing LC second phase has a similar effect, also
resulting in a more brittle behavior. The simulations have provided a better understanding of these phenomena.
A method for calculating the true stress during simulation of computer-generated materials (CGMs) is proposed. The true stress behavior
was found to differ qualitatively from the engineering stress when the structure of the material allows for considerable changes in cross-
sectional area at large-scale deformation.
q 2004 Elsevier Ltd. All rights reserved.
Keywords: Molecular dynamics; Modeling and simulation; Polymers
1. Introduction
Computer simulations have been previously employed to
study a variety of phenomena occurring at the molecular
level in polymeric materials [1–3]. These simulations aim at
characterizing the behavior and performance of both single-
phase amorphous polymers and two-phase polymer liquid
crystals (PLCs) under an external uniaxial tensile force. The
present paper reports on results from a simple model for
addressing the behavior of the typical skin-core microstruc-
ture resulting from some processing methods for thermo-
plastics. More complex models are proposed and will be
applied in future simulations.
0032-3861/$ - see front matter q 2004 Elsevier Ltd. All rights reserved.
doi:10.1016/j.polymer.2004.08.063
* Corresponding author. Address: Department of Polymer Engineering,
University of Minho, Campus de Azurem, 4800-058 Guimaraes, Portugal.
Tel.: C351-253510320; fax: C351-253510339.
E-mail addresses: [email protected] (R. Simoes), amcunha@
dep.uminho.pt (A.M. Cunha), [email protected] (W. Brostow).
Polymer liquid crystals are typically copolymers con-
sisting of rigid liquid crystalline (LC) sequences combined
with flexible sequences [4] and exhibit a series of improved
properties when compared to other polymers [5–7]. Due to
the complexity of their behavior, they have been con-
comitantly studied by statistical mechanics [8,9], viscoe-
lastic models [10–12], and experimental methods [4–7].
However, these research methods have not been able to
provide complete answers to some of the pertinent questions
about the properties and behavior of these materials.
Computer simulations of PLCs can provide information
from which those answers might emerge.
Injection molding (IM) is one of the most important
processing technologies for thermoplastic materials, namely
for parts with a complex geometry. It involves the material
flow under high shear and extensional stress fields and high
cooling rates that subject the material to a complex
thermomechanical environment. Due to all these effects,
thermoplastic IM parts exhibit an array of morphological
Polymer 45 (2004) 7767–7777
www.elsevier.com/locate/polymer
R. Simoes et al. / Polymer 45 (2004) 7767–77777768
features through their thickness. This anisotropic layered
structure is often simplified to a skin-core model with three
regions, two external highly oriented skin regions and an
inner spherulitic core, proposed by Tadmor [13]. Although
the number of identified layers is dependent on the
observer’s criteria and the level of detail of the experimental
analysis technique employed, the three-layer model has
been successfully applied by several authors [14–17] to the
study of the influence of morphology on mechanical
properties.
Each region in this skin-core layered structure exhibits
distinct behavior. The particular morphology of each region
and the skin-core ratio (usually defined either in terms of two-
dimensional width or area) depend on the specific thermo-
mechanical environment during processing. Necessarily,
these factors determine the final properties of the molded
part. Experimentally, the formation of the skin was found to
be thermally controlled at high temperatures and governed by
the shear stress level at lower temperatures [17,18].
The skin layer is formed due to the rapid cooling of the
hot melt against the cold mold wall during the filling stage.
Due to the high orientation of the chains in the melt at this
stage, the frozen skin layer displays high degree of
orientation. Although Zipper [19] showed that the highly
oriented molecular chains in the skin are tilted towards the
core and not parallel to the surface of the mold as could be
initially assumed, the simplified three-layer model used in
the present work will consider the chains in the skin to be
parallel to the surface. Future work will improve on this
concept and use a more accurate model. The thickness of the
skin layer depends not only on the thermomechanical
environment (cooling rate, stress fields) but also on the
molecular weight of the chains, with higher molecular
weights resulting in thicker skins [18].
Due to the insulation effect of the previously formed
skin, the low thermal conductivity of polymers and the
originally lower shear level, the core material has enough
time to undergo an extensive relaxation process—resulting
in lower orientation of the core region compared to the skin
region. Some models consider the core nearly isotropic as a
simplification. Since the present work deals with amorphous
materials, the core region will be assumed isotropic.
As pointed out before, computer simulations can provide
information to complement experimental results and
provide insights into phenomena that cannot be reproduced
experimentally, and are not performed with the intent of
replacing experimental testing. The concomitant use of
simulations and experiments is expected to produce a
synergistic effect, resulting in an improved understanding of
the properties and behavior of polymeric materials.
2. Simulation method
The statistical segment model of an amorphous poly-
meric chain has been used, as advocated by Flory [20]. In
the statistical segment model, several repeating units of a
chain are simplified as one single segment. The creation of
materials on the computer is described in Section 3.
The segments interact with each other according to a
series of interaction potentials. These differ for intra-chain
chemical bonding and inter-chain secondary interactions.
Since these simulations deal with both one- and two-phase
systems, different potentials were defined to characterize the
interactions between segments of the flexible polymer
matrix and those of a rigid liquid-crystalline (LC) second
phase. The intra-chain bonds between rigid LC segments are
represented by a narrow Morse-like potential, allowing only
very small bond extensions. In the case of the intra-chain
bonds between flexible segments, a spliced double-well
potential is used to allow for conformation transitions as in
real polymer chains. For both flexible and rigid segments,
the inter-chain (secondary) van der Walls interactions are
much weaker and are described by Morse-like potentials
with a relatively broad well. A detailed description of the
potentials has been provided in Ref. [1].
The molecular dynamics (MD) method has been
employed to perform the simulations. The preference over
alternative methods, such as Monte Carlo (MC) or Brownian
dynamics, has been explained elsewhere [1,2]. The time
evolution calculation uses a leap-frog algorithm [21].
The MD method considers a system of N particles
(statistical segments in this case) evolving along time. Each
particle is described by three Cartesian coordinates and
three momentum components along the main axes. As
these six variables are calculated at each time step of the
simulation, the method provides detailed time-dependent
behavior for every segment in the system. The major
difference between MD and MC is that in MD all particles
are moved at once at each time step, whereas in traditional
MC each particle moves at a time and that movement is
accepted or rejected. In the MD method, time is an explicit
variable, which allows the simulation of time-dependent
phenomena as well as equilibrium properties. This feature
is particularly important in the study of viscoelastic
materials.
The molecular dynamics (MD) method has been used for
many years to study phenomena which are inaccessible
experimentally, or which are too costly to perform [22].
Other significant advantages of computer simulation
methods are the ability to study the response under
hypothetical conditions which cannot be reproduced in a
laboratory, and being able to study variables independently
of one another. A detailed review of the various computer
simulation methods has been provided by Fossey [22].
MD methods have been employed in the investigation of
a wide variety of phenomena in different research areas.
Among these is the use of MD by Smith et al. [23] to
simulate the X-ray scattering pattern. On the topic of
tribology, Gerde and Marder [24] have investigated friction,
including its connection to the crack healing mechanism.
Theodorou et al. have applied both MC and MD to
R. Simoes et al. / Polymer 45 (2004) 7767–7777 7769
investigate a plethora of phenomena, such as diffusion [25],
permeation [26], elongational flow [27], and stress relax-
ation [28]. However, they follow a quite different approach
to the problem, performing simulations mostly at the
atomistic level, whereas the present study employs a
course-grain approach. MD simulations have also been
applied to investigate thermal properties and the melting
phenomena, including that of thin layers on a substrate [29,
30], and the thermodynamic properties of simple fluids and
polymer melts [31,32]. Diffusion coefficients of gases
through polymers [33] and the transport of fluids through
polymer membranes [34] have also been addressed through
MD simulations.
Another method of interest for the study of polymers is
the kinetic model of fracture, developed by Termonia and
co-workers. This method has been successfully employed in
the study of the mechanical behavior of polymers [35–37]
and the simulation of spider silk fibers [38]. Although
focused on phenomena occurring at significant different
length scales from those in the present study, fracture
mechanics approaches have also been employed in the
simulation of polymers [39–42].
The simulation method used in the present paper had
been previously applied to the study of stress relaxation in
metals and polymers [43–45]. Those simulations have
shown that stress relaxation is mainly achieved by plastic
deformation occurring in the vicinity of defects. In an ideal
lattice, the force required to initiate a crack is higher, but
then the force is sufficient to cause quick propagation. A
close similarity was found between the stress-relaxation
curves resulting from the computer simulations and those
from experiments. The simulation results also fit with the
Kubat cooperative theory of stress relaxation in materials.
This paper follows simulation work focused on investi-
gating the mechanical properties [1] and the crack formation
and propagation phenomena in PLCs [2]. Two of the key
questions are where cracks form in the material and how
they propagate, since they could have equally been
expected to form in the flexible matrix because of its
relative weakness or inside the second phase because of
their relative rigidity. Based on simulation results, it was
shown that cracks appear preferentially between regions
where agglomerates of the second phase exist in close
proximity. The cracks then grow along the interface of the
two phases. Whenever that preferential crack growth path is
unavailable, cracks will propagate through the flexible
phase.
More recently, a similar simulation method was
employed in the study of tribological properties, namely
scratch resistance and recovery of amorphous polymeric
materials [3]. Although at a preliminary stage, these
simulations indicate that the tribological properties are
mainly dictated by the local chain geometry. In the case of
two-phase PLCs, performance can be improved if the
rigid second phase exhibits preferential migration to the
surface.
3. Material generation procedures
3.1. Single-region materials
Both one- and two-phase polymeric materials were
created on the computer. In each of these cases, the
amorphous phase is comprised of a series of self-avoiding
coiled chains. For two-phase materials, a rigid LC phase is
then dispersed in the flexible matrix up to a specified
concentration.
The creation of the coiled chains follows a procedure
developed by Mom [46] and later modified to result in a
more realistic representation of polymeric chains [47]. All
segments in the material are initially positioned in a
triangular lattice, filling all available positions. At this
stage, each segment represents one chain of length 1. The
reasons for using the triangular lattice have been previously
discussed [43,47], but the main reason is the more realistic
coordination number than, for example, that of the square
lattice. Following this procedure, both completely filled
lattices and those containing vacancies can be created.
Chains grow along time by bonding of neighboring end-
of-chain segments, similarly to the step-wise polymeriz-
ation process. Whenever several pairs of segments are
equally spaced, which happens very frequently in the early
stages of the procedure, one of these pairs is randomly
picked, and the segments bond to form a chain of length 2.
This mechanism is then repeated until no more segments
can be bonded in this way. A preferential direction can be
defined for chain growth, originating structures with varying
degrees of orientation along the main axes. However, in the
present work this feature was not used and the amorphous
phase is always randomly oriented. Even though the
procedure for chain growth is relatively simple, the resulting
three-dimensional materials exhibit several realistic fea-
tures, as previously described in Ref. [47].
In the case of two-phase polymer liquid crystals (PLCs),
the LC reinforcement is then added to the flexible matrix.
Experimental data clearly shows that the LC phase forms
quasi-spherical agglomerates [48,49], usually called islands.
Thus, in order to achieve the desired LC concentration,
islands of a chosen size are introduced in the CGM by
random sequential addition.
To determine the influence of the LC concentration on
the properties and behavior of the CGMs, as discussed in
Section 5.2, it was essential that the effects of the chain
geometry and island spatial distribution were prevented,
since these have been previously shown to affect the
mechanical response of the material [2,50]. Thus, for
creating the materials described in Section 5.2, an approach
that isolates the influence of the LC concentration was
employed. Instead of independently creating materials with
varying LC concentration, a CGM containing the highest
LC concentration of interest is created first and then islands
are randomly removed to obtain lower concentration
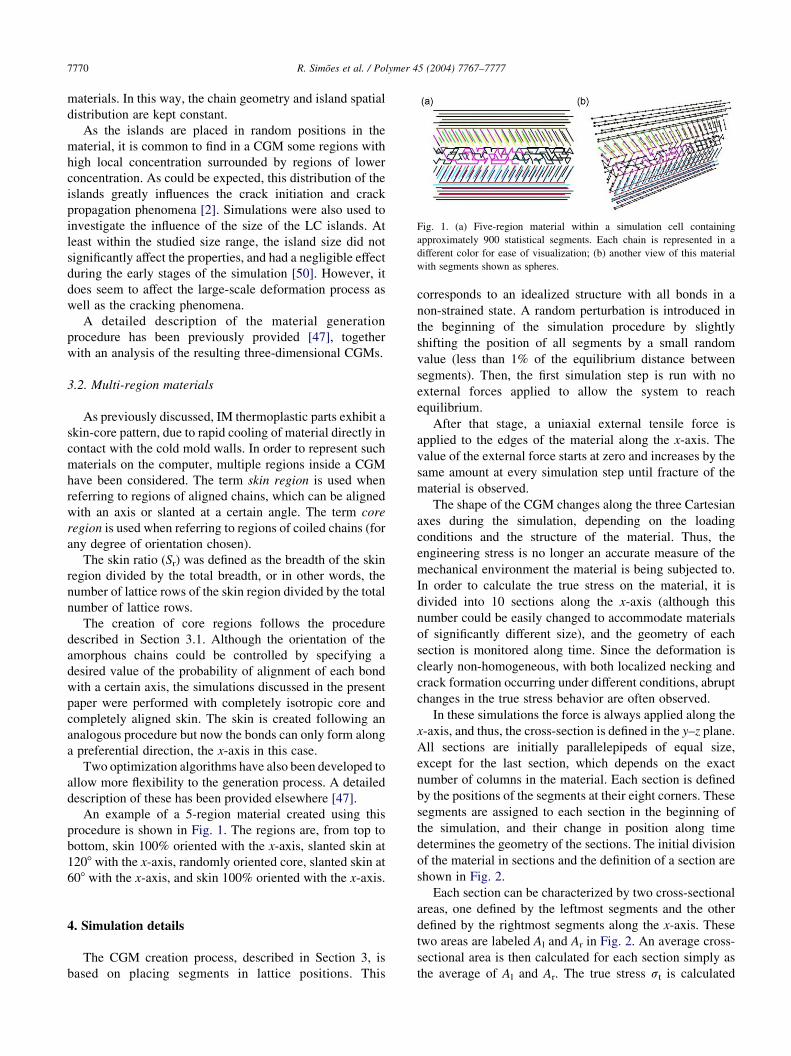
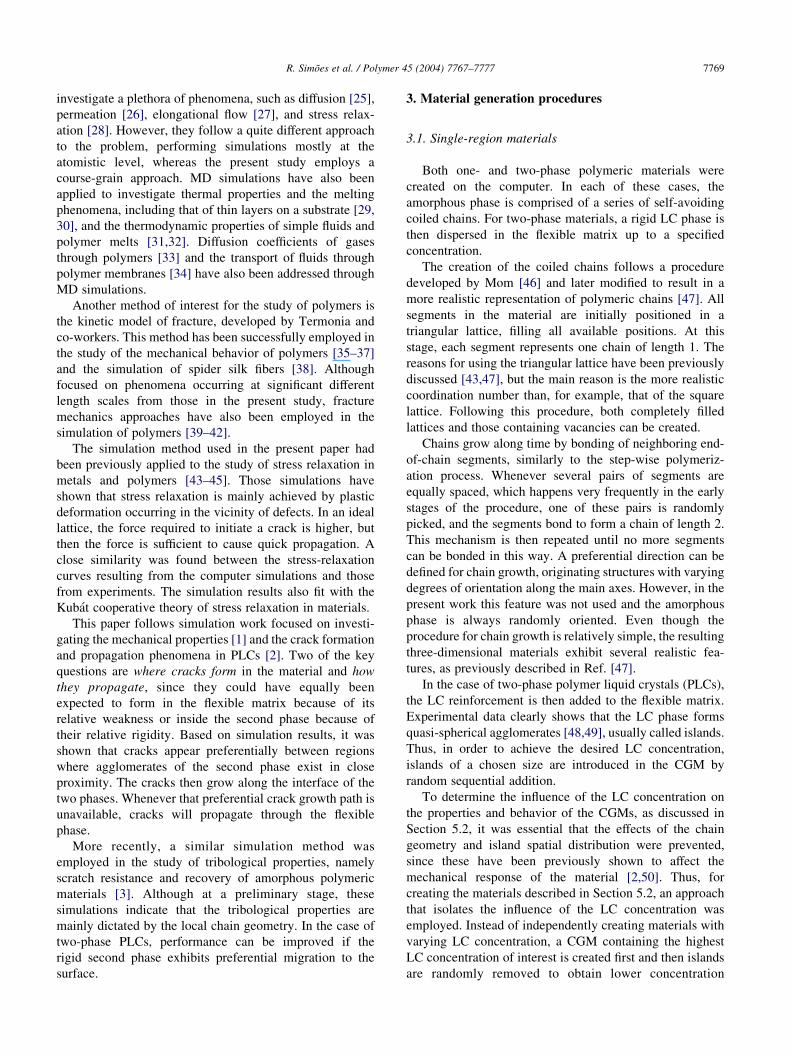
Fig. 1. (a) Five-region material within a simulation cell containing
approximately 900 statistical segments. Each chain is represented in a
different color for ease of visualization; (b) another view of this material
with segments shown as spheres.
R. Simoes et al. / Polymer 45 (2004) 7767–77777770
materials. In this way, the chain geometry and island spatial
distribution are kept constant.
As the islands are placed in random positions in the
material, it is common to find in a CGM some regions with
high local concentration surrounded by regions of lower
concentration. As could be expected, this distribution of the
islands greatly influences the crack initiation and crack
propagation phenomena [2]. Simulations were also used to
investigate the influence of the size of the LC islands. At
least within the studied size range, the island size did not
significantly affect the properties, and had a negligible effect
during the early stages of the simulation [50]. However, it
does seem to affect the large-scale deformation process as
well as the cracking phenomena.
A detailed description of the material generation
procedure has been previously provided [47], together
with an analysis of the resulting three-dimensional CGMs.
3.2. Multi-region materials
As previously discussed, IM thermoplastic parts exhibit a
skin-core pattern, due to rapid cooling of material directly in
contact with the cold mold walls. In order to represent such
materials on the computer, multiple regions inside a CGM
have been considered. The term skin region is used when
referring to regions of aligned chains, which can be aligned
with an axis or slanted at a certain angle. The term core
region is used when referring to regions of coiled chains (for
any degree of orientation chosen).
The skin ratio (Sr) was defined as the breadth of the skin
region divided by the total breadth, or in other words, the
number of lattice rows of the skin region divided by the total
number of lattice rows.
The creation of core regions follows the procedure
described in Section 3.1. Although the orientation of the
amorphous chains could be controlled by specifying a
desired value of the probability of alignment of each bond
with a certain axis, the simulations discussed in the present
paper were performed with completely isotropic core and
completely aligned skin. The skin is created following an
analogous procedure but now the bonds can only form along
a preferential direction, the x-axis in this case.
Two optimization algorithms have also been developed to
allow more flexibility to the generation process. A detailed
description of these has been provided elsewhere [47].
An example of a 5-region material created using this
procedure is shown in Fig. 1. The regions are, from top to
bottom, skin 100% oriented with the x-axis, slanted skin at
1208 with the x-axis, randomly oriented core, slanted skin at
608 with the x-axis, and skin 100% oriented with the x-axis.
4. Simulation details
The CGM creation process, described in Section 3, is
based on placing segments in lattice positions. This
corresponds to an idealized structure with all bonds in a
non-strained state. A random perturbation is introduced in
the beginning of the simulation procedure by slightly
shifting the position of all segments by a small random
value (less than 1% of the equilibrium distance between
segments). Then, the first simulation step is run with no
external forces applied to allow the system to reach
equilibrium.
After that stage, a uniaxial external tensile force is
applied to the edges of the material along the x-axis. The
value of the external force starts at zero and increases by the
same amount at every simulation step until fracture of the
material is observed.
The shape of the CGM changes along the three Cartesian
axes during the simulation, depending on the loading
conditions and the structure of the material. Thus, the
engineering stress is no longer an accurate measure of the
mechanical environment the material is being subjected to.
In order to calculate the true stress on the material, it is
divided into 10 sections along the x-axis (although this
number could be easily changed to accommodate materials
of significantly different size), and the geometry of each
section is monitored along time. Since the deformation is
clearly non-homogeneous, with both localized necking and
crack formation occurring under different conditions, abrupt
changes in the true stress behavior are often observed.
In these simulations the force is always applied along the
x-axis, and thus, the cross-section is defined in the y–z plane.
All sections are initially parallelepipeds of equal size,
except for the last section, which depends on the exact
number of columns in the material. Each section is defined
by the positions of the segments at their eight corners. These
segments are assigned to each section in the beginning of
the simulation, and their change in position along time
determines the geometry of the sections. The initial division
of the material in sections and the definition of a section are
shown in Fig. 2.
Each section can be characterized by two cross-sectional
areas, one defined by the leftmost segments and the other
defined by the rightmost segments along the x-axis. These
two areas are labeled Al and Ar in Fig. 2. An average cross-
sectional area is then calculated for each section simply as
the average of Al and Ar. The true stress st is calculated
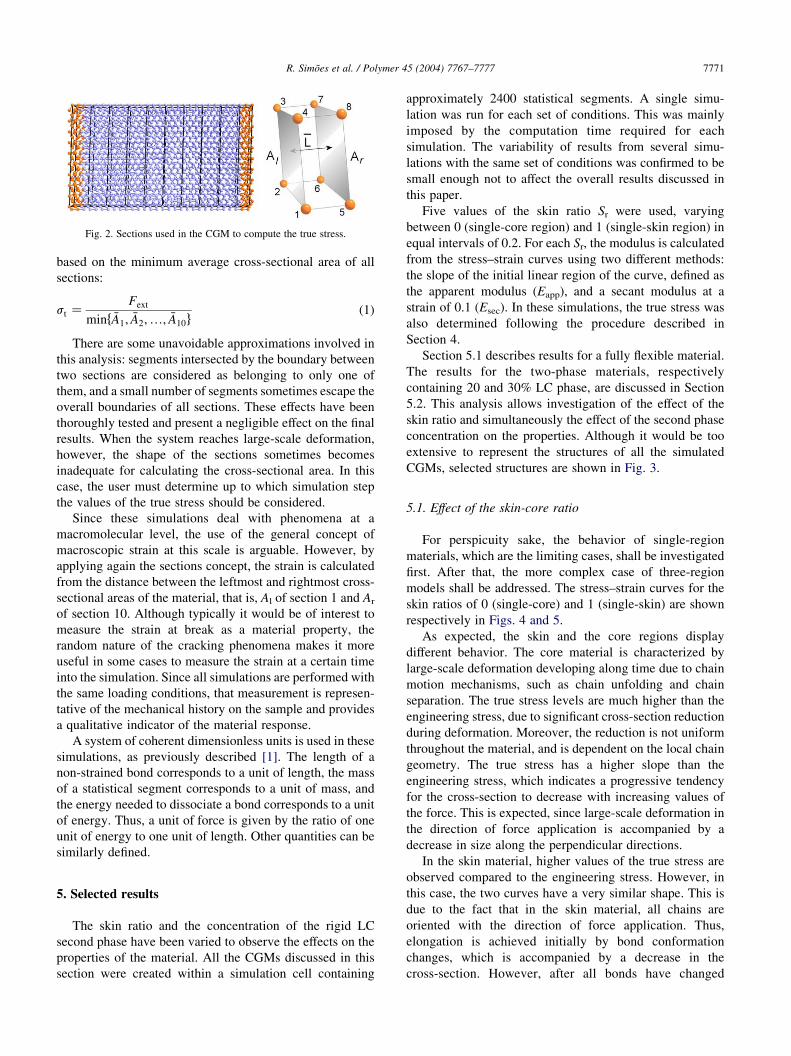
Fig. 2. Sections used in the CGM to compute the true stress.
R. Simoes et al. / Polymer 45 (2004) 7767–7777 7771
based on the minimum average cross-sectional area of all
sections:
st ZFext
minf �A1; �A2;.; �A10g(1)
There are some unavoidable approximations involved in
this analysis: segments intersected by the boundary between
two sections are considered as belonging to only one of
them, and a small number of segments sometimes escape the
overall boundaries of all sections. These effects have been
thoroughly tested and present a negligible effect on the final
results. When the system reaches large-scale deformation,
however, the shape of the sections sometimes becomes
inadequate for calculating the cross-sectional area. In this
case, the user must determine up to which simulation step
the values of the true stress should be considered.
Since these simulations deal with phenomena at a
macromolecular level, the use of the general concept of
macroscopic strain at this scale is arguable. However, by
applying again the sections concept, the strain is calculated
from the distance between the leftmost and rightmost cross-
sectional areas of the material, that is, Al of section 1 and Ar
of section 10. Although typically it would be of interest to
measure the strain at break as a material property, the
random nature of the cracking phenomena makes it more
useful in some cases to measure the strain at a certain time
into the simulation. Since all simulations are performed with
the same loading conditions, that measurement is represen-
tative of the mechanical history on the sample and provides
a qualitative indicator of the material response.
A system of coherent dimensionless units is used in these
simulations, as previously described [1]. The length of a
non-strained bond corresponds to a unit of length, the mass
of a statistical segment corresponds to a unit of mass, and
the energy needed to dissociate a bond corresponds to a unit
of energy. Thus, a unit of force is given by the ratio of one
unit of energy to one unit of length. Other quantities can be
similarly defined.
5. Selected results
The skin ratio and the concentration of the rigid LC
second phase have been varied to observe the effects on the
properties of the material. All the CGMs discussed in this
section were created within a simulation cell containing
approximately 2400 statistical segments. A single simu-
lation was run for each set of conditions. This was mainly
imposed by the computation time required for each
simulation. The variability of results from several simu-
lations with the same set of conditions was confirmed to be
small enough not to affect the overall results discussed in
this paper.
Five values of the skin ratio Sr were used, varying
between 0 (single-core region) and 1 (single-skin region) in
equal intervals of 0.2. For each Sr, the modulus is calculated
from the stress–strain curves using two different methods:
the slope of the initial linear region of the curve, defined as
the apparent modulus (Eapp), and a secant modulus at a
strain of 0.1 (Esec). In these simulations, the true stress was
also determined following the procedure described in
Section 4.
Section 5.1 describes results for a fully flexible material.
The results for the two-phase materials, respectively
containing 20 and 30% LC phase, are discussed in Section
5.2. This analysis allows investigation of the effect of the
skin ratio and simultaneously the effect of the second phase
concentration on the properties. Although it would be too
extensive to represent the structures of all the simulated
CGMs, selected structures are shown in Fig. 3.
5.1. Effect of the skin-core ratio
For perspicuity sake, the behavior of single-region
materials, which are the limiting cases, shall be investigated
first. After that, the more complex case of three-region
models shall be addressed. The stress–strain curves for the
skin ratios of 0 (single-core) and 1 (single-skin) are shown
respectively in Figs. 4 and 5.
As expected, the skin and the core regions display
different behavior. The core material is characterized by
large-scale deformation developing along time due to chain
motion mechanisms, such as chain unfolding and chain
separation. The true stress levels are much higher than the
engineering stress, due to significant cross-section reduction
during deformation. Moreover, the reduction is not uniform
throughout the material, and is dependent on the local chain
geometry. The true stress has a higher slope than the
engineering stress, which indicates a progressive tendency
for the cross-section to decrease with increasing values of
the force. This is expected, since large-scale deformation in
the direction of force application is accompanied by a
decrease in size along the perpendicular directions.
In the skin material, higher values of the true stress are
observed compared to the engineering stress. However, in
this case, the two curves have a very similar shape. This is
due to the fact that in the skin material, all chains are
oriented with the direction of force application. Thus,
elongation is achieved initially by bond conformation
changes, which is accompanied by a decrease in the
cross-section. However, after all bonds have changed
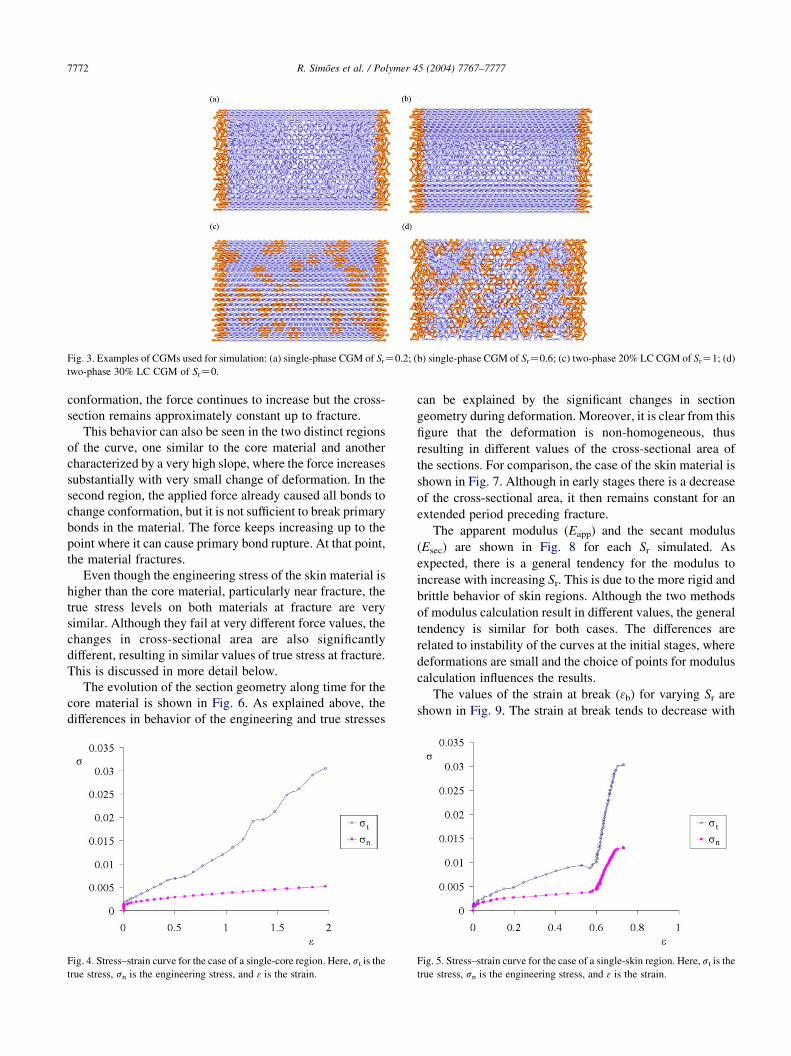
Fig. 3. Examples of CGMs used for simulation: (a) single-phase CGM of SrZ0.2; (b) single-phase CGM of SrZ0.6; (c) two-phase 20% LC CGM of SrZ1; (d)
two-phase 30% LC CGM of SrZ0.
R. Simoes et al. / Polymer 45 (2004) 7767–77777772
conformation, the force continues to increase but the cross-
section remains approximately constant up to fracture.
This behavior can also be seen in the two distinct regions
of the curve, one similar to the core material and another
characterized by a very high slope, where the force increases
substantially with very small change of deformation. In the
second region, the applied force already caused all bonds to
change conformation, but it is not sufficient to break primary
bonds in the material. The force keeps increasing up to the
point where it can cause primary bond rupture. At that point,
the material fractures.
Even though the engineering stress of the skin material is
higher than the core material, particularly near fracture, the
true stress levels on both materials at fracture are very
similar. Although they fail at very different force values, the
changes in cross-sectional area are also significantly
different, resulting in similar values of true stress at fracture.
This is discussed in more detail below.
The evolution of the section geometry along time for the
core material is shown in Fig. 6. As explained above, the
differences in behavior of the engineering and true stresses
Fig. 4. Stress–strain curve for the case of a single-core region. Here, st is the
true stress, sn is the engineering stress, and 3 is the strain.
can be explained by the significant changes in section
geometry during deformation. Moreover, it is clear from this
figure that the deformation is non-homogeneous, thus
resulting in different values of the cross-sectional area of
the sections. For comparison, the case of the skin material is
shown in Fig. 7. Although in early stages there is a decrease
of the cross-sectional area, it then remains constant for an
extended period preceding fracture.
The apparent modulus (Eapp) and the secant modulus
(Esec) are shown in Fig. 8 for each Sr simulated. As
expected, there is a general tendency for the modulus to
increase with increasing Sr. This is due to the more rigid and
brittle behavior of skin regions. Although the two methods
of modulus calculation result in different values, the general
tendency is similar for both cases. The differences are
related to instability of the curves at the initial stages, where
deformations are small and the choice of points for modulus
calculation influences the results.
The values of the strain at break (3b) for varying Sr are
shown in Fig. 9. The strain at break tends to decrease with
Fig. 5. Stress–strain curve for the case of a single-skin region. Here, st is the
true stress, sn is the engineering stress, and 3 is the strain.
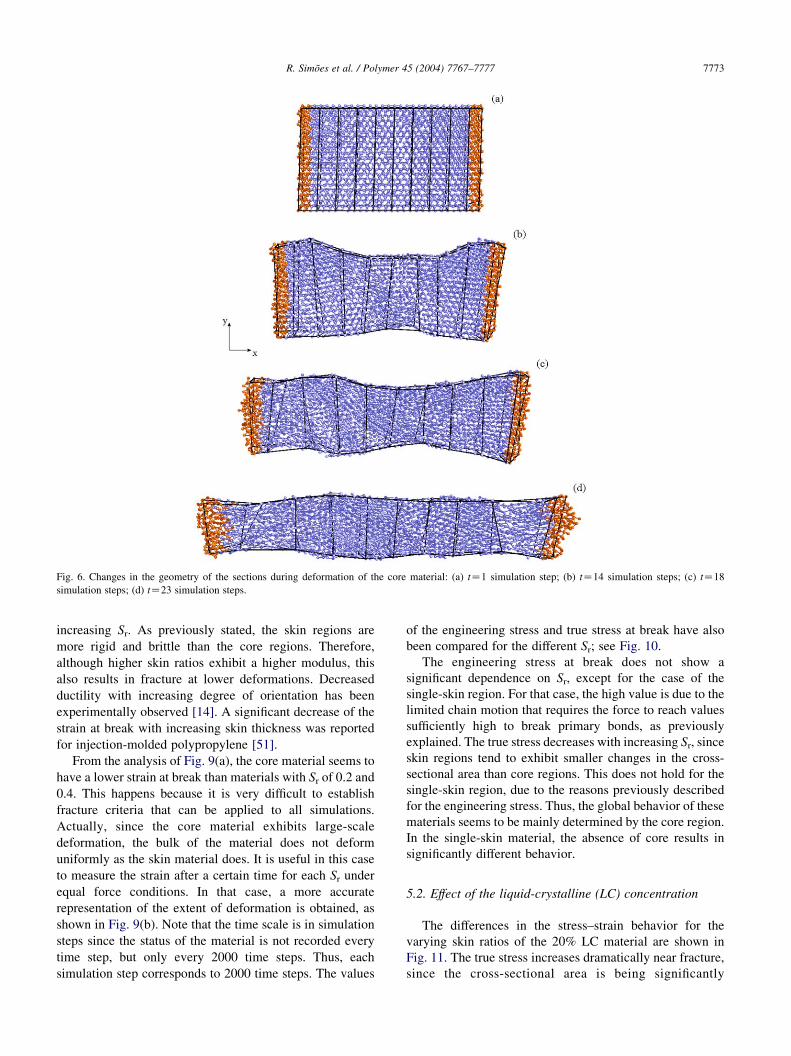
Fig. 6. Changes in the geometry of the sections during deformation of the core material: (a) tZ1 simulation step; (b) tZ14 simulation steps; (c) tZ18
simulation steps; (d) tZ23 simulation steps.
R. Simoes et al. / Polymer 45 (2004) 7767–7777 7773
increasing Sr. As previously stated, the skin regions are
more rigid and brittle than the core regions. Therefore,
although higher skin ratios exhibit a higher modulus, this
also results in fracture at lower deformations. Decreased
ductility with increasing degree of orientation has been
experimentally observed [14]. A significant decrease of the
strain at break with increasing skin thickness was reported
for injection-molded polypropylene [51].
From the analysis of Fig. 9(a), the core material seems to
have a lower strain at break than materials with Sr of 0.2 and
0.4. This happens because it is very difficult to establish
fracture criteria that can be applied to all simulations.
Actually, since the core material exhibits large-scale
deformation, the bulk of the material does not deform
uniformly as the skin material does. It is useful in this case
to measure the strain after a certain time for each Sr under
equal force conditions. In that case, a more accurate
representation of the extent of deformation is obtained, as
shown in Fig. 9(b). Note that the time scale is in simulation
steps since the status of the material is not recorded every
time step, but only every 2000 time steps. Thus, each
simulation step corresponds to 2000 time steps. The values
of the engineering stress and true stress at break have also
been compared for the different Sr; see Fig. 10.
The engineering stress at break does not show a
significant dependence on Sr, except for the case of the
single-skin region. For that case, the high value is due to the
limited chain motion that requires the force to reach values
sufficiently high to break primary bonds, as previously
explained. The true stress decreases with increasing Sr, since
skin regions tend to exhibit smaller changes in the cross-
sectional area than core regions. This does not hold for the
single-skin region, due to the reasons previously described
for the engineering stress. Thus, the global behavior of these
materials seems to be mainly determined by the core region.
In the single-skin material, the absence of core results in
significantly different behavior.
5.2. Effect of the liquid-crystalline (LC) concentration
The differences in the stress–strain behavior for the
varying skin ratios of the 20% LC material are shown in
Fig. 11. The true stress increases dramatically near fracture,
since the cross-sectional area is being significantly
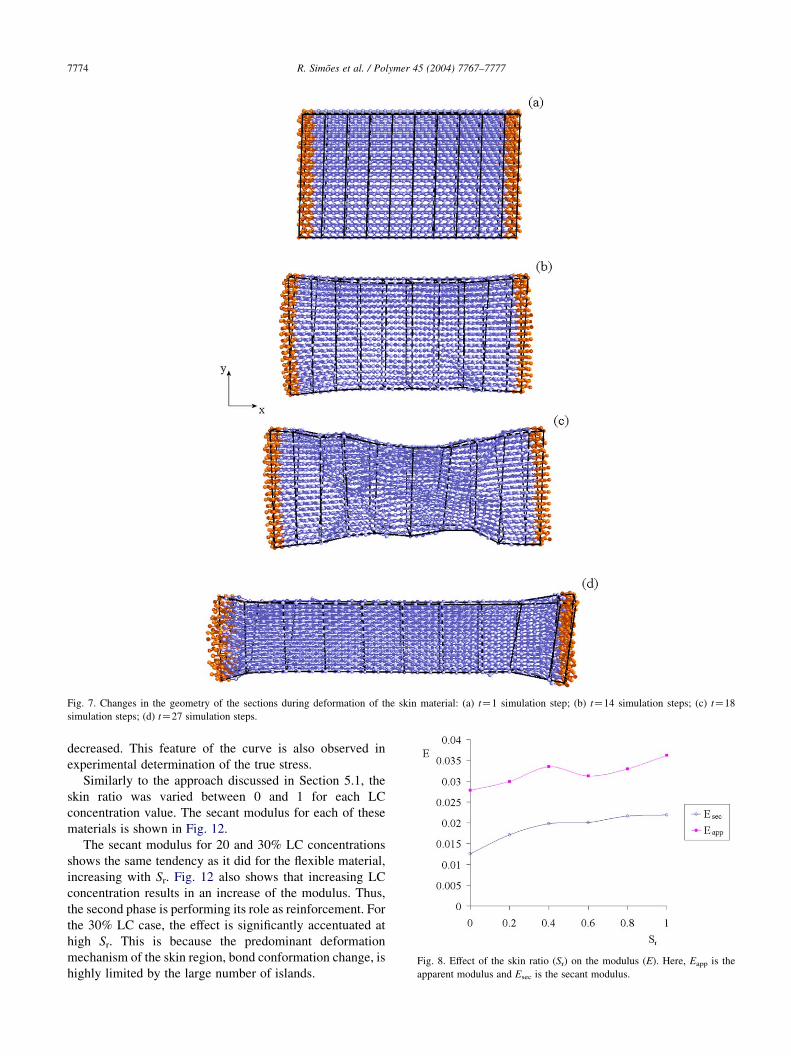
Fig. 7. Changes in the geometry of the sections during deformation of the skin material: (a) tZ1 simulation step; (b) tZ14 simulation steps; (c) tZ18
simulation steps; (d) tZ27 simulation steps.
Fig. 8. Effect of the skin ratio (Sr) on the modulus (E). Here, Eapp is the
apparent modulus and Esec is the secant modulus.
R. Simoes et al. / Polymer 45 (2004) 7767–77777774
decreased. This feature of the curve is also observed in
experimental determination of the true stress.
Similarly to the approach discussed in Section 5.1, the
skin ratio was varied between 0 and 1 for each LC
concentration value. The secant modulus for each of these
materials is shown in Fig. 12.
The secant modulus for 20 and 30% LC concentrations
shows the same tendency as it did for the flexible material,
increasing with Sr. Fig. 12 also shows that increasing LC
concentration results in an increase of the modulus. Thus,
the second phase is performing its role as reinforcement. For
the 30% LC case, the effect is significantly accentuated at
high Sr. This is because the predominant deformation
mechanism of the skin region, bond conformation change, is
highly limited by the large number of islands.
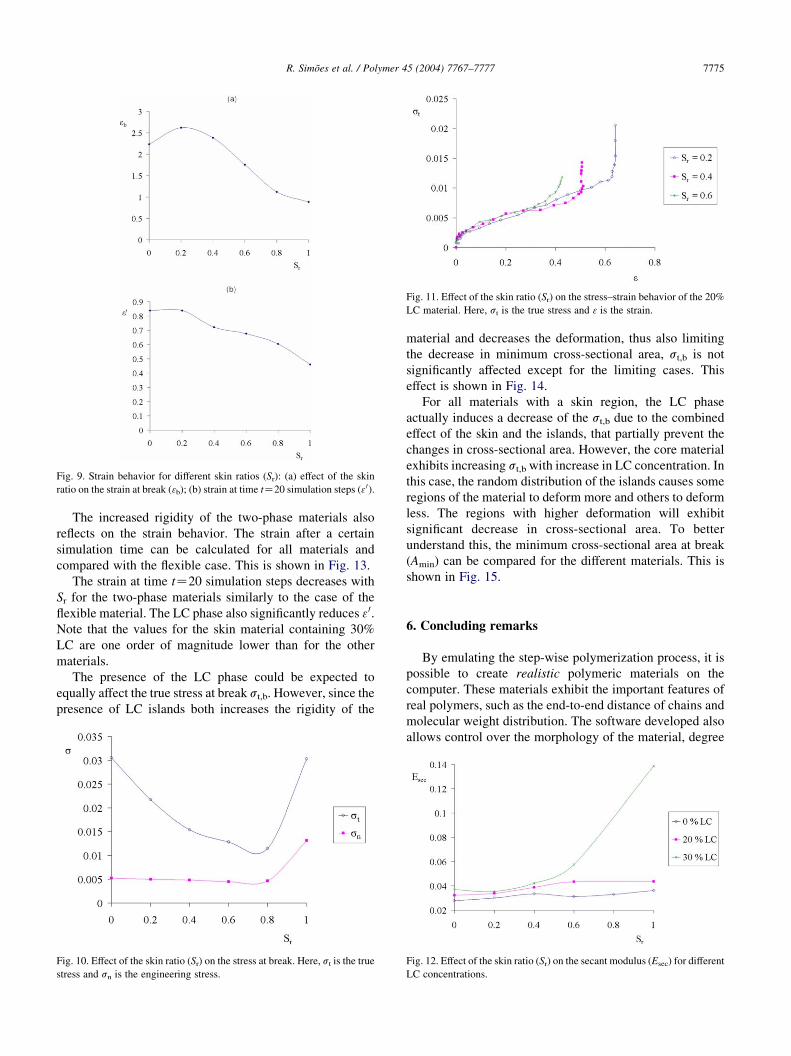
Fig. 9. Strain behavior for different skin ratios (Sr): (a) effect of the skin
ratio on the strain at break (3b); (b) strain at time tZ20 simulation steps (30).
Fig. 11. Effect of the skin ratio (Sr) on the stress–strain behavior of the 20%
LC material. Here, st is the true stress and 3 is the strain.
R. Simoes et al. / Polymer 45 (2004) 7767–7777 7775
The increased rigidity of the two-phase materials also
reflects on the strain behavior. The strain after a certain
simulation time can be calculated for all materials and
compared with the flexible case. This is shown in Fig. 13.
The strain at time tZ20 simulation steps decreases with
Sr for the two-phase materials similarly to the case of the
flexible material. The LC phase also significantly reduces 3 0.
Note that the values for the skin material containing 30%
LC are one order of magnitude lower than for the other
materials.
The presence of the LC phase could be expected to
equally affect the true stress at break st,b. However, since the
presence of LC islands both increases the rigidity of the
Fig. 10. Effect of the skin ratio (Sr) on the stress at break. Here, st is the true
stress and sn is the engineering stress.
material and decreases the deformation, thus also limiting
the decrease in minimum cross-sectional area, st,b is not
significantly affected except for the limiting cases. This
effect is shown in Fig. 14.
For all materials with a skin region, the LC phase
actually induces a decrease of the st,b due to the combined
effect of the skin and the islands, that partially prevent the
changes in cross-sectional area. However, the core material
exhibits increasing st,b with increase in LC concentration. In
this case, the random distribution of the islands causes some
regions of the material to deform more and others to deform
less. The regions with higher deformation will exhibit
significant decrease in cross-sectional area. To better
understand this, the minimum cross-sectional area at break
(Amin) can be compared for the different materials. This is
shown in Fig. 15.
6. Concluding remarks
By emulating the step-wise polymerization process, it is
possible to create realistic polymeric materials on the
computer. These materials exhibit the important features of
real polymers, such as the end-to-end distance of chains and
molecular weight distribution. The software developed also
allows control over the morphology of the material, degree
Fig. 12. Effect of the skin ratio (Sr) on the secant modulus (Esec) for different
LC concentrations.
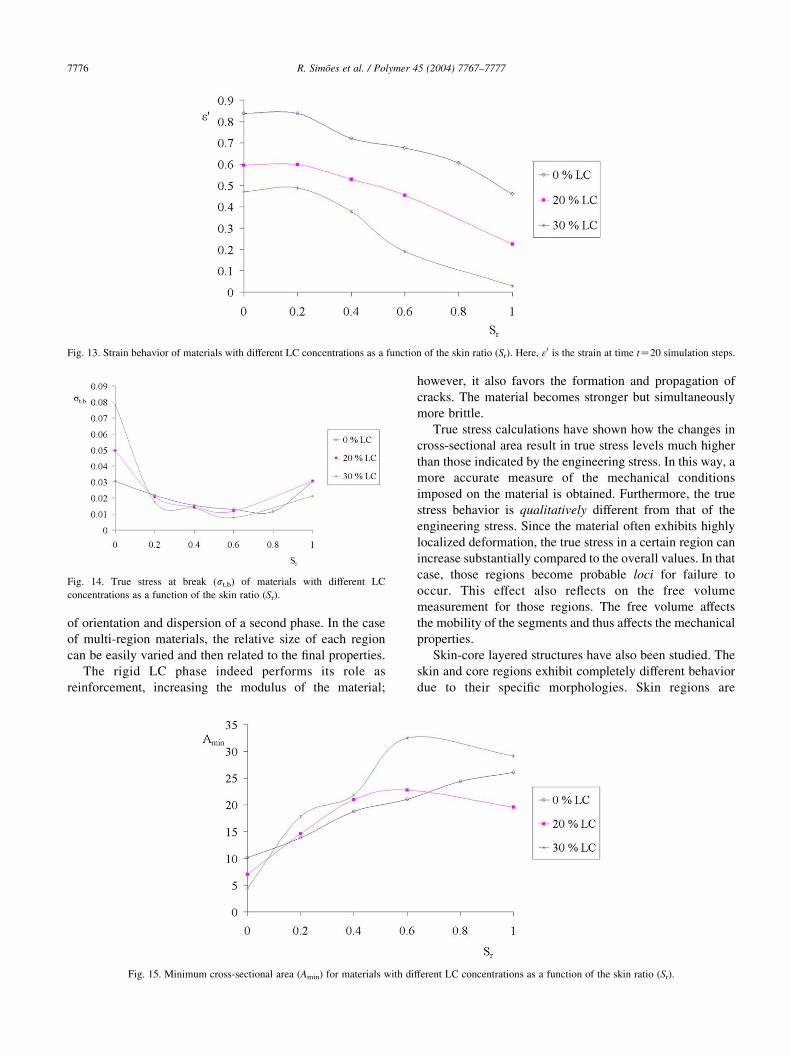
Fig. 13. Strain behavior of materials with different LC concentrations as a function of the skin ratio (Sr). Here, 3 0 is the strain at time tZ20 simulation steps.
Fig. 14. True stress at break (st,b) of materials with different LC
concentrations as a function of the skin ratio (Sr).
R. Simoes et al. / Polymer 45 (2004) 7767–77777776
of orientation and dispersion of a second phase. In the case
of multi-region materials, the relative size of each region
can be easily varied and then related to the final properties.
The rigid LC phase indeed performs its role as
reinforcement, increasing the modulus of the material;
Fig. 15. Minimum cross-sectional area (Amin) for materials with di
however, it also favors the formation and propagation of
cracks. The material becomes stronger but simultaneously
more brittle.
True stress calculations have shown how the changes in
cross-sectional area result in true stress levels much higher
than those indicated by the engineering stress. In this way, a
more accurate measure of the mechanical conditions
imposed on the material is obtained. Furthermore, the true
stress behavior is qualitatively different from that of the
engineering stress. Since the material often exhibits highly
localized deformation, the true stress in a certain region can
increase substantially compared to the overall values. In that
case, those regions become probable loci for failure to
occur. This effect also reflects on the free volume
measurement for those regions. The free volume affects
the mobility of the segments and thus affects the mechanical
properties.
Skin-core layered structures have also been studied. The
skin and core regions exhibit completely different behavior
due to their specific morphologies. Skin regions are
fferent LC concentrations as a function of the skin ratio (Sr).
R. Simoes et al. / Polymer 45 (2004) 7767–7777 7777
predominantly brittle and break at relatively low strain
values, while core regions are predominantly ductile and
have high values of the strain at break. However, both
regions were found to fail at similar true stress levels. The
skin-core ratio was shown to influence the mechanical
properties even if the orientation of each region is kept
constant.
In future simulations, a 5-region model can be used,
instead of the simplified 3-region model employed thus far.
However, in order to expand the model, it is required to
experimentally delaminate and analyze each region indivi-
dually so that the model accurately represents the real
structure.
The possibility of predicting the mechanical properties
from simulation results is encouraging, but further work is
required before quantitative relationships can be estab-
lished. Although the simulations have provided pertinent
information regarding phenomena taking place at the
mesoscale, the jump to macroscopic properties and behavior
requires additional work.
Acknowledgements
Support for this research has been provided by the
Fundacao para a Ciencia e a Tecnologia, 38 Quadro
Comunitario de Apoio, Lisbon, and also by the Robert A.
Welch Foundation, Houston (Grant # B-1203).
References
[1] Brostow W, Donahue III M, Karashin CE, Simoes R. Mater Res
Innovations 2001;4:75.
[2] Brostow W, Cunha AM, Quintanilla J, Simoes R. Macromol Theory
Simul 2002;11:308.
[3] Brostow W, Hinze JA, Simoes R. J Mater Res 2004;19:851.
[4] Samulski ET. Faraday Disc 1985;79:7.
[5] Brostow W. Polymer 1990;31:979.
[6] Brostow W. In: Mark JE, editor. Physical properties of polymers
handbook. Woodbury, NY: American Institute of Physics Press; 1996.
Chapter 33.
[7] Hess M, Lopez BL. In: Brostow W, editor. Mechanical and
thermophysical properties of polymer liquid crystals. London:
Chapman & Hall; 1998. Chapter 9.
[8] Brostow W, Hibner K, Walasek J. J Chem Phys 1998;108:6484.
[9] Brostow W, Walasek J. J Chem Phys 2001;114:2466.
[10] Brostow W, D’Souza NA, Kubat J, Maksimov R. J Chem Phys 1999;
110:9706.
[11] Brostow W. Mater Res Innovations 2000;3:347.
[12] Akinay AE, Brostow W. Polymer 2001;42:4527.
[13] Tadmor Z, Gogos GG. Principles of polymer processing. New York:
Wiley; 1979.
[14] Cunha AM, Pouzada AS, Crawford RJ. Plast Rubber Compos Process
Appl 1992;18:79.
[15] Fujiyama M. In: Karger-Koscis J, editor. Polypropylene structure,
blends and composites: structure and morphology, vol. 1. London:
Chapman & Hall; 1995. Chapter 6.
[16] Phillips R, Herbert G, News J, Wolkowicz M. Polym Eng Sci 1994;
34:1731.
[17] Viana JC, Cunha AM, Billon N. Int Polym 1997;43:159.
[18] Brito AM, Cunha AM, Pouzada AS, Crawford RJ. Int Polym Proc VI
1991;4:370.
[19] Zipper P, Abuja PM, Janosi A, Wrentschur E, Geymayer W, Ingolic E,
et al. Int Polym Proc X 1995;4:341.
[20] Flory PJ. Statistical mechanics of chain molecules. New York: Wiley;
1969.
[21] van Gunsteren WF. In: Truhlar DG, editor. Mathematical frontiers in
computational chemical physics. New York: Springer; 1988.
[22] Fossey S. In: Brostow W, editor. Performance of plastics. Munich-
Cincinnati: Hanser; 2000. p. 63.
[23] Ayyagari C, Bedrov D, Smith GD. Macromolecules 2000;33:6194.
[24] Gerde E, Marder M. Nature 2001;413:285.
[25] Karayiannis NC, Mavrantzas VG, Theodorou DN. Chem Eng Sci
2001;56:2789.
[26] Makrodimitris K, Papadopoulos GK, Theodorou DN. J Phys Chem B
2001;105:777.
[27] Mavrantzas VG, Theodorou DN. Macromol Theory Simul 2000;9:
500.
[28] Harmandaris VA, Mavrantzas VG, Theodorou DN. Macromolecules
2000;33:8062.
[29] Abraham FF. Phys Rev Lett 1980;44:463.
[30] Abraham FF, Rudge WE, Auerbach DJ, Koch SW. Phys Rev Lett
1984;52:445.
[31] Andersen HC. J Chem Phys 1980;72:2384.
[32] Banaszak M. TASK Quart 2001;5:17.
[33] Muller-Plathe F, Rogers SC, Van Gunsteren WF. Macromolecules
1992;25:6722.
[34] Fritz L, Hofmann D. Polymer 1997;38:1035.
[35] Termonia Y. Encyclopedia of polymer science and technology, 3rd
ed. New York: Wiley; 2002.
[36] Termonia Y, Smith P. Macromolecules 1987;20:835.
[37] Termonia Y, Smith P. Macromolecules 1988;21:2184.
[38] Termonia Y. Macromolecules 1994;27:7378.
[39] Karger-Kocsis J. In: Cunha AM, editor. Structure development in
processing for polymer property enhancement. Brussels: North
Atlantic Treaty Organization; 1999.
[40] Santana OO, Maspoch ML, Martinez AB. Polym Bull 1999;39:511.
[41] Li Y, Ann H, Binienda WK. Int J Solids Struct 1998;11:981.
[42] Shbeeb N, Binienda WK, Kreider K. Int J Fract 2000;104:23.
[43] Brostow W, Kubat J. Phys Rev B 1993;47:7659.
[44] Blonski S, Brostow W, Kubat J. Phys Rev B 1994;49:6494.
[45] Brostow W, Kubat J, Kubat MJ. Mech Compos Mater 1995;31:432.
[46] Mom V. J Comput Chem 1981;2:446.
[47] Brostow W, Cunha AM, Simoes R. Mater Res Innovations 2003;7:19.
[48] Brostow W, Dziemianowicz TS, Romanski R, Werber W. Polym Eng
Sci 1988;28:785.
[49] Brostow W, Hess M. Mater Res Soc Symp 1992;255:57.
[50] Brostow W, Cunha AM, Viana JC, Simoes R. Proc Ann Tech Conf
Soc Plast Engrs 2003;61:2957.
[51] Plebmann K, Mendes G, Cremer M, Fenske W, Feser W, Netze C,
Offergeld H, Potsch G, Stabrey H. Kunststoffe 1990;80:200.
Related Documents