ORIGINAL ARTICLE Morphological distance and inter-nest distance account for intra-specific prey overlap in digger wasps (Hymenoptera: Crabronidae) Carlo Polidori • Yolanda Ballesteros • Davide Santoro • Jose ´ Tormos • Josep D. Ası ´s Received: 3 January 2012 / Accepted: 17 April 2012 / Published online: 4 May 2012 Ó The Society of Population Ecology and Springer 2012 Abstract Although inter-individual diet variation is common in predatory wasp populations, the factors accounting for such variation are still largely unknown. Here, we asked if paired diet dissimilarity in three species of digger wasps correlates with morphological distance and inter-nest distance, two factors previously linked to diet partitioning in vertebrates. Results sharply differed among species and generations. All sampled populations showed significant inter-individual diet variation for prey taxa, but only in half of the cases for prey size. In one generation of two species [Bembix zonata Klug and Stizus continuus (Klug)], similar-sized wasps had similar prey taxonomic spectra (and for S. continuus also similar prey size spectra), a phenomenon which probably reduces intra-specific competition. In addition, B. zonata females nesting closer to each other had more similar prey taxonomic spectra, suggesting that distant females probably hunt on different patches that harbour different prey species. For the females of a further species (Bembix merceti Parker), pairwise size difference and inter-nest distance did not affect prey dis- similarity. Both morphological distance and inter-nest distance are potentially important in shaping the overlap of individual resource use in wasps, though probably only in certain conditions such as a highly clumped distribution of nests and size-related constraints on prey selection. Keywords Diet dissimilarity Intra-specific competition Nest distribution Prey size Wasp size Introduction One of the most important findings of the recently renewed interest in intra-specific trait variation (see Bolnick et al. 2011) is that individual diet specialization is extremely common in predatory animal populations from disparate taxa such as amphibians, mammals, fishes, and insects (e.g., Svanba ¨ck and Persson 2004; Bolnick et al. 2007; Quevedo et al. 2009; Polidori et al. 2011). The reasons why such individual specialization is promoted and maintained were also recently investigated, and we now know that the degree of intra-specific niche overlap may for example be affected by foraging experience (Rendell and Whitehead 2001), sexual dimorphism (Martins et al. 2008), body size (Bolnick and Paull 2009), cognitive constraints that limit the use of diverse sets of resources (Bolnick et al. 2003) or inter- and intra-specific competition (Bolnick 2001; Svan- ba ¨ck and Bolnick 2007; Bolnick et al. 2010). In practice all of these studies were carried out on vertebrate predators, so that factors accounting for diet overlap between individuals are still not very clear for other taxa. This is the case for solitary hunting wasps (Hymenoptera: Aculeata). In fact, to date, studies on diet specialization of solitary hunting wasps have mostly been done at the species level, and only rarely at the individual level. For example, we know that in wasp guilds, mean pairwise overlap in microhabitat utili- zation can be significantly lower than predicted by null C. Polidori (&) Departamento de Biodiversidad y Biologı ´a Evolutiva, Museo Nacional de Ciencias Naturales (CSIC), C/Jose ´ Gutie ´rrez Abascal 2, 28006 Madrid, Spain e-mail: [email protected] Y. Ballesteros J. Tormos J. D. Ası ´s Unidad de Zoologı ´a, Facultad de Biologı ´a, Universidad de Salamanca, 37071 Salamanca, Spain D. Santoro School of Biological Sciences, Victoria University of Wellington, New Kirk Building, 6012 Wellington, New Zealand 123 Popul Ecol (2012) 54:443–454 DOI 10.1007/s10144-012-0322-9

Welcome message from author
This document is posted to help you gain knowledge. Please leave a comment to let me know what you think about it! Share it to your friends and learn new things together.
Transcript

ORIGINAL ARTICLE
Morphological distance and inter-nest distance accountfor intra-specific prey overlap in digger wasps(Hymenoptera: Crabronidae)
Carlo Polidori • Yolanda Ballesteros •
Davide Santoro • Jose Tormos • Josep D. Asıs
Received: 3 January 2012 / Accepted: 17 April 2012 / Published online: 4 May 2012
� The Society of Population Ecology and Springer 2012
Abstract Although inter-individual diet variation is
common in predatory wasp populations, the factors
accounting for such variation are still largely unknown.
Here, we asked if paired diet dissimilarity in three species
of digger wasps correlates with morphological distance and
inter-nest distance, two factors previously linked to diet
partitioning in vertebrates. Results sharply differed among
species and generations. All sampled populations showed
significant inter-individual diet variation for prey taxa, but
only in half of the cases for prey size. In one generation of
two species [Bembix zonata Klug and Stizus continuus
(Klug)], similar-sized wasps had similar prey taxonomic
spectra (and for S. continuus also similar prey size spectra),
a phenomenon which probably reduces intra-specific
competition. In addition, B. zonata females nesting closer
to each other had more similar prey taxonomic spectra,
suggesting that distant females probably hunt on different
patches that harbour different prey species. For the females
of a further species (Bembix merceti Parker), pairwise size
difference and inter-nest distance did not affect prey dis-
similarity. Both morphological distance and inter-nest
distance are potentially important in shaping the overlap of
individual resource use in wasps, though probably only in
certain conditions such as a highly clumped distribution of
nests and size-related constraints on prey selection.
Keywords Diet dissimilarity � Intra-specific competition �Nest distribution � Prey size � Wasp size
Introduction
One of the most important findings of the recently renewed
interest in intra-specific trait variation (see Bolnick et al.
2011) is that individual diet specialization is extremely
common in predatory animal populations from disparate
taxa such as amphibians, mammals, fishes, and insects
(e.g., Svanback and Persson 2004; Bolnick et al. 2007;
Quevedo et al. 2009; Polidori et al. 2011). The reasons why
such individual specialization is promoted and maintained
were also recently investigated, and we now know that the
degree of intra-specific niche overlap may for example be
affected by foraging experience (Rendell and Whitehead
2001), sexual dimorphism (Martins et al. 2008), body size
(Bolnick and Paull 2009), cognitive constraints that limit
the use of diverse sets of resources (Bolnick et al. 2003) or
inter- and intra-specific competition (Bolnick 2001; Svan-
back and Bolnick 2007; Bolnick et al. 2010). In practice all
of these studies were carried out on vertebrate predators, so
that factors accounting for diet overlap between individuals
are still not very clear for other taxa. This is the case for
solitary hunting wasps (Hymenoptera: Aculeata). In fact, to
date, studies on diet specialization of solitary hunting
wasps have mostly been done at the species level, and only
rarely at the individual level. For example, we know that in
wasp guilds, mean pairwise overlap in microhabitat utili-
zation can be significantly lower than predicted by null
C. Polidori (&)
Departamento de Biodiversidad y Biologıa Evolutiva,
Museo Nacional de Ciencias Naturales (CSIC),
C/Jose Gutierrez Abascal 2, 28006 Madrid, Spain
e-mail: [email protected]
Y. Ballesteros � J. Tormos � J. D. Asıs
Unidad de Zoologıa, Facultad de Biologıa,
Universidad de Salamanca, 37071 Salamanca, Spain
D. Santoro
School of Biological Sciences, Victoria
University of Wellington, New Kirk Building,
6012 Wellington, New Zealand
123
Popul Ecol (2012) 54:443–454
DOI 10.1007/s10144-012-0322-9

models (Field 1992), but we still have only suggestions that
this pattern applies at the individual level (Polidori et al.
2005). Sympatric Philanthus digger wasp species studied at
a large North American nesting site showed limited dietary
overlap (O’Neill and Evans 1982), and the same trend was
found between females in a single population of a Philanthus
species (Stubblefield et al. 1993). In both cases, however, the
ultimate causes of this resource partitioning were not elu-
cidated. Competition could account for this pattern, as
observed in parasitoid wasps (Shimada 1985). We also
know, both at the species and individual level, that larger
foraging species/females are generally able to select larger
prey, though it is still unclear if this wasp-prey size positive
relationship is also reflected in a significant prey taxa or prey
size segregation, in particular within populations (Field
1992; Polidori et al. 2005, 2009, 2010; Karsai et al. 2006;
Coelho 2011). For instance, although theoretical consider-
ations may predict that, in comparison with smaller preda-
tors, larger ones could be favoured in subduing, handling and
carrying a wider range of prey to the nest, a recent review and
re-analysis of published data largely rejected this hypothesis,
with only three out of ten populations showing smaller
individuals significantly more or less specialized than larger
ones (Polidori et al. 2011). Other factors, such as possible
trade-offs probably related to learning in searching and/or
handling prey, have also been suggested as an explanation
for individual specialization in solitary wasps, but without
supporting evidences (Araujo and Gonzaga 2007).
There is thus a need to investigate in greater depth the
role of selected factors in shaping individual resource
overlap in wasp populations. In this study, we partially fill
this gap by testing if two particular factors, namely dis-
tance between individuals’ nests and morphological dis-
tance (size difference) between individuals, account for
pairwise diet overlap in three species of solitary predatory
digger wasps (Hymenoptera: Crabronidae). In particular,
we hypothesize that: (1) morphologically divergent indi-
viduals share few if any prey (Roughgarden 1972;
Ackermann and Doebeli 2004), because an individual
consumer’s phenotype is likely to determine the set of
resources that it is able to use (Roughgarden 1972;
Ackermann and Doebeli 2004; Bolnick and Paull 2009);
and (2) close-nesting individuals forage on similar types of
prey, because, as occurs in some social wasps (Nieh 2009),
they may tend to travel to and feed or hunt prey in locations
where they can see conspecifics preying or because of local
enhancement (the facilitation of learning resulting from an
individual’s attention being drawn to a locale and then
reinforced with a reward, e.g., Brown 1986), or because
close-nesting wasps may have access to the same closer
hunting patch, and patches differ in prey types.
Digger wasps, i.e., aculeate hymenopterans which dig
their nests in the ground and fill them up with paralysed
arthropods in order to feed the offspring reared in the nest
(Evans and O’Neill 2007), seem to be an adequate model to
test for the effect of these two factors on diet partitioning:
firstly, in any given population, body size variance among
individuals is often great enough to appreciate size-related
fitness components, including provisioning (O’Neill 2001;
Evans and O’Neill 2007; Coelho 2011); secondly, the
variance in the distance between pairs of nests is often high
as a result of the common spatially clumped distribution of
nests (e.g., Polidori et al. 2006, 2008); and thirdly, digger
wasps nest in restricted areas and are central-place forag-
ers, allowing researchers to monitor with ease the resource
use of many individuals (e.g., Polidori et al. 2010; Santoro
et al. 2011).
Methods
Studied organisms
Bembix merceti Parker and Bembix zonata Klug are
solitary Diptera-hunting wasps restricted to Southern
Europe or even to the Iberian Peninsula alone (the former
species). The nests of both species are unicellular and
wasps nest in aggregations (Asıs et al. 2004). Despite
many fly families being reported among prey of
B. merceti (Evans and O’Neill 2007), recent studies have
shown that populations may actually be selective in prey
use, with wasps positively selecting families of flies with
greater mean weights even though they are less abundant
(Asıs et al. 2011), and that individual wasps significantly
segregate their diets (individual specialization) (Polidori
et al. 2011). On the other hand, only very limited prey
sampling has been carried out for B. zonata (Asıs et al.
2004), so that details on prey use in this species are
unknown.
Stizus continuus (Klug) is a Mediterranean solitary wasp
whose populations are bivoltine in Southern Europe;
females dig multicellular nests in large aggregations and
hunt for grasshoppers, mainly of the family Acrididae, to
feed their immature offspring (Polidori et al. 2008, 2009).
As for B. merceti, recent studies on S. continuus clearly
showed a selective predation at population-level, females
hunting mainly grasshopper species living on bushes
(though they are less abundant), and high specialization at
individual level (Santoro et al. 2011).
Mapping of nests, wasp size and prey sampling
Two study areas were chosen to carry out the field work,
performed during July and August 2007, 2009 and 2010
(depending on the species, see Table 1). The nest aggre-
gations of B. merceti and B. zonata were located in the
444 Popul Ecol (2012) 54:443–454
123
neighbourhood of Almarail (province of Soria, Spain),
where there is a predominance of cereal crops. The nest
aggregation of S. continuus was located at ‘La Mallada
Larga’ of ‘Dehesa del Saler’ (province of Valencia, Spain),
which is a coastal salt marsh with damp sandy soil. Details
of the two study areas are reported in Asıs et al. (2011) and
Polidori et al. (2008) respectively.
Within each nest aggregation, wasp females and their
associated nests were marked to allow individual identifi-
cation. Each wasp was marked with a unique combination
of two or three colours on the thorax, using marking pens
with fast drying inks (water-based paint), a well-estab-
lished technique in wasp behavioural studies (e.g., Polidori
et al. 2008; Asıs et al. 2011). Nests were individually
marked with a differently coloured stick located close to
the entrance, and their coordinates recorded in a Cartesian
system (see Polidori et al. 2008). We then obtained for each
nest (i.e., wasp) the distances to all the other nests (wasps)
(ND) using Pitagora’s formula. Marked wasps were
weighed in the field to the nearest 1 mg with an electronic
portable balance. The most limiting factor while hunting
and carrying a prey item to the nest is its size (relative to
wasp size) (Coelho 2011), so we did not consider addi-
tional morphological characters.
To obtain prey, marked females returning to the nest
after a foraging trip were re-captured and, once deprived of
the prey, released. Prey were then preserved in 95 % eth-
anol or killed by ether. To reduce problems of small
samples, at least four prey items were collected from each
marked wasp (Santoro et al. 2011) (Table 1). Prey were
weighed to the nearest 1 mg with an electronic balance,
and identified at the species level or separated into mor-
phospecies with the help of specialists (see Acknowl-
edgements) and by comparison with previous collections
(Asıs et al. 2011).
Measures of individual diet specialization
Individual diet specialization was calculated as the pro-
portional similarity between the diet of the individual i and
the diet of the generation (intra-specific overlap in prey
taxa) (Bolnick et al. 2002), i.e.,
PSi ¼ 1� 0:5X
j
pij � qj
����
where pij is the proportion of the jth prey species in indi-
vidual i’s diet, and qj is proportion of the jth prey species in
the whole species/generation’s prey spectrum.
The mean value of PSi (IS) expresses the average indi-
vidual specialization for a species/generation. IS varies
from near 0 (maximum individual specialization) to 1 (no
individual specialization). However, we used the more
intuitive V (i.e., 1 - IS), so that higher values indicated
higher individual specialization (see Bolnick et al. 2007).
To measure individual specialization for prey weight we
used Roughgarden’s Index (R’s I) (Roughgarden 1974) for
continuous data (Bolnick et al. 2002). The index is based
on the within-individual component (WIC) and the
between-individual component (BIC) of the total niche
width (TNW), i.e.,
R0sI ¼ WIC
TNW¼
E Var xij ij� �� �
VarðxijÞ
where xij = weight of the jth prey item in individual i’s
diet. Also, this index decreases with specialization, so we
used the more intuitive W (i.e., 1 - R’sI) (higher values
indicate higher individual specialization).
The indices of individual specialization (PSi and R’s I)
were calculated with the IndSpec1 program (Bolnick et al.
2002). IndSpec1 uses a non-parametric Monte Carlo pro-
cedure to generate replicate null diet matrices drawn from
the population distribution, from which P values can be
computed (Bolnick et al. 2002). Ten thousand replicates in
Monte Carlo bootstrap simulations were performed.
Measures of pairwise diet dissimilarity
We performed a series of Pearson correlation tests (for
n [ 10; correlation coefficient r) or Spearman correlation
tests (for n \ 10; correlation coefficient q) to test if larger
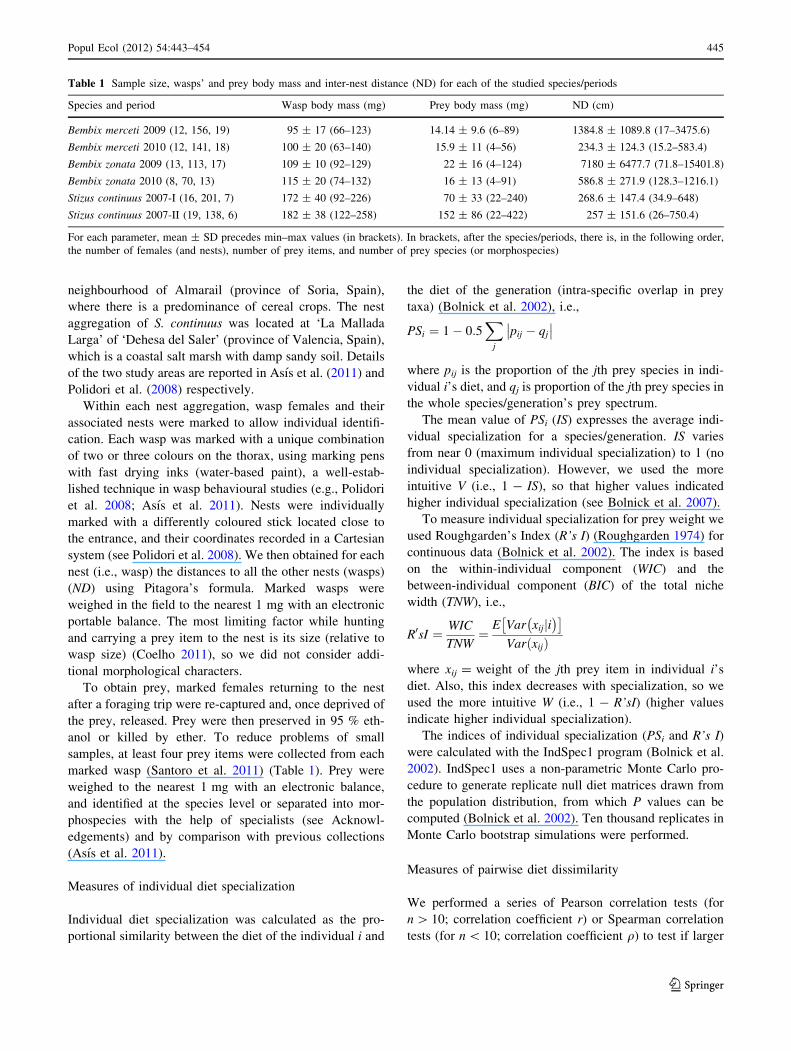
Table 1 Sample size, wasps’ and prey body mass and inter-nest distance (ND) for each of the studied species/periods
Species and period Wasp body mass (mg) Prey body mass (mg) ND (cm)
Bembix merceti 2009 (12, 156, 19) 95 ± 17 (66–123) 14.14 ± 9.6 (6–89) 1384.8 ± 1089.8 (17–3475.6)
Bembix merceti 2010 (12, 141, 18) 100 ± 20 (63–140) 15.9 ± 11 (4–56) 234.3 ± 124.3 (15.2–583.4)
Bembix zonata 2009 (13, 113, 17) 109 ± 10 (92–129) 22 ± 16 (4–124) 7180 ± 6477.7 (71.8–15401.8)
Bembix zonata 2010 (8, 70, 13) 115 ± 20 (74–132) 16 ± 13 (4–91) 586.8 ± 271.9 (128.3–1216.1)
Stizus continuus 2007-I (16, 201, 7) 172 ± 40 (92–226) 70 ± 33 (22–240) 268.6 ± 147.4 (34.9–648)
Stizus continuus 2007-II (19, 138, 6) 182 ± 38 (122–258) 152 ± 86 (22–422) 257 ± 151.6 (26–750.4)
For each parameter, mean ± SD precedes min–max values (in brackets). In brackets, after the species/periods, there is, in the following order,
the number of females (and nests), number of prey items, and number of prey species (or morphospecies)
Popul Ecol (2012) 54:443–454 445
123

wasps hunt for larger prey, using the ln-transformed data to
meet normality assumptions.
We calculated the pairwise taxonomic diet dissimilarity
(the complement of the diet similarity PS; Bolnick and
Paull 2009) between each pair of individuals i and j as:
PDSij ¼ 1�Xn
k¼1
minðpik; pjkÞ
where pik and pjk are the proportions of the kth prey type in
individual i’s and j’s diet, respectively (Ingram et al. 2011).
PDSij ranges from zero, when individuals consume the
same prey in identical proportions, up to 1, when the
individuals share no prey taxa in common. The diet simi-
larity PSij was calculated with IndSpec1, which also pro-
vided a matrix of diet similarity, i.e., a matrix including all
the pairwise PSij values between individuals; we then used
the complementary values PDSij to build the dissimilarity
matrix (PDS matrix). The mean value of PDSij across all
pairs of individuals (ET) represents the overall level of prey
taxa variation within the population (Ingram et al. 2011).
We calculated the pairwise prey size dissimilarity
(SDSij) between each pair of individuals i and j with the
following formula that we developed for the present study:
SDSij ¼
ffiffiffiffiffiffiffiffiffiffiffiffiffiffiffiffiffiffiffiffiffiffiffiffiffiffiffiffiffiffiffiffiffiffiffiffiffiffiffiffiffiffiffiffiffiffiffiffiffiffiffiffiffiffiffiffiffiffiffiffiffiffiPmi � Pmj
� �þ Pcvi � Pcvj
� �
Pmi þ Pmj
����
����
s
where Pm is the mean prey size of the individual and Pcv is
the coefficient of variation (SD/mean) in prey size of the
individual. The index ranges from 0 (completely over-
lapped prey size) to &1 (extremely divergent prey size);
note that the index takes into account both the size dif-
ference and the difference in the relative variance in prey
size, so that, if the mean prey size is exactly the same for
the two individuals, SDSij increases with increasing dif-
ference in relative variance. We then built the dissimilarity
matrix (SDS matrix). Note also that, because this index is
based on a continuous variable (e.g., a linear measure or a
mass), the upper extreme never reaches 1, but becomes
asymptotic to 1 above a certain (very high) difference in
mean prey size between the two individuals (SDSij is[0.99
when the ratio of the larger mean to the smaller mean is
[100). The mean value of SDSij across all pairs of indi-
viduals (ES) represents the overall level of prey size vari-
ation within the population.
We tested for differences in PDSij, SDSij and ND distri-
butions between the two generations for each population
with a two-sample Kolgomorov–Smirnov test. We tested
for differences in wasp mass and prey mass between gen-
erations with an unpaired Student’s t test, applied to the ln-
transformed data to meet normality assumptions. An
Aspin–Welch test was used instead of the Student’s t test in
the case of non-homogeneity of variance (significant F test).
Correlating pairwise wasp trait differences with prey
dissimilarity measures
Because prey taxonomic overlap and prey size overlap can
be inter-correlated, we first plotted the SDS matrix with the
PDS matrix. A positive correlation between the SDS matrix
and the PDS matrix would suggest that prey species differ
in size enough to allow taxonomic and size differences to
be highly related, i.e., that wasps hunting for more diverse
prey species actually also hunted for prey with more var-
iable size. We tested for a significant positive or negative
slope of this relationship with a two-tailed Mantel test,
whose statistical significance was assessed by 10000 rep-
licate permutations (Bolnick and Paull 2009).
From the body mass values of the individual wasps, we built
a matrix based on the absolute pairwise difference of body
mass between females (wasp_MASS matrix). To obtain a
value between 0 and 1, as for PDS and SDS, we calculated such
paired size differences as massi �massj
�� ���maxðmassi;jÞ, so
that the difference is expressed as a proportional mass increase
of the larger wasp relative to the smaller one. If body size
difference affects the level of prey (taxa and/or size) dissimi-
larity, the wasp_MASS matrix and the PDS matrix and/or the
SDS matrix would be correlated (Mantel test).
We built a matrix with the distances between each nest
and all the others (ND) (NEST matrix). If pairwise inter-
nest distance explains the degree of prey taxa dissimilarity,
the NEST matrix and the PDS matrix would be correlated.
These correlations were also tested with a Mantel test. Note
that we did not analyse the relationship between inter-nest
distance and SDS, because there is no reason to expect
wasps to be partitioning their prey size in relation to nest
distance to conspecifics.
Results
Wasp traits
The populations studied varied considerably in body mass
(weight) (Table 1). Within the studied cases, S. continuus
females, B. merceti females in 2010 and B. zonata females in
2010 appeared to be more variable in size (coefficient of
variation approximately 0.2) than B. merceti in 2009 and
B. zonata in 2009 (coefficient of variation approximately
0.07) (Table 1). Wasp body mass did not differ between gene-
rations in any species (B. merceti: F = 1.38, P = 0.29, t =
-0.55, df = 22, P = 0.58; B. zonata: F = 4.8, P = 0.02,
Aspin–Welch’s t = -0.67, df = 8.82, P = 0.51; S. con-
tinuus: F = 1.54, P = 0.18, t = -0.79, df = 33, P = 0.43).
The populations studied varied considerably in mean
nest distance (ND) (Table 1). Bembix zonata in 2009 was
446 Popul Ecol (2012) 54:443–454
123

the population which nested in the largest area, and thus the
distance between its nests had the widest range, with nests
being approximately 40 cm to 150 m apart (Table 1). This
nest aggregation was in fact composed of two well-sepa-
rated (about 100 m) clusters of nests. At the other extreme,
nests of S. continuus in the first generation of 2007 were
only 35–650 cm apart (Table 1). ND distribution did not
differ between generations in S. continuus (Kolgomorov–
Smirnov test: D = 0.09, n1 = 120, n2 = 172, P = 0.58),
but it differed between generations in the other two species
(though only marginally in B. zonata) (Kolgomorov–
Smirnov test, B. merceti: D = 0.71, n1 = 66, n2 = 66,
P \ 0.0001; B. zonata, D = 0.56, n1 = 78, n2 = 28,
P = 0.06).
Overall prey spectrum and individual specialization
Fly prey of B. merceti and B. zonata consisted mainly of
Bombyliidae and Syrphidae, in both 2009 and 2010
(Table 2). For both species, a few other fly families, such
as Calliphoridae and Stratiomyidae, were also included in
the diet at appreciable frequencies (Table 2).
Orthopteran prey of S. continuus in the first generation
of 2007 belonged to three families, with Acrididae being
the most hunted. In the second generation of 2007 Acrid-
idae was again the most hunted family (Table 2).
Prey size was highly variable within the studied cases: in
each, the smaller prey item weighed at least approximately
10 times less than the largest prey item, and sometimes
even approximately 20 times less (B. zonata 2010,
S. continuus 2007-II) (Table 1). Prey size did not differ
between generations in B. merceti (F = 1.77, P = 0.0003,
Aspin–Welch’s t = -0.96, df = 258.3, P = 0.33), but did
in B. zonata (F = 1.02, P = 0.47, t = 3.5, df = 181,
P = 0.0005) and in S. continuus (F = 2.46, P \ 0.0001,
Aspin–Welch’s t = -12.1, df = 212.5, P \ 0.001).
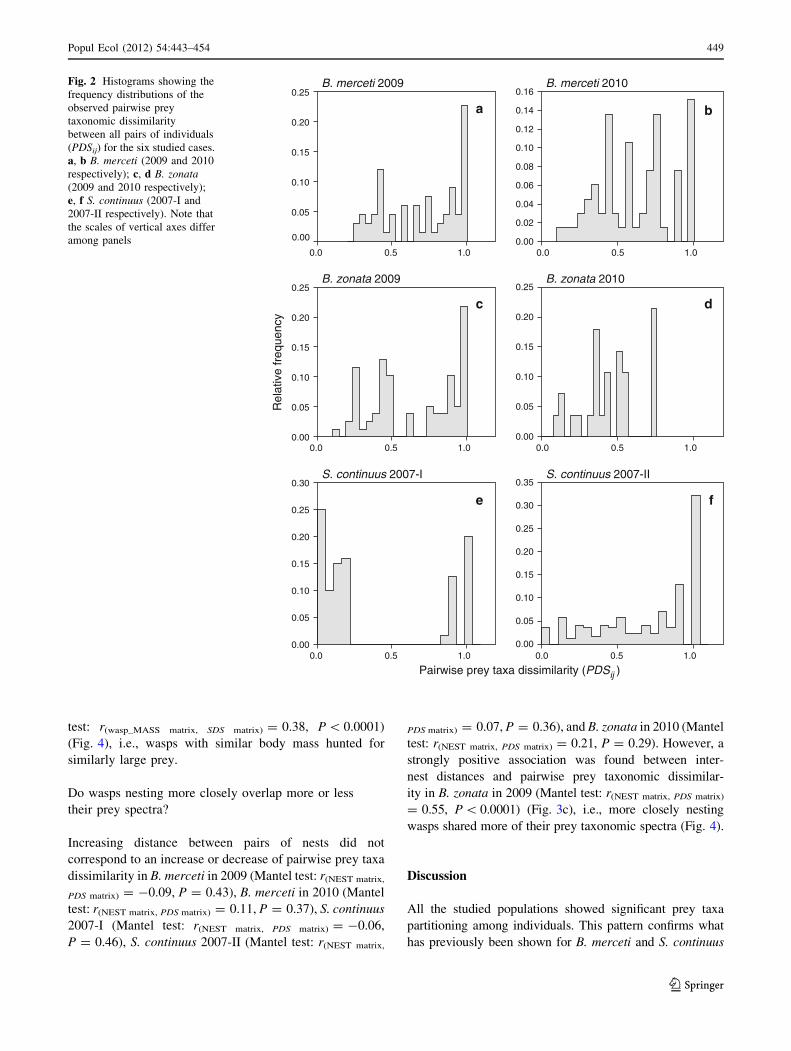
All the populations and generations showed significant
prey taxa partitioning among individuals (Table 3), while
prey size partitioning was detected in both S. continuus
generations and in B. merceti in 2010, but not in the other
Bembix populations/periods (Table 3).
The value of ET was variable across the study cases, and
sometimes very variable between generations of a given
species (Table 3). In all the populations, at least one pair of
individuals showed a complete absence of prey overlap
(PDSij = 1), while only in S. continuus were there also
pairs of individuals completely sharing their prey spectrum
(PDSij = 0), giving a clear bimodal distribution of PDSij in
one of the generations (2007-I) (Table 2; Fig. 1). PDSij
distribution did not differ between generations in B. mer-
ceti (Kolgomorov–Smirnov test: D = 0.21, n1 = 66,
n2 = 66, P = 0.08), but it differed between generations
in the other two species (Kolgomorov–Smirnov test,
B. zonata, D = 0.45, n1 = 78, n2 = 28, P = 0.0003;
S. continuus: D = 0.56, n1 = 120, n2 = 172, P \ 0.001).
Variation in the distribution of the SDSij values was also
observed (Table 3; Fig. 2), which led to variable values of
ES. Cases of SDSij = 0 (total overlap in prey size) occurred
only in S. continuus in one generation, while, on the other
hand, no values of SDSij \ 0.1 were recorded in one gen-
eration of B. zonata (Table 2; Fig. 2). SDSij distribution did
not differ between generations in B. merceti (Kolgomorov–
Smirnov test: D = 0.19, n1 = 66, n2 = 66, P = 0.13) and
in B. zonata (Kolgomorov–Smirnov test, D = 0.25,
n1 = 78, n2 = 28, P = 0.12), but did in S. continuus:
D = 0.33, n1 = 120, n2 = 172, P \ 0.001).
Relationships between prey taxonomic spectra and prey
size spectra
A positive correlation between the SDS matrix and the PDS
matrix was found in five of the six studied cases,
Table 2 Relative frequencies (%) of prey families hunted by female wasps in the three studied species
Species and period Asi Bom Cal Sar Str Syr Tac Tab The
Diptera
B. merceti 2009 – 26.3 (8) 8.3 (1) 1.9 (3) 15.4 (1) 51.9 (3) 3.2 (3) – –
B. merceti 2010 – 44.7 (11) 2.1 (2) 0.7 (1) – 50.4 (1) 1.4 (1) 1.4 (2) –
B. zonata 2009 2.7 (2) 61.1 (6) – 0.9 (1) – 32.7 (4) 1.8 (1) – 0.9 (1)
B. zonata 2010 2.9 (2) 28.6 (8) 65.7 (3)
Acr Pyr Gry
Orthoptera
S. continuus 2007-I 96.3 (5) 3.1 (1) 0.6 (1)
S. continuus 2007-II 78.8 (5) 21.2 (1) –
In brackets there are the number of species (or morphospecies) identified in each family
Asi Asilidae, Bom Bombyliidae, Cal Calliphoridae, Sar Sarcophagidae, Str Stratiomyidae, Syr Syrphidae, Tac Tachinidae, Tab Tabanidae, TheTherevidae, Acr Acrididae, Pyr Pyrgomorphidae, Gry Gryllidae
Popul Ecol (2012) 54:443–454 447
123
suggesting that wasps hunting for more diverse prey spe-
cies actually also hunted for prey with more variable size
(Mantel test: B. merceti 2009: r(PDS matrix, SDS matrix) =
0.31, P \ 0.0001; B. merceti 2010: r(PDS matrix, SDS matrix) =
0.34, P \ 0.0001; B. zonata 2009: r(PDS matrix, SDS matrix)
= -0.11, P = 0.18; B. zonata 2010: r(PDS matrix, SDS matrix)
= 0.94, P \ 0.0001; S. continuus 2007-I: r(PDS matrix, SDS
matrix) = 0.47, P \ 0.0001; S. continuus 2007-II: r(PDS
matrix, SDS matrix) = 0.58, P \ 0.0001).
Do similar-size wasps overlap more or less their prey
spectra?
In all but one case (S. continuus 2007-II: Pearson test,
r = 0.74, n = 19, P = 0.0002) larger wasps did not hunt,
on average, for larger prey (B. merceti 2009: r = 0.38,
n = 12, P = 0.22; B. merceti 2010: r = 0.32, n = 12,
P = 0.30; B. zonata 2009: r = -0.27, n = 13, P = 0.37;
B. zonata 2010: q = 0.15, n = 8, P = 0.68; S. continuus
2007-I: r = 0.24, n = 16, P = 0.36).
Increasing morphological distance (body mass) between
pairs of wasps did not correspond to an increase or
decrease of pairwise prey taxonomic dissimilarity in B.
merceti in 2009 (Mantel test: r(wasp_MASS matrix, PDS matrix)
= -0.12, P = 0.29), B. merceti in 2010 (Mantel
test: r(wasp_MASS matrix, PDS matrix) = -0.006, P = 0.61),
B. zonata in 2010 (Mantel test: r(wasp_MASS matrix, PDS
matrix) = -0.18, P = 0.33), and in S. continuus 2007-I
(Mantel test: r(wasp_MASS matrix, PDS matrix) = -0.08, P =
0.35) (Fig. 3). However, a positive association between
pairwise size distance and pairwise prey taxonomic dis-
similarity was found marginally in B. zonata in 2009
(Mantel test: r(wasp_MASS matrix, PDS matrix) = 0.22,
P = 0.055) and more strongly in S. continuus 2007-II
(Mantel test: r(wasp_MASS matrix, PDS matrix) = 0.20,
P = 0.008) (Fig. 3), i.e., wasps with similar body mass
shared more of their prey taxonomic spectra.
Increasing morphological distance (body mass) between
pairs of wasps did not correspond to an increase or
decrease of pairwise prey size dissimilarity in B. merceti
in 2009 (Mantel test: r(wasp_MASS matrix, SDS matrix) =
-0.035, P = 0.76), B. merceti in 2010 (Mantel test:
r(wasp_MASS matrix, SDS matrix) = -0.14, P = 0.24), B. zonata
in 2009 (Mantel test: r(wasp_MASS matrix, SDS matrix) = 0.06,
P = 0.59), B. zonata in 2010 (Mantel test: r(wasp_MASS
matrix, SDS matrix) = -0.12, P = 0.54), and S. continuus
2007-I (Mantel test: r(wasp_MASS matrix, SDS matrix) = -0.11,
P = 0.22) (Fig. 4). However, a positive association was
found for size distance between pairs of wasps and pair-
wise prey size dissimilarity in S. continuus 2007-II (Mantel
Table 3 Individual diet specialization and pairwise diet dissimilarity between females for each species/period studied
Species and period Individual specialization for
prey taxa (V)
Individual specialization
for prey size (W)
Pairwise prey taxonomic
dissimilarity
Pairwise prey size
dissimilarity
B. merceti 2009 0.531 ± 0.202, P \ 0.0001 0.164, ns PDSij = 0.246–1,
ET = 0.704 ± 0.253
SDSij = 0.094–0.807,
ES = 0.395 ± 0.197
B. merceti 2010 0.412 ± 0.178, P \ 0.0013 0.384, P \ 0.0001 PDSij = 0.142–1,
ET = 0.621 ± 0.344
SDSij = 0.040–0.756,
ES = 0.426 ± 0.162
B. zonata 2009 0.514 ± 0.185, P \ 0.0001 0.174, ns PDSij = 0.142–1,
ET = 0.654 ± 0.283
SDSij = 0.054–0.719,
ES = 0.384 ± 0.154
B. zonata 2010 0.391 ± 0.127, P \ 0.0049 0.066, ns PDSij = 0.076–0.75,
ET = 0.460 ± 0.196
SDSij = 0.149–0.664,
ES = 0.436 ± 0.155
S. continuus 2007-I 0.336 ± 0.259, P \ 0.0001 0.341, P \ 0.0001 PDSij = 0–1,
ET = 0.389 ± 0.423
SDSij = 0.007–0.801,
ES = 0.352 ± 0.221
S. continuus 2007-II 0.567 ± 0.152, P \ 0.0001 0.494, P \ 0.0001 PDSij = 0–1,
ET = 0.695 ± 0.315
SDSij = 0.041–0.756,
ES = 0.447 ± 0.169
For each parameter, min–max range precedes mean ± SD
1
2
3
4
5
6
7
B. merceti
2009
ln(m
ass)
(m
g)
waspprey
B. zonata S. continuus
2009 2007-II2007-I20102010
Fig. 1 Box plots showing averages (crosses), outliers (circles), and
with whiskers showing minimum–maximum values and 1st and 3rd
quartiles of ln-transformed wasp size and prey size in the six studied
species/periods
448 Popul Ecol (2012) 54:443–454
123
test: r(wasp_MASS matrix, SDS matrix) = 0.38, P \ 0.0001)
(Fig. 4), i.e., wasps with similar body mass hunted for
similarly large prey.
Do wasps nesting more closely overlap more or less
their prey spectra?
Increasing distance between pairs of nests did not
correspond to an increase or decrease of pairwise prey taxa
dissimilarity in B. merceti in 2009 (Mantel test: r(NEST matrix,
PDS matrix) = -0.09, P = 0.43), B. merceti in 2010 (Mantel
test: r(NEST matrix, PDS matrix) = 0.11, P = 0.37), S. continuus
2007-I (Mantel test: r(NEST matrix, PDS matrix) = -0.06,
P = 0.46), S. continuus 2007-II (Mantel test: r(NEST matrix,
PDS matrix) = 0.07, P = 0.36), and B. zonata in 2010 (Mantel
test: r(NEST matrix, PDS matrix) = 0.21, P = 0.29). However, a
strongly positive association was found between inter-
nest distances and pairwise prey taxonomic dissimilar-
ity in B. zonata in 2009 (Mantel test: r(NEST matrix, PDS matrix)
= 0.55, P \ 0.0001) (Fig. 3c), i.e., more closely nesting
wasps shared more of their prey taxonomic spectra (Fig. 4).
Discussion
All the studied populations showed significant prey taxa
partitioning among individuals. This pattern confirms what
has previously been shown for B. merceti and S. continuus
e
c
0.00
0.05
0.10
0.15
0.20
0.25
0.00
0.02
0.04
0.06
0.08
0.10
0.12
0.14
0.16
0.00
0.05
0.10
0.15
0.20
0.25
0.00
0.05
0.10
0.15
0.20
0.25
0.00
0.05
0.10
0.15
0.20
0.25
0.30
0.00.00
0.05
0.10
0.15
0.20
0.25
0.30
0.35
Rel
ativ
e fr
eque
ncy
Pairwise prey taxa dissimilarity (PDS )
B. merceti 2009 B. merceti 2010
B. zonata 2009 B. zonata 2010
S. continuus 2007-I S. continuus 2007-II
a b
d
f
1.00.5 0.0 1.00.5
0.0 1.00.50.0 1.00.5
0.0 1.00.50.0 1.00.5
ij
Fig. 2 Histograms showing the
frequency distributions of the
observed pairwise prey
taxonomic dissimilarity
between all pairs of individuals
(PDSij) for the six studied cases.
a, b B. merceti (2009 and 2010
respectively); c, d B. zonata(2009 and 2010 respectively);
e, f S. continuus (2007-I and
2007-II respectively). Note that
the scales of vertical axes differ
among panels
Popul Ecol (2012) 54:443–454 449
123

(Asıs et al. 2011; Santoro et al. 2011), and is reported here for
the first time in B. zonata, increasing the number of predatory
wasp species in which individual specialization occurs to
about 15 species (Polidori et al. 2011 and unpublished data).
On the contrary, prey size inter-individual variation was not
significant in half of the cases, so it seems overall to be a rarer
occurrence in wasps. Newer and more intriguing results arose
from our analysis of the factors that possibly account for such
inter-individual variation of diet. The influence of the two
factors is discussed in detail below.
Morphological distance and diet dissimilarity
In two cases (B. zonata 2009 and S. continuus 2007-II) we
found a positive correlation between wasp size difference
and prey taxonomic dissimilarity, that is, wasps with sim-
ilar size shared an important proportion of prey taxa,
according to our hypothesis. A similar result has also
recently been found by Bolnick and Paull (2009), using the
same type of statistical approach for a predatory fish, the
threespine stickleback (Gasterosteus aculeatus), but to date
never in invertebrates. Interestingly, both paired body size
and trophic morphology differences in the stickleback
explained only a small percentage of the variance in diet
overlap (about 0.3–0.9 % at best, depending on the mor-
phological trait being considered) compared to our findings
(about 4 % in both wasp species) (Bolnick and Paull 2009;
Ingram et al. 2011).
Though this relationship was clearly tested here for the
first time in wasps, some previous information already
c
e
Pairwise prey size dissimilarity (SDSij)
Rel
ativ
e fr
eque
ncy
B. merceti 2009 B. merceti 2010
B. zonata 2009 B. zonata 2010
S. continuus 2007-I S. continuus 2007-II
a b
d
f
0.0 1.00.5 0.0 1.00.5
0.0 1.00.50.0 1.00.5
0.0 1.00.50.0 1.00.50.00
0.02
0.04
0.06
0.08
0.12
0.00
0.02
0.04
0.06
0.08
0.10
0.12
0.14
0.08
0.00
0.02
0.04
0.08
0.10
0.12
0.00
0.02
0.04
0.06
0.10
0.12
0.00
0.02
0.04
0.16
0.08
0.10
0.12
0.00
0.02
0.04
0.10
0.06
0.08
0.10
0.12
0.06
Fig. 3 Histograms showing the
frequency distributions of the
observed pairwise prey size
dissimilarity (SDSij) between all
pairs of individuals for the six
studied cases. a, b B. merceti(2009 and 2010 respectively); c,d B. zonata (2009 and 2010
respectively); e, f, S. continuus(2007-I and 2007-II
respectively). Note that the
scales of vertical axes differ
among panels
450 Popul Ecol (2012) 54:443–454
123

suggested that this phenomenon might occur. For example,
in the digger wasps Cerceris arenaria L. and Sphecius
speciosus Drury, dietary segregation is largely due to size-
specific selection, given the great size difference between
small prey species (hunted by small wasps) and large prey
species (hunted by large wasps) (Polidori et al. 2005)
which moreover, at least for C. arenaria, inhabit different
microhabitats. In the beetle-hunting Cerceris rubida Jurine,
the relationship between the size of the female and that of
its prey also suggests that individual diet specialization is at
least partially due to size-constraints, though differences in
microhabitats exploited by individual females, being
essentially the same, would not account for diet segregation
(Polidori et al. 2010). In the cricket-hunting Palmodes la-
eviventris (Cresson), larger females take larger prey, and
size selection may further explain the strong bias towards
female prey (Gwynne and Dodson 1983).
Interestingly, in our sample the relationship between
wasp size and prey size was found to be significantly
positive only in S. continuus, contrasting with the general
trend observed in apoid wasps (e.g., Gwynne and Dodson
1983; Polidori et al. 2005, 2010; Grant 2006; see Polidori
et al. 2011 for a review). However, it is also true that in
Bembix species larger females usually do not discard
small prey, somehow destroying the correlation (see Asıs
et al. 2011). Moreover, Bembix wasps typically maintain a
‘‘margin’’ between the maximum prey mass they can lift
and the mass of the heaviest carried prey (Asıs et al. 2011;
Coelho 2011), possibly due to environmental scarcity of
prey matching the maximum theoretical load, or in order to
retain high manoeuvrability under parasitic pressure (Asıs
et al. 2011; Coelho 2011). In S. continuus, in contrast,
wasps tend to, on average, maximize the prey load (Santoro
et al. 2011). The tendency to maximize prey load (i.e.,
when loaded prey decreases the flight muscle ratio just
above the marginal flight muscle ratio) is not very wide-
spread in wasps and is generally imprecise, since loaded
prey mass, apart from wasp mass, is also greatly influenced
by available prey sizes, by the prey stealing behaviour of
conspecifics or by the location of their nests (review in
Coelho 2011). According in part to this positive relation-
ship between wasp size and mean prey size found in S.
continuus 2007-II, we found a significant relationship
between wasp size distance and prey size overlap in this
case. Such a double relationship (wasp size distance vs.
both prey taxa and prey size dissimilarity) is probably due
to the fact that the PDSij matrix and the SDSij matrix were
highly correlated, i.e., that different prey species also had a
different prey size. Furthermore, the trend observed in S.
continuus in the second generation of 2007 was not found
in the first generation. In the latter, wasp size and mean
prey size were not correlated, and the distributions of PDSij
Pre
y ta
xa d
issi
mila
rity
(PD
S )
Pre
y si
ze d
issi
mila
rity
(SD
S )
0
0.0
0.2
0.4
0.6
0.8
1.0
0.0
Wasp size distance Wasp size distance
Nest-nest distance (cm)
0.0
0.2
0.4
0.6
0.8
1.0
0.0
Pre
y ta
xa d
issi
mila
rity
(PD
S )
Wasp size distance
B. zonata 2009
S. continuus 2007-II
B. zonata 2009
S. continuus 2007-II
a b
c d
0.0
0.2
0.4
0.6
0.8
0.0
0.2
0.4
0.6
0.8
1.0
0.2 0.4 10000 20000
0.2 0.4 0.6 0.0 0.2 0.4 0.6
ijijij
Pre
y ta
xa d
issi
mila
rity
(PD
S ) ij
Fig. 4 Significant relationships
observed between a pairwise
wasp size distance and pairwise
prey taxa dissimilarity of S.continuus 2007-II (P = 0.008),
b pairwise wasp size distance
and pairwise prey size
dissimilarity of S. continuus2007-II (P \ 0.0001),
c pairwise wasp size distance
and pairwise prey taxa
dissimilarity of B. zonata 2009
(P = 0.055), and d pairwise
inter-nest distance and pairwise
prey taxa dissimilarity of
B. zonata 2009 (P \ 0.0001), as
calculated with a two-tailed
Mantel test. The linear least
squares lines for the observed
regressions of diet dissimilarity
functions (i.e., PDSij and SDSij)
are shown. Note that the scales
of both vertical and horizontal
axes differ among panels
Popul Ecol (2012) 54:443–454 451
123
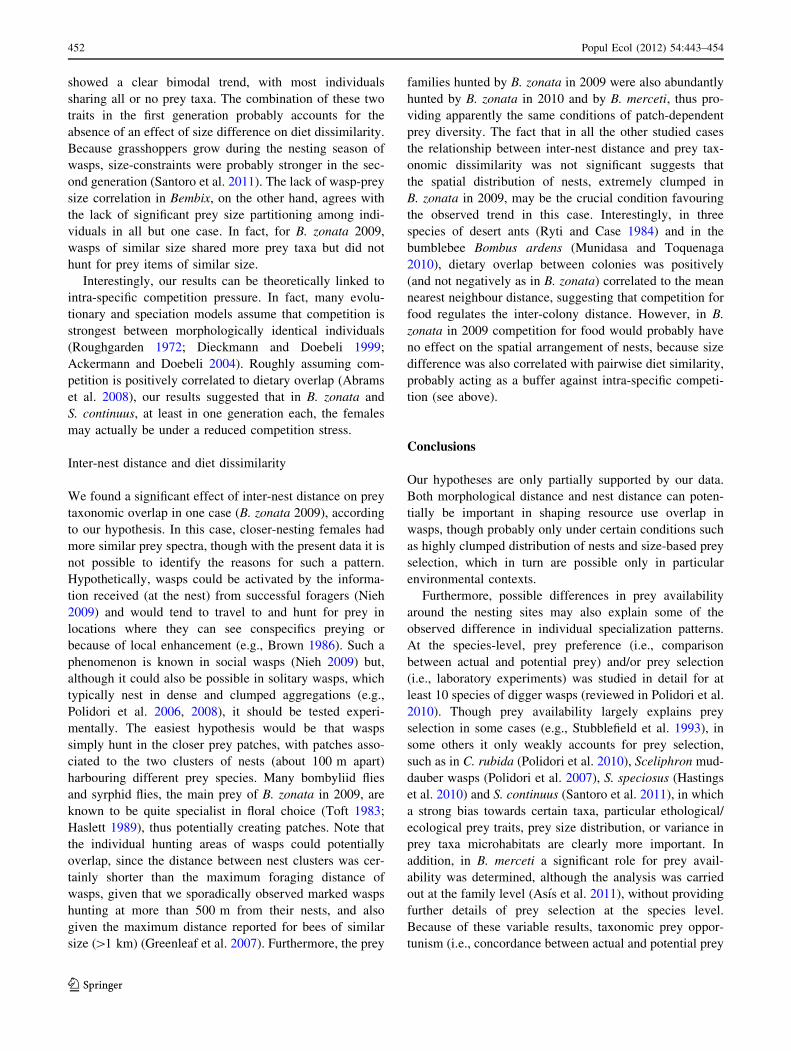
showed a clear bimodal trend, with most individuals
sharing all or no prey taxa. The combination of these two
traits in the first generation probably accounts for the
absence of an effect of size difference on diet dissimilarity.
Because grasshoppers grow during the nesting season of
wasps, size-constraints were probably stronger in the sec-
ond generation (Santoro et al. 2011). The lack of wasp-prey
size correlation in Bembix, on the other hand, agrees with
the lack of significant prey size partitioning among indi-
viduals in all but one case. In fact, for B. zonata 2009,
wasps of similar size shared more prey taxa but did not
hunt for prey items of similar size.
Interestingly, our results can be theoretically linked to
intra-specific competition pressure. In fact, many evolu-
tionary and speciation models assume that competition is
strongest between morphologically identical individuals
(Roughgarden 1972; Dieckmann and Doebeli 1999;
Ackermann and Doebeli 2004). Roughly assuming com-
petition is positively correlated to dietary overlap (Abrams
et al. 2008), our results suggested that in B. zonata and
S. continuus, at least in one generation each, the females
may actually be under a reduced competition stress.
Inter-nest distance and diet dissimilarity
We found a significant effect of inter-nest distance on prey
taxonomic overlap in one case (B. zonata 2009), according
to our hypothesis. In this case, closer-nesting females had
more similar prey spectra, though with the present data it is
not possible to identify the reasons for such a pattern.
Hypothetically, wasps could be activated by the informa-
tion received (at the nest) from successful foragers (Nieh
2009) and would tend to travel to and hunt for prey in
locations where they can see conspecifics preying or
because of local enhancement (e.g., Brown 1986). Such a
phenomenon is known in social wasps (Nieh 2009) but,
although it could also be possible in solitary wasps, which
typically nest in dense and clumped aggregations (e.g.,
Polidori et al. 2006, 2008), it should be tested experi-
mentally. The easiest hypothesis would be that wasps
simply hunt in the closer prey patches, with patches asso-
ciated to the two clusters of nests (about 100 m apart)
harbouring different prey species. Many bombyliid flies
and syrphid flies, the main prey of B. zonata in 2009, are
known to be quite specialist in floral choice (Toft 1983;
Haslett 1989), thus potentially creating patches. Note that
the individual hunting areas of wasps could potentially
overlap, since the distance between nest clusters was cer-
tainly shorter than the maximum foraging distance of
wasps, given that we sporadically observed marked wasps
hunting at more than 500 m from their nests, and also
given the maximum distance reported for bees of similar
size ([1 km) (Greenleaf et al. 2007). Furthermore, the prey
families hunted by B. zonata in 2009 were also abundantly
hunted by B. zonata in 2010 and by B. merceti, thus pro-
viding apparently the same conditions of patch-dependent
prey diversity. The fact that in all the other studied cases
the relationship between inter-nest distance and prey tax-
onomic dissimilarity was not significant suggests that
the spatial distribution of nests, extremely clumped in
B. zonata in 2009, may be the crucial condition favouring
the observed trend in this case. Interestingly, in three
species of desert ants (Ryti and Case 1984) and in the
bumblebee Bombus ardens (Munidasa and Toquenaga
2010), dietary overlap between colonies was positively
(and not negatively as in B. zonata) correlated to the mean
nearest neighbour distance, suggesting that competition for
food regulates the inter-colony distance. However, in B.
zonata in 2009 competition for food would probably have
no effect on the spatial arrangement of nests, because size
difference was also correlated with pairwise diet similarity,
probably acting as a buffer against intra-specific competi-
tion (see above).
Conclusions
Our hypotheses are only partially supported by our data.
Both morphological distance and nest distance can poten-
tially be important in shaping resource use overlap in
wasps, though probably only under certain conditions such
as highly clumped distribution of nests and size-based prey
selection, which in turn are possible only in particular
environmental contexts.
Furthermore, possible differences in prey availability
around the nesting sites may also explain some of the
observed difference in individual specialization patterns.
At the species-level, prey preference (i.e., comparison
between actual and potential prey) and/or prey selection
(i.e., laboratory experiments) was studied in detail for at
least 10 species of digger wasps (reviewed in Polidori et al.
2010). Though prey availability largely explains prey
selection in some cases (e.g., Stubblefield et al. 1993), in
some others it only weakly accounts for prey selection,
such as in C. rubida (Polidori et al. 2010), Sceliphron mud-
dauber wasps (Polidori et al. 2007), S. speciosus (Hastings
et al. 2010) and S. continuus (Santoro et al. 2011), in which
a strong bias towards certain taxa, particular ethological/
ecological prey traits, prey size distribution, or variance in
prey taxa microhabitats are clearly more important. In
addition, in B. merceti a significant role for prey avail-
ability was determined, although the analysis was carried
out at the family level (Asıs et al. 2011), without providing
further details of prey selection at the species level.
Because of these variable results, taxonomic prey oppor-
tunism (i.e., concordance between actual and potential prey
452 Popul Ecol (2012) 54:443–454
123

frequencies) was recently discussed as a doubtful phe-
nomenon in apoid wasps (see Polidori et al. 2010). For
example, an increasing importance is being given to the
‘‘sensory window’’ hypothesis, which states that different
taxa are included or excluded in the diet depending on
chemical recognition thresholds, regardless of abundance
(Anton and Gnatzy 1998; T. Schmitt, personal communi-
cation). Despite no studies having yet been undertaken, at
the individual level, prey availability would probably have
a significant role if different prey species form distinct
patches in the environment (and individual wasps hunt on
different patches) (see above), or due to intra-specific
variance in sensory recognition dynamics or handling
abilities.
Acknowledgments Thanks are due to the Town Hall of Valencia
and the Generalitat Valenciana for issuing the permits necessary to
carry out part of this work in La Mallada Larga (El Saler). We express
our gratitude to M. Portillo (Universidad de Salamanca, Spain) for his
help in determination of prey flies. The research was supported by
funding from the Junta de Castilla y Leon (SA094A09) and from and
by a post-doctoral contract to CP (Program JAE-Doc ‘‘Junta para la
Ampliacion de Estudios’’ funded by the Spanish Research Council
(CSIC) and the FSE). Experiments comply with the current Spanish
law.
References
Abrams PA, Rueffler C, Dinnage R (2008) Competition–similarity
relationships and the nonlinearity of competitive effects in
consumer–resource systems. Am Nat 12:463–474
Ackermann M, Doebeli M (2004) Evolution of niche width and
adaptive diversification. Evolution 58:2599–2612
Anton S, Gnatzy W (1998) Prey specificity and the importance of
close-range chemical cues in prey recognition in the digger
wasp, Liris niger. J Insect Behav 11:671–690
Araujo MS, Gonzaga MO (2007) Individual specialization in the
hunting wasp Trypoxylon (Trypargylum) albonigrum (Hyme-
noptra, Crabronidae). Behav Ecol Sociobiol 61:1855–1863
Asıs JD, Tormos J, Gayubo SF (2004) Nesting behaviour and
provisioning in Bembix merceti and Bembix zonata (Hymenop-
tera: Crabronidae). J Nat Hist 38:1799–1809
Asıs JD, Banos-Picon L, Tormos J, Ballesteros Y, Alonso M, Gayubo
SF (2011) Are solitary progressive-provisioning wasps optimal
foragers? A study with the digger wasp Bembix merceti(Hymenoptera: Crabronidae). Behaviour 148:191–214
Bolnick DI (2001) Intraspecific competition favours niche width
expansion in Drosophila melanogaster. Nature 410:463–466
Bolnick DI, Paull JE (2009) Morphological and dietary differences
between individuals are weakly but positively correlated within a
population of threespine stickleback. Evol Ecol Res
11:1217–1233
Bolnick DI, Yang LH, Fordyce JA, Davis JM, Svanback R (2002)
Measuring individual-level resource specialization. Ecology
83:2936–2941
Bolnick DI, Svanback R, Fordyce JA, Yang LH, Davis JM, Hulsey
CD, Forister ML (2003) The ecology of individuals: incidence
and implications of individual specialization. Am Nat 161:1–28
Bolnick DI, Svanback R, Araujo M, Persson L (2007) Comparative
support for the niche variation hypothesis that more generalized
populations also are more heterogeneous. Proc Natl Acad Sci
USA 104:10075–10079
Bolnick DI, Ingram T, Snowberg LK, Stutz WE, Lau OL, Paull JS
(2010) Ecological release from interspecific competition leads to
decoupled changes in population and individual niche widths.
Proc R Soc B 277:1789–1797
Bolnick DI, Amarasekare P, Araujo M, Burger R, Levine J, Novak M,
Rudolf V, Schreiber S, Urban M, Vasseur D (2011) Why
intraspecific trait variation matters in ecology. Trends Ecol Evol
26:183–192
Brown CR (1986) Cliff swallow colonies as information centers.
Science 234:83–85
Coelho JR (2011) Effects of prey size and load carriage on the
evolution of foraging strategies in wasps. In: Polidori C (ed)
Predation in the Hymenoptera: an evolutionary perspective.
Transworld Research Network, Kerala, pp 23–38
Dieckmann U, Doebeli M (1999) On the origin of species by
sympatric speciation. Nature 400:354–357
Evans HE, O’Neill KM (2007) The Sand Wasps: natural history and
behaviour. Harvard University Press, Cambridge
Field J (1992) Guild structure in solitary spider-hunting wasps
(Hymenoptera, Pompilidae) compared with null model predic-
tions. Ecol Entomol 17:198–208
Grant PR (2006) Opportunistic predation and offspring sex ratios of
cicada-killer wasps (Sphecius speciosus Drury). Ecol Entomol
31:539–547
Greenleaf SS, Williams NM, Winfree R, Kremen C (2007) Bee
foraging ranges and their relationship with body size. Oecologia
153:589–596
Gwynne DT, Dodson GN (1983) Nonrandom provisioning by the
digger wasp, Palmodes laeviventris (Hymenoptera: Sphecidae).
Ann Entomol Soc Am 76:434–436
Haslett JR (1989) Interpreting patterns of resource utilization:
randomness and selectivity in pollen feeding by adult hoverflies.
Oecologia 78:433–432
Hastings JM, Holliday CW, Long A, Jones K, Rodriguez G (2010)
Size-specific provisioning by cicada killers, Sphecius speciosus,
(Hymenoptera: Crabronidae) in North Florida. Fla Entomol
93:412–421
Ingram T, Stutz WE, Bolnick DI (2011) Does intraspecific size
variation in a predator affect its diet diversity and top-down
control of prey? PLoS ONE 6:e20782
Karsai I, Somogyi K, Hardy ICW (2006) Body size, host choice and
sex allocation in a spider hunting pompilid wasp. Biol J Linnean
Soc 87:285–296
Martins EG, Araujo MS, Bonato V, dos Reis SF (2008) Sex and
season affect individual-level diet variation in the Neotropical
marsupial Gracilinanus microtarsus (Didelphidae). Biotropica
40:132–135
Munidasa DT, Toquenaga Y (2010) Do pollen diets vary among
adjacent bumble bee colonies? Ecol Res 25:639–646
Nieh JC (2009) Convergent evolution of food recruitment mecha-
nisms in bees and wasps. In: Gadau J, Fewell J (eds)
Organization of insect societies: from genome to sociocomplex-
ity. Harward University Press, Cambridge, pp 266–288
O’Neill KM (2001) Solitary wasps: behaviour and natural history.
Cornell University Press, Ithaca
O’Neill KM, Evans HE (1982) Patterns of prey use in four sympatric
species of Philanthus (Hymenoptera: Sphecidae) with a review
of prey selection in the genus. J Nat Hist 16:791–801
Polidori C, Boesi R, Isola F, Andrietti F (2005) Provisioning patterns
and choice of prey in the digger wasp Cerceris arenaria(Hymenoptera: Crabronidae): the role of prey size. Eur J
Entomol 102:801–804
Polidori C, Casiraghi M, Di Lorenzo M, Valarani B, Andrietti F
(2006) Philopatry, nest choice and aggregation temporal-spatial
Popul Ecol (2012) 54:443–454 453
123

change in the digger wasp Cerceris arenaria (Hymenoptera:
Crabronidae). J Ethol 24:155–163
Polidori C, Federici M, Pesarini C, Andrietti F (2007) Factors
affecting spider prey selection by Sceliphron mud-dauber wasps
(Hymenoptera: Sphecidae) in northern Italy. Anim Biol
57:11–28
Polidori C, Mendiola P, Asıs JD, Tormos J, Selfa J, Andrietti F (2008)
Female-female attraction influences nest establishment in the
digger wasp Stizus continuus (Hymenoptera: Crabronidae).
Anim Behav 75:1651–1661
Polidori C, Mendiola P, Asıs JD, Tormos J, Garcia MD, Selfa J (2009)
Predatory habits of the grasshopper-hunting wasp Stizus con-tinuus (Hymenoptera: Crabronidae): diet preference, predator-
prey size relationships and foraging capacity. J Nat Hist
43:2985–3000
Polidori C, Gobbi M, Chatenaud L, Santoro D, Montani O, Andrietti
F (2010) Taxon-biased diet preference in the ‘generalist’ beetle-
hunting wasp Cerceris rubida provides insights on the evolution
of prey specialization in apoid wasps. Biol J Linnean Soc
99:544–558
Polidori C, Santoro D, Asıs JD, Tormos J (2011) Individual prey
specialization in wasps: predator size is a weak predictor of
taxonomic niche width and niche overlap. In: Polidori C (ed)
Predation in the Hymenoptera: an evolutionary perspective.
Transworld Research Network, Kerala, pp 101–122
Quevedo M, Svanback R, Eklov P (2009) Intrapopulation niche
partitioning in a generalist predator limits food web connectivity.
Ecology 90:2263–2274
Rendell L, Whitehead H (2001) Culture in whales and dolphins.
Behav Brain Sci 24:309–382
Roughgarden J (1972) Evolution of niche width. Am Nat
106:683–718
Roughgarden J (1974) Niche width: biogeographic patterns among
Anolis lizard populations. Am Nat 108:429–442
Ryti RT, Case TJ (1984) Spatial arrangement and diet overlap
between colonies of desert ants. Oecologia 62:401–404
Santoro D, Polidori C, Asıs JD, Tormos J (2011) Complex
interactions between components of individual prey specializa-
tion affect mechanisms of niche variation in a grasshopper-
hunting wasp. J Anim Ecol 80:1123–1133
Shimada M (1985) Niche modification and stability of competitive
systems. II. Persistence of interspecific competitive systems with
parasitoid wasps. Res Popul Ecol 27:203–216
Stubblefield JW, Seger J, Wenzel JW, Heisler MM (1993) Temporal,
spatial, sex-ratio, and body-size heterogeneity of prey species
taken by the beewolf Philanthus sanbornii (Hymenoptera:
Sphecidae). Philos Trans R Soc B-Biol Sci 339:397–423
Svanback R, Bolnick DI (2007) Intraspecific competition drives
increased resource use diversity within a natural population. Proc
R Soc B 274:839–844
Svanback R, Persson L (2004) Individual specialization, niche width
and population dynamics: implications for trophic polymor-
phisms. J Anim Ecol 73:973–982
Toft CA (1983) Community patterns of nectivorous adult parasitoids
(Diptera, Bombyliidae) on their resources. Oecologia
57:200–215
454 Popul Ecol (2012) 54:443–454
123
Related Documents