Atmos. Chem. Phys., 5, 2739–2748, 2005 www.atmos-chem-phys.org/acp/5/2739/ SRef-ID: 1680-7324/acp/2005-5-2739 European Geosciences Union Atmospheric Chemistry and Physics Morphological, chemical and optical absorbing characterization of aerosols in the urban atmosphere of Valladolid S. Mogo 1,2 , V. E. Cachorro 1 , and A. M. de Frutos 1 1 Grupo de ´ Optica Atmosf´ erica,Universidad de Valladolid, Valladolid, Spain 2 Dep. de F´ ısica, Universidade da Beira Interior, Covilh˜ a, Portugal Received: 28 February 2005 – Published in Atmos. Chem. Phys. Discuss.: 13 June 2005 Revised: 9 August 2005 – Accepted: 29 September 2005 – Published: 19 October 2005 Abstract. Samples of atmospheric aerosol particles were collected in Valladolid, Spain, during the winter of 2003– 2004. The measurements were made with a Dekati PM 10 cascade impactor with four size stages: greater than 10 μm, between 2.5 to 10 μm, 1 to 2.5 μm and less than 1 μm. The size and shape of the particles were analyzed with a scanning electron microscope (SEM) and elemental analysis was done with an energy dispersive x-ray analysis (EDX). We present an evaluation by size, shape and composition of the major particulate species in the Valladolid urban atmosphere. The total aerosol concentration is very variable, ranging from 39.86 μg·m -3 to 184.88 μg·m -3 with the coarse par- ticles as the dominant mass fraction. Emphasis was given to fine particles (<1 μm), for which the visible (400 nm to 650 nm) light absorption coefficients were measured using the integrating plate technique. We have made some en- hancements in the illumination system of this measurement system. The absorption coefficient, σ a , is highly variable and ranges from 7.33×10 -6 m -1 to 1.01×10 -4 m -1 at a wave- length of 550 nm. There is an inverse power law relation- ship between σ a and wavelength, with an average exponent of -0.8. 1 Introduction The importance of aerosols has been stressed many times in the past few decades. For example a great number of studies have looked at their influence on climate change through their contribution to radiative forcing (Haywood and Boucher, 2000; Roberts and Jones, 2004; Hansen and Nazarenko, 2004). In this context the study of aerosols is focused on those of anthropogenic and natural origin. Correspondence to: S. Mogo ([email protected]) It is well known that aerosols directly affect climate through changes in the optical depth, i.e., the vertical integral of the particle extinction coefficient. Hence, the knowledge of the scattering and absorptive properties of aerosols is of utmost importance. Regardless of the huge number of stud- ies of the radiative properties of aerosols, their net effect on global climate change is uncertain since the effect of parti- cles can be to cool or to warm, depending on their size and at what altitude they are found (H¨ anel and Hillenbrand, 1989; Wang, 2004). The particle properties show in general a great spatial and temporal variability. The scattering and absorption of light by particles depends also on their elemental composition. At present sulphate aerosols are considered the primary particles responsible for net cooling. They scatter solar radiation and are effective as cloud condensation nuclei, resulting in a negative radia- tive forcing that leads to a cooling of the Earth surface. On the other hand, soot, or black carbon (BC) is an effective ab- sorber of solar radiation and has, therefore, a warming effect. The particles’ optical properties also depend on how var- ious aerosol species are mixed, i.e., if they form an internal mixture, an external mixture or a core-shell structure (Chan- dra et al., 2004). For example, the absorption coefficient of a mixture of elemental carbon with non-absorbent particles is larger for an internal mixture than for an external mixture (Horvath, 1993). This underscores that studies of aerosol composition should not be taken apart from the study of their optical and radiative characteristics. As part of a general characterization study of the urban aerosol in the city of Valladolid, this work categorizes the morphology and elemental composition and analyzes their light absorbing characteristics as related to the elemental components and range of sizes. The classification took into account the results of scanning electron microscopy and en- ergy dispersive x-ray analysis. The scanning electron micro- scope provides high resolution images of the particles and the energy dispersive x-ray analysis provides information about © 2005 Author(s). This work is licensed under a Creative Commons License.

Welcome message from author
This document is posted to help you gain knowledge. Please leave a comment to let me know what you think about it! Share it to your friends and learn new things together.
Transcript

Atmos. Chem. Phys., 5, 2739–2748, 2005www.atmos-chem-phys.org/acp/5/2739/SRef-ID: 1680-7324/acp/2005-5-2739European Geosciences Union
AtmosphericChemistry
and Physics
Morphological, chemical and optical absorbing characterization ofaerosols in the urban atmosphere of Valladolid
S. Mogo1,2, V. E. Cachorro1, and A. M. de Frutos1
1Grupo deOptica Atmosferica, Universidad de Valladolid, Valladolid, Spain2Dep. de Fısica, Universidade da Beira Interior, Covilha, Portugal
Received: 28 February 2005 – Published in Atmos. Chem. Phys. Discuss.: 13 June 2005Revised: 9 August 2005 – Accepted: 29 September 2005 – Published: 19 October 2005
Abstract. Samples of atmospheric aerosol particles werecollected in Valladolid, Spain, during the winter of 2003–2004. The measurements were made with a Dekati PM10cascade impactor with four size stages: greater than 10µm,between 2.5 to 10µm, 1 to 2.5µm and less than 1µm. Thesize and shape of the particles were analyzed with a scanningelectron microscope (SEM) and elemental analysis was donewith an energy dispersive x-ray analysis (EDX). We presentan evaluation by size, shape and composition of the majorparticulate species in the Valladolid urban atmosphere.
The total aerosol concentration is very variable, rangingfrom 39.86µg·m−3 to 184.88µg·m−3 with the coarse par-ticles as the dominant mass fraction. Emphasis was givento fine particles (<1µm), for which the visible (400 nm to650 nm) light absorption coefficients were measured usingthe integrating plate technique. We have made some en-hancements in the illumination system of this measurementsystem. The absorption coefficient,σa , is highly variable andranges from 7.33×10⁻⁶ m−1 to 1.01×10⁻⁴ m−1 at a wave-length of 550 nm. There is an inverse power law relation-ship betweenσa and wavelength, with an average exponentof −0.8.
1 Introduction
The importance of aerosols has been stressed many timesin the past few decades. For example a great number ofstudies have looked at their influence on climate changethrough their contribution to radiative forcing (Haywoodand Boucher, 2000; Roberts and Jones, 2004; Hansen andNazarenko, 2004). In this context the study of aerosols isfocused on those of anthropogenic and natural origin.
Correspondence to:S. Mogo([email protected])
It is well known that aerosols directly affect climatethrough changes in the optical depth, i.e., the vertical integralof the particle extinction coefficient. Hence, the knowledgeof the scattering and absorptive properties of aerosols is ofutmost importance. Regardless of the huge number of stud-ies of the radiative properties of aerosols, their net effect onglobal climate change is uncertain since the effect of parti-cles can be to cool or to warm, depending on their size and atwhat altitude they are found (Hanel and Hillenbrand, 1989;Wang, 2004). The particle properties show in general a greatspatial and temporal variability.
The scattering and absorption of light by particles dependsalso on their elemental composition. At present sulphateaerosols are considered the primary particles responsible fornet cooling. They scatter solar radiation and are effectiveas cloud condensation nuclei, resulting in a negative radia-tive forcing that leads to a cooling of the Earth surface. Onthe other hand, soot, or black carbon (BC) is an effective ab-sorber of solar radiation and has, therefore, a warming effect.
The particles’ optical properties also depend on how var-ious aerosol species are mixed, i.e., if they form an internalmixture, an external mixture or a core-shell structure (Chan-dra et al., 2004). For example, the absorption coefficient of amixture of elemental carbon with non-absorbent particles islarger for an internal mixture than for an external mixture(Horvath, 1993). This underscores that studies of aerosolcomposition should not be taken apart from the study of theiroptical and radiative characteristics.
As part of a general characterization study of the urbanaerosol in the city of Valladolid, this work categorizes themorphology and elemental composition and analyzes theirlight absorbing characteristics as related to the elementalcomponents and range of sizes. The classification took intoaccount the results of scanning electron microscopy and en-ergy dispersive x-ray analysis. The scanning electron micro-scope provides high resolution images of the particles and theenergy dispersive x-ray analysis provides information about
© 2005 Author(s). This work is licensed under a Creative Commons License.
2740 S. Mogo et al.: SEM/EDX andBa of Valladolid aerosol
SPAIN
Valladolid
POR
TU
GA
L
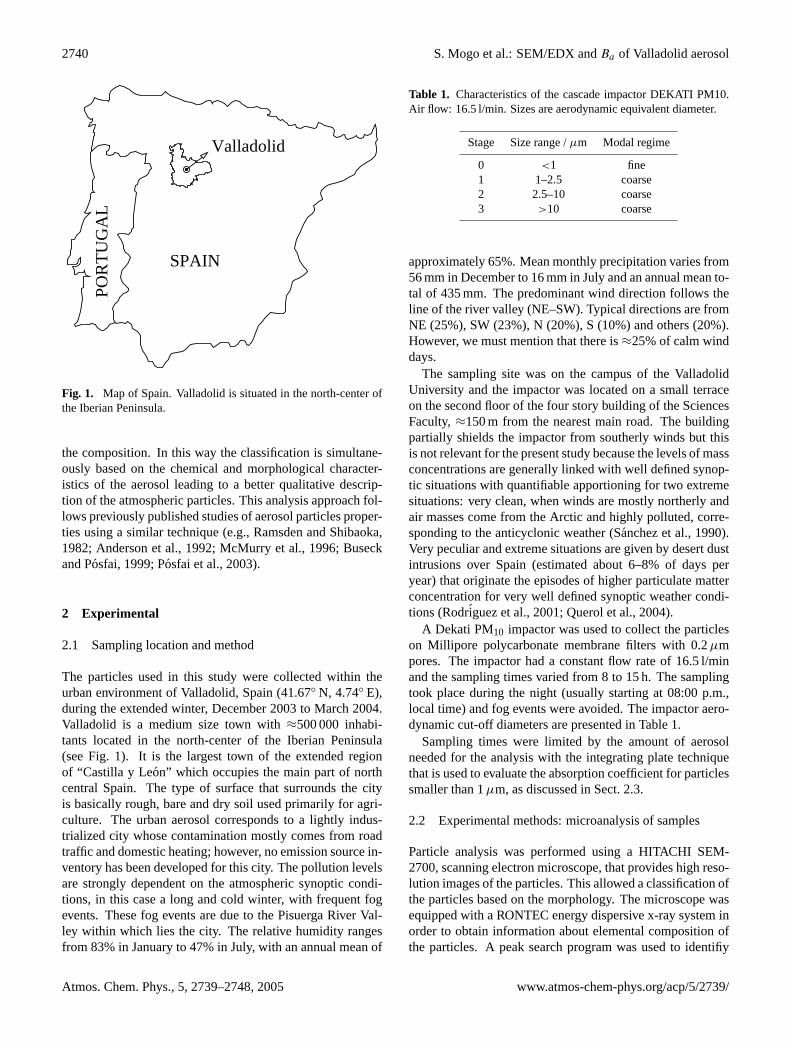
Fig. 1. Map of Spain. Valladolid is situated in the north-center ofthe Iberian Peninsula.
the composition. In this way the classification is simultane-ously based on the chemical and morphological character-istics of the aerosol leading to a better qualitative descrip-tion of the atmospheric particles. This analysis approach fol-lows previously published studies of aerosol particles proper-ties using a similar technique (e.g.,Ramsden and Shibaoka,1982; Anderson et al., 1992; McMurry et al., 1996; Buseckand Posfai, 1999; Posfai et al., 2003).
2 Experimental
2.1 Sampling location and method
The particles used in this study were collected within theurban environment of Valladolid, Spain (41.67◦ N, 4.74◦ E),during the extended winter, December 2003 to March 2004.Valladolid is a medium size town with≈500 000 inhabi-tants located in the north-center of the Iberian Peninsula(see Fig.1). It is the largest town of the extended regionof “Castilla y Leon” which occupies the main part of northcentral Spain. The type of surface that surrounds the cityis basically rough, bare and dry soil used primarily for agri-culture. The urban aerosol corresponds to a lightly indus-trialized city whose contamination mostly comes from roadtraffic and domestic heating; however, no emission source in-ventory has been developed for this city. The pollution levelsare strongly dependent on the atmospheric synoptic condi-tions, in this case a long and cold winter, with frequent fogevents. These fog events are due to the Pisuerga River Val-ley within which lies the city. The relative humidity rangesfrom 83% in January to 47% in July, with an annual mean of
Table 1. Characteristics of the cascade impactor DEKATI PM10.Air flow: 16.5 l/min. Sizes are aerodynamic equivalent diameter.
Stage Size range /µm Modal regime
0 <1 fine1 1–2.5 coarse2 2.5–10 coarse3 >10 coarse
approximately 65%. Mean monthly precipitation varies from56 mm in December to 16 mm in July and an annual mean to-tal of 435 mm. The predominant wind direction follows theline of the river valley (NE–SW). Typical directions are fromNE (25%), SW (23%), N (20%), S (10%) and others (20%).However, we must mention that there is≈25% of calm winddays.
The sampling site was on the campus of the ValladolidUniversity and the impactor was located on a small terraceon the second floor of the four story building of the SciencesFaculty,≈150 m from the nearest main road. The buildingpartially shields the impactor from southerly winds but thisis not relevant for the present study because the levels of massconcentrations are generally linked with well defined synop-tic situations with quantifiable apportioning for two extremesituations: very clean, when winds are mostly northerly andair masses come from the Arctic and highly polluted, corre-sponding to the anticyclonic weather (Sanchez et al., 1990).Very peculiar and extreme situations are given by desert dustintrusions over Spain (estimated about 6–8% of days peryear) that originate the episodes of higher particulate matterconcentration for very well defined synoptic weather condi-tions (Rodriguez et al., 2001; Querol et al., 2004).
A Dekati PM10 impactor was used to collect the particleson Millipore polycarbonate membrane filters with 0.2µmpores. The impactor had a constant flow rate of 16.5 l/minand the sampling times varied from 8 to 15 h. The samplingtook place during the night (usually starting at 08:00 p.m.,local time) and fog events were avoided. The impactor aero-dynamic cut-off diameters are presented in Table1.
Sampling times were limited by the amount of aerosolneeded for the analysis with the integrating plate techniquethat is used to evaluate the absorption coefficient for particlessmaller than 1µm, as discussed in Sect.2.3.
2.2 Experimental methods: microanalysis of samples
Particle analysis was performed using a HITACHI SEM-2700, scanning electron microscope, that provides high reso-lution images of the particles. This allowed a classification ofthe particles based on the morphology. The microscope wasequipped with a RONTEC energy dispersive x-ray system inorder to obtain information about elemental composition ofthe particles. A peak search program was used to identifiy
Atmos. Chem. Phys., 5, 2739–2748, 2005 www.atmos-chem-phys.org/acp/5/2739/

S. Mogo et al.: SEM/EDX andBa of Valladolid aerosol 2741
the elements in the x-ray spectrum of each particle that wasanalyzed. This method allows the identification and poste-rior classification of different particles that share the samemorphology, by using their elemental signatures.
2.3 Experimental methods: absorption coefficients deter-mination
Most of the difficulties in assessing the radiative net effect ofthe aerosols are due to uncertainties in the evaluation of theabsorption coefficient that is usually much smaller than thescattering coefficient. Although, the extinction coefficientcan be determined with a given precision using a white cell,exact splitting of the two contributions, absorption and scat-tering, is not an easy task and has a very high uncertainty,especially the determination of the absorption coefficient.
In the current study the absorption coefficients were eval-uated by measuring the transmission of light through everyfilter before and after the aerosol collection. The methodused is an adaptation of the well known integrating platemethod (Lin et al., 1973), with some changes from the origi-nal method in the illumination and detection systems.
The light source was provided by a 50-W tungsten halo-gen lamp. A monochromator was laid between the light andthe integrating plate. This allows the filter to be illuminatedwith monochromatic light with a wavelength dependent onthe diffraction grating of the monochromator. The detectionsystem was a simple photosensor. With this approach sev-eral wavelengths in the visible spectral region can be used.The monochromator spectral window is 400–650 nm with a50 nm resolution. The diagram of the measurement systemis shown in Fig.2.
Absorption coefficients (σa) of particle samples with aero-dynamic size below 1µm were determined by measuring theapparent transmission,T (λ), of the incident light through thepolycarbonate filter:
T (λ) =If (λ)
I0(λ), (1)
where If (λ) and I0(λ) are the intensities of light passingthrough the loaded and unloaded filter, respectively, for eachwavelength. Assuming that the attenuation of the light beamfollows the Beer-Lambert law, one has:
If (λ) = I0(λ)e−xσa(λ), (2)
wherex is the optical path length calculated from the vol-ume of sampled air and the effective cross-section area of thefilter (x=
VA
). The absorption coefficient can be determinedknowingI0(λ), If (λ), V andA:
σa(λ) = −A
Vln
If (λ)
I0(λ). (3)
The mass absorption specific coefficient of fine particles,Ba(λ) is:
Ba(λ) =σa(λ)
Mφ<1µm, (4)
halogen
detector
opal glass platemonochromator
foto−
tungsten
filter
Fig. 2. Schema of the optical system using the integrating plate(opal glass plate) for the analysis of light absorbing aerosols. Thelight source is a 50-W tungsten halogen lamp. The monochromatorcan work from 400 nm to 650 nm. The detection is provided by aphotosensor.
whereMφ<1µm is the mass concentration of fine particles(aerodynamic size below 1µm).
By using this method, it is assumed that the optical proper-ties of the particles are unchanged by the collection methodand that their behavior remain unaltered after collection onthe filter.
With a system analogous to ours, it was determined that9% of the scattering is measured as absorption (Bond et al.,1999). As we do not measure either scattering or extinctionwe are unable to correct the absorption values for this error.The method is very reproducible (within 1–2% margin) butthe calibration of the instrument has an uncertainty of≈20%.
The filters were weighed before and after collection for de-termination of the amount of particulate matter in each im-pactor stage. The transmission measurements of the cleanfilter and the loaded filter were separated by 36–46 h to allowstabilization and acclimatization in the weighing room. Spe-cial care was taken in order to remove electrical charges fromthe filters. Transmission measurements were made throughblank filters for testing filters variability. For a 46-h periodbetween the measurements of the blank and the loaded filterno differences were observed.
Based on an evaluation using propagation of errors we es-timated an error forσa between 27% and 39%. The errorhas a spectral dependence, with larger errors at 400 nm thanat 650 nm. This is related with the low intensity of the lightsource for the smaller wavelengths and the transmittance ofthe polycarbonate filter, which are the main sources of errorand together represent 80% of the total error. Other sourcesof uncertainty are the area of aerosol deposit and the volumeof sampled air. The estimated detection limit, for a 24-h av-erage sample, is 1.46×10⁻⁸ m−1.
www.atmos-chem-phys.org/acp/5/2739/ Atmos. Chem. Phys., 5, 2739–2748, 2005

2742 S. Mogo et al.: SEM/EDX andBa of Valladolid aerosol
Table 2. Particles sampled on each impactor stage. Values represent the percent of particles in each size stage.
Elemental <1µm 1–2.5µm 2.5–10µm >10µmanalysis c i s p c i s p c i s p c i s p
S – 4 15 – – 3 – – – 6 – – – 12 – –Cl salts – – – – – 27 – – – 33 12 – – 15 – 4>Si, Ca (Al, Fe) – 4 4 – – 22 5 – – 18 3 6 – 31 – 12>Si, Ti (Ca) – – – – – – – – – – – 3 – – – –C 42 – 31 – 30 – 11 – 9 – – – 12 4 – –>Fe – – – – – – 3 – – 6 – 3 – – – –>Zn – – – – – – – – – – – – – 4 – –>Al – – – – – – – – – – – – – 4 – 4
Fig. 3. SEM photo and x-ray spectrum of particles in the range bellow 1µm. The darker points are the filter pores.(a) Carbon chains. Goldpeaks in x-ray spectrum are due to the gold coating of the filter.(b) Spherical carbon particle.(c) Spherical sulfur-rich particle. The carbonpeak is due to the carbon coating of the filter.
3 Results and discussion
3.1 SEM and EDX
The filters were covered with a conductive layer in order tomake them visible in the electron microscope. This coatingwas made in some cases with a gold layer and in others witha carbon layer. Thus, in the x-ray spectra appears peaks dueto either the gold or carbon coating and are ignored whenperforming the analysis. In the case of carbonaceous parti-
cles they can be distinguished from the polycarbonate filtermaterial on which they are collected because they present amuch stronger signal than that of the filter. This informationtogether with its morphology was used in order to separatethe signal of the particle from that of the polycarbonate filter.
We performed a detailed analysis of 12 filters from threerepresentative days of measurements, From each filter, 20particles were analyzed for a total of 240. Several classesof particles were detected in each impactor stage from both
Atmos. Chem. Phys., 5, 2739–2748, 2005 www.atmos-chem-phys.org/acp/5/2739/
S. Mogo et al.: SEM/EDX andBa of Valladolid aerosol 2743
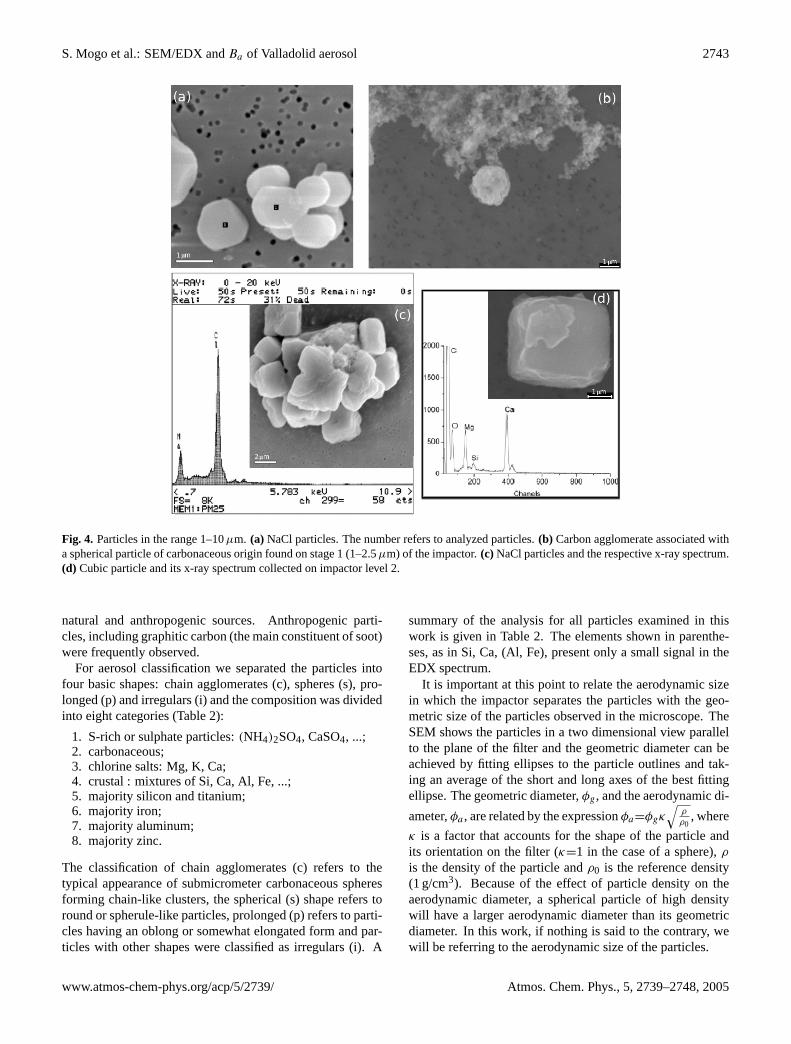
Fig. 4. Particles in the range 1–10µm. (a) NaCl particles. The number refers to analyzed particles.(b) Carbon agglomerate associated witha spherical particle of carbonaceous origin found on stage 1 (1–2.5µm) of the impactor.(c) NaCl particles and the respective x-ray spectrum.(d) Cubic particle and its x-ray spectrum collected on impactor level 2.
natural and anthropogenic sources. Anthropogenic parti-cles, including graphitic carbon (the main constituent of soot)were frequently observed.
For aerosol classification we separated the particles intofour basic shapes: chain agglomerates (c), spheres (s), pro-longed (p) and irregulars (i) and the composition was dividedinto eight categories (Table2):
1. S-rich or sulphate particles:(NH4)2SO4, CaSO4, ...;2. carbonaceous;3. chlorine salts: Mg, K, Ca;4. crustal : mixtures of Si, Ca, Al, Fe, ...;5. majority silicon and titanium;6. majority iron;7. majority aluminum;8. majority zinc.
The classification of chain agglomerates (c) refers to thetypical appearance of submicrometer carbonaceous spheresforming chain-like clusters, the spherical (s) shape refers toround or spherule-like particles, prolonged (p) refers to parti-cles having an oblong or somewhat elongated form and par-ticles with other shapes were classified as irregulars (i). A
summary of the analysis for all particles examined in thiswork is given in Table2. The elements shown in parenthe-ses, as in Si, Ca, (Al, Fe), present only a small signal in theEDX spectrum.
It is important at this point to relate the aerodynamic sizein which the impactor separates the particles with the geo-metric size of the particles observed in the microscope. TheSEM shows the particles in a two dimensional view parallelto the plane of the filter and the geometric diameter can beachieved by fitting ellipses to the particle outlines and tak-ing an average of the short and long axes of the best fittingellipse. The geometric diameter,φg, and the aerodynamic di-
ameter,φa , are related by the expressionφa=φgκ√
ρρ0
, where
κ is a factor that accounts for the shape of the particle andits orientation on the filter (κ=1 in the case of a sphere),ρ
is the density of the particle andρ0 is the reference density(1 g/cm3). Because of the effect of particle density on theaerodynamic diameter, a spherical particle of high densitywill have a larger aerodynamic diameter than its geometricdiameter. In this work, if nothing is said to the contrary, wewill be referring to the aerodynamic size of the particles.
www.atmos-chem-phys.org/acp/5/2739/ Atmos. Chem. Phys., 5, 2739–2748, 2005
2744 S. Mogo et al.: SEM/EDX andBa of Valladolid aerosol
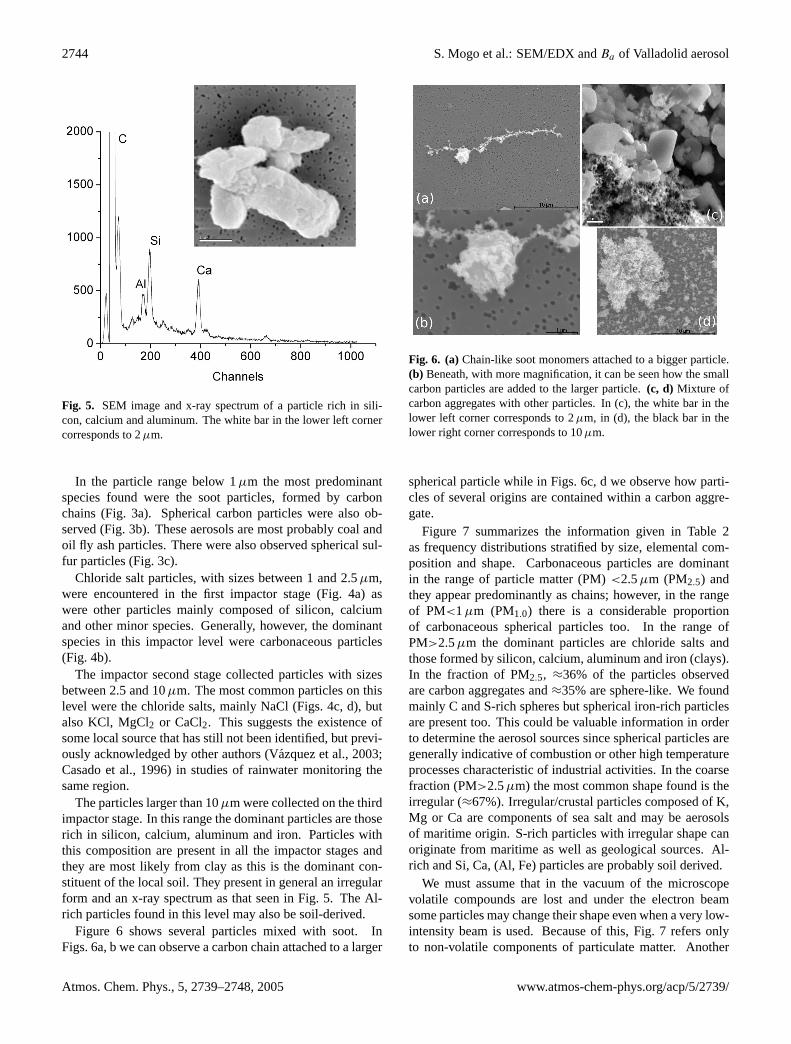
Fig. 5. SEM image and x-ray spectrum of a particle rich in sili-con, calcium and aluminum. The white bar in the lower left cornercorresponds to 2µm.
In the particle range below 1µm the most predominantspecies found were the soot particles, formed by carbonchains (Fig.3a). Spherical carbon particles were also ob-served (Fig.3b). These aerosols are most probably coal andoil fly ash particles. There were also observed spherical sul-fur particles (Fig.3c).
Chloride salt particles, with sizes between 1 and 2.5µm,were encountered in the first impactor stage (Fig.4a) aswere other particles mainly composed of silicon, calciumand other minor species. Generally, however, the dominantspecies in this impactor level were carbonaceous particles(Fig. 4b).
The impactor second stage collected particles with sizesbetween 2.5 and 10µm. The most common particles on thislevel were the chloride salts, mainly NaCl (Figs.4c, d), butalso KCl, MgCl2 or CaCl2. This suggests the existence ofsome local source that has still not been identified, but previ-ously acknowledged by other authors (Vazquez et al., 2003;Casado et al., 1996) in studies of rainwater monitoring thesame region.
The particles larger than 10µm were collected on the thirdimpactor stage. In this range the dominant particles are thoserich in silicon, calcium, aluminum and iron. Particles withthis composition are present in all the impactor stages andthey are most likely from clay as this is the dominant con-stituent of the local soil. They present in general an irregularform and an x-ray spectrum as that seen in Fig.5. The Al-rich particles found in this level may also be soil-derived.
Figure 6 shows several particles mixed with soot. InFigs.6a, b we can observe a carbon chain attached to a larger
Fig. 6. (a)Chain-like soot monomers attached to a bigger particle.(b) Beneath, with more magnification, it can be seen how the smallcarbon particles are added to the larger particle.(c, d) Mixture ofcarbon aggregates with other particles. In (c), the white bar in thelower left corner corresponds to 2µm, in (d), the black bar in thelower right corner corresponds to 10µm.
spherical particle while in Figs.6c, d we observe how parti-cles of several origins are contained within a carbon aggre-gate.
Figure 7 summarizes the information given in Table2as frequency distributions stratified by size, elemental com-position and shape. Carbonaceous particles are dominantin the range of particle matter (PM)<2.5µm (PM2.5) andthey appear predominantly as chains; however, in the rangeof PM<1µm (PM1.0) there is a considerable proportionof carbonaceous spherical particles too. In the range ofPM>2.5µm the dominant particles are chloride salts andthose formed by silicon, calcium, aluminum and iron (clays).In the fraction of PM2.5, ≈36% of the particles observedare carbon aggregates and≈35% are sphere-like. We foundmainly C and S-rich spheres but spherical iron-rich particlesare present too. This could be valuable information in orderto determine the aerosol sources since spherical particles aregenerally indicative of combustion or other high temperatureprocesses characteristic of industrial activities. In the coarsefraction (PM>2.5µm) the most common shape found is theirregular (≈67%). Irregular/crustal particles composed of K,Mg or Ca are components of sea salt and may be aerosolsof maritime origin. S-rich particles with irregular shape canoriginate from maritime as well as geological sources. Al-rich and Si, Ca, (Al, Fe) particles are probably soil derived.
We must assume that in the vacuum of the microscopevolatile compounds are lost and under the electron beamsome particles may change their shape even when a very low-intensity beam is used. Because of this, Fig.7 refers onlyto non-volatile components of particulate matter. Another
Atmos. Chem. Phys., 5, 2739–2748, 2005 www.atmos-chem-phys.org/acp/5/2739/

S. Mogo et al.: SEM/EDX andBa of Valladolid aerosol 2745
Fig. 7. Frequency distribution of the analyzed particles by size,composition and shape. As in the Table2, c , i , s and p meanchain agglomerate, irregular, spherical and prolonged, respectively.Each column represents a characteristic elemental composition. 60particles were analyzed in each range of sizes.
limitation of the SEM is that the method is very laboriousand time consuming; nevertheless, it is a powerful tool fordetailed characterization of individual aerosol particles.
3.2 Mass concentration and mass absorption coefficients
There is a complete lack of information about absorption andscattering coefficients in the atmosphere of Valladolid (nei-ther any other towns from center Spain) and its environmentis not comparable to other towns in central Europe becausethe combination of the aridity and the agricultural usage ofthe land result in aerosol masses that are high compared toother European cities of similar size and population. This isalso true for all of central Spain. The absorption coefficientswere measured only for particles with aerodynamic diame-ters<1µm. Larger particles may potentially contribute tothe the overall atmospheric absorption coefficient; however,as discussed in the previous section, the majority of carbona-ceous material was found at sizes smaller than 1µm. Sinceelemental carbon is the most predominant light absorber inthe atmosphere, the measurements of absorption coefficientthat we present here are probably good estimates of the totalabsorption coefficient.
Figure 8 shows the time variation of the absorption co-efficient at visible wavelengths during the periods of sam-pling. For a wavelength that is close to the middle of thevisible spectrum, 550 nm, minimum and maximum values of7×10−6 m−1 and 100×10−6 m−1 were measured. The av-erage value for all the campaign period was 45×10−6 m−1.After averaging over all wavelengths we get a minimum of
Fig. 8. Time variation of aerosol absorption coefficient during thecampaign for PM1.0.
7×10⁻⁶ m−1 and a maximum of 100×10−6 m−1. The aver-age absorption coefficient observed was 47×10−6 m−1. Thevalues ofσa measured in Valladolid are comparable in rangewith the monthly means reported for Melpitz, Germany,5×10−6 m−1 to 80×10−6 m−1 (Heintzenberg and Bussemer,2000). Values of 50×10−6 m−1 to 250×10−6 m−1 were re-ported for Asian dust with black carbon contamination (Chouet al., 2003).
Figure 9 shows variations of the absorption coefficientthrough the visible spectrum. The three curves belongto three representative sample days, one particularly high(11 February), one particularly low (26 February) and onenormal day (20 April). It can be observed that the ab-sorption coefficient value decreases with the wavelength;however, this decrease is not very pronounced during ourmeasurement period, reaching a maximum difference of31×10−6 m−1 between 400 nm and 650 nm, a minimum dif-ference of 3×10⁻⁶ m−1 and an average of 18×10−6 m−1.The wavelength dependence of the absorption coefficient canbe approximated byσa=Kλ−αa , whereK is a constant,λis the wavelength of light andαa is the alpha exponent forabsorption. For an aerosol whose absorption coefficient hasno wavelength dependence,αa=0. An urban aerosol valueof αa=1 has been reported (Rosen et al., 1979; Kirchstet-ter et al., 2004). The averageαa value for all the days ofour campaign is 0.8. On the day with relatively high ab-sorption coefficients it can be seen that the trend with wave-length is somewhat different than the other days, i.e., thereis almost no difference between 400 nm and 500 nm. On theother hand, because of the estimated uncertainty in the mea-surement, shown by the vertical bars, these differences arewithin the expected accuracy of the measurement.
Figure 10 shows a time series of total particulate mat-ter (TPM), PM1.0, and the ratio of coarse to fine mode(C/F) during the campaign period. TPM values vary from40µg·m−3 to 185µg·m−3 and the average for all the cam-paign days was 108µg·m−3. Fine particle concentrationsranged between 10µg·m−3 and 54µg·m−3 with an average
www.atmos-chem-phys.org/acp/5/2739/ Atmos. Chem. Phys., 5, 2739–2748, 2005
2746 S. Mogo et al.: SEM/EDX andBa of Valladolid aerosol
Fig. 9. Aerosol absorption coefficient variation within the visiblespectrum. The different lines belong to three example days: oneparticularly high, 11 February (•); one particularly low, 26 February(N); and one normal day, 20 April (H).
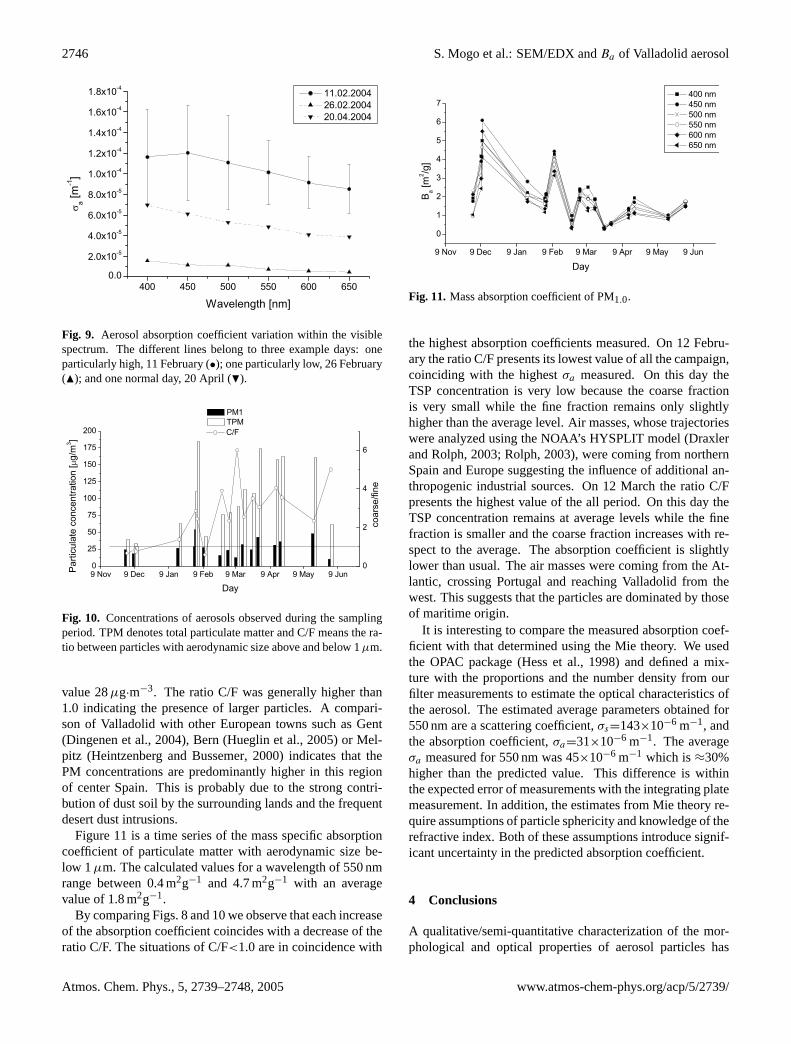
Fig. 10. Concentrations of aerosols observed during the samplingperiod. TPM denotes total particulate matter and C/F means the ra-tio between particles with aerodynamic size above and below 1µm.
value 28µg·m−3. The ratio C/F was generally higher than1.0 indicating the presence of larger particles. A compari-son of Valladolid with other European towns such as Gent(Dingenen et al., 2004), Bern (Hueglin et al., 2005) or Mel-pitz (Heintzenberg and Bussemer, 2000) indicates that thePM concentrations are predominantly higher in this regionof center Spain. This is probably due to the strong contri-bution of dust soil by the surrounding lands and the frequentdesert dust intrusions.
Figure11 is a time series of the mass specific absorptioncoefficient of particulate matter with aerodynamic size be-low 1µm. The calculated values for a wavelength of 550 nmrange between 0.4 m2g−1 and 4.7 m2g−1 with an averagevalue of 1.8 m2g−1.
By comparing Figs.8 and10we observe that each increaseof the absorption coefficient coincides with a decrease of theratio C/F. The situations of C/F<1.0 are in coincidence with
Fig. 11. Mass absorption coefficient of PM1.0.
the highest absorption coefficients measured. On 12 Febru-ary the ratio C/F presents its lowest value of all the campaign,coinciding with the highestσa measured. On this day theTSP concentration is very low because the coarse fractionis very small while the fine fraction remains only slightlyhigher than the average level. Air masses, whose trajectorieswere analyzed using the NOAA’s HYSPLIT model (Draxlerand Rolph, 2003; Rolph, 2003), were coming from northernSpain and Europe suggesting the influence of additional an-thropogenic industrial sources. On 12 March the ratio C/Fpresents the highest value of the all period. On this day theTSP concentration remains at average levels while the finefraction is smaller and the coarse fraction increases with re-spect to the average. The absorption coefficient is slightlylower than usual. The air masses were coming from the At-lantic, crossing Portugal and reaching Valladolid from thewest. This suggests that the particles are dominated by thoseof maritime origin.
It is interesting to compare the measured absorption coef-ficient with that determined using the Mie theory. We usedthe OPAC package (Hess et al., 1998) and defined a mix-ture with the proportions and the number density from ourfilter measurements to estimate the optical characteristics ofthe aerosol. The estimated average parameters obtained for550 nm are a scattering coefficient,σs=143×10−6 m−1, andthe absorption coefficient,σa=31×10−6 m−1. The averageσa measured for 550 nm was 45×10−6 m−1 which is≈30%higher than the predicted value. This difference is withinthe expected error of measurements with the integrating platemeasurement. In addition, the estimates from Mie theory re-quire assumptions of particle sphericity and knowledge of therefractive index. Both of these assumptions introduce signif-icant uncertainty in the predicted absorption coefficient.
4 Conclusions
A qualitative/semi-quantitative characterization of the mor-phological and optical properties of aerosol particles has
Atmos. Chem. Phys., 5, 2739–2748, 2005 www.atmos-chem-phys.org/acp/5/2739/

S. Mogo et al.: SEM/EDX andBa of Valladolid aerosol 2747
been carried out as part of a more extensive and general studyabout the aerosols in the urban atmosphere of Valladolid. Anoptical technique (integrating plate) was used to obtain ab-sorption information about the particles collected in the fil-ters. Scanning electron microscopy and energy dispersivex-ray analysis were used for obtaining information about themorphological properties of individual particles and their el-emental composition.
Particles of natural and anthropogenic origin were ob-served with graphitic carbon particles dominating those ofanthropogenic origin. These carbon particles were foundon all size stages of the impactor but most frequency in thePM1.0 size range. Coal and oil fly ash particles were domi-nant in the 1 to 2.5µm aerodynamic size range whereas from1µm to 10µm large amounts of salts were observed, sug-gesting the presence of a more local source whose locationrequires further studies.
Black carbon particles are present as an important com-ponent of the fine fraction matter and we consider it can beresponsible for the majority of the measured visible light ab-sorption. Nevertheless dust also contributes to the absorptionon those days where these particles are present in higher con-centrations. In general, we observed that the fine mode par-ticles found in the Valladolid atmosphere are more usuallyrelated with anthropogenic air pollution whereas the coarsemode is the most abundant mass fraction found and consistsmostly of mineral particles with natural origin. This couldexplain the low to medium values of the absorption coeffi-cient measured.
Acknowledgements.This work was partially supported by theCYCIT Ref. REN2002-00966/CLI. We thank an anonymousreviewer and D. Baumgardner for helpful comments.
Edited by: R. Hitzenberger
References
Anderson, J., Buseck, P., Saucy, D., and Pacyna, J.: Characteriza-tion of individual fine-fraction particles from the Arctic aerosolat SPITsbergen, May–June 1987, Atmos. Environ., 26A, 1747–1762, 1992.
Bond, T., Anderson, T., and Campbell, D.: Calibration and inter-comparison of filter-based measurements of visible light absorp-tion by aerosols, Aerosol Sci. Technol., 30, 582–600, 1999.
Buseck, P. and Posfai, M.: Airbone minerals and related aerosolparticles: Effects on climate and environment, Proc. Nat. Acad.Sci. USA, 96, 3372–2279, 1999.
Casado, H., Encinas, D., and Lacaux, J.: Relationship between theatmospheric particulate fraction and the ionic content of precip-itation in an area under influence of a waste incinerator locatedin the Basque Country (Spain), Atmos. Environ., 30, 1537–1542,1996.
Chandra, S., Satheest, S., and Srinivasan, J.: Can the state ofmixing of black carbon aerosols explain the mistery of ‘ex-cess’ atmospheric absorption?, Geophys. Res. Lett., 31, L19 109,doi:10.1029/2004GL020662, 2004.
Chou, C., Chen, T.-K., Huang, S.-H., and Liu, S.: Radiative absorp-tion capability of Asian dust with black carbon contamination,Geophys. Res. Lett., 30, 1616, doi:10.1029/2003GL017076,2003.
Dingenen, R. V., Raes, F., Putaud, J.-P., Baltensperger, U., Charron,A., Facchini, M.-C., Decesari, S., Fuzzi, S., Gehrig, R., Hans-son, H.-C., Harrison, R. M., Huglin, C., Jones, A. M., Laj, P.,Lorbeer, G., Maenhaut, W., Palmgren, F., Querol, X., Rodriguez,S., Schneider, J., t. Brink, H., Tunved, P., Tørseth, K., Wehner, B.,Weingartner, E., Wiedensohler, A., and Wahlin, P.: A Europeanaerosol phenomenology 1: physical characteristics of particulatematter at kerbside, urban, rural and background sites in Europe,Atmos. Environ., 38, 2561–2577, 2004.
Draxler, R. and Rolph, G.: (HYbrid Single-Particle LagrangianIntegrated Trajectory) Model access via NOAA ARL READYWebsite (http://www.arl.noaa.gov/ready/hysplit4.html), NOAAAir Resources Laboratory, Silver Spring, MD, 2003.
Hanel, G. and Hillenbrand, C.: Calorimetric measurement of opticalabsorption, Appl. Opt., 28, 510–516, 1989.
Hansen, J. and Nazarenko, L.: Soot climate forcing via snow andice albedos, Proc. Nat. Acad. Sci. USA, 101, 423–428, 2004.
Haywood, J. and Boucher, O.: Estimates of direct and indirect ra-diative forcing due to tropospheric aerosols: a review, Rev. Geo-phys., 38, 513–543, 2000.
Heintzenberg, J. and Bussemer, M.: Development and applicationof a spectral light absorption photometer for aerosol and hydrosolsamples, J. Aerosol Sci., 31, 801–812, 2000.
Hess, M., Koepke, P., and Schult, I.: Optical Properties of Aerosolsand clouds: The software package OPAC, Bull. Am. Met. Soc.,79, 831–844, 1998.
Horvath, H.: Atmospheric light absorption – a review, Atmos. Env-iron., 27A, 293–317, 1993.
Hueglin, C., Gehrig, R., Baltensperger, U., Gysel, M., Monn, C.,and Vonmont, H.: Chemical characterisation of PM2.5, PM10and coarse particles at urban, near-city and rural sites in Switzer-land, Atmos. Environ., 39, 637–651, 2005.
Kirchstetter, T., Novakov, T., and Hobbs, P.: Evidence thatthe spectral dependence of light absorption by aerosols is af-fected by organic carbon, J. Geophys. Res., 109, D21 208,doi:10.1029/2004JD004999, 2004.
Lin, C., Baker, M., and Charlson, R.: Absorption coefficient of at-mospheric aerosol: a method of measurement, Appl. Opt., 12,1356–1363, 1973.
McMurry, P., Litchy, M., Huang, P., Cai, X., Turpin, B., Dick,W., and Hanson, A.: Elemental composition and morphologyof individual particles separated by size and hygroscopicity withTDMA, Atmos. Environ., 30, 101–108, 1996.
Posfai, M., Simonics, R., Li, J., Hobbs, P., and P.Buseck: Individualaerosol particles from biomass burning in southern Africa: 1.Compositions and size distributions of carbonaceous particles, J.Geophys. Res., 108, 8483, doi:10.1029/2002JD002291, 2003.
Querol, X., Alastuey, A., Viana, M., Rodriguez, S., Artinano, B.,Salvador, P., Santos, S., Patier, R., Ruiz, C., de la Rosa, J., de laCampa, A., Menendez, M., and Gil, J.: Speciation and origin ofPM10 and PM2.5 in Spain, J. Aerosol Sci., 35, 1151–1172, 2004.
Ramsden, A. and Shibaoka, M.: Characterization and analysis ofindividual fly-ash particles from coal-fired power stations bya combination of optical microscopy, electron microscopy andquantitative electron microprobe analysis, Atmos. Environ., 16,
www.atmos-chem-phys.org/acp/5/2739/ Atmos. Chem. Phys., 5, 2739–2748, 2005
2748 S. Mogo et al.: SEM/EDX andBa of Valladolid aerosol
2191–2206, 1982.Roberts, D. and Jones, A.: Climate sensitivity to black carbon
aerosol from fossil fuel combustion, J. Geophys. Res., 109,D16 202, doi:10.1029/2004JD004676, 2004.
Rodrıguez, S., Querol, X., Alastuey, A., Kallos, G., and Kakaliagou,O.: Saharan dust contributions to PM10 and TSP levels in South-ern and Eastern Spain, Atmos. Environ., 35, 2433–2447, 2001.
Rolph, G.: Real-time Environmental Applications and Display sYs-tem (READY) Website (http://www.arl.noaa.gov/ready/hysplit4.html), NOAA Air Resources Laboratory, Silver Spring, MD,2003.
Rosen, H., Hansen, D., Gundel, L., and Novakov, T.: Carbonaceousparticles in the atmosphere, chap. Identification of the graphiticcarbon component of source and ambient particulates by Ramanspectroscopy and an optical attenuation technique, pp. 229–232,Lawrence Berkeley Laboratory, 1979.
Sanchez, M., Pascual, D., Ramos, C., and Perez, I.: Forecastingparticulate pollutant concentrations in a city from meteorologicalvariables and regional weather patterns, Atmos. Environ., 24A,1509–1519, 1990.
Vazquez, A., Costoya, M., Pena, R., Garcıa, S., and Herrero, C.: Arainwater quality monitoring network: a preliminary study of thecomposition of rainwater in Galicia (NW Spain), Chemosp., 51,375–386, 2003.
Wang, C.: A modeling study on the climate impacts ofblack carbon aerosols, J. Geophys. Res., 109, D03 106,doi:10.1029/2003JD004084, 2004.
Atmos. Chem. Phys., 5, 2739–2748, 2005 www.atmos-chem-phys.org/acp/5/2739/
Related Documents