Morphodynamics of intertidal bar morphology on a macrotidal beach under low-energy wave conditions, North Lincolnshire, England Aart Kroon a; , Gerhard Masselink b a Institute for Marine and Atmospheric Research Utrecht, Department of Physical Geography, Utrecht University, P.O. Box 80115, 3508 TC Utrecht, The Netherlands b Department of Geography, University of Loughborough, Loughborough, Leicestershire, LE11 3TU, UK Received 27 December 2001; accepted 12 July 2002 Abstract The morphological changes of multiple intertidal bars (ridges) on a macrotidal beach were examined under low- energy wave conditions during a spring-to-spring tidal cycle. The morphological response was coupled to the tidal water level variations and related residence times for swash processes and surf (breaking waves and bores) over the cross-shore profile. Spring tides induced a large spatial variation in water lines and small residence times for distinct processes. Neap tides narrowed the intertidal area and increased the time for certain processes to work on the sediment at one location. The observed morphological changes could be coupled to the stagnation of processes at a certain bar crest position. The action of surf (breaking waves and bores) played the major role in the onshore migration of the intertidal bars and the simultaneous erosion of the seaward flank. Swash action, responsible for the generation and migration of intertidal bars in microtidal settings, was not the dominant process in causing the observed morphological changes. Intertidal ridges on macrotidal beaches cannot be considered swash bars as suggested by most previous investigations into these morphological features. ȣ 2002 Elsevier Science B.V. All rights reserved. Keywords: beach; intertidal bars; ridge; runnel; macrotidal; swash; bores 1. Introduction Intertidal bar morphology is common on many tidal beaches. The morphodynamics of such inter- tidal bar systems are primarily controlled by the tidal range and the incident wave energy level and variability. Two types of intertidal bar systems can loosely be identi¢ed. On beaches subjected to small tidal ranges ( 6 3 m) there is generally only space enough for a single intertidal bar/ trough system. Such bars may originally have de- veloped near the low-water line and migrated on- shore towards the upper beach (berm) following low-energy wave conditions (Hayes and Booth- royd, 1969; Davis et al., 1972; Owens and Frobel, 1977; Wijnberg and Kroon, in press). Their pres- ence and migration are therefore indicative of on- shore sediment transport and their morphology characterised by distinct landward slip faces testi- 0025-3227 / 02 / $ ^ see front matter ȣ 2002 Elsevier Science B.V. All rights reserved. PII:S0025-3227(02)00475-9 * Corresponding author. Tel: +31-30-2533864; fax: +31-30-2531145. E-mail address: [email protected] (A. Kroon). MARGO 3197 8-10-02 Marine Geology 190 (2002) 591^608 www.elsevier.com/locate/margeo

Welcome message from author
This document is posted to help you gain knowledge. Please leave a comment to let me know what you think about it! Share it to your friends and learn new things together.
Transcript

Morphodynamics of intertidal bar morphologyon a macrotidal beach under low-energy wave conditions,
North Lincolnshire, England
Aart Kroon a;�, Gerhard Masselink b
a Institute for Marine and Atmospheric Research Utrecht, Department of Physical Geography, Utrecht University,P.O. Box 80115, 3508 TC Utrecht, The Netherlands
b Department of Geography, University of Loughborough, Loughborough, Leicestershire, LE11 3TU, UK
Received 27 December 2001; accepted 12 July 2002
Abstract
The morphological changes of multiple intertidal bars (ridges) on a macrotidal beach were examined under low-energy wave conditions during a spring-to-spring tidal cycle. The morphological response was coupled to the tidalwater level variations and related residence times for swash processes and surf (breaking waves and bores) over thecross-shore profile. Spring tides induced a large spatial variation in water lines and small residence times for distinctprocesses. Neap tides narrowed the intertidal area and increased the time for certain processes to work on the sedimentat one location. The observed morphological changes could be coupled to the stagnation of processes at a certain barcrest position. The action of surf (breaking waves and bores) played the major role in the onshore migration of theintertidal bars and the simultaneous erosion of the seaward flank. Swash action, responsible for the generation andmigration of intertidal bars in microtidal settings, was not the dominant process in causing the observedmorphological changes. Intertidal ridges on macrotidal beaches cannot be considered swash bars as suggested by mostprevious investigations into these morphological features.0 2002 Elsevier Science B.V. All rights reserved.
Keywords: beach; intertidal bars; ridge; runnel; macrotidal; swash; bores
1. Introduction
Intertidal bar morphology is common on manytidal beaches. The morphodynamics of such inter-tidal bar systems are primarily controlled by thetidal range and the incident wave energy level andvariability. Two types of intertidal bar systems
can loosely be identi¢ed. On beaches subjectedto small tidal ranges (6 3 m) there is generallyonly space enough for a single intertidal bar/trough system. Such bars may originally have de-veloped near the low-water line and migrated on-shore towards the upper beach (berm) followinglow-energy wave conditions (Hayes and Booth-royd, 1969; Davis et al., 1972; Owens and Frobel,1977; Wijnberg and Kroon, in press). Their pres-ence and migration are therefore indicative of on-shore sediment transport and their morphologycharacterised by distinct landward slip faces testi-
0025-3227 / 02 / $ ^ see front matter 0 2002 Elsevier Science B.V. All rights reserved.PII: S 0 0 2 5 - 3 2 2 7 ( 0 2 ) 0 0 4 7 5 - 9
* Corresponding author. Tel: +31-30-2533864;fax: +31-30-2531145.
E-mail address: [email protected] (A. Kroon).
MARGO 3197 8-10-02
Marine Geology 190 (2002) 591^608
www.elsevier.com/locate/margeo

¢es this. Such intertidal bars ¢nally merge or weldwith the berm, or £atten as a result of macro-scalebeach pro¢le adjustment following storm erosion.On those beaches subjected to large tidal ranges(s 3 m), the intertidal zone is wide enough toaccommodate a number of intertidal bar/troughsystems. Here, however, the bars appear not tobe related to macro-scale beach pro¢le adjustment(Mulrennan, 1992), but are thought to be associ-ated with local adjustments of the beach gradient(King and Williams, 1949; King, 1972). Such in-tertidal bars are relatively stationary features andgenerally do not have a pronounced asymmetriccross-shore pro¢le with a slip face (Mulrennan,1992; Sipka and Anthony, 1999).The present study is concerned with the mor-
phodynamics of multiple intertidal bar systems.The type of morphology under consideration isgenerally known as ‘ridge and runnel’ morphol-ogy, a term introduced by King and Williams(1949) to describe the morphological highs andintervening lows found in the intertidal zones ofsome fetch-limited, macrotidal beaches in Eng-land and France. According to King and Williams(1949), the ridges are intertidal swash bars thathave survived tidal immersion. King (1972, p.343) further suggested that ‘ridges and runnelsare the result of an attempt by the waves to pro-duce an equilibrium swash zone gradient, suitableto their dimensions, on a beach the overall gra-dient of which is £atter than the equilibrium gra-dient’. The notion that the ridges are intertidalswash bars has become more or less entrenchedin the coastal literature (Orford and Wright,1978). It seems prudent, however, to brie£y reviewon what basis it has been deduced that the ridgesare formed by swash processes. In laboratory ex-periments reported by King and Williams (1949)it was shown that a bar formed by breaking waves(‘breaker bar’) was £attened, if not destroyed by afalling water level. A ridge formed by high-tideswash processes (‘swash bar’), on the otherhand, was left undisturbed by a falling water lev-el. On the basis of these results, King and Wil-liams (1949, p. 84) felt justi¢ed to conclude ‘atentative correlation (T) of swash bars with theridges found on some tidal beaches’. King andWilliams (1949) also noted that the upper part
of the seaward slope of ridges on natural beachesis generally smooth and this provided their secondreason for presuming that the ridges are formedby the same agencies as swash bars. King (1972,p. 344) argued that ‘where waves are adjusting thegradient of the swash slope to suit their dimen-sions the process will continue most e¡ectivelywhere the waves are at speci¢c levels for the lon-gest period on a tidal beach’. Carrying this argu-ment through, King (1972) postulated that theselevels will be the position of the mean low springand neap tides and found this hypothesis con-¢rmed by long-term ¢eld observations conductedon Blackpool beach.When the cumulative evidence put forward by
King and Williams (1949) and King (1972) tosupport a swash origin of the ridges is consideredin a fresh light it does not seem to hold up verywell. Firstly, the laboratory experiments wererather inconclusive. For example, no attemptwas made to form swash bars in the intertidalzone, so the e¡ect of falling water levels on inter-tidal swash bars was not investigated. The factthat the seaward slopes of the ridges are generallysmooth does not con¢rm a swash origin either.Whether or not an intertidal surface is left smoothor rippled by falling tide levels is more a re£ectionof the ability of the swash to £atten the ripplesformed by wave processes, than an indication ofthe dominant hydrodynamic process. Finally, ob-servations on most ridge and runnel beaches re-ported in the literature suggest that the locationsof the ridges are not related to the positions onthe intertidal pro¢le where the water level is sta-tionary for the longest time, but are distributedacross the entire intertidal pro¢le (Wright, 1976;Orford, 1985; Mulrennan, 1992; Masselink andAnthony, 2001). There is even some evidence tosuggest that the largest intertidal ridges are mostlikely to be found around the mid-tide level,where the swash zone is never stationary (Masse-link and Anthony, 2001).Most ridge and runnel beaches are subjected to
semi-diurnal, macrotidal tidal regimes. In suchenvironments, non-stationary water levels due tothe tides is an important characteristic of the hy-drodynamics. Concurrent with the vertical varia-tion in the water level is the migration of di¡erent
MARGO 3197 8-10-02
A. Kroon, G. Masselink /Marine Geology 190 (2002) 591^608592

hydrodynamic zones across the beach pro¢le(Masselink, 1993). Almost all ridges are expectedto experience at some stage during the neap-to-spring tidal cycle a mixture of swash, surf zoneand shoaling wave processes (and aeolian process-es during periods of emergence). The frequency ofoccurrence of each of these processes, not to bemistaken for their relative importance, will varyspatially across the intertidal pro¢le and tempo-rally with changing wave/tide conditions.It seems imperative that any study aimed at
investigating the formation and maintenance ofridge and runnel morphology must address thespatial and temporal variation in the relative im-portance of the di¡erent hydrodynamic processes.However, despite an resurgence of interest inridge and runnel morphodynamics (Voulgaris etal., 1996, 1998; Levoy et al., 1998; Sipka andAnthony, 1999; Chauhan, 2000) none of theserecent studies have addressed this. Masselinkand Anthony (2001) suggested that it is possible,if not probable, that swash and surf zone process-es work in concert to develop and maintain ridgeand runnel morphology. They further suggestedthat to investigate this hypothesis, comprehensive¢eld measurements complemented by numericalmodelling are required.The objective of this paper is to investigate the
relative importance of swash and surf zone pro-cesses in maintaining ridge and runnel morphol-ogy. Detailed morphological and hydrodynamicmeasurements were conducted on a ridge and run-nel beach over a 2-week period. The ¢eld obser-vations are subsequently used in conjunction witha numerical model to determine to what extentthe observed morphological changes can be attrib-uted to swash and surf zone processes.
2. Study area
The ¢eld experiment was conducted on Thed-dlethorpe beach, North Lincolnshire coast, Eng-land (Fig. 1). The beach is located at the southernend of a 20-km long coastal section which is partof the ebb tidal delta of the Humber estuary. Thearea is characterised by long-term accretion(King, 1972; Halcrow, 1988) and is devoid of
coastal engineering structures. The beach mor-phology is characterised by numerous well-devel-oped intertidal bar systems (‘ridge and runnel’morphology) intersected by tidal drainage chan-nels (Masselink and Anthony, 2001). The interti-dal bars front an up to 2.5 km wide salt marshand/or a sand £at. The salt marsh/sand £at area islocated just below Mean High Water Spring(MHWS) level and its width progressively de-creases toward the south. On Theddlethorpebeach, the sand £at is 400 m wide, but 2 km southof the beach, the intertidal bars are directlybacked by sand dunes.The mean spring tide range in the region is 6 m
and the tide levels are: Mean Low Water Spring(MLWS)=32.85 m, Mean Low Water Neap(MLWN)=31.25 m, Mean High Water Neap(MHWN)=1.55 m and MHWS=3.15 m (all inm ODN, where ODN refers to Ordnance DatumNewlyn, which is approximately mean sea level(MSL)) (Admiralty Tide Tables, 2000; principalport Immingham and secondary port Skegness).Tidal currents generally £ow in a southward di-rection during the £ood following the coastal out-line and in a northward direction during the ebb(Admiralty Tidal Stream Atlas, 1962). Winds arepredominantly from the southwest, however, dur-ing the winter months the development of highpressure systems over northern Europe can leadto prolonged northwesterly to easterly winds(Odd et al., 1995). Annual wave statistics havebeen compiled by the Department of Energy(1989) and indicate a 50% and 10% exceedencesigni¢cant wave height for the Lincolnshire coastof 0.5 m and 1.5 m, respectively, and a mostcommon wave period of less than 4 s. The sedi-ment transport along the Lincolnshire coast isprimarily wave-driven and wave energy calcula-tions suggest that beach sediments are transportedsouthwards from Donna Nook (Halcrow, 1988).
3. Methods
3.1. Field methods
Fieldwork was conducted in July and August2000. Aerial photographs of the beach were taken
MARGO 3197 8-10-02
A. Kroon, G. Masselink /Marine Geology 190 (2002) 591^608 593

on 5 August by the Environment Agency and givea good indication of the beach morphology at thetime of the ¢eld experiment (Fig. 2). The exper-imental design was very much dictated by themorphology present. A cross-shore transect wasestablished at the start of the ¢eld period, startingin the dunes and extending almost 1 km seawardacross the intertidal sand £at and beach. Tempo-rary benchmarks were established in the dunesand these were tied to a permanent benchmarkwith known elevation (in m ODN). The maintransect was surveyed every daylight low tidefrom 31 July to 16 August using a laser totalstation. During these surveys, detailed observa-tions on the bed morphology were made as well.Information on the 3-D con¢guration of the in-tertidal beach was obtained on 3 and 4 August bysurveying an extra eight transects 50, 100, 150 and200 m at either side of the main transect. Thesemeasurements were used to generate a digital ele-vation model (DEM) of the intertidal zone. A
large number of sediment samples (about 200)were collected from the upper intertidal sand £atarea and the region with the intertidal bar mor-phology during the 3-D survey. These sampleswere analysed in the laboratory using a settlingtube and the fall velocities obtained from theanalysis were converted to sediment sizes usingformulae predicted by Gibbs et al. (1971).During three tidal cycles (5, 7 and 9 August),
high-resolution (temporal and spatial) morpho-logical measurements were conducted. On eachof these days, a cross-shore transect across theintertidal bar morphology was established about50 m north of the main transect using 0.8-m long,¢breglass rods inserted into the beach at regularintervals (spacing 1 or 2 m). The locations of therods and the elevations of their tops were mea-sured at low tide using the total station. As therods became inundated by the rising tide, theirheights above the sand surface were monitoredusing a specially designed ruler. Only a few rods
Fig. 1. Location map of the study area. The dark grey areas in (b) indicate intertidal regions.
MARGO 3197 8-10-02
A. Kroon, G. Masselink /Marine Geology 190 (2002) 591^608594

had to be measured at the start of the measure-ments because most of the rods were emerged.This only required a few minutes. However, asthe tide rose, the number of rods that were a¡ectedby wave and swash processes progressively in-creased and the time required conducting the mea-surements increased accordingly. Measurementswere conducted approximately every 15 min.Rods that were covered by more than 0.75 m ofwater could not be reliably measured. These rodswere ‘abandoned’ during the rising tide, but ‘revis-ited’ as the tide fell. The above method of obtain-ing detailed information on morphological changehas also been used by Masselink et al. (1997). Thevertical accuracy of the measurements is consid-ered better than 1 cm. Concurrent with the rodmeasurements, observations were made of thebed morphology (plane bed, washed-out ripples,wave ripples) and the hydrodynamic process thatthe rods were experiencing (swash action, surfzone bores, breaking waves, shoaling waves).Hydrodynamic measurements were made using
three, self-logging instrument frames. Theseframes were positioned on the intertidal beach.Frame 1 was positioned most seaward at the bot-tom of the seaward slope of the fourth intertidalbar and consisted of a pressure sensor and a 3-Dacoustic current meter (ACM). The ACM wasinstalled such that it measured currents 0.15 mabove the bed. The frame was deployed from 1to 14 August and the data were collected in burst-mode with an interval of 30 min. The burst was512 data points collected at 2 Hz yielding datasections of 4 min and 16 s. There were two prob-lems with the data. First, because the frame wasdeployed in the intertidal zone, no data were col-lected under low tide conditions, except duringneap low tide. Second, due to problems with theequipment software, two gaps were present in thedata record. In order to obtain a continuouswater-level record for the ¢eld experiment, tidegauge data collected at Immingham (located35 km north of the study area) and Boy Grift(15 km south of the study area) were used tocomplement the water-level data collected byFrame 1. Cross-correlations were conducted be-tween the three data sources and these were sub-sequently used to interpolate the missing data sec-
tions in the water-level record measured onTheddlethorpe beach. Frame 2 was generally posi-tioned on the seaward slope of the third bar andFrame 3 was usually deployed on the seawardslope of the second bar. Frames 2 and 3 eachcomprised of a pressure sensor, a 2-D, electro-magnetic current meter (EM) and an opticalback scatterrance sensor (OBS). The EM andOBS on each of the frames were installed totake measurements at 0.15 m above the bed.The frames were deployed from 3 to 15 Augustand the data were collected in burst-mode with aninterval of 1 h. The burst was 4800 data pointscollected at 2 Hz yielding data sections of 40 min.The local wave height Hs, wave period Ts and
water levels h at Frames 2 and 3 were computedover series of 10 min with a traditional wave-by-wave statistics approach. In addition, the asym-metry of the wave form was computed using twomethods. The wave skewness A (or horizontalasymmetry) was de¢ned as the height of thewave crest divided by the total wave height. Asaw-tooth parameter B (or vertical asymmetry)was de¢ned by the time span of the wave frontpassage divided by the total wave period. Thevalues for these wave asymmetry parameters are0.5 under symmetrical waves and increase withincreasing asymmetry.
3.2. Numerical methods
The time that certain processes like shoalingwaves, breaking waves, surf zone bores and swashaction were operating on a speci¢c position alongthe central cross-shore pro¢le was computed witha simple model based on water levels. The waterlevels on the intertidal beach were supposed to becomposed of the tidal water level, the wave set-uplevel and the wave run-up level. The tidal waterlevels were directly measured o¡shore. The waterlevels related to the waves were computed withthe use of constant wave conditions or the localwave characteristics measured at Frame 2. Thecombined e¡ect of wave set-up and wave run-upwere computed with (Holman, 1986, in Komar,1998):
R ¼ 0:36g0:5H0:5o TtanL ð1Þ
MARGO 3197 8-10-02
A. Kroon, G. Masselink /Marine Geology 190 (2002) 591^608 595

where R is the wave run-up height exceeded by2% of the run-up events (surrogate for the max-imum run-up height), g is acceleration of gravity,Ho is the deep-water wave height, T is the waveperiod and tanL is the beach gradient.The model computes the local water levels at
distinct positions over the cross-shore pro¢le byadding the measured tidal levels and the com-puted wave-related levels. An attenuation coe⁄-cient (i.e. irregular wave breaker criterion) of 0.35was used to compute the breaker depth out of thelocal wave height. The processes at a certain lo-cation were subsequently coupled to speci¢c localconditions. Shoaling waves occurred when the lo-cal water depth exceeded the breaker depth.Breaking waves and surf zone bores occurredwhen the local water depth was smaller than thebreaker depth and when the position was con-stantly under water. Swash action occurredwhen the local water level was between the tidalwater level and the wave run-up level on thebeach. The spatial distribution of shoaling waves,surf (breaking waves and bores) and swash werecomputed for every minute during a semi-diurnal£ood period. This resulted in spatial patterns ofprocess characteristics over the cross-shore pro-¢le, as well as their relative contribution over atidal cycle.
4. Results
4.1. Beach morphology and sedimentology
The intertidal morphology of Theddlethorpebeach is shown in Figs. 2 and 3. The salient fea-tures of the beach pro¢le are: (1) a 400-m wide,sub-horizontal (tanL=0.0015) intertidal sand £atlocated just below MHWS level ; and (2) a 400-mwide, gently sloping (tanL=0.015) region withpronounced intertidal bar morphology. At thetime of the ¢eld experiment, six intertidal bar sys-tems were present, and a seventh subtidal bar sys-tem was also observed (but not surveyed). Thecross-shore pro¢le shows all six intertidal bars(Fig. 3a), which are numbered 1^6 in the seawarddirection. The largest bar, both in terms of widthand height, can be found around MSL (bar 4),whereas the seawardmost bar (bar 6) is least pro-nounced.Figs. 2 and 3 indicate that the bar morphology
is relatively continuous in the longshore direction.However, a relatively large drainage channelsouth of the main transect intersects bars 3 and4 and two smaller drainage channels can be ob-served cutting through bar 1. Bar 1 peters out in anorthward direction, while bar 2 merges with bar3 south of the main transect. The DEM (Fig. 3b)
Fig. 2. Aerial photograph of the study area taken on 5 August. The location of the central transect is indicated by the dashedline. Dark sections in the photograph represent small drainage channels and runnels, whereas the ridges are indicated by the lightareas.
MARGO 3197 8-10-02
A. Kroon, G. Masselink /Marine Geology 190 (2002) 591^608596

clearly shows that bar 1 actually consists of twobar crests. The appearance of bar 1 in the ¢eldwas that of two depositional lobes (see alsoFig. 2).Analysis of the intertidal sediments revealed a
distinct textural break around MSL. The D50 val-ues of all sediments collected above MSL arewithin the range 0.18^0.21 mm, whereas the rangeof D50 values for the samples taken below MSL is0.16^0.18 mm. No signi¢cant di¡erence in sedi-ment size was found between intertidal bars, in-tertidal troughs and upper intertidal sand £at. Itshould be noted, however, that veneers of mudwere generally present in the deeper parts of theintertidal troughs and also on the surface of thelower intertidal bars. Such mud veneers did notoccur on the higher intertidal bars.
The intertidal bar morphology can be subdi-vided into four distinct morphodynamic sub-envi-ronments on the basis of morphology, sedimentol-ogy and hydrodynamic processes.(1) The trough is dominated by tidal currents
and shoaling/reforming waves. Current ripples arepresent in the deepest part of the trough, butwave-current and wave ripples may be found athigher levels.(2) The seaward slope of the bar is a¡ected by a
mixture of swash, surf zone and shoaling waveprocesses. The slope has a convex shape withthe local gradient decreasing in the landward di-rection. Plane beds generally prevail if the localgradient is s 0.025 (lower part of the slope),whereas washed-out wave ripples occur when thelocal gradient is 6 0.025 (upper part of the slope).
Fig. 3. (a) Beach pro¢le measured on 4 August. Horizontal lines indicate, from top to bottom, MHWS, MHWN, MSL, MLWNand MLWS. (b) 3-D beach pro¢le measured on 3 and 4 August. Thick solid line indicates the central transect. The alongshorecoordinates (y-axis) run from south (negative values) to north (positive values).
MARGO 3197 8-10-02
A. Kroon, G. Masselink /Marine Geology 190 (2002) 591^608 597

A narrow zone (several m’s wide) of washed-outwave ripples is usually found at the base of theseaward slope. This zone occurs at the same ele-vation as the crest of the bar located to the sea-ward and marks the transition from trough tobar.(3) The landward slope of the bar extends from
the bar crest to the brink point (top of the slipface) and is generally sub-horizontal. The regionis occasionally subjected to unidirectional pulsesof water running into the trough when wavesovertop the bar crest. More frequently, the land-ward slope of the bar will experience surf zoneand shoaling wave action. Commonly, the bed ischaracterised by washed-out wave ripples, rhom-boid ripples and/or wave-current ripples.(4) A slip face is present on all intertidal bars,
except for bar 6. The most common sedimento-logical features on the surface of the slip face werewaterline marks and drainage rills.
4.2. Hydrodynamics during the ¢eld experiments
The tidal water level, nearshore currents andwaves during the 2-week ¢eld experiment areshown in Fig. 4. Time-averaged longshore andcross-shore currents indicate a strong tidal mod-ulation (Fig. 4b,c). Southward and onshore cur-rents prevail during the rising tide, whereas north-ward and o¡shore currents occur during thefalling tide. The mean longshore current attainsa maximum velocity of 0.25 m/s during springtides and is about 0.15 m/s during neap tides.The residual longshore current is negligible. Themean cross-shore current is generally on the orderof a few cm/s and only exceeds 0.05 m/s duringthe largest spring tides. Signi¢cant wave heightsvaried from 0.1 to 0.4 m and signi¢cant waveperiods were 4^7 s. The waves generally ap-proached the beach with their crests parallel tothe coast. It is noted that the most energetic
Fig. 4. Tide and wave conditions during the ¢eld experiment in 2000. (a) Water level. (b) Longshore current velocity. (c) Cross-shore current velocity. (d) Signi¢cant wave height. (e) Signi¢cant wave period. Positive longshore and cross-shore currents are to-ward the north and onshore, respectively. The tidal cycles that occurred over the ¢eld period are numbered 1^27 in (a) for laterreference.
MARGO 3197 8-10-02
A. Kroon, G. Masselink /Marine Geology 190 (2002) 591^608598

wave conditions coincided with neap tidal condi-tions.
4.3. Morphological change over a tidal cycle
Continuous morphological monitoring of a 2^3intertidal bar system was conducted during threetidal cycles on 5, 7 and 9 August. The data col-lected on bar 3 on 9 August (tide number 17; Fig.4a) are summarised in Fig. 5 (data collected dur-ing 5 and 7 August were similar, but less prom-inent due to reduced wave conditions, Fig. 4d).During the tidal cycle, the intertidal bar migratedonshore through deposition on the slip face andthe landward slope of the bar, and erosion on the
seaward slope (Fig. 5a). The results can best bediscussed within the context of the three morpho-logical regions comprising the intertidal bar sys-tem: (1) the slip face of the bar (x=4^7 m); (2) thelandward slope of the bar from the brink point tothe crest of the bar (x=7^12 m); and (3) the sea-ward slope of the bar (x=12^30 m).Onshore migration of the bar and sediment ac-
cretion on the slip face occurred continuouslyaround high tide while the bar crest was coveredby waves and swash (Fig. 5b). Accretion com-menced as soon as the incident waves startedovertopping the bar crest during the rising tideand accretion ceased when the bar crest becameexposed during the falling tide. Most of the sedi-
Fig. 5. (a) Beach pro¢les of bar 3 measured on the morning (dashed line) and evening (solid line) on 9 August. Horizontaldashed line indicates the high tide water level. Open circles indicate locations for which bed level changes are shown in ¢guresbelow. (b) Changes in bed elevation measured during tidal cycle at x=5 m. Shading indicates the time when wave and swash ac-tion took place on the bar crest. (c) Changes in bed elevation measured during tidal cycle at x=9 m. Light and heavy shadingindicates the time when swash and surf zone bores were operating at x=9 m, respectively. (d) Changes in bed elevation measuredduring tidal cycle at x=20 m. Light and heavy shading indicates the time when swash and surf zone bores were operating atx=20 m, respectively.
MARGO 3197 8-10-02
A. Kroon, G. Masselink /Marine Geology 190 (2002) 591^608 599

ment deposited on the slip face was delivered byswash and waves operating on the intertidal bar,but part of the sediment was washed from the sideof the trough by waves refracting around the£anks of the intertidal bar. The landward slopewas subjected to a mixture of swash and surf zonebores. At high tide, the water depth over the barcrest was about 0.3 m. When the region wasunder the in£uence of swash action, both duringrising and falling tides, the £ow mainly consistedof wave uprush. The water would rush across theregion and shunt sediment into the runnel, result-ing in slip face accretion and bar migration (Fig.5c). Limited erosion of the landward slope oc-curred under these conditions. When the land-ward slope was under the in£uence of surf zonebores, however, accretion prevailed. The netchange over the tidal cycle on the landward slopewas 3^5 cm accretion. The seaward slope of thebar was also subjected to a mixture of swash and
surf zone processes. However, in this region,swash processes resulted in sediment accretion,whereas surf zone bores caused erosion (Fig.5d). The net change on the seaward slope was2^4 cm erosion.Most signi¢cantly, Fig. 5 demonstrates that
morphological change on the intertidal, in partic-ular the erosion of the seaward slope, occurs pri-marily under the in£uence of surf zone bores.Swash action has a signi¢cant e¡ect on the mor-phology, but is secondary to that of surf zonebores. The location of the swash and bores alsoheavily depends on the antecedent morphology.
4.4. Morphological change over spring-to-springtidal cycle
In a general sense, the amount of morpholog-ical change over the 2-week period of observa-tions was quite limited. The number of intertidal
Fig. 6. (a) Daily beach pro¢les of the central transect. The pro¢les have been vertically o¡set by 1 m. The spacing of the verticalticks marks is also 1 m. (b) Beach pro¢le measured on 1 August (thick solid line) and 14 August (solid line). The intertidal barsare numbered 1^5 in the o¡shore direction. (c) Morphological change between 1 and 14 August. Positive values indicate accre-tion, negative values indicate erosion.
MARGO 3197 8-10-02
A. Kroon, G. Masselink /Marine Geology 190 (2002) 591^608600
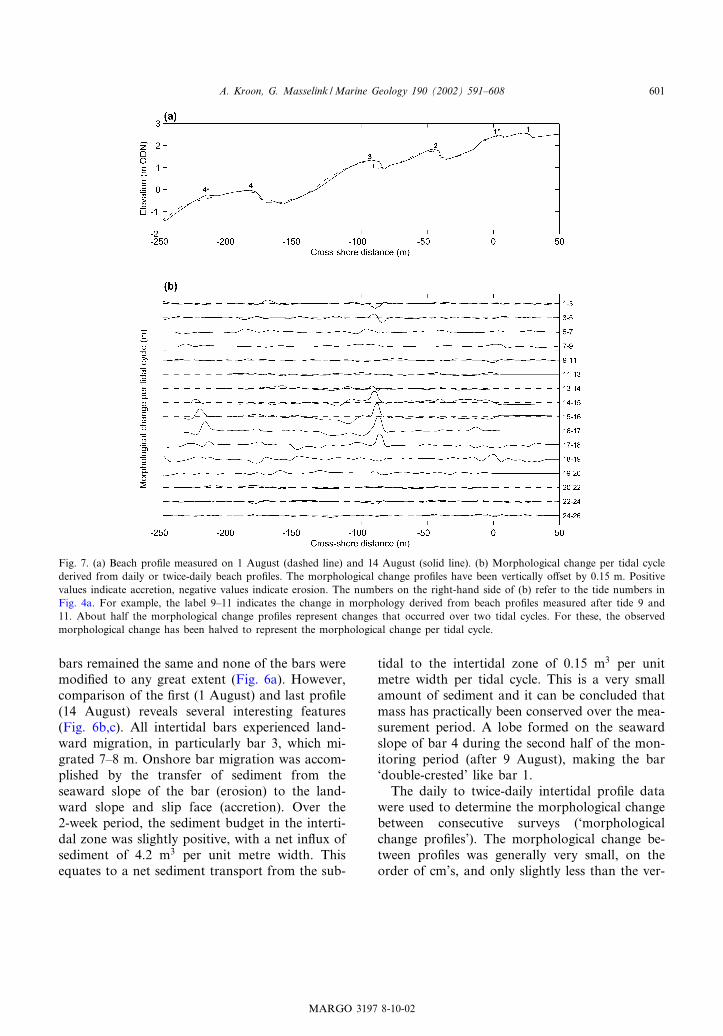
bars remained the same and none of the bars weremodi¢ed to any great extent (Fig. 6a). However,comparison of the ¢rst (1 August) and last pro¢le(14 August) reveals several interesting features(Fig. 6b,c). All intertidal bars experienced land-ward migration, in particularly bar 3, which mi-grated 7^8 m. Onshore bar migration was accom-plished by the transfer of sediment from theseaward slope of the bar (erosion) to the land-ward slope and slip face (accretion). Over the2-week period, the sediment budget in the interti-dal zone was slightly positive, with a net in£ux ofsediment of 4.2 m3 per unit metre width. Thisequates to a net sediment transport from the sub-
tidal to the intertidal zone of 0.15 m3 per unitmetre width per tidal cycle. This is a very smallamount of sediment and it can be concluded thatmass has practically been conserved over the mea-surement period. A lobe formed on the seawardslope of bar 4 during the second half of the mon-itoring period (after 9 August), making the bar‘double-crested’ like bar 1.The daily to twice-daily intertidal pro¢le data
were used to determine the morphological changebetween consecutive surveys (‘morphologicalchange pro¢les’). The morphological change be-tween pro¢les was generally very small, on theorder of cm’s, and only slightly less than the ver-
Fig. 7. (a) Beach pro¢le measured on 1 August (dashed line) and 14 August (solid line). (b) Morphological change per tidal cyclederived from daily or twice-daily beach pro¢les. The morphological change pro¢les have been vertically o¡set by 0.15 m. Positivevalues indicate accretion, negative values indicate erosion. The numbers on the right-hand side of (b) refer to the tide numbers inFig. 4a. For example, the label 9^11 indicates the change in morphology derived from beach pro¢les measured after tide 9 and11. About half the morphological change pro¢les represent changes that occurred over two tidal cycles. For these, the observedmorphological change has been halved to represent the morphological change per tidal cycle.
MARGO 3197 8-10-02
A. Kroon, G. Masselink /Marine Geology 190 (2002) 591^608 601

tical accuracy of the measurements. To reduce thee¡ect of (random) measurement error on the re-sults, the cross-shore variation in morphologicalchange was smoothed with a 5-m wide movingaverage. Finally, the morphological change pro¢lewas detrended to remove inaccuracies in the ver-tical datum between the pro¢les.The morphological change pro¢les are shown in
Fig. 7. Onshore migration of bars 1^3 occurred atthe start of the ¢eld period (1^5 August; tidenumber 1^9) when large spring tidal ranges ofup to 6 m were experienced (Fig. 4a). In addition,the trough to the landward of bar 3 was deepenedsigni¢cantly, whereas the trough landward of bar4 underwent accretion through the progradationof a drainage delta present just to the south of thecentral survey line (Fig. 2). The high tide levelduring these spring tides exceeded 3 m and re-sulted in the submergence of the intertidal barmorphology and inundation of the upper interti-dal £at. During neap tide conditions and elevatedwave energy levels in the middle of the ¢eld peri-
od (7^10 August; tide number 13^18), onshoremigration of bars 2^4 occurred. Bar 3 exhibitedthe most dynamic behaviour and experiencedlandward migration rates of about 1 m per tide.In addition to the onshore migration of the inter-tidal bars, a small lobe was deposited on the sea-ward slope of bar 4. The sediment required toform this depositional feature was eroded fromlower on the pro¢le, resulting in a steepening ofthe local pro¢le. Toward the end of the ¢eld peri-od (10^14 August; tide number 19^27), the tidalrange increased and wave energy levels were low.Not many morphological changes occurred. Ofnote is the formation of a small lobe on the sea-ward slope of bar 1 at the end of the ¢eld period(tide number 22^26).
4.5. Swash and surf zone processes on intertidalbars
The swash and surf zone processes werestrongly coupled to the local water depth. The
Fig. 8. Variations of the water motion on the seaward slope of bar 2 (dots) and bar 3 (crosses) over tide number 15. (a) Localwater depth h. (b) Signi¢cant wave height Hs. (c) Wave skewness A. (d) Saw-tooth parameter B. (e) Mean cross-shore velocity u.(f) Mean alongshore velocity v.
MARGO 3197 8-10-02
A. Kroon, G. Masselink /Marine Geology 190 (2002) 591^608602

local water motions on the seaward slope of bars2 and 3 were measured with the stand-aloneframes. An example of the characteristics of thewater motion over tide number 15 is presented inFig. 8. The local water depth h showed the tidalcurve (Fig. 8a) and the signi¢cant wave height Hs
was almost constant in time and reached a valueof 0.12 m on the slope of bar 2 and 0.22 m on theslope of bar 3 (Fig. 8b). The larger wave heightson bar 3 occurred because at high tide waves werebreaking on both bars crests and incident waveswere signi¢cantly attenuated when propagatingacross bar 3. The shape of the waves on bars 2and 3 was distinctly asymmetric. The wave skew-ness A reached a value of 0.6 at the slope of bar 2and a value of 0.55 at the slope of bar 3 (Fig. 8c).
The saw-tooth parameter B ranged between 0.3and 0.4 at the slope of bar 2 and ranged between0.4 and 0.5 at the slope of bar 3 (Fig. 8d). Themean cross-shore velocity u was small and o¡-shore directed. At the slope of bar 2, a maximumo¡shore-directed value of 0.15 m/s occurred. Theu at the slope of bar 3 was constant at about0.05 m/s (Fig. 8e). The mean alongshore velocityv reached maximum values of about 0.25 m/s andshowed northward £owing currents during risingtide (Fig. 8f).The values for the wave asymmetry parameters
A and B at the seaward slope of bar 2 were far o¡the standard value of 0.5, typical of symmetricalwaves. This implied that the waves at this locationwere propagating as bores. Values for A and B atthe seaward slope of bar 3 also indicated thatasymmetric waves were present, but especiallythe value of B was close to 0.5. This impliedthat the waves at this location were propagatingas asymmetric shoaling waves. Unfortunately, allmeasurements required a water depth over 0.3 min order to get reliable data over 10 min. All mea-sured cross-shore velocities at 0.2 m above the bedwere still o¡shore-directed. Onshore-directed£ows were observed in the ¢eld at the crest ofthe bars when the water depth was less than 0.2 m.
4.6. Numerical simulations of the local processcharacteristics
The numerical model described in Section 3.2was used to compute the temporal and spatialvariation in the occurrence of swash, surf zoneand shoaling wave processes across the intertidalbeach pro¢le. The measured tidal water levels andwave conditions were used as input variables forthe numerical simulations of the local processcharacteristics over a measured intertidal barredpro¢le (Table 1). Additionally, the measured tidalwater levels and two constant wave conditions(Hs =0.1 m, Ts =4 s; Hs =0.2 m, Ts =6 s) wereused to study the variability of the process char-acteristics over the whole spring-to-spring tidalcycle of the ¢eld experiments.The modelled cross-shore distribution of swash
and surf (breaking waves and bores) over thebarred intertidal pro¢le during a spring £ood is
Table 1Measured signi¢cant wave heights, wave periods and tidalranges for the numerical simulations of the cross-shore inter-tidal process characteristics
Date Tide Hs Ts Tidal range(number) (m) (s) (m)
1-08-2000 1 0.20a 6.0a 5.842 0.20a 6.0a 5.75
2-08-2000 3 0.20a 6.0a 6.364 0.20a 6.0a 6.09
3-08-2000 5 0.20a 6.0a 6.236 0.20a 6.0a 5.82
4-08-2000 7 0.20a 6.0a 5.888 0.13 4.8 5.45
5-08-2000 9 0.09 4.2 5.3610 0.13 4.0 4.79
6-08-2000 11 0.10 4.2 4.6012 0.09 4.8 4.11
7-08-2000 13 0.09 5.6 3.998-08-2000 14 0.17 5.7 3.59
15 0.22 6.3 3.329-08-2000 16 0.29 6.1 3.07
17 0.27 6.6 2.9110-08-2000 18 0.22 5.7 3.04
19 0.16 5.6 2.9711-08-2000 20 0.12 5.2 3.21
21 0.14 4.7 3.3012-08-2000 22 0.18 5.2 3.78
23 0.17 3.7 3.7013-08-2000 24 0.20 4.2 4.27
25 0.13 3.9 4.1614-08-2000 26 0.20a 6.0a 4.68
27 0.20a 6.0a 4.5315-08-2000 28 0.20a 6.0a 5.05
a Standard wave conditions (not measured)
MARGO 3197 8-10-02
A. Kroon, G. Masselink /Marine Geology 190 (2002) 591^608 603

presented in Fig. 9 (tide number 9; tide range5.4 m; Hs =0.1 m). Due to the large tidal range,and hence tidal translation rates, swash and surfzone processes rapidly shift over the pro¢le andall intertidal bars experience approximately thesame time of each of these processes. The swashis only active for a couple of minutes at each barlocation and the surf zone processes operatefor 30 min to 1 h in the barred area. These peri-ods are too short to cause signi¢cant modi¢ca-tions in the morphology of any of the intertidalbars (morphological changes were less than 1 cm;Fig. 7b).Simulation results for a neap £ood are pre-
sented in Fig. 10 (tide number 17; tide range3.0 m; Hs =0.3 m). Swash and surf zone processesare spread between bars 2 and 5. The peaks in thespatial distribution of both process characteristicsare at the locations of the intertidal bars. At bar2, the swash action is most prominent and plays arole over more than 1 h, followed by the surf. At
the other bar crests (bars 3^5), surf zone processesoperate for more than 2 h at one location, with amaximum of about 4 h near bar crest 3. Theswash on bars 3^5 is also more prominent thanin the spring tide case and reaches time spans ofabout 30 min. The periods that the swash and thesurf act on the pro¢le are su⁄cient to cause mor-phological changes near some of the bars. In ad-dition, it should be pointed out that the waves inthe neap tide case were signi¢cantly more ener-getic than in the spring tide case. The combinedaction of swash and surf were responsible for theonshore migration of bar 3 and the formation of asmall depositional lobe on the seaward slope ofbar 4 (Fig. 7b).The duration of swash and surf zone processes
at bar crests 1^5 over the spring-to-spring tidalcycle are presented in Fig. 11. These durationshave been computed using measured tidal levelsand measured wave conditions for tide numbers8^25 (see Table 1) and standard wave conditions
Fig. 9. (a) Beach pro¢le along the central transect with the projected high and low water levels during a spring tide. (b) Numeri-cal simulations of the cross-shore distribution of surf (breaking waves and bores; line), and swash (dotted line) during a spring£ood.
MARGO 3197 8-10-02
A. Kroon, G. Masselink /Marine Geology 190 (2002) 591^608604

of Hs =0.2 m and Ts =6.0 s for tide numbers 1^7and 26^28. Bar 1 was intertidal during the springtides and subaerial during the neap tides. Theswash and especially the surf on 4^6 August(tide numbers 8^11) operated at the crest of thisbar between 1 and 2 h. The surf zone bores mayhave caused modest morphological changes at bar1 as observed in Fig. 7b. Bar crest 2 was halfwayacross the intertidal area during spring tide andclose to the high water line during neap tide. Thein£uence of surf zone bores increased from springtowards neap tide and only decreased at the neaptide itself when the swash was dominant. Most ofthe time, the bores and the swash did not operatelong enough at a certain location to cause signi¢-cant morphological changes. Only the swash andsurf action at 6^9 August (tide numbers 12^17)caused a small onshore migration of the bar(Fig. 7b). Bar crest 3 was always intertidal. Thein£uence of the swash and especially the surf zonebores increased from spring tide to neap tide. At
neap tide, the surf operated between 2 and 4 h atide over the bar crest (7^10 August, tide numbers13^19). These bores induced a net onshore trans-port of sediment during this period, causingan onshore migration of the bar and a concurrenterosion of the seaward slope of the bar (Fig. 7b).The same observations of increasing in£uence ofbores and breaking waves at neap tide applyto bar crest 4. Again, this was also re£ected inthe morphological changes observed in thecross-shore pro¢les (Fig. 7b) with an onshore mi-gration of the bar crest and erosion of the sea-ward side of the bar over the same period. Barcrest 5 was completely submerged during neaptide and intertidal during spring tide. The swashwas only of any in£uence on 8 August (tide num-ber 14). Breaking waves and bores only operatedover 2 h two days before and two days after neaptide.The numerical simulations were also made with
constant wave conditions over the whole period
Fig. 10. (a) Beach pro¢le along the central transect with the projected high and low water levels during a neap tide. (b) Numeri-cal simulations of the cross-shore distribution of surf (breaking waves and bores; line), and swash (dotted line) during a neap£ood.
MARGO 3197 8-10-02
A. Kroon, G. Masselink /Marine Geology 190 (2002) 591^608 605

of the ¢eld experiments (1^15 August; tide num-bers 1^28). The process characteristics (swash andsurf action) at bar crests 1^5 and the measuredtidal water levels over the spring-to-spring tidalcycle for waves with Hs =0.2 m and Ts =6 sshow very similar patterns as the measured waveconditions presented in Fig. 11. The in£uence ofswash and surf zone processes at spring tide wasalways less than that at neap tides. At the start ofthe experiments the swash was no longer than acouple of minutes active over the whole pro¢leand the surf (breaking waves and bores) operatedfor less than 1 h. Again, the major morphologicalchanges near the bar crests of bar 1^5 could beaddressed to the periods that the surf and swashwere at least 2 h 30 min working on a certainlocation. The process characteristics with smallerwaves (Hs =0.1 m and Ts =4 s) showed the samespatial patterns but with a smaller intensities(hours).
5. Discussion and conclusions
Intertidal bar morphology was monitored on amacrotidal beach over a spring-to-spring tidalcycle under low-energy, fetch-limited wave condi-tions (Hs6 0.3 m; Ts =4^7 s). The observed mor-phological changes were very small, but over the2-week period the intertidal sediment budget wasclearly positive and all intertidal bars migratedonshore with rates ranging from insigni¢cant to1 m per tide. The landward movement of the barswas accomplished by the transfer of sedimentfrom the seaward slope of the bar (erosion) tothe landward slope and slip face (accretion).This onshore sediment transport was carried outby a combination of swash and surf zone process-es.The morphological measurements showed that
the intertidal bar dynamics exhibited a pro-nounced spatial and temporal variability. The
Fig. 11. (a) Measured tidal water levels during the period 1^15 August 2000 (Julian days 214^228). (b^f) Duration of the surf(breaking waves and bores) (black) and swash action (white) during the successive tides at the locations of bar crests 1^5. Thesimulations are based on a combination of measured and interpolated wave conditions (Table 1).
MARGO 3197 8-10-02
A. Kroon, G. Masselink /Marine Geology 190 (2002) 591^608606
most active bar was located around MSL (bar 3)and the largest bar migration rates occurred dur-ing neap tide conditions. Bar morphologicalchanges during spring tide conditions were verylimited. A simple numerical model was developedto predict the duration of swash/surf processes onthe intertidal pro¢le under varying wave/tide con-ditions. The model results were subsequently usedto explain the morphological observations. It wasfound that the most important factor controllingbar morphological change (i.e. onshore bar migra-tion) is the length of time that the bar crest isunder the in£uence of swash and surf zone pro-cesses. During spring tides, the rapid tidal trans-lation rate does not allow these hydrodynamicprocesses to act su⁄ciently long (generally lessthan 30 min) at any location to accomplish sig-ni¢cant morphological changes. During or aroundneap tides, however, swash and surf zone process-es may operate for up to 30 min and 2 h, respec-tively, at the bar locations. It is at these times thatthe intertidal bars display an onshore migrationof the crest and erosion of the seaward side (asshown in Fig. 7b).The simple numerical model that computes the
water level over the cross-shore pro¢les during thetidal cycle may only be used in case of low-energywave conditions. Wave transformation is not di-rectly taken into account and the di¡erent processcharacteristics are simply coupled to water levels.During high-energy wave conditions, the modelneeds to be extended to describe the wave energydecay over the pro¢le more accurate (e.g. Battjesand Janssen, 1978). However, the present model isable to couple the residence time of distinct pro-cesses like surf (breaking waves and bores) orswash to morphological changes in a variety oftidal ranges.The duration of swash and surf action on the
intertidal pro¢le does not solely depend on thetide range, but is also a¡ected by the incidentwave height. This is because larger wave heightsare associated with wider swash and surf zones,thereby increasing the duration of each of theseprocesses for a given tidal range. According toMasselink (1993), the duration of di¡erent typesof hydrodynamic processes (swash, surf andshoaling waves) on the intertidal beach pro¢le is
governed by the ratio of tide range to waveheight, referred to as the relative tide rangeRTR. During the ¢eld experiment, the most ener-getic waves coincided with neap tide conditions(Fig. 4). Therefore, the relative tide range duringneap tides (RTR=10^20) was considerably lessthan during spring tides (RTR=30^50). It is ofinterest to compare the present RTR values withthose that characterise the measurements of Sipkaand Anthony (1999) who also measured morpho-logical change and wave/tide conditions on a mac-rotidal beach with intertidal bar morphology.During their experiment, Sipka and Anthony(1999) experienced similar wave conditions, butslightly larger tidal ranges. The relative tide rangeexceeded 30, even during neap tides. Sipka andAnthony (1999) reported that morphologicalchanges over the measurement period were insig-ni¢cant, perhaps suggesting that signi¢cant mor-phological changes to macrotidal bar morphologyrequire wave/tide conditions characterised byRTR6 30.Intertidal bars on macrotidal beaches are gen-
erally considered swash bars whose formation,maintenance and onshore migration of whichare controlled by swash processes, while energeticsurf zone processes acting during storms result intheir £attening or even destruction (King, 1972).This paper does not address bar formation ordestruction. However, the data presented hereclearly demonstrate that onshore bar migrationis mainly accomplished by surf zone processes,with swash processes playing a secondary role(Fig. 5). It thus seems inappropriate to refer tothese intertidal bars as swash bars. In fact, whenthe bars are actively migrating onshore, such asbar 3 during neap tide conditions, they are rathersimilar in morphology and behaviour to inner surfzone bars. Sunamura and Takeda (1984, p. 70)provided the following description of the onshoremigration of such bars: ‘When a bar is migratingonshore, wave breaking always occurs over thegently seaward-sloping surface of the bar. Wavesafter breaking form bores that advance over thebar. Such bores transport sediments onshoreacross the gently sloping surface, primarily in abed-load manner, and eventually the material ismoved to the steep landward edge of the bar
MARGO 3197 8-10-02
A. Kroon, G. Masselink /Marine Geology 190 (2002) 591^608 607

where it is deposited on the slip-face of the bar.’The above description on inner bar migration isdirectly applicable to the landward movement ofintertidal bars. The only di¡erence between thebehaviour of microtidal, inner surf zone barsand macrotidal, intertidal bars is that the innersurf zone bars migrate onshore as long as low-energetic wave conditions persist, whereas thelandward movement of the intertidal bars is in-termittent and controlled by the tidal water levels.
Acknowledgements
The authors would like to thank Selma vanHouwelingen and Aafke Tonk for their assistanceduring the ¢eld experiments in July and August2000.
References
Admiralty Tidal Stream Atlas, 1962. Tidal Stream Atlas,North Sea, Southern Portion, revised edn. HydrographicO⁄ce, Taunton.
Admiralty Tide Tables, 2000. United Kingdom and Ireland(including European Channel Ports). Hydrographic O⁄ce,Taunton.
Battjes, J.A., Janssen, J.P.F.M., 1978. Energy loss and set-updue to breaking of random waves. Proceedings 16th Interna-tional Coastal Engineering Conference, ASCE, pp. 570^587.
Chauhan, P.P.S., 2000. Bedform association on a ridge andrunnel foreshore: Implications for the hydrography of amacrotidal estuarine beach. J. Coast. Res. 16, 1011^1021.
Davis, R.A., Fox, W.T., Hayes, M.O., Boothroyd, J.C., 1972.Comparison of ridge and runnel systems in tidal and non-tidal environments. J. Sediment. Petrol. 2, 413^421.
Department of Energy, 1989. Wave Climate Atlas of the Brit-ish Isles. OTH 89 303. HMSO, London.
Gibbs, R.J., Matthews, M.D., Link, D.A., 1971. The relation-ship between sphere size and settling velocity. J. Sediment.Petrol. 41, 7^18.
Halcrow, 1988. The Sea Defence Management Study for theAnglian Region. William Halcrow, Swindon.
Hayes, M.O., Boothroyd, J.C., 1969. Storms as modifyingagents in the coastal environment. In: Hayes, M.O. (Ed.),Coastal Environments, NE Massachusetts. University ofMassachusetts, Amherst, pp. 290^315.
King, C.A.M., 1972. Beaches and Coasts. Edward Arnold,London.
King, C.A.M., Williams, W.W., 1949. The formation andmovement of sand bars by wave action. Geogr. J. 113, 70^85.
Komar, P.D., 1998. Beach Processes and Sedimentation, 2nded. Prentice Hall, Upper Saddle River, NJ, 544 pp.
Levoy, F., Anthony, E.J., Barusseau, J.P., Howa, H., Tessier,B., 1998. Morphodynamique d’une plage macrotidale a'barres. C.R. Acad. Sci. 327, 811^818.
Masselink, G., 1993. Simulating the e¡ects of tides on beachmorphodynamics. J. Coast. Res. Spec. Issue 15, 180^197.
Masselink, G., Hegge, B.J., Pattiaratchi, C.B., 1997. Morpho-dynamics of a natural beach with beach cusp morphology.Earth Surf. Process. Landf. 22, 1139^1155.
Masselink, G., Anthony, E.J., 2001. Location and height ofintertidal bars on macrotidal ridge and runnel beaches.Earth Surf. Process. Landf. 26, 759^774.
Mulrennan, M.E., 1992. Ridge and runnel beach morphody-namics: An example from the Central East Coast of Ireland.J. Coast. Res. 8, 906^918.
Odd, N.V., Baugh, J.V., Murphy, D.G., Cooper, A.J., Oakes,A.M., 1995. Development and Application of Norpoll(MK1.1) to Predict the E¡ect of Load Reductions on Con-centrations of Cadmium and Lead, Particulate Pollutants inthe North Sea ^ Phase II Final Report. Report SR383, HRWallingford Ltd., Wallingford.
Orford, J.D., 1985. Murlough Spit, Dundrum Bay. In: Whal-ley, B., Smith, B.J., Orford, J.D., Carter, R.W. (Eds.), FieldGuide to Northern Ireland. Queens University, Belfast, pp.68^76.
Orford, J.D., Wright, P., 1978. What’s in a name? Descriptiveor genetic implications of ‘ridge and runnel’ topography.Mar. Geol. 28, M1^M8.
Owens, E.H., Frobel, D.H., 1977. Ridge and runnel systems inthe Magdalan Islands. Quebec. J. Sediment. Petrol. 47, 191^198.
Sipka, V., Anthony, E.J., 1999. Morphology and hydrodynam-ics of a macrotidal ridge and runnel beach under low waveconditions. J. Rech. Oceanogr. 24, 24^31.
Sunamura, T., Takeda, I., 1984. Landward migration of innerbars. Mar. Geol. 60, 63^78.
Voulgaris, G., Mason, T., Collins, M.B., 1996. An energeticsapproach for suspended sand transport on macrotidalridge and runnel beaches. Proceedings 25th Interna-tional Coastal Engineering Conference, ASCE, pp. 3948^3961.
Voulgaris, G., Simmonds, D.J., Michel, D., Collins, M.B.,Huntley, D.A., 1998. Measuring and modelling sedimenttransport on a macrotidal ridge and runnel beach: An in-tercomparison. J. Coast. Res. 14, 315^330.
Wijnberg, K.M., Kroon, A., in press. Barred Beaches. Geo-morphology.
Wright, P., 1976. The Morphology, Sedimentary Structuresand Processes of the Foreshore at Ainsdale. Unpubl.Ph.D. Thesis, University of Reading.
MARGO 3197 8-10-02
A. Kroon, G. Masselink /Marine Geology 190 (2002) 591^608608
Related Documents