This article appeared in a journal published by Elsevier. The attached copy is furnished to the author for internal non-commercial research and education use, including for instruction at the authors institution and sharing with colleagues. Other uses, including reproduction and distribution, or selling or licensing copies, or posting to personal, institutional or third party websites are prohibited. In most cases authors are permitted to post their version of the article (e.g. in Word or Tex form) to their personal website or institutional repository. Authors requiring further information regarding Elsevier’s archiving and manuscript policies are encouraged to visit: http://www.elsevier.com/copyright

Welcome message from author
This document is posted to help you gain knowledge. Please leave a comment to let me know what you think about it! Share it to your friends and learn new things together.
Transcript
This article appeared in a journal published by Elsevier. The attachedcopy is furnished to the author for internal non-commercial researchand education use, including for instruction at the authors institution
and sharing with colleagues.
Other uses, including reproduction and distribution, or selling orlicensing copies, or posting to personal, institutional or third party
websites are prohibited.
In most cases authors are permitted to post their version of thearticle (e.g. in Word or Tex form) to their personal website orinstitutional repository. Authors requiring further information
regarding Elsevier’s archiving and manuscript policies areencouraged to visit:
http://www.elsevier.com/copyright
Author's personal copy
Ecological Engineering 36 (2010) 1469–1477
Contents lists available at ScienceDirect
Ecological Engineering
journa l homepage: www.e lsev ier .com/ locate /eco leng
Morlet wavelet and autocorrelation analysis of long-term data series of theKis-Balaton water protection system (KBWPS)
József Kovácsa, István Gábor Hatvania,∗, János Korponaib, Ilona Székely Kovácsc
a Eötvös Loránd Science University, Department of Physical and Applied Geology, H-1117 Budapest, Hungaryb West Transdanubian Water Authority, Department Kis-Balaton, H-8360 Keszthely, Hungaryc Budapest Business School, Institute of Methodology, H-1054 Budapest, Hungary
a r t i c l e i n f o
Article history:Received 25 September 2009Received in revised form 13 April 2010Accepted 5 June 2010
Keywords:Lake BalatonWavelet analysisAutocorrelation analysisKis-Balaton water protection systemMultivariate data analysisMacrophyte shading
a b s t r a c t
Lake Balaton is the largest shallow freshwater lake in Central Europe. Its water quality is mainly affectedby the supplying rivers and other water sources. The primary source is the Zala River. The water of thisriver used to be filtered by the Kis-Balaton wetland (KBW) before entering Lake Balaton at KeszthelyBay. In the course of the nineteenth century, water level modifications at KBW shrank and it lost its fullcapacity to function as a filter for the Zala’s waters, so the nutrient load of Lake Balaton greatly increased,and its water quality started to deteriorate. This is the reason an artificial extended wetland called theKis-Balaton water protection system (KBWPS) had to be constructed–to retain the inorganic nutrients atthe mouth of the Zala River and stop the further degradation of Balaton’s water quality.
In this study, Morlet wavelet spectrum (periodicity) analysis and autocorrelation (memory) analysiswere used with weekly chemical, biological and physical data for the KBWPS for the period 1993–2007.We compared the periodicity and the memory of the parameters in the two different habitats of theKBWPS and the Zala River. We also analyzed the tracking capability of the periodical seasons of the twophases (the complete Phase I, and the incomplete Phase II) and the river. The results showed that theincomplete Phase II is unable to conserve the periodicity and sustain long memory because of the shadingprovided by the macrophyte cover and the extra inflows. In conclusion, we were able to point out thedependence of the system’s processes on temperature and climate conditions with methods that havenot yet been used for this kind of purpose.
© 2010 Elsevier B.V. All rights reserved.
1. Introduction
Lake Balaton is the biggest shallow freshwater lake in Cen-tral Europe. Its surface area is 596 km2, its mean depth is 3.25 m,and its volume is 1.98 km3. Its water quality is mainly affectedby the supplying rivers and other water sources. The main sup-plying source is the Zala River and its only outflow is the Siócanal.
In the late nineteenth century, the water level of Lake Bala-ton was lowered by the Sió canal’s sluice, so that the newly builtBudapest–Zagreb railway would not be damaged by floods. Thelowering of the water level resulted in the partial disappearance ofthe Kis-Balaton wetland (KBW), which dried up just when agri-cultural activity and the use of phosphate detergents rose and
∗ Corresponding author. Tel.: +36 70 317 97 58; fax: +36 1 31 97 738.E-mail addresses: [email protected] (J. Kovács), [email protected]
(I.G. Hatvani), [email protected] (J. Korponai),[email protected] (I.Sz. Kovács).
adversely affected the functioning of the wetland (Mander andForsberg, 2000). The KBW’s decreased ability to function and thedomestic pollutants resulted in the intense eutrophication of LakeBalaton. Between 1977 and 1985 an average of 92 tonnes of totalphosphorus, 816 tonnes of total-nitrogen and 14,400 tonnes of sus-pended solids entered the lake at Keszthely Bay from the inflowsof the Zala River. The first disturbing sign of the eutrophicationwas the appearance of cyanobacters in the lake in 1934 (Entz et al.,1937); the first blooming of the N2-fixing Aphanizomenon flos-aquecyanobacteria in Keszthely Bay was observed in 1965 (Hortobágyiand Kárpáti, 1967).
Originally the KBW was an important nutrient filtering area,since it increased the hydraulic residence time of the Zala River’swaters and provided ground for the eutrophicational processes totake place before the waters reached the first basin of Lake Balaton(Keszhely Bay). It must be stated that as Lake Balaton’s primarywater source the Zala River supplies 45% of Lake Balaton’s water and35–40% of its nutrient input. Without this source being filtered, thedeterioration of Balaton’s water and eutrophication began (Lotz,1988).
0925-8574/$ – see front matter © 2010 Elsevier B.V. All rights reserved.doi:10.1016/j.ecoleng.2010.06.028

Author's personal copy
1470 J. Kovács et al. / Ecological Engineering 36 (2010) 1469–1477
Fig. 1. Position of the KBWPS’ Phases I and II and its investigated sampling locations.
Measures were required to stop the eutrophication of Lake Bala-ton, measures must be taken. It is known that before the abundanceof phytoplankton can decrease, a significant reduction must bemade in the nutrient input of a shallow lake with a long historyof eutrophication (Istvánovics and Somlyódi, 2001). The idea of theKis-Balaton water protection system (KBWPS) was born in the sec-ond half of the twentieth century. It is a “mitigation” wetland, theprimary purpose of which is to restore the Zala River’s original flowand to retain the inorganic nutrients at the mouth of Zala Riverand to stop the degradation of Balaton’s water quality (Tátrai etal., 2000; Pomogyi, 1991; Istvánovics and Somlyódi, 2001; Nguyenet al., 2005). Of course the KBW cannot be restored to its originalstate, but the main aim should be to create a water protection sys-tem (KBWPS) that could fulfill the once-natural wetland’s function(Brooks et al., 2005).
1.1. The structure of the KBWPS
The construction of the KBWPS was planned to take place in twophases occupying the former Kis-Balaton Wetland delta (Fig. 1). Itis an extended wetland with open water space (Phase I) and “clas-sic” wetland (Phase II) habitats. Phase I (area: 18 km2, hydraulicretention time: 30 days) was finished in 1985 after a five-step flood-ing (Korponai et al., 2010). It resulted in open waterspace, whichgives ideal conditions for algaes to reproduce. Phase II (area func-tioning: 16 out of 57 km2, hydraulic retention time: 90 days) isstill incomplete. Only a 16 km2 experimental area has been func-tioning since 1992. 95% of this area is covered by macrophytes,primarily reeds (Tátrai et al., 2000; Nguyen et al., 2005) (Fig. 1).The rest of Phase II is still inoperative. The tender which willprovide financial support to finish the whole KBWPS and pro-tect Lake Balaton’s environment has recently been presented inBrussels.
Due to the KBWPS and investments in drainage and sewagetreatment around the lake, the water quality of Lake Balton has
improved and since 1995 oligotrophic trends can be observed(Istvánovics et al., 2002, 2007; Hajnal and Padisák, 2008).
2. Aims of the study
Since Hungary is located in the moderate climate zone, the pro-cesses in nature are likely to indicate annual periodicity drivenby the seasons. Aquatic ecosystems follow these changes throughthe temporal and light conditions so their chemical and biologi-cal parameters should show annual periodicity. If these systemsare disturbed, for example by overflows, pollution (be it natural oranthropogenic) or even limited in their connection with the lightand temperature conditions, their capacity to follow the seasonalchanges and to sustain their memory (self-tracing capability) isreduced.
The aims of this study were to:
(1) Examine the parameters of the KBWPS with regard to theirmemory and periodicity, to find out the dominating processes’capacity to follow the seasonal changes in the different habitats.
(2) Describe nature of these dominating processes of the two dif-ferent ecosystems, as different habitats of the KBWPS: Phase I(eutrophic pond), the undisturbed and disturbed area of PhaseII (wetland), and the Zala River.
3. Materials and methods
3.1. Sampling
We examined all the available chemical, biological and physicalparameters on a long-term scale from 1993 to 2007 to gain a widerpicture of the processes evolving (change of habitats, eutrophica-tion, etc.) in the partially reconstructed Kis-Balaton Wetland. Sincethe installation of Phase I, weekly sampling has been carried out bythe laboratory of the West Transdanubian Water Authority’s Kis-
Author's personal copy
J. Kovács et al. / Ecological Engineering 36 (2010) 1469–1477 1471
Fig. 2. Spline interpolation.
Balaton Department. Our tests were conducted on four cardinalsampling locations:
• “Z15”, the inlet of Phase I, which typifies the waters of the ZalaRiver,
• “Z11”, the interface between Phase I and Phase II, which typifiesthe waters of Phase I,
• “Kb210”, the sampling location that typifies Phase II solely asa wetland without the extra water inputs that connect to theKBWPS at sampling location Kb205 (Fig. 1), and
• “Z27”, the outlet of the KBWPS, which typifies the water outputof Phase II including the waters of the Combined Belt Canal andthe drainage pipes of fishing lakes from Somogy; this representsthe waters, which enter Lake Balaton.
The samples were taken following the water authority’s nationalcode of practice and analyzed in the same laboratory during theinvestigated time period.
3.2. Parameters and database
Twenty-two parameters were analyzed. They consisted of:chemical oxygen demand-potassium-dichromate original (CODC),biological oxygen demand (BOD-5), pH, Cl−, Fe2+, Mn2+, Ca2+,Na+, K+, SO4
2−, NH4-N (mg/l), Chlorophyll-a (mg/m3), dissolvedphosphorus, Mg2+, HCO3
−, CO32−, suspended solids, NO2-N, NO3-
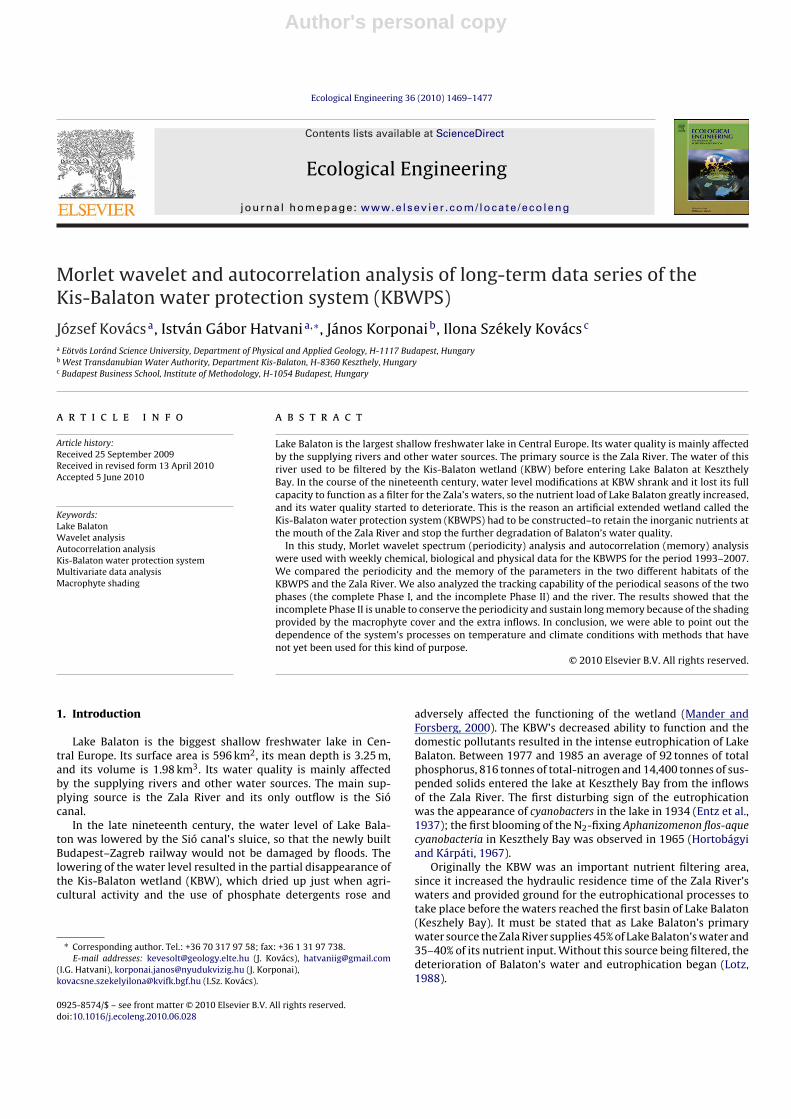
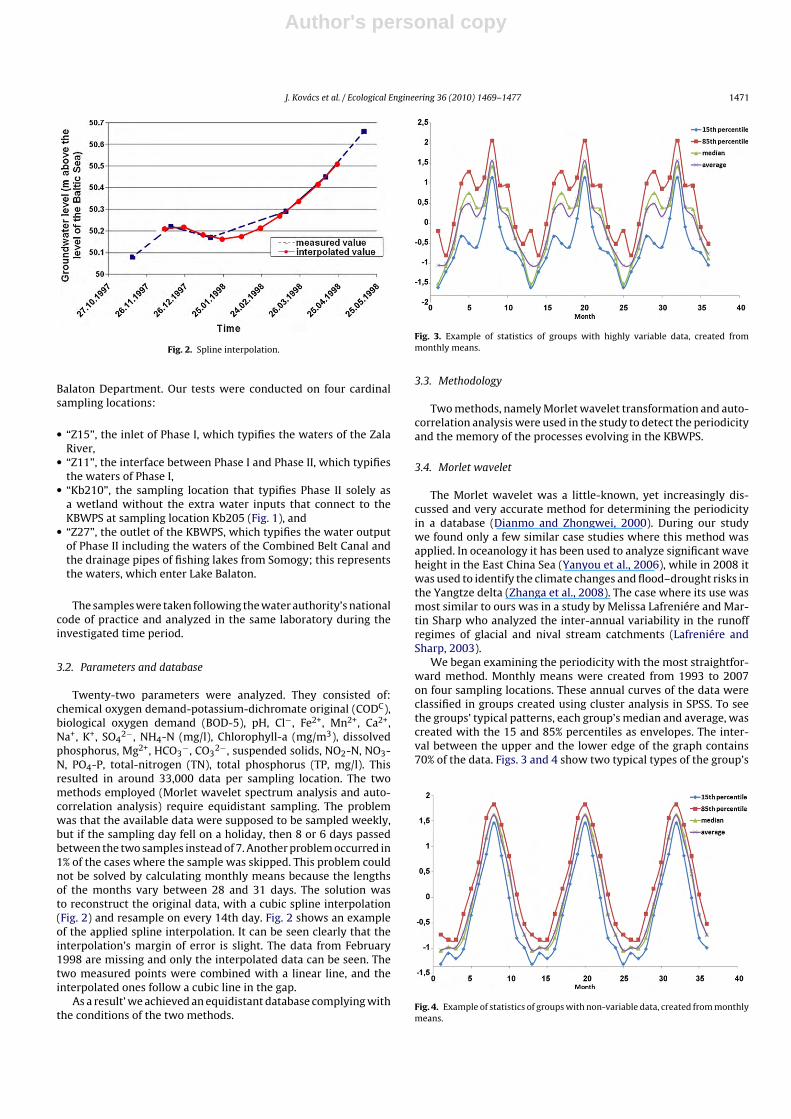
N, PO4-P, total-nitrogen (TN), total phosphorus (TP, mg/l). Thisresulted in around 33,000 data per sampling location. The twomethods employed (Morlet wavelet spectrum analysis and auto-correlation analysis) require equidistant sampling. The problemwas that the available data were supposed to be sampled weekly,but if the sampling day fell on a holiday, then 8 or 6 days passedbetween the two samples instead of 7. Another problem occurred in1% of the cases where the sample was skipped. This problem couldnot be solved by calculating monthly means because the lengthsof the months vary between 28 and 31 days. The solution wasto reconstruct the original data, with a cubic spline interpolation(Fig. 2) and resample on every 14th day. Fig. 2 shows an exampleof the applied spline interpolation. It can be seen clearly that theinterpolation’s margin of error is slight. The data from February1998 are missing and only the interpolated data can be seen. Thetwo measured points were combined with a linear line, and theinterpolated ones follow a cubic line in the gap.
As a result’ we achieved an equidistant database complying withthe conditions of the two methods.
Fig. 3. Example of statistics of groups with highly variable data, created frommonthly means.
3.3. Methodology
Two methods, namely Morlet wavelet transformation and auto-correlation analysis were used in the study to detect the periodicityand the memory of the processes evolving in the KBWPS.
3.4. Morlet wavelet
The Morlet wavelet was a little-known, yet increasingly dis-cussed and very accurate method for determining the periodicityin a database (Dianmo and Zhongwei, 2000). During our studywe found only a few similar case studies where this method wasapplied. In oceanology it has been used to analyze significant waveheight in the East China Sea (Yanyou et al., 2006), while in 2008 itwas used to identify the climate changes and flood–drought risks inthe Yangtze delta (Zhanga et al., 2008). The case where its use wasmost similar to ours was in a study by Melissa Lafreniére and Mar-tin Sharp who analyzed the inter-annual variability in the runoffregimes of glacial and nival stream catchments (Lafreniére andSharp, 2003).
We began examining the periodicity with the most straightfor-ward method. Monthly means were created from 1993 to 2007on four sampling locations. These annual curves of the data wereclassified in groups created using cluster analysis in SPSS. To seethe groups’ typical patterns, each group’s median and average, wascreated with the 15 and 85% percentiles as envelopes. The inter-val between the upper and the lower edge of the graph contains70% of the data. Figs. 3 and 4 show two typical types of the group’s
Fig. 4. Example of statistics of groups with non-variable data, created from monthlymeans.
Author's personal copy
1472 J. Kovács et al. / Ecological Engineering 36 (2010) 1469–1477
Fig. 5. Graph of the Morlet wavelet.
envelopes, median and average. To achieve a better interpretationwe tripled the years in these figures. There were cases where thedistance between the 15 and the 85 percentiles was wide. Thisreflects the diversity of the annual curves behind these graphs(Fig. 3), while other graphs such as Fig. 4 show the opposite. In thelatter case the distances were narrow and the annual curves weresimilar to each other. The graph explicitly showed annual period-icity in the group’s time series. Although the graph in Fig. 4 seemsto show periodicity, it does not mean that the annual period waspresent through the whole examined time. Even in more sophis-ticated techniques (like Lomb-Scargle’s) only the presence of anannual period can be determined (Lomb, 1976). The most reliablemethod to determine whether the annual periodic components arecontinuously present or not over the entire study interval, is theWavelet spectrum analysis.
The Morlet wavelet transformation, unlike the standard Fouriertransformation, permits of time-frequency mapping, because theFourier transformation decouples the examined data to trigono-metric (sine, cosine) curves, hence this method is inadequate toestimate a power spectral density (PSD). However, the Wavelettransformation surmounts the non-stationary problem with itsadaptability, by fragmenting the data to short “wavelets” insteadof long sine waves. This solves the problem raised by the Fouriertransformation. Wavelet transformation Wn(s) could be defined asthe convolution of the data and the wavelet function:
Wn(s) =n∑n=0
Xn′ ∗[
(n′ − n)ıts
]whereby the asterisk (*) represents the complex conjugate, ‘Xn’ theoriginal data stream, ‘s’ the scale, ‘ ’ the wavelet function and ‘ı’the degree of the resolution.
Its adaptability lies in the scaling method. The mother waveletprovides a source function to generate daughter wavelets, by scal-ing and transforming it. The purpose of the wavelet transformationis multiple dissociation; by decomposing the data in the scalingspace. In this way it is possible to reveal its self-similarity structure,and as a result the data’s periodicity can be examined.
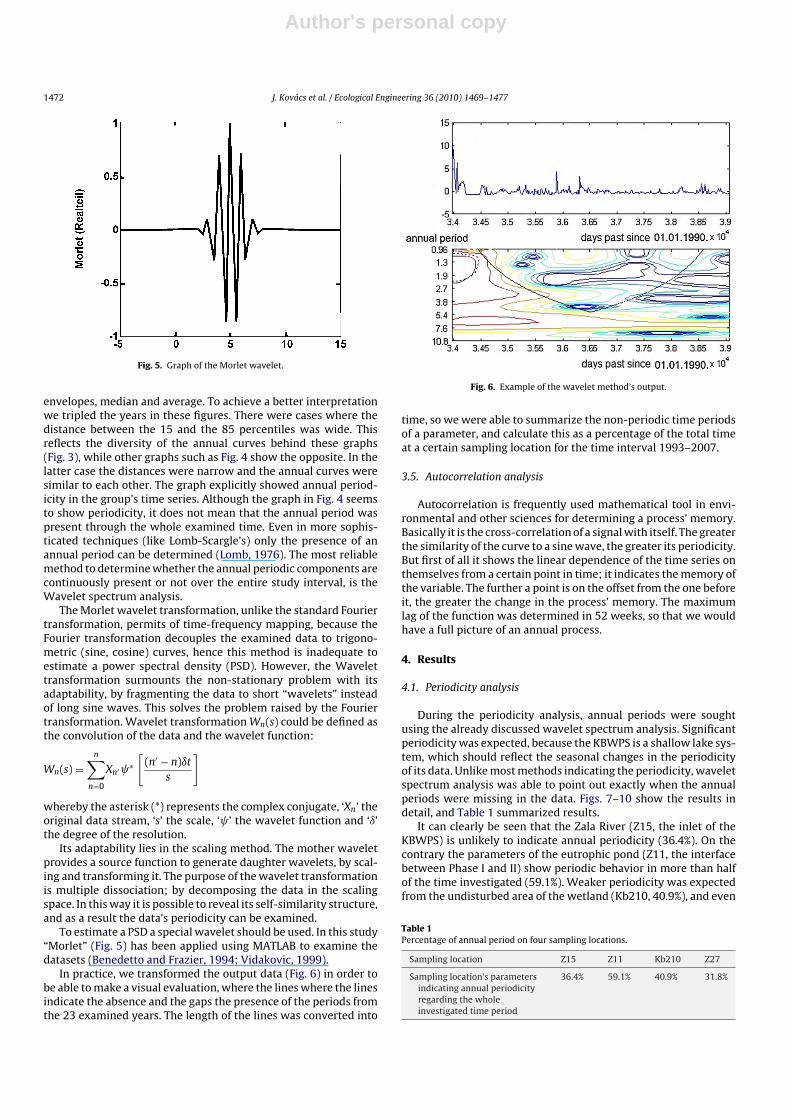
To estimate a PSD a special wavelet should be used. In this study“Morlet” (Fig. 5) has been applied using MATLAB to examine thedatasets (Benedetto and Frazier, 1994; Vidakovic, 1999).
In practice, we transformed the output data (Fig. 6) in order tobe able to make a visual evaluation, where the lines where the linesindicate the absence and the gaps the presence of the periods fromthe 23 examined years. The length of the lines was converted into
Fig. 6. Example of the wavelet method’s output.
time, so we were able to summarize the non-periodic time periodsof a parameter, and calculate this as a percentage of the total timeat a certain sampling location for the time interval 1993–2007.
3.5. Autocorrelation analysis
Autocorrelation is frequently used mathematical tool in envi-ronmental and other sciences for determining a process’ memory.Basically it is the cross-correlation of a signal with itself. The greaterthe similarity of the curve to a sine wave, the greater its periodicity.But first of all it shows the linear dependence of the time series onthemselves from a certain point in time; it indicates the memory ofthe variable. The further a point is on the offset from the one beforeit, the greater the change in the process’ memory. The maximumlag of the function was determined in 52 weeks, so that we wouldhave a full picture of an annual process.
4. Results
4.1. Periodicity analysis
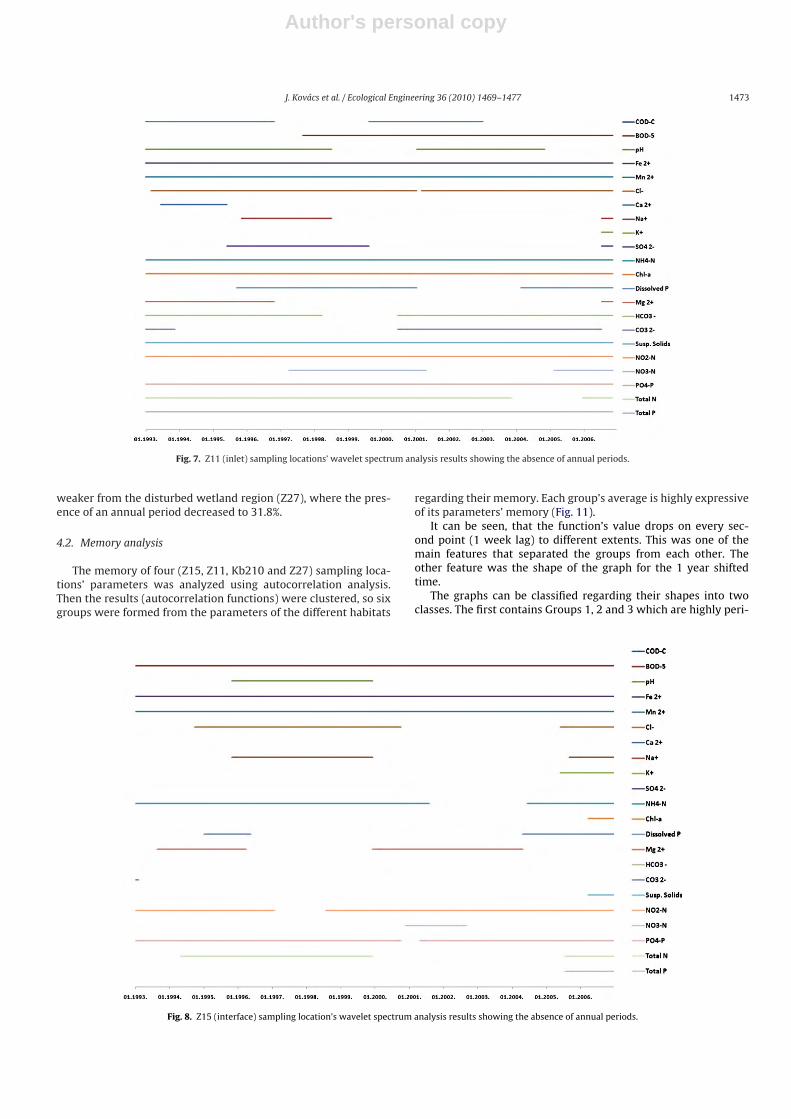
During the periodicity analysis, annual periods were soughtusing the already discussed wavelet spectrum analysis. Significantperiodicity was expected, because the KBWPS is a shallow lake sys-tem, which should reflect the seasonal changes in the periodicityof its data. Unlike most methods indicating the periodicity, waveletspectrum analysis was able to point out exactly when the annualperiods were missing in the data. Figs. 7–10 show the results indetail, and Table 1 summarized results.
It can clearly be seen that the Zala River (Z15, the inlet of theKBWPS) is unlikely to indicate annual periodicity (36.4%). On thecontrary the parameters of the eutrophic pond (Z11, the interfacebetween Phase I and II) show periodic behavior in more than halfof the time investigated (59.1%). Weaker periodicity was expectedfrom the undisturbed area of the wetland (Kb210, 40.9%), and even
Table 1Percentage of annual period on four sampling locations.
Sampling location Z15 Z11 Kb210 Z27
Sampling location’s parametersindicating annual periodicityregarding the wholeinvestigated time period
36.4% 59.1% 40.9% 31.8%
Author's personal copy
J. Kovács et al. / Ecological Engineering 36 (2010) 1469–1477 1473
Fig. 7. Z11 (inlet) sampling locations’ wavelet spectrum analysis results showing the absence of annual periods.
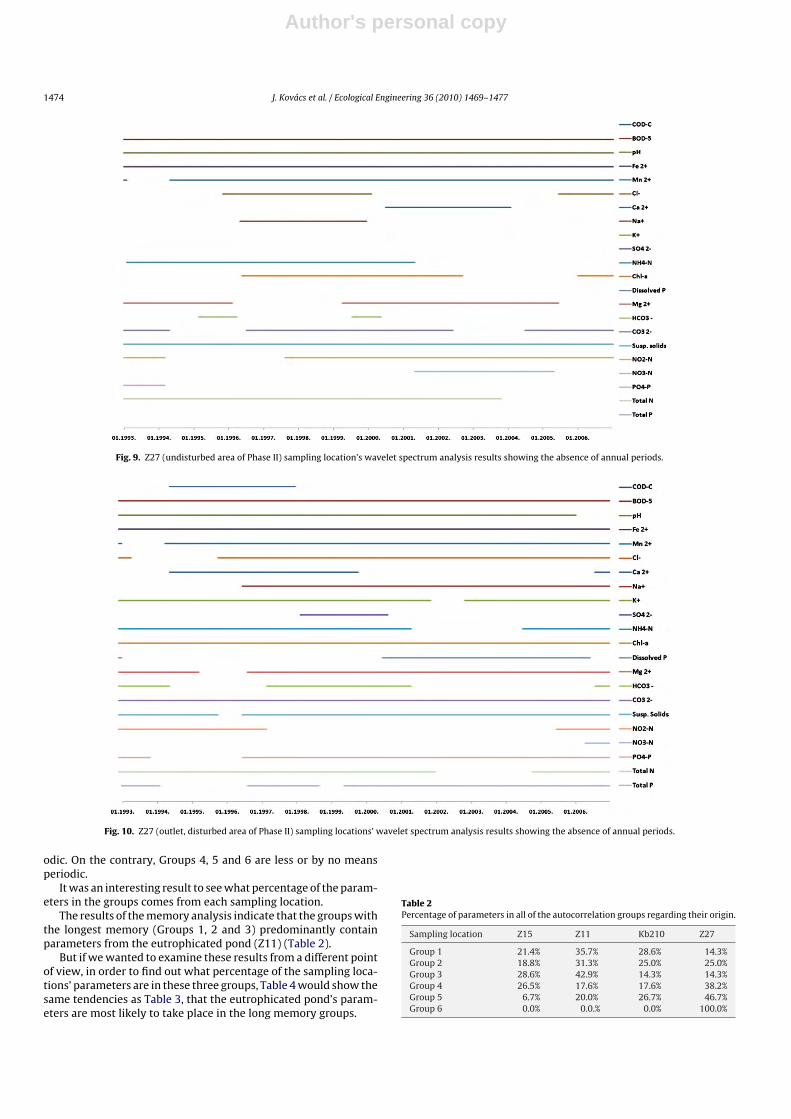
weaker from the disturbed wetland region (Z27), where the pres-ence of an annual period decreased to 31.8%.
4.2. Memory analysis
The memory of four (Z15, Z11, Kb210 and Z27) sampling loca-tions’ parameters was analyzed using autocorrelation analysis.Then the results (autocorrelation functions) were clustered, so sixgroups were formed from the parameters of the different habitats
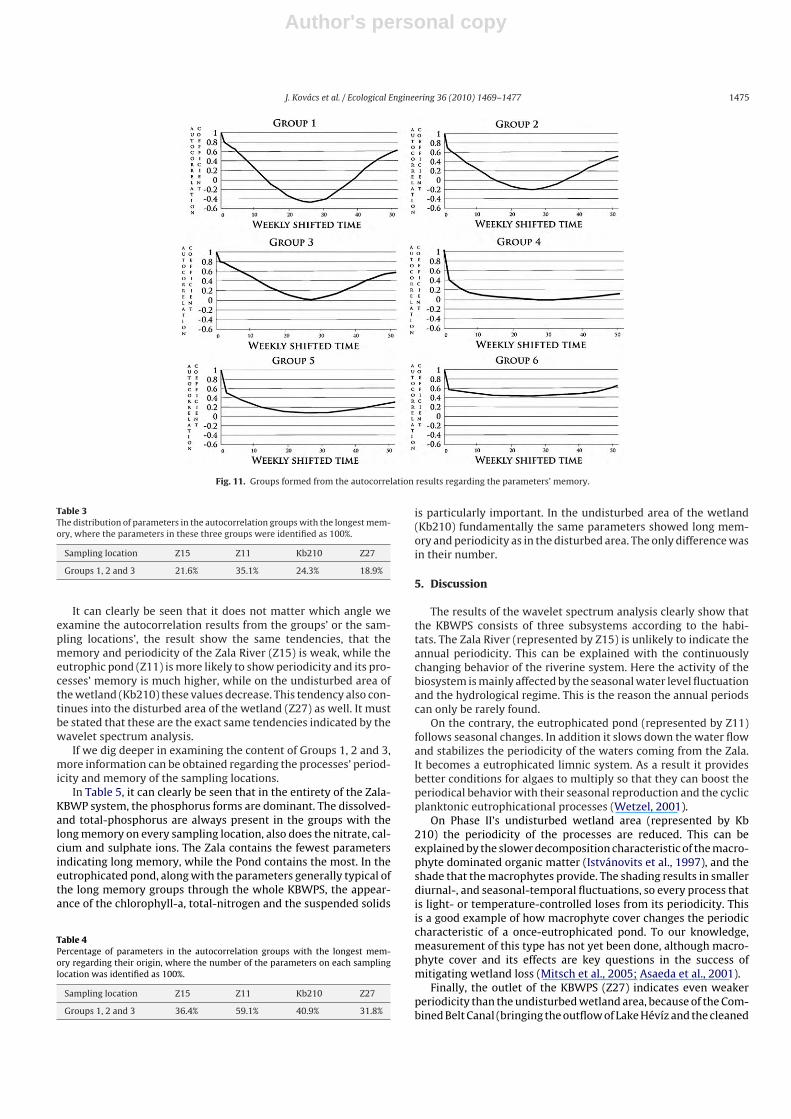
regarding their memory. Each group’s average is highly expressiveof its parameters’ memory (Fig. 11).
It can be seen, that the function’s value drops on every sec-ond point (1 week lag) to different extents. This was one of themain features that separated the groups from each other. Theother feature was the shape of the graph for the 1 year shiftedtime.
The graphs can be classified regarding their shapes into twoclasses. The first contains Groups 1, 2 and 3 which are highly peri-
Fig. 8. Z15 (interface) sampling location’s wavelet spectrum analysis results showing the absence of annual periods.
Author's personal copy
1474 J. Kovács et al. / Ecological Engineering 36 (2010) 1469–1477
Fig. 9. Z27 (undisturbed area of Phase II) sampling location’s wavelet spectrum analysis results showing the absence of annual periods.
Fig. 10. Z27 (outlet, disturbed area of Phase II) sampling locations’ wavelet spectrum analysis results showing the absence of annual periods.
odic. On the contrary, Groups 4, 5 and 6 are less or by no meansperiodic.
It was an interesting result to see what percentage of the param-eters in the groups comes from each sampling location.
The results of the memory analysis indicate that the groups withthe longest memory (Groups 1, 2 and 3) predominantly containparameters from the eutrophicated pond (Z11) (Table 2).
But if we wanted to examine these results from a different pointof view, in order to find out what percentage of the sampling loca-tions’ parameters are in these three groups, Table 4 would show thesame tendencies as Table 3, that the eutrophicated pond’s param-eters are most likely to take place in the long memory groups.
Table 2Percentage of parameters in all of the autocorrelation groups regarding their origin.
Sampling location Z15 Z11 Kb210 Z27
Group 1 21.4% 35.7% 28.6% 14.3%Group 2 18.8% 31.3% 25.0% 25.0%Group 3 28.6% 42.9% 14.3% 14.3%Group 4 26.5% 17.6% 17.6% 38.2%Group 5 6.7% 20.0% 26.7% 46.7%Group 6 0.0% 0.0.% 0.0% 100.0%
Author's personal copy
J. Kovács et al. / Ecological Engineering 36 (2010) 1469–1477 1475
Fig. 11. Groups formed from the autocorrelation results regarding the parameters’ memory.
Table 3The distribution of parameters in the autocorrelation groups with the longest mem-ory, where the parameters in these three groups were identified as 100%.
Sampling location Z15 Z11 Kb210 Z27
Groups 1, 2 and 3 21.6% 35.1% 24.3% 18.9%
It can clearly be seen that it does not matter which angle weexamine the autocorrelation results from the groups’ or the sam-pling locations’, the result show the same tendencies, that thememory and periodicity of the Zala River (Z15) is weak, while theeutrophic pond (Z11) is more likely to show periodicity and its pro-cesses’ memory is much higher, while on the undisturbed area ofthe wetland (Kb210) these values decrease. This tendency also con-tinues into the disturbed area of the wetland (Z27) as well. It mustbe stated that these are the exact same tendencies indicated by thewavelet spectrum analysis.
If we dig deeper in examining the content of Groups 1, 2 and 3,more information can be obtained regarding the processes’ period-icity and memory of the sampling locations.
In Table 5, it can clearly be seen that in the entirety of the Zala-KBWP system, the phosphorus forms are dominant. The dissolved-and total-phosphorus are always present in the groups with thelong memory on every sampling location, also does the nitrate, cal-cium and sulphate ions. The Zala contains the fewest parametersindicating long memory, while the Pond contains the most. In theeutrophicated pond, along with the parameters generally typical ofthe long memory groups through the whole KBWPS, the appear-ance of the chlorophyll-a, total-nitrogen and the suspended solids
Table 4Percentage of parameters in the autocorrelation groups with the longest mem-ory regarding their origin, where the number of the parameters on each samplinglocation was identified as 100%.
Sampling location Z15 Z11 Kb210 Z27
Groups 1, 2 and 3 36.4% 59.1% 40.9% 31.8%
is particularly important. In the undisturbed area of the wetland(Kb210) fundamentally the same parameters showed long mem-ory and periodicity as in the disturbed area. The only difference wasin their number.
5. Discussion
The results of the wavelet spectrum analysis clearly show thatthe KBWPS consists of three subsystems according to the habi-tats. The Zala River (represented by Z15) is unlikely to indicate theannual periodicity. This can be explained with the continuouslychanging behavior of the riverine system. Here the activity of thebiosystem is mainly affected by the seasonal water level fluctuationand the hydrological regime. This is the reason the annual periodscan only be rarely found.
On the contrary, the eutrophicated pond (represented by Z11)follows seasonal changes. In addition it slows down the water flowand stabilizes the periodicity of the waters coming from the Zala.It becomes a eutrophicated limnic system. As a result it providesbetter conditions for algaes to multiply so that they can boost theperiodical behavior with their seasonal reproduction and the cyclicplanktonic eutrophicational processes (Wetzel, 2001).
On Phase II’s undisturbed wetland area (represented by Kb210) the periodicity of the processes are reduced. This can beexplained by the slower decomposition characteristic of the macro-phyte dominated organic matter (Istvánovits et al., 1997), and theshade that the macrophytes provide. The shading results in smallerdiurnal-, and seasonal-temporal fluctuations, so every process thatis light- or temperature-controlled loses from its periodicity. Thisis a good example of how macrophyte cover changes the periodiccharacteristic of a once-eutrophicated pond. To our knowledge,measurement of this type has not yet been done, although macro-phyte cover and its effects are key questions in the success ofmitigating wetland loss (Mitsch et al., 2005; Asaeda et al., 2001).
Finally, the outlet of the KBWPS (Z27) indicates even weakerperiodicity than the undisturbed wetland area, because of the Com-bined Belt Canal (bringing the outflow of Lake Hévíz and the cleaned
Author's personal copy
1476 J. Kovács et al. / Ecological Engineering 36 (2010) 1469–1477
Table 5Parameters in the autocorrelation groups number 1, 2 and 3 regarding their origin.
Sampling locations Z15 Z11 Kb210 Z27
Parameters that belong to autocorrelation groupswith the longest memory (Groups 1, 2 and 3)
Dissolved P Dissolved P Dissolved P Dissolved P
PO4-P – PO4-P PO4-PTotal P Total P Total P Total PK+ K+ K+ –Ca2+ Ca2+ Ca2+ Ca2+
Na+ Na+ Na+ –SO4
2− SO42− SO4
2− SO42−
NO3-N NO3-N NO3-N NO3-N– CODC CODC CODC
– Chl-a – –– Total N – –– Suspended – –– Solids– Cl−
HCO3−
sewage of Keszthely city) and the drainage pipes of fishing lakesfrom Somogy. The unfinished area of Phase II is not capable ofbuffering these kind of overflows, and that is the reason why theperiodical nature of the processes is reduced.
With regard to the memory analysis (autocorrelation analysis),either way we examine the result, from the groups (with the longestmemory), or the four sampling point perspective, the tendenciesand their causes would be almost exactly the same as the onesdiscussed in the explanation of the results of the wavelet spectrumanalysis.
The above results described the nature of the different habitatsof the KBWPS, but if we want to have a comprehensive pictureof the processes, the distribution of the parameters should also beexamined. The results regarding the origin of the parameters in theautocorrelation groups with the longest memory can be explainedwith the following reasons.
The Zala River and the whole KBWPS is phosphorus-dominated,which is the driving and also the limiting factor of the eutrophica-tion. The reason the phosphorus parameters show long memory,and are also periodic in most cases, is because the eutrophica-tion itself is highly seasonal and it is defined by the light andtemperature conditions of the water. In the Zala River few param-eters showed long memory because of the diffuse loadings and thefloods. When the seasonal floods came, the concentration of theseparticular parameters rose and afterwards decreased.
In the eutrophic pond, among many others, the chlorophyll-a,suspended solids, and total-nitrogen instantly took their places inthe autocorrelation groups with the longest memory, which is notsurprising. It is a general truth that in the moderate climate bio-genic cycles dominate the waters (Padisák, 2005) and make theprocesses show long memory and periodicity in most cases. Inthe water, metabolism is light- and temperature-limited. In thesummer metabolism is faster, then it slows down in winter, andturns back on in spring. In the Hidvégi Pond’s open waterspaceplanktonic eutrophication dominates with its diurnal and seasonalcycle. During the day photosynthesis consumes carbon-dioxide,and produces oxygen, while in the warm seasons the ratio of thephosphorus and nitrogen forms is low. In the winter these charac-teristics operate in the opposite direction. These systematic eventscause the parameters of the eutrophic pond to show long memory.
The water then flows into the undisturbed area of the wet-land (PhaseII, Kb210) where the water space is 80–90% shadedby macrophytes, primarily reeds. The shade provided affects thewater’s light conditions, and damps the amplitude of the diurnaltemperature oscillation. As a result the photoautotrophic processesare forced into the background, and the decomposing processes
along with the microbial loop take their place. These processes arealso defined by the temperature oscillations, but on a much largerscale. This is reflected in the absence of the parameters that describeeutrophication. Only those take place in the long autocorrelationgroups that were among the ones controlled by the oxy-redoxyconditions and decomposition. In the microbial loop the oxidationand nitrification processes are dominant. On both the undisturbed(Kb210) and disturbed (Z27) area of Phase II in the winter thedecomposing processes slow down, and the water’s oxygen con-tent is not used up; so the sulphate’s oxidation processes, whilein the summer its reduction processes dominate. The only differ-ence between the undisturbed, and disturbed area of Phase II, isthat after the Combined Belt Canal’s and the fishing lake’s inflowreaches and disturbs the wetland, the number of components withlong memory is reduced.
6. Conclusions
Using the wavelet spectrum and autocorrelation analyses, wewere able to describe the nature of the processes evolving in theKBWPS in the question of their periodicity and memory. To ourknowledge, no one has ever used these two methods to describe anecological system like the KBWPS. With these we not only obtaineda more comprehensive picture of the system, but were able to seethe deeper dependence of the processes through the examinedparameters’ behavior. It is a known fact that the temperature andclimatic conditions define a biosystem, especially in water, but thisdependence has not yet been described in terms of periodicity andmemory.
Acknowledgements
The data analyzed were provided by the West Trans-danubianWater Authority, for which we are very grateful. We are also grate-ful for the useful advice and help of Nóra Szilágyi from the EötvösLoránd University and István Tártai from the Hungarian Academyof Sciences, Balaton Limnological Research Institute.
References
Asaeda, T., Trung, V.K., Manatunge, J., Bon, T.V., 2001. Modellingmacrophyte–nutrient–phytoplankton interactions in shallow eutrophiclakes and the evaluation of environmental impacts. Ecol. Eng. 16, 341–357.
Benedetto, J., Frazier, M. (Eds.), 1994. Wavelets: Mathematics and Applications. CRCPress, Boca Raton, FL, p. 575.
Brooks, R.P., Wardrop, D.H., Cole, C.A., Campbell, D.A., 2005. Are we purveyors of wet-land homogeneity? A model of degradation and restoration to improve wetlandmitigation performance. Ecol. Eng. 24, 331–340.
Author's personal copy
J. Kovács et al. / Ecological Engineering 36 (2010) 1469–1477 1477
Dianmo, L., Zhongwei, G., 2000. Some aspect of ecological modeling developmentsin China. Ecol. Model. 132, 3–10.
Entz, G., Kottász, J., Sebestyén, O., 1937. Quantitativ tanulmányok a Balaton bioszesz-tonjában, A Magyar Biológiai Kutatóintézet I. Osztályának Munkái X, 1–152.
Hajnal, E., Padisák, J., 2008. Analysis of long-term ecological status of Lake Balatonbased on the ALMOBAL phytoplankton database. Hydrobiologia 599, 259–276.
Hortobágyi, T., Kárpáti, I., 1967. Nagyméretu vízvirágzás a Balaton délnyugati részén(Large water blooming in the southern-western region of the Balaton). BotanikaiKözlöny 54, 137–142.
Istvánovics, V., Clement, A., Somlyody, L., Specziar, A., G.-Toth, L., Padisak, J., 2007.Updating water quality targets for shallow Lake Balaton (Hungary)* recoveringfrom eutrophication. Hydrobiologia 581, 305–318.
Istvánovics, V., Somlyódi, L., 2001. Factors influencing lake recovery fromeutrophication—the case of Basin 1 of Lake Balaton. Water Res. 35 (3), 729–735.
Istvánovics, V., Somlyódi, L., Clement, A., 2002. Cyanobacteria-mediated internaleutrophication in shallow Lake Balaton after load reduction. Water Research36, 3314–3322.
Istvánovits, V., Kovács, A., Vörös, L., Herodek, S., Pomogyi, P., 1997. Phosphoruscycling in a large, reconstructed wetland, the lower Kis-Balaton Reservoir (Hun-gary). Verh. Int. Verein. Limnol. 26, 323–329.
Korponai, J., Braun, M., Buczkó, K., Gyulai, I., Forró, L., Nédli, J., Papp, I., 2010. Transi-tion from shallow lake to a wetland: a multi-proxy case study in Zalavári Pond,Lake Balaton, Hungary. Hydrobiologia (Published online).
Lafreniére, M., Sharp, M., 2003. Wavelet analysis of inter-annual variability inthe runoff regimes of glacial and nival stream catchments, Bow Lake, Alberta.Hydrol. Process. 17, 1093–1118.
Lomb, N.R., 1976. Least-squares frequency analysis of unequally spaced data. Astro-phys. Space Sci. 39, 447–462.
Lotz, G., 1988. A Kis-Balaton Vízvédelmi Rendszer. Hidrológiai Tájékoztató. Október20–22.
Mander, Ü., Forsberg, C., 2000. Nonpoint pollution in agricultural watersheds ofendangered costal seas. Ecol. Eng. 14, 317–324.
Mitsch, W.J., Zhang, L., Anderson, C.J., Altor, A.E., Hernández, M.E., 2005. Creatingriverine wetlands: ecological succession, nutrient retention, and pulsing effects.Ecol. Eng. 25, 510–527.
Nguyen, H.L., Leermakers, M., Kurunczi, S., Bozo, L., Baeyens, W., 2005. Mercurydistribution and speciation in Lake Balaton, Hungary. Sci. Tot. Environ. 340,231–246.
Padisák, J., 2005. Általános limnológia (General Limnology). ELTE Eötvös Kiadó,Budapest, p. 310.
Pomogyi, P. (Ed.), 1991. A Kis-Balaton Védorendszer kémiai, biológiai, anyagforgalmivizsgálatai, Összefoglaló jelentés az 1985–1990 közötti kutatásokról (Researchon the chemical, biological and nutrient transport of the KBWPS, Report on theresults on the period 1985–1990), Szombathely-Keszthely, p. 71.
Tátrai, I., Kálmán, M., Korponai, J., Paulovits, G., Pomogyi, P., 2000. The role of the Kis-Balaton water protection system in the control of water quality of Lake Balaton.Ecol. Eng. 16, 73–78.
Vidakovic, B., 1999. Statistical Modeling by Wavelets. Wiley, New York, p. 382.Wetzel, R.G., 2001. Limnology: Lake and River Ecosystems, 3rd ed. Academic Press,
San Diego, CA, 1006 pp.Yanyou, G., Yijun, H., Mingkui, L., 2006. Multi-scale wavelet analysis of
TOPEX/Posseidon altimeter significant wave height in eastern China seas. Chin.J. Oceanol. Limnol. 24 (1), 81–86.
Zhanga, Q., Gemmerb, M., Chena, J., 2008. Climate changes and flood/drought riskin the Yangtze Delta, China, during the past millennium. Quatern. Int. 176–177,62–69.
Related Documents