Morgan Stanley Global Consumer Conference Morgan Stanley Global Consumer Conference John Cahill Chairman & CEO Al Drewes Chief Financial Officer John Cahill Chairman & CEO Al Drewes Chief Financial Officer November 6, 2003 November 6, 2003

Welcome message from author
This document is posted to help you gain knowledge. Please leave a comment to let me know what you think about it! Share it to your friends and learn new things together.
Transcript
Morgan StanleyGlobal Consumer ConferenceMorgan StanleyGlobal Consumer Conference
John CahillChairman & CEO
Al DrewesChief Financial Officer
John CahillChairman & CEO
Al DrewesChief Financial Officer
November 6, 2003November 6, 2003
Statements made in this presentation that relate to futureperformance or financial results of this company areforward-looking statements, which involve uncertaintiesthat could cause actual performance or results to materiallydiffer. We undertake no obligation to update any of thesestatements. Listeners are cautioned not to place unduereliance on these forward-looking statements. Thesestatements should be taken in conjunction with theadditional information about risk and uncertainties setforth in the company’s annual report on Form 10-K.
Statements made in this presentation that relate to futureperformance or financial results of this company areforward-looking statements, which involve uncertaintiesthat could cause actual performance or results to materiallydiffer. We undertake no obligation to update any of thesestatements. Listeners are cautioned not to place unduereliance on these forward-looking statements. Thesestatements should be taken in conjunction with theadditional information about risk and uncertainties setforth in the company’s annual report on Form 10-K.
Perspective on ProgressPerspective on Progress
• Financial Outlook• Financial Outlook
• Priority 2: Improving Performance in Mexico• Priority 2: Improving Performance in Mexico
• Priority 1: Achieving Topline Growth in the U.S.• Priority 1: Achieving Topline Growth in the U.S.

Perspective on ProgressPerspective on Progress
• Priority 1: Achieving Topline Growth in the U.S.• Priority 1: Achieving Topline Growth in the U.S.
U.S. Topline MomentumU.S. Topline Momentum
• Second Half Actions ProvideMomentum into 2004
– Volume Improving– Pricing Trends Solid– Continued Strong Execution
• Second Half Actions ProvideMomentum into 2004
– Volume Improving– Pricing Trends Solid– Continued Strong Execution
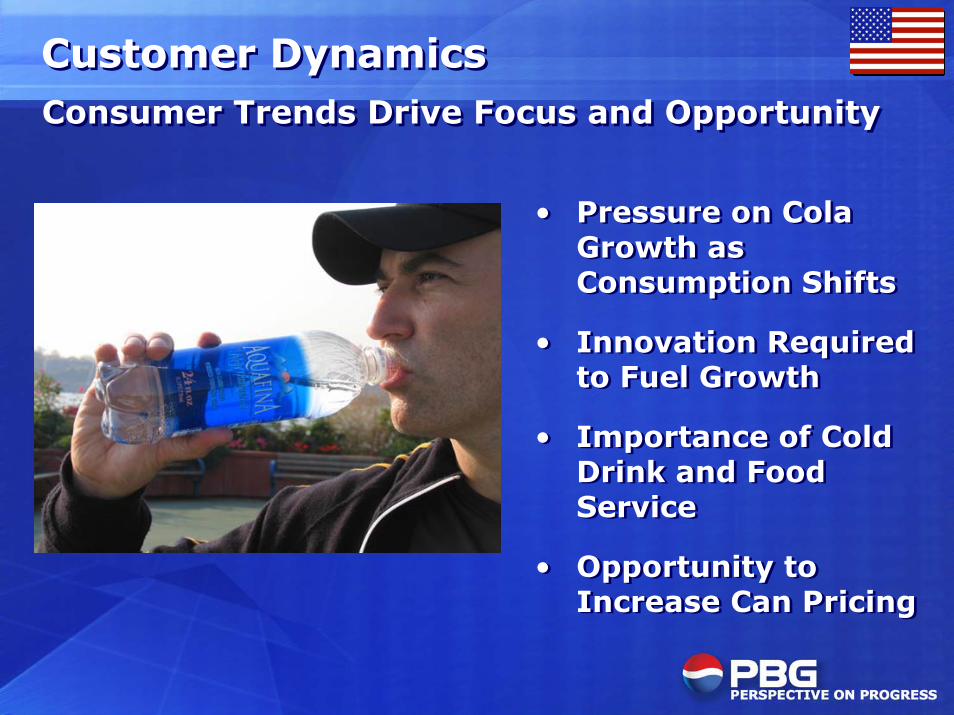
Customer DynamicsCustomer DynamicsConsumer Trends Drive Focus and OpportunityConsumer Trends Drive Focus and Opportunity
• Pressure on ColaGrowth asConsumption Shifts
• Innovation Requiredto Fuel Growth
• Importance of ColdDrink and FoodService
• Opportunity toIncrease Can Pricing
• Pressure on ColaGrowth asConsumption Shifts
• Innovation Requiredto Fuel Growth
• Importance of ColdDrink and FoodService
• Opportunity toIncrease Can Pricing
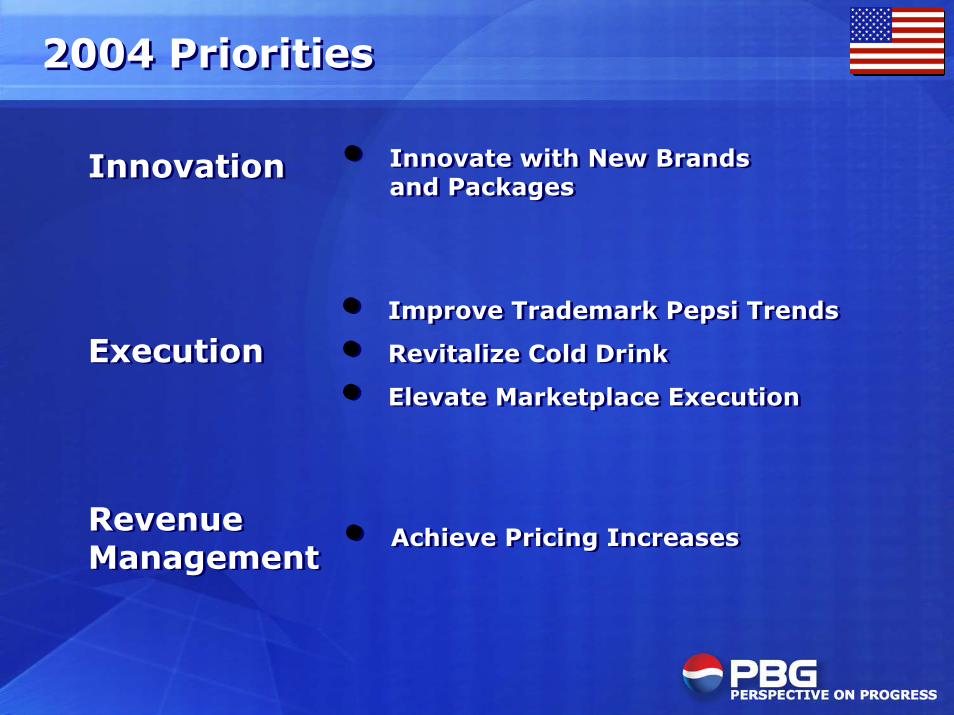
2004 Priorities2004 Priorities
InnovationInnovation • Innovate with New Brandsand Packages
• Innovate with New Brandsand Packages
• Achieve Pricing Increases• Achieve Pricing Increases
• Improve Trademark Pepsi Trends
• Revitalize Cold Drink
• Elevate Marketplace Execution
• Improve Trademark Pepsi Trends
• Revitalize Cold Drink
• Elevate Marketplace Execution
ExecutionExecution
RevenueManagementRevenueManagement
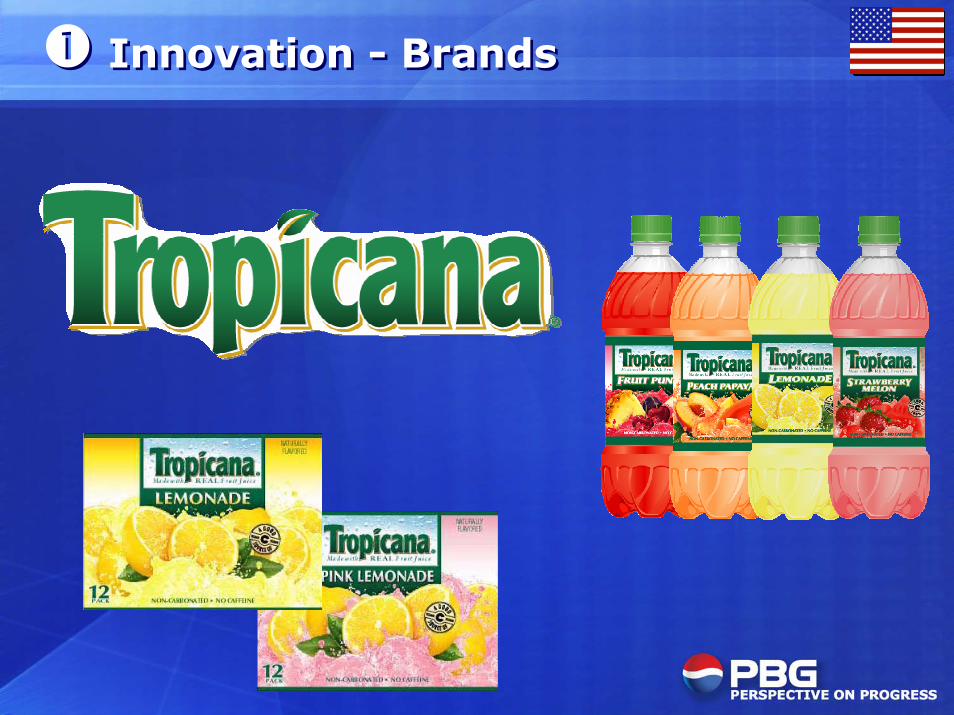
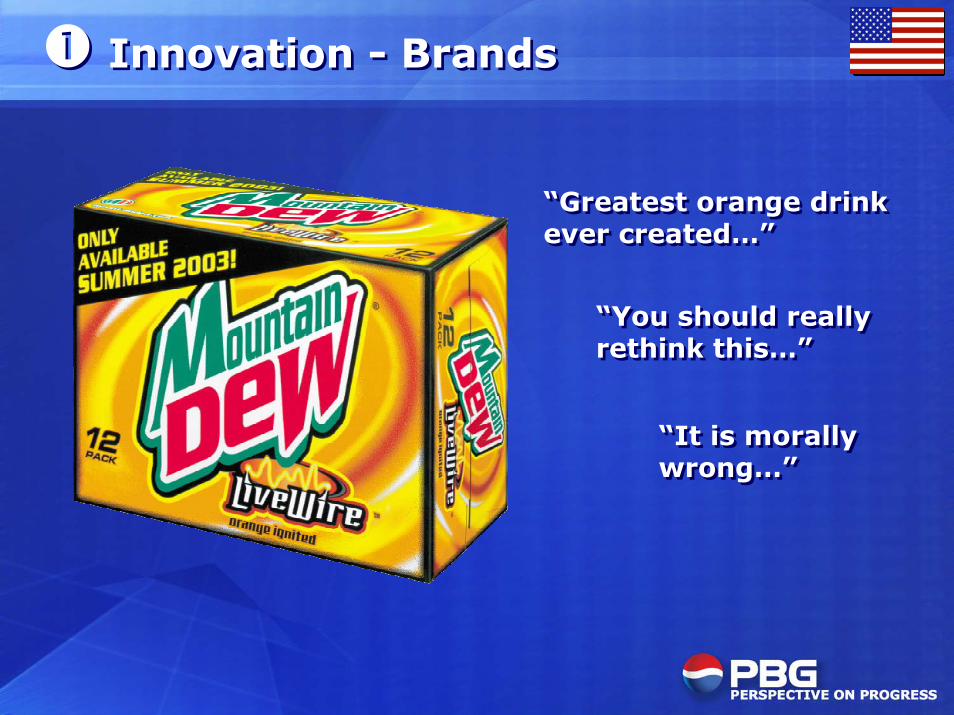
� Innovation - Brands� Innovation - Brands
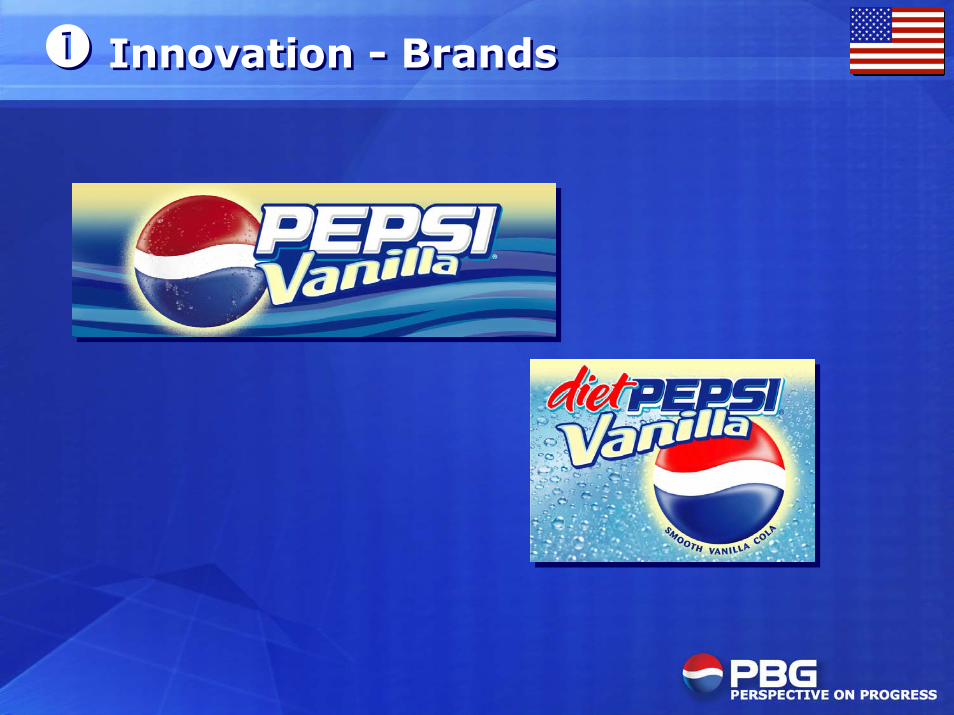
� Innovation - Brands� Innovation - Brands
� Innovation - Brands� Innovation - Brands
“Greatest orange drinkever created…”“Greatest orange drinkever created…”
“You should reallyrethink this…”“You should reallyrethink this…”
“It is morallywrong…”“It is morallywrong…”
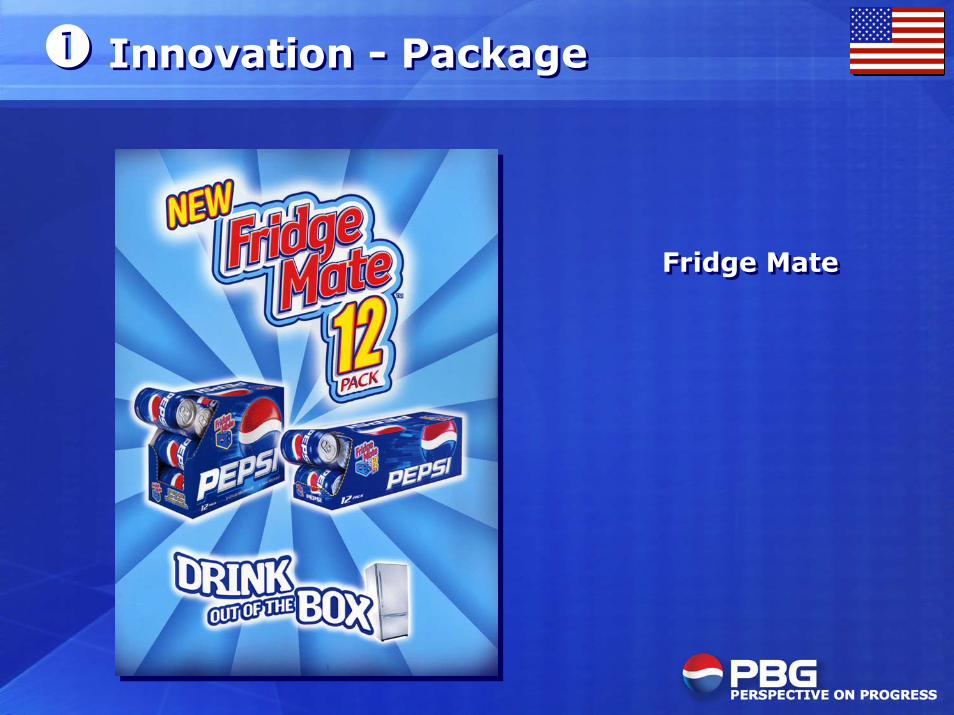
� Innovation - Package� Innovation - Package
Fridge MateFridge Mate
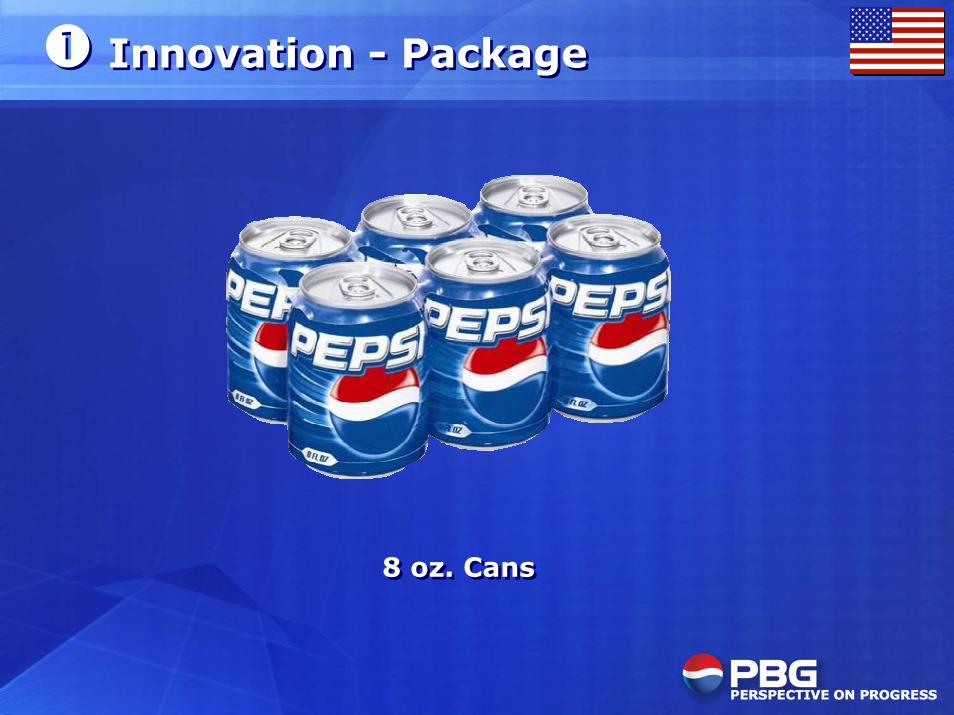
� Innovation - Package� Innovation - Package
8 oz. Cans8 oz. Cans
• Improve Cola Trends• Improve Cola Trends
• Improve Cola Trends• Improve Cola Trends
• System Focus
• Brand Relevance
• Innovation
• System Focus
• Brand Relevance
• Innovation
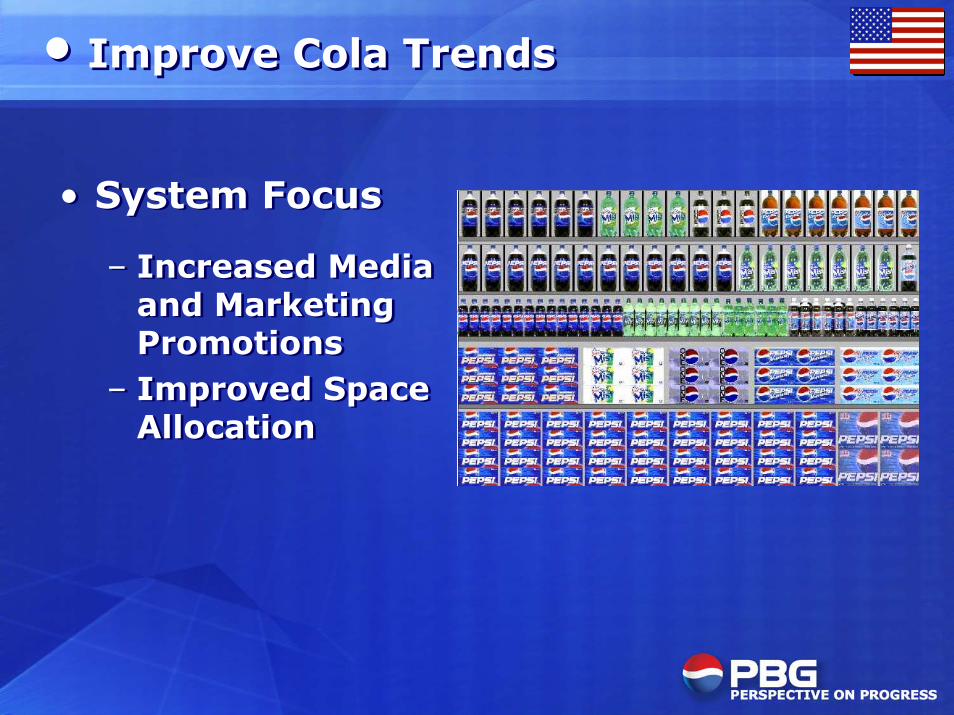
• Improve Cola Trends• Improve Cola Trends
• System Focus
– Increased Mediaand MarketingPromotions
– Improved SpaceAllocation
• System Focus
– Increased Mediaand MarketingPromotions
– Improved SpaceAllocation
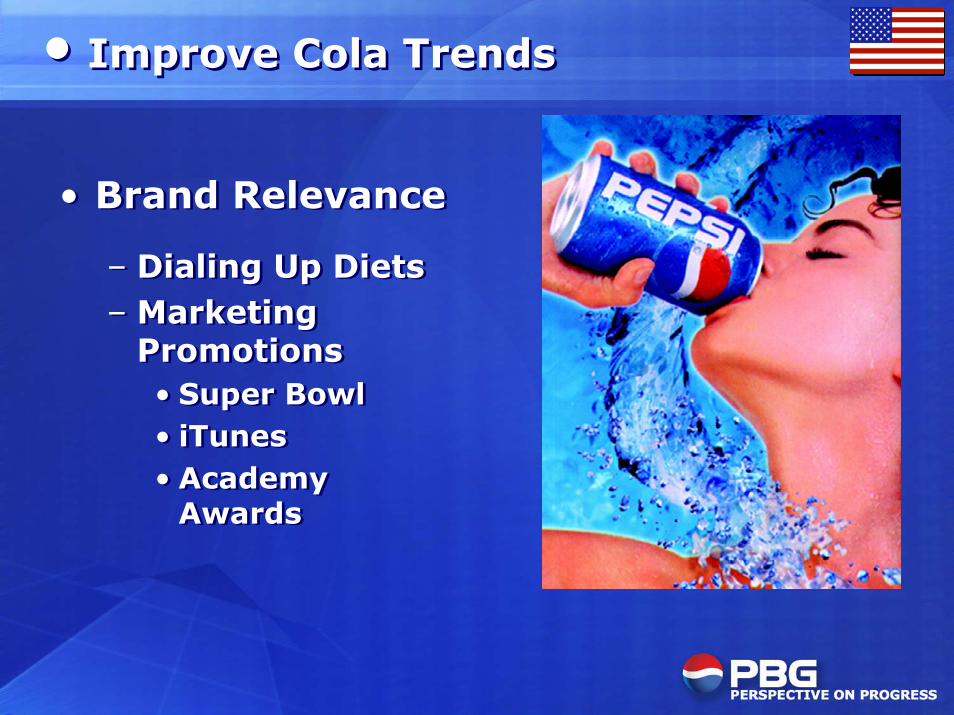
• Improve Cola Trends• Improve Cola Trends
• Brand Relevance
– Dialing Up Diets– Marketing
Promotions• Super Bowl• iTunes• Academy
Awards
• Brand Relevance
– Dialing Up Diets– Marketing
Promotions• Super Bowl• iTunes• Academy
Awards
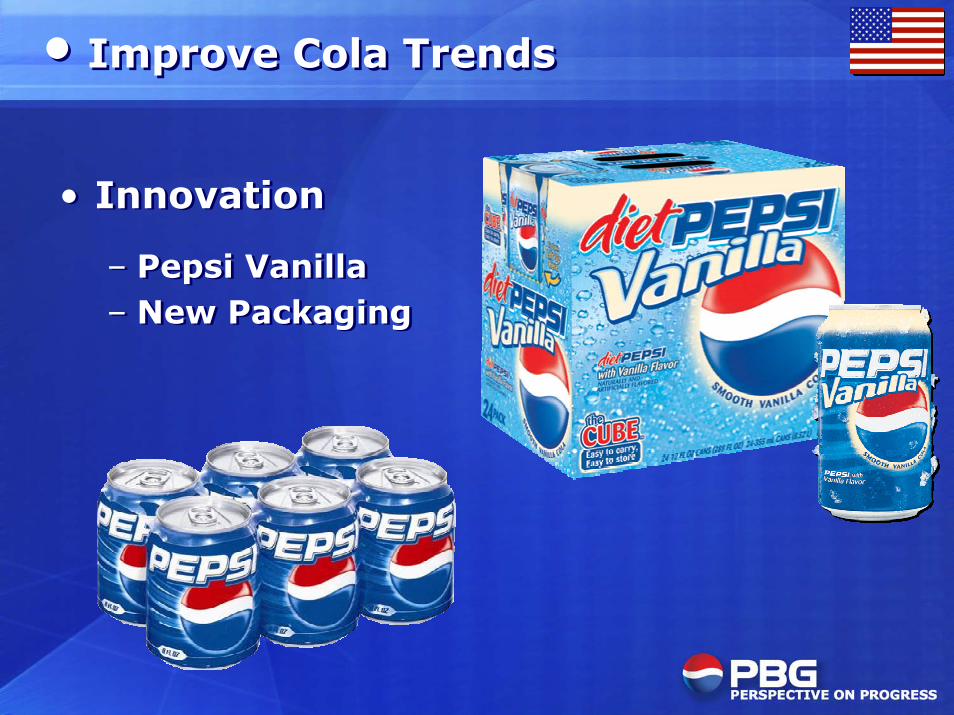
• Improve Cola Trends• Improve Cola Trends
• Innovation
– Pepsi Vanilla– New Packaging
• Innovation
– Pepsi Vanilla– New Packaging

• Revitalize Cold Drink• Revitalize Cold Drink
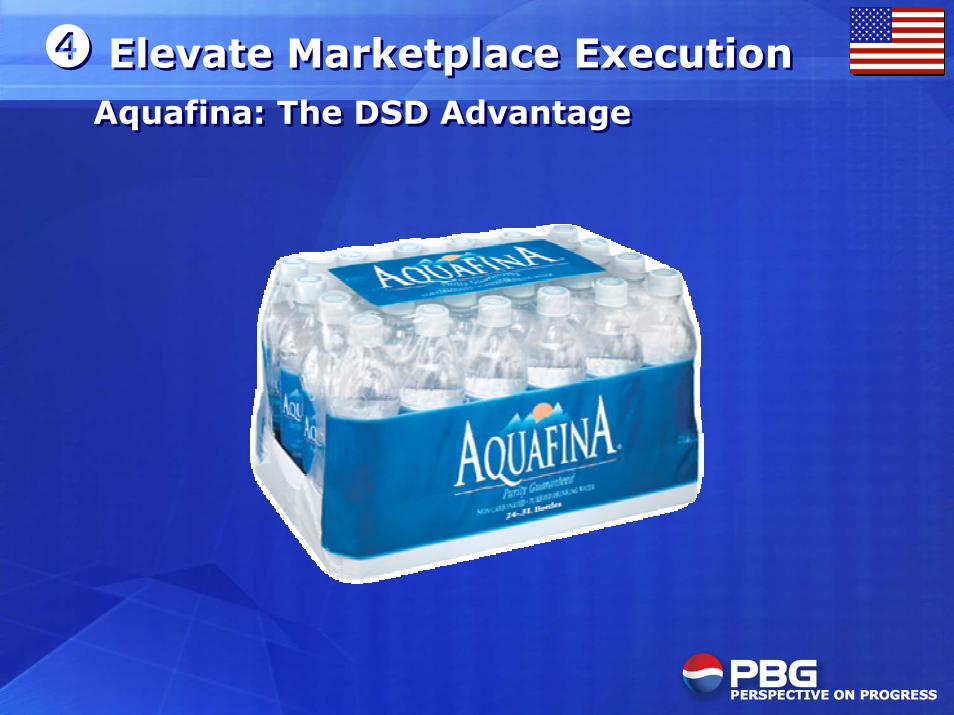
� Elevate Marketplace Execution� Elevate Marketplace ExecutionAquafina: The DSD AdvantageAquafina: The DSD Advantage

� Elevate Marketplace Execution� Elevate Marketplace ExecutionAquafina: The DSD AdvantageAquafina: The DSD Advantage
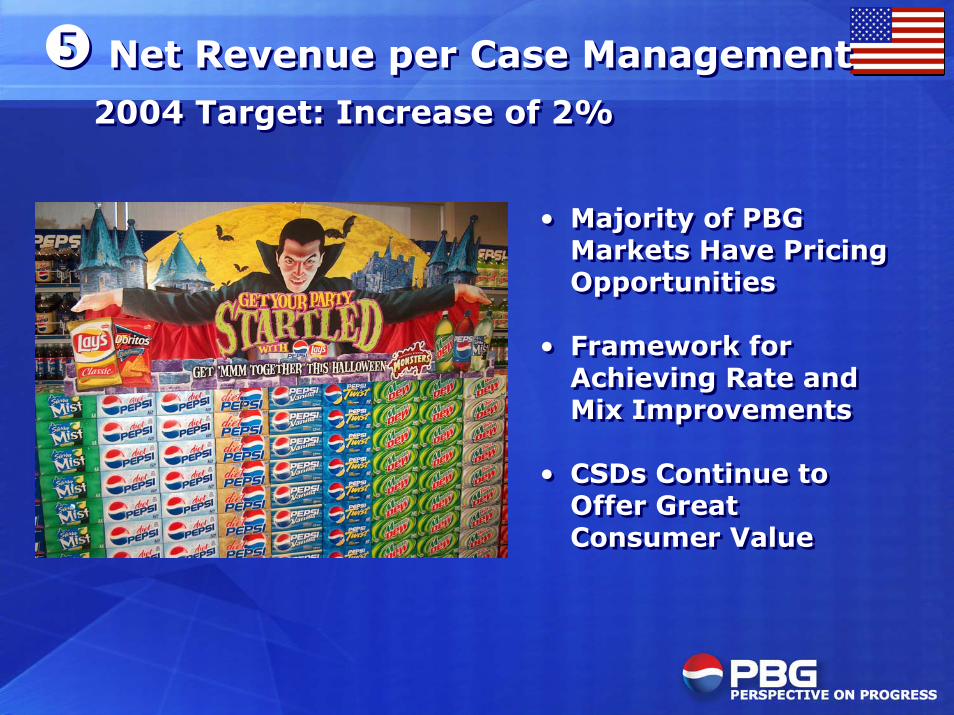
• Majority of PBGMarkets Have PricingOpportunities
• Framework forAchieving Rate andMix Improvements
• CSDs Continue toOffer GreatConsumer Value
• Majority of PBGMarkets Have PricingOpportunities
• Framework forAchieving Rate andMix Improvements
• CSDs Continue toOffer GreatConsumer Value
� Net Revenue per Case Management� Net Revenue per Case Management
2004 Target: Increase of 2%2004 Target: Increase of 2%
U.S. SummaryU.S. Summary
• Innovate with New Brands and Packages
• Improve Trademark Pepsi Trends
• Revitalize Cold Drink
• Elevate Marketplace Execution
• Achieve Pricing Increases
• Innovate with New Brands and Packages
• Improve Trademark Pepsi Trends
• Revitalize Cold Drink
• Elevate Marketplace Execution
• Achieve Pricing Increases
Perspective on ProgressPerspective on Progress
• Priority 2: Improving Performance in Mexico• Priority 2: Improving Performance in Mexico

Improving Performance in MexicoImproving Performance in Mexico
Improving Performance in MexicoImproving Performance in Mexico
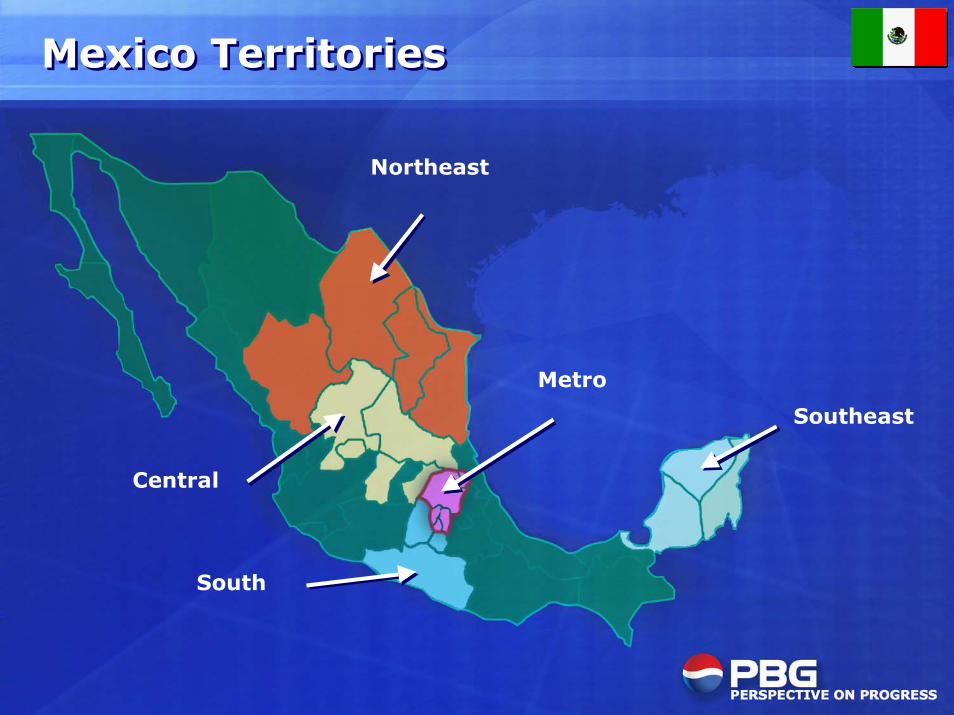
Central
South
Southeast
Mexico TerritoriesMexico Territories
Northeast
Metro

Brand and Channel OverviewBrand and Channel Overview

• Weak Macroeconomic Factors
• Cost and Competitive Pressures
• Weak Macroeconomic Factors
• Cost and Competitive Pressures
2003 Dynamics2003 Dynamics

Mexico City PerformanceMexico City Performance
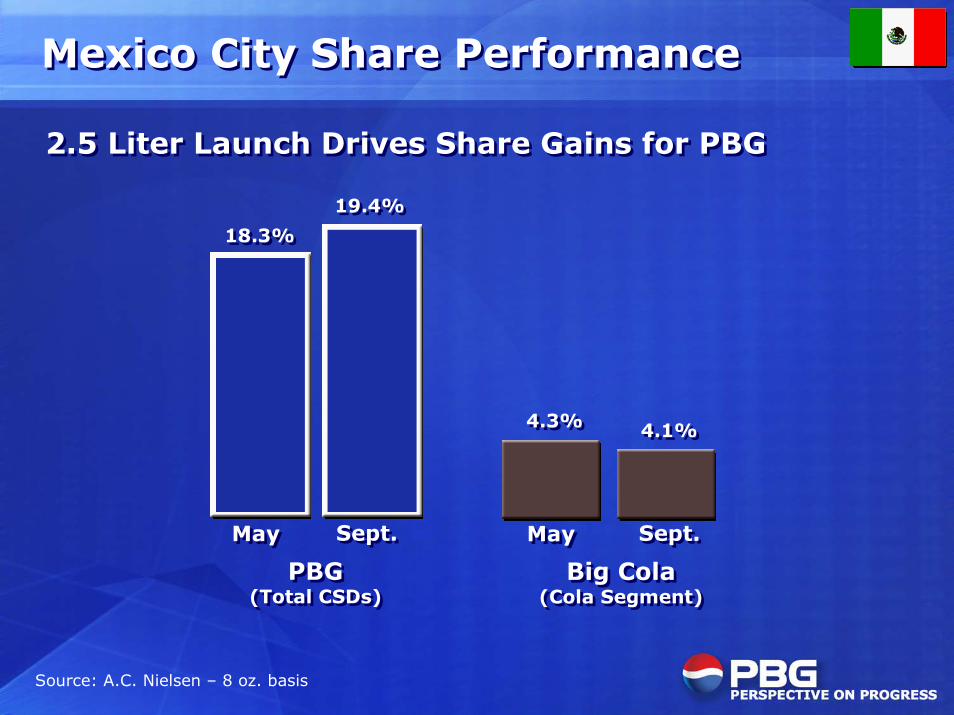
2.5 Liter Launch Drives Share Gains for PBG2.5 Liter Launch Drives Share Gains for PBG
Mexico City Share PerformanceMexico City Share Performance
18.3%18.3%
MayMay Sept.Sept.
PBG(Total CSDs)
PBG(Total CSDs)
19.4%19.4%
4.3%4.3%
MayMay Sept.Sept.
Big Cola(Cola Segment)
Big Cola(Cola Segment)
4.1%4.1%
Source: A.C. Nielsen – 8 oz. basis
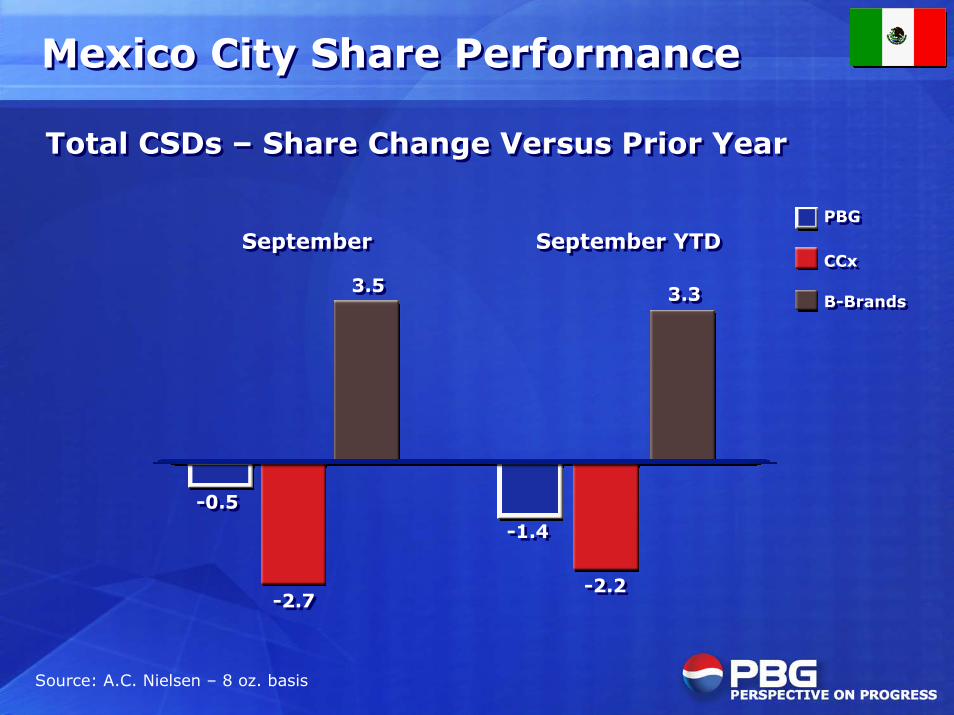
Mexico City Share PerformanceMexico City Share Performance
Total CSDs – Share Change Versus Prior YearTotal CSDs – Share Change Versus Prior Year
SeptemberSeptember September YTDSeptember YTD
3.53.5
-2.7-2.7
-0.5-0.5
-2.2-2.2
-1.4-1.4
3.33.3
PBGPBG
CCxCCx
B-BrandsB-Brands
Source: A.C. Nielsen – 8 oz. basis
Mexico: 2004 PrioritiesMexico: 2004 Priorities
� Drive Consumer-Value Strategy
� Build Brands
� Strengthen Execution and Productivity
� Drive Consumer-Value Strategy
� Build Brands
� Strengthen Execution and Productivity
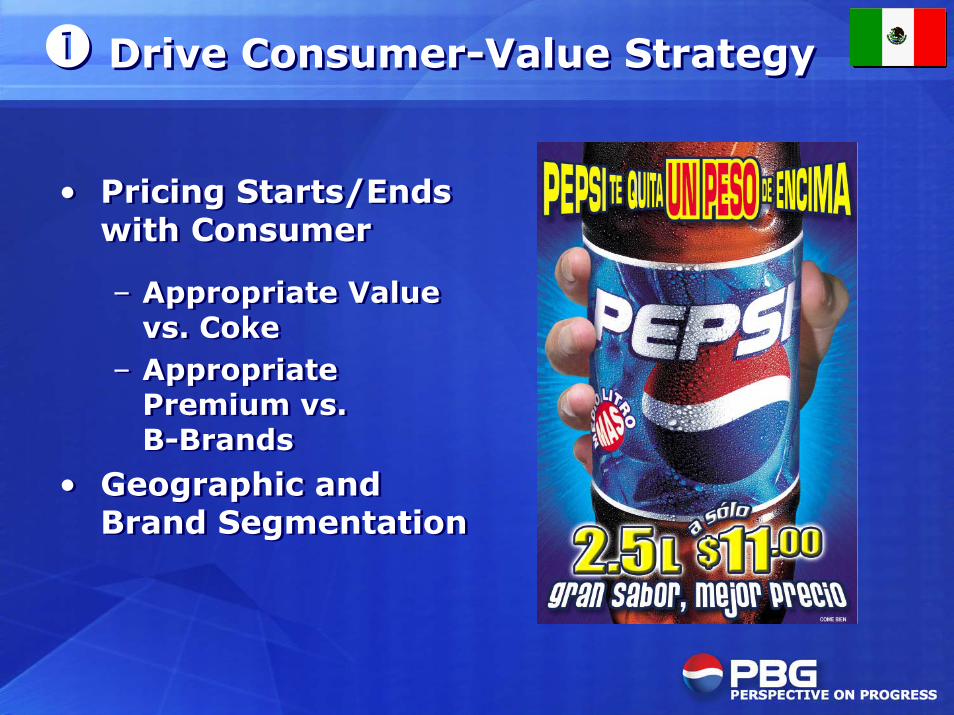
• Pricing Starts/Endswith Consumer
– Appropriate Valuevs. Coke
– AppropriatePremium vs.B-Brands
• Geographic andBrand Segmentation
• Pricing Starts/Endswith Consumer
– Appropriate Valuevs. Coke
– AppropriatePremium vs.B-Brands
• Geographic andBrand Segmentation
� Drive Consumer-Value Strategy� Drive Consumer-Value Strategy

� Build Brands� Build Brands

� Build Brands - Electropura� Build Brands - Electropura
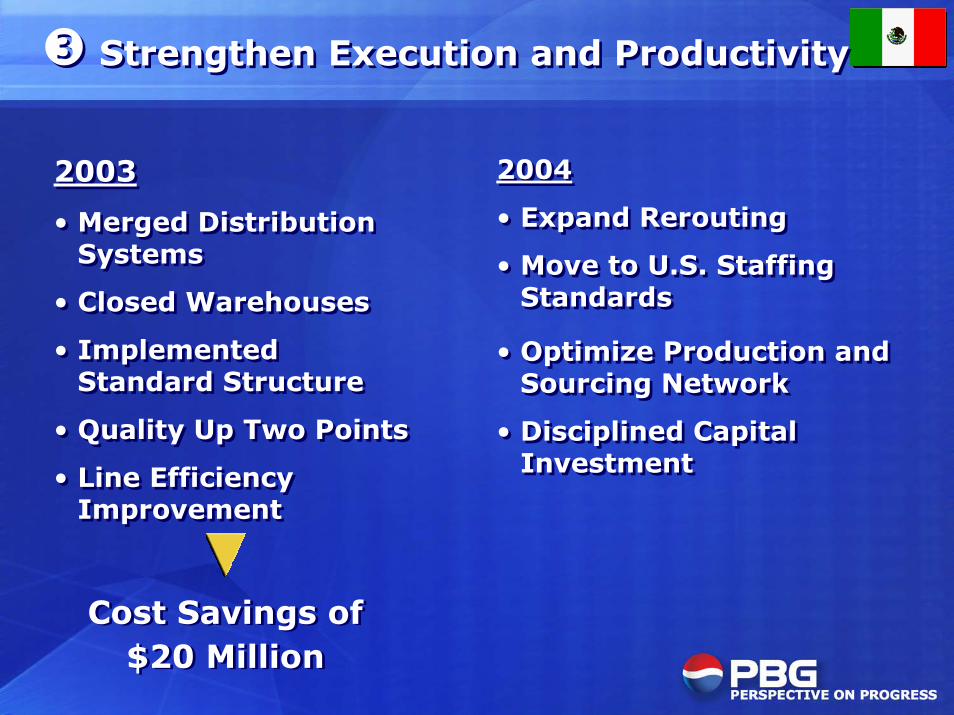
2004
• Expand Rerouting
• Move to U.S. StaffingStandards
• Optimize Production andSourcing Network
• Disciplined CapitalInvestment
2004
• Expand Rerouting
• Move to U.S. StaffingStandards
• Optimize Production andSourcing Network
• Disciplined CapitalInvestment
2003
• Merged DistributionSystems
• Closed Warehouses
• ImplementedStandard Structure
• Quality Up Two Points
• Line EfficiencyImprovement
2003
• Merged DistributionSystems
• Closed Warehouses
• ImplementedStandard Structure
• Quality Up Two Points
• Line EfficiencyImprovement
� Strengthen Execution and Productivity� Strengthen Execution and Productivity
Cost Savings of$20 Million
Cost Savings of$20 Million

Mexico SummaryMexico Summary

Perspective on ProgressPerspective on Progress
• Financial Outlook• Financial Outlook
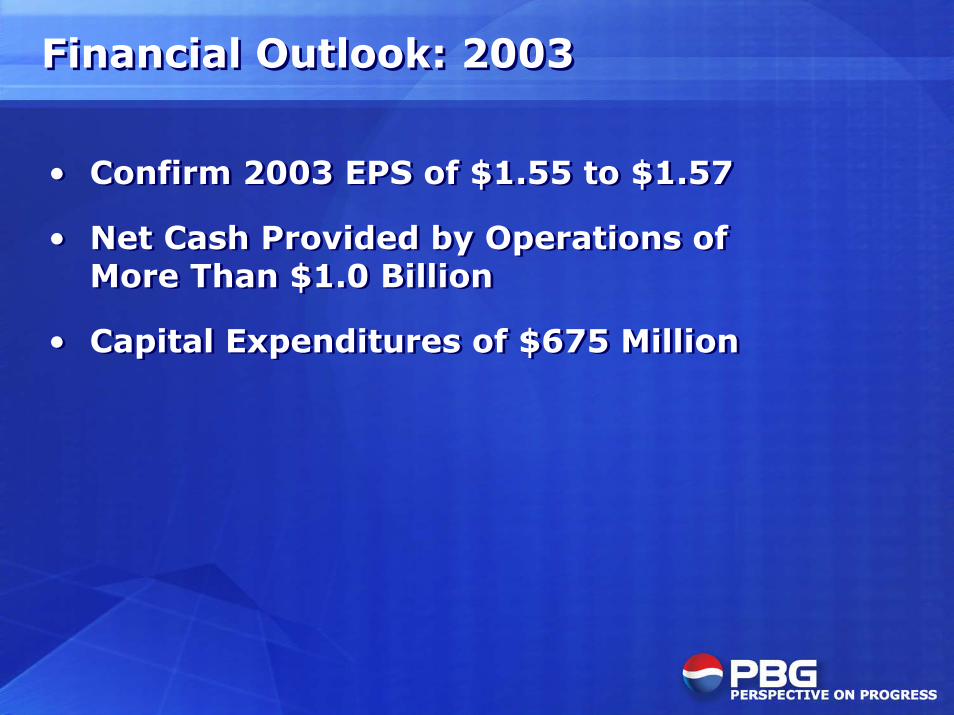
Financial Outlook: 2003Financial Outlook: 2003
• Confirm 2003 EPS of $1.55 to $1.57
• Net Cash Provided by Operations ofMore Than $1.0 Billion
• Capital Expenditures of $675 Million
• Confirm 2003 EPS of $1.55 to $1.57
• Net Cash Provided by Operations ofMore Than $1.0 Billion
• Capital Expenditures of $675 Million
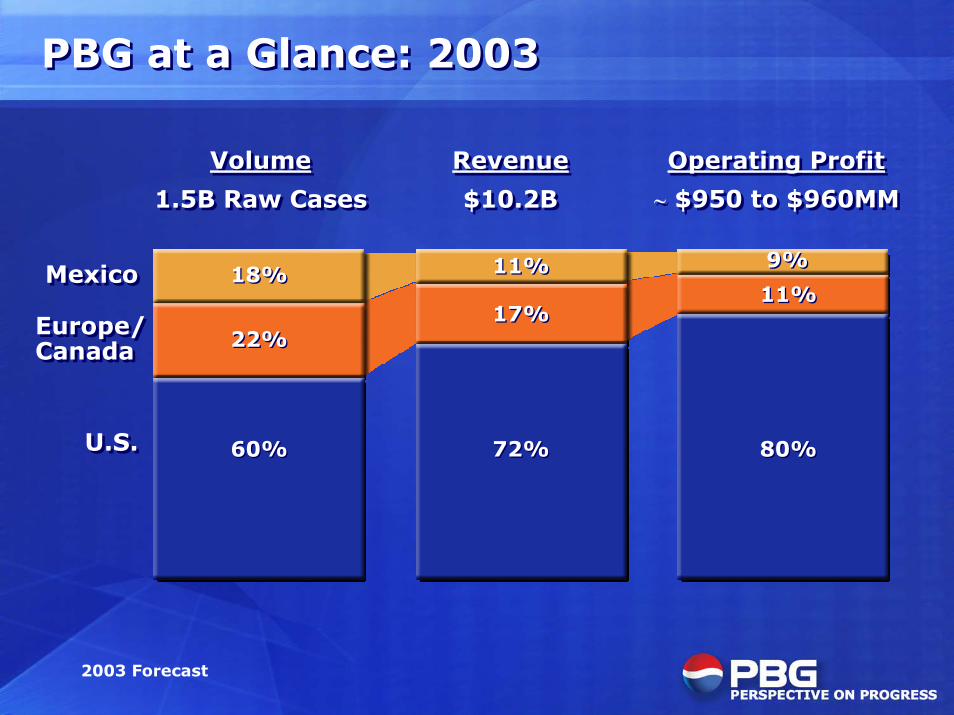
PBG at a Glance: 2003PBG at a Glance: 2003
Operating Profit
� $950 to $960MM
Operating Profit
� $950 to $960MMRevenue
$10.2B
Revenue
$10.2B
2003 Forecast
MexicoMexico
60%60%
22%22%
18%18%
72%72%
17%17%
11%11%
80%80%
11%11%
9%9%
Volume
1.5B Raw Cases
Volume
1.5B Raw Cases
Europe/Canada Europe/Canada
U.S.U.S.
Financial Outlook: 2004Financial Outlook: 2004
• Realistic Plan
– Achievable Topline Growth in the U.S.
– Conservative Expectations in Mexico
• Benefit Increases Create Profit Pressure
• Realistic Plan
– Achievable Topline Growth in the U.S.
– Conservative Expectations in Mexico
• Benefit Increases Create Profit Pressure
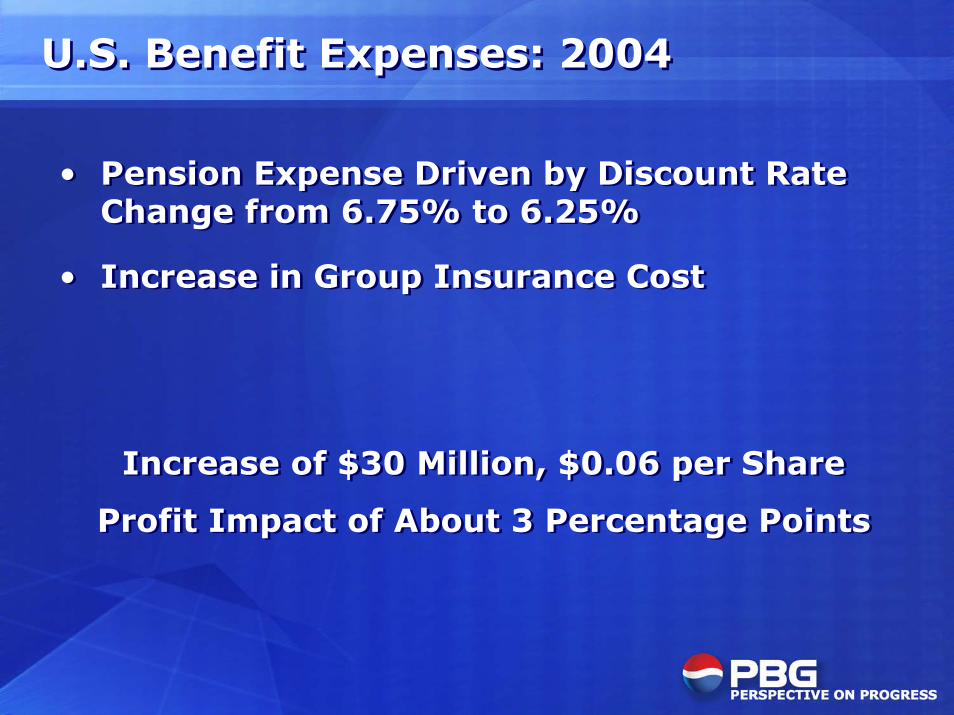
U.S. Benefit Expenses: 2004U.S. Benefit Expenses: 2004
• Pension Expense Driven by Discount RateChange from 6.75% to 6.25%
• Increase in Group Insurance Cost
• Pension Expense Driven by Discount RateChange from 6.75% to 6.25%
• Increase in Group Insurance Cost
Increase of $30 Million, $0.06 per Share
Profit Impact of About 3 Percentage Points
Increase of $30 Million, $0.06 per Share
Profit Impact of About 3 Percentage Points
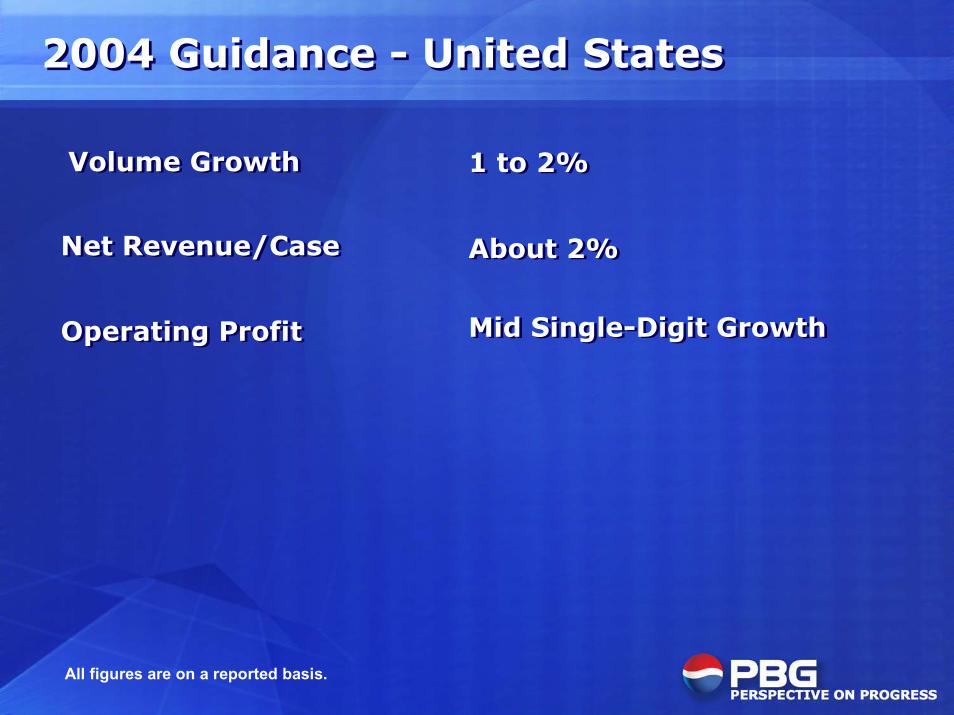
2004 Guidance - United States2004 Guidance - United States
1 to 2%1 to 2%
Net Revenue/CaseNet Revenue/Case
Operating ProfitOperating Profit
About 2%About 2%
Mid Single-Digit GrowthMid Single-Digit Growth
Volume GrowthVolume Growth
All figures are on a reported basis.
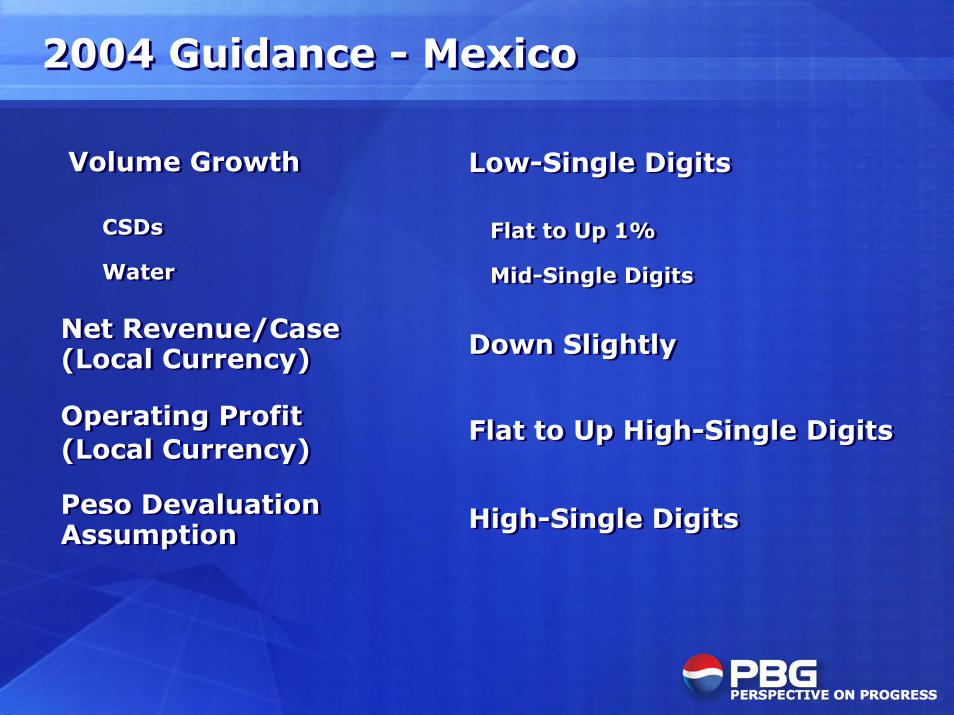
2004 Guidance - Mexico2004 Guidance - Mexico
CSDs
Water
CSDs
Water
Net Revenue/Case(Local Currency)Net Revenue/Case(Local Currency)
Operating Profit(Local Currency)Operating Profit(Local Currency)
Peso DevaluationAssumptionPeso DevaluationAssumption
Flat to Up 1%
Mid-Single Digits
Flat to Up 1%
Mid-Single Digits
Down SlightlyDown Slightly
Flat to Up High-Single DigitsFlat to Up High-Single Digits
High-Single DigitsHigh-Single Digits
Low-Single DigitsLow-Single DigitsVolume GrowthVolume Growth
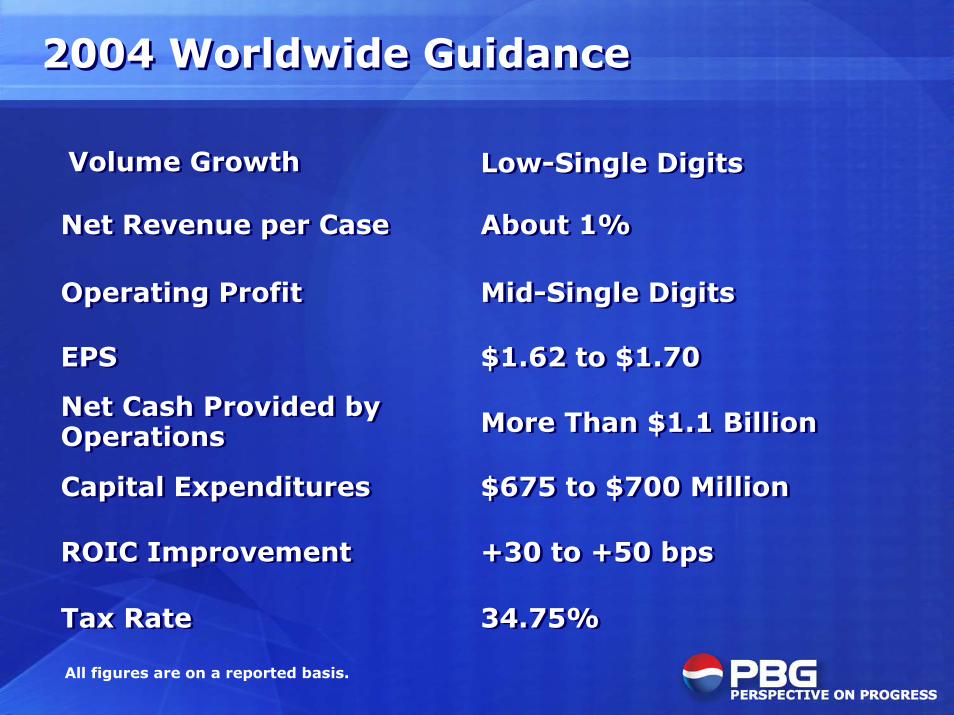
2004 Worldwide Guidance2004 Worldwide Guidance
All figures are on a reported basis.
EPSEPS
Net Cash Provided byOperationsNet Cash Provided byOperations
Capital ExpendituresCapital Expenditures
ROIC ImprovementROIC Improvement
Tax RateTax Rate
Net Revenue per CaseNet Revenue per Case
Operating ProfitOperating Profit
$1.62 to $1.70$1.62 to $1.70
More Than $1.1 BillionMore Than $1.1 Billion
$675 to $700 Million$675 to $700 Million
+30 to +50 bps+30 to +50 bps
34.75%34.75%
About 1%About 1%
Mid-Single DigitsMid-Single Digits
Low-Single DigitsLow-Single DigitsVolume GrowthVolume Growth
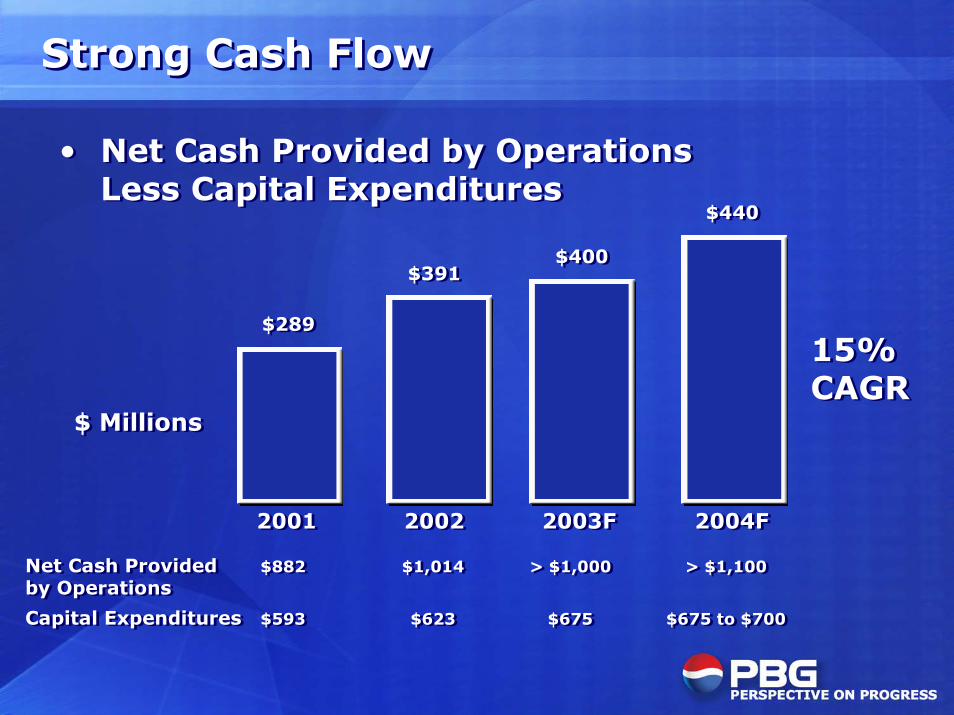
Strong Cash FlowStrong Cash Flow
• Net Cash Provided by OperationsLess Capital Expenditures
• Net Cash Provided by OperationsLess Capital Expenditures
$289$289
$391$391$400$400
$440$440
20012001 20022002 2003F2003F 2004F2004F
$ Millions$ Millions
15%CAGR15%CAGR
Net Cash Provided $882 $1,014 > $1,000 > $1,100by Operations
Capital Expenditures $593 $623 $675 $675 to $700
Net Cash Provided $882 $1,014 > $1,000 > $1,100by Operations
Capital Expenditures $593 $623 $675 $675 to $700
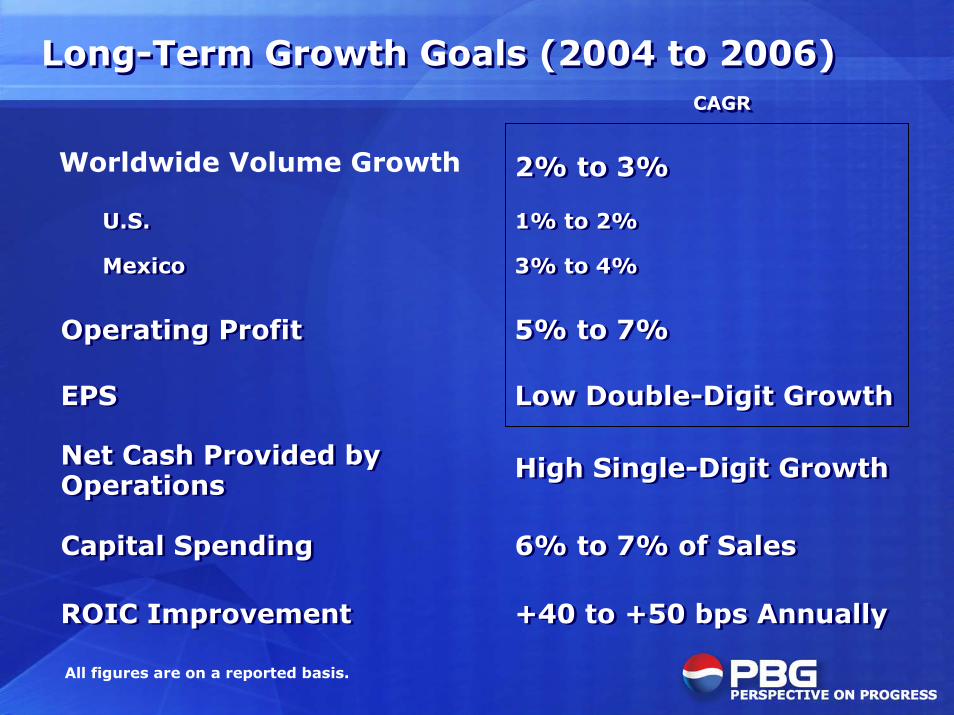
Long-Term Growth Goals (2004 to 2006)Long-Term Growth Goals (2004 to 2006) CAGR CAGR
EPSEPS
Net Cash Provided byOperationsNet Cash Provided byOperations
2% to 3%2% to 3%
1% to 2%
3% to 4%
1% to 2%
3% to 4%
Operating ProfitOperating Profit 5% to 7%5% to 7%
Low Double-Digit GrowthLow Double-Digit Growth
High Single-Digit GrowthHigh Single-Digit Growth
U.S.
Mexico
U.S.
Mexico
Capital SpendingCapital Spending 6% to 7% of Sales6% to 7% of Sales
ROIC ImprovementROIC Improvement +40 to +50 bps Annually+40 to +50 bps Annually
All figures are on a reported basis.
Worldwide Volume Growth
SummarySummary
• Goals Are Clear
• Organization Is Focused
• Plans Address Challenges
• Strong Cash Flow Growth
• Continued Improvement in ROIC
• Goals Are Clear
• Organization Is Focused
• Plans Address Challenges
• Strong Cash Flow Growth
• Continued Improvement in ROIC
Related Documents