Comment Please see analyst certification and other important disclosures starting on page 55. Page 1 Industry Equity Research North America Morgan Stanley does and seeks to do business with companies covered in its research reports. As a result, investors should be aware that the firm may have a conflict of interest that could affect the objectivity of this report. Investors should consider this report as only a single factor in making their investment decision. Customers of Morgan Stanley in the United States can receive independent, third-party research on the company or companies covered in this report, at no cost to them, where such research is available. Customers can access this independent research at www.morganstanley.com/equityresearch or can call 800-624-2063 to request a copy of this research. Industry Overview October 18, 20 Chris Gutek +1 (1)415 576 2613 [email protected] April Henry +1 (1)212 761 4669 [email protected] Sharat Shroff, CFA +1 (1)415 576 2220 [email protected] For-Profit Education Industry Overview GICS SECTOR INDUSTRIALS US Strategist Weight 12.8% S&P 500 Weight 11.6% • We see both large opportunities and risks in the for-profit education stocks This report provides an overview of the for-profit, postsecondary education market. Please read this report in parallel with our initiation report on Apollo Group. • For-profit education is likely growing at 15–20%, helped by multiple drivers Many of these companies are helping to meet the needs of working adults, who increasingly need to update their skills to stay competitive. Working students have different needs from traditional students; for-profits are addressing these needs well and are taking share from the traditional schools. • Online education represents a significant growth opportunity for the for-profits Only about 4–5% of total postsecondary students are now taking fully online classes, but penetration is rising rapidly. Students are attracted to the increased flexibility th online education provides, and as long as no unscrupulous operators cut corners and undermine the perceived quality of online classes, penetration should grow nicely. • The business also has high barriers to entry and low cyclicality Tough regulations restrain would-be new entrants, and the existing schools are likely to continue to consolidate. • However, demographic drivers are mixed, at best There are about 50 million adults in the US as the addressable market, and some for- profits are going after the traditional 18-23 year-old students. Many areas that are th focus of for-profit educational programs are rapidly growing, such as healthcare, IT, and management. However, the number of high school graduates will begin to decli in a few years, and the DoE does not expect a mix-shift toward older students. • Competition is increasing, as the business matures The cost of new student leads seems to be rising, and marketing expenses will likely outgrow revenues at most of these companies. • Also, there is no shortage of operational landmines in this business Regulations are stringent, and consequences can be severe. Also, acquisitive companies face significant integration challenges. • In-Line view on the Human Resources Services subgroup We believe the outlook for cyclical staffing stocks is mixed, while the outlook for the best-managed education stocks is positive on a longer-term view. For-Profits have only a 3% share of students Not-for-profit public, 12,233,156, 77% Not-for-profit private, 3,167,330, 20% For-profit, 527,501, 3% Source: U.S. Dept. of Education Business Services

Welcome message from author
This document is posted to help you gain knowledge. Please leave a comment to let me know what you think about it! Share it to your friends and learn new things together.
Transcript

5/14/2018 Morgan Stanley Education Report - slidepdf.com
http://slidepdf.com/reader/full/morgan-stanley-education-report 1/60
Comment
Please see analyst certification and other important disclosures starting on page 55.
Page 1
Industry
Equity Research
North America
Morgan Stanley does and seeks to do business with companies covered in its research reports. As a result, investors should be aware thatthe firm may have a conflict of interest that could affect the objectivity of this report. Investors should consider this report as only a singlefactor in making their investment decision. Customers of Morgan Stanley in the United States can receive independent, third-partyresearch on the company or companies covered in this report, at no cost to them, where such research is available. Customers can accessthis independent research at www.morganstanley.com/equityresearch or can call 800-624-2063 to request a copy of this research.
Industry Overview October 18, 20Chris Gutek +1 (1)415 576 [email protected]
April Henry+1 (1)212 761 [email protected]
Sharat Shroff, CFA+1 (1)415 576 [email protected]
For-Profit Education Industry Overview
GICS SECTOR INDUSTRIALS
US Strategist Weight 12.8%
S&P 500 Weight 11.6%
• We see both large opportunities and risks in the for-profit education stocksThis report provides an overview of the for-profit, postsecondary education market.
Please read this report in parallel with our initiation report on Apollo Group.• For-profit education is li kely growing at 15–20%, helped by multiple drivers
Many of these companies are helping to meet the needs of working adults, who
increasingly need to update their skills to stay competitive. Working students have
different needs from traditional students; for-profits are addressing these needs well
and are taking share from the traditional schools.
• Online education represents a signifi cant growth opportunity for the for-profitsOnly about 4–5% of total postsecondary students are now taking fully online classes,
but penetration is rising rapidly. Students are attracted to the increased flexibility th
online education provides, and as long as no unscrupulous operators cut corners and
undermine the perceived quality of online classes, penetration should grow nicely.
• The business also has high barriers to entry and low cycl icalityTough regulations restrain would-be new entrants, and the existing schools are likely
to continue to consolidate.
• However, demographic drivers are mixed, at best
There are about 50 million adults in the US as the addressable market, and some for-
profits are going after the traditional 18-23 year-old students. Many areas that are th
focus of for-profit educational programs are rapidly growing, such as healthcare, IT,
and management. However, the number of high school graduates will begin to decli
in a few years, and the DoE does not expect a mix-shift toward older students.
• Competition is increasing, as the business maturesThe cost of new student leads seems to be rising, and marketing expenses will likely
outgrow revenues at most of these companies.
• Also, there is no shortage of operational landmines in this businessRegulations are stringent, and consequences can be severe. Also, acquisitive
companies face significant integration challenges.• In-Line view on the Human Resources Services subgroup
We believe the outlook for cyclical staffing stocks is mixed, while the outlook for the
best-managed education stocks is positive on a longer-term view.
For-Profits have only a 3% share of students
Not-for-profit
public,
12,233,156, 77%
Not-for-profit
private,
3,167,330, 20%
For-profit,
527,501, 3%
Source: U.S. Dept. of Education
Business Services

5/14/2018 Morgan Stanley Education Report - slidepdf.com
http://slidepdf.com/reader/full/morgan-stanley-education-report 2/60
Business Services – October 18, 2004
Please see analyst certification and other important disclosures starting on page 55.
Page 2
Contents
For-Profit Education Industry Overview.....................................................................................................................................3 Summary and Investment Conclusion.............................................................................................................................................3
Investment Positives........................................................................................................................................................................4
Investment Concerns ....................................................................................................................................................................... 6
Market Size and Growth..................................................................................................................................................................8
Online Education Opportunity ......................................................................................................................................................18
Regulatory Issues ..........................................................................................................................................................................24
Tuition Financing: A Key Growth Driver ....................................................................................................................................29
Valuation.......................................................................................................................................................................................34
Public Company Summaries ......................................................................................................................................................... 37
Apollo Group: Best in Class.........................................................................................................................................................38
Career Education: Acquisitive Company with Diverse Program Offerings........... .......... .......... ........... .......... ........... .......... ........ 40
Corinthian College: Heavy Focus on Acquisitions ........... ............ ........... ............ ............ ............ ......... ......... .......... ........... ......... 42
DeVry: Cyclical Headwinds.........................................................................................................................................................44
Education Management: Strength in Diversity of Programs.......... .......... ........... ........... .......... ........... ........... .......... ........... ......... 46
ITT Educational Services: Strong Brand for Technology Education .......... ........... .......... ........... ........... ............ .......... .......... ...... 48
Laureate Education: International Scale Is a Plus ........... ........... ........... .......... ........... ........... ........... ........... .......... .......... .......... ... 50
Strayer Education: Strong Regional Competitor ........... ........... ............ ........... ............ ........... ........... .......... .......... .......... .......... ... 52

5/14/2018 Morgan Stanley Education Report - slidepdf.com
http://slidepdf.com/reader/full/morgan-stanley-education-report 3/60
Business Services – October 18, 2004
Please see analyst certification and other important disclosures starting on page 55.
Page 3
For-Profit Education Industry Overview
Summary and Investment ConclusionWe are initiating coverage of the for-profit education
industry within the context of our In-Line view on the
broader Human Resources Services subgroup. This report
provides an overview of the for-profit, postsecondary
education market. Please read this report in conjunction
with our initiation report on the Apollo Group, A New Core
Holding in Our Coverage Universe, dated October 18,
2004.
We have initiated coverage of Apollo Group (APOL
$68.21, Overweight, target $85), the largest privateinstitution of higher education in the US, and therefore the
largest publicly-held, for-profit, postsecondary education
company. Our rating on APOL shares is Overweight,
since we find the stock’s valuation to be attractive relative
to the company’s robust growth and cash flow prospects.
APOL stock is up nearly 10,000% since its IPO a decade
ago, and although the company’s growth rate is slowing,
we believe that the stock will continue to outperform the
broader equity market, as well as our Human Resources
Services coverage universe. The stock is down about 30%
from its recent highs, and we would recommend increasing
exposure to the stock on this weakness.
Our price target of $85 is based on our DCF and EVA
analyses, and translates into 31 times C2005E EPS, and a
price to C2005E free cash flow multiple of 34 times. These
multiples seem reasonable to us, given the impressive
growth, high return on capital, and strong cash flow.
The risks to our price target include: 1) changes to the
regulatory environment, and/or real or perceived legal
problems at Apollo or its competitors, 2) rapid deceleration
in online enrolments, 3) decrease in Federal financing for
student tuition, and 4) rapidly rising advertising costs,
likely due to declining student lead flow.
Industry — Investment Positives
• Rapid growth by focusing on unmet needs
• Under-penetrated market opportunities
• Online education represents a significant
opportunity
• Some demographic trends are positive
• Market share gains from traditional schools
• Barriers to entry, helped by regulations
• Low cyclicality
• Consolidation opportunities seem plentiful, at least
for now
Industry — Investment Negatives
• Very low population growth
• Uncertain demographic trends for working adults
• Increasing competition for student leads
• Educational quality of the for-profits may suffer
from the move online
• Online education may suffer from potential
regulatory or competitive setbacks
• Acquisitive companies face numerous risks

5/14/2018 Morgan Stanley Education Report - slidepdf.com
http://slidepdf.com/reader/full/morgan-stanley-education-report 4/60
Business Services – October 18, 2004
Please see analyst certification and other important disclosures starting on page 55.
Page 4
Investment Positives
Rapid growth by focusing on unmet needs: We believe
that the for-profit postsecondary education industry isgrowing at 15-20%, largely because these companies are
meeting the educational needs of working adults. Working
adults have very different educational and related support
needs from education providers. Working adults want
highly focused educational programs that teach them
specific skills or give them specific qualifications that will
be directly relevant in the current or desired job. These
working adults also prefer to learn from instructors who
have real-world experience, and they appreciate small class
sizes and intensive interaction with instructors. They want
the instructors’ and administrators’ goals to be aligned
with theirs, especially as it relates to educational qualityand job placement rates. They also demand convenient
class times, including night and weekend sessions, and
convenient locations for their classes, near their workplace
or home. From a macro perspective, we believe that the
ongoing globalization of the world’s economies will put
pressure on workers in developed countries to continuously
upgrade their skills, or risk becoming uncompetitive and/or
under-employed.
Under-penetrated market opportunities: For-profits
have historically ignored the traditional-aged college
students, preferring to focus on working adults. That said,fewer and fewer students are following a “traditional”
educational path. For-profits are starting to go after these
younger students, and early results suggest good traction.
We see other market expansion opportunities as well. For
example, for-profits have only a 3% share of enrollees at
two-year institutions (competing with community colleges),
which is in-line with their share of the overall post
secondary pool of enrollees. We think that the for-profits
are very capable of providing the type of career-enhancing
education that is sought by students who have historically
attended junior colleges. Also, the for-profits have a very
low share, about 1%, of professional degree students, and
they are modestly under-represented among graduate
students as well.
Online education represents a significant opportunity:
Online education is rapidly gaining traction, and may
represent the biggest under-penetrated opportunity.
Segment-leading schools, such as the University of
Phoenix Online, have recently generated enrollment
growth of nearly 50%, despite having about 100,000 online
students. Including not-for-profit schools, only 4–5% of
postsecondary students are now fully online. Online
education offers many advantages, and barring regulatoryissues or perceptions about deteriorating quality, we expect
growth rates to remain high for many years, as a significant
portion of the roughly 6.5 million working adult students
shift over time to a partly or fully online program. At least
so far, the DoE’s Distance Education Demonstration
Program has reached surprisingly positive conclusions
regarding educational quality and student graduation rates.
As this mix-shift plays out, there could be a benefit to the
margins of the for-profit companies.
Some demographic trends are positive: There are 50
million people in the US between the ages of 25 and 45who have a high school diploma but no bachelors degree.
This represents a large pool of prospective students for the
for-profits. Also, the US economy continues to shift away
from manufacturing and toward services. Some of the
specific occupations that are benefiting from this trend
seem likely to drive demand for for-profit educational
services. These sectors and occupations include IT,
healthcare, education, business / management, etc.
Market-share gains from traditional schools: For-
profits appear to be taking share from traditional schools,
partly due to lack of public sector college funding due tohigher allocation of educational dollars towards K-12
education. Public tuition rates were up about 10% in 2002,
another 14% in 2003, and will likely be up another 10% in
the year starting this fall. This represents a $1,400 increase
in three years for the average public school. Associate
programs take share from community colleges, some of
which are perceived to provide bad “customer service” and
are less geared toward providing quick, useful certificates
and degrees.
Barriers to entry, helped by regulations: The numerous
government regulations seem to dampen competition by
creating barriers to entry. For example, schools need to be
accredited in order for their students to be eligible for Title
IV financial aid. Most students use government aid, so it
would be expensive for a new entrant to build a school
from scratch, without government-supported students
during its start-up phase. Also, the online market has
barriers to entry, since IT investments can be expensive
and complex. Also, traditional schools have cultural and
institutional barriers to change, which hinder their ability
5/14/2018 Morgan Stanley Education Report - slidepdf.com
http://slidepdf.com/reader/full/morgan-stanley-education-report 5/60
Business Services – October 18, 2004
Please see analyst certification and other important disclosures starting on page 55.
Page 5
to compete with the offline and online offerings of the for-
profits.
Low cyclicality: Undergraduate education for traditional(young) students is generally non-cyclical, although
undergraduate for working adults may be modestly cyclical.
However, graduate education seems to be slightly counter-
cyclical, since many people decide to upgrade their
educations when the economy is soft and employment
prospects are relatively poor. Some specific types of
programs are cyclical (such as IT), but these can be partly
offset by others that are counter-cyclical (such as culinary
arts).
Consolidation opportunities seem plentiful, at least fonow: There are several thousand for-profit schools in the
US, although only a small percentage of them offer
bachelors or higher degrees. We suspect that there will b
good consolidation opportunities for some of the trade-
oriented schools for a few years, although the quality of t
remaining, private companies is unclear, so acquisitions
may pose integration challenges.

5/14/2018 Morgan Stanley Education Report - slidepdf.com
http://slidepdf.com/reader/full/morgan-stanley-education-report 6/60
Business Services – October 18, 2004
Please see analyst certification and other important disclosures starting on page 55.
Page 6
Investment Concerns
Very low population growth: Demographic trends in the
U.S. are not very encouraging for the postsecondaryeducation industry. The number of high school graduates
is expected to rise at a low single digit annual rate through
2009, but then begin a long period of modest declines as
the “echo boomers” work through the educational system.
Some of this will likely be offset by a modest further
increase in the percentage of high school students who
attend college. However, even with this effect, the number
of high school graduates who enter college may be roughly
flat from 2010 to 2020.
Uncertain demographic trends for working adults:
For-profit schools have historically focused on workingadults, generally including students aged 25 and older.
Historically, there has been a significant aging of the
postsecondary school population. In 1970, 28% of
undergraduate students were age 25 or older, and this ratio
increased to 37% by 1980 and to 43% by 2000. However,
trends in more recent years have been negative. Based on
forecasts from the Department of Education, it seems as if
the aging of the student population may not be a significant
driver for growth for the for-profits going forward. This
seems counter-intuitive to us, so we believe that this
assumption could prove conservative, especially as
increasingly relevant programs targeted at working adultspotentially expand the size of the market for adult
education.
Increasing competition for student leads: These for-
profit schools are growing rapidly, by opening new schools,
offering new programs, and increasing utilization of
existing facilities (including through online and hybrid
classes). While we believe these for-profits can further
penetrate their target market, and take share from
traditional schools, we believe that growth rates will slow
as the business matures. There seem to be a few red flags
already, suggesting that the competition for existing
student prospects has become more fierce. For example,
the University of Phoenix was recently criticized by the
Department of Education for its aggressive recruiting
techniques. The DoE report quoted several recruiters who
said that there were a decreasing number of student leads
available for each of the rapidly growing number of
recruiters. Other schools have reported slowing lead flow,
partly due to company-specific execution and / or legal
issues. However, these situations may also reflect
increased competition and increased maturity of the
industry. As the industry inevitably matures, we expect the
current 4–6% tuition growth rates to come under pressure.This pressure may be accelerated by the move toward
online education. Job placement rates for the for-profits
have fallen below 90% in recent years, partly due to the
economy, but maybe partly due to industry maturation as
well.
Educational quality of the for-profits may suffer from
the move online: Our industry contacts in the traditional
postsecondary education sector tell us in no uncertain
terms that the quality of many for-profit schools’ education
is sub-par. Partly for that reason, students at these schools
often have trouble transferring their credits to thetraditional schools. Of course, the “quality” issue is
debatable, and we note that many for-profits have high
graduation and placement rates, as well as strong student
feedback. We understand that the Department of
Education is considering standardizing the accreditation
requirements for online educational programs. This could
be a positive, but some companies (such as Apollo Group)
are concerned that any new rules may not be sufficiently
strict to prevent some unscrupulous competitors from
cutting a few corners. If this happens, the perception of the
quality of online education could suffer considerably.
Online education may suffer from potential regulatory
or competitive setbacks: The DoE currently restricts
online education programs, primarily through the “50/50”
Rule. We assume that these rules are most likely to be
loosened in coming years. However, if these rules get
loosened only slowly, or not at all, the move towards
online education could slow sharply. Also, more than 90%
of public schools now offer online education, so the lead
established by the larger for-profit schools may come
under competitive pressure. Furthermore, loosening of the
rules would likely not significantly benefit the companies
(including some of the larger, public companies) that are
already exempt from the rules, through participation in the
DoE’s Distance Education Demonstration Program.
Acquisitive companies face numerous risks: Some
publicly held, for-profit companies have been aggressive
acquirers in recent years, and many of these companies
have experienced integration problems. We believe that
typical acquisition candidates are smaller, privately held
companies that started as proprietary trade schools. Many
of these companies may have been aggressively managed,

5/14/2018 Morgan Stanley Education Report - slidepdf.com
http://slidepdf.com/reader/full/morgan-stanley-education-report 7/60
Business Services – October 18, 2004
Please see analyst certification and other important disclosures starting on page 55.
Page 7
and their acquisition can create cultural problems, as well
as legal and regulatory risk. The aggressive consolidators
may have focused too much on prices paid, and near-term
earnings accretion achieved, rather than of the quality of
assets acquired or on long-term synergies realized.
Therefore, as a general rule, we would tend to avoid the
stocks of the acquisitive companies.

5/14/2018 Morgan Stanley Education Report - slidepdf.com
http://slidepdf.com/reader/full/morgan-stanley-education-report 8/60
Business Services – October 18, 2004
Please see analyst certification and other important disclosures starting on page 55.
Page 8
Market Size and Growth
In this section, we provide a broad overview of the
education industry, including the size of the various sub-segments of the business. We also highlight the two key
growth drivers we see for the for profit higher education
business: 1) meeting educational needs of working adults,
and 2) taking market share away from traditional colleges
and universities in the education of recent high school
graduates. We discuss the first segment in a lot of detail,
since this is likely to be the more relevant driver in the
medium term. We discuss the online education
opportunity in a later section of this report.
Market Definition and Size
According to the US Department of Education, educationrepresents a nearly $750 billion industry (the second-
largest industry after healthcare). Including childcare and
pre-kindergarten spending, as well as testing and training, a
more broadly defined market may exceed $1 trillion. Post
secondary education is currently about a $300 billion
business, but only about 40% of this is in the private sector
(including non-profits). The for-profit, degree-granting
higher education sector is perhaps a $10 billion business,
but it is likely growing at about 15–20% per year. If non-
degree-granting trade schools were included, the market
size may well be much larger, perhaps $20–30 billion.
Private education is less significant in the K-12 sector, and for-profit education in this K-12 segment is even less
significant (and is not covered within the scope of this
report).
Exhibit 1
Education Spending Was $700+ Billion in 2000–2001
Public K-12, $392 ,
57%
Private K-12, $31 , 4%
Public Postsecondary,
$171 , 24%
Private Postsecondary,
$106 , 15%
Source: Dept. of Education
Spending on public K-12 education is more than double
the spending on public postsecondary education. Giventhe relatively poor quality of the K-12 education in this
country, coupled with many national and local politicians’
pledges to improve the quality of, and support for,
education, we see some risk that K-12 spending growth
could siphon away funds that might otherwise be available
to increase spending on public postsecondary education.
Such a funding squeeze could be a positive for the for-
profit sector, as it slowly takes market share of traditional-
aged college students away from traditional colleges and
universities.
The for-profit segment currently represents only 3–4% of total postsecondary educational system enrollments,
although these penetration rates are clearly rising, and we
expect these penetration rates to rise significantly in
coming years. The for-profits have high graduation rates,
and they therefore represent 4.8% of degrees granted, as of
2002. For-profits represent 13.1% of associate degrees,
2.0% of bachelor’s degrees, 3.0% of masters degrees, 1.5%
of doctoral degrees, and a mere 0.2% of professional
degrees. We estimate that the for-profit, degree-granting
educational segment represents about $10 billion of annual
spending. This is about 3% of total postsecondary
spending, or 8–10% of private postsecondary spending.
Exhibit 2
Post Secondary Enrollment by Institution Type
Not-for-profit
public,12,233,156, 77%
Not-for-profitprivate,
3,167,330, 20%
For-profit,
527,501, 3%
Source: Dept. of Education, 2001 data
5/14/2018 Morgan Stanley Education Report - slidepdf.com
http://slidepdf.com/reader/full/morgan-stanley-education-report 9/60
Business Services – October 18, 2004
Please see analyst certification and other important disclosures starting on page 55.
Page 9
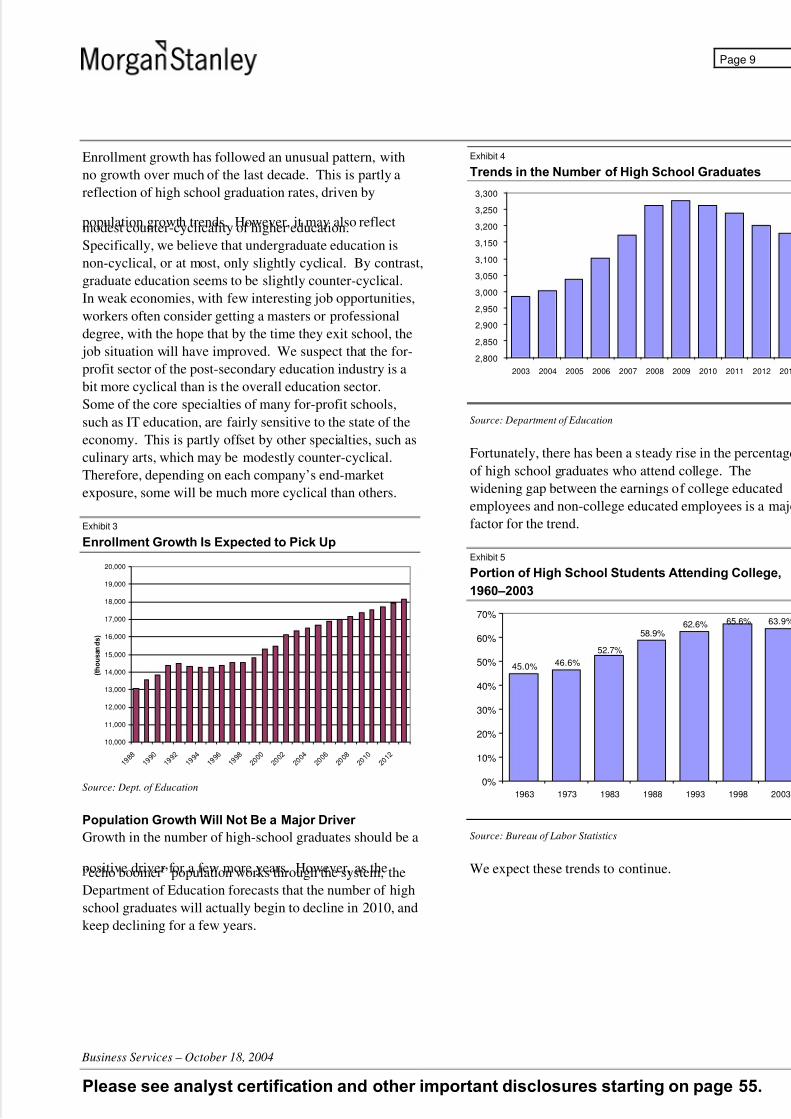
Enrollment growth has followed an unusual pattern, with
no growth over much of the last decade. This is partly a
reflection of high school graduation rates, driven by
population growth trends. However, it may also reflectmodest counter-cyclicality of higher education.
Specifically, we believe that undergraduate education is
non-cyclical, or at most, only slightly cyclical. By contrast,
graduate education seems to be slightly counter-cyclical.
In weak economies, with few interesting job opportunities,
workers often consider getting a masters or professional
degree, with the hope that by the time they exit school, the
job situation will have improved. We suspect that the for-
profit sector of the post-secondary education industry is a
bit more cyclical than is the overall education sector.
Some of the core specialties of many for-profit schools,
such as IT education, are fairly sensitive to the state of the
economy. This is partly offset by other specialties, such as
culinary arts, which may be modestly counter-cyclical.
Therefore, depending on each company’s end-market
exposure, some will be much more cyclical than others.
Exhibit 3
Enrollment Growth Is Expected to Pick Up
10,000
11,000
12,000
13,000
14,000
15,000
16,000
17,000
18,000
19,000
20,000
1 9 8 8
1 9 9 0
1 9 9 2
1 9 9 4
1 9 9 6
1 9 9 8
2 0 0 0
2 0 0 2
2 0 0 4
2 0 0 6
2 0 0 8
2 0 1 0
2 0 1 2
( t h o u s a n d s )
Source: Dept. of Education
Population Growth Will Not Be a Major Driver
Growth in the number of high-school graduates should be a
positive driver for a few more years. However, as the“echo boomer” population works through the system, the
Department of Education forecasts that the number of high
school graduates will actually begin to decline in 2010, and
keep declining for a few years.
Exhibit 4
Trends in the Number of High School Graduates
2,800
2,850
2,900
2,950
3,000
3,050
3,100
3,150
3,200
3,250
3,300
2003 2004 2005 2006 2007 2008 2009 2010 2011 2012 201
Source: Department of Education
Fortunately, there has been a steady rise in the percentage
of high school graduates who attend college. The
widening gap between the earnings of college educated
employees and non-college educated employees is a majo
factor for the trend.
Exhibit 5
Portion of High School Students Attending College,
1960–2003
45.0% 46.6%
52.7%
58.9%62.6% 63.9%65.6%
0%
10%
20%
30%
40%
50%
60%
70%
1963 1973 1983 1988 1993 1998 2003
Source: Bureau of Labor Statistics
We expect these trends to continue.

5/14/2018 Morgan Stanley Education Report - slidepdf.com
http://slidepdf.com/reader/full/morgan-stanley-education-report 10/60
Business Services – October 18, 2004
Please see analyst certification and other important disclosures starting on page 55.
Page 10
Exhibit 6
College Enrollment Rates Should Continue to Rise
63.90%
65.29%65.74%
66.19%66.64%
67.09%67.53%
67.98%68.43%
68.88%69.33%
61%
62%
63%
64%
65%
66%
67%
68%
69%
70%
2003 2004 2005 2006 2007 2008 2009 2010 2011 2012 2013
Source: Dept. of Education
Net of the population and enrollment rate trends, the
number of high school graduates who go on to college
should grow by a modest 1-3% though 2008, but will
likely be about flat for the subsequent five-year period.
Demographic Trends of Working Adults Are Mixed Too
As one would expect, the student population at the for-
profits is skewed toward older adults, versus at traditional
public and private institutions. In fact, more than half of
for-profit students are over age 25, versus about one-third
for other schools. Across all students, about two-thirds are
under age 25, and this has traditionally meant that two-thirds of the market was to some extent off-limits for the
for-profit companies. This is changing, as the for-profits
become more relevant for younger, more traditional
students.
Exhibit 7
Post Secondary Enrollments by Age
0%
5%
10%
15%
20%
25%
30%
19 & under 20-21 22-24 25-29 30-34 35-39 40-49 50 & older
F or -P ro fi ts N ot -F or -P ro fi ts
Source: Dept. of Education, 2001 data
Historically, there has been a significant aging of the
postsecondary school population. In 1970, 28% of
undergraduate students were age 25 or older, and this ratio
increased to 37% by 1980 and 43% by 2000. However,based on forecasts from the Department of Education, it
seems as if the aging of the student population has
stabilized, and may not be a significant driver for growth
for the for-profits going forward. This seems counter-
intuitive to us, so we believe that this assumption could
prove conservative, especially as increasingly relevant
programs targeted at working adults potentially expand the
size of the market for adult education.
The overall US population is growing at about 1.5% per
year, including effects from both net births and
immigration. Perhaps surprisingly, the percentage of post
secondary students who are age 25 or above has actually
declined 4–5 percentage points in the last decade, to about
38%. This suggests that the trend toward working-age
adults seeking to boost their employment prospects
through further education is a modest one. It also reflects
near-term growth in high school graduates.
Because of the dearth of births following the baby boom
generation, the population of 35–44 year olds is expected
to decline modestly over the next 10 years. The population
of 30–34 year olds should hold roughly flat, while the
population of 25–29 year olds should grow modestly. By
contrast, the total workforce should grow by a modest 12%in total over the next decade, and much of that growth will
come from the over-55 crowd (who are less interested in
further education). That said, as global economies
continue to become more tightly linked, we expect labor
markets to become more competitive, and this should
increase the pressure on workers in developed countries to
continuously upgrade their skills in order to remain
competitive.

5/14/2018 Morgan Stanley Education Report - slidepdf.com
http://slidepdf.com/reader/full/morgan-stanley-education-report 11/60
Business Services – October 18, 2004
Please see analyst certification and other important disclosures starting on page 55.
Page 11
Exhibit 8
Mix of Old vs. Young Students Is Stable
0.0%
10.0%
20.0%
30.0%
40.0%
50.0%
60.0%
70.0%
1 9 9 0
1 9 9 2
1 9 9 4
1 9 9 6
1 9 9 8
2 0 0 0
2 0 0 2
2 0 0 4
2 0 0 6
2 0 0 8
2 0 1 0
2 0 1 2
Over 25 Under 25
Source: Dept. of Education
Exhibit 9
Age-Mix Changes Should Be Modest
23.1%
20.5%
18.4%
12.6%
8.0%
17.4%
24.0%
20.5%
18.4%
13.6%
7.4%
16.2%
21.6%
20.7%
19.3%
13.9%
8.1%
15.5%
0%
10%
20%
30%
40%
50%
60%
70%
80%
90%
100%
2003 2008 2013
Portion of Enrollees By Age Group
19 an d un der ye ar s old 20 and 21 years old 22 and 24 years old
25 to 29 years old 30 to 34 years old 35 years old and older
Source: Dept. of Education
The vast majority of post secondary students are enrolled
in undergraduate degree programs, rather than graduate or
professional degree programs. “Undergraduates” include
about 6+ million students who are enrolled in associate
degree programs, but there are another 0.4 million who are
enrolled in non-degree programs.
Exhibit 10
Enrollment by Degree Level
First-Professional
527,501
Graduate3,167,330
Undergraduate
12,233,156
Source: Dept of Education, 2001 data
Enrollments at for-profit institutions tend to be skewed
heavily toward undergraduates, who make up about 90%
of students. For-profits have not been very successful in
attracting professional degree students, who make up less
than 1% of for-profit enrollments, versus 6% of
enrollments at private, not-for-profit institutions. For-
profits are also a bit under-penetrated in the graduate
degree programs, so these represent additional growth
opportunities for these companies.
Exhibit 11
For-Profit Enrollments Are Skewed Toward Undergrad
0%
10%
20%
30%
40%
50%
60%
70%
80%
90%
100%
Not-for-profitpublic
Not-for-profitprivate
For-profit
Source: Dept. of Education, 2001 data
For-profits have a 3% share of enrollees at two-year
institutions (competing with community colleges), which
in-line with their share of the overall post secondary pool
of enrollees. However, unlike for four-year institutions, o
for graduate and professional degrees, private, not-for-
profit institutions don’t really compete in this segment.
5/14/2018 Morgan Stanley Education Report - slidepdf.com
http://slidepdf.com/reader/full/morgan-stanley-education-report 12/60
Business Services – October 18, 2004
Please see analyst certification and other important disclosures starting on page 55.
Page 12
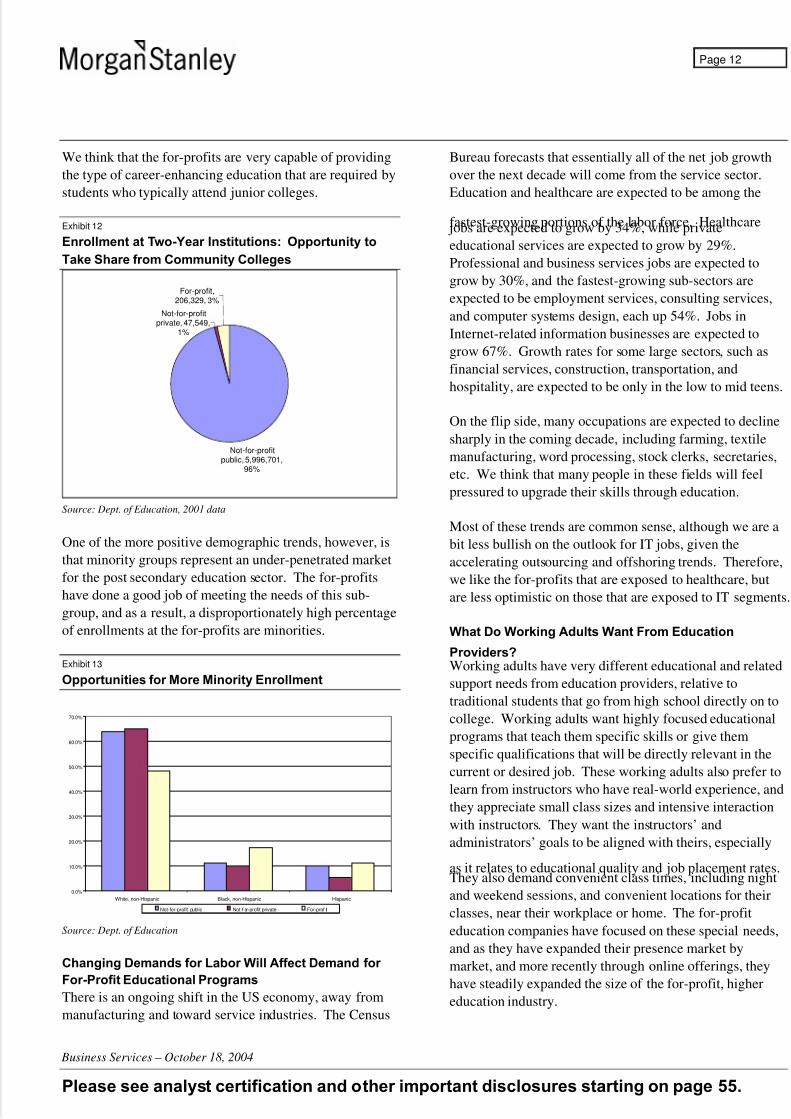
We think that the for-profits are very capable of providing
the type of career-enhancing education that are required by
students who typically attend junior colleges.
Exhibit 12
Enrollment at Two-Year Institutions: Opportunity to
Take Share from Community Colleges
Not-for-profitpublic, 5,996,701,
96%
Not-for-profitprivate, 47,549,
1%
For-profit,206,329, 3%
Source: Dept. of Education, 2001 data
One of the more positive demographic trends, however, is
that minority groups represent an under-penetrated market
for the post secondary education sector. The for-profits
have done a good job of meeting the needs of this sub-
group, and as a result, a disproportionately high percentage
of enrollments at the for-profits are minorities.
Exhibit 13
Opportunities for More Minority Enrollment
0.0%
10.0%
20.0%
30.0%
40.0%
50.0%
60.0%
70.0%
White, non-Hispanic Black, non-Hispanic Hispanic
Not-for-profit public Not -f or-profit private For-prof it
Source: Dept. of Education
Changing Demands for Labor Will Affect Demand for
For-Profit Educational Programs
There is an ongoing shift in the US economy, away from
manufacturing and toward service industries. The Census
Bureau forecasts that essentially all of the net job growth
over the next decade will come from the service sector.
Education and healthcare are expected to be among the
fastest-growing portions of the labor force. Healthcare jobs are expected to grow by 34%, while private
educational services are expected to grow by 29%.
Professional and business services jobs are expected to
grow by 30%, and the fastest-growing sub-sectors are
expected to be employment services, consulting services,
and computer systems design, each up 54%. Jobs in
Internet-related information businesses are expected to
grow 67%. Growth rates for some large sectors, such as
financial services, construction, transportation, and
hospitality, are expected to be only in the low to mid teens.
On the flip side, many occupations are expected to decline
sharply in the coming decade, including farming, textile
manufacturing, word processing, stock clerks, secretaries,
etc. We think that many people in these fields will feel
pressured to upgrade their skills through education.
Most of these trends are common sense, although we are a
bit less bullish on the outlook for IT jobs, given the
accelerating outsourcing and offshoring trends. Therefore,
we like the for-profits that are exposed to healthcare, but
are less optimistic on those that are exposed to IT segments.
What Do Working Adults Want From Education
Providers?Working adults have very different educational and related
support needs from education providers, relative to
traditional students that go from high school directly on to
college. Working adults want highly focused educational
programs that teach them specific skills or give them
specific qualifications that will be directly relevant in the
current or desired job. These working adults also prefer to
learn from instructors who have real-world experience, and
they appreciate small class sizes and intensive interaction
with instructors. They want the instructors’ and
administrators’ goals to be aligned with theirs, especially
as it relates to educational quality and job placement rates.They also demand convenient class times, including night
and weekend sessions, and convenient locations for their
classes, near their workplace or home. The for-profit
education companies have focused on these special needs,
and as they have expanded their presence market by
market, and more recently through online offerings, they
have steadily expanded the size of the for-profit, higher
education industry.

5/14/2018 Morgan Stanley Education Report - slidepdf.com
http://slidepdf.com/reader/full/morgan-stanley-education-report 13/60
Business Services – October 18, 2004
Please see analyst certification and other important disclosures starting on page 55.
Page 13
We can break down the demand drivers for for-profit
higher education, among working-age adults, into several
buckets: 1) population growth among the relevant age and
demographic groups, 2) increased needs for new skills inorder for employees to stay employed or make
advancements, and 3) increased funding for would-be
students, who have previously not been able to afford an
education while working.
The National Center for Economic Statistics (a division of
the Department of Education) published a report in August
2003 that looked at the trend towards adults seeking post
secondary enrollment. Among such students, age 24 or
older, about two-thirds described themselves as
“employees who study,” meaning that work was their
highest priority. The other one-third described themselves
as “students who work.” The employees who study were
much more likely to be older, married, and have children,
versus the students who work. They were also much more
likely to attend school part time (76%, versus 32 for the
others), and the vast majority of them (87%) work full time,
meaning that their income was much higher ($46,000 per
year versus $22,000). The employees who study are also
much less likely to complete their degrees, and to the
extent that the for-profits aggressively try to keep their
students enrolled, they likely do a better job of meeting the
needs of these busy students than do traditional schools.
Taking Share from Traditional Colleges andUniversities Represents a Good Opportunity
The rate of growth of high school graduates who enter
college will likely be very modest, as discussed above.
However, we see a very good opportunity for the for-profit
companies to take share away from the traditional schools
as it relates to this more traditional-aged enrollee. In fact,
only about 25% of students currently follow a “traditional”
path (enter college right after graduating from high school,
attend full-time, while being supported by parents) toward
higher education. By contrast, the vast majority of
students deviate from this path in one or more ways. In the
industry, these students are referred to as “non-traditionalstudents” or as “working adults.”
As we discussed above, working adults have different
needs from traditional students. They have less interest in
purely liberal arts, theoretical education, and care more
about learning real-world, practical skills. They are
generally not interested in having to support highly paid
professors who spend most of their time on research
activities. They are also not particularly interested in
supporting a leafy, manicured campus setting or money-
losing sports teams, for that matter. Even among more
traditional students, we believe the for-profits have an
opportunity to provide a better-tailored educational produto suit the students’ needs. In addition to factors
mentioned above, this may include providing better job
placement services, a more relevant curriculum, a better
value proposition, more flexibility with class schedules
(including online classes), etc.
The for-profits generally maintain high job placement rat
typically 85–95%, for several reasons. First, they are ver
focused on maintaining high rates as a way to recruit new
students and maintain high revenue growth. Second, they
try to stay very close to labor market trends, much more s
than traditional schools. To the extent that they can stay
flexible with their programs, they are likely to provide
skills that are in demand at any given time. Most for-
profits have some type of advisory board that monitors
their curriculum and recommends changes to keep it
relevant.
The for-profits have aggressively explored the
opportunities for online and distance learning, partly as a
way to make the educational process more convenient for
their students. The for-profits also have more flexibility
invest capital in technology projects such as this, compar
to the traditional (and especially public sector) schools.
We believe that these investments will further help the foprofits meet the needs of working adults, thereby
expanding the market, and to a lesser extent, gaining shar
from the traditional schools.
Exhibit 14
For-Profit Institutions Are Multiplying
137
-16
34
-40
-20
0
20
40
60
80
100
120
140
160
Change in Number of Institutions, 1997 to 2002
For-Profits Not -For-Pr of its Private Not-For -Profits Public
Source: Dept. of Education

5/14/2018 Morgan Stanley Education Report - slidepdf.com
http://slidepdf.com/reader/full/morgan-stanley-education-report 14/60
Business Services – October 18, 2004
Please see analyst certification and other important disclosures starting on page 55.
Page 14
In this context, community colleges have in recent years
become increasingly concerned about the competitive
threat from the for-profits. For-profit programs are much
more focused than those at community colleges, and this isthe most stark point of differentiation. However, customer
service is also a strong competitive advantage for the for-
profits. A report from the Community College Research
Center underscored these fears, and it highlighted several
interesting trends. First, degree and certificate completion
rates are much higher for the for-profits than for the
traditional schools. Also, four-year for-profit institutions
confer as many associates degrees as they do bachelors
degrees. In response to this last point, there is some talk in
the traditional educational community that perhaps
traditional four-year colleges should begin to offer
associates degrees, and that even traditional community
colleges should begin to offer bachelors degrees. In some
cases, relationships are more cooperative, and many four-
year for-profits get many transfer students from
community colleges.
Even if the public universities decided to overhaul their
educational models to more directly meet the specific
needs of working students, they would still run into various
money-related bottlenecks. For example, capacity
utilization in the public universities is generally very high,
and relatively few states have the money available to open
new campuses. Some states, such as California, have also
taken steps to reduce the number of students who attendexisting campuses, since the states generally subsidize the
students, and the governments are looking for ways to cut
spending. As the economy eventually picks up, we suspect
that for political reasons, funding for K-12 education will
continue to receive a higher priority than funding for
public universities.
In theory, the not-for-profit, private institutions could
increase capacity. However, the high-end schools
generally do not want to dilute their brands, and they
would face resistance to expansion from various internal
constituents. On the margin, less prestigious not-for-profits could expand, but by definition, they are not being
driven by a profit motive, so their incentives for meeting
growing needs are fairly modest. Some non-for-profits
could convert to for-profit status, and they may well be
encouraged to do so by their own managers, as well as by
potential private equity investors.
For-profits represent 13.1% of associate degrees, 2.0% of
bachelors degrees, 3.0% of masters degrees, 1.5% of
doctoral degrees, and a mere 0.2% of professional degrees.
We see opportunities for these shares to rise in each
segment.
Compelling Opportunity to Educate More Adults
We believe that the ongoing globalization of the world’s
economies will put pressure on workers in developed
countries to continuously upgrade their skills, or risk
becoming uncompetitive and/or under-employed.
Consistent with this, a rising percentage of high school
graduates are going on to college, and this trend should be
a positive for traditional and for-profit schools. However,
as we discussed earlier, the number of high school
graduates is likely to start declining later this year, so total
enrollments into college from high school graduates likely
will slow to low single digits growth.
Exhibit 15
High School and Bachelors Degree Attainment Rates
0
10
20
30
40
50
60
70
80
90
100
. . 1 9 4 0
. . 1 9 5
2
. . 1 9 6 2
. . 1 9 6 6
. . 1 9 6 9
. . 1 9 7 2
. . 1 9 7 5
. . 1 9 7 8
. . 1 9 8 1
. . 1 9 8 4
. . 1 9 8 7
. . 1 9 9
0
. . 1 9 9 3
. . 1 9 9 6
. . 1 9 9 9
. . 2 0 0 2
P e r c e n t
HS, 25+
HS, 25-29
BS, 25+
BS, 25-29
Source: U.S. Census Bureau
Regarding older adults seeking to upgrade their education,
we have not seen any good forecasts for what this is likely
to mean for in terms of growth opportunities for schools
that focus on educating adult workers. That said, we can
explore some basic scenario analyses to try to get some
idea of what these trends could imply for incremental
growth for the for-profit schools. We also believe that as
these for-profit schools expand, and generally try to meetthe needs of working adults (though such facilitators as
online education), they will stimulate demand from
students and therefore increase the size of the market.
In our scenario analysis, we make assumptions about the
percentage of the population that has a high school degree
and will need to seek an associate and/or bachelors degree,
as well as the percent of the population that has a bachelors
degree that will need to seek a masters degree. There are

5/14/2018 Morgan Stanley Education Report - slidepdf.com
http://slidepdf.com/reader/full/morgan-stanley-education-report 15/60
Business Services – October 18, 2004
Please see analyst certification and other important disclosures starting on page 55.
Page 15
about 185 million people in the US over age 25, and of
those, 83 million are between 25 and 45. Of that
population, nearly 50 million people have a high school
degree but to not have a bachelors degree. If 50% of thatgroup were to seek a degree some time in the next 20 years,
and the average enrollment lasted four years, that would
generate five million adult students. This compares to
about 500,000 for-profit enrollees and about 400,000 for-
profit graduates per year currently. In other words, if the
for-profit sector got all of these incremental adult students,
the for-profit segment could expand significantly. Actual
data show that there are actually about 6 million
enrollments into degree-granting programs per year by
those age 25 or older, but most don’t go to for-profits.
If we do a similar analysis for bachelor degreed adults who
may seek a masters degree, we get another 500,000
students. This is based on about 20 million bachelor
degree holders (but without masters or professional
degrees) who are between 25 and 45. If we assume that
25% of this group were to seek a masters degree some time
in the next 20 years, that would generate 250,000
additional for-profit graduates per year.
Exhibit 16
Needs are Shifting Toward Degree Programs
Change inthe Number of Degree and Non-degree Granting Institutions, 1997-2002
2,712
4,096
2,257
4,251
0
500
1,000
1,500
2,000
2,500
3,000
3,500
4,000
4,500
Non-degree granting Degree granting
1997 2002 Source: Dept. of Education
Will the Federal Government Continue to Sufficiently
Fund Student Loans and Grants?
We expect the government to renew the Higher Education
Act in the coming months, and we generally believe that
funding levels will allow for modest growth in overall
postsecondary student levels. However, the share held by
the for-profits is so low that we don’t see lack of
government funding as a factor limiting the growth rate for
the public companies. Please see a more thorough
discussion of this topic later in the report.
Exhibit 17
Revenue Sources by Institution Type
0%
10%
20%
30%
40%
50%
60%
70%
80%
90%
100%
For-Profits Public Not-For-Profits Private Not-For-Profits
Tuition and fees Government appropraitions Government grants and contra
Private gifts, grants, and contracts Other revenue
Source: Dept. of Education
Actual Growth by the For-Profits Has Been Impressive
In the last eight years, enrollment growth at the for-profit
has taken off. We believe that this largely has been drive
by these companies’ aggressive focus on expanding the
market for postsecondary education of working adults.
Also, this growth was enabled by changes to the Title IV
funding rules in 1998, which opened up student loans to
many more working adults and to the for-profit schools.
Assuming that students continue to have access to source
of funding for tuition costs, we expect that enrollment an
revenue growth will continue to be driven by three key
factors: 1) campus expansion by the for-profits, facilitateby easy access to capital, including by expanding their
program offerings, 2) the ability of the for-profits to meet
the educational needs of working adults, and 3) the ability
of the for-profits to take share of the market for traditiona
students.
Exhibit 18
Indexed Enrollment Growth: For-Profits Gain Share
0
200
400
600
800
1,000
1,200
1 9 7 6
1 9 7 8
1 9 8 0
1 9 8 2
1 9 8 4
1 9 8 6
1 9 8 8
1 9 9 0
1 9 9 2
1 9 9 4
1 9 9 6
1 9 9 8
2 0 0 0
Public Not-For-Profit For-Profit
Source: Dept. of Education

5/14/2018 Morgan Stanley Education Report - slidepdf.com
http://slidepdf.com/reader/full/morgan-stanley-education-report 16/60
Business Services – October 18, 2004
Please see analyst certification and other important disclosures starting on page 55.
Page 16
Acquisition Opportunities Should Further Add to For-
Profit Growth, but the Pace of Acquisitions May Slow
There are more than 6,000 institutions in the US that meet
the requirements of Title IV, and of these, more than 4,000grant degrees. Even in the for-profit portion of the
business, there are several thousand institutions. However,
the vast majority of the for-profits are non-degree-granting
institutions, which may be less attractive for acquisitions.
Also, of the for-profit, degree-granting institutions, a
majority provide only associate degrees. Therefore, it
seems to us as if the number of high-quality higher
education firms that are available may not be as great as
some of these companies suggest.
Some of the most acquisitive of the larger for-profit
schools, such as Career Education and Corinthian College,
typically have dozens of companies on their acquisition
radar screen at any given time, with perhaps half a dozen in
late stage negotiations. Although acquirers typically look
for companies that have a good strategic fit (geographic
expansion, entrance into a fast-growing segment, etc.),
they also typically are very price sensitive.
We believe (based on our experience in other roll-up
situations in other industries) that financially-driven
acquisition strategies usually eventually run into problems.
Such problems can be due to: 1) too-rapid acquisitions,with insufficient integration, 2) buying increasingly lower-
quality companies, to keep the deals accretive, as purchase
prices rise, and/or 3) cultural clashes with the acquired
companies and managements. Specifically in the
education industry, companies also run the risk of
acquiring companies that have spotty regulatory
compliance track records. These deals can create a lot of
value, when integrated correctly an intensively. By
contrast, they also run the risk of bringing in less
responsible managers, and ultimately creating more
regulatory risks for the acquitting company.
Acquisition multiples were historically 5–10x trailing
EBITDA, but in recent years these have expanded into the
low teens, especially for larger and higher-quality
companies.
Exhibit 19
Title IV Institutions by Type, 2002-2003
N ot - f o r -p ro f i t For-p ro f i t N o t - f o r -p ro f i t For-p ro f i t
A l l i ns t i t u t i ons 6,508 6,354 2,051 1,921 2,382 154 29 48 77
4 yea rs and above 2,551 2,490 632 1,558 300 61 18 36 7
At l eas t 2 bu t l ess t han 4 y ea rs2,194 2,170 1,155 251 764 24 11 3 10
Less than 2 y ears 1,763 1,694 264 112 1,318 69 0 9 60
Degree -g ran t i ng 4,251 4,168 1,712 1,665 791 83 29 39 15
4 yea rs and above 2,527 2,466 631 1,538 297 61 18 36 7
At l eas t 2 bu t l ess t han 4 y ea rs 1,724 1,702 1,081 127 494 22 11 3 8
Less than 2 y ears † † † † † † † † †
Non-deg ree -g ran t i ng 2,257 2,186 339 256 1,591 71 0 9 62
4 yea rs and above 24 24 1 20 3 0 0 0 0
At l eas t 2 bu t l ess t han 4 y ea rs 470 468 74 124 270 2 0 0 2
Less than 2 y ears 1,763 1,694 264 112 1,318 69 0 9 60
Un i t ed St at es Ou t ly i ng ar eas
Tot a l Pu b l i c
P r i va te
Tot a l Pub l i c
P r i va teTo ta l D eg ree-g ran t i ng s ta t us and l eve l
o f i ns t i t u t i onTota l
Source: Dept. of Education

5/14/2018 Morgan Stanley Education Report - slidepdf.com
http://slidepdf.com/reader/full/morgan-stanley-education-report 17/60
Business Services – October 18, 2004
Please see analyst certification and other important disclosures starting on page 55.
Page 17
On the positive side, we see some potential benefits of
consolidation. Specifically, companies can create strong
brand names, on a national basis, which can be used to
“cross-pollinate” the programs through cross-selling.Consolidation may also delay the inevitable maturation of
the business, and may allow for high tuition growth rates,
relative to in a more fragmented environment. It is also
somewhat faster to expand through acquisitions versus
organic growth, but we see this as a less compelling reason
than in other industries, since new, organically developed
campuses can be profitable in their first year.
Pricing Growth Has Been Robust, but Seems Likely to
Slow Eventually
Tuition cost inflation has typically been 3–5% per year in
the last decade or so, or typically 2–3% in excess of the
inflation rate. The Department of Education reports that
from 1998 to 2003, tuition costs at public four-year
universities rose by 32%, costs at private non-for-profits
rose 29%, and at for-profits rose a robust 35%. Tuition
rates at for profit four-year institutions average about
$11,500, versus $14,500 at not-for profit private
institutions and $4,000 for in-state students at public
institutions. The “price of attendance” (a more fully
loaded cost figure, is for $21,000 at for-profits, versus
$24,000 at non-for-profit private institutions and $13,000
for public institutions. Tuition costs at two-year public
schools has increased much less rapidly, by 15%, versus by
41% at two-year for-profits.
Interestingly, tuition growth tends to be counter-cyclical.
In a weak economy, state budget shortfalls and declining
endowment values drive high tuition increases. In this
context, we don’t expect tuition pricing to come under
pressure in the next year or two.
Education industry participants typically argue that, despite
rising costs, an education is still a “good deal”, in that the
higher wages associated with higher-skilled jobs generate a
good return on money spent on education. We believe that
this is generally true, given the wide variation in incomelevels by educational attainment. However, we think that
the current rate of tuition price growth is unsustainable. As
these for-profit competitors aggressively add capacity, we
think that the business will become more price competitive
as it slowly matures. We haven’t seen signs that this is
happening yet, however. In the medium term, we also
think that tuition growth will be affected by the
government’s willingness to increase loan subsidies in line
with tuition growth.
Exhibit 20
Average Annual Income by Education Level
$-
$20,000
$40,000
$60,000
$80,000
$100,000
$120,000
N o t H
S g r a d u a t e
H S g r a d u a t e
S o m e c o l l e
g e
A s s o c i a t e
B a c h e l o r s
M a s t e
r s
P r o f e s s i o
n a l
D o c t o
r a l
Source: Dept. of Education
An internal rate of return (IRR) analysis suggests that
money spent on education is generally worth spending.
For example, if we model for a basic scenario for a
working adult to seek a bachelors degree through night
classes at a typical for-profit institution, we calculate an
18% pre-tax IRR. This assumes $25,000 of spending on
education per year for four years, followed by a $20,000
boost to annual income in the year following graduation,
growing at 3% per year for the next 30 years. If the
income boost were only $10,000, we still get an 11% IRR
For someone who pursues a graduate degree later in life,
realistic scenario yields a 20% pre-tax IRR. That assume
$25,000 of educational costs per year for two years,
followed by a $10,000 boost to annual income, growing a
3% per year for the next 20 years. We could haircut the
assumptions regarding the boost to earnings, and still
conclude that a realistic IRR is nicely in excess of the hig
single digit pre-tax return that many equity strategists
assume that a long-term investment in the equity markets
would realize.
Job placement rates by for for-profits were historically
90%+, but this has fallen to 85–90% in more recent years
Some of this is likely due to the weaker economic
environment since 2000; however, some of it may alsoreflect a slowly maturing industry. This business has fair
high fixed costs, and the marginal cost per incremental
student is fairly low. In that context, if excess capacity
were to develop, either due to excessive opening of new
offices or due to lack of loan funding, we think that price
competition could pick up quickly.
5/14/2018 Morgan Stanley Education Report - slidepdf.com
http://slidepdf.com/reader/full/morgan-stanley-education-report 18/60
Business Services – October 18, 2004
Please see analyst certification and other important disclosures starting on page 55.
Page 18
Online Education Opportunity
We believe that online education represents a significant
growth opportunity for the education industry, and wethink that we are relatively early in the development of this
opportunity. Online education, by being more flexible,
seems particularly well suited for older students, and for
for-profit providers. This segment may well maintain
25%+ revenue growth for another five years or so.
However, we also think that companies will need to
develop these new offerings carefully, with a focus on
educational quality, to ensure that these more efficiently
delivered degrees have value to students, employers, and
government regulators. Even if most schools provide high-
quality educational services, we think that only one or two
aggressive competitors could potentially taint the image of all online degrees. Therefore, while we assume that most
for-profits will deliver high growth through online
offerings, we are not willing to give the earnings from
these online offerings as high of a valuation multiple as the
growth forecasts might otherwise justify.
While the flexibility of online education should modestly
expand the market for educational services, it may also
benefit from a mix-shift away from on ground education.
Online and offline offerings are getting integrated, and the
profitability of the two models may be similar. Given
these considerations, we think that it is appropriate to focuson a given company’s overall growth rate, and not get
overly impressed with the growth of the company’s online
segment.
Why Is Online Education so Promising?
Meeting Students’ Changing Needs: The profile of the
typical college student has been changing in recent years,
with a trend toward older students. Even among younger
students, more of them hold jobs, have families, and have
other responsibilities. Therefore, more than ever, students
value flexibility and convenience when seeking an
education. Online educational programs meet these needs
very well, and therefore have the potential to increase the
size of the market for adult (and typical college age)
education.
Creating New Opportunities for International Students:
Higher education has been an “export” business for US
education in recent decades. By offering classes online, it
is now much more convenient for international students to
receive an American university degree.
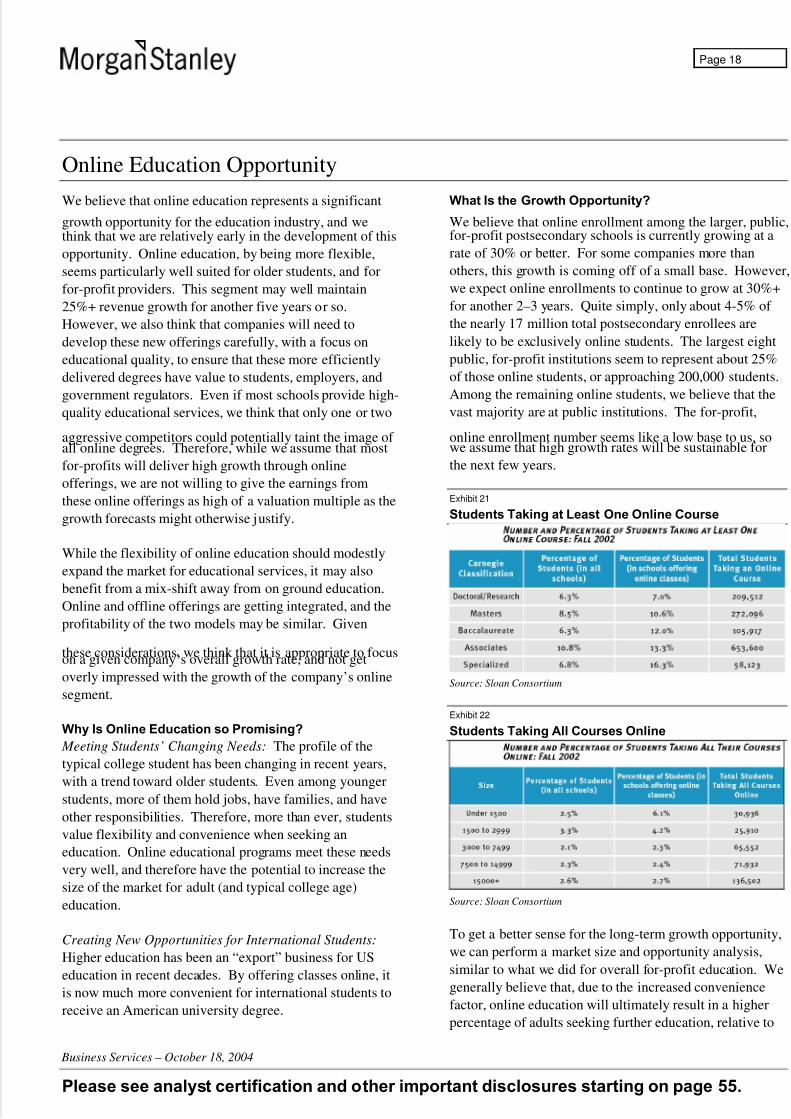
What Is the Growth Opportunity?
We believe that online enrollment among the larger, public,for-profit postsecondary schools is currently growing at a
rate of 30% or better. For some companies more than
others, this growth is coming off of a small base. However,
we expect online enrollments to continue to grow at 30%+
for another 2–3 years. Quite simply, only about 4-5% of
the nearly 17 million total postsecondary enrollees are
likely to be exclusively online students. The largest eight
public, for-profit institutions seem to represent about 25%
of those online students, or approaching 200,000 students.
Among the remaining online students, we believe that the
vast majority are at public institutions. The for-profit,
online enrollment number seems like a low base to us, sowe assume that high growth rates will be sustainable for
the next few years.
Exhibit 21
Students Taking at Least One Online Course
Source: Sloan Consortium
Exhibit 22
Students Taking All Courses Online
Source: Sloan Consortium
To get a better sense for the long-term growth opportunity,
we can perform a market size and opportunity analysis,
similar to what we did for overall for-profit education. We
generally believe that, due to the increased convenience
factor, online education will ultimately result in a higher
percentage of adults seeking further education, relative to

5/14/2018 Morgan Stanley Education Report - slidepdf.com
http://slidepdf.com/reader/full/morgan-stanley-education-report 19/60
Business Services – October 18, 2004
Please see analyst certification and other important disclosures starting on page 55.
Page 19
penetration rates that would have occurred without the
online opportunity. However, our earlier analysis
generally assumed that the market for adult higher
education would be expanded (by several percentagepoints of annual growth) due to online business models.
This earlier analysis may have been conservative in its
assumption of market expansion due to the online
convenience, and we have seen some industry estimates
that suggest a vast majority of online students would not be
students at all if online courses were not available.
Nevertheless, we think that an analysis of the online
opportunity should focus on the existing market for adult
higher education, and then try to make some estimates for
how quickly this market will transition from offline to
online classes. To a lesser extent, we think that the online
market size analysis should focus on the opportunity to
convert 18-24-year-old traditional students from offline to
online educational formats. We expect traditional
universities to be competitive in the online market for
younger students, so we do not see this as a particularly
large growth opportunity for the for-profits in the near term.
For our broad analysis of the opportunity for for-profit
education, we started with the roughly 50 million U.S.
adults aged 25-45 who have a high school diploma, but no
college degree. If 50% of that group were to seek a degree
some time in the next 20 years, and the average enrollment
lasted four years, that would generate five million adultstudents in any given year. This compares to about
500,000 for-profit enrollees and about 400,000 for-profit
graduates per year currently. In other words, if the for-
profit sector got all of these incremental adult students, the
for-profit segment could expand significantly. Actual data
show that there are actually about six million enrollments
in degree-granting programs.
If we take the above-described population of 50 million
and trim it down further based on likely income and other
demographical factors of those who are likely to seek an
adult education, we still believe there are at least 25million addressable “potential students.” About 38% of
current postsecondary enrollees are age 25 or above,
yielding about 6.5 million adult students currently. We
believe that there are less than one million online
postsecondary students currently, even including younger
students. We believe that a significant percentage of those
6.5 million older students will shift online in coming years.
In this context, we believe that online enrollment growth
will likely hold at perhaps 25% per year for a few more
years, and, given pricing growth of 2-4%, we think that
online revenue for the industry could maintain nearly a
30% growth rate. The Sloan Consortium has similar
expectations, assuming that online enrollment growth wilbe much higher at for-profits than at other types of schoo
Interestingly, the National Education Association surveys
suggest that online education is catching on with the unde
25 student population about as fast as it is for older
students. If true, this could represent another strong
growth prospect for the for-profits.
What Are the Risks and Growth Rate Limiting Factors
Perceived quality risks. In our view, the primary risk is
that a few bad apples in the industry could push growth
rates for new online degree programs too quickly, resultin
in declining quality standards. If that were to happen, we
would expect regulators, employers, and students to sour
on the idea of online education, and this could reduce
demand even from companies that maintained high quali
standards.
Regulatory risks. The DoE currently restricts what
percentage of programs and students that can be online
versus on campus. This “50/50 Rule” makes an institutio
ineligible for Title IV funding if: 1) more than 50% of
courses are though distance education, 2) more than 50%
of students are enrolled via distance education, and/or 3)
more than 50% of courses lead to a certificate or diploma
The DoE also has some ongoing tests with some of the foprofit companies that are intended to study the
effectiveness of online education. Depending on how the
DoE’s assessment of how the Distance Education
Demonstration Program progresses, there is a possibility
that existing regulations could either be strengthened or
loosened. DoE has increased the number of schools in th
program from 15 initially in 1998 to 27 more recently,
suggesting that it is going well so far. In the short term,
reauthorization of the Higher Education Act seems likely
to cause some further loosening of the 50/50 Rule, but
ultimately, we think that the regulatory situation will be
driven by perceptions over online program quality.
Applicability issues. In our view, not all types of classes
and degree programs are amenable to online learning.
Subjects like business, accounting, computer science and
education seem to be teachable online, while hands-on
courses such as health and science, as well as vocational
training, do not work as well.
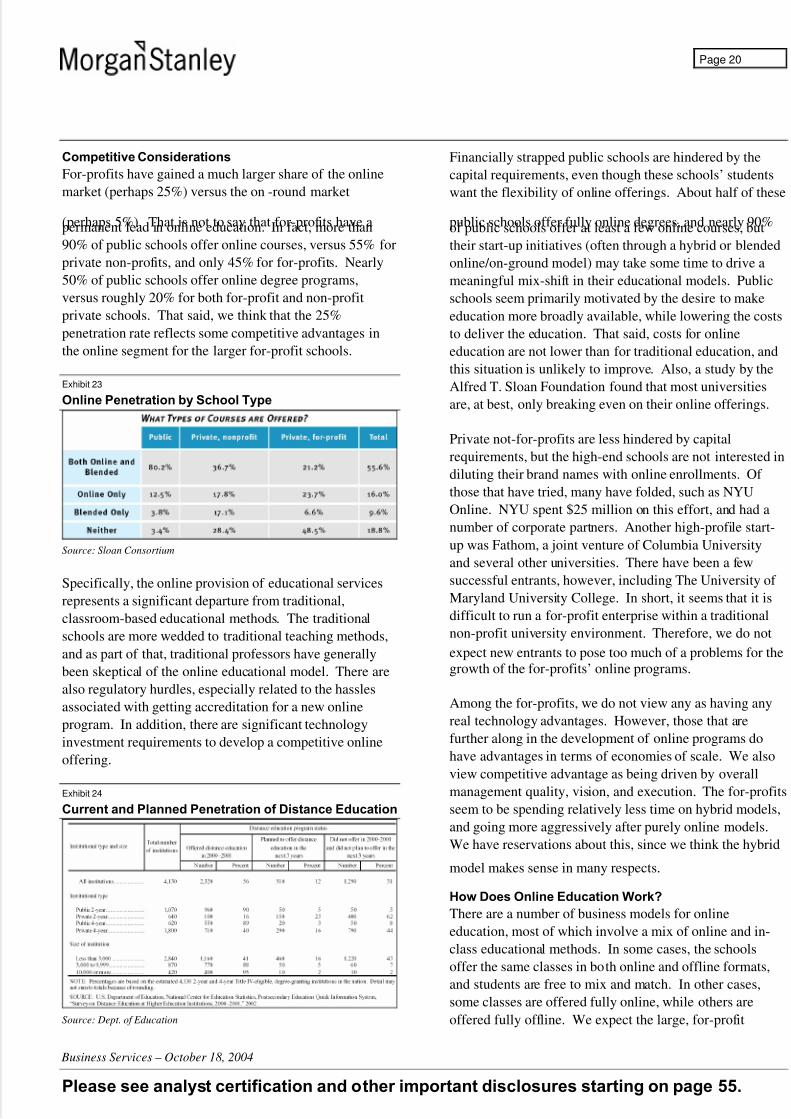
5/14/2018 Morgan Stanley Education Report - slidepdf.com
http://slidepdf.com/reader/full/morgan-stanley-education-report 20/60
Business Services – October 18, 2004
Please see analyst certification and other important disclosures starting on page 55.
Page 20
Competitive Considerations
For-profits have gained a much larger share of the online
market (perhaps 25%) versus the on -round market
(perhaps 5%). That is not to say that for-profits have apermanent lead in online education. In fact, more than
90% of public schools offer online courses, versus 55% for
private non-profits, and only 45% for for-profits. Nearly
50% of public schools offer online degree programs,
versus roughly 20% for both for-profit and non-profit
private schools. That said, we think that the 25%
penetration rate reflects some competitive advantages in
the online segment for the larger for-profit schools.
Exhibit 23
Online Penetration by School Type
Source: Sloan Consortium
Specifically, the online provision of educational services
represents a significant departure from traditional,
classroom-based educational methods. The traditional
schools are more wedded to traditional teaching methods,
and as part of that, traditional professors have generally
been skeptical of the online educational model. There are
also regulatory hurdles, especially related to the hassles
associated with getting accreditation for a new online
program. In addition, there are significant technology
investment requirements to develop a competitive online
offering.
Exhibit 24
Current and Planned Penetration of Distance Education
Source: Dept. of Education
Financially strapped public schools are hindered by the
capital requirements, even though these schools’ students
want the flexibility of online offerings. About half of these
public schools offer fully online degrees, and nearly 90%of public schools offer at least a few online courses, but
their start-up initiatives (often through a hybrid or blended
online/on-ground model) may take some time to drive a
meaningful mix-shift in their educational models. Public
schools seem primarily motivated by the desire to make
education more broadly available, while lowering the costs
to deliver the education. That said, costs for online
education are not lower than for traditional education, and
this situation is unlikely to improve. Also, a study by the
Alfred T. Sloan Foundation found that most universities
are, at best, only breaking even on their online offerings.
Private not-for-profits are less hindered by capital
requirements, but the high-end schools are not interested in
diluting their brand names with online enrollments. Of
those that have tried, many have folded, such as NYU
Online. NYU spent $25 million on this effort, and had a
number of corporate partners. Another high-profile start-
up was Fathom, a joint venture of Columbia University
and several other universities. There have been a few
successful entrants, however, including The University of
Maryland University College. In short, it seems that it is
difficult to run a for-profit enterprise within a traditional
non-profit university environment. Therefore, we do not
expect new entrants to pose too much of a problems for thegrowth of the for-profits’ online programs.
Among the for-profits, we do not view any as having any
real technology advantages. However, those that are
further along in the development of online programs do
have advantages in terms of economies of scale. We also
view competitive advantage as being driven by overall
management quality, vision, and execution. The for-profits
seem to be spending relatively less time on hybrid models,
and going more aggressively after purely online models.
We have reservations about this, since we think the hybrid
model makes sense in many respects.
How Does Online Education Work?
There are a number of business models for online
education, most of which involve a mix of online and in-
class educational methods. In some cases, the schools
offer the same classes in both online and offline formats,
and students are free to mix and match. In other cases,
some classes are offered fully online, while others are
offered fully offline. We expect the large, for-profit

5/14/2018 Morgan Stanley Education Report - slidepdf.com
http://slidepdf.com/reader/full/morgan-stanley-education-report 21/60
Business Services – October 18, 2004
Please see analyst certification and other important disclosures starting on page 55.
Page 21
schools to leverage a mixture of formats, to offer
maximum flexibility. That said, we believe that online-
only formats will become more significant going forward,
and we would not rule out the possibility that somecompletely new, online-only entrants could emerge.
The mix-and-match format works well for the for-profit
companies for several reasons. First, these companies
already have significant on-ground operations, including
classroom activities as well as company administration.
These operations can be leveraged through incremental
online enrollments. Online enrollments can benefit from
the previously established brand name of the on-ground
operations, and the absence of such a brand represents a
significant barrier to entry for pure online entrants. Also,
students that have the flexibility to take a mixture of
offline and online classes tend to take more units, and
generate more revenue, than other students. Finally,
companies with significant on-ground operations may be
best positioned to ensure the quality of their online
programs, since they would have a good perspective from
which to develop programs, evaluate test scores, etc.
Exhibit 25
Definitions of Online Education
Source: Sloan Consortium
The online-only business model is a bit difficult, given
regulations from the Higher Education Act, including the
old 12-Hour Rule and the 50/50 rule. An online-only
company would have to forgo Title IV funding, which
would sharply limit the pool of potential students.
Nevertheless, the 1998 authorization of the Distance
Education Demonstration program has allowed some
online-only schools to ramp up quickly. Schools that
participate in this program, such as Capella University and
Walden University, have ramped up nicely. Others, such
as Jones International University, have had their growth
rates restrained by lack of access to Title IV funding.
Despite the regulatory and student funding challenges of the online-only business model, there are some advantage
to this model. As is the case with most online businesses
the cost structure is lower for online schools, given fewer
physical locations. Also, online schools are not viewed a
much of a competitive threat versus the traditional school
and this fact makes it easier for online-only schools to
recruit full-time faculty of traditional schools as adjunct
instructors. Online-only schools also can sign alliances
with traditional schools, in which the online schools can
leverage the facilities, and even some classes, of the
traditional schools.
Marketing and lead generation is somewhat different in
purely online businesses. Specifically, we believe that a
significant majority of leads for online programs come
through Internet channels. While some of these leads com
directly from the schools’ websites, many of them come
from search engine searches and ads, as well as from bulk
emails. Other leads can come from links on education
industry websites. Costs for leads can range from about
for a click-through on a search engine site, to perhaps $10
for a highly qualified lead from an industry site. While
costs per lead are lower in the online model, the lead
conversion rates are also lower, so total client acquisition
costs are likely similar in the two models.
One might assume that online education would require
students to have broadband access, but this is not
necessarily the case. In fact, online courses generally do
not make much use of streaming video, heavy-duty
graphics, etc. As broadband access improves, however,
online providers will have an opportunity to upgrade the
technology aspect of their offerings, and this could make
online education even more competitive versus on-groun
Is Quality Comparable to Traditional Education?
The question of quality of online education is highlydebatable and seems somewhat subjective. We generally
believe that the quality of online education is lower than
that of traditional classroom-based education. This seem
to be common sense, in our view, and we believe that
employers do not put nearly as much value on an online
degree as on an offline degree from a recognized univers
Furthermore, our conversations with academics at
traditional schools consistently confirm our suspicions.
Academics typically complain about the lack of broadly

5/14/2018 Morgan Stanley Education Report - slidepdf.com
http://slidepdf.com/reader/full/morgan-stanley-education-report 22/60
Business Services – October 18, 2004
Please see analyst certification and other important disclosures starting on page 55.
Page 22
enriching courses at online schools. They also complain
about the lower quality standards for the teachers, who
may not have advanced degrees in the fields in which they
are teaching. They also are skeptical of online students’ability to pick up finer points from the professors and other
students. In general, we believe that the courses and
credits from for-profits are often not transferable to not-
for-profit institutions.
Researchers at the Sloan Consortium (which describes
itself as a consortium of institutions and organizations
committed to quality online education), propose that there
are five keys to creating a high-quality online educational
program: 1) learning effectiveness, 2) student satisfaction,
3) faculty satisfaction, 4) cost effectiveness, and 5) access.
Also, the Institute for Higher Education Policy, in a report
titled Quality on the Line: Benchmarks for Success in
Internet-Based Distance Education, highlights the
following keys to quality in online education:
• The development and maintenance of the
technical infrastructure
• Adequate training for faculty and students in
technical tools and distance education teaching
and learning strategies
• Readily available technical assistance
• Support and interaction between students and
faculty and among students
• Engagement of students in tasks that require
higher-order thinking skills
• Ongoing evaluation and assessment of the
curriculum and teaching/learning processes
However, surveys from Sloan, which could be biased in
favor of online education, confirm our suspicion that
online education is modestly inferior to traditionaleducational quality. Some surveys have also suggested
that online students spend less time studying, and that they
score lower on tests than traditional students. However,
respondents to the Sloan survey believed that over the next
three years the quality of online education would come to
modestly surpass that of traditional education.
Exhibit 26
Academic Officers' View on Online Learning Outcomes
vs. Classroom Learning Outcomes
Superior1%
SomewhatSuperior
12%
Same44%
SomewhatInferior
32%
Inferior
11%
Source: Sloan Consortium
Older DoE survey data from 2000 seems to suggest that
students view online educational quality as modestly below
that of traditional education. However, in a July 2003
second report to Congress on the Distance Education
Demonstration program, the DoE reached surprisingly
positive conclusions regarding online education. DoE
concluded that online education was significantly
expanding educational opportunities for would-be students.
It concluded that retention and completion (graduation)
rates for online programs compared favorably with those of
traditional schools, and that these metrics are primarily
driven by the quality of the institution, rather than by themode of delivery of the education. That said, retention is
higher for schools that offer both onsite and online courses
than it is for purely online schools.
Exhibit 27
Undergrad Students' Satisfaction with Quality of Online
Education vs. Classroom Education
More satisfied23%
Equally satisfied46%
Less satisfied30%
Other1%
Source:US Dept. of Education. 2000 data

5/14/2018 Morgan Stanley Education Report - slidepdf.com
http://slidepdf.com/reader/full/morgan-stanley-education-report 23/60
Business Services – October 18, 2004
Please see analyst certification and other important disclosures starting on page 55.
Page 23
Exhibit 28
Online Education Is Less Critical for Bachelors
Degrees
Source: Sloan Consortium
Interestingly, the Sloan Consortium reports that a majority
of schools of each type view online education as critical to
their growth strategies. However, online education is seen
as more critical for associate and doctoral programs than
for baccalaureate programs. School participants were also
least optimistic on the relative quality of online
baccalaureate programs, but were relatively moreoptimistic on the potential quality of online associate and
doctoral programs.
Although students and administrators increasingly accept
online education, faculty and employer perceptions still lag
a bit. Faculty are quite concerned about educational
quality. For faculty, teaching online courses is more time-
consuming than for offline courses, and there is also the
obvious problem of potential student cheating. A survey
from the National Education Association suggests that
faculty’s satisfaction with the quality of online education
also depends to a great degree on the level of technicalsupport that they and their students receive. Faculty are
also concerned about the potential loss of their intellectual
property, as well as with bread-and-butter issues such as
having to teach more students for less money.
Exhibit 29
Faculty Acceptance of Online Education is Lagging
Source: Sloan Consortium
What Is the Margin Opportunity?
We believe that online margins, while currently
comparable to on-ground margins, have the potential to
expand meaningfully as companies get their programs up
to full scale. Mature on-ground operations at well-run
companies often have operating margins in the high-30%
range. Due primarily to lower rent costs, we believe that
online operations could eventually achieve operatingmargins of 40-45%, or perhaps even higher. Companies
that have mixed business models may also be able to save
on total marketing costs.
In addition, tuition rates tend to be modestly higher for
online courses, despite the lower costs. We are not
convinced that this is sustainable, but it could provide
further upside to online margins should it prove to be
sustainable. Customer acquisition costs seem to be
modestly lower for online programs, but we are not
convinced that this is sustainable either. Online program
get most of their students from online ads, and do not getmany from alliances with high schools. Also, online
programs get relatively few leads from low-cost referrals
Online programs tend to have smaller class sizes, but this
may be partly due to the start-up nature of many program
and therefore leverage on the teacher’s salary costs may
eventually be a source of positive margin differential for
online education.

5/14/2018 Morgan Stanley Education Report - slidepdf.com
http://slidepdf.com/reader/full/morgan-stanley-education-report 24/60
Business Services – October 18, 2004
Please see analyst certification and other important disclosures starting on page 55.
Page 24
Regulatory Issues
The Higher Education Act of 1965 and related regulations
govern those higher education institutions that participatein the Title IV funding program. Compliance with these
regulations is critical for accreditation, and authorization to
operate in various states, and it can influence the costs of
doing business by controlling the supply of Federal funds.
These regulations have been highly successful in shutting
down most “diploma mills,” and therefore in ensuring a
fairly high quality of higher education.
In the past, regulatory issues have had considerable bearing
on the performance of for-profit postsecondary education
companies. An adverse ruling or the threat of an
investigation from the US Department of Education hashad a sharp negative impact on share price in several recent
situations, as we will soon discuss. In many cases, these
investigations cause overreactions by equity investors,
although inadequate compliance has the potential to cause
significant problems for these public companies.
Accreditation
Although accreditation is a nongovernmental activity, it is
used by the government to help protect the Federal
government’s loans to students, as well as to ensure the
quality of the US higher educational system. Only those
institutions that are accredited by a DoE-recognizedaccrediting organization are eligible to receive federal
assistance for their students. Corinthian College has had
recent problems in this regard, as discussed later in this
chapter.
The process of accreditation can be fairly exhaustive and
time-consuming, and creates barriers to entry for new start-
up higher education institutions. For instance, it could take
up to two years for a startup to get accredited. Further,
new institutions are accredited for a period of only two
years (versus five years for older institutions). Even for
mature institutions, accreditation is not permanent, and
institutions have to seek reaffirmation every five years.
New degree programs, and/or new locations for an existing
college often require new accreditation reviews.
Accreditation also serves the purpose of giving the
programs a level of credibility with students and employers.
There are three different types of accrediting agencies:
• Regional accrediting organizations operate in six
different regions of the country and review entire
institutions. Regional accreditation is accepted
nationally as the basis for the recognition of earnedcredit and degrees for academic purposes.
• National accrediting organizations operate throughout
the country and review entire institutions.
• Specialized accrediting organizations also operate
through the country, and they review programs as well
as some single-purpose operations.
Limits on Title IV Program Funds
The regulations under Title IV define the type of
educational programs offered by an institution that qualify
for Title IV funds. Further, these regulations limit theamount of funds disbursed to a student in any academic
year. An academic year must consist of at least 30 weeks
of instructional time, and a minimum of 24 credit hours.
Programs such as corporate training, or executive
education, do not qualify for funding under Title IV, and
the cost has to be borne by students (or their sponsors).
Standards of Financial Responsibility
The Higher Education Amendments of 1992 required the
DoE to develop financial responsibility standards for
institutions, taking into account operating losses, net worth,
operating fund deficits, and asset-to-liability ratios. In
November 1997, the standards to determine the viability of
financial institutions participating in Title IV funding were
further tightened, especially for for-profit providers.
It was determined that the financial health of institutions
will be assessed based on three ratios: primary reserve,
equity, and net income. The primary reserve ratio is a
measure of the financial viability and liquidity of an
institution. The net income ratio gauges the ability of an
institution to generate surpluses to build reserves for future
program initiatives. This ratio is akin to sales turnover.
Finally, the equity ratio is a measure of the amount of
resources financed by owners’ investments, contributions
or accumulated earnings. An institution’s raw scores are
converted to strength factors and combined into a
composite score.
Institutions with composite scores of 1.5 or above are
deemed financially responsible, while those below 1.0 are
not allowed to continue to participate in the Title IV
programs without providing additional surety. Institutions
with composite scores between 1.0 and 1.4 can participate

5/14/2018 Morgan Stanley Education Report - slidepdf.com
http://slidepdf.com/reader/full/morgan-stanley-education-report 25/60
Business Services – October 18, 2004
Please see analyst certification and other important disclosures starting on page 55.
Page 25
in Title IV , but only througha new "in the zone
alternative," under which they will be subject to special
disbursement requirements and enhanced monitoring by
DoE. An institution may remain “in the zone” for up tothree years.
Most of the public companies have composite scores well
above the threshold of 1.5. For instance, as of August 31,
2003, the University of Phoenix had a composite score of
3.0 (which is the maximum achievable). We believe the
additional oversight of the DoE provides an extra layer of
comfort for investors, and may partly explain the strong
balance sheets of the for-profit postsecondary companies.
For example, DoE puts restrictions on cash collected for
unbilled tuition.
Student Loan Defaults
In order to reduce the abuse of Title IV program funding,
the government launched the Default Management
Initiative in the late 1980s. Since then, 1,200 schools have
lost student loan program eligibility. Currently, the DoE
requires eligible institutions to maintain a student loan
cohort default rate of less than 25% for three consecutive
years. An institution’s cohort default rates under the FFEL
and FDL programs are calculated on an annual basis as the
rate at which student borrowers scheduled to begin
repayment on their loans in one federal fiscal year default
on those loans by the end of the next federal fiscal year. If
the default rates exceed 25%, then the DoE may suspendthe institution’s participation in FFEL, FDL or Pell
programs.
Exhibit 30
National Cohort Default Rates Have Improved Steadily
0.0%
5.0%
10.0%
15.0%
20.0%
25.0%
1988 1989 1990 1991 1992 1993 1994 1995 1996 1997 1998 1999 2000 2001 2002
Source: Department of Education
Other Title IV rRegulations
Compensation of representatives. Title IV regulations
prohibit an institution from providing any commission,
bonus, or other incentive payments to admissions orfinancial aid officers based on success in securing
enrollments or financial aid. This is intended to reduce
conflicts of interest in the recruiting process.
The 90/10 rule. This rule says for-profit institutions are
ineligible to participate in Title IV programs if the amoun
of Title IV program funds used by the students or
institution to satisfy tuition, fees, and other costs exceeds
90% of the institution’s cash-basis revenues from eligible
programs. We believe that this rule may be changed in th
near term, such that it may apply to not-for-profits as wel
or it could be eliminated altogether.
Restrictions on distance education. There are restrictio
on the number of courses and students that can be enrolle
in distance learning programs. Institutions that have mor
degree programs than certificate offerings are not eligible
to participate in Title IV if more than 50% of courses are
by correspondence or 50% of courses are offered via
distance education. “Distance” education includes both
correspondence and telecommunications offerings.
Change in ownership or control. Such changes could
trigger recertification by the DoE, re-accreditation, and/o
reauthorization by state agencies.
Administrative capability. The DoE is required to asse
the administrative capability of each institution.
State Regulations
Companies typically have to apply for permission to
operate in each state, although these regulations generally
do not cause much trouble for the companies. Some state
regulations cover online courses that are made available i
their state, even if the company does not have a physical
presence in the state.
Instances of Recent Company-Specific Problems with
Regulations and Selected Stock Reaction
In this section, we describe some of the problems
regulation has caused companies in this space and how
these problems appear to have affected stocks. In some
cases, a mere accusation of running afoul of the rules, let
alone actually violating them, can seem to affect stocks
adversely. Further, if one company is so affected, other
companies in the space can be affected by association.

5/14/2018 Morgan Stanley Education Report - slidepdf.com
http://slidepdf.com/reader/full/morgan-stanley-education-report 26/60
Business Services – October 18, 2004
Please see analyst certification and other important disclosures starting on page 55.
Page 26
Although potential outcomes are largely unclear since in
many instances the suits and investigations are still
pending, worst-case scenarios would include fines,
suspension and/or revocation of Title IV eligibility or thereturn of aid funds. That said, more often than not,
accusations and investigations have, to date, rarely resulted
in significant punitive action. According to industry
experts, those prompted by disgruntled employees in the
form of “wrongful termination” suits are quite common
and often yield immaterial actual conclusions. This is in
part driven by a statute called the “False Claims Act,”
which gives private citizens the authority to file suits on
behalf of the federal government if they suspect fraud has
been committed by a federal contractor or funding
recipient. Should the allegations be proven, the filer can
collect as much as 25% of penalties paid and/or settlement
amounts.
Confirmed Regulatory Violation:
Recruiter compensation. In late 2000, the DoE’s Office
of Inspector General opened an inquiry into the structure
and administration compensation methods of ITT’s student
recruiters at three of its then 67 institutions. DoE
regulations prohibit the provision of commissions or
bonuses as a sole incentive to recruit students. While the
inquiry was pending, all of the company’s schools were
barred from receiving new certifications and from making
substantive changes such as an extension of course
offerings or locations. The institutions were reinstated inJanuary 2002.
Pending Litigation and Investigations:
Student performance and personnel records. In
February 2004, ITT disclosed that the Department of
Justice (DoJ) had obtained a search warrant and related
grand jury subpoenas for 10 of its 77 schools at the time.
Documents concerned rates for placement, retention,
graduation and attendance as well as recruitment and
admission materials, student grades, graduate salaries, and
credit transfer records. The stock dropped 33% following
the announcement. Subsequently, the Texas regional SECand the federal SEC launched inquiries into the DoJ’s
claims.
Shareholder suits. In July 2004, Corinthian College’s
shareholders filed a class action lawsuit charging senior
management with SEC violations related to the
manipulation of student financial aid records. The suit
alleges the company: 1) manipulated aid documents to
boost loan amounts available to students, constituting fraud,
2) used the aforementioned funds to boost its revenues and
stock price, 3) lacked adequate internal controls and, 4)
materially inflated earnings and net income, violating
GAAP. The company’s stock price dropped by nearly50% over the 48 hours following the announcement and
has recovered only moderately since.
Exhibit 31
COCO Shares Lose Nearly 50% on Shareholder Suit
Source: ILX (Ticker: COCO)
Employee-sourced shareholder suits. On December 2,
2003, a former Career Education employee accused the
company of enrollment padding, providing the basis for a
shareholder class action suit in the same month. The
shares lost 28% of their value in one day, closing at $39.
The SEC opened a formal probe into the suit’s allegations
on June 22, 2004, followed by a DoJ investigation that
began September 2, 2004. After a springtime recovery to ahigh of $69 on June 16, the shares dropped 50% during the
course of the summer to a new 52-week low of $34.
Exhibit 32
Shareholder Suit against CECO Snowballs…
Source: ILX (Ticker: CECO)
Financial aid record investigations. In October of 2002,
the California Attorney General initiated an investigation
of ITT, which maintains 11 campuses in California, to
learn if records were falsified. Grade-point averages,
Dec’03: former employee-driven suit filed re:enrollment padding
On July’04:
employee groupexpands to 13
On June’04:SEC startsformal probe
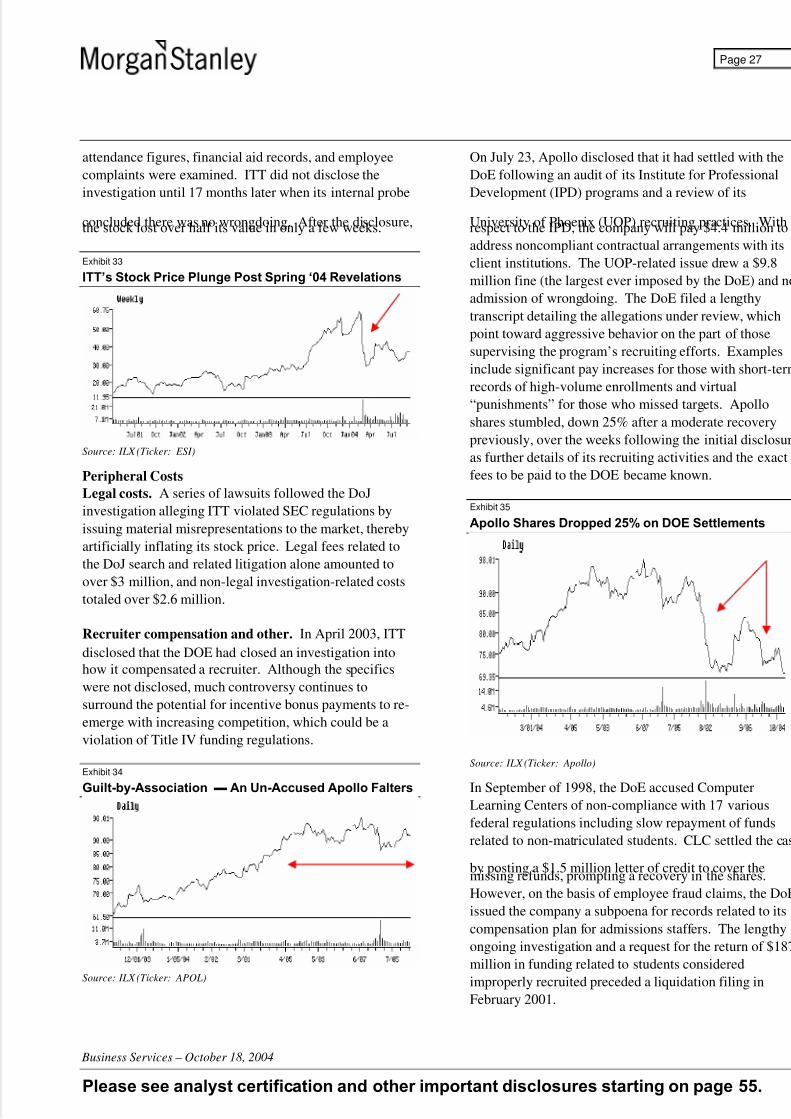
5/14/2018 Morgan Stanley Education Report - slidepdf.com
http://slidepdf.com/reader/full/morgan-stanley-education-report 27/60
Business Services – October 18, 2004
Please see analyst certification and other important disclosures starting on page 55.
Page 27
attendance figures, financial aid records, and employee
complaints were examined. ITT did not disclose the
investigation until 17 months later when its internal probe
concluded there was no wrongdoing. After the disclosure,the stock lost over half its value in only a few weeks.
Exhibit 33
ITT’s Stock Price Plunge Post Spring ‘04 Revelations
Source: ILX (Ticker: ESI)
Peripheral Costs
Legal costs. A series of lawsuits followed the DoJ
investigation alleging ITT violated SEC regulations by
issuing material misrepresentations to the market, thereby
artificially inflating its stock price. Legal fees related to
the DoJ search and related litigation alone amounted to
over $3 million, and non-legal investigation-related costs
totaled over $2.6 million.
Recruiter compensation and other. In April 2003, ITT
disclosed that the DOE had closed an investigation intohow it compensated a recruiter. Although the specifics
were not disclosed, much controversy continues to
surround the potential for incentive bonus payments to re-
emerge with increasing competition, which could be a
violation of Title IV funding regulations.
Exhibit 34
Guilt-by-Association ▬ An Un-Accused Apollo Falters
Source: ILX (Ticker: APOL)
On July 23, Apollo disclosed that it had settled with the
DoE following an audit of its Institute for Professional
Development (IPD) programs and a review of its
University of Phoenix (UOP) recruiting practices. Withrespect to the IPD, the company will pay $4.4 million to
address noncompliant contractual arrangements with its
client institutions. The UOP-related issue drew a $9.8
million fine (the largest ever imposed by the DoE) and no
admission of wrongdoing. The DoE filed a lengthy
transcript detailing the allegations under review, which
point toward aggressive behavior on the part of those
supervising the program’s recruiting efforts. Examples
include significant pay increases for those with short-term
records of high-volume enrollments and virtual
“punishments” for those who missed targets. Apollo
shares stumbled, down 25% after a moderate recovery
previously, over the weeks following the initial disclosur
as further details of its recruiting activities and the exact
fees to be paid to the DOE became known.
Exhibit 35
Apollo Shares Dropped 25% on DOE Settlements
Source: ILX (Ticker: Apollo)
In September of 1998, the DoE accused Computer
Learning Centers of non-compliance with 17 various
federal regulations including slow repayment of funds
related to non-matriculated students. CLC settled the cas
by posting a $1.5 million letter of credit to cover themissing refunds, prompting a recovery in the shares.
However, on the basis of employee fraud claims, the DoE
issued the company a subpoena for records related to its
compensation plan for admissions staffers. The lengthy
ongoing investigation and a request for the return of $187
million in funding related to students considered
improperly recruited preceded a liquidation filing in
February 2001.

5/14/2018 Morgan Stanley Education Report - slidepdf.com
http://slidepdf.com/reader/full/morgan-stanley-education-report 28/60
Business Services – October 18, 2004
Please see analyst certification and other important disclosures starting on page 55.
Page 28
Exhibit 36
CLC Recruiting Violations Bring On Chapter 7…
Source: ILX (Ticker: Apollo)

5/14/2018 Morgan Stanley Education Report - slidepdf.com
http://slidepdf.com/reader/full/morgan-stanley-education-report 29/60
Business Services – October 18, 2004
Please see analyst certification and other important disclosures starting on page 55.
Page 29
Tuition Financing: A Key Growth Driver
The government is by far the largest provider of financial
aid to postsecondary students, providing perhaps 70% of direct student aid, or about $50 billion. Total student aid is
at least $80 billion, and this has more than doubled in the
last decade. However, it is not clear whether the
government is willing to increase funding at a sufficiently
high rate to match rising tuition/room-and-board expenses
(especially given rising deficits and national security
priorities). Also, tuition costs continue to grow much faster
than household income. Therefore, the outlook for
government, as well as private sector, sources of funding for
students is a critical enabler of growth for the education
sector, and the for-profits in particular. Students at for-
profits (about 25% of them get all of their funding fromgovernment loans) are more dependent on loans than are
students at traditional schools.
Evolution of Financial Aid
The existence of private and institutional financial support
for college education predates the emergence of federal and
state assistance. The cornerstone for the current federal and
state aid programs was laid with the passage of Higher
Education Act in 1965, which established a guaranteed loan
program that has grown into the biggest single source of
financial aid.
Exhibit 37
Milestones in Evolution of Financial Aid Year Commentary
1944 Serviceman’s Readjustment Act (GI Bill). World War II
veterans had their tuition paid, and received monthly
subsistence support
1950 First evidence of need-based financial support. Previously,
academic achievement and promise used to be the pr imary
decision factors
1954 College Scholarship Service (CSS) was formed
1958 National Defence Student Loan (Perkins) Program which
provided Federal matching funds
1964 College Work-Study Program that authorized funds to
institutions which matched 20% of the allocated Federal funds
1965 Title IV guaranteed loans launched. Education OpportunityGrants (now known as Supplemental Educational Opportunity
Grants) under the Higher Education Act (HEA)
1972 Reauthorization of HEA. A Basic Grants Program was
added, and the State Student Incentive Grant Program was launched. Sallie Mae was created to facilitate state loans.
1992 Reauthorization of HEA. Limits under Stafford loan program
were raised.
1993 Federal Direct Loan program was established
Source: Morgan Stanley, College Board
Financial aid can be divided into three main buckets — 1)
grants and/or merit-based scholarships that do not have tobe repaid, 2) work-study that requires some form of campu
work in exchange for aid, and 3) loans that have to repaid.
Exhibit 38
2002-03 Financial Aid for Postsecondary Education
= $105 Billion
Pell Grant
11%State sponsored
Loans
1%
Private Loans
7%
Institutional/ Other
Grant
19%
Federal Loans
47%
Federal Grants
4%
State Grant
5%
Tax Credit
5%
Work-study
1%
Source: College Board, Morgan Stanley
Grants
In the 2002-03 period, grants constituted 40% of the total
financial aid available to students. If tax credits are
included under the broader definition of grants (since they
do not have to be repaid), the percentage contribution rises
to 45%. Since 1996-97, grants as a percentage of total
financial aid have increased, but are still below the level o
a decade ago. The loan-to-grant ratio is higher for
undergraduate students, who use three times as much loan
aid as grant aid. Grants are administered at the federal, sta
and institutional level.
The grants supported by the federal government include:
Pell Grants. These are the most popular form of federal
grants, and are usually awarded to undergraduate studentswho have not earned a bachelor’s or professional degree.
During 2002-03, 4.8 million students received Pell Grants
up 11% YoY, with an average award of $2,420 per
applicant. The maximum award was raised by $50 to
$4,050 for 2003-04 period. The rate of increase in Pell
Grants has not kept pace with surging education costs. Th
College Board calculates that Pell Grants covered less than
25% of tuition, fees, and room and board expenses at a

5/14/2018 Morgan Stanley Education Report - slidepdf.com
http://slidepdf.com/reader/full/morgan-stanley-education-report 30/60
Business Services – October 18, 2004
Please see analyst certification and other important disclosures starting on page 55.
Page 30
public four-year institution in 2002-03. This percentage has
steadily fallen from a peak of almost 50% in 1975-76.
Federal Supplemental Educational Opportunity Grants(FSEOG). These grants are for undergraduates with
exceptional financial need. The FSEOG program began in
1993, and offers Federal funds up to 75% of the total grant.
The remaining 25% are provided by the participating
institution. The grant is capped at $4,000 per student.
Leveraging Educational Assistance Partnerships
(LEAP). The LEAP program began as the State Student
Inventive Grants in 1972 in 28 states. The current LEAP
program was enacted in 1998 to provide matching federal
funds to support state need-based postsecondary student
grant assistance. Preliminary statistics suggest that the
government had provided $66 million in the 2002-03 period.
State-sponsored grants. Between 1990 and 2000, the
percentage of full-time dependent students receiving state
grants increased from 11% to 18% at public two-year
institutions, and from 14% to 21% at public 4-year
institutions. State grants increased by 10% to $5.6 billion in
2002-03, and have more than doubled in the past decade.
Many of the states have initiated merit-based grants, so
students who do not qualify for need-based aid have begun
to receive state grants. In the past ten years, the proportion
of merit-based state grants has increased from 10% to 24%.
Institutional grant. In 2002-03, institutional grants totaled
$20 billion, representing half of all the grant aid available to
students. Institutions use “discounted tuitions” to ensure
steady numbers of enrollments, and to attract bright
candidates, suggesting that these grants are not always
need-based. At public 4-year colleges and universities,
almost a quarter of the students receive institutional grants.
Tax credits. We can consider federal tax credits to be
another for of financial aid. The Tax Reform Act of 1997
added several new education credits, including the Hope
Scholarship Credit of up to $1,500 per year. Also, theLifetime Learning Credit provides up to $2,000 per year.
The act also provided for deduction of interest on
education-related loans, and also created limited education
IRAs. The Tax Relief Act of 2001 provided more
incentives, including expanded IRAs (Education Savings
Accounts), employer assistance, and additional loan interest
deductions.
Federal Work Study
Federal Work-Study (FWS) provides part-time jobs for
undergraduate and graduate students with financial need.
The program encourages community service work and work related to the recipient’s course of study. Under this
program, the DoE provides funds to participating
institutions to cover 75% of the salaries of the
undergraduate and graduate students working part-time.
The amount of loans offered under FWS was about $1.2
billion in the 2002-03 academic year.
Government Sponsored Loan Programs
In the 2002-03 academic year, federal guaranteed loans
accounted for 47% of all the financial aid available for
postsecondary education. These loans are critical from the
perspective of the institutions involved. In 1999-2000, 44%
of all full-time dependent undergraduates or their parents
borrowed from non-family sources to help pay for their
education, with 43% borrowing through one or more of the
federal loan programs. The College Board estimates that
$49 billion was given out under the Federal loan program in
the 2002-03 period.
There are three main types of Federal sponsored loans:
Federal Family Education Loan Program (FFEL). This
is a public-private partnership created by Congress in 1965
to deliver and administer guaranteed education loans for
students and their parents. Under FFEL, private lenderssuch as banks, credit unions, and savings and loan
associations usually make the loans, which are guaranteed
by the federal government.
The FFEL program can be divided into two main buckets:
1) Stafford Loans, and 2) PLUS Loans.
The Stafford loans can be subsidized or unsubsidized by the
federal government, and the interest rate is capped at 8.25%.
Previously, only students demonstrating financial need
could borrow through the Stafford program. These loans
were subsidized, meaning that the government paid theinterest while the student was in school. The unsubsidized
Stafford loan program was open to all full-time dependent
students. The maximum loan amount offered under the
Stafford programs is $23,000.
The PLUS Loan program provides loans to parents to help
them pay the education expenses of a child who is a
dependent student enrolled at least half time in an eligible
program. The amount under a PLUS loan is capped at the

5/14/2018 Morgan Stanley Education Report - slidepdf.com
http://slidepdf.com/reader/full/morgan-stanley-education-report 31/60
Business Services – October 18, 2004
Please see analyst certification and other important disclosures starting on page 55.
Page 31
cost of attendance minus any other financial aid received by
the student.
Separately, the state governments started sponsoring loansin 1995-96 but the total amount disbursed is fairly small,
only about 1% of the total financial aid available to students
in 2002-03 (see Exhibit 38) There has been talk recently of
expanding direct government lending, but this is a
politically sensitive issue because many banks profit from
the current system.
Ford Federal Direct Student Loans (FDSL). Under the
Direct Loan program, the government provides the capital
for the loans. The FDSL program commenced in 1994,
providing 7% of the total new loan volume (FFEL and
FDSL combined), and that percentage had increased to
about 27% by F2003. The government’s ability to borrow
funds at relatively low interest rates, and its ability to
contract for low-cost loan servicing make the Direct Loan
program less expensive than the subsidies paid to lenders
and guaranty agencies in the FFEL program. The types of
loans offered under the Direct Loan program are similar to
those under the FFEL, with the same terms and conditions.
Perkins Loan. A Federal Perkins Loans is a low-interest
(5%) loan for both undergraduate and graduate students
with financial need, offered at 2,000 participating
postsecondary institutions. The Perkins program is
structured as a revolving fund, and had assets of $7.2 billionin F2000, according to the DoE. After the reauthorization
of the HEA in 1998, undergraduates can borrow $4,000, and
graduate and professional students can borrow up to $6,000
per year.
Institutional financial aid administrators at participating
institutions have substantial flexibility in determining the
amount of Perkins loans to award to students. Under the
funding formula, funds are distributed to institutions first,
on the basis of the institution’s base guarantee plus the pro
rata share received during the 1999-2000 award year under
the Perkins Loan Program and, then, on the basis of theaggregate need of the eligible students in attendance.
Institutions must contribute 25% of the funding.
Exhibit 39
Funding Under Various Federal Loan Programs($, billions) 1992-93 2000-01 2001-02 2002-03
FFEL 12.5 27.1 30.4 34.6
FDL NA 10.9 11.4 13.1
Perkins 0.9 1.1 1.2 1.3
Source: College Board
Outlook for Federal Funding
The federal funding cycle is an annual process that include
the earmarking of first authorized funds in variations on th
Higher Education Act but also, perhaps as important,proposals for regulation modifications that can have a
material impact on the for-profit industry’s market
opportunity.
As of publication time, the legislation required to fund
federal financial aid programs, the Expanding Opportuniti
in Higher Education Act (H.R. 3039) for the beginning of
the Federal government’s 2005 fiscal year this fall, is still
pending in the US Congress. Industry expectations are tha
final consideration will most likely not take place until nex
early 2005 (leaving the fall of CY04 funded at FY04 level
in the interim) although there is a small possibility for late
2004. In addition to requesting nearly $57.3 billion for
2005 in loan funding, in line with White House
recommendations (and up from $55.7 billion in 2004), the
bill specifies a delineation between online and merely
correspondence programs, meant to exclude the latter from
qualification. The bill includes a proposal to modestly
increase the maximum loan amounts for first- and second-
year students, although this very expensive provision may
get eliminated.
Although not yet currently addressed in the bill, the 50%
rule (which requires qualifying institutions to offer no mor
than half of their coursework online via the DistanceEducation Demonstration Program) is a topic of debate,
with strong support for abolishing or loosening the rule by
House Republicans and corporations.
Though in the very early stages, preliminary memos out o
the administration’s Office of Management and Budget
(OMB) have suggested that the 2006 DoE budget proposa
could pare back the nearly $1.7 billion increase in 2005 to
just under $0.2 billion. Targeted areas include: Title I sta
grants (by $340 million), the Pell Grant (by $327 million)
Special Education ($309 million) and Vocational Training
(by $26 million.) However, administration representativehave indicated that their initial instructions were only
preliminary guidelines (normal for this time of year) and f
from an actual policy decision. Regardless, the timing for
the most relevant stage of the policymaking process is
unlikely to take shape until well after the election, or
roughly in February of 2005. Also, it is worth noting that
similar indications of budget cuts have emerged in prior
early administration planning periods during President

5/14/2018 Morgan Stanley Education Report - slidepdf.com
http://slidepdf.com/reader/full/morgan-stanley-education-report 32/60
Business Services – October 18, 2004
Please see analyst certification and other important disclosures starting on page 55.
Page 32
George W. Bush’s term that did not materialize in his final
proposals.
Also pending in Congress is the College Access andOpportunity Act of 2004 (HR 4283). The bill aims to
authorize the transfer of credits from non-accredited
programs to qualified institutions. Although, if passed, the
legislation would not directly benefit for-profit schools in a
pecuniary fashion, the legitimization of their non-accredited
programs could accelerate the market shift from not-for-
profit. The prospects for passage are mixed.
Because both parties going into the election appear to
support early and higher education, we believe it is very
likely that the longer-term requirements driven by variables
such as demographic change and skills training will be met
in the interest of maintaining a competitive domestic labor
force.
Non-Federal Loans: Key to Tuition Rate Increases
Private loans are becoming a very important part of
postsecondary education funding because tuition fees are
outpacing the growth in government and institution-
sponsored financial aid. These third-party loans increased
45% in 2002-03 to a level of almost $7 billion, representing
7% of the total financial aid available to postsecondary
students. Since 1995-96, private loans have multiplied six
times, and now represent 13% of the total educational loan
volume.
According to a research report prepared by the Institute of
Higher Education and Policy (IHEP), the number and
diversity of private loan products has increased. IHEP
estimates that the number of private loan products grew
from 79 in March 1997 to 272 in March 2003, an increase
of 244%. Of the 272 products, 67 were available to
undergraduates, 113 were available to graduate and
professional students, and 92 were available to both groups
of students.
Exhibit 40Lenders with Most Private Loan Products, March 2003Lender Number of Financial Products
Northstar 15
Southwest Student Service Corporation 14
Key Bank 12
Student Loan Xpress 12
Access Group 11
Fleet 11
Nellie Mae 11
Bank One 10
Source: Institute of Higher Education Policy, July 2003
Sallie Mae (or SLM Corporation) is the nation’s leading
source of funding and servicing support for education loans,
and is the largest corporate player in the successful
private/public partnership established to finance college forAmerican families. The company was founded in 1973 and
provides federally guaranteed student loans originated under
the Federal Family Education Loan Program. Since its birth,
Sallie Mae has expanded its role from a secondary market
for student loans to other aspects of the student loan life
cycle, such as default aversion and collections. The
company serves more than 7 million borrowers, and
manages about $90 billion in student loans.
Private loans may be key to sustain the steady rate of
increase in tuition fees. Over the 1977-2004 period,
tuition, fees, and room and board charges (TFRB) have
increased 115% at private four-year institutions, and 75% at
public four-year institutions (on an inflation-adjusted basis).
Exhibit 41
Indexed Growth in Aid versus Tuition Fees (TFRB)
50%
70%
90%
110%
130%
150%
170%
190%
210%
230%
250%
83-
84
84-
85
85-
86
86-
87
87-
88
88-
89
89-
90
90-
91
91-
92
92-
93
93-
94
94-
95
95-
96
96-
97
97-
98
98-
99
99-
00
00-
01
01-
02
02-
03
Federal A id TFRB for 4 -yea r Pvt TFRB for 4 -yea r Pub
Source: College Board
More importantly, the “net price” of the TFRB after average
grants per student has increased from $4,778 in 1992-93 to
$5,418 in 2002-03 (in constant dollar terms).
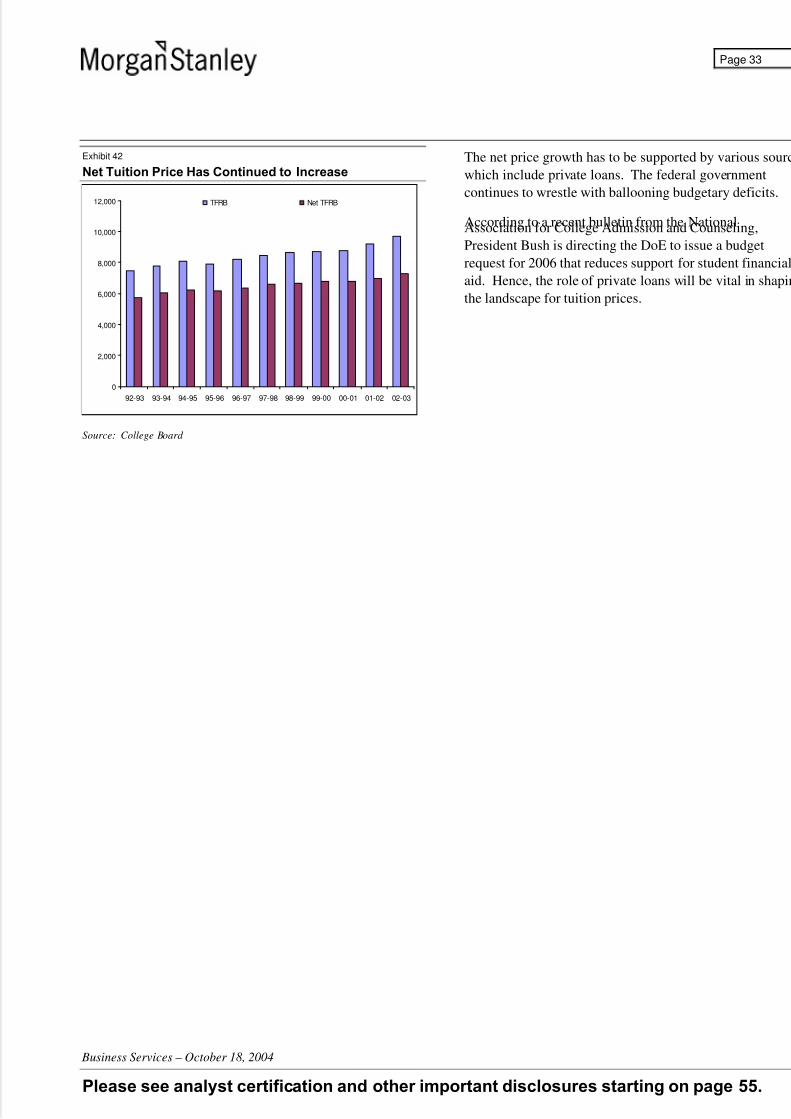
5/14/2018 Morgan Stanley Education Report - slidepdf.com
http://slidepdf.com/reader/full/morgan-stanley-education-report 33/60
Business Services – October 18, 2004
Please see analyst certification and other important disclosures starting on page 55.
Page 33
Exhibit 42
Net Tuition Price Has Continued to Increase
0
2,000
4,000
6,000
8,000
10,000
12,000
92-93 93-94 94-95 95-96 96-97 97-98 98-99 99-00 00-01 01-02 02-03
TFRB Net TFRB
Source: College Board
The net price growth has to be supported by various sourc
which include private loans. The federal government
continues to wrestle with ballooning budgetary deficits.
According to a recent bulletin from the NationalAssociation for College Admission and Counseling,
President Bush is directing the DoE to issue a budget
request for 2006 that reduces support for student financial
aid. Hence, the role of private loans will be vital in shapin
the landscape for tuition prices.
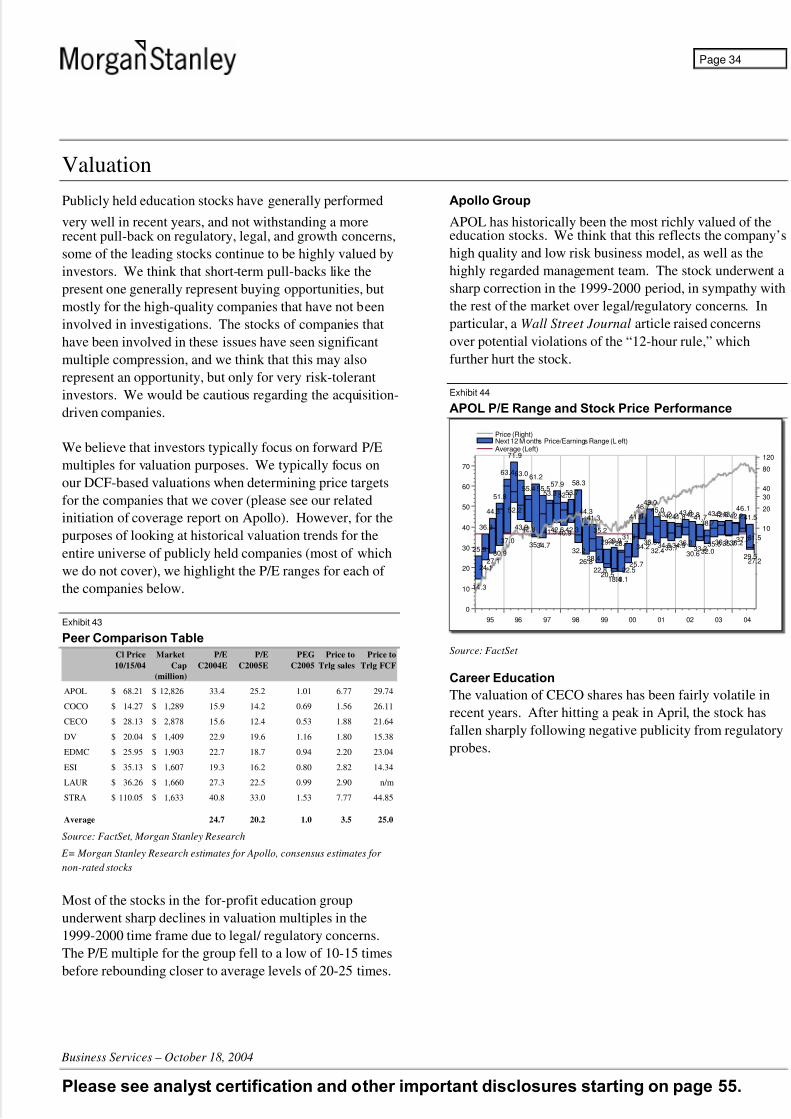
5/14/2018 Morgan Stanley Education Report - slidepdf.com
http://slidepdf.com/reader/full/morgan-stanley-education-report 34/60
Business Services – October 18, 2004
Please see analyst certification and other important disclosures starting on page 55.
Page 34
Valuation
Publicly held education stocks have generally performed
very well in recent years, and not withstanding a morerecent pull-back on regulatory, legal, and growth concerns,
some of the leading stocks continue to be highly valued by
investors. We think that short-term pull-backs like the
present one generally represent buying opportunities, but
mostly for the high-quality companies that have not been
involved in investigations. The stocks of companies that
have been involved in these issues have seen significant
multiple compression, and we think that this may also
represent an opportunity, but only for very risk-tolerant
investors. We would be cautious regarding the acquisition-
driven companies.
We believe that investors typically focus on forward P/E
multiples for valuation purposes. We typically focus on
our DCF-based valuations when determining price targets
for the companies that we cover (please see our related
initiation of coverage report on Apollo). However, for the
purposes of looking at historical valuation trends for the
entire universe of publicly held companies (most of which
we do not cover), we highlight the P/E ranges for each of
the companies below.
Exhibit 43
Peer Comparison TableCl Price Market P/E P/E PEG Price to Price to
10/15/04 Cap C2004E C2005E C2005 Trlg sales Trlg FCF
(million)
APOL 68.21$ 12,826$ 33.4 25.2 1.01 6.77 29.74
COCO 14.27$ 1,289$ 15.9 14.2 0.69 1.56 26.11
CECO 28.13$ 2,878$ 15.6 12.4 0.53 1.88 21.64
DV 20.04$ 1,409$ 22.9 19.6 1.16 1.80 15.38
EDMC 25.95$ 1,903$ 22.7 18.7 0.94 2.20 23.04
ESI 35.13$ 1,607$ 19.3 16.2 0.80 2.82 14.34
LAUR 36.26$ 1,660$ 27.3 22.5 0.99 2.90 n/m
STRA 110.05$ 1,633$ 40.8 33.0 1.53 7.77 44.85
Average 24.7 20.2 1.0 3.5 25.0
Source: FactSet, Morgan Stanley Research
E= Morgan Stanley Research estimates for Apollo, consensus estimates for
non-rated stocks
Most of the stocks in the for-profit education group
underwent sharp declines in valuation multiples in the
1999-2000 time frame due to legal/ regulatory concerns.
The P/E multiple for the group fell to a low of 10-15 times
before rebounding closer to average levels of 20-25 times.
Apollo Group
APOL has historically been the most richly valued of theeducation stocks. We think that this reflects the company’s
high quality and low risk business model, as well as the
highly regarded management team. The stock underwent a
sharp correction in the 1999-2000 period, in sympathy with
the rest of the market over legal/regulatory concerns. In
particular, a Wall Street Journal article raised concerns
over potential violations of the “12-hour rule,” which
further hurt the stock.
Exhibit 44
APOL P/E Range and Stock Price Performance
95 96 97 98 99 00 01 02 03 04
0
10
20
30
40
50
60
70
10
20
3040
80
120
25.9
14.3
36.9
24.1
44.3
27.1
51.8
30.9
63.4
37.0
71.9
52.2
63.0
43.9
55.4
42.8
61.2
35.1
55.5
34.7
53.3
41.5
57.9
42.6
52.5
40.9
53.7
42.3
58.3
32.2
44.3
26.8
41.3
28.4
35.2
22.8
29.4
20.5
29.9
18.4
28.7
18.1
31.9
22.5
41.9
25.7
46.7
34.2
49.0
36.5
45.0
32.4
43.2
34.8
42.2
33.7
41.8
34.9
43.8
36.2
42.8
30.6
41.7
33.2
38.7
32.0
43.5
35.6
42.8
36.3
43.1
35.7
42.2
36.2
46.1
37.7
41.5
29.5
31.5
27.2
Price (Right)Next 12 M onths Price/Earnings Range (L eft)Average (Left)
Source: FactSet
Career Education
The valuation of CECO shares has been fairly volatile in
recent years. After hitting a peak in April, the stock has
fallen sharply following negative publicity from regulatory
probes.

5/14/2018 Morgan Stanley Education Report - slidepdf.com
http://slidepdf.com/reader/full/morgan-stanley-education-report 35/60
Business Services – October 18, 2004
Please see analyst certification and other important disclosures starting on page 55.
Page 35
Exhibit 45
CECO P/E Range and Stock Price Performance
98 99 00 01 02 03 04
15
20
25
30
35
40
5
10
15
20
40
60
80
30.0
26.9
34.9
27.3
32.0
19.7
30.9
15.7
33.8
25.7
33.5
23.9
27.1
17.0
24.9
15.9
24.4
17.5
23.7
15.4
38.2
23.2
38.4
21.6
36.4
23.9
36.7
29.3
39.1
23.6
36.0
24.4
32.6
27.9
34.3
29.6
32.1
22.8
32.6
21.9
26.9
21.6
32.3
25.4
39.8
31.5
40.2
21.9
34.5
26.9
37.6
20.5
23.2
12.7
13.8
12.2
Price (Right)Next 12 Months Price/Earnings Range (Left)
Average (Left)
Source: FactSet
Corinthian College
Like the other stocks in the sector, COC came under
pressure in 1999 and early 2000 following regulatory and
legal concerns. More recently, there have been company-
specific regulatory and legal issues, and a very sharp
decline in the shares.
Exhibit 46
COCO P/E Range and Stock Price Performance
99 00 01 02 03 04
0
5
10
15
20
25
30
35
5
10
15
20
25303540
27.0
22.6
23.6
12.8
20.8
12.2
17.8
12.6
20.1
10.2
15.1
9.9
29.5
18.7
35.7
22.4
35.8
24.7
36.0
24.6
36.0
15.5
25.3
19.2
28.0
22.5
33.9
25.8
31.9
21.9
31.8
23.7
27.5
22.0
28.9
24.0
32.2
26.8
31.6
23.9
29.3
24.3
30.1
16.4
19.6
8.6
15.0
14.0
Price (Right)Next 12 Months Price/Earnings Range (Left)Average (Left)
Source: FactSet
Education Management
Education Management underwent multiple compressionin late 1999, in sync with the whole industry, but has been
relatively more stable in the past two years. EDMC shares
are trading at the top end of the industry valuation range
(excluding APOL). The company has been relatively less
affected by legal issues, and the diversity of its programs
provides a stable outlook for growth in enrollments.
Exhibit 47
EDMC P/E Range and Stock Price Performance
96 97 98 99 00 01 02 03 04
0
5
10
15
20
25
30
35
40
45
5
1
1
2
2
3
3
28.7
24.7
29.9
23.9
34.0
26.7
32.4
28.1
32.3
25.3
35.0
27.3
34.2
28.9
34.3
24.5
38.4
26.0
46.4
34.0
44.9
20.6
29.6
16.2
18.7
11.2
18.3
12.5
22.1
16.5
31.1
19.6
39.6
24.6
37.9
24.3
37.2
26.9
36.4
19.6
32.8
24.5
31.2
26.1
32.2
25.9
29.5
25.7
30.3
20.4
24.2
20.0
29.0
22.5
32.8
28.0
33.0
26.6
31.9
24.9
30.7
24.3
26.8
18.0
20.8
19.2
Price (Right)Next 12 Months Price/Earnings Range (Left)
Average (Left)
Source: FactSet
ITT Educational Services
ESI experienced weakness in 2002 as demand for
technology education declined, and after a brief recovery
in late 2003, the stock has corrected, and is trading closer
to average levels.
Exhibit 48
ESI P/E Range and Stock Price Performance
95 96 97 98 99 00 01 02 03 04
0
5
10
15
20
25
30
35
40
45
5
1
1
2
4
6
14.9
10.7
17.8
12.9
19.9
15.8
22.5
17.2
30.6
22.4
42.7
30.0
43.4
30.9
43.5
29.0
40.3
29.9
32.6
26.5
34.7
24.0
31.5
24.7
31.9
24.9
36.0
26.3
34.6
26.5
35.1
23.7
38.7
29.8
36.2
18.2
25.6
13.7
21.3
12.8
16.3
9.1
19.4
12.5
22.3
13.8
21.7
10.4
24.2
13.8
29.9
16.9
30.6
16.4
25.1
19.1
26.6
20.8
29.2
22.7
23.3
15.2
23.9
14.5
25.1
19.7
26.2
20.9
35.5
22.6
38.3
29.9
36.8
16.6
24.1
18.3
20.4
13.9
17.8
16.9
Price (Right)Next 12 Months Price/Earnings Range (Left)Average (Left)
Source: FactSet
Laureate Education
Compared to the rest of the group, LAUR (and its
predecessor Sylvan Leaning Systems) has held relativelysteady. Laureate faces much less regulatory scrutiny as i
derives less than 5% of its revenues from Title IV funds.
The company has broader international exposure compar
to its peers.

5/14/2018 Morgan Stanley Education Report - slidepdf.com
http://slidepdf.com/reader/full/morgan-stanley-education-report 36/60
Business Services – October 18, 2004
Please see analyst certification and other important disclosures starting on page 55.
Page 36
Exhibit 49
LAUR P/E Range and Stock Price Performance
94 95 96 97 98 99 00 01 02 03 04
0
5
10
15
20
25
30
35
40
5
10
15
20
25
30
354040.4
28.1
42.6
27.0
35.6
26.3
38.3
26.9
32.5
22.7
26.3
21.8
36.7
25.2
33.9
24.3
42.0
29.3
38.8
28.8
33.1
24.4
39.8
27.6
40.3
24.6
34.8
24.0
37.7
29.8
39.0
30.3
35.3
25.0
36.9
28.9
36.4
19.0
28.7
15.9
28.7
20.3
23.2
15.3
21.1
10.7
13.4
7.6
34.2
8.8
39.8
26.5
33.9
24.3
32.7
24.6
36.9
28.2
36.2
23.3
39.0
26.9
35.7
22.5
30.7
24.1
29.5
18.9
19.2
10.8
16.8
8.6
17.0
10.0
24.3
15.2
27.6
22.4
27.5
21.9
27.0
22.0
28.6
23.6
26.9
20.4
24.8
23.2
Price (Right)Next 12 Months Price/Earnings Range (Left)
Average (Left)
Source: FactSet
Strayer Education
STRA’s multiples have expanded following the change of
ownership in May 2001. The company has delivered
impressive growth in revenues, and expanded its
geographic presence into the states of Tennessee,
Pennsylvania, and North Carolina. The growth outlook for
Strayer should be helped by the smaller size of its revenue
base.
Exhibit 50
STRA P/E Range and Stock Price Performance
96 97 98 99 00 01 02 03 04
0
5
10
15
20
25
30
35
40
45
20
40
60
80
100
120140
15.4
15.2
20.9
15.2
24.0
14.8
28.6
14.1
29.5
22.5
35.0
26.3
33.7
26.2
32.2
27.4
30.8
19.3
31.3
19.6
28.2
22.3
26.6
18.1
22.1
13.2
16.5
8.8
22.6
13.3
18.1
13.7
17.3
13.5
17.5
11.2
21.9
17.2
29.6
19.8
31.9
21.8
30.2
24.1
29.2
25.6
34.4
26.4
32.8
24.0
30.7
23.0
27.9
23.6
35.4
25.4
42.4
33.4
43.4
37.0
43.9
37.3
44.8
35.1
38.4
27.4
37.1
33.9
Price (Right)Next 12 M onths Price/Earnings Range (L eft)
Average (Left)
Source: FactSet
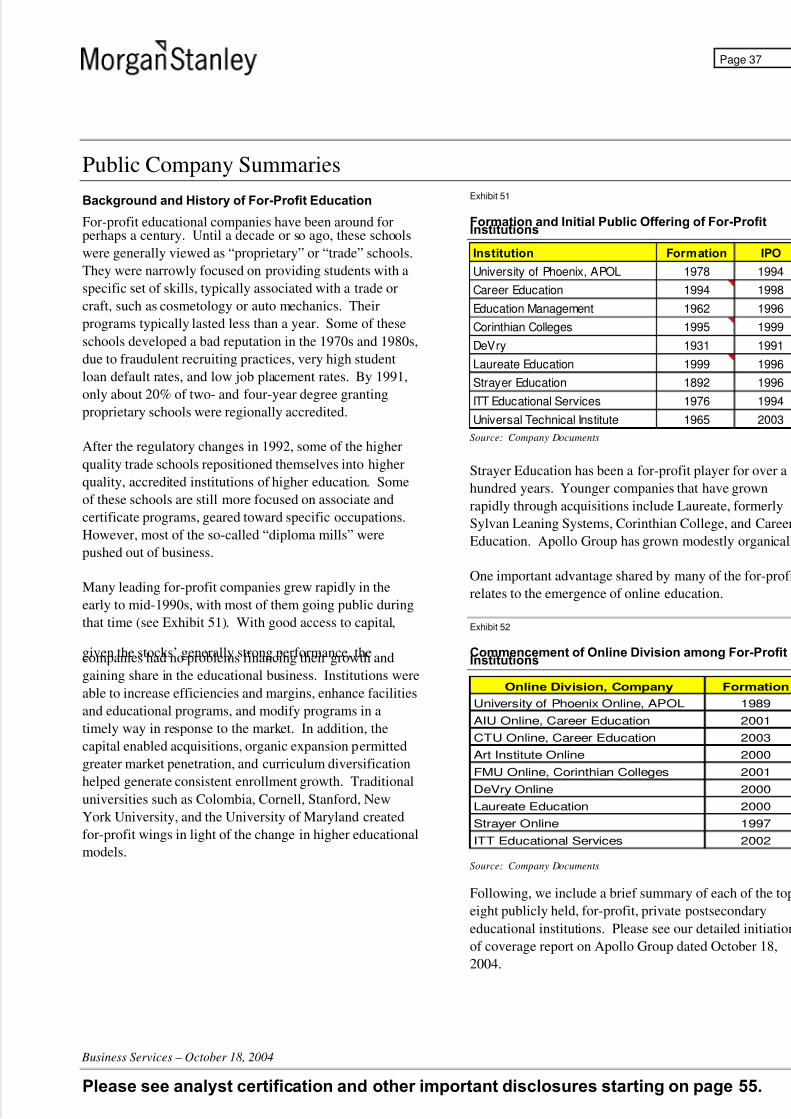
5/14/2018 Morgan Stanley Education Report - slidepdf.com
http://slidepdf.com/reader/full/morgan-stanley-education-report 37/60
Business Services – October 18, 2004
Please see analyst certification and other important disclosures starting on page 55.
Page 37
Public Company Summaries
Background and History of For-Profit Education
For-profit educational companies have been around forperhaps a century. Until a decade or so ago, these schools
were generally viewed as “proprietary” or “trade” schools.
They were narrowly focused on providing students with a
specific set of skills, typically associated with a trade or
craft, such as cosmetology or auto mechanics. Their
programs typically lasted less than a year. Some of these
schools developed a bad reputation in the 1970s and 1980s,
due to fraudulent recruiting practices, very high student
loan default rates, and low job placement rates. By 1991,
only about 20% of two- and four-year degree granting
proprietary schools were regionally accredited.
After the regulatory changes in 1992, some of the higher
quality trade schools repositioned themselves into higher
quality, accredited institutions of higher education. Some
of these schools are still more focused on associate and
certificate programs, geared toward specific occupations.
However, most of the so-called “diploma mills” were
pushed out of business.
Many leading for-profit companies grew rapidly in the
early to mid-1990s, with most of them going public during
that time (see Exhibit 51). With good access to capital,
given the stocks’ generally strong performance, thecompanies had no problems financing their growth and
gaining share in the educational business. Institutions were
able to increase efficiencies and margins, enhance facilities
and educational programs, and modify programs in a
timely way in response to the market. In addition, the
capital enabled acquisitions, organic expansion permitted
greater market penetration, and curriculum diversification
helped generate consistent enrollment growth. Traditional
universities such as Colombia, Cornell, Stanford, New
York University, and the University of Maryland created
for-profit wings in light of the change in higher educational
models.
Exhibit 51
Formation and Initial Public Offering of For-ProfitInstitutions
Institution Formation IPO
University of Phoenix, APOL 1978 1994
Career Education 1994 1998
Education Management 1962 1996
Corinthian Colleges 1995 1999
DeVry 1931 1991
Laureate Education 1999 1996
Strayer Education 1892 1996
ITT Educational Services 1976 1994
Universal Technical Institute 1965 2003
Source: Company Documents
Strayer Education has been a for-profit player for over a
hundred years. Younger companies that have grown
rapidly through acquisitions include Laureate, formerly
Sylvan Leaning Systems, Corinthian College, and Career
Education. Apollo Group has grown modestly organicall
One important advantage shared by many of the for-profi
relates to the emergence of online education.
Exhibit 52
Commencement of Online Division among For-ProfitInstitutions
Online Division, Company Formation
University of Phoenix Online, APOL 1989
AIU Online, Career Education 2001
CTU Online, Career Education 2003
Art Institute Online 2000
FMU Online, Corinthian Colleges 2001
DeVry Online 2000
Laureate Education 2000
Strayer Online 1997
ITT Educational Services 2002
Source: Company Documents
Following, we include a brief summary of each of the top
eight publicly held, for-profit, private postsecondary
educational institutions. Please see our detailed initiation
of coverage report on Apollo Group dated October 18,
2004.

5/14/2018 Morgan Stanley Education Report - slidepdf.com
http://slidepdf.com/reader/full/morgan-stanley-education-report 38/60
Business Services – October 18, 2004
Please see analyst certification and other important disclosures starting on page 55.
Page 38
Apollo Group: Best in Class
Company Overview
Apollo Group’s largest division, University of Phoenix,was formed in 1978, with an IPO in 1994. The company
has relied on organic growth, delivering stellar results that
have consistently exceeded consensus expectations.
Apollo also has facilities in Canada, with expansion plans
for Mexico during F2005. In total, Apollo schools offer 18
degree programs. The company employs over 15,000 full-
time employees, which overlap with 17,000 full and part-
time faculty members and, we estimate, close to 5,000
enrollment counselors.
Exhibit 53
Quick Snapshot
F2004 F2005E Long YoY Change (%) Term
Revenue ($, mn) 1798 30% 25%
EPS $1.82 34% 29%
Enrolments 255,643 24% 21%
Campus Locations 82 10% 8-10%
Composite Score * 3.0 NA NA
% of U.S. Revenues
From Title IV fund** 62% NA NA
E = Morgan Stanley Research Estimates
Source: Company Data, Morgan Stanley
* Composite score is a measure of Financial Responsibility as defined by DoE,
and ranges from -1.0 to 3.0. Apollo figure is for F2003 period
** For University of Phoenix for the F2003 period
Apollo’s schools include the University of Phoenix, the
Institute for Professional Development, the College for
Financial Planning, and Western International University.
Program offerings. The University of Phoenix offers
bachelor’s and master’s degrees in business and bachelor’s
degrees in health care services, criminal justice
administration and nursing, and master’s program in
computer information systems, organizational management.
The biggest concentration of students is in the bachelor’s
program, with average program duration of 2.7 years. Thisprovides good visibility for management, in our view.
Exhibit 54
Mix of Degree Enrolments at Apollo = 255,643
Bachelors
66%
Doctoral
0%Associates
4%
Masters
30%
Source: Company Documents
Growth Strategy
The company’s growth strategy revolves around the
following key areas:
Establish new campus locations and learning centers.
Management said it believes in the first-mover advantage,
and is likely to be aggressive in opening campuses, perhaps
at an accelerated rate of 7-9 locations, for the next couple
of years. The timing of new campus openings aresomewhat affected by regulatory approvals. For instance,
management could exceed the target of 7-9 new campus
opening in F2005 if Apollo gets the regulatory approval it
needs from New York State regulators.
Establish new Institute for Professional Development
(IPD) relationships. IPD plans to enter into additional
long-term contracts with private colleges and universities.
Expand educational programs. The company has a staff
of 55 employees involved in the curriculum development
process. The launch of newer programs is predicated onthe demand for professionals in that area of specialization.
Expand access to programs. Management said it plans to
increase access to the company’s programs through
distance education. The FlexNet initiative should help in
increasing penetration of the company’s programs. At
newer campuses, management said it relies on initiating
tried and tested programs to create traction with students.
As the campus matures, the company opens learning

5/14/2018 Morgan Stanley Education Report - slidepdf.com
http://slidepdf.com/reader/full/morgan-stanley-education-report 39/60
Business Services – October 18, 2004
Please see analyst certification and other important disclosures starting on page 55.
Page 39
centers to further increase its penetration in a particular
market.
International expansion. Apollo is focused on expandingorganically in North America via its Canada and Mexico
operations, while partnering with and potentially acquiring
companies on other continents. In addition to its WIU
joint venture in Asia, the company has a roughly $1
million investment in Apollo International, a joint venture
covering a small campus in the Netherlands. However,
management said the company intends to pursue
partnerships rather than further joint ventures in the future.
Key Regulatory/ Legal Issues
The company recently reached an agreement with the Do
to settle both the Office of Inspector General audit of IPD
client institutions and the University of Phoenix programreview. Among other matters, the program review of UO
revolved around the incentive compensation of enrollmen
advisors. Management decided to settle with the DoE in
the interests of shareholders for $9.8 million, rather than
engage in a protracted review.

5/14/2018 Morgan Stanley Education Report - slidepdf.com
http://slidepdf.com/reader/full/morgan-stanley-education-report 40/60
Business Services – October 18, 2004
Please see analyst certification and other important disclosures starting on page 55.
Page 40
Career Education: Acquisitive Company with Diverse Program Offerings
Company Overview
Career Education is among the fastest-growing companiesin the for-profit, postsecondary, education industry.
However, much of this growth has come through rapid
acquisitions. The company operates 81 college campuses
in the US and International regions, including Canada,
France, the United Kingdom, and the United Arab
Emirates. At the end of July 2004, total student enrollment
at the company’s various subsidiaries was about 81,000,
with over 20% of in the Online Education Group.
Exhibit 55
Quick SnapshotF2003 F2004E Long
YoY Change (%) Term
Revenue ($, mn) 1188 44% 20%+
EPS $1.19 52% 25.0%
Enrolments 83,200
Campus Locations 78
Composite Score * 2.6 NA NA
% of U.S. Revenues
From Title IV fund 58% NA NA
Source: Company Data, Morgan Stanley, E= First Call estimates
* Composite score is a measure of Financial Responsibility as defined by DoE,
and ranges from -1.0 to 3.0
Career Education’s schools include American
InterContinental University (AIU), Colorado TechnicalUniversity, Gibbs College, and the Western School of
Health and Business Careers.
Program offerings: Career Education has a fairly diverse
offering that focuses on visual communications,
information technology, business studies, culinary arts, and
health education. Some of these disciplines may be
somewhat economically sensitive (like IT) but overall, the
consolidated growth in degree enrollments should be
relatively acyclical, in our view.
Exhibit 56
Proportion of Enrollments by Program, 2003
Visual
Communications &
Design
29%
Buiness Studies
33%
Culinary Art 12%
IT
13%
Health
Education
13%
Source: Career Education
Exhibit 57
Proportion of Enrollments by Level, 2003
Bachelor
Programs &
Above , 34%
Associate
Programs, 48%
Certificate
Programs, 18%
Source: Career Education
Growth Strategy: Acquisitions Play a Big Role
The key elements of Career Education’s growth strategy
include:
Continuing organic growth at existing campus locations.
Acquiring additional schools. To date, the company has
grown primarily through acquisitions, which total 26 todate. Career Education’s target schools demonstrate
characteristics that include being the “school of choice,”
marketable curricula, and attractive facilities and
geographic locations.
Opening new branch campuses. Branch locations build
on the presence of existing main campus locations.

5/14/2018 Morgan Stanley Education Report - slidepdf.com
http://slidepdf.com/reader/full/morgan-stanley-education-report 41/60
Business Services – October 18, 2004
Please see analyst certification and other important disclosures starting on page 55.
Page 41
Expanding the Online Education Group (OEG). The
company has two platforms to offer online education —
American InterContinental University Online, and
Colorado Technical University. The OEG segment offers27 degree programs leaving scope for future expansion.
Expanding internationally and recruiting international
students. The company acquired a group of schools in
France in February 2003, and may pursue that strategy to
increase share in International markets.
Multiple Compression Following from Regulatory
Concerns
Career Education’s forward P/E multiple has compressed
from a peak of about 40 times in late 2003 to a current
level of 12 times. In June 2003 US Department of Justice
announced an investigation of potentially inflated
enrollment and revenue inflation. In addition,
management’s guidance for 3Q04 fell slightly short of
analyst expectations.
Outstanding Key Regulatory/ Legal Issues
Accreditation actions: AIU has been placed on
“warning” status by the member colleges of the Southern
Association of Colleges and Schools (SACS). AIU has
until December 2004 to provide additional information o
compliance matters.
Following a review, the Accrediting Commission for
Community and Junior Colleges of the Western
Association of Schools and Colleges (ACCJC) placed the
Brooks College (owned by Career Education) on Probatio
pending a review of its progress by October 15, 2004.
Some of the degree programs offered by the Western
School of Health and Business Careers are under review
the Accrediting Commission of Career Schools and
Colleges of Technology (ACCSCT) for discrepancies in
the documents filed during the accreditation process.
The US Department of Justice is conducting an
investigation concerning the company, although they hav
not specified the context of the investigation.
On June 22, 2004, the SEC escalated a preliminary inquir
into a formal investigation about allegations that Career
Education inflated enrollment numbers to get a larger
portion of Title IV funds.
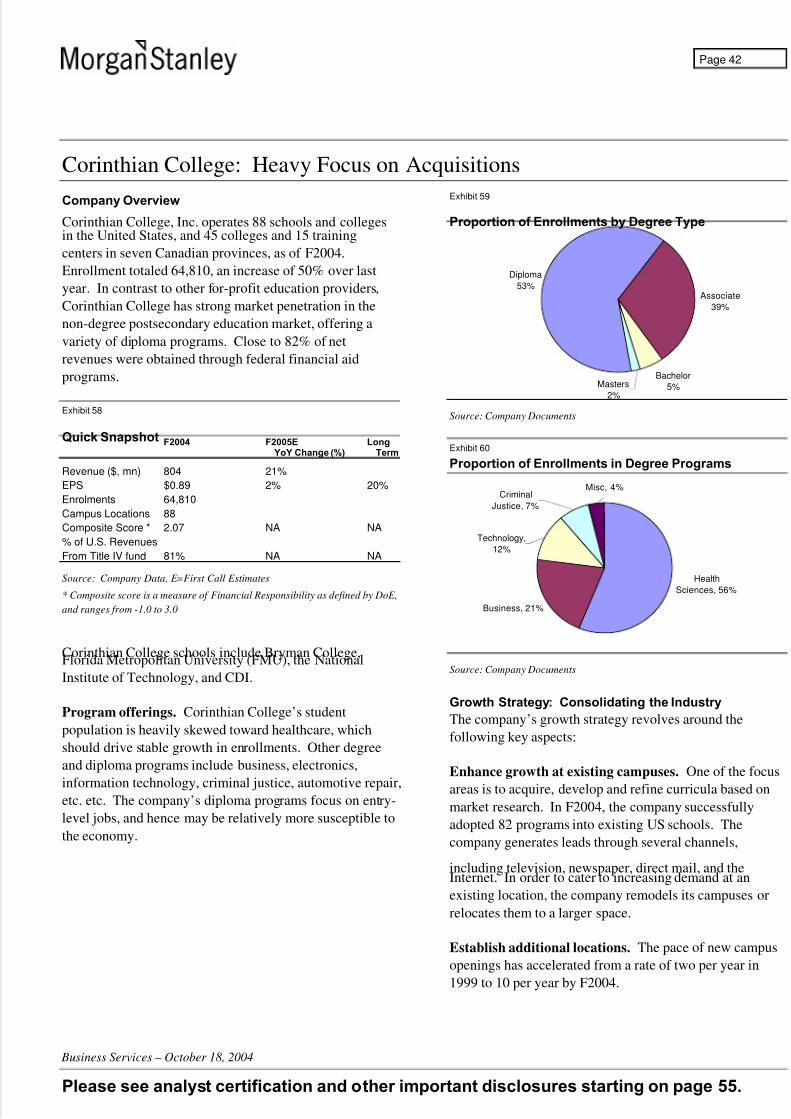
5/14/2018 Morgan Stanley Education Report - slidepdf.com
http://slidepdf.com/reader/full/morgan-stanley-education-report 42/60
Business Services – October 18, 2004
Please see analyst certification and other important disclosures starting on page 55.
Page 42
Corinthian College: Heavy Focus on Acquisitions
Company Overview
Corinthian College, Inc. operates 88 schools and collegesin the United States, and 45 colleges and 15 training
centers in seven Canadian provinces, as of F2004.
Enrollment totaled 64,810, an increase of 50% over last
year. In contrast to other for-profit education providers,
Corinthian College has strong market penetration in the
non-degree postsecondary education market, offering a
variety of diploma programs. Close to 82% of net
revenues were obtained through federal financial aid
programs.
Exhibit 58
Quick Snapshot F2004 F2005E Long YoY Change (%) Term
Revenue ($, mn) 804 21%
EPS $0.89 2% 20%
Enrolments 64,810
Campus Locations 88
Composite Score * 2.07 NA NA
% of U.S. Revenues
From Title IV fund 81% NA NA
Source: Company Data, E=First Call Estimates
* Composite score is a measure of Financial Responsibility as defined by DoE,
and ranges from -1.0 to 3.0
Corinthian College schools include Bryman College,Florida Metropolitan University (FMU), the National
Institute of Technology, and CDI.
Program offerings. Corinthian College’s student
population is heavily skewed toward healthcare, which
should drive stable growth in enrollments. Other degree
and diploma programs include business, electronics,
information technology, criminal justice, automotive repair,
etc. etc. The company’s diploma programs focus on entry-
level jobs, and hence may be relatively more susceptible to
the economy.
Exhibit 59
Proportion of Enrollments by Degree Type
Bachelor
5%
Associate
39%
Diploma
53%
Masters
2%
Source: Company Documents
Exhibit 60
Proportion of Enrollments in Degree Programs
Health
Sciences, 56%
Business, 21%
Technology,
12%
Criminal
Justice, 7%
Misc, 4%
Source: Company Documents
Growth Strategy: Consolidating the Industry
The company’s growth strategy revolves around the
following key aspects:
Enhance growth at existing campuses. One of the focus
areas is to acquire, develop and refine curricula based on
market research. In F2004, the company successfully
adopted 82 programs into existing US schools. The
company generates leads through several channels,
including television, newspaper, direct mail, and theInternet. In order to cater to increasing demand at an
existing location, the company remodels its campuses or
relocates them to a larger space.
Establish additional locations. The pace of new campus
openings has accelerated from a rate of two per year in
1999 to 10 per year by F2004.
5/14/2018 Morgan Stanley Education Report - slidepdf.com
http://slidepdf.com/reader/full/morgan-stanley-education-report 43/60
Business Services – October 18, 2004
Please see analyst certification and other important disclosures starting on page 55.
Page 43
Acquisitions are a key growth driver. Of the 133
campus, and 15 training centers, 105 campuses and all the
training centers have been acquired.
Expand distance learning and corporate training. The
company plans to grow online education by increasing the
number of courses offered, adding to the number of
campuses offering online courses, and expanding the type
of degrees and programs offered online. In the corporate
training market, Corinthian acquired a platform in the
Canadian market with the acquisition of CDI.
Management said it hopes to drive growth in the North
American market using CDI as a base.
Key Issues Facing the Company
• The shift toward Internet-based leads has been bumpy.
The company hopes to shift from costly TV advertising
to cheaper Internet-based leads, which account for 28%
of the total flow of leads in F4Q04. However, the
conversion rate on Internet-based leads has been
weaker than management expectations.
• Attrition increased in F4Q04. Among other factors, the
negative impact of the pending lawsuit against FMU
appeared to hurt the retention in FMU’s online offeri
The company has retained retention specialists to rais
retention levels across the organization.
Outstanding Key Regulatory/Legal Issues
On September 20, 2004, the company revealed that the
SEC is conducting an informal inquiry regarding the
company. The company believes that the inquiry concern
Corinthian’s financial projections, performance and
communications with analysts in F2004.
There are putative class action lawsuits outstanding again
FMU and Rhodes College that have been filed separately
by current and former students. The students allege that
FMU concealed the fact that it is not accredited by SACS
and that FMU credits are not transferable to other
institutions. Plaintiffs are seeking certification of the
lawsuit as class actions.
The California Attorney General is examining some
lawsuits previously settled by the company.

5/14/2018 Morgan Stanley Education Report - slidepdf.com
http://slidepdf.com/reader/full/morgan-stanley-education-report 44/60
Business Services – October 18, 2004
Please see analyst certification and other important disclosures starting on page 55.
Page 44
DeVry: Cyclical Headwinds
Company Overview
DeVry started as a provider of undergraduate program inelectronics in 1931, and introduced a computer information
systems curriculum in 1979. Later in the 1980s, the
company diversified its program offerings to include
business operations and telecom management. The IT
program was launched in 1998 in response to the growing
need for IT professionals. DeVry boasts a strong and
stable management team led by Chairman Dennis J. Keller
and President and CEO Ronald Taylor, both of whom have
been associated with DeVry for more than three decades.
Exhibit 61
Quick Snapshot F2004 F2005E Long YoY Change (%) Term
Revenue ($, mn) 785 6%
EPS $0.82 13% 15%
UG Enrolments 38,306
Grad Enrolments 10,276
% of U.S. Revenues >1.5
From Govt. Aid 60+% NA NA
Source: Company Data, E=First Call Estimates
* Composite score is a measure of Financial Responsibility as defined by DoE,
and ranges from -1.0 to 3.0
Devry’s schools include DeVry University,(including the
Keller Graduate School of Management), the BeckerConviser Professional Review, and Ross University.
Program offerings. Programs include medical and
veterinary medical education, computer technology,
electronics, business and medical technology, business
administration with concentrations like e-commerce,
operations management, and business information systems.
For graduate students, the Keller School of Management
offers an MBA and Masters’ degrees in Project
Management, Human Resources, Telecom Management,
and Accounting and Financial Management.
Clearly, DeVry’s enrollments are leveraged to the hiring
trends in the technology area, which have been fairly weak
in this recession.
Attempts to Diversify Program Enrollments Are a
Positive
At the start of F2004, DeVry University introduced three
new undergraduate programs — Biomedical Engineering
Technology (offered at four campuses), Biomedical
Informatics (offered at six campuses), and Health
Information Technology (offered at three campuses). The
ensuing shift toward more healthcare programs is apositive for the company, although technology is likely to
account for a majority of the student enrollments for the
next few years.
Online Strategy
DeVry launched its online delivery initiative in F2001 to
offer a “mix-and-match” format combining campus with
online education, with the intent of adding convenience
and flexibility. The Bachelor of Business Administration
degree program was the first undergraduate DeVry
program to be offered in a fully online format. In F2005
and beyond, the company plans to offer newconcentrations in security management and hospitality
management as a part of its online bachelor’s degree
program in business administration.
Operating Strategy for the Three Main Divisions
DeVry University: The key elements of the long-term
strategy include:
• Invigorate growth in enrollment through targeted
marketing of high school students, and an enhanced
student recruiting process.
• Re-engineer some of the programs to increase student
appeal.
• Open six to eight DeVry University Centers (DVUC)
per year.
• Extend daytime undergraduate programs to DVUC.
• Also grow the Level II center model, which can support
1,500 students without being anchored to a campus.
• Grow the online business, and focus on the hybrid
model.
Ross University: Management plans to increase faculty
and facilities to sustain the current momentum in the
business. The company is in the process of building a
2,500-seat lecture hall in F2005.
Becker Professional Review. The demand for entry-level
accountants is fairly strong, and is a key driver of growth
for this division. Further, management plans to capitalize

5/14/2018 Morgan Stanley Education Report - slidepdf.com
http://slidepdf.com/reader/full/morgan-stanley-education-report 45/60
Business Services – October 18, 2004
Please see analyst certification and other important disclosures starting on page 55.
Page 45
on the all-time low pass rates in the CFA exams to foster
demand for the Stalla review course.
Outstanding Key Regulatory/Legal Issues
We believe there are no significant regulatory issues facing
DeVry presently, although there is a patent-infringement
notice filed by Acacia Research Corporation alleging
DeVry infringed upon Acacia’s streaming audio and video
patents .
Separately, in June 2004, the company received
notification from the US DoE that the company’s
“financial responsibility” yielded a composite score of 1.4
for the year ended June 2003. This falls below thethreshold of 1.5 necessary to qualify for Title IV funding
As such, the DoE required DeVry to make financial aid
disbursements under a “cash monitoring” mode. The
company believes that the composite score exceeds 1.5 fo
the year ended June 2004.
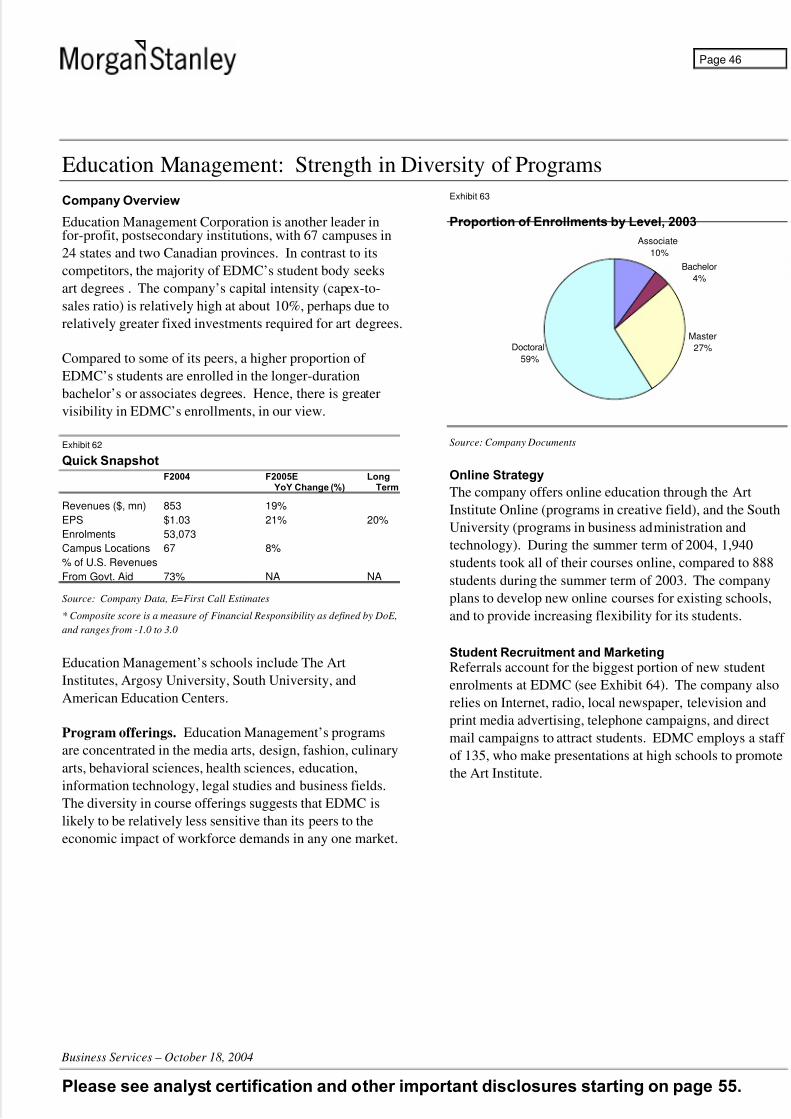
5/14/2018 Morgan Stanley Education Report - slidepdf.com
http://slidepdf.com/reader/full/morgan-stanley-education-report 46/60
Business Services – October 18, 2004
Please see analyst certification and other important disclosures starting on page 55.
Page 46
Education Management: Strength in Diversity of Programs
Company Overview
Education Management Corporation is another leader infor-profit, postsecondary institutions, with 67 campuses in
24 states and two Canadian provinces. In contrast to its
competitors, the majority of EDMC’s student body seeks
art degrees . The company’s capital intensity (capex-to-
sales ratio) is relatively high at about 10%, perhaps due to
relatively greater fixed investments required for art degrees.
Compared to some of its peers, a higher proportion of
EDMC’s students are enrolled in the longer-duration
bachelor’s or associates degrees. Hence, there is greater
visibility in EDMC’s enrollments, in our view.
Exhibit 62
Quick SnapshotF2004 F2005E Long
YoY Change (%) Term
Revenues ($, mn) 853 19%
EPS $1.03 21% 20%
Enrolments 53,073
Campus Locations 67 8%
% of U.S. Revenues
From Govt. Aid 73% NA NA
Source: Company Data, E=First Call Estimates
* Composite score is a measure of Financial Responsibility as defined by DoE,
and ranges from -1.0 to 3.0
Education Management’s schools include The Art
Institutes, Argosy University, South University, and
American Education Centers.
Program offerings. Education Management’s programs
are concentrated in the media arts, design, fashion, culinary
arts, behavioral sciences, health sciences, education,
information technology, legal studies and business fields.
The diversity in course offerings suggests that EDMC is
likely to be relatively less sensitive than its peers to the
economic impact of workforce demands in any one market.
Exhibit 63
Proportion of Enrollments by Level, 2003
Master
27%
Bachelor
4%
Associate
10%
Doctoral
59%
Source: Company Documents
Online Strategy
The company offers online education through the Art
Institute Online (programs in creative field), and the South
University (programs in business administration and
technology). During the summer term of 2004, 1,940
students took all of their courses online, compared to 888
students during the summer term of 2003. The company
plans to develop new online courses for existing schools,
and to provide increasing flexibility for its students.
Student Recruitment and MarketingReferrals account for the biggest portion of new student
enrolments at EDMC (see Exhibit 64). The company also
relies on Internet, radio, local newspaper, television and
print media advertising, telephone campaigns, and direct
mail campaigns to attract students. EDMC employs a staff
of 135, who make presentations at high schools to promote
the Art Institute.
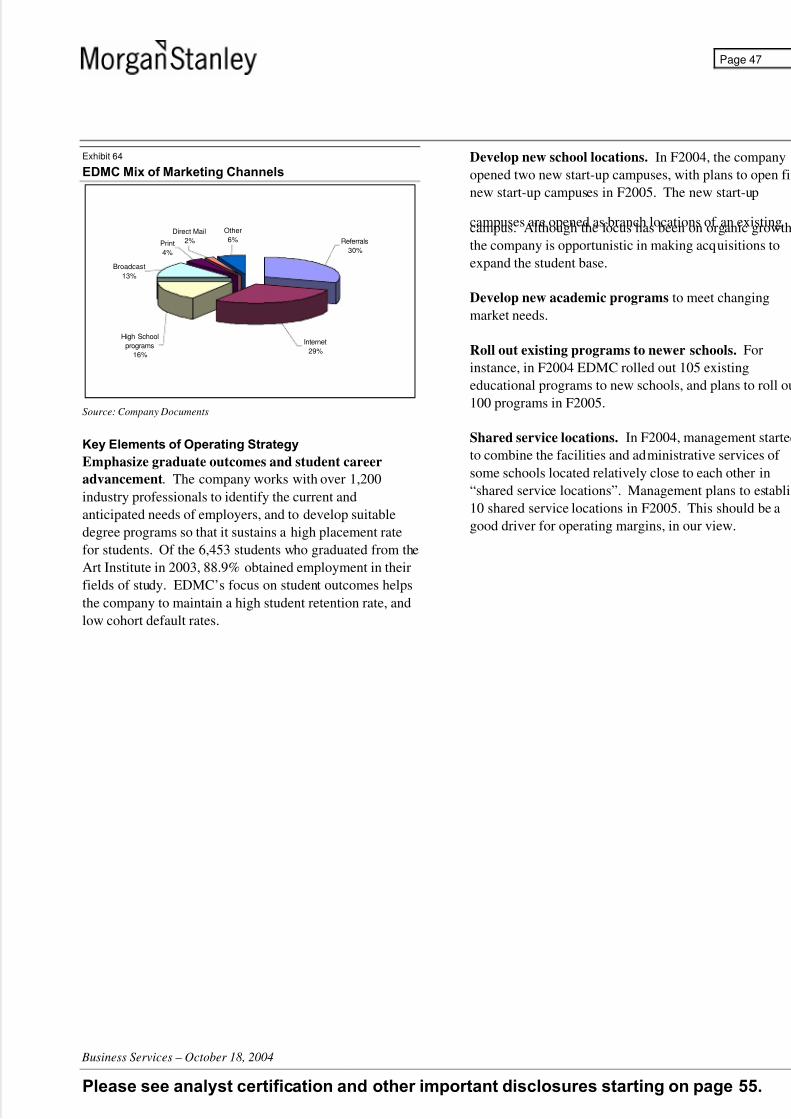
5/14/2018 Morgan Stanley Education Report - slidepdf.com
http://slidepdf.com/reader/full/morgan-stanley-education-report 47/60
Business Services – October 18, 2004
Please see analyst certification and other important disclosures starting on page 55.
Page 47
Exhibit 64
EDMC Mix of Marketing Channels
Referrals
30%
Internet
29%
High School
programs
16%
Broadcast
13%
4%
Direct Mail
2%
Other
6%
Source: Company Documents
Key Elements of Operating Strategy
Emphasize graduate outcomes and student career
advancement. The company works with over 1,200
industry professionals to identify the current and
anticipated needs of employers, and to develop suitable
degree programs so that it sustains a high placement rate
for students. Of the 6,453 students who graduated from the
Art Institute in 2003, 88.9% obtained employment in their
fields of study. EDMC’s focus on student outcomes helps
the company to maintain a high student retention rate, and
low cohort default rates.
Develop new school locations. In F2004, the company
opened two new start-up campuses, with plans to open fiv
new start-up campuses in F2005. The new start-up
campuses are opened as branch locations of an existingcampus. Although the focus has been on organic growth
the company is opportunistic in making acquisitions to
expand the student base.
Develop new academic programs to meet changing
market needs.
Roll out existing programs to newer schools. For
instance, in F2004 EDMC rolled out 105 existing
educational programs to new schools, and plans to roll ou
100 programs in F2005.
Shared service locations. In F2004, management started
to combine the facilities and administrative services of
some schools located relatively close to each other in
“shared service locations”. Management plans to establis
10 shared service locations in F2005. This should be a
good driver for operating margins, in our view.

5/14/2018 Morgan Stanley Education Report - slidepdf.com
http://slidepdf.com/reader/full/morgan-stanley-education-report 48/60
Business Services – October 18, 2004
Please see analyst certification and other important disclosures starting on page 55.
Page 48
ITT Educational Services: Strong Brand for Technology Education
Company Overview
As the leading provider of technology-orientedpostsecondary degrees, ITT Educational Services operates
77 institutes in 30 states providing degree programs in the
fields of technology to approximately 38,000 students (as
of December 31, 2003). Over 99% of programs offered
yield degrees. The remaining diploma programs are under
review to become associate programs. Management hopes
to raise the number of schools authorized to offer
bachelor’s programs from 51 at the end of 2003 to 57 by
2004.
Exhibit 65
Quick Snapshot 2003 2004E Long YoY Change (%) Term
Revenues ($, mn) 522.8 19%
EPS $1.27 43% 20%
Enrolments 37,076
Campus Locations 77 5%+
Composite Score * 2.8 NA NA
% of U.S. Revenues
From Govt. Aid 72% NA NA
Source: Company Data, E=First Call Estimates
* Composite score is a measure of Financial Responsibility as defined by DoE,
and ranges from -1.0 to 3.0
ITT derives about 20% of its revenues from studentfunding made available under the Private loan programs,
which have helped enrollment growth in the past three
years. Its exposure to Private loans is higher than the
industry average.
ITT’s schools include the School of IT, the School of
Electronics Technology, the School of Drafting & Design,
the School of Criminal Justice, and the School of Business.
Program offerings. The company offers over 20 degree
programs and several diploma programs in Software
Application and Programming, Web Development,
Computer Drafting and Design, Technical Project
Management, and Multimedia, to name a few.
About 39% of ITT’s students are enrolled in IT programs,
with an additional 35% enrolled in electronics technology
programs (see Exhibit 66). The sharp concentration of
students in the IT sector exposes enrollment growth to
fluctuations in the economy in general, and to the demand
for jobs in the technology sector in particular. However,
ITT’s average program duration has increased from 18
months in 1986 to about 27 months currently, which
should help increase the visibility, in our view.
Exhibit 66
Proportion of Enrollments by Program, 2003
IT Programs ,
39%
Electronics
Programs,
35%
Design &
Drafting
Programs,
25%
Business
Programs,
1%
Source: Company Documents
Online Strategy
ITT is in the first innings of its online expansion strategy.
In 2003, ITT started to offer online services in 47 states, up
from 36 states in the previous year.
Key Elements of the Business Strategy
Management has a 10-point growth plan, the key aspects of which include:
Enhance results at the Institute level. The company
plans to increase enrollments at existing locations, and
improve student outcomes (in the form of better placement
rates) to increase the appeal for prospective students.
Management also plans to expand the availability of
existing programs to all locations. In 2003, the company
added 181 programs in 47 existing institutes, with the
intent of adding 230 programs at 66 existing institutes in
2004.
In addition, the company plans to develop newer programs,
focusing on information technology (IT), design, business
and/or criminal justice, at the associate, bachelor and
master degree levels. Management is also considering
developing one or more short-term, non-degree programs
of study in 2004.
The company is also increasing the number of its institutes
that offer bachelor programs. In 2003, the number of

5/14/2018 Morgan Stanley Education Report - slidepdf.com
http://slidepdf.com/reader/full/morgan-stanley-education-report 49/60
Business Services – October 18, 2004
Please see analyst certification and other important disclosures starting on page 55.
Page 49
institutes offering bachelor programs increased to 51, and
management is aiming to raise it to 57, by the end of 2004.
Geographic expansion. Management drives geographicexpansion by a combination of opening new institutions
and opening new learning sites (which help to increase the
penetration of an existing institute). In the past two years,
the company has opened three to four new institutes per
year in locations identified by its proprietary methodology.
The company supplements its organic efforts by acquiring
quality companies, especially to grow its online offering.
ITT is also entering into alliances and licensing its
curricula to international educators, particularly in China
and India.
Increase Margins by leveraging fixed costs.
Management’s focus is to increase enrollments without
incurring a proportionate increase in fixed costs. The
company is centralizing management functions, and is in
the process of creating operational uniformity across
institutes. Further, the shift toward the online delivery
model should help margins, in our view. Also, as
bachelor’s programs grow into a bigger percentage of the
overall mix, margins should get an uplift from the higher
revenue per bachelor’s program.
Outstanding Key Regulatory/Legal Issues
On February 25, 2004, federal agents executed search
warrants at the company’s headquarters, and at ten of the
77 ITT Technical Institutes nationwide. Subpoenas wereissued against some of the company’s directors and
executive officers. The subpoenas and search warrants
seek documents related to placement, retention, graduatio
and attendance, recruitment and admissions materials,
student grades, graduate salaries, transferability of credits
to other institutions, and personnel records. Although no
charges have been filed, management believes the DoJ
may be investigating claims alleging falsification of
records related to transferability of credits, student
attendance, retention, and the like.
Later, on March 4, the SEC notified the company that it
had initiated an inquiry into the allegations being
investigated by the DoJ.
The DoE recertified almost all of ITT’s campus groups in
2003, except two that were placed on provisional
certification. The reason given was that their Perkins
cohort default rates exceeded the threshold of 15%. The
company is in the process of ending its participation in th
Perkins loan program, which accounts for a small
percentage of its revenues.

5/14/2018 Morgan Stanley Education Report - slidepdf.com
http://slidepdf.com/reader/full/morgan-stanley-education-report 50/60
Business Services – October 18, 2004
Please see analyst certification and other important disclosures starting on page 55.
Page 50
Laureate Education: International Scale Is a Plus
Company Overview
Laureate Education is the world leader in internationalhigher education. The company was previously known as
Sylvan Learning Systems but underwent a change of name
to better reflect the focus on postsecondary education.
Among the for-profit providers, Laureate possesses the
largest scale of business internationally, with a network of
12 campus-based locations in 11 countries, spanning Latin
America, Europe, and Asia.
Exhibit 67
Quick Snapshot2003 2004E Long
YoY Change (%) Term
Revenues ($, mn) 473 32%
EPS $0.89 +49% 20%
Enrolments 117,100
Campus Locations 12
% of U.S. Revenues
From Govt. Aid <5% NA NA
Source: Company Data, E=First Call Estimates
* Composite score is a measure of Financial Responsibility as defined by DoE,
and ranges from -1.0 to 3.0
Laureate’s schools: The company reports results under
two broad divisions — the Campus-based segment, and the
Online segment. Some of the schools in the Campus
segment include Universidad del Valle de México,Universidad de Las Américas, Universidad Europea de
Madrid, and Universidad Interamericana.
The Online Higher Education (OHE) segment operates
under Canter & Associates, Walden E-learning (Walden),
and National Technological University (NTU).
Programs: The company offers over 100 career-oriented
undergraduate and graduate degree programs in a wide
range of fields, including international business, hotel
management, health sciences, information technology and
engineering.
Online Strategy
Laureate’s online offering is in the early stages of growth.
The company’s strategy is to expand online program
offerings in disciplines that are experiencing good growth
and/or facing professional shortages. Management plans to
deepen the penetration of the online offerings within the
existing student base. For instance, at Cantor, 32% of the
students are enrolled online, with the remaining students
enrolled in traditional distance learning programs. NTU
was acquired in 2002, and provides Laureate with a strong
foothold in the domestic online education market. NTUboasts of a partnership with over 20 major U.S.
engineering schools and key Fortune 100 companies,
providing ample scope for enrollments to grow from a low
base.
The growth in the OHE segment has started to accelerate
after a period of restructuring in 2003 during which the
company terminated some of the relationships between
Cantor and some of the private universities. Those
relationships have been replaced with other strategic
partners, including Walden University.
Strategic Priorities
Entry into new segments. Although the primary focus for
the campus-based business is the 18-22-year-old student,
the company entered the working adult market in 2003.
Laureate enrolled 1,700 working adults in three locations
— Chile, Mexico and Spain. Secondly, the company
gained access to the technical vocational segment with the
acquisition of UNAB in Chile, which has total enrollment
of 5,000 students.
Strengthen presence in existing geographies. In 2003,
management expanded and consolidated operations inLatin America. For 2004, the attention will shift to Europe,
with an emphasis on building scale by adding new
campuses, new products, and expanding segments (like
post-graduate programs). As a part of the European
expansion strategy, the company intends to grow the Swiss
Hospitality business into a real worldwide business.
Entry into new countries. Management is always
examining opportunities in newer geographies, and may
announce entry into one or two new countries.
Regulations Governing Laureate’s Program Offerings
In the US, Laureate operates distance-based educationprograms, including online education. Walden and NTU
are two of only 26 distance learning institutions qualified
to participate in the Distance Education Demonstration
Program. The Congress partly lifted the constraints (laid
out in the original version of HEA bill) on distance-based
education to test the programs for quality and Title IV
eligibility. Sixteen participants, including Walden and
NTU, received waivers of provisions that prohibit Title IV
eligibility at distance learning institutions. At the end of

5/14/2018 Morgan Stanley Education Report - slidepdf.com
http://slidepdf.com/reader/full/morgan-stanley-education-report 51/60
Business Services – October 18, 2004
Please see analyst certification and other important disclosures starting on page 55.
Page 51
2003, about 26% of Laureate’s OHE’s revenues were
directly tied to Title IV funds.
Separately, the company has obtained the necessaryapprovals from the applicable agencies in each country to
operate the schools. In general, the company works with
regulators in each country to ensure that new programs are
approved before they are launched.
Because of the company’s limited exposure to Title IV
funds, it undergoes relatively less scrutiny. There are no
legal or regulatory-related proceedings pertaining to
Laureate.
Other Key Points
• Student financial aid has not been institutionalized in
Chile (about 40% of enrollments). The company
piloted some commercial loan programs but the critic
part is to assess the credit profile and the repayment
rate before private parties can extend loans. While
management is not anticipating any breakthroughs inthe short term, we believe the creation of sustainable
student financial aid can be a significant positive for
enrollment growth in Chile.
• The company enjoys a low tax rate of 22% due to the
geographic mix of operations, and the favorable tax
rates in countries like Chile.
• Laureate’s results can be affected by exchange rate
fluctuations.

5/14/2018 Morgan Stanley Education Report - slidepdf.com
http://slidepdf.com/reader/full/morgan-stanley-education-report 52/60
Business Services – October 18, 2004
Please see analyst certification and other important disclosures starting on page 55.
Page 52
Strayer Education: Strong Regional Competitor
Company Overview
Strayer Education was founded in 1892 and providespostsecondary education in Pennsylvania, Maryland,
Washington, D.C., Virginia, North Carolina, South
Carolina, and Tennessee. Since the initial public offering
in 1996, the company has grown from eight campuses in
one state and Washington, D.C., to 30 campuses in eight
states (3Q04).
Exhibit 68
Quick Snapshot2003 2004E Long
YoY Change (%) Term
Revenues ($, mn) 147 25%
EPS $2.17 25% 22%Enrolments 20,000+
Campus Locations 27
Composite Score * 3.0 NA NA
% of U.S. Revenues
From Govt. Aid 55% NA NA
Source: Company Data, E=First Call Estimates
* Composite score is a measure of Financial Responsibility as defined by DoE,
and ranges from -1.0 to 3.0
Strayer’s primary asset is the Strayer University.
Programs include undergraduate and graduate degree
programs in business administration, accounting,information technology, education, and public
administration. The enrollments in business/economics
and computer information systems account for 85% of the
total student population (see following exhibits).
Exhibit 69
Enrollments by Level, Spring 2004
Associate 12%
Diploma
2%
Undeclared
4%
Masters
22%
Bachelor
60%
Source: Company Documents
Exhibit 70
Enrollments by Program, Spring 2004
Business &
Economics
50%
Computer
information
systems
35%
Other
2%
Accounting
13%
Source: Company Documents
The average length of study is two quarters because the
students have prior credits.
Recapitalization in May 2001
In May 2001, the company underwent a $150 million
recapitalization and change of control transaction, in which
it issued 5.8 million shares of its Convertible Preferred
Stock to an investor group consisting of New Mountain
Partners LP and DB Capital Investors, LP. The Company
used the $150 million, together with approximately $36.4
million of its cash, to repurchase 7.2 million shares of
outstanding common stock from then-CEO Ron Bailey,who owned 8.2 million shares.
The current management team under Chairman and CEO
Robert Silberman has invested heavily in growth since
2001, generating compounded revenue growth of 23% in
that period. We note that there has been some flux in the
management ranks over the past few years, including the
recapitalization in 2001. Most recently, executive Vice
President and COO Scott W. Steffey resigned for personal
reasons.
Growth StrategyManagement’s strategy to drive growth revolves around
the following key points:
Maintain stable enrollments in mature markets. For
campuses that are over three years old (14 campuses in
total), the company’s goal is to hold enrolments steady,
and drive revenue growth through tuition increases of
about 5%.

5/14/2018 Morgan Stanley Education Report - slidepdf.com
http://slidepdf.com/reader/full/morgan-stanley-education-report 53/60
Business Services – October 18, 2004
Please see analyst certification and other important disclosures starting on page 55.
Page 53
Open new campuses. The company plans to open four
new campuses in 2004 (two were opened in Spring 2004)
to strengthen the presence in existing states, and expand
into contiguous states as well. It takes 15-18 months for anew campus to turn profitable.
Expand Strayer Online. Enrollments at Strayer Online
have grown at a compounded rate of 80% since the
inception of the program in 1997. The company has
enjoyed good success with the “on-demand” format
(started in summer 2001) for course offerings since it
provides flexibility to the working adults. Management
plans to market the online program to both domestic and
international students.
Enrollments in the online university had increased to
almost 10,000 by Spring 2004.
Develop corporate alliances. Stayer’s evening, weekend,
and online courses are designed to be attractive for the
education and training needs of employers and their
employees. The company has sponsorship and
reimbursement agreements with over 90 corporations, an
plans to increase such relationships.
Make strategic acquisitions. Management looks toacquire companies that are a good strategic fit with
existing curricula, have high accreditation standards, and
enhance the company’s geographic presence. Before
committing to an acquisition, management evaluates
alternative uses of capital for such purposes as organic
growth, share repurchases, or dividends.
Key Outstanding Regulatory/Legal Issues
Following the change in ownership in May 2001, the US
DoE placed Strayer under provisional certification to
receive Title IV funds. This is standard procedure, and th
full certification is likely to be reinstated within
approximately three years of the change in ownership,
barring any inconsistencies in the compliance procedures
at the school.

5/14/2018 Morgan Stanley Education Report - slidepdf.com
http://slidepdf.com/reader/full/morgan-stanley-education-report 54/60
Business Services – October 18, 2004
Please see analyst certification and other important disclosures starting on page 55.
Page 54
ModelWare is a proprietary framework for financial analysis created by Morgan Stanley Research. This new
framework rests on the principles of comparability, transparency, and flexibility, and aims to provide investors with better tools
to view the anticipated performance of an enterprise. The result of an 18-month global effort, ModelWare harmonizes the
underlying data and calculations in Morgan Stanley models with a broad set of consistently defined financial metrics. Our
analysts have populated the database with over 2.5 million data points, based on an extensive taxonomy of more than 3,500
unique metrics and more than 400 Morgan Stanley calculations. The ModelWare framework will also have the flexibility to
allow analysts and investors to quickly customize their own analytical approach.
What makes the ModelWare architecture distinctive lies in the separation of data from calculations. Its transparency
will permit users to see every component of every calculation, to choose elements or recombine them as they wish without
laborious adjustments or recalculations. When choices must be made in defining standard or industry-specific measures,
ModelWare defaults to economic logic, rather than favoring one accounting rule over another. This discipline facilitates
comparability across sectors and regions. Underlying the ModelWare data is a new set of systems that check the internal
consistency of forecast data in each of our analyst’s models.
ModelWare EPS illustrates the approach taken. It represents ModelWare net income divided by average fully diluted shares
outstanding. ModelWare net income sums net operating profit after tax (NOPAT), net financial income or expense (NFE), and
other income or expense. ModelWare adjusts reported net income to improve comparability across companies, sectors, and
regions. These adjustments include the following: We exclude goodwill amortization and items deemed by analysts to be
“one-time” events; we capitalize operating leases where their use is significant (e.g., in transportation and retail); and we
convert inventory to FIFO accounting when LIFO costing is used. For more information on these adjustments and others, as
well as additional background, please see “Morgan Stanley ModelWare (ver. 1.0): A Road Map for Investors,” by Trevor
Harris and team, August 2, 2004.

5/14/2018 Morgan Stanley Education Report - slidepdf.com
http://slidepdf.com/reader/full/morgan-stanley-education-report 55/60
Business Services – October 18, 2004
Page 55
Analyst CertificationThe following analysts hereby certify that their views about the companies and their securities discussed in this report areaccurately expressed and that they have not received and will not receive direct or indirect compensation in exchange forexpressing specific recommendations or views in this report: Chris Gutek and April Henry.
Important US Regulatory Disclosures on Subject CompaniesThe information and opinions in this report were prepared by Morgan Stanley & Co. Incorporated and its affiliates (collective"Morgan Stanley").
As of September 30, 2004, Morgan Stanley beneficially owned 1% or more of a class of common equity securities of thefollowing companies covered in this report: Apollo Group.
Morgan Stanley & Co. Incorporated makes a market in the securities of Apollo Group.
The research analysts, strategists, or research associates principally responsible for the preparation of this research report havereceived compensation based upon various factors, including quality of research, investor client feedback, stock picking,competitive factors, firm revenues and overall investment banking revenues.

5/14/2018 Morgan Stanley Education Report - slidepdf.com
http://slidepdf.com/reader/full/morgan-stanley-education-report 56/60
Business Services – October 18, 2004
Page 56
Stock Ratings
Different securities firms use a variety of rating terms as well as different rating systems to describe their recommendations. For example,Morgan Stanley uses a relative rating system including terms such as Overweight, Equal-weight or Underweight (see definitions below). Arating system using terms such as buy, hold and sell is not equivalent to our rating system. Investors should carefully read the definitions of
all ratings used in each research report. In addition, since the research report contains more complete information concerning the analyst’sviews, investors should carefully read the entire research report and not infer its contents from the rating alone. In any case, ratings (orresearch) should not be used or relied upon as investment advice. An investor’s decision to buy or sell a stock should depend on individualcircumstances (such as the investor’s existing holdings) and other considerations.
Global Stock Ratings Distribution
(as of September 30, 2004)
Coverage Universe Investment Banking Clients (IBC)
Stock Rating Category Count% ofTotal Count
% ofTotal IBC
% of RatingCategory
Overweight/Buy 626 34% 250 38% 40%Equal-weight/Hold 848 46% 308 47% 36%Underweight/Sell 353 19% 98 15% 28%Total 1,827 656
Data include common stock and ADRs currently assigned ratings. For disclosure purposes (in accordance with NASD and NYSE requirements), we note that
Overweight, our most positive stock rating, most closely corresponds to a buy recommendation; Equal-weight and Underweight most closely correspond to neutral and sell recommendations, respectively. However, Overweight, Equal-weight, and Underweight are not the equivalent of buy, neutral, and sell but represent recommended
relative weightings (see definitions below). An investor's decision to buy or sell a stock should depend on individual circumstances (such as the investor's existing
holdings) and other considerations. Investment Banking Clients are companies from whom Morgan Stanley or an affiliate received investment banking compensation in
the last 12 months.
Analyst Stock Ratings
Overweight (O). The stock’s total return is expected to exceed the average total return of the analyst’s industry (or industryteam’s) coverage universe, on a risk-adjusted basis, over the next 12-18 months.
Equal-weight (E). The stock’s total return is expected to be in line with the average total return of the analyst’s industry (orindustry team’s) coverage universe, on a risk-adjusted basis, over the next 12-18 months.
Underweight (U). The stock’s total return is expected to be below the average total return of the analyst’s industry (or industryteam’s) coverage universe, on a risk-adjusted basis, over the next 12-18 months.
More volatile (V). We estimate that this stock has more than a 25% chance of a price move (up or down) of more than 25% ina month, based on a quantitative assessment of historical data, or in the analyst’s view, it is likely to become materially morevolatile over the next 1-12 months compared with the past three years. Stocks with less than one year of trading history areautomatically rated as more volatile (unless otherwise noted). We note that securities that we do not currently consider "morevolatile" can still perform in that manner.
Unless otherwise specified, the time frame for price targets included in this report is 12 to 18 months. Ratings prior to March18, 2002: SB=Strong Buy; OP=Outperform; N=Neutral; UP=Underperform. For definitions, please go towww.morganstanley.com/companycharts.
Analyst Industry Views
Attractive (A). The analyst expects the performance of his or her industry coverage universe over the next 12-18 months to beattractive vs. the relevant broad market benchmark named on the cover of this report.
In-Line (I). The analyst expects the performance of his or her industry coverage universe over the next 12-18 months to be in
line with the relevant broad market benchmark named on the cover of this report.Cautious (C). The analyst views the performance of his or her industry coverage universe over the next 12-18 months withcaution vs. the relevant broad market benchmark named on the cover of this report.
Stock price charts and rating histories for companies discussed in this report are also available at
www.morganstanley.com/companycharts. You may also request this information by writing to Morgan Stanley at 1585
Broadway, 14th Floor (Attention: Research Disclosures), New York, NY, 10036 USA.

5/14/2018 Morgan Stanley Education Report - slidepdf.com
http://slidepdf.com/reader/full/morgan-stanley-education-report 57/60
Business Services – October 18, 2004
Page 57
Stock Price, Price Target and Rating History (See Rating Definitions)

5/14/2018 Morgan Stanley Education Report - slidepdf.com
http://slidepdf.com/reader/full/morgan-stanley-education-report 58/60
Business Services – October 18, 2004
Page 58
Other Important DisclosuresThis research report has been published in accordance with our conflict management policy, which is available atwww.morganstanley.com/institutional/research/conflictpolicies.
For a discussion, if applicable, of the valuation methods used to determine the price targets included in this summary and therisks related to achieving these targets, please refer to the latest relevant published research on these stocks. Research isavailable through your sales representative or on Client Link at www.morganstanley.com and other electronic systems.
This report does not provide individually tailored investment advice. It has been prepared without regard to the individualfinancial circumstances and objectives of persons who receive it. The securities discussed in this report may not be suitable forall investors. Morgan Stanley recommends that investors independently evaluate particular investments and strategies, andencourages investors to seek the advice of a financial adviser. The appropriateness of a particular investment or strategy willdepend on an investor’s individual circumstances and objectives.
This report is not an offer to buy or sell any security or to participate in any trading strategy. In addition to any holdingsdisclosed in the section entitled "Important US Regulatory Disclosures on Subject Companies", Morgan Stanley and/or itsemployees not involved in the preparation of this report may have investments in securities or derivatives of securities of companies mentioned in this report, and may trade them in ways different from those discussed in this report. Derivatives maybe issued by Morgan Stanley or associated persons.
Morgan Stanley & Co. Incorporated and its affiliate companies do business that relates to companies covered in its researchreports, including market making and specialized trading, risk arbitrage and other proprietary trading, fund management,investment services and investment banking. Morgan Stanley sells to and buys from customers the equity securities of companies covered in its research reports on a principal basis.
Morgan Stanley makes every effort to use reliable, comprehensive information, but we make no representation that it isaccurate or complete. We have no obligation to tell you when opinions or information in this report change apart from whenwe intend to discontinue research coverage of a subject company.
With the exception of information regarding Morgan Stanley, reports prepared by Morgan Stanley research personnel are basedon public information. Facts and views presented in this report have not been reviewed by, and may not reflect informationknown to, professionals in other Morgan Stanley business areas, including investment banking personnel.
Morgan Stanley research personnel conduct site visits from time to time but are prohibited from accepting payment orreimbursement by the company of travel expenses for such visits.
The value of and income from your investments may vary because of changes in interest rates or foreign exchange rates,securities prices or market indexes, operational or financial conditions of companies or other factors. There may be timelimitations on the exercise of options or other rights in your securities transactions. Past performance is not necessarily a guideto future performance. Estimates of future performance are based on assumptions that may not be realized.
This publication is disseminated in Japan by Morgan Stanley Japan Limited; in Hong Kong by Morgan Stanley Dean WitterAsia Limited; in Singapore by Morgan Stanley Dean Witter Asia (Singapore) Pte. (Registration number 199206298Z) and/orMorgan Stanley Asia (Singapore) Securities Pte Ltd (Registration number 200008434H), regulated by the Monetary Authorityof Singapore, which accepts responsibility for its contents; in Australia by Morgan Stanley Dean Witter Australia LimitedA.B.N. 67 003 734 576, holder of Australian financial services licence No. 233742, which accepts responsibility for itscontents; in Taiwan by Morgan Stanley & Co. International Limited, Taipei Branch; in Korea by Morgan Stanley & Co.International Limited, Seoul Branch; in India by JM Morgan Stanley Securities Private Limited; in Canada by Morgan StanleyCanada Limited, which has approved of, and has agreed to take responsibility for, the contents of this publication in Canada; inSpain by Morgan Stanley, S.V., S.A., a Morgan Stanley group company, which is supervised by the Spanish Securities Markets
Commission (CNMV) and states that this document has been written and distributed in accordance with the rules of conductapplicable to financial research as established under Spanish regulations; in the United States by Morgan Stanley & Co.Incorporated and Morgan Stanley DW Inc., which accept responsibility for its contents. Morgan Stanley & Co. InternationalLimited, authorized and regulated by Financial Services Authority, disseminates in the UK research that it has prepared, andapproves solely for the purposes of section 21 of the Financial Services and Markets Act 2000, research which has beenprepared by any of its affiliates. Private U.K. investors should obtain the advice of their Morgan Stanley & Co. InternationalLimited representative about the investments concerned. In Australia, this report, and any access to it, is intended only for“wholesale clients” within the meaning of the Australian Corporations Act.

5/14/2018 Morgan Stanley Education Report - slidepdf.com
http://slidepdf.com/reader/full/morgan-stanley-education-report 59/60
Business Services – October 18, 2004
Page 59
The trademarks and service marks contained herein are the property of their respective owners. Third-party data providers mano warranties or representations of any kind relating to the accuracy, completeness, or timeliness of the data they provide andshall not have liability for any damages of any kind relating to such data. The Global Industry Classification Standard("GICS") was developed by and is the exclusive property of MSCI and S&P.
This report or any portion hereof may not be reprinted, sold or redistributed without the written consent of Morgan Stanley.
Morgan Stanley research is disseminated and available primarily electronically, and, in some cases, in printed form.
Additional information on recommended securities is available on request.

5/14/2018 Morgan Stanley Education Report - slidepdf.com
http://slidepdf.com/reader/full/morgan-stanley-education-report 60/60
The Americas
1585 BroadwayNew York, NY 10036-8293United States
Tel: +1 (1)212 761 4000
Europe
25 Cabot Square, Canary Wharf London E14 4QAUnited Kingdom
Tel: +44 (0)20 7425 8000
Japan
20-3, Ebisu 4-chomeShibuya-ku,Tokyo 150-6008, Japan
Tel: +81 (0)3 5424 5000
Asia/Pacific
Three Exchange SquareCentralHong Kong
Tel: +852 2848 5200
© 2004 Morgan Stanley
Related Documents