More than po: Debugging in lldb @MicheleTitolo

Welcome message from author
This document is posted to help you gain knowledge. Please leave a comment to let me know what you think about it! Share it to your friends and learn new things together.
Transcript

More than po: Debugging in lldb
@MicheleTitolo


lldb

What we’ll cover
• LLDB basics
• Advanced thread, breakpoint, watchpoint
• Debugging with script
• Swift

lldb commands

Basics

po

expr -O --

(lldb) po self.myCar <Car: 0x7fc8206334d0>

-description

(lldb) po self.myCar 2014 Tesla S UIDeviceRGBColorSpace 0 0 1 1

p

expr --
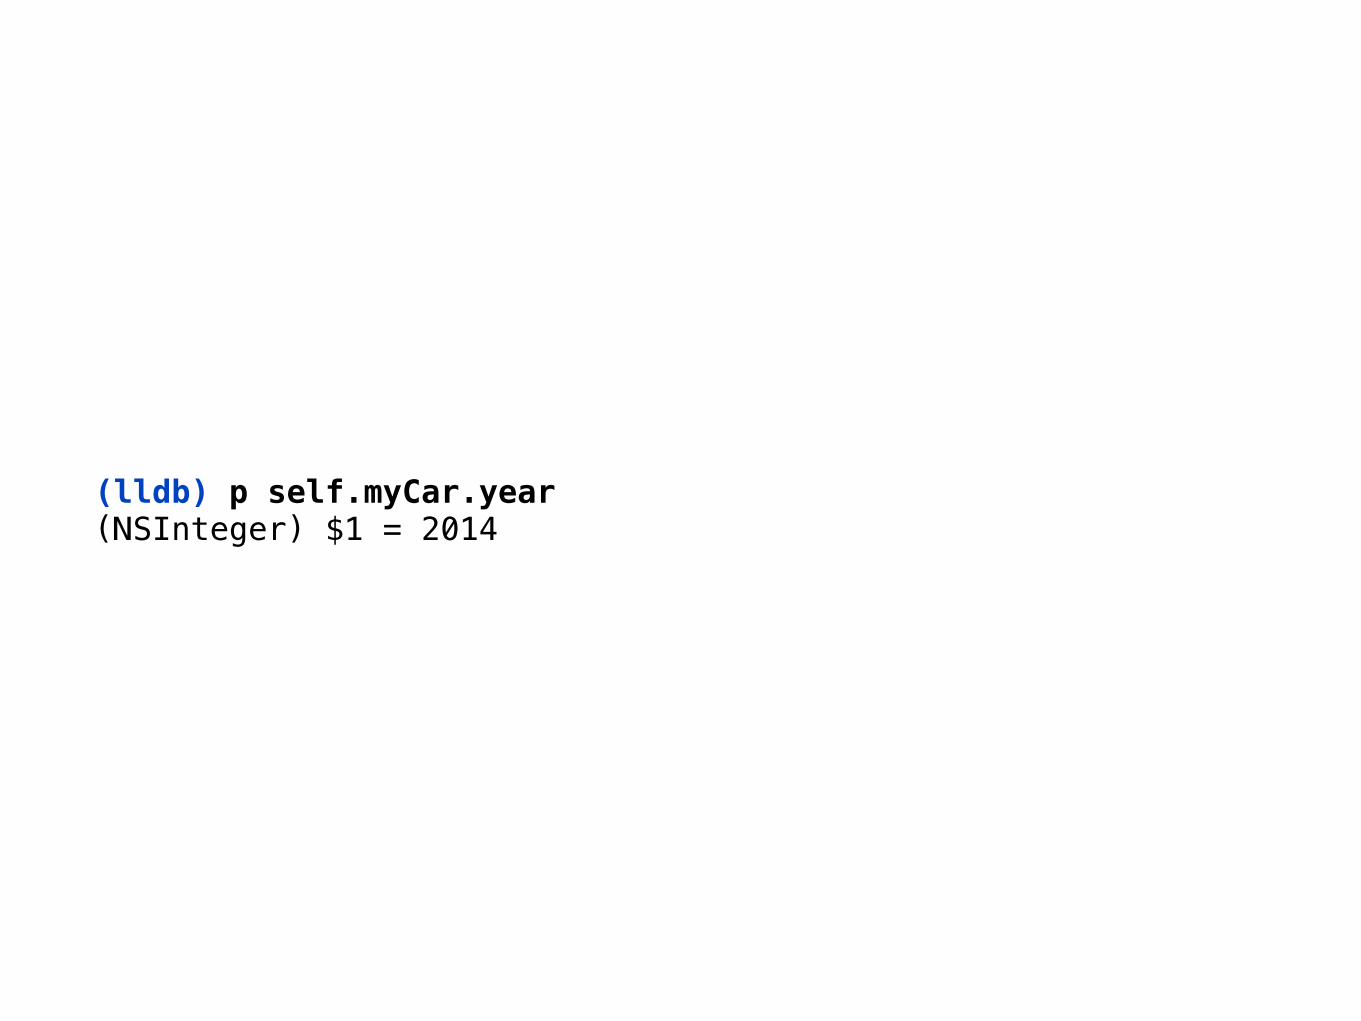
(lldb) p self.myCar.year (NSInteger) $1 = 2014

(lldb) p *self.myCar (Car) $1 = { NSObject = { isa = Car } _running = NO _make = 0x000000010077d088 @"Tesla" _model = 0x000000010077d0a8 @"S" _year = 2014 _color = 0x00007fd531eb9e30 _gear = Park}
use expr to modify values at runtime

(lldb) po self.myCar2014 Tesla S UIDeviceRGBColorSpace 0 0 1 1
(lldb) expr self.myCar.year = 2013 (NSInteger) $0 = 2013
(lldb) po self.myCar2013 Tesla S UIDeviceRGBColorSpace 0 0 1 1

frame variable

fr v
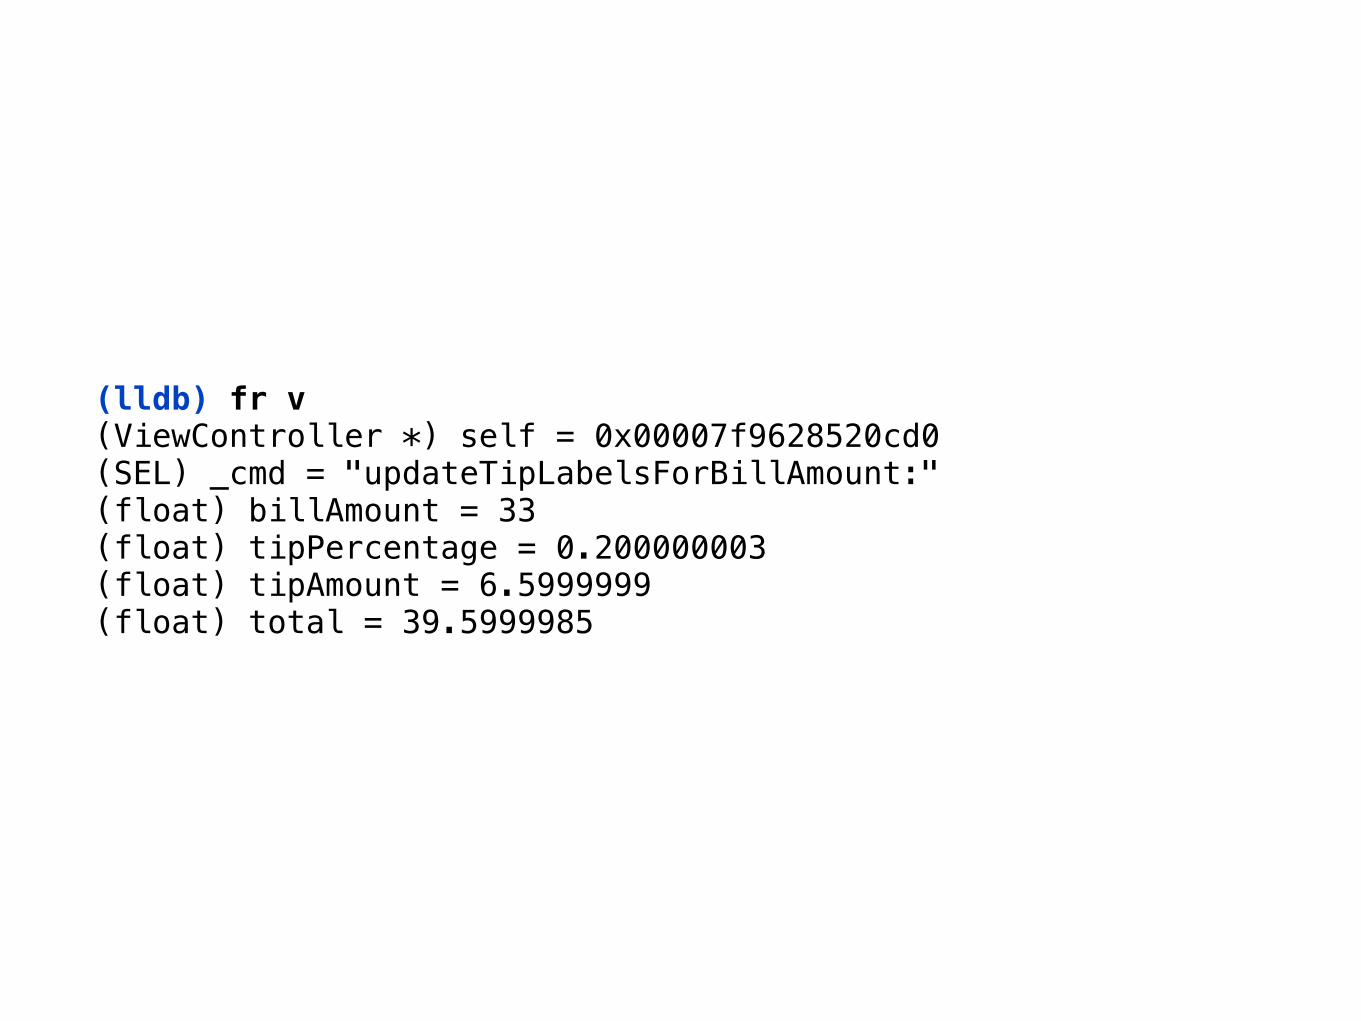
(lldb) fr v (ViewController *) self = 0x00007f9628520cd0(SEL) _cmd = "updateTipLabelsForBillAmount:"(float) billAmount = 33(float) tipPercentage = 0.200000003(float) tipAmount = 6.5999999(float) total = 39.5999985

bt

thread backtrace

(lldb) bt * thread #1: tid = 0x66c2, 0x0000000101a90330 Cars`-[ViewController viewDidLoad](self=0x00007fc3d2c21570, _cmd=0x0000000102f21cfb) + 448 at ViewController.m:28, queue = 'com.apple.main-thread', stop reason = breakpoint 1.1 * frame #0: 0x0000000101a90330 Cars`-[ViewController viewDidLoad](self=0x00007fc3d2c21570, _cmd=0x0000000102f21cfb) + 448 at ViewController.m:28 frame #1: 0x000000010284f090 UIKit`-[UIViewController loadViewIfRequired] + 738 frame #2: 0x000000010284f28e UIKit`-[UIViewController view] + 27 frame #3: 0x000000010276b5e9 UIKit`-[UIWindow addRootViewControllerViewIfPossible] + 58 frame #4: 0x000000010276b9af UIKit`-[UIWindow _setHidden:forced:] + 247 frame #5: 0x0000000102778219 UIKit`-[UIWindow makeKeyAndVisible] + 42 frame #6: 0x000000010271b727 UIKit`-[UIApplication _callInitializationDelegatesForMainScene:transitionContext:] + 2732 frame #7: 0x000000010271e43e UIKit`-[UIApplication _runWithMainScene:transitionContext:completion:] + 1349 frame #8: 0x000000010271d33c UIKit`-[UIApplication workspaceDidEndTransaction:] + 179

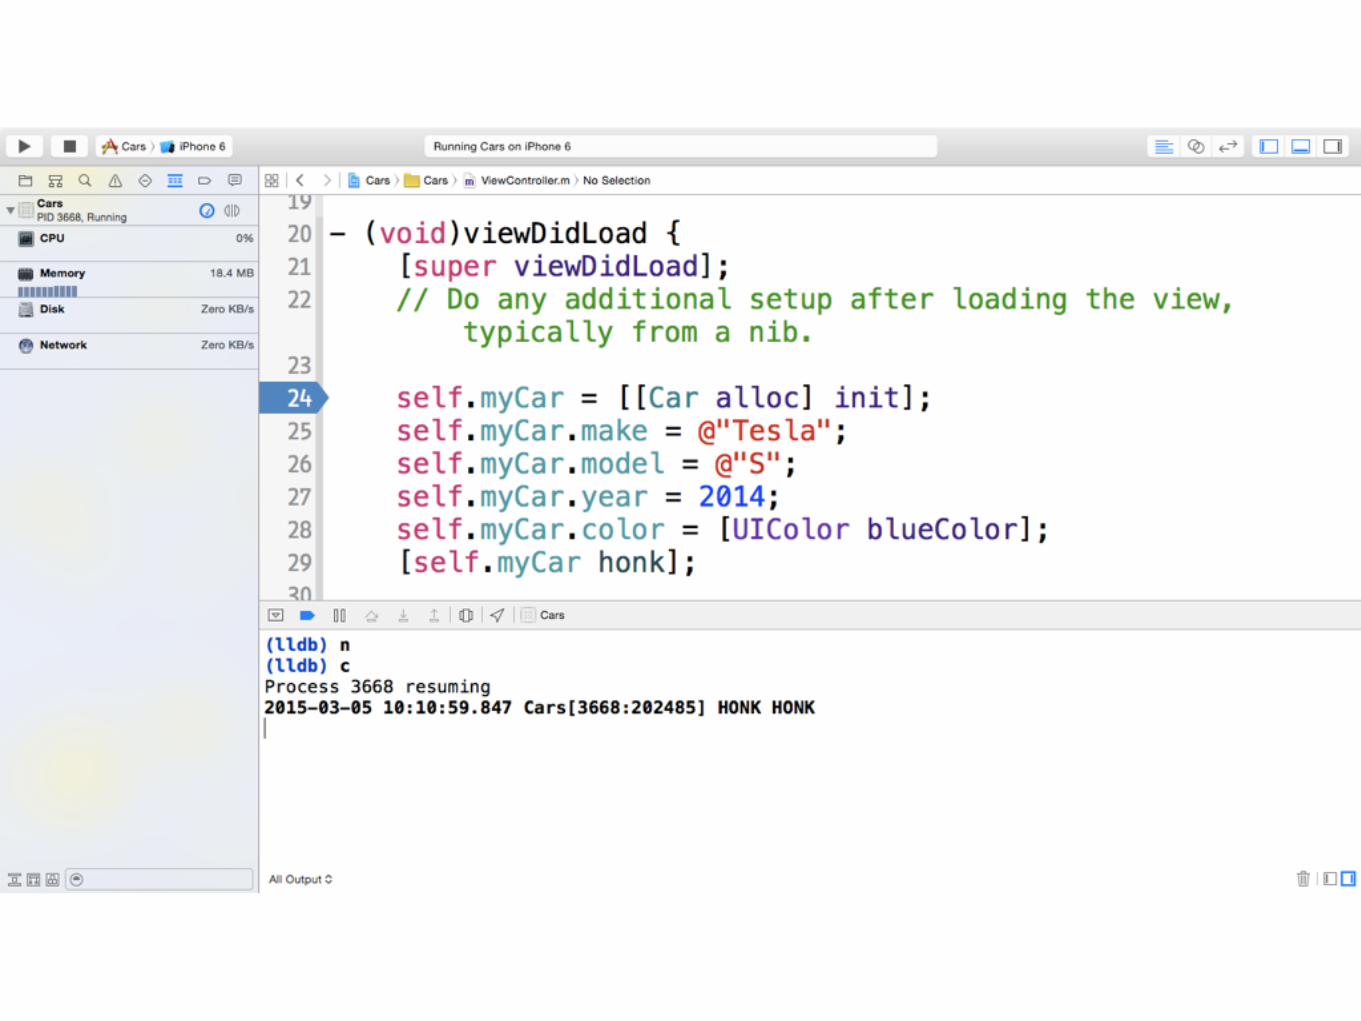
step / s


next / n


thread step-out / finish


continue / c
~/.lldbinit

settings set prompt [lldb]$
command alias bd breakpoint disable command alias be breakpoint enable command alias bdel breakpoint delete command alias bcommand breakpoint command add command alias commands breakpoint command list

process
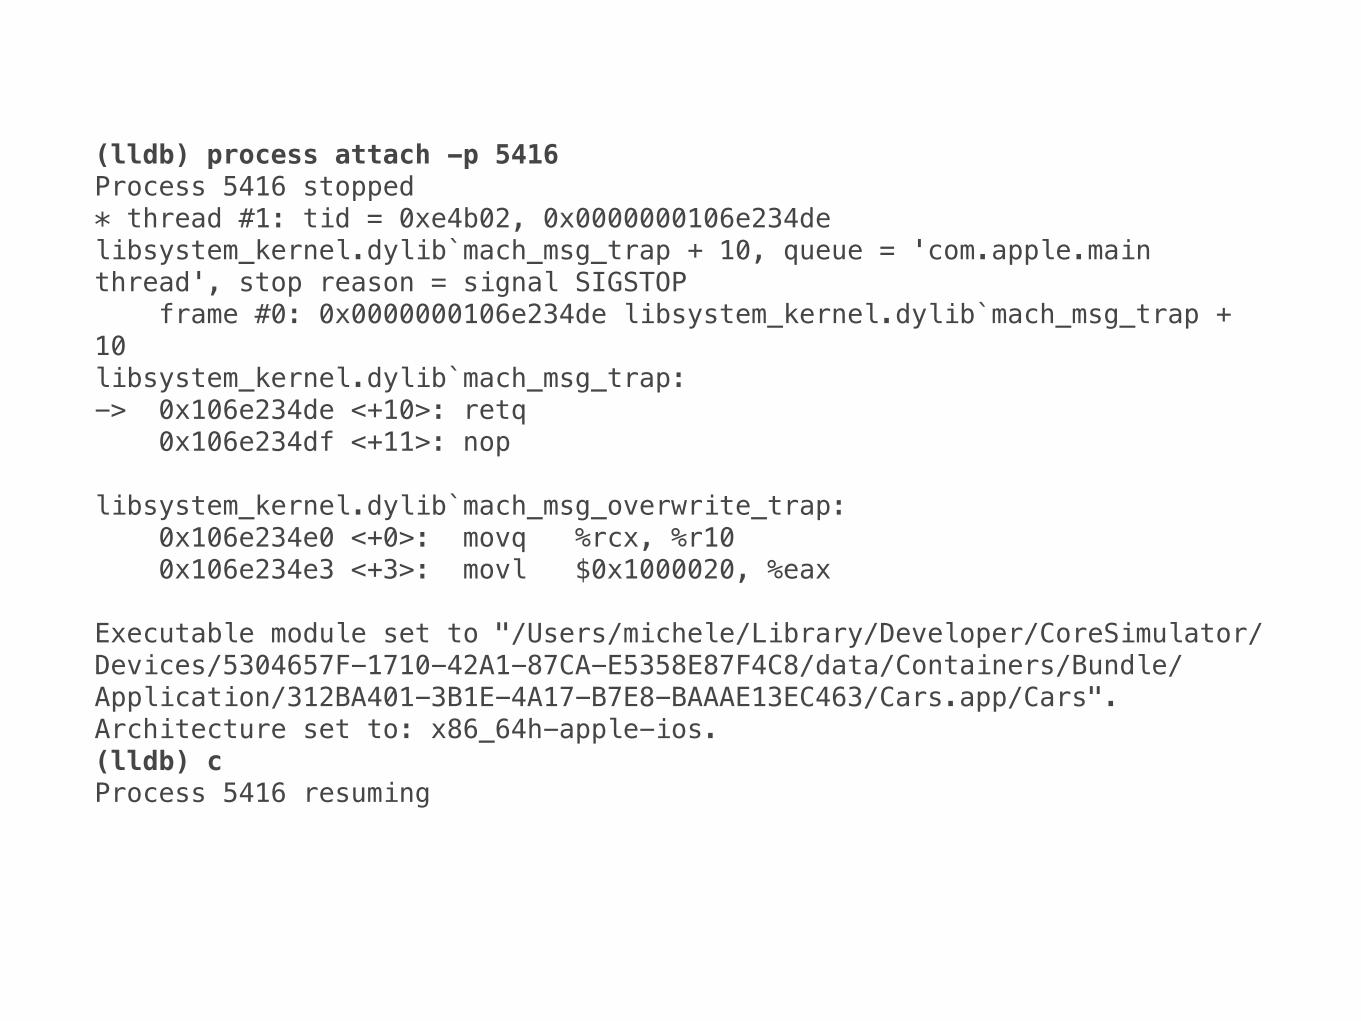
(lldb) process attach -p 5416 Process 5416 stopped* thread #1: tid = 0xe4b02, 0x0000000106e234delibsystem_kernel.dylib`mach_msg_trap + 10, queue = 'com.apple.mainthread', stop reason = signal SIGSTOP frame #0: 0x0000000106e234de libsystem_kernel.dylib`mach_msg_trap +10 libsystem_kernel.dylib`mach_msg_trap:-> 0x106e234de <+10>: retq 0x106e234df <+11>: noplibsystem_kernel.dylib`mach_msg_overwrite_trap: 0x106e234e0 <+0>: movq %rcx, %r10 0x106e234e3 <+3>: movl $0x1000020, %eaxExecutable module set to "/Users/michele/Library/Developer/CoreSimulator/Devices/5304657F-1710-42A1-87CA-E5358E87F4C8/data/Containers/Bundle/Application/312BA401-3B1E-4A17-B7E8-BAAAE13EC463/Cars.app/Cars".Architecture set to: x86_64h-apple-ios. (lldb) c Process 5416 resuming

help

help breakpoint

help breakpoint command

help breakpoint command add

-h --help


Thread

thread info

(lldb) thread info thread #1: tid = 0x66c2, 0x0000000101a90330 Cars`-[ViewController viewDidLoad](self=0x00007fc3d2c21570, _cmd=0x0000000102f21cfb) + 448 at ViewController.m:28, queue = 'com.apple.main-thread', stop reason = breakpoint 1.1

thread list

(lldb) thread list Process 921 stopped* thread #1: tid = 0x66c2, 0x0000000101a90330 Cars`-[ViewController viewDidLoad](self=0x00007fc3d2c21570, _cmd=0x0000000102f21cfb) + 448 at ViewController.m:28, queue = 'com.apple.main-thread', stop reason = breakpoint 1.1 thread #2: tid = 0x66da, 0x0000000104bcc232 libsystem_kernel.dylib`kevent64 + 10, queue = 'com.apple.libdispatch-manager' thread #3: tid = 0x66dc, 0x0000000104bc651a libsystem_kernel.dylib`semaphore_wait_trap + 10, queue = 'FBSSerialQueue' thread #4: tid = 0x66dd, 0x0000000104bcb94a libsystem_kernel.dylib`__workq_kernreturn + 10 thread #5: tid = 0x66de, 0x0000000104bcb94a libsystem_kernel.dylib`__workq_kernreturn + 10 thread #6: tid = 0x66df, 0x0000000104bcb94a libsystem_kernel.dylib`__workq_kernreturn + 10

thread until <linenum>

(lldb) thread until 31 Process 1615 resuming(lldb)

thread return <expr>

(lldb) thread return NO (lldb) thread return [NSNumber numberWithInt:7] (lldb) thread return @"Hello"

Breakpoints


breakpoint list

br list

(lldb) br list Current breakpoints:1: file = 'Cars/Car.m', line = 50, locations = 1, resolved = 1, hit count = 0 1.1: where = Cars`-[Car changeGearTo:] + 52 at Car.m:50, address = 0x00000001026fd4e4, resolved, hit count = 0 2: file = 'Cars/ViewController.m', line = 31, locations = 1, resolved = 1, hit count = 1 2.1: where = Cars`-[ViewController viewDidLoad] + 512 at ViewController.m:31, address = 0x00000001026fcb40, resolved, hit count = 1

br set br modify br delete

(lldb) br set -f ViewController.m -l 31 Breakpoint 2: where = Cars`-[ViewController viewDidLoad] +512 at ViewController.m:31, address = 0x000000010e2bdb40

(lldb) br set -F "-[Car changeGearTo:]” Breakpoint 3: where = Cars`-[Car changeGearTo:] + 20 atCar.m:47, address = 0x00000001073ba4c4

br ~= b

(lldb) b ViewController.m:31

(lldb) br ViewController.m:31 error: command 'breakpoint' did not recognize 'ViewController .m:31' as valid (subcommand might be invalid).

(lldb) b Car.m:63Breakpoint 2: where = Cars`-[Car increaseSpeedTo:] + 118 at Car.m:63, address = 0x0000000100b7a576(lldb) br modify -c "speed==15" 2 (lldb) c Process 3093 resuming(lldb)


(lldb) br modify -c "speed==15 && self.gear==4” 2

(lldb) br modify -c "speed==20 && [self canChangeGearTo:4]" 2

(lldb) br modify -c "speed==15 && self.gear==4" -i 17 2

-i <count> ( --ignore-count <count> ) Set the number of times this breakpoint is skipped before stopping.

-i <count> ( --ignore-count <count> ) Set the minimum number of times this breakpoint is skipped before stopping.

(lldb) br delete 2 1 breakpoints deleted; 0 breakpoint locations disabled.

br enable br disable
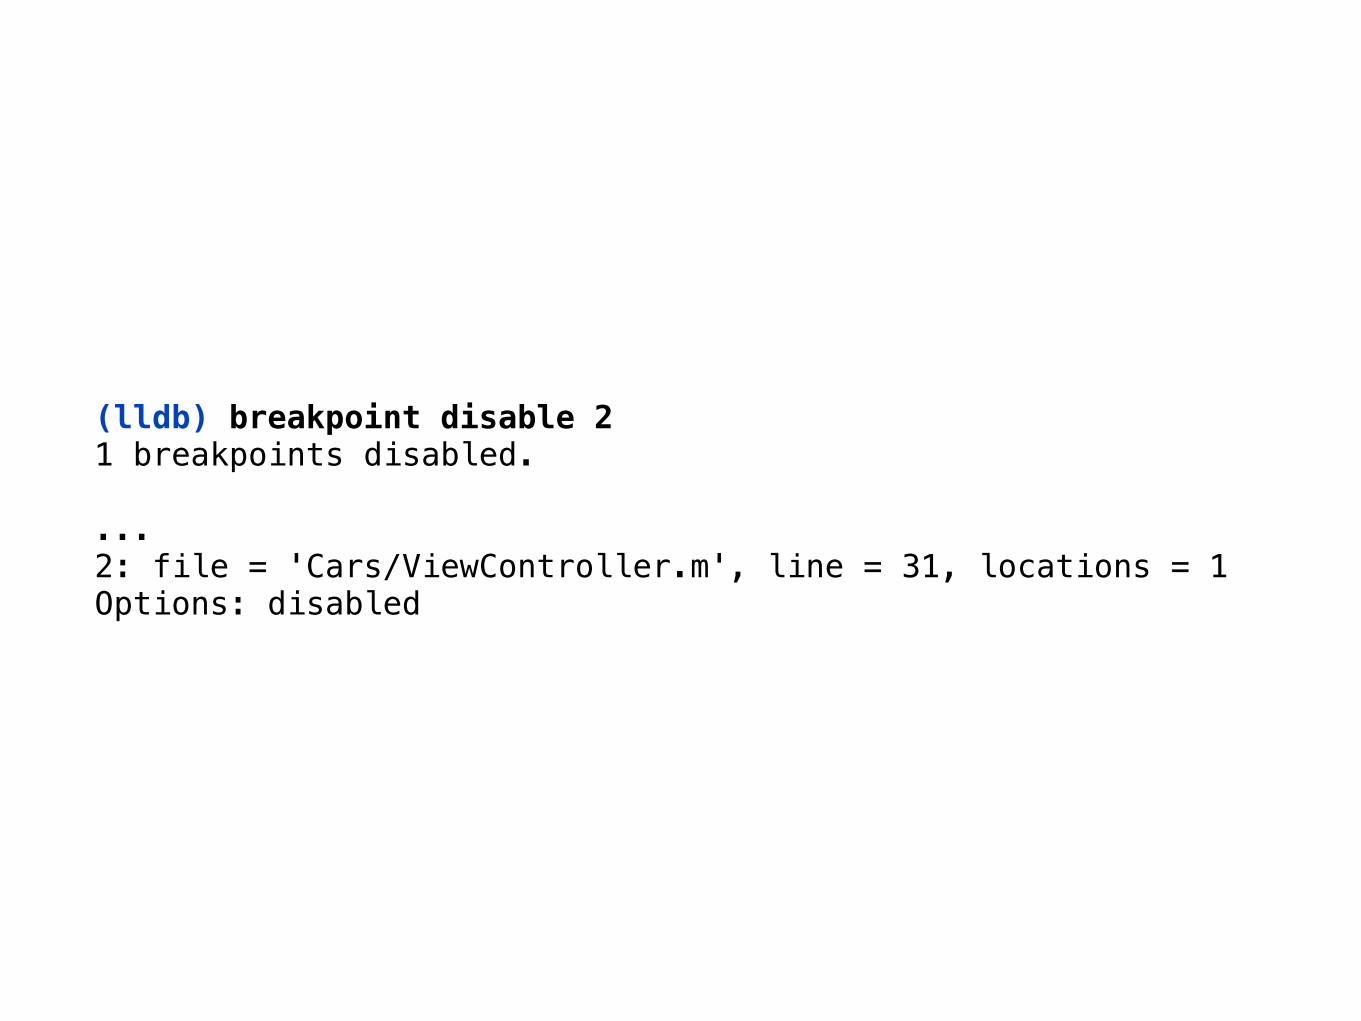
(lldb) breakpoint disable 2 1 breakpoints disabled. ...2: file = 'Cars/ViewController.m', line = 31, locations = 1 Options: disabled

(lldb) breakpoint enable 2 1 breakpoints enabled.
...2: file = 'Cars/ViewController.m', line = 31, locations = 1, resolved = 1, hit count = 1

br command
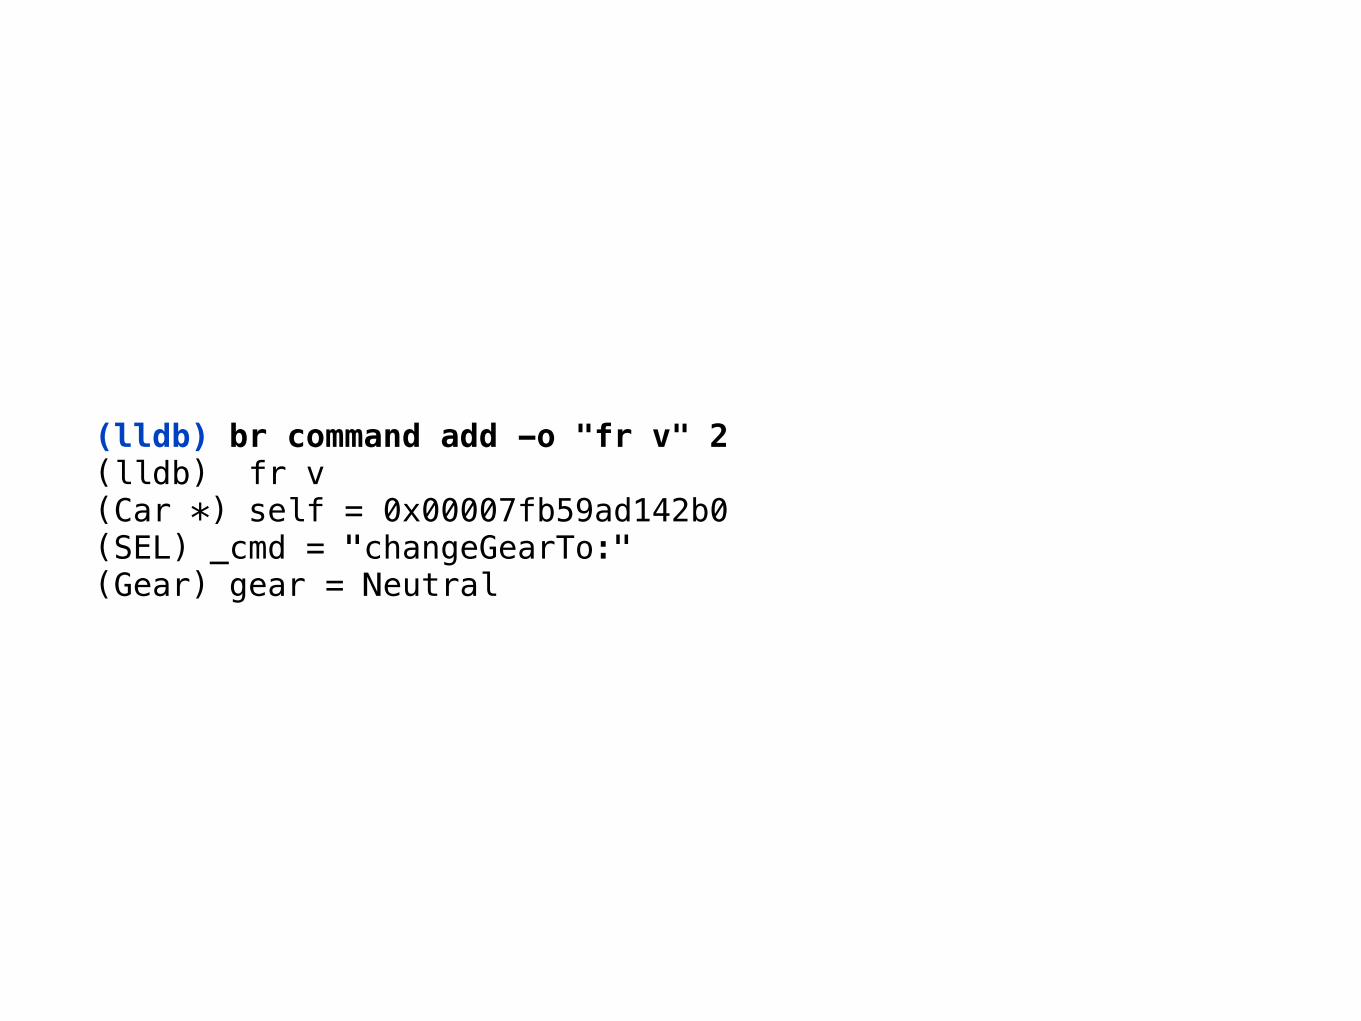
(lldb) br command add -o "fr v" 2 (lldb) fr v(Car *) self = 0x00007fb59ad142b0(SEL) _cmd = "changeGearTo:"(Gear) gear = Neutral

(lldb) br command add 1 Enter your debugger command(s). Type 'DONE' to end.> fr v> continue> DONE

(lldb) br command add 1 Enter your debugger command(s). Type 'DONE' to end.> fr v> continue> DONE (lldb) fr v(Car *) self = 0x00007f8061625490(SEL) _cmd = "changeGearTo:"(Gear) gear = Reverse(lldb) continueProcess 2068 resumingCommand #2 'continue' continued the target.
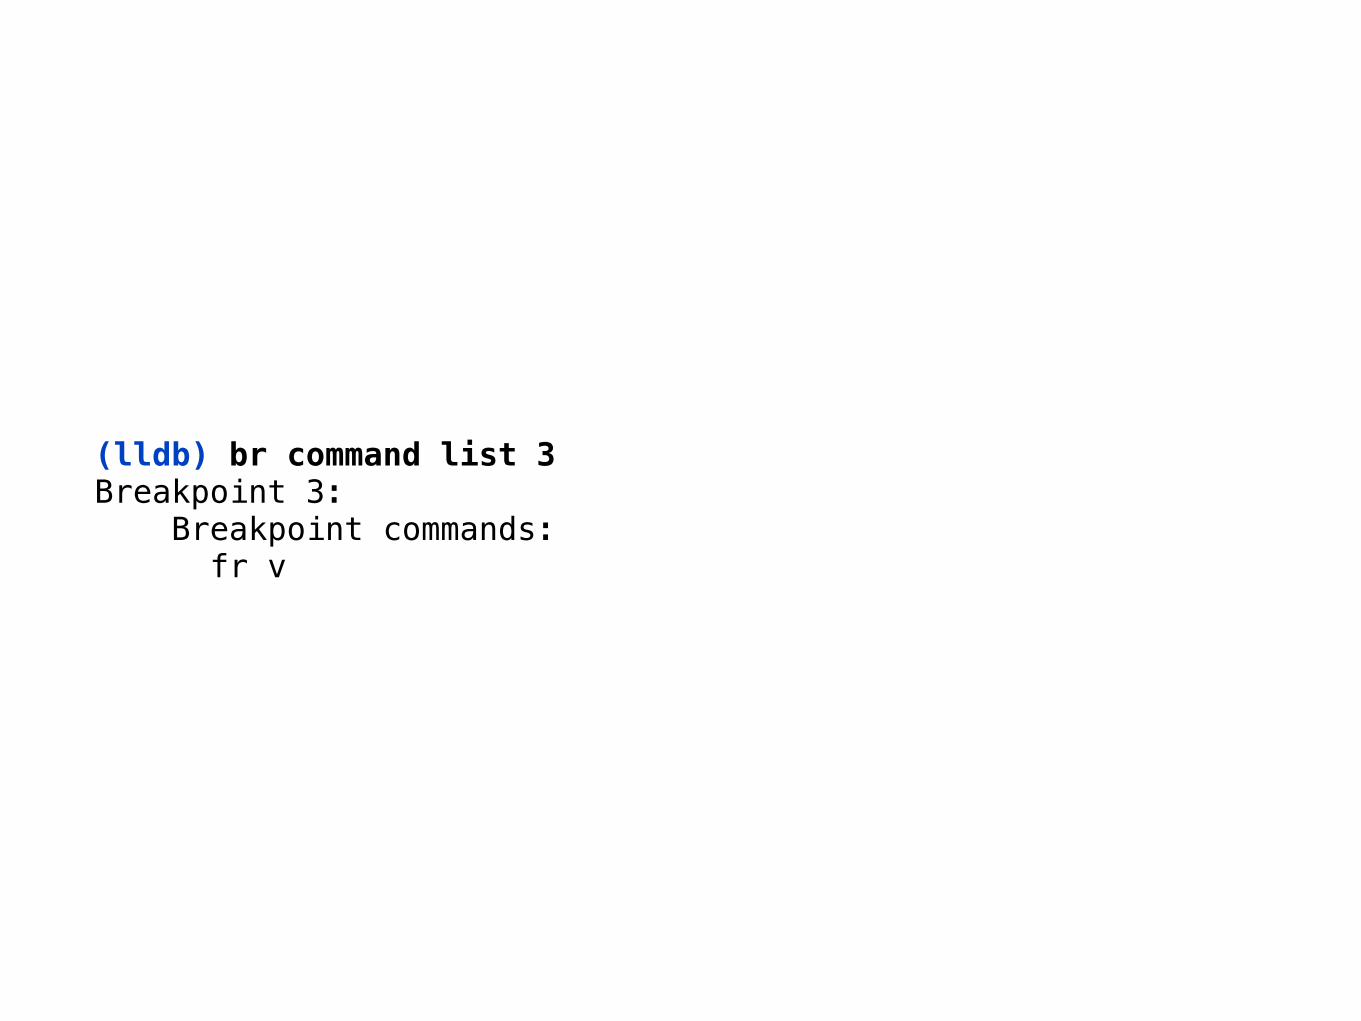
(lldb) br command list 3 Breakpoint 3: Breakpoint commands: fr v

(lldb) br command delete 3


Watchpoints


a watchpoint tracks a value over time

…kind of like KVO!

[self.myCar addObserver:self forKeyPath:@"speed" options:NSKeyValueObservingOptionNew context:KVOContext];
- (void)observeValueForKeyPath:(NSString *)keyPath ofObject:(id)object change:(NSDictionary *)change context:(void *)context{ if (car.speed > 1000) { NSLog(@"WHY AM I GOING SO FAST %ld", (long)car.speed); }}

- (void)setSpeed:(NSInteger)speed { _speed = speed; if (_speed > 1000) { NSLog(@"WHY AM I GOING SO FAST %ld", (long)_speed); } }

breakpoint: place watchpoint: value
watchpoint set

watch set

(lldb) watch set var self.speederror: "self" is a pointer and . was used to attempt toaccess "speed". Did you mean "self->speed"? (lldb) watch set var self->speederror: "speed" is not a member of "(Car *const) self" (lldb) watch set var _speed

watch modify -c … -i …

(lldb) watch set var _speed Watchpoint created: Watchpoint 1: addr = 0x7fb9c145d768 size= 8 state = enabled type = w watchpoint spec = ‘_speed' new value: 0 (lldb) watch modify -c '(_speed==15)' (lldb) c Process 2150 resuming
Watchpoint 1 hit:old value: 0new value: 15(lldb)


(lldb) watch set var _speedWatchpoint created: Watchpoint 1: addr = 0x7fa3b2e05278 size= 8 state = enabled type = w watchpoint spec = ‘_speed' new value: 0(lldb) watch modify -c '(_speed==15)' (lldb) watch command add 1 Enter your debugger command(s). Type 'DONE' to end.> p _speed> continue> DONE (lldb) c Process 2252 resuming (NSInteger) $16 = 15Process 2252 resumingCommand #2 'continue' continued the target.

Stopped due to an error evaluating condition of watchpoint Watchpoint 1: addr = 0x7f84d940a180 size = 8 state = disabled type = w: "(_gear==First)" error: use of undeclared identifier 'First' error: 1 errors parsing expression
Watchpoint 1 hit: old value: Park new value: First

watch delete watch enable watch disable

(lldb) watch disable 11 watchpoints disabled. (lldb) watch enable 11 watchpoints enabled.


script


write code to debug your code
copy + paste


script

(lldb) help script Pass an expression to the script interpreter for evaluation and
return the results. Drop into the interactive interpreter if no expression is given. This command takes 'raw' input (no need to quote stuff).
Syntax: script [<script-expression-for-evaluation>]

(lldb) scriptPython Interactive Interpreter. To exit, type 'quit()', 'exit()'. >>> print lldb.debugger Debugger (instance: "debugger_47", id: 47) >>> print lldb.target Cars >>> print lldb.process SBProcess: pid = 6425, state = stopped, threads = 5, executable = Cars >>> print lldb.thread SBThread: tid = 0x3813e >>> print lldb.frame frame #0: 0x0000000103075979 Cars`-[ViewController viewDidLoad](self=0x00007f8173f23680, _cmd=0x0000000104507cfb) + 57 at ViewController.m:24 >>> quit()

writing functions

def breakpoint_func(frame, bp_loc, dict): # implementation here # return false to skip
current stack framebreakpoint locationpython session dictuseless

Sample Case

only stop when -changeGearTo:
is in the call stack

find_in_stack = ['-[Car changeGearTo:]'] def continue_ignored(frame, bp_loc, dict): global find_in_stack names = set([frame.GetFunctionName() for frame in frame.GetThread()]) all_ignored = set(find_in_stack) ignored_here = all_ignored.intersection(names) if len(ignored_here) == 0: return False
quit()

find_in_stack = [def names = set([frame.GetFunctionName() all_ignored = set(find_in_stack) ignored_here = all_ignored.intersection(names) return False
quit()
find_in_stack = ['-[Car changeGearTo:]'] def continue_ignored(frame, bp_loc, dict): global find_in_stack names = set([frame.GetFunctionName() for frame in frame.GetThread()]) all_ignored = set(find_in_stack) ignored_here = all_ignored.intersection(names) if len(ignored_here) == 0: return False
quit()
stack symbolfunction declaration
global accessor
all functions in stack
check if symbol we want is in this stack
if it isn’t, continue

find_in_stack = ['-[Car changeGearTo:]'] def continue_ignored(frame, bp_loc, dict): global find_in_stack names = set([frame.GetFunctionName() for frame in frame.GetThread()]) all_ignored = set(find_in_stack) ignored_here = all_ignored.intersection(names) if len(ignored_here) == 0: return False
quit()


br command add -s python #
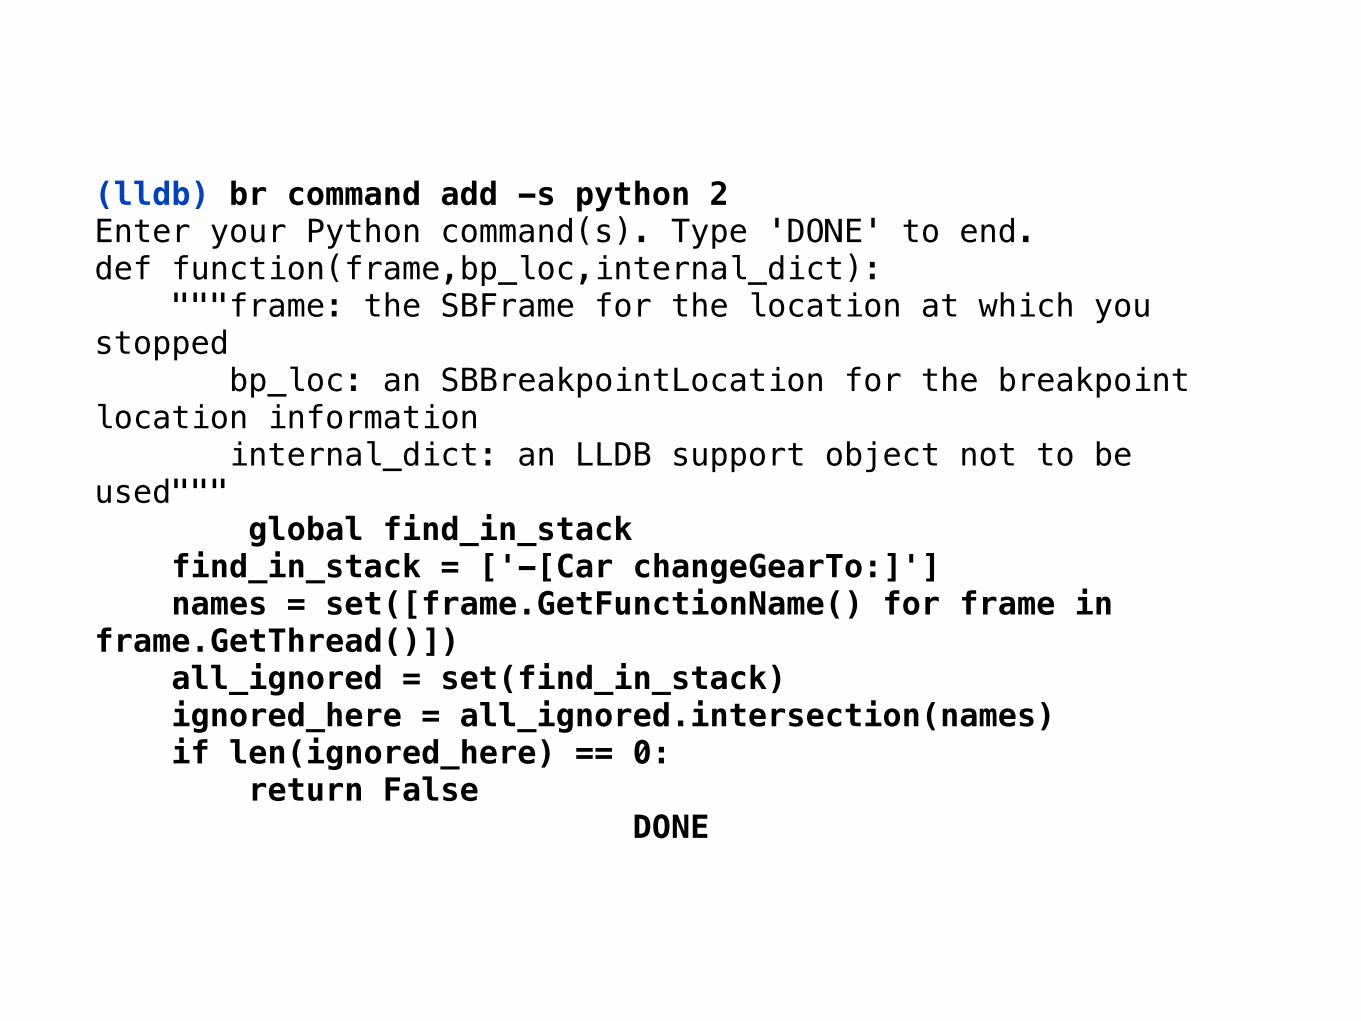
(lldb) br command add -s python 2 Enter your Python command(s). Type 'DONE' to end.def function(frame,bp_loc,internal_dict): """frame: the SBFrame for the location at which you stopped bp_loc: an SBBreakpointLocation for the breakpoint location information internal_dict: an LLDB support object not to be used""" global find_in_stack find_in_stack = ['-[Car changeGearTo:]'] names = set([frame.GetFunctionName() for frame in frame.GetThread()]) all_ignored = set(find_in_stack) ignored_here = all_ignored.intersection(names) if len(ignored_here) == 0: return False DONE

(lldb) br command add -s python 2 -o “print 1+1”


type summary

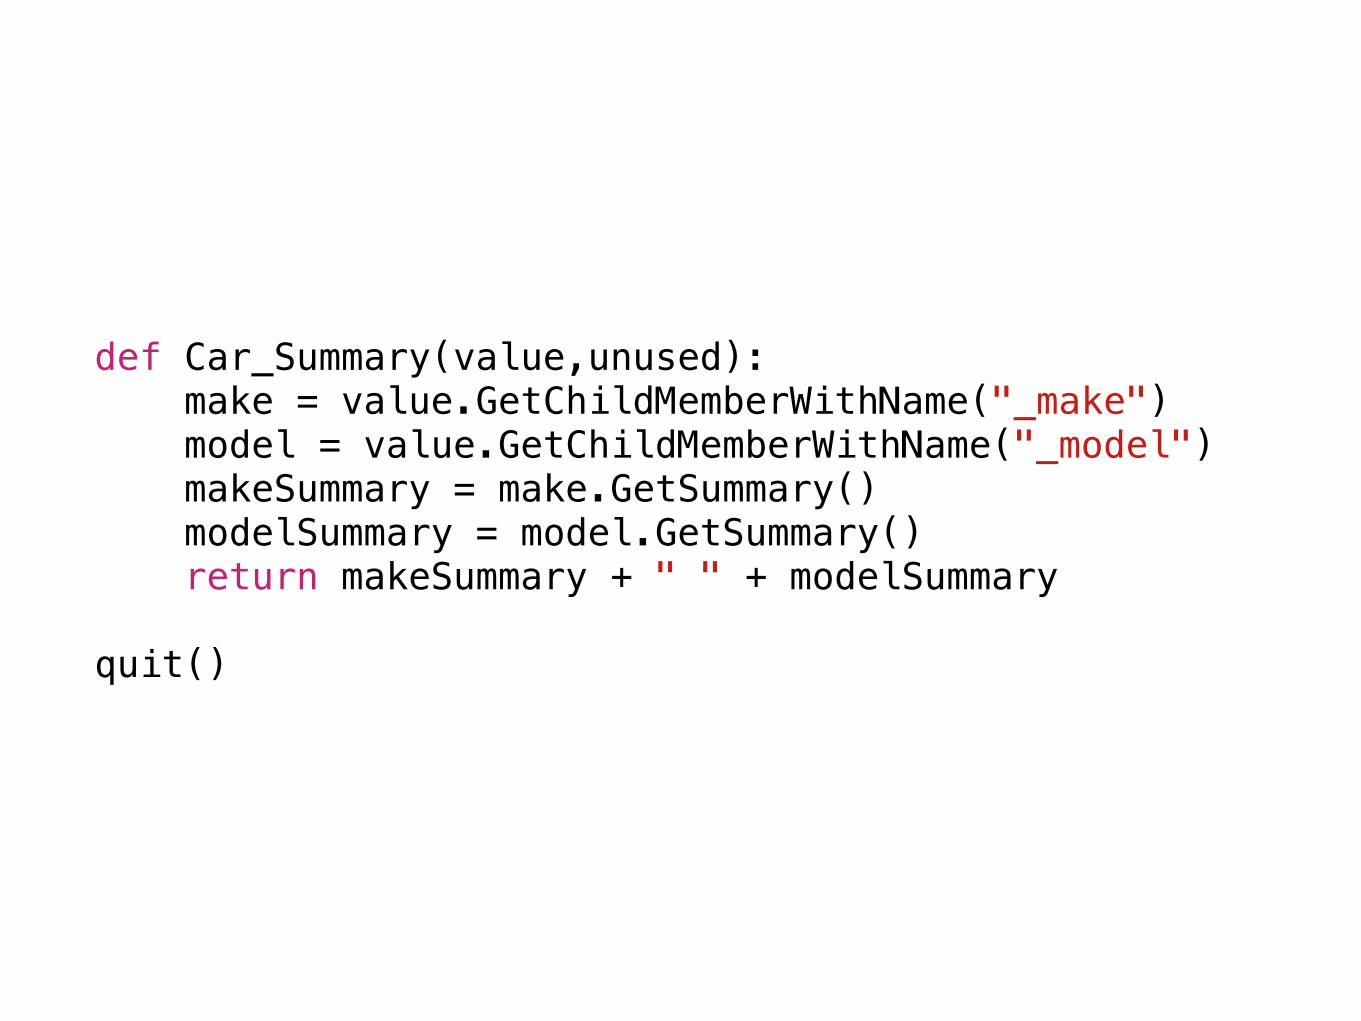
Use a python function to better describe a class

def Car_Summary(value,unused): make = value.GetChildMemberWithName("_make") model = value.GetChildMemberWithName("_model") makeSummary = make.GetSummary() modelSummary = model.GetSummary() return makeSummary + " " + modelSummary
quit()

def make = value.GetChildMemberWithName( model = value.GetChildMemberWithName( makeSummary = make.GetSummary() modelSummary = model.GetSummary()
quit()
def Car_Summary(value,unused): make = value.GetChildMemberWithName("_make") model = value.GetChildMemberWithName("_model") makeSummary = make.GetSummary() modelSummary = model.GetSummary() return makeSummary + " " + modelSummary quit()
value is the frameget the variables we want
printable summaries
return a string
def Car_Summary(value,unused): make = value.GetChildMemberWithName("_make") model = value.GetChildMemberWithName("_model") makeSummary = make.GetSummary() modelSummary = model.GetSummary() return makeSummary + " " + modelSummary
quit()


• Only break after another breakpoint has been hit
• Check multiple threads for a symbol
• Data formatters for everything
• Custom LLDB commands
More Use Cases

swift

p

(lldb) po self.myCar <SwiftCars.Car: 0x7fe8bb456a60>
(lldb) p *self.myCar error: <EXPR>:1:1: error: '*' is not a prefix unary operator*self.myCar^

(lldb) fr v -F self.myCar self.myCar = 0x00007fe8bb456a60self.myCar =self.myCar.isa = SwiftCars.Carself.myCar.make._core._owner = nilself.myCar.model._core._owner = nilself.myCar.color = 0x00007fe8bb452c80self.myCar.color.isa = UICachedDeviceRGBColorself.myCar.color._systemColorName = 0x00007fe8bb4424c0 “blueColor"self.myCar.color.redComponent = 0self.myCar.color.greenComponent = 0self.myCar.color.blueComponent = 1self.myCar.color.alphaComponent = 1self.myCar.color.cachedColor = 0x0000000000000000self.myCar.color.cachedColorOnceToken = 0self.myCar.running.value = 0self.myCar.gear = Park

type summary
calling functions

(lldb) po self.canChangeGearTo(0) error: property 'canChangeGearTo' not found on object of type 'Car *'error: 1 errors parsing expression

frame lang == lldb lang

script
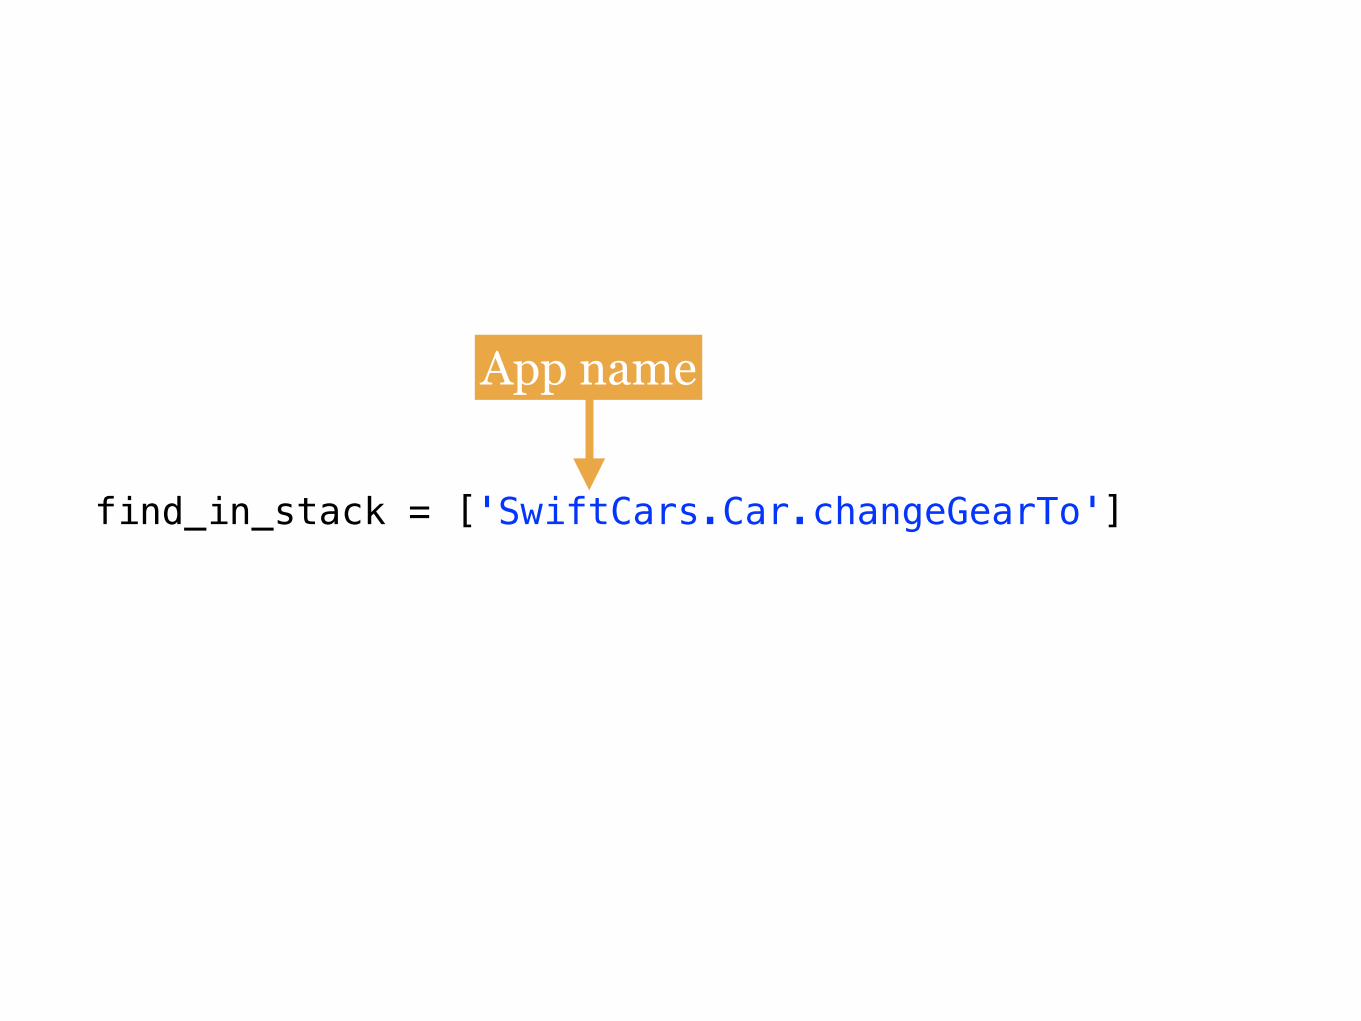
find_in_stack = ['SwiftCars.Car.changeGearTo']
App name

Resources• WWDC ’13 Session 413
• WWDC ’14 Sessions 409 & 410
• http://lldb.llvm.org/
• http://www.objc.io/issue-19/lldb-debugging.html
• http://blog.ittybittyapps.com/blog/2013/11/07/integrating-reveal-without-modifying-your-xcode-project/
• https://github.com/facebook/chisel
• https://developer.apple.com/library/mac/documentation/IDEs/Conceptual/gdb_to_lldb_transition_guide/document/lldb-terminal-workflow-tutorial.html

Questions?@MicheleTitolo
Related Documents