Annual Report 2016/ 17 More than

Welcome message from author
This document is posted to help you gain knowledge. Please leave a comment to let me know what you think about it! Share it to your friends and learn new things together.
Transcript
Annu
al R
epor
t 201
6/17
More than
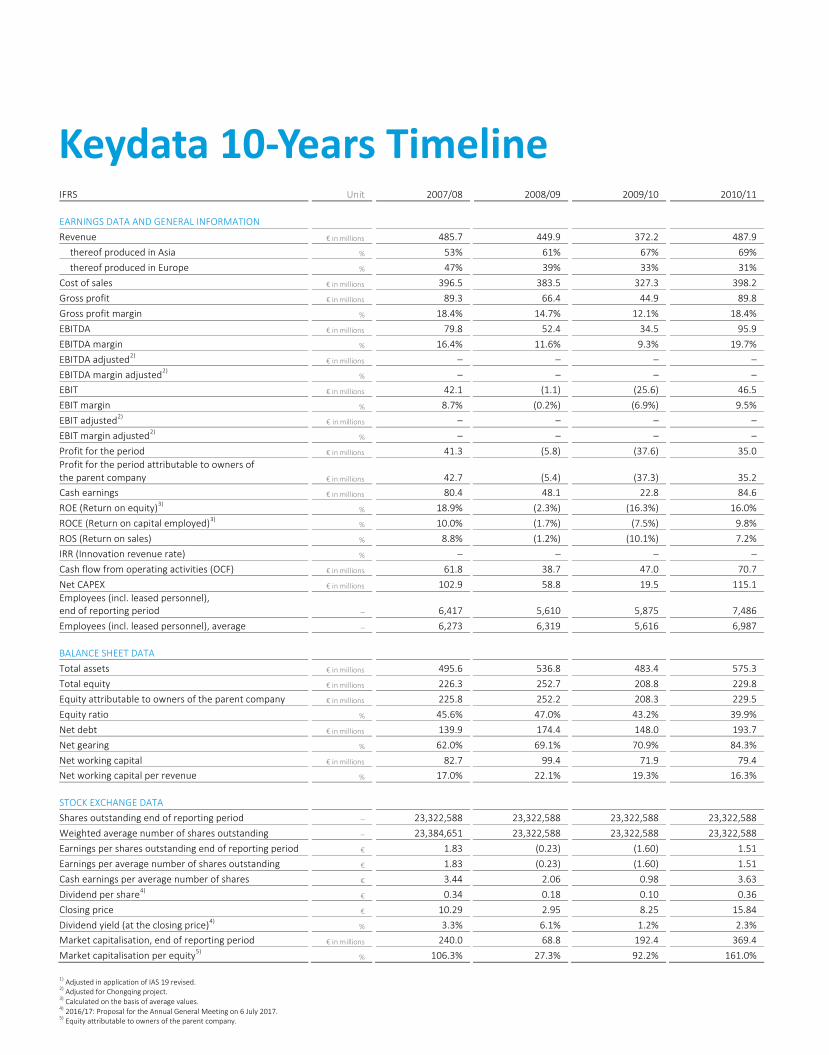
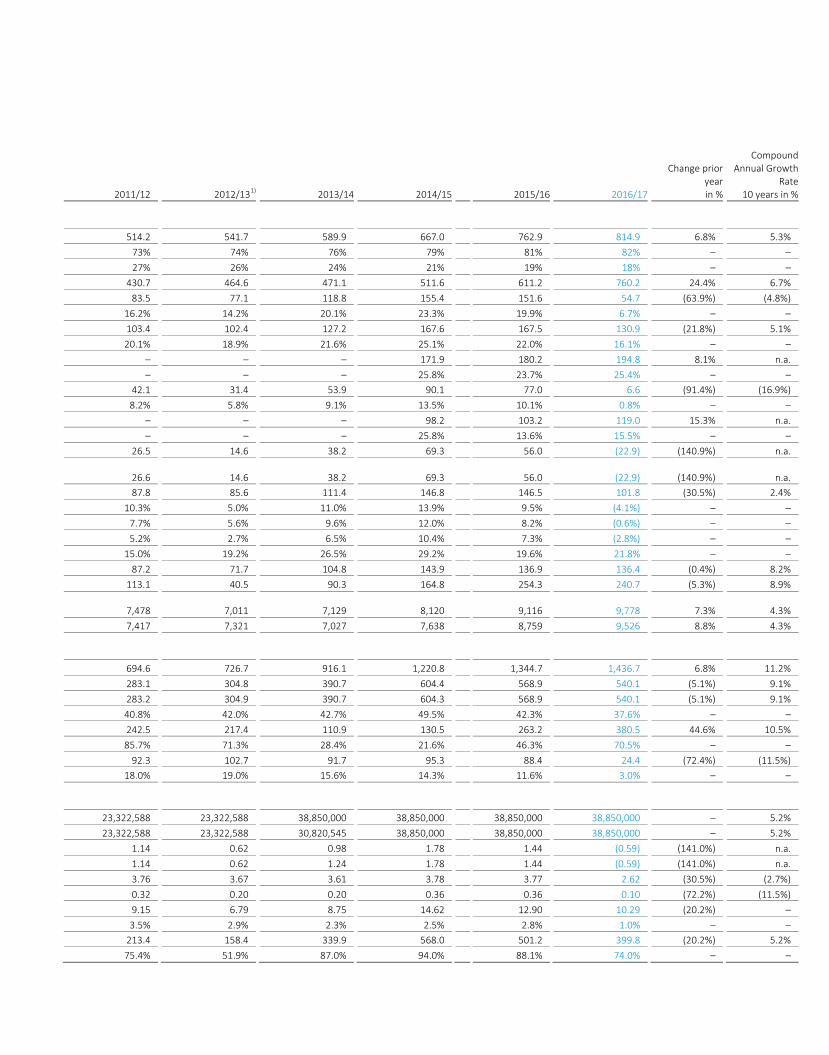
Keydata 10-Years Timeline
IFRS
Unit
2007/08
2008/09
2009/10
2010/11
2011/12
2012/13
1)
2013/14
2014/15
2015/16
2016/17
Changeprioryearin%
CompoundAnnualGrowth
Rate10yearsin%
EARNINGSDATAANDGENERALINFORMATION
Revenue
€inmillions
485.7
449.9
372.2
487.9
514.2
541.7
589.9
667.0
762.9
814.9
6.8%
5.3%
thereofproducedinAsia
%
53%
61%
67%
69%
73%
74%
76%
79%
81%
82%
–
–thereofproducedinEurope
%
47%
39%
33%
31%
27%
26%
24%
21%
19%
18%
–
–
Costofsales
€inmillions
396.5
383.5
327.3
398.2
430.7
464.6
471.1
511.6
611.2
760.2
24.4%
6.7%Grossprofit
€inmillions
89.3
66.4
44.9
89.8
83.5
77.1
118.8
155.4
151.6
54.7
(63.9%)
(4.8%)
Grossprofitmargin
%
18.4%
14.7%
12.1%
18.4%
16.2%
14.2%
20.1%
23.3%
19.9%
6.7%
–
–EBITDA
€inmillions
79.8
52.4
34.5
95.9
103.4
102.4
127.2
167.6
167.5
130.9
(21.8%)
5.1%
EBITDAmargin
%
16.4%
11.6%
9.3%
19.7%
20.1%
18.9%
21.6%
25.1%
22.0%
16.1%
–
–EBITDAadjusted
2)
€inmillions
–
–
–
–
–
–
–
171.9
180.2
194.8
8.1%
n.a.EBITDAmarginadjusted
2)
%
–
–
–
–
–
–
–
25.8%
23.7%
25.4%
–
–EBIT
€inmillions
42.1
(1.1)
(25.6)
46.5
42.1
31.4
53.9
90.1
77.0
6.6
(91.4%)
(16.9%)
EBITmargin
%
8.7%
(0.2%)
(6.9%)
9.5%
8.2%
5.8%
9.1%
13.5%
10.1%
0.8%
–
–EBITadjusted
2)
€inmillions
–
–
–
–
–
–
–
98.2
103.2
119.0
15.3%
n.a.EBITmarginadjusted
2)
%
–
–
–
–
–
–
–
25.8%
13.6%
15.5%
–
–Profitfortheperiod
€inmillions
41.3
(5.8)
(37.6)
35.0
26.5
14.6
38.2
69.3
56.0
(22.9)
(140.9%)
n.a.
Profitfortheperiodattributabletoownersoftheparentcompany
€inmillions
42.7
(5.4)
(37.3)
35.2
26.6
14.6
38.2
69.3
56.0
(22.9)
(140.9%)
n.a.
Cashearnings
€inmillions
80.4
48.1
22.8
84.6
87.8
85.6
111.4
146.8
146.5
101.8
(30.5%)
2.4%ROE(Returnonequity)
3)
%
18.9%
(2.3%)
(16.3%)
16.0%
10.3%
5.0%
11.0%
13.9%
9.5%
(4.1%)
–
–ROCE(Returnoncapitalemployed)
3)
%
10.0%
(1.7%)
(7.5%)
9.8%
7.7%
5.6%
9.6%
12.0%
8.2%
(0.6%)
–
–ROS(Returnonsales)
%
8.8%
(1.2%)
(10.1%)
7.2%
5.2%
2.7%
6.5%
10.4%
7.3%
(2.8%)
–
–
IRR(Innovationrevenuerate)
%
–
–
–
–
15.0%
19.2%
26.5%
29.2%
19.6%
21.8%
–
–Cashflowfromoperatingactivities(OCF)
€inmillions
61.8
38.7
47.0
70.7
87.2
71.7
104.8
143.9
136.9
136.4
(0.4%)
8.2%
NetCAPEX
€inmillions
102.9
58.8
19.5
115.1
113.1
40.5
90.3
164.8
254.3
240.7
(5.3%)
8.9%Employees(incl.leasedpersonnel),endofreportingperiod
–
6,417
5,610
5,875
7,486
7,478
7,011
7,129
8,120
9,116
9,778
7.3%
4.3%
Employees(incl.leasedpersonnel),average
–
6,273
6,319
5,616
6,987
7,417
7,321
7,027
7,638
8,759
9,526
8.8%
4.3%
BALANCESHEETDATA
Totalassets
€inmillions
495.6
536.8
483.4
575.3
694.6
726.7
916.1
1,220.8
1,344.7
1,436.7
6.8%
11.2%Totalequity
€inmillions
226.3
252.7
208.8
229.8
283.1
304.8
390.7
604.4
568.9
540.1
(5.1%)
9.1%
Equityattributabletoownersoftheparentcompany
€inmillions
225.8
252.2
208.3
229.5
283.2
304.9
390.7
604.3
568.9
540.1
(5.1%)
9.1%Equityratio
%
45.6%
47.0%
43.2%
39.9%
40.8%
42.0%
42.7%
49.5%
42.3%
37.6%
–
–
Netdebt
€inmillions
139.9
174.4
148.0
193.7
242.5
217.4
110.9
130.5
263.2
380.5
44.6%
10.5%Netgearing
%
62.0%
69.1%
70.9%
84.3%
85.7%
71.3%
28.4%
21.6%
46.3%
70.5%
–
–
Networkingcapital
€inmillions
82.7
99.4
71.9
79.4
92.3
102.7
91.7
95.3
88.4
24.4
(72.4%)
(11.5%)Networkingcapitalperrevenue
%
17.0%
22.1%
19.3%
16.3%
18.0%
19.0%
15.6%
14.3%
11.6%
3.0%
–
–
STOCKEXCHANGEDATA
Sharesoutstandingendofreportingperiod
–
23,322,588
23,322,588
23,322,588
23,322,588
23,322,588
23,322,588
38,850,000
38,850,000
38,850,000
38,850,000
–
5.2%Weightedaveragenumberofsharesoutstanding
–
23,384,651
23,322,588
23,322,588
23,322,588
23,322,588
23,322,588
30,820,545
38,850,000
38,850,000
38,850,000
–
5.2%
Earningspersharesoutstandingendofreportingperiod
€
1.83
(0.23)
(1.60)
1.51
1.14
0.62
0.98
1.78
1.44
(0.59)
(141.0%)
n.a.Earningsperaveragenumberofsharesoutstanding
€
1.83
(0.23)
(1.60)
1.51
1.14
0.62
1.24
1.78
1.44
(0.59)
(141.0%)
n.a.
Cashearningsperaveragenumberofshares
€
3.44
2.06
0.98
3.63
3.76
3.67
3.61
3.78
3.77
2.62
(30.5%)
(2.7%)Dividendpershare
4)
€
0.34
0.18
0.10
0.36
0.32
0.20
0.20
0.36
0.36
0.10
(72.2%)
(11.5%)Closingprice
€
10.29
2.95
8.25
15.84
9.15
6.79
8.75
14.62
12.90
10.29
(20.2%)
–
Dividendyield(attheclosingprice)
4)
%
3.3%
6.1%
1.2%
2.3%
3.5%
2.9%
2.3%
2.5%
2.8%
1.0%
–
–Marketcapitalisation,endofreportingperiod
€inmillions
240.0
68.8
192.4
369.4
213.4
158.4
339.9
568.0
501.2
399.8
(20.2%)
5.2%
Marketcapitalisationperequity
5)
%
106.3%
27.3%
92.2%
161.0%
75.4%
51.9%
87.0%
94.0%
88.1%
74.0%
–
–1)AdjustedinapplicationofIAS19revised.2)AdjustedforChongqingproject.3)Calculatedonthebasisofaveragevalues.4)2016/17:ProposalfortheAnnualGeneralMeetingon6July2017.5)Equityattributabletoownersoftheparentcompany.
Keydata10-YearsTimeline
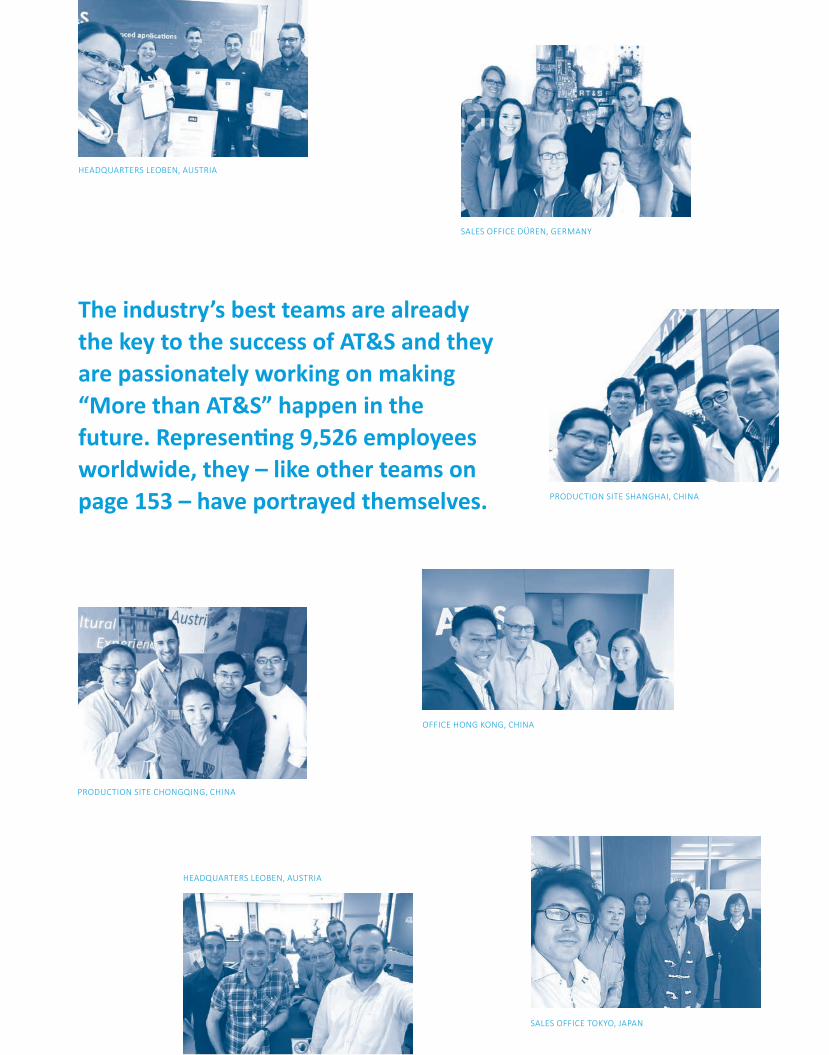
PRODUCTION SITE SHANGHAI, CHINA
OFFICE HONG KONG, CHINA
SALES OFFICE TOKYO, JAPAN
HEADQUARTERS LEOBEN, AUSTRIA
SALES OFFICE DÜREN, GERMANY
HEADQUARTERS LEOBEN, AUSTRIA
The industry’s best teams are already the key to the success of AT&S and they are passionately working on making “More than AT&S” happen in the future. Representing 9,526 employees worldwide, they – like other teams on page 153 – have portrayed themselves.
PRODUCTION SITE CHONGQING, CHINA
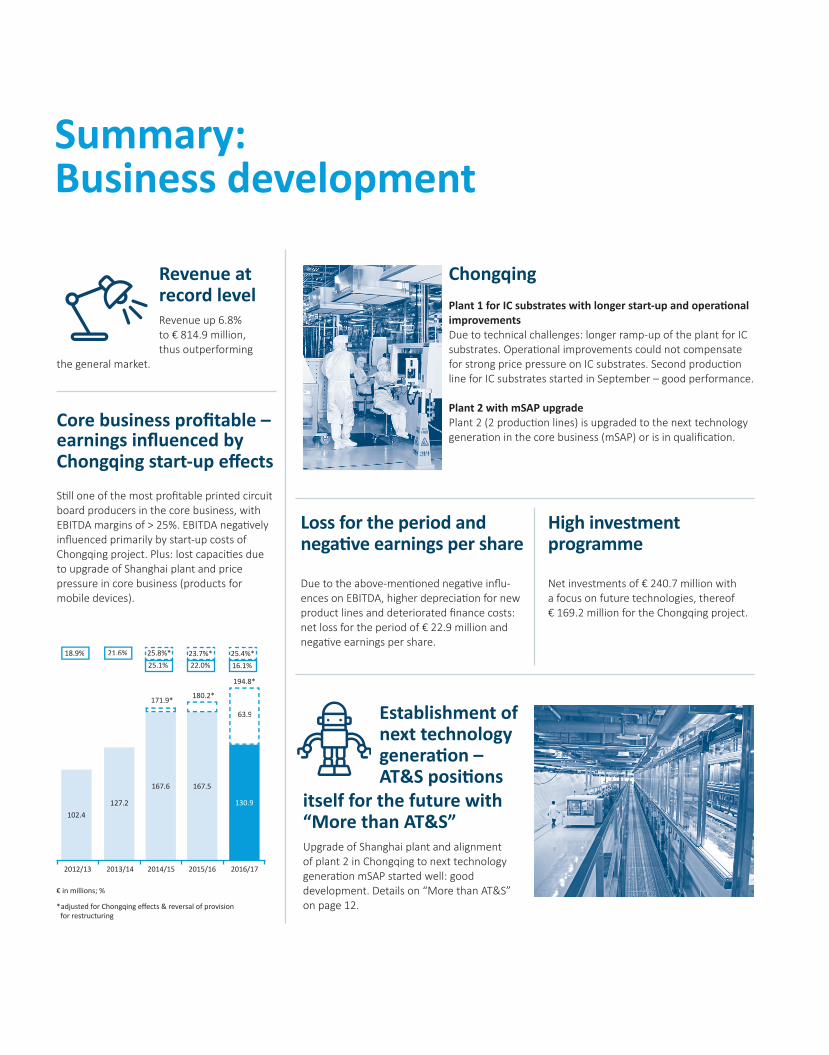
Summary:Business development
Revenue at record level Revenue up 6.8% to € 814.9 million, thus outperforming
the general market.
Core business profi table –earnings infl uenced by Chongqing start-up eff ects
Sti ll one of the most profi table printed circuit board producers in the core business, with EBITDA margins of > 25%. EBITDA negati velyinfl uenced primarily by start-up costs of Chongqing project. Plus: lost capaciti es due to upgrade of Shanghai plant and price pressure in core business (products for mobile devices).
ChongqingPlant 1 for IC substrates with longer start-up and operati onal improvementsDue to technical challenges: longer ramp-up of the plant for IC substrates. Operati onal improvements could not compensate for strong price pressure on IC substrates. Second producti on line for IC substrates started in September – good performance.
Plant 2 with mSAP upgradePlant 2 (2 producti on lines) is upgraded to the next technology generati on in the core business (mSAP) or is in qualifi cati on.
Loss for the period and negati ve earnings per share
Due to the above-menti oned negati ve infl u-ences on EBITDA, higher depreciati on for new product lines and deteriorated fi nance costs: net loss for the period of € 22.9 million and negati ve earnings per share.
Establishment of next technology generati on – AT&S positi ons
itself for the future with “More than AT&S”Upgrade of Shanghai plant and alignment of plant 2 in Chongqing to next technology generati on mSAP started well: good development. Details on “More than AT&S” on page 12.
High investment programme
Net investments of € 240.7 million with a focus on future technologies, thereof € 169.2 million for the Chongqing project.
102.4
2012/13
€ in millions; %
*adjusted for Chongqing eff ects & reversal of provision for restructuring
2013/14 2014/15 2015/16 2016/17
127.2
167.6
25.8%*21.6%18.9%25.1%
23.7%*22.0%
25.4%*16.1%
167.5
63.9
194.8*
180.2*171.9*
130.9
63.9
21.6%18.9%
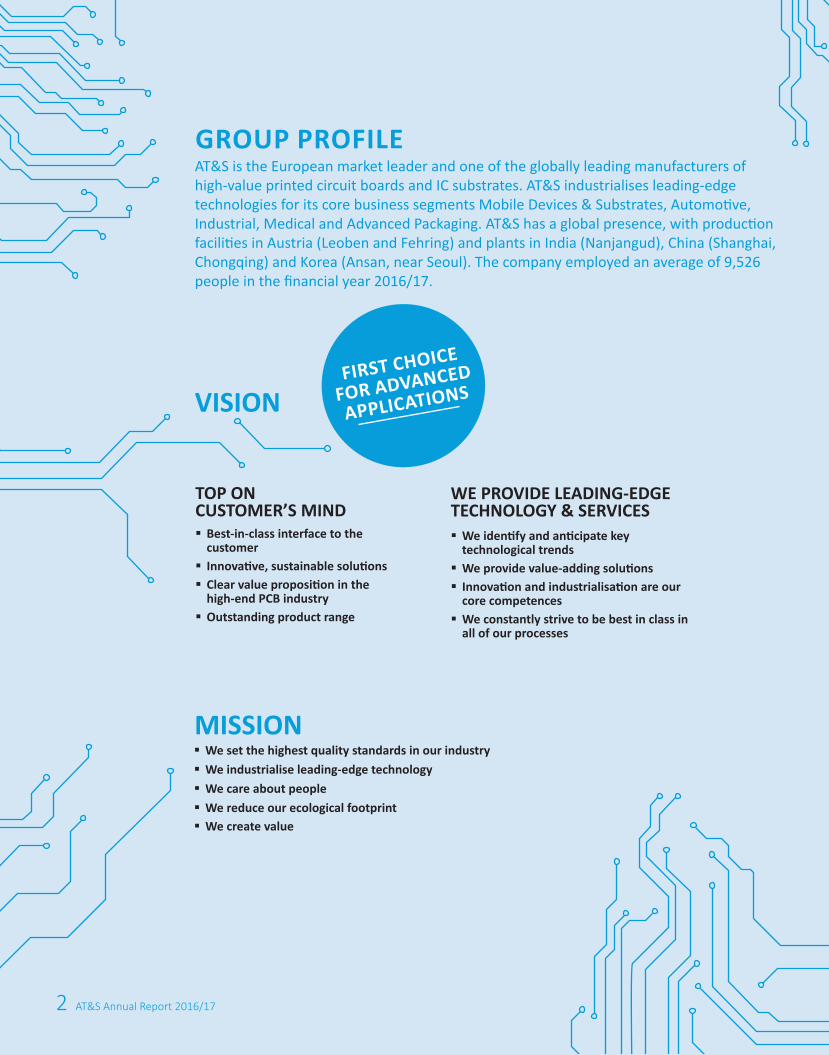
MISSION
2 AT&S Annual Report 2016/17
§ We set the highest quality standards in our industry§ We industrialise leading-edge technology§ We care about people§ We reduce our ecological footprint§ We create value
TOP ON CUSTOMER’S MIND§ Best-in-class interface to the
customer§ Innovative, sustainable solutions§ Clear value proposition in the
high-end PCB industry§ Outstanding product range
WE PROVIDE LEADING-EDGE TECHNOLOGY & SERVICES§ We identify and anticipate key
technological trends§ We provide value-adding solutions§ Innovation and industrialisation are our
core competences§ We constantly strive to be best in class in
all of our processes
GROUP PROFILEAT&S is the European market leader and one of the globally leading manufacturers of high-value printed circuit boards and IC substrates. AT&S industrialises leading-edge technologies for its core business segments Mobile Devices & Substrates, Automotive, Industrial, Medical and Advanced Packaging. AT&S has a global presence, with production facilities in Austria (Leoben and Fehring) and plants in India (Nanjangud), China (Shanghai, Chongqing) and Korea (Ansan, near Seoul). The company employed an average of 9,526 people in the financial year 2016/17.
VISIONFIRST CHOICE
FOR ADVANCED
APPLICATIONS
3Table of Contents
Table of Contents
47 Group Management Report 2016/17 48 Business development 48 Market and industry 53 Profi t situati on 57 Financial positi on 64 Signifi cant events aft er the reporti ng period 65 Plants and branch offi ces 66 Business development by segments 70 Group 70 Employees 74 Sustainability 77 Research and development 79 Risk and opportuniti es management 84 Internal Control and Risk Management System with regard to accounti ng 85 Shareholder structure and disclosure on capital (disclosures according to § 243a Austrian Commercial Code) 87 Outlook
89 Consolidated Financial Statements as of 31 March 2017
140 Statement of all Legal Representati ves
141 Auditor’s Report
145 Glossary
4 AT&S at a glance 4 Business units 5 Group sites 6 Management interview 12 More than AT&S 14 Goals and strategy 16 Market environment
19 Report of the Supervisory Board
22 Investor Relati ons
27 Corporate Governance Report 28 Principles and Corporate Governance Declarati on 31 AT&S AG Management Board 33 AT&S AG Supervisory Board and Annual General Meeti ng 39 Remunerati on Report: Management and Supervisory Boards 43 Directors’ Holdings & Dealings 44 Compliance & other codes of conduct
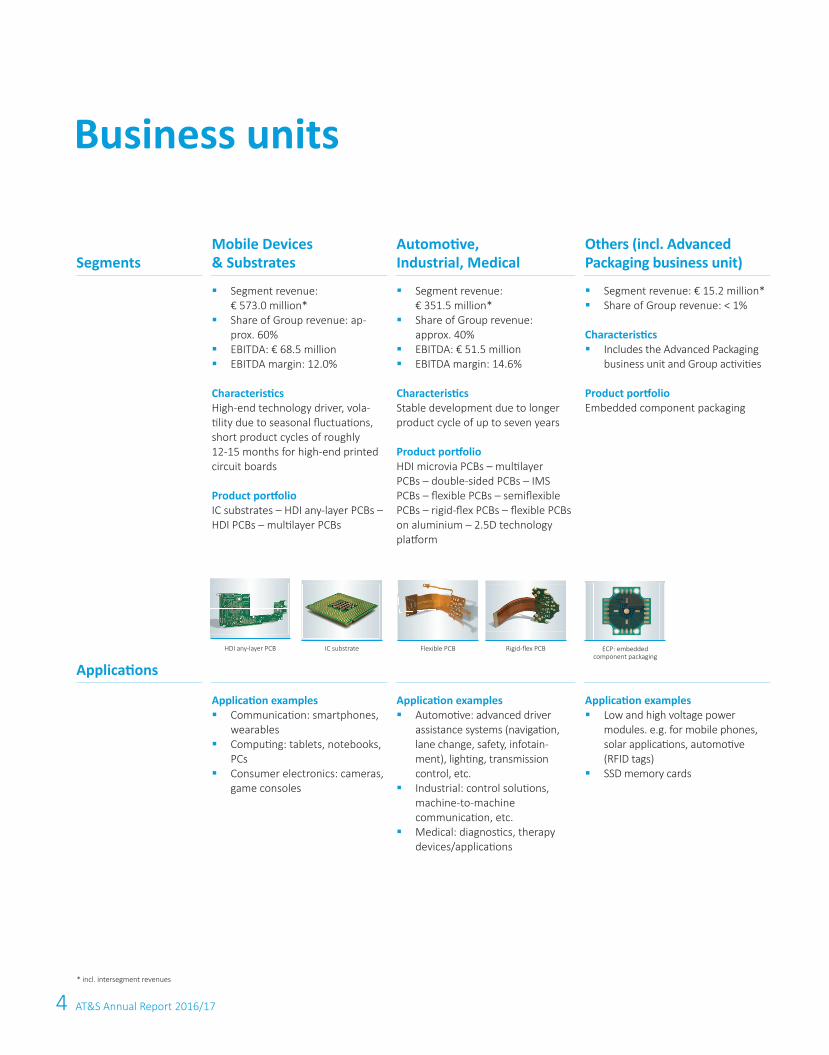
Business units
SegmentsMobile Devices& Substrates
Automoti ve, Industrial, Medical
Others (incl. Advanced Packaging business unit)
Applicati ons
§ Segment revenue: € 573.0 million*
§ Share of Group revenue: ap-prox. 60%
§ EBITDA: € 68.5 million§ EBITDA margin: 12.0%
Characteristi cs High-end technology driver, vola-ti lity due to seasonal fl uctuati ons, short product cycles of roughly 12-15 months for high-end printed circuit boards
Product portf olio IC substrates – HDI any-layer PCBs – HDI PCBs – multi layer PCBs
§ Segment revenue: € 351.5 million*
§ Share of Group revenue: approx. 40%
§ EBITDA: € 51.5 million§ EBITDA margin: 14.6%
Characteristi cs Stable development due to longer product cycle of up to seven years
Product portf olio HDI microvia PCBs – multi layer PCBs – double-sided PCBs – IMS PCBs – fl exible PCBs – semifl exible PCBs – rigid-fl ex PCBs – fl exible PCBs on aluminium – 2.5D technology platf orm
§ Segment revenue: € 15.2 million*§ Share of Group revenue: < 1%
Characteristi cs§ Includes the Advanced Packaging
business unit and Group acti viti es
Product portf olioEmbedded component packaging
Applicati on examples§ Communicati on: smartphones,
wearables§ Computi ng: tablets, notebooks,
PCs§ Consumer electronics: cameras,
game consoles
Applicati on examples§ Automoti ve: advanced driver
assistance systems (navigati on, lane change, safety, infotain-ment), lighti ng, transmission control, etc.
§ Industrial: control soluti ons, machine-to-machine communicati on, etc.
§ Medical: diagnosti cs, therapy devices/applicati ons
Applicati on examples§ Low and high voltage power
modules. e.g. for mobile phones, solar applicati ons, automoti ve (RFID tags)
§ SSD memory cards
4 AT&S Annual Report 2016/17
ECP: embedded component packaging
Flexible PCBIC substrateHDI any-layer PCB Rigid-fl ex PCB
* incl. intersegment revenues
5Business units/Group sites
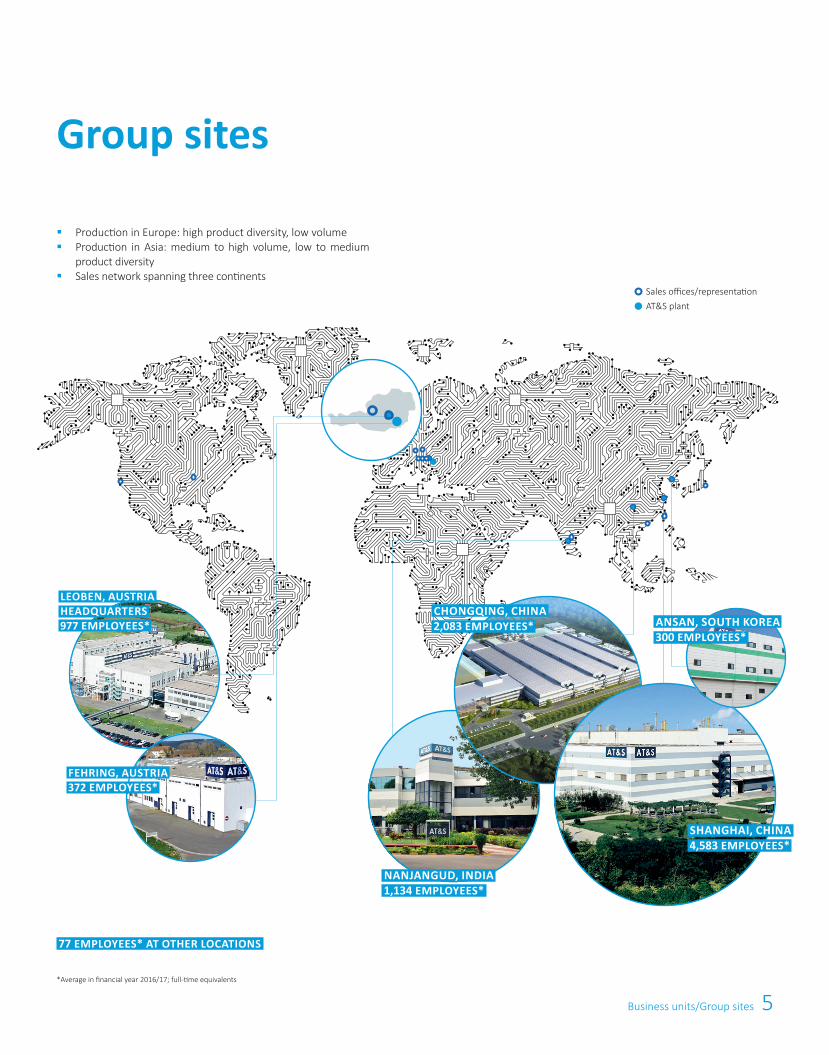
§ Production in Europe: high product diversity, low volume§ Production in Asia: medium to high volume, low to medium
product diversity§ Sales network spanning three continents
Sales offices/representation
AT&S plant
Group sites
LEOBEN, AUSTRIAHEADQUARTERS977 EMPLOYEES*
CHONGQING, CHINA2,083 EMPLOYEES*
FEHRING, AUSTRIA372 EMPLOYEES*
77 EMPLOYEES* AT OTHER LOCATIONS
NANJANGUD, INDIA1,134 EMPLOYEES*
SHANGHAI, CHINA4,583 EMPLOYEES*
ANSAN, SOUTH KOREA300 EMPLOYEES*
*Average in financial year 2016/17; full-time equivalents
6 AT&S Annual Report 2016/17
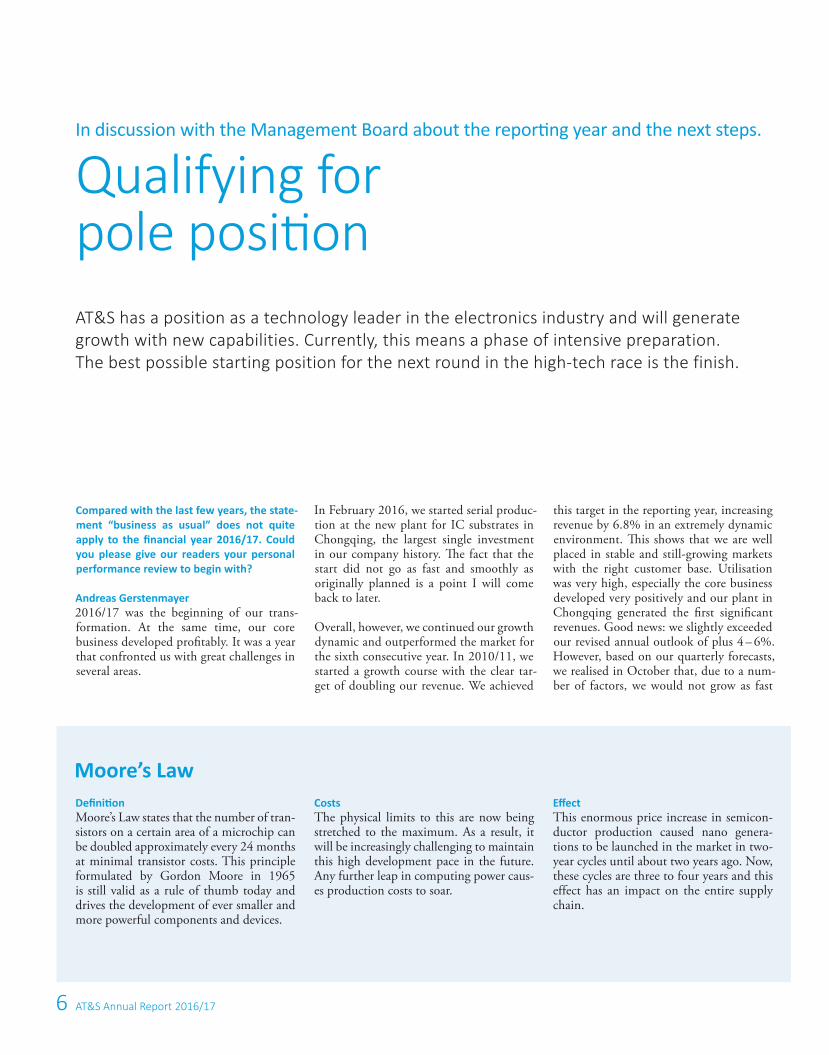
In discussion with the Management Board about the reporti ng year and the next steps.
Qualifying for pole positi on
Compared with the last few years, the state-ment “business as usual” does not quite apply to the fi nancial year 2016/17. Could you please give our readers your personal performance review to begin with?
Andreas Gerstenmayer2016/17 was the beginning of our trans-formation. At the same time, our core business developed profi tably. It was a year that confronted us with great challenges in several areas.
In February 2016, we started serial produc-tion at the new plant for IC substrates in Chongqing, the largest single investment in our company history. Th e fact that the start did not go as fast and smoothly as originally planned is a point I will come back to later.
Overall, however, we continued our growth dynamic and outperformed the market for the sixth consecutive year. In 2010/11, we started a growth course with the clear tar-get of doubling our revenue. We achieved
this target in the reporting year, increasing revenue by 6.8% in an extremely dynamic environment. Th is shows that we are well placed in stable and still-growing markets with the right customer base. Utilisation was very high, especially the core business developed very positively and our plant in Chongqing generated the fi rst signifi cant revenues. Good news: we slightly exceeded our revised annual outlook of plus 4 – 6%. However, based on our quarterly forecasts, we realised in October that, due to a num-ber of factors, we would not grow as fast
AT&S has a position as a technology leader in the electronics industry and will generate growth with new capabilities. Currently, this means a phase of intensive preparation. The best possible starting position for the next round in the high-tech race is the finish.
Defi niti onMoore’s Law states that the number of tran-sistors on a certain area of a microchip can be doubled approximately every 24 months at minimal transistor costs. This principle formulated by Gordon Moore in 1965 is still valid as a rule of thumb today and drives the development of ever smaller and more powerful components and devices.
CostsThe physical limits to this are now being stretched to the maximum. As a result, it will be increasingly challenging to maintain this high development pace in the future. Any further leap in computing power caus-es production costs to soar.
Eff ectThis enormous price increase in semicon-ductor production caused nano genera-tions to be launched in the market in two-year cycles until about two years ago. Now, these cycles are three to four years and this effect has an impact on the entire supply chain.
Moore’s Law
7
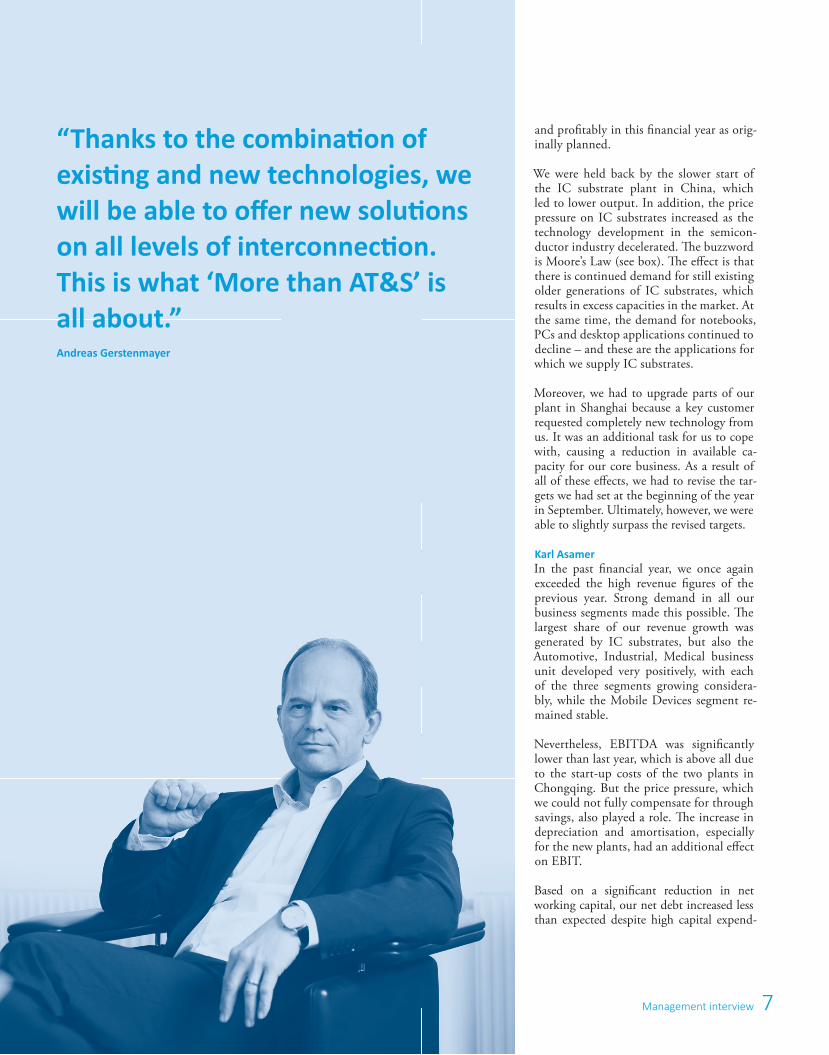
and profi tably in this fi nancial year as orig-inally planned.
We were held back by the slower start of the IC substrate plant in China, which led to lower output. In addition, the price pressure on IC substrates increased as the technology development in the semicon-ductor industry decelerated. Th e buzzword is Moore’s Law (see box). Th e eff ect is that there is continued demand for still existing older generations of IC substrates, which results in excess capacities in the market. At the same time, the demand for notebooks, PCs and desktop applications continued to decline – and these are the applications for which we supply IC substrates.
Moreover, we had to upgrade parts of our plant in Shanghai because a key customer requested completely new technology from us. It was an additional task for us to cope with, causing a reduction in available ca-pacity for our core business. As a result of all of these eff ects, we had to revise the tar-gets we had set at the beginning of the year in September. Ultimately, however, we were able to slightly surpass the revised targets.
Karl AsamerIn the past fi nancial year, we once again exceeded the high revenue fi gures of the previous year. Strong demand in all our business segments made this possible. Th e largest share of our revenue growth was generated by IC substrates, but also the Automotive, Industrial, Medical business unit developed very positively, with each of the three segments growing considera-bly, while the Mobile Devices segment re-mained stable.
Nevertheless, EBITDA was signifi cantly lower than last year, which is above all due to the start-up costs of the two plants in Chongqing. But the price pressure, which we could not fully compensate for through savings, also played a role. Th e increase in depreciation and amortisation, especially for the new plants, had an additional eff ect on EBIT.
Based on a signifi cant reduction in net working capital, our net debt increased less than expected despite high capital expend-
Management interview
“Thanks to the combinati on of existi ng and new technologies, we will be able to off er new soluti ons on all levels of interconnecti on. This is what ‘More than AT&S’ is all about.”Andreas Gerstenmayer
8 AT&S Annual Report 2016/17
iture. As a result, the key fi gure net debt/EBITDA was maintained below 3.0.
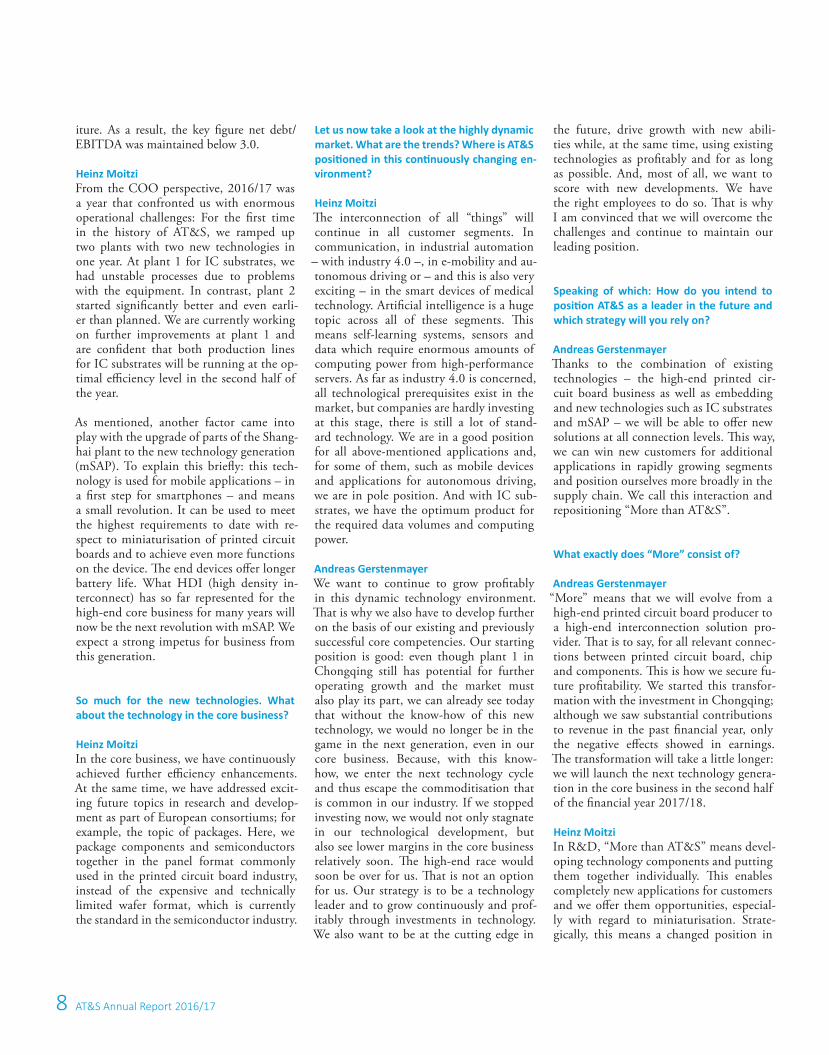
Heinz MoitziFrom the COO perspective, 2016/17 was a year that confronted us with enormous operational challenges: For the fi rst time in the history of AT&S, we ramped up two plants with two new technologies in one year. At plant 1 for IC substrates, we had unstable processes due to problems with the equipment. In contrast, plant 2 started signifi cantly better and even earli-er than planned. We are currently working on further improvements at plant 1 and are confi dent that both production lines for IC substrates will be running at the op-timal effi ciency level in the second half of the year.
As mentioned, another factor came into play with the upgrade of parts of the Shang-hai plant to the new technology generation (mSAP). To explain this briefl y: this tech-nology is used for mobile applications – in a fi rst step for smartphones – and means a small revolution. It can be used to meet the highest requirements to date with re-spect to miniaturisation of printed circuit boards and to achieve even more functions on the device. Th e end devices off er longer battery life. What HDI (high density in-terconnect) has so far represented for the high-end core business for many years will now be the next revolution with mSAP. We expect a strong impetus for business from this generation.
So much for the new technologies. What about the technology in the core business?
Heinz MoitziIn the core business, we have continuously achieved further effi ciency enhancements. At the same time, we have addressed excit-ing future topics in research and develop-ment as part of European consortiums; for example, the topic of packages. Here, we package components and semiconductors together in the panel format commonly used in the printed circuit board industry, instead of the expensive and technically limited wafer format, which is currently the standard in the semiconductor industry.
Let us now take a look at the highly dynamic market. What are the trends? Where is AT&S positi oned in this conti nuously changing en-vironment?
Heinz MoitziTh e interconnection of all “things” will continue in all customer segments. In communication, in industrial automation
– with industry 4.0 –, in e-mobility and au-tonomous driving or – and this is also very exciting – in the smart devices of medical technology. Artifi cial intelligence is a huge topic across all of these segments. Th is means self-learning systems, sensors and data which require enormous amounts of computing power from high-performance servers. As far as industry 4.0 is concerned, all technological prerequisites exist in the market, but companies are hardly investing at this stage, there is still a lot of stand-ard technology. We are in a good position for all above-mentioned applications and, for some of them, such as mobile devices and applications for autonomous driving, we are in pole position. And with IC sub-strates, we have the optimum product for the required data volumes and computing power.
Andreas GerstenmayerWe want to continue to grow profi tably in this dynamic technology environment. Th at is why we also have to develop further on the basis of our existing and previously successful core competencies. Our starting position is good: even though plant 1 in Chongqing still has potential for further operating growth and the market must also play its part, we can already see today that without the know-how of this new technology, we would no longer be in the game in the next generation, even in our core business. Because, with this know-how, we enter the next technology cycle and thus escape the commoditisation that is common in our industry. If we stopped investing now, we would not only stagnate in our technological development, but also see lower margins in the core business relatively soon. Th e high-end race would soon be over for us. Th at is not an option for us. Our strategy is to be a technology leader and to grow continuously and prof-itably through investments in technology. We also want to be at the cutting edge in
the future, drive growth with new abili-ties while, at the same time, using existing technologies as profi tably and for as long as possible. And, most of all, we want to score with new developments. We have the right employees to do so. Th at is why I am convinced that we will overcome the challenges and continue to maintain our leading position.
Speaking of which: How do you intend to positi on AT&S as a leader in the future and which strategy will you rely on?
Andreas GerstenmayerTh anks to the combination of existing technologies – the high-end printed cir-cuit board business as well as embedding and new technologies such as IC substrates and mSAP – we will be able to off er new solutions at all connection levels. Th is way, we can win new customers for additional applications in rapidly growing segments and position ourselves more broadly in the supply chain. We call this interaction and repositioning “More than AT&S”.
What exactly does “More” consist of?
Andreas Gerstenmayer“More” means that we will evolve from a high-end printed circuit board producer to a high-end interconnection solution pro-vider. Th at is to say, for all relevant connec-tions between printed circuit board, chip and components. Th is is how we secure fu-ture profi tability. We started this transfor-mation with the investment in Chongqing; although we saw substantial contributions to revenue in the past fi nancial year, only the negative eff ects showed in earnings. Th e transformation will take a little longer: we will launch the next technology genera-tion in the core business in the second half of the fi nancial year 2017/18.
Heinz MoitziIn R&D, “More than AT&S” means devel-oping technology components and putting them together individually. Th is enables completely new applications for customers and we off er them opportunities, especial-ly with regard to miniaturisation. Strate-gically, this means a changed position in
9Management interview
the value chain: miniaturisation forces us to implement functionalities in increasing-ly smaller spaces. We can already partially off er this today with embedding solutions. Th e vision is the “all-in-one package”, in which a single module with countless components and functionalities is created within a very small space. Segments that were previously clearly defi ned in the val-ue chain – semiconductor, printed circuit board, assembly – will merge. As a result, the entire supply chain will change. With our positioning “More than AT&S”, we can play a signifi cant role in this change: thanks to a larger number of solutions in the development pipeline and the extend-ed IP portfolio, also with increased added value.
Which challenges does AT&S sti ll have to overcome for the positi oning as “More than AT&S” and to return to profi tability?
Andreas GerstenmayerIn general, as always: we have to be able to satisfy new customer requirements in terms of technology and quality. Th is is not something where we can easily come up with quick solutions, even though we have been able to successfully fi nd solutions for the last 30 years. Th e other priority is to achieve further operational improve-ments at the IC substrate plant. With the big learning curve behind us, we are now about to start the optimisation phase. Synchronising over 100 process steps in extremely narrow tolerances is like work-ing with a symphonic orchestra: the goal is perfect harmony. At this stage, our op-erational improvements are still overcom-pensated by the prevailing price pressure. Provided that the price situation improves, we will achieve EBITDA breakeven with the two existing production lines. We are currently evaluating the corresponding solutions.
What do you now expect for the current fi nancial year?
Andreas GerstenmayerMany of the influencing factors of last year will carry on this year – though at different speeds. In the core business, we
“For the fi rst ti me in the history of AT&S, we have ramped up two plants with two new technologies in one year.”Heinz Moitzi
10 AT&S Annual Report 2016/17
currently see stable or increasing demand; there will be no drastic changes in compe-tition. The market will remain tough for IC substrates due to the delayed technolo-gy development and excess capacities. Fig-uratively speaking, we are currently in the qualifying phase for the pole position of the next round in the high-tech race. To get there, we have to strive for a broader technological positioning at the top, and that is exactly what “More than AT&S” is all about. So, we will see signifi cant revenue growth in 2017/18 based on the technologies which we produce in Chongqing and the technology leap in the core business. However, the earnings development will continue to be burdened by the eff ects of Chongqing described before. Th e positive impact on earnings from the new technol-ogy generation will only take eff ect when serial production starts in the second half of the year. We have to continue to further develop our processes and abilities in the fi nancial year 2017/18 in order to reliably meet the growing technological require-ments and to be positioned properly to account for changing business models.
Where do you want to be in 2021?
Andreas Gerstenmayer“More than AT&S” should then have been implemented and we will not only have achieved our desired position in the value chain but also expanded it.
What can investors expect from AT&S?
Andreas GerstenmayerInvestors should be aware that AT&S is now undergoing a transformation phase and currently working hard on some issues that will only have a positive eff ect in the coming fi nancial years. Technology cycles change every few years. In this case, the IC substrate cycle is taking longer than origi-nally projected by the market. On the plus side, we have an excellent track record in the core business. Here we are still fi rmly on track. And we have a clear strategy for the future.
10 AT&S Annual Report 2016/17
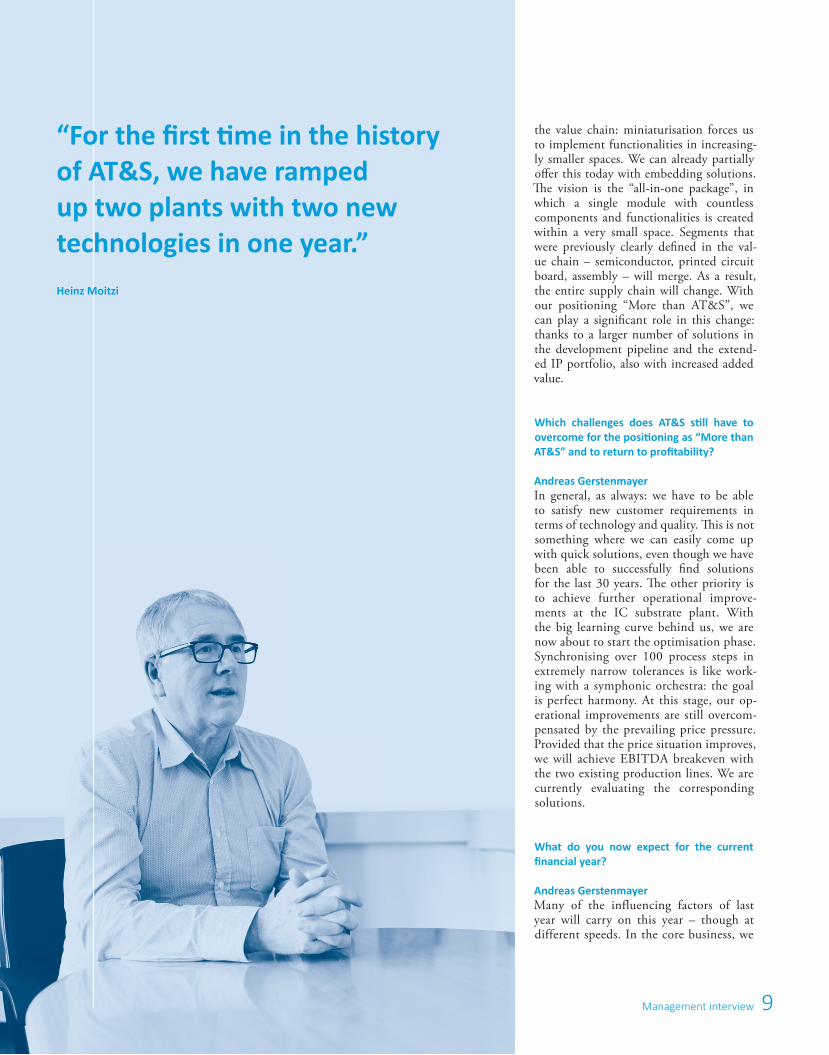
On 2 June 2017, Monika Stoisser-Göhring succeeded Karl Asamer, who resigned from his mandate as CFO for personal reasons as of 2 June 2017. At the end of the interview, Monika Stoisser-Göhring outlines the focus areas and fi nancial targets; for a short biography, please refer to page 31 (Secti on “AT&S AG Management Board”).
Monika Stoisser-Göhring
Karl Asamer
11
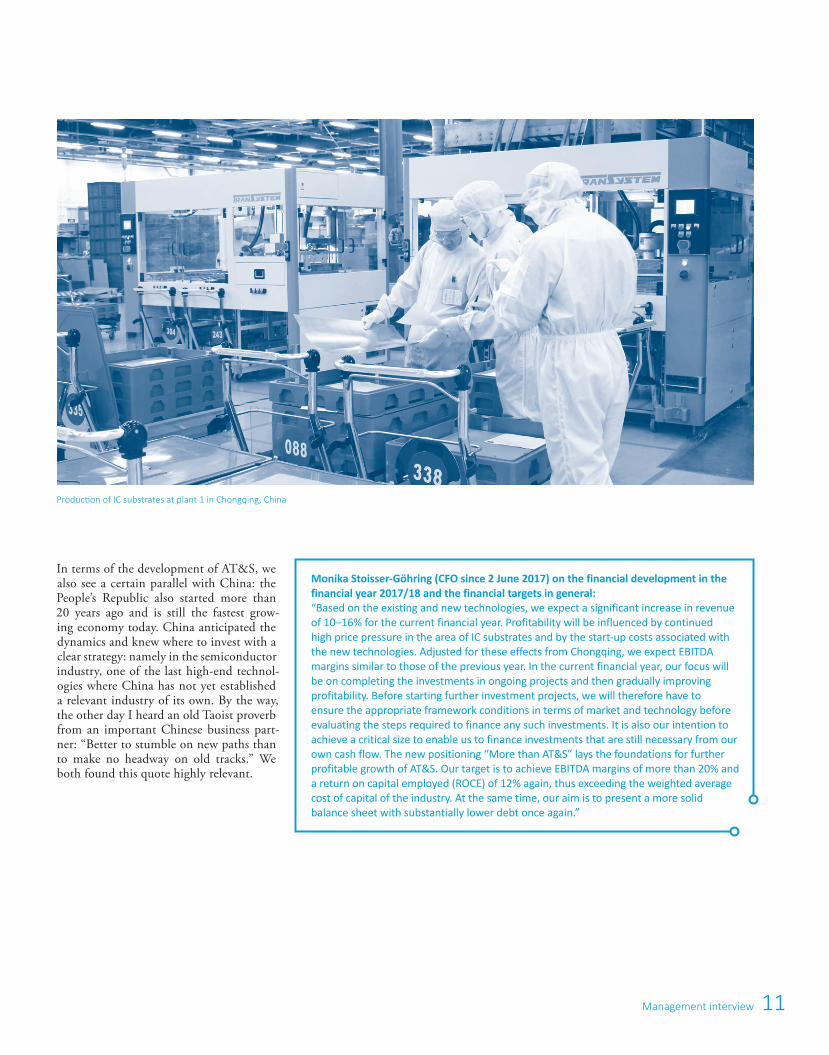
In terms of the development of AT&S, we also see a certain parallel with China: the People’s Republic also started more than 20 years ago and is still the fastest grow-ing economy today. China anticipated the dynamics and knew where to invest with a clear strategy: namely in the semiconductor industry, one of the last high-end technol-ogies where China has not yet established a relevant industry of its own. By the way, the other day I heard an old Taoist proverb from an important Chinese business part-ner: “Better to stumble on new paths than to make no headway on old tracks.” We both found this quote highly relevant.
Management interview
Production of IC substrates at plant 1 in Chongqing, China
Monika Stoisser-Göhring (CFO since 2 June 2017) on the financial development in the financial year 2017/18 and the financial targets in general: “Based on the existing and new technologies, we expect a significant increase in revenue of 10–16% for the current financial year. Profitability will be influenced by continued high price pressure in the area of IC substrates and by the start-up costs associated with the new technologies. Adjusted for these effects from Chongqing, we expect EBITDA margins similar to those of the previous year. In the current financial year, our focus will be on completing the investments in ongoing projects and then gradually improving profitability. Before starting further investment projects, we will therefore have to ensure the appropriate framework conditions in terms of market and technology before evaluating the steps required to finance any such investments. It is also our intention to achieve a critical size to enable us to finance investments that are still necessary from our own cash flow. The new positioning “More than AT&S” lays the foundations for further profitable growth of AT&S. Our target is to achieve EBITDA margins of more than 20% and a return on capital employed (ROCE) of 12% again, thus exceeding the weighted average cost of capital of the industry. At the same time, our aim is to present a more solid balance sheet with substantially lower debt once again.”
12 AT&S Annual Report 2016/17
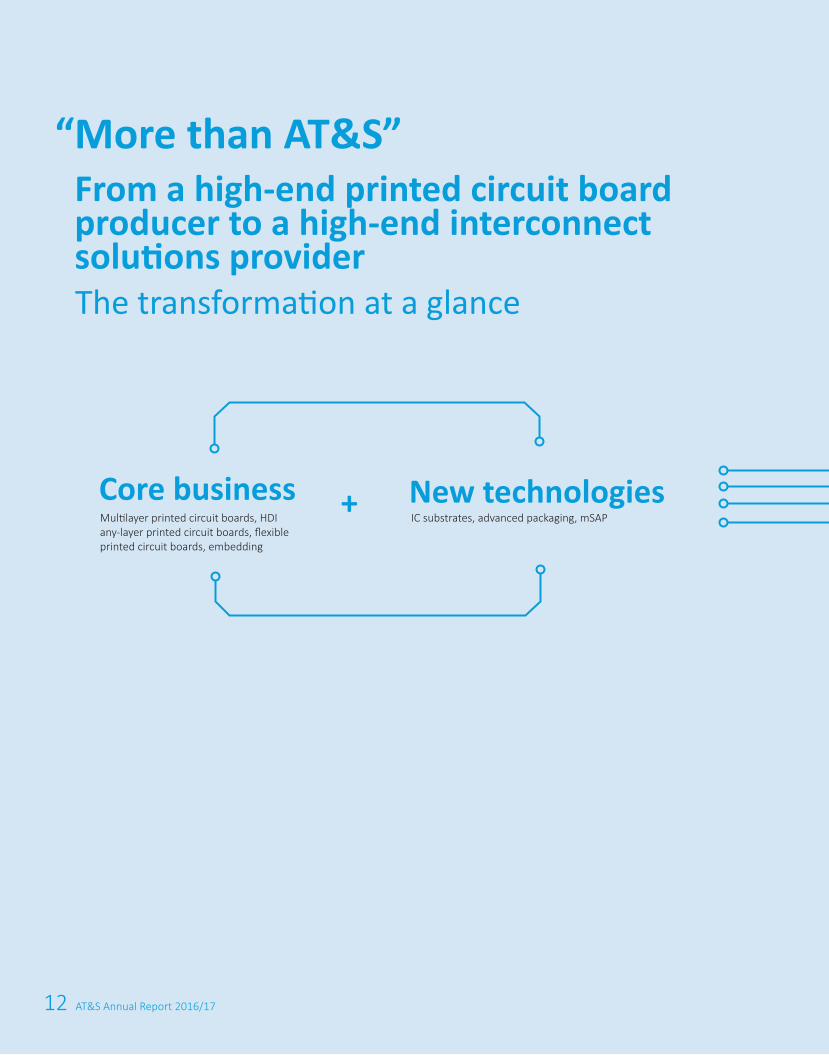
Core business New technologies
“More than AT&S” From a high-end printed circuit board producer to a high-end interconnect solutions providerThe transformation at a glance
+Multilayer printed circuit boards, HDI any-layer printed circuit boards, flexible printed circuit boards, embedding
IC substrates, advanced packaging, mSAP
13More than AT&S
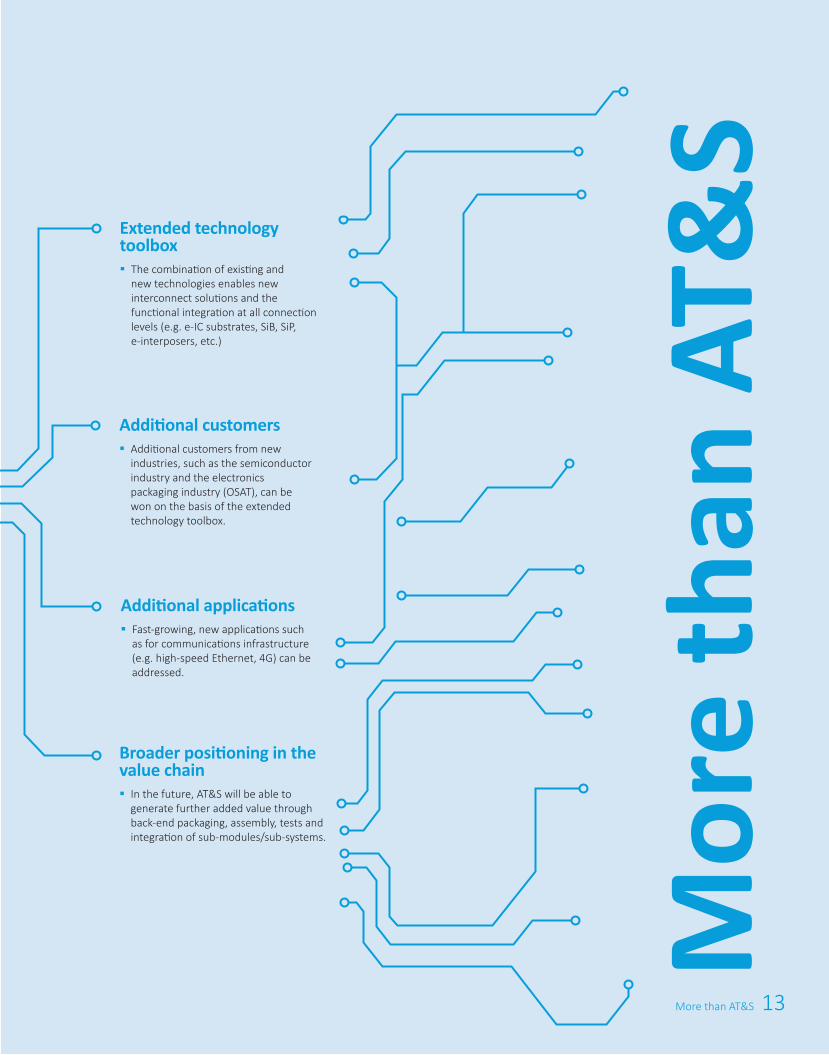
Additional applications§Fast-growing, new applications such
as for communications infrastructure (e.g. high-speed Ethernet, 4G) can be addressed.
Extended technology toolbox§The combination of existing and
new technologies enables new interconnect solutions and the functional integration at all connection levels (e.g. e-IC substrates, SiB, SiP, e-interposers, etc.)
Additional customers§Additional customers from new
industries, such as the semiconductor industry and the electronics packaging industry (OSAT), can be won on the basis of the extended technology toolbox.
Broader positioning in the value chain§In the future, AT&S will be able to
generate further added value through back-end packaging, assembly, tests and integration of sub-modules/sub-systems.
Mor
e th
an A
T&S
FIRST CHOICE FOR ADVANCED APPLICATIONS
14 AT&S Annual Report 2016/17
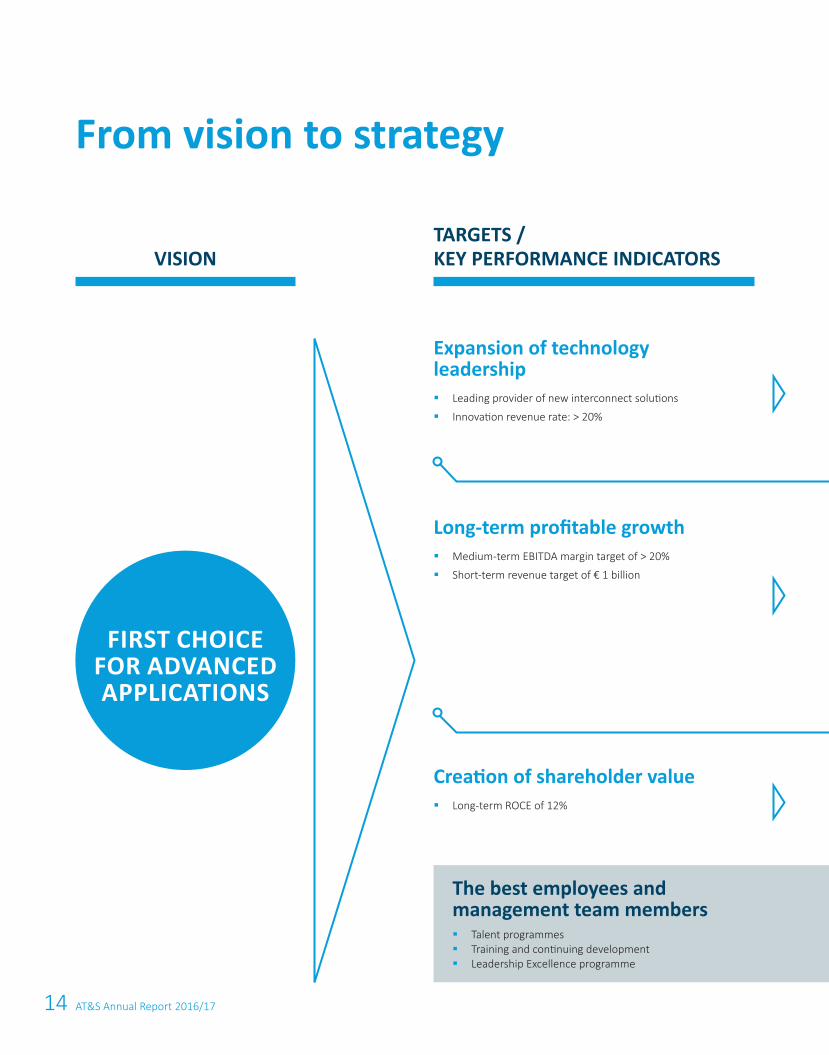
From vision to strategy
Creation of shareholder value§ Long-term ROCE of 12%
Expansion of technology leadership§ Leading provider of new interconnect solutions
§ Innovation revenue rate: > 20%
Long-term profitable growth§ Medium-term EBITDA margin target of > 20%
§ Short-term revenue target of € 1 billion
VISIONTARGETS /KEY PERFORMANCE INDICATORS
The best employees and management team members§ Talent programmes§ Training and continuing development§ Leadership Excellence programme
15Goals and strategy
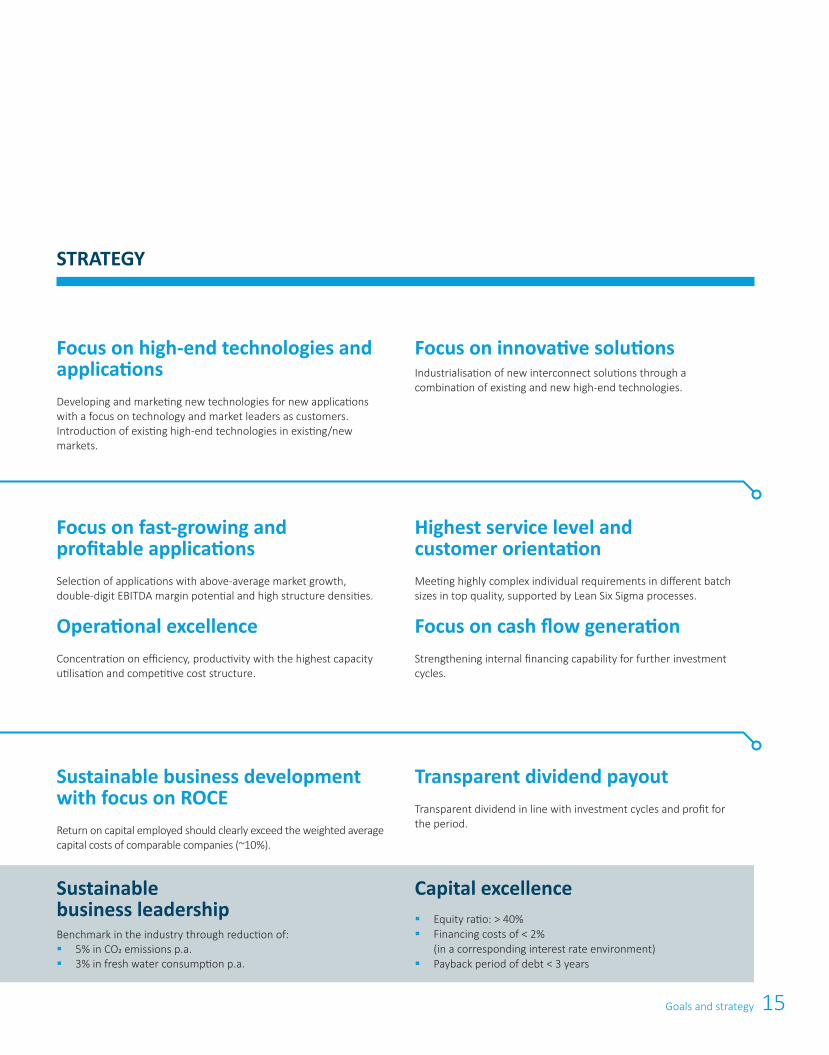
Sustainable business development with focus on ROCEReturn on capital employed should clearly exceed the weighted average capital costs of comparable companies (~10%).
Focus on fast-growing and profitable applications Selection of applications with above-average market growth, double-digit EBITDA margin potential and high structure densities.
Operational excellenceConcentration on efficiency, productivity with the highest capacity utilisation and competitive cost structure.
Highest service level and customer orientation Meeting highly complex individual requirements in different batch sizes in top quality, supported by Lean Six Sigma processes.
Focus on cash flow generation Strengthening internal financing capability for further investment cycles.
Transparent dividend payoutTransparent dividend in line with investment cycles and profit for the period.
STRATEGY
Focus on high-end technologies and applicationsDeveloping and marketing new technologies for new applications with a focus on technology and market leaders as customers. Introduction of existing high-end technologies in existing/new markets.
Focus on innovative solutionsIndustrialisation of new interconnect solutions through a combination of existing and new high-end technologies.
Capital excellence§ Equity ratio: > 40%§ Financing costs of < 2%
(in a corresponding interest rate environment)§ Payback period of debt < 3 years
Sustainable business leadershipBenchmark in the industry through reduction of:§ 5% in CO2 emissions p.a.§ 3% in fresh water consumption p.a.
16 AT&S Annual Report 2016/17
Functional integration
Modularisation
Miniaturisation
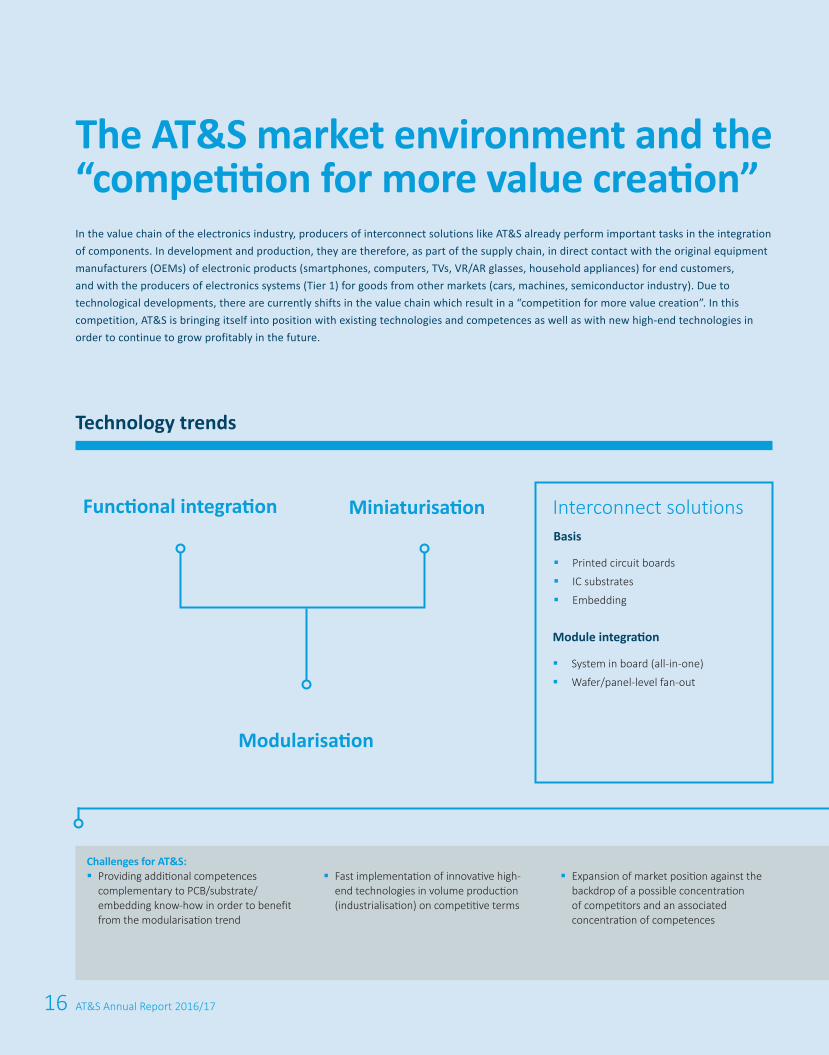
The AT&S market environment and the “competition for more value creation”In the value chain of the electronics industry, producers of interconnect solutions like AT&S already perform important tasks in the integration of components. In development and production, they are therefore, as part of the supply chain, in direct contact with the original equipment manufacturers (OEMs) of electronic products (smartphones, computers, TVs, VR/AR glasses, household appliances) for end customers, and with the producers of electronics systems (Tier 1) for goods from other markets (cars, machines, semiconductor industry). Due to technological developments, there are currently shifts in the value chain which result in a “competition for more value creation”. In this competition, AT&S is bringing itself into position with existing technologies and competences as well as with new high-end technologies in order to continue to grow profitably in the future.
Basis
§ Printed circuit boards
§ IC substrates
§ Embedding
Module integration
§ System in board (all-in-one)
§ Wafer/panel-level fan-out
Interconnect solutions
Challenges for AT&S: §Providing additional competences
complementary to PCB/substrate/embedding know-how in order to benefit from the modularisation trend
§Fast implementation of innovative high-end technologies in volume production (industrialisation) on competitive terms
§Expansion of market position against the backdrop of a possible concentration of competitors and an associated concentration of competences
Technology trends
17Market environment
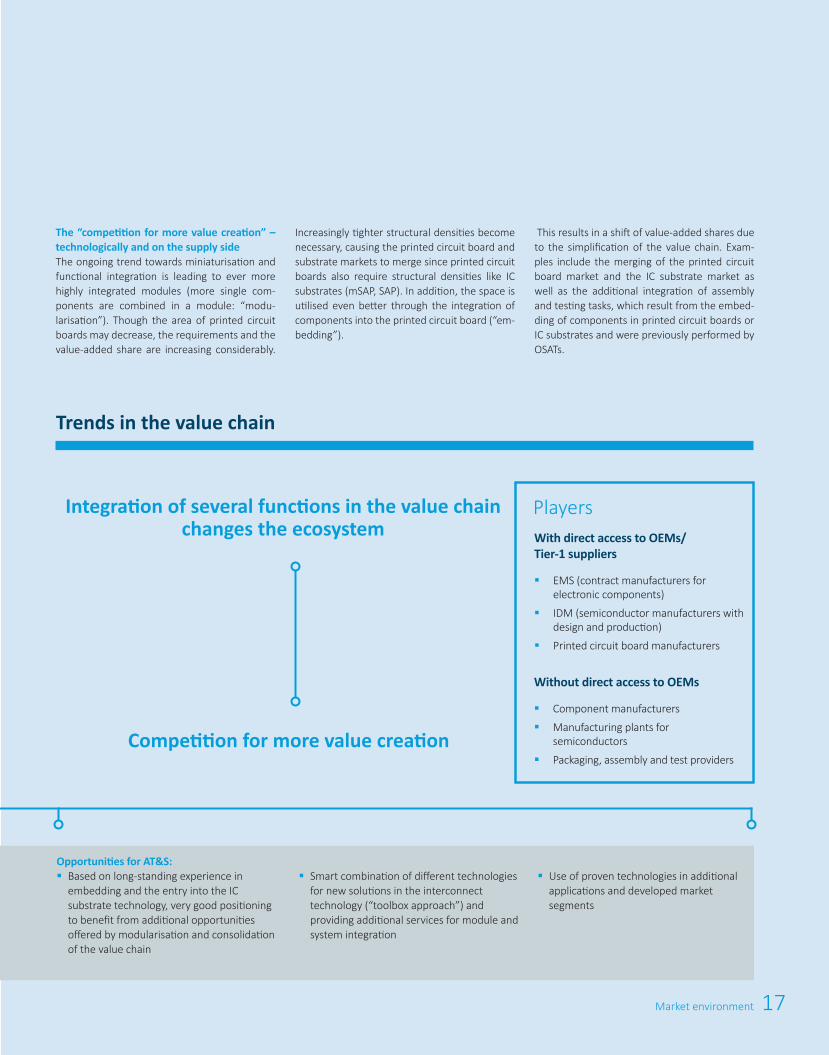
Integration of several functions in the value chain changes the ecosystem
Competition for more value creation
Increasingly tighter structural densities become necessary, causing the printed circuit board and substrate markets to merge since printed circuit boards also require structural densities like IC substrates (mSAP, SAP). In addition, the space is utilised even better through the integration of components into the printed circuit board (“em-bedding”).
This results in a shift of value-added shares due to the simplification of the value chain. Exam-ples include the merging of the printed circuit board market and the IC substrate market as well as the additional integration of assembly and testing tasks, which result from the embed-ding of components in printed circuit boards or IC substrates and were previously performed by OSATs.
Opportunities for AT&S:§Based on long-standing experience in
embedding and the entry into the IC substrate technology, very good positioning to benefit from additional opportunities offered by modularisation and consolidation of the value chain
Without direct access to OEMs
§ Component manufacturers
§ Manufacturing plants for semiconductors
§ Packaging, assembly and test providers
With direct access to OEMs/ Tier-1 suppliers
§ EMS (contract manufacturers for electronic components)
§ IDM (semiconductor manufacturers with design and production)
§ Printed circuit board manufacturers
Players
The “competition for more value creation” – technologically and on the supply sideThe ongoing trend towards miniaturisation and functional integration is leading to ever more highly integrated modules (more single com-ponents are combined in a module: “modu-larisation”). Though the area of printed circuit boards may decrease, the requirements and the value-added share are increasing considerably.
§Smart combination of different technologies for new solutions in the interconnect technology (“toolbox approach”) and providing additional services for module and system integration
§Use of proven technologies in additional applications and developed market segments
Trends in the value chain
18 AT&S Annual Report 2016/17
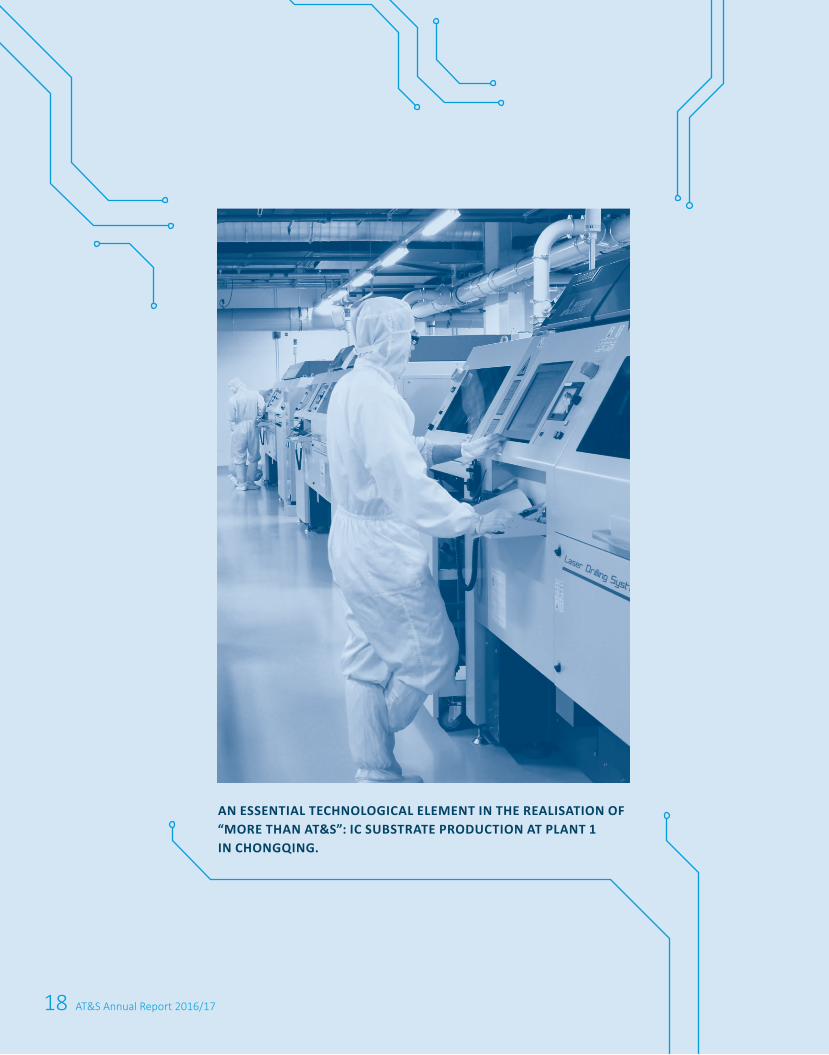
AN ESSENTIAL TECHNOLOGICAL ELEMENT IN THE REALISATION OF “MORE THAN AT&S”: IC SUBSTRATE PRODUCTION AT PLANT 1 IN CHONGQING.
19Report of the Supervisory Board
Dear shareholders
In the financial year 2016/17, AT&S clearly continued its growth course: revenue increased from € 762.9 million to € 814.9 million. This was attributable to the first revenue contributions of the Chongqing project and strong demand in all segments of the core business. Earnings before interest, taxes, depreciation and amortisation (EBITDA) of the Group were negatively influenced primarily by the costs of the longer ramp-up phase of the IC substrate plant in Chongqing and the price pressure on IC substrates. Cost savings only partially compensated for these developments. Adjusted for the effects of the Chongqing project and the income from the reversal of the provision for restructuring, the core business of AT&S is still highly profitable with an EBITDA margin of 25.4%, exceeding the value of the previous year (23.7%). Taking into account higher scheduled depreciation for newly commissioned equipment, EBIT decreased significantly. After deducting finance costs - net, which were lower than in the previous year, and income taxes, this resulted in a net loss of € 22.9 million for the financial year 2016/17. The significant operational improvements achieved in Chong-qing were, however, overcompensated by the price pressure of longer technology cycles and lower demand for IC substrates for computing applications (desktop, notebook). AT&S is convinced it has taken the right steps for a broader positioning in a changing supply chain by establishing an extended technology portfolio based on IC substrates and the next technology generation (mSAP).
COMPOSITION OF THE SUPERVISORY BOARD The Supervisory Board of AT&S consists of twelve members. At the 22nd Annual General Meeting on 7 July 2016, the Management Board and the Supervisory Board proposed an amendment to the Articles of Association to change the term of Supervisory Board mem-bers and the replacement of outgoing Supervisory Board members and to make it more flexible. This pro-posal was adopted by resolution of the Annual General Meeting and Section 11 (1) of the Articles of Associa-tion was amended as follows: “Save where otherwise stipulated by the General Meeting, election of mem-bers to the Supervisory Board shall be for the longest time permitted under Section 87 para 7 of the Stock Corporation Act, i.e. until the close of that General Meeting which votes on discharge from liability for the fourth financial year after such election, not counting the financial year in which such election is held.”
On this basis, members were elected to the Supervisory Board at the Annual General Meeting on 7 July 2016. In accordance with the proposal made by the Supervisory Board, Regina Prehofer, Georg Riedl and Karin Schaupp were re-elected to the Supervisory Board of the company until the end of the Annual General Meet-ing which votes on the discharge from liability for the financial year 2018/19. Further members representing shareholder interests on the Supervisory Board of AT&S are Hannes Androsch (Chairman), Willibald Dörfling-er (First Deputy Chairman), Karl Fink, Albert Hochleitner and Gerhard Pichler. Following her re-election, Regi-na Prehofer acts as Second Deputy Chairwoman of the Supervisory Board.
The employees delegated by the Works Council as employee representatives on the Supervisory Board have not changed: Wolfgang Fleck, Siegfried Trauch, Günther Wölfler and Sabine Fussi.
ACTIVITIES OF THE SUPERVISORY BOARD The Supervisory Board met five times during the fi-nancial year 2016/17, with the participation of the Management Board. Regina Prehofer and Albert Hochleit-ner were excused from one Supervisory Board meeting.
In the financial year from 1 April 2016 to 31 March 2017, the Supervisory Board was regularly informed by the Management Board through a continuous, open exchange of information and opinions, as well as com-prehensive oral and written reports about the market situation, strategy, operating and financial position of the Group and its investments, staff situation and planned capital expenditures, and the Supervisory Board took the respective decisions accordingly. The discussions focused especially on the commissioning of the IC substrate plant in Chongqing and the further expansion of the Chongqing site by means of the production of the next generation of printed circuit boards and thus the strategic orientation of the company. Key decisions by the Supervisory Board in the past financial year were also related to the respective investments as well as the evaluation and continuous improvement of the financing structure in this context. Between meetings of
Report of the Supervisory Board
20 AT&S Annual Report 2016/17
the Supervisory Board, the Chairman of the Supervisory Board and his Deputies were regularly informed by the Management Board of business developments.
In addition, the Supervisory Board was able to confirm a functional issuer compliance system and dealt with the establishment of a Governance, Risk & Compliance Committee (“GRC Committee”) within the company at one meeting. In addition, the Management Board informed the Supervisory Board in detail about measures to fight corruption at the company.
The Supervisory Board decided on 6 June 2016, in the course of the extension of the mandate of Mr Asamer, which had originally been limited to three years, to extend the mandates of all Management Board members, Andreas Gerstenmayer, Karl Asamer and Heinz Moitzi, early and to appoint all of them for a new term effec-tive until 31 May 2021 (“Renewal of appointment”). On 2 June 2017, Karl Asamer decided to resign from his mandate for personal reasons and asked the Supervisory Board for a termination of his contract by mutual agreement. The Supervisory Board agreed and simultaneously appointed Monika Stoisser-Göhring as his successor to hold the positions of CFO and Deputy Chairwoman of the Management Board of the Company from 2 June 2017 until 31 May 2020.
SUPERVISORY BOARD COMMITTEES Within the Supervisory Board, the Audit Committee and the Nomination and Remuneration Committee, as standing committees, exercise certain tasks allocated to them through the rules of procedure of the Supervisory Board. In addition, the Supervisory Board established a temporary Project Committee during the financial year 2016/17. The respective committees established carried out detailed analyses of particular matters and reported their findings to the Supervisory Board:
The Audit Committee, consisting of Regina Prehofer (Chairwoman), Gerhard Pichler (finance expert), Georg Riedl, Wolfgang Fleck and Günther Wölfler, focused primarily on the review of the annual and consolidated annual financial statements for the year ended 31 March 2016 and on planning and preparation for the audit of the annual and consolidated financial statements for the financial year 2016/17. Through discussions with the Auditor, inspection of relevant documents and discussions with the Management Board, it obtained a comprehensive view. The Audit Committee also monitored the effectiveness of the company-wide internal control system and the Group’s internal audit and risk management systems. The Audit Committee reported to the full Supervisory Board with respect to this monitoring and found no deficiencies. The Audit Committee convened three times in the past financial year. The meetings, which were attended by all committee mem-bers, were chaired by Regina Prehofer, who was also regularly involved in quarterly reporting in this function and reported on these matters to the Supervisory Board.
In accordance with a decision made by the Supervisory Board, the members of the Nomination and Remu-neration Committee are Hannes Androsch (Chairman), Willibald Dörflinger (Deputy Chairman), Georg Riedl, Wolfgang Fleck and Günther Wölfler. The Nomination and Remuneration Committee met once in the past financial year, with all Committee members attending. This meeting focused on the further development of the composition of the Supervisory Board. It was found that the requirements of Supervisory Board activities at AT&S have increased considerably in recent years, not least due to the expansion projects in China. It was therefore agreed that the international orientation of the Supervisory Board would be increased in the medi-um term and further experts from the electronics industry should be included in the future. The number of Supervisory Board members will also be subject to a critical review.
Based on a decision made by the Supervisory Board on 16 March 2017, a temporary Project Committee was established in the financial year 2016/17 to further support the Management Board in strategic and budget planning. The following members were appointed to this committee: Willibald Dörflinger, as Chairman, as well as Regina Prehofer and Gerhard Pichler, as capital representatives, and Wolfgang Fleck and Günther Wölfler, as employee representatives. The Project Committee did not meet in the financial year 2016/17.
21Report of the Supervisory Board
the Supervisory Board, the Chairman of the Supervisory Board and his Deputies were regularly informed by the Management Board of business developments.
In addition, the Supervisory Board was able to confirm a functional issuer compliance system and dealt with the establishment of a Governance, Risk & Compliance Committee (“GRC Committee”) within the company at one meeting. In addition, the Management Board informed the Supervisory Board in detail about measures to fight corruption at the company.
The Supervisory Board decided on 6 June 2016, in the course of the extension of the mandate of Mr Asamer, which had originally been limited to three years, to extend the mandates of all Management Board members, Andreas Gerstenmayer, Karl Asamer and Heinz Moitzi, early and to appoint all of them for a new term effec-tive until 31 May 2021 (“Renewal of appointment”). On 2 June 2017, Karl Asamer decided to resign from his mandate for personal reasons and asked the Supervisory Board for a termination of his contract by mutual agreement. The Supervisory Board agreed and simultaneously appointed Monika Stoisser-Göhring as his successor to hold the positions of CFO and Deputy Chairwoman of the Management Board of the Company from 2 June 2017 until 31 May 2020.
SUPERVISORY BOARD COMMITTEES Within the Supervisory Board, the Audit Committee and the Nomination and Remuneration Committee, as standing committees, exercise certain tasks allocated to them through the rules of procedure of the Supervisory Board. In addition, the Supervisory Board established a temporary Project Committee during the financial year 2016/17. The respective committees established carried out detailed analyses of particular matters and reported their findings to the Supervisory Board:
The Audit Committee, consisting of Regina Prehofer (Chairwoman), Gerhard Pichler (finance expert), Georg Riedl, Wolfgang Fleck and Günther Wölfler, focused primarily on the review of the annual and consolidated annual financial statements for the year ended 31 March 2016 and on planning and preparation for the audit of the annual and consolidated financial statements for the financial year 2016/17. Through discussions with the Auditor, inspection of relevant documents and discussions with the Management Board, it obtained a comprehensive view. The Audit Committee also monitored the effectiveness of the company-wide internal control system and the Group’s internal audit and risk management systems. The Audit Committee reported to the full Supervisory Board with respect to this monitoring and found no deficiencies. The Audit Committee convened three times in the past financial year. The meetings, which were attended by all committee mem-bers, were chaired by Regina Prehofer, who was also regularly involved in quarterly reporting in this function and reported on these matters to the Supervisory Board.
In accordance with a decision made by the Supervisory Board, the members of the Nomination and Remu-neration Committee are Hannes Androsch (Chairman), Willibald Dörflinger (Deputy Chairman), Georg Riedl, Wolfgang Fleck and Günther Wölfler. The Nomination and Remuneration Committee met once in the past financial year, with all Committee members attending. This meeting focused on the further development of the composition of the Supervisory Board. It was found that the requirements of Supervisory Board activities at AT&S have increased considerably in recent years, not least due to the expansion projects in China. It was therefore agreed that the international orientation of the Supervisory Board would be increased in the medi-um term and further experts from the electronics industry should be included in the future. The number of Supervisory Board members will also be subject to a critical review.
Based on a decision made by the Supervisory Board on 16 March 2017, a temporary Project Committee was established in the financial year 2016/17 to further support the Management Board in strategic and budget planning. The following members were appointed to this committee: Willibald Dörflinger, as Chairman, as well as Regina Prehofer and Gerhard Pichler, as capital representatives, and Wolfgang Fleck and Günther Wölfler, as employee representatives. The Project Committee did not meet in the financial year 2016/17.
SELF-EVALUATION OF THE SUPERVISORY BOARD The Supervisory Board annually performs a self-evaluation, as it did again in the financial year 2016/17, to ensure the continuous improvement of its working practices and the fulfilment of its responsibilities to the shareholders and other stakeholders. The annual evaluation carried out by the Supervisory Board confirmed that its regular practices meet the re-quirements of the Austrian Stock Corporation Act and the Austrian Corporate Governance Code (ÖCGK), and that its organisation, work practices and orientation in the interests of the shareholders and all other stake-holders are effective. The self-evaluation will continue to constitute an important component of critical re-view by the Supervisory Board of its own activities and will be further expanded while at the same time ensur-ing that it is efficient.
ANNUAL FINANCIAL STATEMENT AND DIVIDENDS The Supervisory Board of AT&S proposed to the 22nd Annual General Meeting that PwC Wirtschaftsprüfung GmbH, Vienna be appointed Company and Group auditors for the financial year 2016/17. The proposal was approved by the Annual General Meeting of 7 July 2016.
The annual financial statements of AT & S Austria Technologie & Systemtechnik Aktiengesellschaft and the consolidated financial statements for the year ended 31 March 2017 were both audited by PwC Wirtschaftsprüfung GmbH, Vienna, and were awarded an unqualified audit report. The Management Report and the Group Management Report for the financial year 2016/17 were consistent with the annual financial statements and the consolidated financial statements. Based on the prior discussions of the Audit Commit-tee, and, following its own detailed discussions and examination, the Supervisory Board approved the Com-pany’s annual financial statements for the year ended 31 March 2017 in accordance with Section 96 (4) Aus-trian Stock Corporation Act (AktG). Also, based on the prior discussions of the Audit Committee, and after its own detailed consideration and examination, it approved the consolidated financial statements drawn up in accordance with Section 245a Austrian Commercial Code (UGB) and with IFRS, as well as the Management Report, the Group Management Report and the Corporate Governance Report. The Supervisory Board re-view, which included extensive discussions with the auditors, did not give rise to any objections. Pursuant to the recommendation of the Audit Committee, the Supervisory Board of AT&S will propose to the 23rd Annual General Meeting that PwC Wirtschaftsprüfung GmbH, Vienna be appointed Company and Group auditors for the financial year 2017/18.
The Supervisory Board approves the proposal of the Management Board: a proposal will be made to the Annual General Meeting to distribute a dividend of € 0.10 per share for the no par shares outstanding on the payout date and entitled to dividend, and to carry forward the remaining amount of € 73,706,616.50.
THANKS TO THE MANAGEMENT BOARD AND ALL AT&S EMPLOYEES The past financial year was once again marked by enormous challenges: the electronics industry continues to develop very dynamically in an extremely competitive environment. Moreover, the establishment and ramp-up of the production site in Chongqing with two plants had to be managed in addition to the continuously changing requirements in the core business. The Supervisory Board would therefore like to express its gratitude and acknowledgement to the entire Management Board and all employees for their achievements in the past financial year. The special commitment that distinguishes the employees will continue to be an indispensable basis for the sustainable success of the entire Group!
On behalf of the Supervisory Board
Leoben-Hinterberg, 2 June 2017
Hannes Androsch m.p. Chairman of the Supervisory Board
22 AT&S Annual Report 2016/17
4 AT&S Annual Report 2016/17
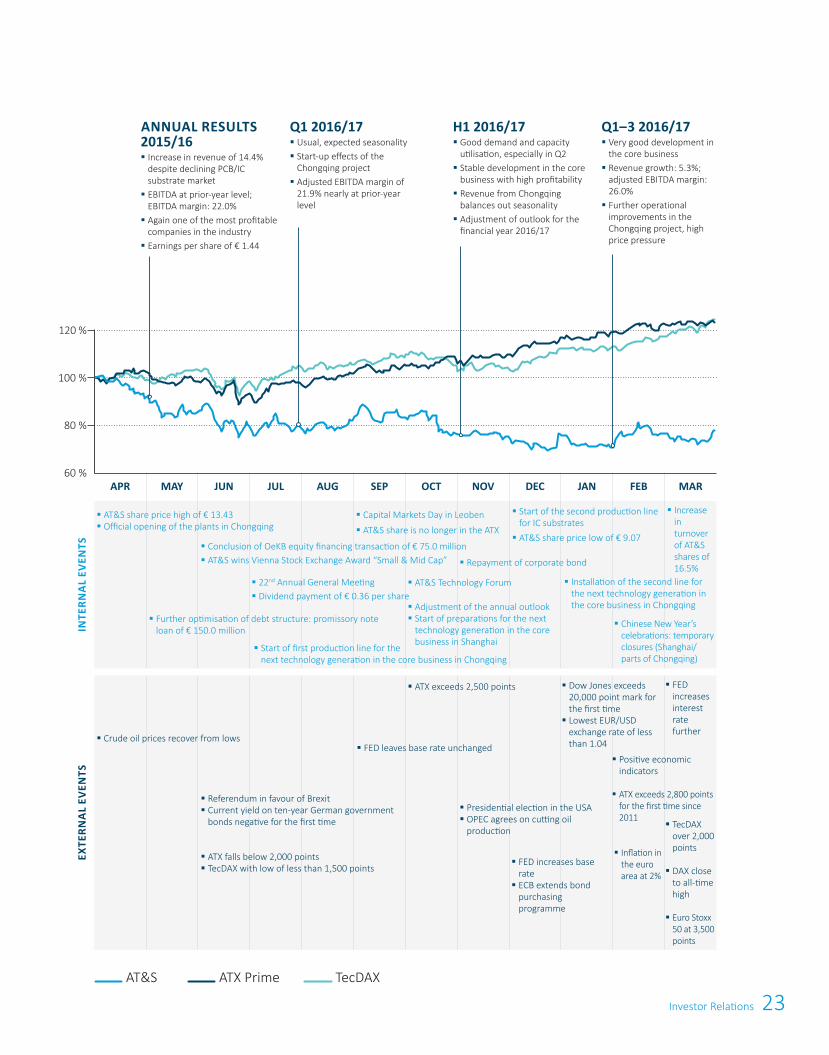
DEVELOPMENTS IN THE CAPITAL MARKET IN THE FINANCIAL YEAR 2016/17 The develop-ments in the international financial markets in the financial year 2016/17 were to a significant extent charac-terised by events of global relevance. The outcome of the referendum held in the United Kingdom in June 2016 in favour of leaving the European Union (Brexit) temporarily triggered sharp drops in share prices. In the subsequent months, a favourable trend prevailed across the board despite the uncertainty caused by this result, with rising stock prices which more than compensated the losses suffered in many cases. The outcome of the presidential elections in the USA, which came unexpectedly to many market participants, was another defining event, and resulted in a significant upswing in the major financial markets. In addition, good econom-ic indicators in the USA in the last months of the financial year 2016/17 also provided for positive sentiment in the markets. The US lead index Dow Jones Industrial exceeded the 20,000-point mark for the first time in January 2017. This corresponds to an increase of 16.8% in the period from April 2016 to March 2017, while the technology index NASDAQ 100 was up 21.2%. In Germany, the DAX came close to its all-time high in March 2017. In the twelve months of the AT&S financial year, the DAX gained 23.6%. The share index for Europe as a whole, the Euro Stoxx 50, also showed a clearly positive performance, though to a lesser extent, with an increase of 16.5%. On the Vienna Stock Exchange, the Austrian lead index ATX and the broader ATX Prime developed in line with international markets, ultimately gaining 24.6% and 22.9% respectively after a subdued start during the first months of the reporting period.
AT&S SHARE PERFORMANCE AND LIQUIDITY On the Vienna Stock Exchange, the AT&S share started the financial year 2016/17 at a price of € 13.00, already reaching its high of € 13.43 in the reporting period in the first trading days. The further performance initially showed a negative tendency, dropping to less than € 10.00 in late June amid the turbulence in the wake of the Brexit referendum. In line with the recovery of the major financial markets, the AT&S share price increased again to nearly € 12.00 in early September. After this intermediate high, the price declined again, among other things due to the adjustment of the annual forecast (little revenue growth and lower EBITDA margins based on a flatter start-up curve of the IC substrate plant in Chongqing, the technology conversion of part of the largest plant in Shanghai and the associated reduced capacities, as well as a slightly less favourable product mix in the core business). This led to a low for the financial year 2016/17 of € 9.07 in mid-December 2016, which was followed by a slight recovery in the last months of the financial year. The closing price of € 10.29 at 31 March 2017 significantly exceeded the lows during the reporting period, but did not match the highs. In the financial year 2016/17, the decline in the share price thus totals -20.2%, not taking into account the dividend payment of € 0.36 per share in July 2016 (closing price on 31 March 2016: € 12.90). The trading volume of AT&S shares on the Vienna Stock Exchange recorded a significant increase and rose from an average of roughly 65,400 shares per day to roughly 76,200 shares per day (single count). The average daily turnover changed from € 914,387 to € 800,750 (each single count) due to the lower share price. The absolute trading volume of AT&S shares on the Vienna Stock Ex-change thus reached a value of roughly € 201.8 million (single count) in the financial year 2016/17.
Since the index adjustment in September 2016, the AT&S share has been listed in the broad-based ATX Prime again since the required market capitalisation, a key criterion for a continued listing in the Austrian lead index ATX, was no longer given due to the lower share price. This did not result in any impact on the trading vol-ume. AT&S continued to be part of the Austrian sustainability index VÖNIX in the financial year 2016/17 (admission in June 2015). The VÖNIX consists of listed Austrian companies which are leading with respect to social and economic achievements.
In June 2016, AT&S received the Vienna Stock Exchange Award in the category “Small & Mid Cap” for the year 2015. The criteria for this award include areas such as financial reporting, investor relations and corporate governance.
Investor Relations
AT&S share at a glance
Initial listing 16 July 1999
Frankfurt, “Neuer Markt” starting 20 May 2008 Vienna, Prime Market
Number of ordinary shares 38,850,000
Securities Identification No. 922230
ISIN Code AT0000969985
Ticker symbol ATS
Thomson Reuters ATSV.VI
Bloomberg ATS:AV
Indices ATX Prime, ATX GP, WBI,
VÖNIX
Investor Relations 23
4 AT&S Annual Report 2016/17
DEVELOPMENTS IN THE CAPITAL MARKET IN THE FINANCIAL YEAR 2016/17 The develop-ments in the international financial markets in the financial year 2016/17 were to a significant extent charac-terised by events of global relevance. The outcome of the referendum held in the United Kingdom in June 2016 in favour of leaving the European Union (Brexit) temporarily triggered sharp drops in share prices. In the subsequent months, a favourable trend prevailed across the board despite the uncertainty caused by this result, with rising stock prices which more than compensated the losses suffered in many cases. The outcome of the presidential elections in the USA, which came unexpectedly to many market participants, was another defining event, and resulted in a significant upswing in the major financial markets. In addition, good econom-ic indicators in the USA in the last months of the financial year 2016/17 also provided for positive sentiment in the markets. The US lead index Dow Jones Industrial exceeded the 20,000-point mark for the first time in January 2017. This corresponds to an increase of 16.8% in the period from April 2016 to March 2017, while the technology index NASDAQ 100 was up 21.2%. In Germany, the DAX came close to its all-time high in March 2017. In the twelve months of the AT&S financial year, the DAX gained 23.6%. The share index for Europe as a whole, the Euro Stoxx 50, also showed a clearly positive performance, though to a lesser extent, with an increase of 16.5%. On the Vienna Stock Exchange, the Austrian lead index ATX and the broader ATX Prime developed in line with international markets, ultimately gaining 24.6% and 22.9% respectively after a subdued start during the first months of the reporting period.
AT&S SHARE PERFORMANCE AND LIQUIDITY On the Vienna Stock Exchange, the AT&S share started the financial year 2016/17 at a price of € 13.00, already reaching its high of € 13.43 in the reporting period in the first trading days. The further performance initially showed a negative tendency, dropping to less than € 10.00 in late June amid the turbulence in the wake of the Brexit referendum. In line with the recovery of the major financial markets, the AT&S share price increased again to nearly € 12.00 in early September. After this intermediate high, the price declined again, among other things due to the adjustment of the annual forecast (little revenue growth and lower EBITDA margins based on a flatter start-up curve of the IC substrate plant in Chongqing, the technology conversion of part of the largest plant in Shanghai and the associated reduced capacities, as well as a slightly less favourable product mix in the core business). This led to a low for the financial year 2016/17 of € 9.07 in mid-December 2016, which was followed by a slight recovery in the last months of the financial year. The closing price of € 10.29 at 31 March 2017 significantly exceeded the lows during the reporting period, but did not match the highs. In the financial year 2016/17, the decline in the share price thus totals -20.2%, not taking into account the dividend payment of € 0.36 per share in July 2016 (closing price on 31 March 2016: € 12.90). The trading volume of AT&S shares on the Vienna Stock Exchange recorded a significant increase and rose from an average of roughly 65,400 shares per day to roughly 76,200 shares per day (single count). The average daily turnover changed from € 914,387 to € 800,750 (each single count) due to the lower share price. The absolute trading volume of AT&S shares on the Vienna Stock Ex-change thus reached a value of roughly € 201.8 million (single count) in the financial year 2016/17.
Since the index adjustment in September 2016, the AT&S share has been listed in the broad-based ATX Prime again since the required market capitalisation, a key criterion for a continued listing in the Austrian lead index ATX, was no longer given due to the lower share price. This did not result in any impact on the trading vol-ume. AT&S continued to be part of the Austrian sustainability index VÖNIX in the financial year 2016/17 (admission in June 2015). The VÖNIX consists of listed Austrian companies which are leading with respect to social and economic achievements.
In June 2016, AT&S received the Vienna Stock Exchange Award in the category “Small & Mid Cap” for the year 2015. The criteria for this award include areas such as financial reporting, investor relations and corporate governance.
Investor Relations
AT&S share at a glance
Initial listing 16 July 1999
Frankfurt, “Neuer Markt” starting 20 May 2008 Vienna, Prime Market
Number of ordinary shares 38,850,000
Securities Identification No. 922230
ISIN Code AT0000969985
Ticker symbol ATS
Thomson Reuters ATSV.VI
Bloomberg ATS:AV
Indices ATX Prime, ATX GP, WBI,
VÖNIX
120 %
100 %
80 %
60 %
AT&S ATX Prime TecDAX
APR MAY JUN JUL AUG SEP OCT NOV DEC JAN FEB MAR
EXTE
RNA
L EV
ENTS
INTE
RNA
L EV
ENTS
§ AT&S share price high of € 13.43§ Official opening of the plants in Chongqing
§ Further optimisation of debt structure: promissory note loan of € 150.0 million
§ AT&S wins Vienna Stock Exchange Award “Small & Mid Cap”
§ Start of first production line for the next technology generation in the core business in Chongqing
§ Conclusion of OeKB equity financing transaction of € 75.0 million
§ 22nd Annual General Meeting§ Dividend payment of € 0.36 per share
§ Adjustment of the annual outlook§ Start of preparations for the next
technology generation in the core business in Shanghai
§ AT&S Technology Forum
§ Repayment of corporate bond
§ Start of the second production line for IC substrates
§ AT&S share price low of € 9.07
§ Installation of the second line for the next technology generation in the core business in Chongqing
§ Chinese New Year’s celebrations: temporary closures (Shanghai/ parts of Chongqing)
§ Increase in turnover of AT&S shares of 16.5%
§ Referendum in favour of Brexit§ Current yield on ten-year German government
bonds negative for the first time
§ATX falls below 2,000 points§TecDAX with low of less than 1,500 points
§ Presidential election in the USA§ OPEC agrees on cutting oil
production
§ Crude oil prices recover from lows
§ ATX exceeds 2,500 points
§ FED leaves base rate unchanged
§FED increases base rate§ ECB extends bond
purchasing programme
§ Dow Jones exceeds 20,000 point mark for the first time§ Lowest EUR/USD
exchange rate of less than 1.04
§ Inflation in the euro area at 2%
§ FED increases interest rate further
§ TecDAX over 2,000 points
§ DAX close to all-time high
§ Euro Stoxx 50 at 3,500 points
§ Capital Markets Day in Leoben
§ AT&S share is no longer in the ATX
ANNUAL RESULTS 2015/16 § Increase in revenue of 14.4% despite declining PCB/IC substrate market§ EBITDA at prior-year level; EBITDA margin: 22.0%§ Again one of the most profitable companies in the industry§ Earnings per share of € 1.44
Q1 2016/17§ Usual, expected seasonality§ Start-up effects of the Chongqing project§ Adjusted EBITDA margin of 21.9% nearly at prior-year level
H1 2016/17§ Good demand and capacity utilisation, especially in Q2§ Stable development in the core business with high profitability§ Revenue from Chongqing balances out seasonality§ Adjustment of outlook for the financial year 2016/17
Q1–3 2016/17§ Very good development in the core business§ Revenue growth: 5.3%; adjusted EBITDA margin: 26.0%§Further operational improvements in the Chongqing project, high price pressure
§ Positive economic indicators
§ ATX exceeds 2,800 points for the first time since 2011
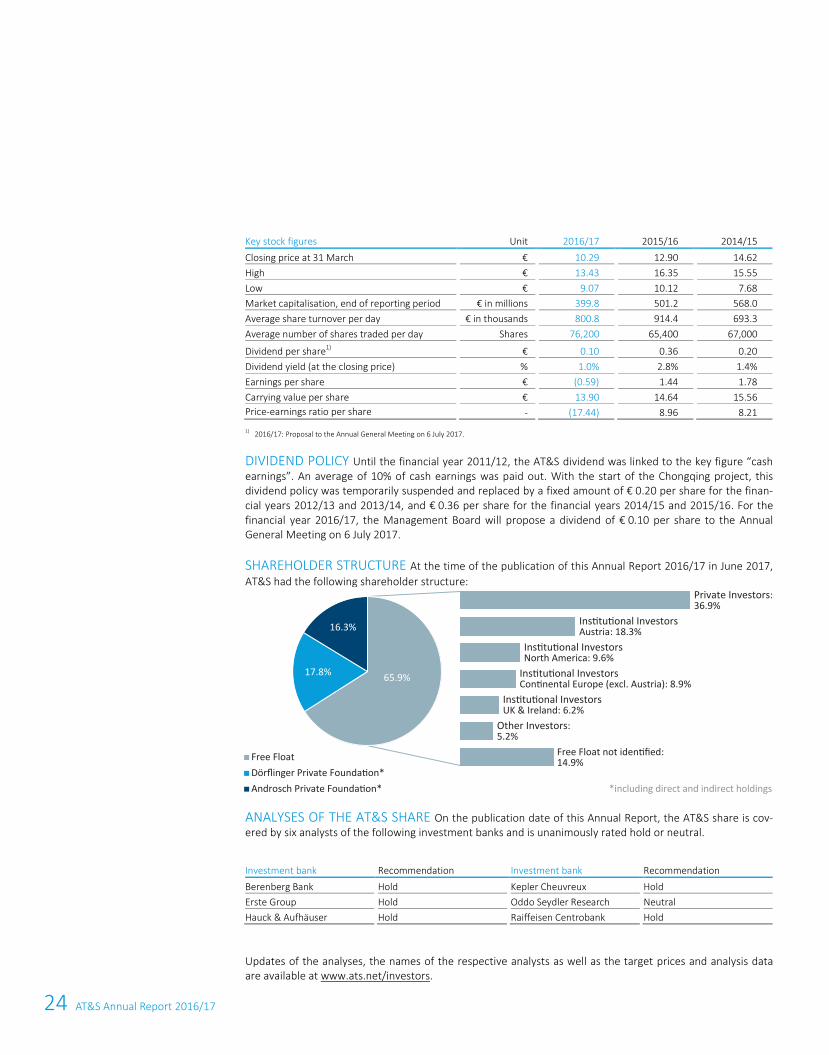
24 AT&S Annual Report 2016/17
6 AT&S Annual Report 2016/17
Key stock figures Unit 2016/17 2015/16 2014/15 Closing price at 31 March € 10.29 12.90 14.62 High
€
13.43
16.35
15.55
Low
€
9.07
10.12
7.68 Market capitalisation, end of reporting period
€ in millions
399.8
501.2
568.0
Average share turnover per day
€ in thousands
800.8
914.4
693.3 Average number of shares traded per day
Shares
76,200
65,400
67,000
Dividend per share1)
€
0.10
0.36
0.20 Dividend yield (at the closing price)
%
1.0%
2.8%
1.4%
Earnings per share
€
(0.59)
1.44
1.78 Carrying value per share
€
13.90
14.64
15.56
Price-earnings ratio per share
-
(17.44)
8.96
8.21 1) 2016/17: Proposal to the Annual General Meeting on 6 July 2017.
DIVIDEND POLICY Until the financial year 2011/12, the AT&S dividend was linked to the key figure “cash earnings”. An average of 10% of cash earnings was paid out. With the start of the Chongqing project, this dividend policy was temporarily suspended and replaced by a fixed amount of € 0.20 per share for the finan-cial years 2012/13 and 2013/14, and € 0.36 per share for the financial years 2014/15 and 2015/16. For the financial year 2016/17, the Management Board will propose a dividend of € 0.10 per share to the Annual General Meeting on 6 July 2017.
SHAREHOLDER STRUCTURE At the time of the publication of this Annual Report 2016/17 in June 2017, AT&S had the following shareholder structure:
ANALYSES OF THE AT&S SHARE On the publication date of this Annual Report, the AT&S share is cov-ered by six analysts of the following investment banks and is unanimously rated hold or neutral.
Investment bank Recommendation Investment bank Recommendation Berenberg Bank
Hold
Kepler Cheuvreux
Hold
Erste Group Hold
Oddo Seydler Research
Neutral
Hauck & Aufhäuser Hold
Raiffeisen Centrobank
Hold
Updates of the analyses, the names of the respective analysts as well as the target prices and analysis data are available at www.ats.net/investors.
65.9%17.8%
16.3%
Free FloatDörflinger Private Foundation*Androsch Private Foundation* *including direct and indirect holdings
Other Investors:5.2%
Free Float not identified:14.9%
Private Investors:36.9%
Institutional InvestorsContinental Europe (excl. Austria): 8.9%
Institutional InvestorsNorth America: 9.6%
Institutional InvestorsUK & Ireland: 6.2%
Institutional Investors Austria: 18.3%
Investor Relations 25
6 AT&S Annual Report 2016/17
Key stock figures Unit 2016/17 2015/16 2014/15 Closing price at 31 March € 10.29 12.90 14.62 High
€
13.43
16.35
15.55
Low
€
9.07
10.12
7.68 Market capitalisation, end of reporting period
€ in millions
399.8
501.2
568.0
Average share turnover per day
€ in thousands
800.8
914.4
693.3 Average number of shares traded per day
Shares
76,200
65,400
67,000
Dividend per share1)
€
0.10
0.36
0.20 Dividend yield (at the closing price)
%
1.0%
2.8%
1.4%
Earnings per share
€
(0.59)
1.44
1.78 Carrying value per share
€
13.90
14.64
15.56
Price-earnings ratio per share
-
(17.44)
8.96
8.21 1) 2016/17: Proposal to the Annual General Meeting on 6 July 2017.
DIVIDEND POLICY Until the financial year 2011/12, the AT&S dividend was linked to the key figure “cash earnings”. An average of 10% of cash earnings was paid out. With the start of the Chongqing project, this dividend policy was temporarily suspended and replaced by a fixed amount of € 0.20 per share for the finan-cial years 2012/13 and 2013/14, and € 0.36 per share for the financial years 2014/15 and 2015/16. For the financial year 2016/17, the Management Board will propose a dividend of € 0.10 per share to the Annual General Meeting on 6 July 2017.
SHAREHOLDER STRUCTURE At the time of the publication of this Annual Report 2016/17 in June 2017, AT&S had the following shareholder structure:
ANALYSES OF THE AT&S SHARE On the publication date of this Annual Report, the AT&S share is cov-ered by six analysts of the following investment banks and is unanimously rated hold or neutral.
Investment bank Recommendation Investment bank Recommendation Berenberg Bank
Hold
Kepler Cheuvreux
Hold
Erste Group Hold
Oddo Seydler Research
Neutral
Hauck & Aufhäuser Hold
Raiffeisen Centrobank
Hold
Updates of the analyses, the names of the respective analysts as well as the target prices and analysis data are available at www.ats.net/investors.
Investor Relations 7
ROADSHOWS In the financial year 2016/17, AT&S carried out another extensive programme of roadshows and conferences and was thus present at the main European financial centres. As part of more than 15 road-shows and investor conferences in the reporting period, the dialogue with existing and potential shareholders was continued. In addition, contact with investors was maintained through numerous telephone calls and teleconferences, emails and personal talks. Furthermore, AT&S presented itself at an information day of the Vienna Stock Exchange and at a roadshow for private investors. At the Capital Market Day held in Leoben in September, the participating institutional investors and analysts were informed about current market devel-opments, the value chain, the Chongqing project as well as the new positioning and the related opportunities for AT&S. In general, contact with investors in the past financial year focused on the developments and pro-gress made in the establishment of the new plants in Chongqing, the future positioning of AT&S in the market and developments in the core business.
CAPITAL MARKET COMMUNICATION Transparent, proactive and sustainable communication on equal terms with all capital market participants is the basis and principle of capital market communication at AT&S. An extensive, mutual dialogue with all capital market participants as well as the provision of timely infor-mation that is relevant for stakeholders serves to strengthen the trust in AT&S, promote the development of a deeper understanding of the AT&S business model with its opportunities and risks and thus support the perception of AT&S in the capital market. On the Investor Relations pages at www.ats.net/investors, AT&S provides comprehensive, regularly updated documents such as annual and quarterly reports and presenta-tions for viewing and download. Further information sources include channels on Twitter (@ATS_IR_PR) and YouTube (ATundS). As an additional service for enhanced transparency and equal treatment of all sharehold-ers, AT&S broadcasts its Annual General Meeting and the press conferences, which are held twice a year. The access data for the broadcasts are published on the website in good time before the respective event. The Investor Relations team will be pleased to receive feedback and suggestions regarding capital market com-munication at any time (see contact data below).
We would like to take this opportunity to cordially invite all shareholders to the 23rd Annual General Meeting on 6 July 2017. All documents relevant for the Annual General Meeting and further, detailed information will be available on the website in due course. The resolutions and other documents of previous Annual General Meetings can also be viewed and downloaded from the website.
Financial Calendar 26 June 2017 Record date Annual General Meeting 06 July 2017
23rd Annual General Meeting
25 July 2017 Ex-dividend day
26 July 2017 Record date dividend
27 July 2017 Dividend payment day
27 July 2017 Results for the first quarter 2017/18
03 November 2017 Results for the first half-year 2017/18
31 January 2018 Results for the first three quarters 2017/18
08 May 2018 Annual results 2017/18
CONTACT/SHAREHOLDER HOTLINE Elke Koch Phone.: +43 (0)3842 200 5925 Email: [email protected]
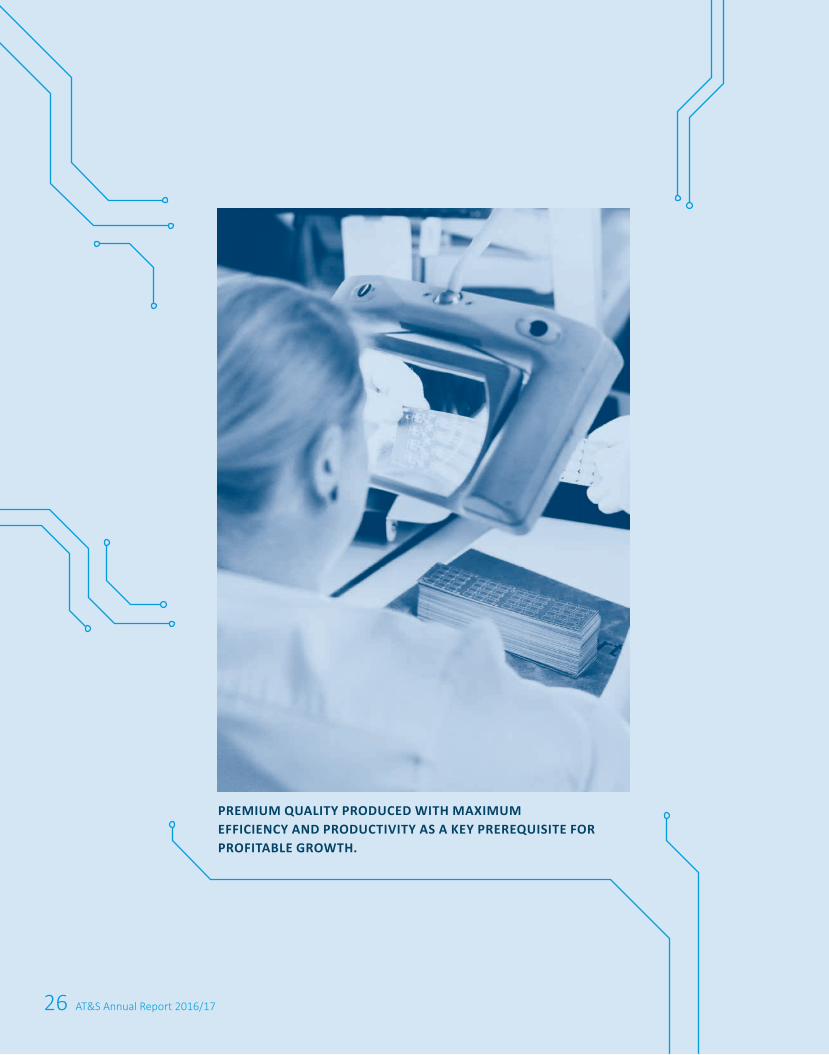
26 AT&S Annual Report 2016/17
PREMIUM QUALITY PRODUCED WITH MAXIMUM EFFICIENCY AND PRODUCTIVITY AS A KEY PREREQUISITE FOR PROFITABLE GROWTH.
27Corporate Governance Report
Corporate Governance Report
Table of Contents
Principles and Corporate Governance Declaration 28
AT&S AG Management Board 31
AT&S AG Supervisory Board and Annual General Meeting 33
Composition 34
Independence of Supervisory Board members 36
Diversity 37
Agreements requiring approval 37
Committees 37
Remuneration Report: Management and Supervisory Boards 39
Directors’ Holdings & Dealings 43
Compliance & other codes of conduct 44
Governance, risk & compliance committee 44
Code of business ethics and conduct 44
Anti-corruption guideline 44
Fair business practices policy 45
Capital market compliance 45
Advancement of women in senior management 45
28 AT&S Annual Report 2016/17
10 AT&S Annual Report 2016/17
CORPORATE GOVERNANCE CODE In Austria, the Corporate Governance Code (ÖCGK) drawn up by the Working Group for Corporate Governance under the guidance of the government authorities responsible for the Austrian capital market has been in force since 1 October 2002. Since then, it has been reviewed in light of national and international developments and amended where necessary.
As a system of rules, the ÖCGK supplements Austrian stock and capital market legislation with recommenda-tions and suggestions regarding good corporate management. The objective of the ÖCGK is the responsible management and control of enterprises for the purpose of sustainable, long-term value creation, with a high level of transparency for all stakeholders of the company.
Its basis is provided by the provisions of Austrian company, stock exchange and capital markets legislation, the EU recommendations concerning the responsibilities of Supervisory Board members and the remunera-tion of directors, and the principles of the OECD guidelines for corporate governance.
The rules of the ÖCGK are divided into three categories:
L-Rules (legal requirements): rules based on mandatory statutory requirements C-Rules (comply or explain): rules from which any departure must be explained and justified R-Rules (recommendations): rules in the nature of recommendations, where non-compliance need neither
be disclosed nor explained.
The version of the ÖCGK currently in force can be downloaded from the Working Group's website at www.corporate-governance.at. An English translation of the Code and interpretations of the Code prepared by the Working Group are also available there.
AT&S shares have been listed on the Vienna Stock Exchange since 20 May 2008. In order to qualify for inclu-sion in the Prime Market, companies must provide an undertaking to comply with the ÖCGK. AT&S has there-fore expressly subscribed to the ÖCGK since its shares were listed.
AT & S Austria Technologie & Systemtechnik Aktiengesellschaft (AT&S) declares its adherence to the Austrian Corporate Governance Code (ÖCGK) as amended in January 2015, and submits this corporate governance report, which also forms part of the Annual Report for the financial year 2016/17. It is also available on the company's website, www.ats.net, under Company – Corporate Governance – Reports. With regard to content orientation, the requirements of Comment 22 of the Austrian Financial Reporting and Auditing Committee (AFRAC) were followed. In essential reporting items, the concerns of the entire Group will be included, if necessary. With the following declarations of undertaking, AT&S complies with the provisions of the Code as amended in January 2015 as of 31 March 2017:
C-RULES 27–28A AND ALL RELATED PROVISIONS These rules were amended in the course of the review of the ÖCGK in December 2009 and came into force on 1 January 2010. Rules 27, 27a and 28 con-tained in the version of January 2010 only apply to contracts concluded after 31 December 2009. C-Rules 27-28a were therefore not applicable with respect to the original agreement appointing Heinz Moitzi to the Management Board as of 1 April 2005 and were also not applied in full when that agreement was extended by the Supervisory Board in 2016. Due to the short period between the most recent revision of the Austrian Corporate Governance Code and the appointment of Andreas Gerstenmayer as Chairman of the Manage-ment Board in mid-December 2009, and in order to avoid any departure from the remuneration regulations applicable to the appointment of Mr Moitzi, the new rules were not taken into account when the agreement with Andreas Gerstenmayer was signed in January 2010, nor when his Management Board appointment was renewed in 2016. This was not considered necessary because the Group’s stock option scheme had already expired (see below). Furthermore, the Management Board and Supervisory Board work closely together on the long-term development of the Group. The Supervisory Board and the Nomination and Remuneration
Principles and Corporate Governance Declaration
29Corporate Governance Report
10 AT&S Annual Report 2016/17
CORPORATE GOVERNANCE CODE In Austria, the Corporate Governance Code (ÖCGK) drawn up by the Working Group for Corporate Governance under the guidance of the government authorities responsible for the Austrian capital market has been in force since 1 October 2002. Since then, it has been reviewed in light of national and international developments and amended where necessary.
As a system of rules, the ÖCGK supplements Austrian stock and capital market legislation with recommenda-tions and suggestions regarding good corporate management. The objective of the ÖCGK is the responsible management and control of enterprises for the purpose of sustainable, long-term value creation, with a high level of transparency for all stakeholders of the company.
Its basis is provided by the provisions of Austrian company, stock exchange and capital markets legislation, the EU recommendations concerning the responsibilities of Supervisory Board members and the remunera-tion of directors, and the principles of the OECD guidelines for corporate governance.
The rules of the ÖCGK are divided into three categories:
L-Rules (legal requirements): rules based on mandatory statutory requirements C-Rules (comply or explain): rules from which any departure must be explained and justified R-Rules (recommendations): rules in the nature of recommendations, where non-compliance need neither
be disclosed nor explained.
The version of the ÖCGK currently in force can be downloaded from the Working Group's website at www.corporate-governance.at. An English translation of the Code and interpretations of the Code prepared by the Working Group are also available there.
AT&S shares have been listed on the Vienna Stock Exchange since 20 May 2008. In order to qualify for inclu-sion in the Prime Market, companies must provide an undertaking to comply with the ÖCGK. AT&S has there-fore expressly subscribed to the ÖCGK since its shares were listed.
AT & S Austria Technologie & Systemtechnik Aktiengesellschaft (AT&S) declares its adherence to the Austrian Corporate Governance Code (ÖCGK) as amended in January 2015, and submits this corporate governance report, which also forms part of the Annual Report for the financial year 2016/17. It is also available on the company's website, www.ats.net, under Company – Corporate Governance – Reports. With regard to content orientation, the requirements of Comment 22 of the Austrian Financial Reporting and Auditing Committee (AFRAC) were followed. In essential reporting items, the concerns of the entire Group will be included, if necessary. With the following declarations of undertaking, AT&S complies with the provisions of the Code as amended in January 2015 as of 31 March 2017:
C-RULES 27–28A AND ALL RELATED PROVISIONS These rules were amended in the course of the review of the ÖCGK in December 2009 and came into force on 1 January 2010. Rules 27, 27a and 28 con-tained in the version of January 2010 only apply to contracts concluded after 31 December 2009. C-Rules 27-28a were therefore not applicable with respect to the original agreement appointing Heinz Moitzi to the Management Board as of 1 April 2005 and were also not applied in full when that agreement was extended by the Supervisory Board in 2016. Due to the short period between the most recent revision of the Austrian Corporate Governance Code and the appointment of Andreas Gerstenmayer as Chairman of the Manage-ment Board in mid-December 2009, and in order to avoid any departure from the remuneration regulations applicable to the appointment of Mr Moitzi, the new rules were not taken into account when the agreement with Andreas Gerstenmayer was signed in January 2010, nor when his Management Board appointment was renewed in 2016. This was not considered necessary because the Group’s stock option scheme had already expired (see below). Furthermore, the Management Board and Supervisory Board work closely together on the long-term development of the Group. The Supervisory Board and the Nomination and Remuneration
Principles and Corporate Governance Declaration
Corporate Governance Report 11
Committee also regularly analyse the broader long-term orientation of Management Board remuneration. The following deviations from the rules currently require explanation:
The Group's now-expired stock option scheme did not require the beneficiaries to hold shares in the Group, and provided only for a vesting period of two years before (a part of) the options acquired could be exercised. The stock option scheme in question has expired, with the last allocation having been made on 1 April 2012. Options granted under this scheme could still be exercised until 31 March 2017. Details regarding the stock option scheme can be found in the section on Management Board remuneration.
After extensive planning, a long-term incentive (“LTI”) programme for the Management Board and key staff was implemented by resolution of the Supervisory Board on 3 July 2014 as a replacement for the stock option scheme that expired with the last distribution on 1 April 2012. The new programme is based on stock appre-ciation rights (“SAR”). The Management Board and Supervisory Board also work continuously to raise the performance of AT&S Group still further with respect to non-financial targets. However, in order to maintain the transparency and traceability of target achievement as it relates to variable long-term remuneration, no fixed non-financial criteria for remuneration under the long-term incentive programme are stipulated. Details of this long-term incentive programme can be found in the section on Management Board remuneration.
The variable remuneration of the Management Board (not in the form of stock options and SAR) is dependent on the achievement of two performance indicators defined in the budget for the respective financial year: return on capital employed (ROCE), with a 90% weighting, and the innovation revenue rate (IRR), with a 10% weighting. The basic prerequisite for awarding this variable remuneration is positive EBIT for the Group as a whole for the financial year and attainment of the target EBIT margin for the Group as a whole by at least 70% (the “hurdle rate”). If these key performance indicators are exceeded, bonuses are restricted to a maxi-mum of 200% of the annual bonus set out in the contract of employment. The inclusion of IRR is of major importance in giving variable remuneration a long-term focus because innovation strength – the develop-ment of new technologies, products or product types – is a crucial factor for the future business success of the Group. It can also be reliably measured. IRR represents the share of total revenue generated from tech-nologically innovative products introduced in the past three years. The three-year reference period provides a long-term component of variable remuneration.
Management Board members are contractually entitled to termination benefits in accordance with the Sala-ried Employees Act (AngG), applied mutatis mutandis (“old system for severance pay”), if their appointments are terminated. In the event of premature termination of a Management Board member's appointment by the respective board member for reasonable cause, or where the function becomes obsolete for legal rea-sons, remuneration is payable until the end of the appointment contract, and not necessarily for a maximum of two years. Where a Management Board member resigns their appointment or is removed from office for severe breach of duty, and in the event of death, payment of salary ceases at the end of the applicable month. Subject to termination provisions in accordance with the Salaried Employees Act, compensation payments in the case of premature termination of Management Board appointments, even if without good cause, could exceed more than two years' total remuneration in exceptional cases. The contracts of all mem-bers of the Management Board include a “Change of Control” clause, which defines the benefits related to the termination of the Management Board appointment as a result of a change of control. A change of con-trol exists in the event that a shareholder of the company has obtained control of the company in accordance with Section 22 of the Austrian Takeover Act (ÜbG) by holding at least 30% of the voting rights (including the voting rights of third parties attributable to the shareholder pursuant to the Austrian Takeover Act), or the company has been merged with a non-Group legal entity, unless the value of the other legal entity amounts to less than 50% of the value of the company according to the agreed exchange ratio.
In the event of a change of control, the Management Board member is entitled to resign for good cause and to terminate the Management Board contract at the end of each calendar month within a period of six months after the change of control takes legal effect, subject to a notice period of three months (“special
30 AT&S Annual Report 2016/17
12 AT&S Annual Report 2016/17
termination right”). If the special termination right is exercised or the Management Board contract is termi-nated by mutual agreement within six months of the change of control, the Management Board member is entitled to the payment of his/her remuneration entitlements for the remaining term of this contract, how-ever, for a maximum of three annual gross salaries. Other remuneration components (e.g. stock options) shall not be included in the calculation of the amount of the severance payment and shall be excluded from it. If a termination benefit has been agreed in the Management Board contract, the Management Board member is also entitled to this termination benefit in the event the special termination right is exercised or the Man-agement Board contract is terminated by mutual consent in the event of a change of control. Beyond that, there are no entitlements. The agreement of such a contract clause is considered market standard by the Nomination and Remuneration Committee and serves to ensure that Management Board members exercise their tasks in the best interests of the company in such situations.
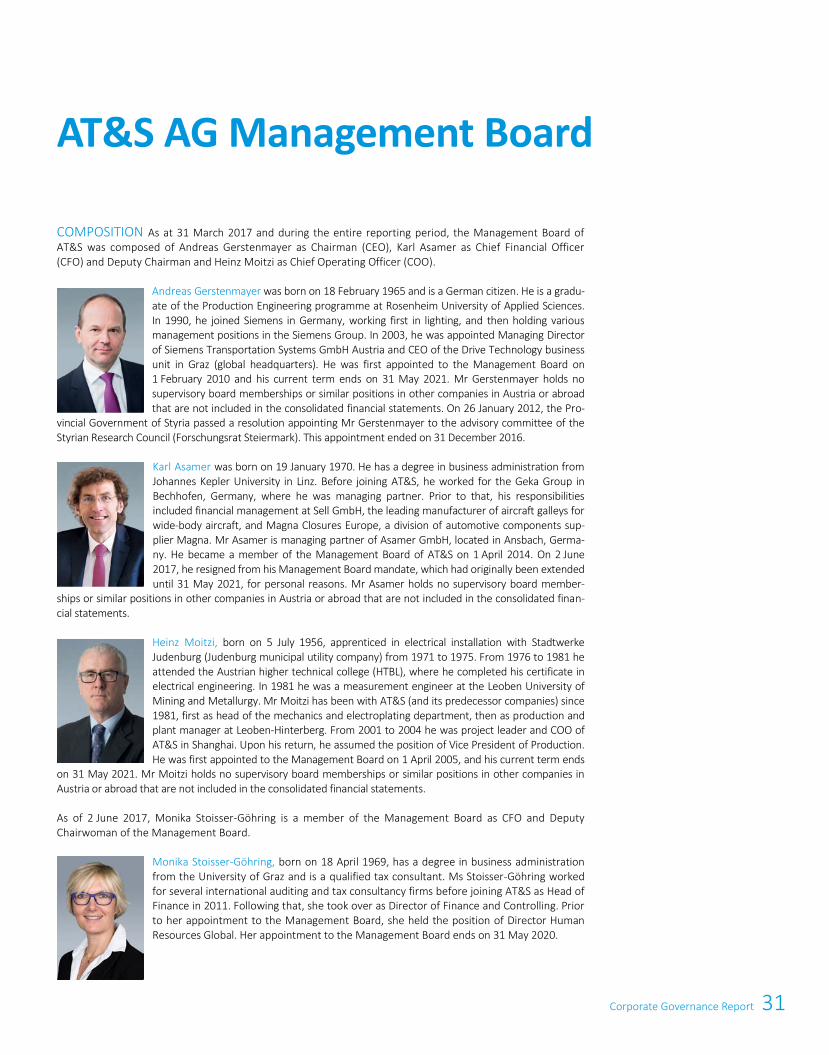
31Corporate Governance Report
Corporate Governance Report 1
COMPOSITION As at 31 March 2017 and during the entire reporting period, the Management Board of AT&S was composed of Andreas Gerstenmayer as Chairman (CEO), Karl Asamer as Chief Financial Officer (CFO) and Deputy Chairman and Heinz Moitzi as Chief Operating Officer (COO).
Andreas Gerstenmayer was born on 18 February 1965 and is a German citizen. He is a gradu-ate of the Production Engineering programme at Rosenheim University of Applied Sciences. In 1990, he joined Siemens in Germany, working first in lighting, and then holding various management positions in the Siemens Group. In 2003, he was appointed Managing Director of Siemens Transportation Systems GmbH Austria and CEO of the Drive Technology business unit in Graz (global headquarters). He was first appointed to the Management Board on 1 February 2010 and his current term ends on 31 May 2021. Mr Gerstenmayer holds no supervisory board memberships or similar positions in other companies in Austria or abroad that are not included in the consolidated financial statements. On 26 January 2012, the Pro-
vincial Government of Styria passed a resolution appointing Mr Gerstenmayer to the advisory committee of the Styrian Research Council (Forschungsrat Steiermark). This appointment ended on 31 December 2016.
Karl Asamer was born on 19 January 1970. He has a degree in business administration from Johannes Kepler University in Linz. Before joining AT&S, he worked for the Geka Group in Bechhofen, Germany, where he was managing partner. Prior to that, his responsibilities included financial management at Sell GmbH, the leading manufacturer of aircraft galleys for wide-body aircraft, and Magna Closures Europe, a division of automotive components sup-plier Magna. Mr Asamer is managing partner of Asamer GmbH, located in Ansbach, Germa-ny. He became a member of the Management Board of AT&S on 1 April 2014. On 2 June 2017, he resigned from his Management Board mandate, which had originally been extended until 31 May 2021, for personal reasons. Mr Asamer holds no supervisory board member-
ships or similar positions in other companies in Austria or abroad that are not included in the consolidated finan-cial statements.
Heinz Moitzi, born on 5 July 1956, apprenticed in electrical installation with Stadtwerke Judenburg (Judenburg municipal utility company) from 1971 to 1975. From 1976 to 1981 he attended the Austrian higher technical college (HTBL), where he completed his certificate in electrical engineering. In 1981 he was a measurement engineer at the Leoben University of Mining and Metallurgy. Mr Moitzi has been with AT&S (and its predecessor companies) since 1981, first as head of the mechanics and electroplating department, then as production and plant manager at Leoben-Hinterberg. From 2001 to 2004 he was project leader and COO of AT&S in Shanghai. Upon his return, he assumed the position of Vice President of Production. He was first appointed to the Management Board on 1 April 2005, and his current term ends
on 31 May 2021. Mr Moitzi holds no supervisory board memberships or similar positions in other companies in Austria or abroad that are not included in the consolidated financial statements.
As of 2 June 2017, Monika Stoisser-Göhring is a member of the Management Board as CFO and Deputy Chairwoman of the Management Board.
Monika Stoisser-Göhring, born on 18 April 1969, has a degree in business administration from the University of Graz and is a qualified tax consultant. Ms Stoisser-Göhring worked for several international auditing and tax consultancy firms before joining AT&S as Head of Finance in 2011. Following that, she took over as Director of Finance and Controlling. Prior to her appointment to the Management Board, she held the position of Director Human Resources Global. Her appointment to the Management Board ends on 31 May 2020.
AT&S AG Management Board
12 AT&S Annual Report 2016/17
termination right”). If the special termination right is exercised or the Management Board contract is termi-nated by mutual agreement within six months of the change of control, the Management Board member is entitled to the payment of his/her remuneration entitlements for the remaining term of this contract, how-ever, for a maximum of three annual gross salaries. Other remuneration components (e.g. stock options) shall not be included in the calculation of the amount of the severance payment and shall be excluded from it. If a termination benefit has been agreed in the Management Board contract, the Management Board member is also entitled to this termination benefit in the event the special termination right is exercised or the Man-agement Board contract is terminated by mutual consent in the event of a change of control. Beyond that, there are no entitlements. The agreement of such a contract clause is considered market standard by the Nomination and Remuneration Committee and serves to ensure that Management Board members exercise their tasks in the best interests of the company in such situations.
32 AT&S Annual Report 2016/17
14 AT&S Annual Report 2016/17
WORK PRACTICES AND ORGANISATION As a collective executive body, the Management Board is jointly responsible for the management of the company. Each member of the Management Board is also responsible for defined areas of the business, in addition to their collective responsibility. Management Board members have a duty to keep each other informed of all important business events and transactions. Fun-damental issues of business policy and major decisions require a joint decision by all Management Board members. Meetings of the Management Board are characterised by a culture of open discussion. If unani-mous agreement is not reached on such decisions, the Chairman of the Supervisory Board must be informed without delay. The Supervisory Board must also be informed of all proposed decisions with far-reaching consequences. The Management Board is required to obtain the prior consent of the Supervisory Board for business transactions as stipulated by law and the Articles of Association or rules and procedures issued by the Supervisory Board to the Management Board; this applies to both the companies and measures of its subsidiaries. Internal Audit reports directly to the Management Board. The audit plan and any material out-comes must be reported to the Audit Committee of the Supervisory Board at least once a year. The rules and procedures of AT&S's Management Board require the Board to meet at least once a month. In the past finan-cial year, there were a total of 30 Management Board meetings. Written minutes of all Board meetings and decisions were provided.
In addition to the statutory collective responsibility, functional responsibility is allocated to the members of the Management Board as follows, with the reporting obligations referring to both those of the company and those of the subsidiaries:
a) Andreas Gerstenmayer is Chairman of the Management Board (CEO) and responsible for:
Sales and Marketing Human Resources incl. CSR & Sustainability Investor Relations, External and Internal Commu-
nications
Business Development & Strategy Compliance
b) Karl Asamer is Deputy Chairman of the Management Board with responsibility as CFO for:
Finance and Accounting, Treasury Controlling Procurement
Legal Affairs, Risk Management and Internal Audit IT & Tools
c) Heinz Moitzi is COO with responsibility for:
Research & Development (R&D) Operations Quality Management
Business Process Excellence Environment Safety
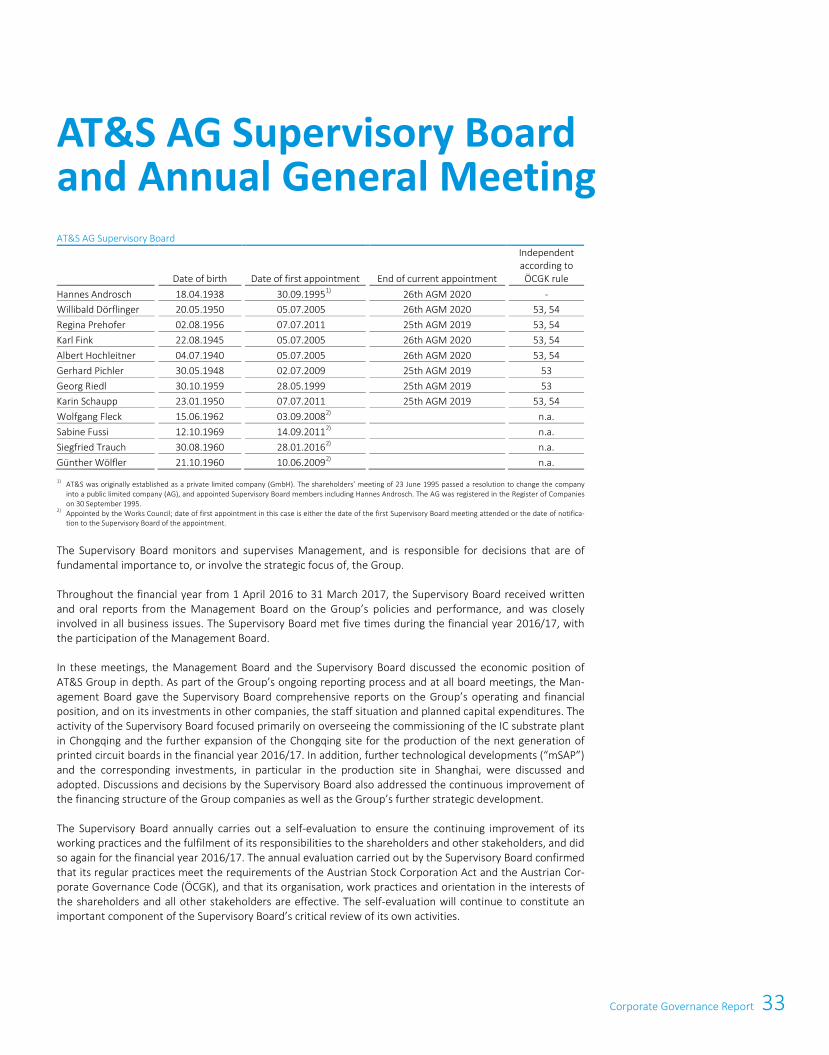
33Corporate Governance Report
14 AT&S Annual Report 2016/17
WORK PRACTICES AND ORGANISATION As a collective executive body, the Management Board is jointly responsible for the management of the company. Each member of the Management Board is also responsible for defined areas of the business, in addition to their collective responsibility. Management Board members have a duty to keep each other informed of all important business events and transactions. Fun-damental issues of business policy and major decisions require a joint decision by all Management Board members. Meetings of the Management Board are characterised by a culture of open discussion. If unani-mous agreement is not reached on such decisions, the Chairman of the Supervisory Board must be informed without delay. The Supervisory Board must also be informed of all proposed decisions with far-reaching consequences. The Management Board is required to obtain the prior consent of the Supervisory Board for business transactions as stipulated by law and the Articles of Association or rules and procedures issued by the Supervisory Board to the Management Board; this applies to both the companies and measures of its subsidiaries. Internal Audit reports directly to the Management Board. The audit plan and any material out-comes must be reported to the Audit Committee of the Supervisory Board at least once a year. The rules and procedures of AT&S's Management Board require the Board to meet at least once a month. In the past finan-cial year, there were a total of 30 Management Board meetings. Written minutes of all Board meetings and decisions were provided.
In addition to the statutory collective responsibility, functional responsibility is allocated to the members of the Management Board as follows, with the reporting obligations referring to both those of the company and those of the subsidiaries:
a) Andreas Gerstenmayer is Chairman of the Management Board (CEO) and responsible for:
Sales and Marketing Human Resources incl. CSR & Sustainability Investor Relations, External and Internal Commu-
nications
Business Development & Strategy Compliance
b) Karl Asamer is Deputy Chairman of the Management Board with responsibility as CFO for:
Finance and Accounting, Treasury Controlling Procurement
Legal Affairs, Risk Management and Internal Audit IT & Tools
c) Heinz Moitzi is COO with responsibility for:
Research & Development (R&D) Operations Quality Management
Business Process Excellence Environment Safety
Corporate Governance Report 15
AT&S AG Supervisory Board
Date of birth
Date of first appointment
End of current appointment
Independent according to ÖCGK rule
Hannes Androsch
18.04.1938
30.09.1995
1)
26th AGM 2020
- Willibald Dörflinger
20.05.1950
05.07.2005
26th AGM 2020
53, 54
Regina Prehofer
02.08.1956
07.07.2011
25th AGM 2019
53, 54 Karl Fink
22.08.1945
05.07.2005
26th AGM 2020
53, 54
Albert Hochleitner
04.07.1940
05.07.2005
26th AGM 2020
53, 54 Gerhard Pichler
30.05.1948
02.07.2009
25th AGM 2019
53
Georg Riedl
30.10.1959
28.05.1999
25th AGM 2019
53 Karin Schaupp
23.01.1950
07.07.2011
25th AGM 2019
53, 54
Wolfgang Fleck
15.06.1962
03.09.2008
2)
n.a. Sabine Fussi
12.10.1969
14.09.2011
2)
n.a. Siegfried Trauch
30.08.1960
28.01.2016
2)
n.a. Günther Wölfler
21.10.1960
10.06.2009
2)
n.a. 1) AT&S was originally established as a private limited company (GmbH). The shareholders’ meeting of 23 June 1995 passed a resolution to change the company
into a public limited company (AG), and appointed Supervisory Board members including Hannes Androsch. The AG was registered in the Register of Companies on 30 September 1995.
2) Appointed by the Works Council; date of first appointment in this case is either the date of the first Supervisory Board meeting attended or the date of notifica-tion to the Supervisory Board of the appointment.
The Supervisory Board monitors and supervises Management, and is responsible for decisions that are of fundamental importance to, or involve the strategic focus of, the Group.
Throughout the financial year from 1 April 2016 to 31 March 2017, the Supervisory Board received written and oral reports from the Management Board on the Group’s policies and performance, and was closely involved in all business issues. The Supervisory Board met five times during the financial year 2016/17, with the participation of the Management Board.
In these meetings, the Management Board and the Supervisory Board discussed the economic position of AT&S Group in depth. As part of the Group’s ongoing reporting process and at all board meetings, the Man-agement Board gave the Supervisory Board comprehensive reports on the Group’s operating and financial position, and on its investments in other companies, the staff situation and planned capital expenditures. The activity of the Supervisory Board focused primarily on overseeing the commissioning of the IC substrate plant in Chongqing and the further expansion of the Chongqing site for the production of the next generation of printed circuit boards in the financial year 2016/17. In addition, further technological developments (“mSAP”) and the corresponding investments, in particular in the production site in Shanghai, were discussed and adopted. Discussions and decisions by the Supervisory Board also addressed the continuous improvement of the financing structure of the Group companies as well as the Group’s further strategic development.
The Supervisory Board annually carries out a self-evaluation to ensure the continuing improvement of its working practices and the fulfilment of its responsibilities to the shareholders and other stakeholders, and did so again for the financial year 2016/17. The annual evaluation carried out by the Supervisory Board confirmed that its regular practices meet the requirements of the Austrian Stock Corporation Act and the Austrian Cor-porate Governance Code (ÖCGK), and that its organisation, work practices and orientation in the interests of the shareholders and all other stakeholders are effective. The self-evaluation will continue to constitute an important component of the Supervisory Board’s critical review of its own activities.
AT&S AG Supervisory Board and Annual General Meeting
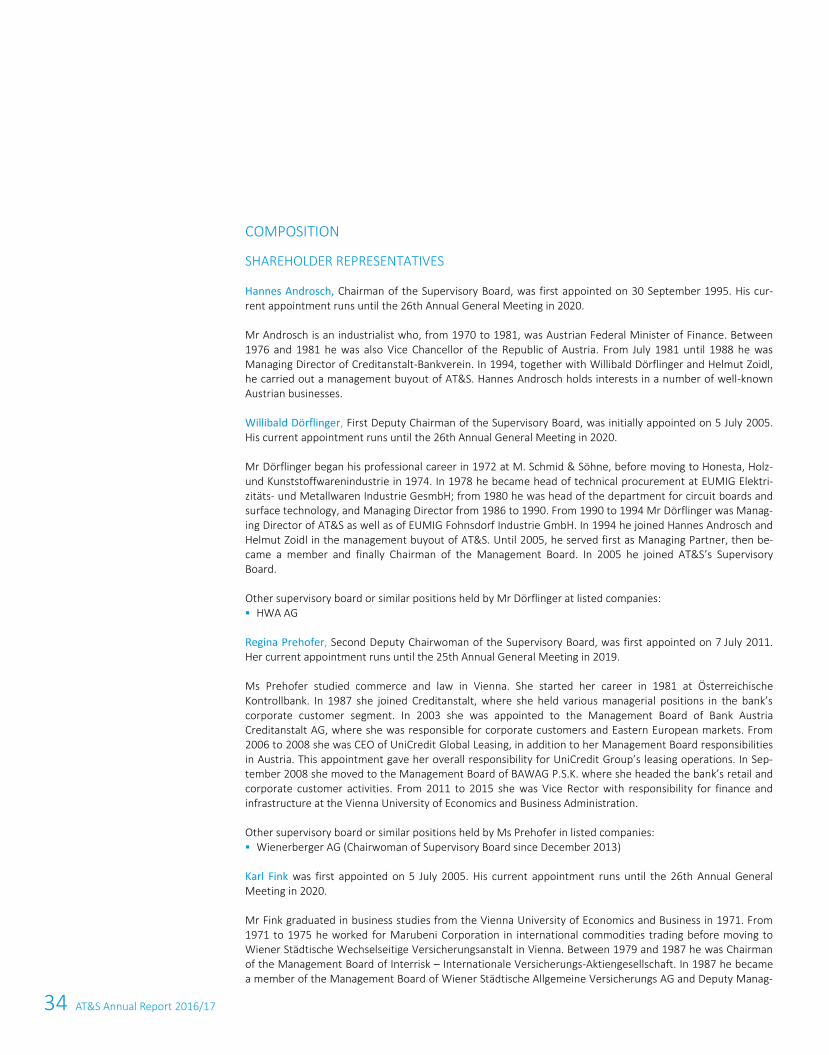
34 AT&S Annual Report 2016/17
16 AT&S Annual Report 2016/17
COMPOSITION
SHAREHOLDER REPRESENTATIVES
Hannes Androsch, Chairman of the Supervisory Board, was first appointed on 30 September 1995. His cur-rent appointment runs until the 26th Annual General Meeting in 2020.
Mr Androsch is an industrialist who, from 1970 to 1981, was Austrian Federal Minister of Finance. Between 1976 and 1981 he was also Vice Chancellor of the Republic of Austria. From July 1981 until 1988 he was Managing Director of Creditanstalt-Bankverein. In 1994, together with Willibald Dörflinger and Helmut Zoidl, he carried out a management buyout of AT&S. Hannes Androsch holds interests in a number of well-known Austrian businesses.
Willibald Dörflinger, First Deputy Chairman of the Supervisory Board, was initially appointed on 5 July 2005. His current appointment runs until the 26th Annual General Meeting in 2020.
Mr Dörflinger began his professional career in 1972 at M. Schmid & Söhne, before moving to Honesta, Holz- und Kunststoffwarenindustrie in 1974. In 1978 he became head of technical procurement at EUMIG Elektri-zitäts- und Metallwaren Industrie GesmbH; from 1980 he was head of the department for circuit boards and surface technology, and Managing Director from 1986 to 1990. From 1990 to 1994 Mr Dörflinger was Manag-ing Director of AT&S as well as of EUMIG Fohnsdorf Industrie GmbH. In 1994 he joined Hannes Androsch and Helmut Zoidl in the management buyout of AT&S. Until 2005, he served first as Managing Partner, then be-came a member and finally Chairman of the Management Board. In 2005 he joined AT&S’s Supervisory Board.
Other supervisory board or similar positions held by Mr Dörflinger at listed companies: HWA AG
Regina Prehofer, Second Deputy Chairwoman of the Supervisory Board, was first appointed on 7 July 2011. Her current appointment runs until the 25th Annual General Meeting in 2019.
Ms Prehofer studied commerce and law in Vienna. She started her career in 1981 at Österreichische Kontrollbank. In 1987 she joined Creditanstalt, where she held various managerial positions in the bank’s corporate customer segment. In 2003 she was appointed to the Management Board of Bank Austria Creditanstalt AG, where she was responsible for corporate customers and Eastern European markets. From 2006 to 2008 she was CEO of UniCredit Global Leasing, in addition to her Management Board responsibilities in Austria. This appointment gave her overall responsibility for UniCredit Group’s leasing operations. In Sep-tember 2008 she moved to the Management Board of BAWAG P.S.K. where she headed the bank’s retail and corporate customer activities. From 2011 to 2015 she was Vice Rector with responsibility for finance and infrastructure at the Vienna University of Economics and Business Administration.
Other supervisory board or similar positions held by Ms Prehofer in listed companies: Wienerberger AG (Chairwoman of Supervisory Board since December 2013)
Karl Fink was first appointed on 5 July 2005. His current appointment runs until the 26th Annual General Meeting in 2020.
Mr Fink graduated in business studies from the Vienna University of Economics and Business in 1971. From 1971 to 1975 he worked for Marubeni Corporation in international commodities trading before moving to Wiener Städtische Wechselseitige Versicherungsanstalt in Vienna. Between 1979 and 1987 he was Chairman of the Management Board of Interrisk – Internationale Versicherungs-Aktiengesellschaft. In 1987 he became a member of the Management Board of Wiener Städtische Allgemeine Versicherungs AG and Deputy Manag-
35Corporate Governance Report
16 AT&S Annual Report 2016/17
COMPOSITION
SHAREHOLDER REPRESENTATIVES
Hannes Androsch, Chairman of the Supervisory Board, was first appointed on 30 September 1995. His cur-rent appointment runs until the 26th Annual General Meeting in 2020.
Mr Androsch is an industrialist who, from 1970 to 1981, was Austrian Federal Minister of Finance. Between 1976 and 1981 he was also Vice Chancellor of the Republic of Austria. From July 1981 until 1988 he was Managing Director of Creditanstalt-Bankverein. In 1994, together with Willibald Dörflinger and Helmut Zoidl, he carried out a management buyout of AT&S. Hannes Androsch holds interests in a number of well-known Austrian businesses.
Willibald Dörflinger, First Deputy Chairman of the Supervisory Board, was initially appointed on 5 July 2005. His current appointment runs until the 26th Annual General Meeting in 2020.
Mr Dörflinger began his professional career in 1972 at M. Schmid & Söhne, before moving to Honesta, Holz- und Kunststoffwarenindustrie in 1974. In 1978 he became head of technical procurement at EUMIG Elektri-zitäts- und Metallwaren Industrie GesmbH; from 1980 he was head of the department for circuit boards and surface technology, and Managing Director from 1986 to 1990. From 1990 to 1994 Mr Dörflinger was Manag-ing Director of AT&S as well as of EUMIG Fohnsdorf Industrie GmbH. In 1994 he joined Hannes Androsch and Helmut Zoidl in the management buyout of AT&S. Until 2005, he served first as Managing Partner, then be-came a member and finally Chairman of the Management Board. In 2005 he joined AT&S’s Supervisory Board.
Other supervisory board or similar positions held by Mr Dörflinger at listed companies: HWA AG
Regina Prehofer, Second Deputy Chairwoman of the Supervisory Board, was first appointed on 7 July 2011. Her current appointment runs until the 25th Annual General Meeting in 2019.
Ms Prehofer studied commerce and law in Vienna. She started her career in 1981 at Österreichische Kontrollbank. In 1987 she joined Creditanstalt, where she held various managerial positions in the bank’s corporate customer segment. In 2003 she was appointed to the Management Board of Bank Austria Creditanstalt AG, where she was responsible for corporate customers and Eastern European markets. From 2006 to 2008 she was CEO of UniCredit Global Leasing, in addition to her Management Board responsibilities in Austria. This appointment gave her overall responsibility for UniCredit Group’s leasing operations. In Sep-tember 2008 she moved to the Management Board of BAWAG P.S.K. where she headed the bank’s retail and corporate customer activities. From 2011 to 2015 she was Vice Rector with responsibility for finance and infrastructure at the Vienna University of Economics and Business Administration.
Other supervisory board or similar positions held by Ms Prehofer in listed companies: Wienerberger AG (Chairwoman of Supervisory Board since December 2013)
Karl Fink was first appointed on 5 July 2005. His current appointment runs until the 26th Annual General Meeting in 2020.
Mr Fink graduated in business studies from the Vienna University of Economics and Business in 1971. From 1971 to 1975 he worked for Marubeni Corporation in international commodities trading before moving to Wiener Städtische Wechselseitige Versicherungsanstalt in Vienna. Between 1979 and 1987 he was Chairman of the Management Board of Interrisk – Internationale Versicherungs-Aktiengesellschaft. In 1987 he became a member of the Management Board of Wiener Städtische Allgemeine Versicherungs AG and Deputy Manag-
Corporate Governance Report 17
ing Director in July 2004. In October 2007 he was appointed Managing Director of Wiener Städtische Versi-cherung AG, Vienna Insurance Group. Mr Fink retired from the Vienna Insurance Group Managing Board on 30 September 2009. He is a member of the Management Board of Wiener Städtische Versicherungsverein, the principal shareholder in Vienna Insurance Group, holds a number of supervisory positions and consulta-tive positions within that Group. He is also honorary consul of Montenegro.
Albert Hochleitner was first appointed on 5 July 2005. His current appointment runs until the 26th Annual General Meeting in 2020.
Mr Hochleitner completed his studies in engineering physics at Vienna University of Technology in 1965. In the same year, he joined the Siemens Group’s low voltage works in Vienna. In 1984 he was appointed Chair-man of the Management Board of Uher AG. In 1988 he joined Siemens AG, where he was head of the electric motors business in the automotive technology sector based in Wurzburg. In October 1992 he became a member of the Management Board of Siemens AG Austria. From 1994 he was Chairman of the Management Board, before becoming a member of the Supervisory Board of Siemens AG in 2005, which he left in 2010 because of reaching the applicable age limit for members of the Supervisory Board.
Gerhard Pichler was first appointed on 2 July 2009. His current appointment runs until the 25th Annual Gen-eral Meeting in 2019.
Mr Pichler studied business administration at the Vienna University of Economics and Business. A certified auditor and tax adviser, he was Managing Director of CONSULTATIO Wirtschaftsprüfungsgesellschaft m.b.H. from 1986, and Managing Partner of the Group from 1995. As of 31 December 2016, Mr Pichler terminated his activity at CONSULTATIO Wirtschaftsprüfungsgesellschaft m.b.H. and resigned from his function as Man-aging Director.
Georg Riedl was first appointed on 28 May 1999. His current appointment runs until the 25th Annual General Meeting in 2019.
Mr Riedl acquired his doctorate in law in 1984 from the University of Vienna. In 1991 he commenced inde-pendent practice at Riedl & Ringhofer. He has been in independent practice since 2013 at the law office of Frotz Riedl Rechtsanwälte. He specialises in business, commercial, corporate, foundation and tax law, mer-gers and acquisitions, and contract law.
Other Supervisory Board or similar positions held by Mr Riedl in listed companies: VIENNA INSURANCE GROUP AG Wiener Versicherung Gruppe
Karin Schaupp was first appointed on 7 July 2011. Her current appointment runs until the 25th Annual Gen-eral Meeting in 2019.
Ms Schaupp earned her doctorate at the Karl Franzens University in Graz in 1978 and began her career as a university research assistant at the Institute of Pharmaceutical Chemistry. In 1980 she started her career in industry as Head of Analytics at Leopold Pharma GmbH. After holding various research, development and product management posts in the international pharmaceuticals industry, she was appointed CEO of Frese-nius Kabi Austria GmbH in 1997. In 1999 she became regional manager for Austria and Southeastern Europe. In 2000 she was appointed to the management board of Fresenius Kabi AG, Bad Homburg, with responsibility for worldwide operations. She has been an independent consultant since 2003, with a focus on strategic business development and innovation transfer.
Other Supervisory Board or similar positions held by Ms Schaupp at listed companies: BDI – BioEnergy International AG
36 AT&S Annual Report 2016/17
18 AT&S Annual Report 2016/17
EMPLOYEE REPRESENTATIVES
Employee participation in supervisory boards and their committees is mandated by law, and forms part of the Austrian corporate governance system. Employee representatives are entitled to delegate one representative as a Supervisory Board member for every two Supervisory Board members elected by the General Meeting. If there is an odd number of shareholders’ representatives, the number of employee representatives is rounded up. This one-third representation also applies to all Supervisory Board committees, with the exception of meetings and votes concerning the relationship between the company and its management board members. Resolutions appointing or dismissing a management board member and the granting of stock options in the company are also excepted. The Group Works Council meets regularly with the Management Board. These meetings facilitate the exchange of information on developments in the Group which have a direct bearing on employees.
Wolfgang Fleck, Sabine Fussi, Siegfried Trauch and Günther Wölfler were delegated to the Supervisory Board by the Works Council.
Additional information on the Supervisory Board and its composition is available online at www.ats.net/company/supervisory-board/.
INDEPENDENCE OF SUPERVISORY BOARD MEMBERS The ÖCGK specifies that the majority of Supervisory Board members representing the shareholders must be independent. In accordance with C Rule 53, the Supervisory Board has established the following criteria to be used in determining the independence of its members. Supervisory Board members are to be regarded as independent if they have no business or personal relationships with the Company or its Management Board which could be cause for material con-flicts of interest and therefore liable to influence the behaviour of the member in question. The following criteria are applied in determining the independence of Supervisory Board members:
The Supervisory Board member was neither a member of the Management Board nor a senior manager of the Company or one of its subsidiaries in the past five years.
The Supervisory Board member neither had during the last financial year nor currently has a business relationship with the Group or any of its subsidiaries of material significance to that member. This also ap-plies to business relationships between AT&S Group and enterprises in which the Supervisory Board mem-ber has a significant economic interest.
During the last three years, the Supervisory Board member was neither a statutory auditor of the Group, nor a person with an interest in the audit firm, nor an employee of any such firm.
The Supervisory Board member is not a member of a management board of another company where a member of AT&S’s Management Board is a member of that company’s Supervisory Board.
The Supervisory Board member has not been a member of the Supervisory Board for longer than 15 years. This does not apply to Supervisory Board members who are shareholders with entrepreneurial interests in the Group, or who represent the interests of such shareholders.
The Supervisory Board member is not a close family relative (direct descendant, spouse, life partner, par-ent, uncle, aunt, sibling, nephew or niece) of a Management Board member or of any person in a position described in the foregoing points.
In the meeting of 16 March 2017, the members of the Supervisory Board representing shareholder interests each declared whether they were independent as determined by the above criteria. Seven of the eight mem-bers of the AT&S AG Supervisory Board representing shareholder interests declared that they were inde-pendent. Mr Androsch declared that he was not independent.
C Rule 54 specifies that, for companies with a free float in excess of 50%, at least two Supervisory Board members who are independent should also not be shareholders with interests in excess of 10%, or repre-sentatives of such interests. Five of the eight Supervisory Board members representing the shareholders –
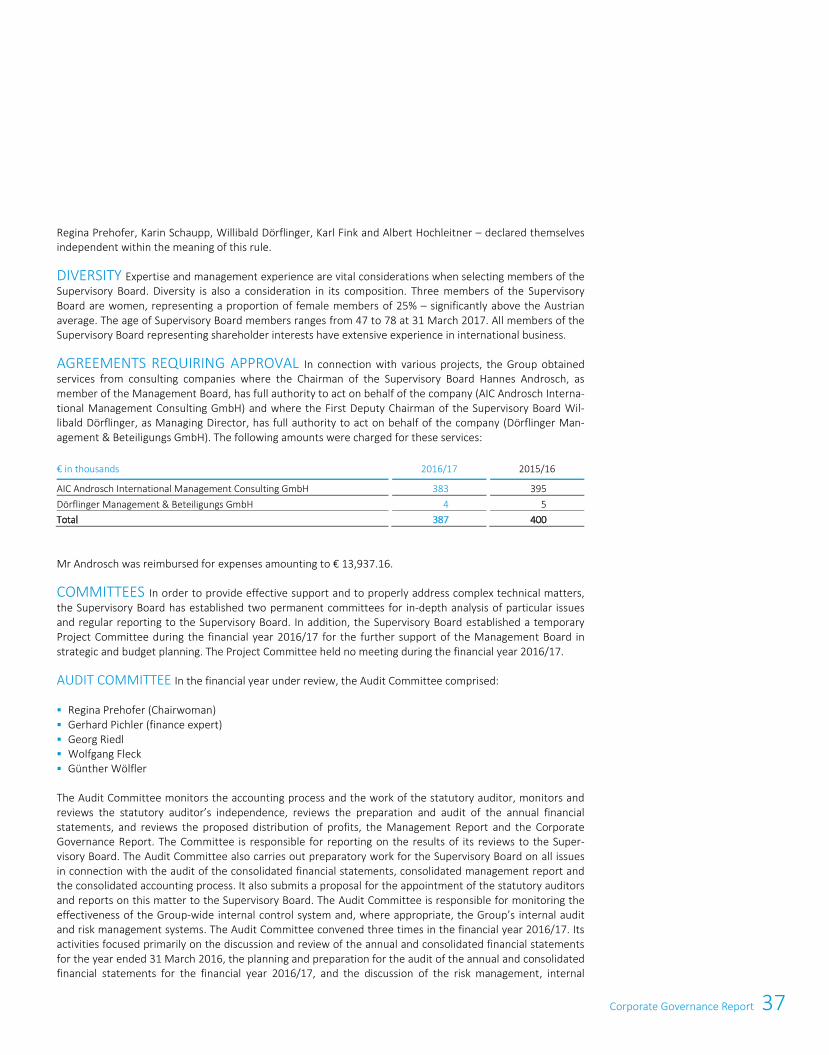
37Corporate Governance Report
18 AT&S Annual Report 2016/17
EMPLOYEE REPRESENTATIVES
Employee participation in supervisory boards and their committees is mandated by law, and forms part of the Austrian corporate governance system. Employee representatives are entitled to delegate one representative as a Supervisory Board member for every two Supervisory Board members elected by the General Meeting. If there is an odd number of shareholders’ representatives, the number of employee representatives is rounded up. This one-third representation also applies to all Supervisory Board committees, with the exception of meetings and votes concerning the relationship between the company and its management board members. Resolutions appointing or dismissing a management board member and the granting of stock options in the company are also excepted. The Group Works Council meets regularly with the Management Board. These meetings facilitate the exchange of information on developments in the Group which have a direct bearing on employees.
Wolfgang Fleck, Sabine Fussi, Siegfried Trauch and Günther Wölfler were delegated to the Supervisory Board by the Works Council.
Additional information on the Supervisory Board and its composition is available online at www.ats.net/company/supervisory-board/.
INDEPENDENCE OF SUPERVISORY BOARD MEMBERS The ÖCGK specifies that the majority of Supervisory Board members representing the shareholders must be independent. In accordance with C Rule 53, the Supervisory Board has established the following criteria to be used in determining the independence of its members. Supervisory Board members are to be regarded as independent if they have no business or personal relationships with the Company or its Management Board which could be cause for material con-flicts of interest and therefore liable to influence the behaviour of the member in question. The following criteria are applied in determining the independence of Supervisory Board members:
The Supervisory Board member was neither a member of the Management Board nor a senior manager of the Company or one of its subsidiaries in the past five years.
The Supervisory Board member neither had during the last financial year nor currently has a business relationship with the Group or any of its subsidiaries of material significance to that member. This also ap-plies to business relationships between AT&S Group and enterprises in which the Supervisory Board mem-ber has a significant economic interest.
During the last three years, the Supervisory Board member was neither a statutory auditor of the Group, nor a person with an interest in the audit firm, nor an employee of any such firm.
The Supervisory Board member is not a member of a management board of another company where a member of AT&S’s Management Board is a member of that company’s Supervisory Board.
The Supervisory Board member has not been a member of the Supervisory Board for longer than 15 years. This does not apply to Supervisory Board members who are shareholders with entrepreneurial interests in the Group, or who represent the interests of such shareholders.
The Supervisory Board member is not a close family relative (direct descendant, spouse, life partner, par-ent, uncle, aunt, sibling, nephew or niece) of a Management Board member or of any person in a position described in the foregoing points.
In the meeting of 16 March 2017, the members of the Supervisory Board representing shareholder interests each declared whether they were independent as determined by the above criteria. Seven of the eight mem-bers of the AT&S AG Supervisory Board representing shareholder interests declared that they were inde-pendent. Mr Androsch declared that he was not independent.
C Rule 54 specifies that, for companies with a free float in excess of 50%, at least two Supervisory Board members who are independent should also not be shareholders with interests in excess of 10%, or repre-sentatives of such interests. Five of the eight Supervisory Board members representing the shareholders –
Corporate Governance Report 19
Regina Prehofer, Karin Schaupp, Willibald Dörflinger, Karl Fink and Albert Hochleitner – declared themselves independent within the meaning of this rule.
DIVERSITY Expertise and management experience are vital considerations when selecting members of the Supervisory Board. Diversity is also a consideration in its composition. Three members of the Supervisory Board are women, representing a proportion of female members of 25% – significantly above the Austrian average. The age of Supervisory Board members ranges from 47 to 78 at 31 March 2017. All members of the Supervisory Board representing shareholder interests have extensive experience in international business.
AGREEMENTS REQUIRING APPROVAL In connection with various projects, the Group obtained services from consulting companies where the Chairman of the Supervisory Board Hannes Androsch, as member of the Management Board, has full authority to act on behalf of the company (AIC Androsch Interna-tional Management Consulting GmbH) and where the First Deputy Chairman of the Supervisory Board Wil-libald Dörflinger, as Managing Director, has full authority to act on behalf of the company (Dörflinger Man-agement & Beteiligungs GmbH). The following amounts were charged for these services:
€ in thousands
2016/17
2015/16
AIC Androsch International Management Consulting GmbH 383
395
Dörflinger Management & Beteiligungs GmbH 4
5
Total 387
400
Mr Androsch was reimbursed for expenses amounting to € 13,937.16.
COMMITTEES In order to provide effective support and to properly address complex technical matters, the Supervisory Board has established two permanent committees for in-depth analysis of particular issues and regular reporting to the Supervisory Board. In addition, the Supervisory Board established a temporary Project Committee during the financial year 2016/17 for the further support of the Management Board in strategic and budget planning. The Project Committee held no meeting during the financial year 2016/17.
AUDIT COMMITTEE In the financial year under review, the Audit Committee comprised:
Regina Prehofer (Chairwoman) Gerhard Pichler (finance expert) Georg Riedl Wolfgang Fleck Günther Wölfler
The Audit Committee monitors the accounting process and the work of the statutory auditor, monitors and reviews the statutory auditor’s independence, reviews the preparation and audit of the annual financial statements, and reviews the proposed distribution of profits, the Management Report and the Corporate Governance Report. The Committee is responsible for reporting on the results of its reviews to the Super-visory Board. The Audit Committee also carries out preparatory work for the Supervisory Board on all issues in connection with the audit of the consolidated financial statements, consolidated management report and the consolidated accounting process. It also submits a proposal for the appointment of the statutory auditors and reports on this matter to the Supervisory Board. The Audit Committee is responsible for monitoring the effectiveness of the Group-wide internal control system and, where appropriate, the Group’s internal audit and risk management systems. The Audit Committee convened three times in the financial year 2016/17. Its activities focused primarily on the discussion and review of the annual and consolidated financial statements for the year ended 31 March 2016, the planning and preparation for the audit of the annual and consolidated financial statements for the financial year 2016/17, and the discussion of the risk management, internal
38 AT&S Annual Report 2016/17
20 AT&S Annual Report 2016/17
control and internal audit systems. The Chairwoman of the Audit Committee was also involved in the quarter-ly reporting in the financial year 2016/17.
NOMINATION AND REMUNERATION COMMITTEE This committee consisted of the following members:
Hannes Androsch (Chairman) Willibald Dörflinger (Deputy Chairman) Georg Riedl Wolfgang Fleck Günther Wölfler
The Nomination and Remuneration Committee submits proposals to the Supervisory Board for appointments to fill vacancies on the Management Board whenever necessary. It deals with succession planning issues and the remuneration of Management Board members. This committee met once for this purpose in the financial year 2016/17. This meeting focused on the further development of the composition of the Supervisory Board. It was found that the requirements of Supervisory Board activities at AT&S have increased considerably in the past years, not least due to the expansion projects in China. It was therefore agreed that the international orientation of the Supervisory Board would be increased in the medium term and further experts from the electronics industry should be included in the future. The number of Supervisory Board members will also be subject to a critical review.
The Nomination and Remuneration Committee is authorised to make decisions in urgent cases. All of the commit-tee members representing shareholders possess knowledge of and experience in the area of remuneration policies.
PROJECT COMMITTEE Based on a decision made by the Supervisory Board on 16 March 2017 regarding the further support of the Management Board in strategic and budget planning, a temporary Project Commit-tee was established in the financial year 2016/17. This Project Committee consists of the following members:
Willibald Dörflinger (Chairman) Regina Prehofer Gerhard Pichler Wolfgang Fleck Günther Wölfler
The Project Committee did not meet during the financial year 2016/17.
ANNUAL GENERAL MEETING At the Annual General Meeting, which takes place at least once a year, the shareholders exercise their rights as provided by law and the Articles of Association, in particular their voting right. All shareholders thus have the opportunity to make use of their right to request information and make motions to the Management Board and Supervisory Board and to submit their statements and present their concerns and, if applicable, propose agenda items in accordance with Section 109 of the Stock Corpora-tion Act and submit proposals for resolutions in accordance with Section 110 of the Stock Corporation Act. The main tasks and competences of the Annual General Meeting include the resolution on profit appropria-tion, the election to the Supervisory Board, election of the auditor, discharge of the Management Board and the Supervisory Board as well as amendments to the Articles of Association. The agenda and the resolutions adopted at the Annual General Meetings of the company, for example of the 22nd Annual General Meeting of 7 July 2016, are available on the company’s website at, www.ats.net, under Investors – Annual General Meeting.
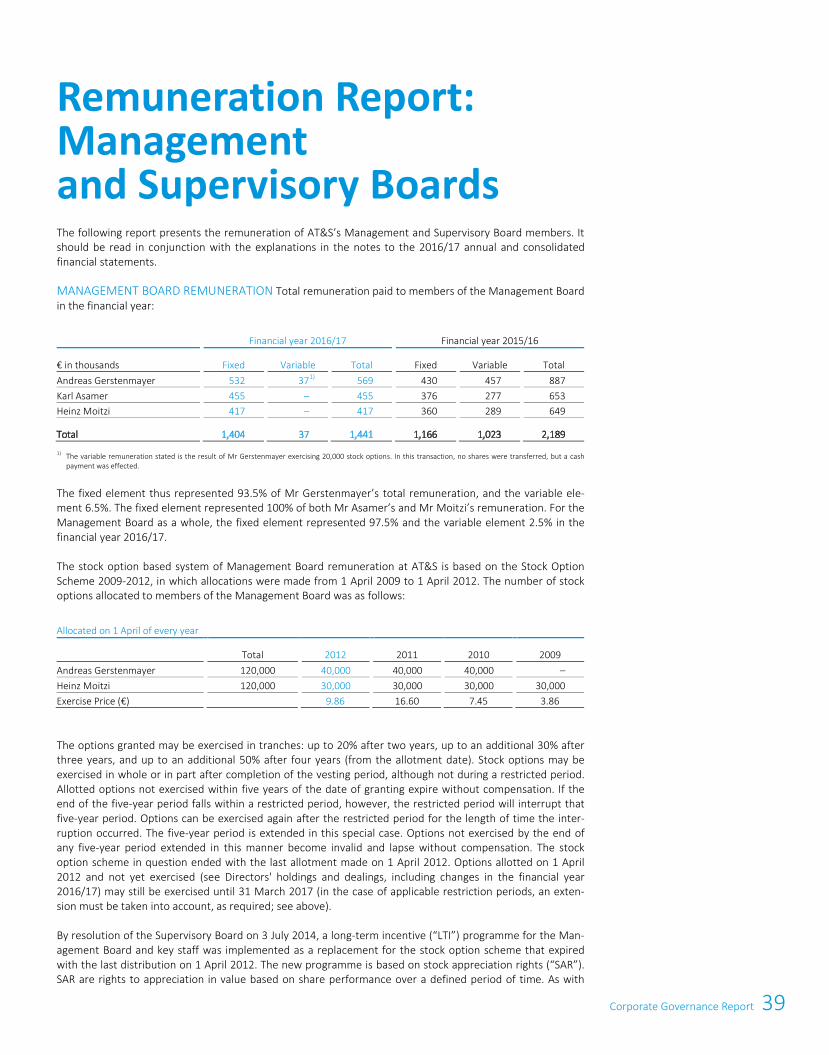
39Corporate Governance Report
20 AT&S Annual Report 2016/17
control and internal audit systems. The Chairwoman of the Audit Committee was also involved in the quarter-ly reporting in the financial year 2016/17.
NOMINATION AND REMUNERATION COMMITTEE This committee consisted of the following members:
Hannes Androsch (Chairman) Willibald Dörflinger (Deputy Chairman) Georg Riedl Wolfgang Fleck Günther Wölfler
The Nomination and Remuneration Committee submits proposals to the Supervisory Board for appointments to fill vacancies on the Management Board whenever necessary. It deals with succession planning issues and the remuneration of Management Board members. This committee met once for this purpose in the financial year 2016/17. This meeting focused on the further development of the composition of the Supervisory Board. It was found that the requirements of Supervisory Board activities at AT&S have increased considerably in the past years, not least due to the expansion projects in China. It was therefore agreed that the international orientation of the Supervisory Board would be increased in the medium term and further experts from the electronics industry should be included in the future. The number of Supervisory Board members will also be subject to a critical review.
The Nomination and Remuneration Committee is authorised to make decisions in urgent cases. All of the commit-tee members representing shareholders possess knowledge of and experience in the area of remuneration policies.
PROJECT COMMITTEE Based on a decision made by the Supervisory Board on 16 March 2017 regarding the further support of the Management Board in strategic and budget planning, a temporary Project Commit-tee was established in the financial year 2016/17. This Project Committee consists of the following members:
Willibald Dörflinger (Chairman) Regina Prehofer Gerhard Pichler Wolfgang Fleck Günther Wölfler
The Project Committee did not meet during the financial year 2016/17.
ANNUAL GENERAL MEETING At the Annual General Meeting, which takes place at least once a year, the shareholders exercise their rights as provided by law and the Articles of Association, in particular their voting right. All shareholders thus have the opportunity to make use of their right to request information and make motions to the Management Board and Supervisory Board and to submit their statements and present their concerns and, if applicable, propose agenda items in accordance with Section 109 of the Stock Corpora-tion Act and submit proposals for resolutions in accordance with Section 110 of the Stock Corporation Act. The main tasks and competences of the Annual General Meeting include the resolution on profit appropria-tion, the election to the Supervisory Board, election of the auditor, discharge of the Management Board and the Supervisory Board as well as amendments to the Articles of Association. The agenda and the resolutions adopted at the Annual General Meetings of the company, for example of the 22nd Annual General Meeting of 7 July 2016, are available on the company’s website at, www.ats.net, under Investors – Annual General Meeting.
Corporate Governance Report 21
The following report presents the remuneration of AT&S’s Management and Supervisory Board members. It should be read in conjunction with the explanations in the notes to the 2016/17 annual and consolidated financial statements.
MANAGEMENT BOARD REMUNERATION Total remuneration paid to members of the Management Board in the financial year:
Financial year 2016/17
Financial year 2015/16
€ in thousands
Fixed
Variable
Total
Fixed
Variable
Total Andreas Gerstenmayer
532
37
1)
569
430
457
887 Karl Asamer
455
–
455
376
277
653
Heinz Moitzi
417 –
417
360
289
649
Total 1,404
37
1,441
1,166
1,023
2,189
1) The variable remuneration stated is the result of Mr Gerstenmayer exercising 20,000 stock options. In this transaction, no shares were transferred, but a cash
payment was effected.
The fixed element thus represented 93.5% of Mr Gerstenmayer’s total remuneration, and the variable ele-ment 6.5%. The fixed element represented 100% of both Mr Asamer’s and Mr Moitzi’s remuneration. For the Management Board as a whole, the fixed element represented 97.5% and the variable element 2.5% in the financial year 2016/17.
The stock option based system of Management Board remuneration at AT&S is based on the Stock Option Scheme 2009-2012, in which allocations were made from 1 April 2009 to 1 April 2012. The number of stock options allocated to members of the Management Board was as follows:
Allocated on 1 April of every year
Total
2012
2011
2010
2009 Andreas Gerstenmayer
120,000
40,000
40,000
40,000
–
Heinz Moitzi 120,000
30,000
30,000
30,000
30,000
Exercise Price (€)
9.86
16.60
7.45
3.86
The options granted may be exercised in tranches: up to 20% after two years, up to an additional 30% after three years, and up to an additional 50% after four years (from the allotment date). Stock options may be exercised in whole or in part after completion of the vesting period, although not during a restricted period. Allotted options not exercised within five years of the date of granting expire without compensation. If the end of the five-year period falls within a restricted period, however, the restricted period will interrupt that five-year period. Options can be exercised again after the restricted period for the length of time the inter-ruption occurred. The five-year period is extended in this special case. Options not exercised by the end of any five-year period extended in this manner become invalid and lapse without compensation. The stock option scheme in question ended with the last allotment made on 1 April 2012. Options allotted on 1 April 2012 and not yet exercised (see Directors' holdings and dealings, including changes in the financial year 2016/17) may still be exercised until 31 March 2017 (in the case of applicable restriction periods, an exten-sion must be taken into account, as required; see above).
By resolution of the Supervisory Board on 3 July 2014, a long-term incentive (“LTI”) programme for the Man-agement Board and key staff was implemented as a replacement for the stock option scheme that expired with the last distribution on 1 April 2012. The new programme is based on stock appreciation rights (“SAR”). SAR are rights to appreciation in value based on share performance over a defined period of time. As with
Remuneration Report: Management and Supervisory Boards
40 AT&S Annual Report 2016/17
22 AT&S Annual Report 2016/17
stock options, but without a granting of actual shares or an option for such granting, the recipient receives financial remuneration only if the performance of the share price is positive. In particular, the conditions include long-term and multiple-year performance criteria, a minimum vesting period of three years (with a subsequent exercise period of no more than two years), a minimum own investment by the recipient, and an upper limit on the potential financial benefits:
Earnings per share (EPS) determines how many of the SAR allotted may actually be exercised once the vesting period ends. The EPS established by the medium-term plan for the reporting date of the third year following the allotment applies as the target. If, at the end of the vesting period, less than 50% of the EPS target has been achieved, the allotted SAR are forfeited. If 100% or more of the EPS target has been achieved at the end of the vesting period, all of the allotted SAR may be exercised. If achievement of the target is between 50% and 100%, the allotted SAR may be exercised in linear proportion to the percentage achieved.
Own investment is a mandatory prerequisite for exercising SAR. The own investment is made by purchasing shares corresponding to 20% of the total allotment amount in SAR for a given year (e.g. for an allotment of 5,000 SAR, the own investment is 1,000 shares). If the own investment has not been made in full by the end of the vesting period (after three years), SAR are forfeited in a corresponding amount. The own in-vestment must be held for the entire period of participation in the LTI programme.
The exercise price is determined on the allotment date and is equal to the average closing price of AT&S shares on the Vienna Stock Exchange during the six months preceding the respective allotment date.
The performance of the share price determines the amount of the LTI awarded to the recipient: The differ-ence between the exercise price of the relevant virtual allotment and the closing price of the AT&S share on the Vienna Stock Exchange on the exercise date is multiplied by the number of SAR. There are no pre-miums on the exercise price and payouts are made in cash. In the event of extraordinary positive perfor-mance, the payout amount per SAR is limited to the amount represented by 200% of the respective exer-cise price. (Example: for an exercise price of € 8.00, the maximum value per SAR is € 16.00, which means that any share closing price above € 24.00 produces no associated increase in the value per SAR).
In this LTI Programme for 2014 – 2016, three allotment tranches were possible between 1 April 2014 and 1 April 2016. To date, the following number of SAR has been allotted to members of the Management Board at the exercise price indicated:
Allocated on 1 April of each year
Total
2016
2015
2014 Andreas Gerstenmayer
130,000
50,000
40,000
40,000
Karl Asamer 90,000
30,000
30,000
30,000
Heinz Moitzi 90,000
30,000
30,000
30,000
Exercise Price (€)
13.66
10.70
7.68
Since the necessary own investment was not achieved (see above), all SAR of Mr Moitzi stated above were forfeited with the expiry of 31 March 2017. The variable remuneration of the Management Board (not in the form of stock options and SAR), which is generally accounted for in total remuneration, depends on the short-term achievement of two performance indicators defined in the budget for the respective financial year: return on capital employed (ROCE), with a 90% weighting, and the innovation revenue rate (IRR), with a 10% weighting. The basic prerequisite for awarding this variable remuneration is positive EBIT for the Group as a whole for the financial year and the attainment of the target EBIT margin for the Group as a whole by at least 70% (the “hurdle rate”). If these key performance indicators are exceeded, bonuses are restricted to a maxi-mum of 200% of the annual bonus set out in the contract of employment. The inclusion of IRR is of major importance in giving variable remuneration a long-term focus. Innovative strength – the development of new
41Corporate Governance Report
22 AT&S Annual Report 2016/17
stock options, but without a granting of actual shares or an option for such granting, the recipient receives financial remuneration only if the performance of the share price is positive. In particular, the conditions include long-term and multiple-year performance criteria, a minimum vesting period of three years (with a subsequent exercise period of no more than two years), a minimum own investment by the recipient, and an upper limit on the potential financial benefits:
Earnings per share (EPS) determines how many of the SAR allotted may actually be exercised once the vesting period ends. The EPS established by the medium-term plan for the reporting date of the third year following the allotment applies as the target. If, at the end of the vesting period, less than 50% of the EPS target has been achieved, the allotted SAR are forfeited. If 100% or more of the EPS target has been achieved at the end of the vesting period, all of the allotted SAR may be exercised. If achievement of the target is between 50% and 100%, the allotted SAR may be exercised in linear proportion to the percentage achieved.
Own investment is a mandatory prerequisite for exercising SAR. The own investment is made by purchasing shares corresponding to 20% of the total allotment amount in SAR for a given year (e.g. for an allotment of 5,000 SAR, the own investment is 1,000 shares). If the own investment has not been made in full by the end of the vesting period (after three years), SAR are forfeited in a corresponding amount. The own in-vestment must be held for the entire period of participation in the LTI programme.
The exercise price is determined on the allotment date and is equal to the average closing price of AT&S shares on the Vienna Stock Exchange during the six months preceding the respective allotment date.
The performance of the share price determines the amount of the LTI awarded to the recipient: The differ-ence between the exercise price of the relevant virtual allotment and the closing price of the AT&S share on the Vienna Stock Exchange on the exercise date is multiplied by the number of SAR. There are no pre-miums on the exercise price and payouts are made in cash. In the event of extraordinary positive perfor-mance, the payout amount per SAR is limited to the amount represented by 200% of the respective exer-cise price. (Example: for an exercise price of € 8.00, the maximum value per SAR is € 16.00, which means that any share closing price above € 24.00 produces no associated increase in the value per SAR).
In this LTI Programme for 2014 – 2016, three allotment tranches were possible between 1 April 2014 and 1 April 2016. To date, the following number of SAR has been allotted to members of the Management Board at the exercise price indicated:
Allocated on 1 April of each year
Total
2016
2015
2014 Andreas Gerstenmayer
130,000
50,000
40,000
40,000
Karl Asamer 90,000
30,000
30,000
30,000
Heinz Moitzi 90,000
30,000
30,000
30,000
Exercise Price (€)
13.66
10.70
7.68
Since the necessary own investment was not achieved (see above), all SAR of Mr Moitzi stated above were forfeited with the expiry of 31 March 2017. The variable remuneration of the Management Board (not in the form of stock options and SAR), which is generally accounted for in total remuneration, depends on the short-term achievement of two performance indicators defined in the budget for the respective financial year: return on capital employed (ROCE), with a 90% weighting, and the innovation revenue rate (IRR), with a 10% weighting. The basic prerequisite for awarding this variable remuneration is positive EBIT for the Group as a whole for the financial year and the attainment of the target EBIT margin for the Group as a whole by at least 70% (the “hurdle rate”). If these key performance indicators are exceeded, bonuses are restricted to a maxi-mum of 200% of the annual bonus set out in the contract of employment. The inclusion of IRR is of major importance in giving variable remuneration a long-term focus. Innovative strength – the development of new
Corporate Governance Report 23
technologies, products or product types – is a crucial factor for the future business success of the Group. It can also be reliably measured: IRR represents the share of total revenue generated by technologically innova-tive products introduced in the past three years. The three-year reference period provides a long-term com-ponent of variable remuneration. In the past financial year the hurdle rate was not reached, so that there was no entitlement to this part of variable remuneration.
With respect to the variable remuneration of executives in other Group companies, the same principles apply as described above for the Management Board of the parent company.
Management Board members are contractually entitled to termination benefits in accordance with the Sala-ried Employees Act (AngG), applied mutatis mutandis (“old system for severance pay”), if their appointments are terminated. In the event of premature termination initiated by a Management Board member for reason-able cause, or if the function is eliminated for legal reasons, remuneration is payable until the end of the appointment contract. Where a Management Board member resigns the appointment or is removed from office for severe breach of duty, and in the event of death, payment of salary ceases at the end of the appli-cable month.
Mr Gerstenmayer and Mr Moitzi have pension entitlements in the form of defined benefit or defined contri-bution plans agreed individually. For Andreas Gerstenmayer, a contribution of 10% of monthly gross salary is paid into a pension fund. Mr Moitzi's pension entitlement is 1.2% of his most recent salary for each year of service, up to a maximum of 40%. The amount of the occupational pension is based on the capital accumu-lated in the pension fund; the annuitisation is determined by the pension fund’s rules.
Members of the Management Board are entitled to a company car (included in the above-mentioned fixed remuneration in the amount of the additional taxable amount) and are covered by accident insurance, the premium of which is also included in the above-mentioned fixed remuneration. Health insurance is limited to what is provided under the Austrian statutory social security system.
SUPERVISORY BOARD REMUNERATION Remuneration of the members of the Supervisory Board is de-termined retrospectively for the past financial year by means of a resolution at the Annual General Meeting. Remuneration paid to members of the Supervisory Board in the financial year 2016/17 for the previous finan-cial year was in accordance with the resolution passed at the 22nd Annual General Meeting of 7 July 2016:
in €
Member
Fixed fee
Committee fee
Variable remuneration
Attendance fees
Total
Hannes Androsch 56,240
5,000
23,760
2,000
87,000
Willibald Dörflinger 44,160
3,000
15,840
2,000
65,000
Regina Prehofer 44,160
5,000
15,840
2,000
67,000
Karl Fink 28,120
–
11,880
1,200
41,200
Albert Hochleitner 28,120
–
11,880
2,000
42,000
Gerhard Pichler 28,120
3,000
11,880
2,000
45,000
Georg Riedl 28,120
6,000
11,880
2,000
48,000
Karin Schaupp 28,120
–
11,880
2,000
42,000
Total 285,160
22,000
114,840
15,200
437,200
The Chairman of the Supervisory Board receives fixed remuneration of € 56,240 as shown above, his Deputies € 44,160 and all other elected members € 28,120. Chairmanship of a standing committee (Nomination and Remuneration Committee, Audit Committee) is remunerated with a fixed amount of € 5,000 per financial year, and membership of a standing committee with € 3,000. The attendance fee is € 400 per Supervisory
42 AT&S Annual Report 2016/17
24 AT&S Annual Report 2016/17
Board meeting and all cash expenses are thus reimbursed. Members of the Supervisory Board also received variable remuneration based on the short-term achievement of defined targets for the performance indica-tors cash earnings (with a weighting of 45%), ROCE (return on capital employed; also with a weighting of 45%) and the innovation revenue rate (IRR; with a weighting of 10%). If the targets are achieved 100%, the Chair-man receives € 15,000, his Deputies € 10,000 and other members € 7,500 per financial year. If the key per-formance indicators for ROCE, cash earnings and IRR are exceeded, variable remuneration of a maximum of 200% of the base described above is paid. Members of the Supervisory Board do not receive stock options in the Group. Since the targets established for variable remuneration in the budget for the financial year 2015/16 were achieved, variable remuneration accrued for that year and was subsequently paid out in the financial year 2016/17 in accordance with the resolution by the 22nd Annual General Meeting of 7 July 2016. For the financial year 2016/17, the remuneration of the Supervisory Board will be determined at the 23rd Annual General Meeting on 6 July 2017.
The employee representatives perform their duties on the Supervisory Board voluntarily and therefore re-ceive no separate remuneration for their position.
DIRECTORS AND OFFICERS LIABILITY INSURANCE (D&O INSURANCE) The D&O insurance at AT&S covers all past, present and future members of the Company’s and its subsidiaries’ managing and supervisory bodies and selected other senior staff. The insurance covers court and all other costs of defence against unwarranted claims, together with the satisfaction of warranted claims for pure financial loss arising from breaches of duty by the insured in their managerial or supervisory activities. The insurance provides global cover and the annual premium is paid by AT&S.
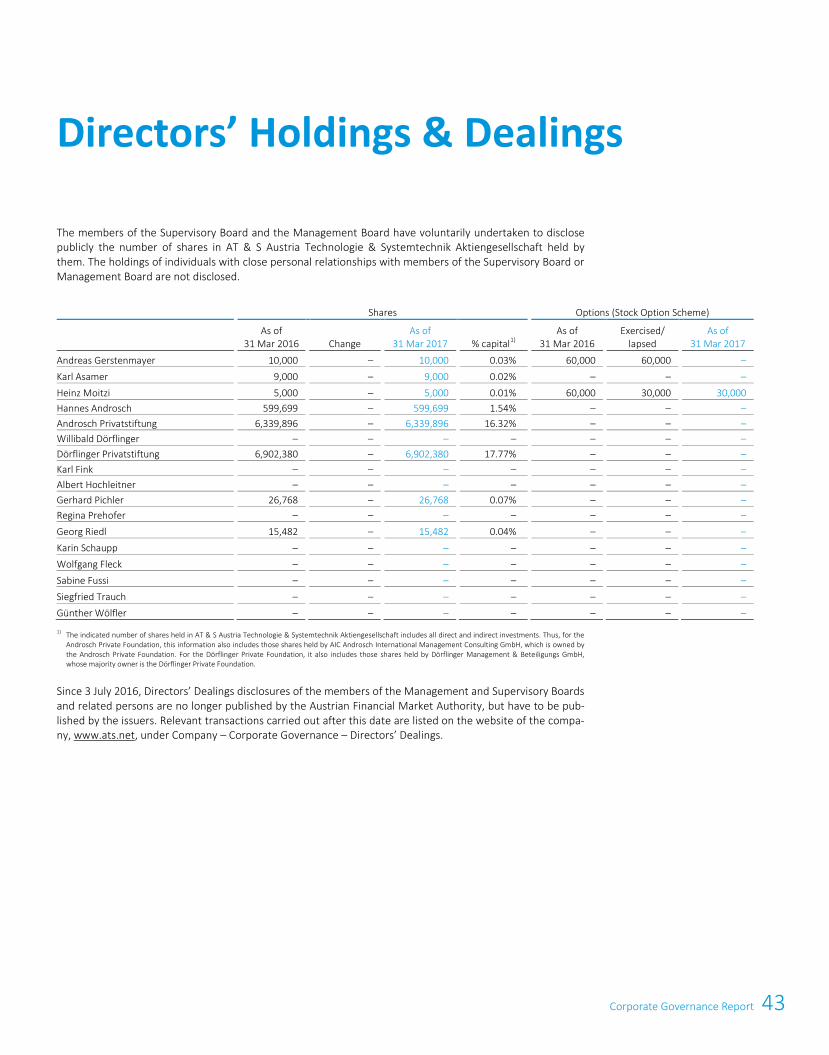
43Corporate Governance Report
24 AT&S Annual Report 2016/17
Board meeting and all cash expenses are thus reimbursed. Members of the Supervisory Board also received variable remuneration based on the short-term achievement of defined targets for the performance indica-tors cash earnings (with a weighting of 45%), ROCE (return on capital employed; also with a weighting of 45%) and the innovation revenue rate (IRR; with a weighting of 10%). If the targets are achieved 100%, the Chair-man receives € 15,000, his Deputies € 10,000 and other members € 7,500 per financial year. If the key per-formance indicators for ROCE, cash earnings and IRR are exceeded, variable remuneration of a maximum of 200% of the base described above is paid. Members of the Supervisory Board do not receive stock options in the Group. Since the targets established for variable remuneration in the budget for the financial year 2015/16 were achieved, variable remuneration accrued for that year and was subsequently paid out in the financial year 2016/17 in accordance with the resolution by the 22nd Annual General Meeting of 7 July 2016. For the financial year 2016/17, the remuneration of the Supervisory Board will be determined at the 23rd Annual General Meeting on 6 July 2017.
The employee representatives perform their duties on the Supervisory Board voluntarily and therefore re-ceive no separate remuneration for their position.
DIRECTORS AND OFFICERS LIABILITY INSURANCE (D&O INSURANCE) The D&O insurance at AT&S covers all past, present and future members of the Company’s and its subsidiaries’ managing and supervisory bodies and selected other senior staff. The insurance covers court and all other costs of defence against unwarranted claims, together with the satisfaction of warranted claims for pure financial loss arising from breaches of duty by the insured in their managerial or supervisory activities. The insurance provides global cover and the annual premium is paid by AT&S.
Corporate Governance Report 25
The members of the Supervisory Board and the Management Board have voluntarily undertaken to disclose publicly the number of shares in AT & S Austria Technologie & Systemtechnik Aktiengesellschaft held by them. The holdings of individuals with close personal relationships with members of the Supervisory Board or Management Board are not disclosed.
Shares
Options (Stock Option Scheme)
As of 31 Mar 2016
Change
As of 31 Mar 2017
% capital
1)
As of 31 Mar 2016
Exercised/ lapsed
As of 31 Mar 2017
Andreas Gerstenmayer
10,000
–
10,000
0.03%
60,000
60,000
– Karl Asamer
9,000
–
9,000
0.02%
–
–
–
Heinz Moitzi
5,000
–
5,000
0.01%
60,000
30,000
30,000 Hannes Androsch
599,699
–
599,699
1.54%
–
–
–
Androsch Privatstiftung
6,339,896
–
6,339,896
16.32%
–
–
– Willibald Dörflinger
–
–
–
–
–
–
–
Dörflinger Privatstiftung
6,902,380
–
6,902,380
17.77%
–
–
– Karl Fink
–
–
–
–
–
–
–
Albert Hochleitner
–
–
–
–
–
–
– Gerhard Pichler
26,768
–
26,768
0.07%
–
–
–
Regina Prehofer
–
–
–
–
–
–
– Georg Riedl
15,482
–
15,482
0.04%
–
–
–
Karin Schaupp
–
–
–
–
–
–
– Wolfgang Fleck
–
–
–
–
–
–
–
Sabine Fussi
–
–
–
–
–
–
– Siegfried Trauch
–
–
–
–
–
–
–
Günther Wölfler
–
–
–
–
–
–
– 1) The indicated number of shares held in AT & S Austria Technologie & Systemtechnik Aktiengesellschaft includes all direct and indirect investments. Thus, for the
Androsch Private Foundation, this information also includes those shares held by AIC Androsch International Management Consulting GmbH, which is owned by the Androsch Private Foundation. For the Dörflinger Private Foundation, it also includes those shares held by Dörflinger Management & Beteiligungs GmbH, whose majority owner is the Dörflinger Private Foundation.
Since 3 July 2016, Directors’ Dealings disclosures of the members of the Management and Supervisory Boards and related persons are no longer published by the Austrian Financial Market Authority, but have to be pub-lished by the issuers. Relevant transactions carried out after this date are listed on the website of the compa-ny, www.ats.net, under Company – Corporate Governance – Directors’ Dealings.
Directors’ Holdings & Dealings
44 AT&S Annual Report 2016/17
26 AT&S Annual Report 2016/17
GOVERNANCE, RISK & COMPLIANCE COMMITTEE In the financial year 2016/17, a group-wide Governance, Risk & Compliance Committee (“GRC Committee”) was established to identify and mitigate potentially relevant compliance and governance risks. Various representatives of the international senior management of the Group, including the areas “Compliance” and “Internal Audit & Risk Management”, were appointed as members. The purpose of the GRC Committee is to support the Management Board of AT&S in overseeing compliance with legal and regulatory requirements in the AT&S Group and in the associated risk management in order to
(i) better understand the nature of risks and potential risks; (ii) ensure that the management of the AT&S Group identifies and controls key legal, compliance and enter-prise risks, and to initiate action to recognise non-compliance; (iii) initiate measures in order to prevent non-compliance; and (iv) define procedures for actions and proceedings in case non-compliance is identified.
Furthermore, the GRC Committee helps the AT&S Group and its executives, managers, employees or related parties to conduct operations and activities ethically, with the highest level of integrity, and in compliance with legal and regulatory requirements. Therefore, the GRC Committee promotes an organisational culture that encourages ethical conduct in accordance with AT&S Group’s Global Code of Business Ethics and Con-duct, and a commitment to compliance with the law. Consequently, the Members of the GRC Committee have been appointed to support the coordination of the compliance activities across the AT&S Group by assessing risks, reviewing updates on compliance developments and best practices, requesting the organisa-tion to implement appropriate measures or proposing such measures to the AT&S Management Board, and monitoring ongoing progress in key compliance areas. The activities of the GRC Committee were reported to the Supervisory Board in the past financial year.
CODE OF BUSINESS ETHICS AND CONDUCT AT&S has established its own Code of Business Ethics and Conduct which describes how AT&S conducts its business in an ethical and socially responsible way. These prin-ciples apply to all activities of AT&S worldwide, to all AT&S segments, and to all companies that are part of the AT&S Group. AT&S is committed to meeting the requirements of the Electronic Industry Citizenship Coalition (EICC). Integrity and compliance with both legal and ethical principles are essential for maintaining the credibil-ity, trustworthiness and authenticity of the Group. Stricter or more detailed guidelines may be established for specific matters, regions, countries or functions, but they must be consistent with this corporate policy. Under one of the main provisions of the Code, AT&S does not tolerate any form of discrimination, for example on the basis of gender, age, religion, or ethnic origin, in activities such as recruitment, remuneration and promotion.
ANTI-CORRUPTION GUIDELINE Integrity is an indispensable part of the key values of AT&S. On this basis, the Management Board of AT&S issued an anti-corruption guideline in the financial year 2016/17 which is valid in a uniform manner in the entire Group worldwide. Without exception, it is applicable to all executives, representatives, employees, parties, units and companies working or operating for or on behalf of AT&S or one of its Group companies and must be implemented. Based on this guideline, AT&S is increasing activities to assume responsibility and to prevent the illegal acceptance or provision of gifts, any form of bribery and embezzlement as well as the appearance or suspicion of conflict of interest or corruption and to ensure strict prosecution of such cases. All AT&S employees must comply with all principles of integrity, applicable laws and internal regulations. It is prohibited to directly or indirectly offer, demand or accept bribes and/or illegal and unlawful donations, facilitation payments or inappropriate gifts and rewards, hospitality or any other undue benefits, or to make any agreements in this respect. This also applies in particular to offering and accepting gifts directly or indirectly, actively or passively, to/from public officials or to/from “private” business partners, and to any behaviour that may lead to the appearance of corruption, bribery or embezzlement. Using a risk-based approach, all AT&S employees who may be subject to such risks have received and receive additional training and instruction. In the past financial year, 355 managers and employees were trained this way. In addition, relevant information and reporting channels are provided to clarify any dubious cases.
Compliance & other codes of conduct
45Corporate Governance Report
26 AT&S Annual Report 2016/17
GOVERNANCE, RISK & COMPLIANCE COMMITTEE In the financial year 2016/17, a group-wide Governance, Risk & Compliance Committee (“GRC Committee”) was established to identify and mitigate potentially relevant compliance and governance risks. Various representatives of the international senior management of the Group, including the areas “Compliance” and “Internal Audit & Risk Management”, were appointed as members. The purpose of the GRC Committee is to support the Management Board of AT&S in overseeing compliance with legal and regulatory requirements in the AT&S Group and in the associated risk management in order to
(i) better understand the nature of risks and potential risks; (ii) ensure that the management of the AT&S Group identifies and controls key legal, compliance and enter-prise risks, and to initiate action to recognise non-compliance; (iii) initiate measures in order to prevent non-compliance; and (iv) define procedures for actions and proceedings in case non-compliance is identified.
Furthermore, the GRC Committee helps the AT&S Group and its executives, managers, employees or related parties to conduct operations and activities ethically, with the highest level of integrity, and in compliance with legal and regulatory requirements. Therefore, the GRC Committee promotes an organisational culture that encourages ethical conduct in accordance with AT&S Group’s Global Code of Business Ethics and Con-duct, and a commitment to compliance with the law. Consequently, the Members of the GRC Committee have been appointed to support the coordination of the compliance activities across the AT&S Group by assessing risks, reviewing updates on compliance developments and best practices, requesting the organisa-tion to implement appropriate measures or proposing such measures to the AT&S Management Board, and monitoring ongoing progress in key compliance areas. The activities of the GRC Committee were reported to the Supervisory Board in the past financial year.
CODE OF BUSINESS ETHICS AND CONDUCT AT&S has established its own Code of Business Ethics and Conduct which describes how AT&S conducts its business in an ethical and socially responsible way. These prin-ciples apply to all activities of AT&S worldwide, to all AT&S segments, and to all companies that are part of the AT&S Group. AT&S is committed to meeting the requirements of the Electronic Industry Citizenship Coalition (EICC). Integrity and compliance with both legal and ethical principles are essential for maintaining the credibil-ity, trustworthiness and authenticity of the Group. Stricter or more detailed guidelines may be established for specific matters, regions, countries or functions, but they must be consistent with this corporate policy. Under one of the main provisions of the Code, AT&S does not tolerate any form of discrimination, for example on the basis of gender, age, religion, or ethnic origin, in activities such as recruitment, remuneration and promotion.
ANTI-CORRUPTION GUIDELINE Integrity is an indispensable part of the key values of AT&S. On this basis, the Management Board of AT&S issued an anti-corruption guideline in the financial year 2016/17 which is valid in a uniform manner in the entire Group worldwide. Without exception, it is applicable to all executives, representatives, employees, parties, units and companies working or operating for or on behalf of AT&S or one of its Group companies and must be implemented. Based on this guideline, AT&S is increasing activities to assume responsibility and to prevent the illegal acceptance or provision of gifts, any form of bribery and embezzlement as well as the appearance or suspicion of conflict of interest or corruption and to ensure strict prosecution of such cases. All AT&S employees must comply with all principles of integrity, applicable laws and internal regulations. It is prohibited to directly or indirectly offer, demand or accept bribes and/or illegal and unlawful donations, facilitation payments or inappropriate gifts and rewards, hospitality or any other undue benefits, or to make any agreements in this respect. This also applies in particular to offering and accepting gifts directly or indirectly, actively or passively, to/from public officials or to/from “private” business partners, and to any behaviour that may lead to the appearance of corruption, bribery or embezzlement. Using a risk-based approach, all AT&S employees who may be subject to such risks have received and receive additional training and instruction. In the past financial year, 355 managers and employees were trained this way. In addition, relevant information and reporting channels are provided to clarify any dubious cases.
Compliance & other codes of conduct
Corporate Governance Report 27
FAIR BUSINESS PRACTICES POLICY Fairness and integrity in our business, in advertising and in competition form the basis of all our actions and relationships. Therefore, all AT&S employees must be straightforward and honest when dealing with competitors, business partners and the general public in all professional and busi-ness relationships. The objective of the “AT&S Fair Business Practices Policy”, which was issued in the fourth quarter of the past financial year, is to further specify the existing Code of Business Ethics and Conduct and to present the principles of fair competition in greater detail and to establish them in the company culture.
CAPITAL MARKET COMPLIANCE As a company listed on the Vienna Stock Exchange, AT&S acknowledges its responsibility to prevent the abuse of compliance-related information and inside information through appropri-ate measures and in accordance with applicable laws and regulations. AT&S attaches great importance to the equal treatment of all investors and the provision of comprehensive information. AT&S also complies with laws related to third parties such as customers and suppliers. All employees are therefore required to conduct them-selves with due care in this respect. AT&S supports the aim of the ÖCGK to raise Austrian and foreign investors’ confidence in the Austrian financial market by enhancing transparency and reinforcing standard principles.
For the purpose of preventing insider trading and ensuring compliance with other relevant capital market regulations, the Group has adopted a Compliance Code (“Corporate Directive Issuer Compliance”) that also applies to all Supervisory Board members. The Corporate Directive Issuer Compliance was updated in the financial year 2016/17 and adapted to the requirements of Regulation (EU) No 596/2014 of the European Parliament and of the Council of 16 April 2014 on market abuse (market abuse regulation – “MAR”), which entered into force on 3 July 2016, the Austrian Stock Exchange Act (as amended in Federal Law Gazette I No 76/2016) and the Issuer Compliance Directive (as amended in Federal Law Gazette II No 214/2016). These guidelines apply to all companies in the AT&S Group, and all employees and governing bodies, including the Supervisory Board. They apply in particular to persons working in certain areas of confidentiality and contain detailed instructions and aids to ensure compliance with the relevant regulations. The compliance officer also offers and conducts relevant training for this purpose. Persons pertaining to an area of confidentiality gener-ally have to participate in mandatory capital market compliance training once per financial year. In the past financial year, more than 200 persons completed such training.
ADVANCEMENT OF WOMEN IN SENIOR MANAGEMENT AT&S has no explicitly formulated plan for increasing the number of women on the Management or Supervisory Boards or in senior management posi-tions in the Company or its subsidiaries. The selection of candidates to fill open positions is based on the principle of the best possible person for the job – regardless of gender, age, religion or ethnic origin.
There are women in various senior management positions at AT&S and its subsidiaries. Although no women are represented on the Management Board of AT&S, two of the eight members of the AT&S Supervisory Board representing shareholder interests and one of the employee representatives are women. At 25%, the proportion of female Supervisory Board members is above the average for Austrian companies. At the end of the financial year, the proportion of female employees at AT&S was 35%. The female proportion in Europe and the United States, at 43%, is still significantly higher than in Asia, where the proportion of females em-ployed by AT&S is 33%. Women constitute 11% of the employees reporting directly to the Management Board of the AT&S Group. The Group continues to try to increase female representation at board and senior management level. Proactive efforts are made, particularly when staff return from maternity leave, to ensure that careers and family life are compatible.
Management Board
Andreas Gerstenmayer m.p. Karl Asamer m.p. Heinz Moitzi m.p.
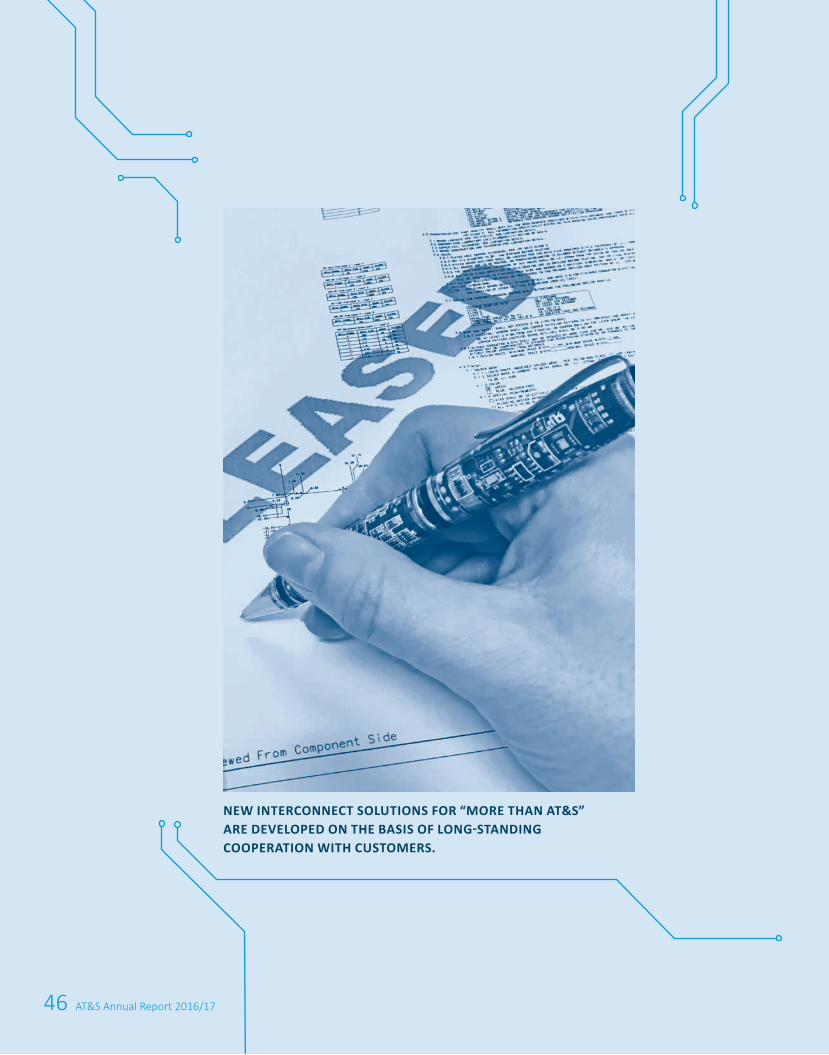
46 AT&S Annual Report 2016/17
NEW INTERCONNECT SOLUTIONS FOR “MORE THAN AT&S”ARE DEVELOPED ON THE BASIS OF LONG-STANDING COOPERATION WITH CUSTOMERS.
47Group Management Report
Table of Contents
1. Business development 48
1.1. Market and industry 48
1.2. Profit situation 53
1.3. Financial position 57
2. Significant events after the reporting period 64
3. Plants and branch offices 65
4. Business development by segments 66
5. Group 70
5.1. Employees 70
5.2. Sustainability 74
5.3. Research and development 77
6. Risk and opportunities management 79
7. Internal Control and Risk Management System with regard to accounting 84
8. Shareholding structure and disclosures on capital (disclosures according to § 243a Austrian Commercial Code) 85
9. Outlook 87
Group Management Report 2016/17
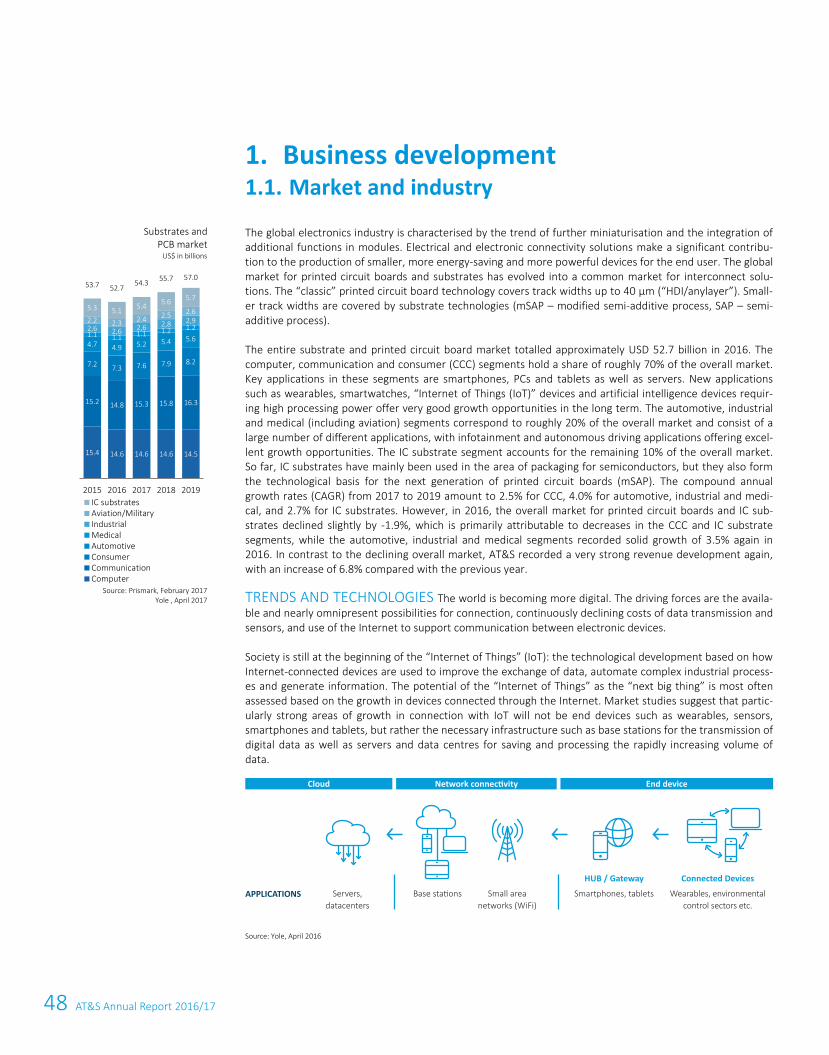
48 AT&S Annual Report 2016/17
30 AT&S Annual Report 2016/17
The global electronics industry is characterised by the trend of further miniaturisation and the integration of additional functions in modules. Electrical and electronic connectivity solutions make a significant contribu-tion to the production of smaller, more energy-saving and more powerful devices for the end user. The global market for printed circuit boards and substrates has evolved into a common market for interconnect solu-tions. The “classic” printed circuit board technology covers track widths up to 40 µm (“HDI/anylayer”). Small-er track widths are covered by substrate technologies (mSAP – modified semi-additive process, SAP – semi-additive process).
The entire substrate and printed circuit board market totalled approximately USD 52.7 billion in 2016. The computer, communication and consumer (CCC) segments hold a share of roughly 70% of the overall market. Key applications in these segments are smartphones, PCs and tablets as well as servers. New applications such as wearables, smartwatches, “Internet of Things (IoT)” devices and artificial intelligence devices requir-ing high processing power offer very good growth opportunities in the long term. The automotive, industrial and medical (including aviation) segments correspond to roughly 20% of the overall market and consist of a large number of different applications, with infotainment and autonomous driving applications offering excel-lent growth opportunities. The IC substrate segment accounts for the remaining 10% of the overall market. So far, IC substrates have mainly been used in the area of packaging for semiconductors, but they also form the technological basis for the next generation of printed circuit boards (mSAP). The compound annual growth rates (CAGR) from 2017 to 2019 amount to 2.5% for CCC, 4.0% for automotive, industrial and medi-cal, and 2.7% for IC substrates. However, in 2016, the overall market for printed circuit boards and IC sub-strates declined slightly by -1.9%, which is primarily attributable to decreases in the CCC and IC substrate segments, while the automotive, industrial and medical segments recorded solid growth of 3.5% again in 2016. In contrast to the declining overall market, AT&S recorded a very strong revenue development again, with an increase of 6.8% compared with the previous year.
TRENDS AND TECHNOLOGIES The world is becoming more digital. The driving forces are the availa-ble and nearly omnipresent possibilities for connection, continuously declining costs of data transmission and sensors, and use of the Internet to support communication between electronic devices.
Society is still at the beginning of the “Internet of Things” (IoT): the technological development based on how Internet-connected devices are used to improve the exchange of data, automate complex industrial process-es and generate information. The potential of the “Internet of Things” as the “next big thing” is most often assessed based on the growth in devices connected through the Internet. Market studies suggest that partic-ularly strong areas of growth in connection with IoT will not be end devices such as wearables, sensors, smartphones and tablets, but rather the necessary infrastructure such as base stations for the transmission of digital data as well as servers and data centres for saving and processing the rapidly increasing volume of data.
Source: Yole, April 2016
Business development 1.1.1. Market and industry
Substrates and PCB market
US$ in billions
Source: Prismark, February 2017
Yole , April 2017
15.4 14.6 14.6 14.6 14.5
15.2 14.8 15.3 15.8 16.3
7.2 7.3 7.6 7.9 8.2
4.7 4.9 5.2 5.4 5.6 1.1 1.1 1.1 1.2 1.2 2,6 2,6 2,6 2,8 2,92.2 2.3 2.4 2.5 2.6 5.3 5.1 5.4 5.6 5.7
53.7 52.7 54.3 55.7 57.0
2015 2016 2017 2018 2019IC substratesAviation/MilitaryIndustrialMedicalAutomotiveConsumerCommunicationComputer
Cloud Network connectivity End device
APPLICATIONS Base stations Small area networks (WiFi)
Servers, datacenters
Smartphones, tablets Wearables, environmental control sectors etc.
HUB / Gateway Connected Devices
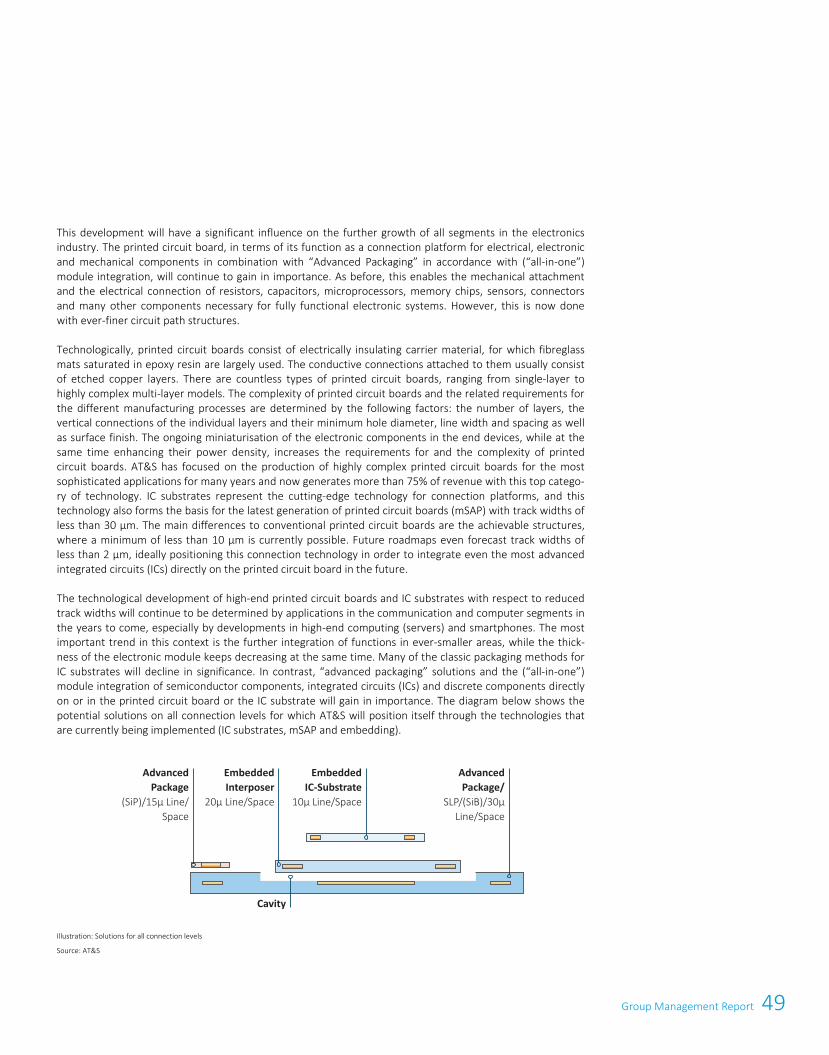
49Group Management Report
30 AT&S Annual Report 2016/17
The global electronics industry is characterised by the trend of further miniaturisation and the integration of additional functions in modules. Electrical and electronic connectivity solutions make a significant contribu-tion to the production of smaller, more energy-saving and more powerful devices for the end user. The global market for printed circuit boards and substrates has evolved into a common market for interconnect solu-tions. The “classic” printed circuit board technology covers track widths up to 40 µm (“HDI/anylayer”). Small-er track widths are covered by substrate technologies (mSAP – modified semi-additive process, SAP – semi-additive process).
The entire substrate and printed circuit board market totalled approximately USD 52.7 billion in 2016. The computer, communication and consumer (CCC) segments hold a share of roughly 70% of the overall market. Key applications in these segments are smartphones, PCs and tablets as well as servers. New applications such as wearables, smartwatches, “Internet of Things (IoT)” devices and artificial intelligence devices requir-ing high processing power offer very good growth opportunities in the long term. The automotive, industrial and medical (including aviation) segments correspond to roughly 20% of the overall market and consist of a large number of different applications, with infotainment and autonomous driving applications offering excel-lent growth opportunities. The IC substrate segment accounts for the remaining 10% of the overall market. So far, IC substrates have mainly been used in the area of packaging for semiconductors, but they also form the technological basis for the next generation of printed circuit boards (mSAP). The compound annual growth rates (CAGR) from 2017 to 2019 amount to 2.5% for CCC, 4.0% for automotive, industrial and medi-cal, and 2.7% for IC substrates. However, in 2016, the overall market for printed circuit boards and IC sub-strates declined slightly by -1.9%, which is primarily attributable to decreases in the CCC and IC substrate segments, while the automotive, industrial and medical segments recorded solid growth of 3.5% again in 2016. In contrast to the declining overall market, AT&S recorded a very strong revenue development again, with an increase of 6.8% compared with the previous year.
TRENDS AND TECHNOLOGIES The world is becoming more digital. The driving forces are the availa-ble and nearly omnipresent possibilities for connection, continuously declining costs of data transmission and sensors, and use of the Internet to support communication between electronic devices.
Society is still at the beginning of the “Internet of Things” (IoT): the technological development based on how Internet-connected devices are used to improve the exchange of data, automate complex industrial process-es and generate information. The potential of the “Internet of Things” as the “next big thing” is most often assessed based on the growth in devices connected through the Internet. Market studies suggest that partic-ularly strong areas of growth in connection with IoT will not be end devices such as wearables, sensors, smartphones and tablets, but rather the necessary infrastructure such as base stations for the transmission of digital data as well as servers and data centres for saving and processing the rapidly increasing volume of data.
Source: Yole, April 2016
Business development 1.1.1. Market and industry
Substrates and PCB market
US$ in billions
Source: Prismark, February 2017
Yole , April 2017
15.4 14.6 14.6 14.6 14.5
15.2 14.8 15.3 15.8 16.3
7.2 7.3 7.6 7.9 8.2
4.7 4.9 5.2 5.4 5.6 1.1 1.1 1.1 1.2 1.2 2,6 2,6 2,6 2,8 2,92.2 2.3 2.4 2.5 2.6 5.3 5.1 5.4 5.6 5.7
53.7 52.7 54.3 55.7 57.0
2015 2016 2017 2018 2019IC substratesAviation/MilitaryIndustrialMedicalAutomotiveConsumerCommunicationComputer
Group Management Report 31
This development will have a significant influence on the further growth of all segments in the electronics industry. The printed circuit board, in terms of its function as a connection platform for electrical, electronic and mechanical components in combination with “Advanced Packaging” in accordance with (“all-in-one”) module integration, will continue to gain in importance. As before, this enables the mechanical attachment and the electrical connection of resistors, capacitors, microprocessors, memory chips, sensors, connectors and many other components necessary for fully functional electronic systems. However, this is now done with ever-finer circuit path structures.
Technologically, printed circuit boards consist of electrically insulating carrier material, for which fibreglass mats saturated in epoxy resin are largely used. The conductive connections attached to them usually consist of etched copper layers. There are countless types of printed circuit boards, ranging from single-layer to highly complex multi-layer models. The complexity of printed circuit boards and the related requirements for the different manufacturing processes are determined by the following factors: the number of layers, the vertical connections of the individual layers and their minimum hole diameter, line width and spacing as well as surface finish. The ongoing miniaturisation of the electronic components in the end devices, while at the same time enhancing their power density, increases the requirements for and the complexity of printed circuit boards. AT&S has focused on the production of highly complex printed circuit boards for the most sophisticated applications for many years and now generates more than 75% of revenue with this top catego-ry of technology. IC substrates represent the cutting-edge technology for connection platforms, and this technology also forms the basis for the latest generation of printed circuit boards (mSAP) with track widths of less than 30 µm. The main differences to conventional printed circuit boards are the achievable structures, where a minimum of less than 10 µm is currently possible. Future roadmaps even forecast track widths of less than 2 µm, ideally positioning this connection technology in order to integrate even the most advanced integrated circuits (ICs) directly on the printed circuit board in the future.
The technological development of high-end printed circuit boards and IC substrates with respect to reduced track widths will continue to be determined by applications in the communication and computer segments in the years to come, especially by developments in high-end computing (servers) and smartphones. The most important trend in this context is the further integration of functions in ever-smaller areas, while the thick-ness of the electronic module keeps decreasing at the same time. Many of the classic packaging methods for IC substrates will decline in significance. In contrast, “advanced packaging” solutions and the (“all-in-one”) module integration of semiconductor components, integrated circuits (ICs) and discrete components directly on or in the printed circuit board or the IC substrate will gain in importance. The diagram below shows the potential solutions on all connection levels for which AT&S will position itself through the technologies that are currently being implemented (IC substrates, mSAP and embedding).
Illustration: Solutions for all connection levels
Source: AT&S
Advanced Package
(SiP)/15µ Line/ Space
Embedded Interposer
20µ Line/Space
Cavity
Advanced Package/
SLP/(SiB)/30µ Line/Space
Embedded IC-Substrate
10µ Line/Space
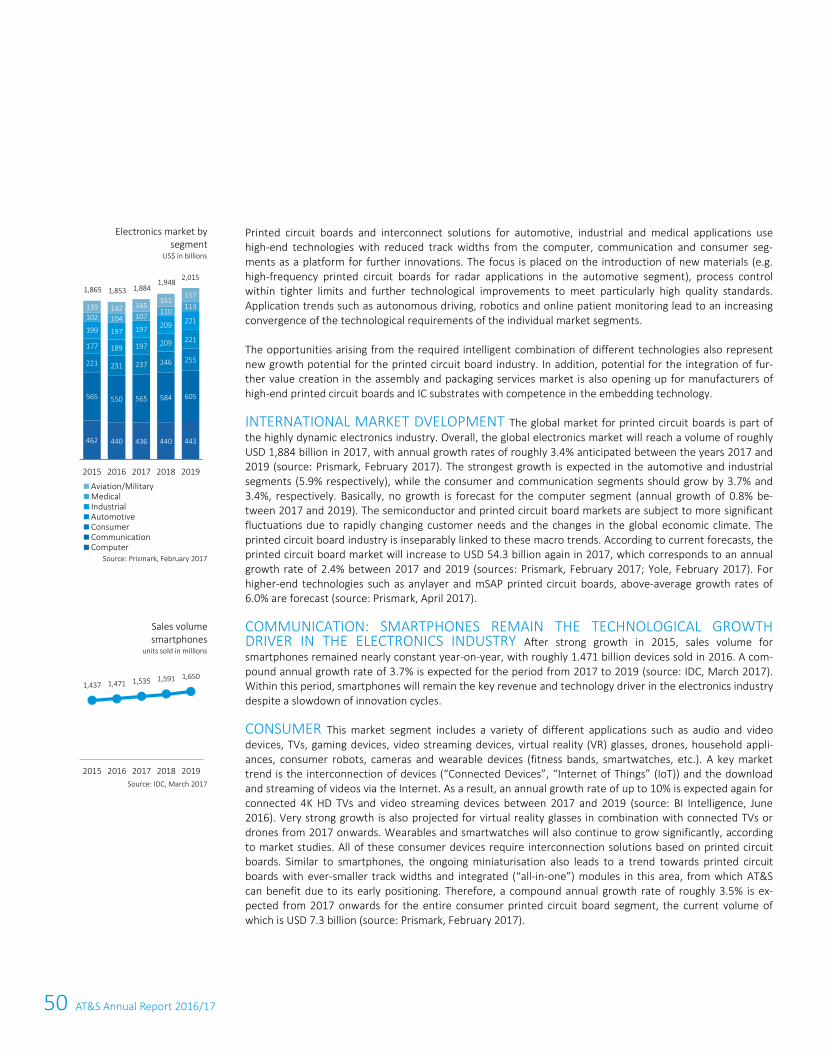
50 AT&S Annual Report 2016/17
32 AT&S Annual Report 2016/17
Printed circuit boards and interconnect solutions for automotive, industrial and medical applications use high-end technologies with reduced track widths from the computer, communication and consumer seg-ments as a platform for further innovations. The focus is placed on the introduction of new materials (e.g. high-frequency printed circuit boards for radar applications in the automotive segment), process control within tighter limits and further technological improvements to meet particularly high quality standards. Application trends such as autonomous driving, robotics and online patient monitoring lead to an increasing convergence of the technological requirements of the individual market segments.
The opportunities arising from the required intelligent combination of different technologies also represent new growth potential for the printed circuit board industry. In addition, potential for the integration of fur-ther value creation in the assembly and packaging services market is also opening up for manufacturers of high-end printed circuit boards and IC substrates with competence in the embedding technology.
INTERNATIONAL MARKET DVELOPMENT The global market for printed circuit boards is part of the highly dynamic electronics industry. Overall, the global electronics market will reach a volume of roughly USD 1,884 billion in 2017, with annual growth rates of roughly 3.4% anticipated between the years 2017 and 2019 (source: Prismark, February 2017). The strongest growth is expected in the automotive and industrial segments (5.9% respectively), while the consumer and communication segments should grow by 3.7% and 3.4%, respectively. Basically, no growth is forecast for the computer segment (annual growth of 0.8% be-tween 2017 and 2019). The semiconductor and printed circuit board markets are subject to more significant fluctuations due to rapidly changing customer needs and the changes in the global economic climate. The printed circuit board industry is inseparably linked to these macro trends. According to current forecasts, the printed circuit board market will increase to USD 54.3 billion again in 2017, which corresponds to an annual growth rate of 2.4% between 2017 and 2019 (sources: Prismark, February 2017; Yole, February 2017). For higher-end technologies such as anylayer and mSAP printed circuit boards, above-average growth rates of 6.0% are forecast (source: Prismark, April 2017).
COMMUNICATION: SMARTPHONES REMAIN THE TECHNOLOGICAL GROWTH DRIVER IN THE ELECTRONICS INDUSTRY After strong growth in 2015, sales volume for smartphones remained nearly constant year-on-year, with roughly 1.471 billion devices sold in 2016. A com-pound annual growth rate of 3.7% is expected for the period from 2017 to 2019 (source: IDC, March 2017). Within this period, smartphones will remain the key revenue and technology driver in the electronics industry despite a slowdown of innovation cycles.
CONSUMER This market segment includes a variety of different applications such as audio and video devices, TVs, gaming devices, video streaming devices, virtual reality (VR) glasses, drones, household appli-ances, consumer robots, cameras and wearable devices (fitness bands, smartwatches, etc.). A key market trend is the interconnection of devices (“Connected Devices”, “Internet of Things” (IoT)) and the download and streaming of videos via the Internet. As a result, an annual growth rate of up to 10% is expected again for connected 4K HD TVs and video streaming devices between 2017 and 2019 (source: BI Intelligence, June 2016). Very strong growth is also projected for virtual reality glasses in combination with connected TVs or drones from 2017 onwards. Wearables and smartwatches will also continue to grow significantly, according to market studies. All of these consumer devices require interconnection solutions based on printed circuit boards. Similar to smartphones, the ongoing miniaturisation also leads to a trend towards printed circuit boards with ever-smaller track widths and integrated (“all-in-one”) modules in this area, from which AT&S can benefit due to its early positioning. Therefore, a compound annual growth rate of roughly 3.5% is ex-pected from 2017 onwards for the entire consumer printed circuit board segment, the current volume of which is USD 7.3 billion (source: Prismark, February 2017).
Electronics market by segment
US$ in billions
Source: Prismark, February 2017
Sales volume smartphones
units sold in millions
Source: IDC, March 2017
462 440 436 440 443
565 550 565 584 605
221 231 237 246 255
177 189 197 209 221199 197 197 209 221102 104 107 110
113139 142 145151
1571,865 1,853 1,884
1,9482,015
2015 2016 2017 2018 2019
Aviation/MilitaryMedicalIndustrialAutomotiveConsumerCommunicationComputer
1,437 1,471 1,535 1,591 1,650
2015 2016 2017 2018 2019
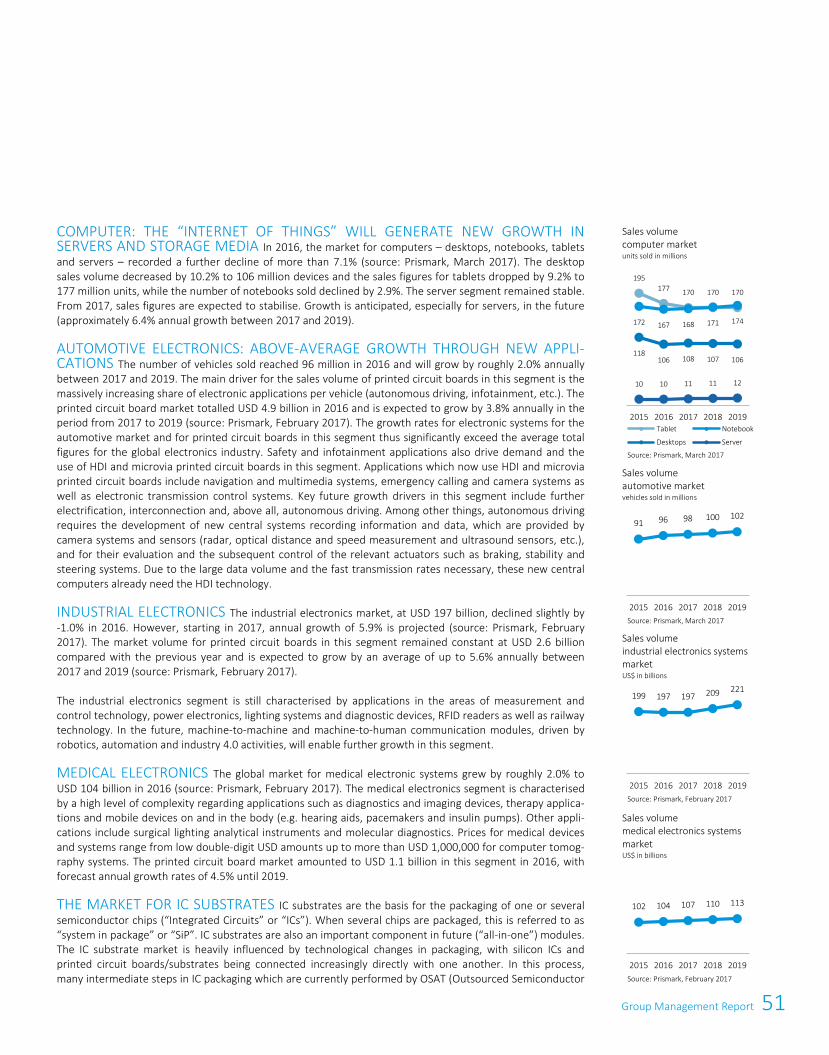
51Group Management Report
32 AT&S Annual Report 2016/17
Printed circuit boards and interconnect solutions for automotive, industrial and medical applications use high-end technologies with reduced track widths from the computer, communication and consumer seg-ments as a platform for further innovations. The focus is placed on the introduction of new materials (e.g. high-frequency printed circuit boards for radar applications in the automotive segment), process control within tighter limits and further technological improvements to meet particularly high quality standards. Application trends such as autonomous driving, robotics and online patient monitoring lead to an increasing convergence of the technological requirements of the individual market segments.
The opportunities arising from the required intelligent combination of different technologies also represent new growth potential for the printed circuit board industry. In addition, potential for the integration of fur-ther value creation in the assembly and packaging services market is also opening up for manufacturers of high-end printed circuit boards and IC substrates with competence in the embedding technology.
INTERNATIONAL MARKET DVELOPMENT The global market for printed circuit boards is part of the highly dynamic electronics industry. Overall, the global electronics market will reach a volume of roughly USD 1,884 billion in 2017, with annual growth rates of roughly 3.4% anticipated between the years 2017 and 2019 (source: Prismark, February 2017). The strongest growth is expected in the automotive and industrial segments (5.9% respectively), while the consumer and communication segments should grow by 3.7% and 3.4%, respectively. Basically, no growth is forecast for the computer segment (annual growth of 0.8% be-tween 2017 and 2019). The semiconductor and printed circuit board markets are subject to more significant fluctuations due to rapidly changing customer needs and the changes in the global economic climate. The printed circuit board industry is inseparably linked to these macro trends. According to current forecasts, the printed circuit board market will increase to USD 54.3 billion again in 2017, which corresponds to an annual growth rate of 2.4% between 2017 and 2019 (sources: Prismark, February 2017; Yole, February 2017). For higher-end technologies such as anylayer and mSAP printed circuit boards, above-average growth rates of 6.0% are forecast (source: Prismark, April 2017).
COMMUNICATION: SMARTPHONES REMAIN THE TECHNOLOGICAL GROWTH DRIVER IN THE ELECTRONICS INDUSTRY After strong growth in 2015, sales volume for smartphones remained nearly constant year-on-year, with roughly 1.471 billion devices sold in 2016. A com-pound annual growth rate of 3.7% is expected for the period from 2017 to 2019 (source: IDC, March 2017). Within this period, smartphones will remain the key revenue and technology driver in the electronics industry despite a slowdown of innovation cycles.
CONSUMER This market segment includes a variety of different applications such as audio and video devices, TVs, gaming devices, video streaming devices, virtual reality (VR) glasses, drones, household appli-ances, consumer robots, cameras and wearable devices (fitness bands, smartwatches, etc.). A key market trend is the interconnection of devices (“Connected Devices”, “Internet of Things” (IoT)) and the download and streaming of videos via the Internet. As a result, an annual growth rate of up to 10% is expected again for connected 4K HD TVs and video streaming devices between 2017 and 2019 (source: BI Intelligence, June 2016). Very strong growth is also projected for virtual reality glasses in combination with connected TVs or drones from 2017 onwards. Wearables and smartwatches will also continue to grow significantly, according to market studies. All of these consumer devices require interconnection solutions based on printed circuit boards. Similar to smartphones, the ongoing miniaturisation also leads to a trend towards printed circuit boards with ever-smaller track widths and integrated (“all-in-one”) modules in this area, from which AT&S can benefit due to its early positioning. Therefore, a compound annual growth rate of roughly 3.5% is ex-pected from 2017 onwards for the entire consumer printed circuit board segment, the current volume of which is USD 7.3 billion (source: Prismark, February 2017).
Electronics market by segment
US$ in billions
Source: Prismark, February 2017
Sales volume smartphones
units sold in millions
Source: IDC, March 2017
462 440 436 440 443
565 550 565 584 605
221 231 237 246 255
177 189 197 209 221199 197 197 209 221102 104 107 110
113139 142 145151
1571,865 1,853 1,884
1,9482,015
2015 2016 2017 2018 2019
Aviation/MilitaryMedicalIndustrialAutomotiveConsumerCommunicationComputer
1,437 1,471 1,535 1,591 1,650
2015 2016 2017 2018 2019
Group Management Report 33
COMPUTER: THE “INTERNET OF THINGS” WILL GENERATE NEW GROWTH IN SERVERS AND STORAGE MEDIA In 2016, the market for computers – desktops, notebooks, tablets and servers – recorded a further decline of more than 7.1% (source: Prismark, March 2017). The desktop sales volume decreased by 10.2% to 106 million devices and the sales figures for tablets dropped by 9.2% to 177 million units, while the number of notebooks sold declined by 2.9%. The server segment remained stable. From 2017, sales figures are expected to stabilise. Growth is anticipated, especially for servers, in the future (approximately 6.4% annual growth between 2017 and 2019).
AUTOMOTIVE ELECTRONICS: ABOVE-AVERAGE GROWTH THROUGH NEW APPLI-CATIONS The number of vehicles sold reached 96 million in 2016 and will grow by roughly 2.0% annually between 2017 and 2019. The main driver for the sales volume of printed circuit boards in this segment is the massively increasing share of electronic applications per vehicle (autonomous driving, infotainment, etc.). The printed circuit board market totalled USD 4.9 billion in 2016 and is expected to grow by 3.8% annually in the period from 2017 to 2019 (source: Prismark, February 2017). The growth rates for electronic systems for the automotive market and for printed circuit boards in this segment thus significantly exceed the average total figures for the global electronics industry. Safety and infotainment applications also drive demand and the use of HDI and microvia printed circuit boards in this segment. Applications which now use HDI and microvia printed circuit boards include navigation and multimedia systems, emergency calling and camera systems as well as electronic transmission control systems. Key future growth drivers in this segment include further electrification, interconnection and, above all, autonomous driving. Among other things, autonomous driving requires the development of new central systems recording information and data, which are provided by camera systems and sensors (radar, optical distance and speed measurement and ultrasound sensors, etc.), and for their evaluation and the subsequent control of the relevant actuators such as braking, stability and steering systems. Due to the large data volume and the fast transmission rates necessary, these new central computers already need the HDI technology.
INDUSTRIAL ELECTRONICS The industrial electronics market, at USD 197 billion, declined slightly by -1.0% in 2016. However, starting in 2017, annual growth of 5.9% is projected (source: Prismark, February 2017). The market volume for printed circuit boards in this segment remained constant at USD 2.6 billion compared with the previous year and is expected to grow by an average of up to 5.6% annually between 2017 and 2019 (source: Prismark, February 2017).
The industrial electronics segment is still characterised by applications in the areas of measurement and control technology, power electronics, lighting systems and diagnostic devices, RFID readers as well as railway technology. In the future, machine-to-machine and machine-to-human communication modules, driven by robotics, automation and industry 4.0 activities, will enable further growth in this segment.
MEDICAL ELECTRONICS The global market for medical electronic systems grew by roughly 2.0% to USD 104 billion in 2016 (source: Prismark, February 2017). The medical electronics segment is characterised by a high level of complexity regarding applications such as diagnostics and imaging devices, therapy applica-tions and mobile devices on and in the body (e.g. hearing aids, pacemakers and insulin pumps). Other appli-cations include surgical lighting analytical instruments and molecular diagnostics. Prices for medical devices and systems range from low double-digit USD amounts up to more than USD 1,000,000 for computer tomog-raphy systems. The printed circuit board market amounted to USD 1.1 billion in this segment in 2016, with forecast annual growth rates of 4.5% until 2019.
THE MARKET FOR IC SUBSTRATES IC substrates are the basis for the packaging of one or several semiconductor chips (“Integrated Circuits” or “ICs”). When several chips are packaged, this is referred to as “system in package” or “SiP”. IC substrates are also an important component in future (“all-in-one”) modules. The IC substrate market is heavily influenced by technological changes in packaging, with silicon ICs and printed circuit boards/substrates being connected increasingly directly with one another. In this process, many intermediate steps in IC packaging which are currently performed by OSAT (Outsourced Semiconductor
Sales volume computer market units sold in millions
Source: Prismark, March 2017
Sales volume automotive market vehicles sold in millions
Source: Prismark, March 2017
Sales volume industrial electronics systems market US$ in billions
Source: Prismark, February 2017
Sales volume medical electronics systems market US$ in billions
Source: Prismark, February 2017
195177 170 170 170
172 167 168 171 174
118106 108 107 106
10 10 11 11 12
2015 2016 2017 2018 2019Tablet Notebook
Desktops Server
91 96 98 100 102
2015 2016 2017 2018 2019
199 197 197 209 221
2015 2016 2017 2018 2019
102 104 107 110 113
2015 2016 2017 2018 2019
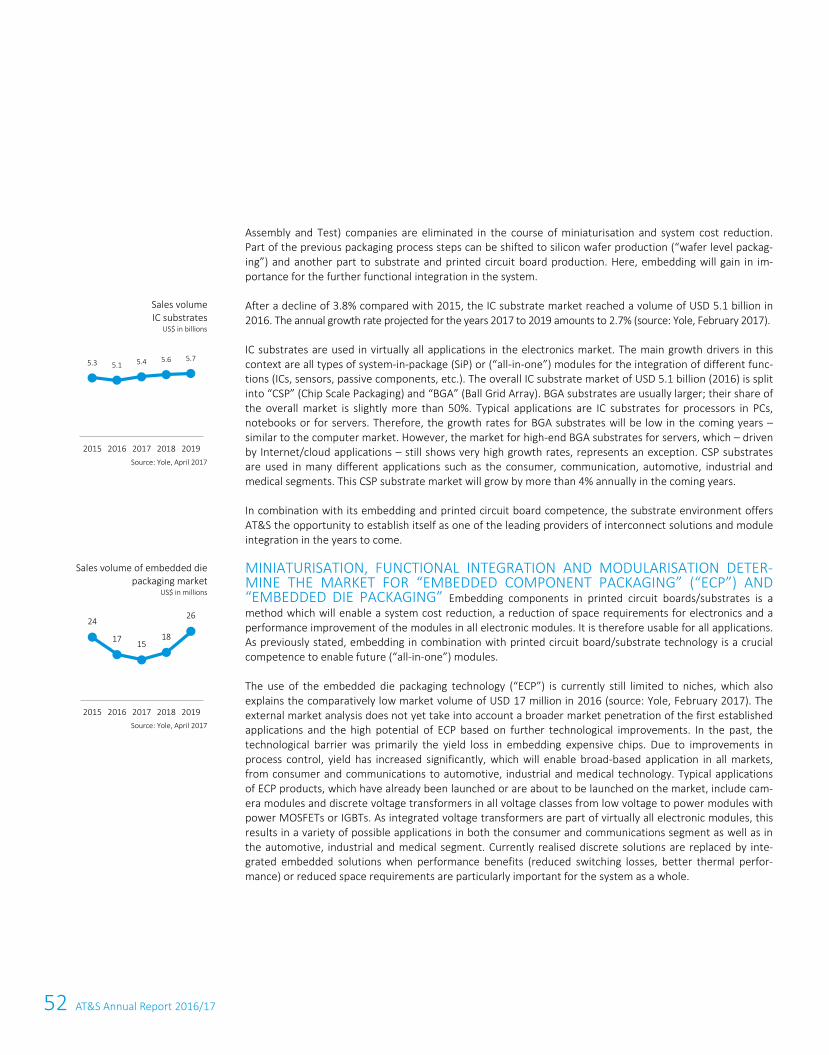
52 AT&S Annual Report 2016/17
34 AT&S Annual Report 2016/17
Assembly and Test) companies are eliminated in the course of miniaturisation and system cost reduction. Part of the previous packaging process steps can be shifted to silicon wafer production (“wafer level packag-ing”) and another part to substrate and printed circuit board production. Here, embedding will gain in im-portance for the further functional integration in the system.
After a decline of 3.8% compared with 2015, the IC substrate market reached a volume of USD 5.1 billion in 2016. The annual growth rate projected for the years 2017 to 2019 amounts to 2.7% (source: Yole, February 2017).
IC substrates are used in virtually all applications in the electronics market. The main growth drivers in this context are all types of system-in-package (SiP) or (“all-in-one”) modules for the integration of different func-tions (ICs, sensors, passive components, etc.). The overall IC substrate market of USD 5.1 billion (2016) is split into “CSP” (Chip Scale Packaging) and “BGA” (Ball Grid Array). BGA substrates are usually larger; their share of the overall market is slightly more than 50%. Typical applications are IC substrates for processors in PCs, notebooks or for servers. Therefore, the growth rates for BGA substrates will be low in the coming years – similar to the computer market. However, the market for high-end BGA substrates for servers, which – driven by Internet/cloud applications – still shows very high growth rates, represents an exception. CSP substrates are used in many different applications such as the consumer, communication, automotive, industrial and medical segments. This CSP substrate market will grow by more than 4% annually in the coming years.
In combination with its embedding and printed circuit board competence, the substrate environment offers AT&S the opportunity to establish itself as one of the leading providers of interconnect solutions and module integration in the years to come.
MINIATURISATION, FUNCTIONAL INTEGRATION AND MODULARISATION DETER-MINE THE MARKET FOR “EMBEDDED COMPONENT PACKAGING” (“ECP”) AND “EMBEDDED DIE PACKAGING” Embedding components in printed circuit boards/substrates is a method which will enable a system cost reduction, a reduction of space requirements for electronics and a performance improvement of the modules in all electronic modules. It is therefore usable for all applications. As previously stated, embedding in combination with printed circuit board/substrate technology is a crucial competence to enable future (“all-in-one”) modules.
The use of the embedded die packaging technology (“ECP”) is currently still limited to niches, which also explains the comparatively low market volume of USD 17 million in 2016 (source: Yole, February 2017). The external market analysis does not yet take into account a broader market penetration of the first established applications and the high potential of ECP based on further technological improvements. In the past, the technological barrier was primarily the yield loss in embedding expensive chips. Due to improvements in process control, yield has increased significantly, which will enable broad-based application in all markets, from consumer and communications to automotive, industrial and medical technology. Typical applications of ECP products, which have already been launched or are about to be launched on the market, include cam-era modules and discrete voltage transformers in all voltage classes from low voltage to power modules with power MOSFETs or IGBTs. As integrated voltage transformers are part of virtually all electronic modules, this results in a variety of possible applications in both the consumer and communications segment as well as in the automotive, industrial and medical segment. Currently realised discrete solutions are replaced by inte-grated embedded solutions when performance benefits (reduced switching losses, better thermal perfor-mance) or reduced space requirements are particularly important for the system as a whole.
Sales volume IC substrates
US$ in billions
Source: Yole, April 2017
Sales volume of embedded die packaging market
US$ in millions
Source: Yole, April 2017
5.3 5.1 5.4 5.6 5.7
2015 2016 2017 2018 2019
24
17 1518
26
2015 2016 2017 2018 2019
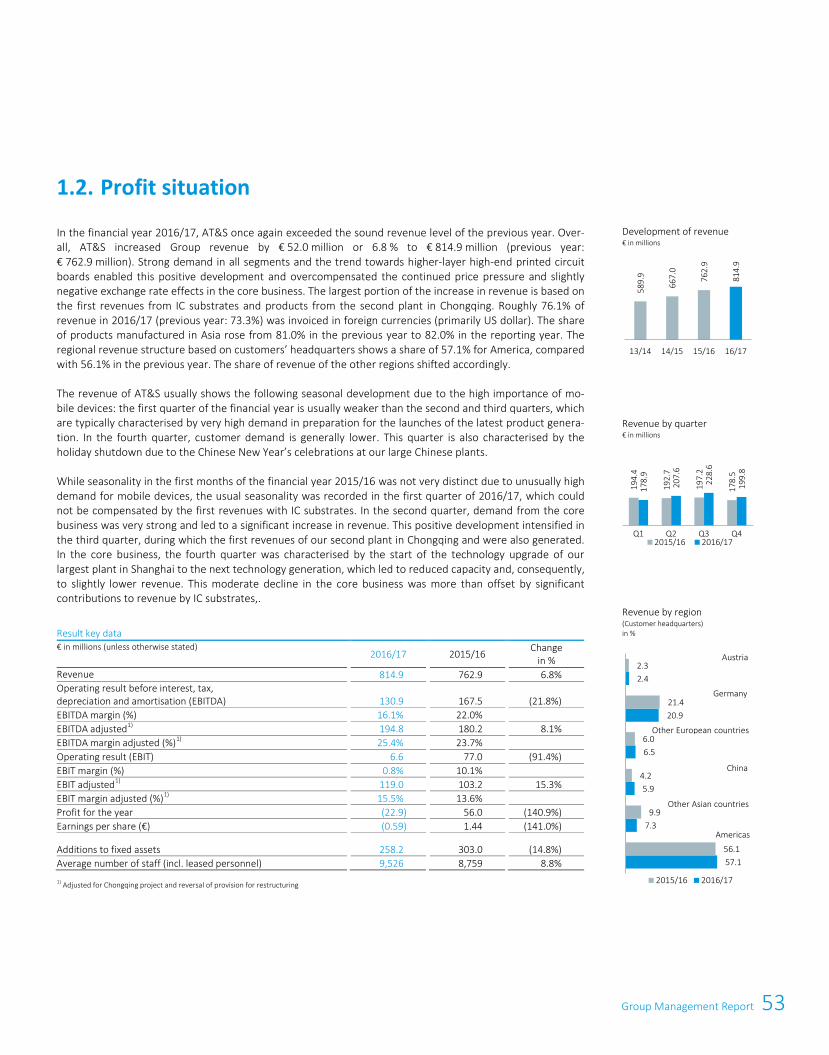
53Group Management Report
34 AT&S Annual Report 2016/17
Assembly and Test) companies are eliminated in the course of miniaturisation and system cost reduction. Part of the previous packaging process steps can be shifted to silicon wafer production (“wafer level packag-ing”) and another part to substrate and printed circuit board production. Here, embedding will gain in im-portance for the further functional integration in the system.
After a decline of 3.8% compared with 2015, the IC substrate market reached a volume of USD 5.1 billion in 2016. The annual growth rate projected for the years 2017 to 2019 amounts to 2.7% (source: Yole, February 2017).
IC substrates are used in virtually all applications in the electronics market. The main growth drivers in this context are all types of system-in-package (SiP) or (“all-in-one”) modules for the integration of different func-tions (ICs, sensors, passive components, etc.). The overall IC substrate market of USD 5.1 billion (2016) is split into “CSP” (Chip Scale Packaging) and “BGA” (Ball Grid Array). BGA substrates are usually larger; their share of the overall market is slightly more than 50%. Typical applications are IC substrates for processors in PCs, notebooks or for servers. Therefore, the growth rates for BGA substrates will be low in the coming years – similar to the computer market. However, the market for high-end BGA substrates for servers, which – driven by Internet/cloud applications – still shows very high growth rates, represents an exception. CSP substrates are used in many different applications such as the consumer, communication, automotive, industrial and medical segments. This CSP substrate market will grow by more than 4% annually in the coming years.
In combination with its embedding and printed circuit board competence, the substrate environment offers AT&S the opportunity to establish itself as one of the leading providers of interconnect solutions and module integration in the years to come.
MINIATURISATION, FUNCTIONAL INTEGRATION AND MODULARISATION DETER-MINE THE MARKET FOR “EMBEDDED COMPONENT PACKAGING” (“ECP”) AND “EMBEDDED DIE PACKAGING” Embedding components in printed circuit boards/substrates is a method which will enable a system cost reduction, a reduction of space requirements for electronics and a performance improvement of the modules in all electronic modules. It is therefore usable for all applications. As previously stated, embedding in combination with printed circuit board/substrate technology is a crucial competence to enable future (“all-in-one”) modules.
The use of the embedded die packaging technology (“ECP”) is currently still limited to niches, which also explains the comparatively low market volume of USD 17 million in 2016 (source: Yole, February 2017). The external market analysis does not yet take into account a broader market penetration of the first established applications and the high potential of ECP based on further technological improvements. In the past, the technological barrier was primarily the yield loss in embedding expensive chips. Due to improvements in process control, yield has increased significantly, which will enable broad-based application in all markets, from consumer and communications to automotive, industrial and medical technology. Typical applications of ECP products, which have already been launched or are about to be launched on the market, include cam-era modules and discrete voltage transformers in all voltage classes from low voltage to power modules with power MOSFETs or IGBTs. As integrated voltage transformers are part of virtually all electronic modules, this results in a variety of possible applications in both the consumer and communications segment as well as in the automotive, industrial and medical segment. Currently realised discrete solutions are replaced by inte-grated embedded solutions when performance benefits (reduced switching losses, better thermal perfor-mance) or reduced space requirements are particularly important for the system as a whole.
Sales volume IC substrates
US$ in billions
Source: Yole, April 2017
Sales volume of embedded die packaging market
US$ in millions
Source: Yole, April 2017
5.3 5.1 5.4 5.6 5.7
2015 2016 2017 2018 2019
24
17 1518
26
2015 2016 2017 2018 2019
Group Management Report 35
In the financial year 2016/17, AT&S once again exceeded the sound revenue level of the previous year. Over-all, AT&S increased Group revenue by € 52.0 million or 6.8 % to € 814.9 million (previous year: € 762.9 million). Strong demand in all segments and the trend towards higher-layer high-end printed circuit boards enabled this positive development and overcompensated the continued price pressure and slightly negative exchange rate effects in the core business. The largest portion of the increase in revenue is based on the first revenues from IC substrates and products from the second plant in Chongqing. Roughly 76.1% of revenue in 2016/17 (previous year: 73.3%) was invoiced in foreign currencies (primarily US dollar). The share of products manufactured in Asia rose from 81.0% in the previous year to 82.0% in the reporting year. The regional revenue structure based on customers’ headquarters shows a share of 57.1% for America, compared with 56.1% in the previous year. The share of revenue of the other regions shifted accordingly.
The revenue of AT&S usually shows the following seasonal development due to the high importance of mo-bile devices: the first quarter of the financial year is usually weaker than the second and third quarters, which are typically characterised by very high demand in preparation for the launches of the latest product genera-tion. In the fourth quarter, customer demand is generally lower. This quarter is also characterised by the holiday shutdown due to the Chinese New Year’s celebrations at our large Chinese plants.
While seasonality in the first months of the financial year 2015/16 was not very distinct due to unusually high demand for mobile devices, the usual seasonality was recorded in the first quarter of 2016/17, which could not be compensated by the first revenues with IC substrates. In the second quarter, demand from the core business was very strong and led to a significant increase in revenue. This positive development intensified in the third quarter, during which the first revenues of our second plant in Chongqing and were also generated. In the core business, the fourth quarter was characterised by the start of the technology upgrade of our largest plant in Shanghai to the next technology generation, which led to reduced capacity and, consequently, to slightly lower revenue. This moderate decline in the core business was more than offset by significant contributions to revenue by IC substrates,.
Result key data € in millions (unless otherwise stated)
2016/17 2015/16 Change
in % Revenue 814.9
762.9
6.8%
Operating result before interest, tax, depreciation and amortisation (EBITDA)
130.9
167.5
(21.8%)
EBITDA margin (%) 16.1%
22.0%
EBITDA adjusted
1) 194.8
180.2
8.1%
EBITDA margin adjusted (%)
1) 25.4%
23.7%
Operating result (EBIT) 6.6
77.0
(91.4%)
EBIT margin (%) 0.8%
10.1%
EBIT adjusted
1) 119.0
103.2
15.3%
EBIT margin adjusted (%)
1) 15.5%
13.6%
Profit for the year (22.9)
56.0
(140.9%)
Earnings per share (€) (0.59)
1.44
(141.0%)
Additions to fixed assets 258.2
303.0
(14.8%)
Average number of staff (incl. leased personnel) 9,526
8,759
8.8%
1) Adjusted for Chongqing project and reversal of provision for restructuring
1.2. Profit situation
Development of revenue € in millions
Revenue by quarter € in millions
Revenue by region (Customer headquarters) in %
589.
9
667.
0
762.
9
814.
9
13/14 14/15 15/16 16/17
194.
4
192.
7
197.
2
178.
5
178.
9
207.
6
228.
6
199.
8
Q1 Q2 Q3 Q42015/16 2016/17
57.1
7.3
5.9
6.5
20.9
2.4
56.1
9.9
4.2
6.0
21.4
2.3
2015/16 2016/17
Austria
Germany
Other European countries
China
Other Asian countries
Americas
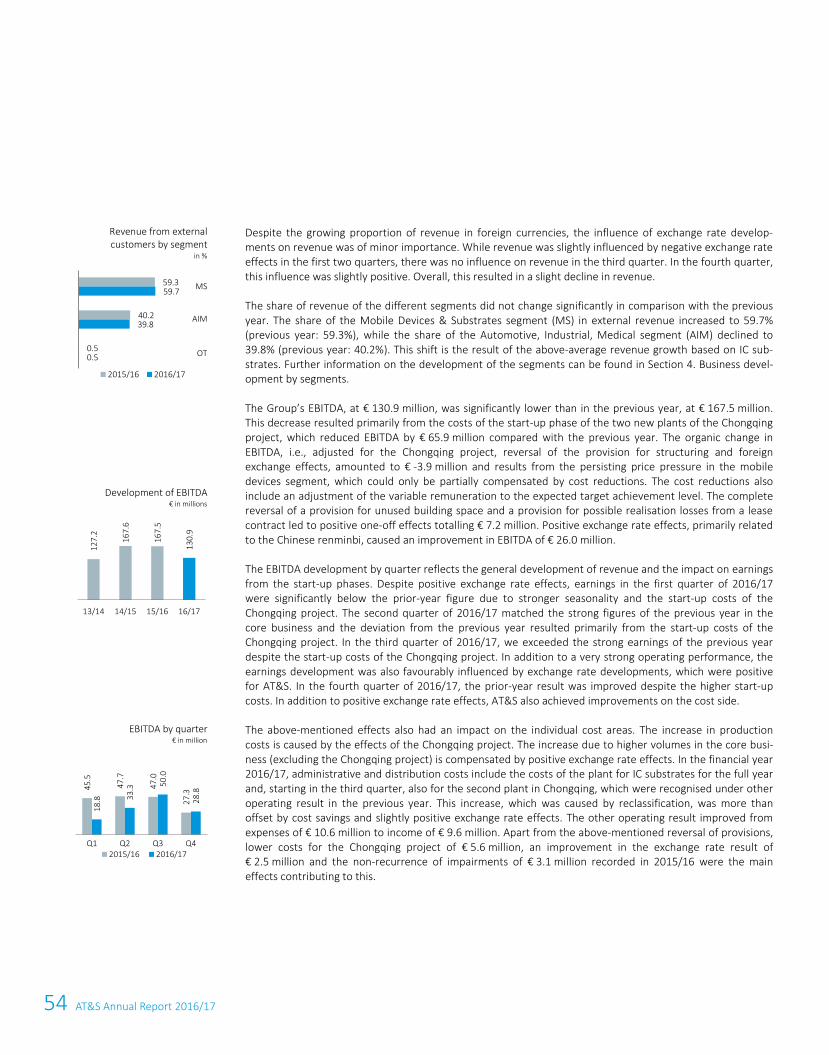
54 AT&S Annual Report 2016/17
36 AT&S Annual Report 2016/17
Despite the growing proportion of revenue in foreign currencies, the influence of exchange rate develop-ments on revenue was of minor importance. While revenue was slightly influenced by negative exchange rate effects in the first two quarters, there was no influence on revenue in the third quarter. In the fourth quarter, this influence was slightly positive. Overall, this resulted in a slight decline in revenue.
The share of revenue of the different segments did not change significantly in comparison with the previous year. The share of the Mobile Devices & Substrates segment (MS) in external revenue increased to 59.7% (previous year: 59.3%), while the share of the Automotive, Industrial, Medical segment (AIM) declined to 39.8% (previous year: 40.2%). This shift is the result of the above-average revenue growth based on IC sub-strates. Further information on the development of the segments can be found in Section 4. Business devel-opment by segments.
The Group’s EBITDA, at € 130.9 million, was significantly lower than in the previous year, at € 167.5 million. This decrease resulted primarily from the costs of the start-up phase of the two new plants of the Chongqing project, which reduced EBITDA by € 65.9 million compared with the previous year. The organic change in EBITDA, i.e., adjusted for the Chongqing project, reversal of the provision for structuring and foreign exchange effects, amounted to € -3.9 million and results from the persisting price pressure in the mobile devices segment, which could only be partially compensated by cost reductions. The cost reductions also include an adjustment of the variable remuneration to the expected target achievement level. The complete reversal of a provision for unused building space and a provision for possible realisation losses from a lease contract led to positive one-off effects totalling € 7.2 million. Positive exchange rate effects, primarily related to the Chinese renminbi, caused an improvement in EBITDA of € 26.0 million.
The EBITDA development by quarter reflects the general development of revenue and the impact on earnings from the start-up phases. Despite positive exchange rate effects, earnings in the first quarter of 2016/17 were significantly below the prior-year figure due to stronger seasonality and the start-up costs of the Chongqing project. The second quarter of 2016/17 matched the strong figures of the previous year in the core business and the deviation from the previous year resulted primarily from the start-up costs of the Chongqing project. In the third quarter of 2016/17, we exceeded the strong earnings of the previous year despite the start-up costs of the Chongqing project. In addition to a very strong operating performance, the earnings development was also favourably influenced by exchange rate developments, which were positive for AT&S. In the fourth quarter of 2016/17, the prior-year result was improved despite the higher start-up costs. In addition to positive exchange rate effects, AT&S also achieved improvements on the cost side.
The above-mentioned effects also had an impact on the individual cost areas. The increase in production costs is caused by the effects of the Chongqing project. The increase due to higher volumes in the core busi-ness (excluding the Chongqing project) is compensated by positive exchange rate effects. In the financial year 2016/17, administrative and distribution costs include the costs of the plant for IC substrates for the full year and, starting in the third quarter, also for the second plant in Chongqing, which were recognised under other operating result in the previous year. This increase, which was caused by reclassification, was more than offset by cost savings and slightly positive exchange rate effects. The other operating result improved from expenses of € 10.6 million to income of € 9.6 million. Apart from the above-mentioned reversal of provisions, lower costs for the Chongqing project of € 5.6 million, an improvement in the exchange rate result of € 2.5 million and the non-recurrence of impairments of € 3.1 million recorded in 2015/16 were the main effects contributing to this.
Revenue from external customers by segment
in %
Development of EBITDA € in millions
EBITDA by quarter € in million
59.3
40.2
0.5
59.7
39.8
0.5
2015/16 2016/17
MS
AIM
OT
127.
2
167.
6
167.
5
130.
9
13/14 14/15 15/16 16/17
45.5
47.7
47.0
27.3
18.8 33
.3 50.0
28.8
Q1 Q2 Q3 Q42015/16 2016/17
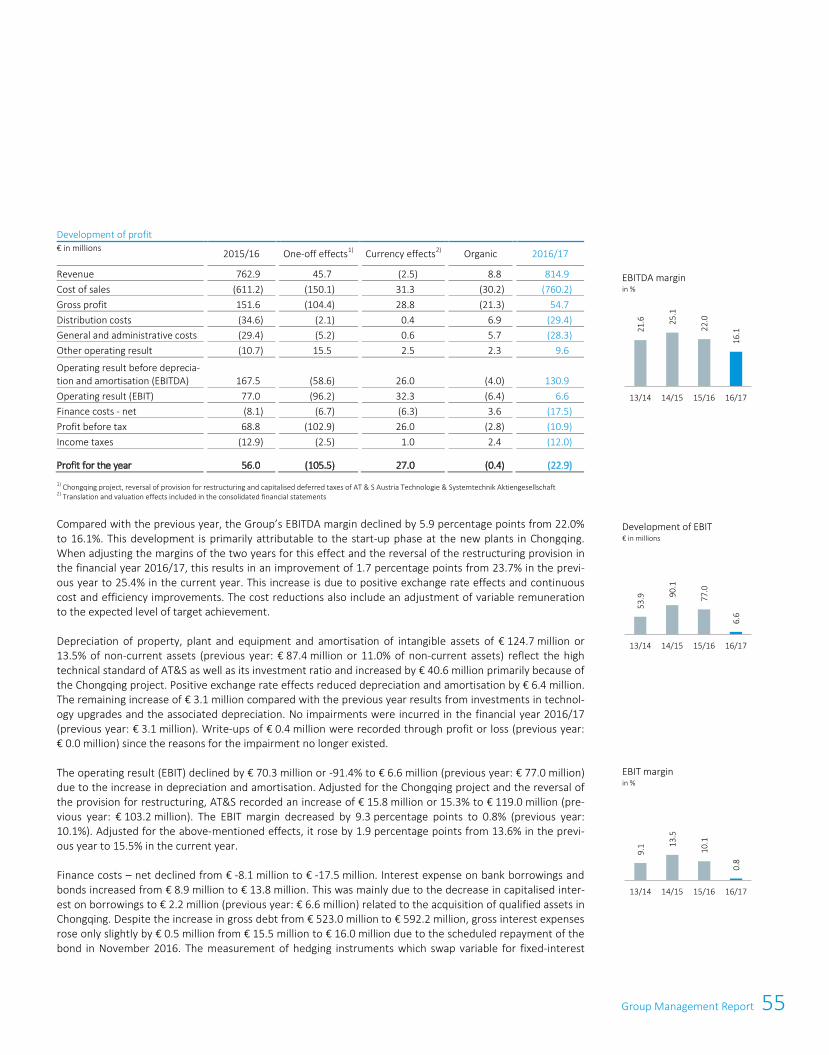
55Group Management Report
36 AT&S Annual Report 2016/17
Despite the growing proportion of revenue in foreign currencies, the influence of exchange rate develop-ments on revenue was of minor importance. While revenue was slightly influenced by negative exchange rate effects in the first two quarters, there was no influence on revenue in the third quarter. In the fourth quarter, this influence was slightly positive. Overall, this resulted in a slight decline in revenue.
The share of revenue of the different segments did not change significantly in comparison with the previous year. The share of the Mobile Devices & Substrates segment (MS) in external revenue increased to 59.7% (previous year: 59.3%), while the share of the Automotive, Industrial, Medical segment (AIM) declined to 39.8% (previous year: 40.2%). This shift is the result of the above-average revenue growth based on IC sub-strates. Further information on the development of the segments can be found in Section 4. Business devel-opment by segments.
The Group’s EBITDA, at € 130.9 million, was significantly lower than in the previous year, at € 167.5 million. This decrease resulted primarily from the costs of the start-up phase of the two new plants of the Chongqing project, which reduced EBITDA by € 65.9 million compared with the previous year. The organic change in EBITDA, i.e., adjusted for the Chongqing project, reversal of the provision for structuring and foreign exchange effects, amounted to € -3.9 million and results from the persisting price pressure in the mobile devices segment, which could only be partially compensated by cost reductions. The cost reductions also include an adjustment of the variable remuneration to the expected target achievement level. The complete reversal of a provision for unused building space and a provision for possible realisation losses from a lease contract led to positive one-off effects totalling € 7.2 million. Positive exchange rate effects, primarily related to the Chinese renminbi, caused an improvement in EBITDA of € 26.0 million.
The EBITDA development by quarter reflects the general development of revenue and the impact on earnings from the start-up phases. Despite positive exchange rate effects, earnings in the first quarter of 2016/17 were significantly below the prior-year figure due to stronger seasonality and the start-up costs of the Chongqing project. The second quarter of 2016/17 matched the strong figures of the previous year in the core business and the deviation from the previous year resulted primarily from the start-up costs of the Chongqing project. In the third quarter of 2016/17, we exceeded the strong earnings of the previous year despite the start-up costs of the Chongqing project. In addition to a very strong operating performance, the earnings development was also favourably influenced by exchange rate developments, which were positive for AT&S. In the fourth quarter of 2016/17, the prior-year result was improved despite the higher start-up costs. In addition to positive exchange rate effects, AT&S also achieved improvements on the cost side.
The above-mentioned effects also had an impact on the individual cost areas. The increase in production costs is caused by the effects of the Chongqing project. The increase due to higher volumes in the core busi-ness (excluding the Chongqing project) is compensated by positive exchange rate effects. In the financial year 2016/17, administrative and distribution costs include the costs of the plant for IC substrates for the full year and, starting in the third quarter, also for the second plant in Chongqing, which were recognised under other operating result in the previous year. This increase, which was caused by reclassification, was more than offset by cost savings and slightly positive exchange rate effects. The other operating result improved from expenses of € 10.6 million to income of € 9.6 million. Apart from the above-mentioned reversal of provisions, lower costs for the Chongqing project of € 5.6 million, an improvement in the exchange rate result of € 2.5 million and the non-recurrence of impairments of € 3.1 million recorded in 2015/16 were the main effects contributing to this.
Revenue from external customers by segment
in %
Development of EBITDA € in millions
EBITDA by quarter € in million
59.3
40.2
0.5
59.7
39.8
0.5
2015/16 2016/17
MS
AIM
OT
127.
2
167.
6
167.
5
130.
9
13/14 14/15 15/16 16/17
45.5
47.7
47.0
27.3
18.8 33
.3 50.0
28.8
Q1 Q2 Q3 Q42015/16 2016/17
Group Management Report 37
Development of profit € in millions
2015/16 One-off effects
1) Currency effects
2) Organic 2016/17
Revenue 762.9
45.7
(2.5)
8.8
814.9
Cost of sales (611.2)
(150.1)
31.3
(30.2)
(760.2)
Gross profit 151.6
(104.4)
28.8
(21.3)
54.7
Distribution costs (34.6)
(2.1)
0.4
6.9
(29.4)
General and administrative costs (29.4)
(5.2)
0.6
5.7
(28.3)
Other operating result (10.7)
15.5
2.5
2.3
9.6
Operating result before deprecia-tion and amortisation (EBITDA)
167.5
(58.6)
26.0
(4.0)
130.9
Operating result (EBIT) 77.0
(96.2)
32.3
(6.4)
6.6
Finance costs - net (8.1)
(6.7)
(6.3)
3.6
(17.5)
Profit before tax 68.8
(102.9)
26.0
(2.8)
(10.9)
Income taxes (12.9)
(2.5)
1.0
2.4
(12.0)
Profit for the year 56.0
(105.5)
27.0
(0.4)
(22.9)
1) Chongqing project, reversal of provision for restructuring and capitalised deferred taxes of AT & S Austria Technologie & Systemtechnik Aktiengesellschaft 2) Translation and valuation effects included in the consolidated financial statements
Compared with the previous year, the Group’s EBITDA margin declined by 5.9 percentage points from 22.0% to 16.1%. This development is primarily attributable to the start-up phase at the new plants in Chongqing. When adjusting the margins of the two years for this effect and the reversal of the restructuring provision in the financial year 2016/17, this results in an improvement of 1.7 percentage points from 23.7% in the previ-ous year to 25.4% in the current year. This increase is due to positive exchange rate effects and continuous cost and efficiency improvements. The cost reductions also include an adjustment of variable remuneration to the expected level of target achievement.
Depreciation of property, plant and equipment and amortisation of intangible assets of € 124.7 million or 13.5% of non-current assets (previous year: € 87.4 million or 11.0% of non-current assets) reflect the high technical standard of AT&S as well as its investment ratio and increased by € 40.6 million primarily because of the Chongqing project. Positive exchange rate effects reduced depreciation and amortisation by € 6.4 million. The remaining increase of € 3.1 million compared with the previous year results from investments in technol-ogy upgrades and the associated depreciation. No impairments were incurred in the financial year 2016/17 (previous year: € 3.1 million). Write-ups of € 0.4 million were recorded through profit or loss (previous year: € 0.0 million) since the reasons for the impairment no longer existed.
The operating result (EBIT) declined by € 70.3 million or -91.4% to € 6.6 million (previous year: € 77.0 million) due to the increase in depreciation and amortisation. Adjusted for the Chongqing project and the reversal of the provision for restructuring, AT&S recorded an increase of € 15.8 million or 15.3% to € 119.0 million (pre-vious year: € 103.2 million). The EBIT margin decreased by 9.3 percentage points to 0.8% (previous year: 10.1%). Adjusted for the above-mentioned effects, it rose by 1.9 percentage points from 13.6% in the previ-ous year to 15.5% in the current year.
Finance costs – net declined from € -8.1 million to € -17.5 million. Interest expense on bank borrowings and bonds increased from € 8.9 million to € 13.8 million. This was mainly due to the decrease in capitalised inter-est on borrowings to € 2.2 million (previous year: € 6.6 million) related to the acquisition of qualified assets in Chongqing. Despite the increase in gross debt from € 523.0 million to € 592.2 million, gross interest expenses rose only slightly by € 0.5 million from € 15.5 million to € 16.0 million due to the scheduled repayment of the bond in November 2016. The measurement of hedging instruments which swap variable for fixed-interest
EBITDA margin in %
Development of EBIT € in millions
EBIT margin in %
21.6 25
.1
22.0
16.1
13/14 14/15 15/16 16/17
53.9 90
.1
77.0
6.6
13/14 14/15 15/16 16/179.
1 13.5
10.1
0.8
13/14 14/15 15/16 16/17
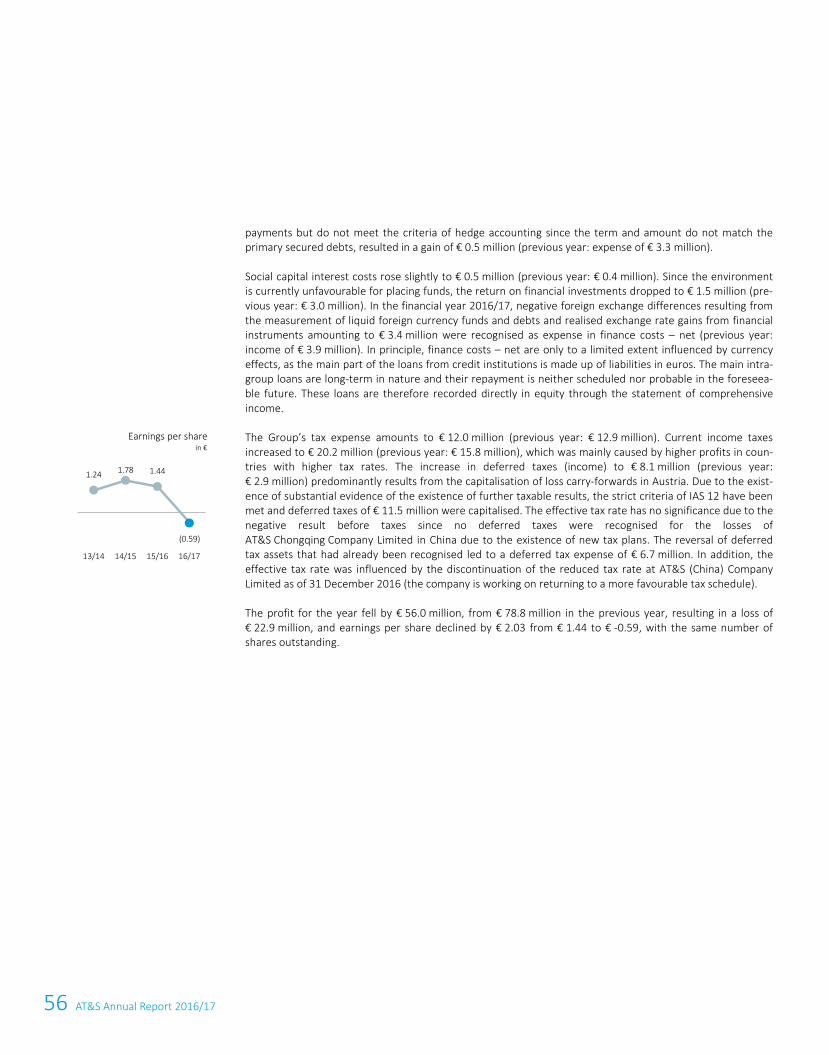
56 AT&S Annual Report 2016/17
38 AT&S Annual Report 2016/17
payments but do not meet the criteria of hedge accounting since the term and amount do not match the primary secured debts, resulted in a gain of € 0.5 million (previous year: expense of € 3.3 million).
Social capital interest costs rose slightly to € 0.5 million (previous year: € 0.4 million). Since the environment is currently unfavourable for placing funds, the return on financial investments dropped to € 1.5 million (pre-vious year: € 3.0 million). In the financial year 2016/17, negative foreign exchange differences resulting from the measurement of liquid foreign currency funds and debts and realised exchange rate gains from financial instruments amounting to € 3.4 million were recognised as expense in finance costs – net (previous year: income of € 3.9 million). In principle, finance costs – net are only to a limited extent influenced by currency effects, as the main part of the loans from credit institutions is made up of liabilities in euros. The main intra-group loans are long-term in nature and their repayment is neither scheduled nor probable in the foreseea-ble future. These loans are therefore recorded directly in equity through the statement of comprehensive income.
The Group’s tax expense amounts to € 12.0 million (previous year: € 12.9 million). Current income taxes increased to € 20.2 million (previous year: € 15.8 million), which was mainly caused by higher profits in coun-tries with higher tax rates. The increase in deferred taxes (income) to € 8.1 million (previous year: € 2.9 million) predominantly results from the capitalisation of loss carry-forwards in Austria. Due to the exist-ence of substantial evidence of the existence of further taxable results, the strict criteria of IAS 12 have been met and deferred taxes of € 11.5 million were capitalised. The effective tax rate has no significance due to the negative result before taxes since no deferred taxes were recognised for the losses of AT&S Chongqing Company Limited in China due to the existence of new tax plans. The reversal of deferred tax assets that had already been recognised led to a deferred tax expense of € 6.7 million. In addition, the effective tax rate was influenced by the discontinuation of the reduced tax rate at AT&S (China) Company Limited as of 31 December 2016 (the company is working on returning to a more favourable tax schedule).
The profit for the year fell by € 56.0 million, from € 78.8 million in the previous year, resulting in a loss of € 22.9 million, and earnings per share declined by € 2.03 from € 1.44 to € -0.59, with the same number of shares outstanding.
Earnings per share in €
1.24 1.78 1.44
13/14 14/15 15/16 16/17
(0.59)
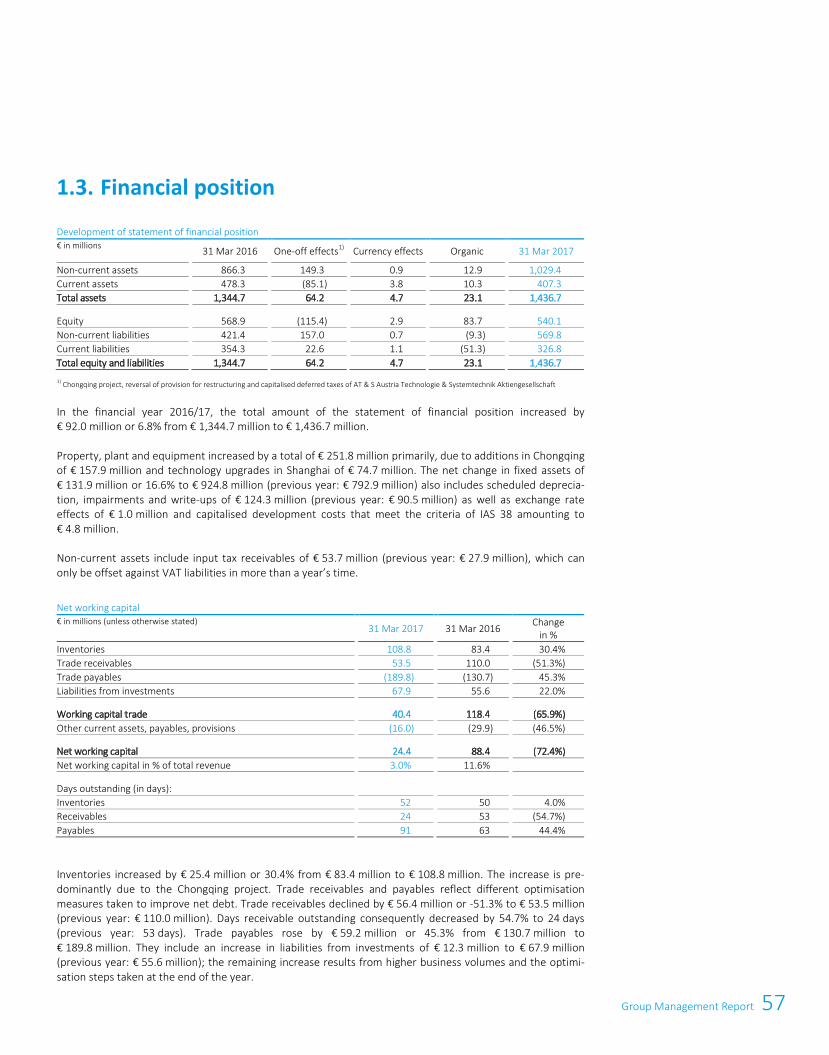
57Group Management Report
38 AT&S Annual Report 2016/17
payments but do not meet the criteria of hedge accounting since the term and amount do not match the primary secured debts, resulted in a gain of € 0.5 million (previous year: expense of € 3.3 million).
Social capital interest costs rose slightly to € 0.5 million (previous year: € 0.4 million). Since the environment is currently unfavourable for placing funds, the return on financial investments dropped to € 1.5 million (pre-vious year: € 3.0 million). In the financial year 2016/17, negative foreign exchange differences resulting from the measurement of liquid foreign currency funds and debts and realised exchange rate gains from financial instruments amounting to € 3.4 million were recognised as expense in finance costs – net (previous year: income of € 3.9 million). In principle, finance costs – net are only to a limited extent influenced by currency effects, as the main part of the loans from credit institutions is made up of liabilities in euros. The main intra-group loans are long-term in nature and their repayment is neither scheduled nor probable in the foreseea-ble future. These loans are therefore recorded directly in equity through the statement of comprehensive income.
The Group’s tax expense amounts to € 12.0 million (previous year: € 12.9 million). Current income taxes increased to € 20.2 million (previous year: € 15.8 million), which was mainly caused by higher profits in coun-tries with higher tax rates. The increase in deferred taxes (income) to € 8.1 million (previous year: € 2.9 million) predominantly results from the capitalisation of loss carry-forwards in Austria. Due to the exist-ence of substantial evidence of the existence of further taxable results, the strict criteria of IAS 12 have been met and deferred taxes of € 11.5 million were capitalised. The effective tax rate has no significance due to the negative result before taxes since no deferred taxes were recognised for the losses of AT&S Chongqing Company Limited in China due to the existence of new tax plans. The reversal of deferred tax assets that had already been recognised led to a deferred tax expense of € 6.7 million. In addition, the effective tax rate was influenced by the discontinuation of the reduced tax rate at AT&S (China) Company Limited as of 31 December 2016 (the company is working on returning to a more favourable tax schedule).
The profit for the year fell by € 56.0 million, from € 78.8 million in the previous year, resulting in a loss of € 22.9 million, and earnings per share declined by € 2.03 from € 1.44 to € -0.59, with the same number of shares outstanding.
Earnings per share in €
1.24 1.78 1.44
13/14 14/15 15/16 16/17
(0.59)
Consolidated Financial Statements 39
Development of statement of financial position € in millions
31 Mar 2016
One-off effects
1) Currency effects Organic
31 Mar 2017
Non-current assets 866.3
149.3
0.9
12.9
1,029.4
Current assets 478.3
(85.1)
3.8
10.3
407.3
Total assets 1,344.7
64.2
4.7
23.1
1,436.7
Equity 568.9
(115.4)
2.9
83.7
540.1
Non-current liabilities 421.4
157.0
0.7
(9.3)
569.8
Current liabilities 354.3
22.6
1.1
(51.3)
326.8
Total equity and liabilities 1,344.7
64.2
4.7
23.1
1,436.7
1) Chongqing project, reversal of provision for restructuring and capitalised deferred taxes of AT & S Austria Technologie & Systemtechnik Aktiengesellschaft
In the financial year 2016/17, the total amount of the statement of financial position increased by € 92.0 million or 6.8% from € 1,344.7 million to € 1,436.7 million.
Property, plant and equipment increased by a total of € 251.8 million primarily, due to additions in Chongqing of € 157.9 million and technology upgrades in Shanghai of € 74.7 million. The net change in fixed assets of € 131.9 million or 16.6% to € 924.8 million (previous year: € 792.9 million) also includes scheduled deprecia-tion, impairments and write-ups of € 124.3 million (previous year: € 90.5 million) as well as exchange rate effects of € 1.0 million and capitalised development costs that meet the criteria of IAS 38 amounting to € 4.8 million.
Non-current assets include input tax receivables of € 53.7 million (previous year: € 27.9 million), which can only be offset against VAT liabilities in more than a year’s time.
Net working capital € in millions (unless otherwise stated)
31 Mar 2017 31 Mar 2016 Change
in % Inventories
108.8
83.4
30.4%
Trade receivables 53.5
110.0
(51.3%)
Trade payables (189.8)
(130.7)
45.3%
Liabilities from investments 67.9
55.6
22.0%
Working capital trade 40.4
118.4
(65.9%)
Other current assets, payables, provisions (16.0)
(29.9)
(46.5%)
Net working capital 24.4
88.4
(72.4%)
Net working capital in % of total revenue 3.0%
11.6%
Days outstanding (in days):
Inventories 52
50
4.0%
Receivables 24
53
(54.7%)
Payables 91
63
44.4%
Inventories increased by € 25.4 million or 30.4% from € 83.4 million to € 108.8 million. The increase is pre-dominantly due to the Chongqing project. Trade receivables and payables reflect different optimisation measures taken to improve net debt. Trade receivables declined by € 56.4 million or -51.3% to € 53.5 million (previous year: € 110.0 million). Days receivable outstanding consequently decreased by 54.7% to 24 days (previous year: 53 days). Trade payables rose by € 59.2 million or 45.3% from € 130.7 million to € 189.8 million. They include an increase in liabilities from investments of € 12.3 million to € 67.9 million (previous year: € 55.6 million); the remaining increase results from higher business volumes and the optimi-sation steps taken at the end of the year.
1.3. Financial position
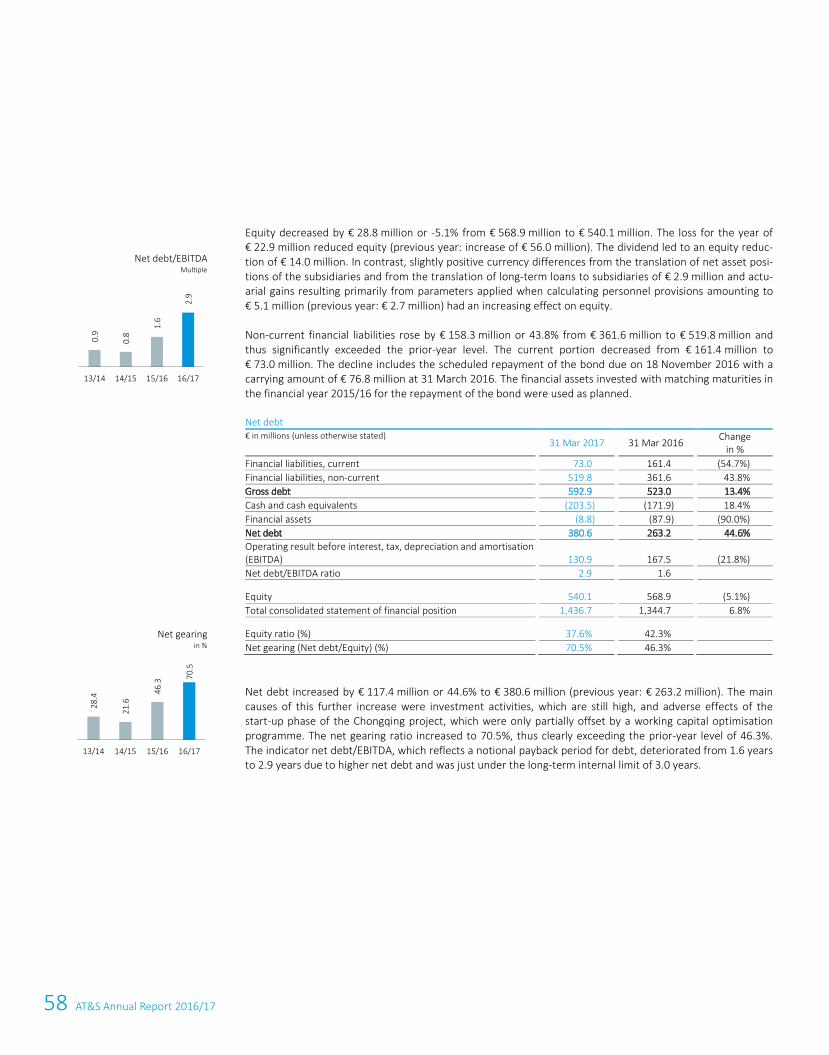
58 AT&S Annual Report 2016/17
40 AT&S Annual Report 2016/17
Equity decreased by € 28.8 million or -5.1% from € 568.9 million to € 540.1 million. The loss for the year of € 22.9 million reduced equity (previous year: increase of € 56.0 million). The dividend led to an equity reduc-tion of € 14.0 million. In contrast, slightly positive currency differences from the translation of net asset posi-tions of the subsidiaries and from the translation of long-term loans to subsidiaries of € 2.9 million and actu-arial gains resulting primarily from parameters applied when calculating personnel provisions amounting to € 5.1 million (previous year: € 2.7 million) had an increasing effect on equity.
Non-current financial liabilities rose by € 158.3 million or 43.8% from € 361.6 million to € 519.8 million and thus significantly exceeded the prior-year level. The current portion decreased from € 161.4 million to € 73.0 million. The decline includes the scheduled repayment of the bond due on 18 November 2016 with a carrying amount of € 76.8 million at 31 March 2016. The financial assets invested with matching maturities in the financial year 2015/16 for the repayment of the bond were used as planned.
Net debt € in millions (unless otherwise stated)
31 Mar 2017
31 Mar 2016
Change
in % Financial liabilities, current
73.0
161.4
(54.7%)
Financial liabilities, non-current 519.8
361.6
43.8%
Gross debt 592.9
523.0
13.4%
Cash and cash equivalents (203.5)
(171.9)
18.4%
Financial assets (8.8)
(87.9)
(90.0%)
Net debt 380.6
263.2
44.6%
Operating result before interest, tax, depreciation and amortisation (EBITDA)
130.9
167.5
(21.8%)
Net debt/EBITDA ratio 2.9
1.6
Equity 540.1
568.9
(5.1%)
Total consolidated statement of financial position 1,436.7
1,344.7
6.8%
Equity ratio (%) 37.6%
42.3%
Net gearing (Net debt/Equity) (%) 70.5%
46.3%
Net debt increased by € 117.4 million or 44.6% to € 380.6 million (previous year: € 263.2 million). The main causes of this further increase were investment activities, which are still high, and adverse effects of the start-up phase of the Chongqing project, which were only partially offset by a working capital optimisation programme. The net gearing ratio increased to 70.5%, thus clearly exceeding the prior-year level of 46.3%. The indicator net debt/EBITDA, which reflects a notional payback period for debt, deteriorated from 1.6 years to 2.9 years due to higher net debt and was just under the long-term internal limit of 3.0 years.
Net debt/EBITDA Multiple
Net gearing in %
0.9
0.8
1.6
2.9
13/14 14/15 15/16 16/17
28.4
21.6
46.3
70.5
13/14 14/15 15/16 16/17
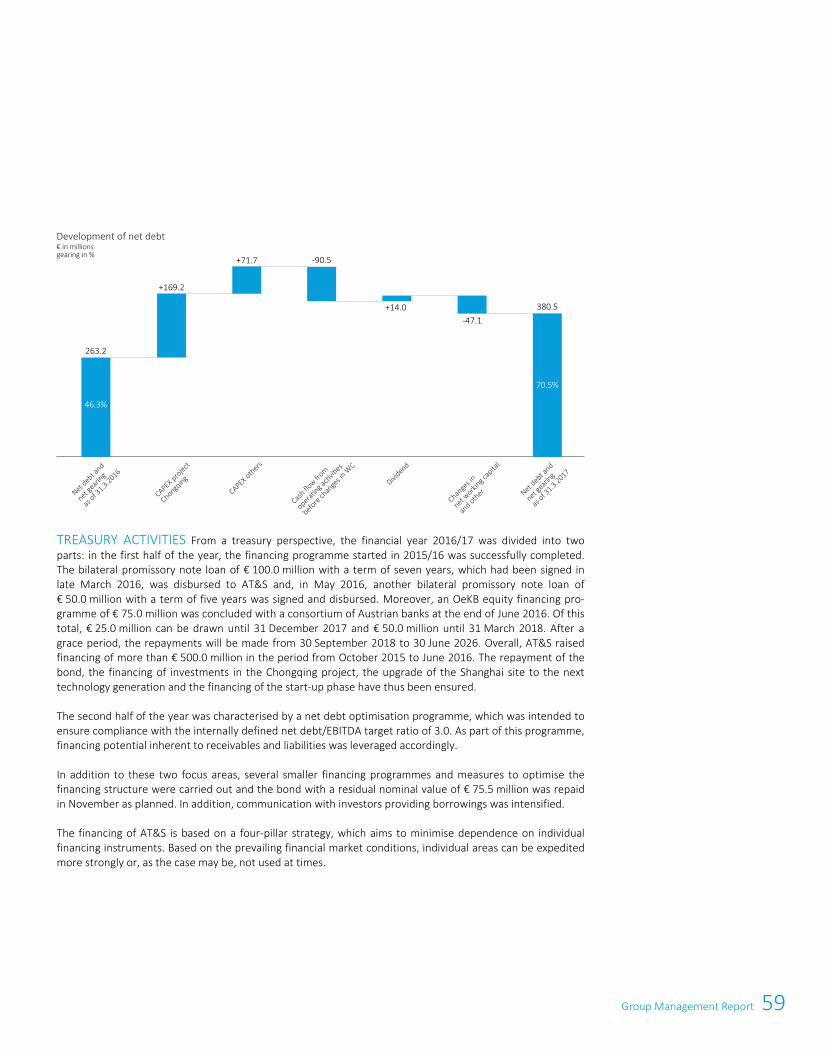
59Group Management Report
40 AT&S Annual Report 2016/17
Equity decreased by € 28.8 million or -5.1% from € 568.9 million to € 540.1 million. The loss for the year of € 22.9 million reduced equity (previous year: increase of € 56.0 million). The dividend led to an equity reduc-tion of € 14.0 million. In contrast, slightly positive currency differences from the translation of net asset posi-tions of the subsidiaries and from the translation of long-term loans to subsidiaries of € 2.9 million and actu-arial gains resulting primarily from parameters applied when calculating personnel provisions amounting to € 5.1 million (previous year: € 2.7 million) had an increasing effect on equity.
Non-current financial liabilities rose by € 158.3 million or 43.8% from € 361.6 million to € 519.8 million and thus significantly exceeded the prior-year level. The current portion decreased from € 161.4 million to € 73.0 million. The decline includes the scheduled repayment of the bond due on 18 November 2016 with a carrying amount of € 76.8 million at 31 March 2016. The financial assets invested with matching maturities in the financial year 2015/16 for the repayment of the bond were used as planned.
Net debt € in millions (unless otherwise stated)
31 Mar 2017
31 Mar 2016
Change
in % Financial liabilities, current
73.0
161.4
(54.7%)
Financial liabilities, non-current 519.8
361.6
43.8%
Gross debt 592.9
523.0
13.4%
Cash and cash equivalents (203.5)
(171.9)
18.4%
Financial assets (8.8)
(87.9)
(90.0%)
Net debt 380.6
263.2
44.6%
Operating result before interest, tax, depreciation and amortisation (EBITDA)
130.9
167.5
(21.8%)
Net debt/EBITDA ratio 2.9
1.6
Equity 540.1
568.9
(5.1%)
Total consolidated statement of financial position 1,436.7
1,344.7
6.8%
Equity ratio (%) 37.6%
42.3%
Net gearing (Net debt/Equity) (%) 70.5%
46.3%
Net debt increased by € 117.4 million or 44.6% to € 380.6 million (previous year: € 263.2 million). The main causes of this further increase were investment activities, which are still high, and adverse effects of the start-up phase of the Chongqing project, which were only partially offset by a working capital optimisation programme. The net gearing ratio increased to 70.5%, thus clearly exceeding the prior-year level of 46.3%. The indicator net debt/EBITDA, which reflects a notional payback period for debt, deteriorated from 1.6 years to 2.9 years due to higher net debt and was just under the long-term internal limit of 3.0 years.
Net debt/EBITDA Multiple
Net gearing in %
0.9
0.8
1.6
2.9
13/14 14/15 15/16 16/17
28.4
21.6
46.3
70.5
13/14 14/15 15/16 16/17
Consolidated Financial Statements 41
TREASURY ACTIVITIES From a treasury perspective, the financial year 2016/17 was divided into two parts: in the first half of the year, the financing programme started in 2015/16 was successfully completed. The bilateral promissory note loan of € 100.0 million with a term of seven years, which had been signed in late March 2016, was disbursed to AT&S and, in May 2016, another bilateral promissory note loan of € 50.0 million with a term of five years was signed and disbursed. Moreover, an OeKB equity financing pro-gramme of € 75.0 million was concluded with a consortium of Austrian banks at the end of June 2016. Of this total, € 25.0 million can be drawn until 31 December 2017 and € 50.0 million until 31 March 2018. After a grace period, the repayments will be made from 30 September 2018 to 30 June 2026. Overall, AT&S raised financing of more than € 500.0 million in the period from October 2015 to June 2016. The repayment of the bond, the financing of investments in the Chongqing project, the upgrade of the Shanghai site to the next technology generation and the financing of the start-up phase have thus been ensured.
The second half of the year was characterised by a net debt optimisation programme, which was intended to ensure compliance with the internally defined net debt/EBITDA target ratio of 3.0. As part of this programme, financing potential inherent to receivables and liabilities was leveraged accordingly.
In addition to these two focus areas, several smaller financing programmes and measures to optimise the financing structure were carried out and the bond with a residual nominal value of € 75.5 million was repaid in November as planned. In addition, communication with investors providing borrowings was intensified.
The financing of AT&S is based on a four-pillar strategy, which aims to minimise dependence on individual financing instruments. Based on the prevailing financial market conditions, individual areas can be expedited more strongly or, as the case may be, not used at times.
21,6 %28,4 %
Development of net debt€ in millionsgearing in %
CAPEX project
Chongqing
CAPEX others
Cash flow fr
om
operating a
ctiviti
es
before chan
ges in
WC
Dividend
Change
s in
net worki
ng cap
ital
and other Net d
ebt and
net geari
ng
as of 3
1.3.2017
Net debt a
nd
net geari
ng
as of 3
1.3.2016
263.2
46.3%
70.5%
+14.0
-90.5
-47.1380.5
+169.2
+71.7
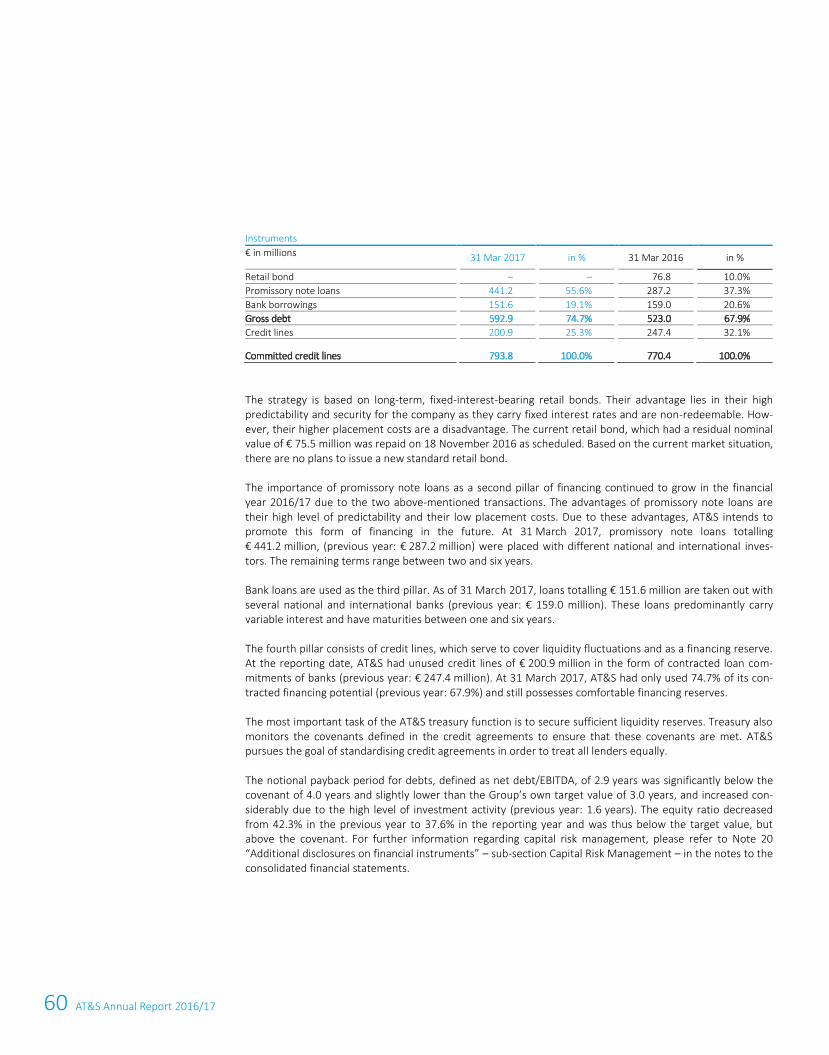
60 AT&S Annual Report 2016/17
Instruments € in millions
31 Mar 2017
in %
31 Mar 2016
in %
Retail bond –
–
76.8
10.0%
Promissory note loans 441.2
55.6%
287.2
37.3%
Bank borrowings 151.6
19.1%
159.0
20.6%
Gross debt 592.9
74.7%
523.0
67.9%
Credit lines 200.9
25.3%
247.4
32.1%
Committed credit lines 793.8
100.0%
770.4
100.0%
The strategy is based on long-term, fixed-interest-bearing retail bonds. Their advantage lies in their high predictability and security for the company as they carry fixed interest rates and are non-redeemable. How-ever, their higher placement costs are a disadvantage. The current retail bond, which had a residual nominal value of € 75.5 million was repaid on 18 November 2016 as scheduled. Based on the current market situation, there are no plans to issue a new standard retail bond.
The importance of promissory note loans as a second pillar of financing continued to grow in the financial year 2016/17 due to the two above-mentioned transactions. The advantages of promissory note loans are their high level of predictability and their low placement costs. Due to these advantages, AT&S intends to promote this form of financing in the future. At 31 March 2017, promissory note loans totalling € 441.2 million, (previous year: € 287.2 million) were placed with different national and international inves-tors. The remaining terms range between two and six years.
Bank loans are used as the third pillar. As of 31 March 2017, loans totalling € 151.6 million are taken out with several national and international banks (previous year: € 159.0 million). These loans predominantly carry variable interest and have maturities between one and six years.
The fourth pillar consists of credit lines, which serve to cover liquidity fluctuations and as a financing reserve. At the reporting date, AT&S had unused credit lines of € 200.9 million in the form of contracted loan com-mitments of banks (previous year: € 247.4 million). At 31 March 2017, AT&S had only used 74.7% of its con-tracted financing potential (previous year: 67.9%) and still possesses comfortable financing reserves.
The most important task of the AT&S treasury function is to secure sufficient liquidity reserves. Treasury also monitors the covenants defined in the credit agreements to ensure that these covenants are met. AT&S pursues the goal of standardising credit agreements in order to treat all lenders equally.
The notional payback period for debts, defined as net debt/EBITDA, of 2.9 years was significantly below the covenant of 4.0 years and slightly lower than the Group’s own target value of 3.0 years, and increased con-siderably due to the high level of investment activity (previous year: 1.6 years). The equity ratio decreased from 42.3% in the previous year to 37.6% in the reporting year and was thus below the target value, but above the covenant. For further information regarding capital risk management, please refer to Note 20 “Additional disclosures on financial instruments” – sub-section Capital Risk Management – in the notes to the consolidated financial statements.
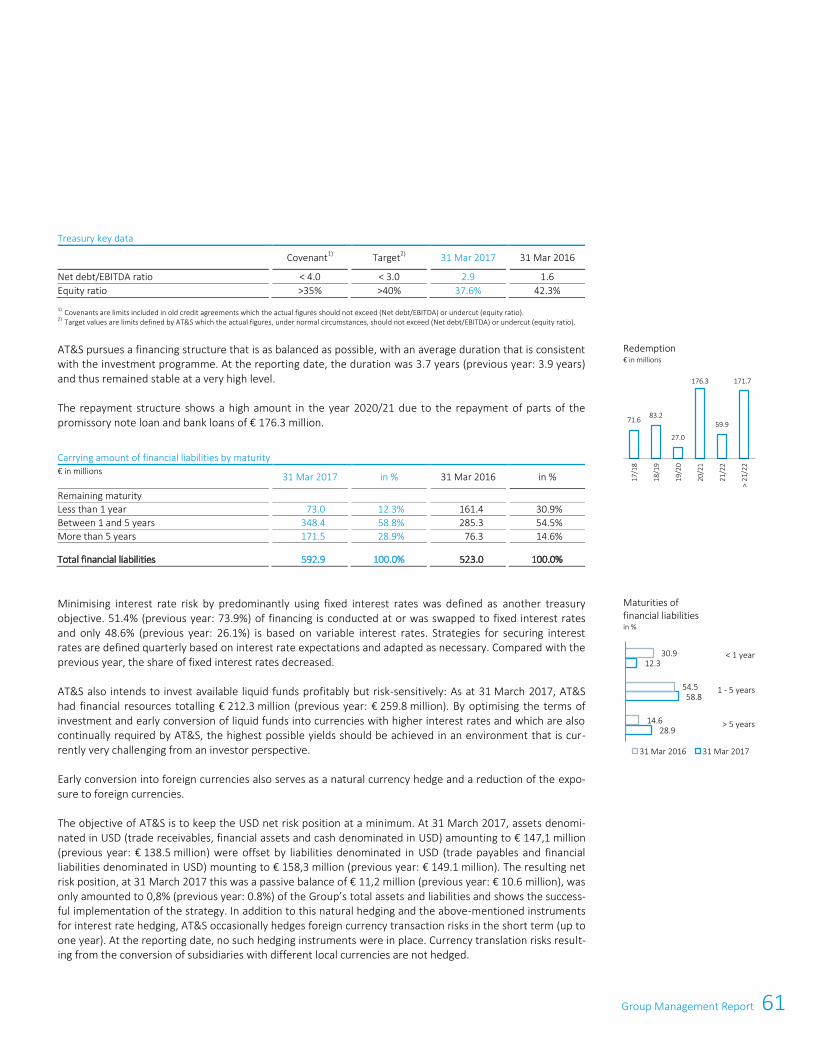
61Group Management Report
Instruments € in millions
31 Mar 2017
in %
31 Mar 2016
in %
Retail bond –
–
76.8
10.0%
Promissory note loans 441.2
55.6%
287.2
37.3%
Bank borrowings 151.6
19.1%
159.0
20.6%
Gross debt 592.9
74.7%
523.0
67.9%
Credit lines 200.9
25.3%
247.4
32.1%
Committed credit lines 793.8
100.0%
770.4
100.0%
The strategy is based on long-term, fixed-interest-bearing retail bonds. Their advantage lies in their high predictability and security for the company as they carry fixed interest rates and are non-redeemable. How-ever, their higher placement costs are a disadvantage. The current retail bond, which had a residual nominal value of € 75.5 million was repaid on 18 November 2016 as scheduled. Based on the current market situation, there are no plans to issue a new standard retail bond.
The importance of promissory note loans as a second pillar of financing continued to grow in the financial year 2016/17 due to the two above-mentioned transactions. The advantages of promissory note loans are their high level of predictability and their low placement costs. Due to these advantages, AT&S intends to promote this form of financing in the future. At 31 March 2017, promissory note loans totalling € 441.2 million, (previous year: € 287.2 million) were placed with different national and international inves-tors. The remaining terms range between two and six years.
Bank loans are used as the third pillar. As of 31 March 2017, loans totalling € 151.6 million are taken out with several national and international banks (previous year: € 159.0 million). These loans predominantly carry variable interest and have maturities between one and six years.
The fourth pillar consists of credit lines, which serve to cover liquidity fluctuations and as a financing reserve. At the reporting date, AT&S had unused credit lines of € 200.9 million in the form of contracted loan com-mitments of banks (previous year: € 247.4 million). At 31 March 2017, AT&S had only used 74.7% of its con-tracted financing potential (previous year: 67.9%) and still possesses comfortable financing reserves.
The most important task of the AT&S treasury function is to secure sufficient liquidity reserves. Treasury also monitors the covenants defined in the credit agreements to ensure that these covenants are met. AT&S pursues the goal of standardising credit agreements in order to treat all lenders equally.
The notional payback period for debts, defined as net debt/EBITDA, of 2.9 years was significantly below the covenant of 4.0 years and slightly lower than the Group’s own target value of 3.0 years, and increased con-siderably due to the high level of investment activity (previous year: 1.6 years). The equity ratio decreased from 42.3% in the previous year to 37.6% in the reporting year and was thus below the target value, but above the covenant. For further information regarding capital risk management, please refer to Note 20 “Additional disclosures on financial instruments” – sub-section Capital Risk Management – in the notes to the consolidated financial statements.
Treasury key data
Covenant1)
Target2)
31 Mar 2017
31 Mar 2016
Net debt/EBITDA ratio
< 4.0
< 3.0
2.9
1.6 Equity ratio
>35%
>40%
37.6%
42.3%
1) Covenants are limits included in old credit agreements which the actual figures should not exceed (Net debt/EBITDA) or undercut (equity ratio). 2) Target values are limits defined by AT&S which the actual figures, under normal circumstances, should not exceed (Net debt/EBITDA) or undercut (equity ratio).
AT&S pursues a financing structure that is as balanced as possible, with an average duration that is consistent with the investment programme. At the reporting date, the duration was 3.7 years (previous year: 3.9 years) and thus remained stable at a very high level.
The repayment structure shows a high amount in the year 2020/21 due to the repayment of parts of the promissory note loan and bank loans of € 176.3 million.
Carrying amount of financial liabilities by maturity € in millions
31 Mar 2017
in %
31 Mar 2016
in %
Remaining maturity
Less than 1 year 73.0
12.3%
161.4
30.9%
Between 1 and 5 years 348.4
58.8%
285.3
54.5%
More than 5 years 171.5
28.9%
76.3
14.6%
Total financial liabilities 592.9
100.0%
523.0
100.0%
Minimising interest rate risk by predominantly using fixed interest rates was defined as another treasury objective. 51.4% (previous year: 73.9%) of financing is conducted at or was swapped to fixed interest rates and only 48.6% (previous year: 26.1%) is based on variable interest rates. Strategies for securing interest rates are defined quarterly based on interest rate expectations and adapted as necessary. Compared with the previous year, the share of fixed interest rates decreased.
AT&S also intends to invest available liquid funds profitably but risk-sensitively: As at 31 March 2017, AT&S had financial resources totalling € 212.3 million (previous year: € 259.8 million). By optimising the terms of investment and early conversion of liquid funds into currencies with higher interest rates and which are also continually required by AT&S, the highest possible yields should be achieved in an environment that is cur-rently very challenging from an investor perspective.
Early conversion into foreign currencies also serves as a natural currency hedge and a reduction of the expo-sure to foreign currencies.
The objective of AT&S is to keep the USD net risk position at a minimum. At 31 March 2017, assets denomi-nated in USD (trade receivables, financial assets and cash denominated in USD) amounting to € 147,1 million (previous year: € 138.5 million) were offset by liabilities denominated in USD (trade payables and financial liabilities denominated in USD) mounting to € 158,3 million (previous year: € 149.1 million). The resulting net risk position, at 31 March 2017 this was a passive balance of € 11,2 million (previous year: € 10.6 million), was only amounted to 0,8% (previous year: 0.8%) of the Group’s total assets and liabilities and shows the success-ful implementation of the strategy. In addition to this natural hedging and the above-mentioned instruments for interest rate hedging, AT&S occasionally hedges foreign currency transaction risks in the short term (up to one year). At the reporting date, no such hedging instruments were in place. Currency translation risks result-ing from the conversion of subsidiaries with different local currencies are not hedged.
Redemption € in millions
Maturities of financial liabilities in %
171.7
59.9
176.3
27.0
83.271.6
> 21
/22
21/2
2
20/2
1
19/2
0
18/1
9
17/1
8
28.9
58.8
12.3
14.6
54.5
30.9
31 Mar 2016 31 Mar 2017
< 1 year
1 - 5 years
> 5 years
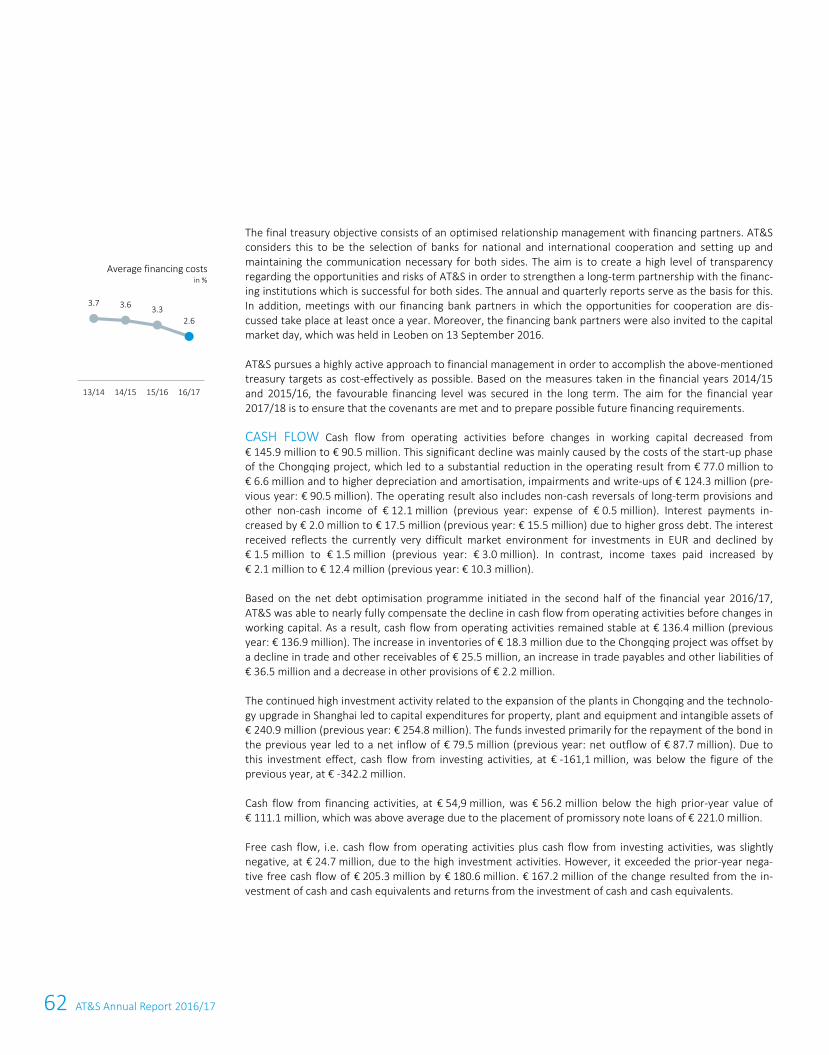
62 AT&S Annual Report 2016/17
44 AT&S Annual Report 2016/17
The final treasury objective consists of an optimised relationship management with financing partners. AT&S considers this to be the selection of banks for national and international cooperation and setting up and maintaining the communication necessary for both sides. The aim is to create a high level of transparency regarding the opportunities and risks of AT&S in order to strengthen a long-term partnership with the financ-ing institutions which is successful for both sides. The annual and quarterly reports serve as the basis for this. In addition, meetings with our financing bank partners in which the opportunities for cooperation are dis-cussed take place at least once a year. Moreover, the financing bank partners were also invited to the capital market day, which was held in Leoben on 13 September 2016.
AT&S pursues a highly active approach to financial management in order to accomplish the above-mentioned treasury targets as cost-effectively as possible. Based on the measures taken in the financial years 2014/15 and 2015/16, the favourable financing level was secured in the long term. The aim for the financial year 2017/18 is to ensure that the covenants are met and to prepare possible future financing requirements.
CASH FLOW Cash flow from operating activities before changes in working capital decreased from € 145.9 million to € 90.5 million. This significant decline was mainly caused by the costs of the start-up phase of the Chongqing project, which led to a substantial reduction in the operating result from € 77.0 million to € 6.6 million and to higher depreciation and amortisation, impairments and write-ups of € 124.3 million (pre-vious year: € 90.5 million). The operating result also includes non-cash reversals of long-term provisions and other non-cash income of € 12.1 million (previous year: expense of € 0.5 million). Interest payments in-creased by € 2.0 million to € 17.5 million (previous year: € 15.5 million) due to higher gross debt. The interest received reflects the currently very difficult market environment for investments in EUR and declined by € 1.5 million to € 1.5 million (previous year: € 3.0 million). In contrast, income taxes paid increased by € 2.1 million to € 12.4 million (previous year: € 10.3 million).
Based on the net debt optimisation programme initiated in the second half of the financial year 2016/17, AT&S was able to nearly fully compensate the decline in cash flow from operating activities before changes in working capital. As a result, cash flow from operating activities remained stable at € 136.4 million (previous year: € 136.9 million). The increase in inventories of € 18.3 million due to the Chongqing project was offset by a decline in trade and other receivables of € 25.5 million, an increase in trade payables and other liabilities of € 36.5 million and a decrease in other provisions of € 2.2 million.
The continued high investment activity related to the expansion of the plants in Chongqing and the technolo-gy upgrade in Shanghai led to capital expenditures for property, plant and equipment and intangible assets of € 240.9 million (previous year: € 254.8 million). The funds invested primarily for the repayment of the bond in the previous year led to a net inflow of € 79.5 million (previous year: net outflow of € 87.7 million). Due to this investment effect, cash flow from investing activities, at € -161,1 million, was below the figure of the previous year, at € -342.2 million.
Cash flow from financing activities, at € 54,9 million, was € 56.2 million below the high prior-year value of € 111.1 million, which was above average due to the placement of promissory note loans of € 221.0 million.
Free cash flow, i.e. cash flow from operating activities plus cash flow from investing activities, was slightly negative, at € 24.7 million, due to the high investment activities. However, it exceeded the prior-year nega-tive free cash flow of € 205.3 million by € 180.6 million. € 167.2 million of the change resulted from the in-vestment of cash and cash equivalents and returns from the investment of cash and cash equivalents.
Average financing costs in %
3.7 3.6 3.32.6
13/14 14/15 15/16 16/17
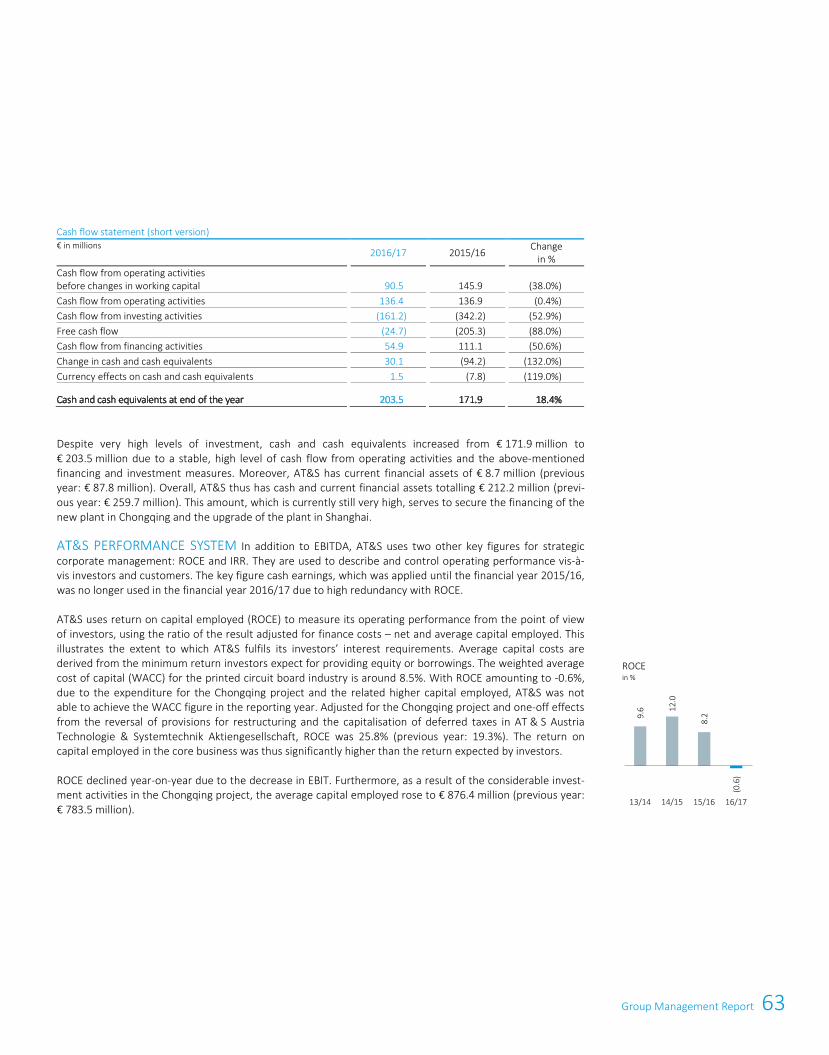
63Group Management Report
44 AT&S Annual Report 2016/17
The final treasury objective consists of an optimised relationship management with financing partners. AT&S considers this to be the selection of banks for national and international cooperation and setting up and maintaining the communication necessary for both sides. The aim is to create a high level of transparency regarding the opportunities and risks of AT&S in order to strengthen a long-term partnership with the financ-ing institutions which is successful for both sides. The annual and quarterly reports serve as the basis for this. In addition, meetings with our financing bank partners in which the opportunities for cooperation are dis-cussed take place at least once a year. Moreover, the financing bank partners were also invited to the capital market day, which was held in Leoben on 13 September 2016.
AT&S pursues a highly active approach to financial management in order to accomplish the above-mentioned treasury targets as cost-effectively as possible. Based on the measures taken in the financial years 2014/15 and 2015/16, the favourable financing level was secured in the long term. The aim for the financial year 2017/18 is to ensure that the covenants are met and to prepare possible future financing requirements.
CASH FLOW Cash flow from operating activities before changes in working capital decreased from € 145.9 million to € 90.5 million. This significant decline was mainly caused by the costs of the start-up phase of the Chongqing project, which led to a substantial reduction in the operating result from € 77.0 million to € 6.6 million and to higher depreciation and amortisation, impairments and write-ups of € 124.3 million (pre-vious year: € 90.5 million). The operating result also includes non-cash reversals of long-term provisions and other non-cash income of € 12.1 million (previous year: expense of € 0.5 million). Interest payments in-creased by € 2.0 million to € 17.5 million (previous year: € 15.5 million) due to higher gross debt. The interest received reflects the currently very difficult market environment for investments in EUR and declined by € 1.5 million to € 1.5 million (previous year: € 3.0 million). In contrast, income taxes paid increased by € 2.1 million to € 12.4 million (previous year: € 10.3 million).
Based on the net debt optimisation programme initiated in the second half of the financial year 2016/17, AT&S was able to nearly fully compensate the decline in cash flow from operating activities before changes in working capital. As a result, cash flow from operating activities remained stable at € 136.4 million (previous year: € 136.9 million). The increase in inventories of € 18.3 million due to the Chongqing project was offset by a decline in trade and other receivables of € 25.5 million, an increase in trade payables and other liabilities of € 36.5 million and a decrease in other provisions of € 2.2 million.
The continued high investment activity related to the expansion of the plants in Chongqing and the technolo-gy upgrade in Shanghai led to capital expenditures for property, plant and equipment and intangible assets of € 240.9 million (previous year: € 254.8 million). The funds invested primarily for the repayment of the bond in the previous year led to a net inflow of € 79.5 million (previous year: net outflow of € 87.7 million). Due to this investment effect, cash flow from investing activities, at € -161,1 million, was below the figure of the previous year, at € -342.2 million.
Cash flow from financing activities, at € 54,9 million, was € 56.2 million below the high prior-year value of € 111.1 million, which was above average due to the placement of promissory note loans of € 221.0 million.
Free cash flow, i.e. cash flow from operating activities plus cash flow from investing activities, was slightly negative, at € 24.7 million, due to the high investment activities. However, it exceeded the prior-year nega-tive free cash flow of € 205.3 million by € 180.6 million. € 167.2 million of the change resulted from the in-vestment of cash and cash equivalents and returns from the investment of cash and cash equivalents.
Average financing costs in %
3.7 3.6 3.32.6
13/14 14/15 15/16 16/17
Consolidated Financial Statements 45
Cash flow statement (short version) € in millions
2016/17 2015/16 Change
in % Cash flow from operating activities before changes in working capital
90.5
145.9
(38.0%)
Cash flow from operating activities 136.4
136.9
(0.4%)
Cash flow from investing activities (161.2)
(342.2)
(52.9%)
Free cash flow (24.7)
(205.3)
(88.0%)
Cash flow from financing activities 54.9
111.1
(50.6%)
Change in cash and cash equivalents 30.1
(94.2)
(132.0%)
Currency effects on cash and cash equivalents 1.5
(7.8)
(119.0%)
Cash and cash equivalents at end of the year 203.5
171.9
18.4%
Despite very high levels of investment, cash and cash equivalents increased from € 171.9 million to € 203.5 million due to a stable, high level of cash flow from operating activities and the above-mentioned financing and investment measures. Moreover, AT&S has current financial assets of € 8.7 million (previous year: € 87.8 million). Overall, AT&S thus has cash and current financial assets totalling € 212.2 million (previ-ous year: € 259.7 million). This amount, which is currently still very high, serves to secure the financing of the new plant in Chongqing and the upgrade of the plant in Shanghai.
AT&S PERFORMANCE SYSTEM In addition to EBITDA, AT&S uses two other key figures for strategic corporate management: ROCE and IRR. They are used to describe and control operating performance vis-à-vis investors and customers. The key figure cash earnings, which was applied until the financial year 2015/16, was no longer used in the financial year 2016/17 due to high redundancy with ROCE.
AT&S uses return on capital employed (ROCE) to measure its operating performance from the point of view of investors, using the ratio of the result adjusted for finance costs – net and average capital employed. This illustrates the extent to which AT&S fulfils its investors’ interest requirements. Average capital costs are derived from the minimum return investors expect for providing equity or borrowings. The weighted average cost of capital (WACC) for the printed circuit board industry is around 8.5%. With ROCE amounting to -0.6%, due to the expenditure for the Chongqing project and the related higher capital employed, AT&S was not able to achieve the WACC figure in the reporting year. Adjusted for the Chongqing project and one-off effects from the reversal of provisions for restructuring and the capitalisation of deferred taxes in AT & S Austria Technologie & Systemtechnik Aktiengesellschaft, ROCE was 25.8% (previous year: 19.3%). The return on capital employed in the core business was thus significantly higher than the return expected by investors.
ROCE declined year-on-year due to the decrease in EBIT. Furthermore, as a result of the considerable invest-ment activities in the Chongqing project, the average capital employed rose to € 876.4 million (previous year: € 783.5 million).
ROCE in %
9.6 12
.0
8.2
(0.6
)
13/14 14/15 15/16 16/17
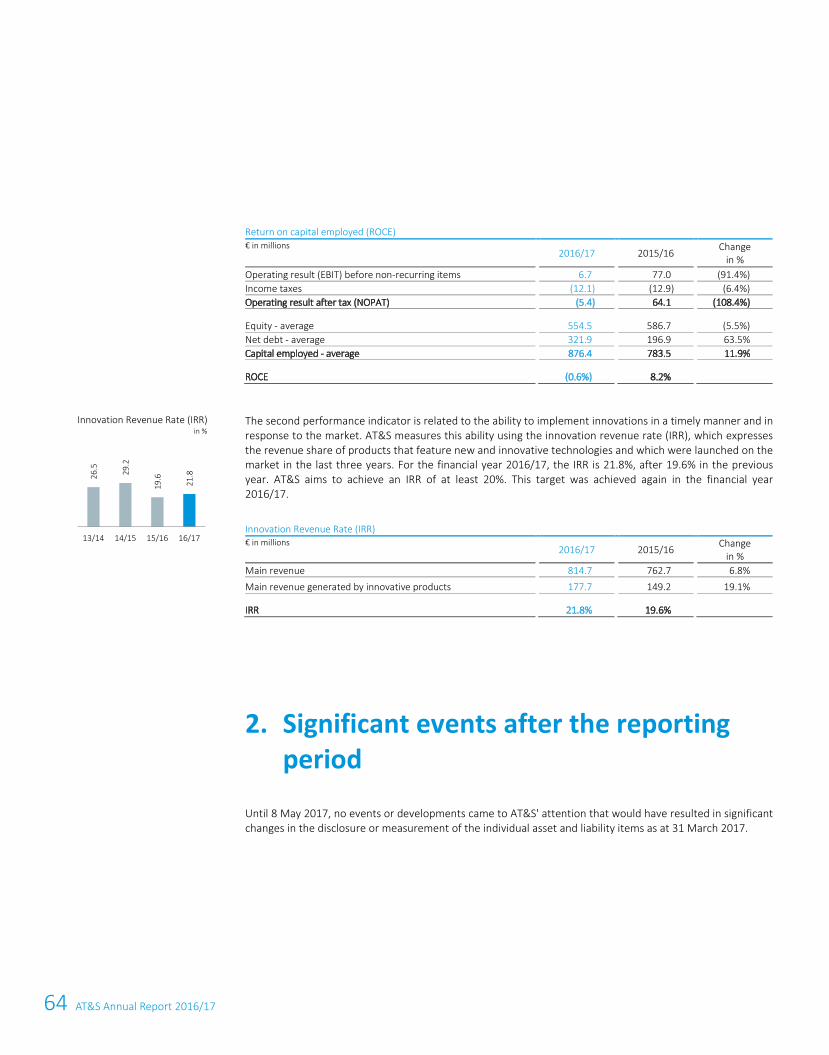
64 AT&S Annual Report 2016/17
46 AT&S Annual Report 2016/17
Return on capital employed (ROCE) € in millions
2016/17
2015/16
Change
in % Operating result (EBIT) before non-recurring items
6.7
77.0
(91.4%)
Income taxes (12.1)
(12.9)
(6.4%)
Operating result after tax (NOPAT) (5.4)
64.1
(108.4%)
Equity - average 554.5
586.7
(5.5%)
Net debt - average 321.9
196.9
63.5%
Capital employed - average 876.4
783.5
11.9%
ROCE (0.6%)
8.2%
The second performance indicator is related to the ability to implement innovations in a timely manner and in response to the market. AT&S measures this ability using the innovation revenue rate (IRR), which expresses the revenue share of products that feature new and innovative technologies and which were launched on the market in the last three years. For the financial year 2016/17, the IRR is 21.8%, after 19.6% in the previous year. AT&S aims to achieve an IRR of at least 20%. This target was achieved again in the financial year 2016/17.
Innovation Revenue Rate (IRR) € in millions
2016/17
2015/16
Change
in % Main revenue
814.7
762.7
6.8%
Main revenue generated by innovative products 177.7
149.2
19.1%
IRR 21.8%
19.6%
Significant events after the reporting 2.period
Until 8 May 2017, no events or developments came to AT&S' attention that would have resulted in significant changes in the disclosure or measurement of the individual asset and liability items as at 31 March 2017.
Innovation Revenue Rate (IRR) in %
26.5 29.2
19.6
21.8
13/14 14/15 15/16 16/17
65Group Management Report
46 AT&S Annual Report 2016/17
Return on capital employed (ROCE) € in millions
2016/17
2015/16
Change
in % Operating result (EBIT) before non-recurring items
6.7
77.0
(91.4%)
Income taxes (12.1)
(12.9)
(6.4%)
Operating result after tax (NOPAT) (5.4)
64.1
(108.4%)
Equity - average 554.5
586.7
(5.5%)
Net debt - average 321.9
196.9
63.5%
Capital employed - average 876.4
783.5
11.9%
ROCE (0.6%)
8.2%
The second performance indicator is related to the ability to implement innovations in a timely manner and in response to the market. AT&S measures this ability using the innovation revenue rate (IRR), which expresses the revenue share of products that feature new and innovative technologies and which were launched on the market in the last three years. For the financial year 2016/17, the IRR is 21.8%, after 19.6% in the previous year. AT&S aims to achieve an IRR of at least 20%. This target was achieved again in the financial year 2016/17.
Innovation Revenue Rate (IRR) € in millions
2016/17
2015/16
Change
in % Main revenue
814.7
762.7
6.8%
Main revenue generated by innovative products 177.7
149.2
19.1%
IRR 21.8%
19.6%
Significant events after the reporting 2.period
Until 8 May 2017, no events or developments came to AT&S' attention that would have resulted in significant changes in the disclosure or measurement of the individual asset and liability items as at 31 March 2017.
Innovation Revenue Rate (IRR) in %
26.5 29.2
19.6
21.8
13/14 14/15 15/16 16/17
Group Management Report 47
The AT&S Group currently operates six production plants, which specialise in different technologies.
LEOBEN AND FEHRING The Austrian plants primarily supply the European market and, increasingly, also the American market. In Europe, short lead times, special applications and customer proximity are par-ticularly important. The plant in Leoben continued along the path of niche and prototype production started in recent years. Products for the future market of Advanced Packaging are also manufactured in Leoben. In the financial year 2016/17, unused space was used for further technological improvements at the site. The plant in Fehring recorded positive development in the reporting year. A stronger focus on specific applica-tions and markets helped create synergies with other sites (Leoben and Nanjangud) and improve the product mix.
SHANGHAI The plant in Shanghai manufactures leading-edge HDI (high density interconnection) printed circuit boards in serial production for the Mobile Devices & Substrates segment for customers all over the world. Capacity utilisation was very good in the financial year 2016/17, and production continuously ran at the capacity limit for several months. In 2016/17, there was continued high demand for HDI printed circuit boards for the automotive industry, which were produced for the Automotive, Industrial, Medical segment. To secure the position as a technology leader, part of the plant was upgraded to the next technology genera-tion, starting in the third quarter of 2016/17. The upgrade will be completed in mid-2017.
CHONGQING At this new plant in China, AT&S is setting another technological milestone with the pro-duction of IC substrates (integrated circuit substrates). Following the successful certification in February 2016, the financial year 2016/17 was characterised by the launch of serial production which, however, could not be implemented at the expected speed. The second production line was successfully installed and serial production was launched in December 2016. Due to the drastic changes in the semiconductor industry, with associated technology delays, the prices and product mix do not meet expectations. The establishment of the second plant is proceeding according to plan. The ramp-up of serial production on the first line was carried out as scheduled and has already generated revenue. The second line is currently being installed and series production is expected to start in mid-2017.
ANSAN The very positive development of the site in Korea continued in the financial year 2016/17. In addi-tion to the good capacity utilisation in the medical sector for European and American customers, substantial quantities were manufactured for the Mobile Devices & Substrates segment.
NANJANGUD This site benefited from continuous high capacity utilisation, operational improvements and a better product mix in the financial year 2016/17, which led to very good revenue and earnings develop-ment.
HONG KONG The Hong Kong-based company AT&S Asia Pacific is the holding company for the Mobile Devices & Substrates segment – hence, for the Chinese plants and the allocated sales companies – and the headquarters of Group-wide procurement for this segment. The proximity to the CEMs of the customers and to suppliers is a locational advantage which business partners highly appreciate.
The sales companies in America, Germany, Japan and Taiwan continued to ensure good and close contact with customers in the financial year 2016/17.
Plants and branch offices 3.
Austria
China
China
South Korea
India
China
Sales companies
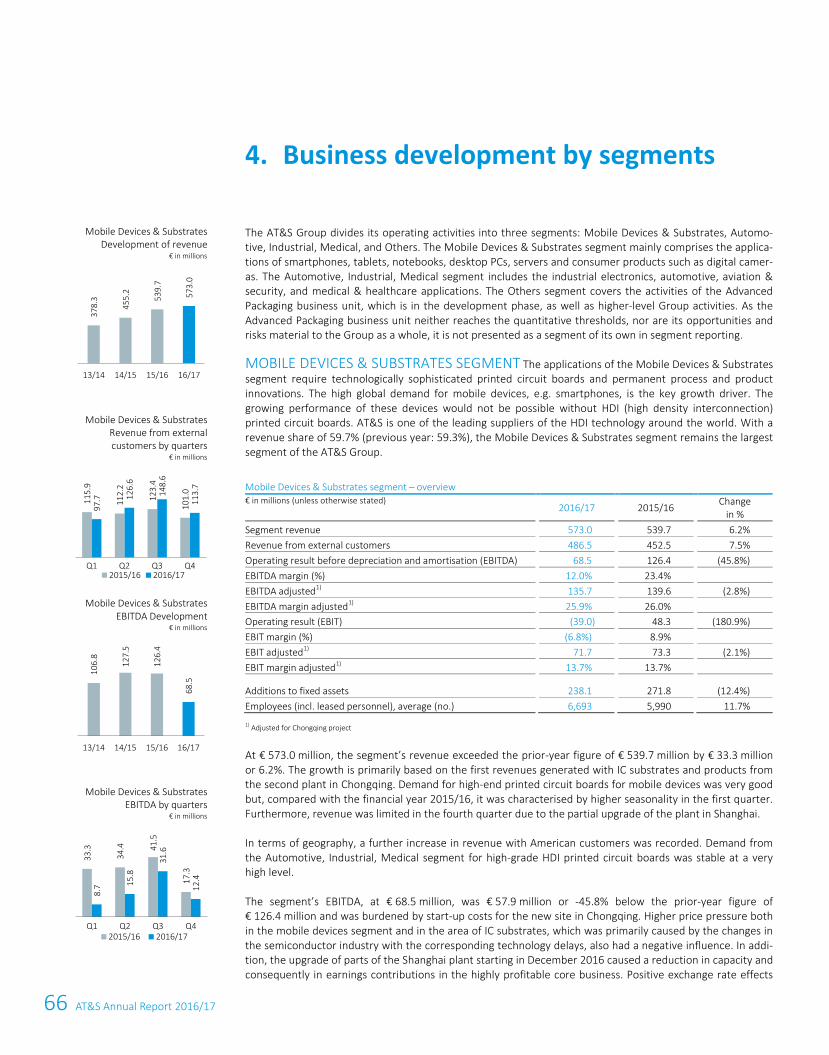
66 AT&S Annual Report 2016/17
48 AT&S Annual Report 2016/17
The AT&S Group divides its operating activities into three segments: Mobile Devices & Substrates, Automo-tive, Industrial, Medical, and Others. The Mobile Devices & Substrates segment mainly comprises the applica-tions of smartphones, tablets, notebooks, desktop PCs, servers and consumer products such as digital camer-as. The Automotive, Industrial, Medical segment includes the industrial electronics, automotive, aviation & security, and medical & healthcare applications. The Others segment covers the activities of the Advanced Packaging business unit, which is in the development phase, as well as higher-level Group activities. As the Advanced Packaging business unit neither reaches the quantitative thresholds, nor are its opportunities and risks material to the Group as a whole, it is not presented as a segment of its own in segment reporting.
MOBILE DEVICES & SUBSTRATES SEGMENT The applications of the Mobile Devices & Substrates segment require technologically sophisticated printed circuit boards and permanent process and product innovations. The high global demand for mobile devices, e.g. smartphones, is the key growth driver. The growing performance of these devices would not be possible without HDI (high density interconnection) printed circuit boards. AT&S is one of the leading suppliers of the HDI technology around the world. With a revenue share of 59.7% (previous year: 59.3%), the Mobile Devices & Substrates segment remains the largest segment of the AT&S Group.
Mobile Devices & Substrates segment – overview € in millions (unless otherwise stated)
2016/17
2015/16
Change in %
Segment revenue 573.0
539.7
6.2%
Revenue from external customers 486.5
452.5
7.5%
Operating result before depreciation and amortisation (EBITDA) 68.5
126.4
(45.8%)
EBITDA margin (%) 12.0%
23.4%
EBITDA adjusted
1) 135.7
139.6
(2.8%)
EBITDA margin adjusted
1) 25.9%
26.0%
Operating result (EBIT) (39.0)
48.3
(180.9%)
EBIT margin (%) (6.8%)
8.9%
EBIT adjusted
1) 71.7
73.3
(2.1%)
EBIT margin adjusted
1) 13.7%
13.7%
Additions to fixed assets 238.1
271.8
(12.4%)
Employees (incl. leased personnel), average (no.) 6,693
5,990
11.7%
1) Adjusted for Chongqing project
At € 573.0 million, the segment’s revenue exceeded the prior-year figure of € 539.7 million by € 33.3 million or 6.2%. The growth is primarily based on the first revenues generated with IC substrates and products from the second plant in Chongqing. Demand for high-end printed circuit boards for mobile devices was very good but, compared with the financial year 2015/16, it was characterised by higher seasonality in the first quarter. Furthermore, revenue was limited in the fourth quarter due to the partial upgrade of the plant in Shanghai.
In terms of geography, a further increase in revenue with American customers was recorded. Demand from the Automotive, Industrial, Medical segment for high-grade HDI printed circuit boards was stable at a very high level.
The segment’s EBITDA, at € 68.5 million, was € 57.9 million or -45.8% below the prior-year figure of € 126.4 million and was burdened by start-up costs for the new site in Chongqing. Higher price pressure both in the mobile devices segment and in the area of IC substrates, which was primarily caused by the changes in the semiconductor industry with the corresponding technology delays, also had a negative influence. In addi-tion, the upgrade of parts of the Shanghai plant starting in December 2016 caused a reduction in capacity and consequently in earnings contributions in the highly profitable core business. Positive exchange rate effects
Business development by segments 4.
Mobile Devices & Substrates Development of revenue
€ in millions
Mobile Devices & Substrates Revenue from external customers by quarters
€ in millions
Mobile Devices & Substrates EBITDA Development
€ in millions
Mobile Devices & Substrates EBITDA by quarters
€ in millions
378.
3
455.
2
539.
7
573.
0
13/14 14/15 15/16 16/17
115.
9
112.
2
123.
4
101.
0
97.7 12
6.6
148.
6
113.
7
Q1 Q2 Q3 Q42015/16 2016/17
106.
8
127.
5
126.
4
68.5
13/14 14/15 15/16 16/17
33.3
34.4 41
.5
17.3
8.7 15
.8
31.6
12.4
Q1 Q2 Q3 Q42015/16 2016/17
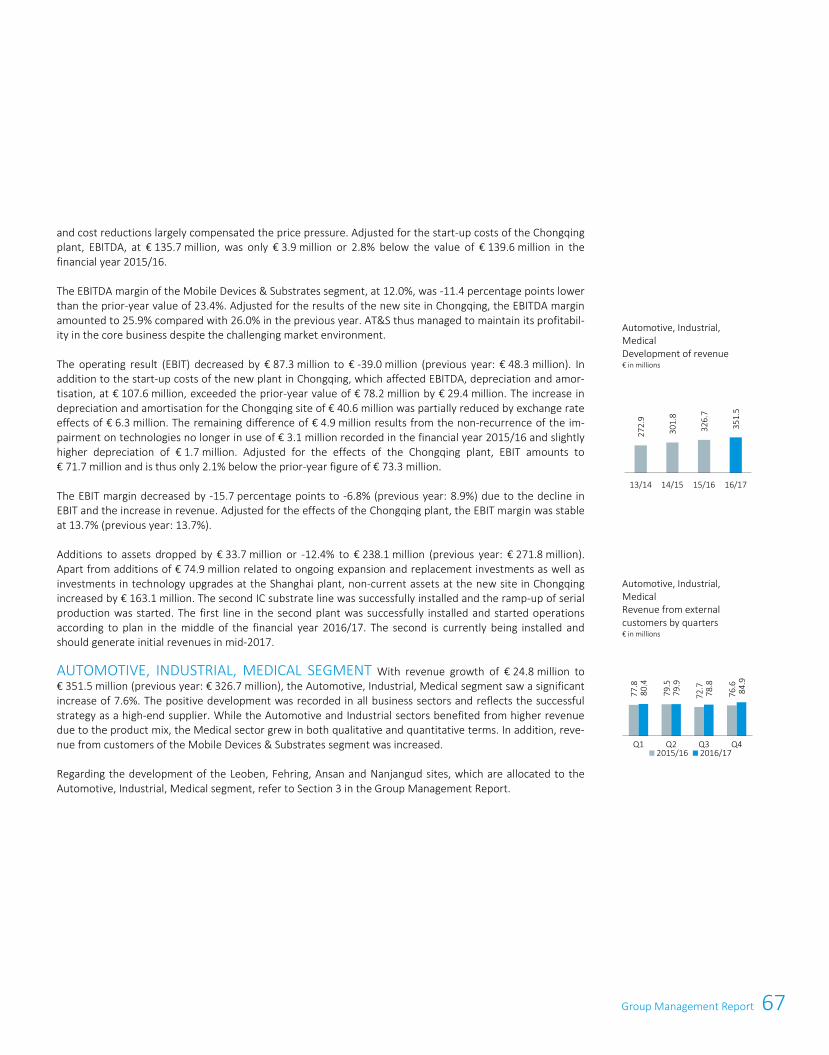
67Group Management Report
48 AT&S Annual Report 2016/17
The AT&S Group divides its operating activities into three segments: Mobile Devices & Substrates, Automo-tive, Industrial, Medical, and Others. The Mobile Devices & Substrates segment mainly comprises the applica-tions of smartphones, tablets, notebooks, desktop PCs, servers and consumer products such as digital camer-as. The Automotive, Industrial, Medical segment includes the industrial electronics, automotive, aviation & security, and medical & healthcare applications. The Others segment covers the activities of the Advanced Packaging business unit, which is in the development phase, as well as higher-level Group activities. As the Advanced Packaging business unit neither reaches the quantitative thresholds, nor are its opportunities and risks material to the Group as a whole, it is not presented as a segment of its own in segment reporting.
MOBILE DEVICES & SUBSTRATES SEGMENT The applications of the Mobile Devices & Substrates segment require technologically sophisticated printed circuit boards and permanent process and product innovations. The high global demand for mobile devices, e.g. smartphones, is the key growth driver. The growing performance of these devices would not be possible without HDI (high density interconnection) printed circuit boards. AT&S is one of the leading suppliers of the HDI technology around the world. With a revenue share of 59.7% (previous year: 59.3%), the Mobile Devices & Substrates segment remains the largest segment of the AT&S Group.
Mobile Devices & Substrates segment – overview € in millions (unless otherwise stated)
2016/17
2015/16
Change in %
Segment revenue 573.0
539.7
6.2%
Revenue from external customers 486.5
452.5
7.5%
Operating result before depreciation and amortisation (EBITDA) 68.5
126.4
(45.8%)
EBITDA margin (%) 12.0%
23.4%
EBITDA adjusted
1) 135.7
139.6
(2.8%)
EBITDA margin adjusted
1) 25.9%
26.0%
Operating result (EBIT) (39.0)
48.3
(180.9%)
EBIT margin (%) (6.8%)
8.9%
EBIT adjusted
1) 71.7
73.3
(2.1%)
EBIT margin adjusted
1) 13.7%
13.7%
Additions to fixed assets 238.1
271.8
(12.4%)
Employees (incl. leased personnel), average (no.) 6,693
5,990
11.7%
1) Adjusted for Chongqing project
At € 573.0 million, the segment’s revenue exceeded the prior-year figure of € 539.7 million by € 33.3 million or 6.2%. The growth is primarily based on the first revenues generated with IC substrates and products from the second plant in Chongqing. Demand for high-end printed circuit boards for mobile devices was very good but, compared with the financial year 2015/16, it was characterised by higher seasonality in the first quarter. Furthermore, revenue was limited in the fourth quarter due to the partial upgrade of the plant in Shanghai.
In terms of geography, a further increase in revenue with American customers was recorded. Demand from the Automotive, Industrial, Medical segment for high-grade HDI printed circuit boards was stable at a very high level.
The segment’s EBITDA, at € 68.5 million, was € 57.9 million or -45.8% below the prior-year figure of € 126.4 million and was burdened by start-up costs for the new site in Chongqing. Higher price pressure both in the mobile devices segment and in the area of IC substrates, which was primarily caused by the changes in the semiconductor industry with the corresponding technology delays, also had a negative influence. In addi-tion, the upgrade of parts of the Shanghai plant starting in December 2016 caused a reduction in capacity and consequently in earnings contributions in the highly profitable core business. Positive exchange rate effects
Business development by segments 4.
Mobile Devices & Substrates Development of revenue
€ in millions
Mobile Devices & Substrates Revenue from external customers by quarters
€ in millions
Mobile Devices & Substrates EBITDA Development
€ in millions
Mobile Devices & Substrates EBITDA by quarters
€ in millions
378.
3
455.
2
539.
7
573.
0
13/14 14/15 15/16 16/17
115.
9
112.
2
123.
4
101.
0
97.7 12
6.6
148.
6
113.
7
Q1 Q2 Q3 Q42015/16 2016/17
106.
8
127.
5
126.
4
68.5
13/14 14/15 15/16 16/17
33.3
34.4 41
.5
17.3
8.7 15
.8
31.6
12.4
Q1 Q2 Q3 Q42015/16 2016/17
Group Management Report 49
and cost reductions largely compensated the price pressure. Adjusted for the start-up costs of the Chongqing plant, EBITDA, at € 135.7 million, was only € 3.9 million or 2.8% below the value of € 139.6 million in the financial year 2015/16.
The EBITDA margin of the Mobile Devices & Substrates segment, at 12.0%, was -11.4 percentage points lower than the prior-year value of 23.4%. Adjusted for the results of the new site in Chongqing, the EBITDA margin amounted to 25.9% compared with 26.0% in the previous year. AT&S thus managed to maintain its profitabil-ity in the core business despite the challenging market environment.
The operating result (EBIT) decreased by € 87.3 million to € -39.0 million (previous year: € 48.3 million). In addition to the start-up costs of the new plant in Chongqing, which affected EBITDA, depreciation and amor-tisation, at € 107.6 million, exceeded the prior-year value of € 78.2 million by € 29.4 million. The increase in depreciation and amortisation for the Chongqing site of € 40.6 million was partially reduced by exchange rate effects of € 6.3 million. The remaining difference of € 4.9 million results from the non-recurrence of the im-pairment on technologies no longer in use of € 3.1 million recorded in the financial year 2015/16 and slightly higher depreciation of € 1.7 million. Adjusted for the effects of the Chongqing plant, EBIT amounts to € 71.7 million and is thus only 2.1% below the prior-year figure of € 73.3 million.
The EBIT margin decreased by -15.7 percentage points to -6.8% (previous year: 8.9%) due to the decline in EBIT and the increase in revenue. Adjusted for the effects of the Chongqing plant, the EBIT margin was stable at 13.7% (previous year: 13.7%).
Additions to assets dropped by € 33.7 million or -12.4% to € 238.1 million (previous year: € 271.8 million). Apart from additions of € 74.9 million related to ongoing expansion and replacement investments as well as investments in technology upgrades at the Shanghai plant, non-current assets at the new site in Chongqing increased by € 163.1 million. The second IC substrate line was successfully installed and the ramp-up of serial production was started. The first line in the second plant was successfully installed and started operations according to plan in the middle of the financial year 2016/17. The second is currently being installed and should generate initial revenues in mid-2017.
AUTOMOTIVE, INDUSTRIAL, MEDICAL SEGMENT With revenue growth of € 24.8 million to € 351.5 million (previous year: € 326.7 million), the Automotive, Industrial, Medical segment saw a significant increase of 7.6%. The positive development was recorded in all business sectors and reflects the successful strategy as a high-end supplier. While the Automotive and Industrial sectors benefited from higher revenue due to the product mix, the Medical sector grew in both qualitative and quantitative terms. In addition, reve-nue from customers of the Mobile Devices & Substrates segment was increased.
Regarding the development of the Leoben, Fehring, Ansan and Nanjangud sites, which are allocated to the Automotive, Industrial, Medical segment, refer to Section 3 in the Group Management Report.
Automotive, Industrial, Medical Development of revenue € in millions
Automotive, Industrial, Medical Revenue from external customers by quarters € in millions
272.
9
301.
8
326.
7
351.
5
13/14 14/15 15/16 16/17
77.8
79.5
72.7
76.6
80.4
79.9
78.8
84.9
Q1 Q2 Q3 Q42015/16 2016/17
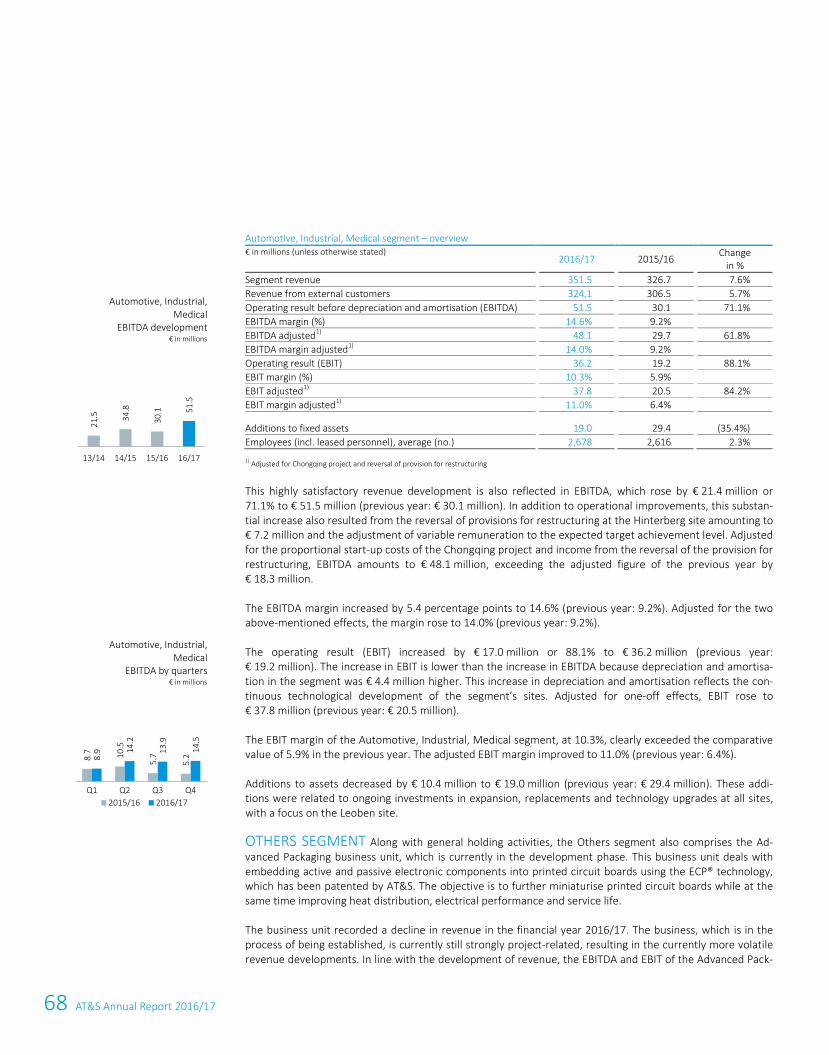
68 AT&S Annual Report 2016/17
50 AT&S Annual Report 2016/17
Automotive, Industrial, Medical segment – overview € in millions (unless otherwise stated)
2016/17 2015/16 Change
in % Segment revenue
351.5
326.7
7.6%
Revenue from external customers 324.1
306.5
5.7%
Operating result before depreciation and amortisation (EBITDA) 51.5
30.1
71.1%
EBITDA margin (%) 14.6%
9.2%
EBITDA adjusted
1) 48.1
29.7
61.8%
EBITDA margin adjusted
1) 14.0%
9.2%
Operating result (EBIT) 36.2
19.2
88.1%
EBIT margin (%) 10.3%
5.9%
EBIT adjusted
1) 37.8
20.5
84.2%
EBIT margin adjusted
1) 11.0%
6.4%
Additions to fixed assets 19.0
29.4
(35.4%)
Employees (incl. leased personnel), average (no.) 2,678
2,616
2.3%
1) Adjusted for Chongqing project and reversal of provision for restructuring
This highly satisfactory revenue development is also reflected in EBITDA, which rose by € 21.4 million or 71.1% to € 51.5 million (previous year: € 30.1 million). In addition to operational improvements, this substan-tial increase also resulted from the reversal of provisions for restructuring at the Hinterberg site amounting to € 7.2 million and the adjustment of variable remuneration to the expected target achievement level. Adjusted for the proportional start-up costs of the Chongqing project and income from the reversal of the provision for restructuring, EBITDA amounts to € 48.1 million, exceeding the adjusted figure of the previous year by € 18.3 million.
The EBITDA margin increased by 5.4 percentage points to 14.6% (previous year: 9.2%). Adjusted for the two above-mentioned effects, the margin rose to 14.0% (previous year: 9.2%).
The operating result (EBIT) increased by € 17.0 million or 88.1% to € 36.2 million (previous year: € 19.2 million). The increase in EBIT is lower than the increase in EBITDA because depreciation and amortisa-tion in the segment was € 4.4 million higher. This increase in depreciation and amortisation reflects the con-tinuous technological development of the segment’s sites. Adjusted for one-off effects, EBIT rose to € 37.8 million (previous year: € 20.5 million).
The EBIT margin of the Automotive, Industrial, Medical segment, at 10.3%, clearly exceeded the comparative value of 5.9% in the previous year. The adjusted EBIT margin improved to 11.0% (previous year: 6.4%).
Additions to assets decreased by € 10.4 million to € 19.0 million (previous year: € 29.4 million). These addi-tions were related to ongoing investments in expansion, replacements and technology upgrades at all sites, with a focus on the Leoben site.
OTHERS SEGMENT Along with general holding activities, the Others segment also comprises the Ad-vanced Packaging business unit, which is currently in the development phase. This business unit deals with embedding active and passive electronic components into printed circuit boards using the ECP® technology, which has been patented by AT&S. The objective is to further miniaturise printed circuit boards while at the same time improving heat distribution, electrical performance and service life.
The business unit recorded a decline in revenue in the financial year 2016/17. The business, which is in the process of being established, is currently still strongly project-related, resulting in the currently more volatile revenue developments. In line with the development of revenue, the EBITDA and EBIT of the Advanced Pack-
Automotive, Industrial, Medical
EBITDA development € in millions
Automotive, Industrial, Medical
EBITDA by quarters € in millions
21.5 34
.8
30.1 51
.5
13/14 14/15 15/16 16/17
8.7 10
.5
5.7
5.28.
9 14.2
13.9
14.5
Q1 Q2 Q3 Q42015/16 2016/17
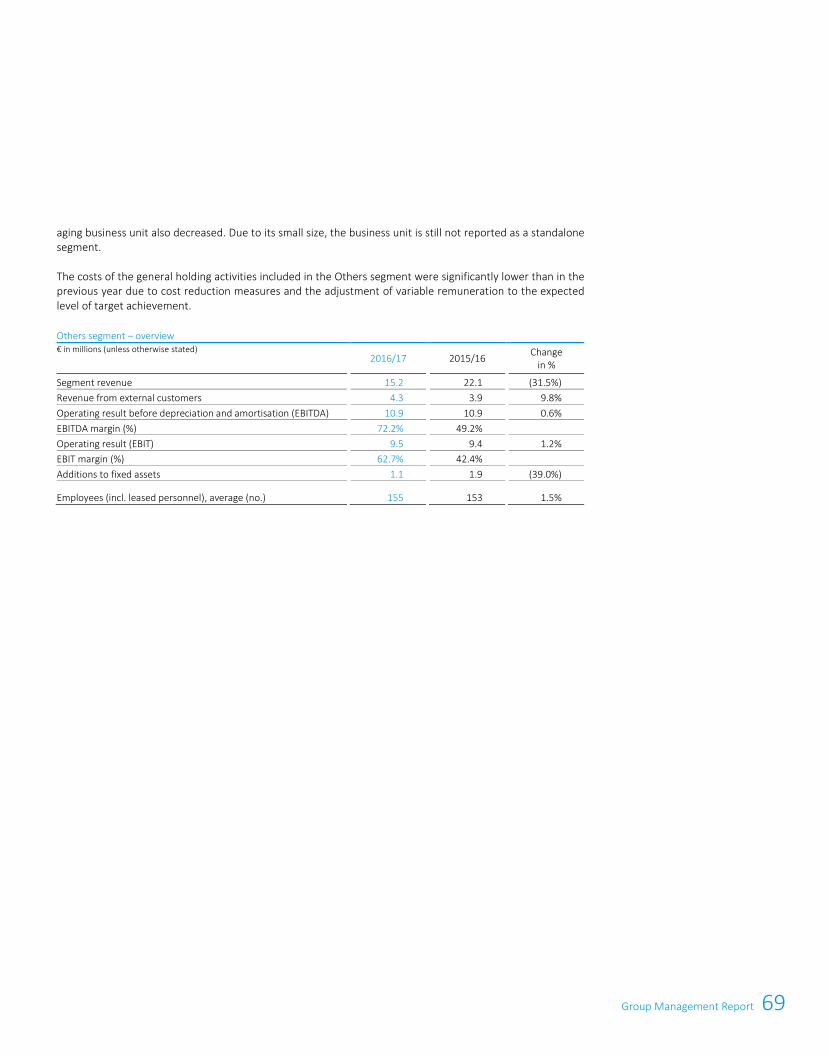
69Group Management Report
50 AT&S Annual Report 2016/17
Automotive, Industrial, Medical segment – overview € in millions (unless otherwise stated)
2016/17 2015/16 Change
in % Segment revenue
351.5
326.7
7.6%
Revenue from external customers 324.1
306.5
5.7%
Operating result before depreciation and amortisation (EBITDA) 51.5
30.1
71.1%
EBITDA margin (%) 14.6%
9.2%
EBITDA adjusted
1) 48.1
29.7
61.8%
EBITDA margin adjusted
1) 14.0%
9.2%
Operating result (EBIT) 36.2
19.2
88.1%
EBIT margin (%) 10.3%
5.9%
EBIT adjusted
1) 37.8
20.5
84.2%
EBIT margin adjusted
1) 11.0%
6.4%
Additions to fixed assets 19.0
29.4
(35.4%)
Employees (incl. leased personnel), average (no.) 2,678
2,616
2.3%
1) Adjusted for Chongqing project and reversal of provision for restructuring
This highly satisfactory revenue development is also reflected in EBITDA, which rose by € 21.4 million or 71.1% to € 51.5 million (previous year: € 30.1 million). In addition to operational improvements, this substan-tial increase also resulted from the reversal of provisions for restructuring at the Hinterberg site amounting to € 7.2 million and the adjustment of variable remuneration to the expected target achievement level. Adjusted for the proportional start-up costs of the Chongqing project and income from the reversal of the provision for restructuring, EBITDA amounts to € 48.1 million, exceeding the adjusted figure of the previous year by € 18.3 million.
The EBITDA margin increased by 5.4 percentage points to 14.6% (previous year: 9.2%). Adjusted for the two above-mentioned effects, the margin rose to 14.0% (previous year: 9.2%).
The operating result (EBIT) increased by € 17.0 million or 88.1% to € 36.2 million (previous year: € 19.2 million). The increase in EBIT is lower than the increase in EBITDA because depreciation and amortisa-tion in the segment was € 4.4 million higher. This increase in depreciation and amortisation reflects the con-tinuous technological development of the segment’s sites. Adjusted for one-off effects, EBIT rose to € 37.8 million (previous year: € 20.5 million).
The EBIT margin of the Automotive, Industrial, Medical segment, at 10.3%, clearly exceeded the comparative value of 5.9% in the previous year. The adjusted EBIT margin improved to 11.0% (previous year: 6.4%).
Additions to assets decreased by € 10.4 million to € 19.0 million (previous year: € 29.4 million). These addi-tions were related to ongoing investments in expansion, replacements and technology upgrades at all sites, with a focus on the Leoben site.
OTHERS SEGMENT Along with general holding activities, the Others segment also comprises the Ad-vanced Packaging business unit, which is currently in the development phase. This business unit deals with embedding active and passive electronic components into printed circuit boards using the ECP® technology, which has been patented by AT&S. The objective is to further miniaturise printed circuit boards while at the same time improving heat distribution, electrical performance and service life.
The business unit recorded a decline in revenue in the financial year 2016/17. The business, which is in the process of being established, is currently still strongly project-related, resulting in the currently more volatile revenue developments. In line with the development of revenue, the EBITDA and EBIT of the Advanced Pack-
Automotive, Industrial, Medical
EBITDA development € in millions
Automotive, Industrial, Medical
EBITDA by quarters € in millions
21.5 34
.8
30.1 51
.5
13/14 14/15 15/16 16/17
8.7 10
.5
5.7
5.28.
9 14.2
13.9
14.5
Q1 Q2 Q3 Q42015/16 2016/17
Group Management Report 51
aging business unit also decreased. Due to its small size, the business unit is still not reported as a standalone segment.
The costs of the general holding activities included in the Others segment were significantly lower than in the previous year due to cost reduction measures and the adjustment of variable remuneration to the expected level of target achievement.
Others segment – overview € in millions (unless otherwise stated)
2016/17
2015/16
Change
in %
Segment revenue 15.2
22.1
(31.5%)
Revenue from external customers 4.3
3.9
9.8%
Operating result before depreciation and amortisation (EBITDA) 10.9
10.9
0.6%
EBITDA margin (%) 72.2%
49.2%
Operating result (EBIT) 9.5
9.4
1.2%
EBIT margin (%) 62.7%
42.4%
Additions to fixed assets 1.1
1.9
(39.0%)
Employees (incl. leased personnel), average (no.) 155
153
1.5%
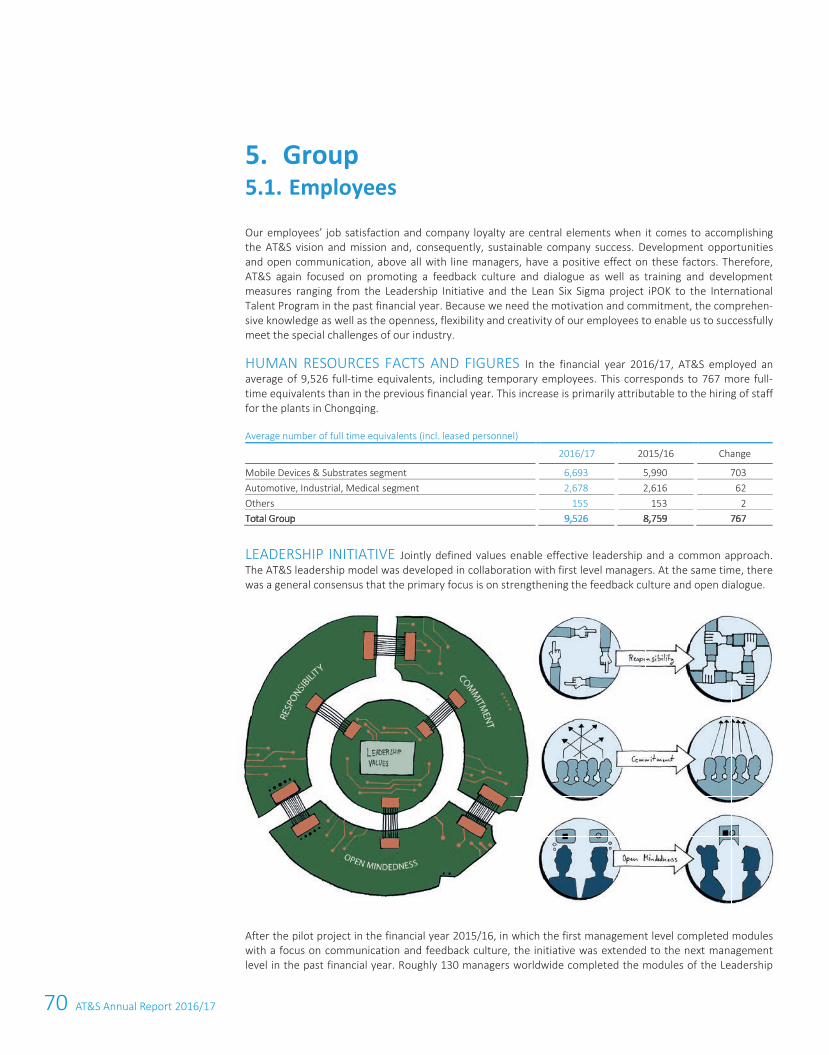
70 AT&S Annual Report 2016/17
52 AT&S Annual Report 2016/17
Our employees’ job satisfaction and company loyalty are central elements when it comes to accomplishing the AT&S vision and mission and, consequently, sustainable company success. Development opportunities and open communication, above all with line managers, have a positive effect on these factors. Therefore, AT&S again focused on promoting a feedback culture and dialogue as well as training and development measures ranging from the Leadership Initiative and the Lean Six Sigma project iPOK to the International Talent Program in the past financial year. Because we need the motivation and commitment, the comprehen-sive knowledge as well as the openness, flexibility and creativity of our employees to enable us to successfully meet the special challenges of our industry.
HUMAN RESOURCES FACTS AND FIGURES In the financial year 2016/17, AT&S employed an average of 9,526 full-time equivalents, including temporary employees. This corresponds to 767 more full-time equivalents than in the previous financial year. This increase is primarily attributable to the hiring of staff for the plants in Chongqing.
Average number of full time equivalents (incl. leased personnel)
2016/17
2015/16
Change
Mobile Devices & Substrates segment 6,693
5,990
703
Automotive, Industrial, Medical segment 2,678
2,616
62
Others 155
153
2
Total Group 9,526
8,759
767
LEADERSHIP INITIATIVE Jointly defined values enable effective leadership and a common approach. The AT&S leadership model was developed in collaboration with first level managers. At the same time, there was a general consensus that the primary focus is on strengthening the feedback culture and open dialogue.
After the pilot project in the financial year 2015/16, in which the first management level completed modules with a focus on communication and feedback culture, the initiative was extended to the next management level in the past financial year. Roughly 130 managers worldwide completed the modules of the Leadership
Group 5.5.1. Employees
71Group Management Report
52 AT&S Annual Report 2016/17
Our employees’ job satisfaction and company loyalty are central elements when it comes to accomplishing the AT&S vision and mission and, consequently, sustainable company success. Development opportunities and open communication, above all with line managers, have a positive effect on these factors. Therefore, AT&S again focused on promoting a feedback culture and dialogue as well as training and development measures ranging from the Leadership Initiative and the Lean Six Sigma project iPOK to the International Talent Program in the past financial year. Because we need the motivation and commitment, the comprehen-sive knowledge as well as the openness, flexibility and creativity of our employees to enable us to successfully meet the special challenges of our industry.
HUMAN RESOURCES FACTS AND FIGURES In the financial year 2016/17, AT&S employed an average of 9,526 full-time equivalents, including temporary employees. This corresponds to 767 more full-time equivalents than in the previous financial year. This increase is primarily attributable to the hiring of staff for the plants in Chongqing.
Average number of full time equivalents (incl. leased personnel)
2016/17
2015/16
Change
Mobile Devices & Substrates segment 6,693
5,990
703
Automotive, Industrial, Medical segment 2,678
2,616
62
Others 155
153
2
Total Group 9,526
8,759
767
LEADERSHIP INITIATIVE Jointly defined values enable effective leadership and a common approach. The AT&S leadership model was developed in collaboration with first level managers. At the same time, there was a general consensus that the primary focus is on strengthening the feedback culture and open dialogue.
After the pilot project in the financial year 2015/16, in which the first management level completed modules with a focus on communication and feedback culture, the initiative was extended to the next management level in the past financial year. Roughly 130 managers worldwide completed the modules of the Leadership
Group 5.5.1. Employees
Group Management Report 53
Initiative in the past financial year. The feedback was positive throughout and further measures are currently being planned for the financial year 2017/18.
SUPPORT AND CHALLENGE Systematically supporting and challenging employees is a central ele-ment of effective leadership. Therefore, the annual appraisal interview has been revised in line with the Leadership Initiative. The redesign of the staff appraisal meeting was defined jointly with managers and em-ployees from different sites worldwide. The heads of the business units and the group functions were closely involved in the form of a steering committee.
This new design also aims at strengthening the communication and feedback culture within the organisation and at offering growth and development opportunities, thus increasing employee engagement and retention. Moreover, the appraisal interview serves to derive individual goals from company goals in order to ensure that our vision, mission and objectives are not only understood but also implemented. Bonus systems will offer additional incentives. The appraisal and development interviews will be held separately and at different times, with the aim of placing a stronger focus on growth and development potential. In addition, the devel-opment interview will offer an opportunity to compare the self-image and external image and to reflect on the differences in an open dialogue.
In the past financial year, our employees once again had the opportunity to attend specific training and de-velopment programmes in the framework of individual, site-specific training catalogues and in consultation with their managers. The wide variety ranges from training focusing on technology and quality-relevant topics to IT topics, project management, creativity techniques to intercultural training, language courses, soft skills, leadership and sustainability. Moreover, as part of the onboarding process, we offer basic training in order to give new AT&S employees an overview of the market, our products, structures and procedures at AT&S and to familiarise them with the values of the company.
LEAN SIX SIGMA The combination of Lean Management and Six Sigma is a method for the systematic improvement of processes. While Lean Management focuses on minimising non-value adding processes (efficiency), Six Sigma concentrates on the continuous reduction of errors (effectiveness).
The iPOK (Implementation of Practice Orientated Knowledge) initiative contributes to implementing the AT&S vision and mission through efficiency and effectiveness enhancements as well as the internal training struc-ture and the related knowledge and information transfer between employees, departments and plants. The training consists of a theoretical and a practical part in order to establish the theoretical knowledge in the organisation in the long term. Since the project started, our employees completed 77 “Black Belt” und 133 “Green Belt” training courses or were still undergoing training at the end of the financial year. 160 Lean Six Sigma projects were launched in the scope of these certifications and training courses.
AT&S offers comprehensive apprentice training for the specialists of tomorrow, especially in the areas of mechatronics, laboratory technology, physics laboratory, process technology, mechanical engineering and metal technology, but also in the administrative area. At the end of the financial year, AT&S employed 33 apprentices in Austria and one in Germany, of whom 15 apprentices started their training with AT&S in the past financial year. Our objective is to get young people of different educational levels excited about profes-sions in the areas of technology, economics and IT at AT&S – either by offering introduction courses and summer internships, or at job and career fairs. By the end of the financial year 2016/17, 11 young university graduates completed our “International Talent Program”; another two will complete their training at our Austrian sites within the financial year 2017/18. This training in eight modules is carried out over a period of 12 to 18 months and prepares colleagues for their tasks at our sites in China and India. At present, we are hiring more international talents, primarily for the plants in Shanghai and Chongqing. The huge international interest in this programme was reflected by around 1,700 applications from more than 60 countries.
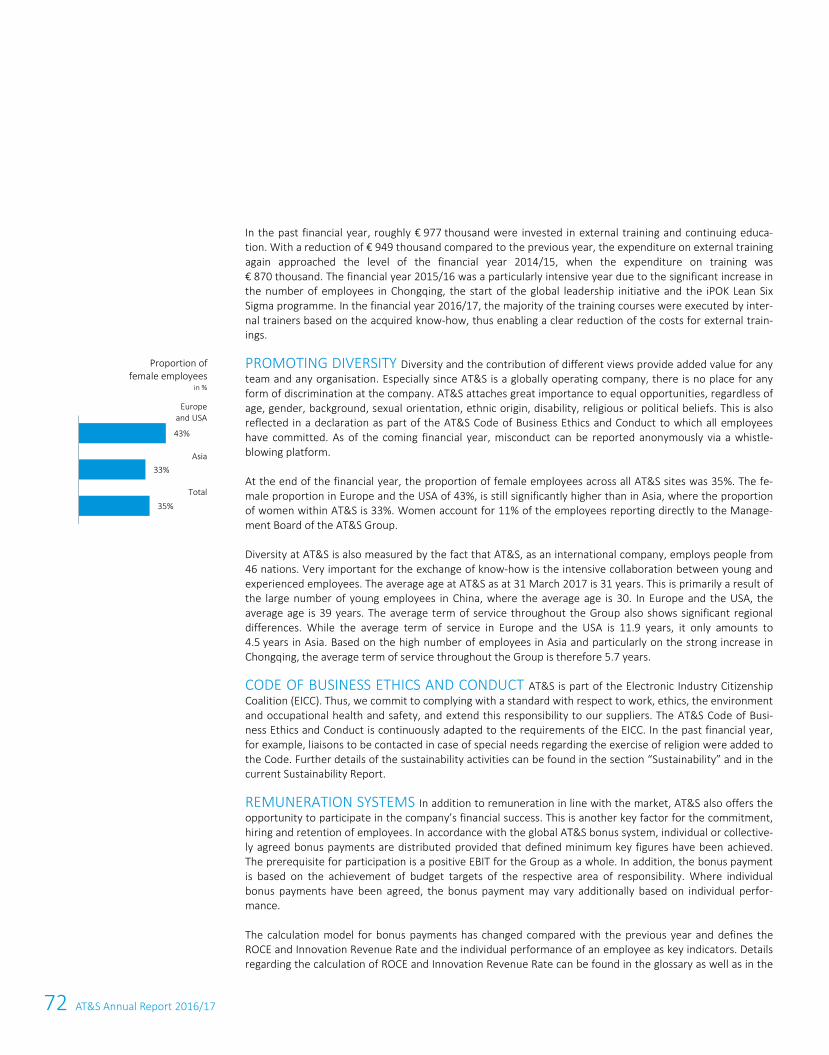
72 AT&S Annual Report 2016/17
54 AT&S Annual Report 2016/17
In the past financial year, roughly € 977 thousand were invested in external training and continuing educa-tion. With a reduction of € 949 thousand compared to the previous year, the expenditure on external training again approached the level of the financial year 2014/15, when the expenditure on training was € 870 thousand. The financial year 2015/16 was a particularly intensive year due to the significant increase in the number of employees in Chongqing, the start of the global leadership initiative and the iPOK Lean Six Sigma programme. In the financial year 2016/17, the majority of the training courses were executed by inter-nal trainers based on the acquired know-how, thus enabling a clear reduction of the costs for external train-ings.
PROMOTING DIVERSITY Diversity and the contribution of different views provide added value for any team and any organisation. Especially since AT&S is a globally operating company, there is no place for any form of discrimination at the company. AT&S attaches great importance to equal opportunities, regardless of age, gender, background, sexual orientation, ethnic origin, disability, religious or political beliefs. This is also reflected in a declaration as part of the AT&S Code of Business Ethics and Conduct to which all employees have committed. As of the coming financial year, misconduct can be reported anonymously via a whistle-blowing platform.
At the end of the financial year, the proportion of female employees across all AT&S sites was 35%. The fe-male proportion in Europe and the USA of 43%, is still significantly higher than in Asia, where the proportion of women within AT&S is 33%. Women account for 11% of the employees reporting directly to the Manage-ment Board of the AT&S Group.
Diversity at AT&S is also measured by the fact that AT&S, as an international company, employs people from 46 nations. Very important for the exchange of know-how is the intensive collaboration between young and experienced employees. The average age at AT&S as at 31 March 2017 is 31 years. This is primarily a result of the large number of young employees in China, where the average age is 30. In Europe and the USA, the average age is 39 years. The average term of service throughout the Group also shows significant regional differences. While the average term of service in Europe and the USA is 11.9 years, it only amounts to 4.5 years in Asia. Based on the high number of employees in Asia and particularly on the strong increase in Chongqing, the average term of service throughout the Group is therefore 5.7 years.
CODE OF BUSINESS ETHICS AND CONDUCT AT&S is part of the Electronic Industry Citizenship Coalition (EICC). Thus, we commit to complying with a standard with respect to work, ethics, the environment and occupational health and safety, and extend this responsibility to our suppliers. The AT&S Code of Busi-ness Ethics and Conduct is continuously adapted to the requirements of the EICC. In the past financial year, for example, liaisons to be contacted in case of special needs regarding the exercise of religion were added to the Code. Further details of the sustainability activities can be found in the section “Sustainability” and in the current Sustainability Report.
REMUNERATION SYSTEMS In addition to remuneration in line with the market, AT&S also offers the opportunity to participate in the company’s financial success. This is another key factor for the commitment, hiring and retention of employees. In accordance with the global AT&S bonus system, individual or collective-ly agreed bonus payments are distributed provided that defined minimum key figures have been achieved. The prerequisite for participation is a positive EBIT for the Group as a whole. In addition, the bonus payment is based on the achievement of budget targets of the respective area of responsibility. Where individual bonus payments have been agreed, the bonus payment may vary additionally based on individual perfor-mance.
The calculation model for bonus payments has changed compared with the previous year and defines the ROCE and Innovation Revenue Rate and the individual performance of an employee as key indicators. Details regarding the calculation of ROCE and Innovation Revenue Rate can be found in the glossary as well as in the
Proportion of female employees
in %
35%
33%
43%
Europeand USA
Asia
Total
73Group Management Report
54 AT&S Annual Report 2016/17
In the past financial year, roughly € 977 thousand were invested in external training and continuing educa-tion. With a reduction of € 949 thousand compared to the previous year, the expenditure on external training again approached the level of the financial year 2014/15, when the expenditure on training was € 870 thousand. The financial year 2015/16 was a particularly intensive year due to the significant increase in the number of employees in Chongqing, the start of the global leadership initiative and the iPOK Lean Six Sigma programme. In the financial year 2016/17, the majority of the training courses were executed by inter-nal trainers based on the acquired know-how, thus enabling a clear reduction of the costs for external train-ings.
PROMOTING DIVERSITY Diversity and the contribution of different views provide added value for any team and any organisation. Especially since AT&S is a globally operating company, there is no place for any form of discrimination at the company. AT&S attaches great importance to equal opportunities, regardless of age, gender, background, sexual orientation, ethnic origin, disability, religious or political beliefs. This is also reflected in a declaration as part of the AT&S Code of Business Ethics and Conduct to which all employees have committed. As of the coming financial year, misconduct can be reported anonymously via a whistle-blowing platform.
At the end of the financial year, the proportion of female employees across all AT&S sites was 35%. The fe-male proportion in Europe and the USA of 43%, is still significantly higher than in Asia, where the proportion of women within AT&S is 33%. Women account for 11% of the employees reporting directly to the Manage-ment Board of the AT&S Group.
Diversity at AT&S is also measured by the fact that AT&S, as an international company, employs people from 46 nations. Very important for the exchange of know-how is the intensive collaboration between young and experienced employees. The average age at AT&S as at 31 March 2017 is 31 years. This is primarily a result of the large number of young employees in China, where the average age is 30. In Europe and the USA, the average age is 39 years. The average term of service throughout the Group also shows significant regional differences. While the average term of service in Europe and the USA is 11.9 years, it only amounts to 4.5 years in Asia. Based on the high number of employees in Asia and particularly on the strong increase in Chongqing, the average term of service throughout the Group is therefore 5.7 years.
CODE OF BUSINESS ETHICS AND CONDUCT AT&S is part of the Electronic Industry Citizenship Coalition (EICC). Thus, we commit to complying with a standard with respect to work, ethics, the environment and occupational health and safety, and extend this responsibility to our suppliers. The AT&S Code of Busi-ness Ethics and Conduct is continuously adapted to the requirements of the EICC. In the past financial year, for example, liaisons to be contacted in case of special needs regarding the exercise of religion were added to the Code. Further details of the sustainability activities can be found in the section “Sustainability” and in the current Sustainability Report.
REMUNERATION SYSTEMS In addition to remuneration in line with the market, AT&S also offers the opportunity to participate in the company’s financial success. This is another key factor for the commitment, hiring and retention of employees. In accordance with the global AT&S bonus system, individual or collective-ly agreed bonus payments are distributed provided that defined minimum key figures have been achieved. The prerequisite for participation is a positive EBIT for the Group as a whole. In addition, the bonus payment is based on the achievement of budget targets of the respective area of responsibility. Where individual bonus payments have been agreed, the bonus payment may vary additionally based on individual perfor-mance.
The calculation model for bonus payments has changed compared with the previous year and defines the ROCE and Innovation Revenue Rate and the individual performance of an employee as key indicators. Details regarding the calculation of ROCE and Innovation Revenue Rate can be found in the glossary as well as in the
Proportion of female employees
in %
35%
33%
43%
Europeand USA
Asia
Total
Group Management Report 55
section “Financial Position”. The bonus system also ensures that bonus payments are partially or fully sus-pended in economically difficult situations, in which the targets set are not met.
OUTLOOK Continuous personnel development in line with technological developments and the changing working environment is essential for our business success and will consequently also be the basis of person-nel work in the coming year. In addition to that, the Leadership Initiative, the iPOK project and the Interna-tional Talent Program will continue to be focus areas within AT&S in the financial year 2017/18. Furthermore, our intention is to increase transparency regarding training and career paths even further, thus enhancing perspectives for our employees.
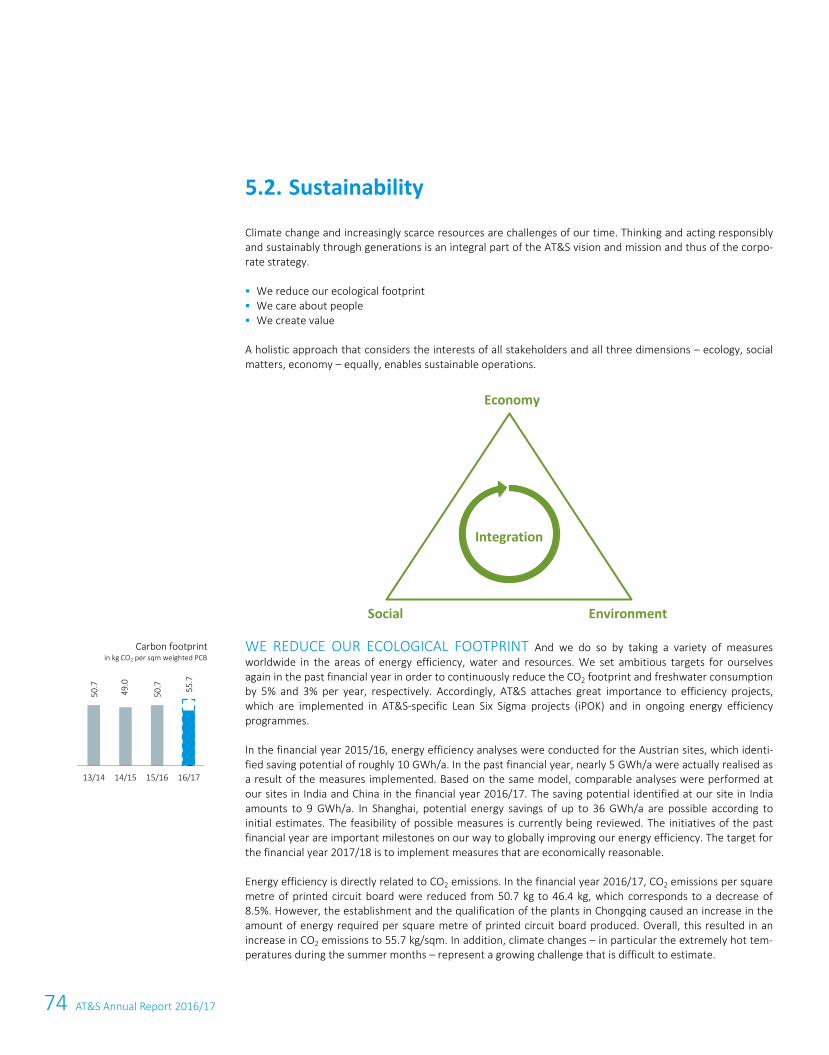
74 AT&S Annual Report 2016/17
56 AT&S Annual Report 2016/17
Climate change and increasingly scarce resources are challenges of our time. Thinking and acting responsibly and sustainably through generations is an integral part of the AT&S vision and mission and thus of the corpo-rate strategy.
We reduce our ecological footprint We care about people We create value
A holistic approach that considers the interests of all stakeholders and all three dimensions – ecology, social matters, economy – equally, enables sustainable operations.
WE REDUCE OUR ECOLOGICAL FOOTPRINT And we do so by taking a variety of measures worldwide in the areas of energy efficiency, water and resources. We set ambitious targets for ourselves again in the past financial year in order to continuously reduce the CO2 footprint and freshwater consumption by 5% and 3% per year, respectively. Accordingly, AT&S attaches great importance to efficiency projects, which are implemented in AT&S-specific Lean Six Sigma projects (iPOK) and in ongoing energy efficiency programmes.
In the financial year 2015/16, energy efficiency analyses were conducted for the Austrian sites, which identi-fied saving potential of roughly 10 GWh/a. In the past financial year, nearly 5 GWh/a were actually realised as a result of the measures implemented. Based on the same model, comparable analyses were performed at our sites in India and China in the financial year 2016/17. The saving potential identified at our site in India amounts to 9 GWh/a. In Shanghai, potential energy savings of up to 36 GWh/a are possible according to initial estimates. The feasibility of possible measures is currently being reviewed. The initiatives of the past financial year are important milestones on our way to globally improving our energy efficiency. The target for the financial year 2017/18 is to implement measures that are economically reasonable.
Energy efficiency is directly related to CO2 emissions. In the financial year 2016/17, CO2 emissions per square metre of printed circuit board were reduced from 50.7 kg to 46.4 kg, which corresponds to a decrease of 8.5%. However, the establishment and the qualification of the plants in Chongqing caused an increase in the amount of energy required per square metre of printed circuit board produced. Overall, this resulted in an increase in CO2 emissions to 55.7 kg/sqm. In addition, climate changes – in particular the extremely hot tem-peratures during the summer months – represent a growing challenge that is difficult to estimate.
5.2. Sustainability
Carbon footprint in kg CO2 per sqm weighted PCB
50.7
49.0
50.7 55
.7
13/14 14/15 15/16 16/17
Social Environment
Economy
Integration
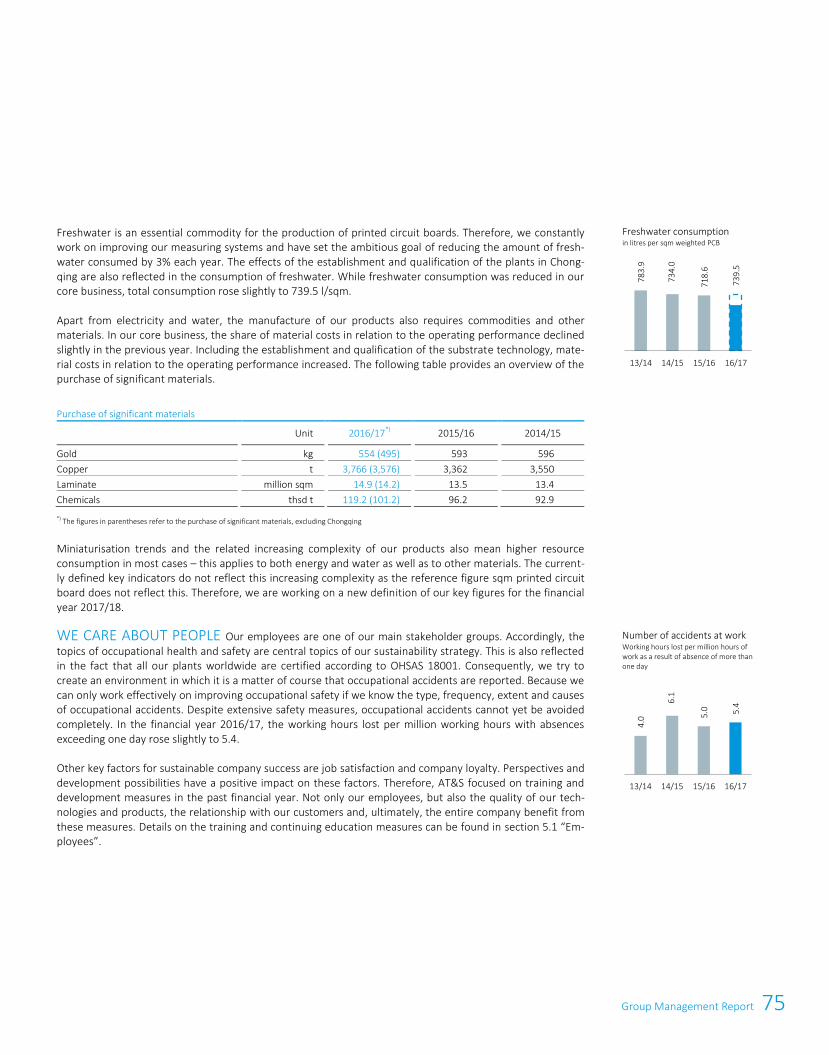
75Group Management Report
56 AT&S Annual Report 2016/17
Climate change and increasingly scarce resources are challenges of our time. Thinking and acting responsibly and sustainably through generations is an integral part of the AT&S vision and mission and thus of the corpo-rate strategy.
We reduce our ecological footprint We care about people We create value
A holistic approach that considers the interests of all stakeholders and all three dimensions – ecology, social matters, economy – equally, enables sustainable operations.
WE REDUCE OUR ECOLOGICAL FOOTPRINT And we do so by taking a variety of measures worldwide in the areas of energy efficiency, water and resources. We set ambitious targets for ourselves again in the past financial year in order to continuously reduce the CO2 footprint and freshwater consumption by 5% and 3% per year, respectively. Accordingly, AT&S attaches great importance to efficiency projects, which are implemented in AT&S-specific Lean Six Sigma projects (iPOK) and in ongoing energy efficiency programmes.
In the financial year 2015/16, energy efficiency analyses were conducted for the Austrian sites, which identi-fied saving potential of roughly 10 GWh/a. In the past financial year, nearly 5 GWh/a were actually realised as a result of the measures implemented. Based on the same model, comparable analyses were performed at our sites in India and China in the financial year 2016/17. The saving potential identified at our site in India amounts to 9 GWh/a. In Shanghai, potential energy savings of up to 36 GWh/a are possible according to initial estimates. The feasibility of possible measures is currently being reviewed. The initiatives of the past financial year are important milestones on our way to globally improving our energy efficiency. The target for the financial year 2017/18 is to implement measures that are economically reasonable.
Energy efficiency is directly related to CO2 emissions. In the financial year 2016/17, CO2 emissions per square metre of printed circuit board were reduced from 50.7 kg to 46.4 kg, which corresponds to a decrease of 8.5%. However, the establishment and the qualification of the plants in Chongqing caused an increase in the amount of energy required per square metre of printed circuit board produced. Overall, this resulted in an increase in CO2 emissions to 55.7 kg/sqm. In addition, climate changes – in particular the extremely hot tem-peratures during the summer months – represent a growing challenge that is difficult to estimate.
5.2. Sustainability
Carbon footprint in kg CO2 per sqm weighted PCB
50.7
49.0
50.7 55
.7
13/14 14/15 15/16 16/17
Freshwater is an essential commodity for the production of printed circuit boards. Therefore, we constantly work on improving our measuring systems and have set the ambitious goal of reducing the amount of fresh-water consumed by 3% each year. The effects of the establishment and qualification of the plants in Chong-qing are also reflected in the consumption of freshwater. While freshwater consumption was reduced in our core business, total consumption rose slightly to 739.5 l/sqm.
Apart from electricity and water, the manufacture of our products also requires commodities and other materials. In our core business, the share of material costs in relation to the operating performance declined slightly in the previous year. Including the establishment and qualification of the substrate technology, mate-rial costs in relation to the operating performance increased. The following table provides an overview of the purchase of significant materials.
Purchase of significant materials
Unit
2016/17
*)
2015/16
2014/15
Gold
kg
554 (495) 593
596
Copper
t
3,766 (3,576) 3,362
3,550
Laminate
million sqm
14.9 (14.2) 13.5
13.4
Chemicals
thsd t
119.2 (101.2) 96.2
92.9
*) The figures in parentheses refer to the purchase of significant materials, excluding Chongqing
Miniaturisation trends and the related increasing complexity of our products also mean higher resource consumption in most cases – this applies to both energy and water as well as to other materials. The current-ly defined key indicators do not reflect this increasing complexity as the reference figure sqm printed circuit board does not reflect this. Therefore, we are working on a new definition of our key figures for the financial year 2017/18.
WE CARE ABOUT PEOPLE Our employees are one of our main stakeholder groups. Accordingly, the topics of occupational health and safety are central topics of our sustainability strategy. This is also reflected in the fact that all our plants worldwide are certified according to OHSAS 18001. Consequently, we try to create an environment in which it is a matter of course that occupational accidents are reported. Because we can only work effectively on improving occupational safety if we know the type, frequency, extent and causes of occupational accidents. Despite extensive safety measures, occupational accidents cannot yet be avoided completely. In the financial year 2016/17, the working hours lost per million working hours with absences exceeding one day rose slightly to 5.4.
Other key factors for sustainable company success are job satisfaction and company loyalty. Perspectives and development possibilities have a positive impact on these factors. Therefore, AT&S focused on training and development measures in the past financial year. Not only our employees, but also the quality of our tech-nologies and products, the relationship with our customers and, ultimately, the entire company benefit from these measures. Details on the training and continuing education measures can be found in section 5.1 “Em-ployees”.
Freshwater consumption in litres per sqm weighted PCB
Number of accidents at work Working hours lost per million hours of work as a result of absence of more than one day
783.
9
734.
0
718.
6
739.
5
13/14 14/15 15/16 16/17
4.0
6.1
5.0 5.4
13/14 14/15 15/16 16/17
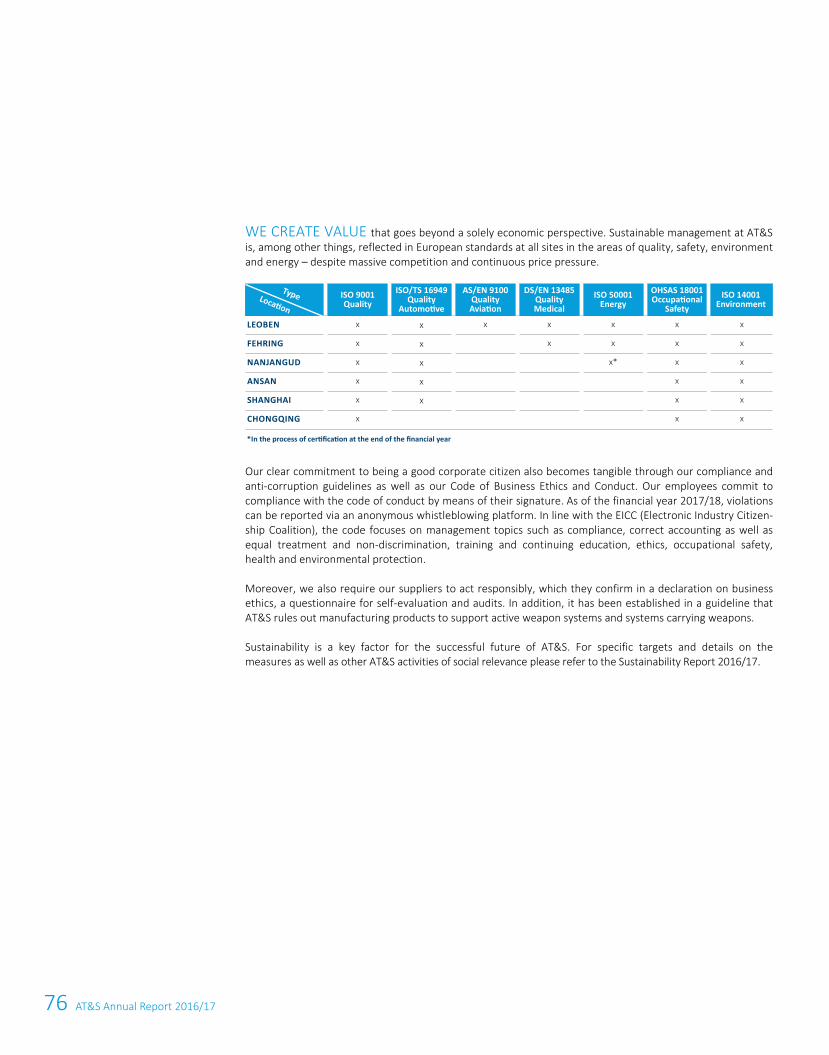
76 AT&S Annual Report 2016/17
58 AT&S Annual Report 2016/17
WE CREATE VALUE that goes beyond a solely economic perspective. Sustainable management at AT&S is, among other things, reflected in European standards at all sites in the areas of quality, safety, environment and energy – despite massive competition and continuous price pressure.
Our clear commitment to being a good corporate citizen also becomes tangible through our compliance and anti-corruption guidelines as well as our Code of Business Ethics and Conduct. Our employees commit to compliance with the code of conduct by means of their signature. As of the financial year 2017/18, violations can be reported via an anonymous whistleblowing platform. In line with the EICC (Electronic Industry Citizen-ship Coalition), the code focuses on management topics such as compliance, correct accounting as well as equal treatment and non-discrimination, training and continuing education, ethics, occupational safety, health and environmental protection.
Moreover, we also require our suppliers to act responsibly, which they confirm in a declaration on business ethics, a questionnaire for self-evaluation and audits. In addition, it has been established in a guideline that AT&S rules out manufacturing products to support active weapon systems and systems carrying weapons.
Sustainability is a key factor for the successful future of AT&S. For specific targets and details on the measures as well as other AT&S activities of social relevance please refer to the Sustainability Report 2016/17.
ISO 9001Quality
ISO/TS 16949Quality
Automotive
AS/EN 9100QualityAviation
DS/EN 13485QualityMedical
ISO 50001Energy
OHSAS 18001Occupational
SafetyISO 14001
Environment
LEOBEN x x x x x x x
FEHRING x x x x x x
NANJANGUD x x x* x x
ANSAN x x x x
SHANGHAI x x x x
CHONGQING x x x
*In the process of certification at the end of the financial year
TypeLocation
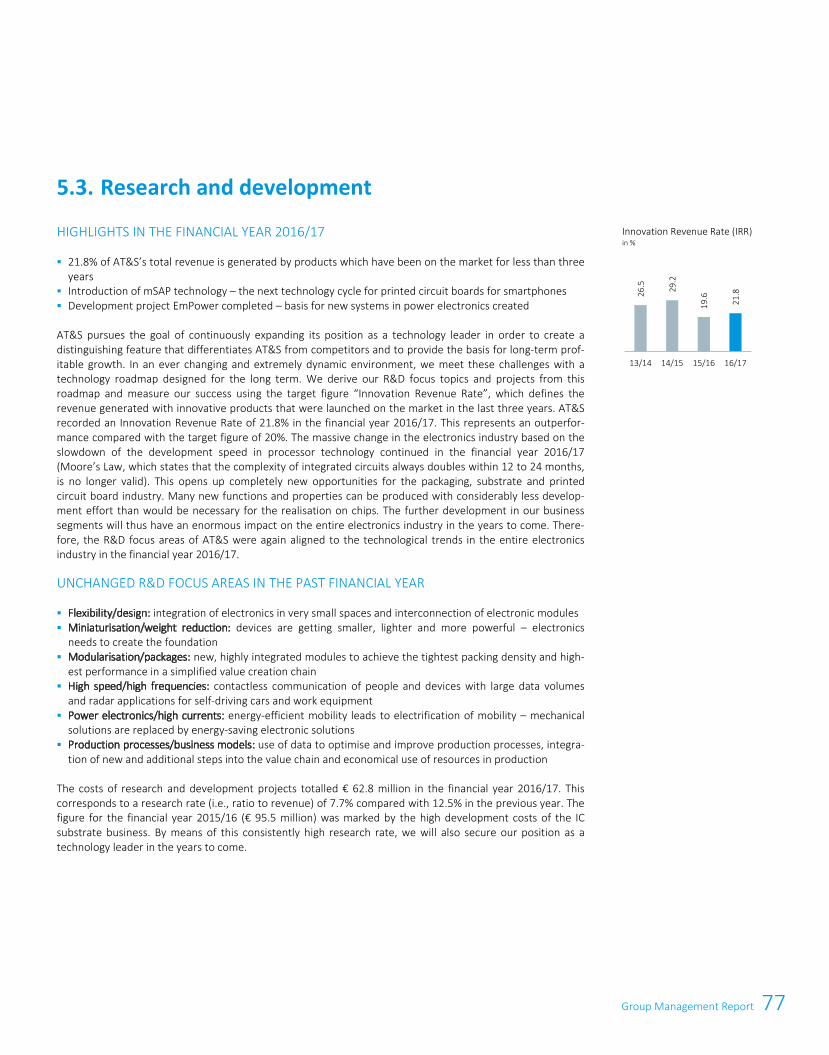
77Group Management Report
58 AT&S Annual Report 2016/17
WE CREATE VALUE that goes beyond a solely economic perspective. Sustainable management at AT&S is, among other things, reflected in European standards at all sites in the areas of quality, safety, environment and energy – despite massive competition and continuous price pressure.
Our clear commitment to being a good corporate citizen also becomes tangible through our compliance and anti-corruption guidelines as well as our Code of Business Ethics and Conduct. Our employees commit to compliance with the code of conduct by means of their signature. As of the financial year 2017/18, violations can be reported via an anonymous whistleblowing platform. In line with the EICC (Electronic Industry Citizen-ship Coalition), the code focuses on management topics such as compliance, correct accounting as well as equal treatment and non-discrimination, training and continuing education, ethics, occupational safety, health and environmental protection.
Moreover, we also require our suppliers to act responsibly, which they confirm in a declaration on business ethics, a questionnaire for self-evaluation and audits. In addition, it has been established in a guideline that AT&S rules out manufacturing products to support active weapon systems and systems carrying weapons.
Sustainability is a key factor for the successful future of AT&S. For specific targets and details on the measures as well as other AT&S activities of social relevance please refer to the Sustainability Report 2016/17.
Group Management Report 59
HIGHLIGHTS IN THE FINANCIAL YEAR 2016/17
21.8% of AT&S’s total revenue is generated by products which have been on the market for less than three years
Introduction of mSAP technology – the next technology cycle for printed circuit boards for smartphones Development project EmPower completed – basis for new systems in power electronics created
AT&S pursues the goal of continuously expanding its position as a technology leader in order to create a distinguishing feature that differentiates AT&S from competitors and to provide the basis for long-term prof-itable growth. In an ever changing and extremely dynamic environment, we meet these challenges with a technology roadmap designed for the long term. We derive our R&D focus topics and projects from this roadmap and measure our success using the target figure “Innovation Revenue Rate”, which defines the revenue generated with innovative products that were launched on the market in the last three years. AT&S recorded an Innovation Revenue Rate of 21.8% in the financial year 2016/17. This represents an outperfor-mance compared with the target figure of 20%. The massive change in the electronics industry based on the slowdown of the development speed in processor technology continued in the financial year 2016/17 (Moore’s Law, which states that the complexity of integrated circuits always doubles within 12 to 24 months, is no longer valid). This opens up completely new opportunities for the packaging, substrate and printed circuit board industry. Many new functions and properties can be produced with considerably less develop-ment effort than would be necessary for the realisation on chips. The further development in our business segments will thus have an enormous impact on the entire electronics industry in the years to come. There-fore, the R&D focus areas of AT&S were again aligned to the technological trends in the entire electronics industry in the financial year 2016/17.
UNCHANGED R&D FOCUS AREAS IN THE PAST FINANCIAL YEAR
Flexibility/design: integration of electronics in very small spaces and interconnection of electronic modules Miniaturisation/weight reduction: devices are getting smaller, lighter and more powerful – electronics
needs to create the foundation Modularisation/packages: new, highly integrated modules to achieve the tightest packing density and high-
est performance in a simplified value creation chain High speed/high frequencies: contactless communication of people and devices with large data volumes
and radar applications for self-driving cars and work equipment Power electronics/high currents: energy-efficient mobility leads to electrification of mobility – mechanical
solutions are replaced by energy-saving electronic solutions Production processes/business models: use of data to optimise and improve production processes, integra-
tion of new and additional steps into the value chain and economical use of resources in production
The costs of research and development projects totalled € 62.8 million in the financial year 2016/17. This corresponds to a research rate (i.e., ratio to revenue) of 7.7% compared with 12.5% in the previous year. The figure for the financial year 2015/16 (€ 95.5 million) was marked by the high development costs of the IC substrate business. By means of this consistently high research rate, we will also secure our position as a technology leader in the years to come.
5.3. Research and development
Innovation Revenue Rate (IRR) in %
26.5 29
.2
19.6 21.8
13/14 14/15 15/16 16/17
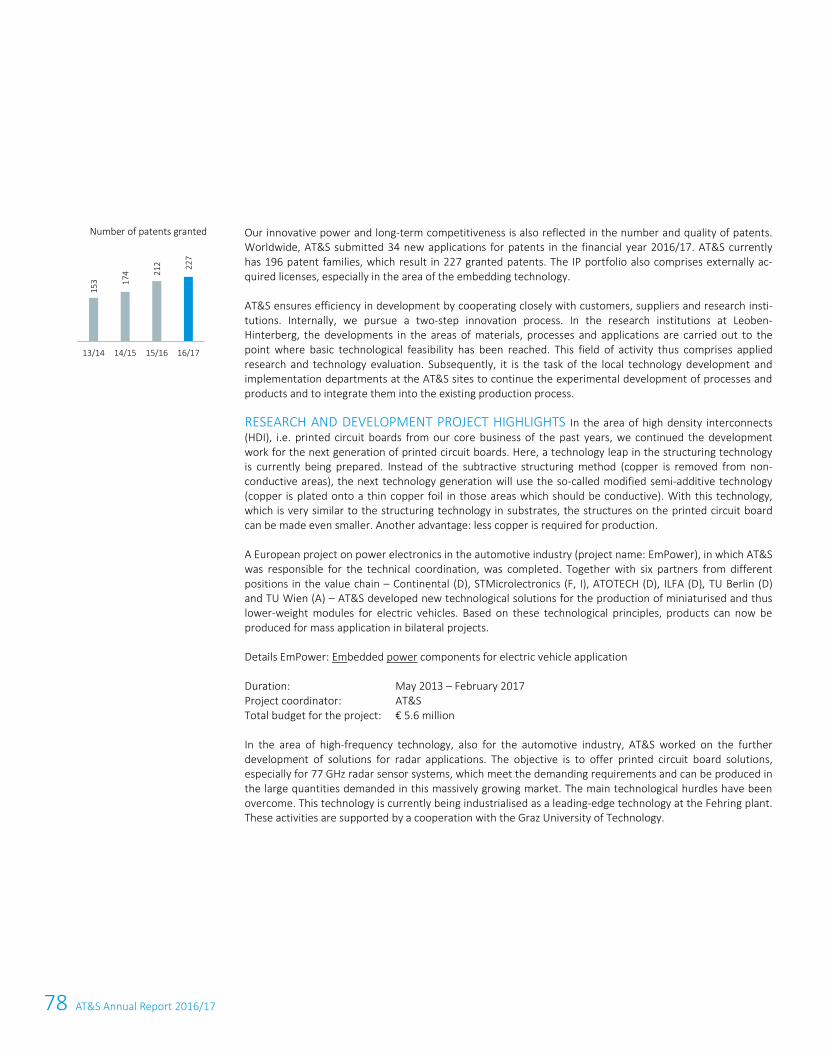
78 AT&S Annual Report 2016/17
60 AT&S Annual Report 2016/17
Our innovative power and long-term competitiveness is also reflected in the number and quality of patents. Worldwide, AT&S submitted 34 new applications for patents in the financial year 2016/17. AT&S currently has 196 patent families, which result in 227 granted patents. The IP portfolio also comprises externally ac-quired licenses, especially in the area of the embedding technology.
AT&S ensures efficiency in development by cooperating closely with customers, suppliers and research insti-tutions. Internally, we pursue a two-step innovation process. In the research institutions at Leoben-Hinterberg, the developments in the areas of materials, processes and applications are carried out to the point where basic technological feasibility has been reached. This field of activity thus comprises applied research and technology evaluation. Subsequently, it is the task of the local technology development and implementation departments at the AT&S sites to continue the experimental development of processes and products and to integrate them into the existing production process.
RESEARCH AND DEVELOPMENT PROJECT HIGHLIGHTS In the area of high density interconnects (HDI), i.e. printed circuit boards from our core business of the past years, we continued the development work for the next generation of printed circuit boards. Here, a technology leap in the structuring technology is currently being prepared. Instead of the subtractive structuring method (copper is removed from non-conductive areas), the next technology generation will use the so-called modified semi-additive technology (copper is plated onto a thin copper foil in those areas which should be conductive). With this technology, which is very similar to the structuring technology in substrates, the structures on the printed circuit board can be made even smaller. Another advantage: less copper is required for production.
A European project on power electronics in the automotive industry (project name: EmPower), in which AT&S was responsible for the technical coordination, was completed. Together with six partners from different positions in the value chain – Continental (D), STMicrolectronics (F, I), ATOTECH (D), ILFA (D), TU Berlin (D) and TU Wien (A) – AT&S developed new technological solutions for the production of miniaturised and thus lower-weight modules for electric vehicles. Based on these technological principles, products can now be produced for mass application in bilateral projects.
Details EmPower: Embedded power components for electric vehicle application
Duration: May 2013 – February 2017 Project coordinator: AT&S Total budget for the project: € 5.6 million
In the area of high-frequency technology, also for the automotive industry, AT&S worked on the further development of solutions for radar applications. The objective is to offer printed circuit board solutions, especially for 77 GHz radar sensor systems, which meet the demanding requirements and can be produced in the large quantities demanded in this massively growing market. The main technological hurdles have been overcome. This technology is currently being industrialised as a leading-edge technology at the Fehring plant. These activities are supported by a cooperation with the Graz University of Technology.
Number of patents granted
153 17
4 212 22
7
13/14 14/15 15/16 16/17
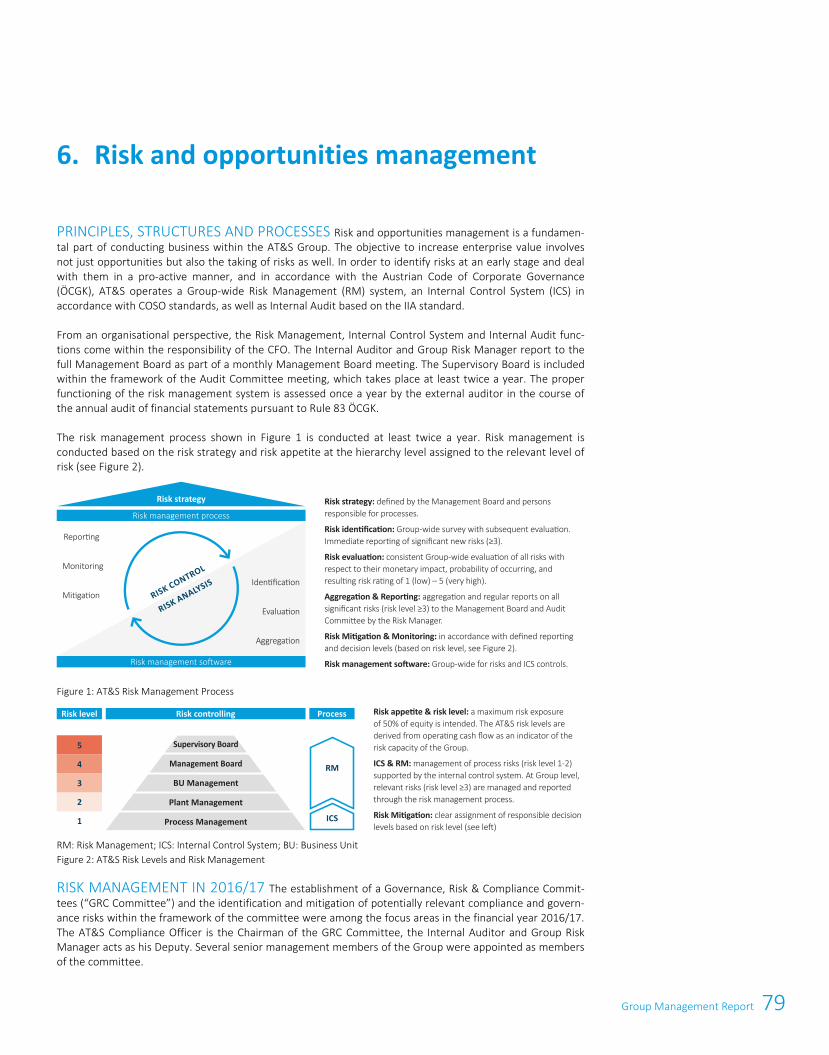
79Group Management Report
Group Management Report 61
PRINCIPLES, STRUCTURES AND PROCESSES Risk and opportunities management is a fundamen-tal part of conducting business within the AT&S Group. The objective to increase enterprise value involves not just opportunities but also the taking of risks as well. In order to identify risks at an early stage and deal with them in a pro-active manner, and in accordance with the Austrian Code of Corporate Governance (ÖCGK), AT&S operates a Group-wide Risk Management (RM) system, an Internal Control System (ICS) in accordance with COSO standards, as well as Internal Audit based on the IIA standard.
From an organisational perspective, the Risk Management, Internal Control System and Internal Audit func-tions come within the responsibility of the CFO. The Internal Auditor and Group Risk Manager report to the full Management Board as part of a monthly Management Board meeting. The Supervisory Board is included within the framework of the Audit Committee meeting, which takes place at least twice a year. The proper functioning of the risk management system is assessed once a year by the external auditor in the course of the annual audit of financial statements pursuant to Rule 83 ÖCGK.
The risk management process shown in Figure 1 is conducted at least twice a year. Risk management is conducted based on the risk strategy and risk appetite at the hierarchy level assigned to the relevant level of risk (see Figure 2).
Figure 1: AT&S Risk Management Process
RM: Risk Management; ICS: Internal Control System; BU: Business Unit Figure 2: AT&S Risk Levels and Risk Management
RISK MANAGEMENT IN 2016/17 The establishment of a Governance, Risk & Compliance Commit-tees (“GRC Committee”) and the identification and mitigation of potentially relevant compliance and govern-ance risks within the framework of the committee were among the focus areas in the financial year 2016/17. The AT&S Compliance Officer is the Chairman of the GRC Committee, the Internal Auditor and Group Risk Manager acts as his Deputy. Several senior management members of the Group were appointed as members of the committee.
Risk and opportunities management 6.
5
4
3
2
1
Risk management process
Risk management software
Risk strategy Risk strategy: defined by the Management Board and persons responsible for processes.
Risk identification: Group-wide survey with subsequent evaluation. Immediate reporting of significant new risks (≥3).
Risk evaluation: consistent Group-wide evaluation of all risks with respect to their monetary impact, probability of occurring, and resulting risk rating of 1 (low) – 5 (very high).
Aggregation & Reporting: aggregation and regular reports on all significant risks (risk level ≥3) to the Management Board and Audit Committee by the Risk Manager.
Risk Mitigation & Monitoring: in accordance with defined reporting and decision levels (based on risk level, see Figure 2).
Risk management software: Group-wide for risks and ICS controls.
Reporting
Aggregation
RISK ANALYSISRISK CONTROL
Identification
Monitoring
Evaluation
Mitigation
Risk level Risk controlling Process Risk appetite & risk level: a maximum risk exposure of 50% of equity is intended. The AT&S risk levels are derived from operating cash flow as an indicator of the risk capacity of the Group.
ICS & RM: management of process risks (risk level 1-2) supported by the internal control system. At Group level, relevant risks (risk level ≥3) are managed and reported through the risk management process.
Risk Mitigation: clear assignment of responsible decision levels based on risk level (see left)
Supervisory Board
Management Board
BU Management
Plant Management
Process Management
RM
ICS
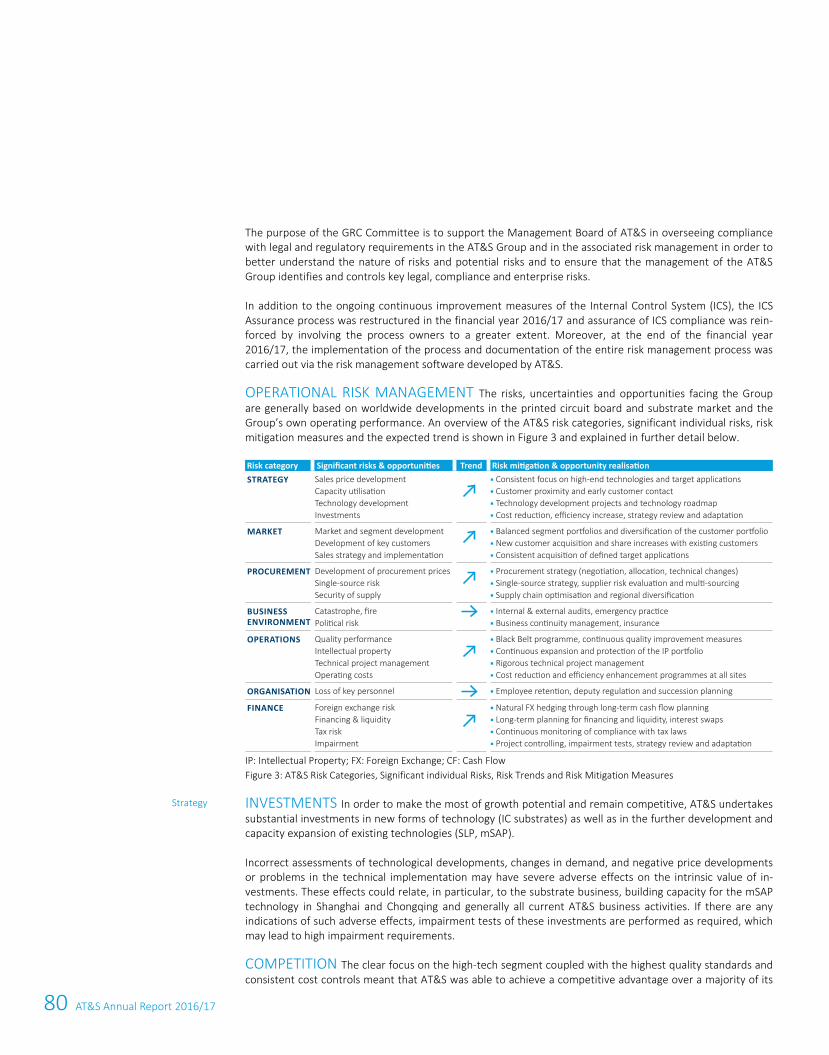
80 AT&S Annual Report 2016/17
62 AT&S Annual Report 2016/17
The purpose of the GRC Committee is to support the Management Board of AT&S in overseeing compliance with legal and regulatory requirements in the AT&S Group and in the associated risk management in order to better understand the nature of risks and potential risks and to ensure that the management of the AT&S Group identifies and controls key legal, compliance and enterprise risks.
In addition to the ongoing continuous improvement measures of the Internal Control System (ICS), the ICS Assurance process was restructured in the financial year 2016/17 and assurance of ICS compliance was rein-forced by involving the process owners to a greater extent. Moreover, at the end of the financial year 2016/17, the implementation of the process and documentation of the entire risk management process was carried out via the risk management software developed by AT&S.
OPERATIONAL RISK MANAGEMENT The risks, uncertainties and opportunities facing the Group are generally based on worldwide developments in the printed circuit board and substrate market and the Group’s own operating performance. An overview of the AT&S risk categories, significant individual risks, risk mitigation measures and the expected trend is shown in Figure 3 and explained in further detail below.
IP: Intellectual Property; FX: Foreign Exchange; CF: Cash Flow Figure 3: AT&S Risk Categories, Significant individual Risks, Risk Trends and Risk Mitigation Measures
INVESTMENTS In order to make the most of growth potential and remain competitive, AT&S undertakes substantial investments in new forms of technology (IC substrates) as well as in the further development and capacity expansion of existing technologies (SLP, mSAP).
Incorrect assessments of technological developments, changes in demand, and negative price developments or problems in the technical implementation may have severe adverse effects on the intrinsic value of in-vestments. These effects could relate, in particular, to the substrate business, building capacity for the mSAP technology in Shanghai and Chongqing and generally all current AT&S business activities. If there are any indications of such adverse effects, impairment tests of these investments are performed as required, which may lead to high impairment requirements.
COMPETITION The clear focus on the high-tech segment coupled with the highest quality standards and consistent cost controls meant that AT&S was able to achieve a competitive advantage over a majority of its
Strategy
Risk category Significant risks & opportunities Trend Risk mitigation & opportunity realisationSTRATEGY Sales price development
Capacity utilisation Technology development Investments
§ Consistent focus on high-end technologies and target applications§ Customer proximity and early customer contact§ Technology development projects and technology roadmap§ Cost reduction, efficiency increase, strategy review and adaptation
MARKET Market and segment development Development of key customers Sales strategy and implementation
§ Balanced segment portfolios and diversification of the customer portfolio§ New customer acquisition and share increases with existing customers§ Consistent acquisition of defined target applications
PROCUREMENT Development of procurement pricesSingle-source risk Security of supply
§ Procurement strategy (negotiation, allocation, technical changes)§ Single-source strategy, supplier risk evaluation and multi-sourcing§ Supply chain optimisation and regional diversification
BUSINESS ENVIRONMENT
Catastrophe, fire Political risk
§ Internal & external audits, emergency practice§ Business continuity management, insurance
OPERATIONS Quality performance Intellectual property Technical project management Operating costs
§ Black Belt programme, continuous quality improvement measures§ Continuous expansion and protection of the IP portfolio§ Rigorous technical project management§ Cost reduction and efficiency enhancement programmes at all sites
ORGANISATION Loss of key personnel § Employee retention, deputy regulation and succession planning
FINANCE Foreign exchange risk Financing & liquidity Tax riskImpairment
§ Natural FX hedging through long-term cash flow planning§ Long-term planning for financing and liquidity, interest swaps§ Continuous monitoring of compliance with tax laws§ Project controlling, impairment tests, strategy review and adaptation
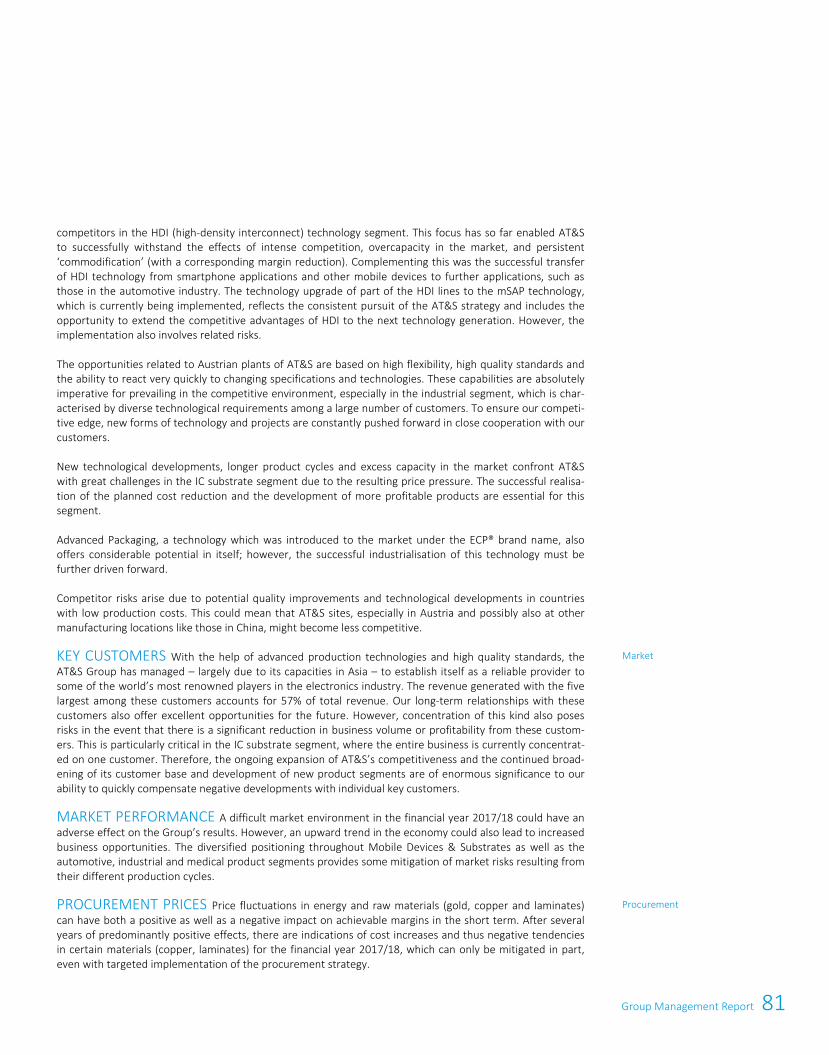
81Group Management Report
62 AT&S Annual Report 2016/17
The purpose of the GRC Committee is to support the Management Board of AT&S in overseeing compliance with legal and regulatory requirements in the AT&S Group and in the associated risk management in order to better understand the nature of risks and potential risks and to ensure that the management of the AT&S Group identifies and controls key legal, compliance and enterprise risks.
In addition to the ongoing continuous improvement measures of the Internal Control System (ICS), the ICS Assurance process was restructured in the financial year 2016/17 and assurance of ICS compliance was rein-forced by involving the process owners to a greater extent. Moreover, at the end of the financial year 2016/17, the implementation of the process and documentation of the entire risk management process was carried out via the risk management software developed by AT&S.
OPERATIONAL RISK MANAGEMENT The risks, uncertainties and opportunities facing the Group are generally based on worldwide developments in the printed circuit board and substrate market and the Group’s own operating performance. An overview of the AT&S risk categories, significant individual risks, risk mitigation measures and the expected trend is shown in Figure 3 and explained in further detail below.
IP: Intellectual Property; FX: Foreign Exchange; CF: Cash Flow Figure 3: AT&S Risk Categories, Significant individual Risks, Risk Trends and Risk Mitigation Measures
INVESTMENTS In order to make the most of growth potential and remain competitive, AT&S undertakes substantial investments in new forms of technology (IC substrates) as well as in the further development and capacity expansion of existing technologies (SLP, mSAP).
Incorrect assessments of technological developments, changes in demand, and negative price developments or problems in the technical implementation may have severe adverse effects on the intrinsic value of in-vestments. These effects could relate, in particular, to the substrate business, building capacity for the mSAP technology in Shanghai and Chongqing and generally all current AT&S business activities. If there are any indications of such adverse effects, impairment tests of these investments are performed as required, which may lead to high impairment requirements.
COMPETITION The clear focus on the high-tech segment coupled with the highest quality standards and consistent cost controls meant that AT&S was able to achieve a competitive advantage over a majority of its
Strategy
Group Management Report 63
competitors in the HDI (high-density interconnect) technology segment. This focus has so far enabled AT&S to successfully withstand the effects of intense competition, overcapacity in the market, and persistent ‘commodification’ (with a corresponding margin reduction). Complementing this was the successful transfer of HDI technology from smartphone applications and other mobile devices to further applications, such as those in the automotive industry. The technology upgrade of part of the HDI lines to the mSAP technology, which is currently being implemented, reflects the consistent pursuit of the AT&S strategy and includes the opportunity to extend the competitive advantages of HDI to the next technology generation. However, the implementation also involves related risks.
The opportunities related to Austrian plants of AT&S are based on high flexibility, high quality standards and the ability to react very quickly to changing specifications and technologies. These capabilities are absolutely imperative for prevailing in the competitive environment, especially in the industrial segment, which is char-acterised by diverse technological requirements among a large number of customers. To ensure our competi-tive edge, new forms of technology and projects are constantly pushed forward in close cooperation with our customers.
New technological developments, longer product cycles and excess capacity in the market confront AT&S with great challenges in the IC substrate segment due to the resulting price pressure. The successful realisa-tion of the planned cost reduction and the development of more profitable products are essential for this segment.
Advanced Packaging, a technology which was introduced to the market under the ECP® brand name, also offers considerable potential in itself; however, the successful industrialisation of this technology must be further driven forward.
Competitor risks arise due to potential quality improvements and technological developments in countries with low production costs. This could mean that AT&S sites, especially in Austria and possibly also at other manufacturing locations like those in China, might become less competitive.
KEY CUSTOMERS With the help of advanced production technologies and high quality standards, the AT&S Group has managed – largely due to its capacities in Asia – to establish itself as a reliable provider to some of the world’s most renowned players in the electronics industry. The revenue generated with the five largest among these customers accounts for 57% of total revenue. Our long-term relationships with these customers also offer excellent opportunities for the future. However, concentration of this kind also poses risks in the event that there is a significant reduction in business volume or profitability from these custom-ers. This is particularly critical in the IC substrate segment, where the entire business is currently concentrat-ed on one customer. Therefore, the ongoing expansion of AT&S’s competitiveness and the continued broad-ening of its customer base and development of new product segments are of enormous significance to our ability to quickly compensate negative developments with individual key customers.
MARKET PERFORMANCE A difficult market environment in the financial year 2017/18 could have an adverse effect on the Group’s results. However, an upward trend in the economy could also lead to increased business opportunities. The diversified positioning throughout Mobile Devices & Substrates as well as the automotive, industrial and medical product segments provides some mitigation of market risks resulting from their different production cycles.
PROCUREMENT PRICES Price fluctuations in energy and raw materials (gold, copper and laminates) can have both a positive as well as a negative impact on achievable margins in the short term. After several years of predominantly positive effects, there are indications of cost increases and thus negative tendencies in certain materials (copper, laminates) for the financial year 2017/18, which can only be mitigated in part, even with targeted implementation of the procurement strategy.
Market
Procurement
82 AT&S Annual Report 2016/17
64 AT&S Annual Report 2016/17
SOURCING The sourcing strategy of AT&S focuses on a wide and clearly diversified base of carefully se-lected suppliers in order to reduce dependencies on individual suppliers. The Group enjoys long-standing and stable customer-supplier relations with its key suppliers with particular expertise and competitive standings. To avoid supply shortages, AT&S conducts rigorous supplier risk management, taking account of regional cluster risks, various supply routes, and alternative procurement options. With few exceptions – such as in the IC substrates and ECP areas for which the suppler base is smaller – alternative supplier options are there-fore usually available in order to respond to supply risks. One challenge in the area of sourcing is currently the procurement of copper foils due to a significant increase in global demand.
LOCATION-SPECIFIC RISKS The large majority of AT&S’ operating activities is based at sites outside of Austria, particularly in China. This means that the Group might be subject to potential legal uncertainties, state intervention, trade restrictions or political unrest. Irrespective of the above, any production site of the Group may furthermore be exposed to disruptive events such as fire, natural disasters, acts of war, shortages of supply or other elementary events. The termination of land use rights, permits or lease contracts of specif-ic plants might also have a negative impact on the production output of the Group.
To minimise the effects of such risks, the Group has instituted business continuity management. The Group conducts active insurance management by means of weighing the risks and associated costs. It has concluded insurance contracts to the extent customary for a company of this size if such contracts are available at costs which are reasonable in relation to the impending risks.
COMPLIANCE Any amendments to regulatory requirements, such as the prohibition of specific processes or materials, might lead to a rise in production costs. AT&S might be subject to payment of substantial penal-ties should any breach of customer confidentiality agreements or statutory provisions occur. AT&S has im-plemented organisational measures aimed at preventing or minimising the occurrence of compliance risks. The extension of such measures is ongoing. As a rule, AT&S follows a zero-tolerance policy and expects 100% compliance on the part of its employees with all applicable laws and regulations. The establishment of a Governance, Risk & Compliance Committee (“GRC Committee”) and the identification and mitigation of po-tentially relevant compliance and governance risks in the framework of this committee were among the focus areas in this context in the financial year 2016/17.
FRAUD, DATA SECURITY AND CYBERCRIME To continue to successfully prevent attempted fraud, internal controls were further intensified in the past financial years and initiatives to sensitise employ-ees with regard to such fraud schemes were increased. Moreover, AT&S continues to expand its data and IT security measures on a regular basis.
QUALITY PERFORMANCE As in the past, it will be the high quality of products, adherence to delivery deadlines and service quality which will offer the Group a chance to differentiate itself from the competition and exploit growth opportunities in the future. At the same time, AT&S has to make substantial contractual commitments, especially to key customers, with respect to capacity reserves and volume guarantees, adher-ence to delivery deadlines and quality performance. Any technical defects, quality deficiencies, difficulties in delivering products or failure to provide volume guarantees granted may expose AT&S to warranty claims, claims for damages and contractual penalties. Substantial quality deficiencies could also result in product recalls and the loss of customers. AT&S has established a quality management and planning system designed to rule out or minimise deficiencies in product quality planning mistakes and their negative consequences as far as possible. Furthermore, the Group is insured against major risks by virtue of an (extended) product liability insurance policy taking into account exclusions of coverage and customary coverage limits.
INTELLECTUAL PROPERTY AT&S endeavours to exploit any opportunities for obtaining intellectual property as well as gaining access to promising patents through the development of its own projects, cooper-ation schemes with partners and investments. Risks arise if AT&S fails to protect its intellectual property, thus enabling the competition to utilise these technologies. Legal disputes about intellectual property can prevent
Business environment
Operations
83Group Management Report
64 AT&S Annual Report 2016/17
SOURCING The sourcing strategy of AT&S focuses on a wide and clearly diversified base of carefully se-lected suppliers in order to reduce dependencies on individual suppliers. The Group enjoys long-standing and stable customer-supplier relations with its key suppliers with particular expertise and competitive standings. To avoid supply shortages, AT&S conducts rigorous supplier risk management, taking account of regional cluster risks, various supply routes, and alternative procurement options. With few exceptions – such as in the IC substrates and ECP areas for which the suppler base is smaller – alternative supplier options are there-fore usually available in order to respond to supply risks. One challenge in the area of sourcing is currently the procurement of copper foils due to a significant increase in global demand.
LOCATION-SPECIFIC RISKS The large majority of AT&S’ operating activities is based at sites outside of Austria, particularly in China. This means that the Group might be subject to potential legal uncertainties, state intervention, trade restrictions or political unrest. Irrespective of the above, any production site of the Group may furthermore be exposed to disruptive events such as fire, natural disasters, acts of war, shortages of supply or other elementary events. The termination of land use rights, permits or lease contracts of specif-ic plants might also have a negative impact on the production output of the Group.
To minimise the effects of such risks, the Group has instituted business continuity management. The Group conducts active insurance management by means of weighing the risks and associated costs. It has concluded insurance contracts to the extent customary for a company of this size if such contracts are available at costs which are reasonable in relation to the impending risks.
COMPLIANCE Any amendments to regulatory requirements, such as the prohibition of specific processes or materials, might lead to a rise in production costs. AT&S might be subject to payment of substantial penal-ties should any breach of customer confidentiality agreements or statutory provisions occur. AT&S has im-plemented organisational measures aimed at preventing or minimising the occurrence of compliance risks. The extension of such measures is ongoing. As a rule, AT&S follows a zero-tolerance policy and expects 100% compliance on the part of its employees with all applicable laws and regulations. The establishment of a Governance, Risk & Compliance Committee (“GRC Committee”) and the identification and mitigation of po-tentially relevant compliance and governance risks in the framework of this committee were among the focus areas in this context in the financial year 2016/17.
FRAUD, DATA SECURITY AND CYBERCRIME To continue to successfully prevent attempted fraud, internal controls were further intensified in the past financial years and initiatives to sensitise employ-ees with regard to such fraud schemes were increased. Moreover, AT&S continues to expand its data and IT security measures on a regular basis.
QUALITY PERFORMANCE As in the past, it will be the high quality of products, adherence to delivery deadlines and service quality which will offer the Group a chance to differentiate itself from the competition and exploit growth opportunities in the future. At the same time, AT&S has to make substantial contractual commitments, especially to key customers, with respect to capacity reserves and volume guarantees, adher-ence to delivery deadlines and quality performance. Any technical defects, quality deficiencies, difficulties in delivering products or failure to provide volume guarantees granted may expose AT&S to warranty claims, claims for damages and contractual penalties. Substantial quality deficiencies could also result in product recalls and the loss of customers. AT&S has established a quality management and planning system designed to rule out or minimise deficiencies in product quality planning mistakes and their negative consequences as far as possible. Furthermore, the Group is insured against major risks by virtue of an (extended) product liability insurance policy taking into account exclusions of coverage and customary coverage limits.
INTELLECTUAL PROPERTY AT&S endeavours to exploit any opportunities for obtaining intellectual property as well as gaining access to promising patents through the development of its own projects, cooper-ation schemes with partners and investments. Risks arise if AT&S fails to protect its intellectual property, thus enabling the competition to utilise these technologies. Legal disputes about intellectual property can prevent
Business environment
Operations
Group Management Report 65
AT&S from using or selling disputed technologies. Furthermore, legal disputes with regard to the unauthor-ised use of external intellectual property can have considerable negative financial consequences. The new IC substrates segment in particular bears risks in this regard, as AT&S needs to further increase its relevant expertise in this field.
TECHNOLOGY AND PROJECT DEVELOPMENT The establishment and expansion of capacity for IC substrates and the mSAP technologies in Chongqing lead to specific risks for the Chongqing site due to the significant investment volume. Complications in the further technological development and project imple-mentation could result in major burdens on business development and the existing financial and administra-tive resources. In the coming financial year, the focus will be on continuous performance improvement in substrate production and in the qualifications of new technologies at the sites in Shanghai und Chongqing.
COST CONTROL Strict cost reduction and efficiency increases, especially in the new IC substrate seg-ment, but also at all other sites, are crucial to the Group’s competitiveness and profitability. If cost reduction measures and performance increases, especially for the IC substrate segment, but also at all other sites, cannot be implemented as planned (or if the costs cannot be passed on to customers), this may have a nega-tive impact on the competitiveness of the Group.
EMPLOYEES The collective industry experience and management expertise of the employees of the AT&S Group form the foundation for taking advantage of future opportunities. The business of the Group might suffer if employees in leading positions were to terminate their employment relations with AT&S or if AT&S were unable to continue to recruit highly qualified engineering, sales and administrative personnel and retain them long-term. AT&S continuously develops strategies for retaining key employees, recruiting valuable personnel and further expanding the skills of its staff.
EXCHANGE RATE RISKS Exchange rate fluctuations in EUR, RMB and USD – and to a lesser extent in JPY, KRW and INR – can have considerable positive or negative effects on the results of the Group. To mini-mise these effects, the Group employs a hedging strategy by generating opposing cash flows in the respective currencies. The high investments in China of the past years result in significant currency risks related to the RMB, which could increase or decrease the Group’s equity. Hedging against this risk would involve high costs and is not carried out.
FINANCING AND LIQUIDITY To secure the financial needs for the expansion strategy, the Group uses long-term financial and liquidity planning. However, negative business developments, significant deviations from assumptions in business cases, exchange rate fluctuations or valuation adjustments may result in failure to achieve the targeted equity ratio and the net debt/EBITDA ratio as assured in financing agreements and subsequently lead to additional financing requirements under more difficult conditions and higher costs, or the loss of existing financing facilities. Interest rates are hedged centrally for the Group as a whole through Group Treasury, in part with the use of appropriate financial instruments.
For more information on financial, liquidity, credit and foreign exchange risks, please refer to Note 20 "Addi-tional disclosures on financial instruments" in the notes to the consolidated financial statements.
TAX RISK The Company is active on a global basis and thus subject to different tax systems. Unless the requirements for the formation of a provision or liability are met, both national and international tax risks are incorporated within financial risks and monitored accordingly. At present, the material tax risks are in relation to the companies in India. In order to minimise future task risks, the Group continuously monitors compliance with national tax laws and international guidelines such as the BEPS (Base Erosion and Profit Shifting) guide-line of the OECD and makes any necessary adjustments. Although AT&S strives to comply with all tax laws and regulations, there is a risk of different interpretations in different countries, which may lead to double taxation.
Organisation
Finance
84 AT&S Annual Report 2016/17
66 AT&S Annual Report 2016/17
The accounting-related Internal Control and Risk Management system is an integral part of the Group-wide risk management system. According to the framework concept of COSO (The Committee of Sponsoring Or-ganization of the Treadway Commission), under the concept of Company-wide risk management, the actual risk management as well as the Internal Control System (ICS) are subsumed. The main criteria of the Risk Management, the Internal Control System and Internal audit of AT&S are specified in a Group-wide risk man-agement and audit manual.
The documentation of the internal controls (business processes, risks, control measures and those responsi-ble) is made principally in the form of control matrices, which are archived in a central management data-base. The accounting-related Internal Control System includes principles, procedures and measures to ensure the compliance of accounting in terms of the control targets described for financial reporting.
The accounting procedures are documented in separate process instructions. These processes are standard-ised across the Group and are presented in a standardised documentation format. Additional requirements for accounting procedures result from specific local regulations. The basic principles of accounting and re-porting are documented in the process descriptions and also in detailed process instructions, which are also filed in the central management manual. In addition, guidelines on measurement procedures and organisa-tional requirements in connection with the processes of accounting and preparing the financial statements are compiled and updated on a regular basis. Schedules are set in accordance with Group requirements.
The internal financial reporting is done on a monthly basis as part of the Group reporting, with the financial information being reviewed and analysed by the Group Accounting and Group Controlling department (part of Group Finance & Controlling). The monthly budget/actual variance with corresponding comments on the results of the segments, of the plants as well as of the Company, is reported internally to the executives and to the members of the Supervisory Board.
The annual preparation of the budget is carried out by the Group Controlling department (as part of Group Finance & Controlling). Quarterly forecasts are drawn up during the year for the remaining financial year based on the quarterly results and current planning information. The forecasts with comments on the budget comparison and presentations on the impact of opportunities and risks up to the end of the financial year are reported to the Supervisory Board. In addition to regular reporting, multiple-year planning, project-related financial information or calculations on investment projects are prepared and submitted to the Supervisory Board.
Internal Control and Risk Management 7.System with regard to accounting
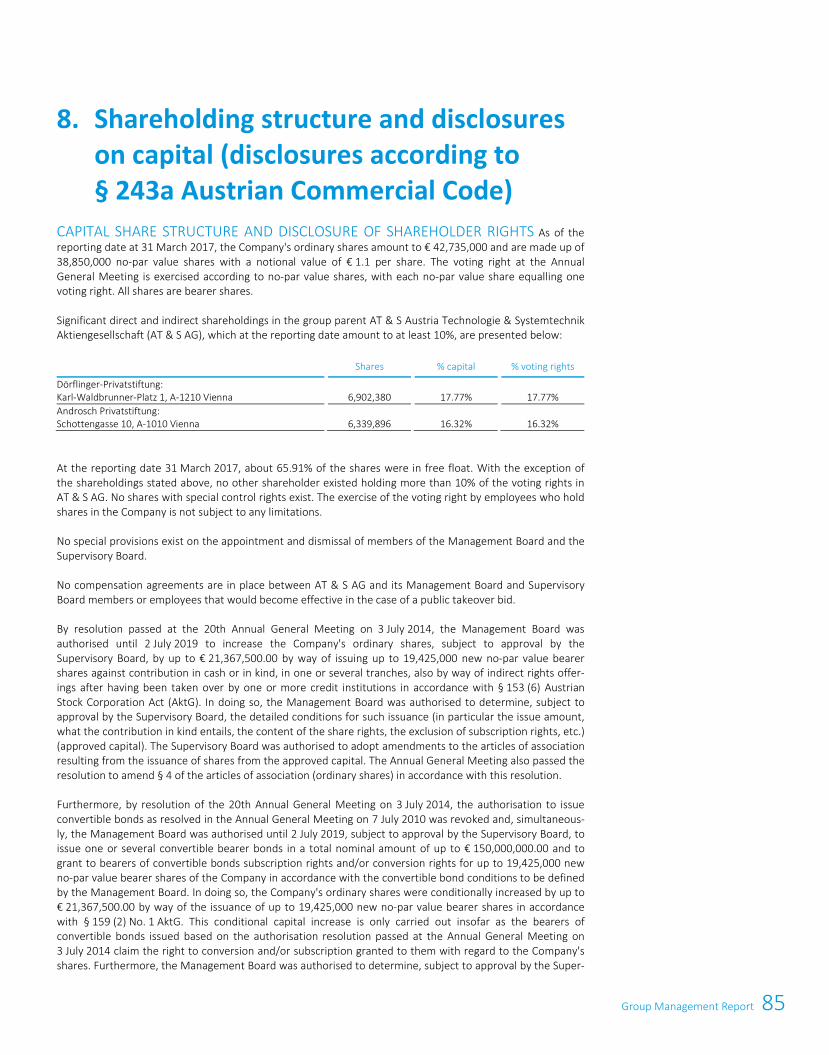
85Group Management Report
66 AT&S Annual Report 2016/17
The accounting-related Internal Control and Risk Management system is an integral part of the Group-wide risk management system. According to the framework concept of COSO (The Committee of Sponsoring Or-ganization of the Treadway Commission), under the concept of Company-wide risk management, the actual risk management as well as the Internal Control System (ICS) are subsumed. The main criteria of the Risk Management, the Internal Control System and Internal audit of AT&S are specified in a Group-wide risk man-agement and audit manual.
The documentation of the internal controls (business processes, risks, control measures and those responsi-ble) is made principally in the form of control matrices, which are archived in a central management data-base. The accounting-related Internal Control System includes principles, procedures and measures to ensure the compliance of accounting in terms of the control targets described for financial reporting.
The accounting procedures are documented in separate process instructions. These processes are standard-ised across the Group and are presented in a standardised documentation format. Additional requirements for accounting procedures result from specific local regulations. The basic principles of accounting and re-porting are documented in the process descriptions and also in detailed process instructions, which are also filed in the central management manual. In addition, guidelines on measurement procedures and organisa-tional requirements in connection with the processes of accounting and preparing the financial statements are compiled and updated on a regular basis. Schedules are set in accordance with Group requirements.
The internal financial reporting is done on a monthly basis as part of the Group reporting, with the financial information being reviewed and analysed by the Group Accounting and Group Controlling department (part of Group Finance & Controlling). The monthly budget/actual variance with corresponding comments on the results of the segments, of the plants as well as of the Company, is reported internally to the executives and to the members of the Supervisory Board.
The annual preparation of the budget is carried out by the Group Controlling department (as part of Group Finance & Controlling). Quarterly forecasts are drawn up during the year for the remaining financial year based on the quarterly results and current planning information. The forecasts with comments on the budget comparison and presentations on the impact of opportunities and risks up to the end of the financial year are reported to the Supervisory Board. In addition to regular reporting, multiple-year planning, project-related financial information or calculations on investment projects are prepared and submitted to the Supervisory Board.
Internal Control and Risk Management 7.System with regard to accounting
Group Management Report 67
CAPITAL SHARE STRUCTURE AND DISCLOSURE OF SHAREHOLDER RIGHTS As of the reporting date at 31 March 2017, the Company's ordinary shares amount to € 42,735,000 and are made up of 38,850,000 no-par value shares with a notional value of € 1.1 per share. The voting right at the Annual General Meeting is exercised according to no-par value shares, with each no-par value share equalling one voting right. All shares are bearer shares.
Significant direct and indirect shareholdings in the group parent AT & S Austria Technologie & Systemtechnik Aktiengesellschaft (AT & S AG), which at the reporting date amount to at least 10%, are presented below:
Shares
% capital
% voting rights
Dörflinger-Privatstiftung: Karl-Waldbrunner-Platz 1, A-1210 Vienna 6,902,380
17.77%
17.77%
Androsch Privatstiftung: Schottengasse 10, A-1010 Vienna
6,339,896
16.32%
16.32%
At the reporting date 31 March 2017, about 65.91% of the shares were in free float. With the exception of the shareholdings stated above, no other shareholder existed holding more than 10% of the voting rights in AT & S AG. No shares with special control rights exist. The exercise of the voting right by employees who hold shares in the Company is not subject to any limitations.
No special provisions exist on the appointment and dismissal of members of the Management Board and the Supervisory Board.
No compensation agreements are in place between AT & S AG and its Management Board and Supervisory Board members or employees that would become effective in the case of a public takeover bid.
By resolution passed at the 20th Annual General Meeting on 3 July 2014, the Management Board was authorised until 2 July 2019 to increase the Company's ordinary shares, subject to approval by the Supervisory Board, by up to € 21,367,500.00 by way of issuing up to 19,425,000 new no-par value bearer shares against contribution in cash or in kind, in one or several tranches, also by way of indirect rights offer-ings after having been taken over by one or more credit institutions in accordance with § 153 (6) Austrian Stock Corporation Act (AktG). In doing so, the Management Board was authorised to determine, subject to approval by the Supervisory Board, the detailed conditions for such issuance (in particular the issue amount, what the contribution in kind entails, the content of the share rights, the exclusion of subscription rights, etc.) (approved capital). The Supervisory Board was authorised to adopt amendments to the articles of association resulting from the issuance of shares from the approved capital. The Annual General Meeting also passed the resolution to amend § 4 of the articles of association (ordinary shares) in accordance with this resolution.
Furthermore, by resolution of the 20th Annual General Meeting on 3 July 2014, the authorisation to issue convertible bonds as resolved in the Annual General Meeting on 7 July 2010 was revoked and, simultaneous-ly, the Management Board was authorised until 2 July 2019, subject to approval by the Supervisory Board, to issue one or several convertible bearer bonds in a total nominal amount of up to € 150,000,000.00 and to grant to bearers of convertible bonds subscription rights and/or conversion rights for up to 19,425,000 new no-par value bearer shares of the Company in accordance with the convertible bond conditions to be defined by the Management Board. In doing so, the Company's ordinary shares were conditionally increased by up to € 21,367,500.00 by way of the issuance of up to 19,425,000 new no-par value bearer shares in accordance with § 159 (2) No. 1 AktG. This conditional capital increase is only carried out insofar as the bearers of convertible bonds issued based on the authorisation resolution passed at the Annual General Meeting on 3 July 2014 claim the right to conversion and/or subscription granted to them with regard to the Company's shares. Furthermore, the Management Board was authorised to determine, subject to approval by the Super-
Shareholding structure and disclosures 8.on capital (disclosures according to § 243a Austrian Commercial Code)
86 AT&S Annual Report 2016/17
68 AT&S Annual Report 2016/17
visory Board, the further details of carrying out the conditional capital increase (particularly the issue amount and the content of the share rights).
With regard to increasing the approved capital and/or the conditional capital increase, the following defini-tion of amount in accordance with the resolutions passed at the 20th Annual General Meeting on 3 July 2014 is to be observed: The sum of (i) the number of shares currently issued or potentially to be issued from condi-tional capital in accordance with the convertible bond conditions and (ii) the number of shares issued from approved capital shall not exceed the total amount of 19,425,000 (definition of amount of authorisations).
TREASURY SHARES By a resolution passed at the 21st Annual General Meeting on 9 July 2015, the Management Board was again authorised to acquire and to withdraw – within 30 months as from the resolu-tion date – treasury shares to the maximum extent of up to 10% of the ordinary shares of the Company. Furthermore, the Management Board was authorised, for a period of five years as of the date the resolution was passed, i.e. up to and including 8 July 2020, upon approval by the Supervisory Board, to sell treasury shares also in a different way than via the stock exchange or by public offering, most notably to serve em-ployee stock options, convertible bonds or to use such shares as a consideration for the acquisition of entities or other assets and for any other legal purpose.
As of 31 March 2017, the Group does not hold any treasury shares.
There are no off-balance sheet transactions between AT & S AG and its subsidiaries.
AT & S AG neither has granted any loans nor has it assumed any liabilities in favour of board members.
For further information, reference is made to the notes to the consolidated financial statements (Note 22 “Share capital” as well as Note 16 “Financial liabilities”).
The Company's Corporate Governance Report pursuant to § 243b Austrian Commercial Code is available at http://www.ats.net/company/corporate-governance/reports/.
87Group Management Report
68 AT&S Annual Report 2016/17
visory Board, the further details of carrying out the conditional capital increase (particularly the issue amount and the content of the share rights).
With regard to increasing the approved capital and/or the conditional capital increase, the following defini-tion of amount in accordance with the resolutions passed at the 20th Annual General Meeting on 3 July 2014 is to be observed: The sum of (i) the number of shares currently issued or potentially to be issued from condi-tional capital in accordance with the convertible bond conditions and (ii) the number of shares issued from approved capital shall not exceed the total amount of 19,425,000 (definition of amount of authorisations).
TREASURY SHARES By a resolution passed at the 21st Annual General Meeting on 9 July 2015, the Management Board was again authorised to acquire and to withdraw – within 30 months as from the resolu-tion date – treasury shares to the maximum extent of up to 10% of the ordinary shares of the Company. Furthermore, the Management Board was authorised, for a period of five years as of the date the resolution was passed, i.e. up to and including 8 July 2020, upon approval by the Supervisory Board, to sell treasury shares also in a different way than via the stock exchange or by public offering, most notably to serve em-ployee stock options, convertible bonds or to use such shares as a consideration for the acquisition of entities or other assets and for any other legal purpose.
As of 31 March 2017, the Group does not hold any treasury shares.
There are no off-balance sheet transactions between AT & S AG and its subsidiaries.
AT & S AG neither has granted any loans nor has it assumed any liabilities in favour of board members.
For further information, reference is made to the notes to the consolidated financial statements (Note 22 “Share capital” as well as Note 16 “Financial liabilities”).
The Company's Corporate Governance Report pursuant to § 243b Austrian Commercial Code is available at http://www.ats.net/company/corporate-governance/reports/.
Group Management Report 69
The dynamics of the current developments in the electronics industry – miniaturisation with a simultaneous increase in performance and higher integration of electronic components – will continue unabated in the financial year 2017/18. The basis for this is the continuous interconnection of devices and the enormous volume and speed of data – big data and cloud computing, for example, for communications applications, mobility and industrial applications.
These developments continue to offer enormous growth potential – for those companies that have posi-tioned themselves accordingly in the supply chain or anticipate it.
AT&S is convinced it has taken the right steps for a broader positioning in a changing supply chain with its strategic focus on high-end technologies and applications in the existing business as well as with the estab-lishment of an expanded technology portfolio based on IC substrates and the next technology generation (mSAP). The transformation from a high-end printed circuit board producer to a high-end interconnect solu-tions provider is the prerequisite for future profitable growth, since only through continuous technology advancements and the corresponding investments will AT&S be able to secure its position as a tier-one sup-plier for technology and world market leaders.
Effects from the financial year 2016/17 will continue and also influence the business development in 2017/18: the market development for IC substrates, based on the deceleration of Moore’s Law and lower demand for computing applications (desktop computers, notebooks), lead to continued price pressure on IC substrates.
Serial production for the next technology generation (mSAP) for mobile devices will start in the second quar-ter of the financial year 2017/18; this technology is currently being installed in Shanghai and in the second plant in Chongqing, with the aim to continue to position AT&S as a leading supplier for mobile devices.
For the core business, AT&S expects continued stable or growing demand in an extremely competitive envi-ronment in all customer segments in the financial year 2017/18.
Provided that the macroeconomic environment remains stable and the USD/EUR currency relation remains at a similar level as in the past financial year, AT&S expects an increase in revenue of 10–16% for the financial year 2017/18. The EBITDA margin should range between 16–18% based on the market developments for IC substrates and the ramp of the next technology generation (mSAP). Higher depreciation for mainly new production lines of roughly € 25 million in the financial year 2017/18 will influence EBIT.
Leoben-Hinterberg, 8 May 2017
The Management Board
Andreas Gerstenmayer m.p. Karl Asamer m.p. Heinz Moitzi m.p.
Outlook 9.
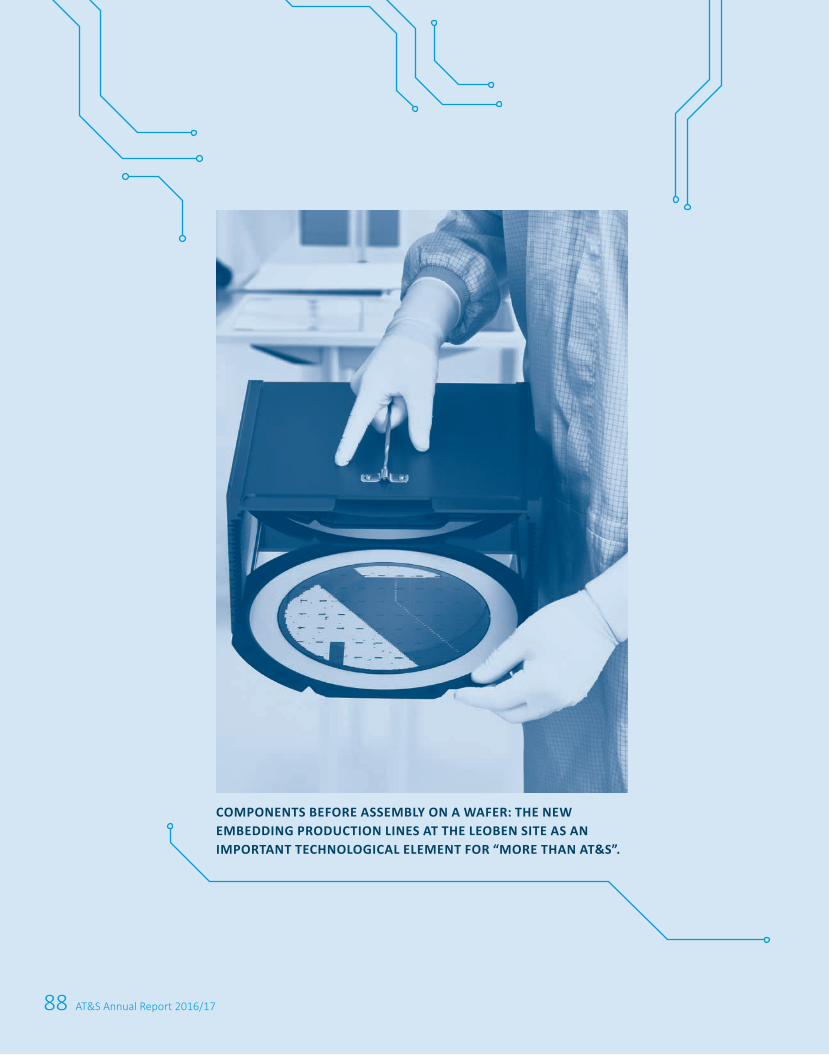
88 AT&S Annual Report 2016/17
COMPONENTS BEFORE ASSEMBLY ON A WAFER: THE NEW EMBEDDING PRODUCTION LINES AT THE LEOBEN SITE AS ANIMPORTANT TECHNOLOGICAL ELEMENT FOR “MORE THAN AT&S”.
89Consolidated Financial Statements
Table of Contents
Consolidated Statement of Profit or Loss 90
Consolidated Statement of Comprehensive Income 90
Consolidated Statement of Financial Position 91
Consolidated Statement of Cash Flows 92
Consolidated Statement of Changes in Equity 93
Notes to the Consolidated Financial Statements 94
Consolidated Financial Statementsas of 31 March 2017
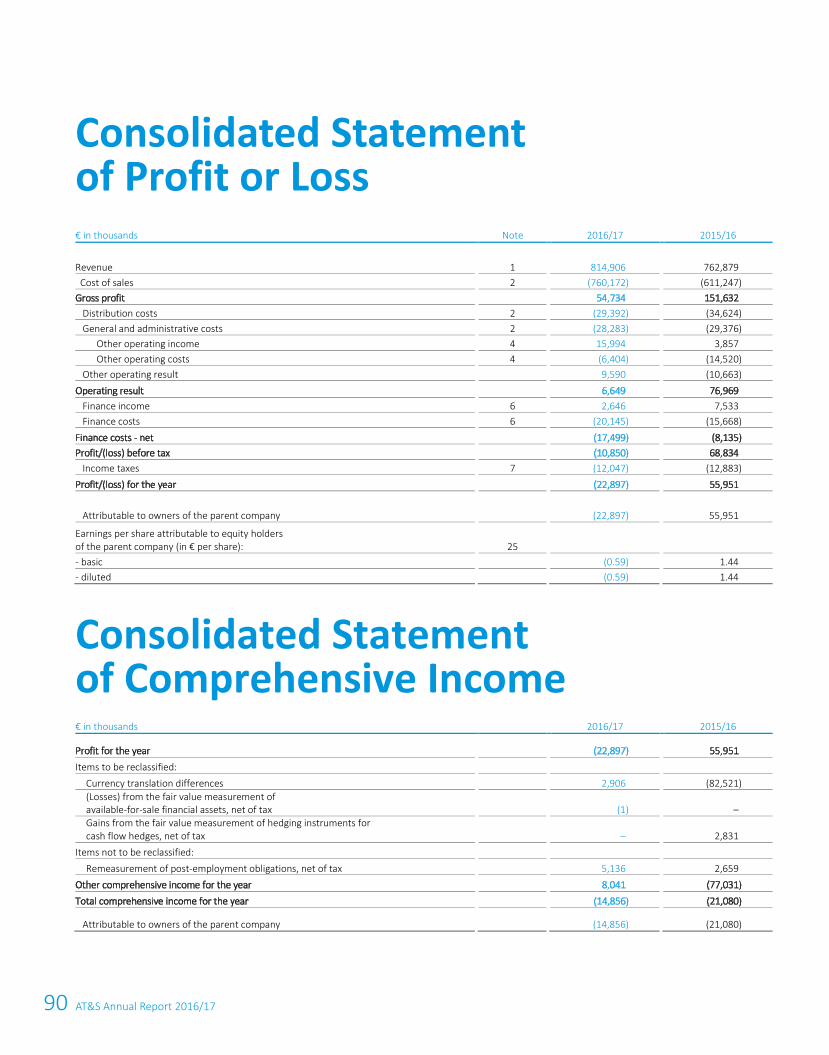
90 AT&S Annual Report 2016/17
72 AT&S Annual Report 2016/17
€ in thousands Note 2016/17 2015/16
Revenue
1 814,906
762,879
Cost of sales
2 (760,172)
(611,247)
Gross profit
54,734 151,632
Distribution costs
2 (29,392)
(34,624)
General and administrative costs
2 (28,283)
(29,376)
Other operating income
4 15,994
3,857
Other operating costs
4 (6,404)
(14,520)
Other operating result
9,590 (10,663)
Operating result
6,649
76,969
Finance income
6 2,646
7,533
Finance costs
6 (20,145)
(15,668)
Finance costs - net
(17,499)
(8,135)
Profit/(loss) before tax
(10,850) 68,834
Income taxes
7 (12,047)
(12,883)
Profit/(loss) for the year
(22,897)
55,951
Attributable to owners of the parent company
(22,897) 55,951
Earnings per share attributable to equity holders of the parent company (in € per share):
25
- basic
(0.59) 1.44
- diluted
(0.59)
1.44
Consolidated Statement of Comprehensive Income € in thousands 2016/17 2015/16
Profit for the year (22,897) 55,951 Items to be reclassified:
Currency translation differences 2,906 (82,521) (Losses) from the fair value measurement of available-for-sale financial assets, net of tax (1) – Gains from the fair value measurement of hedging instruments for cash flow hedges, net of tax – 2,831
Items not to be reclassified: 5,136 2659 Remeasurement of post-employment obligations, net of tax 5,136 2,659
Other comprehensive income for the year 8,041 (77,031) Total comprehensive income for the year (14,856) (21,080)
Attributable to owners of the parent company (14,856) (21,080)
Consolidated Statement of Profit or Loss
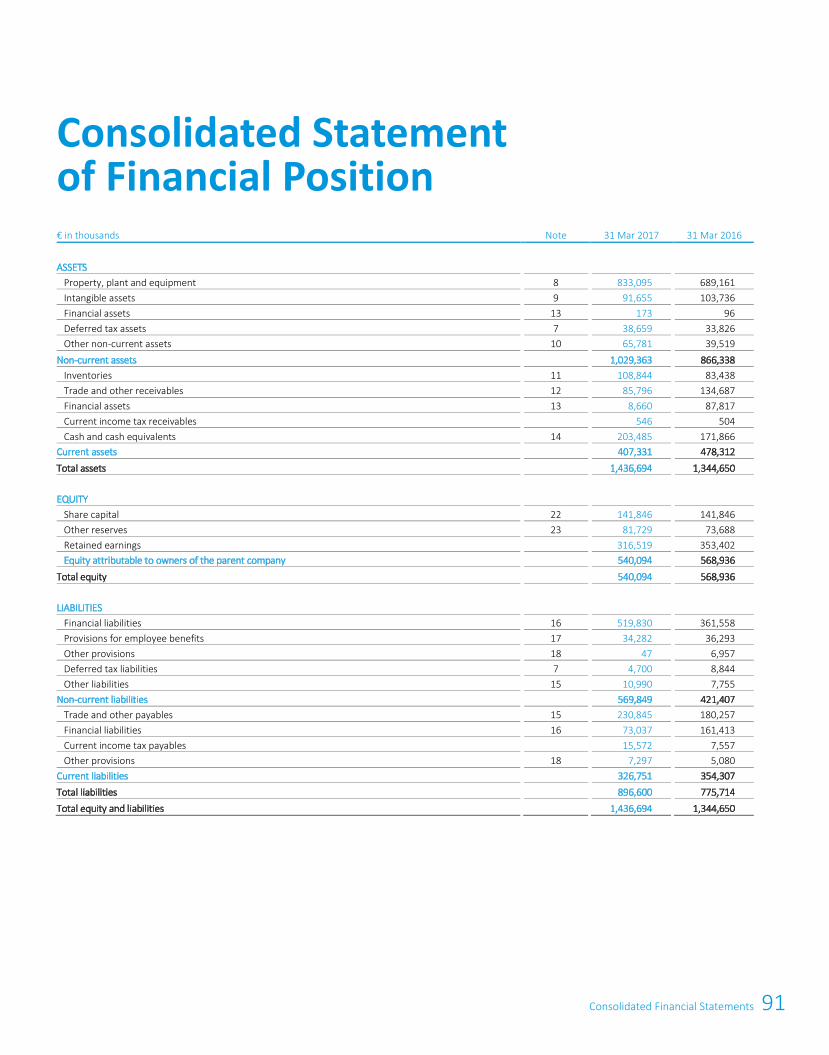
91Consolidated Financial Statements
72 AT&S Annual Report 2016/17
€ in thousands Note 2016/17 2015/16
Revenue
1 814,906
762,879
Cost of sales
2 (760,172)
(611,247)
Gross profit
54,734 151,632
Distribution costs
2 (29,392)
(34,624)
General and administrative costs
2 (28,283)
(29,376)
Other operating income
4 15,994
3,857
Other operating costs
4 (6,404)
(14,520)
Other operating result
9,590 (10,663)
Operating result
6,649
76,969
Finance income
6 2,646
7,533
Finance costs
6 (20,145)
(15,668)
Finance costs - net
(17,499)
(8,135)
Profit/(loss) before tax
(10,850) 68,834
Income taxes
7 (12,047)
(12,883)
Profit/(loss) for the year
(22,897)
55,951
Attributable to owners of the parent company
(22,897) 55,951
Earnings per share attributable to equity holders of the parent company (in € per share):
25
- basic
(0.59) 1.44
- diluted
(0.59)
1.44
Consolidated Statement of Comprehensive Income € in thousands 2016/17 2015/16
Profit for the year (22,897) 55,951 Items to be reclassified:
Currency translation differences 2,906 (82,521) (Losses) from the fair value measurement of available-for-sale financial assets, net of tax (1) – Gains from the fair value measurement of hedging instruments for cash flow hedges, net of tax – 2,831
Items not to be reclassified: 5,136 2659 Remeasurement of post-employment obligations, net of tax 5,136 2,659
Other comprehensive income for the year 8,041 (77,031) Total comprehensive income for the year (14,856) (21,080)
Attributable to owners of the parent company (14,856) (21,080)
Consolidated Statement of Profit or Loss
Consolidated Financial Statements 73
€ in thousands Note 31 Mar 2017 31 Mar 2016
ASSETS Property, plant and equipment
8 833,095
689,161
Intangible assets
9 91,655
103,736
Financial assets
13 173
96
Deferred tax assets
7 38,659
33,826
Other non-current assets
10 65,781
39,519
Non-current assets
1,029,363
866,338
Inventories
11 108,844
83,438
Trade and other receivables
12 85,796
134,687
Financial assets
13 8,660
87,817
Current income tax receivables
546 504
Cash and cash equivalents
14 203,485
171,866
Current assets
407,331
478,312
Total assets
1,436,694
1,344,650
EQUITY
Share capital
22 141,846
141,846
Other reserves
23 81,729
73,688
Retained earnings
316,519
353,402
Equity attributable to owners of the parent company
540,094
568,936
Total equity
540,094
568,936
LIABILITIES
Financial liabilities
16 519,830
361,558
Provisions for employee benefits
17 34,282
36,293
Other provisions
18 47
6,957
Deferred tax liabilities
7 4,700
8,844
Other liabilities
15 10,990
7,755
Non-current liabilities
569,849
421,407
Trade and other payables
15 230,845
180,257
Financial liabilities
16 73,037
161,413
Current income tax payables
15,572 7,557
Other provisions
18 7,297
5,080
Current liabilities
326,751
354,307
Total liabilities
896,600
775,714
Total equity and liabilities
1,436,694
1,344,650
Consolidated Statement of Financial Position
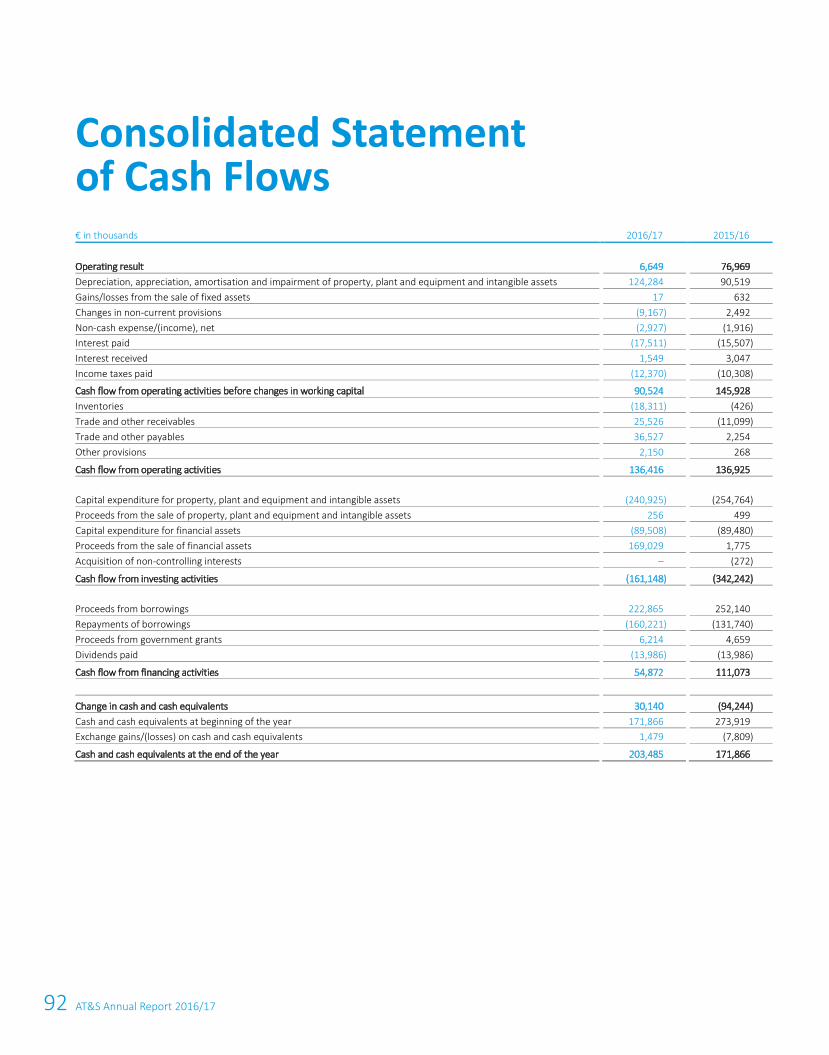
92 AT&S Annual Report 2016/17
74 AT&S Annual Report 2016/17
€ in thousands 2016/17 2015/16
Operating result 6,649
76,969
Depreciation, appreciation, amortisation and impairment of property, plant and equipment and intangible assets 124,284
90,519
Gains/losses from the sale of fixed assets 17
632
Changes in non-current provisions (9,167)
2,492
Non-cash expense/(income), net (2,927)
(1,916)
Interest paid (17,511)
(15,507)
Interest received 1,549
3,047
Income taxes paid (12,370)
(10,308)
Cash flow from operating activities before changes in working capital 90,524
145,928
Inventories (18,311)
(426)
Trade and other receivables 25,526
(11,099)
Trade and other payables 36,527
2,254
Other provisions 2,150
268
Cash flow from operating activities 136,416
136,925
Capital expenditure for property, plant and equipment and intangible assets (240,925)
(254,764)
Proceeds from the sale of property, plant and equipment and intangible assets 256
499
Capital expenditure for financial assets (89,508)
(89,480)
Proceeds from the sale of financial assets 169,029
1,775
Acquisition of non-controlling interests –
(272)
Cash flow from investing activities (161,148)
(342,242)
Proceeds from borrowings 222,865
252,140
Repayments of borrowings (160,221)
(131,740)
Proceeds from government grants 6,214
4,659
Dividends paid (13,986)
(13,986)
Cash flow from financing activities 54,872
111,073
Change in cash and cash equivalents 30,140
(94,244)
Cash and cash equivalents at beginning of the year 171,866
273,919
Exchange gains/(losses) on cash and cash equivalents 1,479
(7,809)
Cash and cash equivalents at the end of the year 203,485
171,866
Consolidated Statement of Cash Flows
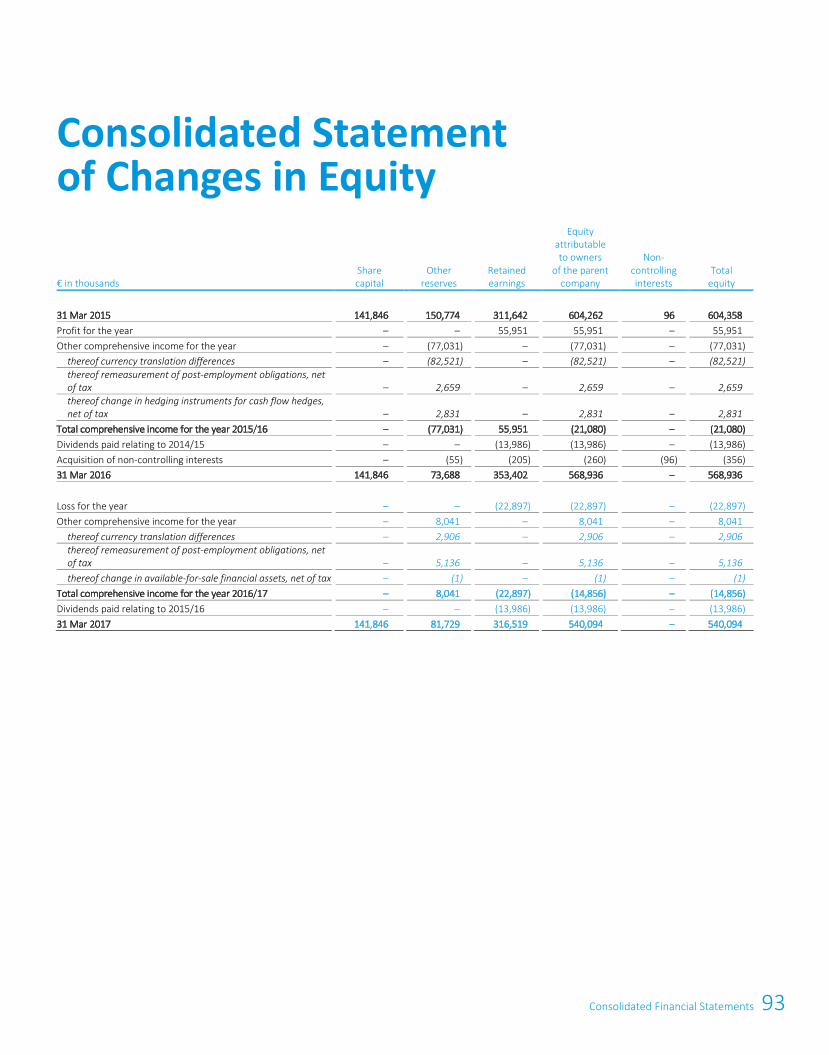
93Consolidated Financial Statements
74 AT&S Annual Report 2016/17
€ in thousands 2016/17 2015/16
Operating result 6,649
76,969
Depreciation, appreciation, amortisation and impairment of property, plant and equipment and intangible assets 124,284
90,519
Gains/losses from the sale of fixed assets 17
632
Changes in non-current provisions (9,167)
2,492
Non-cash expense/(income), net (2,927)
(1,916)
Interest paid (17,511)
(15,507)
Interest received 1,549
3,047
Income taxes paid (12,370)
(10,308)
Cash flow from operating activities before changes in working capital 90,524
145,928
Inventories (18,311)
(426)
Trade and other receivables 25,526
(11,099)
Trade and other payables 36,527
2,254
Other provisions 2,150
268
Cash flow from operating activities 136,416
136,925
Capital expenditure for property, plant and equipment and intangible assets (240,925)
(254,764)
Proceeds from the sale of property, plant and equipment and intangible assets 256
499
Capital expenditure for financial assets (89,508)
(89,480)
Proceeds from the sale of financial assets 169,029
1,775
Acquisition of non-controlling interests –
(272)
Cash flow from investing activities (161,148)
(342,242)
Proceeds from borrowings 222,865
252,140
Repayments of borrowings (160,221)
(131,740)
Proceeds from government grants 6,214
4,659
Dividends paid (13,986)
(13,986)
Cash flow from financing activities 54,872
111,073
Change in cash and cash equivalents 30,140
(94,244)
Cash and cash equivalents at beginning of the year 171,866
273,919
Exchange gains/(losses) on cash and cash equivalents 1,479
(7,809)
Cash and cash equivalents at the end of the year 203,485
171,866
Consolidated Statement of Cash Flows
Consolidated Financial Statements 75
€ in thousands Share capital
Other reserves
Retained earnings
Equity attributable to owners
of the parent company
Non- controlling interests
Total equity
31 Mar 2015 141,846
150,774
311,642
604,262
96
604,358
Profit for the year –
–
55,951
55,951
–
55,951
Other comprehensive income for the year –
(77,031)
–
(77,031)
–
(77,031)
thereof currency translation differences –
(82,521)
–
(82,521)
–
(82,521)
thereof remeasurement of post-employment obligations, net of tax
–
2,659
–
2,659
–
2,659
thereof change in hedging instruments for cash flow hedges, net of tax
–
2,831
–
2,831
–
2,831
Total comprehensive income for the year 2015/16 –
(77,031)
55,951
(21,080)
–
(21,080)
Dividends paid relating to 2014/15 –
–
(13,986)
(13,986)
–
(13,986)
Acquisition of non-controlling interests –
(55)
(205)
(260)
(96)
(356)
31 Mar 2016 141,846
73,688
353,402
568,936
–
568,936
Loss for the year –
–
(22,897)
(22,897)
–
(22,897)
Other comprehensive income for the year –
8,041
–
8,041
–
8,041
thereof currency translation differences –
2,906
–
2,906
–
2,906
thereof remeasurement of post-employment obligations, net of tax
–
5,136
–
5,136
–
5,136
thereof change in available-for-sale financial assets, net of tax –
(1)
–
(1)
–
(1)
Total comprehensive income for the year 2016/17 –
8,041
(22,897)
(14,856)
–
(14,856)
Dividends paid relating to 2015/16 –
–
(13,986)
(13,986)
–
(13,986)
31 Mar 2017 141,846
81,729
316,519
540,094
–
540,094
Consolidated Statement of Changes in Equity
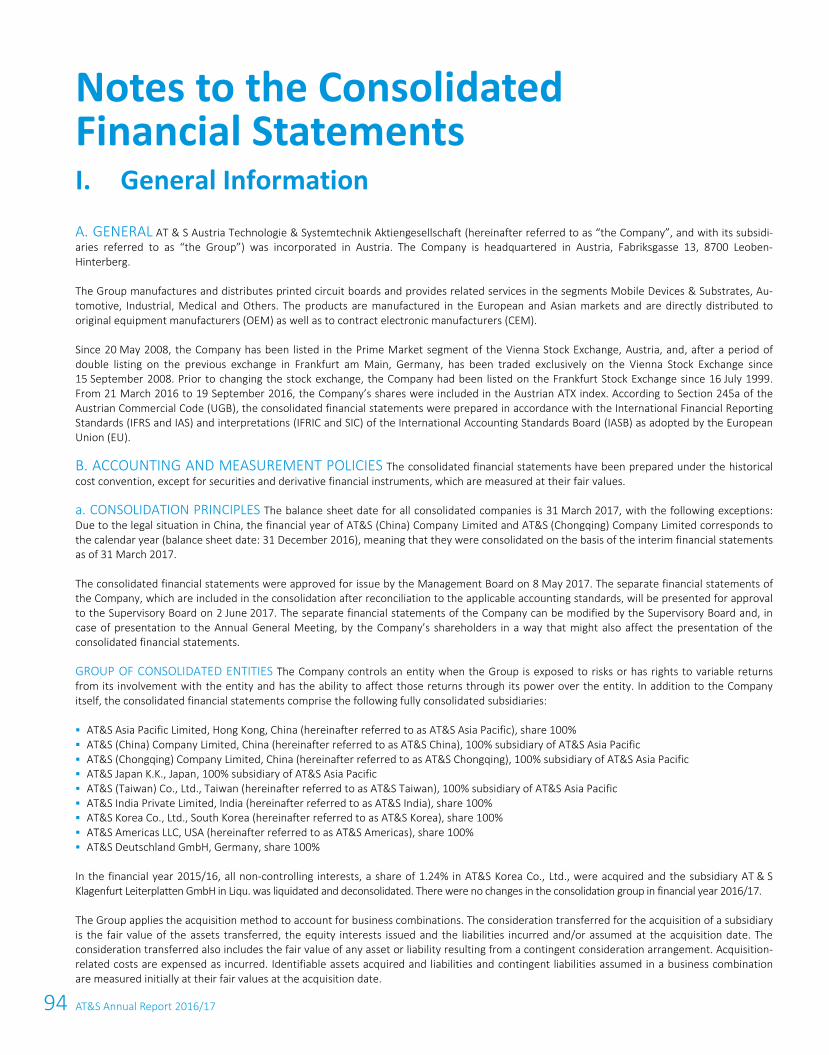
94 AT&S Annual Report 2016/17
76 AT&S Annual Report 2016/17
GENERAL AT & S Austria Technologie & Systemtechnik Aktiengesellschaft (hereinafter referred to as “the Company”, and with its subsidi-A.aries referred to as “the Group”) was incorporated in Austria. The Company is headquartered in Austria, Fabriksgasse 13, 8700 Leoben-Hinterberg.
The Group manufactures and distributes printed circuit boards and provides related services in the segments Mobile Devices & Substrates, Au-tomotive, Industrial, Medical and Others. The products are manufactured in the European and Asian markets and are directly distributed to original equipment manufacturers (OEM) as well as to contract electronic manufacturers (CEM).
Since 20 May 2008, the Company has been listed in the Prime Market segment of the Vienna Stock Exchange, Austria, and, after a period of double listing on the previous exchange in Frankfurt am Main, Germany, has been traded exclusively on the Vienna Stock Exchange since 15 September 2008. Prior to changing the stock exchange, the Company had been listed on the Frankfurt Stock Exchange since 16 July 1999. From 21 March 2016 to 19 September 2016, the Company’s shares were included in the Austrian ATX index. According to Section 245a of the Austrian Commercial Code (UGB), the consolidated financial statements were prepared in accordance with the International Financial Reporting Standards (IFRS and IAS) and interpretations (IFRIC and SIC) of the International Accounting Standards Board (IASB) as adopted by the European Union (EU).
ACCOUNTING AND MEASUREMENT POLICIES The consolidated financial statements have been prepared under the historical B.cost convention, except for securities and derivative financial instruments, which are measured at their fair values.
a. CONSOLIDATION PRINCIPLES The balance sheet date for all consolidated companies is 31 March 2017, with the following exceptions: Due to the legal situation in China, the financial year of AT&S (China) Company Limited and AT&S (Chongqing) Company Limited corresponds to the calendar year (balance sheet date: 31 December 2016), meaning that they were consolidated on the basis of the interim financial statements as of 31 March 2017.
The consolidated financial statements were approved for issue by the Management Board on 8 May 2017. The separate financial statements of the Company, which are included in the consolidation after reconciliation to the applicable accounting standards, will be presented for approval to the Supervisory Board on 2 June 2017. The separate financial statements of the Company can be modified by the Supervisory Board and, in case of presentation to the Annual General Meeting, by the Company’s shareholders in a way that might also affect the presentation of the consolidated financial statements.
GROUP OF CONSOLIDATED ENTITIES The Company controls an entity when the Group is exposed to risks or has rights to variable returns from its involvement with the entity and has the ability to affect those returns through its power over the entity. In addition to the Company itself, the consolidated financial statements comprise the following fully consolidated subsidiaries:
AT&S Asia Pacific Limited, Hong Kong, China (hereinafter referred to as AT&S Asia Pacific), share 100% AT&S (China) Company Limited, China (hereinafter referred to as AT&S China), 100% subsidiary of AT&S Asia Pacific AT&S (Chongqing) Company Limited, China (hereinafter referred to as AT&S Chongqing), 100% subsidiary of AT&S Asia Pacific AT&S Japan K.K., Japan, 100% subsidiary of AT&S Asia Pacific AT&S (Taiwan) Co., Ltd., Taiwan (hereinafter referred to as AT&S Taiwan), 100% subsidiary of AT&S Asia Pacific AT&S India Private Limited, India (hereinafter referred to as AT&S India), share 100% AT&S Korea Co., Ltd., South Korea (hereinafter referred to as AT&S Korea), share 100% AT&S Americas LLC, USA (hereinafter referred to as AT&S Americas), share 100% AT&S Deutschland GmbH, Germany, share 100%
In the financial year 2015/16, all non-controlling interests, a share of 1.24% in AT&S Korea Co., Ltd., were acquired and the subsidiary AT & S Klagenfurt Leiterplatten GmbH in Liqu. was liquidated and deconsolidated. There were no changes in the consolidation group in financial year 2016/17.
The Group applies the acquisition method to account for business combinations. The consideration transferred for the acquisition of a subsidiary is the fair value of the assets transferred, the equity interests issued and the liabilities incurred and/or assumed at the acquisition date. The consideration transferred also includes the fair value of any asset or liability resulting from a contingent consideration arrangement. Acquisition-related costs are expensed as incurred. Identifiable assets acquired and liabilities and contingent liabilities assumed in a business combination are measured initially at their fair values at the acquisition date.
Notes to the Consolidated Financial Statements I. General Information
95Consolidated Financial Statements
76 AT&S Annual Report 2016/17
GENERAL AT & S Austria Technologie & Systemtechnik Aktiengesellschaft (hereinafter referred to as “the Company”, and with its subsidi-A.aries referred to as “the Group”) was incorporated in Austria. The Company is headquartered in Austria, Fabriksgasse 13, 8700 Leoben-Hinterberg.
The Group manufactures and distributes printed circuit boards and provides related services in the segments Mobile Devices & Substrates, Au-tomotive, Industrial, Medical and Others. The products are manufactured in the European and Asian markets and are directly distributed to original equipment manufacturers (OEM) as well as to contract electronic manufacturers (CEM).
Since 20 May 2008, the Company has been listed in the Prime Market segment of the Vienna Stock Exchange, Austria, and, after a period of double listing on the previous exchange in Frankfurt am Main, Germany, has been traded exclusively on the Vienna Stock Exchange since 15 September 2008. Prior to changing the stock exchange, the Company had been listed on the Frankfurt Stock Exchange since 16 July 1999. From 21 March 2016 to 19 September 2016, the Company’s shares were included in the Austrian ATX index. According to Section 245a of the Austrian Commercial Code (UGB), the consolidated financial statements were prepared in accordance with the International Financial Reporting Standards (IFRS and IAS) and interpretations (IFRIC and SIC) of the International Accounting Standards Board (IASB) as adopted by the European Union (EU).
ACCOUNTING AND MEASUREMENT POLICIES The consolidated financial statements have been prepared under the historical B.cost convention, except for securities and derivative financial instruments, which are measured at their fair values.
a. CONSOLIDATION PRINCIPLES The balance sheet date for all consolidated companies is 31 March 2017, with the following exceptions: Due to the legal situation in China, the financial year of AT&S (China) Company Limited and AT&S (Chongqing) Company Limited corresponds to the calendar year (balance sheet date: 31 December 2016), meaning that they were consolidated on the basis of the interim financial statements as of 31 March 2017.
The consolidated financial statements were approved for issue by the Management Board on 8 May 2017. The separate financial statements of the Company, which are included in the consolidation after reconciliation to the applicable accounting standards, will be presented for approval to the Supervisory Board on 2 June 2017. The separate financial statements of the Company can be modified by the Supervisory Board and, in case of presentation to the Annual General Meeting, by the Company’s shareholders in a way that might also affect the presentation of the consolidated financial statements.
GROUP OF CONSOLIDATED ENTITIES The Company controls an entity when the Group is exposed to risks or has rights to variable returns from its involvement with the entity and has the ability to affect those returns through its power over the entity. In addition to the Company itself, the consolidated financial statements comprise the following fully consolidated subsidiaries:
AT&S Asia Pacific Limited, Hong Kong, China (hereinafter referred to as AT&S Asia Pacific), share 100% AT&S (China) Company Limited, China (hereinafter referred to as AT&S China), 100% subsidiary of AT&S Asia Pacific AT&S (Chongqing) Company Limited, China (hereinafter referred to as AT&S Chongqing), 100% subsidiary of AT&S Asia Pacific AT&S Japan K.K., Japan, 100% subsidiary of AT&S Asia Pacific AT&S (Taiwan) Co., Ltd., Taiwan (hereinafter referred to as AT&S Taiwan), 100% subsidiary of AT&S Asia Pacific AT&S India Private Limited, India (hereinafter referred to as AT&S India), share 100% AT&S Korea Co., Ltd., South Korea (hereinafter referred to as AT&S Korea), share 100% AT&S Americas LLC, USA (hereinafter referred to as AT&S Americas), share 100% AT&S Deutschland GmbH, Germany, share 100%
In the financial year 2015/16, all non-controlling interests, a share of 1.24% in AT&S Korea Co., Ltd., were acquired and the subsidiary AT & S Klagenfurt Leiterplatten GmbH in Liqu. was liquidated and deconsolidated. There were no changes in the consolidation group in financial year 2016/17.
The Group applies the acquisition method to account for business combinations. The consideration transferred for the acquisition of a subsidiary is the fair value of the assets transferred, the equity interests issued and the liabilities incurred and/or assumed at the acquisition date. The consideration transferred also includes the fair value of any asset or liability resulting from a contingent consideration arrangement. Acquisition-related costs are expensed as incurred. Identifiable assets acquired and liabilities and contingent liabilities assumed in a business combination are measured initially at their fair values at the acquisition date.
Notes to the Consolidated Financial Statements I. General Information
Consolidated Financial Statements 77
For each business combination, the Group measures any non-controlling interest in the acquiree either at fair value or at the non-controlling interest’s proportionate share of the acquiree’s identifiable net assets and, accordingly, recognises the full or proportional goodwill. If the con-sideration transferred is less than the fair value of the net assets of the subsidiary acquired, the difference is recognised directly in profit or loss.
When the Group ceases to have control or significant influence over a company, any retained interest in the entity is remeasured to its fair value, with the change in carrying amount recognised in profit or loss. The fair value is the fair value determined at initial recognition of an associate, joint venture or financial asset. In addition, any amounts recognised in other comprehensive income in respect of that entity are accounted for as if the parent company had directly disposed of the related assets or liabilities. This means that a profit or loss previously recognised in other comprehensive income is reclassified from equity to profit or loss.
METHODS OF CONSOLIDATION All significant intercompany balances and transactions have been eliminated so that the consolidated finan-cial statements present the accounting information of the Group as if it were one single company.
Capital consolidation is made in accordance with IFRS 3 “Business Combinations” and IFRS 10 “Consolidated Financial Statements”. Intercompa-ny accounts receivable and payable as well as expenses and income are eliminated. Unless immaterial, intercompany results in non-current assets and inventories are eliminated. Furthermore, uniform accounting and measurement methods are applied to all consolidated subsidiaries.
The Group considers transactions with non-controlling interests as transactions with equity holders of the Group. When non-controlling interests are acquired, the difference between the acquisition costs and the attributable share of net assets acquired in the subsidiary is deducted from equity. Gains or losses on the sale of non-controlling interests are also recognised in equity.
b. SEGMENT REPORTING The definition of operating segments and the presentation of segment results are based on the management approach and follow internal reports to the Management Board as the chief operating decision maker, i.e. the body that decides on the alloca-tion of resources to the individual segments. An operating segment is a component of an entity that engages in business activities and whose operating results are reviewed regularly by the entity’s chief operating decision-maker. Business activities involve earning revenues and incurring expenses, and these may also relate to business transactions with other operating segments of the entity. Separate financial information is avail-able for the individual operating segments.
The AT&S group structures the operating activities in three Segments:
Mobile Devices & Substrates Automotive, Industrial, Medical Others
The business unit Mobile Devices & Substrates is responsible for the production of printed circuit boards for mobile end-user devices such as smartphones, tablets, notebooks and consumer products like digital cameras as well as substrates for desktop PCs and servers. The printed circuit boards for these applications are largely produced in our Shanghai (AT&S China) and Chongqing (AT&S Chongqing) plants.
The business unit Automotive, Industrial, Medical supplies customers in the fields of automotive supplies, industrial applications, medical tech-nology, aerospace, security and other sectors. Production for this business segment mainly takes place at our plants in India, Korea and Austria.
The activities of the emerging business segment Advanced Packaging and parent group activities are included in the business unit Others. Ad-vanced Packaging specialises in new, technologically highly-advanced applications. A variety of electronical components are integrated directly into printed circuit boards in order to enable further reductions in the size of end-user devices while also enhancing the functionality. This new technology is useful in a wide range of applications. This business segment is still under development and is therefore not yet shown separately, since neither the quantitive threshold reached nor the associated opportunities and risks are material to the Group as a whole.
c. FOREIGN CURRENCIES The Group’s presentation currency is the euro (€). The functional currency of the foreign subsidiaries is the re-spective local currency.
FOREIGN SUBSIDIARIES With the exception of equity positions (historical exchange rate), the balance sheets of AT&S India, AT&S China, AT&S Asia Pacific, AT&S Japan K.K., AT&S Korea, AT&S Americas, AT&S Chongqing and AT&S Taiwan are translated at the exchange rates on the bal-
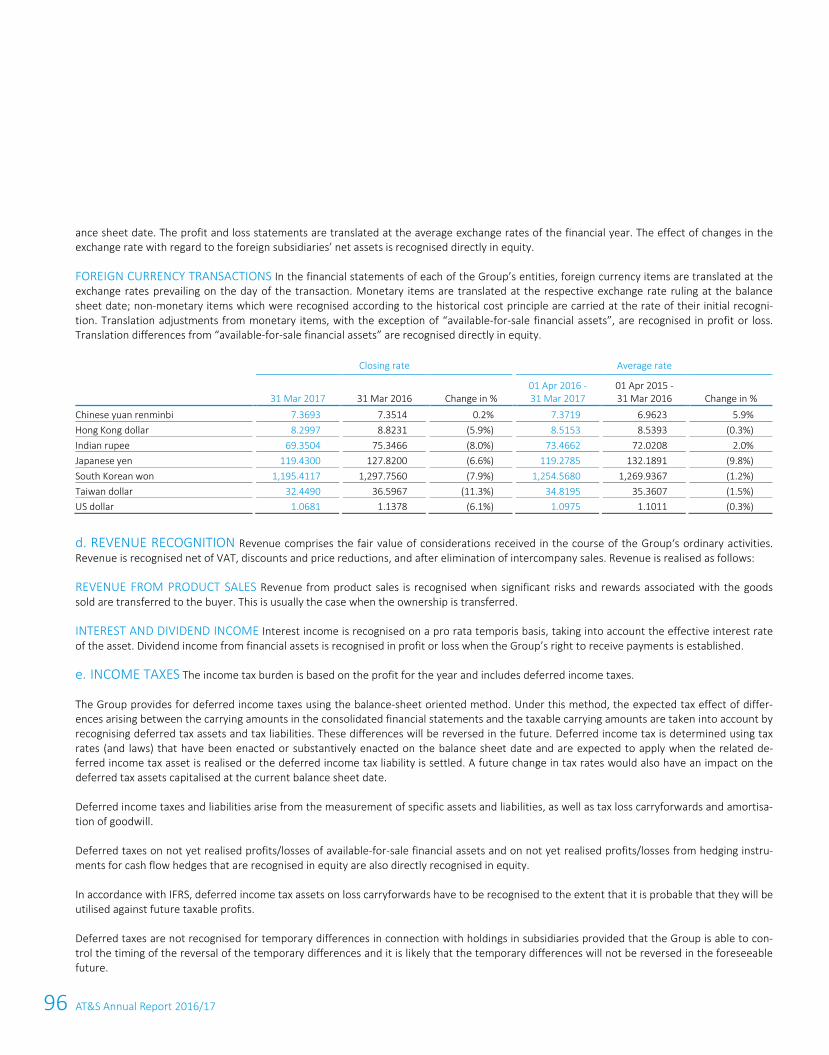
96 AT&S Annual Report 2016/17
78 AT&S Annual Report 2016/17
ance sheet date. The profit and loss statements are translated at the average exchange rates of the financial year. The effect of changes in the exchange rate with regard to the foreign subsidiaries’ net assets is recognised directly in equity.
FOREIGN CURRENCY TRANSACTIONS In the financial statements of each of the Group’s entities, foreign currency items are translated at the exchange rates prevailing on the day of the transaction. Monetary items are translated at the respective exchange rate ruling at the balance sheet date; non-monetary items which were recognised according to the historical cost principle are carried at the rate of their initial recogni-tion. Translation adjustments from monetary items, with the exception of “available-for-sale financial assets”, are recognised in profit or loss. Translation differences from “available-for-sale financial assets” are recognised directly in equity.
Closing rate
Average rate
31 Mar 2017 31 Mar 2016 Change in % 01 Apr 2016 - 31 Mar 2017
01 Apr 2015 - 31 Mar 2016 Change in %
Chinese yuan renminbi 7.3693
7.3514
0.2%
7.3719
6.9623
5.9%
Hong Kong dollar 8.2997
8.8231
(5.9%)
8.5153
8.5393
(0.3%)
Indian rupee 69.3504
75.3466
(8.0%)
73.4662
72.0208
2.0%
Japanese yen 119.4300
127.8200
(6.6%)
119.2785
132.1891
(9.8%)
South Korean won 1,195.4117
1,297.7560
(7.9%)
1,254.5680
1,269.9367
(1.2%)
Taiwan dollar 32.4490
36.5967
(11.3%)
34.8195
35.3607
(1.5%)
US dollar 1.0681
1.1378
(6.1%)
1.0975
1.1011
(0.3%)
d. REVENUE RECOGNITION Revenue comprises the fair value of considerations received in the course of the Group‘s ordinary activities. Revenue is recognised net of VAT, discounts and price reductions, and after elimination of intercompany sales. Revenue is realised as follows:
REVENUE FROM PRODUCT SALES Revenue from product sales is recognised when significant risks and rewards associated with the goods sold are transferred to the buyer. This is usually the case when the ownership is transferred.
INTEREST AND DIVIDEND INCOME Interest income is recognised on a pro rata temporis basis, taking into account the effective interest rate of the asset. Dividend income from financial assets is recognised in profit or loss when the Group’s right to receive payments is established.
e. INCOME TAXES The income tax burden is based on the profit for the year and includes deferred income taxes.
The Group provides for deferred income taxes using the balance-sheet oriented method. Under this method, the expected tax effect of differ-ences arising between the carrying amounts in the consolidated financial statements and the taxable carrying amounts are taken into account by recognising deferred tax assets and tax liabilities. These differences will be reversed in the future. Deferred income tax is determined using tax rates (and laws) that have been enacted or substantively enacted on the balance sheet date and are expected to apply when the related de-ferred income tax asset is realised or the deferred income tax liability is settled. A future change in tax rates would also have an impact on the deferred tax assets capitalised at the current balance sheet date.
Deferred income taxes and liabilities arise from the measurement of specific assets and liabilities, as well as tax loss carryforwards and amortisa-tion of goodwill.
Deferred taxes on not yet realised profits/losses of available-for-sale financial assets and on not yet realised profits/losses from hedging instru-ments for cash flow hedges that are recognised in equity are also directly recognised in equity.
In accordance with IFRS, deferred income tax assets on loss carryforwards have to be recognised to the extent that it is probable that they will be utilised against future taxable profits.
Deferred taxes are not recognised for temporary differences in connection with holdings in subsidiaries provided that the Group is able to con-trol the timing of the reversal of the temporary differences and it is likely that the temporary differences will not be reversed in the foreseeable future.
97Consolidated Financial Statements
78 AT&S Annual Report 2016/17
ance sheet date. The profit and loss statements are translated at the average exchange rates of the financial year. The effect of changes in the exchange rate with regard to the foreign subsidiaries’ net assets is recognised directly in equity.
FOREIGN CURRENCY TRANSACTIONS In the financial statements of each of the Group’s entities, foreign currency items are translated at the exchange rates prevailing on the day of the transaction. Monetary items are translated at the respective exchange rate ruling at the balance sheet date; non-monetary items which were recognised according to the historical cost principle are carried at the rate of their initial recogni-tion. Translation adjustments from monetary items, with the exception of “available-for-sale financial assets”, are recognised in profit or loss. Translation differences from “available-for-sale financial assets” are recognised directly in equity.
Closing rate
Average rate
31 Mar 2017 31 Mar 2016 Change in % 01 Apr 2016 - 31 Mar 2017
01 Apr 2015 - 31 Mar 2016 Change in %
Chinese yuan renminbi 7.3693
7.3514
0.2%
7.3719
6.9623
5.9%
Hong Kong dollar 8.2997
8.8231
(5.9%)
8.5153
8.5393
(0.3%)
Indian rupee 69.3504
75.3466
(8.0%)
73.4662
72.0208
2.0%
Japanese yen 119.4300
127.8200
(6.6%)
119.2785
132.1891
(9.8%)
South Korean won 1,195.4117
1,297.7560
(7.9%)
1,254.5680
1,269.9367
(1.2%)
Taiwan dollar 32.4490
36.5967
(11.3%)
34.8195
35.3607
(1.5%)
US dollar 1.0681
1.1378
(6.1%)
1.0975
1.1011
(0.3%)
d. REVENUE RECOGNITION Revenue comprises the fair value of considerations received in the course of the Group‘s ordinary activities. Revenue is recognised net of VAT, discounts and price reductions, and after elimination of intercompany sales. Revenue is realised as follows:
REVENUE FROM PRODUCT SALES Revenue from product sales is recognised when significant risks and rewards associated with the goods sold are transferred to the buyer. This is usually the case when the ownership is transferred.
INTEREST AND DIVIDEND INCOME Interest income is recognised on a pro rata temporis basis, taking into account the effective interest rate of the asset. Dividend income from financial assets is recognised in profit or loss when the Group’s right to receive payments is established.
e. INCOME TAXES The income tax burden is based on the profit for the year and includes deferred income taxes.
The Group provides for deferred income taxes using the balance-sheet oriented method. Under this method, the expected tax effect of differ-ences arising between the carrying amounts in the consolidated financial statements and the taxable carrying amounts are taken into account by recognising deferred tax assets and tax liabilities. These differences will be reversed in the future. Deferred income tax is determined using tax rates (and laws) that have been enacted or substantively enacted on the balance sheet date and are expected to apply when the related de-ferred income tax asset is realised or the deferred income tax liability is settled. A future change in tax rates would also have an impact on the deferred tax assets capitalised at the current balance sheet date.
Deferred income taxes and liabilities arise from the measurement of specific assets and liabilities, as well as tax loss carryforwards and amortisa-tion of goodwill.
Deferred taxes on not yet realised profits/losses of available-for-sale financial assets and on not yet realised profits/losses from hedging instru-ments for cash flow hedges that are recognised in equity are also directly recognised in equity.
In accordance with IFRS, deferred income tax assets on loss carryforwards have to be recognised to the extent that it is probable that they will be utilised against future taxable profits.
Deferred taxes are not recognised for temporary differences in connection with holdings in subsidiaries provided that the Group is able to con-trol the timing of the reversal of the temporary differences and it is likely that the temporary differences will not be reversed in the foreseeable future.
Consolidated Financial Statements 79
f. PROPERTY, PLANT AND EQUIPMENT Items of property, plant and equipment are measured at cost. Expenditure directly attributable to the acquisition and subsequent expenditure is capitalised; repairs and maintenance costs, however, are expensed as incurred.
Borrowing costs directly attributable to the acquisition, construction or production of a qualifying asset are capitalised as part of the acquisition or production costs of this asset in accordance with IAS 23.
From the time of their availability for use, the assets are depreciated on a straight-line basis over their expected useful lives. Depreciation is charged on a pro rata temporis basis. Land is not subject to depreciation.
Scheduled depreciation is based on the following useful lives applicable throughout the Group:
Plants and buildings 10–50 years Machinery and technical equipment 4–15 years Tools, fixtures, furniture and office equipment 3–15 years
Depreciation periods and methods are reviewed annually at the end of the financial year.
In accordance with IAS 17 “Leases”, leased property, plant and equipment for which the Group bears substantially all the risks and rewards of ownership, and which in economic terms constitute asset purchases with long-term financing, are capitalised at their fair value or the lower present value of the minimum lease payments. Scheduled depreciation is effected over the useful life of the asset. If at the beginning of the lease it is not sufficiently certain that the title will pass to the lessee, the leased asset is depreciated over the shorter of the two periods, the lease term or useful life. Financial obligations resulting from future lease payments are discounted and carried as a liability. Current lease pay-ments are split into repayment and financing costs.
Leased assets under all other lease and rental agreements are classified as operating leases and attributed to the lessor. Lease payments are recognised as an expense.
Profits or losses resulting from the closure or retirement of non-current assets, which arise from the difference between the net realisable value and the carrying amounts, are recognised in profit or loss.
g. INTANGIBLE ASSETS
PATENTS, TRADEMARKS AND LICENSES Expenditure on acquired patents, trademarks and licenses is capitalised at cost, including incidental acquisition expenses, and amortised on a straight-line basis over useful life, generally between two and ten years. Amortisation terms and meth-ods are reviewed annually at the end of the financial year.
RESEARCH AND DEVELOPMENT COSTS Research costs are expensed as incurred and charged to cost of sales. Development costs are also expensed as incurred.
An intangible asset arising from development is recognised if, and only if, an entity can demonstrate all of the following: The technical feasibility of completing the intangible asset so that it will be available for use or sale. Its intention to complete the intangible asset and use or sell it. Its ability to use or sell the intangible asset. How the intangible asset will generate probable future economic benefits is verifiable. The availability of adequate technical, financial and other resources to complete the development and to use or sell the intangible asset. Its ability to reliably measure the expenditure attributable to the intangible asset during its development.
Capitalised development projects include all the directly attributable costs incurred as a result of development processes. Borrowing costs are capitalised if the development project is a qualifying asset in accordance with IAS 23. Development costs are amortised on a straight-line basis over a useful life from six to seven years, which is derived from the expected sales periods.
98 AT&S Annual Report 2016/17
80 AT&S Annual Report 2016/17
h. IMPAIRMENT LOSSES AND WRITE-UPS OF PROPERTY, PLANT AND EQUIPMENT, INTANGIBLE ASSETS The Group regularly reviews property, plant and equipment and intangible assets for possible impairment. If evidence for impairment exists, an impairment test is carried out without delay. Intangible assets in the development phase are tested annually for impairment. If the recoverable amount of the respective asset is below its carrying amount, an impairment loss amounting to the difference is recognised. The recoverable amount is the higher of an asset’s fair value less costs to sell and its value in use. The value in use corresponds to the estimated future cash flows expected from the continued use of the asset and its disposal at the end of its useful life. The discount rates applied correspond to the weighted cost of capital based on externally available capital market data that are typical in the industry and have been adapted to the specific risks.
If the reason for the impairment recognised in the past no longer exists, with the exception of goodwill, a reversal of impairment up to amortised cost is made.
i. INVENTORIES Inventories are stated at the lower of cost or net realisable value. Net realisable value is the estimated selling price in the ordinary course of business, less variable costs necessary to make the sale. Cost is determined by the first-in, first-out (FIFO) method. The cost of finished goods and work in progress comprises raw materials, direct labour, other direct costs and related production overheads. Interest on borrowed capital is not recognised.
j. TRADE AND OTHER RECEIVABLES Receivables are reported at nominal values, less any allowances for doubtful accounts. Foreign cur-rency receivables are translated at the average exchange rate prevailing at the balance sheet date. Risk management covers all recognisable credit and country-specific risks.
k. FINANCIAL ASSETS Financial assets are recognised and derecognised using settlement date accounting. The fair values recognised in the statement of financial position generally correspond to market prices of financial assets. Except for financial assets at fair value through profit or loss, they are recognised initially including transaction costs.
Financial assets are divided into the categories explained below. The classification depends on the respective purpose of the financial asset and is reviewed annually.
FINANCIAL ASSETS AT FAIR VALUE THROUGH PROFIT OR LOSS Financial instruments acquired primarily for the purpose of earning a profit from short-term fluctuations in prices or trader margins are classified as financial assets at fair value through profit or loss. At the time of their acquisition, they are stated at fair value, excluding transaction costs, and, in subsequent periods, at their respective fair values. Realised and unrealised gains and losses are recognised in profit or loss in “Finance costs - net”. This relates primarily to securities held for trading. Derivative financial instruments also fall into this category, unless hedge accounting is applied (refer to l. “Derivative financial instruments”).
SECURITIES HELD TO MATURITY Securities held to maturity are recognised at amortised cost using the effective interest rate method. Any impairment is recognised in profit or loss.
LOANS AND RECEIVABLES Loans and receivables are non-derivative financial assets with fixed or determinable payments that are not listed in an active market. In the statement of financial position, the respective assets are recognised under the item “Trade and other receivables”.
AVAILABLE-FOR-SALE FINANCIAL ASSETS Available-for-sale financial assets relate to securities available for sale. Available-for-sale securities are instruments which Management intends to sell as a reaction to expected liquidity requirements or expected changes in interest rates, ex-change rates or share prices. Their classification as non-current or current assets depends on the length of time for which they are expected to be held.
At the time of acquisition, they are stated at cost, including transaction costs, in subsequent periods, at their respective fair values. Unrealised gains and losses, net of income tax, are recognised in other comprehensive income and not taken through profit or loss until they are sold or considered as impaired.
Interest income and dividends from available-for-sale securities are recognised in profit or loss under “Finance costs - net”.
When an available-for-sale security is sold, the accumulated unrealised gain or loss previously recognised in equity is included in profit or loss for the reporting period in “Finance costs - net”.
99Consolidated Financial Statements
80 AT&S Annual Report 2016/17
h. IMPAIRMENT LOSSES AND WRITE-UPS OF PROPERTY, PLANT AND EQUIPMENT, INTANGIBLE ASSETS The Group regularly reviews property, plant and equipment and intangible assets for possible impairment. If evidence for impairment exists, an impairment test is carried out without delay. Intangible assets in the development phase are tested annually for impairment. If the recoverable amount of the respective asset is below its carrying amount, an impairment loss amounting to the difference is recognised. The recoverable amount is the higher of an asset’s fair value less costs to sell and its value in use. The value in use corresponds to the estimated future cash flows expected from the continued use of the asset and its disposal at the end of its useful life. The discount rates applied correspond to the weighted cost of capital based on externally available capital market data that are typical in the industry and have been adapted to the specific risks.
If the reason for the impairment recognised in the past no longer exists, with the exception of goodwill, a reversal of impairment up to amortised cost is made.
i. INVENTORIES Inventories are stated at the lower of cost or net realisable value. Net realisable value is the estimated selling price in the ordinary course of business, less variable costs necessary to make the sale. Cost is determined by the first-in, first-out (FIFO) method. The cost of finished goods and work in progress comprises raw materials, direct labour, other direct costs and related production overheads. Interest on borrowed capital is not recognised.
j. TRADE AND OTHER RECEIVABLES Receivables are reported at nominal values, less any allowances for doubtful accounts. Foreign cur-rency receivables are translated at the average exchange rate prevailing at the balance sheet date. Risk management covers all recognisable credit and country-specific risks.
k. FINANCIAL ASSETS Financial assets are recognised and derecognised using settlement date accounting. The fair values recognised in the statement of financial position generally correspond to market prices of financial assets. Except for financial assets at fair value through profit or loss, they are recognised initially including transaction costs.
Financial assets are divided into the categories explained below. The classification depends on the respective purpose of the financial asset and is reviewed annually.
FINANCIAL ASSETS AT FAIR VALUE THROUGH PROFIT OR LOSS Financial instruments acquired primarily for the purpose of earning a profit from short-term fluctuations in prices or trader margins are classified as financial assets at fair value through profit or loss. At the time of their acquisition, they are stated at fair value, excluding transaction costs, and, in subsequent periods, at their respective fair values. Realised and unrealised gains and losses are recognised in profit or loss in “Finance costs - net”. This relates primarily to securities held for trading. Derivative financial instruments also fall into this category, unless hedge accounting is applied (refer to l. “Derivative financial instruments”).
SECURITIES HELD TO MATURITY Securities held to maturity are recognised at amortised cost using the effective interest rate method. Any impairment is recognised in profit or loss.
LOANS AND RECEIVABLES Loans and receivables are non-derivative financial assets with fixed or determinable payments that are not listed in an active market. In the statement of financial position, the respective assets are recognised under the item “Trade and other receivables”.
AVAILABLE-FOR-SALE FINANCIAL ASSETS Available-for-sale financial assets relate to securities available for sale. Available-for-sale securities are instruments which Management intends to sell as a reaction to expected liquidity requirements or expected changes in interest rates, ex-change rates or share prices. Their classification as non-current or current assets depends on the length of time for which they are expected to be held.
At the time of acquisition, they are stated at cost, including transaction costs, in subsequent periods, at their respective fair values. Unrealised gains and losses, net of income tax, are recognised in other comprehensive income and not taken through profit or loss until they are sold or considered as impaired.
Interest income and dividends from available-for-sale securities are recognised in profit or loss under “Finance costs - net”.
When an available-for-sale security is sold, the accumulated unrealised gain or loss previously recognised in equity is included in profit or loss for the reporting period in “Finance costs - net”.
Consolidated Financial Statements 81
When an available-for-sale security is considered to be impaired, the accumulated unrealised loss previously recognised in equity is recognised in profit or loss in “Finance costs - net”. An asset is impaired if there are indications that the recoverable value is below its carrying amount. In particular, this is the case if the decrease in fair value is of such extent that the acquisition cost is unlikely to be recovered in the foreseeable future. Recoverability is reviewed annually at every balance sheet date.
Furthermore, financial assets that have not been allocated to any of the other categories described are recognised under available-for-sale fi-nancial assets. If the fair value of non-listed equity instruments cannot be determined reliably, these financial assets are measured at cost. Im-pairment losses, if any, are recognised in profit or loss, and the respective impairment losses are not reversed.
l. DERIVATIVE FINANCIAL INSTRUMENTS Where possible, the Group uses derivative financial instruments to hedge against foreign cur-rency fluctuations related to transactions in foreign currencies – in particular the US dollar. These instruments mainly include forward contracts, foreign currency options and foreign exchange swap contracts. They are entered into in order to protect the Group against exchange rate fluctu-ations by fixing future exchange rates for foreign currency assets and liabilities.
Furthermore, the Group manages its interest rate risk by using interest rate swaps.
The Group does not hold any financial instruments for speculative purposes.
The first-time recognition at the conclusion of the contract and the subsequent measurement of derivative financial instruments are made at their fair values. “Hedge accounting” in accordance with IAS 39 “Financial Instruments: Recognition and Measurement”, according to which changes in fair values of hedging instruments are recognised in equity, is applied when there is an effective hedging relationship pursuant to IAS 39 for hedging instruments for cash flow hedges. The assessment of whether the derivative financial instruments used in the hedging rela-tionship are highly effective in offsetting the changes in cash flows of the hedged item is documented at the inception of the hedging relation-ship and on an ongoing basis. When “hedge accounting” in equity is not applicable, unrealised gains and losses from derivative financial instru-ments are recognised in profit or loss in “Finance costs - net”.
m. CASH AND CASH EQUIVALENTS Cash and cash equivalents comprise cash, time deposits, deposits held at call with banks and short-term, highly liquid investments with an original maturity of up to three months (commercial papers and money market funds).
n. NON-CONTROLLING INTERESTS The Company acquired the non-controlling interest of 1.24% of the equity in AT&S Korea in financial year 2015/16 and thus no longer reports any non-controlling interests.
The profit for the year and other comprehensive income are attributed to the owners of the parent company and the non-controlling interests. The allocation to the non-controlling interests is made even if this results in a negative balance for the non-controlling interests.
o. PROVISIONS Provisions are recognised if the Group has a legal or de facto obligation to third parties, which is based on past events, where it is probable that this will result in an outflow of resources and the amount can be estimated reliably. The provisions are remeasured at each balance sheet date and their amounts adjusted accordingly.
Non-current provisions are reported at the discounted amount to be paid at each balance sheet date if the interest effect resulting from the discounting is material.
p. PROVISIONS FOR EMPLOYEE BENEFITS
PENSION OBLIGATIONS The Group operates various defined contribution and defined benefit pension schemes.
A defined contribution plan is a pension plan under which the Group pays fixed contributions into a special purpose entity (fund). These contri-butions are charged to staff costs. No provision has to be set up, as there are no additional obligations beyond the fixed amounts.
For individual members of the Management Board and certain executive employees, the Group has defined benefit plans that are valued by qualified and independent actuaries at each balance sheet date. The Group’s obligation is to meet the benefits committed to current and former members of the Management Board and executive employees as well as their dependents. The pension obligation calculated according to the
100 AT&S Annual Report 2016/17
82 AT&S Annual Report 2016/17
projected unit credit method is reduced by the plan assets of the fund in the case of a funded pension scheme. The present value of the future pension benefit is determined on the basis of years of service, expected remuneration and pension adjustments.
To the extent that the plan assets of the fund do not cover the obligation, the net liability is accrued under pension provisions. If the net assets exceed the pension obligation, the exceeding amount is capitalised under “Overfunded pension benefits”.
Staff costs recognised in the respective financial year are based on expected values and include the service costs. The net liabilities net interest is recognised in “Finance costs - net”. Remeasurements of the net liability are recognised in other comprehensive income and comprise gains and losses arising from the remeasurement of post-employment obligations.
PROVISIONS FOR SEVERANCE PAYMENTS Pursuant to Austrian labour regulations, severance payments have to be paid primarily on termina-tion of employment by the employer or on the retirement of an employee. The liabilities are measured by qualified and independent actuaries at each balance sheet date.
For employees who joined Austrian companies up to and including 2002, the Company has direct obligations that account for the major part of the Group’s severance payment obligations. In accordance with IAS 19, these liabilities are calculated using the projected unit credit method as described above and represent severance payment obligations not covered by plan assets. For employees who joined the Company as on or after of 1 January 2003, the severance payment obligation is met by regular contributions to a staff provision fund (“Mitarbeitervorsorgekasse”). These contributions are included in staff costs. The Company has no further payment obligations once the contributions have been paid.
For employees of the company in India, obligations for severance payments are covered by life insurance policies. Furthermore, severance pay-ment obligations exist for employees in South Korea and China. These obligations are measured in accordance with IAS 19 using the projected unit credit method as described above and represent severance payment obligations not covered by plan assets.
OTHER EMPLOYEE BENEFITS Other employee benefits include provisions for anniversary bonuses and relate to employees in Austria and China.
Anniversary bonuses are special one-off payments stipulated in the Collective Agreement which are dependent on remuneration and duration of service. Eligibility is determined by a certain minimum length of employment. The respective liability is calculated in accordance with the pro-jected unit credit method based on the same parameters used for severance payments.
Staff costs recognised in the respective financial year include entitlements acquired and the actuarial results. The interest component is recog-nised in “Finance costs - net”. The liabilities are measured by qualified and independent actuaries at each balance sheet date.
q. STOCK OPTION PLANS The Group has issued stock option plans that are settled either in cash or in treasury shares, with the choice of settlement being with the entitled employees. These stock option plans are accounted for in accordance with IFRS 2 “Share-based Payment”.
The share-based payments are structured in such a way that both settlement alternatives have the same fair value. The fair value of the em-ployee services received in exchange for the granting of the options is recognised as an expense. Liabilities arising from stock option plans are recognised initially, and at each balance sheet date until settlement, at fair value using an option price model and are recognised in profit or loss. Reference is made to Note 15 “Trade and other payables”.
r. STOCK APPRECIATION RIGHTS The Group introduced a long-term incentive programme based on stock appreciation rights (SAR). Stock appreciation rights relate to value increases in share prices based on the performance of the share price. These rights are accounted for in ac-cordance with IFRS 2 “Share-based Payment”.
The fair value of the employee services rendered as consideration for the granting of SAR is recognised as an expense. Upon initial recognition and at every balance sheet date until the liabilities are settled, SAR liabilities are measured at fair value through profit or loss, applying the option price model. Reference is made to Note 15 “Trade and other payables”.
s. LIABILITIES Financial liabilities are initially measured at fair value less transaction cost and, in subsequent periods, at amortised cost using the effective interest rate method. Foreign currency liabilities are translated at the average exchange rate prevailing at the balance sheet date.
Consolidated Financial Statements 83
t. GOVERNMENT GRANTS Government grants are recognised at their fair value where there is a reasonable assurance that the grants will be received and the Group will comply with all attached conditions.
Government grants relating to costs are deferred and recognised in profit or loss over the period necessary to match them with the costs that they are intended to compensate. Government grants relating to investments in property, plant and equipment are included in liabilities as deferred government grants; they are recognised in profit or loss on a straight-line basis over the expected useful life of the related assets. Gov-ernment grants relating to costs and property, plant and equipment are recognised in profit or loss in the other operating result.
u. CONTINGENT LIABILITIES, CONTINGENT ASSETS AND OTHER FINANCIAL OBLIGATIONS Contingent liabilities are not recog-nised in the statement of financial position, but disclosed in Note 21 in the notes to the consolidated financial statements. They are not disclosed if an outflow of resources with economic benefit is unlikely.
A contingent asset is not recognised in the consolidated financial statements, but disclosed if the inflow of an economic benefit is likely.
v. FIRST-TIME APPLICATION OF ACCOUNTING STANDARDS The following new and/or amended standards and interpretations were applied for the first time in the financial year and pertain to the International Financial Reporting Standards (IFRS) as adopted by the EU.
IFRS 11: Accounting for Acquisition of interests in Joint Operations IAS 16, IAS 41: Property, Plant and Equipment/Agriculture: Bearer Plants IAS 1: Disclosure initiative (Amendments to IAS 1) IAS 16, IAS 38: Property, Plant and Equipment/Intangible Assets, Clarification of Acceptable Methods of Depreciation and Amortisation Annual Improvements to IFRSs 2012 - 2014
Due to a lack off relevance, the initial application had no significant impact on the disclosures of the Group.
w. FUTURE AMENDMENTS TO ACCOUNTING STANDARDS The IASB and IFRIC issued additional standards and interpretations not yet effective in the financial year 2016/17.
These have already been in part adopted by the European Union. The following standards and interpretations had already been published by the time these consolidated financial statements were prepared and are not yet effective; they have not been adopted early in the preparation of these consolidated financial statements:
101Consolidated Financial Statements
82 AT&S Annual Report 2016/17
projected unit credit method is reduced by the plan assets of the fund in the case of a funded pension scheme. The present value of the future pension benefit is determined on the basis of years of service, expected remuneration and pension adjustments.
To the extent that the plan assets of the fund do not cover the obligation, the net liability is accrued under pension provisions. If the net assets exceed the pension obligation, the exceeding amount is capitalised under “Overfunded pension benefits”.
Staff costs recognised in the respective financial year are based on expected values and include the service costs. The net liabilities net interest is recognised in “Finance costs - net”. Remeasurements of the net liability are recognised in other comprehensive income and comprise gains and losses arising from the remeasurement of post-employment obligations.
PROVISIONS FOR SEVERANCE PAYMENTS Pursuant to Austrian labour regulations, severance payments have to be paid primarily on termina-tion of employment by the employer or on the retirement of an employee. The liabilities are measured by qualified and independent actuaries at each balance sheet date.
For employees who joined Austrian companies up to and including 2002, the Company has direct obligations that account for the major part of the Group’s severance payment obligations. In accordance with IAS 19, these liabilities are calculated using the projected unit credit method as described above and represent severance payment obligations not covered by plan assets. For employees who joined the Company as on or after of 1 January 2003, the severance payment obligation is met by regular contributions to a staff provision fund (“Mitarbeitervorsorgekasse”). These contributions are included in staff costs. The Company has no further payment obligations once the contributions have been paid.
For employees of the company in India, obligations for severance payments are covered by life insurance policies. Furthermore, severance pay-ment obligations exist for employees in South Korea and China. These obligations are measured in accordance with IAS 19 using the projected unit credit method as described above and represent severance payment obligations not covered by plan assets.
OTHER EMPLOYEE BENEFITS Other employee benefits include provisions for anniversary bonuses and relate to employees in Austria and China.
Anniversary bonuses are special one-off payments stipulated in the Collective Agreement which are dependent on remuneration and duration of service. Eligibility is determined by a certain minimum length of employment. The respective liability is calculated in accordance with the pro-jected unit credit method based on the same parameters used for severance payments.
Staff costs recognised in the respective financial year include entitlements acquired and the actuarial results. The interest component is recog-nised in “Finance costs - net”. The liabilities are measured by qualified and independent actuaries at each balance sheet date.
q. STOCK OPTION PLANS The Group has issued stock option plans that are settled either in cash or in treasury shares, with the choice of settlement being with the entitled employees. These stock option plans are accounted for in accordance with IFRS 2 “Share-based Payment”.
The share-based payments are structured in such a way that both settlement alternatives have the same fair value. The fair value of the em-ployee services received in exchange for the granting of the options is recognised as an expense. Liabilities arising from stock option plans are recognised initially, and at each balance sheet date until settlement, at fair value using an option price model and are recognised in profit or loss. Reference is made to Note 15 “Trade and other payables”.
r. STOCK APPRECIATION RIGHTS The Group introduced a long-term incentive programme based on stock appreciation rights (SAR). Stock appreciation rights relate to value increases in share prices based on the performance of the share price. These rights are accounted for in ac-cordance with IFRS 2 “Share-based Payment”.
The fair value of the employee services rendered as consideration for the granting of SAR is recognised as an expense. Upon initial recognition and at every balance sheet date until the liabilities are settled, SAR liabilities are measured at fair value through profit or loss, applying the option price model. Reference is made to Note 15 “Trade and other payables”.
s. LIABILITIES Financial liabilities are initially measured at fair value less transaction cost and, in subsequent periods, at amortised cost using the effective interest rate method. Foreign currency liabilities are translated at the average exchange rate prevailing at the balance sheet date.
Consolidated Financial Statements 83
t. GOVERNMENT GRANTS Government grants are recognised at their fair value where there is a reasonable assurance that the grants will be received and the Group will comply with all attached conditions.
Government grants relating to costs are deferred and recognised in profit or loss over the period necessary to match them with the costs that they are intended to compensate. Government grants relating to investments in property, plant and equipment are included in liabilities as deferred government grants; they are recognised in profit or loss on a straight-line basis over the expected useful life of the related assets. Gov-ernment grants relating to costs and property, plant and equipment are recognised in profit or loss in the other operating result.
u. CONTINGENT LIABILITIES, CONTINGENT ASSETS AND OTHER FINANCIAL OBLIGATIONS Contingent liabilities are not recog-nised in the statement of financial position, but disclosed in Note 21 in the notes to the consolidated financial statements. They are not disclosed if an outflow of resources with economic benefit is unlikely.
A contingent asset is not recognised in the consolidated financial statements, but disclosed if the inflow of an economic benefit is likely.
v. FIRST-TIME APPLICATION OF ACCOUNTING STANDARDS The following new and/or amended standards and interpretations were applied for the first time in the financial year and pertain to the International Financial Reporting Standards (IFRS) as adopted by the EU.
IFRS 11: Accounting for Acquisition of interests in Joint Operations IAS 16, IAS 41: Property, Plant and Equipment/Agriculture: Bearer Plants IAS 1: Disclosure initiative (Amendments to IAS 1) IAS 16, IAS 38: Property, Plant and Equipment/Intangible Assets, Clarification of Acceptable Methods of Depreciation and Amortisation Annual Improvements to IFRSs 2012 - 2014
Due to a lack off relevance, the initial application had no significant impact on the disclosures of the Group.
w. FUTURE AMENDMENTS TO ACCOUNTING STANDARDS The IASB and IFRIC issued additional standards and interpretations not yet effective in the financial year 2016/17.
These have already been in part adopted by the European Union. The following standards and interpretations had already been published by the time these consolidated financial statements were prepared and are not yet effective; they have not been adopted early in the preparation of these consolidated financial statements:
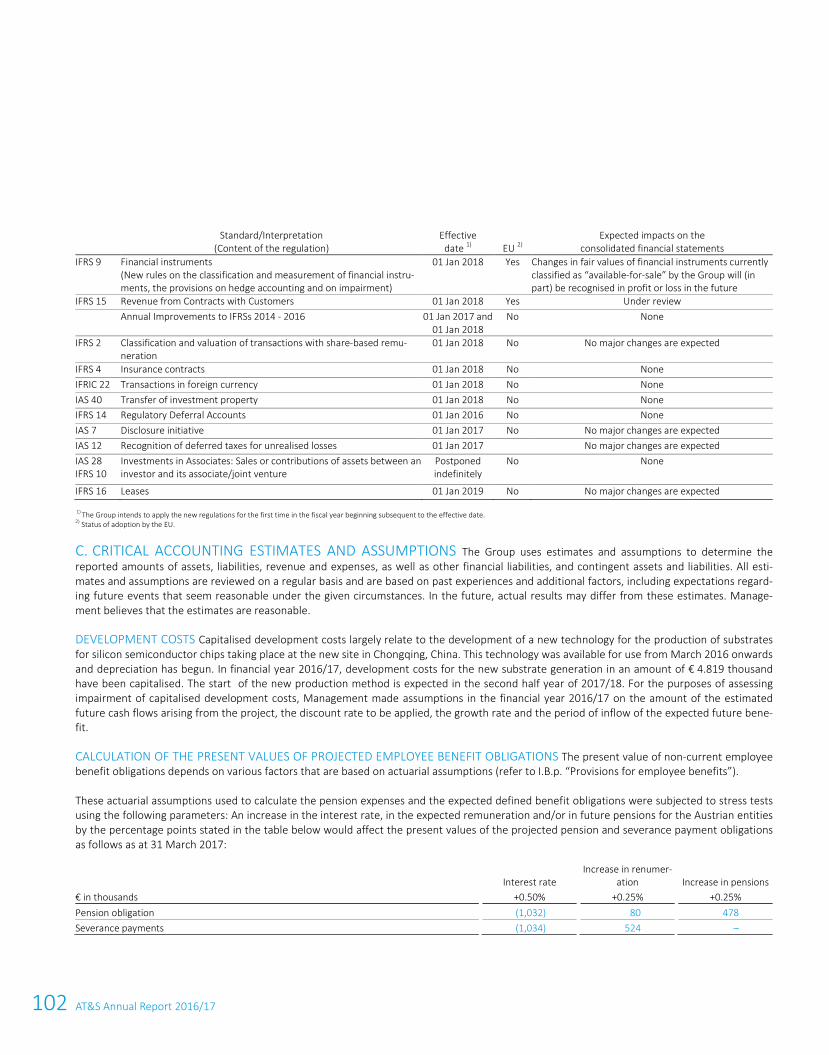
102 AT&S Annual Report 2016/17
84 AT&S Annual Report 2016/17
Standard/Interpretation
(Content of the regulation) Effective
date 1) EU 2) Expected impacts on the
consolidated financial statements IFRS 9 Financial instruments
(New rules on the classification and measurement of financial instru-ments, the provisions on hedge accounting and on impairment)
01 Jan 2018 Yes Changes in fair values of financial instruments currently classified as “available-for-sale” by the Group will (in part) be recognised in profit or loss in the future
IFRS 15 Revenue from Contracts with Customers 01 Jan 2018 Yes Under review Annual Improvements to IFRSs 2014 - 2016 01 Jan 2017 and
01 Jan 2018 No None
IFRS 2 Classification and valuation of transactions with share-based remu-neration
01 Jan 2018 No No major changes are expected
IFRS 4 Insurance contracts 01 Jan 2018 No None IFRIC 22 Transactions in foreign currency 01 Jan 2018 No None IAS 40 Transfer of investment property 01 Jan 2018 No None IFRS 14 Regulatory Deferral Accounts 01 Jan 2016 No None IAS 7 Disclosure initiative 01 Jan 2017 No No major changes are expected IAS 12 Recognition of deferred taxes for unrealised losses 01 Jan 2017 No major changes are expected IAS 28 IFRS 10
Investments in Associates: Sales or contributions of assets between an investor and its associate/joint venture
Postponed indefinitely
No None
IFRS 16 Leases 01 Jan 2019 No No major changes are expected
1) The Group intends to apply the new regulations for the first time in the fiscal year beginning subsequent to the effective date. 2) Status of adoption by the EU.
CRITICAL ACCOUNTING ESTIMATES AND ASSUMPTIONS The Group uses estimates and assumptions to determine the C.reported amounts of assets, liabilities, revenue and expenses, as well as other financial liabilities, and contingent assets and liabilities. All esti-mates and assumptions are reviewed on a regular basis and are based on past experiences and additional factors, including expectations regard-ing future events that seem reasonable under the given circumstances. In the future, actual results may differ from these estimates. Manage-ment believes that the estimates are reasonable.
DEVELOPMENT COSTS Capitalised development costs largely relate to the development of a new technology for the production of substrates for silicon semiconductor chips taking place at the new site in Chongqing, China. This technology was available for use from March 2016 onwards and depreciation has begun. In financial year 2016/17, development costs for the new substrate generation in an amount of € 4.819 thousand have been capitalised. The start of the new production method is expected in the second half year of 2017/18. For the purposes of assessing impairment of capitalised development costs, Management made assumptions in the financial year 2016/17 on the amount of the estimated future cash flows arising from the project, the discount rate to be applied, the growth rate and the period of inflow of the expected future bene-fit.
CALCULATION OF THE PRESENT VALUES OF PROJECTED EMPLOYEE BENEFIT OBLIGATIONS The present value of non-current employee benefit obligations depends on various factors that are based on actuarial assumptions (refer to I.B.p. “Provisions for employee benefits”).
These actuarial assumptions used to calculate the pension expenses and the expected defined benefit obligations were subjected to stress tests using the following parameters: An increase in the interest rate, in the expected remuneration and/or in future pensions for the Austrian entities by the percentage points stated in the table below would affect the present values of the projected pension and severance payment obligations as follows as at 31 March 2017:
Interest rate
Increase in renumer-ation
Increase in pensions
€ in thousands
+0.50%
+0.25%
+0.25% Pension obligation
(1,032)
80
478
Severance payments (1,034)
524
–
103Consolidated Financial Statements
84 AT&S Annual Report 2016/17
Standard/Interpretation
(Content of the regulation) Effective
date 1) EU 2) Expected impacts on the
consolidated financial statements IFRS 9 Financial instruments
(New rules on the classification and measurement of financial instru-ments, the provisions on hedge accounting and on impairment)
01 Jan 2018 Yes Changes in fair values of financial instruments currently classified as “available-for-sale” by the Group will (in part) be recognised in profit or loss in the future
IFRS 15 Revenue from Contracts with Customers 01 Jan 2018 Yes Under review Annual Improvements to IFRSs 2014 - 2016 01 Jan 2017 and
01 Jan 2018 No None
IFRS 2 Classification and valuation of transactions with share-based remu-neration
01 Jan 2018 No No major changes are expected
IFRS 4 Insurance contracts 01 Jan 2018 No None IFRIC 22 Transactions in foreign currency 01 Jan 2018 No None IAS 40 Transfer of investment property 01 Jan 2018 No None IFRS 14 Regulatory Deferral Accounts 01 Jan 2016 No None IAS 7 Disclosure initiative 01 Jan 2017 No No major changes are expected IAS 12 Recognition of deferred taxes for unrealised losses 01 Jan 2017 No major changes are expected IAS 28 IFRS 10
Investments in Associates: Sales or contributions of assets between an investor and its associate/joint venture
Postponed indefinitely
No None
IFRS 16 Leases 01 Jan 2019 No No major changes are expected
1) The Group intends to apply the new regulations for the first time in the fiscal year beginning subsequent to the effective date. 2) Status of adoption by the EU.
CRITICAL ACCOUNTING ESTIMATES AND ASSUMPTIONS The Group uses estimates and assumptions to determine the C.reported amounts of assets, liabilities, revenue and expenses, as well as other financial liabilities, and contingent assets and liabilities. All esti-mates and assumptions are reviewed on a regular basis and are based on past experiences and additional factors, including expectations regard-ing future events that seem reasonable under the given circumstances. In the future, actual results may differ from these estimates. Manage-ment believes that the estimates are reasonable.
DEVELOPMENT COSTS Capitalised development costs largely relate to the development of a new technology for the production of substrates for silicon semiconductor chips taking place at the new site in Chongqing, China. This technology was available for use from March 2016 onwards and depreciation has begun. In financial year 2016/17, development costs for the new substrate generation in an amount of € 4.819 thousand have been capitalised. The start of the new production method is expected in the second half year of 2017/18. For the purposes of assessing impairment of capitalised development costs, Management made assumptions in the financial year 2016/17 on the amount of the estimated future cash flows arising from the project, the discount rate to be applied, the growth rate and the period of inflow of the expected future bene-fit.
CALCULATION OF THE PRESENT VALUES OF PROJECTED EMPLOYEE BENEFIT OBLIGATIONS The present value of non-current employee benefit obligations depends on various factors that are based on actuarial assumptions (refer to I.B.p. “Provisions for employee benefits”).
These actuarial assumptions used to calculate the pension expenses and the expected defined benefit obligations were subjected to stress tests using the following parameters: An increase in the interest rate, in the expected remuneration and/or in future pensions for the Austrian entities by the percentage points stated in the table below would affect the present values of the projected pension and severance payment obligations as follows as at 31 March 2017:
Interest rate
Increase in renumer-ation
Increase in pensions
€ in thousands
+0.50%
+0.25%
+0.25% Pension obligation
(1,032)
80
478
Severance payments (1,034)
524
–
Consolidated Financial Statements 85
A decrease in the same parameters for the Austrian companies would have the following effects on the present value of pension and severance payment obligations as at 31 March 2017:
Interest rate
Increase in renumer-ation
Increase in pensions
€ in thousands
-0.50%
-0.25%
-0.25% Pension obligation
1,159
(78)
(456)
Severance payments 1,121
(506)
–
Reference is made to Note 17 “Provisions for employee benefits”.
MEASUREMENT OF DEFERRED INCOME TAX ASSETS AND CURRENT TAX LIABILITIES Deferred income tax assets and liabilities are deter-mined using the tax rates (and laws) that have been enacted or substantively enacted by the balance sheet date and are expected to apply when the related deferred income tax asset is realised or the deferred income tax liability is settled. A future change in tax rates would also have an impact on the deferred tax capitalised at the balance sheet date.
Deferred income tax assets in the amount of € 38,071 thousand were not recognised for income tax loss carryforwards in the Group of € 213,630 thousand. If the tax losses were subsequently expected to be realised, these deferred income tax assets would have to be recognised and a related tax income reported. Reference is made to Note 7 “Income taxes”.
Moreover, a different interpretation of tax laws by fiscal authorities could also lead to a change in income tax liabilities.
OTHER ESTIMATES AND ASSUMPTIONS Further estimates, if necessary, relate to impairments of non-current assets and provisions, as well as the measurement of derivative financial instruments, allowances for doubtful accounts receivable and measurements of inventory. Reference is particularly made to Note 4 “Other operating result”, Note 8 “Property, plant and equipment”, Note 9 “Intangible assets” and Note 18 “Other provisions”.
104 AT&S Annual Report 2016/17
86 AT&S Annual Report 2016/17
The segment information presented below is prepared in accordance with the management approach concept as depicted in the Group’s inter-nal reporting (refer to Section I.B.b. “Segment Reporting”).
The reportable segments consist of the business units Mobile Devices & Substrates, Automotive, Industrial, Medical and Others. The Others segment includes the business unit Advanced Packaging, which is in the development phase. The Advanced Packaging segment neither reaches the quantitative threshold levels, nor are this business unit's opportunities and risks material to the Group as a whole. It is therefore not pre-sented as a standalone segment in segment reporting. The Others segment further includes general holding activities as well as the Group’s financing activities. The central operating result control reference is the operating result before depreciation and amortisation. The respective reconciliation to Group figures also includes the corresponding consolidation.
Transfers and transactions between the segments are executed at arm’s length, as with independent third parties. Segment reporting is pre-pared in accordance with the principles set out in I.B. “Accounting and measurement policies”.
€ in thousands
Mobile Devices & Substrates
Automotive, Industrial, Medical
Others
Elimination/ Consolidation
Group
2016/17
2015/16
2016/17
2015/16
2016/17
2015/16
2016/17
2015/16
2016/17
2015/16
Segment revenue 572,960
539,665
351,485
326,679
15,164
22,135
(124,703)
(125,600)
814,906
762,879
Internal revenue (86,422)
(87,206)
(27,373)
(20,143)
(10,908)
(18,251)
124,703
125,600
–
–
External revenue 486,538
452,459
324,112
306,536
4,256
3,884
–
–
814,906
762,879
Operating result before depreciation/amortisation
68,515
126,439
51,475
30,087
10,943
10,876
–
86
130,933
167,488
Depreciation/amortisation incl. appreciation
(107,557)
(78,182)
(15,292)
(10,856)
(1,435)
(1,481)
–
–
(124,284)
(90,519)
Operating result (39,042)
48,257
36,183
19,231
9,508
9,395
–
86
6,649
76,969
Finance costs - net
(17,499)
(8,135)
Profit/(loss) before tax
(10,850)
68,834
Income taxes
(12,047)
(12,883)
Profit for the year
(22,897)
55,951
Property, plant and equipment and intangible assets
822,490
696,578
98,933
92,695
3,327
3,624
–
–
924,750
792,897
Additions to property, plant and equipment and intangible assets
238,058
271,752
18,982
29,362
1,143
1,869
–
–
258,183
302,983
INFORMATION BY GEOGRAPHIC REGION Revenue broken down by region, based on customer’s headquarters:
€ in thousands
2016/17
2015/16 Austria
19,739
17,525
Germany 170,090
163,374
Other European countries 52,792
46,073
China 47,972
32,387
Other Asian countries 59,387
75,603
Americas 464,926
427,917
Revenue 814,906
762,879
56.8% of total revenue (previous year: 56.1%) is attributable to the five largest customers in terms of revenue.
II. Segment Reporting
105Consolidated Financial Statements
86 AT&S Annual Report 2016/17
The segment information presented below is prepared in accordance with the management approach concept as depicted in the Group’s inter-nal reporting (refer to Section I.B.b. “Segment Reporting”).
The reportable segments consist of the business units Mobile Devices & Substrates, Automotive, Industrial, Medical and Others. The Others segment includes the business unit Advanced Packaging, which is in the development phase. The Advanced Packaging segment neither reaches the quantitative threshold levels, nor are this business unit's opportunities and risks material to the Group as a whole. It is therefore not pre-sented as a standalone segment in segment reporting. The Others segment further includes general holding activities as well as the Group’s financing activities. The central operating result control reference is the operating result before depreciation and amortisation. The respective reconciliation to Group figures also includes the corresponding consolidation.
Transfers and transactions between the segments are executed at arm’s length, as with independent third parties. Segment reporting is pre-pared in accordance with the principles set out in I.B. “Accounting and measurement policies”.
€ in thousands
Mobile Devices & Substrates
Automotive, Industrial, Medical
Others
Elimination/ Consolidation
Group
2016/17
2015/16
2016/17
2015/16
2016/17
2015/16
2016/17
2015/16
2016/17
2015/16
Segment revenue 572,960
539,665
351,485
326,679
15,164
22,135
(124,703)
(125,600)
814,906
762,879
Internal revenue (86,422)
(87,206)
(27,373)
(20,143)
(10,908)
(18,251)
124,703
125,600
–
–
External revenue 486,538
452,459
324,112
306,536
4,256
3,884
–
–
814,906
762,879
Operating result before depreciation/amortisation
68,515
126,439
51,475
30,087
10,943
10,876
–
86
130,933
167,488
Depreciation/amortisation incl. appreciation
(107,557)
(78,182)
(15,292)
(10,856)
(1,435)
(1,481)
–
–
(124,284)
(90,519)
Operating result (39,042)
48,257
36,183
19,231
9,508
9,395
–
86
6,649
76,969
Finance costs - net
(17,499)
(8,135)
Profit/(loss) before tax
(10,850)
68,834
Income taxes
(12,047)
(12,883)
Profit for the year
(22,897)
55,951
Property, plant and equipment and intangible assets
822,490
696,578
98,933
92,695
3,327
3,624
–
–
924,750
792,897
Additions to property, plant and equipment and intangible assets
238,058
271,752
18,982
29,362
1,143
1,869
–
–
258,183
302,983
INFORMATION BY GEOGRAPHIC REGION Revenue broken down by region, based on customer’s headquarters:
€ in thousands
2016/17
2015/16 Austria
19,739
17,525
Germany 170,090
163,374
Other European countries 52,792
46,073
China 47,972
32,387
Other Asian countries 59,387
75,603
Americas 464,926
427,917
Revenue 814,906
762,879
56.8% of total revenue (previous year: 56.1%) is attributable to the five largest customers in terms of revenue.
II. Segment Reporting
Consolidated Financial Statements 87
Property, plant and equipment and intangible assets broken down by domicile:
€ in thousands
31 Mar 2017
31 Mar 2016 Austria
69,039
66,054
China 822,422
696,534
Others 33,289
30,309
Total 924,750
792,897
106 AT&S Annual Report 2016/17
88 AT&S Annual Report 2016/17
1. REVENUE
€ in thousands
2016/17
2015/16 Main revenue
814,698
762,646
Incidental revenue 208
233
Revenue 814,906
762,879
2. TYPES OF EXPENSES The expense types of cost of sales, distribution costs and general and administrative costs are as follows:
€ in thousands
2016/17
2015/16
Cost of materials 320,186
267,806
Staff costs 206,051
160,898
Depreciation/amortisation 124,489
79,679
Purchased services incl. leased personnel 27,675
46,405
Energy 46,579
41,415
Maintenance (incl. spare parts) 53,831
47,022
Transportation costs 15,563
14,845
Rental and leasing expenses 6,708
5,634
Change in inventories (4,322)
(3,023)
Other 21,087
14,566
Total 817,847
675,247
In the financial years 2016/17 and 2015/16, the item “Other” mainly relates to travel expenses, insurance expenses, IT service costs, legal and consulting fees.
3. RESEARCH AND DEVELOPMENT COSTS In the financial year 2016/17, the Group incurred research and development costs in the amount of € 57,950 thousand (previous year: € 34,428 thousand). The stated amounts represent only costs which can be directly allocated and which are recognised in the profit and loss under cost of sales. In these consolidated financial statements, development costs of € 4,819 thou-sand (previous year: € 61,052 thousand) were capitalised. Reference is made to Note 9 “Intangible assets”.
4. OTHER OPERATING RESULT
€ in thousands
2016/17
2015/16 Income from the reversal of government grants
830
191
Government grants for expenses 3,468
3,194
Income/(expenses) from exchange differences 2,566
52
Income from reversal of accruals/provision 7,250
–
Miscellaneous other income 1,880
420
Other operating income 15,994
3,857
Impairments of property, plant and equipment 1) –
(3,113)
Start-up losses (6,387)
(10,774)
Gains/(losses) from the disposal of non-current assets (17)
(633)
Other operating costs (6,404)
(14,520)
Other operating result 9,590
(10,663)
1) Reference is made to Note 8 "Property, plant and equipment".
In the financial years 2016/17 and 2015/16, government grants for expenses mainly relate to export refunds as well as research and develop-ment awards. Similar to prior financial year 2015/16, start-up losses resulted in the financial year 2016/17 from the construction of the new
III. Notes to the Consolidated Statement of Profit or Loss
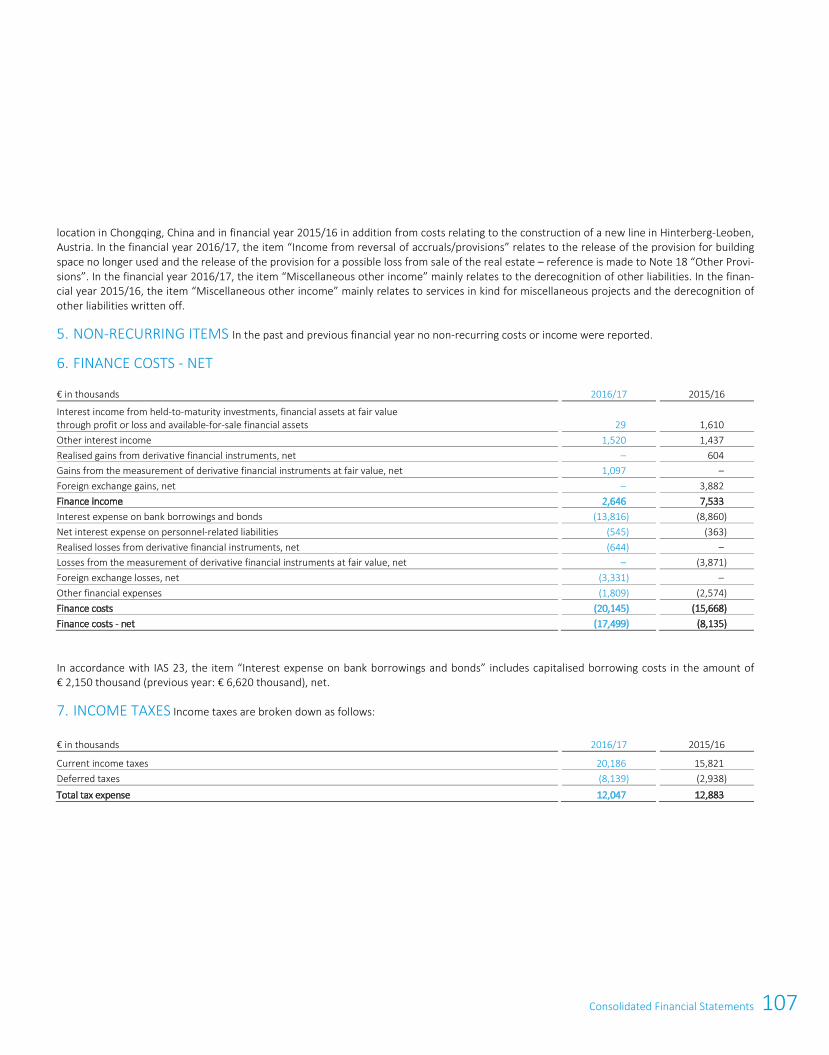
107Consolidated Financial Statements
88 AT&S Annual Report 2016/17
1. REVENUE
€ in thousands
2016/17
2015/16 Main revenue
814,698
762,646
Incidental revenue 208
233
Revenue 814,906
762,879
2. TYPES OF EXPENSES The expense types of cost of sales, distribution costs and general and administrative costs are as follows:
€ in thousands
2016/17
2015/16
Cost of materials 320,186
267,806
Staff costs 206,051
160,898
Depreciation/amortisation 124,489
79,679
Purchased services incl. leased personnel 27,675
46,405
Energy 46,579
41,415
Maintenance (incl. spare parts) 53,831
47,022
Transportation costs 15,563
14,845
Rental and leasing expenses 6,708
5,634
Change in inventories (4,322)
(3,023)
Other 21,087
14,566
Total 817,847
675,247
In the financial years 2016/17 and 2015/16, the item “Other” mainly relates to travel expenses, insurance expenses, IT service costs, legal and consulting fees.
3. RESEARCH AND DEVELOPMENT COSTS In the financial year 2016/17, the Group incurred research and development costs in the amount of € 57,950 thousand (previous year: € 34,428 thousand). The stated amounts represent only costs which can be directly allocated and which are recognised in the profit and loss under cost of sales. In these consolidated financial statements, development costs of € 4,819 thou-sand (previous year: € 61,052 thousand) were capitalised. Reference is made to Note 9 “Intangible assets”.
4. OTHER OPERATING RESULT
€ in thousands
2016/17
2015/16 Income from the reversal of government grants
830
191
Government grants for expenses 3,468
3,194
Income/(expenses) from exchange differences 2,566
52
Income from reversal of accruals/provision 7,250
–
Miscellaneous other income 1,880
420
Other operating income 15,994
3,857
Impairments of property, plant and equipment 1) –
(3,113)
Start-up losses (6,387)
(10,774)
Gains/(losses) from the disposal of non-current assets (17)
(633)
Other operating costs (6,404)
(14,520)
Other operating result 9,590
(10,663)
1) Reference is made to Note 8 "Property, plant and equipment".
In the financial years 2016/17 and 2015/16, government grants for expenses mainly relate to export refunds as well as research and develop-ment awards. Similar to prior financial year 2015/16, start-up losses resulted in the financial year 2016/17 from the construction of the new
III. Notes to the Consolidated Statement of Profit or Loss
Consolidated Financial Statements 89
location in Chongqing, China and in financial year 2015/16 in addition from costs relating to the construction of a new line in Hinterberg-Leoben, Austria. In the financial year 2016/17, the item “Income from reversal of accruals/provisions” relates to the release of the provision for building space no longer used and the release of the provision for a possible loss from sale of the real estate – reference is made to Note 18 “Other Provi-sions”. In the financial year 2016/17, the item “Miscellaneous other income” mainly relates to the derecognition of other liabilities. In the finan-cial year 2015/16, the item “Miscellaneous other income” mainly relates to services in kind for miscellaneous projects and the derecognition of other liabilities written off.
5. NON-RECURRING ITEMS In the past and previous financial year no non-recurring costs or income were reported.
6. FINANCE COSTS - NET
€ in thousands
2016/17
2015/16
Interest income from held-to-maturity investments, financial assets at fair value through profit or loss and available-for-sale financial assets
29
1,610
Other interest income 1,520
1,437
Realised gains from derivative financial instruments, net –
604
Gains from the measurement of derivative financial instruments at fair value, net 1,097
–
Foreign exchange gains, net –
3,882
Finance income 2,646
7,533
Interest expense on bank borrowings and bonds (13,816)
(8,860)
Net interest expense on personnel-related liabilities (545)
(363)
Realised losses from derivative financial instruments, net (644)
–
Losses from the measurement of derivative financial instruments at fair value, net –
(3,871)
Foreign exchange losses, net (3,331)
–
Other financial expenses (1,809)
(2,574)
Finance costs (20,145)
(15,668)
Finance costs - net (17,499)
(8,135)
In accordance with IAS 23, the item “Interest expense on bank borrowings and bonds” includes capitalised borrowing costs in the amount of € 2,150 thousand (previous year: € 6,620 thousand), net.
7. INCOME TAXES Income taxes are broken down as follows:
€ in thousands 2016/17 2015/16
Current income taxes 20,186 15,821 Deferred taxes (8,139) (2,938) Total tax expense 12,047 12,883
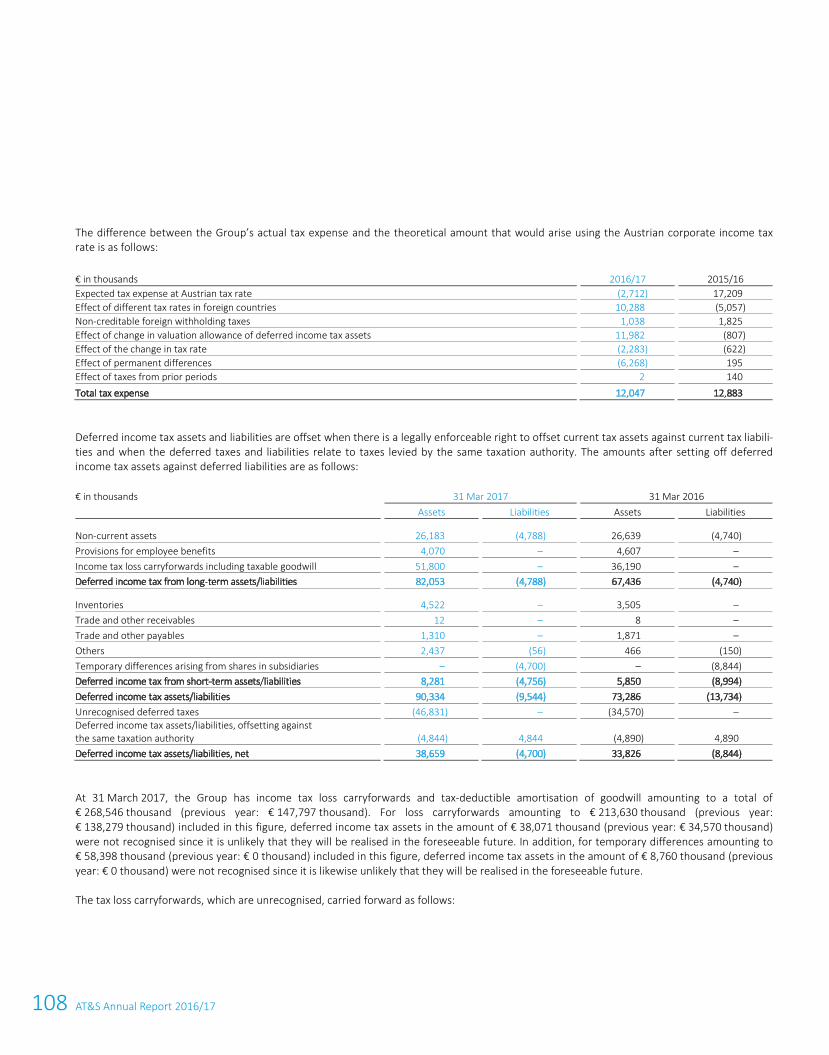
108 AT&S Annual Report 2016/17
90 AT&S Annual Report 2016/17
The difference between the Group’s actual tax expense and the theoretical amount that would arise using the Austrian corporate income tax rate is as follows:
€ in thousands
2016/17
2015/16 Expected tax expense at Austrian tax rate
(2,712)
17,209
Effect of different tax rates in foreign countries 10,288
(5,057)
Non-creditable foreign withholding taxes 1,038
1,825
Effect of change in valuation allowance of deferred income tax assets 11,982
(807)
Effect of the change in tax rate (2,283)
(622)
Effect of permanent differences (6,268)
195
Effect of taxes from prior periods 2
140
Total tax expense 12,047
12,883
Deferred income tax assets and liabilities are offset when there is a legally enforceable right to offset current tax assets against current tax liabili-ties and when the deferred taxes and liabilities relate to taxes levied by the same taxation authority. The amounts after setting off deferred income tax assets against deferred liabilities are as follows:
€ in thousands
31 Mar 2017
31 Mar 2016
Assets
Liabilities
Assets
Liabilities
Non-current assets 26,183
(4,788)
26,639
(4,740)
Provisions for employee benefits 4,070
–
4,607
–
Income tax loss carryforwards including taxable goodwill 51,800
–
36,190
–
Deferred income tax from long-term assets/liabilities 82,053
(4,788)
67,436
(4,740)
Inventories 4,522
–
3,505
–
Trade and other receivables 12
–
8
–
Trade and other payables 1,310
–
1,871
–
Others 2,437
(56)
466
(150)
Temporary differences arising from shares in subsidiaries –
(4,700)
–
(8,844)
Deferred income tax from short-term assets/liabilities 8,281
(4,756)
5,850
(8,994)
Deferred income tax assets/liabilities 90,334
(9,544)
73,286
(13,734)
Unrecognised deferred taxes (46,831)
–
(34,570)
–
Deferred income tax assets/liabilities, offsetting against the same taxation authority
(4,844)
4,844
(4,890)
4,890
Deferred income tax assets/liabilities, net 38,659
(4,700)
33,826
(8,844)
At 31 March 2017, the Group has income tax loss carryforwards and tax-deductible amortisation of goodwill amounting to a total of € 268,546 thousand (previous year: € 147,797 thousand). For loss carryforwards amounting to € 213,630 thousand (previous year: € 138,279 thousand) included in this figure, deferred income tax assets in the amount of € 38,071 thousand (previous year: € 34,570 thousand) were not recognised since it is unlikely that they will be realised in the foreseeable future. In addition, for temporary differences amounting to € 58,398 thousand (previous year: € 0 thousand) included in this figure, deferred income tax assets in the amount of € 8,760 thousand (previous year: € 0 thousand) were not recognised since it is likewise unlikely that they will be realised in the foreseeable future.
The tax loss carryforwards, which are unrecognised, carried forward as follows:
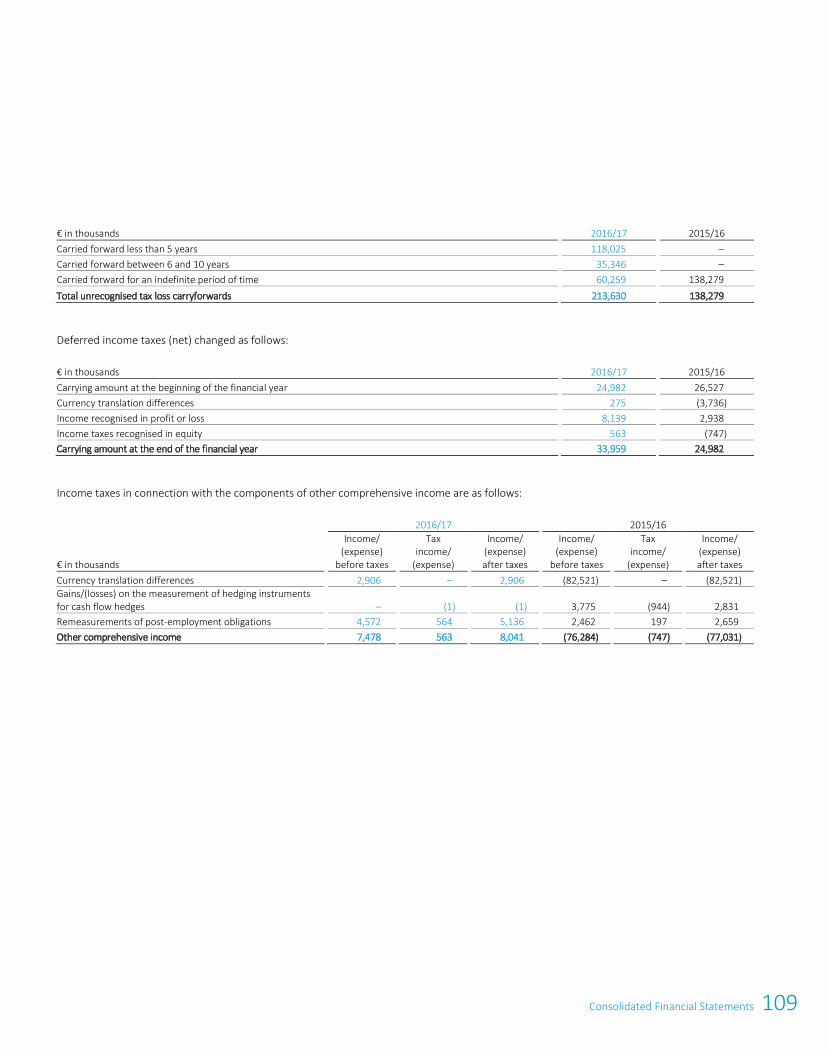
109Consolidated Financial Statements
90 AT&S Annual Report 2016/17
The difference between the Group’s actual tax expense and the theoretical amount that would arise using the Austrian corporate income tax rate is as follows:
€ in thousands
2016/17
2015/16 Expected tax expense at Austrian tax rate
(2,712)
17,209
Effect of different tax rates in foreign countries 10,288
(5,057)
Non-creditable foreign withholding taxes 1,038
1,825
Effect of change in valuation allowance of deferred income tax assets 11,982
(807)
Effect of the change in tax rate (2,283)
(622)
Effect of permanent differences (6,268)
195
Effect of taxes from prior periods 2
140
Total tax expense 12,047
12,883
Deferred income tax assets and liabilities are offset when there is a legally enforceable right to offset current tax assets against current tax liabili-ties and when the deferred taxes and liabilities relate to taxes levied by the same taxation authority. The amounts after setting off deferred income tax assets against deferred liabilities are as follows:
€ in thousands
31 Mar 2017
31 Mar 2016
Assets
Liabilities
Assets
Liabilities
Non-current assets 26,183
(4,788)
26,639
(4,740)
Provisions for employee benefits 4,070
–
4,607
–
Income tax loss carryforwards including taxable goodwill 51,800
–
36,190
–
Deferred income tax from long-term assets/liabilities 82,053
(4,788)
67,436
(4,740)
Inventories 4,522
–
3,505
–
Trade and other receivables 12
–
8
–
Trade and other payables 1,310
–
1,871
–
Others 2,437
(56)
466
(150)
Temporary differences arising from shares in subsidiaries –
(4,700)
–
(8,844)
Deferred income tax from short-term assets/liabilities 8,281
(4,756)
5,850
(8,994)
Deferred income tax assets/liabilities 90,334
(9,544)
73,286
(13,734)
Unrecognised deferred taxes (46,831)
–
(34,570)
–
Deferred income tax assets/liabilities, offsetting against the same taxation authority
(4,844)
4,844
(4,890)
4,890
Deferred income tax assets/liabilities, net 38,659
(4,700)
33,826
(8,844)
At 31 March 2017, the Group has income tax loss carryforwards and tax-deductible amortisation of goodwill amounting to a total of € 268,546 thousand (previous year: € 147,797 thousand). For loss carryforwards amounting to € 213,630 thousand (previous year: € 138,279 thousand) included in this figure, deferred income tax assets in the amount of € 38,071 thousand (previous year: € 34,570 thousand) were not recognised since it is unlikely that they will be realised in the foreseeable future. In addition, for temporary differences amounting to € 58,398 thousand (previous year: € 0 thousand) included in this figure, deferred income tax assets in the amount of € 8,760 thousand (previous year: € 0 thousand) were not recognised since it is likewise unlikely that they will be realised in the foreseeable future.
The tax loss carryforwards, which are unrecognised, carried forward as follows:
Consolidated Financial Statements 91
€ in thousands
2016/17
2015/16 Carried forward less than 5 years
118,025
–
Carried forward between 6 and 10 years 35,346
–
Carried forward for an indefinite period of time 60,259
138,279
Total unrecognised tax loss carryforwards 213,630
138,279
Deferred income taxes (net) changed as follows:
€ in thousands
2016/17
2015/16 Carrying amount at the beginning of the financial year
24,982
26,527
Currency translation differences 275
(3,736)
Income recognised in profit or loss 8,139
2,938
Income taxes recognised in equity 563
(747)
Carrying amount at the end of the financial year 33,959
24,982
Income taxes in connection with the components of other comprehensive income are as follows:
2016/17 2015/16
€ in thousands
Income/ (expense)
before taxes
Tax income/
(expense)
Income/ (expense) after taxes
Income/ (expense)
before taxes
Tax income/
(expense)
Income/ (expense) after taxes
Currency translation differences 2,906 – 2,906 (82,521) – (82,521) Gains/(losses) on the measurement of hedging instruments for cash flow hedges – (1) (1) 3,775 (944) 2,831 Remeasurements of post-employment obligations 4,572 564 5,136 2,462 197 2,659 Other comprehensive income 7,478 563 8,041 (76,284) (747) (77,031)
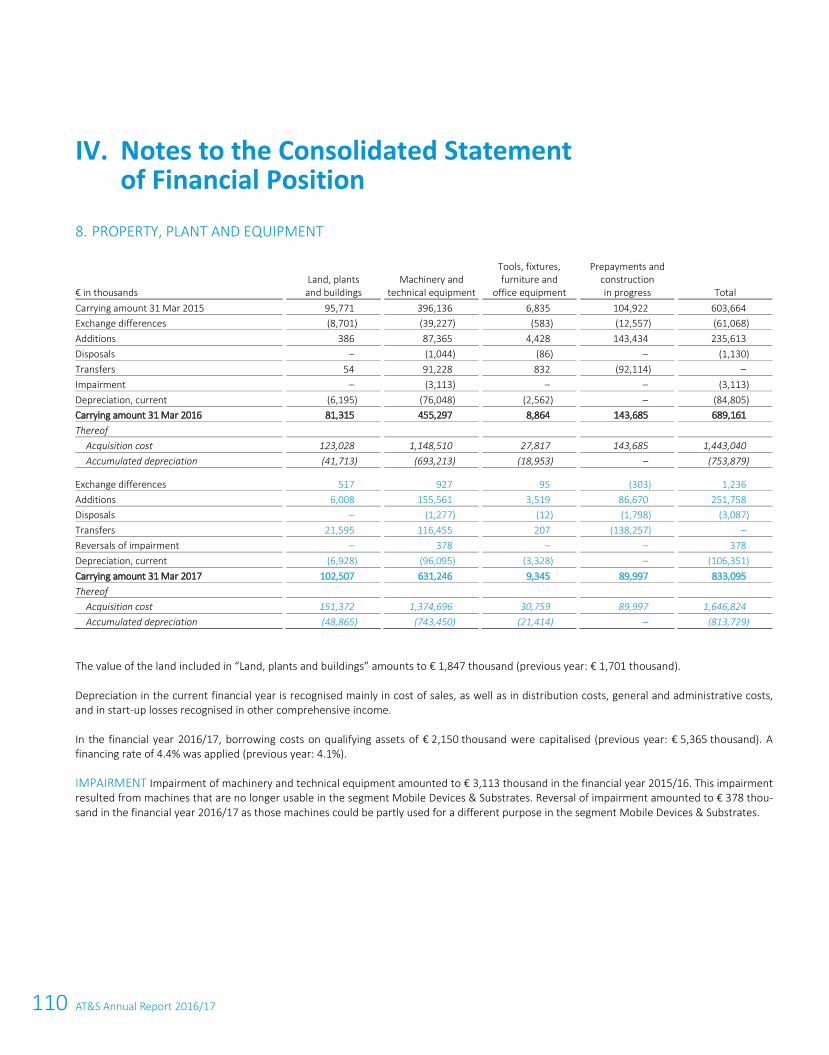
110 AT&S Annual Report 2016/17
92 AT&S Annual Report 2016/17
8. PROPERTY, PLANT AND EQUIPMENT
€ in thousands
Land, plants and buildings
Machinery and technical equipment
Tools, fixtures, furniture and
office equipment
Prepayments and construction in progress
Total
Carrying amount 31 Mar 2015 95,771
396,136
6,835
104,922
603,664
Exchange differences (8,701)
(39,227)
(583)
(12,557)
(61,068)
Additions 386
87,365
4,428
143,434
235,613
Disposals ‒
(1,044)
(86)
‒
(1,130)
Transfers 54
91,228
832
(92,114)
‒
Impairment ‒
(3,113)
‒
‒
(3,113)
Depreciation, current (6,195)
(76,048)
(2,562)
‒
(84,805)
Carrying amount 31 Mar 2016 81,315
455,297
8,864
143,685
689,161
Thereof
Acquisition cost 123,028
1,148,510
27,817
143,685
1,443,040
Accumulated depreciation (41,713)
(693,213)
(18,953)
‒
(753,879)
Exchange differences 517
927
95
(303)
1,236
Additions 6,008
155,561
3,519
86,670
251,758
Disposals ‒
(1,277)
(12)
(1,798)
(3,087)
Transfers 21,595
116,455
207
(138,257)
‒
Reversals of impairment ‒
378
‒
‒
378
Depreciation, current (6,928)
(96,095)
(3,328)
‒
(106,351)
Carrying amount 31 Mar 2017 102,507
631,246
9,345
89,997
833,095
Thereof
Acquisition cost 151,372
1,374,696
30,759
89,997
1,646,824
Accumulated depreciation (48,865)
(743,450)
(21,414)
‒
(813,729)
The value of the land included in “Land, plants and buildings” amounts to € 1,847 thousand (previous year: € 1,701 thousand).
Depreciation in the current financial year is recognised mainly in cost of sales, as well as in distribution costs, general and administrative costs, and in start-up losses recognised in other comprehensive income.
In the financial year 2016/17, borrowing costs on qualifying assets of € 2,150 thousand were capitalised (previous year: € 5,365 thousand). A financing rate of 4.4% was applied (previous year: 4.1%).
IMPAIRMENT Impairment of machinery and technical equipment amounted to € 3,113 thousand in the financial year 2015/16. This impairment resulted from machines that are no longer usable in the segment Mobile Devices & Substrates. Reversal of impairment amounted to € 378 thou-sand in the financial year 2016/17 as those machines could be partly used for a different purpose in the segment Mobile Devices & Substrates.
IV. Notes to the Consolidated Statement of Financial Position
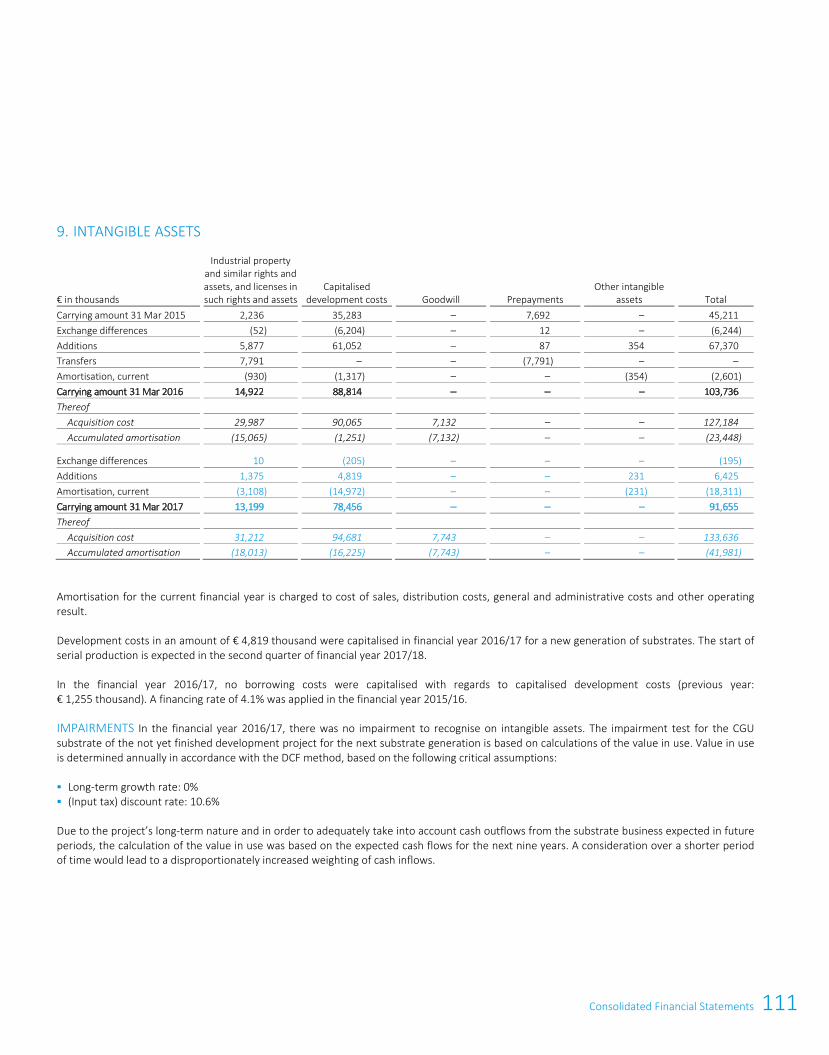
111Consolidated Financial Statements
92 AT&S Annual Report 2016/17
8. PROPERTY, PLANT AND EQUIPMENT
€ in thousands
Land, plants and buildings
Machinery and technical equipment
Tools, fixtures, furniture and
office equipment
Prepayments and construction in progress
Total
Carrying amount 31 Mar 2015 95,771
396,136
6,835
104,922
603,664
Exchange differences (8,701)
(39,227)
(583)
(12,557)
(61,068)
Additions 386
87,365
4,428
143,434
235,613
Disposals ‒
(1,044)
(86)
‒
(1,130)
Transfers 54
91,228
832
(92,114)
‒
Impairment ‒
(3,113)
‒
‒
(3,113)
Depreciation, current (6,195)
(76,048)
(2,562)
‒
(84,805)
Carrying amount 31 Mar 2016 81,315
455,297
8,864
143,685
689,161
Thereof
Acquisition cost 123,028
1,148,510
27,817
143,685
1,443,040
Accumulated depreciation (41,713)
(693,213)
(18,953)
‒
(753,879)
Exchange differences 517
927
95
(303)
1,236
Additions 6,008
155,561
3,519
86,670
251,758
Disposals ‒
(1,277)
(12)
(1,798)
(3,087)
Transfers 21,595
116,455
207
(138,257)
‒
Reversals of impairment ‒
378
‒
‒
378
Depreciation, current (6,928)
(96,095)
(3,328)
‒
(106,351)
Carrying amount 31 Mar 2017 102,507
631,246
9,345
89,997
833,095
Thereof
Acquisition cost 151,372
1,374,696
30,759
89,997
1,646,824
Accumulated depreciation (48,865)
(743,450)
(21,414)
‒
(813,729)
The value of the land included in “Land, plants and buildings” amounts to € 1,847 thousand (previous year: € 1,701 thousand).
Depreciation in the current financial year is recognised mainly in cost of sales, as well as in distribution costs, general and administrative costs, and in start-up losses recognised in other comprehensive income.
In the financial year 2016/17, borrowing costs on qualifying assets of € 2,150 thousand were capitalised (previous year: € 5,365 thousand). A financing rate of 4.4% was applied (previous year: 4.1%).
IMPAIRMENT Impairment of machinery and technical equipment amounted to € 3,113 thousand in the financial year 2015/16. This impairment resulted from machines that are no longer usable in the segment Mobile Devices & Substrates. Reversal of impairment amounted to € 378 thou-sand in the financial year 2016/17 as those machines could be partly used for a different purpose in the segment Mobile Devices & Substrates.
IV. Notes to the Consolidated Statement of Financial Position
Consolidated Financial Statements 93
9. INTANGIBLE ASSETS
€ in thousands
Industrial property and similar rights and assets, and licenses in such rights and assets
Capitalised development costs
Goodwill
Prepayments
Other intangible assets
Total
Carrying amount 31 Mar 2015 2,236
35,283
‒
7,692
‒
45,211
Exchange differences (52)
(6,204)
‒
12
‒
(6,244)
Additions 5,877
61,052
‒
87
354
67,370
Transfers 7,791
‒
‒
(7,791)
‒
‒
Amortisation, current (930)
(1,317)
‒
‒
(354)
(2,601)
Carrying amount 31 Mar 2016 14,922
88,814
‒
‒
‒
103,736
Thereof
Acquisition cost 29,987
90,065
7,132
‒
‒
127,184
Accumulated amortisation (15,065)
(1,251)
(7,132)
‒
‒
(23,448)
Exchange differences 10
(205)
‒
‒
‒
(195)
Additions 1,375
4,819
‒
‒
231
6,425
Amortisation, current (3,108)
(14,972)
‒
‒
(231)
(18,311)
Carrying amount 31 Mar 2017 13,199
78,456
‒
‒
‒
91,655
Thereof
Acquisition cost 31,212
94,681
7,743
‒
‒
133,636
Accumulated amortisation (18,013)
(16,225)
(7,743)
‒
‒
(41,981)
Amortisation for the current financial year is charged to cost of sales, distribution costs, general and administrative costs and other operating result.
Development costs in an amount of € 4,819 thousand were capitalised in financial year 2016/17 for a new generation of substrates. The start of serial production is expected in the second quarter of financial year 2017/18.
In the financial year 2016/17, no borrowing costs were capitalised with regards to capitalised development costs (previous year: € 1,255 thousand). A financing rate of 4.1% was applied in the financial year 2015/16.
IMPAIRMENTS In the financial year 2016/17, there was no impairment to recognise on intangible assets. The impairment test for the CGU substrate of the not yet finished development project for the next substrate generation is based on calculations of the value in use. Value in use is determined annually in accordance with the DCF method, based on the following critical assumptions:
Long-term growth rate: 0% (Input tax) discount rate: 10.6%
Due to the project’s long-term nature and in order to adequately take into account cash outflows from the substrate business expected in future periods, the calculation of the value in use was based on the expected cash flows for the next nine years. A consideration over a shorter period of time would lead to a disproportionately increased weighting of cash inflows.
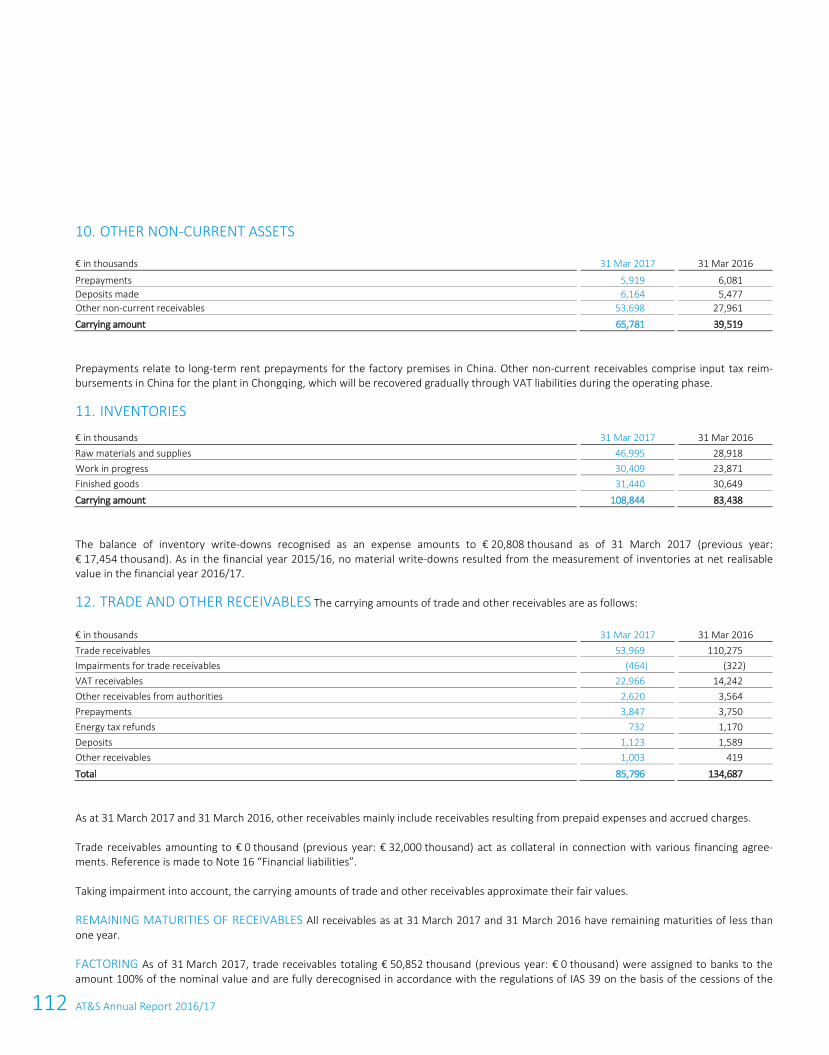
112 AT&S Annual Report 2016/17
94 AT&S Annual Report 2016/17
10. OTHER NON-CURRENT ASSETS
€ in thousands
31 Mar 2017
31 Mar 2016
Prepayments 5,919
6,081
Deposits made 6,164
5,477
Other non-current receivables 53,698
27,961
Carrying amount 65,781
39,519
Prepayments relate to long-term rent prepayments for the factory premises in China. Other non-current receivables comprise input tax reim-bursements in China for the plant in Chongqing, which will be recovered gradually through VAT liabilities during the operating phase.
11. INVENTORIES
€ in thousands
31 Mar 2017
31 Mar 2016 Raw materials and supplies
46,995
28,918
Work in progress 30,409
23,871
Finished goods 31,440
30,649
Carrying amount 108,844
83,438
The balance of inventory write-downs recognised as an expense amounts to € 20,808 thousand as of 31 March 2017 (previous year: € 17,454 thousand). As in the financial year 2015/16, no material write-downs resulted from the measurement of inventories at net realisable value in the financial year 2016/17.
12. TRADE AND OTHER RECEIVABLES The carrying amounts of trade and other receivables are as follows:
€ in thousands
31 Mar 2017
31 Mar 2016 Trade receivables
53,969
110,275
Impairments for trade receivables (464)
(322)
VAT receivables 22,966
14,242
Other receivables from authorities 2,620
3,564
Prepayments 3,847
3,750
Energy tax refunds 732
1,170
Deposits 1,123
1,589
Other receivables 1,003
419
Total 85,796
134,687
As at 31 March 2017 and 31 March 2016, other receivables mainly include receivables resulting from prepaid expenses and accrued charges.
Trade receivables amounting to € 0 thousand (previous year: € 32,000 thousand) act as collateral in connection with various financing agree-ments. Reference is made to Note 16 “Financial liabilities”.
Taking impairment into account, the carrying amounts of trade and other receivables approximate their fair values.
REMAINING MATURITIES OF RECEIVABLES All receivables as at 31 March 2017 and 31 March 2016 have remaining maturities of less than one year.
FACTORING As of 31 March 2017, trade receivables totaling € 50,852 thousand (previous year: € 0 thousand) were assigned to banks to the amount 100% of the nominal value and are fully derecognised in accordance with the regulations of IAS 39 on the basis of the cessions of the
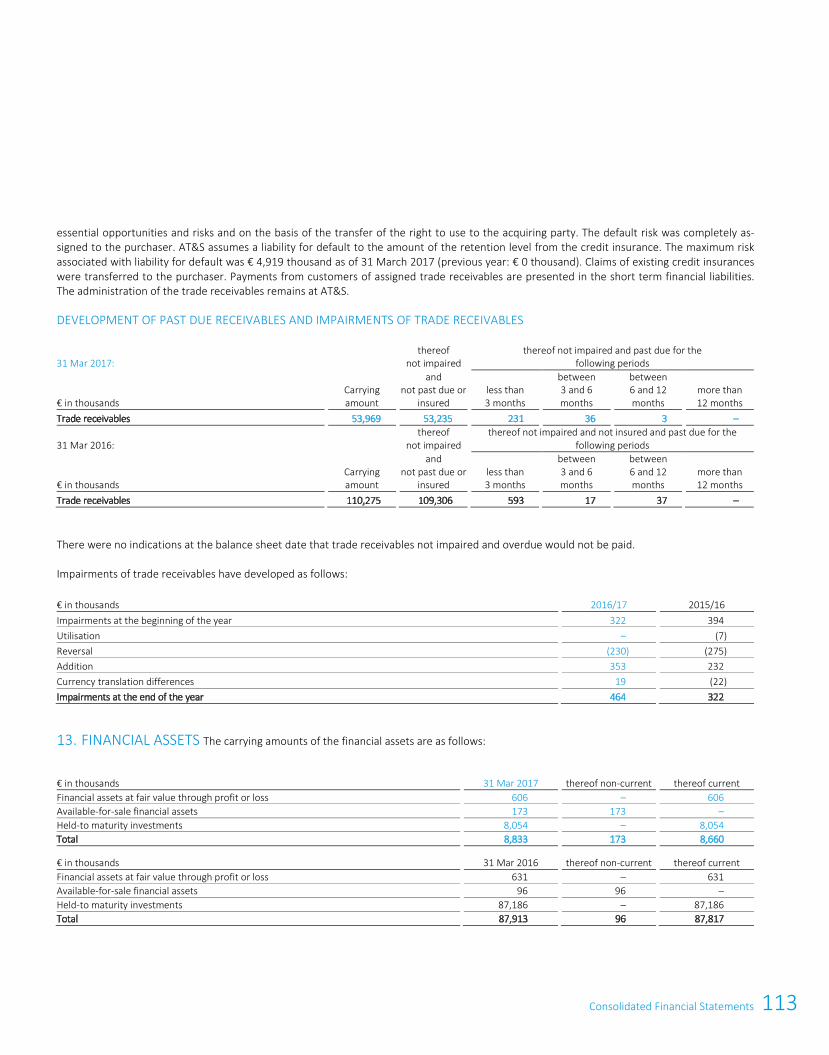
113Consolidated Financial Statements
94 AT&S Annual Report 2016/17
10. OTHER NON-CURRENT ASSETS
€ in thousands
31 Mar 2017
31 Mar 2016
Prepayments 5,919
6,081
Deposits made 6,164
5,477
Other non-current receivables 53,698
27,961
Carrying amount 65,781
39,519
Prepayments relate to long-term rent prepayments for the factory premises in China. Other non-current receivables comprise input tax reim-bursements in China for the plant in Chongqing, which will be recovered gradually through VAT liabilities during the operating phase.
11. INVENTORIES
€ in thousands
31 Mar 2017
31 Mar 2016 Raw materials and supplies
46,995
28,918
Work in progress 30,409
23,871
Finished goods 31,440
30,649
Carrying amount 108,844
83,438
The balance of inventory write-downs recognised as an expense amounts to € 20,808 thousand as of 31 March 2017 (previous year: € 17,454 thousand). As in the financial year 2015/16, no material write-downs resulted from the measurement of inventories at net realisable value in the financial year 2016/17.
12. TRADE AND OTHER RECEIVABLES The carrying amounts of trade and other receivables are as follows:
€ in thousands
31 Mar 2017
31 Mar 2016 Trade receivables
53,969
110,275
Impairments for trade receivables (464)
(322)
VAT receivables 22,966
14,242
Other receivables from authorities 2,620
3,564
Prepayments 3,847
3,750
Energy tax refunds 732
1,170
Deposits 1,123
1,589
Other receivables 1,003
419
Total 85,796
134,687
As at 31 March 2017 and 31 March 2016, other receivables mainly include receivables resulting from prepaid expenses and accrued charges.
Trade receivables amounting to € 0 thousand (previous year: € 32,000 thousand) act as collateral in connection with various financing agree-ments. Reference is made to Note 16 “Financial liabilities”.
Taking impairment into account, the carrying amounts of trade and other receivables approximate their fair values.
REMAINING MATURITIES OF RECEIVABLES All receivables as at 31 March 2017 and 31 March 2016 have remaining maturities of less than one year.
FACTORING As of 31 March 2017, trade receivables totaling € 50,852 thousand (previous year: € 0 thousand) were assigned to banks to the amount 100% of the nominal value and are fully derecognised in accordance with the regulations of IAS 39 on the basis of the cessions of the
Consolidated Financial Statements 95
essential opportunities and risks and on the basis of the transfer of the right to use to the acquiring party. The default risk was completely as-signed to the purchaser. AT&S assumes a liability for default to the amount of the retention level from the credit insurance. The maximum risk associated with liability for default was € 4,919 thousand as of 31 March 2017 (previous year: € 0 thousand). Claims of existing credit insurances were transferred to the purchaser. Payments from customers of assigned trade receivables are presented in the short term financial liabilities. The administration of the trade receivables remains at AT&S.
DEVELOPMENT OF PAST DUE RECEIVABLES AND IMPAIRMENTS OF TRADE RECEIVABLES
31 Mar 2017: thereof
not impaired thereof not impaired and past due for the
following periods
€ in thousands Carrying amount
and not past due or
insured
less than 3 months
between 3 and 6 months
between 6 and 12 months
more than 12 months
Trade receivables 53,969 53,235 231 36 3 –
31 Mar 2016: thereof
not impaired thereof not impaired and not insured and past due for the
following periods
€ in thousands Carrying amount
and not past due or
insured less than 3 months
between 3 and 6 months
between 6 and 12 months
more than 12 months
Trade receivables 110,275 109,306 593 17 37 –
There were no indications at the balance sheet date that trade receivables not impaired and overdue would not be paid.
Impairments of trade receivables have developed as follows:
€ in thousands
2016/17
2015/16 Impairments at the beginning of the year
322
394
Utilisation –
(7)
Reversal (230)
(275)
Addition 353
232
Currency translation differences 19
(22)
Impairments at the end of the year 464
322
13. FINANCIAL ASSETS The carrying amounts of the financial assets are as follows:
€ in thousands
31 Mar 2017
thereof non-current
thereof current Financial assets at fair value through profit or loss
606
–
606
Available-for-sale financial assets 173
173
–
Held-to maturity investments 8,054
–
8,054
Total 8,833
173
8,660
€ in thousands
31 Mar 2016
thereof non-current
thereof current Financial assets at fair value through profit or loss
631
–
631
Available-for-sale financial assets 96
96
–
Held-to maturity investments 87,186
–
87,186
Total 87,913
96
87,817
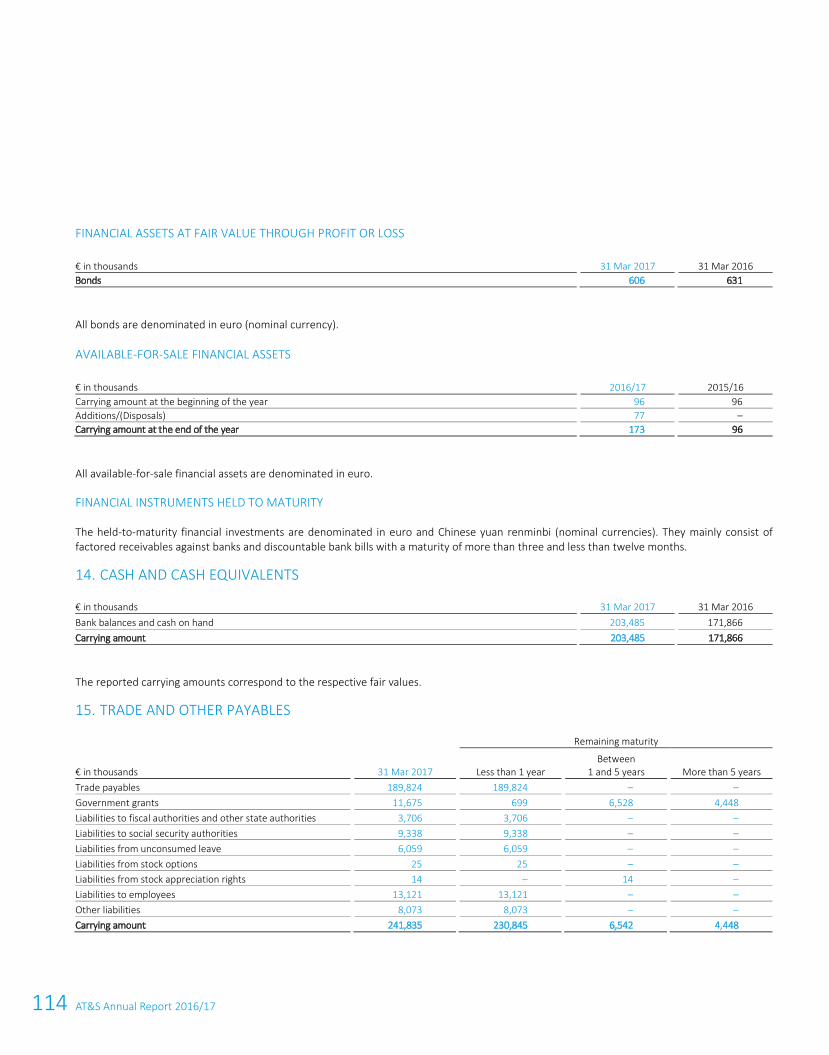
114 AT&S Annual Report 2016/17
96 AT&S Annual Report 2016/17
FINANCIAL ASSETS AT FAIR VALUE THROUGH PROFIT OR LOSS
€ in thousands
31 Mar 2017
31 Mar 2016 Bonds
606
631
All bonds are denominated in euro (nominal currency).
AVAILABLE-FOR-SALE FINANCIAL ASSETS
€ in thousands
2016/17
2015/16 Carrying amount at the beginning of the year
96
96
Additions/(Disposals) 77
–
Carrying amount at the end of the year 173
96
All available-for-sale financial assets are denominated in euro.
FINANCIAL INSTRUMENTS HELD TO MATURITY
The held-to-maturity financial investments are denominated in euro and Chinese yuan renminbi (nominal currencies). They mainly consist of factored receivables against banks and discountable bank bills with a maturity of more than three and less than twelve months.
14. CASH AND CASH EQUIVALENTS
€ in thousands
31 Mar 2017
31 Mar 2016 Bank balances and cash on hand
203,485
171,866
Carrying amount 203,485
171,866
The reported carrying amounts correspond to the respective fair values.
15. TRADE AND OTHER PAYABLES
Remaining maturity
€ in thousands 31 Mar 2017 Less than 1 year Between
1 and 5 years More than 5 years Trade payables 189,824 189,824 ‒ ‒ Government grants 11,675 699 6,528 4,448 Liabilities to fiscal authorities and other state authorities 3,706 3,706 ‒ ‒ Liabilities to social security authorities 9,338 9,338 ‒ ‒ Liabilities from unconsumed leave 6,059 6,059 ‒ ‒ Liabilities from stock options 25 25 ‒ ‒ Liabilities from stock appreciation rights 14 ‒ 14 ‒ Liabilities to employees 13,121 13,121 ‒ ‒ Other liabilities 8,073 8,073 ‒ ‒ Carrying amount 241,835 230,845 6,542 4,448
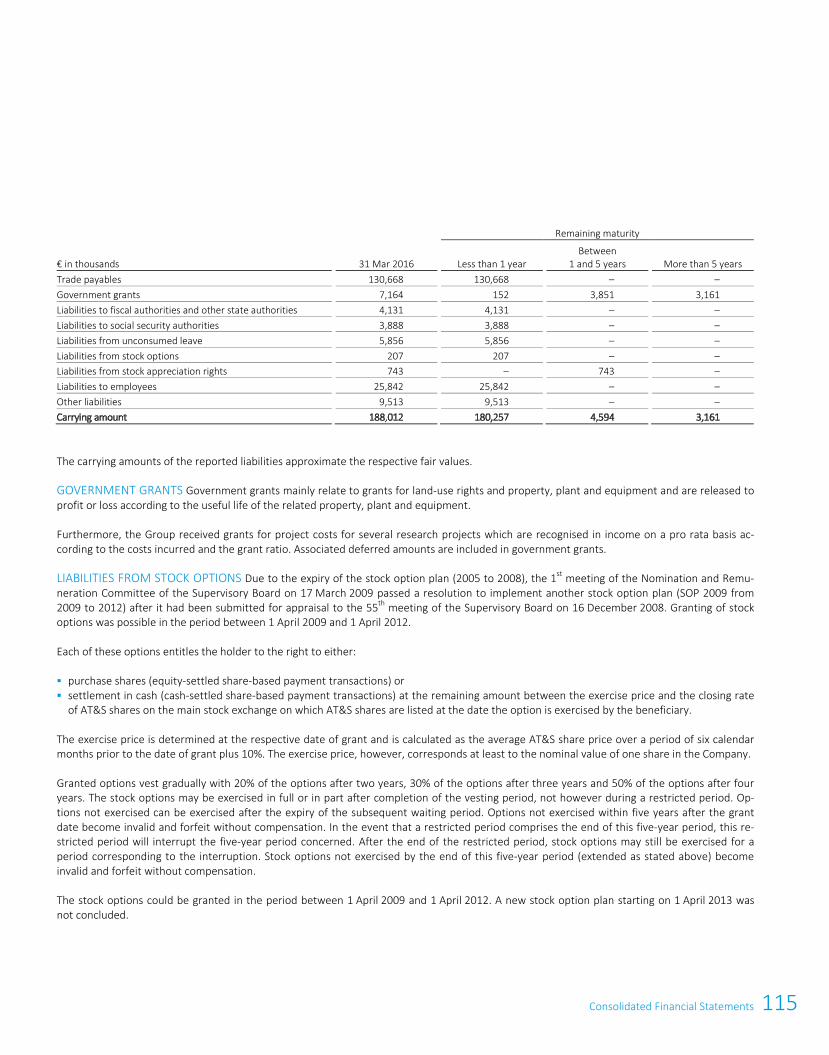
115Consolidated Financial Statements
96 AT&S Annual Report 2016/17
FINANCIAL ASSETS AT FAIR VALUE THROUGH PROFIT OR LOSS
€ in thousands
31 Mar 2017
31 Mar 2016 Bonds
606
631
All bonds are denominated in euro (nominal currency).
AVAILABLE-FOR-SALE FINANCIAL ASSETS
€ in thousands
2016/17
2015/16 Carrying amount at the beginning of the year
96
96
Additions/(Disposals) 77
–
Carrying amount at the end of the year 173
96
All available-for-sale financial assets are denominated in euro.
FINANCIAL INSTRUMENTS HELD TO MATURITY
The held-to-maturity financial investments are denominated in euro and Chinese yuan renminbi (nominal currencies). They mainly consist of factored receivables against banks and discountable bank bills with a maturity of more than three and less than twelve months.
14. CASH AND CASH EQUIVALENTS
€ in thousands
31 Mar 2017
31 Mar 2016 Bank balances and cash on hand
203,485
171,866
Carrying amount 203,485
171,866
The reported carrying amounts correspond to the respective fair values.
15. TRADE AND OTHER PAYABLES
Remaining maturity
€ in thousands 31 Mar 2017 Less than 1 year Between
1 and 5 years More than 5 years Trade payables 189,824 189,824 ‒ ‒ Government grants 11,675 699 6,528 4,448 Liabilities to fiscal authorities and other state authorities 3,706 3,706 ‒ ‒ Liabilities to social security authorities 9,338 9,338 ‒ ‒ Liabilities from unconsumed leave 6,059 6,059 ‒ ‒ Liabilities from stock options 25 25 ‒ ‒ Liabilities from stock appreciation rights 14 ‒ 14 ‒ Liabilities to employees 13,121 13,121 ‒ ‒ Other liabilities 8,073 8,073 ‒ ‒ Carrying amount 241,835 230,845 6,542 4,448
Consolidated Financial Statements 97
Remaining maturity
€ in thousands 31 Mar 2016 Less than 1 year Between
1 and 5 years More than 5 years Trade payables 130,668 130,668 ‒ ‒ Government grants 7,164 152 3,851 3,161 Liabilities to fiscal authorities and other state authorities 4,131 4,131 ‒ ‒ Liabilities to social security authorities 3,888 3,888 ‒ ‒ Liabilities from unconsumed leave 5,856 5,856 ‒ ‒ Liabilities from stock options 207 207 ‒ ‒ Liabilities from stock appreciation rights 743 ‒ 743 ‒ Liabilities to employees 25,842 25,842 ‒ ‒ Other liabilities 9,513 9,513 ‒ ‒ Carrying amount 188,012 180,257 4,594 3,161
The carrying amounts of the reported liabilities approximate the respective fair values.
GOVERNMENT GRANTS Government grants mainly relate to grants for land-use rights and property, plant and equipment and are released to profit or loss according to the useful life of the related property, plant and equipment.
Furthermore, the Group received grants for project costs for several research projects which are recognised in income on a pro rata basis ac-cording to the costs incurred and the grant ratio. Associated deferred amounts are included in government grants.
LIABILITIES FROM STOCK OPTIONS Due to the expiry of the stock option plan (2005 to 2008), the 1st meeting of the Nomination and Remu-neration Committee of the Supervisory Board on 17 March 2009 passed a resolution to implement another stock option plan (SOP 2009 from 2009 to 2012) after it had been submitted for appraisal to the 55th meeting of the Supervisory Board on 16 December 2008. Granting of stock options was possible in the period between 1 April 2009 and 1 April 2012.
Each of these options entitles the holder to the right to either:
purchase shares (equity-settled share-based payment transactions) or settlement in cash (cash-settled share-based payment transactions) at the remaining amount between the exercise price and the closing rate
of AT&S shares on the main stock exchange on which AT&S shares are listed at the date the option is exercised by the beneficiary.
The exercise price is determined at the respective date of grant and is calculated as the average AT&S share price over a period of six calendar months prior to the date of grant plus 10%. The exercise price, however, corresponds at least to the nominal value of one share in the Company.
Granted options vest gradually with 20% of the options after two years, 30% of the options after three years and 50% of the options after four years. The stock options may be exercised in full or in part after completion of the vesting period, not however during a restricted period. Op-tions not exercised can be exercised after the expiry of the subsequent waiting period. Options not exercised within five years after the grant date become invalid and forfeit without compensation. In the event that a restricted period comprises the end of this five-year period, this re-stricted period will interrupt the five-year period concerned. After the end of the restricted period, stock options may still be exercised for a period corresponding to the interruption. Stock options not exercised by the end of this five-year period (extended as stated above) become invalid and forfeit without compensation.
The stock options could be granted in the period between 1 April 2009 and 1 April 2012. A new stock option plan starting on 1 April 2013 was not concluded.
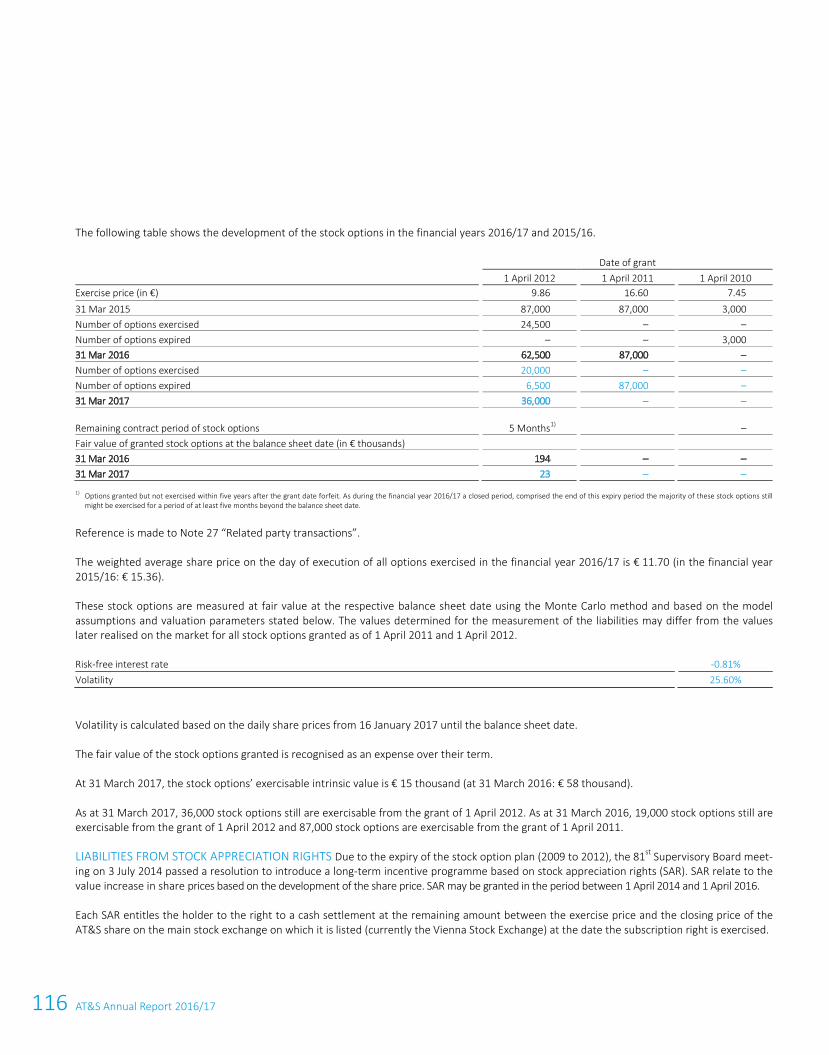
116 AT&S Annual Report 2016/17
98 AT&S Annual Report 2016/17
The following table shows the development of the stock options in the financial years 2016/17 and 2015/16.
Date of grant
1 April 2012
1 April 2011
1 April 2010
Exercise price (in €) 9.86
16.60
7.45
31 Mar 2015 87,000
87,000
3,000
Number of options exercised 24,500
–
–
Number of options expired –
–
3,000
31 Mar 2016 62,500
87,000
–
Number of options exercised 20,000
–
–
Number of options expired 6,500
87,000
–
31 Mar 2017 36,000
–
–
Remaining contract period of stock options 5 Months
1)
–
Fair value of granted stock options at the balance sheet date (in € thousands)
31 Mar 2016 194
–
–
31 Mar 2017 23
–
–
1) Options granted but not exercised within five years after the grant date forfeit. As during the financial year 2016/17 a closed period, comprised the end of this expiry period the majority of these stock options still
might be exercised for a period of at least five months beyond the balance sheet date.
Reference is made to Note 27 “Related party transactions”.
The weighted average share price on the day of execution of all options exercised in the financial year 2016/17 is € 11.70 (in the financial year 2015/16: € 15.36).
These stock options are measured at fair value at the respective balance sheet date using the Monte Carlo method and based on the model assumptions and valuation parameters stated below. The values determined for the measurement of the liabilities may differ from the values later realised on the market for all stock options granted as of 1 April 2011 and 1 April 2012.
Risk-free interest rate -0.81% Volatility 25.60%
Volatility is calculated based on the daily share prices from 16 January 2017 until the balance sheet date.
The fair value of the stock options granted is recognised as an expense over their term.
At 31 March 2017, the stock options’ exercisable intrinsic value is € 15 thousand (at 31 March 2016: € 58 thousand).
As at 31 March 2017, 36,000 stock options still are exercisable from the grant of 1 April 2012. As at 31 March 2016, 19,000 stock options still are exercisable from the grant of 1 April 2012 and 87,000 stock options are exercisable from the grant of 1 April 2011.
LIABILITIES FROM STOCK APPRECIATION RIGHTS Due to the expiry of the stock option plan (2009 to 2012), the 81st Supervisory Board meet-ing on 3 July 2014 passed a resolution to introduce a long-term incentive programme based on stock appreciation rights (SAR). SAR relate to the value increase in share prices based on the development of the share price. SAR may be granted in the period between 1 April 2014 and 1 April 2016.
Each SAR entitles the holder to the right to a cash settlement at the remaining amount between the exercise price and the closing price of the AT&S share on the main stock exchange on which it is listed (currently the Vienna Stock Exchange) at the date the subscription right is exercised.
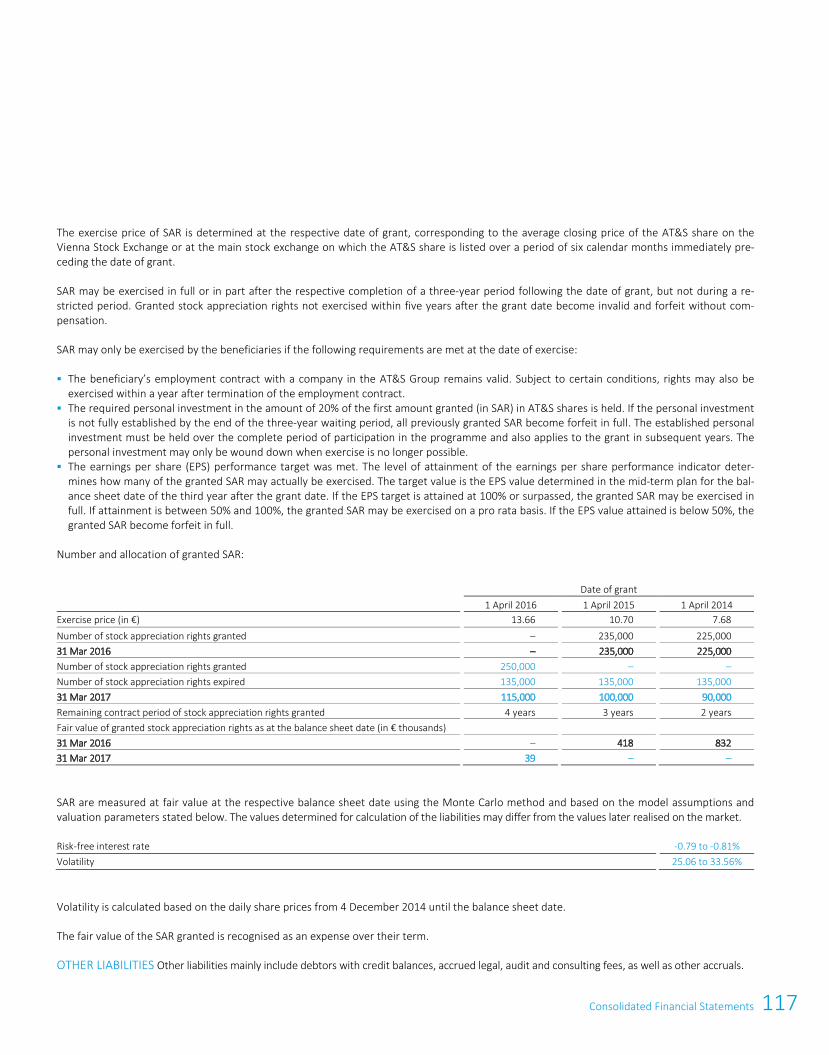
117Consolidated Financial Statements
98 AT&S Annual Report 2016/17
The following table shows the development of the stock options in the financial years 2016/17 and 2015/16.
Date of grant
1 April 2012
1 April 2011
1 April 2010
Exercise price (in €) 9.86
16.60
7.45
31 Mar 2015 87,000
87,000
3,000
Number of options exercised 24,500
–
–
Number of options expired –
–
3,000
31 Mar 2016 62,500
87,000
–
Number of options exercised 20,000
–
–
Number of options expired 6,500
87,000
–
31 Mar 2017 36,000
–
–
Remaining contract period of stock options 5 Months
1)
–
Fair value of granted stock options at the balance sheet date (in € thousands)
31 Mar 2016 194
–
–
31 Mar 2017 23
–
–
1) Options granted but not exercised within five years after the grant date forfeit. As during the financial year 2016/17 a closed period, comprised the end of this expiry period the majority of these stock options still
might be exercised for a period of at least five months beyond the balance sheet date.
Reference is made to Note 27 “Related party transactions”.
The weighted average share price on the day of execution of all options exercised in the financial year 2016/17 is € 11.70 (in the financial year 2015/16: € 15.36).
These stock options are measured at fair value at the respective balance sheet date using the Monte Carlo method and based on the model assumptions and valuation parameters stated below. The values determined for the measurement of the liabilities may differ from the values later realised on the market for all stock options granted as of 1 April 2011 and 1 April 2012.
Risk-free interest rate -0.81% Volatility 25.60%
Volatility is calculated based on the daily share prices from 16 January 2017 until the balance sheet date.
The fair value of the stock options granted is recognised as an expense over their term.
At 31 March 2017, the stock options’ exercisable intrinsic value is € 15 thousand (at 31 March 2016: € 58 thousand).
As at 31 March 2017, 36,000 stock options still are exercisable from the grant of 1 April 2012. As at 31 March 2016, 19,000 stock options still are exercisable from the grant of 1 April 2012 and 87,000 stock options are exercisable from the grant of 1 April 2011.
LIABILITIES FROM STOCK APPRECIATION RIGHTS Due to the expiry of the stock option plan (2009 to 2012), the 81st Supervisory Board meet-ing on 3 July 2014 passed a resolution to introduce a long-term incentive programme based on stock appreciation rights (SAR). SAR relate to the value increase in share prices based on the development of the share price. SAR may be granted in the period between 1 April 2014 and 1 April 2016.
Each SAR entitles the holder to the right to a cash settlement at the remaining amount between the exercise price and the closing price of the AT&S share on the main stock exchange on which it is listed (currently the Vienna Stock Exchange) at the date the subscription right is exercised.
Consolidated Financial Statements 99
The exercise price of SAR is determined at the respective date of grant, corresponding to the average closing price of the AT&S share on the Vienna Stock Exchange or at the main stock exchange on which the AT&S share is listed over a period of six calendar months immediately pre-ceding the date of grant.
SAR may be exercised in full or in part after the respective completion of a three-year period following the date of grant, but not during a re-stricted period. Granted stock appreciation rights not exercised within five years after the grant date become invalid and forfeit without com-pensation.
SAR may only be exercised by the beneficiaries if the following requirements are met at the date of exercise:
The beneficiary’s employment contract with a company in the AT&S Group remains valid. Subject to certain conditions, rights may also be exercised within a year after termination of the employment contract.
The required personal investment in the amount of 20% of the first amount granted (in SAR) in AT&S shares is held. If the personal investment is not fully established by the end of the three-year waiting period, all previously granted SAR become forfeit in full. The established personal investment must be held over the complete period of participation in the programme and also applies to the grant in subsequent years. The personal investment may only be wound down when exercise is no longer possible.
The earnings per share (EPS) performance target was met. The level of attainment of the earnings per share performance indicator deter-mines how many of the granted SAR may actually be exercised. The target value is the EPS value determined in the mid-term plan for the bal-ance sheet date of the third year after the grant date. If the EPS target is attained at 100% or surpassed, the granted SAR may be exercised in full. If attainment is between 50% and 100%, the granted SAR may be exercised on a pro rata basis. If the EPS value attained is below 50%, the granted SAR become forfeit in full.
Number and allocation of granted SAR:
Date of grant
1 April 2016
1 April 2015
1 April 2014
Exercise price (in €) 13.66 10.70 7.68 Number of stock appreciation rights granted
–
235,000
225,000
31 Mar 2016
–
235,000
225,000 Number of stock appreciation rights granted
250,000
–
–
Number of stock appreciation rights expired
135,000
135,000
135,000 31 Mar 2017
115,000
100,000
90,000
Remaining contract period of stock appreciation rights granted
4 years
3 years
2 years Fair value of granted stock appreciation rights as at the balance sheet date (in € thousands)
31 Mar 2016
–
418
832 31 Mar 2017
39
–
–
SAR are measured at fair value at the respective balance sheet date using the Monte Carlo method and based on the model assumptions and valuation parameters stated below. The values determined for calculation of the liabilities may differ from the values later realised on the market.
Risk-free interest rate -0.79 to -0.81% Volatility
25.06 to 33.56%
Volatility is calculated based on the daily share prices from 4 December 2014 until the balance sheet date.
The fair value of the SAR granted is recognised as an expense over their term.
OTHER LIABILITIES Other liabilities mainly include debtors with credit balances, accrued legal, audit and consulting fees, as well as other accruals.
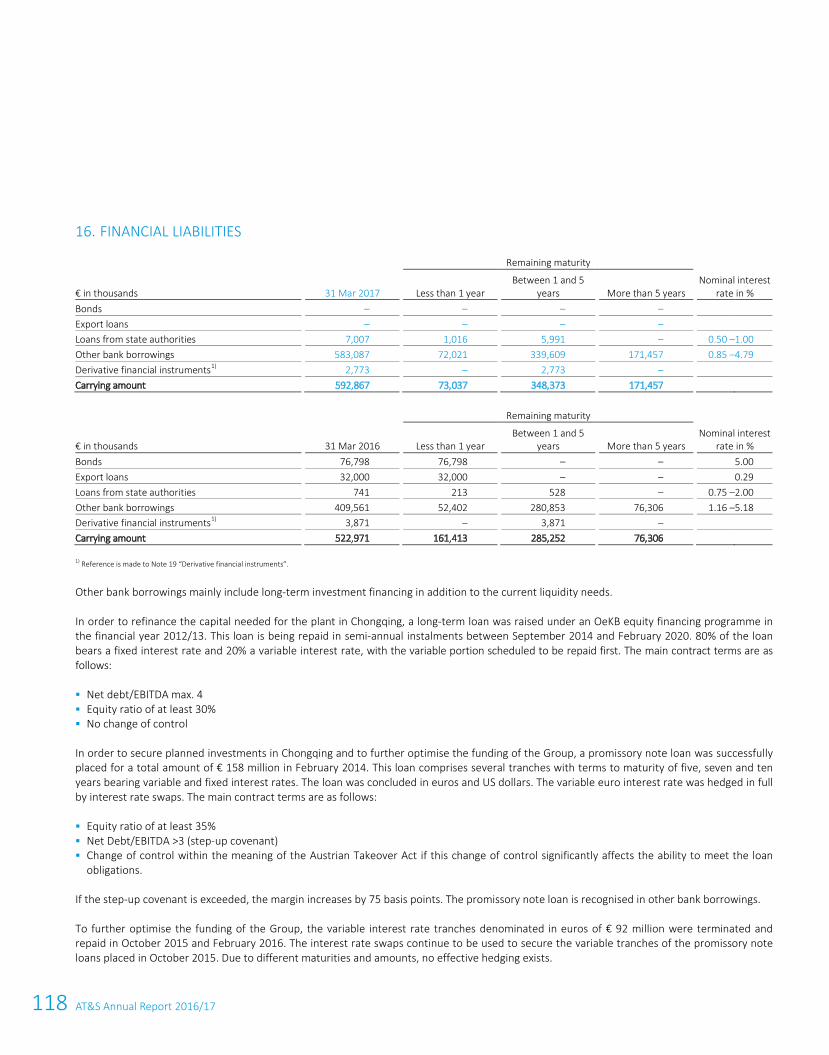
118 AT&S Annual Report 2016/17
100 AT&S Annual Report 2016/17
16. FINANCIAL LIABILITIES
Remaining maturity
€ in thousands
31 Mar 2017
Less than 1 year
Between 1 and 5 years
More than 5 years
Nominal interest rate in %
Bonds –
–
–
–
Export loans –
–
–
–
Loans from state authorities 7,007
1,016
5,991
–
0.50 – 1.00
Other bank borrowings 583,087
72,021
339,609
171,457
0.85 – 4.79
Derivative financial instruments
1) 2,773
–
2,773
–
Carrying amount 592,867
73,037
348,373
171,457
Remaining maturity
€ in thousands
31 Mar 2016
Less than 1 year
Between 1 and 5 years
More than 5 years
Nominal interest rate in %
Bonds 76,798
76,798
–
–
5.00
Export loans 32,000
32,000
–
–
0.29
Loans from state authorities 741
213
528
–
0.75 – 2.00
Other bank borrowings 409,561
52,402
280,853
76,306
1.16 – 5.18
Derivative financial instruments
1) 3,871
–
3,871
–
Carrying amount 522,971
161,413
285,252
76,306
1) Reference is made to Note 19 “Derivative financial instruments”.
Other bank borrowings mainly include long-term investment financing in addition to the current liquidity needs.
In order to refinance the capital needed for the plant in Chongqing, a long-term loan was raised under an OeKB equity financing programme in the financial year 2012/13. This loan is being repaid in semi-annual instalments between September 2014 and February 2020. 80% of the loan bears a fixed interest rate and 20% a variable interest rate, with the variable portion scheduled to be repaid first. The main contract terms are as follows:
Net debt/EBITDA max. 4 Equity ratio of at least 30% No change of control
In order to secure planned investments in Chongqing and to further optimise the funding of the Group, a promissory note loan was successfully placed for a total amount of € 158 million in February 2014. This loan comprises several tranches with terms to maturity of five, seven and ten years bearing variable and fixed interest rates. The loan was concluded in euros and US dollars. The variable euro interest rate was hedged in full by interest rate swaps. The main contract terms are as follows:
Equity ratio of at least 35% Net Debt/EBITDA >3 (step-up covenant) Change of control within the meaning of the Austrian Takeover Act if this change of control significantly affects the ability to meet the loan
obligations.
If the step-up covenant is exceeded, the margin increases by 75 basis points. The promissory note loan is recognised in other bank borrowings.
To further optimise the funding of the Group, the variable interest rate tranches denominated in euros of € 92 million were terminated and repaid in October 2015 and February 2016. The interest rate swaps continue to be used to secure the variable tranches of the promissory note loans placed in October 2015. Due to different maturities and amounts, no effective hedging exists.
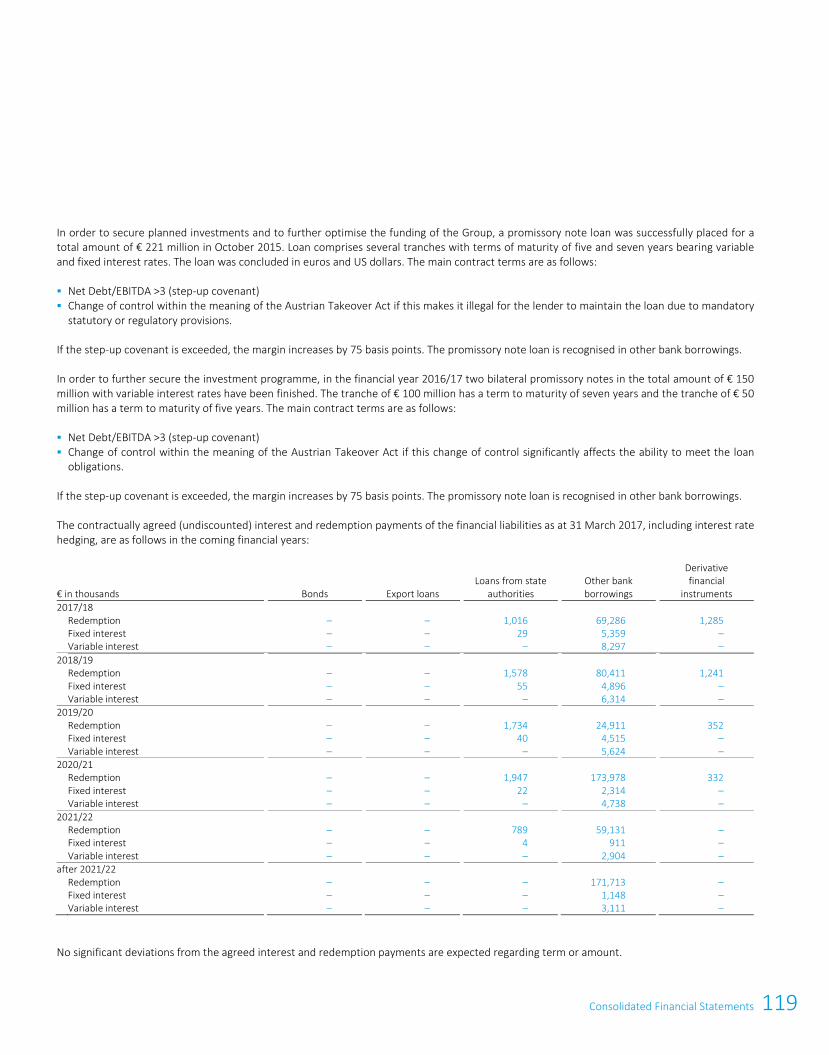
119Consolidated Financial Statements
100 AT&S Annual Report 2016/17
16. FINANCIAL LIABILITIES
Remaining maturity
€ in thousands
31 Mar 2017
Less than 1 year
Between 1 and 5 years
More than 5 years
Nominal interest rate in %
Bonds –
–
–
–
Export loans –
–
–
–
Loans from state authorities 7,007
1,016
5,991
–
0.50 – 1.00
Other bank borrowings 583,087
72,021
339,609
171,457
0.85 – 4.79
Derivative financial instruments
1) 2,773
–
2,773
–
Carrying amount 592,867
73,037
348,373
171,457
Remaining maturity
€ in thousands
31 Mar 2016
Less than 1 year
Between 1 and 5 years
More than 5 years
Nominal interest rate in %
Bonds 76,798
76,798
–
–
5.00
Export loans 32,000
32,000
–
–
0.29
Loans from state authorities 741
213
528
–
0.75 – 2.00
Other bank borrowings 409,561
52,402
280,853
76,306
1.16 – 5.18
Derivative financial instruments
1) 3,871
–
3,871
–
Carrying amount 522,971
161,413
285,252
76,306
1) Reference is made to Note 19 “Derivative financial instruments”.
Other bank borrowings mainly include long-term investment financing in addition to the current liquidity needs.
In order to refinance the capital needed for the plant in Chongqing, a long-term loan was raised under an OeKB equity financing programme in the financial year 2012/13. This loan is being repaid in semi-annual instalments between September 2014 and February 2020. 80% of the loan bears a fixed interest rate and 20% a variable interest rate, with the variable portion scheduled to be repaid first. The main contract terms are as follows:
Net debt/EBITDA max. 4 Equity ratio of at least 30% No change of control
In order to secure planned investments in Chongqing and to further optimise the funding of the Group, a promissory note loan was successfully placed for a total amount of € 158 million in February 2014. This loan comprises several tranches with terms to maturity of five, seven and ten years bearing variable and fixed interest rates. The loan was concluded in euros and US dollars. The variable euro interest rate was hedged in full by interest rate swaps. The main contract terms are as follows:
Equity ratio of at least 35% Net Debt/EBITDA >3 (step-up covenant) Change of control within the meaning of the Austrian Takeover Act if this change of control significantly affects the ability to meet the loan
obligations.
If the step-up covenant is exceeded, the margin increases by 75 basis points. The promissory note loan is recognised in other bank borrowings.
To further optimise the funding of the Group, the variable interest rate tranches denominated in euros of € 92 million were terminated and repaid in October 2015 and February 2016. The interest rate swaps continue to be used to secure the variable tranches of the promissory note loans placed in October 2015. Due to different maturities and amounts, no effective hedging exists.
Consolidated Financial Statements 101
In order to secure planned investments and to further optimise the funding of the Group, a promissory note loan was successfully placed for a total amount of € 221 million in October 2015. Loan comprises several tranches with terms of maturity of five and seven years bearing variable and fixed interest rates. The loan was concluded in euros and US dollars. The main contract terms are as follows:
Net Debt/EBITDA >3 (step-up covenant) Change of control within the meaning of the Austrian Takeover Act if this makes it illegal for the lender to maintain the loan due to mandatory
statutory or regulatory provisions.
If the step-up covenant is exceeded, the margin increases by 75 basis points. The promissory note loan is recognised in other bank borrowings.
In order to further secure the investment programme, in the financial year 2016/17 two bilateral promissory notes in the total amount of € 150 million with variable interest rates have been finished. The tranche of € 100 million has a term to maturity of seven years and the tranche of € 50 million has a term to maturity of five years. The main contract terms are as follows:
Net Debt/EBITDA >3 (step-up covenant) Change of control within the meaning of the Austrian Takeover Act if this change of control significantly affects the ability to meet the loan
obligations.
If the step-up covenant is exceeded, the margin increases by 75 basis points. The promissory note loan is recognised in other bank borrowings.
The contractually agreed (undiscounted) interest and redemption payments of the financial liabilities as at 31 March 2017, including interest rate hedging, are as follows in the coming financial years:
€ in thousands
Bonds
Export loans
Loans from state authorities
Other bank borrowings
Derivative financial
instruments 2017/18
Redemption –
–
1,016
69,286
1,285
Fixed interest
–
–
29
5,359
–
Variable interest –
–
–
8,297
–
2018/19
Redemption
–
–
1,578
80,411
1,241
Fixed interest
–
–
55
4,896
–
Variable interest
–
–
–
6,314
–
2019/20
Redemption
–
–
1,734
24,911
352
Fixed interest
–
–
40
4,515
–
Variable interest –
–
–
5,624
–
2020/21
Redemption
–
–
1,947
173,978
332
Fixed interest
–
–
22
2,314
–
Variable interest –
–
–
4,738
–
2021/22
Redemption
–
–
789
59,131
–
Fixed interest
–
–
4
911
–
Variable interest –
–
–
2,904
–
after 2021/22
Redemption
–
–
–
171,713
–
Fixed interest
–
–
–
1,148
–
Variable interest –
–
–
3,111
–
No significant deviations from the agreed interest and redemption payments are expected regarding term or amount.
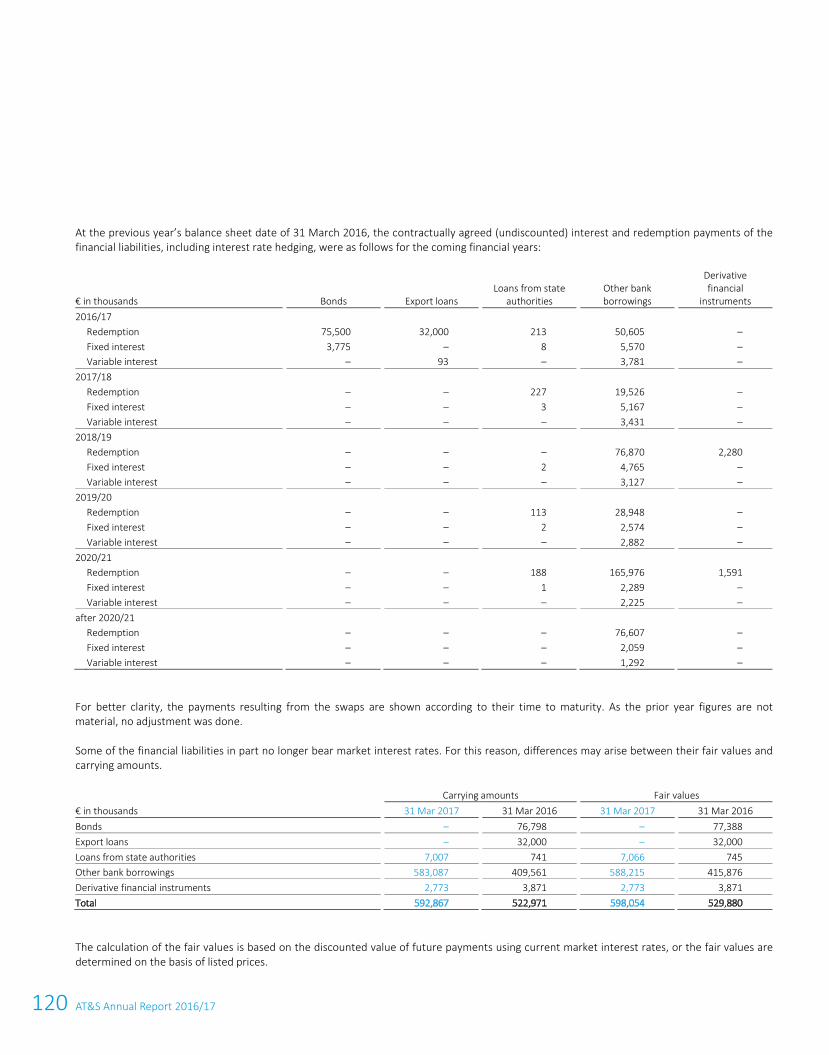
120 AT&S Annual Report 2016/17
102 AT&S Annual Report 2016/17
At the previous year’s balance sheet date of 31 March 2016, the contractually agreed (undiscounted) interest and redemption payments of the financial liabilities, including interest rate hedging, were as follows for the coming financial years:
€ in thousands
Bonds
Export loans
Loans from state authorities
Other bank borrowings
Derivative financial
instruments 2016/17
Redemption
75,500
32,000
213
50,605
–
Fixed interest
3,775
–
8
5,570
–
Variable interest –
93
–
3,781
–
2017/18
Redemption
–
–
227
19,526
–
Fixed interest
–
–
3
5,167
–
Variable interest –
–
–
3,431
–
2018/19
Redemption
–
–
–
76,870
2,280
Fixed interest
–
–
2
4,765
–
Variable interest
–
–
–
3,127
–
2019/20
Redemption
–
–
113
28,948
–
Fixed interest
–
–
2
2,574
–
Variable interest –
–
–
2,882
–
2020/21
Redemption
–
–
188
165,976
1,591
Fixed interest
–
–
1
2,289
–
Variable interest –
–
–
2,225
–
after 2020/21
Redemption
–
–
–
76,607
–
Fixed interest
–
–
–
2,059
–
Variable interest –
–
–
1,292
–
For better clarity, the payments resulting from the swaps are shown according to their time to maturity. As the prior year figures are not material, no adjustment was done.
Some of the financial liabilities in part no longer bear market interest rates. For this reason, differences may arise between their fair values and carrying amounts.
Carrying amounts Fair values € in thousands 31 Mar 2017 31 Mar 2016 31 Mar 2017 31 Mar 2016 Bonds – 76,798 – 77,388 Export loans – 32,000 – 32,000 Loans from state authorities 7,007 741 7,066 745 Other bank borrowings 583,087 409,561 588,215 415,876 Derivative financial instruments 2,773 3,871 2,773 3,871 Total 592,867 522,971 598,054 529,880
The calculation of the fair values is based on the discounted value of future payments using current market interest rates, or the fair values are determined on the basis of listed prices.
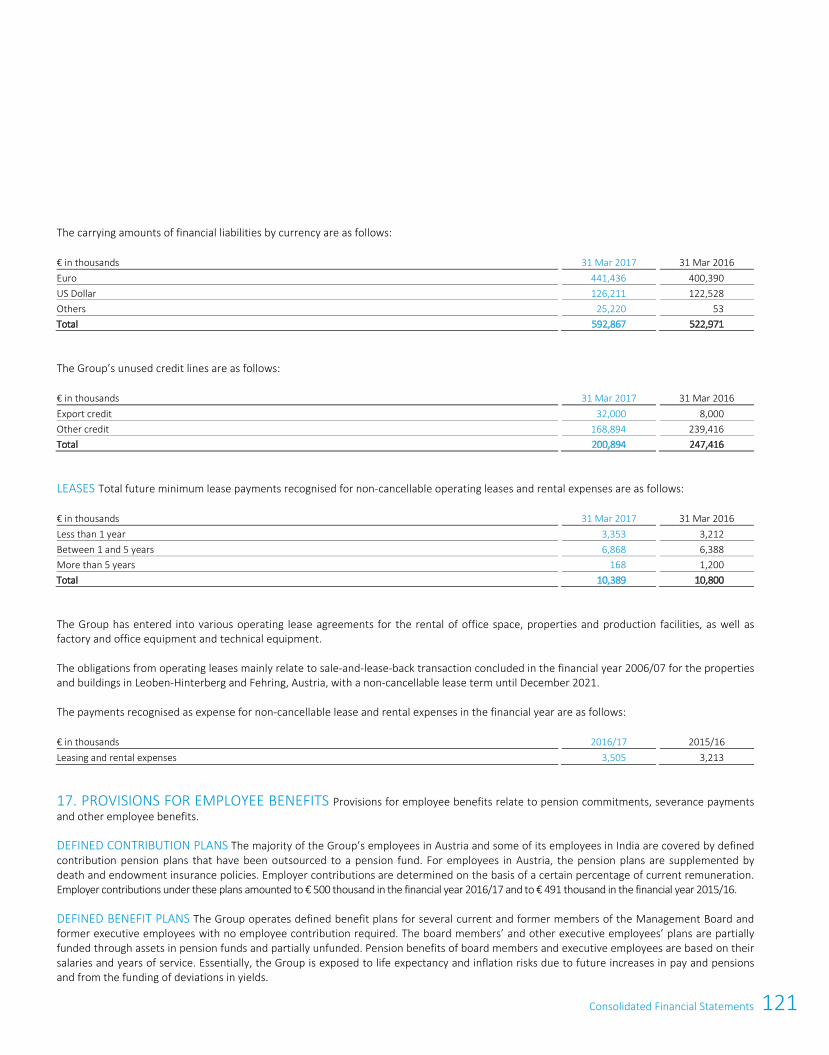
121Consolidated Financial Statements
102 AT&S Annual Report 2016/17
At the previous year’s balance sheet date of 31 March 2016, the contractually agreed (undiscounted) interest and redemption payments of the financial liabilities, including interest rate hedging, were as follows for the coming financial years:
€ in thousands
Bonds
Export loans
Loans from state authorities
Other bank borrowings
Derivative financial
instruments 2016/17
Redemption
75,500
32,000
213
50,605
–
Fixed interest
3,775
–
8
5,570
–
Variable interest –
93
–
3,781
–
2017/18
Redemption
–
–
227
19,526
–
Fixed interest
–
–
3
5,167
–
Variable interest –
–
–
3,431
–
2018/19
Redemption
–
–
–
76,870
2,280
Fixed interest
–
–
2
4,765
–
Variable interest
–
–
–
3,127
–
2019/20
Redemption
–
–
113
28,948
–
Fixed interest
–
–
2
2,574
–
Variable interest –
–
–
2,882
–
2020/21
Redemption
–
–
188
165,976
1,591
Fixed interest
–
–
1
2,289
–
Variable interest –
–
–
2,225
–
after 2020/21
Redemption
–
–
–
76,607
–
Fixed interest
–
–
–
2,059
–
Variable interest –
–
–
1,292
–
For better clarity, the payments resulting from the swaps are shown according to their time to maturity. As the prior year figures are not material, no adjustment was done.
Some of the financial liabilities in part no longer bear market interest rates. For this reason, differences may arise between their fair values and carrying amounts.
Carrying amounts Fair values € in thousands 31 Mar 2017 31 Mar 2016 31 Mar 2017 31 Mar 2016 Bonds – 76,798 – 77,388 Export loans – 32,000 – 32,000 Loans from state authorities 7,007 741 7,066 745 Other bank borrowings 583,087 409,561 588,215 415,876 Derivative financial instruments 2,773 3,871 2,773 3,871 Total 592,867 522,971 598,054 529,880
The calculation of the fair values is based on the discounted value of future payments using current market interest rates, or the fair values are determined on the basis of listed prices.
Consolidated Financial Statements 103
The carrying amounts of financial liabilities by currency are as follows:
€ in thousands
31 Mar 2017
31 Mar 2016 Euro
441,436
400,390
US Dollar 126,211
122,528
Others 25,220
53
Total 592,867
522,971
The Group’s unused credit lines are as follows:
€ in thousands
31 Mar 2017
31 Mar 2016 Export credit
32,000
8,000
Other credit 168,894
239,416
Total 200,894
247,416
LEASES Total future minimum lease payments recognised for non-cancellable operating leases and rental expenses are as follows:
€ in thousands
31 Mar 2017
31 Mar 2016 Less than 1 year
3,353
3,212
Between 1 and 5 years 6,868
6,388
More than 5 years 168
1,200
Total 10,389
10,800
The Group has entered into various operating lease agreements for the rental of office space, properties and production facilities, as well as factory and office equipment and technical equipment.
The obligations from operating leases mainly relate to sale-and-lease-back transaction concluded in the financial year 2006/07 for the properties and buildings in Leoben-Hinterberg and Fehring, Austria, with a non-cancellable lease term until December 2021.
The payments recognised as expense for non-cancellable lease and rental expenses in the financial year are as follows:
€ in thousands
2016/17
2015/16 Leasing and rental expenses
3,505
3,213
17. PROVISIONS FOR EMPLOYEE BENEFITS Provisions for employee benefits relate to pension commitments, severance payments and other employee benefits.
DEFINED CONTRIBUTION PLANS The majority of the Group’s employees in Austria and some of its employees in India are covered by defined contribution pension plans that have been outsourced to a pension fund. For employees in Austria, the pension plans are supplemented by death and endowment insurance policies. Employer contributions are determined on the basis of a certain percentage of current remuneration. Employer contributions under these plans amounted to € 500 thousand in the financial year 2016/17 and to € 491 thousand in the financial year 2015/16.
DEFINED BENEFIT PLANS The Group operates defined benefit plans for several current and former members of the Management Board and former executive employees with no employee contribution required. The board members’ and other executive employees’ plans are partially funded through assets in pension funds and partially unfunded. Pension benefits of board members and executive employees are based on their salaries and years of service. Essentially, the Group is exposed to life expectancy and inflation risks due to future increases in pay and pensions and from the funding of deviations in yields.
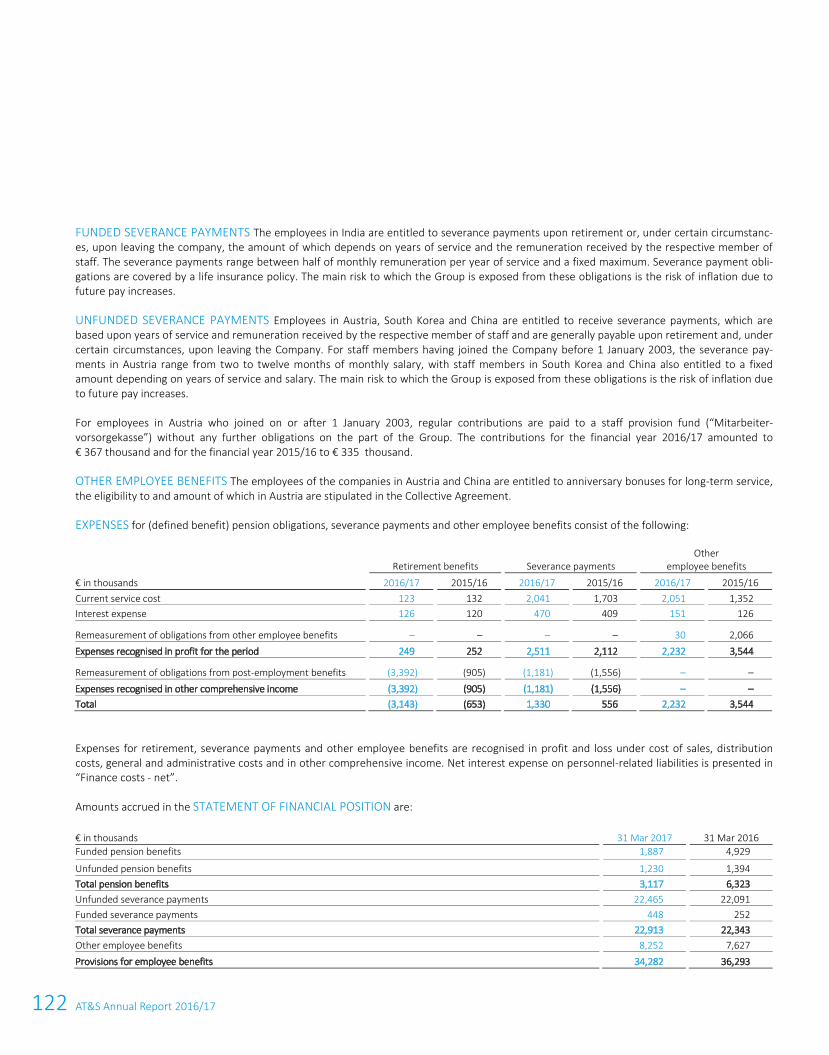
122 AT&S Annual Report 2016/17
104 AT&S Annual Report 2016/17
FUNDED SEVERANCE PAYMENTS The employees in India are entitled to severance payments upon retirement or, under certain circumstanc-es, upon leaving the company, the amount of which depends on years of service and the remuneration received by the respective member of staff. The severance payments range between half of monthly remuneration per year of service and a fixed maximum. Severance payment obli-gations are covered by a life insurance policy. The main risk to which the Group is exposed from these obligations is the risk of inflation due to future pay increases.
UNFUNDED SEVERANCE PAYMENTS Employees in Austria, South Korea and China are entitled to receive severance payments, which are based upon years of service and remuneration received by the respective member of staff and are generally payable upon retirement and, under certain circumstances, upon leaving the Company. For staff members having joined the Company before 1 January 2003, the severance pay-ments in Austria range from two to twelve months of monthly salary, with staff members in South Korea and China also entitled to a fixed amount depending on years of service and salary. The main risk to which the Group is exposed from these obligations is the risk of inflation due to future pay increases.
For employees in Austria who joined on or after 1 January 2003, regular contributions are paid to a staff provision fund (“Mitarbeiter-vorsorgekasse”) without any further obligations on the part of the Group. The contributions for the financial year 2016/17 amounted to € 367 thousand and for the financial year 2015/16 to € 335 thousand.
OTHER EMPLOYEE BENEFITS The employees of the companies in Austria and China are entitled to anniversary bonuses for long-term service, the eligibility to and amount of which in Austria are stipulated in the Collective Agreement.
EXPENSES for (defined benefit) pension obligations, severance payments and other employee benefits consist of the following:
Retirement benefits Severance payments
Other employee benefits
€ in thousands 2016/17 2015/16 2016/17 2015/16 2016/17 2015/16 Current service cost 123 132 2,041 1,703 2,051 1,352 Interest expense 126 120 470 409 151 126
Remeasurement of obligations from other employee benefits – – – – 30 2,066 Expenses recognised in profit for the period 249 252 2,511 2,112 2,232 3,544
Remeasurement of obligations from post-employment benefits (3,392) (905) (1,181) (1,556) – – Expenses recognised in other comprehensive income (3,392) (905) (1,181) (1,556) – – Total (3,143) (653) 1,330 556 2,232 3,544
Expenses for retirement, severance payments and other employee benefits are recognised in profit and loss under cost of sales, distribution costs, general and administrative costs and in other comprehensive income. Net interest expense on personnel-related liabilities is presented in “Finance costs - net”.
Amounts accrued in the STATEMENT OF FINANCIAL POSITION are:
€ in thousands 31 Mar 2017 31 Mar 2016 Funded pension benefits 1,887 4,929
Unfunded pension benefits 1,230 1,394 Total pension benefits 3,117 6,323 Unfunded severance payments 22,465 22,091 Funded severance payments 448 252 Total severance payments 22,913 22,343 Other employee benefits 8,252 7,627 Provisions for employee benefits 34,282 36,293
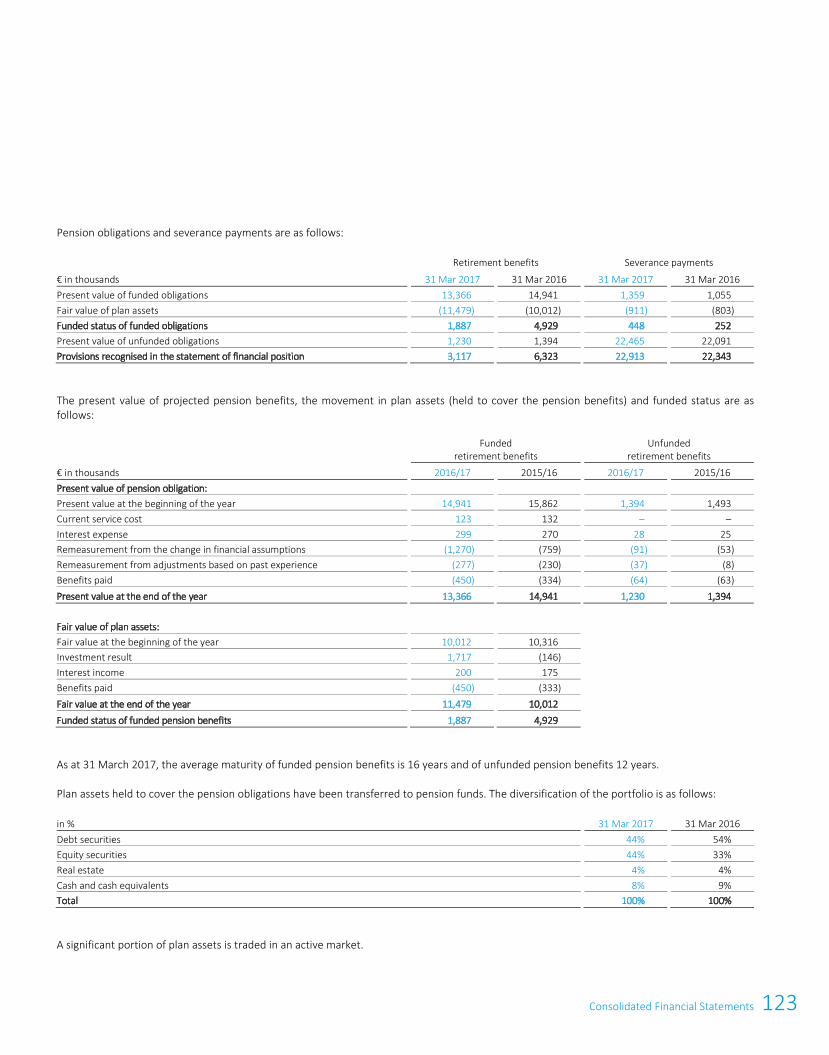
123Consolidated Financial Statements
104 AT&S Annual Report 2016/17
FUNDED SEVERANCE PAYMENTS The employees in India are entitled to severance payments upon retirement or, under certain circumstanc-es, upon leaving the company, the amount of which depends on years of service and the remuneration received by the respective member of staff. The severance payments range between half of monthly remuneration per year of service and a fixed maximum. Severance payment obli-gations are covered by a life insurance policy. The main risk to which the Group is exposed from these obligations is the risk of inflation due to future pay increases.
UNFUNDED SEVERANCE PAYMENTS Employees in Austria, South Korea and China are entitled to receive severance payments, which are based upon years of service and remuneration received by the respective member of staff and are generally payable upon retirement and, under certain circumstances, upon leaving the Company. For staff members having joined the Company before 1 January 2003, the severance pay-ments in Austria range from two to twelve months of monthly salary, with staff members in South Korea and China also entitled to a fixed amount depending on years of service and salary. The main risk to which the Group is exposed from these obligations is the risk of inflation due to future pay increases.
For employees in Austria who joined on or after 1 January 2003, regular contributions are paid to a staff provision fund (“Mitarbeiter-vorsorgekasse”) without any further obligations on the part of the Group. The contributions for the financial year 2016/17 amounted to € 367 thousand and for the financial year 2015/16 to € 335 thousand.
OTHER EMPLOYEE BENEFITS The employees of the companies in Austria and China are entitled to anniversary bonuses for long-term service, the eligibility to and amount of which in Austria are stipulated in the Collective Agreement.
EXPENSES for (defined benefit) pension obligations, severance payments and other employee benefits consist of the following:
Retirement benefits Severance payments
Other employee benefits
€ in thousands 2016/17 2015/16 2016/17 2015/16 2016/17 2015/16 Current service cost 123 132 2,041 1,703 2,051 1,352 Interest expense 126 120 470 409 151 126
Remeasurement of obligations from other employee benefits – – – – 30 2,066 Expenses recognised in profit for the period 249 252 2,511 2,112 2,232 3,544
Remeasurement of obligations from post-employment benefits (3,392) (905) (1,181) (1,556) – – Expenses recognised in other comprehensive income (3,392) (905) (1,181) (1,556) – – Total (3,143) (653) 1,330 556 2,232 3,544
Expenses for retirement, severance payments and other employee benefits are recognised in profit and loss under cost of sales, distribution costs, general and administrative costs and in other comprehensive income. Net interest expense on personnel-related liabilities is presented in “Finance costs - net”.
Amounts accrued in the STATEMENT OF FINANCIAL POSITION are:
€ in thousands 31 Mar 2017 31 Mar 2016 Funded pension benefits 1,887 4,929
Unfunded pension benefits 1,230 1,394 Total pension benefits 3,117 6,323 Unfunded severance payments 22,465 22,091 Funded severance payments 448 252 Total severance payments 22,913 22,343 Other employee benefits 8,252 7,627 Provisions for employee benefits 34,282 36,293
Consolidated Financial Statements 105
Pension obligations and severance payments are as follows:
Retirement benefits Severance payments
€ in thousands 31 Mar 2017 31 Mar 2016 31 Mar 2017 31 Mar 2016 Present value of funded obligations 13,366 14,941 1,359 1,055 Fair value of plan assets (11,479) (10,012) (911) (803) Funded status of funded obligations 1,887 4,929 448 252 Present value of unfunded obligations 1,230 1,394 22,465 22,091 Provisions recognised in the statement of financial position 3,117 6,323 22,913 22,343
The present value of projected pension benefits, the movement in plan assets (held to cover the pension benefits) and funded status are as follows:
Funded retirement benefits
Unfunded retirement benefits
€ in thousands 2016/17 2015/16 2016/17 2015/16 Present value of pension obligation: Present value at the beginning of the year 14,941 15,862 1,394 1,493 Current service cost 123 132 – – Interest expense 299 270 28 25 Remeasurement from the change in financial assumptions (1,270) (759) (91) (53) Remeasurement from adjustments based on past experience (277) (230) (37) (8) Benefits paid (450) (334) (64) (63) Present value at the end of the year 13,366 14,941 1,230 1,394 Fair value of plan assets: Fair value at the beginning of the year 10,012 10,316 Investment result 1,717 (146) Interest income 200 175 Benefits paid (450) (333) Fair value at the end of the year 11,479 10,012 Funded status of funded pension benefits 1,887 4,929
As at 31 March 2017, the average maturity of funded pension benefits is 16 years and of unfunded pension benefits 12 years.
Plan assets held to cover the pension obligations have been transferred to pension funds. The diversification of the portfolio is as follows:
in %
31 Mar 2017
31 Mar 2016 Debt securities
44%
54%
Equity securities 44%
33%
Real estate 4%
4%
Cash and cash equivalents 8%
9%
Total 100%
100%
A significant portion of plan assets is traded in an active market.
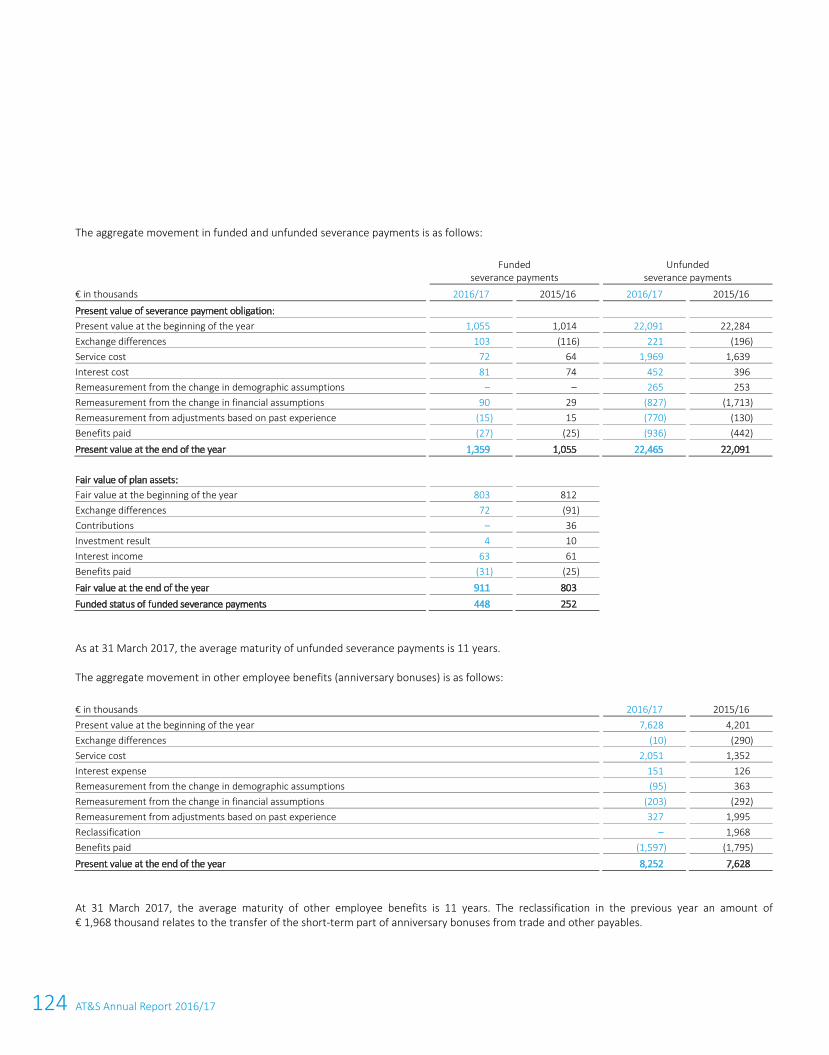
124 AT&S Annual Report 2016/17
106 AT&S Annual Report 2016/17
The aggregate movement in funded and unfunded severance payments is as follows:
Funded severance payments
Unfunded severance payments
€ in thousands 2016/17 2015/16 2016/17 2015/16
Present value of severance payment obligation: Present value at the beginning of the year 1,055 1,014 22,091 22,284 Exchange differences 103 (116) 221 (196) Service cost 72 64 1,969 1,639 Interest cost 81 74 452 396 Remeasurement from the change in demographic assumptions – – 265 253 Remeasurement from the change in financial assumptions 90 29 (827) (1,713) Remeasurement from adjustments based on past experience (15) 15 (770) (130) Benefits paid (27) (25) (936) (442) Present value at the end of the year 1,359 1,055 22,465 22,091 Fair value of plan assets: Fair value at the beginning of the year 803 812 Exchange differences 72 (91) Contributions – 36 Investment result 4 10 Interest income 63 61 Benefits paid (31) (25) Fair value at the end of the year 911 803 Funded status of funded severance payments 448 252
As at 31 March 2017, the average maturity of unfunded severance payments is 11 years.
The aggregate movement in other employee benefits (anniversary bonuses) is as follows:
€ in thousands
2016/17
2015/16 Present value at the beginning of the year
7,628
4,201
Exchange differences (10)
(290)
Service cost 2,051
1,352
Interest expense 151
126
Remeasurement from the change in demographic assumptions (95)
363
Remeasurement from the change in financial assumptions (203)
(292)
Remeasurement from adjustments based on past experience 327
1,995
Reclassification –
1,968
Benefits paid (1,597)
(1,795)
Present value at the end of the year 8,252
7,628
At 31 March 2017, the average maturity of other employee benefits is 11 years. The reclassification in the previous year an amount of € 1,968 thousand relates to the transfer of the short-term part of anniversary bonuses from trade and other payables.
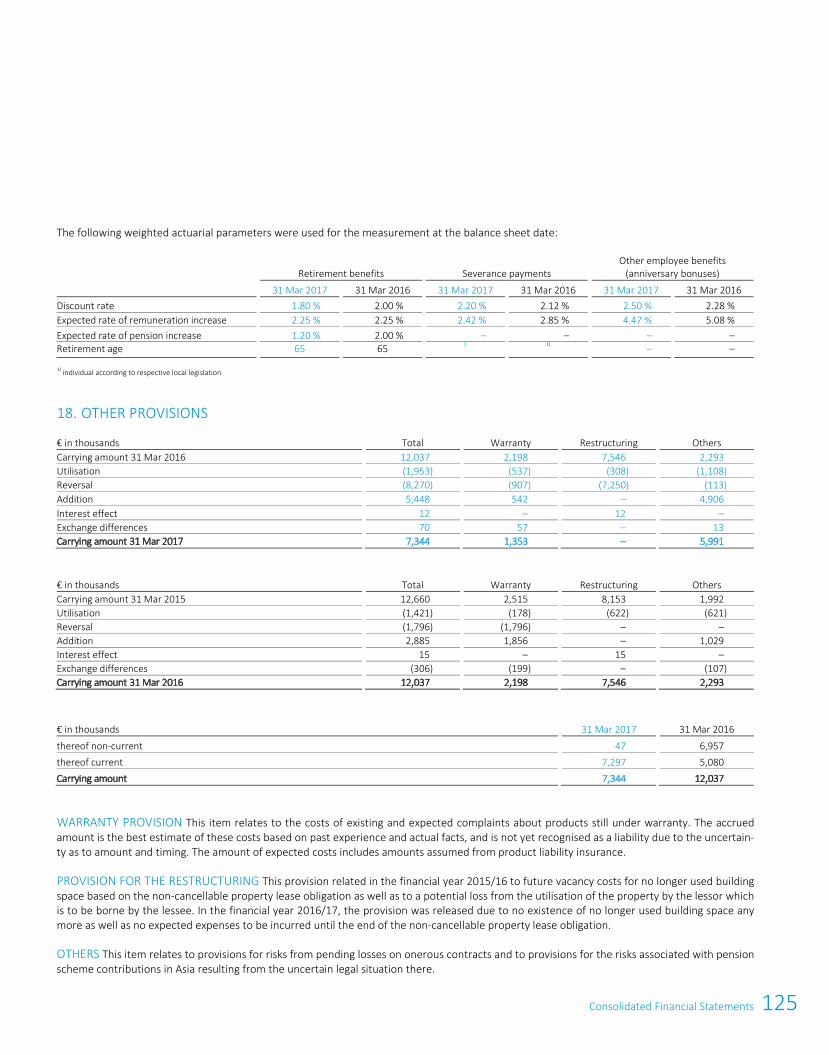
125Consolidated Financial Statements
106 AT&S Annual Report 2016/17
The aggregate movement in funded and unfunded severance payments is as follows:
Funded severance payments
Unfunded severance payments
€ in thousands 2016/17 2015/16 2016/17 2015/16
Present value of severance payment obligation: Present value at the beginning of the year 1,055 1,014 22,091 22,284 Exchange differences 103 (116) 221 (196) Service cost 72 64 1,969 1,639 Interest cost 81 74 452 396 Remeasurement from the change in demographic assumptions – – 265 253 Remeasurement from the change in financial assumptions 90 29 (827) (1,713) Remeasurement from adjustments based on past experience (15) 15 (770) (130) Benefits paid (27) (25) (936) (442) Present value at the end of the year 1,359 1,055 22,465 22,091 Fair value of plan assets: Fair value at the beginning of the year 803 812 Exchange differences 72 (91) Contributions – 36 Investment result 4 10 Interest income 63 61 Benefits paid (31) (25) Fair value at the end of the year 911 803 Funded status of funded severance payments 448 252
As at 31 March 2017, the average maturity of unfunded severance payments is 11 years.
The aggregate movement in other employee benefits (anniversary bonuses) is as follows:
€ in thousands
2016/17
2015/16 Present value at the beginning of the year
7,628
4,201
Exchange differences (10)
(290)
Service cost 2,051
1,352
Interest expense 151
126
Remeasurement from the change in demographic assumptions (95)
363
Remeasurement from the change in financial assumptions (203)
(292)
Remeasurement from adjustments based on past experience 327
1,995
Reclassification –
1,968
Benefits paid (1,597)
(1,795)
Present value at the end of the year 8,252
7,628
At 31 March 2017, the average maturity of other employee benefits is 11 years. The reclassification in the previous year an amount of € 1,968 thousand relates to the transfer of the short-term part of anniversary bonuses from trade and other payables.
Consolidated Financial Statements 107
The following weighted actuarial parameters were used for the measurement at the balance sheet date:
Retirement benefits
Severance payments
Other employee benefits (anniversary bonuses)
31 Mar 2017
31 Mar 2016
31 Mar 2017
31 Mar 2016
31 Mar 2017
31 Mar 2016
Discount rate
1.80 % 2.00 %
2.20 %
2.12 %
2.50 %
2.28 %
Expected rate of remuneration increase
2.25 % 2.25 %
2.42 %
2.85 %
4.47 %
5.08 %
Expected rate of pension increase
1.20 % 2.00 %
–
–
–
–
Retirement age 65 65 1) 1) – – 1) individual according to respective local legislation
18. OTHER PROVISIONS
€ in thousands Total Warranty Restructuring Others Carrying amount 31 Mar 2016 12,037 2,198 7,546 2,293 Utilisation (1,953) (537) (308) (1,108) Reversal (8,270) (907) (7,250) (113) Addition 5,448 542 – 4,906 Interest effect 12 – 12 – Exchange differences 70 57 – 13 Carrying amount 31 Mar 2017 7,344 1,353 – 5,991
€ in thousands Total Warranty Restructuring Others Carrying amount 31 Mar 2015 12,660 2,515 8,153 1,992 Utilisation (1,421) (178) (622) (621) Reversal (1,796) (1,796) – – Addition 2,885 1,856 – 1,029 Interest effect 15 – 15 – Exchange differences (306) (199) – (107) Carrying amount 31 Mar 2016 12,037 2,198 7,546 2,293
€ in thousands
31 Mar 2017
31 Mar 2016
thereof non-current 47
6,957
thereof current 7,297
5,080
Carrying amount 7,344
12,037
WARRANTY PROVISION This item relates to the costs of existing and expected complaints about products still under warranty. The accrued amount is the best estimate of these costs based on past experience and actual facts, and is not yet recognised as a liability due to the uncertain-ty as to amount and timing. The amount of expected costs includes amounts assumed from product liability insurance.
PROVISION FOR THE RESTRUCTURING This provision related in the financial year 2015/16 to future vacancy costs for no longer used building space based on the non-cancellable property lease obligation as well as to a potential loss from the utilisation of the property by the lessor which is to be borne by the lessee. In the financial year 2016/17, the provision was released due to no existence of no longer used building space any more as well as no expected expenses to be incurred until the end of the non-cancellable property lease obligation.
OTHERS This item relates to provisions for risks from pending losses on onerous contracts and to provisions for the risks associated with pension scheme contributions in Asia resulting from the uncertain legal situation there.
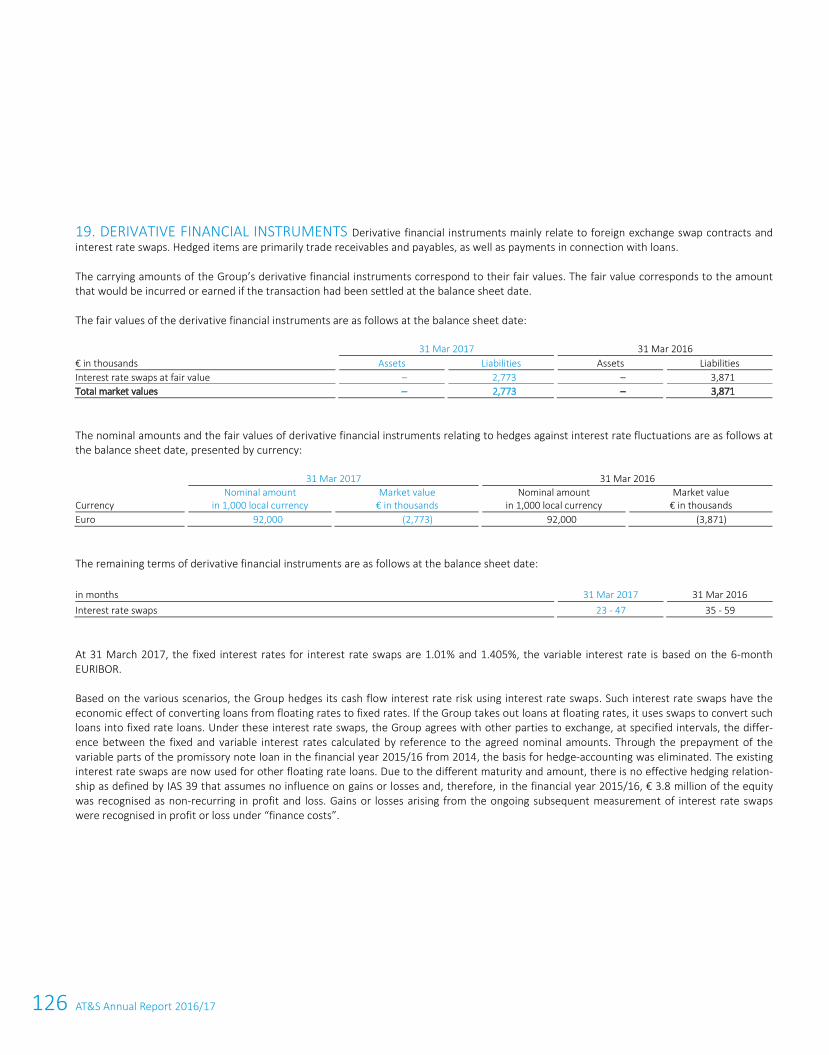
126 AT&S Annual Report 2016/17
108 AT&S Annual Report 2016/17
19. DERIVATIVE FINANCIAL INSTRUMENTS Derivative financial instruments mainly relate to foreign exchange swap contracts and interest rate swaps. Hedged items are primarily trade receivables and payables, as well as payments in connection with loans.
The carrying amounts of the Group’s derivative financial instruments correspond to their fair values. The fair value corresponds to the amount that would be incurred or earned if the transaction had been settled at the balance sheet date.
The fair values of the derivative financial instruments are as follows at the balance sheet date:
31 Mar 2017
31 Mar 2016
€ in thousands
Assets
Liabilities
Assets
Liabilities Interest rate swaps at fair value
–
2,773
–
3,871
Total market values
– 2,773
–
3,871
The nominal amounts and the fair values of derivative financial instruments relating to hedges against interest rate fluctuations are as follows at the balance sheet date, presented by currency:
31 Mar 2017 31 Mar 2016
Currency Nominal amount
in 1,000 local currency Market value
€ in thousands Nominal amount
in 1,000 local currency Market value
€ in thousands Euro 92,000 (2,773) 92,000 (3,871)
The remaining terms of derivative financial instruments are as follows at the balance sheet date:
in months
31 Mar 2017
31 Mar 2016 Interest rate swaps
23 - 47
35 - 59
At 31 March 2017, the fixed interest rates for interest rate swaps are 1.01% and 1.405%, the variable interest rate is based on the 6-month EURIBOR.
Based on the various scenarios, the Group hedges its cash flow interest rate risk using interest rate swaps. Such interest rate swaps have the economic effect of converting loans from floating rates to fixed rates. If the Group takes out loans at floating rates, it uses swaps to convert such loans into fixed rate loans. Under these interest rate swaps, the Group agrees with other parties to exchange, at specified intervals, the differ-ence between the fixed and variable interest rates calculated by reference to the agreed nominal amounts. Through the prepayment of the variable parts of the promissory note loan in the financial year 2015/16 from 2014, the basis for hedge-accounting was eliminated. The existing interest rate swaps are now used for other floating rate loans. Due to the different maturity and amount, there is no effective hedging relation-ship as defined by IAS 39 that assumes no influence on gains or losses and, therefore, in the financial year 2015/16, € 3.8 million of the equity was recognised as non-recurring in profit and loss. Gains or losses arising from the ongoing subsequent measurement of interest rate swaps were recognised in profit or loss under “finance costs”.
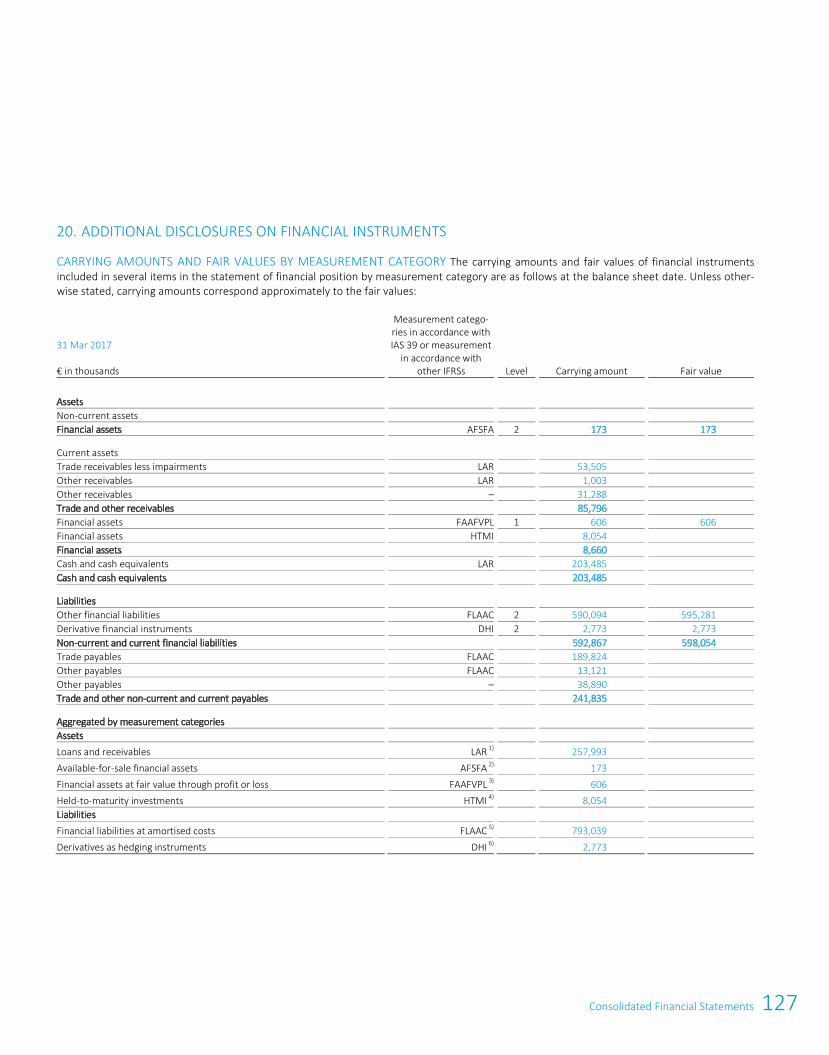
127Consolidated Financial Statements
108 AT&S Annual Report 2016/17
19. DERIVATIVE FINANCIAL INSTRUMENTS Derivative financial instruments mainly relate to foreign exchange swap contracts and interest rate swaps. Hedged items are primarily trade receivables and payables, as well as payments in connection with loans.
The carrying amounts of the Group’s derivative financial instruments correspond to their fair values. The fair value corresponds to the amount that would be incurred or earned if the transaction had been settled at the balance sheet date.
The fair values of the derivative financial instruments are as follows at the balance sheet date:
31 Mar 2017
31 Mar 2016
€ in thousands
Assets
Liabilities
Assets
Liabilities Interest rate swaps at fair value
–
2,773
–
3,871
Total market values
– 2,773
–
3,871
The nominal amounts and the fair values of derivative financial instruments relating to hedges against interest rate fluctuations are as follows at the balance sheet date, presented by currency:
31 Mar 2017 31 Mar 2016
Currency Nominal amount
in 1,000 local currency Market value
€ in thousands Nominal amount
in 1,000 local currency Market value
€ in thousands Euro 92,000 (2,773) 92,000 (3,871)
The remaining terms of derivative financial instruments are as follows at the balance sheet date:
in months
31 Mar 2017
31 Mar 2016 Interest rate swaps
23 - 47
35 - 59
At 31 March 2017, the fixed interest rates for interest rate swaps are 1.01% and 1.405%, the variable interest rate is based on the 6-month EURIBOR.
Based on the various scenarios, the Group hedges its cash flow interest rate risk using interest rate swaps. Such interest rate swaps have the economic effect of converting loans from floating rates to fixed rates. If the Group takes out loans at floating rates, it uses swaps to convert such loans into fixed rate loans. Under these interest rate swaps, the Group agrees with other parties to exchange, at specified intervals, the differ-ence between the fixed and variable interest rates calculated by reference to the agreed nominal amounts. Through the prepayment of the variable parts of the promissory note loan in the financial year 2015/16 from 2014, the basis for hedge-accounting was eliminated. The existing interest rate swaps are now used for other floating rate loans. Due to the different maturity and amount, there is no effective hedging relation-ship as defined by IAS 39 that assumes no influence on gains or losses and, therefore, in the financial year 2015/16, € 3.8 million of the equity was recognised as non-recurring in profit and loss. Gains or losses arising from the ongoing subsequent measurement of interest rate swaps were recognised in profit or loss under “finance costs”.
Consolidated Financial Statements 109
20. ADDITIONAL DISCLOSURES ON FINANCIAL INSTRUMENTS
CARRYING AMOUNTS AND FAIR VALUES BY MEASUREMENT CATEGORY The carrying amounts and fair values of financial instruments included in several items in the statement of financial position by measurement category are as follows at the balance sheet date. Unless other-wise stated, carrying amounts correspond approximately to the fair values:
31 Mar 2017 € in thousands
Measurement catego-ries in accordance with IAS 39 or measurement
in accordance with other IFRSs
Level
Carrying amount
Fair value
Assets Non-current assets
Financial assets
AFSFA
2 173
173
Current assets
Trade receivables less impairments
LAR
53,505 53,506
Other receivables
LAR
1,003 1,003
Other receivables
–
31,288
31,287
Trade and other receivables
85,796 85,796
Financial assets
FAAFVPL
1 606
606
Financial assets
HTMI
8,054
8,054
Financial assets
8,660 8,660
Cash and cash equivalents
LAR
203,485
203,485
Cash and cash equivalents
203,485 203,485
Liabilities
Other financial liabilities
FLAAC
2 590,094
595,281
Derivative financial instruments
DHI
2 2,773
2,773
Non-current and current financial liabilities
592,867 598,054
Trade payables
FLAAC
189,824 189,824
Other payables
FLAAC
13,121 13,121
Other payables
–
38,890
38,890
Trade and other non-current and current payables
241,835
241,835
Aggregated by measurement categories
Assets
Loans and receivables
LAR 1)
257,993
Available-for-sale financial assets
AFSFA 2)
173
Financial assets at fair value through profit or loss
FAAFVPL 3)
606
Held-to-maturity investments
HTMI 4)
8,054
Liabilities
Financial liabilities at amortised costs
FLAAC 5)
793,039
Derivatives as hedging instruments
DHI 6)
2,773
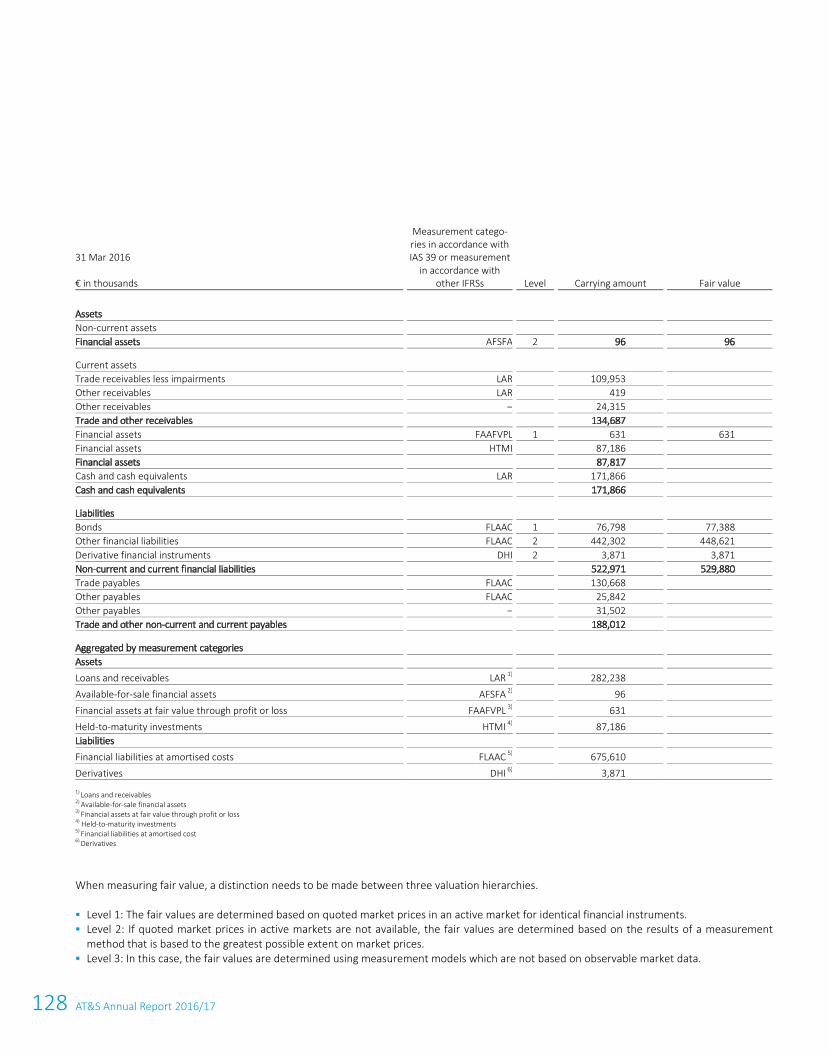
128 AT&S Annual Report 2016/17
110 AT&S Annual Report 2016/17
31 Mar 2016 € in thousands
Measurement catego-ries in accordance with IAS 39 or measurement
in accordance with other IFRSs
Level
Carrying amount
Fair value
Assets Non-current assets
Financial assets
AFSFA
2 96
96
Current assets
Trade receivables less impairments
LAR
109,953 109,953
Other receivables
LAR
419 419
Other receivables
–
24,315
24,315
Trade and other receivables
134,687 134,687
Financial assets
FAAFVPL
1 631
631
Financial assets
HTMI
87,186
87,186
Financial assets
87,817 87,817
Cash and cash equivalents
LAR
171,866
171,866
Cash and cash equivalents
171,866 171,866
Liabilities
Bonds
FLAAC
1 76,798
77,388
Other financial liabilities
FLAAC
2 442,302
448,621
Derivative financial instruments
DHI
2 3,871
3,871
Non-current and current financial liabilities
522,971 529,880
Trade payables
FLAAC
130,668 130,668
Other payables
FLAAC
25,842 25,842
Other payables
–
31,502
Trade and other non-current and current payables
188,012
188,012
Aggregated by measurement categories
Assets
Loans and receivables
LAR 1)
282,238
Available-for-sale financial assets
AFSFA 2)
96
Financial assets at fair value through profit or loss
FAAFVPL 3)
631
Held-to-maturity investments
HTMI 4)
87,186
Liabilities
Financial liabilities at amortised costs
FLAAC 5)
675,610
Derivatives
DHI 6)
3,871
1) Loans and receivables 2) Available-for-sale financial assets 3) Financial assets at fair value through profit or loss 4) Held-to-maturity investments 5) Financial liabilities at amortised cost 6) Derivatives
When measuring fair value, a distinction needs to be made between three valuation hierarchies.
Level 1: The fair values are determined based on quoted market prices in an active market for identical financial instruments. Level 2: If quoted market prices in active markets are not available, the fair values are determined based on the results of a measurement
method that is based to the greatest possible extent on market prices. Level 3: In this case, the fair values are determined using measurement models which are not based on observable market data.
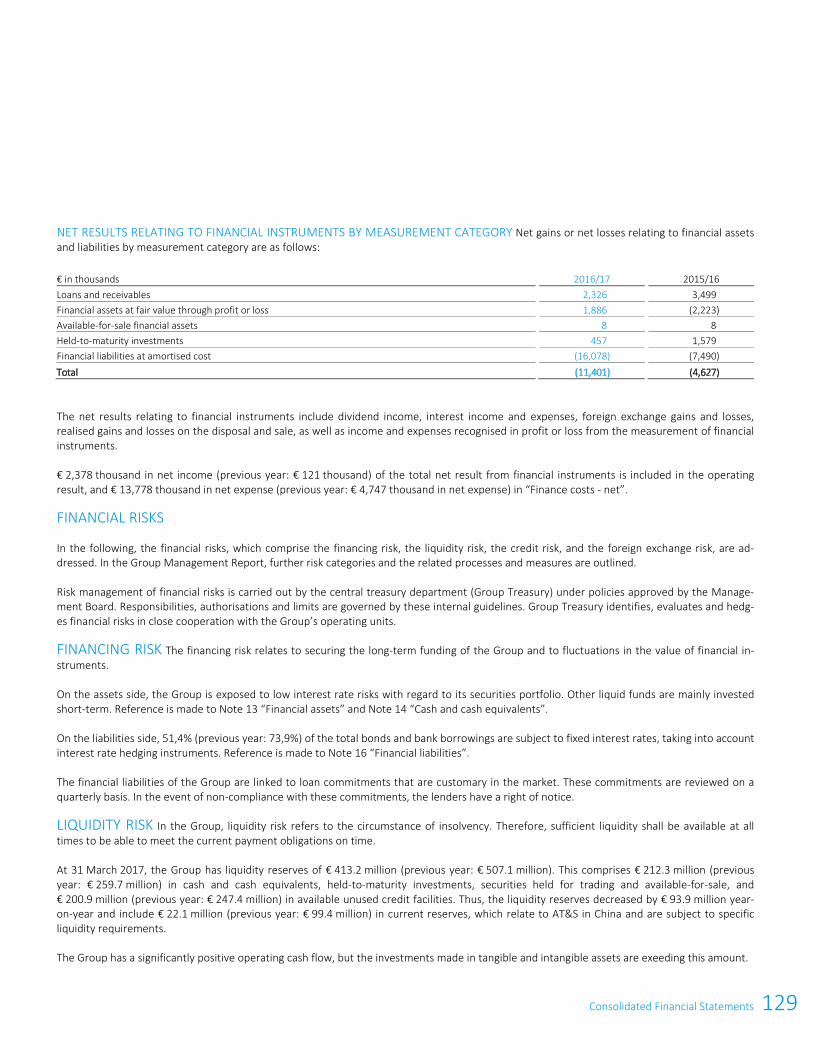
129Consolidated Financial Statements
110 AT&S Annual Report 2016/17
31 Mar 2016 € in thousands
Measurement catego-ries in accordance with IAS 39 or measurement
in accordance with other IFRSs
Level
Carrying amount
Fair value
Assets Non-current assets
Financial assets
AFSFA
2 96
96
Current assets
Trade receivables less impairments
LAR
109,953 109,953
Other receivables
LAR
419 419
Other receivables
–
24,315
24,315
Trade and other receivables
134,687 134,687
Financial assets
FAAFVPL
1 631
631
Financial assets
HTMI
87,186
87,186
Financial assets
87,817 87,817
Cash and cash equivalents
LAR
171,866
171,866
Cash and cash equivalents
171,866 171,866
Liabilities
Bonds
FLAAC
1 76,798
77,388
Other financial liabilities
FLAAC
2 442,302
448,621
Derivative financial instruments
DHI
2 3,871
3,871
Non-current and current financial liabilities
522,971 529,880
Trade payables
FLAAC
130,668 130,668
Other payables
FLAAC
25,842 25,842
Other payables
–
31,502
Trade and other non-current and current payables
188,012
188,012
Aggregated by measurement categories
Assets
Loans and receivables
LAR 1)
282,238
Available-for-sale financial assets
AFSFA 2)
96
Financial assets at fair value through profit or loss
FAAFVPL 3)
631
Held-to-maturity investments
HTMI 4)
87,186
Liabilities
Financial liabilities at amortised costs
FLAAC 5)
675,610
Derivatives
DHI 6)
3,871
1) Loans and receivables 2) Available-for-sale financial assets 3) Financial assets at fair value through profit or loss 4) Held-to-maturity investments 5) Financial liabilities at amortised cost 6) Derivatives
When measuring fair value, a distinction needs to be made between three valuation hierarchies.
Level 1: The fair values are determined based on quoted market prices in an active market for identical financial instruments. Level 2: If quoted market prices in active markets are not available, the fair values are determined based on the results of a measurement
method that is based to the greatest possible extent on market prices. Level 3: In this case, the fair values are determined using measurement models which are not based on observable market data.
Consolidated Financial Statements 111
NET RESULTS RELATING TO FINANCIAL INSTRUMENTS BY MEASUREMENT CATEGORY Net gains or net losses relating to financial assets and liabilities by measurement category are as follows:
€ in thousands
2016/17
2015/16 Loans and receivables
2,326
3,499
Financial assets at fair value through profit or loss 1,886
(2,223)
Available-for-sale financial assets 8
8
Held-to-maturity investments 457
1,579
Financial liabilities at amortised cost (16,078)
(7,490)
Total (11,401)
(4,627)
The net results relating to financial instruments include dividend income, interest income and expenses, foreign exchange gains and losses, realised gains and losses on the disposal and sale, as well as income and expenses recognised in profit or loss from the measurement of financial instruments.
€ 2,378 thousand in net income (previous year: € 121 thousand) of the total net result from financial instruments is included in the operating result, and € 13,778 thousand in net expense (previous year: € 4,747 thousand in net expense) in “Finance costs - net”.
FINANCIAL RISKS
In the following, the financial risks, which comprise the financing risk, the liquidity risk, the credit risk, and the foreign exchange risk, are ad-dressed. In the Group Management Report, further risk categories and the related processes and measures are outlined.
Risk management of financial risks is carried out by the central treasury department (Group Treasury) under policies approved by the Manage-ment Board. Responsibilities, authorisations and limits are governed by these internal guidelines. Group Treasury identifies, evaluates and hedg-es financial risks in close cooperation with the Group’s operating units.
FINANCING RISK The financing risk relates to securing the long-term funding of the Group and to fluctuations in the value of financial in-struments.
On the assets side, the Group is exposed to low interest rate risks with regard to its securities portfolio. Other liquid funds are mainly invested short-term. Reference is made to Note 13 “Financial assets” and Note 14 “Cash and cash equivalents”.
On the liabilities side, 51,4% (previous year: 73,9%) of the total bonds and bank borrowings are subject to fixed interest rates, taking into account interest rate hedging instruments. Reference is made to Note 16 “Financial liabilities”.
The financial liabilities of the Group are linked to loan commitments that are customary in the market. These commitments are reviewed on a quarterly basis. In the event of non-compliance with these commitments, the lenders have a right of notice.
LIQUIDITY RISK In the Group, liquidity risk refers to the circumstance of insolvency. Therefore, sufficient liquidity shall be available at all times to be able to meet the current payment obligations on time.
At 31 March 2017, the Group has liquidity reserves of € 413.2 million (previous year: € 507.1 million). This comprises € 212.3 million (previous year: € 259.7 million) in cash and cash equivalents, held-to-maturity investments, securities held for trading and available-for-sale, and € 200.9 million (previous year: € 247.4 million) in available unused credit facilities. Thus, the liquidity reserves decreased by € 93.9 million year-on-year and include € 22.1 million (previous year: € 99.4 million) in current reserves, which relate to AT&S in China and are subject to specific liquidity requirements.
The Group has a significantly positive operating cash flow, but the investments made in tangible and intangible assets are exeeding this amount.
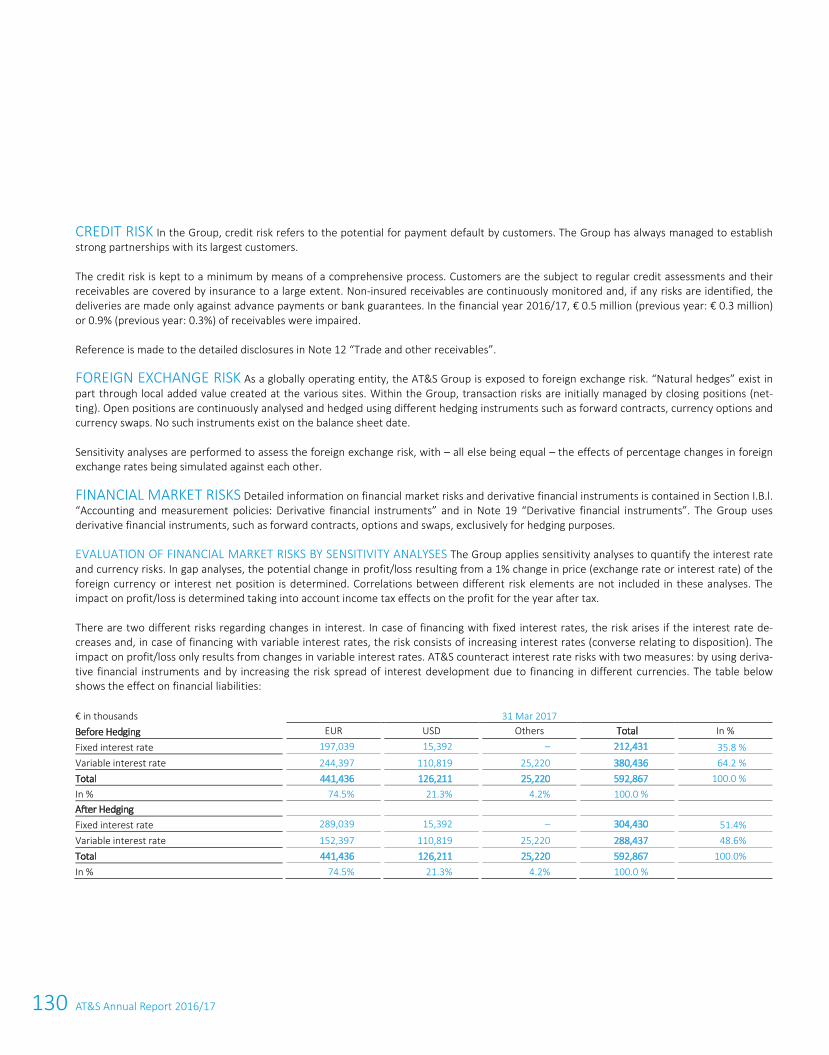
130 AT&S Annual Report 2016/17
112 AT&S Annual Report 2016/17
CREDIT RISK In the Group, credit risk refers to the potential for payment default by customers. The Group has always managed to establish strong partnerships with its largest customers.
The credit risk is kept to a minimum by means of a comprehensive process. Customers are the subject to regular credit assessments and their receivables are covered by insurance to a large extent. Non-insured receivables are continuously monitored and, if any risks are identified, the deliveries are made only against advance payments or bank guarantees. In the financial year 2016/17, € 0.5 million (previous year: € 0.3 million) or 0.9% (previous year: 0.3%) of receivables were impaired.
Reference is made to the detailed disclosures in Note 12 “Trade and other receivables”.
FOREIGN EXCHANGE RISK As a globally operating entity, the AT&S Group is exposed to foreign exchange risk. “Natural hedges” exist in part through local added value created at the various sites. Within the Group, transaction risks are initially managed by closing positions (net-ting). Open positions are continuously analysed and hedged using different hedging instruments such as forward contracts, currency options and currency swaps. No such instruments exist on the balance sheet date.
Sensitivity analyses are performed to assess the foreign exchange risk, with – all else being equal – the effects of percentage changes in foreign exchange rates being simulated against each other.
FINANCIAL MARKET RISKS Detailed information on financial market risks and derivative financial instruments is contained in Section I.B.l. “Accounting and measurement policies: Derivative financial instruments” and in Note 19 “Derivative financial instruments”. The Group uses derivative financial instruments, such as forward contracts, options and swaps, exclusively for hedging purposes.
EVALUATION OF FINANCIAL MARKET RISKS BY SENSITIVITY ANALYSES The Group applies sensitivity analyses to quantify the interest rate and currency risks. In gap analyses, the potential change in profit/loss resulting from a 1% change in price (exchange rate or interest rate) of the foreign currency or interest net position is determined. Correlations between different risk elements are not included in these analyses. The impact on profit/loss is determined taking into account income tax effects on the profit for the year after tax.
There are two different risks regarding changes in interest. In case of financing with fixed interest rates, the risk arises if the interest rate de-creases and, in case of financing with variable interest rates, the risk consists of increasing interest rates (converse relating to disposition). The impact on profit/loss only results from changes in variable interest rates. AT&S counteract interest rate risks with two measures: by using deriva-tive financial instruments and by increasing the risk spread of interest development due to financing in different currencies. The table below shows the effect on financial liabilities:
€ in thousands 31 Mar 2017
Before Hedging EUR USD Others Total In %
Fixed interest rate 197,039 15,392 – 212,431 35.8 % Variable interest rate
244,397
110,819
25,220
380,436
64.2 %
Total 441,436
126,211
25,220
592,867
100.0 %
In % 74.5%
21.3%
4.2%
100.0 %
After Hedging Fixed interest rate
289,039 15,392
–
304,430
51.4% Variable interest rate
152,397
110,819
25,220
288,437
48.6%
Total 441,436
126,211
25,220
592,867
100.0%
In % 74.5%
21.3%
4.2%
100.0 %
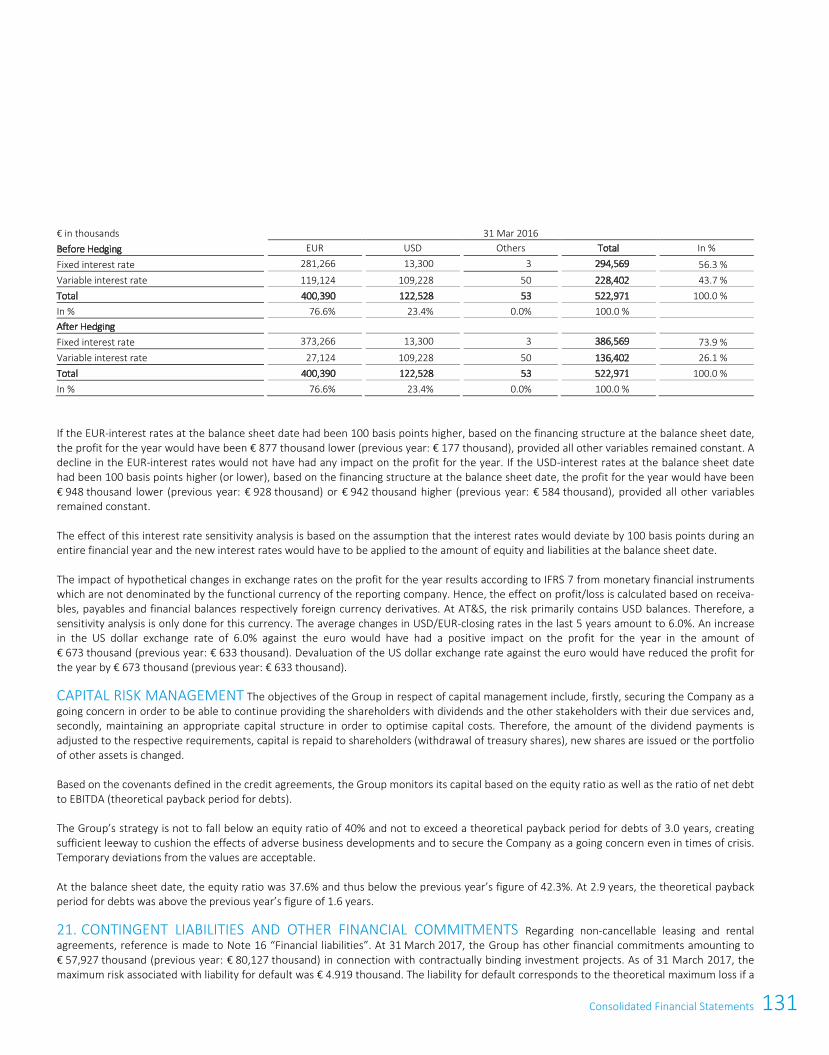
131Consolidated Financial Statements
112 AT&S Annual Report 2016/17
CREDIT RISK In the Group, credit risk refers to the potential for payment default by customers. The Group has always managed to establish strong partnerships with its largest customers.
The credit risk is kept to a minimum by means of a comprehensive process. Customers are the subject to regular credit assessments and their receivables are covered by insurance to a large extent. Non-insured receivables are continuously monitored and, if any risks are identified, the deliveries are made only against advance payments or bank guarantees. In the financial year 2016/17, € 0.5 million (previous year: € 0.3 million) or 0.9% (previous year: 0.3%) of receivables were impaired.
Reference is made to the detailed disclosures in Note 12 “Trade and other receivables”.
FOREIGN EXCHANGE RISK As a globally operating entity, the AT&S Group is exposed to foreign exchange risk. “Natural hedges” exist in part through local added value created at the various sites. Within the Group, transaction risks are initially managed by closing positions (net-ting). Open positions are continuously analysed and hedged using different hedging instruments such as forward contracts, currency options and currency swaps. No such instruments exist on the balance sheet date.
Sensitivity analyses are performed to assess the foreign exchange risk, with – all else being equal – the effects of percentage changes in foreign exchange rates being simulated against each other.
FINANCIAL MARKET RISKS Detailed information on financial market risks and derivative financial instruments is contained in Section I.B.l. “Accounting and measurement policies: Derivative financial instruments” and in Note 19 “Derivative financial instruments”. The Group uses derivative financial instruments, such as forward contracts, options and swaps, exclusively for hedging purposes.
EVALUATION OF FINANCIAL MARKET RISKS BY SENSITIVITY ANALYSES The Group applies sensitivity analyses to quantify the interest rate and currency risks. In gap analyses, the potential change in profit/loss resulting from a 1% change in price (exchange rate or interest rate) of the foreign currency or interest net position is determined. Correlations between different risk elements are not included in these analyses. The impact on profit/loss is determined taking into account income tax effects on the profit for the year after tax.
There are two different risks regarding changes in interest. In case of financing with fixed interest rates, the risk arises if the interest rate de-creases and, in case of financing with variable interest rates, the risk consists of increasing interest rates (converse relating to disposition). The impact on profit/loss only results from changes in variable interest rates. AT&S counteract interest rate risks with two measures: by using deriva-tive financial instruments and by increasing the risk spread of interest development due to financing in different currencies. The table below shows the effect on financial liabilities:
€ in thousands 31 Mar 2017
Before Hedging EUR USD Others Total In %
Fixed interest rate 197,039 15,392 – 212,431 35.8 % Variable interest rate
244,397
110,819
25,220
380,436
64.2 %
Total 441,436
126,211
25,220
592,867
100.0 %
In % 74.5%
21.3%
4.2%
100.0 %
After Hedging Fixed interest rate
289,039 15,392
–
304,430
51.4% Variable interest rate
152,397
110,819
25,220
288,437
48.6%
Total 441,436
126,211
25,220
592,867
100.0%
In % 74.5%
21.3%
4.2%
100.0 %
Consolidated Financial Statements 113
€ in thousands 31 Mar 2016
Before Hedging
EUR USD Others Total In %
Fixed interest rate 281,266 13,300 3
294,569 56.3 %
Variable interest rate 119,124
109,228
50
228,402
43.7 %
Total 400,390
122,528
53
522,971
100.0 %
In % 76.6%
23.4%
0.0%
100.0 %
After Hedging
Fixed interest rate 373,266
13,300
3
386,569
73.9 % Variable interest rate
27,124
109,228
50
136,402
26.1 %
Total 400,390
122,528
53
522,971
100.0 %
In % 76.6%
23.4%
0.0%
100.0 %
If the EUR-interest rates at the balance sheet date had been 100 basis points higher, based on the financing structure at the balance sheet date, the profit for the year would have been € 877 thousand lower (previous year: € 177 thousand), provided all other variables remained constant. A decline in the EUR-interest rates would not have had any impact on the profit for the year. If the USD-interest rates at the balance sheet date had been 100 basis points higher (or lower), based on the financing structure at the balance sheet date, the profit for the year would have been € 948 thousand lower (previous year: € 928 thousand) or € 942 thousand higher (previous year: € 584 thousand), provided all other variables remained constant.
The effect of this interest rate sensitivity analysis is based on the assumption that the interest rates would deviate by 100 basis points during an entire financial year and the new interest rates would have to be applied to the amount of equity and liabilities at the balance sheet date.
The impact of hypothetical changes in exchange rates on the profit for the year results according to IFRS 7 from monetary financial instruments which are not denominated by the functional currency of the reporting company. Hence, the effect on profit/loss is calculated based on receiva-bles, payables and financial balances respectively foreign currency derivatives. At AT&S, the risk primarily contains USD balances. Therefore, a sensitivity analysis is only done for this currency. The average changes in USD/EUR-closing rates in the last 5 years amount to 6.0%. An increase in the US dollar exchange rate of 6.0% against the euro would have had a positive impact on the profit for the year in the amount of € 673 thousand (previous year: € 633 thousand). Devaluation of the US dollar exchange rate against the euro would have reduced the profit for the year by € 673 thousand (previous year: € 633 thousand).
CAPITAL RISK MANAGEMENT The objectives of the Group in respect of capital management include, firstly, securing the Company as a going concern in order to be able to continue providing the shareholders with dividends and the other stakeholders with their due services and, secondly, maintaining an appropriate capital structure in order to optimise capital costs. Therefore, the amount of the dividend payments is adjusted to the respective requirements, capital is repaid to shareholders (withdrawal of treasury shares), new shares are issued or the portfolio of other assets is changed.
Based on the covenants defined in the credit agreements, the Group monitors its capital based on the equity ratio as well as the ratio of net debt to EBITDA (theoretical payback period for debts).
The Group’s strategy is not to fall below an equity ratio of 40% and not to exceed a theoretical payback period for debts of 3.0 years, creating sufficient leeway to cushion the effects of adverse business developments and to secure the Company as a going concern even in times of crisis. Temporary deviations from the values are acceptable.
At the balance sheet date, the equity ratio was 37.6% and thus below the previous year’s figure of 42.3%. At 2.9 years, the theoretical payback period for debts was above the previous year’s figure of 1.6 years.
21. CONTINGENT LIABILITIES AND OTHER FINANCIAL COMMITMENTS Regarding non-cancellable leasing and rental agreements, reference is made to Note 16 “Financial liabilities”. At 31 March 2017, the Group has other financial commitments amounting to € 57,927 thousand (previous year: € 80,127 thousand) in connection with contractually binding investment projects. As of 31 March 2017, the maximum risk associated with liability for default was € 4.919 thousand. The liability for default corresponds to the theoretical maximum loss if a
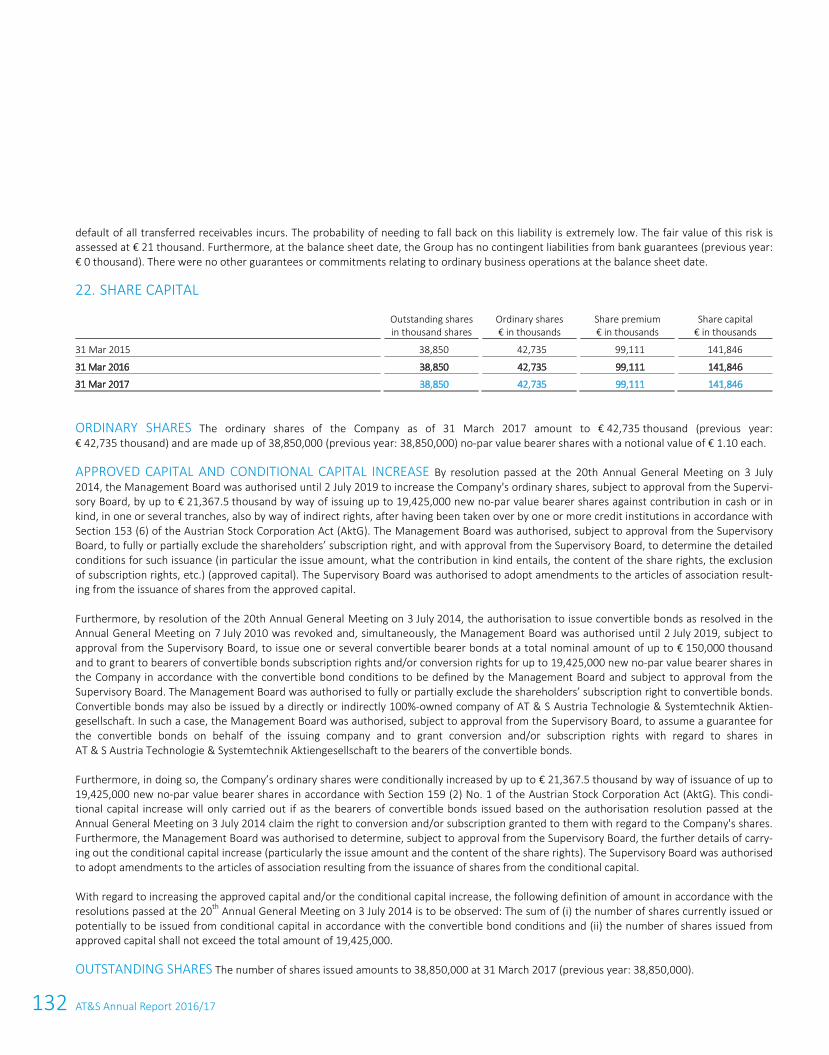
132 AT&S Annual Report 2016/17
114 AT&S Annual Report 2016/17
default of all transferred receivables incurs. The probability of needing to fall back on this liability is extremely low. The fair value of this risk is assessed at € 21 thousand. Furthermore, at the balance sheet date, the Group has no contingent liabilities from bank guarantees (previous year: € 0 thousand). There were no other guarantees or commitments relating to ordinary business operations at the balance sheet date.
22. SHARE CAPITAL
Outstanding shares in thousand shares
Ordinary shares € in thousands
Share premium € in thousands
Share capital € in thousands
31 Mar 2015
38,850 42,735
99,111
141,846
31 Mar 2016
38,850 42,735
99,111
141,846
31 Mar 2017
38,850 42,735
99,111
141,846
ORDINARY SHARES The ordinary shares of the Company as of 31 March 2017 amount to € 42,735 thousand (previous year: € 42,735 thousand) and are made up of 38,850,000 (previous year: 38,850,000) no-par value bearer shares with a notional value of € 1.10 each.
APPROVED CAPITAL AND CONDITIONAL CAPITAL INCREASE By resolution passed at the 20th Annual General Meeting on 3 July 2014, the Management Board was authorised until 2 July 2019 to increase the Company's ordinary shares, subject to approval from the Supervi-sory Board, by up to € 21,367.5 thousand by way of issuing up to 19,425,000 new no-par value bearer shares against contribution in cash or in kind, in one or several tranches, also by way of indirect rights, after having been taken over by one or more credit institutions in accordance with Section 153 (6) of the Austrian Stock Corporation Act (AktG). The Management Board was authorised, subject to approval from the Supervisory Board, to fully or partially exclude the shareholders’ subscription right, and with approval from the Supervisory Board, to determine the detailed conditions for such issuance (in particular the issue amount, what the contribution in kind entails, the content of the share rights, the exclusion of subscription rights, etc.) (approved capital). The Supervisory Board was authorised to adopt amendments to the articles of association result-ing from the issuance of shares from the approved capital.
Furthermore, by resolution of the 20th Annual General Meeting on 3 July 2014, the authorisation to issue convertible bonds as resolved in the Annual General Meeting on 7 July 2010 was revoked and, simultaneously, the Management Board was authorised until 2 July 2019, subject to approval from the Supervisory Board, to issue one or several convertible bearer bonds at a total nominal amount of up to € 150,000 thousand and to grant to bearers of convertible bonds subscription rights and/or conversion rights for up to 19,425,000 new no-par value bearer shares in the Company in accordance with the convertible bond conditions to be defined by the Management Board and subject to approval from the Supervisory Board. The Management Board was authorised to fully or partially exclude the shareholders’ subscription right to convertible bonds. Convertible bonds may also be issued by a directly or indirectly 100%-owned company of AT & S Austria Technologie & Systemtechnik Aktien-gesellschaft. In such a case, the Management Board was authorised, subject to approval from the Supervisory Board, to assume a guarantee for the convertible bonds on behalf of the issuing company and to grant conversion and/or subscription rights with regard to shares in AT & S Austria Technologie & Systemtechnik Aktiengesellschaft to the bearers of the convertible bonds.
Furthermore, in doing so, the Company’s ordinary shares were conditionally increased by up to € 21,367.5 thousand by way of issuance of up to 19,425,000 new no-par value bearer shares in accordance with Section 159 (2) No. 1 of the Austrian Stock Corporation Act (AktG). This condi-tional capital increase will only carried out if as the bearers of convertible bonds issued based on the authorisation resolution passed at the Annual General Meeting on 3 July 2014 claim the right to conversion and/or subscription granted to them with regard to the Company's shares. Furthermore, the Management Board was authorised to determine, subject to approval from the Supervisory Board, the further details of carry-ing out the conditional capital increase (particularly the issue amount and the content of the share rights). The Supervisory Board was authorised to adopt amendments to the articles of association resulting from the issuance of shares from the conditional capital.
With regard to increasing the approved capital and/or the conditional capital increase, the following definition of amount in accordance with the resolutions passed at the 20th Annual General Meeting on 3 July 2014 is to be observed: The sum of (i) the number of shares currently issued or potentially to be issued from conditional capital in accordance with the convertible bond conditions and (ii) the number of shares issued from approved capital shall not exceed the total amount of 19,425,000.
OUTSTANDING SHARES The number of shares issued amounts to 38,850,000 at 31 March 2017 (previous year: 38,850,000).
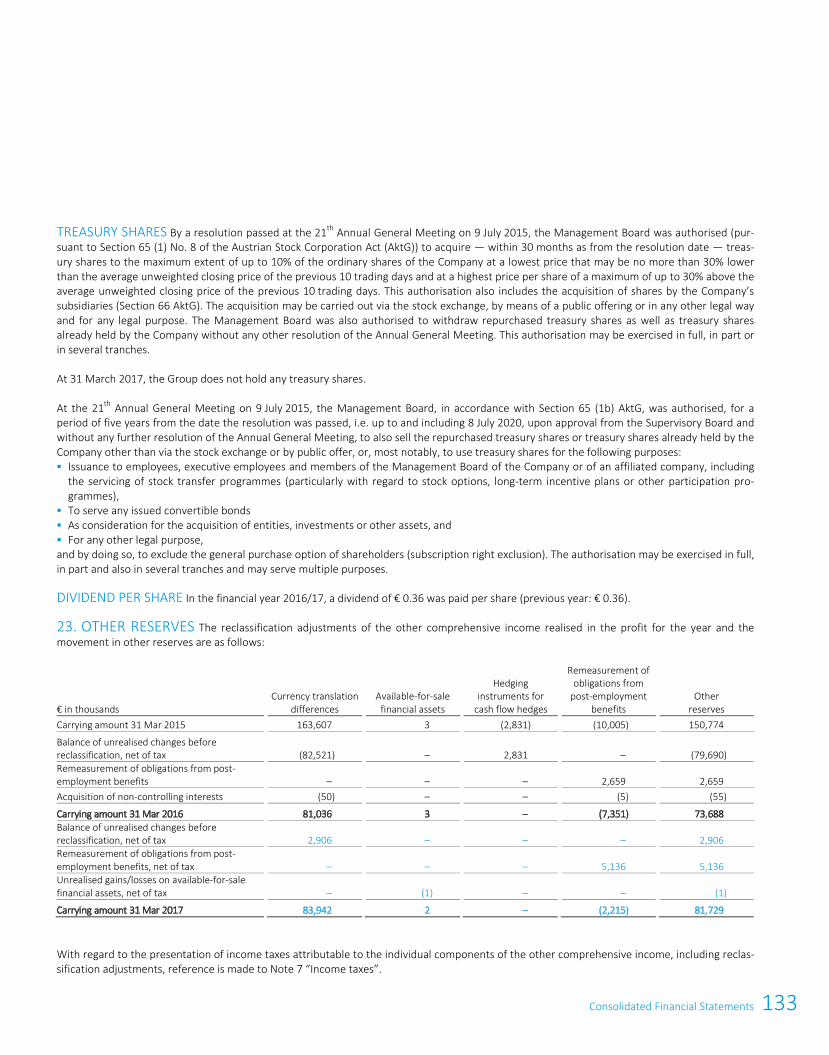
133Consolidated Financial Statements
114 AT&S Annual Report 2016/17
default of all transferred receivables incurs. The probability of needing to fall back on this liability is extremely low. The fair value of this risk is assessed at € 21 thousand. Furthermore, at the balance sheet date, the Group has no contingent liabilities from bank guarantees (previous year: € 0 thousand). There were no other guarantees or commitments relating to ordinary business operations at the balance sheet date.
22. SHARE CAPITAL
Outstanding shares in thousand shares
Ordinary shares € in thousands
Share premium € in thousands
Share capital € in thousands
31 Mar 2015
38,850 42,735
99,111
141,846
31 Mar 2016
38,850 42,735
99,111
141,846
31 Mar 2017
38,850 42,735
99,111
141,846
ORDINARY SHARES The ordinary shares of the Company as of 31 March 2017 amount to € 42,735 thousand (previous year: € 42,735 thousand) and are made up of 38,850,000 (previous year: 38,850,000) no-par value bearer shares with a notional value of € 1.10 each.
APPROVED CAPITAL AND CONDITIONAL CAPITAL INCREASE By resolution passed at the 20th Annual General Meeting on 3 July 2014, the Management Board was authorised until 2 July 2019 to increase the Company's ordinary shares, subject to approval from the Supervi-sory Board, by up to € 21,367.5 thousand by way of issuing up to 19,425,000 new no-par value bearer shares against contribution in cash or in kind, in one or several tranches, also by way of indirect rights, after having been taken over by one or more credit institutions in accordance with Section 153 (6) of the Austrian Stock Corporation Act (AktG). The Management Board was authorised, subject to approval from the Supervisory Board, to fully or partially exclude the shareholders’ subscription right, and with approval from the Supervisory Board, to determine the detailed conditions for such issuance (in particular the issue amount, what the contribution in kind entails, the content of the share rights, the exclusion of subscription rights, etc.) (approved capital). The Supervisory Board was authorised to adopt amendments to the articles of association result-ing from the issuance of shares from the approved capital.
Furthermore, by resolution of the 20th Annual General Meeting on 3 July 2014, the authorisation to issue convertible bonds as resolved in the Annual General Meeting on 7 July 2010 was revoked and, simultaneously, the Management Board was authorised until 2 July 2019, subject to approval from the Supervisory Board, to issue one or several convertible bearer bonds at a total nominal amount of up to € 150,000 thousand and to grant to bearers of convertible bonds subscription rights and/or conversion rights for up to 19,425,000 new no-par value bearer shares in the Company in accordance with the convertible bond conditions to be defined by the Management Board and subject to approval from the Supervisory Board. The Management Board was authorised to fully or partially exclude the shareholders’ subscription right to convertible bonds. Convertible bonds may also be issued by a directly or indirectly 100%-owned company of AT & S Austria Technologie & Systemtechnik Aktien-gesellschaft. In such a case, the Management Board was authorised, subject to approval from the Supervisory Board, to assume a guarantee for the convertible bonds on behalf of the issuing company and to grant conversion and/or subscription rights with regard to shares in AT & S Austria Technologie & Systemtechnik Aktiengesellschaft to the bearers of the convertible bonds.
Furthermore, in doing so, the Company’s ordinary shares were conditionally increased by up to € 21,367.5 thousand by way of issuance of up to 19,425,000 new no-par value bearer shares in accordance with Section 159 (2) No. 1 of the Austrian Stock Corporation Act (AktG). This condi-tional capital increase will only carried out if as the bearers of convertible bonds issued based on the authorisation resolution passed at the Annual General Meeting on 3 July 2014 claim the right to conversion and/or subscription granted to them with regard to the Company's shares. Furthermore, the Management Board was authorised to determine, subject to approval from the Supervisory Board, the further details of carry-ing out the conditional capital increase (particularly the issue amount and the content of the share rights). The Supervisory Board was authorised to adopt amendments to the articles of association resulting from the issuance of shares from the conditional capital.
With regard to increasing the approved capital and/or the conditional capital increase, the following definition of amount in accordance with the resolutions passed at the 20th Annual General Meeting on 3 July 2014 is to be observed: The sum of (i) the number of shares currently issued or potentially to be issued from conditional capital in accordance with the convertible bond conditions and (ii) the number of shares issued from approved capital shall not exceed the total amount of 19,425,000.
OUTSTANDING SHARES The number of shares issued amounts to 38,850,000 at 31 March 2017 (previous year: 38,850,000).
Consolidated Financial Statements 115
TREASURY SHARES By a resolution passed at the 21th Annual General Meeting on 9 July 2015, the Management Board was authorised (pur-suant to Section 65 (1) No. 8 of the Austrian Stock Corporation Act (AktG)) to acquire — within 30 months as from the resolution date — treas-ury shares to the maximum extent of up to 10% of the ordinary shares of the Company at a lowest price that may be no more than 30% lower than the average unweighted closing price of the previous 10 trading days and at a highest price per share of a maximum of up to 30% above the average unweighted closing price of the previous 10 trading days. This authorisation also includes the acquisition of shares by the Company’s subsidiaries (Section 66 AktG). The acquisition may be carried out via the stock exchange, by means of a public offering or in any other legal way and for any legal purpose. The Management Board was also authorised to withdraw repurchased treasury shares as well as treasury shares already held by the Company without any other resolution of the Annual General Meeting. This authorisation may be exercised in full, in part or in several tranches.
At 31 March 2017, the Group does not hold any treasury shares.
At the 21th Annual General Meeting on 9 July 2015, the Management Board, in accordance with Section 65 (1b) AktG, was authorised, for a period of five years from the date the resolution was passed, i.e. up to and including 8 July 2020, upon approval from the Supervisory Board and without any further resolution of the Annual General Meeting, to also sell the repurchased treasury shares or treasury shares already held by the Company other than via the stock exchange or by public offer, or, most notably, to use treasury shares for the following purposes: Issuance to employees, executive employees and members of the Management Board of the Company or of an affiliated company, including
the servicing of stock transfer programmes (particularly with regard to stock options, long-term incentive plans or other participation pro-grammes),
To serve any issued convertible bonds As consideration for the acquisition of entities, investments or other assets, and For any other legal purpose, and by doing so, to exclude the general purchase option of shareholders (subscription right exclusion). The authorisation may be exercised in full, in part and also in several tranches and may serve multiple purposes.
DIVIDEND PER SHARE In the financial year 2016/17, a dividend of € 0.36 was paid per share (previous year: € 0.36).
23. OTHER RESERVES The reclassification adjustments of the other comprehensive income realised in the profit for the year and the movement in other reserves are as follows:
€ in thousands
Currency translation differences
Available-for-sale financial assets
Hedging instruments for
cash flow hedges
Remeasurement of obligations from
post-employment benefits
Other reserves
Carrying amount 31 Mar 2015 163,607
3
(2,831)
(10,005)
150,774
Balance of unrealised changes before reclassification, net of tax
(82,521)
–
2,831
–
(79,690)
Remeasurement of obligations from post-employment benefits
–
–
–
2,659
2,659
Acquisition of non-controlling interests (50)
–
–
(5)
(55)
Carrying amount 31 Mar 2016 81,036
3
–
(7,351)
73,688
Balance of unrealised changes before reclassification, net of tax
2,906
–
–
–
2,906
Remeasurement of obligations from post-employment benefits, net of tax
–
–
–
5,136
5,136
Unrealised gains/losses on available-for-sale financial assets, net of tax
–
(1)
–
–
(1)
Carrying amount 31 Mar 2017 83,942
2
–
(2,215)
81,729
With regard to the presentation of income taxes attributable to the individual components of the other comprehensive income, including reclas-sification adjustments, reference is made to Note 7 “Income taxes”.
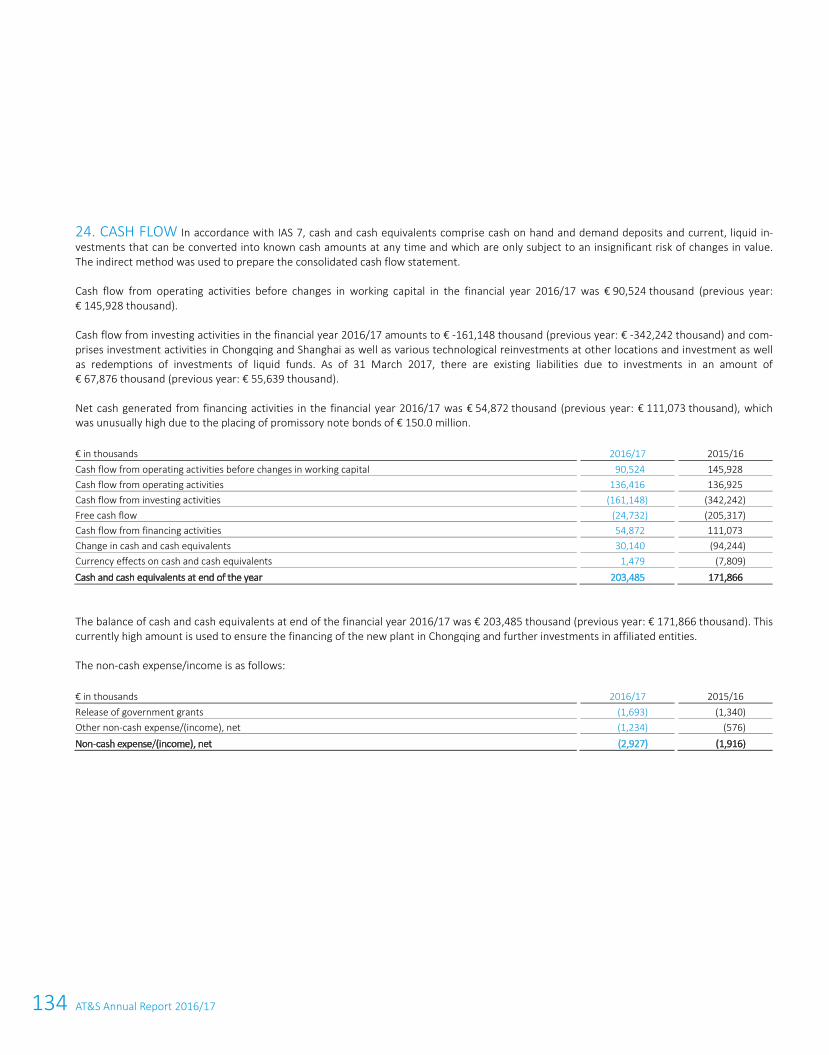
134 AT&S Annual Report 2016/17
116 AT&S Annual Report 2016/17
24. CASH FLOW In accordance with IAS 7, cash and cash equivalents comprise cash on hand and demand deposits and current, liquid in-vestments that can be converted into known cash amounts at any time and which are only subject to an insignificant risk of changes in value. The indirect method was used to prepare the consolidated cash flow statement.
Cash flow from operating activities before changes in working capital in the financial year 2016/17 was € 90,524 thousand (previous year: € 145,928 thousand).
Cash flow from investing activities in the financial year 2016/17 amounts to € -161,148 thousand (previous year: € -342,242 thousand) and com-prises investment activities in Chongqing and Shanghai as well as various technological reinvestments at other locations and investment as well as redemptions of investments of liquid funds. As of 31 March 2017, there are existing liabilities due to investments in an amount of € 67,876 thousand (previous year: € 55,639 thousand).
Net cash generated from financing activities in the financial year 2016/17 was € 54,872 thousand (previous year: € 111,073 thousand), which was unusually high due to the placing of promissory note bonds of € 150.0 million.
€ in thousands
2016/17
2015/16 Cash flow from operating activities before changes in working capital
90,524
145,928
Cash flow from operating activities 136,416
136,925
Cash flow from investing activities (161,148)
(342,242)
Free cash flow (24,732)
(205,317)
Cash flow from financing activities 54,872
111,073
Change in cash and cash equivalents 30,140
(94,244)
Currency effects on cash and cash equivalents 1,479
(7,809)
Cash and cash equivalents at end of the year 203,485
171,866
The balance of cash and cash equivalents at end of the financial year 2016/17 was € 203,485 thousand (previous year: € 171,866 thousand). This currently high amount is used to ensure the financing of the new plant in Chongqing and further investments in affiliated entities.
The non-cash expense/income is as follows:
€ in thousands
2016/17
2015/16 Release of government grants
(1,693)
(1,340)
Other non-cash expense/(income), net (1,234)
(576)
Non-cash expense/(income), net (2,927)
(1,916)
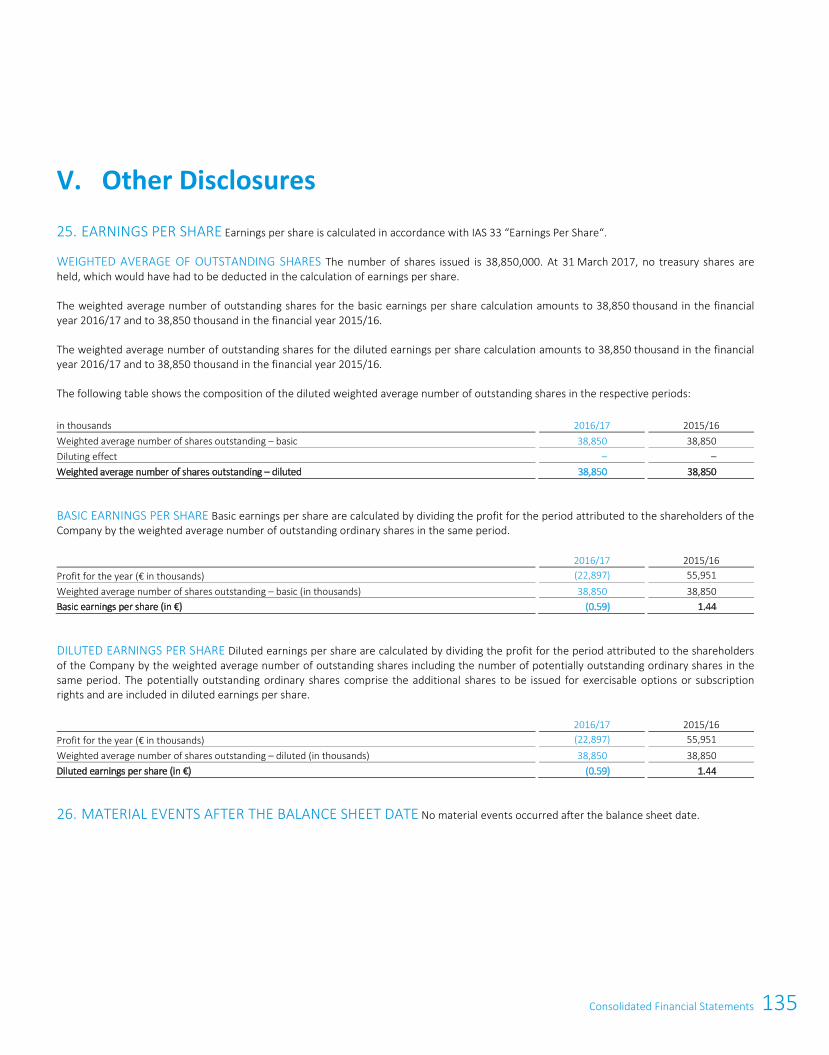
135Consolidated Financial Statements
116 AT&S Annual Report 2016/17
24. CASH FLOW In accordance with IAS 7, cash and cash equivalents comprise cash on hand and demand deposits and current, liquid in-vestments that can be converted into known cash amounts at any time and which are only subject to an insignificant risk of changes in value. The indirect method was used to prepare the consolidated cash flow statement.
Cash flow from operating activities before changes in working capital in the financial year 2016/17 was € 90,524 thousand (previous year: € 145,928 thousand).
Cash flow from investing activities in the financial year 2016/17 amounts to € -161,148 thousand (previous year: € -342,242 thousand) and com-prises investment activities in Chongqing and Shanghai as well as various technological reinvestments at other locations and investment as well as redemptions of investments of liquid funds. As of 31 March 2017, there are existing liabilities due to investments in an amount of € 67,876 thousand (previous year: € 55,639 thousand).
Net cash generated from financing activities in the financial year 2016/17 was € 54,872 thousand (previous year: € 111,073 thousand), which was unusually high due to the placing of promissory note bonds of € 150.0 million.
€ in thousands
2016/17
2015/16 Cash flow from operating activities before changes in working capital
90,524
145,928
Cash flow from operating activities 136,416
136,925
Cash flow from investing activities (161,148)
(342,242)
Free cash flow (24,732)
(205,317)
Cash flow from financing activities 54,872
111,073
Change in cash and cash equivalents 30,140
(94,244)
Currency effects on cash and cash equivalents 1,479
(7,809)
Cash and cash equivalents at end of the year 203,485
171,866
The balance of cash and cash equivalents at end of the financial year 2016/17 was € 203,485 thousand (previous year: € 171,866 thousand). This currently high amount is used to ensure the financing of the new plant in Chongqing and further investments in affiliated entities.
The non-cash expense/income is as follows:
€ in thousands
2016/17
2015/16 Release of government grants
(1,693)
(1,340)
Other non-cash expense/(income), net (1,234)
(576)
Non-cash expense/(income), net (2,927)
(1,916)
Consolidated Financial Statements 117
25. EARNINGS PER SHARE Earnings per share is calculated in accordance with IAS 33 “Earnings Per Share“.
WEIGHTED AVERAGE OF OUTSTANDING SHARES The number of shares issued is 38,850,000. At 31 March 2017, no treasury shares are held, which would have had to be deducted in the calculation of earnings per share.
The weighted average number of outstanding shares for the basic earnings per share calculation amounts to 38,850 thousand in the financial year 2016/17 and to 38,850 thousand in the financial year 2015/16.
The weighted average number of outstanding shares for the diluted earnings per share calculation amounts to 38,850 thousand in the financial year 2016/17 and to 38,850 thousand in the financial year 2015/16.
The following table shows the composition of the diluted weighted average number of outstanding shares in the respective periods:
in thousands
2016/17
2015/16 Weighted average number of shares outstanding – basic
38,850
38,850
Diluting effect –
–
Weighted average number of shares outstanding – diluted 38,850
38,850
BASIC EARNINGS PER SHARE Basic earnings per share are calculated by dividing the profit for the period attributed to the shareholders of the Company by the weighted average number of outstanding ordinary shares in the same period.
2016/17
2015/16 Profit for the year (€ in thousands) (22,897) 55,951 Weighted average number of shares outstanding – basic (in thousands)
38,850
38,850
Basic earnings per share (in €) (0.59)
1.44
DILUTED EARNINGS PER SHARE Diluted earnings per share are calculated by dividing the profit for the period attributed to the shareholders of the Company by the weighted average number of outstanding shares including the number of potentially outstanding ordinary shares in the same period. The potentially outstanding ordinary shares comprise the additional shares to be issued for exercisable options or subscription rights and are included in diluted earnings per share.
2016/17
2015/16 Profit for the year (€ in thousands) (22,897) 55,951 Weighted average number of shares outstanding – diluted (in thousands)
38,850
38,850
Diluted earnings per share (in €) (0.59)
1.44
26. MATERIAL EVENTS AFTER THE BALANCE SHEET DATE No material events occurred after the balance sheet date.
V. Other Disclosures
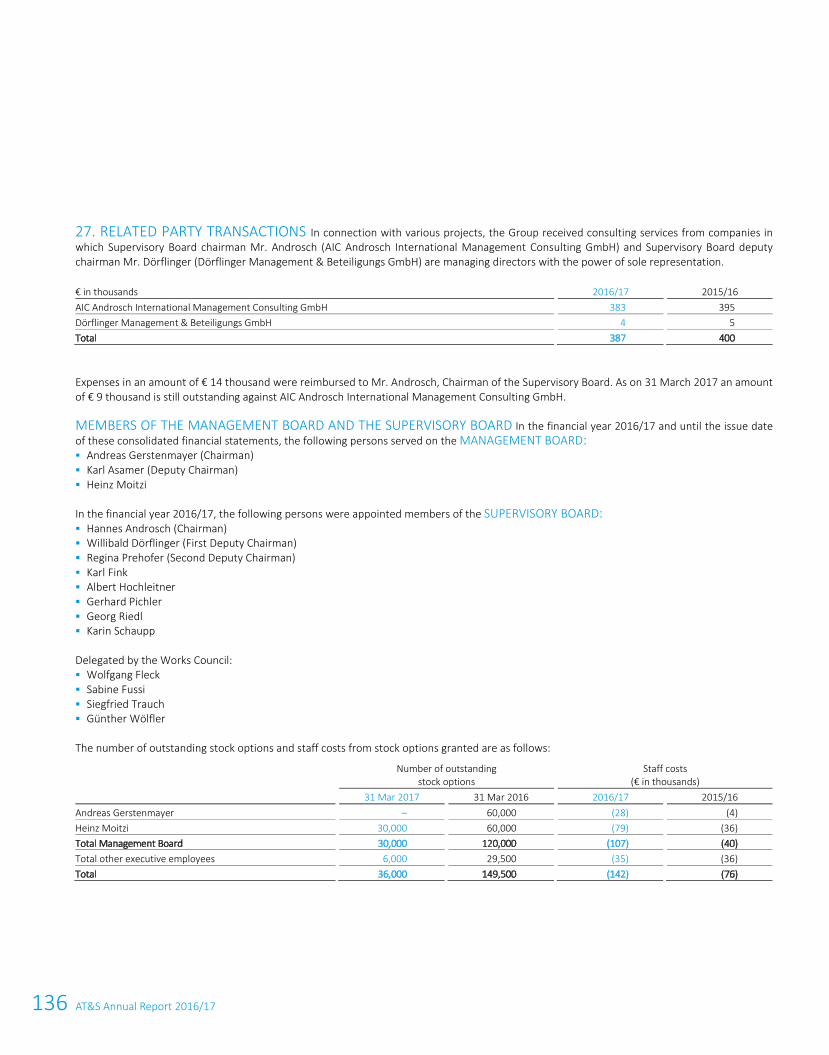
136 AT&S Annual Report 2016/17
118 AT&S Annual Report 2016/17
27. RELATED PARTY TRANSACTIONS In connection with various projects, the Group received consulting services from companies in which Supervisory Board chairman Mr. Androsch (AIC Androsch International Management Consulting GmbH) and Supervisory Board deputy chairman Mr. Dörflinger (Dörflinger Management & Beteiligungs GmbH) are managing directors with the power of sole representation.
€ in thousands
2016/17
2015/16 AIC Androsch International Management Consulting GmbH
383
395
Dörflinger Management & Beteiligungs GmbH 4
5
Total 387
400
Expenses in an amount of € 14 thousand were reimbursed to Mr. Androsch, Chairman of the Supervisory Board. As on 31 March 2017 an amount of € 9 thousand is still outstanding against AIC Androsch International Management Consulting GmbH.
MEMBERS OF THE MANAGEMENT BOARD AND THE SUPERVISORY BOARD In the financial year 2016/17 and until the issue date of these consolidated financial statements, the following persons served on the MANAGEMENT BOARD: Andreas Gerstenmayer (Chairman) Karl Asamer (Deputy Chairman) Heinz Moitzi
In the financial year 2016/17, the following persons were appointed members of the SUPERVISORY BOARD: Hannes Androsch (Chairman) Willibald Dörflinger (First Deputy Chairman) Regina Prehofer (Second Deputy Chairman) Karl Fink Albert Hochleitner Gerhard Pichler Georg Riedl Karin Schaupp
Delegated by the Works Council: Wolfgang Fleck Sabine Fussi Siegfried Trauch Günther Wölfler
The number of outstanding stock options and staff costs from stock options granted are as follows:
Number of outstanding
stock options Staff costs
(€ in thousands) 31 Mar 2017 31 Mar 2016 2016/17 2015/16 Andreas Gerstenmayer – 60,000 (28) (4) Heinz Moitzi 30,000 60,000 (79) (36) Total Management Board 30,000 120,000 (107) (40) Total other executive employees 6,000 29,500 (35) (36) Total 36,000 149,500 (142) (76)
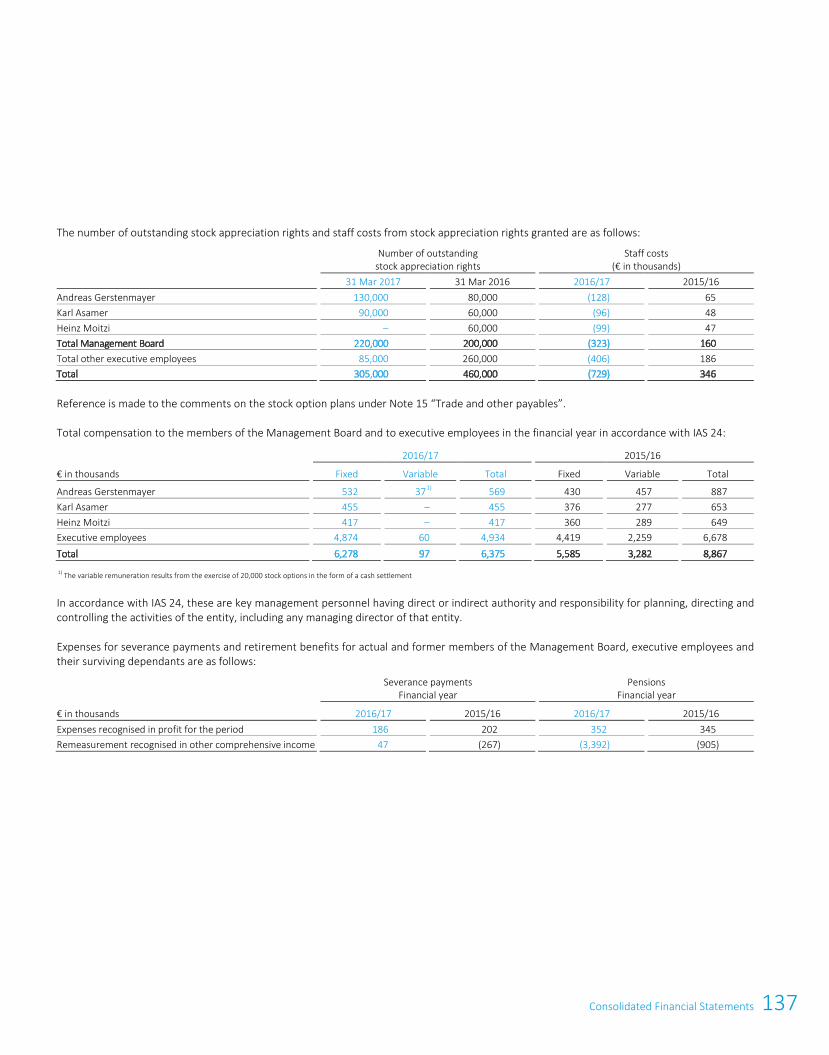
137Consolidated Financial Statements
118 AT&S Annual Report 2016/17
27. RELATED PARTY TRANSACTIONS In connection with various projects, the Group received consulting services from companies in which Supervisory Board chairman Mr. Androsch (AIC Androsch International Management Consulting GmbH) and Supervisory Board deputy chairman Mr. Dörflinger (Dörflinger Management & Beteiligungs GmbH) are managing directors with the power of sole representation.
€ in thousands
2016/17
2015/16 AIC Androsch International Management Consulting GmbH
383
395
Dörflinger Management & Beteiligungs GmbH 4
5
Total 387
400
Expenses in an amount of € 14 thousand were reimbursed to Mr. Androsch, Chairman of the Supervisory Board. As on 31 March 2017 an amount of € 9 thousand is still outstanding against AIC Androsch International Management Consulting GmbH.
MEMBERS OF THE MANAGEMENT BOARD AND THE SUPERVISORY BOARD In the financial year 2016/17 and until the issue date of these consolidated financial statements, the following persons served on the MANAGEMENT BOARD: Andreas Gerstenmayer (Chairman) Karl Asamer (Deputy Chairman) Heinz Moitzi
In the financial year 2016/17, the following persons were appointed members of the SUPERVISORY BOARD: Hannes Androsch (Chairman) Willibald Dörflinger (First Deputy Chairman) Regina Prehofer (Second Deputy Chairman) Karl Fink Albert Hochleitner Gerhard Pichler Georg Riedl Karin Schaupp
Delegated by the Works Council: Wolfgang Fleck Sabine Fussi Siegfried Trauch Günther Wölfler
The number of outstanding stock options and staff costs from stock options granted are as follows:
Number of outstanding
stock options Staff costs
(€ in thousands) 31 Mar 2017 31 Mar 2016 2016/17 2015/16 Andreas Gerstenmayer – 60,000 (28) (4) Heinz Moitzi 30,000 60,000 (79) (36) Total Management Board 30,000 120,000 (107) (40) Total other executive employees 6,000 29,500 (35) (36) Total 36,000 149,500 (142) (76)
Consolidated Financial Statements 119
The number of outstanding stock appreciation rights and staff costs from stock appreciation rights granted are as follows:
Number of outstanding
stock appreciation rights Staff costs
(€ in thousands) 31 Mar 2017 31 Mar 2016 2016/17 2015/16 Andreas Gerstenmayer 130,000 80,000 (128) 65 Karl Asamer 90,000 60,000 (96) 48 Heinz Moitzi – 60,000 (99) 47 Total Management Board 220,000 200,000 (323) 160 Total other executive employees 85,000 260,000 (406) 186 Total 305,000 460,000 (729) 346 Reference is made to the comments on the stock option plans under Note 15 “Trade and other payables”.
Total compensation to the members of the Management Board and to executive employees in the financial year in accordance with IAS 24:
2016/17 2015/16
€ in thousands Fixed Variable Total Fixed Variable Total
Andreas Gerstenmayer 532 37
1) 569 430 457 887 Karl Asamer 455 – 455 376 277 653 Heinz Moitzi 417 – 417 360 289 649 Executive employees 4,874 60 4,934 4,419 2,259 6,678 Total 6,278 97 6,375 5,585 3,282 8,867
1) The variable remuneration results from the exercise of 20,000 stock options in the form of a cash settlement
In accordance with IAS 24, these are key management personnel having direct or indirect authority and responsibility for planning, directing and controlling the activities of the entity, including any managing director of that entity.
Expenses for severance payments and retirement benefits for actual and former members of the Management Board, executive employees and their surviving dependants are as follows:
Severance payments
Financial year Pensions
Financial year
€ in thousands 2016/17 2015/16 2016/17 2015/16 Expenses recognised in profit for the period 186 202 352 345 Remeasurement recognised in other comprehensive income 47 (267) (3,392) (905)
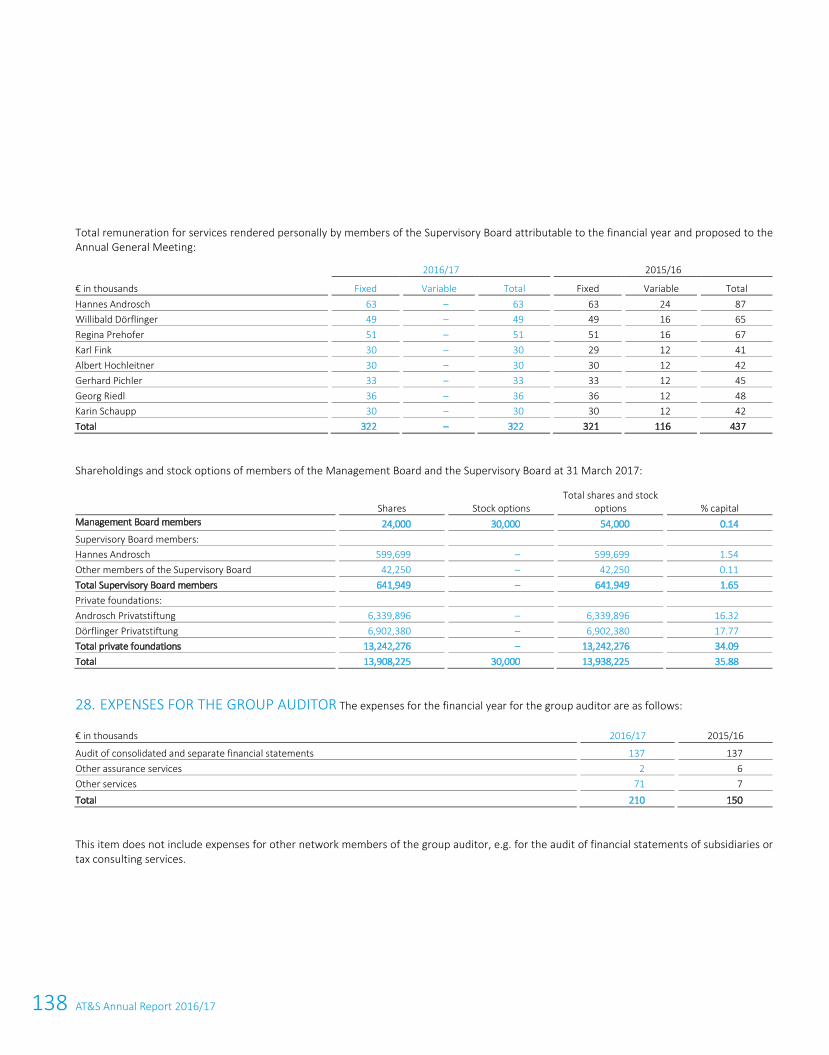
138 AT&S Annual Report 2016/17
120 AT&S Annual Report 2016/17
Total remuneration for services rendered personally by members of the Supervisory Board attributable to the financial year and proposed to the Annual General Meeting:
2016/17 2015/16
€ in thousands Fixed Variable Total Fixed Variable Total Hannes Androsch 63 – 63 63 24 87 Willibald Dörflinger 49 – 49 49 16 65 Regina Prehofer 51 – 51 51 16 67 Karl Fink 30 – 30 29 12 41 Albert Hochleitner 30 – 30 30 12 42 Gerhard Pichler 33 – 33 33 12 45 Georg Riedl 36 – 36 36 12 48 Karin Schaupp 30 – 30 30 12 42 Total 322 – 322 321 116 437
Shareholdings and stock options of members of the Management Board and the Supervisory Board at 31 March 2017:
Shares
Stock options
Total shares and stock options
% capital
Management Board members 24,000 30,000
54,000
0.14
Supervisory Board members:
Hannes Androsch
599,699 –
599,699
1.54
Other members of the Supervisory Board
42,250 –
42,250
0.11
Total Supervisory Board members 641,949
–
641,949
1.65
Private foundations:
Androsch Privatstiftung
6,339,896 –
6,339,896
16.32
Dörflinger Privatstiftung
6,902,380 –
6,902,380
17.77
Total private foundations 13,242,276
–
13,242,276
34.09
Total 13,908,225
30,000
13,938,225
35.88
28. EXPENSES FOR THE GROUP AUDITOR The expenses for the financial year for the group auditor are as follows:
€ in thousands
2016/17
2015/16
Audit of consolidated and separate financial statements 137
137
Other assurance services 2
6
Other services 71
7
Total 210
150
This item does not include expenses for other network members of the group auditor, e.g. for the audit of financial statements of subsidiaries or tax consulting services.
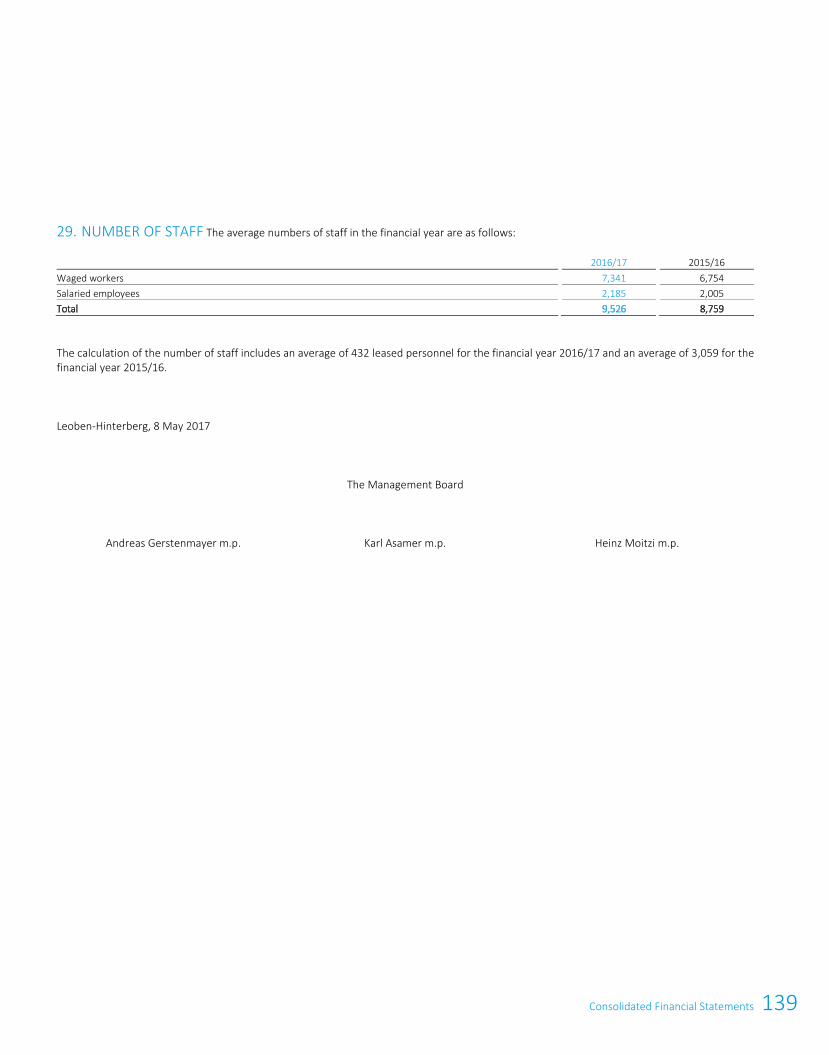
139Consolidated Financial Statements
120 AT&S Annual Report 2016/17
Total remuneration for services rendered personally by members of the Supervisory Board attributable to the financial year and proposed to the Annual General Meeting:
2016/17 2015/16
€ in thousands Fixed Variable Total Fixed Variable Total Hannes Androsch 63 – 63 63 24 87 Willibald Dörflinger 49 – 49 49 16 65 Regina Prehofer 51 – 51 51 16 67 Karl Fink 30 – 30 29 12 41 Albert Hochleitner 30 – 30 30 12 42 Gerhard Pichler 33 – 33 33 12 45 Georg Riedl 36 – 36 36 12 48 Karin Schaupp 30 – 30 30 12 42 Total 322 – 322 321 116 437
Shareholdings and stock options of members of the Management Board and the Supervisory Board at 31 March 2017:
Shares
Stock options
Total shares and stock options
% capital
Management Board members 24,000 30,000
54,000
0.14
Supervisory Board members:
Hannes Androsch
599,699 –
599,699
1.54
Other members of the Supervisory Board
42,250 –
42,250
0.11
Total Supervisory Board members 641,949
–
641,949
1.65
Private foundations:
Androsch Privatstiftung
6,339,896 –
6,339,896
16.32
Dörflinger Privatstiftung
6,902,380 –
6,902,380
17.77
Total private foundations 13,242,276
–
13,242,276
34.09
Total 13,908,225
30,000
13,938,225
35.88
28. EXPENSES FOR THE GROUP AUDITOR The expenses for the financial year for the group auditor are as follows:
€ in thousands
2016/17
2015/16
Audit of consolidated and separate financial statements 137
137
Other assurance services 2
6
Other services 71
7
Total 210
150
This item does not include expenses for other network members of the group auditor, e.g. for the audit of financial statements of subsidiaries or tax consulting services.
Consolidated Financial Statements 121
29. NUMBER OF STAFF The average numbers of staff in the financial year are as follows:
2016/17
2015/16 Waged workers
7,341
6,754
Salaried employees 2,185
2,005
Total 9,526
8,759
The calculation of the number of staff includes an average of 432 leased personnel for the financial year 2016/17 and an average of 3,059 for the financial year 2015/16.
Leoben-Hinterberg, 8 May 2017
The Management Board
Andreas Gerstenmayer m.p. Karl Asamer m.p. Heinz Moitzi m.p.
140 Statement of all Legal Representatives
122 AT&S Annual Report 2016/17
We confirm to the best of our knowledge that the consolidated financial statements give a true and fair view of the assets, liabilities, financial position and profit or loss of the Group as required by the applicable accounting standards and that the Group Management report gives a true and fair view of the development and performance of the business and the position of the Group, together with a description of the principal risks and uncertainties the Group faces.
Leoben-Hinterberg, 8 May 2017
The Management Board
Andreas Gerstenmayer m.p. Chief Executive Officer
Karl Asamer m.p. Chief Financial Officer
Heinz Moitzi m.p. Chief Operations Officer
Statement of all Legal Representatives
141Auditor’s Report
122 AT&S Annual Report 2016/17
We confirm to the best of our knowledge that the consolidated financial statements give a true and fair view of the assets, liabilities, financial position and profit or loss of the Group as required by the applicable accounting standards and that the Group Management report gives a true and fair view of the development and performance of the business and the position of the Group, together with a description of the principal risks and uncertainties the Group faces.
Leoben-Hinterberg, 8 May 2017
The Management Board
Andreas Gerstenmayer m.p. Chief Executive Officer
Karl Asamer m.p. Chief Financial Officer
Heinz Moitzi m.p. Chief Operations Officer
Statement of all Legal Representatives
Auditor’s Report 123
We draw attention to the fact that the English translation of this auditor’s report according to Section 274 of the Austrian Commercial Code (UGB) is presented for the convenience of the reader only and that the German wording is the only legally binding version.
REPORT ON THE CONSOLIDATED FINANCIAL STATEMENTS
AUDIT OPINION We have audited the consolidated financial statements of AT & S Austria Technologie & Systemtechnik Aktiengesellschaft, Leoben-Hinterberg, and its subsidiaries (the Group), which comprise the consolidated balance sheet as at March 31, 2017, the separate consoli-dated income statement, the consolidated statement of comprehensive income, the consolidated statement of cash flows and the consolidated statement of changes in equity for the fiscal year then ended, and the notes to the consolidated financial statements.
In our opinion, the accompanying consolidated financial statements comply with legal requirements and give a true and fair view of the financial position of the Group as at March 31, 2017, and of its financial performance and cash flows for the year then ended in accordance with the International Financial Reporting Standards (IFRSs) as adopted by the EU and the additional requirements under Section 245a Austrian Commer-cial Code.
BASIS FOR OPINION We conducted our audit in accordance with Austrian generally accepted auditing standards. Those standards require the application of the International Standards on Auditing (ISAs). Our responsibilities under those provisions and standards are further described in the “Auditor’s Responsibilities for the Audit of the Consolidated Financial Statements” section of our report. We are independent of the Group in accordance with Austrian Generally Accepted Accounting Principles and professional requirements, and we have fulfilled our other ethical responsibilities in accordance with these requirements. We believe that the audit evidence we have obtained is sufficient and appropriate to provide a basis for our opinion.
KEY AUDIT MATTERS Key audit matters are those matters that, in our professional judgment, were of most significance in our audit of the consolidated financial statements of the fiscal year. These matters were addressed in the context of our audit of the consolidated financial statements as a whole, and in forming our opinion thereon, and we do not provide a separate opinion on these matters.
We have structured key audit matters as follows: Descriptions of individual key audit matters Audit approach Reference to related disclosures
1. DEFERRED TAX ASSETS FROM TAX LOSS CARRY-FORWARDS AND OTHER DEDUCTIBLE TEMPORARY DIFFERENCES
Description of the individual key audit matter
The Group capitalized deferred tax assets in a total amount of EUR 38,659k. This amount mainly includes deferred tax assets from tax loss carry-forwards and amortization of goodwill under tax law in the amount of EUR 13,729k as well as deductible temporary differences in the amount of EUR 24,930k.
Deferred tax assets are capitalized based on the assumption that sufficient taxable income will be generated within a planning period of at least 5 years against which tax loss carry-forwards and other deductible temporary differences can be offset. These assumptions are based on esti-mates of current and planned taxable results and any future measures implemented by the companies concerned that will have an effect on tax.
Audit approach
We: - Identified, for significant companies, the process used to determine the future taxable results that serve as a basis for the calculation of de-
ferred tax assets, - Performed plausibility checks for significant companies to evaluate if the budgeted figures used are plausible when compared to our
knowledge of the planned course of business,
Auditor’s Report
142 AT&S Annual Report 2016/17
124 AT&S Annual Report 2016/17
- Received tax advisor confirmation letters to confirm the existence and accuracy of the tax loss carry-forwards, - Analyzed and confirmed the accounting assumptions on the possibility to utilize tax loss carry-forwards and deductible temporary differences,
and - Audited the presentation and disclosures in the notes to the consolidated financial statements.
Reference to related disclosures
For further related information, we refer to the notes to the consolidated financial statements section I. B. (e.) on accounting and measurement policies in respect of deferred taxes, section I. C. on critical accounting estimates and assumptions concerning the accounting and measurement of deferred taxes and current income tax liabilities, as well as to section III. 7. comments on income taxes.
2. RECOVERABILITY OF CAPITALIZED DEVELOPMENT COSTS WITHIN INTANGIBLE ASSETS
Description of the individual key audit matter
At the balance sheet date, the Group reports development costs (capitalized under intangible assets) in its consolidated balance sheet in an amount of EUR 78,456k that mainly pertain to the cash-generating unit “Substrates” under the Chongqing project, People’s Republic of China. In the fiscal year under review, development costs of EUR 4,819k were capitalized for the next substrate generation, which have not been used yet. An impairment test was performed using a discounted cash flow method. Under this process, the recoverable amount of the cash-generating unit is compared with the carrying amount of the included assets. Annual planning process data is used to make assumptions on the discount rate, profitability as well as growth rates.
Audit approach
We: - Surveyed the process applied to identify and define cash-generating units, to calculate the recoverable amount, to test for impairment, to
calculate the capital cost rate and the growth rate, as well as the calculation model, - Reconciled the assumed future cash flows used in the budget planning with the information included in the forecast made by the manage-
ment board and brought to the attention of the supervisory board, - Drew on our pool of internal experts to perform plausibility checks with regard to the calculations and the calculation model. These experts
recomputed the calculations and verified that the calculation model complies with the generally applicable international accounting principles, - Drew on our pool of internal experts to reconcile the parameters used, e.g. the applied interest rates or growth rates that serve as the basis of
the calculation, and critically assessed the results, and - Audited the presentation and disclosures in the notes to the consolidated financial statements.
Reference to related disclosures
For further related information, we refer to the notes to the consolidated financial statements section I. B. (h) on accounting and measurement policies in respect of the impairment of and reversals of impairment of property, plant and equipment, intangible assets, section I. C. critical estimates and assumptions concerning the accounting and measurement of development costs, as well as to section IV. 9. comments on intangi-ble assets.
RESPONSIBILITIES OF MANAGEMENT AND THE AUDIT COMMITTEE FOR THE CONSOLIDATED FINANCIAL STATEMENTS Management is responsible for the preparation and fair presentation of these consolidated financial statements in accordance with International Financial Reporting Standards (IFRSs) as adopted by the EU, and the additional requirements under Section 245a UGB, and for such internal control as management determines is necessary to enable the preparation of consolidated financial statements that are free from material misstatement, whether due to fraud or error.
In preparing the consolidated financial statements, management is responsible for assessing the Group’s ability to continue as a going concern, disclosing, as applicable, matters related to going concern and using the going concern basis of accounting unless management either intends to liquidate the Group or to cease operations, or has no realistic alternative but to do so.
143Auditor’s Report
124 AT&S Annual Report 2016/17
- Received tax advisor confirmation letters to confirm the existence and accuracy of the tax loss carry-forwards, - Analyzed and confirmed the accounting assumptions on the possibility to utilize tax loss carry-forwards and deductible temporary differences,
and - Audited the presentation and disclosures in the notes to the consolidated financial statements.
Reference to related disclosures
For further related information, we refer to the notes to the consolidated financial statements section I. B. (e.) on accounting and measurement policies in respect of deferred taxes, section I. C. on critical accounting estimates and assumptions concerning the accounting and measurement of deferred taxes and current income tax liabilities, as well as to section III. 7. comments on income taxes.
2. RECOVERABILITY OF CAPITALIZED DEVELOPMENT COSTS WITHIN INTANGIBLE ASSETS
Description of the individual key audit matter
At the balance sheet date, the Group reports development costs (capitalized under intangible assets) in its consolidated balance sheet in an amount of EUR 78,456k that mainly pertain to the cash-generating unit “Substrates” under the Chongqing project, People’s Republic of China. In the fiscal year under review, development costs of EUR 4,819k were capitalized for the next substrate generation, which have not been used yet. An impairment test was performed using a discounted cash flow method. Under this process, the recoverable amount of the cash-generating unit is compared with the carrying amount of the included assets. Annual planning process data is used to make assumptions on the discount rate, profitability as well as growth rates.
Audit approach
We: - Surveyed the process applied to identify and define cash-generating units, to calculate the recoverable amount, to test for impairment, to
calculate the capital cost rate and the growth rate, as well as the calculation model, - Reconciled the assumed future cash flows used in the budget planning with the information included in the forecast made by the manage-
ment board and brought to the attention of the supervisory board, - Drew on our pool of internal experts to perform plausibility checks with regard to the calculations and the calculation model. These experts
recomputed the calculations and verified that the calculation model complies with the generally applicable international accounting principles, - Drew on our pool of internal experts to reconcile the parameters used, e.g. the applied interest rates or growth rates that serve as the basis of
the calculation, and critically assessed the results, and - Audited the presentation and disclosures in the notes to the consolidated financial statements.
Reference to related disclosures
For further related information, we refer to the notes to the consolidated financial statements section I. B. (h) on accounting and measurement policies in respect of the impairment of and reversals of impairment of property, plant and equipment, intangible assets, section I. C. critical estimates and assumptions concerning the accounting and measurement of development costs, as well as to section IV. 9. comments on intangi-ble assets.
RESPONSIBILITIES OF MANAGEMENT AND THE AUDIT COMMITTEE FOR THE CONSOLIDATED FINANCIAL STATEMENTS Management is responsible for the preparation and fair presentation of these consolidated financial statements in accordance with International Financial Reporting Standards (IFRSs) as adopted by the EU, and the additional requirements under Section 245a UGB, and for such internal control as management determines is necessary to enable the preparation of consolidated financial statements that are free from material misstatement, whether due to fraud or error.
In preparing the consolidated financial statements, management is responsible for assessing the Group’s ability to continue as a going concern, disclosing, as applicable, matters related to going concern and using the going concern basis of accounting unless management either intends to liquidate the Group or to cease operations, or has no realistic alternative but to do so.
Auditor’s Report 125
The audit committee is responsible for overseeing the Group’s financial reporting process.
AUDITOR’S RESPONSIBILITIES FOR THE AUDIT OF THE CONSOLIDATED FINANCIAL STATEMENTS Our objectives are to obtain reasonable assurance about whether the consolidated financial statements as a whole are free from material misstatement, whether due to fraud or error, and to issue an auditor’s report that includes our opinion. Reasonable assurance is a high level of assurance, but is not a guarantee that an audit conducted in accordance with Austrian generally accepted auditing standards, which require the application of ISAs, will always detect a material misstatement when it exists. Misstatements can arise from fraud or error and are considered material if, indi-vidually or in the aggregate, they could reasonably be expected to influence the economic decisions of users taken on the basis of these consoli-dated financial statements.
As part of an audit in accordance with Austrian generally accepted auditing standards, which require the application of ISAs, we exercise profes-sional judgment and maintain professional skepticism throughout the audit.
We also: - identify and assess the risks of material misstatement of the consolidated financial statements, whether due to fraud or error, design and
perform audit procedures responsive to those risks, and obtain audit evidence that is sufficient and appropriate to provide a basis for our opinion. The risks of not detecting a material misstatement resulting from fraud is higher than for one resulting from error, as fraud may in-volve collusion, forgery, intentional omissions, misrepresentations, or the override of internal control.
- obtain an understanding of internal control relevant to the audit in order to design audit procedures that are appropriate in the circumstanc-es, but not for the purpose of expressing an opinion on the effectiveness of the Group’s internal control.
- evaluate the appropriateness of accounting policies used and the reasonableness of accounting estimates and related disclosures made by management.
- conclude on the appropriateness of management’s use of the going concern basis of accounting and, based on the audit evidence obtained, whether a material uncertainty exists related to events or conditions that may cast significant doubt on the Group’s ability to continue as a go-ing concern. If we conclude that a material uncertainty exists, we are required to draw attention in our auditor’s report to the related disclo-sures in the consolidated financial statements or, if such disclosures are inadequate, to modify our opinion. Our conclusions are based on the audit evidence obtained up to the date of our auditor’s report. However, future events or conditions may cause the Group to cease to contin-ue as a going concern.
- evaluate the overall presentation, structure and content of the consolidated financial statements, including the disclosures, and whether the consolidated financial statements represent the underlying transactions and events in a manner that achieves fair presentation.
- obtain sufficient appropriate audit evidence regarding the financial information of the entities or business activities within the Group to ex-press an opinion on the consolidated financial statements. We are responsible for the direction, supervision and performance of the group audit. We remain solely responsible for our audit opinion.
We communicate with the audit committee regarding, among other matters, the planned scope and timing of the audit and significant audit findings, including any significant deficiencies in internal control that we identify during our audit.
We also provide the audit committee with a statement that we have complied with all relevant ethical requirements regarding independence, and to communicate with them all relationships and other matters that may reasonably be thought to bear on our independence, and where applicable, related safeguards.
From the matters communicated with the audit committee, we determine those matters that were of most significance in the audit of the con-solidated financial statements of the current period and are therefore the key audit matters. We describe these matters in our auditor’s report unless law or regulation precludes public disclosure about the matter or when, in extremely rare circumstances, we determine that a matter should not be communicated in our report because the adverse consequences of doing so would reasonably be expected to outweigh the public interest benefits of such communication.
144 AT&S Annual Report 2016/17
126 AT&S Annual Report 2016/17
REPORT ON OTHER LEGAL AND REGULATORY REQUIREMENTS
COMMENTS ON THE MANAGEMENT REPORT FOR THE GROUP Pursuant to the Austrian Commercial Code, the management report for the Group is to be audited as to whether it is consistent with the consolidated financial statements and as to whether the management re-port for the Group was prepared in accordance with the applicable legal requirements.
Management is responsible for the preparation of the management report for the Group in accordance with the Austrian Commercial Code.
We conducted our audit in accordance with Austrian Standards on Auditing for the audit of the management report for the Group.
OPINION In our opinion, the management report for the Group was prepared in accordance with the applicable legal requirements, includes accurate disclosures pursuant to Section 243a UGB and is consistent with the consolidated financial statements.
STATEMENT Based on the findings during the audit of the consolidated financial statements and due to the obtained understanding concerning the Group and its circumstances no material misstatements in the management report for the Group came to our attention.
OTHER INFORMATION Management is responsible for the other information. The other information comprises the information included in the annual report, but does not include the consolidated financial statements, the management report for the Group and the auditor’s report. The annual report is expected to be made available to us after the date of this auditor’s report.
Our opinion on the consolidated financial statements does not cover the other information and we will not express any form of assurance con-clusion thereon.
In connection with our audit of the consolidated financial statements, our responsibility is to read the other information identified above when it becomes available and, in doing so, consider whether the other information is materially inconsistent with the consolidated financial statements or our knowledge obtained in the audit, or otherwise appears to be materially misstated.
RESPONSIBLE ENGAGEMENT PARTNER Responsible for the proper performance of the engagement is Mr. Jürgen Schauer, Austrian Certified Public Accountant.
Vienna, 8 May 2017 PwC Wirtschaftsprüfung GmbH
signed:
Jürgen Schauer
Austrian Certified Public Accountant
This report is a translation of the original report in German, which is solely valid. Publication and sharing with third parties of the consolidated financial statements together with our auditor’s opinion is only allowed if the consolidated financial statements and the management report for the Group are identical with the German audited version. This audit opinion is only applicable to the German and complete consolidated financial statements with the management report for the Group. For deviating versions, the provisions of Section 281 (2) UGB apply.
145Glossary
126 AT&S Annual Report 2016/17
REPORT ON OTHER LEGAL AND REGULATORY REQUIREMENTS
COMMENTS ON THE MANAGEMENT REPORT FOR THE GROUP Pursuant to the Austrian Commercial Code, the management report for the Group is to be audited as to whether it is consistent with the consolidated financial statements and as to whether the management re-port for the Group was prepared in accordance with the applicable legal requirements.
Management is responsible for the preparation of the management report for the Group in accordance with the Austrian Commercial Code.
We conducted our audit in accordance with Austrian Standards on Auditing for the audit of the management report for the Group.
OPINION In our opinion, the management report for the Group was prepared in accordance with the applicable legal requirements, includes accurate disclosures pursuant to Section 243a UGB and is consistent with the consolidated financial statements.
STATEMENT Based on the findings during the audit of the consolidated financial statements and due to the obtained understanding concerning the Group and its circumstances no material misstatements in the management report for the Group came to our attention.
OTHER INFORMATION Management is responsible for the other information. The other information comprises the information included in the annual report, but does not include the consolidated financial statements, the management report for the Group and the auditor’s report. The annual report is expected to be made available to us after the date of this auditor’s report.
Our opinion on the consolidated financial statements does not cover the other information and we will not express any form of assurance con-clusion thereon.
In connection with our audit of the consolidated financial statements, our responsibility is to read the other information identified above when it becomes available and, in doing so, consider whether the other information is materially inconsistent with the consolidated financial statements or our knowledge obtained in the audit, or otherwise appears to be materially misstated.
RESPONSIBLE ENGAGEMENT PARTNER Responsible for the proper performance of the engagement is Mr. Jürgen Schauer, Austrian Certified Public Accountant.
Vienna, 8 May 2017 PwC Wirtschaftsprüfung GmbH
signed:
Jürgen Schauer
Austrian Certified Public Accountant
This report is a translation of the original report in German, which is solely valid. Publication and sharing with third parties of the consolidated financial statements together with our auditor’s opinion is only allowed if the consolidated financial statements and the management report for the Group are identical with the German audited version. This audit opinion is only applicable to the German and complete consolidated financial statements with the management report for the Group. For deviating versions, the provisions of Section 281 (2) UGB apply.
Glossary 1
Actuators Drive sections which convert electrical signals into mechanical movement.
Advanced Packaging Active and passive electrical components are embedded in printed circuit boards and interconnected via microvias and conducting lines instead of being assembled on the printed circuit board. This technology enables space-saving, high-performance applications for a wide range of customer segments.
All-in-one module All the components needed for an end device are connected in an integrated module, combining various interconnection technologies.
Assembly service Assembling of components on (or inside) the printed circuit board.
ATX Global Players A free float weighted price index made up of all stocks traded on the Vienna Stock Exchange and listed in the Prime Market, which generate at least 20 percent of sales outside of Europe.
ATX Prime A Vienna Stock Exchange capital-weighted index comprising all securities traded in the Prime Market seg-ment. This is a broadly-based index for all stocks that meet the minimum capitalisation requirements and satisfy the stricter disclosure and reporting obligations.
Back-end packaging In packaging (back-end), processes for the singulation and assembly of semiconductor chips on substrates are carried out and further materials for the packaging and contacting of chips are applied.
BGA substrates Ball Grid Array substrate. This substrate is at least 1.2 times as large as the chip placed on it.
CAPEX CAPEX refers to the cash investments in property, plant and equipment and intangible assets, meaning that the asset acquisition is adjusted to exclude non-cash effects.
Carbon footprint The carbon footprint refers to the amount of greenhouse gas emissions produced over the entire life cycle of a product.
CEMs Contract electronic manufacturers: companies which provide production services – primarily printed circuit board assembly – to the customer.
Chip-on-board and/or chip-on-flex interconnection platforms Method for the direct assembly of unpackaged semiconductors on printed circuit boards.
Commoditisation Goods become simple commodities which can be produced by various manufacturers.
Glossary
146 AT&S Annual Report 2016/17
2 AT&S Annual Report 2016/17
Corporate Governance Code A set of rules for the responsible management and control of business enterprises. Companies voluntarily undertake to comply with the principles of the Code.
COSO standard Internationally recognised standard for Internal Control Systems (ICS) and risk management published by the Committee of Sponsoring Organizations of the Treadway Commission (COSO).
Covenants A covenant is an obligation of a borrower to the creditor not to exceed or fall below certain criteria. The most common covenants are the equity ratio and net debt/EBITDA.
CSP substrates Chip Scale Packaging substrate; this substrate is no more than 1.2 times as large as the chip placed on it.
Dividend record date Date on which the company declares who is a shareholder in the company and therefore entitled to divi-dends.
Duration The average repayment time for financial liabilities.
EBIT Operating result = earnings before net finance costs and taxes (Earnings Before Interest and Taxes).
EBIT margin EBIT as a percentage of total revenue.
EBITDA Operating result before depreciation and amortisation (Earnings Before Interest, Taxes, Depreciation and Amortisation).
EBITDA margin EBITDA as a percentage of total revenue.
ECP® technology Embedded component packaging technology developed by AT&S in order to embed active and/or passive components inside printed circuit boards (® registered trademark AT 255868).
Embedded die packaging Technology used to embed active and passive components in a printed circuit board.
Embedded interposer Interconnection between the printed circuit board and substrate with embedded components, to compen-sate different structure levels.
Embedding Integrating active and/or passive electronic components inside printed circuit boards.
147Glossary
2 AT&S Annual Report 2016/17
Corporate Governance Code A set of rules for the responsible management and control of business enterprises. Companies voluntarily undertake to comply with the principles of the Code.
COSO standard Internationally recognised standard for Internal Control Systems (ICS) and risk management published by the Committee of Sponsoring Organizations of the Treadway Commission (COSO).
Covenants A covenant is an obligation of a borrower to the creditor not to exceed or fall below certain criteria. The most common covenants are the equity ratio and net debt/EBITDA.
CSP substrates Chip Scale Packaging substrate; this substrate is no more than 1.2 times as large as the chip placed on it.
Dividend record date Date on which the company declares who is a shareholder in the company and therefore entitled to divi-dends.
Duration The average repayment time for financial liabilities.
EBIT Operating result = earnings before net finance costs and taxes (Earnings Before Interest and Taxes).
EBIT margin EBIT as a percentage of total revenue.
EBITDA Operating result before depreciation and amortisation (Earnings Before Interest, Taxes, Depreciation and Amortisation).
EBITDA margin EBITDA as a percentage of total revenue.
ECP® technology Embedded component packaging technology developed by AT&S in order to embed active and/or passive components inside printed circuit boards (® registered trademark AT 255868).
Embedded die packaging Technology used to embed active and passive components in a printed circuit board.
Embedded interposer Interconnection between the printed circuit board and substrate with embedded components, to compen-sate different structure levels.
Embedding Integrating active and/or passive electronic components inside printed circuit boards.
Glossary 3
Ex-dividend date If shares are purchased on the ex-dividend date, there is no entitlement to dividends.
Factoring A company (supplier, creditor) transfers accounts receivable from one or several debtors to a financial institu-tion or special institution (factor) before the due date.
Fan-out wafer/panel-level fan-out “Fan-out” is a technology in which additional wiring layers are applied to a chip, which extend beyond the chip area. This enlarged area thus enables better distribution of contacts to the printed circuit board. If these wiring layers are applied to wafers, this is referred to as “wafer-level fan-out”. If the wiring layers are pro-duced on a panel (as used in substrate production), it is called “panel-level fan-out”. Finished wafers or panels mounted with chips are then singulated and tested.
The key advantage of fan-out is the substitution of substrates for specific applications (mobile devices). This allows further miniaturisation as well as lower system costs and better signal propagation properties. The advantage of the panel-level fan-out packaging technology compared with wafer-level fan-out technology is reflected in significantly lower production costs. The panel-level fan-out technology is currently still in the R&D phase. AT&S is, among others, part of a European R&D consortium on panel level fan-out.
Foreign exchange (FX) Conversion from one currency into another.
Functional integration Refers to the integration of several functions of an electronic system in a module.
Good corporate citizenship Civic engagement in and by companies that follow a mid and long-term corporate strategy based on respon-sible business operations and which, as a “good citizen”, are actively engaged even beyond their business activities in the local community, for example, in environmental or cultural pursuits.
HDI printed circuit boards Printed circuit boards with structures smaller than 100 micrometres (0.1 mm) – high density interconnection.
Hedging Financial transactions providing protection against risks such as exchange rate or interest rate fluctuations.
IC substrates IC substrates are multi-layered, electrically conducting circuit substrates for silicon semiconductors also known as chips or integrated circuits/ICs and serve as the connection between the chip(s) and the main printed circuit board.
IFRS International Financial Reporting Standards are the international accounting rules which are mandatory for AT&S as an exchange-listed company.
IGBT applicators An insulated-gate bipolar transistor (IGBT) is a semiconductor component used in power electronics.
148 AT&S Annual Report 2016/17
4 AT&S Annual Report 2016/17
IIA standard Standards for measures and the assessment of the quality of internal auditing specified by the Institute of Internal Auditors (IIA).
Intellectual property In contrast to tangible property, intellectual property is the right to intangible property such as a technical invention.
Internet of Things A trend based on how internet-connected devices are used to improve the exchange of data, automate com-plex processes in industry and generate valuable information.
IRR The Innovation Revenue Rate represents the share of total revenue generated from products that feature new, innovative technologies and have been introduced in the past three years.
ISIN Alphanumerical securities identification number (International Securities Identification Number).
ISO International Organisation for Standardisation.
Key Performance Indicators Key indicators for managing corporate targets and measuring progress and/or achievement.
Lean Six Sigma Management system for efficiency and process improvement. The core element of the system is the descrip-tion, measurement, analysis, improvement and monitoring of business processes using statistical methods.
L/S Line/space: line width and spacing of circuit paths.
LTI Long-term incentive: long-term-oriented bonus system.
Microvia Microvias are minute holes drilled by a laser to generate the electrical connection between the layers in a multilayer circuit board.
Miniaturisation Trend towards even more densely printed circuit board structures on ever smaller surfaces.
Modularisation Individual components packaged into modules.
MOSFET Metal-oxide semiconductor field-effect transistor which amplifies or converts electronic signals.
149Glossary
4 AT&S Annual Report 2016/17
IIA standard Standards for measures and the assessment of the quality of internal auditing specified by the Institute of Internal Auditors (IIA).
Intellectual property In contrast to tangible property, intellectual property is the right to intangible property such as a technical invention.
Internet of Things A trend based on how internet-connected devices are used to improve the exchange of data, automate com-plex processes in industry and generate valuable information.
IRR The Innovation Revenue Rate represents the share of total revenue generated from products that feature new, innovative technologies and have been introduced in the past three years.
ISIN Alphanumerical securities identification number (International Securities Identification Number).
ISO International Organisation for Standardisation.
Key Performance Indicators Key indicators for managing corporate targets and measuring progress and/or achievement.
Lean Six Sigma Management system for efficiency and process improvement. The core element of the system is the descrip-tion, measurement, analysis, improvement and monitoring of business processes using statistical methods.
L/S Line/space: line width and spacing of circuit paths.
LTI Long-term incentive: long-term-oriented bonus system.
Microvia Microvias are minute holes drilled by a laser to generate the electrical connection between the layers in a multilayer circuit board.
Miniaturisation Trend towards even more densely printed circuit board structures on ever smaller surfaces.
Modularisation Individual components packaged into modules.
MOSFET Metal-oxide semiconductor field-effect transistor which amplifies or converts electronic signals.
Glossary 5
mSAP / SAP Modified semi-additive process or semi-additive process
In the conventional, subtractive process in printed circuit board production, a thick copper layer is patterned on a laminate using a photomask. Copper is then selectively stripped by etching (subtraction). In the mSAP process, which allows smaller line/space widths, only a very thin copper layer is applied to the laminate and patterned using a photo mask. Another copper layer is then selectively plated onto the patterned areas. In the SAP process, an even thinner and more homogeneous copper layer is applied and a second photomask is used in order to enable even smaller line/space widths than in mSAP.
Multilayer Multilayer printed circuit board.
Net CAPEX Capital expenditure net of receipts from the disposal of property, plant and equipment and intangible assets.
Net debt For calculation, please refer to the key data section in the Group Management Report.
Net gearing For calculation, please refer to the Group Management Report.
NOPAT Net operating profit after tax represents annual profit adjusted to exclude net finance costs. For calculation, please refer to the Group Management Report.
OEMs Original Equipment Manufacturers – manufacturers of original electronic end devices.
OHSAS 18001 Occupational Health and Safety Assessment Series.
Original Device or Design Manufacturer Manufactures products commissioned by other companies, some of which are developed in-house, that are ultimately sold under the brand name of the customer.
OSATs Outsourced assembly and test: manufacturers that offer integrated IC (Integrated Circuit) Packaging solutions (see Advanced Packaging).
Prime Market Stocks admitted to trading on the Vienna Stock Exchange on the Official Market or Second Regulated Market and subject to additional, more stringent requirements.
Promissory note loan A large bond-like loan with a medium to long term. The lenders are usually banks or insurance companies. The loan is certified with the borrower's promissory note.
Ramp-up Start-up phase of a manufacturing plant.
150 AT&S Annual Report 2016/17
6 AT&S Annual Report 2016/17
R&D Research and Development.
Retail bonds Corporate bonds whose subscribers can be either private or institutional investors.
RFID Radio Frequency Identification – technology for transceiver systems for the automatic and contactless identi-fication of objects using radio waves.
Risk exposure The situation of being exposed to risk. Used as a factor in risk management to indicate risks: a combination of the potential impact and the probability of a risk occurring.
ROCE Return on capital employed measures how effectively a company generates returns from the capital it uses. For calculation, please refer to the Group Management Report.
Sale-and-lease-back Special form of leasing: an enterprise sells property or moveable assets to a leasing company and leases it back for use in the business.
Sourcing strategy Strategy for sourcing goods and services for a company from various suppliers.
Stock options Options to buy or sell particular stocks.
Structure densities Line widths/spaces in relation to unit area.
Swap A swap is a derivative financial instrument under which future payment streams are exchanged. Typically, currencies (currency swap) or fixed and variable interest payments (interest swap) are exchanged.
System in Board (SiB) When passive and/or active components are embedded inside printed circuit boards.
System in Package (SiP) Consists of one or more semiconductors and passive components that form a system or a functional block.
Tier 1 manufacturers Automotive suppliers.
Transistor Electronic semiconductor component to control voltages and currents.
WACC Weighted Average Cost of Capital represents the average cost that a company has to pay to obtain equity or debt capital.
151Glossary
6 AT&S Annual Report 2016/17
R&D Research and Development.
Retail bonds Corporate bonds whose subscribers can be either private or institutional investors.
RFID Radio Frequency Identification – technology for transceiver systems for the automatic and contactless identi-fication of objects using radio waves.
Risk exposure The situation of being exposed to risk. Used as a factor in risk management to indicate risks: a combination of the potential impact and the probability of a risk occurring.
ROCE Return on capital employed measures how effectively a company generates returns from the capital it uses. For calculation, please refer to the Group Management Report.
Sale-and-lease-back Special form of leasing: an enterprise sells property or moveable assets to a leasing company and leases it back for use in the business.
Sourcing strategy Strategy for sourcing goods and services for a company from various suppliers.
Stock options Options to buy or sell particular stocks.
Structure densities Line widths/spaces in relation to unit area.
Swap A swap is a derivative financial instrument under which future payment streams are exchanged. Typically, currencies (currency swap) or fixed and variable interest payments (interest swap) are exchanged.
System in Board (SiB) When passive and/or active components are embedded inside printed circuit boards.
System in Package (SiP) Consists of one or more semiconductors and passive components that form a system or a functional block.
Tier 1 manufacturers Automotive suppliers.
Transistor Electronic semiconductor component to control voltages and currents.
WACC Weighted Average Cost of Capital represents the average cost that a company has to pay to obtain equity or debt capital.
Glossary 7
Wafer Circular, thin slices, usually made from crystalline silicon that are used as a base material for manufacturing integrated circuits (chips) or other microelectronic components.
Wafer-level packaging In this technology, packaging materials and wiring layers as well as solder balls are manufactured directly on a wafer, with wafer singulation performed thereafter.
In conventional methods, the wavers are first singulated into chips and then packaged individually.
Wearable devices Electronic devices that can be worn.
152 AT&S Annual Report 2016/17
AT & S Austria Technologie & Systemtechnik Aktiengesellschaft Fabriksgasse 13 8700 Leoben Austria Phone: +43 (0)3842 200-0 [email protected] www.ats.net
Published by and responsible for content AT & S Austria Technologie & Systemtechnik Aktiengesellschaft Fabriksgasse 13 8700 Leoben Austria
Concept and design (general section) Mensalia Unternehmensberatungs GmbH, Vienna
Photos Andreas Jakwerth: pages 7, 9, 10 AT&S: cover, pages 1, 10, 11, 18, 26, 31, 46, 88 Daniel Novotny: page 19 Helmut Jokesch: page 31 Klaus Vyhnalek: page 31 Werbeagentur dmp: pages 4, 5
Illustrations AT&S: page 74 Mensalia Unternehmensberatungs GmbH: pages 12–17 Werbeagentur dmp: pages 59, 70
Disclaimer This report contains forward-looking statements which were made on the basis of the information available at the time of publication. These can be identified by the use of such expressions as “expects”, “plans”, “an-ticipates”, “intends”, “could”, “will”, “aim” and “estimation” or other similar words. These statements are based on current expectations and assumptions. Such statements are by their very nature subject to known and unknown risks and uncertainties. As a result, actual developments may vary significantly from the for-ward-looking statements made in this report. Recipients of this report are expressly cautioned not to place undue reliance on such statements. Neither AT&S nor any other entity accept any responsibility for the cor-rectness and completeness of the forward-looking statements contained in this report. AT&S undertakes no obligation to update or revise any forward-looking statements, whether as a result of changed assumptions or expectations, new information or future events.
Percentages and individual items presented in this report are rounded, which may result in rounding differ-ences.
Formulations attributable to people are to be understood as gender-neutral.
This report in no way represents an invitation or recommendation to buy or sell shares in AT&S.
The report is published in German and English. In case of doubt, the German version is binding.
No responsibility accepted for errors or omissions.
Published on 9 June 2017
Contact/Imprint
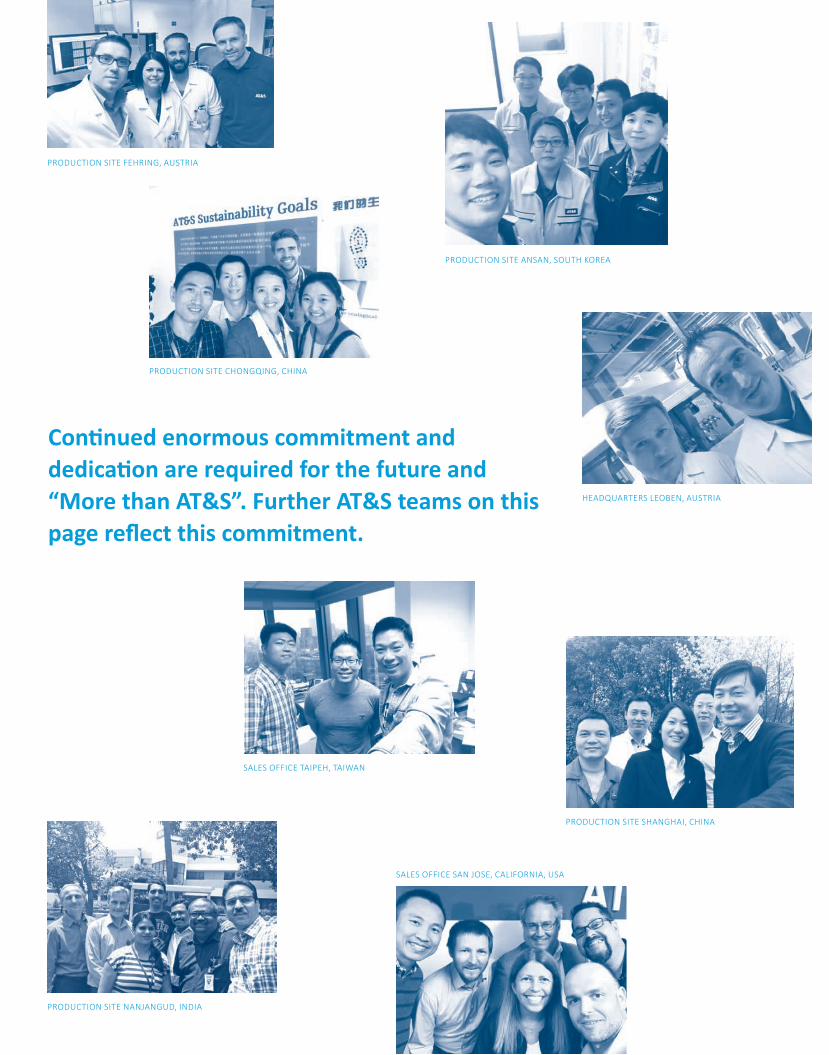
PRODUCTION SITE FEHRING, AUSTRIA
PRODUCTION SITE CHONGQING, CHINA
PRODUCTION SITE ANSAN, SOUTH KOREA
HEADQUARTERS LEOBEN, AUSTRIA
SALES OFFICE TAIPEH, TAIWAN
PRODUCTION SITE NANJANGUD, INDIA
SALES OFFICE SAN JOSE, CALIFORNIA, USA
Continued enormous commitment and dedication are required for the future and “More than AT&S”. Further AT&S teams on this page reflect this commitment.
PRODUCTION SITE SHANGHAI, CHINA

Related Documents