More on risk and return More on risk and return

More on risk and return Objective Describe Robert Haugen’s experiments on the risk-return relationship in the stock market.
Dec 21, 2015
Welcome message from author
This document is posted to help you gain knowledge. Please leave a comment to let me know what you think about it! Share it to your friends and learn new things together.
Transcript

More on risk and returnMore on risk and return

ObjectiveObjective
Describe Robert Haugen’s experiments on the risk-return relationship in the stock market

OutlineOutline
Experiment 1
Experiment 2
Experiment 3
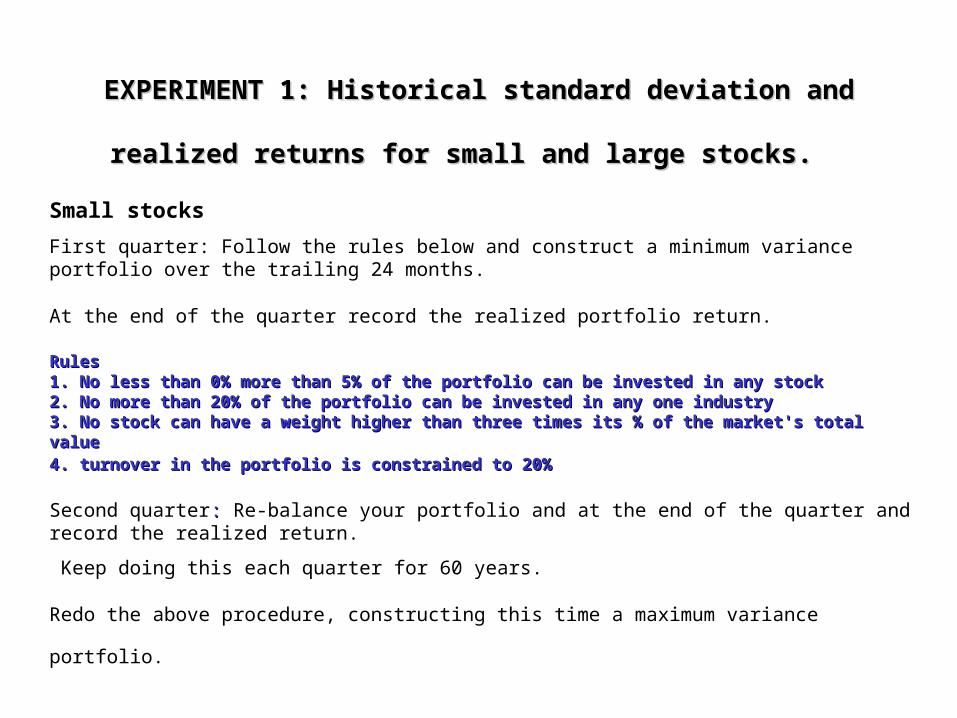
EXPERIMENT 1: Historical standard deviation and realized EXPERIMENT 1: Historical standard deviation and realized
returns for small and large stocks.returns for small and large stocks. Small stocks
First quarter: Follow the rules below and construct a minimum variance portfolio over the trailing 24 months.
At the end of the quarter record the realized portfolio return.
RulesRules 1. No less than 0% more than 5% of the portfolio can be invested in any stock1. No less than 0% more than 5% of the portfolio can be invested in any stock 2. No more than 20% of the portfolio can be invested in any one industry2. No more than 20% of the portfolio can be invested in any one industry 3. No stock can have a weight higher than three times its % of the market's total value3. No stock can have a weight higher than three times its % of the market's total value 4. turnover in the portfolio is constrained to 20%4. turnover in the portfolio is constrained to 20%
Second quarter: : Re-balance your portfolio and at the end of the quarter and record the realized return.
Keep doing this each quarter for 60 years.
Redo the above procedure, constructing this time a maximum variance portfolio.

EXPERIMENT 1: Historical standard deviation and realized EXPERIMENT 1: Historical standard deviation and realized returns for small and large stocks (cont’d).returns for small and large stocks (cont’d).
Large stocks
Redo the above procedure for large stocks as well.

Observed relationship between historical minimum variance portfolios and average annual returns of American stocks (1928 - 1992)
Averageannualizedreturn
standarddeviation
Trend Trend lineline
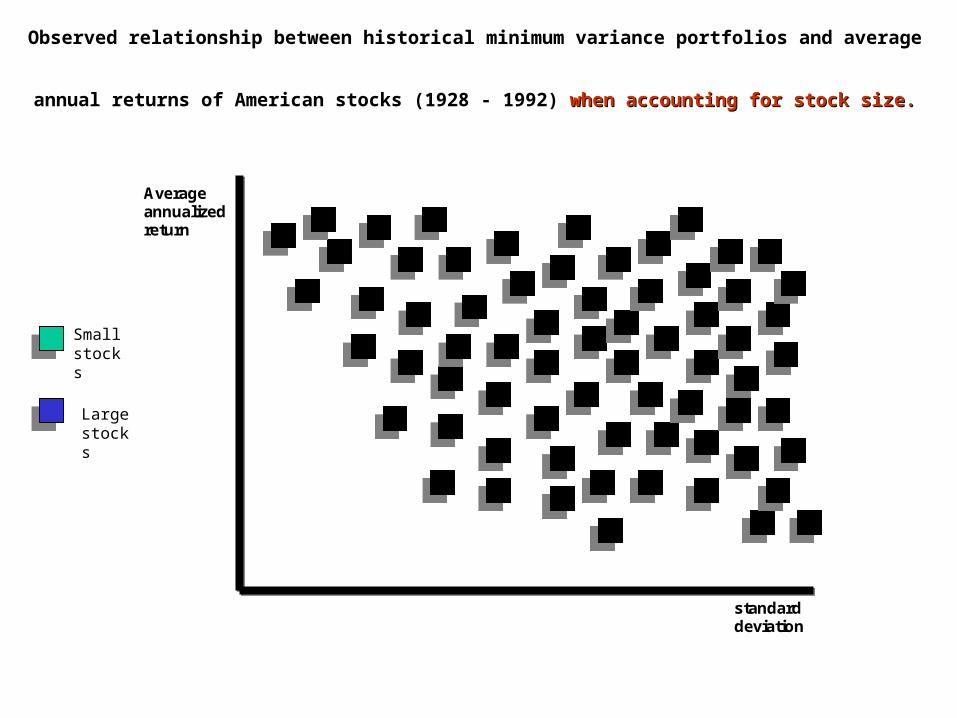
Observed relationship between historical minimum variance portfolios and average annual returns of
American stocks (1928 - 1992) when accounting for stock size.when accounting for stock size.
Averageannualizedreturn
standarddeviation
Small stocks
Large stocks

Observed relationship between historical minimum variance portfolios and average annual returns of
American stocks (1928 - 1992) when accounting for stock size.when accounting for stock size.
Averageannualizedreturn
standarddeviation
Small stocks
Large stocks
Trend lineTrend line
Trend lineTrend line

Observed relationship between historical maximum variance portfolios and average annual
returns of American stocks (1928 - 1992) when accounting for stock size.when accounting for stock size. Averageannualizedreturn
standarddeviation
Small stocks
Large stocks
Trend lineTrend line
Trend lineTrend line
CommentsComments
There is an observedan observed direct relationships between risk and returns across all stocks.
When splitting the stocks into large and small, the observedobserved
relationship becomes inverse.

EXPERIMENT 2: The relative performance of the minimum variance EXPERIMENT 2: The relative performance of the minimum variance
portfolioportfolio Calculate the minimum variance portfoliominimum variance portfolio just as in EXPERIMENT 1, without accounting for size.
Each quarter calculate the difference between the realized return of the portfolio and the realized return of the market index (S&P 500).market index (S&P 500).
Keep doing this for over 60 years.
In the end, calculate the cumulative difference of return between the minimum variance portfoliominimum variance portfolio and the market indexmarket index year by year.

Cumulative difference in returns between the minimum variance portfolio and the Cumulative difference in returns between the minimum variance portfolio and the
market indexmarket index Cumulativedifference inreturn
0%
20%
- 30%
1940 1950 1960 1970 1980 19901930
Since the 1970s, the minimum variance portfolio has outperformed the market index !

CommentsComments
In the 1920s...In the 1920s...
It was fashionable to invest in the stock market.
After several years of solid economic growth, investing in expensiveexpensive stocks had become a fad.
The crash market of 1929 ended the growth stocks craze.

CommentsComments
In the 1930s, 1940s, and 1950s...In the 1930s, 1940s, and 1950s...
Graham and Dodd's Security Analysis was the bible of investing.
The common wisdom said invest only in value stocks, that is, stocks with good current performance.
Trying to predict growth in a reliable manner was considered impossible.
Value stocks = good stocks. Value stocks = good stocks.
Growth stocks = speculative stocks.Growth stocks = speculative stocks.
Tedious research had to be done in order to screen out overpriced stocks.
CommentsComments
In the 60s, 70s and 80s…In the 60s, 70s and 80s…
Economists discovered that markets are efficient, hence its impossible to beat the market.
Growth (expensive) stocks were not overpriced because their earnings were expected to grow long and strong into the future.
Their volatility of return was obviously higher because they were considered riskier.
CAPM and the market efficiency theory spawned hundreds of mutual and
index funds.

CommentsComments
In the 1990s...In the 1990s...
Technology stocks become the object of desire.
Dotcoms with no positive earnings on record sold at astronomical high prices.

EXPERIMENT 3: Historical performance of small and large stocks in EXPERIMENT 3: Historical performance of small and large stocks in relation to their market risk.relation to their market risk.
Divide stocks into several portfolios from small to large.
Calculate the market beta of each portfolio based on last year's data.
At the end of the year, record the realized return for each portfolio
Next year, re-group the stocks according to size, re-calculate the beta of each portfolio, and record end-of-year returns.
Keep doing this for 50 years (1940-1990).

Averageannualizedreturn
Observedbetas
0.5 1 1.5
Relationship between beta and portfolio returnRelationship between beta and portfolio return
Trend line
Averageannualizedreturn
Observedbetas
0.5 1 1.5
Large stocks
Small stocks
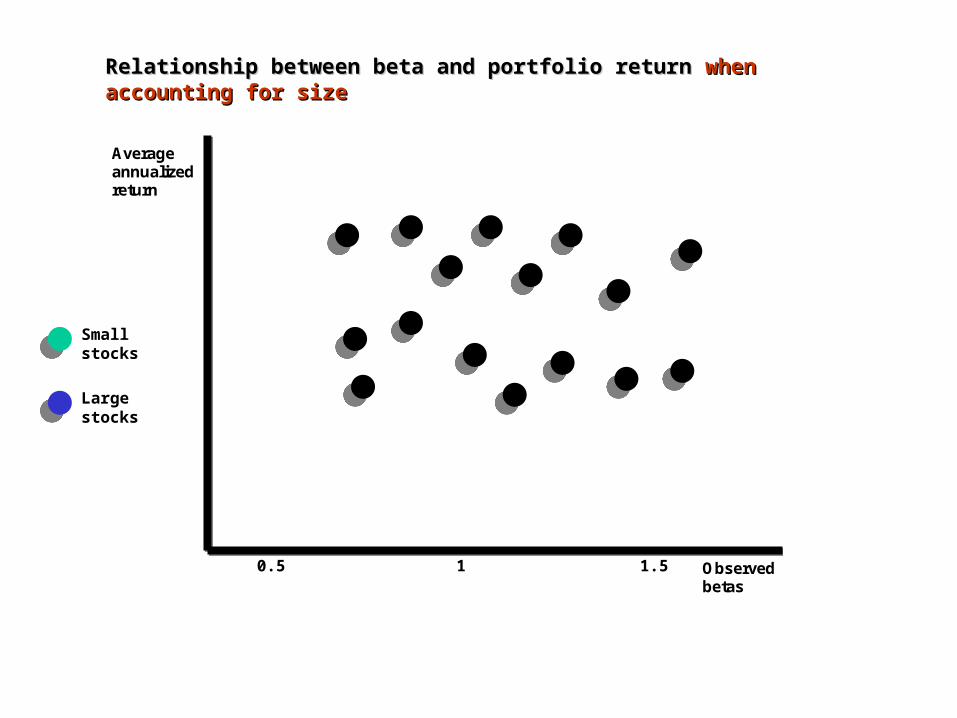
Relationship between beta and portfolio return Relationship between beta and portfolio return when accounting for sizewhen accounting for size

Averageannualizedreturn
Observedbetas
Relationship between beta and portfolio return Relationship between beta and portfolio return when accounting for sizewhen accounting for size
Large stocks
Small stocks
0.5 1 1.5
Trend line
Trend line

DiscussionDiscussion
When ignoring size, there is a direct relationship between average beta and realized portfolio returns.
When accounting for size, inside each size class the relationship becomes inverse.
What the theory labels a risk premiumrisk premium appears to be a liquidity liquidity premium.premium.

Concluding remarks: Is CAPM wrong?Concluding remarks: Is CAPM wrong?
Not necessarily.
CAPM says there is a direct relationship between expectedexpected betabeta and required returnsrequired returns.
What we see is an inverse relationship between observed betaobserved beta and realized returnsrealized returns.
CAPM could be right, but markets could be inefficient, that is, realizations do not equal expectations in the long run.
However, we cannot observe expectations, and hence we cannot dissociate CAPM from market efficiency and tell which one is wrong.
Related Documents