More on regression Speci es richn ess pH Humidi ty Light Tempe ratur e Organi c matter conten t Speci es richn ess pH Humidi ty Light Tempe ratur e Organi c matter conten t Is it possible to infer causal relationships between model drivers from regression analysis? Is it possible to compare the goodness of different models? Is it possible to quantify the influence of different drivers?

More on regression Species richness pH Humidity Light Temper ature Organic matter content Species richness pH Humidity Light Temper ature Organic matter.
Dec 14, 2015
Welcome message from author
This document is posted to help you gain knowledge. Please leave a comment to let me know what you think about it! Share it to your friends and learn new things together.
Transcript
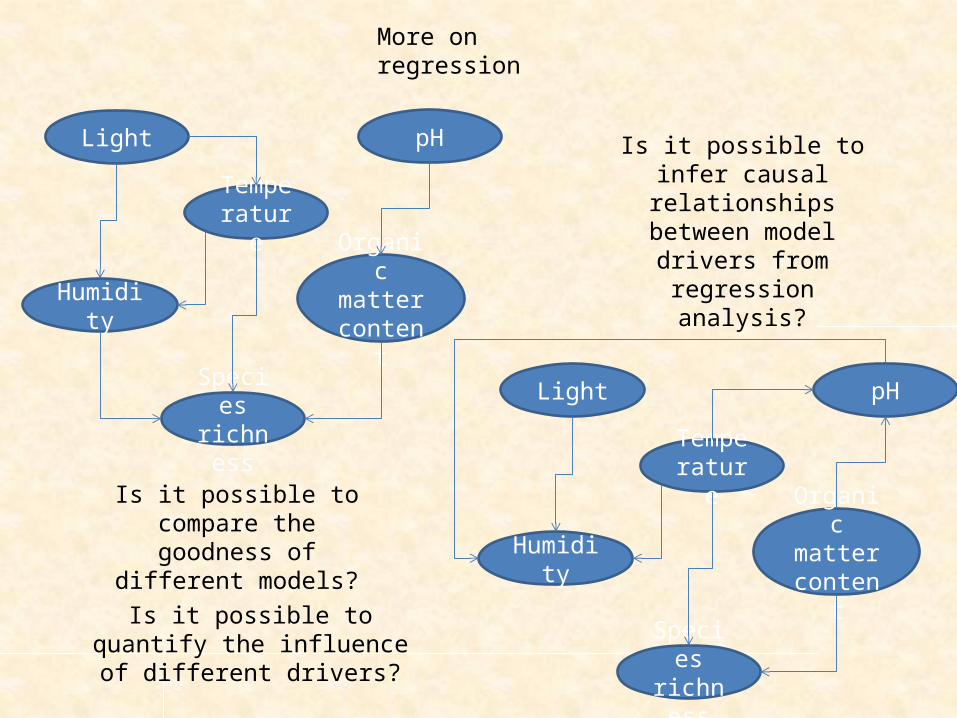
More on regression
Species richness
pH
Humidity
Light
Temperature
Organic matter content
Species richness
pH
Humidity
Light
Temperature
Organic matter content
Is it possible to infer causal relationships between
model drivers from regression analysis?
Is it possible to compare the goodness of different
models?
Is it possible to quantify the influence of different drivers?

Path analysis and linear structure models (Structure equation modelling SEM)
Y
X3X2 X4X1
e
Multiple regression
YX3
X2
X4X1
ee
e
e
e
Path analysis tries to do something that is logically impossible, to derive causal relationships from sets of observations.
Path analysis defines a whole model and tries to separate correlations into direct and indirect effects
eXaXaXaXaaY 443322110
The error term e contains the part of the variance in Y that is not explained by the model. These errors are called residuals
Regression analysis does not study the relationships between the predictor
variables
X Z
Y
WpXW pZX
pZYpXY
e e
e
e
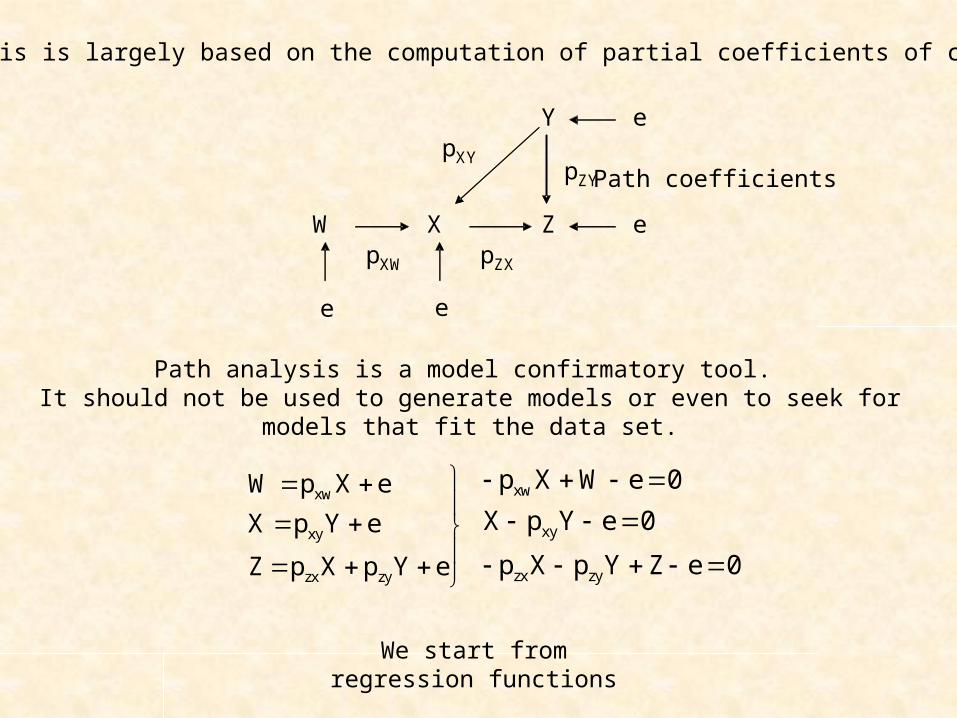
Path analysis is largely based on the computation of partial coefficients of correlation.
Path coefficients
Path analysis is a model confirmatory tool. It should not be used to generate models or even to seek for models that fit the data set.
xw
xy
zx zy
W p X e
X p Y e
Z p X p Y e
xw
xy
zx zy
p X W e 0
X p Y e 0
p X p Y Z e 0
We start from regression functions

Using Z-transformed values we get
X
W
Z
Y
pXW
pYX
pXZ pYZ
W xw X
X xy Y
Z zx X zy Y
W Y xw X Y Y
X W xy Y W W
Z W zx X W zy Y W W
X Z xy Y X X
X Y xy Y Y Y
Z Y zx X Y zy Y Y Y
WY xw XY
XW xy YW
ZW zx XW zy YW
XZ xy YX
XY
Z p Z e
Z p Z e
Z p Z p Z e
Z Z p Z Z eZ
Z Z p Z Z eZ
Z Z p Z Z p Z Z eZ
Z Z p Z Z eZ
Z Z p Z Z eZ
Z Z p Z Z p Z Z eZ
r p r
r p r
r p r p r
r p r
r
xy
ZY zx XY zy
p
r p r p
eZY = 0
ZYZY = 1
ZXZY = rXY
xw
xy
zx zy
p X W e 0
X p Y e 0
p X p Y Z e 0
Path analysis is a nice tool to generate hypotheses.It fails at low coefficients
of correlation and circular model structures.
𝒀=𝑹𝑷
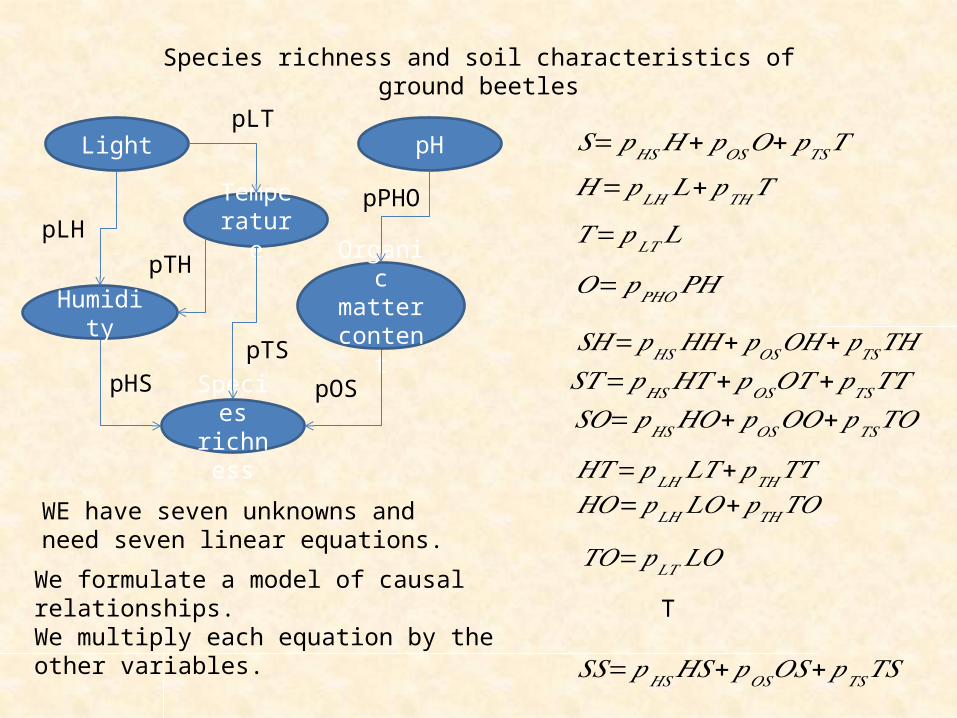
Species richness and soil characteristics of ground beetles
Species richness
pH
Humidity
Light
Temperature
Organic matter content
pLH
pLT
pTH
pPHO
pTSpHS pOS
𝑆=𝑝𝐻𝑆𝐻+𝑝𝑂𝑆𝑂+𝑝𝑇𝑆𝑇
𝐻=𝑝𝐿𝐻 𝐿+𝑝𝑇𝐻𝑇
𝑇=𝑝𝐿𝑇 𝐿
𝑂=𝑝𝑃𝐻𝑂 𝑃𝐻
𝑆𝐻=𝑝𝐻𝑆𝐻𝐻+𝑝𝑂𝑆𝑂𝐻+𝑝𝑇𝑆𝑇𝐻𝑆𝑇=𝑝𝐻𝑆𝐻𝑇+𝑝𝑂𝑆𝑂𝑇+𝑝𝑇𝑆𝑇𝑇𝑆𝑂=𝑝𝐻𝑆𝐻𝑂+𝑝𝑂𝑆𝑂𝑂+𝑝𝑇𝑆𝑇𝑂
𝐻𝑇=𝑝𝐿𝐻 𝐿𝑇+𝑝𝑇𝐻𝑇𝑇𝐻𝑂=𝑝𝐿𝐻 𝐿𝑂+𝑝𝑇𝐻 𝑇𝑂
𝑇𝑂=𝑝𝐿𝑇 𝐿𝑂
𝑆𝑆=𝑝𝐻𝑆𝐻𝑆+𝑝𝑂𝑆𝑂𝑆+𝑝𝑇𝑆𝑇𝑆
TWe formulate a model of causal relationships.We multiply each equation by the other variables.
WE have seven unknowns and need seven linear equations.

𝑆𝐻=𝑝𝐻𝑆𝐻𝐻+𝑝𝑂𝑆𝑂𝐻+𝑝𝑇𝑆𝑇𝐻𝑆𝑇=𝑝𝐻𝑆𝐻𝑇+𝑝𝑂𝑆𝑂𝑇+𝑝𝑇𝑆𝑇𝑇𝑆𝑂=𝑝𝐻𝑆𝐻𝑂+𝑝𝑂𝑆𝑂𝑂+𝑝𝑇𝑆𝑇𝑂
𝐻𝑇=𝑝𝐿𝐻 𝐿𝑇+𝑝𝑇𝐻𝑇𝑇𝐻𝑂=𝑝𝐿𝐻 𝐿𝑂+𝑝𝑇𝐻 𝑇𝑂
𝑇𝑂=𝑝𝐿𝑇 𝐿𝑂T
Species Light Temprature pHOrganic matter content
Humidity
10 3.97 3.42 4.16 4.30 3.3518 3.17 3.37 4.13 3.70 3.2125 3.38 3.40 4.05 3.75 3.3825 3.01 3.45 4.09 3.91 3.1829 2.67 3.30 3.93 3.95 3.0940 2.95 3.42 4.03 3.90 3.1720 3.04 3.30 4.06 4.01 3.0819 2.86 3.54 4.23 3.93 3.0523 3.24 3.31 4.14 4.12 3.0730 2.96 3.40 4.08 3.94 3.0523 3.74 3.52 4.25 4.14 3.0731 3.02 3.30 3.83 3.82 3.2714 3.09 3.42 3.96 3.89 3.1316 3.81 3.45 4.34 4.19 3.1424 3.68 3.49 4.33 3.38 3.4116 3.67 3.48 4.03 3.92 3.3713 3.47 3.44 3.93 3.55 3.34
Species Light Temprature pH Organic_matter_content Humidity
Species 0 0.019219 0.27591 0.34139 0.58463 0.36388Light -0.56068 0 0.07543 0.033355 0.56839 0.022344
Temprature -0.28026 0.44232 0 0.011559 0.71838 0.52892pH -0.24591 0.51755 0.59609 0 0.49036 0.75606
Organic_matter_content -0.14277 0.14892 -0.094463 0.1796 0 0.040297
Humidity -0.23502 0.54942 0.16418 -0.081422 -0.50144 0
Correlation matrix

Y pHS pOS pTS pLH pTH pLT pPHOrSH 1 rOH rTH 0 0 0 0rST rHT rOT 1 0 0 0 0rSO rHO 1 rTO 0 0 0 0rHT 0 0 0 rLT 1 0 0rHO 0 0 0 rLO rTO 0 0rTO 0 0 0 0 0 rLO 0rOT 0 0 0 0 0 0 rPHT
Y pHS pOS pTS pLH pTH pLT pPHO-0.23502 1 0.040297 0.16418 0 0 0 0-0.28026 0.52892 0.71838 1 0 0 0 0-0.14277 0.040297 1 -0.09446 0 0 0 00.52892 0 0 0 0.44232 1 0 0
0.040297 0 0 0 0.14892 -0.09446 0 0-0.09446 0 0 0 0 0 0.14892 00.71838 0 0 0 0 0 0 0.011559
𝑆𝐻=𝑝𝐻𝑆𝐻𝐻+𝑝𝑂𝑆𝑂𝐻+𝑝𝑇𝑆𝑇𝐻𝑆𝑇=𝑝𝐻𝑆𝐻𝑇+𝑝𝑂𝑆𝑂𝑇+𝑝𝑇𝑆𝑇𝑇𝑆𝑂=𝑝𝐻𝑆𝐻𝑂+𝑝𝑂𝑆𝑂𝑂+𝑝𝑇𝑆𝑇𝑂
𝐻𝑇=𝑝𝐿𝐻 𝐿𝑇+𝑝𝑇𝐻𝑇𝑇𝐻𝑂=𝑝𝐿𝐻 𝐿𝑂+𝑝𝑇𝐻 𝑇𝑂
𝑇𝑂=𝑝𝐿𝑇 𝐿𝑂T
pHS -0.21888pOS -0.13999pTS -0.06392pLH 0.473304pTH 0.319568pLT -0.63432pPHO 62.14897
𝑷=𝑹−𝟏𝒀
Species richness
pH
Humidity
Light
Temperature
Organic matter content
0.47
-0.63
0.31
62.2
-0.06-0.22 -0.14
𝒀=𝑹𝑷

N X A B C1 1.00 0.68 0.55 2.162 1.30 0.98 1.49 0.453 1.42 0.74 0.13 0.554 1.70 0.12 0.28 2.345 2.47 0.63 0.73 0.606 3.02 0.73 1.73 0.147 3.91 0.19 0.28 2.608 4.42 0.73 1.36 2.749 5.09 1.91 1.89 0.9910 5.27 1.49 0.96 1.2111 5.58 1.11 1.14 3.2012 6.34 0.84 1.31 1.0113 6.64 1.72 2.57 0.9214 7.32 0.87 1.17 3.21
R2 is the explained variance in abivariate comparison
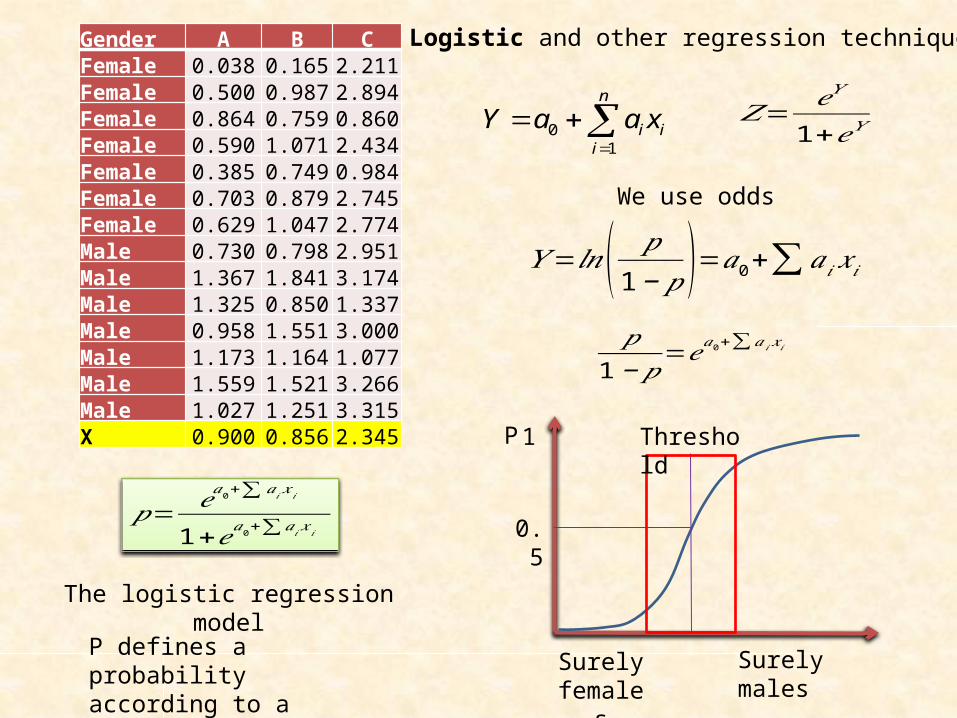
Logistic and other regression techniques
01
n
i ii
Y a a x
We use odds
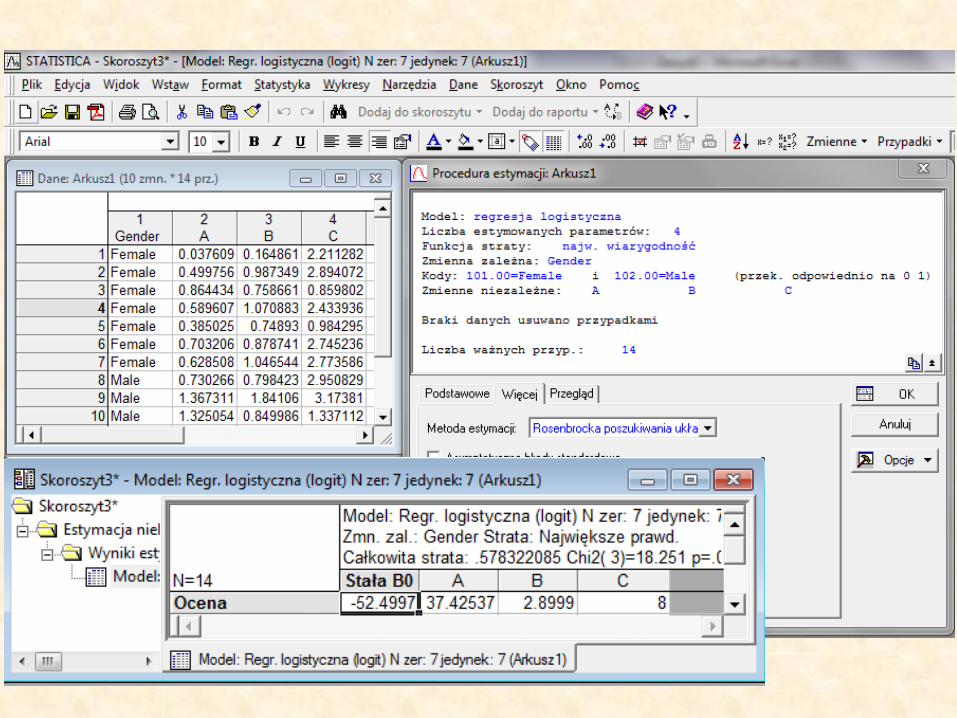
The logistic regression model
𝑍= 𝑒𝑌
1+𝑒𝑌
𝑌=𝑙𝑛( 𝑝1−𝑝 )=𝑎0+∑𝑎𝑖 𝑥𝑖
𝑝1−𝑝
=𝑒𝑎0+∑ 𝑎𝑖𝑥 𝑖
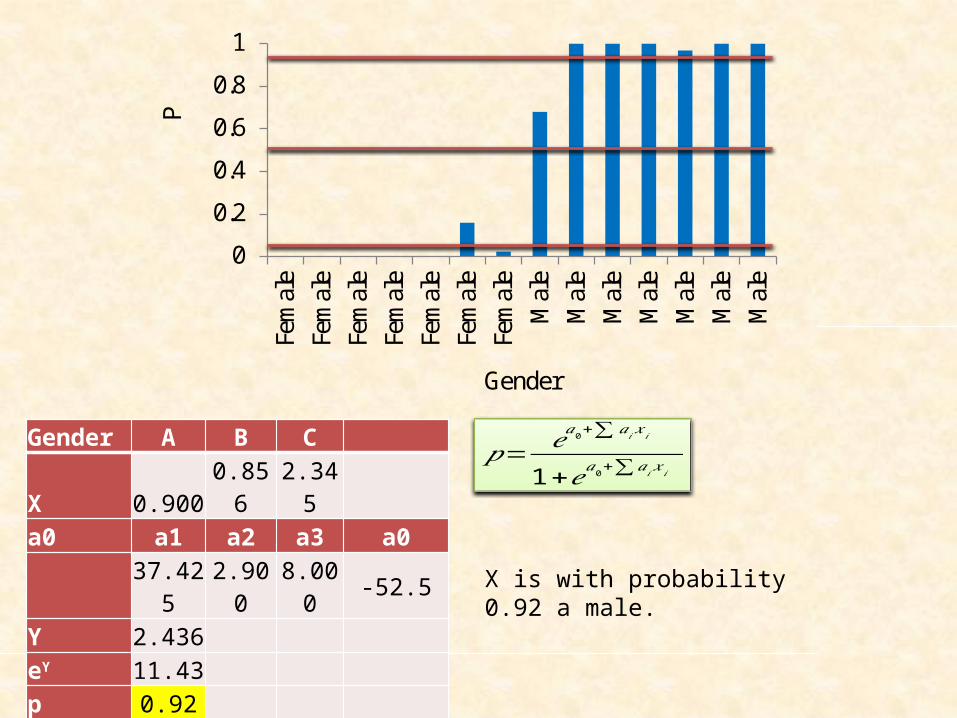
𝑝= 𝑒𝑎0+∑ 𝑎𝑖𝑥 𝑖
1+𝑒𝑎0+∑ 𝑎𝑖 𝑥 𝑖
P defines a probability according to a logistic model
1
0.5
Threshold
Surely malesSurely females
P
Gender A B CFemale 0.038 0.165 2.211Female 0.500 0.987 2.894Female 0.864 0.759 0.860Female 0.590 1.071 2.434Female 0.385 0.749 0.984Female 0.703 0.879 2.745Female 0.629 1.047 2.774Male 0.730 0.798 2.951Male 1.367 1.841 3.174Male 1.325 0.850 1.337Male 0.958 1.551 3.000Male 1.173 1.164 1.077Male 1.559 1.521 3.266Male 1.027 1.251 3.315X 0.900 0.856 2.345
0
0.2
0.4
0.6
0.8
1
Fem
ale
Fem
ale
Fem
ale
Fem
ale
Fem
ale
Fem
ale
Fem
ale
Mal
eM
ale
Mal
eM
ale
Mal
eM
ale
Mal
e
P
Gender
Gender A B CX 0.900 0.856 2.345a0 a1 a2 a3 a0
37.425 2.900 8.000 -52.5Y 2.436eY 11.43p 0.92 X is with probability 0.92 a male.
𝑝= 𝑒𝑎0+∑ 𝑎𝑖𝑥 𝑖
1+𝑒𝑎0+∑ 𝑎𝑖 𝑥 𝑖
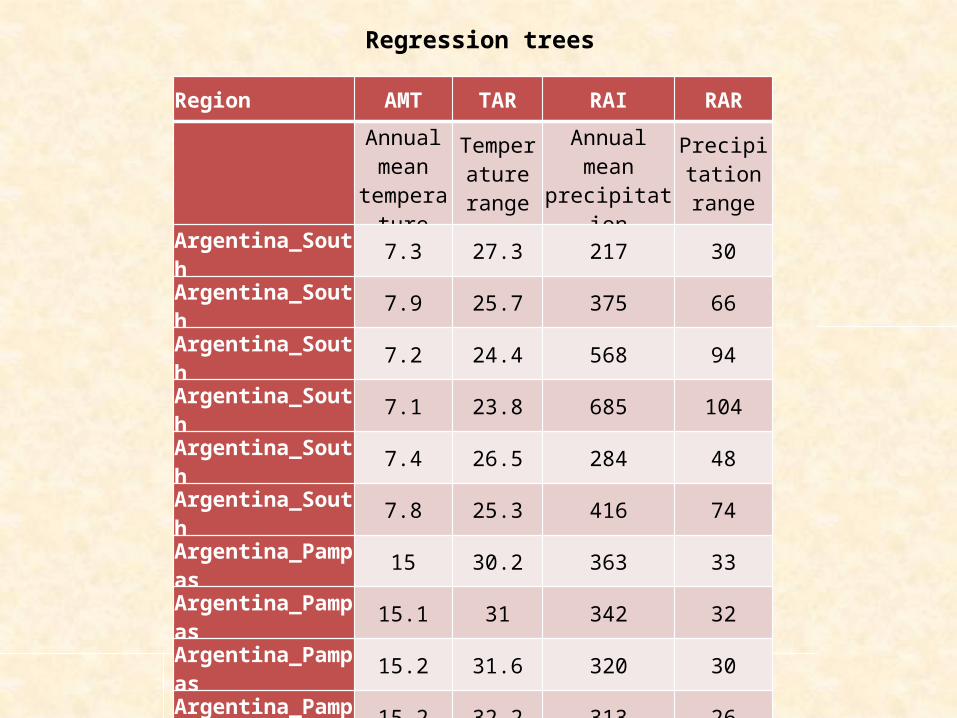
Regression trees
Region AMT TAR RAI RAR
Annual mean
temperature
Temperature range
Annual mean precipitation
Precipitation range
Argentina_South 7.3 27.3 217 30
Argentina_South 7.9 25.7 375 66Argentina_South 7.2 24.4 568 94Argentina_South 7.1 23.8 685 104Argentina_South 7.4 26.5 284 48Argentina_South 7.8 25.3 416 74Argentina_Pampas 15 30.2 363 33Argentina_Pampas 15.1 31 342 32Argentina_Pampas 15.2 31.6 320 30Argentina_Pampas 15.2 32.2 313 26Argentina_Pampas 14.7 32.7 275 27Argentina_Pampas 14.4 32.5 194 17Argentina_East 18.6 31.8 243 51Argentina_East 19.2 30 355 73

Root
Australia Central Other
12 29RAR < 14.5
AMT < 11.15
Argentina South
Other
6 23
AMT < 16.45
Argentina Pampas
Other
6 17
RAI < 380
Argentina East
Other
6 11
Regression tree analysis tries to groups cases according to predefined nominal and ordinal variables and returns variables levels that best group these cases.It uses a heuristic pattern seeking algorithm.

N X A B1 1.00 0.68 0.552 1.30 0.98 1.493 1.42 0.74 0.134 1.70 0.12 0.285 2.47 0.63 0.736 3.02 0.73 1.737 3.91 0.19 0.288 4.42 0.73 1.369 5.09 1.91 1.8910 5.27 1.49 0.9611 5.58 1.11 1.1412 6.34 0.84 1.3113 6.64 1.72 2.5714 7.32 0.87 1.17
What is the correlation between B and X?
y = 0.17x + 0.43R² = 0.29
0
0.5
1
1.5
2
2.5
3
0 2 4 6 8
XB
What is the pure correlation between B and X excluding the influence of A on both X and B?
We need the partial correlation of X and B.
A B
X
rAB
rBXrAX
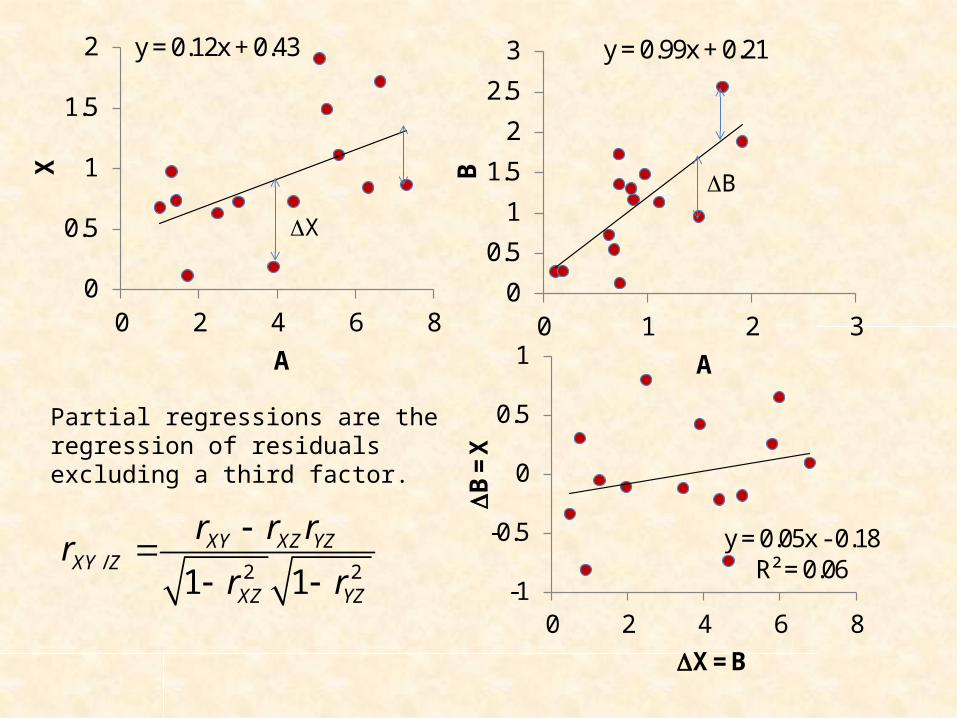
y = 0.12x + 0.43
0
0.5
1
1.5
2
0 2 4 6 8
X
A
y = 0.99x + 0.21
0
0.5
1
1.5
2
2.5
3
0 1 2 3
B
A
DB
DX
y = 0.05x - 0.18R² = 0.06
-1
-0.5
0
0.5
1
0 2 4 6 8
DB =
X
DX = B
Partial regressions are the regression of residuals excluding a third factor.
/ 2 21 1
XY XZ YZ
XY Z
XZ YZ
r r rr
r r
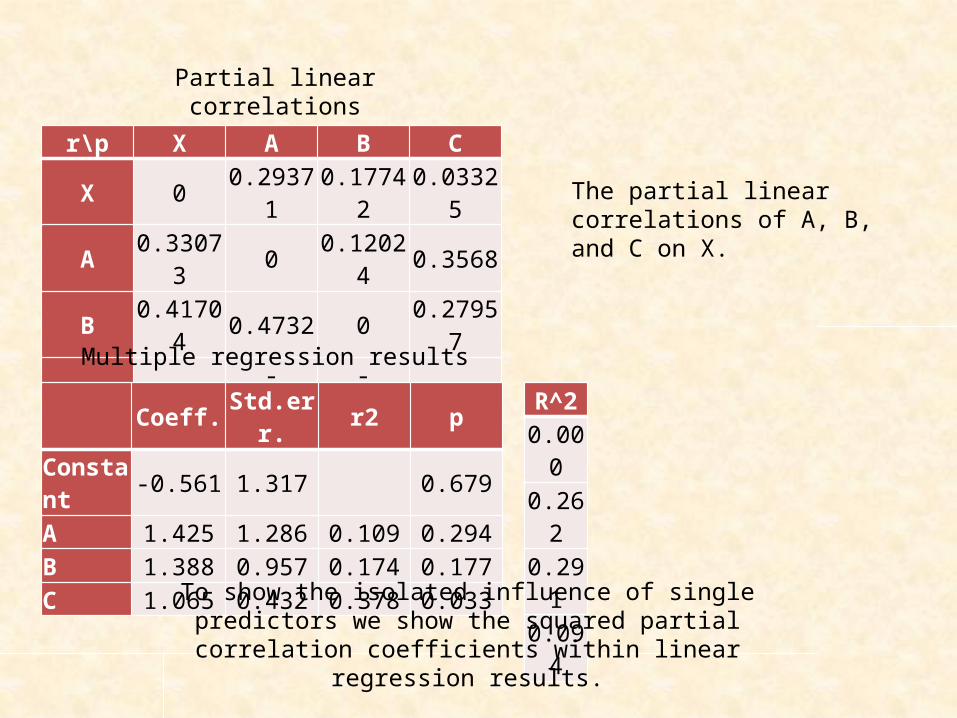
r\p X A B CX 0 0.29371 0.17742 0.03325A 0.33073 0 0.12024 0.3568B 0.41704 0.4732 0 0.27957C 0.61517 -0.29216 -0.33999 0
Coeff. Std.err. r2 pConstant -0.561 1.317 0.679A 1.425 1.286 0.109 0.294B 1.388 0.957 0.174 0.177C 1.065 0.432 0.378 0.033
R^20.0000.2620.2910.094
Partial linear correlations
The partial linear correlations of A, B, and C on X.
To show the isolated influence of single predictors we show the squared partial correlation coefficients within linear
regression results.
Multiple regression results
Related Documents


![FireResistanceInvestigationofSimpleSupportedRC ...concrete beams subjected to fire load. Kang et al. [10] in-vestigated the effect of thickness and moisture on temper-ature distributions](https://static.cupdf.com/doc/110x72/6100ce868f4a4529bf080886/fireresistanceinvestigationofsimplesupportedrc-concrete-beams-subjected-to-ire.jpg)