Working Paper 278 December 2011 More Money or More Development: What Have the MDGs Achieved? Abstract What have the MDGs achieved? And what might their achievements mean for any second generation of MDGs or MDGs 2.0? We argue that the MDGs may have played a role in increasing aid and that development policies beyond aid quantity have seen some limited improvement in rich countries (the evidence on policy change in poor countries is weaker). Further, there is some evidence of faster-than-expected progress improving quality of life in developing countries since the Millennium Declaration, but the contribution of the MDGs themselves in speeding that progress is—of course—difficult to demonstrate even assuming the MDGs induced policy changes after 2002. The paper concludes with reflections on what the experience of MDGs in terms of global goal setting has taught us and how things might be done differently if there were to be a new set of MDGs after 2015. Any MDGs 2.0 need targets that are set realistically and directly link aid flows to social policy change and to results. www.cgdev.org Charles Kenny and Andy Sumner

Welcome message from author
This document is posted to help you gain knowledge. Please leave a comment to let me know what you think about it! Share it to your friends and learn new things together.
Transcript

Working Paper 278December 2011
More Money or More Development: What Have the MDGs Achieved?
Abstract
What have the MDGs achieved? And what might their achievements mean for any second generation of MDGs or MDGs 2.0? We argue that the MDGs may have played a role in increasing aid and that development policies beyond aid quantity have seen some limited improvement in rich countries (the evidence on policy change in poor countries is weaker). Further, there is some evidence of faster-than-expected progress improving quality of life in developing countries since the Millennium Declaration, but the contribution of the MDGs themselves in speeding that progress is—of course—difficult to demonstrate even assuming the MDGs induced policy changes after 2002. The paper concludes with reflections on what the experience of MDGs in terms of global goal setting has taught us and how things might be done differently if there were to be a new set of MDGs after 2015. Any MDGs 2.0 need targets that are set realistically and directly link aid flows to social policy change and to results.
www.cgdev.org
Charles Kenny and Andy Sumner

More Money or More Development:What Have the MDGs Achieved?
Charles Kenny
Andy Sumner
With many thanks to Jonathan Karver for considerable research assistance. Thanks for comments on earlier drafts go to Barry Carin, Ben Leo, Justin Sandefur, David Wheeler, Owen Barder, Michael Clemens, and Richard Manning. Correspondence: [email protected] and [email protected]
CGD is grateful for contributions from the Norwegian Ministry of Foreign Affairs and the Swedish Ministry of Foreign Affairs in support of this work.
Charles Kenny and Andy Sumner. 2011. “More Money or Mored Development: What Have the MDGs Achieved.” CGD Working Paper 278. Washington, D.C.: Center for Global Development. http://www.cgdev.org/content/publications/detail/1425806
Center for Global Development1800 Massachusetts Ave., NW
Washington, DC 20036
202.416.4000(f ) 202.416.4050
www.cgdev.org
The Center for Global Development is an independent, nonprofit policy research organization dedicated to reducing global poverty and inequality and to making globalization work for the poor. Use and dissemination of this Working Paper is encouraged; however, reproduced copies may not be used for commercial purposes. Further usage is permitted under the terms of the Creative Commons License.
The views expressed in CGD Working Papers are those of the authors and should not be attributed to the board of directors or funders of the Center for Global Development.

1. INTRODUCTION ..................................................................................................... 1
2. INPUTS: MORE MONEY OR BETTER DEVELOPMENT POLICY? .................. 3
2A. GLOBAL RESOURCES MOBILIZED - AID ............................................ 4
2B. NATIONAL RESOURCES MOBILIZED .................................................. 5
2C. POLICY CHANGE ...................................................................................... 5
3. RESULTS: ASSESSING THE MDGS BY PROGRESS ON DEVELOPMENT .... 9
3A. HAVE INDICATORS IMPROVED? ........................................................ 15
3B. “ON-TRACK” VS “OFF-TRACK” ........................................................... 16
3C. IS PROGRESS FASTER PRE- OR POST- MDGS? ................................ 18
3D. IS PROGRESS FASTER THAN PREDICTED POST- MDGS? ............. 19
3E. DISTRIBUTION OF OUTCOMES ........................................................... 21
4. CONCLUSIONS...................................................................................................... 23
REFERENCES ............................................................................................................ 40


1
What have the MDGs achieved? And what might their achievements mean for any second
generation of MDGs or MDGs 2.0? It is a lot to ask of one legally toothless document,
silent on the necessary steps to achieve its declared goals, to dramatically and observably
change the course of global development -- however grand the signatories. Perhaps this is
particularly the case when specific targets in the Millennium Declaration largely repeated
language fashioned at previous UN summits over the course of the 1990s (and some,
including the goal of universal education repeated language from declarations as early as
1934). Nevertheless, a range of papers in the early 2000s estimated costs of achieving the
MDGs, while some suggested the policy changes that might be required. And repeated
MDG progress tracking exercises by the UN and the World Bank continue to utilize the
MDGs as a tool to advance reform of aid and development policy. All of this suggests a
widespread hope that the MDGs would make a real-world difference in speeding
development progress, so it is not unreasonable to ask if such progress has been achieved.
There is widespread agreement that the MDGs have placed broad-based poverty reduction
at the center of the development agenda at least in international discussions and policy
discourse (Watkins, 2011). If the benchmark of success is the number of donor reports and
poverty strategies written that include measures of MDG progress, or summit meetings that
highlight the MDGs, the Goals have been overwhelmingly more successful than the UN
development decades (Manning, 2009). More broadly, Figure 1 suggests that the MDGs
have become a considerable topic of discussion at least in books written English. The figure
reports on the number of times the phrases “GDP per capita” “Human Development
Index” and “Millennium Development Goals” have been mentioned in books published
between 1980 and 2006 as scanned by the Google Books project (which already includes
more than five percent of the books ever published) (Michel et al., 2011). “GDP per capita”
and “Human Development Index” are used as the ‘consensus development goals’ prior to
the MDGs. As can be seen, GDP per capita still leads, but the phrase “Millennium
Development Goals” has overtaken “Human Development Index” and, as of 2006, appears
to be rapidly closing on GDP per capita. This is no small accomplishment in terms of
framing the discussion –even while only five percent of Americans, six percent of Chinese
and one quarter of Norwegians surveyed have heard of the MDGs, according to the World
Values Survey (Manning, 2009).
At the same time, some of the constituent elements of the MDGs do not appear to be
gaining in terms of attention paid in English-language books. Figure 2 suggests the terms
“child mortality”, “maternal mortality”, “absolute poverty” or “school completion” have

2
become no more widely used since the MDGs were launched (for those viewing the figure in
black and white, from top to bottom the lines in 1980 at the left of the chart run maternal
mortality, child mortality, absolute poverty, and school completion).
Furthermore, the purpose of the MDGs was not merely or primarily to change thinking but
to change policies and outcomes. They were designed to “encourage sustainable pro-poor
development progress and donor support of domestic efforts in this direction” (Manning,
2009). Have they succeeded in this regard? Perhaps reflecting a greater impact on general aid
and development dialogue than discussion of specific development topics, the evidence in
favor of ‘donor support of domestic efforts’ is stronger than that in favor of ‘pro-poor
development progress.’ Perhaps again this should come as no surprise, given the Goals were
first compiled as OECD DAC targets (albeit DAC targets drawn from UN agreements of
the 1990s).
In light of the likely debate on a second generation of MDGs, here we ask:
a) Have the MDGs led to greater resource mobilization at both global and national
level and policy change by donors and governments? (ie more money)
b) What is the record on poverty reduction progress during the period of the MDGs?
(ie more development)
Note this paper asks if the MDGs as agreed might have had an impact on progress in the
areas covered. It does not discuss if the goals themselves were the right ones. There is a
considerable debate as to whether there should have been goals covering growth,
governance, violence or learning for example. There is no analysis of the potential negative
spillover effects of any greater focus that the MDGs achieved on their target areas in terms
of reduced attention to these other areas.1 Nor does the paper discuss the level of ambition
of the goals beyond a looking at the suitability of using ‘on track/off track’ measures as an
indicator of MDG impact. These issues are analyzed in the sibling paper, which discusses
some potential changes to the goals and a set of ‘straw-man’ targets for any MDGs 2.0 (see
Kenny & Sumner, 2011b). Finally, we focus our analysis on the development goals actually
enumerated in the Millennium Declaration:
“We resolve further: To halve, by the year 2015, the proportion of the world’s people whose
income is less than one dollar a day and the proportion of people who suffer from hunger
and, by the same date, to halve the proportion of people who are unable to reach or to
afford safe drinking water… To ensure that, by the same date, children everywhere, boys
and girls alike, will be able to complete a full course of primary schooling and that girls and
boys will have equal access to all levels of education…. By the same date, to have reduced
1 Having said that, the last decade has seen a considerable decline in war deaths and the number of major
civil conflicts ongoing worldwide suggesting the (unsurprising, perhaps) conclusion that the MDGs not
mentioning civil conflict was not itself a significant spark for such conflict, at the least.

3
maternal mortality by three quarters, and under-five child mortality by two thirds, of their
current rates… To have, by then, halted, and begun to reverse, the spread of HIV/AIDS,
the scourge of malaria and other major diseases that afflict humanity….”
While (even) these targets listed in the citation above have no legal weight, at least they were
in fact agreed by the heads of state –unlike the considerably longer list of targets and
indicators appended to the MDG process over the course of the year or so that followed the
declaration.2 (Although one could make the case that the MDGs were informally endorsed at
the UN Conference on International Financing for Development at Monterrey in 2002,
because funding commitments made on the basis of the MDGs were made there). If it is
difficult to find an impact on progress regarding these goals, it would surely be even harder
with the targets and indicators.
We use a range of approaches towards evaluating change from the pre- to post-MDG
period, including before and after comparisons in levels and changes, as well as before and
after changes controlling for initial conditions. By and large the approaches are driven by the
quality and extent of the data. And in all cases, we should emphasize at the outset that our
ability to make strong causal statements is considerably limited. We do not outline a
complete theory of change spanning from the Declaration at the UN through policy change
to outcome, nor do we test that theory using comprehensive multivariate analysis. At the
most, we can suggest if the pattern of data fails to contradict a story that suggests the MDGs
led to more aid and/or policy change which in turn led to improved outcomes.
We argue that the MDGs may have played a role in increasing aid, that development policies
beyond aid quantity have seen limited improvement in rich and poor countries alike, but that
there is some evidence of faster progress towards quality of life in developing countries since
the Millennium Declaration (a role for the MDGs themselves in speeding that progress is
less straightforward to demonstrate). The paper concludes with reflections on the experience
of the MDGs in terms of global goal setting and how things might be done differently if
there were to be a new set of MDGs post-2015.
This paper is structured as follows: Section 2 reviews what has actually changed – the money
or the policies. Section 3 assesses broad-based poverty reduction during the MDG era.
Section 4 concludes.
In this section we discuss if the MDGs have led to greater resource mobilization at both
global and national level.
2 See for a detailed MDG history Manning (2009)

4
Despite the fact there was no target for aid flows enumerated in the MDGs (a subject of
some criticism), given the MDGs’ evolution in the halls of the Organization for Economic
Cooperation and Development, it is unsurprising that the easiest case to make regarding the
impact of the MDGs may be with aid flows. Figure 3 tracks the course of global ODA since
1990. As can be seen, the 1990s were a period of stagnation in aid flows while the period
since the Millennium Declaration has seen resurgence in growth of aid flows. Between 2000
and 2009, ODA climbed from $72 to $128 billion (Levels were no higher than in 1991
measured as a percentage of rich country GDP, however).
Furthermore, aid flows shifted towards income groups and countries that faced some of the
greatest challenges meeting the MDGs. Figure 4 illustrates per capita aid flows to low and
middle income countries.3 As can be seen, the growth in global aid flows was focused on low
income countries, with per capita allocations rising from $27 to $47 between 2000 and 2009.
This reversed a dramatic decline in per capita flows to the poorest countries in the previous
ten years (although it is likely to reflect in part the graduation to middle income status of
some large countries with comparatively low per-capita aid receipts). Figure 5 shows how
ODA to countries in sub-Saharan Africa in particular also reversed a trend of decline from
1990-2000 to 2000-2010. Aid to the region increased from $12 billion to $42 billion 2000-
2009 –more than tripling.
Regression analysis on data from 1995 to 2009 also suggests that over that period smaller
population countries have received more ODA as a percentage of total GDP when
compared to larger countries.4 This would be consistent with a story that suggested donors
were attempting to maximize the number of countries that would meet the MDGs.
The sectoral allocation of aid flows also suggests a greater focus on ‘MDG priority areas.’
Sumner and Tiwari note that absolute bilateral social sector ODA spending doubled 2000-
2008 while productive sector ODA stagnated (see Figures 6 & 7) (Sumner & Tiwari, 2011).
Figure 8, which includes multilateral flows, suggests a somewhat more nuanced picture with
regard to health and education in particular, but still some evidence of an uptick in these
sectors’ share of total aid flows since 2000. Of course, aid is controlled by the same agencies
that agreed the DAC targets, suggesting that it is possible the aid shift to social sectors might
have occurred even absent the MDGS. Some evidence that the Goals themselves may have
played a role is suggested by Figure 9, which suggests the timing of the uptick was post-
3 With countries defined by their low or middle income status in each year –so that the sample of countries
in each category changes over the period.
4 The two years compared in the regression are 1995 and 2009. The log of population and the log of GDP
per capita are used to predict ODA as a % of GDP in the given year. The coefficient on the log of population is
negative with a greater magnitude in 2009 (β=-0.037) than in 1995 (β=-0.019) and nearly twice the magnitude for
the log of GDP per capita from 1995 to 2009 (β=-0.063 and β=-0.116, respectively). All results are significant at
a level of 0%. There are no controls applied.

5
MDG (2001), rather than earlier in response to the DAC targets. Furthermore, it is worth
noting the creation and funding of institutions including the Global Alliance for Vaccines
and Immunization as well as the US President’s Emergency Fund for AIDS Relief does
suggest there was increased donor attention to the MDG areas of child health and
combating HIV/AIDS in particular over the last ten years (although the second was
introduced by an administration with no love for the MDGs).
The MDGs did not suggest or necessarily require an increase in national spending on social
sectors (in that sense, the complaint about the lack of policy targets in MDG 8 applies to
developing countries as well). Nonetheless, one measure of the impact of the MDGs on
policies might have been an increase in such spending. Figures 10 & 11 look at changes in
domestic spending on health and education as a percentage of GDP in low and middle-
income countries. While it is hard to detect a trend, as GDP/capita grew in the vast majority
of developing countries during the last decade, there will have been an increase in absolute
per capita spending. One could also point to commitments made by African governments at
Abuja in 2001 to spend 15% of total government expenditure and the 2006 Maputo Plan of
Action on
Sexual and Reproductive Health Rights or more recently the AU’s Campaign on Accelerated
Reduction of Maternal Mortality in Africa (CARMMA) in 2009 which seeks to increase the
availability and use of health services.
The figures suggest that low income countries spend about 8% of their GDP on health and
education. This equals about $41 per capita (at market rates). Compare this to aid funding of
around $7.50 per capita for health and education in low income countries, it is clear that
domestic financing decisions would dominate outcomes, all else equal.
At the same time, the total increase in aid flows was, interestingly, about the increase called
for by MDG costing studies –which suggested that, were the MDGs to have been met by
2015, the effort would have cost around $50 billion (Moss, 2010). The increase also tracked
to MDG priorities, and had a focus on countries facing the biggest challenges in meeting the
MDGs. This might be considered to provide a reasonably good test of the assumed
centrality of aid resources to achieving the development outcomes outlined by the MDGs. If
so, we will see that the picture is not terribly reassuring on the link.
One indirect measure of donor policy change in order to further progress towards the
MDGs is to look at how much their policy statements reflect MDG priority areas. In this
regard, Fukuda-Parr (2010), p. 29, notes:
aid policy statements of major bilateral donors align with the MDG priorities only partially
and in varying ways… While multidimensional poverty – including income poverty,

6
education and health – is the stated central policy objective of almost all the bilateral aid
programs, some objectives such as maternal mortality and child survival receive surprisingly
limited emphasis.
Table 1 lists the top 10 most commonly selected MDG priorities in review of 20 donor
programmes. It is clear that there is a considerable adoption of MDG priority areas, however
there is equal or higher adoption of priorities not in the MDGs (although these topics are
mentioned in the broader Millennium Declaration). This might suggest that the impact of
the MDGs on donor policy priorities may have been limited. In turn, this suggests that
despite the fact that aid flows as a whole increased in the period after the Millennium
Declaration, the impact of the MDGs themselves may have been more limited than a simple
post hoc ergo propter hoc argument would suggest.
Table 1: MDG Priorities in Donor Program Strategies, 2003-2007
Core priority
MDG 1 - Income poverty 13/21 MDG 2 - Education 15/21 MDG 3, 4, 5 - Health 14/21 MDG 7 - Water and sanitation 10/21 MDG 6 – HIV/AIDS and global diseases 12/21 MDG 7 - Environment 19/21 Other Human rights 17/21 Governance 15/21 Peace and Security 15/21 Democracy 14/21
Source: Fukuda-Parr (2008, p. 11-13). Notes: Review of 20 bilateral aid programmes and one multilateral
(EU) via policy statements and MDG reports. See Fukuda-Parr (2010, p. 20-23) for full list of donor document
reviewed. ‘Core priority’ defined as ‘whether it mentioned an MDG priority as: an important objective or a core
strategic objective, such as constituting one of the “pillars” of the strategy; whether an action plan was developed
and articulated in a section of the document; and whether numerical targets were set. This effort sought to
distinguish rhetorical “priorities” from those that were actually being implemented’ (p.9).
Of course, as the language in MDG 8 makes clear, there is far more to developed country
support for progress towards the Goals than aid alone. While Goal 8 is notably free of
specific targets regarding rates of progress, it covers topics including trade, investment and
finance. Have donor governments improved their policy performance in these areas since
2000? One way to examine this issue is to look at the CGD Commitment to Development
Index, which rates donor countries on their policies that impact development prospects

7
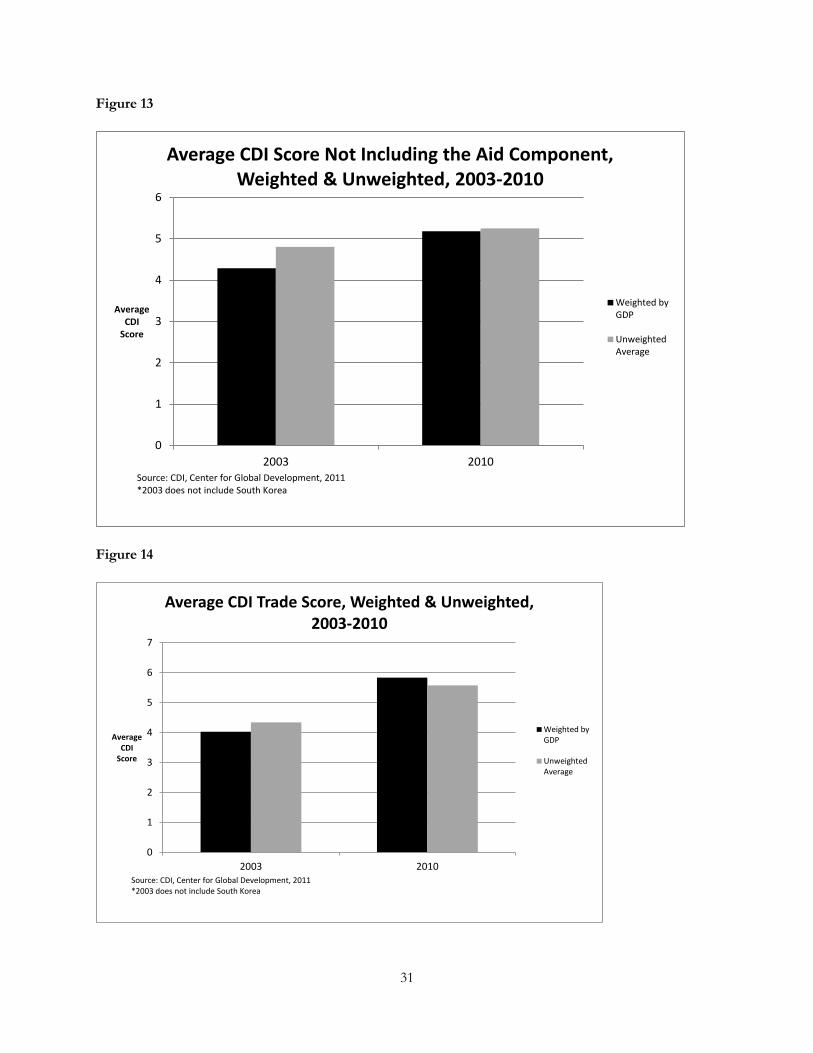
across a range of areas including aid, trade, investment, finance and migration.5 Figure 12
presents the CDI for 2003 and 2010 weighted and unweighted by GDP. As can be seen, the
trend is positive, especially for the larger countries in the index. One reason for this will be
increased aid commitments, which are part of index scoring. Stripping out the aid
component of the CDI, however, Figure 13 suggests that improvement has been more
widespread than aid alone, and Figure 14, examining the trade component, suggests
particular advances there.
On the side of developing countries, a recent UNDP/Columbia University study of 30
countries revealed that 25 had adopted and adapted the MDG goals or indicators (see
examples from Africa in Table 2). The UNDP (2010, p. 8) is not clear why these 30
countries were chosen for the survey but does say each of the 30 countries ‘had some form
of national process or institutional framework in place that was concerned with formulating,
implementing and/or monitoring programmes and policies in support of MDG
achievement’. This would mean it was not a random sample, and even if it were, there can be
considerable gaps between strategy articulation and policy implementation, of course.
UNDP (2010, p. 10) also notes that in 118 countries, 86% of countries had adapted the one
or more of the goals, their targets or associated indicators. In the sample of 30 countries, 25
had. Given the sample was chosen of countries with national MDG-related process this is
not so surprising. In fact one might surprised that all 30 had not adapted some of the MDGs
in some manner.
We can consider measures of actual policy change as well as strategies to examine if the
MDG period has been associated with improved policies in MDG priority areas. One
measure is provided by the World Bank’s Country Policy and Institutional Assessment
(CPIA) process, which (inter alia) scores low-income countries on their development policies
and the quality of their institutions, with scores from 0 (absent) to 6 (perfect). It does this
against a consistent questionnaire instrument to reduce subjectivity in the scores. Figure 15
reports on regional average scores on the CPIA in 2005 (the earliest available year) and 2009
weighted by country population. The scores suggest minor improvement in scores for East
Asia and Eastern Europe, but the broader story is one of stagnation –with no region seeing
an improvement greater than 0.2 on a 0 to 6 scale. The Social Inclusion index of the CPIA is
designed to measure policy efforts towards gender equality, equity of public resource use,
building human resources, social protection and labor and policies and institutions for
environmental sustainability. Figure 16 reports on regional scores and, once again, there is
no evidence of strongly improved outcomes.
We have some measures of health sector effort that can complement these more general
measures of policy quality with reference to the child and maternal mortality goals: they
involve birth attendance by skilled health professionals (Figure 17) and vaccination rates
(Figures 18 & 19). There has been a slight rise in skilled attendance –by about six percentage
5 See www.cgdev.org/section/initiatives/_active/cdi/

8
Table 2. MDG national ownership in selected sub-Saharan African countries
Country National processes of MDG localisation
Adaption of goals or targets
Adaption of indicators
Botswana Country’s Vision 2016 and National Development Plan for 2009-2016 matches the MDGs.
Y
Ethiopia National development plan, PASDEP (2005-2010) prioritises MDG achievements.
Y
Ghana The GPRS II (2006-09) explicitly focuses on the MDGs, which also have been given a separate section in the annual budget statement; civil society prepared MDG shadow report.
Y Y
Malawi The Malawi Growth and Development Strategy (2006-2011) is a MDG-focused national plan; civil society is active in producing shadow MDG reports led by the Council of NGOs in Malawi.
Y
Mozambique MDGs incorporated into the second PARPA (national poverty reduction strategy).
Senegal The President established a Special Presidential Adviser on the MDGs and appointed a national steering committee to coordinate the national response for MDG achievement.
Y Y
Sierra Leone The 2nd Growth and Poverty Reduction Strategy (GPRS) focuses explicitly on the MDGs, with the Office of the President leading its implementation and oversight.
Y
Tanzania MDGs mainstreamed into Development Vision 2025 and medium term plan MKUKUTA, and for Zanzibar.
Y Y
Togo Adopted a National Development Strategy based on the MDGs (2007).
Y
Source: Extracted from UNDP (2010) based on National MDG Reports.

9
points in low income countries between 2000 and 2008, for example-- there is insufficient
data to look at long-term trends. The picture is more positive regarding immunizations –a
stagnation in low-income vaccination rates in the 1990s has given way to a notable upward
trend. This will be in part related to the considerable resources mobilized for worldwide
vaccination programs through the Global Alliance for Vaccines and Immunizations,
suggesting this may be a case where the causal chain from aid and policy to interventions to
outcomes, at least, is comparably strong.
This section assesses poverty reduction progress under the MDGs via various different
methods available. It is worth noting that we will not know until at least 2017-2019 which
goals were met–and given the lack of baseline data we may never know for some goals. For
example, we still lack poverty and hunger data to make up to date estimates of country
progress in the MDG target areas in Sub Saharan Africa for nearly half of the region’s
countries (World Bank/IBRD, 2011). At the same time, we are far enough through the
MDG time frame with sufficient enough data to be able to make some preliminary estimates
of global progress –in most cases we have data covering more than half of the period
between the turn of the Millennium and the MDG target date of 2015.
As well as looking at the global level, we will also examine several ways to assess progress on
the MDGs at the country level. A number of assessments emerged at the time of the
September 2010 MDG summit. The first is Fukuda-Parr & Greenstein's (2010) comparisons
of the rate of annual progress both before and after the introduction of the MDGs. The
second is Leo & Barmeier's (2010) construction of the Center for Global Development’s
MDG Progress Index which assesses how far a country is above or below the trajectory to
meet the MDGs. The third is ODI/UNMC's (2010) league tables based on annual
improvement rates in absolute and relative terms. We will report on these exercises and add
an approach of our own based on deviations from a model of historical change.
In this paper, we examine four questions: have MDG indicators improved? Have they
improved fast enough for the world to be on track to meet the MDGs, have they improved
faster than they did before the MDGs were agreed and have they improved faster than we
would expect on the basis of historical patterns of change? One might question the need to
go beyond asking ‘will we meet the MDGs?’ But from the point of view of ‘what have the
MDGs accomplished’ the process would still have considerable value if it was (causally)
associated with sustained or more rapid progress even without meeting the specific Goals
laid out in 2000 and thereafter.
It is worth repeating here that correlation does not necessarily imply causation and that the
different approaches can lead to markedly different conclusions. Table 3 provides country

10
examples using child mortality in this regard, comparing measures of ‘on-track/off-track’ to
Fukuda-Parr and Greenstein’s approach of examining faster or slower progress since
agreement of the MDGs. Many countries with declining rates of progress since 2000 remain
‘on track’ and many off-track countries have nonetheless increased rates of progress since
the MDGs were agreed (See, for discussion, Pogge 2010).6
It is also worth noting that with country-level analysis of progress, it may be over simple to
suggest countries are ‘failing’ if they are not meeting the global MDG target. MDG architects
have pointed out that the MDGs are intended to be global goals (see, for example,
Vandemoortele & Delamonica, 2010). Of course the goal of 100% for the primary education
MDG would only be possible if all countries met 100% coverage. Furthermore, the DAC
actually adopted exactly the same global and local targets for infant and child mortality in
1996. And Secretary General Annan’s ‘Road Map’ report to the UN General Assembly in
2001 suggested that “it is crucial that the millennium development goals become national
goals” (Manning, 2009). Nonetheless, the targets associated with particular goal areas do
become significantly more ambitious if universally applied at the country level, which has
become the norm in reports on MDG progress from the World Bank and the UN.
The move from a global target of a halving of poverty or a two thirds reduction in child
mortality to country-level monitoring on the basis that every country should achieve the
MDG target reduction is, in effect, to ask for a dramatic acceleration of global progress. To
understand why this is the case, examine Figure 20. In reaching a global target of a halving of
poverty, for example, we would expect about half of all countries to more than halve poverty
and half of countries to reduce poverty less than 50%. The average of leaders and laggards
together is a 50% reduction. But if we move to the country level and suggest that every
country needs to achieve a 50% reduction to avoid the stigma of MDG failure, this suggests
we’ve shifted the distribution of outcomes considerably to the right. Put another way, if every
country meets an MDG of 50% reduction, the average global reduction will be considerably
higher than 50%.
We can conservatively estimate what this change from global to country targets implied for
rates of progress at the country level by looking at the distribution of outcomes for countries
currently on track to meet particular MDG targets (see Figure 21). Taking this distribution,
which is bounded at the lower end by the MDG rate of progress, as a model for a
6 Furthermore, the Millennium Declaration did not in fact include a baseline year for the goals included
therein and the full set of Goals was not even set out until a year after that Declaration. Pogge (2011) argues that
the resulting Goals were under-ambitious compared to earlier commitments, but (pace Vandemoortele and
Delamonica, 2010) many suggested a rate of progress more rapid than historical rates, as we will see. For some
Goals (and in particular maternal mortality) there was insufficient data to make realistic estimates of potential
progress. Regardless, international goals are necessarily political and usually ‘stretch targets’ –in this case set nearly
half way through the time given to complete them. For example, Clemens notes that the goal of universal primary
education has been set by international fora meeting on 9 occasions since the 1930s (1934, 1948, 1951, 1962,
1970, 1980, 1990, 1995 and 2000).

11
distribution in a world where every country meets the MDGs, we can estimate the average
rate of global progress we would see if every country was at least meeting the MDGs.
The results of such a distribution of outcomes is presented in Table 4 below. The table
suggests that, looking at average rates of progress for those countries that are on track to
meet the MDG goals, over the 25 year goal period, we would expect an average decline of
65% in the prevalence of undernourishment (compared to a global goal of 50%), a 78%
decline in the maternal mortality rate (compared to 75%), and a 71% decline in the child
mortality rate (compared to 66%). It is also worth noting that the data suggests that
countries on track to meet the MDGs show progress around one standard deviation above
the average rate of progress for all countries on these three MDGs.
Note our results are based on unweighted country averages, so should be taken as
illustrative.7 At the same time, this is a conservative estimate because it might be more logical
to take the actual distribution of world outcomes and just ‘shift’ it by the gap between the
slowest progressing country and the rate of progress required to meet the MDGs (the model
illustrated in the right panel of Figure 20).
Regardless, given the MDGs were based on average global rates of progress and were then
applied at the country level, our illustrative results suggest that the ‘on-track/off-track’
exercises are all based on the assumption of a considerably increased rate of global progress
during the period of the MDGs. The logic underlying such an assumption is nowhere
discussed in such exercises. And at the country level, some Goals are clearly over-ambitious
compared to historical rates of progress. Easterly (2009, p. 29) and Clemens, et. al., (2007),
both argued that the MDGs are ‘unfair’ to Africa as for some countries they would require
progress at faster rates than any historical trajectory ever recorded.8
To return to the broader question of the impact of MDGs on rates of progress, it is
important to emphasize here that it is not clear if the widespread adoption of MDGs as
country goals has had any practical impact on policies or outcomes. We have seen that aid is
flowing increasingly to smaller population countries where the ‘cost’ of meeting MDG
targets will be lower (all else equal) –but we have no evidence of a causal link. So there are
missing elements to a causal story from MDGs through policy change to more rapid
progress.
7 Unweighted averages imply Vanuatu and China are as important to determining global average rates of
progress. They are not. So if China had seen far more dramatic progress ahead of an MDG target than Vanuatu,
our estimates of the gap would be too low (and vice-versa).
8 Another sleight of hand that the global development community has collectively undertaken is to measure
‘global’ progress using a developing country sample. We do the same here, despite the fact that excluding high-
income countries has the effect of reducing the percentage of countries that are likely to reach any particular goal
and altering the likely complexity of reaching ‘global’ goals –raising some (poverty) and reducing others (halving
mortality).

12
Nonetheless, given that on/track/off track is at best a partial measure of the success of the
MDGs, it is worth examining if the Goals may have been associated with the more modest
target of speeding country progress in Goal areas from the period prior to their agreement.
This has the added advantage that we are examining the impact of the Goals themselves on
progress, rather than the impact of the Goals and ten years of policies and activities (1990-
2000) before the Goals were agreed.
Table 3: On Track or Faster Progress as Measures of MDG Success
Country Annual Under
Five Mortality
Change1990-
2000
Annual
Under Five
Mortality
Change
2000-2007
Annual
Change,
Entire
Period
UN MDG
Monitor
Classification
Post-2000
Change in
Speed of
Progress
Libya -1.9 -0.57 -1.35 “On Track” Decline
Mexico -1.7 -1.14 -1.47 “Achieved” Decline
Malawi -3.9 -8.43 -5.76 “Possible to
Achieve with
Changes”
Improvement
Gambia -2.2 -3.14 -2.59 “Off Track” Improvement
Lesotho +0.5 -3.29 -1.06 “Off Track” Improvement
Nigeria -2.3 -2.57 -2.41 “Off Track” Improvement
Togo -2.8 -3.14 -2.94 “Off Track” Improvement
Tanzania -1.4 -3.86 -2.41 “Possible to
Achieve with
Changes”
Improvement
Source: (Fukuda-Parr & Greenstein, 2012, forthcoming)

13
Table 4: How Fast Global Progress if All countries Meet the MDGs?
MDG
indicator
Percent of
countries
on track
(n=138)
Years
of data
Average
progress
for
countries
on track
over period
of data
availability
Average
rate of
progress
for all
countries
Standard
deviation
of rate of
progress
for all
countries
Predicted
average
decline for
countries
on track
(25 year
period)
Global
target
Prevalence of
Under-
nourishment 31% 14 -45% -11% 36% -65% -50%
Maternal
Mortality Rate 18% 18 -66% -25% 43% -78% -75%
Child
Mortality Rate 40% 18 -59% -40% 22% -71% -67%
Tables 5 and 6 lay out the evidence regarding global and country-level progress towards the
MDGs. At a global level, Table 5 presents evidence regarding the following questions: are
the selected MDG indicators better than they were in 1990? how much of the distance to the
MDGs has been achieved at the global level by 2008 according to the Global Monitoring
Report? are we on track to meet the MDG target given global rates of progress 1990-2008?
has the rate of progress increased from 1990-2000 to 2000-2008? and is the global rate of
progress 2000-8 faster than would be predicted given historical patterns?
At the country level, Table 6 presents evidence regarding the following questions: what
percentage of countries see selected MDG indicators better than they were in 1990? what
percentage of countries are on track to meet the MDG target given country rates of progress
1990-2008? what percentage of countries have seen an increased rate of progress from 1990-
2000 to 2000-2008? and what percentage of countries have seen a rate of progress 2000-8
faster than would be predicted given historical patterns?

14
Table 5: Global Progress
MDG
Improve-
ment
Since
1990?
GMR ‘Distance
progressed to
Goal’ (100% =
goal attained)
On
Track?
Faster Progress
2003-2008
compared to
1990-2001/2?
Faster
than
Historical
Patterns?
Poverty Y 80 Y Y
Under-
nourishment
Y 77 N N
Primary
Education
Y 90 N Y N
Gender
Equality*
Y 96 Y N N
Child
Mortality
Y 69 N Y Y
Maternal
Mortality
Y 57 N Y Y
HIV/AIDS
Drinking
Water
Y 88 Y N
*Primary education Source: Leo and Barmester (2010), World Bank, 2011, authors’ calculations.

15
Table 6: Country Progress
MDG
Leo and
Barmeier % of
countries
making
progress1
ODI % of
countries
making
progress
Leo and
Barmeier %
of countries
on Track1
GMR 2011
% of
countries
on Track
Fukuda-
Parr and
Greenstein
% of
countries
Faster
Progress
% of
countries
Outperform
ing
Historical
Pattern*
Poverty 63 66 49 47 51
Under-
nourishment
55 57 34 25
Primary
Education
75 46 55 35 68
Gender
Equality
61 55 89/82** 46 56
Child Mortality 95 95 38 36 32 51
Maternal
Mortality
83 19 30 33
HIV/AIDS 5 25
Drinking Water 73 82 49 66 34
Source: Leo and Barmeier (2010), ODI (2010), World Bank Global Monitoring Report 2011, & authors’
calculations using World Development Indicators and Hogan et. al. (2010) data
1. % of countries with progress and on track are based on author’s calculations using Leo and Barmeier
(2010) methodology
*Represents the proportion of developing countries for which the appropriate data is available
**Gender Equality for primary and secondary education, respectively
Starting with the simplest question, it is worth asking if the World looks better than it did in
1990? At the global level, the answer to that is a universal ‘yes’ for the indicators where we
have data. Income poverty, undernourishment, child and maternal mortality are all rarer than
they were in 1990 and primary completion (especially for girls) and access to clean water is
more common.

16
The Global Monitoring Report suggests we are 80 percent of the way to reducing income
poverty by half over 1990-2015, and 77 percent of the distance to halving under-nutrition (in
other words, these figures are about 60 percent of their level in 1990). We have achieved 90
percent primary completion in primary education, and girls’ enrollment is 96 percent of the
level of boy’s enrollment. We are two thirds of the way to a two thirds reduction in child
mortality, and a little over half way towards reducing maternal mortality by three quarters.
While the data is less comprehensive, however, it is also clear that we have yet to reverse the
HIV/AIDS epidemic, at least in terms of prevalence and almost certainly in terms of new
infections.
At the country level, Leo and Barmeier’s data suggests that progress is widespread across a
range of indicators. Three quarters or more of countries have seen progress in poverty,
undernourishment, mortality and provision of clean drinking water. Nearly two thirds of
countries have seen progress in gender equality –and others will have had no progress to
achieve, starting the period with parity in school enrollment by gender. Only six percent of
countries have actually reduced HIV prevalence –although 25 percent report prevalence
rates no higher than they were in the 1990s. We should note here that new infections is the
preferred MDG target indicator, but data is more sparse. We should also note in the 2011
update of the MDG Progress Index, Leo and Thuotte (2001) note some changes and an
underlying problem with the on-track/off-track exercise –considerable data revision. For
example, Leo and Thuotte (2011, p. 6) estimate that as many as one-quarter of all countries
or 31 of 76 countries with data revised their MDG 2 indicators for primary education
completion rates:
Overall, primary education completion rate data (either for baseline or more recent years)
was retracted for sixteen developing countries. In addition, there are widespread data
revisions which also have impacted progress performance levels. By illustration, baseline year
data has been revised for 31 developing countries (nearly one-quarter of all countries).
Figures 22, 23, 24 and 25 present developing country aggregate data on the $1.25 poverty
rate, primary completion, under-five mortality and maternal mortality enabling us to measure
progress at the global level. The diamonds present actual data, the thin grey line a fitted
trend line over the entire period for which we have data and the thick red line an
approximate indication of the trend line required to meet the MDG target for each of these
goals.
We are on track to meet the first MDG on poverty –a casual look at the figure suggests that
the target was actually quite conservative given historical trends. This finding is consistent
with the The World Bank (2011b, p. 11) Global Monitoring Report, which noted that the
incidence of income poverty at $1.25 has fallen from 42% in 1990 to 25% in 2005 and is
projected to fall to 14% in 2015. These figures represent a fall from 1.8bn poor people in
1990 to 1.4bn in 2005 and a projected 0.9bn in 2015 (See Bussolo, de Hoyos, & Medvedev,
17
2008).9 A more optimistic estimate is that of Brookings economists Chandy & Gertz (2011,
p. 11) who come to more optimistic conclusions of 9.9% poverty incidence in 2015 (0.6bn
poor people). Ravallion (2011) has noted, and as recognized by Chandy and Gertz
themselves the assumptions of Chandy and Gertz concerning static inequality may overstate
the extent of poverty reduction to 2015 as may the assumption that all of the economic
growth recorded in the national accounts is reflected in households mean consumption. The
former - static inequality - may well particularly understate poverty reduction to 2015 in the
case of fast growing countries, which include many new MICs. Much of course depends on
growth projections for individual countries (most obviously, what happens in China and
India and other large populous countries like Pakistan, Nigeria and Indonesia) as well as the
evolution of income distribution within each country; any re-evaluation of PPPs in each
country (and influence on $1.25 poverty) and population growth in individual countries (see
discussion in Kanbur and Sumner, 2011). Nonetheless, the consensus poisiton appears to be
that we will certainly meet the MDG of halving the proportion of the World’s population
living on $1.25 a day.
Regarding the other MDGs, the prognosis is patchy. At current rates of global progress, we
should meet the goal for improved water and gender equality in basic education. But the
world will not reach universal primary completion by 2015, and will miss the mortality and
undernourishment goals.
At the country level, Leo and Barmester (2010) suggests that around half of all countries are
on track for the income poverty MDG,10 gender equality in schooling, universal primary
9 This estimate takes the global income distribution in 2000, assembled using data from household surveys
for 1.2 million households in 84 developing countries and makes assumptions based on projections for
demography (aging and shifts in the skill composition of the population; changes in the sectoral composition of
employment; and economic growth (including changes in relative wages across skills and sectors). With regard to
overall progress, note, however (i) if China is removed, the reduction the total number of extreme ($1.25) poor is
less impressive. In 1990 there were 1.1bn poor people outside China; in 2005 there was actually 1.2bn but the
projection is for 0.8bn poor people in 2015; (ii) If one uses the $2 poverty line - the average poverty line for
developing countries - there will be still 2bn poor people in 2015 or 1.8bn excluding China and this is about the
same as 1990; (iii)The number of poor people rose slightly in in South Asia, 1990-2005 although this should fall
significantly by 2015 and the number of poor people in Sub-Saharan Africa increased from 300m in 1990 to
almost 400m in 2005 and are the 2015 projection is for 350m.
10 The most significant rates of poverty reduction, 1990-2005, have been achieved in East Asia and the
Pacific with reductions of nearly 70% in the number of people living on less than $1.25 and over 50% reduction
in the number of those with less than $2 a day. These positive trends are expected to continue to 2015 when the
total number of people living below the $1.25 poverty line in East Asia and the Pacific is estimated to be 119m –
just 13% of the 1990 figure. In South Asia, progression out of poverty has been slower. Between 1990 and 2005
there was an increase in the number of people living below both the $1.25 and $2 a day poverty lines despite a
decrease in proportional terms. The situation in this region is expected to improve by 2015. Poverty alleviation in
sub-Saharan Africa has also been slow but is expected to improve by 2015. The number of people living on
below $1.25 a day and $2 a day in sub-Saharan Africa grew between 1990 and 2005 to reach 388 and 557 million
respectively.
18
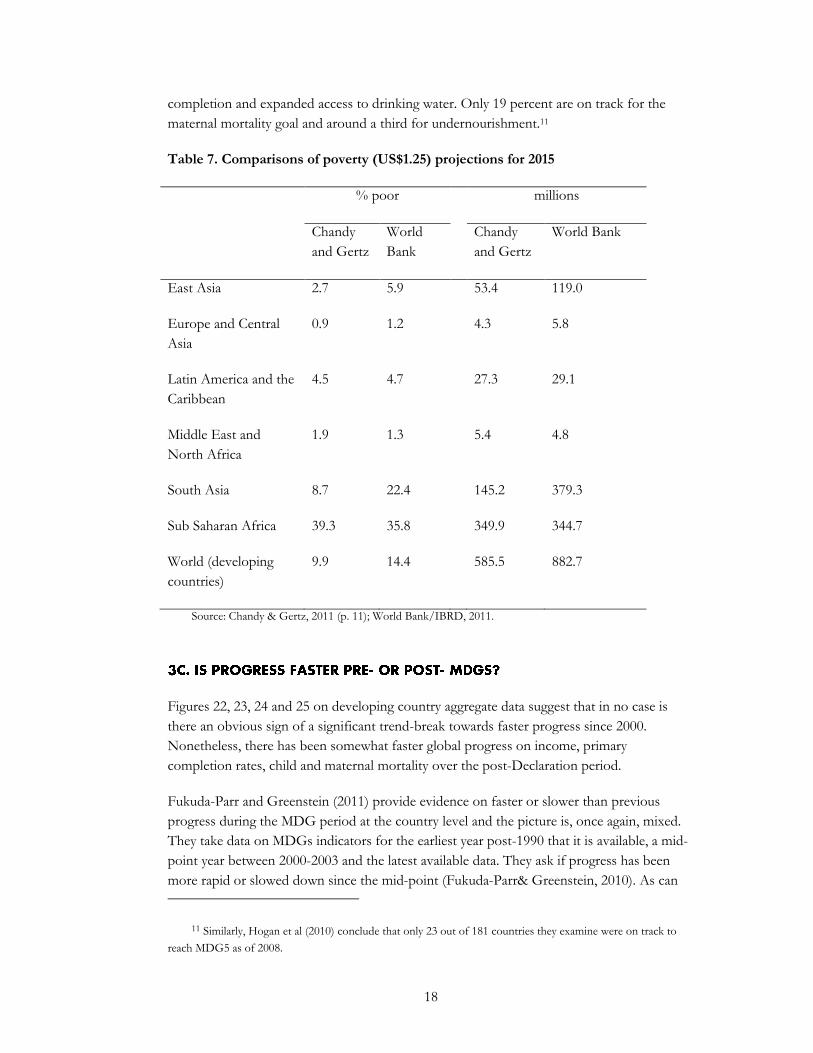
completion and expanded access to drinking water. Only 19 percent are on track for the
maternal mortality goal and around a third for undernourishment.11
Table 7. Comparisons of poverty (US$1.25) projections for 2015
% poor millions
Chandy
and Gertz
World
Bank
Chandy
and Gertz
World Bank
East Asia 2.7 5.9 53.4 119.0
Europe and Central
Asia
0.9 1.2 4.3 5.8
Latin America and the
Caribbean
4.5 4.7 27.3 29.1
Middle East and
North Africa
1.9 1.3 5.4 4.8
South Asia 8.7 22.4 145.2 379.3
Sub Saharan Africa 39.3 35.8 349.9 344.7
World (developing
countries)
9.9 14.4 585.5 882.7
Source: Chandy & Gertz, 2011 (p. 11); World Bank/IBRD, 2011.
Figures 22, 23, 24 and 25 on developing country aggregate data suggest that in no case is
there an obvious sign of a significant trend-break towards faster progress since 2000.
Nonetheless, there has been somewhat faster global progress on income, primary
completion rates, child and maternal mortality over the post-Declaration period.
Fukuda-Parr and Greenstein (2011) provide evidence on faster or slower than previous
progress during the MDG period at the country level and the picture is, once again, mixed.
They take data on MDGs indicators for the earliest year post-1990 that it is available, a mid-
point year between 2000-2003 and the latest available data. They ask if progress has been
more rapid or slowed down since the mid-point (Fukuda-Parr& Greenstein, 2010). As can
11 Similarly, Hogan et al (2010) conclude that only 23 out of 181 countries they examine were on track to
reach MDG5 as of 2008.

19
be seen, only for income out of these indicators has progress accelerated during the period
of the MDGs for the majority of countries.
An alternate way of looking at rates of progress during the period of the MDGs is to ask ‘are
countries under- or over-performing compared to what would be expected given historical
progress on MDG indicators at the cross-country level?’ Here, we use a very simple model
of the determinants of historical progress:
Yt = β0 + β1(Yt-1) + β2(Yt-1)2 + µ
where Yt is the value of the indicator at any time t excluding the base year, and Yt-1 is the 10-
year lag observation.12 The squared term is entered to capture curvature in the historical
path. β1 and β2 are the regression coefficients, µ is the error term, and β0 the constant, which
can be conceptually understood as the global trend in the indicator. Where the indicator is
transformed to the log form (in the case of the child mortality rate and the maternal
mortality rate), the square term is not entered into the estimation equation. (Lange and
Klasen 2011) take a more sophisticated approach in a similar vein).
Figures 26, 27, 28 and 29 below show the values that would be predicted for 2008 or 2009
based on our model and actual values for 2000 relative to actual numbers for 2008 and 2009
(depending on the availability of data per indicator), based on analysis of data from 1970-
2000 (also depending on the indicator). A predicted value for 2010 is then generated from
the regression coefficients and the constant, and the applicable 2008 or 2009 predicted value
extrapolated assuming constant change within each decade. The figures plot the actual value
for the indicator in the end-line year against the predicted end-line value, wherein a data
point on the 45-degree line represents a perfect prediction. Using this approach, 68 and 56
percent of developing countries are seeing faster than predicted progress on primary
education and gender equality in education, respectively; but fewer than 50 percent of
countries are outperforming historical expectations on maternal mortality. With regards to
the child mortality rate, slightly more than half (51%) of countries are outperforming the
historical pattern.
As can be observed in Table 8 below, for all indicators excluding the child mortality rate
(CMR), unweighted averages suggest that progress has been faster than would have been
predicted on the basis of historical norms. Moreover, the average CMR for developing
countries is only one child below the predicted level for the most recent year available. Even
more promising, the weighted averages for all four indicators suggest more progress: higher
12 An OLS estimation model can also be carried out controlling for country and time fixed effects (that is,
creating individual country (k) and decade (j) dummies for k-1 countries and j-1 decades). Including these
additional controls, however, does not modify the strength of the model tremendously, and as such is not crucial
to this simple analysis.

20
primary completion rates, gender parity closer to one, and lower child and maternal mortality
rates13.
Table 8: Actual versus Predicted: Current Levels of the MDGs
MDG
Number of
developing
countries for
which both
values
available
Unweighted
Developing
Country
Average
(Actual)
Unweighted
Developing
Country
Average
(Predicted)
Population
Weighted
Developing
Country
Average
(Actual)
Population
Weighted
Developing
Country
Average
(Predicted)
Primary
education 69 83% 78% 81% 76%
Gender
Equality 62 98% 96% 98% 96%
Child
Mortality* 142 58 57 51 54
Maternal
Mortality** 134 282 305 203 221
Source: World Bank WDI (2011) & Hogan et al. (2010). *CMR is per 1,000 under 5 age children. *MMR
value is per 100,000 live births.
The results above should be interpreted with caution, since they represent a sub-sample in
the entire grouping of countries for which predicted values were calculated. Coefficients on
the lag variables were calculated using the entire sample of countries for which data was
available, not only developing countries. As such, unweighted and weighted averages for
primary education completion (for example) would suggest that countries should be doing
better because the “curve” includes outliers on the high end, which in many cases were
greater than one,14 and are pushing the predicted average further up (closer to 100%
completion). Since these outliers are for the most part not included (these are typically
developed countries), the averages across the sub-sample of developing countries is smaller.
13 MMR historical data from the World Bank and Hogan, et. al. (among other sources) is of course
modeled, which would make a fitted model quite plausible.
14 Since the data set used for primary education completion is the gross completion rate, some values for the
endline year (2008) and earlier years (2000) were greater than 1 (i.e., greater than 100% completion)
21
Beyond the gender-specific targets and a 100% primary completion goal that requires
absolute equality of outcomes worldwide, the MDGs do not highlight the issue of inequality
of outcomes within countries. It is clear that such disparities are large –Table 9 presents data
on inequalities in inputs outcomes for some of the MDGs broken down by gender, location
and income. For example, a national average of 42 per cent of underweight children in South
Asia sits in contrast to 56 per cent of the children underweight in the poorest quintile.
Gender differences are more complicated as UNICEF (2011) argues in a systematic
disaggregation of gender data. For example, in some cases gender disparities are worse for
boys (outside Asia, under-five mortality is usually higher among boys than girls) or the same
at early ages and worsening during adolescence (nutrition and health indicators are – in
general – about the same at early ages – but adolescent girls are less likely to be literate than
boys for example) or there are more complex interaction of gender and poverty (gender
parity in education is much less likely in the poorest 20% group).
The data is sparse to examine whether progress on MDG indicators has been faster or
slower within countries for those groups previously furthest behind since the turn of the
Millennium –this requires two nationally representative household surveys to have been
conducted within a fairly short period. But looking at data from Vandemoortele and
Delamonica (2010) on average versus poorest quintile rates of progress on child mortality
for various countries during the first few years of the Twenty First Century (Table 10), just
under half of countries saw faster progress (percentage drop) amongst the bottom quintile
than average. This is a reasonably hopeful sign that progress has indeed been broad-based at
least for this indicator.
A final note on the exercises looking at the presence and speed of progress in MDG
indicators since 1990 or since the Millennium Declaration: even ignoring the very limited
evidence of faster progress since 2000 in the average (unweighted) developing country, it is a
considerable step from ‘more rapid progress’ to ‘the MDGs caused more rapid progress’.
This is particularly the case when it comes to any indicator that includes ten years of change
prior to the Millennium Declaration itself.
Given the comparatively weak evidence of country policy change beyond larger aid flows,
and of improved outcomes, it is hard to see a clear causal chain from MDGs through policy
change to more development. At the same time, we have no evidence against the
counterfactual that progress may have been even slower absent the MDGs (and absent the
additional aid flows).

22
Table 9: Selected MDGs and inputs: national averages vs women, rural populations and the poorest
MDG 1 - Underweight
prevalence in children under
five (%) 2003–2009
Measles coverage %, 2008
Skilled attendant at delivery, 2003-
2009
Nati
on
al
Ave
rag
e
Wo
men
Ru
ral
Po
ore
st
20%
Nati
on
al
Ave
rag
e
Wo
men
Ru
ral
Po
ore
st
20%
Nati
on
al
Ave
rag
e
Wo
men
Ru
ral
Po
ore
st
20%
Developing
countries exc. China
23 24 28 40 81 64 61 51 63 - 50 28
Sub-Saharan Africa 22 21 25 29 72 58 55 45 46 - 36 24
South Asia 42 42 45 56 74 59 58 44 42 - 33 17
LDCs 28 27 30 34 76 65 62 56 38 - 29 24
China 6 7 8 n.a. 94 n.a. n.a. n.a. 98 - 97 n.a
India 43 43 46 57 70 56 54 40 47 - 38 19
Source: UNICEF (2010, p. 51-63).

23
Table 10: Under-five mortality rates: Trend data of average versus poorest quintiles in
selected Sub-Saharan African and Asian countries
National Average Poorest 20%
Country (survey years) 1995-2000 2000-2005 1995-2000 2000-2005
Benin (1996/2001) 179 156 208 198
Burkina Faso (1998-
9/2003)
219 190 239 206
Ethiopia (2000-2005) 187 130 159 130
Ghana (1998/2003) 105 108 139 128
Kenya (1998/2003) 101 110 136 149
Malawi (2000/2004) 200 156 231 184
Mali (1995-6/2001) 249 233 298 248
Mozambique(1997/2003) 208 172 278 196
Tanzania (1999/2004) 160 130 160 137
Uganda (2000-1/2006) 154 146 192 172
Bangladesh (1996-
7/2004)
124 94 141 121
Cambodia (2000/2005) 117 101 155 127
Indonesia (1997/2002-3) 67 53 109 77
Nepal (1996-2001) 135 105 156 130
Viet Nam (1997-2002 44 31 63 53
Source: Vandemoortele and Delamonica (2010).
The causal chain from international agreement to policy change to development outcomes is
a long one with many confounding influences. Given that, it is impossible to say with any
certainty what was the impact of the MDGs. Having said that, the evidence available fits a

24
story which suggests that the MDGs may well have played a role in increasing aid flows in
the new Millennium, and that aid may have had some role in improving outcomes. At the
same time, the weak available evidence suggests they may have had only a limited impact on
policies in developing countries and on the course of global broad-based poverty reduction.
Given their evolution as DAC Development Goals (albeit from UN agreements of the
1990s) and lack of legal authority, perhaps such a conclusion should come as little surprise.
At the same time, given the increase in aid which flowed disproportionately towards social
sectors, and was of a scale commensurate with MDG ‘costing studies’ which attempted to
calculate how much it would cost to meet the Goals, the evidence of only somewhat more
rapid progress is a concern. On the positive side, aid may well have played a role. On the
cautionary side, and as suggested by the more cautious of costing studies in the beginning,
that role was partial, and had to involve changes in developing country policies as well.
What does this exercise suggest for any second round of MDGs? First of all, much of the
confusion around progress related to the current set of MDGs may derive from choices
made to include indicators for which data was very weak (not least maternal mortality), base
target levels on politics not realistic assessment of potential progress and to translate global
goals into country goals without recognizing how much higher this was raising the bar on
rates of global progress. Any MDGs 2.0 thus need targets for which good historical data is
available.
Second, as the most powerful impact of the MDGs appears to have been on aid flows, but
the impact of that aid on outcomes is difficult to assess and plausibly muted, a new round
might consider more directly tying aid flows to MDG outcomes. One approach would be
cash on delivery –donors would commit to provide funding to countries which
outperformed historical norms of progress equal to the estimated unit cost of that more
rapid progress. This would add teeth to the MDG process, making it more than a global
statement of intent.
Finally, the results of the original MDG process should instill a sense of humility. The
MDGs have been a powerful force in framing debate and providing donors with a
framework for action. But broad-based development is a complex, long-term endeavor.
However high-level the conference that agrees it, there is only so much a declaration can do.

25
Figure 1
Figure 2

26
Figure 3
Figure 4
0
5
10
15
20
25
30
35
40
45
50
19
90
19
91
19
92
19
93
19
94
19
95
19
96
19
97
19
98
19
99
20
00
20
01
20
02
20
03
20
04
20
05
20
06
20
07
20
08
20
09
Total aidper capita(constant2009 US$)
Total ODA Per Capita to Low and Middle Income Countries, 1990-2009
ODA per capita LowIncome
ODA per capitaMiddle Income
Source: OECD, 2011 & World Bank, 2011

27
Figure 5
Figure 6
0%
5%
10%
15%
20%
25%
30%
35%
40%
% ofTotal ODA
Percent of Total ODA Received by Sub-Saharan Africa, 1990-2009
Source: OECD 2011
0
5,000
10,000
15,000
20,000
25,000
30,000
35,000
40,000
19
95
19
96
19
97
19
98
19
99
20
00
20
01
20
02
20
03
20
04
20
05
20
06
20
07
20
08
20
09
Total AidCommittedin Millions(constant2009 $)
Total ODA by Region, Social Infrastructure and Services Sector, 1995-2009
Sub SaharanAfrica
Other Regions
Source: OECD 2011

28
Figure 7
Figure 8
0
5,000
10,000
15,000
20,000
25,000
19
95
19
96
19
97
19
98
19
99
20
00
20
01
20
02
20
03
20
04
20
05
20
06
20
07
20
08
20
09
Total AidCommittedin Millions(constant2009 $)
Total ODA by Region, Economic Infrastructure and Services Sector, 1995-2009
Sub SaharanAfrica
Other Regions
Source: OECD 2011
0%
2%
4%
6%
8%
10%
12%
% ofTotalODA
committment
Total ODA for Health & Education to Developing Countries as % of All ODA, 1995-2009
Total ODADeveloping -Education (% Total)
Total ODADeveloping -Health (% Total)
Source: OECD, 2011

29
Figure 9
Figure 10

30
Figure 11
Figure12
0
1
2
3
4
5
6
2003 2010
AverageCDI
Score
Average CDI Score, Weighted & Unweighted, 2003-2010
Weighted byGDP
UnweightedAverage
Source: CDI, Center for Global Development, 2011*2003 does not include South Korea
31
Figure 13
Figure 14
0
1
2
3
4
5
6
2003 2010
AverageCDI
Score
Average CDI Score Not Including the Aid Component, Weighted & Unweighted, 2003-2010
Weighted byGDP
UnweightedAverage
Source: CDI, Center for Global Development, 2011*2003 does not include South Korea
0
1
2
3
4
5
6
7
2003 2010
AverageCDI
Score
Average CDI Trade Score, Weighted & Unweighted, 2003-2010
Weighted byGDP
UnweightedAverage
Source: CDI, Center for Global Development, 2011*2003 does not include South Korea

32
Figure 15
Figure 16
2.70
2.80
2.90
3.00
3.10
3.20
3.30
3.40
3.50
3.60
3.70
3.80
2005 2009
AverageCPIAScore(scale:
1=lowest6=highest)
Average Population-Weighted CPIA Score, by Region, 2005-2009
East Asia & Pacific
Europe and CentralAsia
Latin America &Caribbean
Middle East & NorthAfrica
South Asia
Sub Saharan Africa
Source: World Bank WDI, 2011
2.70
2.80
2.90
3.00
3.10
3.20
3.30
3.40
3.50
3.60
3.70
3.80
2005 2009
Average CPIA Score (scale:
1=lowest 6=highest)
Average Population-Weighted CPIA Social Inclusion Score, by Region, 2005-2009
East Asia & Pacific
Europe andCentral AsiaLatin America &CaribbeanMiddle East &North AfricaSouth Asia
Sub Saharan Africa
Source: World Bank WDI, 2011

33
Figure 17
Figure 18
0
10
20
30
40
50
60
70
80
90
100
2000 2008
Skilled birth
coverage
Births attended by skilled health staff (% of total), by Income Group 2000-2008
Low income
Lower middle income
Upper middle income
Source: World Bank World Development Indicators, 2011
0
10
20
30
40
50
60
70
80
90
100
19
90
19
91
19
92
19
93
19
94
19
95
19
96
19
97
19
98
19
99
20
00
20
01
20
02
20
03
20
04
20
05
20
06
20
07
20
08
20
09
Percentage of infants
immunized
Immunization Rates, DPT (% of children ages 12-23 months), Developing World by Income Group, 1990-
2009
Low income
Lower middleincome
Upper middleincome
Source: World Bank World Development Indicators, 2011

34
Figure 19
Figure 20
To meet a global target of an average 50% reduction,
we would expect around half of all countries to see
less than 50% reduction, and around half of all
countries to see a greater than 50% reduction…
…to meet a global target of every country seeing a
50% decline, all countries have to pass the 50%
threshold, suggesting a far higher global average
performance.
0
10
20
30
40
50
60
70
80
90
1001
99
0
19
91
19
92
19
93
19
94
19
95
19
96
19
97
19
98
19
99
20
00
20
01
20
02
20
03
20
04
20
05
20
06
20
07
20
08
20
09
Percentage of infants
immunized
Immunization Rates, Measles (% of children ages 12-23 months), by Income Group, 1990-2009
Low income
Lower middle income
Upper middle income
Source: World Bank World Development Indicators, 2011

35
Figure 21
Figure 22

36
Figure 23
Figure 24

37
Figure 25
Figure 26

38
Figure 27
Figure 28

39
Figure 29

40
Bussolo, M., Hoyos, R. de, & Medvedev, D. (2008). Economic Growth and Income Distribution: Linking
Macroeconomic Models with Household Survey Data at the Global Level.
Chandy, L., & Gertz, G. (2011). Poverty in Numbers: The Changing State of Global Poverty from 2005 to
2015. East Asia.
Clemens, M., Kenny, C, & Moss, T. (2007). The Trouble with the MDGs: Confronting Expectations of Aid
and Development Success. World Development, 35(5), 735-751.
Easterly, W. (2009). How the Millennium Development Goals are Unfair to Africa. World Development, 37(1),
26-35. Elsevier Ltd.
Fukuda-Parr, S. (2008). Are the MDGs Priority in Development Strategies and Aid Programmes? Only Few
Are! New York.
Fukuda-Parr, S. (2010). Reducing Inequality – The Missing MDG: A Content Review of PRSPs and Bilateral
Donor Policy Statements. IDS Bulletin, 41(1), 26-35.
Fukuda-Parr, S., & Greenstein, J. (2010). How Should MDG Implementation Be Measured : Faster Progress
or Meeting Targets? Program. UNDP-IPC Working paper 63. UNDP-IPC: Brasilia.
Fukuda-Parr, S., & Greenstein, J. (2012, forthcoming). Metrics of MDGs Progress: A Human Rights Critique
and Alternative. In M. Langford, A. Sumner, & A. Yamin (Eds.), The MDGs and Human Rights.
Hogan, M. C., Foreman, K. J., Naghavi, M., Ahn, S. Y., Wang, M., Makela, S. M., et al. (2010). Maternal
mortality for 181 countries, 1980-2008: a systematic analysis of progress towards Millennium
Development Goal 5. Lancet, 375(9726), 1609-23.
Kanbur, R., & and Sumner, A. (2011). Poor countries or poor people? Development assistance and the new
geography of global poverty. Working paper 2011-08. Ithaca, NY: Charles H. Dyson School of Applied
Economics and Management, Cornell.
Kenny, Charles, & Sumner, A. (2011). MDGs 2.0: What Goals, Targets, and Time Frame?
Leo, B., & Barmeier, J. (2010). Who Are the MDG Trailblazers? A New MDG Progress Index. East Asia.
Leo, B., and Thuotte, R. (2011) MDG Progress Index 2011 The Good (Country Progress), the Bad
(Slippage), and the Ugly (Fickle Data). CGD Notes. CGD: Washington.
Manning, R. (2009). Using Indicators to Encourage Development: Lessons from the Millennium Development Goals.
Copenhagen.
Michel, J.-B., Shen, Y. K., Aiden, A. P., Veres, A., Gray, M. K., Pickett, J. P., et al. (2011). Quantitative
Analysis of Culture Using Millions of Digitized Books. Science, 331(176), 176-82.
Moss, Todd. (2010). What Next for the Millennium Development Goals? Global Policy, 1(2), 218-220.
ODI/UNMC. (2010). Millennium Development Goals Report Card: Learning from Progress. Africa. London.
Pogge, T. (2010). Millions Killed by Clever Dilution of Our Promise. Polity.
Ravallion, M. (2011) New Brookings Study is Overly Optimistic on Progress Against Poverty. Downloaded at
blogs.worldbank.org/developmenttalk/node/585
Sumner, A., & Tiwari, M. (2011). Global Poverty Reduction to 2015 and Beyond. Global Policy, 2(May).
UNDP. (2010). Beyond the Midpoint: Achieving the Millennium Development Goals. Development.
UNICEF. (2010). Progress for Children: Achieving the MDGs with Equity.
Vandemoortele, J., & Delamonica, E. (2010). Taking the MDGs Beyond 2015: Hasten Slowly. IDS Bulletin,
41(1), 60-69.

41
Watkins, K. (2011). The Millennium Development Goals: Three Proposals for Renewing the Vision and
Reshaping the Future. Retrieved 2011, from http://www.scribd.com/doc/2442520/Millennium-
Development-Goals.
World Bank/IBRD. (2011). Global Monitoring Report 2011: Improving the Odds of Achieving the MDGs.
Related Documents