More bread on the table The promise and the potential of financial inclusion NOTE 1, 2017

Welcome message from author
This document is posted to help you gain knowledge. Please leave a comment to let me know what you think about it! Share it to your friends and learn new things together.
Transcript

More bread on the tableThe promise and the potential
of financial inclusion
NOTE 1, 2017

About the cover:
The concept behind the art direction for Volume 2 of the MAP Global Insight series is that data, when harnessed with the requisite level of skill, provides a beautifully clear lens with which to view the communities and countries with which development partners are working, and a focused picture of options for driving positive change.
High-quality data and the use of data analysis tools provide in-depth insights into consumer financial behaviour and needs, and serve as a key to unlocking government and stakeholder mobilisation around evidence-based projects to improve service delivery, thereby positively impacting the lives of the poor.
The cover of Note 1 represents how financial inclusion is a means to an end – the end being improved household and individual well-being that feeds into economic growth which, in tandem with the process of reducing inequality, helps ensure that everyone enjoys a seat at the table of economic participation.
The MAP Global Insights series – Volume 2
Making Access Possible (MAP) is a multi-country initiative to support financial inclusion through a process of evidence-based analysis feeding into a financial inclusion roadmap jointly implemented by a range of local stakeholders.
MAP was initiated by the United Nations Capital Development Fund (UNCDF) and is implemented in partnership with FinMark Trust and the Centre for Financial Regulation and Inclusion (Cenfri). In each country, MAP brings together a broad range of stakeholders from within government, the private sector and the donor community to create a set of practical actions aimed at extending financial inclusion tailored to that country.
The volumes in the MAP Global Insights series consolidate and synthesise the learnings from the MAP programme across the 18 MAP countries.
Series Editor: Kameshnee NaidooVolume Editor: Jacquie WithersAuthors: Kameshnee Naidoo, Anthony Githiari and Obert MaposaLayout and Design: Garage East
The authors of this note would like to thank those who reviewed the document and provided invaluable comments: Brendan Pearce, Farai Muronda, Henri Dommel, Hanadi Tutunji and Samuel Choritz. Many thanks to Satish Mishra and the Strategic Asia Institute in Bali for their initial thoughts on financial inclusion and its potential for development, in an unpublished paper for UNCDF, 'The Future We Want' (2016). Thanks also to the Cenfri team for their data insights: Mia Thom, Hennie Bester, Jeremy Gray and David Saunders, for their data analytics and consumer insights specially prepared for UNCDF strategic partner meetings.

More bread on the table: The promise and the potential of financial inclusion
1
MAP GLOBAL INSIGHTS SERIES VOLUME 1
The king is (not) deadWhy digital payments are not replacing cash
MAP GLOBAL INSIGHTS SERIES:
NOTE 5 | 2016
Decoding the customer
MAP GLOBAL INSIGHTS SERIES:
NOTE 1 | 2015
First impressions from a more granular approach to client typology
Mapping the DNA
MAP GLOBAL INSIGHTS SERIES:
NOTE 6 | 2016
Using consumer insights to unlock the potential of financial inclusion
Shifting measurement away from a one-dimensional view of
financial inclusion
Depth sounding
MAP GLOBAL INSIGHTS SERIES:
NOTE 2 | 2016
‘Homefield advantage’Learning from the popularity of local financial services providers
MAP GLOBAL INSIGHTS SERIES:
NOTE 3 | 2016
Lost in the mailWhy bank account access is not translating into usage
MAP GLOBAL INSIGHTS SERIES:
NOTE 4 | 2016
NOTE 6 draws together the findings from this Global Insights series. It shows that the MAP evidence calls for a rethink of conventional financial inclusion assumptions, based on a consumer decision-making framework that emphasises economic incentives, cost and value.
NOTE 1 unpacks the target market segmentation approach that is central to the MAP methodology of putting the client at the core of the analysis. Note 1 provides a window into the emerging cross-country segments, and the implications for providers, policymakers and donors in this regard.
NOTE 2 explores the shift in financial inclusion measurement away from focusing solely on access to more closely match the realities of how adults live their financial lives and explores the policy implications of moving away from a linear, one-dimensional view of financial inclusion.
NOTE 3 looks at the nature of informal financial services. It shows that it is the local nature of these financial services, rather than their informal nature, that makes them valuable for the majority of consumers in these countries.
NOTE 4 considers the gap between ownership and usage of bank accounts. The note queries whether bank accounts are always the appropriate product for increasing customer welfare, and argues the need for a paradigm shift away from focusing on ownership to a focus on usage in the context of a wider, systems approach.
NOTE 5 focuses on cash as a payment instrument to explore the largely undiminished popularity of cash. The different payment needs of consumers are introduced, analysed and compared with regard to the use of cash versus digital instruments.
The MAP Global Insights series Volume 1 consolidates and synthesises the learnings from MAP across the six MAP pilot countries. Volume 1 was the first of the MAP Global Insights products, and comprises five thematic cross-country notes, based on the initial round of findings from the country diagnostic studies, which were conducted in Thailand, Myanmar, Swaziland, Mozambique, Lesotho and Malawi.

MAP Global Insights Note 1VOLUME 2
2
NOTE 1: More bread on the table: The promise and the potential of financial inclusion. In a changing and uncertain global order, financial inclusion – with its close linkage to the real economy – promises to become a means of supporting growth and contributing to poverty eradication. Using detailed consumer data, this note demonstrates the potential for financial inclusion to play a stronger role in lessening vulnerability to poverty, keeping up with shifting national demographics, nurturing small business growth and addressing food security challenges, among others.
NOTE 2: Humanising data: The MAP toolbox for fine-tuning and calibrating national metrics and optimising consumer delivery. Applying the MAP data analysis tools to the extensive consumer data gathered in-country enables accurate understanding of actual consumer behaviour and needs, both country-specific and in terms of patterns identifiable across developing countries. Findings from the use of the MAP tools have challenged a few of the conventional financial inclusion assumptions, in the process contributing to the global pool of financial inclusion metrics. The tools are central to supporting government and stakeholders in evidence-based decision-making towards smart, consumer-focused solutions.
NOTE 3: ‘Begin at the beginning’: Giving development initiatives political teeth and boosting government capacity to deliver on the SDGs. The single greatest challenge facing development is turning research and strategies into implementable solutions: improvement initiatives that deliver a positive impact. This note unpacks how the MAP programme is working with governments and development partners to boost countries’ capacity for self-determination and delivery on the national financial inclusion roadmap vision and promises, in the process accelerating inclusive growth and making progress towards the UN 2030 Agenda for Sustainable Development.
NOTE 4: There and back again: Harnessing data, developing collaborative platforms and enabling governments to deliver on the SDGs. This concluding note pulls together the power of the consumer data, its role in driving improvement interventions at country level and the importance of the MAP platform in bringing together country governments and stakeholders in evidence-based decision-making. Picking up on the key findings from the consumer data in other notes in the current volume, this note also provides insight into the systematic operational approach of the global MAP programme and reiterates the efficacy of the MAP approach in working with governments to deliver on the SDGs.
MAP GLOBAL INSIGHTS SERIES VOLUME 2
More bread on the tableThe promise and the potential
of financial inclusion
NOTE 1, 2017
Humanising dataThe MAP toolbox for fine-tuning and calibrating
national metrics and optimising consumer delivery
NOTE 2, 2017
Begin at the beginningGiving development initiatives political teeth and
boosting government capacity to deliver on the SDGs
NOTE 3, 2017
There and back againHarnessing data, developing platforms for
collaborative problem-solving and enabling governments to deliver on the SDGs
NOTE 4, 2017
The man in the mirror – change your thinking;
change the worldThe MAP Global Insights series Volume 2 looks at the thinking, strategies and processes that have enabled national delivery in financial inclusion, and attempts to codify the operational approach taken in the 18 ‘MAP countries’, including the 9 where the programme is working with governments to implement the national roadmap on financial inclusion. Key learnings using the country-specific consumer data drive the national implementation approach at country level.
More bread on the table: The promise and the potential of financial inclusion
3
as if, in some countries and societies, there are a bunch of people who can't join the modern economy because they don't have the most fundamental tools. (BCG 2016)
Financial inclusion is a means to an end – the end being improved household and individual welfare and a positive impact on those activities that contribute to production and economic growth. The latter in turn can have a positive impact on further financial sector development.
The promise and the potential of financial inclusion
The 21st century has already presented breathtaking levels and speed of change, both within countries and regions and globally. This is especially so in terms of advances in digital technology, which have made available huge volumes of high-quality consumer data while rapidly (if unevenly) eroding geographic and social distances. At the same time, in many areas – of the world, of society, of particular countries – this ‘change’ has often manifested as a deepening and intensifying of existing poverty, vulnerability and marginalisation.
Financial inclusion is premised on a basic faith in the capacity of the poor and the financially excluded to develop and manage their own financial futures, and the possibility of boosting this capacity by finding ways to offer consumers value in the form of differentiated and customised formal financial products/services.
Effective financial systems can fuel real economic impacts at the macroeconomic level by mobilising savings for investment purposes (including capital allocation for business development), reducing transaction costs, and increasing efficiency, thereby contributing to employment generation and growth. At the microeconomic or household/individual level, financial inclusion can impact directly and positively on people’s well-being by reducing their transaction costs, enabling them to more efficiently manage risks, allocating capital for productive use, and supporting the accumulation of wealth over time. Improved financial services can also facilitate access to core services such as health and education. This can encourage growth directly, by triggering service sectors, as well as indirectly, by enhancing productivity and well-being (Calderón & Liu 2003; Levine 1997).
Financial inclusion is able to provide a number of tangible benefits without delay at the individual and household levels. Nobel Laureate in economics Michael Spence argues:
There are other things that go along with [financial inclusion], things such as having an identity, being able to legally own property and borrow with the property as collateral. The absence of those things, including access to a bank account and the ability to borrow, are elements of non-inclusiveness. It's almost
Access to financial services is highlighted in many of the United Nations Sustainable Development Goals (SDGs). For example, ensuring that all men and women, particularly the poor and vulnerable, have equal rights to financial services has been set as one of the targets for the goal to end poverty in all its forms. This recognises that people’s financial lives are an important aspect of their broader lives. Financial services impact on people’s ability to grow, smooth and protect their income, to transact, and to build and protect their assets. By improving people’s financial lives, financial inclusion can contribute towards the achievement of broader public policy objectives. Financial inclusion makes a strong contribution to the growth of the real economy by triggering higher productivity in agriculture and MSMEs, especially those owned and managed by women, and by mobilising household savings among smallholders and low-income families. Improved financial services and products contribute towards eliminating the ‘missing middle’ and thus help reduce inequality.

MAP Global Insights Note 1VOLUME 2
4
Zimbabwe DRC Lao PDR Madagascar Cambodia Nepal
65%
19%
62%
24%
36%36%
54%
21%
48%
42%
81%
15%
Excluded: did not experience poverty risk
Formally included: did not experience poverty risk
Financially excluded adults (formal or informal)
Financially included adults (formal or informal)
Monthly income category (US$)
52%
69%
57%
45%
40%41%
56%
45% 44%
31%
0 - 9.9 10 - 29.9 30 - 99.9 100 - 200 200 or more
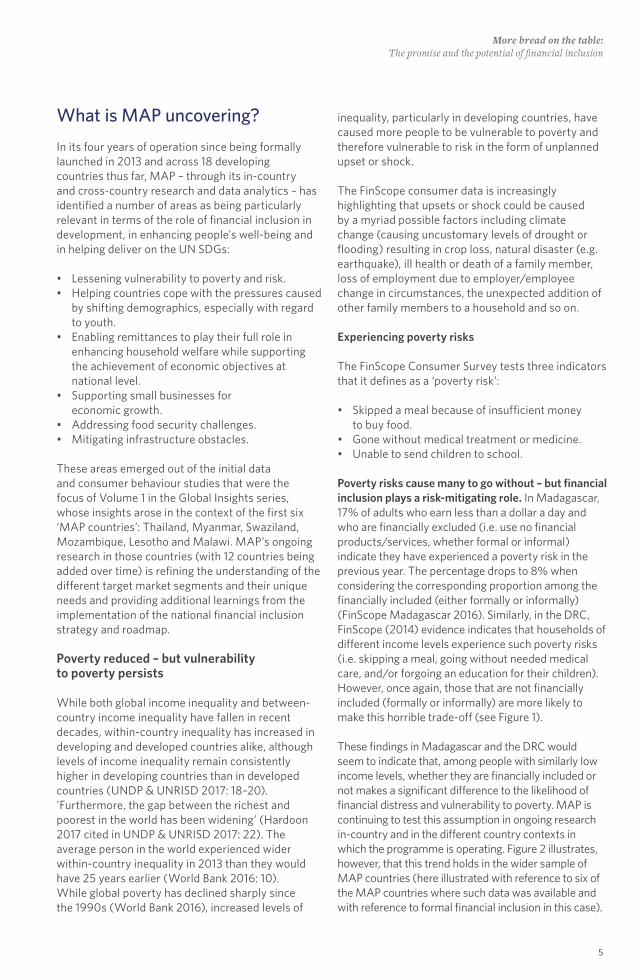
FIGURE 1: Percentage of adults (financially excluded vs included) that reported experiencing a poverty risk: DRC
Source: FinScope DRC 2014.
FIGURE 2: Individuals (formally financially included vs excluded) that reported not experiencing a poverty risk: 6 MAP countries
Sources: FinScope Consumer Surveys: Zimbabwe 2014, DRC 2014, Lao PDR
2014, Madagascar 2016, Cambodia 2015, Nepal 2014.
More bread on the table: The promise and the potential of financial inclusion
5
What is MAP uncovering?
In its four years of operation since being formally launched in 2013 and across 18 developing countries thus far, MAP – through its in-country and cross-country research and data analytics – has identified a number of areas as being particularly relevant in terms of the role of financial inclusion in development, in enhancing people's well-being and in helping deliver on the UN SDGs:
• Lessening vulnerability to poverty and risk.• Helping countries cope with the pressures caused
by shifting demographics, especially with regard to youth.
• Enabling remittances to play their full role in enhancing household welfare while supporting the achievement of economic objectives at national level.
• Supporting small businesses for economic growth.
• Addressing food security challenges.• Mitigating infrastructure obstacles.
These areas emerged out of the initial data and consumer behaviour studies that were the focus of Volume 1 in the Global Insights series, whose insights arose in the context of the first six ‘MAP countries’: Thailand, Myanmar, Swaziland, Mozambique, Lesotho and Malawi. MAP’s ongoing research in those countries (with 12 countries being added over time) is refining the understanding of the different target market segments and their unique needs and providing additional learnings from the implementation of the national financial inclusion strategy and roadmap.
Poverty reduced – but vulnerability to poverty persists
While both global income inequality and between-country income inequality have fallen in recent decades, within-country inequality has increased in developing and developed countries alike, although levels of income inequality remain consistently higher in developing countries than in developed countries (UNDP & UNRISD 2017: 18–20). 'Furthermore, the gap between the richest and poorest in the world has been widening’ (Hardoon 2017 cited in UNDP & UNRISD 2017: 22). The average person in the world experienced wider within-country inequality in 2013 than they would have 25 years earlier (World Bank 2016: 10). While global poverty has declined sharply since the 1990s (World Bank 2016), increased levels of
inequality, particularly in developing countries, have caused more people to be vulnerable to poverty and therefore vulnerable to risk in the form of unplanned upset or shock.
The FinScope consumer data is increasingly highlighting that upsets or shock could be caused by a myriad possible factors including climate change (causing uncustomary levels of drought or flooding) resulting in crop loss, natural disaster (e.g. earthquake), ill health or death of a family member, loss of employment due to employer/employee change in circumstances, the unexpected addition of other family members to a household and so on.
Experiencing poverty risks
The FinScope Consumer Survey tests three indicators that it defines as a ‘poverty risk’:
• Skipped a meal because of insufficient money to buy food.
• Gone without medical treatment or medicine.• Unable to send children to school.
Poverty risks cause many to go without – but financial inclusion plays a risk-mitigating role. In Madagascar, 17% of adults who earn less than a dollar a day and who are financially excluded (i.e. use no financial products/services, whether formal or informal) indicate they have experienced a poverty risk in the previous year. The percentage drops to 8% when considering the corresponding proportion among the financially included (either formally or informally) (FinScope Madagascar 2016). Similarly, in the DRC, FinScope (2014) evidence indicates that households of different income levels experience such poverty risks (i.e. skipping a meal, going without needed medical care, and/or forgoing an education for their children). However, once again, those that are not financially included (formally or informally) are more likely to make this horrible trade-off (see Figure 1).
These findings in Madagascar and the DRC would seem to indicate that, among people with similarly low income levels, whether they are financially included or not makes a significant difference to the likelihood of financial distress and vulnerability to poverty. MAP is continuing to test this assumption in ongoing research in-country and in the different country contexts in which the programme is operating. Figure 2 illustrates, however, that this trend holds in the wider sample of MAP countries (here illustrated with reference to six of the MAP countries where such data was available and with reference to formal financial inclusion in this case).

MAP Global Insights Note 1VOLUME 2
6
Drastic coping strategies
The countries in which MAP works tend to have very low official social safety net coverage. All of the MAP countries thus far demonstrate the high cultural value placed on cohesive households and supportive communities. The strong extended family economic unit also shapes patterns of how family income is generated and distributed (e.g. through remittances), how families take care of the needs of their older members, how they deal with risk events, and their attitudes to, for example, savings and credit. Without access to an adequate range of financial services that are affordable and conveniently available, many turn to alternative coping measures, including continuing to rely on community and other informal structures where these are available, and often the inefficient use of whatever financial services/products (formal or informal) are actually available.
Relying on others for support. In Zimbabwe, the FinScope (2014) research indicates that the community is the main risk-mitigating mechanism on which people rely; 67% of the adult consumers indicate that they have had to rely on family and friends for medical expenses, and 66% indicate the same for regular daily needs. Importantly, 53% relied on their family and friends to pay school fees for children. Across the MAP countries, the research finds that people also take into account the expectation of community support in planning for the future.
Forgoing education, and migration among top longer-term responses to poverty and risk. Despite very limited resources, people do plan ahead: for example, 71% of adults in the Zimbabwe FinScope indicated they were making provision for the future (2014).
‘I was not attending school while I was in Lesotho so I came here looking for a school. I didn’t want a job. As time went, I realised that school will waste my time so I decided to get myself a job.’ (Lesotho, male focus group)
‘I came here in Gauteng [South Africa] looking for a better life because there’s nothing in Lesotho, there’s no rain, and the fields are dying.’ (Lesotho, male focus group)
I’m here in South Africa to complete my academics but due to financial hiccups I find it difficult to raise up money to complete my studies; that’s when I changed the route and said, “No, let me help my life
and live like my friends who have already said that they are looking at the greener pastures”.’ (Malawi, male focus group)
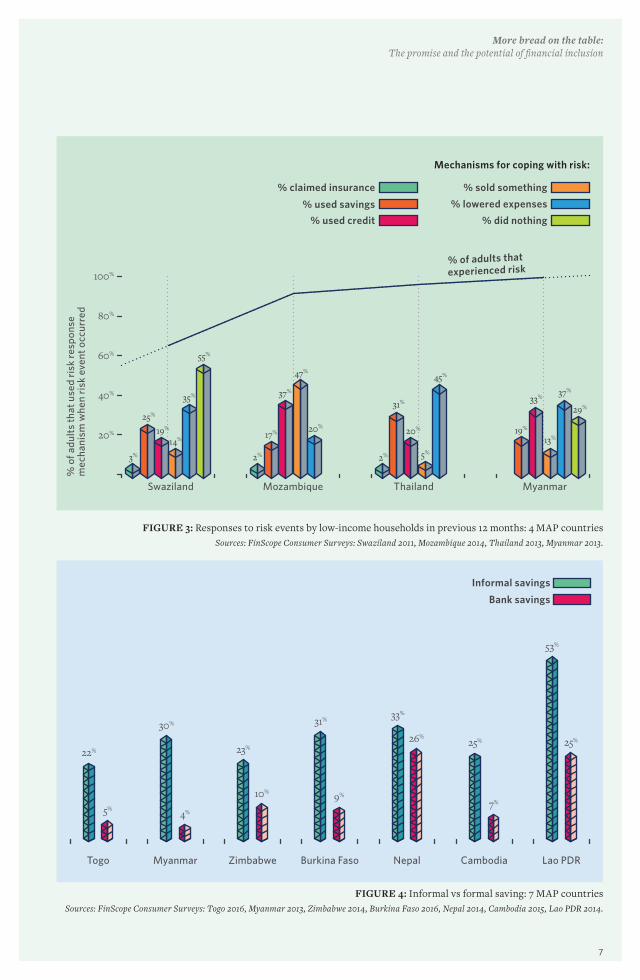
In the absence of the correct product, use whatever is available. Risk and the management of risk for poor households is a significant issue, yet few households across the MAP countries have effective financial instruments for coping with risks (see Figure 3). Healthcare, for instance – an issue regularly highlighted in the research as a risk – adds a significant financial burden to a household when someone falls ill and there are ineffective financial instruments to deal with it.
The MAP research shows that many households, in the absence of risk-mitigating insurance products, turn to drastic coping measures, including selling something, lowering expenses (e.g. by skipping meals or other forms of going without), or using credit or savings to cope. In the Swaziland and Myanmar findings, respectively, a high proportion ‘did nothing’, indicating limited available options for some in terms of managing shocks. All of these commonly used risk-mitigation strategies, however, deprive the poor of a means of getting out of poverty, or entrench them further in poverty.
‘Mike is a 51-year-old general supervisor for the Department of Social Welfare. He earns a salary of US$195 per month and an additional US$20 per day from part-time jobs. He recently had to take a pay cut due to the economic instability in the country. Mike is a family-oriented man who helps pay the rent for his mother and brother. When his sister fell ill, she had to be hospitalised as she had lost a lot of blood. Though the hospital treated her free of charge, Mike needed US$390 to get enough blood from the blood bank for her to receive adequate treatment. He also still needed to pay for his sister’s medication. Therefore, he borrowed money from a moneylender at an interest rate of 30% per month, which at the time of the interview he was still repaying.’ (Zimbabwe, qualitative study 2015)
Use of informal products. Although in many instances the poor do prefer to use informal financial services, in many other instances a formal option is simply not available and consumers turn to the informal mechanisms as the only option. In Myanmar, for every person that saves in a formal institution, five save in an informal/local institution or at home (MAP Myanmar 2014). Informal moneylender loans are more than four times the value of the current estimated retail credit market
More bread on the table: The promise and the potential of financial inclusion
7
FIGURE 3: Responses to risk events by low-income households in previous 12 months: 4 MAP countriesSources: FinScope Consumer Surveys: Swaziland 2011, Mozambique 2014, Thailand 2013, Myanmar 2013.
% o
f adu
lts
that
use
d ri
sk r
espo
nse
mec
hani
sm w
hen
risk
eve
nt o
ccur
red
% used credit
% sold something
% lowered expenses
% did nothing
% of adults thatexperienced risk
19%
14%
35%
55%
3%
25%
Swaziland
2%
17%
37%
47%
20%
Mozambique
2%
31%
20%
5%
45%
Thailand
19%
33%
13%
37%
29%
Myanmar
Mechanisms for coping with risk:
20%
40%
60%
80%
100%
% claimed insurance
% used savings
FIGURE 4: Informal vs formal saving: 7 MAP countriesSources: FinScope Consumer Surveys: Togo 2016, Myanmar 2013, Zimbabwe 2014, Burkina Faso 2016, Nepal 2014, Cambodia 2015, Lao PDR 2014.
22%
5%
30%
4%
23%
10%
31%
9%
33%
26%25%
7%
53%
25%
Togo Myanmar Zimbabwe Burkina Faso Nepal Cambodia Lao PDR
Informal savings
Bank savings
MAP Global Insights Note 1VOLUME 2
8
and this reflects savings that individuals opt to privately intermediate. More than 10% of adults noted that they save in gold. Figure 4 shows the popularity of saving with a bank vs informal savings in seven of the MAP countries.
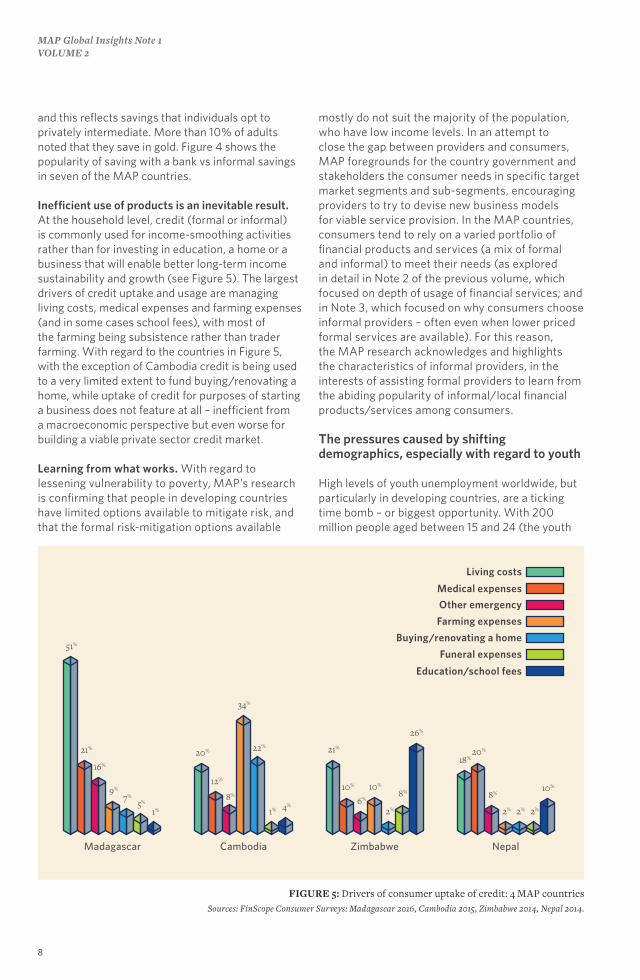
Inefficient use of products is an inevitable result. At the household level, credit (formal or informal) is commonly used for income-smoothing activities rather than for investing in education, a home or a business that will enable better long-term income sustainability and growth (see Figure 5). The largest drivers of credit uptake and usage are managing living costs, medical expenses and farming expenses (and in some cases school fees), with most of the farming being subsistence rather than trader farming. With regard to the countries in Figure 5, with the exception of Cambodia credit is being used to a very limited extent to fund buying/renovating a home, while uptake of credit for purposes of starting a business does not feature at all – inefficient from a macroeconomic perspective but even worse for building a viable private sector credit market.
Learning from what works. With regard to lessening vulnerability to poverty, MAP’s research is confirming that people in developing countries have limited options available to mitigate risk, and that the formal risk-mitigation options available
mostly do not suit the majority of the population, who have low income levels. In an attempt to close the gap between providers and consumers, MAP foregrounds for the country government and stakeholders the consumer needs in specific target market segments and sub-segments, encouraging providers to try to devise new business models for viable service provision. In the MAP countries, consumers tend to rely on a varied portfolio of financial products and services (a mix of formal and informal) to meet their needs (as explored in detail in Note 2 of the previous volume, which focused on depth of usage of financial services; and in Note 3, which focused on why consumers choose informal providers – often even when lower priced formal services are available). For this reason, the MAP research acknowledges and highlights the characteristics of informal providers, in the interests of assisting formal providers to learn from the abiding popularity of informal/local financial products/services among consumers.
The pressures caused by shifting demographics, especially with regard to youth
High levels of youth unemployment worldwide, but particularly in developing countries, are a ticking time bomb – or biggest opportunity. With 200 million people aged between 15 and 24 (the youth
FIGURE 5: Drivers of consumer uptake of credit: 4 MAP countriesSources: FinScope Consumer Surveys: Madagascar 2016, Cambodia 2015, Zimbabwe 2014, Nepal 2014.
7%
5%
1%
16%
9%
51%
21% 22%
1% 4%8%
34%
20%
12%
2%
8%
26%
6%
10%
21%
10%
2% 2%
10%
8%
2%
18%20%
Madagascar Cambodia Zimbabwe Nepal
Other emergency
Farming expenses
Buying/renovating a home
Funeral expenses
Education/school fees
Living costs
Medical expenses

More bread on the table: The promise and the potential of financial inclusion
9
bracket), Africa has the youngest population in the world. Africa’s growing youth population comes with high energy, creativity and talents – only to be stymied by lack of employment opportunities, which has the potential to undermine social cohesion and political stability: in Africa, three out of five young people are unemployed, while in Southeast Asia and the Pacific, youth unemployment rates are six times those of adults (Baah-Boateng 2016).
Young, hungry and disillusioned
Most of the MAP countries have large youth populations (those aged 15–24), and in general also a large proportion of the population 34 years old or younger. When MAP first began its in-country research (with the six countries that were the focus of the first volume), it did not have a particular focus on youth. The assumption, if any, was that youth represented countries’ hopes for the future and that young people, in their prime, had much to contribute. By virtue of the MAP focus on target market segmentation, however, it has become evident that in most of the MAP countries, youth constitute a large proportion of the ‘dependants’ target market segment, a finding that was slightly unexpected. Unchecked, what is potentially a youth dividend could become a youth burden on an older, working population.
The MAP research into the youth aspect of the dependants target market segment is ongoing in the MAP countries, as the findings continue to yield surprises and potential areas for policy intervention and improved service provision.
Economic participation. Focusing in on Burkina Faso, Cambodia, Madagascar and Togo, Figure 6 provides a breakdown of youth labour-force statistics in those four MAP countries in terms of four types of economic participation: farming, being a dependant, being informally employed, and having a salaried job. The data demonstrates that less than a third of youth have formal-sector jobs. Most are involved in family (subsistence) farming and dependent on another family member for a livelihood.
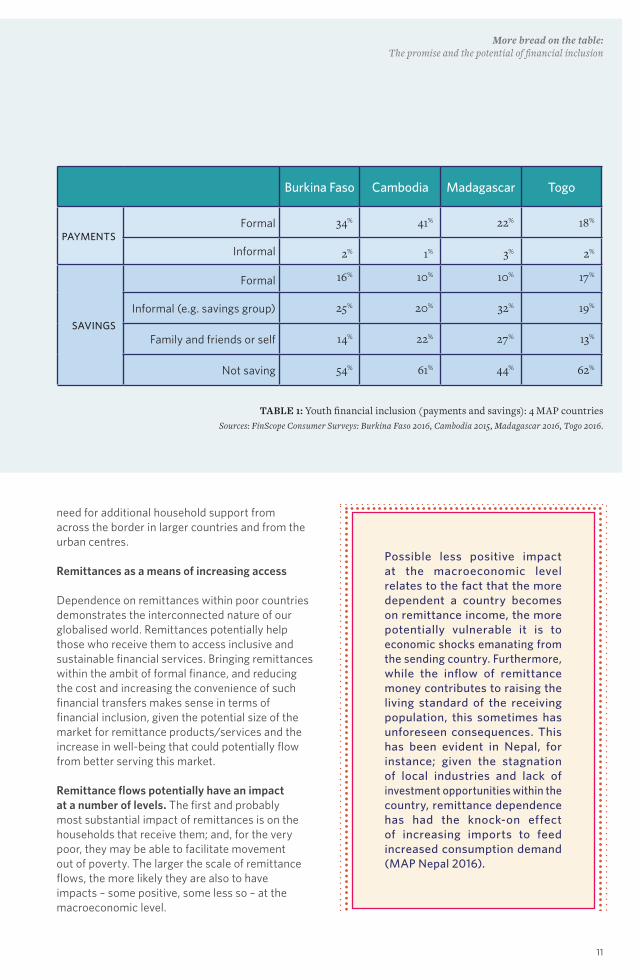
Some uptake of formal services but informal is favoured – with many not saving. In the example of Burkina Faso, Cambodia, Madagascar and Togo for which we indicate labour-force participation, savings among the youth are driven by reliance on informal mechanisms (see Table 1). In each of the four countries, a high percentage of the youth do not save at all (formally or informally).
The urgency of addressing the youth employment question is illustrated by the fact that, since the beginning of the decade, the youth have shown increasing signs of frustration in the form of demonstrations, rebellions and armed conflict – from the Arab world, stretching down to the southern tip of Africa. The ‘infectiousness’ of the Arab Spring revolutions was largely caused by youth in Tunisia, Egypt, Libya, Syria and elsewhere realising that their generation was living in an undignified, liminal state of pre-adulthood, and they demanded access to education and jobs (Mulderig 2011), as well as improved governance. Similarly, South Africa’s youth have expressed their dissatisfaction in the nationwide ‘#FeesMustFall’ protests (which started in October 2015 and are ongoing to some extent) against the high costs of university education in South Africa. Not all protesting students come from poor backgrounds but they all agree about one thing; lower fees represent access, both to higher education and to a better, more prosperous life (Baloyi & Isaacs 2015). In South Africa, in 2014, 51.7% of young people aged 15–34 had never worked before; in addition, 31.3% of young people were not in education, employment or training (NEET) (Statistics South Africa 2015: 3).
A finding that is of interest, because it seems somewhat anomalous given the other data on these consumers, is the comparatively high percentages of the youth in these countries using formal payment mechanisms; the initial MAP speculation is that this is perhaps driven by high levels of mobile phone ownership and uptake of mobile money services. But this assumption needs testing through further research and engagement with local stakeholders.
Economic empowerment of women accelerates efforts to reduce inequality. Women and girls are underrepresented in economic and political decision-making, face barriers to equal participation in the formal economy, earn less, and have unequal access to assets and property. A recent McKinsey

MAP Global Insights Note 1VOLUME 2
10
study highlighted that focusing on narrowing the global gender gap could double the contribution of women to global GDP growth by 2025 (Woetzel et al. 2016).
MAP Lesotho (2014) showed that about a third of the population is remittance-dependent (termed ‘private dependants’ to distinguish them from those on government grants), and of these:
• Just under 80% are female.• About 39% are youth (aged 18–24).• 70% are rurally based.• 62% have either non-formal or only
primary education.
These dependants, despite having a low average income, are found to be a highly active economic group, with a correspondingly wide range of financial service needs (MAP Lesotho 2014). This, combined with the finding that being a remittance receiver tends to shift more of the household financial decision-making power into the hands of women, has propelled this group ‘onto the MAP radar’ as a viable focus for government and stakeholder efforts to improve financial inclusion in Lesotho (Notes 2, 3 and 4 of the current volume report further on related projects).
FIGURE 6: Youth labour-force participation: 4 MAP countriesSources: FinScope Consumer Surveys: Burkina Faso 2016, Cambodia 2015, Madagascar 2016, Togo 2016.
48%
23% 23%
7%
45%
11%
25%
18%
50%
20%24%
6%
23%
35%34%
8%
Burkina Faso Cambodia Madagascar Togo
Informal employment
Salaried job
Farming (mainly subsistence)
Dependant
Remittances provide critical income and food security to the poor
Remittances have overtaken ODA as a source of revenue in developing countries, and have a significant role to play in financing development. In countries as diverse as India and Philippines, remittances account for a very large proportion of GDP and of national savings. According to IFAD (2015), approximately 25 countries receive 10% or more of their GDP from remittances. In countries such as Tajikistan, remittances account for 42% of GDP, and estimates for Somalia are close to 50%. On average in those countries, remittances account for close to 40% of family income, prompting some to call remittances the ‘world’s largest poverty alleviation programme’ (IFAD 2015).
Across the MAP countries, remittances remain a critical income source for poor households. Almost a third of people in most MAP countries are reliant on remittances for their daily livelihoods, meaning that remittances are fulfilling critical needs back home to ensure that people are fed and have access to basic services. Day-to-day needs are fundamentally not being met within the current MAP country contexts, hence the
More bread on the table: The promise and the potential of financial inclusion
11
TABLE 1: Youth financial inclusion (payments and savings): 4 MAP countriesSources: FinScope Consumer Surveys: Burkina Faso 2016, Cambodia 2015, Madagascar 2016, Togo 2016.
Burkina Faso Cambodia Madagascar Togo
PAYMENTSFormal 34% 41% 22% 18%
Informal 2% 1% 3% 2%
SAVINGS
Formal 16% 10% 10% 17%
Informal (e.g. savings group) 25% 20% 32% 19%
Family and friends or self 14% 22% 27% 13%
Not saving 54% 61% 44% 62%
need for additional household support from across the border in larger countries and from the urban centres.
Remittances as a means of increasing access
Dependence on remittances within poor countries demonstrates the interconnected nature of our globalised world. Remittances potentially help those who receive them to access inclusive and sustainable financial services. Bringing remittances within the ambit of formal finance, and reducing the cost and increasing the convenience of such financial transfers makes sense in terms of financial inclusion, given the potential size of the market for remittance products/services and the increase in well-being that could potentially flow from better serving this market.
Remittance flows potentially have an impact at a number of levels. The first and probably most substantial impact of remittances is on the households that receive them; and, for the very poor, they may be able to facilitate movement out of poverty. The larger the scale of remittance flows, the more likely they are also to have impacts – some positive, some less so – at the macroeconomic level.
Possible less positive impact at the macroeconomic level relates to the fact that the more dependent a country becomes on remittance income, the more potentially vulnerable it is to economic shocks emanating from the sending country. Furthermore, while the inflow of remittance money contributes to raising the living standard of the receiving population, this sometimes has unforeseen consequences. This has been evident in Nepal, for instance; given the stagnation of local industries and lack of investment opportunities within the country, remittance dependence has had the knock-on effect of increasing imports to feed increased consumption demand (MAP Nepal 2016).

MAP Global Insights Note 1VOLUME 2
12
As Figure 7 indicates, in relation to eight of the MAP countries, dependence on income from others, including remittances, is quite substantial. Almost a third of adult Zimbabweans – estimated at 3.3 million – now live outside the country. The remittances they send home to family and friends, at 13% of GDP, are now a significant source of foreign funding flowing into the country. This, in conjunction with regulatory reform, has spawned a healthy and competitive market in remittance services. Whereas just five years ago the majority of cross-border remittances into Zimbabwe used informal channels, an increasing proportion of remittances now flows through formal channels, as providers are increasingly able to offer consumers more affordable and accessible formal money transfer options.
Making ends meet from afar
Remittance income for the most part spent on survival. The MAP data indicates, however, that the majority of remittances are typically used to finance day-to-day living expenses. Many migrants are simply unable to earn enough to accumulate substantial funds for investment.
‘Money that we send home is not used for farming nor for business.’ (Lesotho, female focus group, migrant)
‘The money is all used for family needs and there is always none left to start a business.’ (Lesotho, female focus group, migrant)
‘...remittances are not used for business purposes, whether big or small. Money is often sent to cover certain needs. The money that is sent is little and after all is done, nothing remains to start a business.’ (Lesotho, female focus group, migrant)
Because of its role in reducing the financial risks facing a household, the mere presence of migration and remittances is thus arguably a component of poverty reduction.
In Nepal, despite the encouraging figures in remittance incomes – which have aided the nation in increasing the volume of foreign reserves, maintaining a balance-of-payments surplus and bolstering incomes – investment of the received remittances in productive sectors has, according to 2014/15 figures from the country’s finance ministry, remained low. Of Nepali adults who receive remittances:
• 57% spend the remittance money on buying food. • 14% save the remittance money.
• 7% use the remittance money to buy land or a house.
• 7% invest the remittance money in business (MAP Nepal 2016).
Many benefit from each remittance transfer. In the Nepal example, almost all the respondents indicated that they depend solely on the income provided by the migrant worker and that their families would not have an alternative means of income. While primary schooling is free in that country, as children enter high school the costs of education are often covered almost entirely by remittances. The research found that remittances are also quite frequently used to defray agricultural costs, including paying herd boys, purchasing feed to supplement poor rangelands, and paying for medicine for livestock.
In Lesotho too a remittance survey undertaken by FinMark Trust (Truen et al. 2016) showed that the primary financial goal of most households was simply to buy enough food, followed by saving for funerals and retirement, and meeting education costs (see Figure 8). Households said they were finding it difficult to meet their financial commitments and needs, which suggests widespread food insecurity.
Most remitters feel that their money is vital to the continued well-being of recipient households. In MAP’s research on remittance in Malawi, it was found that many of the remittance senders supported children still living in Malawi, and supplied funds to pay for healthcare costs of family members as necessary. They were typically supporting multiple individuals back home.
Moderator: ‘The people that you are sending money to, if you count them?’
Focus-group respondent: ‘The people: from my in-law they are 8; from my mother they are 7.’
Focus-group respondent: ‘It’s going to be a disaster because with the money that we send, they are paying electricity, they are paying for water; if you don’t pay it means they have to cut, they will suffer because if I didn’t send money they will never farm because they need to buy fertiliser, to put people to help them, so if I didn’t send they will never farm and there will be hunger.’ (Malawi, female focus group)
Changing gender dynamics and shifting power
The MAP research has found that both access to and usage of financial services and products

More bread on the table: The promise and the potential of financial inclusion
13
FIGURE 7: Dependence on income from others (including remittances): 8 MAP countriesSource: FinScope Consumer Surveys: Zimbabwe 2014, Malawi 2014, Thailand 2013, Myanmar 2013, Swaziland 2011,
Mozambique 2014, Lesotho 2011, Botswana 2014.
% o
f adu
lts th
at a
re c
lass
ified
as
depe
ndan
ts
15%
Zimbabwe
17%
Malawi
26%
Thailand
27%
Myanmar
27%
Swaziland
30%
Mozambique
35%
Lesotho
36%
Botswana
33%
16%14%
10%7%
7%
4%
3%
2%
Buying enough food
Funerals/retirement
Education costs
Clothes
Agriculture costs
Pay off debt
Savings club
Investing in assets
Medical costs
FIGURE 8: Household financial goals (Lesotho
remittance survey)Source: Truen et al. (2016).

MAP Global Insights Note 1VOLUME 2
14
have strong gender dimensions in all of the MAP countries. For instance, the research in Nepal highlighted the effect incoming remittance tends to have on household power dynamics; in that highly patriarchal society, the fact that most migrants are male and the majority of remittance receivers female means a significant shift of wealth into the hands of female members of the population. The female left behind to run the household has to become a decision-maker in day-to-day financial services usage, even if major decisions are still made in combination with the male spouse/family member who has migrated. Similar gender dynamics and power shifts were found in Lesotho (as mentioned in the previous sub-section) and Swaziland on the basis of remittance income.
Rising female economic participation rates can provide countries with a ‘double dividend’, as women are more likely than men to use their earnings and their bargaining power to buy goods and services that improve the family’s welfare (Goldman Sachs 2014). Rising female participation rates in the economy and in the labour market can mean both better and better-quality growth. Financial inclusion has long fostered women’s economic participation through the early iterations of microfinance and its focus on informal savings groups, and is thus able to build on this ground work.
Taking the learnings on remittances further. Note 2 of the previous volume alluded to the research finding from FinScope Mozambique (2014) that people in that country often have a bank account simply for purposes of receiving remittance payments, arguing that such consumers, while technically ‘financially included’, are actually very thinly served; in other words, these is low depth of usage of financial products/services. Note 4 of the previous volume reported the same for Thailand, and summed up that in the six MAP pilot countries the finding was that the dominant use for bank accounts was for encashment purposes – to turn a salary, grant receipt or remittance into cash as soon as it is received.
Notes 2, 3 and 4 of the current volume report in more detail on the cross-border remittance project under way in Lesotho on the basis of the initial MAP research, and on MAP’s related ongoing work with government and local stakeholders in Mozambique, Zimbabwe, the DRC and Malawi, respectively, to increase financial inclusion by reusing and adapting the learnings from the Lesotho remittance case.
Supporting MSMEs can accelerate innovation, employment and growth
MSMEs constitute the lion’s share of the real economy in developing countries – in terms of both number of organisations as a percentage of total firms and their collective contribution to GDP. Hence, any improvement in this segment of firms, whether through improved productivity or increased growth, translates directly into positive contributions to the overall economy of these countries and improved well-being at the household level. And yet a significant portion of MSMEs remain financially excluded.
Focusing interventions to grow the real economy
Given lack of formal-sector employment, most MSMEs are micro-businesses, born out of necessity:
• In Nepal: informal MSMEs are a major constituent of the country’s informal economy, contributing approximately 38% of GDP (FinScope 2014).
• In Lesotho: 97% of all businesses are micro-businesses, with an annual turnover of under R200,000 (US$29,000) and a maximum of 4 employees. Only 18% of all MSMEs are registered, and only a small proportion of the businesses are likely to be potentially high-growth ones, unless they are still in their early stages (e.g. less than 2 years old) (FinScope Lesotho 2011).
• In Malawi: most MSMEs have been born out of necessity (FinScope MSME survey 2012), with 38% of MSME owners indicating that they established the business in the absence of any alternative means of earning an income. Most are also ‘survivalist’ businesses that are unlikely to employ many people (MAP Malawi 2015).
The value of segmenting MSMEs. Segmenting MSMEs by income and number of employees gives a more accurate view of the characteristics of the business and its potential to contribute to the country’s macroeconomic growth; some are surviving from day to day, which has the value of allowing the individuals and households that run them to make a living, while others could reasonably be estimated to have the potential to yield significant growth. Segmenting MSMEs makes it possible to recognise and use differentiated policy approaches to cater to their differing financial service needs and support their potential contributions to the achievement of the country’s policy objectives.
More bread on the table: The promise and the potential of financial inclusion
15
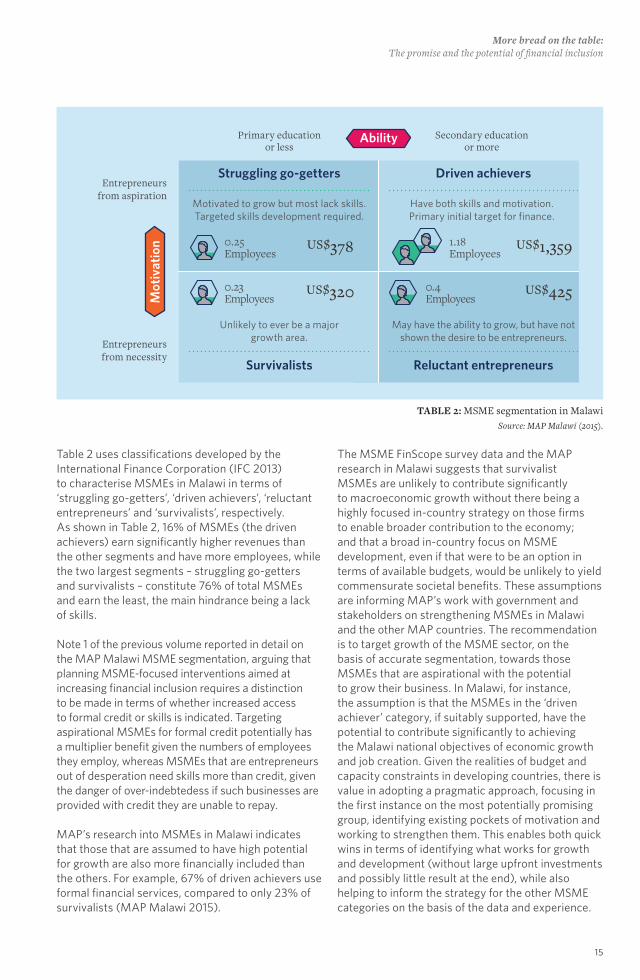
Table 2 uses classifications developed by the International Finance Corporation (IFC 2013) to characterise MSMEs in Malawi in terms of ‘struggling go-getters’, ‘driven achievers’, ‘reluctant entrepreneurs’ and ‘survivalists’, respectively. As shown in Table 2, 16% of MSMEs (the driven achievers) earn significantly higher revenues than the other segments and have more employees, while the two largest segments – struggling go-getters and survivalists – constitute 76% of total MSMEs and earn the least, the main hindrance being a lack of skills.
Note 1 of the previous volume reported in detail on the MAP Malawi MSME segmentation, arguing that planning MSME-focused interventions aimed at increasing financial inclusion requires a distinction to be made in terms of whether increased access to formal credit or skills is indicated. Targeting aspirational MSMEs for formal credit potentially has a multiplier benefit given the numbers of employees they employ, whereas MSMEs that are entrepreneurs out of desperation need skills more than credit, given the danger of over-indebtedess if such businesses are provided with credit they are unable to repay.
MAP’s research into MSMEs in Malawi indicates that those that are assumed to have high potential for growth are also more financially included than the others. For example, 67% of driven achievers use formal financial services, compared to only 23% of survivalists (MAP Malawi 2015).
0.25Employees
Mot
ivat
ion
Ability
Struggling go-getters Driven achievers
Survivalists Reluctant entrepreneurs
Entrepreneurs from aspiration
Primary education or less
Secondary educationor more
Entrepreneurs from necessity
Motivated to grow but most lack skills.Targeted skills development required.
Have both skills and motivation.Primary initial target for finance.
Unlikely to ever be a major growth area.
May have the ability to grow, but have not shown the desire to be entrepreneurs.
US$378
0.23Employees
US$320 0.4Employees
US$425
1.18Employees
US$1,359
TABLE 2: MSME segmentation in MalawiSource: MAP Malawi (2015).
The MSME FinScope survey data and the MAP research in Malawi suggests that survivalist MSMEs are unlikely to contribute significantly to macroeconomic growth without there being a highly focused in-country strategy on those firms to enable broader contribution to the economy; and that a broad in-country focus on MSME development, even if that were to be an option in terms of available budgets, would be unlikely to yield commensurate societal benefits. These assumptions are informing MAP’s work with government and stakeholders on strengthening MSMEs in Malawi and the other MAP countries. The recommendation is to target growth of the MSME sector, on the basis of accurate segmentation, towards those MSMEs that are aspirational with the potential to grow their business. In Malawi, for instance, the assumption is that the MSMEs in the ‘driven achiever’ category, if suitably supported, have the potential to contribute significantly to achieving the Malawi national objectives of economic growth and job creation. Given the realities of budget and capacity constraints in developing countries, there is value in adopting a pragmatic approach, focusing in the first instance on the most potentially promising group, identifying existing pockets of motivation and working to strengthen them. This enables both quick wins in terms of identifying what works for growth and development (without large upfront investments and possibly little result at the end), while also helping to inform the strategy for the other MSME categories on the basis of the data and experience.
MAP Global Insights Note 1VOLUME 2
16
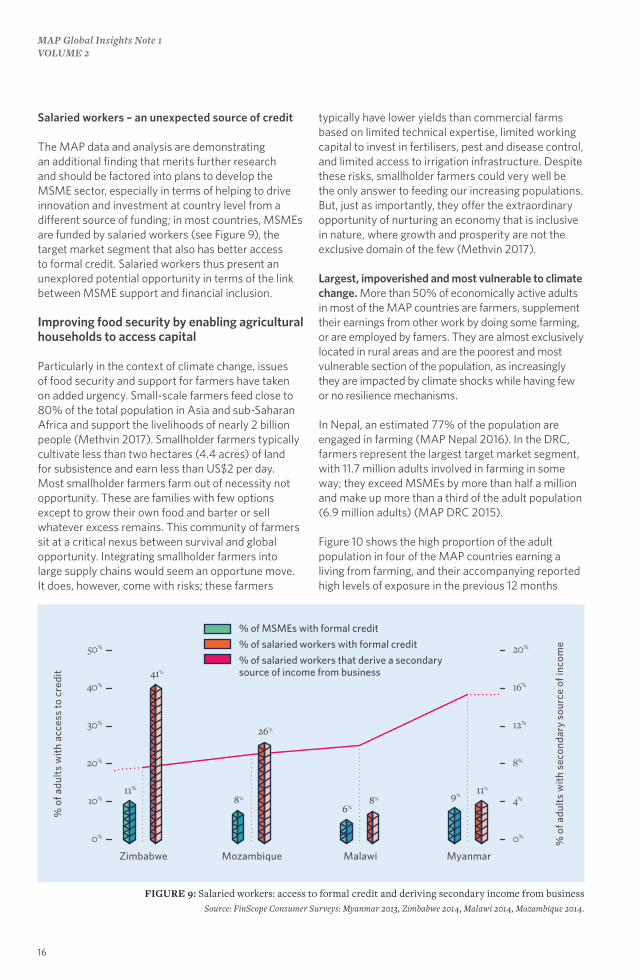
FIGURE 9: Salaried workers: access to formal credit and deriving secondary income from businessSource: FinScope Consumer Surveys: Myanmar 2013, Zimbabwe 2014, Malawi 2014, Mozambique 2014.
% of MSMEs with formal credit
% of salaried workers with formal credit
% of salaried workers that derive a secondarysource of income from business
Zimbabwe Mozambique Malawi Myanmar
% o
f adu
lts
wit
h ac
cess
to c
redi
t
% o
f adu
lts
wit
h se
cond
ary
sour
ce o
f inc
ome
41%
11%
26%
8% 8%
6%
11%
9%
20%
16%
12%
8%
4%
0%
50%
40%
30%
20%
10%
0%
Salaried workers – an unexpected source of credit
The MAP data and analysis are demonstrating an additional finding that merits further research and should be factored into plans to develop the MSME sector, especially in terms of helping to drive innovation and investment at country level from a different source of funding; in most countries, MSMEs are funded by salaried workers (see Figure 9), the target market segment that also has better access to formal credit. Salaried workers thus present an unexplored potential opportunity in terms of the link between MSME support and financial inclusion.
Improving food security by enabling agricultural households to access capital
Particularly in the context of climate change, issues of food security and support for farmers have taken on added urgency. Small-scale farmers feed close to 80% of the total population in Asia and sub-Saharan Africa and support the livelihoods of nearly 2 billion people (Methvin 2017). Smallholder farmers typically cultivate less than two hectares (4.4 acres) of land for subsistence and earn less than US$2 per day. Most smallholder farmers farm out of necessity not opportunity. These are families with few options except to grow their own food and barter or sell whatever excess remains. This community of farmers sit at a critical nexus between survival and global opportunity. Integrating smallholder farmers into large supply chains would seem an opportune move. It does, however, come with risks; these farmers
typically have lower yields than commercial farms based on limited technical expertise, limited working capital to invest in fertilisers, pest and disease control, and limited access to irrigation infrastructure. Despite these risks, smallholder farmers could very well be the only answer to feeding our increasing populations. But, just as importantly, they offer the extraordinary opportunity of nurturing an economy that is inclusive in nature, where growth and prosperity are not the exclusive domain of the few (Methvin 2017).
Largest, impoverished and most vulnerable to climate change. More than 50% of economically active adults in most of the MAP countries are farmers, supplement their earnings from other work by doing some farming, or are employed by famers. They are almost exclusively located in rural areas and are the poorest and most vulnerable section of the population, as increasingly they are impacted by climate shocks while having few or no resilience mechanisms.
In Nepal, an estimated 77% of the population are engaged in farming (MAP Nepal 2016). In the DRC, farmers represent the largest target market segment, with 11.7 million adults involved in farming in some way; they exceed MSMEs by more than half a million and make up more than a third of the adult population (6.9 million adults) (MAP DRC 2015).
Figure 10 shows the high proportion of the adult population in four of the MAP countries earning a living from farming, and their accompanying reported high levels of exposure in the previous 12 months

More bread on the table: The promise and the potential of financial inclusion
17
to climate-related risks (defined in the FinScope Consumer Survey as drought, crop failure, rains not arriving during planned periods, and flooding). Figure 11 shows that, with the exception of Myanmar, in those countries farmers are also more financially excluded than other segments of the population.
Farmers’ resilience tested by post-harvest crop loss. In Zimbabwe, over 50% of farmers live
more than 8 hours from the nearest trading centre, and the near-complete breakdown of the country’s transportation infrastructure, most prominently outside city centres, limits consumer and market connectivity, aggregation and development. Due to a lack of effective refrigeration or storage facilities, post-harvest crop loss can reach 80% in some areas (MAP Zimbabwe 2016).
36%
30%32%
% of adult population that derive their primary income from farming
Malawi Zimbabwe Myanmar Mozambique
33%
100%
80%
60%
40%
20%
0%
% of farmers reporting experiencing climate-related risks in the previous 12 months
FIGURE 10: The farmers target market segment and their exposure to risk: 4 MAP countriesSources: FinScope Consumer Surveys: Malawi 2014, Zimbabwe 2014, Myanmar 2013, Mozambique 2014.
% of farmers that are financially excluded
% of adult population that are financially excluded
76%
69%
45%
-7
-17
+19
-19
28%
57%
76%
90%
71%
Malawi Zimbabwe Myanmar Mozambique
100%
80%
60%
40%
20%
0%
FIGURE 11: Comparison of financial exclusion: farmers vs overall adult populationSources: FinScope Consumer Surveys: Malawi 2014, Zimbabwe 2014, Myanmar 2013, Mozambique 2014.
MAP Global Insights Note 1VOLUME 2
18
Agricultural credit focused on commercial farms. In Zimbabwe, agricultural credit accounts for 16.2% of total formal credit in the market (FinScope Zimbabwe 2014). The bulk of this is lent out to commercial farmers, although these account for only 0.04% of farmers in Zimbabwe.
‘Nyarai is a commercial farmer in Kwala along with her four siblings. She grows flue-cured tobacco and profits approximately US$2,000–US$2,500 per season from her harvest. Nyarai gets an input loan from Zimbabwe Leaf Tobacco Company worth US$3,500, on the condition that she sells her produce to them. She uses the input loan to purchase items such as fertiliser and seeds, which she otherwise would not be able to afford.’ (Zimbabwe, qualitative study 2015)
Banks are, by and large, unwilling or unable to lend to smallholder farmers – even though, following Zimbabwe’s land-reform process (Scoones et al. 2011), they constitute 99.6% of all farmers (FinScope Zimbabwe 2011).
Smallholder farmers reliant on informal and group loans for inputs. In the absence of formal agricultural credit, most smallholder farmers in Zimbabwe, as in most of the other MAP countries, rely on community and other informal sources to meet their credit needs in the form of personal loans. Interest rates are typically as high as 120% per annum for these small-sized loans (Zimbabwe, stakeholder interview 2015).
In the DRC, too, subsistence farmers’ operations are limited by the difficulty of accessing formal credit, and informal saving and borrowing networks are a common support mechanism.
‘I am a member of a group of 14 farmers who meet once a week and contribute US$1. The group’s goal is to help a member in case of a problem. We withdraw an amount from the cashier to help the member in difficulty. But that amount has to be paid back later.’ (Kibumba, DRC, subsistence farmer, female)
Informal = local. Note 3 in the previous volume of the MAP Global Insights series reported the finding that, in poorer target market segments, informal credit providers are for the most part favoured over formal providers, and that much of the reason for this relates to the local nature of such providers, which gives them an edge in providing suitable products and services (the same is also true for informal savings products in many of the MAP countries).
More customised service. Increasingly, too, the MAP research is finding that with regard to providing credit to farmers and MSMEs, in particular, providers assess lenders’ risk by using a wide spectrum of variables, including expected earnings; seasonality of income and type of occupation; the individual make-up of borrowers, including their disposition to repay loans (often based on their financial conduct in informal financial savings groups); and the person’s reputation in the community. Informal/local credit providers are in a position to offer convenience of location, to waive stringent eligibility requirements, to dispense with onerous documentation, to avoid delays in issuing the loan, to be open to offering flexible repayment options and to offer small-value loans. This kind of more customised service suits those such as farmers who have income gaps and unique seasonal cash flow, and who need day-to-day consumption smoothing as well as ways to store income until they need to purchase inputs.
The key to financial product/service innovation. Understanding the cash flow and the savings and borrowing behaviour of consumers – in this case, farmers – is the key to innovation in product development. Furthermore, given gaps in banking and transportation infrastructure in developing countries, formal/remote providers need to find ways to get closer to where the people are, in the interests of offering convenient, responsible and affordable deposit-taking, payments processing, microfinancing, mortgages and insurance – in other words, all the products and services that fuel investment, create jobs, stimulate growth and increase wider societal well-being. In Nepal, for instance, a country with a highly developed culture of saving even among the very poor, government and stakeholders are using the MAP consumer data on actual savings behaviour to consider ways to partner with existing informal/local savings cooperatives and groups (MAP Nepal 2016). This is being seen as an option for expanding distribution of formal savings products/services to these groups’ substantial existing customer bases (see Note 2 of the current volume for more detail).
Infrastructure needed to build efficiency and convenience
In developing countries, development can be well served through decentralised initiatives (functional products and services meeting the unique demands of discrete target market segments) that apply across the geographic regions and sufficient

More bread on the table: The promise and the potential of financial inclusion
19
numbers of a country’s consumers. Yet several factors converge to make it difficult for formal financial providers to provide services much beyond the main urban areas.
Severe distribution challenges reinforce cash economy, lack of intermediation
Across the MAP countries, the banking infrastructure deficit beyond the key urban areas remains acute. And despite the promises and potential of digital technology to overcome the traditional constraints of physical bank branches, such as via branchless banking and agent networks, digital still depends on the presence of infrastructure – including encashment infrastructure – which is difficult to provide outside of urban areas. Thus, digital ‘solutions’ are still often constrained by geography.
Barriers to the adoption of digital services can also have a cultural dimension, as the MAP Nepal (2016) research found: a culture of tax avoidance represents a formidable barrier to the adoption of digital commerce in that country, as the proliferation of retail digital payment services has the potential to reveal the true extent of the tax base.
Lack of transportation infrastructure only compounds the lack of banking infrastructure in developing countries.
In Mozambique: Only a quarter of rural people live within 2 km of any road in the classified road network. If it is hard for citizens to travel in rural areas, it is even harder for financial institutions to install and maintain basic financial infrastructure to serve these people. This is illustrated by the fact that 47% of all bank branches, 45% of ATMs and 60% of POS devices are concentrated in Maputo City and Maputo Province, with less than 5% of these contact points present in Cabo Delgado, Zambezia and Niassa, respectively (MAP Mozambique 2015). Even within these provinces, access to financial services is concentrated in urban areas. Figure 12
FIGURE 12: Comparison of consumer proximity to a bank branch and financial inclusion: Mozambique
Source: FinScope Mozambique 2014.
100% 75% 50% 25% 0%
Cabo Delgado
Niassa
Nampula
Zambezia
Tete
Manica
Gaza
Inhambane
Maputo Province
Sofala
Number of adults
financially included
Proximity (30 minutes) to a bank branch
illustrates this by comparing proximity of adults to a bank branch (‘proximity’ here being defined as living within 30 minutes of one) with the number of adults considered financially included across and within provinces in Mozambique.
In Nepal: Transport infrastructure is limited to key corridors, which hampers efforts to both expand access to financial services and link the broader population to the national economic zones.
Financial services distribution by retailers could benefit individuals and retailers alike. The FinScope survey (2014) reports that 82% of Nepali adults

MAP Global Insights Note 1VOLUME 2
20
are within walking distance of a grocery store, compared to just 15% that are within walking distance of a bank. This suggests that accessing a grocery store would be easier and, importantly, less expensive than accessing a bank, as no transport or opportunity costs would be incurred. Retailers in Nepal, therefore, represent a potential broad touchpoint for reaching large sections of the Nepali population.
Although the number of bank branches is increasing, they are generally located in urban (82.8%) and peri-urban areas (MAP Nepal 2016). By contrast, 81% of the population is based in the rural areas. Serving a customer through a bricks-and-mortar bank branch represents a cost to the bank (renting the premises, security costs, maintenance costs, staff salaries). Furthermore, many people in rural areas feel intimidated by or uncomfortable at the prospect of transacting in a bank and interacting with bank staff, and would be more willing to access financial services from a trusted retailer who is well known to them. For these reasons, banks in Nepal are already open to exploring partnering with retailers and other local agents as a way to expand their networks.
Distributing financial services through retailers could also be highly beneficial to the retailers, as increased numbers of customers would frequent the store, which opens up the opportunity for increased profits through cross-selling. In addition, with increased customers come potentially increased volumes of digital transactions, which would make it a more viable proposition for the merchant to invest in point of sale (POS) mechanisms (for which they pay a fee to the bank), and other digital infrastructure – assuming all other requirements, such as a reliable digital network, were in place.
The MAP findings on consumer needs, preferences and actual behaviour are supporting country government and local stakeholders to explore pragmatic options for improved delivery to larger sections of their populations despite the infrastructure obstacles (banking and transportation). This thinking is an extension of the initial MAP data and findings as reported in the previous volume: in particular, Note 3, which explained the enduring popularity in the MAP countries of local financial services; Note 4, which focused on why bank accounts are not always the answer to improving consumer well-being; and Note 5, which explored why digital payments are not yet replacing cash.
Financial inclusion as the policy instrument of choice
Helping to deliver on the SDGs. In working with a particular country, financial inclusion takes into account national consumption realities and adopts a consumer-driven approach while attempting simultaneously to link to the global economy. Financial inclusion addresses the SDGs by offering complementary, incrementally implemented initiatives to tackle poverty and promote inclusive development in poor and marginalised societies. The fact that financial inclusion is a target under seven of the SDGs means that countries have a strong platform and basis on which to reflect financial inclusion in their plans and policies. Now they need to turn those into reality.
Problem-solving from the ground up. Increasing financial inclusion in a country comes neither solely from policy objectives nor from simply adopting and trying to implement ‘best practice’ reforms from elsewhere. Developing country governments have the crucial role of creating an enabling environment, in which a broad range of strategic partners at country level, armed with political will and with their different perspectives, operational models and expertise, can collaborate to discover the best-fit solutions to the country’s most pressing problems.
The value of consistent, modest effort. Emphasising robust data and analytics as the basis for problem diagnosis, and engaging country governments and local stakeholders to harness the data, the MAP approach is embedding financial inclusion implementation in modest and realistic, day-to-day improvement projects; as discussed in more detail in Notes 2, 3 and 4 of the current volume, such efforts create momentum towards more ambitiously sized projects, eventually morphing into improved in-country institutions.

More bread on the table: The promise and the potential of financial inclusion
21

MAP Global Insights Note 1VOLUME 2
22
References
Adams, S. (2012). ‘Harvard professor slams Obama's World Bank nomination.’ Forbes. Available online from: https://www.forbes.com/sites/susanadams/2012/03/23/harvard-professor-slams-obamas-world-bank-nomination/#30c0343a3db1 (accessed July 2017).
Baah-Boateng, W. (2016). The Youth Unemployment Challenge in Africa: What Are the Drivers? The Economic & Labour Relations Review May 2016 27(4), Sage.
Baloyi, B. & Isaacs, G. (2015). ‘South Africa's “fees must fall” protests are about more than tuition costs.’ CNN Africa. Available online from: http://edition.cnn.com/2015/10/27/africa/fees-must-fall-student-protest-south-africa-explainer/index.html (accessed July 2017).
BCG (Boston Consulting Group). (2016). How Governance Drives Well-being. An interview with Nobel Laureate A. Michael Spence. BCG Perspectives. Available online from: https://www.bcgperspectives.com/content/videos/public-sector-development-spence-nobel-laureate-michael-how-governance-drives-well-being/ (accessed July 2017).
Bester, H., Hougaard, C., Machena, W., Denoon-Stevens, C., Rana, W., Phelane, C. & Weideman, J. (2016). Zimbabwe Financial Inclusion Country Report. FMT Making Access Possible (MAP) Programme.
Calderón, C. & Liu, L. (2003). The Direction of Causality between Financial Development and Economic Growth. Journal of Development Economics 72: 321–334. Available online from: www.isid.ac.in/~tridip/Teaching/DevEco/Readings/07Finance/05King&Levine-QJE1993.pdf (accessed July 2017).
Chamberlain, D., Bester, H., Smit, H., Loots, C., Mburu, S., Dermish, A. & Gidvani, L. (2014). Myanmar Demand, Supply and Policy Diagnostic Report. UNCDF Making Access Possible (MAP) Programme. Available online from: http://cenfri.org/making-access-possible/map-myanmar (accessed April 2017).
Estey, N., Cooper, B., Hougaard, C., Chamberlain, D. & Weiderman, J. (2015). Mozambique Demand, Supply, Policy and Regulation Diagnostic Report. UNCDF Making Access Possible (MAP) Programme. Available online from: http://cenfri.org/making-
access-possible/map-mozambique (accessed April 2017).
FinMark Trust. (2011). FinScope Consumer Survey Lesotho. Available online from: http://www.finmark.org.za/finscope/consumer_lesotho/?title=FinScope%20Consumer (accessed April 2017).
FinMark Trust. (2011). FinScope Consumer Survey Swaziland. Available online from: http://www.finmark.org.za/finscope/consumer_swaziland/?title=FinScope%20Consumer (accessed April 2017).
FinMark Trust. (2011). FinScope Zimbabwe Consumer Survey 2011. Available online from: http://www.finmark.org.za/finscope-consumer-survey-zimbabwe-2011-4/ (accessed July 2017).
FinMark Trust. (2012). FinScope MSME Survey Malawi. Available online from: http://www.finmark.org.za/publication/finscope-malawi-2012-msme-survey (accessed February 2017).
FinMark Trust. (2013). FinScope Consumer Survey Myanmar. Available online from: http://www.finmark.org.za/finscope/consumer_myanmar/?title=FinScope%20Consumer (accessed April 2017).
FinMark Trust. (2013). FinScope Consumer Survey Thailand. Available online from: http://www.finmark.org.za/finscope/consumer_thailand/?title=FinScope%20Consumer (accessed February 2017).
FinMark Trust. (2014). FinScope Consumer Survey Botswana. Available online from: http://www.finmark.org.za/finscope-consumer-survey-botswana-2014/ (accessed July 2017).
FinMark Trust. (2014). FinScope Consumer Survey DRC 2014. Available online from: http://www.finmark.org.za/finscope-consumer-survey-drc-2014/ (accessed August 2017).
FinMark Trust. (2014). FinScope Consumer Survey Malawi. Available online from: http://www.finmark.org.za/finscope/consumer_malawi/?title=FinScope%20Consumerr (accessed February 2017).

More bread on the table: The promise and the potential of financial inclusion
23
FinMark Trust. (2014). FinScope Consumer Survey Mozambique. Available online from: http://www.finmark.org.za/publication/finscope-mozambique-consumersurvey-2014 (accessed April 2017).
FinMark Trust. (2014). FinScope Nepal 2014 Consumer Survey. Available online from: http://www.finmark.org.za/consumer_nepal/ (accessed July 2017).
FinMark Trust. (2014). FinScope Consumer Survey Swaziland. Available online from: http://www.finmark.org.za/finscope-swaziland-2014-consumer-survey-results/ (accessed August 2017).
FinMark Trust. (2014). FinScope Zimbabwe Consumer Survey 2014. Available online from: http://www.finmark.org.za/finscope-zimbabwe-consumer-survey-2014/ (accessed July 2017).
FinMark Trust. (2015). FinScope Consumer Survey Cambodia. Available online from: http://www.finmark.org.za/finscope-cambodia-2015-pocket-guide/ (accessed August 2017).
FinMark Trust. (2015). FinScope Consumer Survey Lao People’s Democratic Republic 2014. Available online from: http://www.finmark.org.za/finscope-consumer-survey-lao-peoples-democratic-republic/ (accessed August 2017).
FinMark Trust. (2016). FinScope Consumer Survey Madagascar 2016. Available online from: http://www.finmark.org.za/wp-content/uploads/2016/11/finscope-madagascar-2016-launch-presentation_en-1-1030x773.jpg (accessed August 2017).
FinMark Trust. (2016). FinScope Consumer Survey Togo 2016. Available online from: http://www.finmark.org.za/finscope-consumer-survey-togo-2016/ (accessed July 2017).
FinMark Trust. (2016). Lesotho 2016. Micro, Small and Medium Enterprises (MSMEs). Available online from: http://www.finmark.org.za/finscope-lesotho-pocket-guide/ (accessed August 2017).
FinMark Trust. (2017). FinScope Consumer Survey Burkina Faso 2016. Available online from: http://www.finmark.org.za/finscope-consumer-survey-burkina-faso/ (accessed August 2017).
Goldman Sachs. (2014). Giving Credit where It Is Due: How Closing the Credit Gap for Women-owned SMEs Can Drive Global Growth. Goldman Sachs Global Market Institute.
IFAD (International Fund for Agricultural Development), World Bank Group. (2015). The Use of Remittances and Financial Inclusion. Available online from: https://www.ifad.org/documents/10180/5bda7499-b8c1-4d12-9d0a-4f8bbe9b530d (accessed July 2017).
IFC (International Finance Corporation). 2013. Investment Climate. Available online from: www.ifc.org/wps/wcm/connect/18e4cb804f7cdfd7b7f6ff0098cb14b9/chapter5.pdf?MOD=AJPERES (accessed April 2014).
Levine, R. (1997). Financial Development and Economic Growth: Views and Agenda. Journal of Economic Literature XXXV June: 688–726. Available online from: https://pascal.iseg.utl.pt/~aafonso/eif/pdf/Levine.pdf (accessed July 2017).
McKinsey Global Institute. (2012). Africa at Work: Job Creation and Inclusive Growth. Available online from: https://www.canback.com/files/2013_MGI_Africa_at_work_August_2012_Full_Report.pdf (accessed June 2017).
Methvin, T. (2017). Small Farmers are the Future of Global Food Security. ImpactAlpha. Available online from: http://impactalpha.com/small-farmers-are-the-future-of-global-food-security/ (accessed July 2017).
Mulderig, M.C. (2011). Adulthood Denied: Youth Dissatisfaction and the Arab Spring. Boston, MA: The Frederick S. Pardee Center for the Study of the Longer-Range Future.
Scoones, I., Marongwe, N., Mavedzenge, B., Murimbarimba, F., Mahenehene, J. & Sukume, C. (2011). Zimbabwe’s Land Reform: Challenging the Myths. The Journal of Peasant Studies 38: 967–993. Available online from: http://www.tandfonline.com/doi/abs/10.1080/03066150.2011.622042 (accessed July 2017).
Shakya, S., Bhaju, S., Shrestha, S., Tuladhar, R. & Tuladhar, S. (2016). Nepal Detailed Country Report 2016. Patan, Nepal: Beed, in association with Cenfri Making Access Possible (MAP) Programme. Available
MAP Global Insights Note 1VOLUME 2
24
online from: https://issuu.com/nepaleconomicforum/docs/nepal_report_final_web (accessed July 2017).
Statistics South Africa. (2015). Labour Market Dynamics in South Africa, 2014. Pretoria: Statistics South Africa.
Thom, M., Cooper, B., Gray, J., Denoon-Stevens, C. & Van der Linden, A. (2015). Malawi Demand, Supply, Policy and Regulation Diagnostic Report. FMT Making Access Possible (MAP) Programme.
Truen, S., Jitsing, W., Kgaphola, K., Chisadza, S., Majoro, M., Foshizi [Black Consumer Insight Agency], Jimson, L., Imani Consulting & Africa Corporate Advisors. (2016). The Impact of Remittances in Lesotho, Malawi and Zimbabwe. Midrand: FinMark Trust. Available online from: http://www.finmark.org.za/the-impact-of-remittances-in-lesotho-malawi-and-zimbabwe/ (accessed July 2017).
UNDP (United Nations Development Programme) & UNRISD (United Nations Research Institute for Social Development (UNRISD). (2017). Global Trends. Challenges and Opportunities in the Implementation of the Sustainable Development Goals. New York and Geneva: UNDP and UNRISD.
Woetzel, J., Madgavkar, A., Manyika, J., Ellingrud, K., Hunt, V. & Krishnan, M. (2016) Realizing Gender Equality’s $12 Trillion Economic Opportunity. McKinsey Global Institute. Available online from: http://www.mckinsey.com/global-themes/employment-and-growth/realizing-gender-equalitys-12-trillion-economic-opportunity (accessed July 2017).
World Bank. (2016). Poverty and Shared Prosperity 2016: Taking on Inequality. Washington, DC: World Bank. doi:10.1596/978-1-4648-0958-3. License: Creative Commons Attribution CC BY 3.0 IGO.
25
UN Capital Development FundTwo United Nations Plaza
New York, NY [email protected] | www.uncdf.org
Tel: +1 212 906 6565 | Fax: +1 212 906 6479www.facebook.com/uncdf
www.twitter.com/uncdf
Unlocking Public and Private Finance for the Poor
About UNCDF
UNCDF is the UN’s capital investment agency for the world’s 47 least developed countries (LDCs). With its capital mandate and instruments, UNCDF offers 'last mile' finance models that unlock public and private resources, especially at the domestic level, to reduce poverty and support local economic development. This last mile is where available resources for development are scarcest; where market failures are most pronounced; and where benefits from national growth tend to leave people excluded.
UNCDF’s financing models work through two channels: savings-led financial inclusion that expands the opportunities for individuals, households, and small businesses to participate in the local economy, providing them with the tools they need to climb out of poverty and manage their financial lives; and by showing how localised investments – through fiscal decentralisation, innovative municipal finance, and structured project
finance – can drive public and private funding that underpins local economic expansion and sustainable development. UNCDF financing models are applied in thematic areas where addressing barriers to finance at the local level can have a transformational effect for poor and excluded people and communities.
By strengthening how finance works for poor people at the household, small enterprise, and local infrastructure levels, UNCDF contributes to SDG 1 on eradicating poverty with a focus on reaching the last mile and addressing exclusion and inequalities of access. At the same time, UNCDF deploys its capital finance mandate in line with SDG 17 on the means of implementation, to unlock public and private finance for the poor at the local level. By identifying those market segments where innovative financing models can have transformational impact in helping to reach the last mile, UNCDF contributes to a number of different SDGs and currently to 28 of 169 targets.
MAPMAKING ACCESS POSSIBLE

Related Documents


