CENTERS FOR DISEASE CONTROL MORBIDITY AND MORTALITY WEEKLY REPORT February 12, 1988 I Vol. 37 I No.5 69 Viral Gastroenteritis - South Dakota and New Mexico 72 Recommendations for Protecting Human Health Against Potential Adverse Effects of Long-Term Exposure to Low Doses of Chemical Warfare Agents 79 La Crosse Encephalitis in West Virginia 82 Influenza Update - · tates f' l9Be to (_, ,';..., \ ' Epidemiologic Notes and Reports /('' Viral Gastroenteritis - South Dakota and New Mex1co The following reports describe two outbreaks of viral gastroenteritis associated with contaminated water. South Dakota. An outbreak of diarrhea occurred among the 331 participants in an outing held at a South Dakota campground on August 30 and 31, 1986. During the event, in which participants hiked 10 or 20 km, water and a reconstituted soft drink were available at rest stands. The State Department of Health conducted a survey of 181 participants: 135 (75%) of these persons reported a gastrointestinal illness. Symptoms most frequently reported were diarrhea (69%), explosive vomiting (55%), nausea (49%), headache (47%), abdominal cramping (46%), and fever (36%). None of the participants required hospitalization. Attack rates by sex and age of patients were virtually equal. Onset of illness occurred 35 hours (mean) after arrival at the campground, and duration of illness was about 33 hours. A biotin-avidin immunoassay performed at CDC yielded a fourfold rise in antibody titer to Norwalk virus in seven of 11 paired human serum specimens. No pathogenic bacterial or parasitic agents were identified from stool samples. Illness was strongly associated with the consumption of water or the reconstituted powdered soft drink made with water. No other foodstuffs were implicated. The implicated water came from a well at the campground. A yard hydrant was located next to a septic dump station, where sewage from self-contained septic tanks and portable toilets in the park was collected. Water from this hydrant had been used to fill water coolers and to prepare the powdered soft drink. Laboratory analyses of remaining water and reconstituted soft drink samples showed bacterial contamination (fecal coliforms > 1,600 cful100 ml). Chlorine was stored in a tank and then drawn directly into the water system by a pump without a monitoring system. Water samples obtained from various locations in the campground had excess coliforms when the chlorination U.S. DEPARTMENT OF HEALTH AND HUMAN SERVICES I PUBLIC HEALTH SERVICE

Welcome message from author
This document is posted to help you gain knowledge. Please leave a comment to let me know what you think about it! Share it to your friends and learn new things together.
Transcript

CENTERS FOR DISEASE CONTROL
MORBIDITY AND MORTALITY WEEKLY REPORT
February 12, 1988 I Vol. 37 I No.5
69 Viral Gastroenteritis - South Dakota and New Mexico
72 Recommendations for Protecting Human Health Against Potential Adverse Effects of Long-Term Exposure to Low Doses of Chemical Warfare Agents
79 La Crosse Encephalitis in West Virginia 82 Influenza Update - · tates
~\'ji415~6t,>
f' Rt.~~~ l9Be to (_, ,';..., \ '
Epidemiologic Notes and Reports \~~ ,~;f,)V ~·; ~o!i, /(''
~~~/ Viral Gastroenteritis - South Dakota and New Mex1co
The following reports describe two outbreaks of viral gastroenteritis associated with contaminated water.
South Dakota. An outbreak of diarrhea occurred among the 331 participants in an outing held at a South Dakota campground on August 30 and 31, 1986. During the event, in which participants hiked 10 or 20 km, water and a reconstituted soft drink were available at rest stands. The State Department of Health conducted a survey of 181 participants: 135 (75%) of these persons reported a gastrointestinal illness. Symptoms most frequently reported were diarrhea (69%), explosive vomiting (55%), nausea (49%), headache (47%), abdominal cramping (46%), and fever (36%). None of the participants required hospitalization. Attack rates by sex and age of patients were virtually equal. Onset of illness occurred 35 hours (mean) after arrival at the campground, and duration of illness was about 33 hours.
A biotin-avidin immunoassay performed at CDC yielded a fourfold rise in antibody titer to Norwalk virus in seven of 11 paired human serum specimens. No pathogenic bacterial or parasitic agents were identified from stool samples. Illness was strongly associated with the consumption of water or the reconstituted powdered soft drink made with water. No other foodstuffs were implicated. The implicated water came from a well at the campground. A yard hydrant was located next to a septic dump station, where sewage from self-contained septic tanks and portable toilets in the park was collected. Water from this hydrant had been used to fill water coolers and to prepare the powdered soft drink. Laboratory analyses of remaining water and reconstituted soft drink samples showed bacterial contamination (fecal coliforms > 1,600 cful100 ml). Chlorine was stored in a tank and then drawn directly into the water system by a pump without a monitoring system. Water samples obtained from various locations in the campground had excess coliforms when the chlorination
U.S. DEPARTMENT OF HEALTH AND HUMAN SERVICES I PUBLIC HEALTH SERVICE

70 MMWR February 12, 1988
Viral Gastroenteritis - Continued
system was not operating. Fluorescent dye injected into a 5,000-gallon septic tank situated uphill from the well confirmed that the well was contaminated with sewage.
This campground was closed immediately and voluntarily by the owner. Corrective measures included relocating the well, installing an alarm system to detect malfunctions in the chlorination system, reconstructing the chlorination system to ensure that chlorine remains in contact with water in a storage tank for 30 minutes before the water is ,distributed, maintaining a daily log on chlorine residuals and sample collection points, and posting the yard hydrant as a nonpotable source of water.
New Mexico. An O\,Jtbreak of gastroenteritis occurred among the 92 guests and staff at a cabin lodge in northern New Mexico over the Labor Day weekend in 1986. The guests arrived Friday, August 29, and provided their own food for the weekend. The first persons to become ill developed diarrhea on Saturday morning, within 24 hours after arrival. By Wednesday, 36 of the guests and staff members reported symptoms: 34 had diarrhea; 9, vomiting; 14, fever; 22, abdominal cramps; and 1, bloody stools. There were no deaths or hospitalizations.
A questionnaire was administered to all 92 guests and staff to ascertain risk factors for gastroenteritis. Guests consisted of unrelated groups, and they stayed in 18 separate cabins. All 36 of the patients and 37 ofthe 56 unaffected attendees had drunk water at their cabin. A dose-response relationship was demonstrated between the amount of water consumed and the attack rate. No illness occurred among the persons who did not drink water; 33% of those drinking 1-2 cups and 59% of those drinking ~3 cups became ill. Five of the 18 cabins were unaffected; three of these belonged to families who were residents or frequent visitors at the lodge.
Assuming guests were exposed upon arrival or when they first drank water, the median incubation period was 41 hours (range = 7-110 hours). Symptoms lasted from 2-17 days, with a median of 5 days.
The cabins were supplied with water taken from a stream and processed through a small chlorinator and a storage tank that was periodically iodized. A filter had been removed recently from the pipe because it repeatedly became plugged with debris. A severe rainstorm occurred the evening the guests arrived, resulting in increased water turbidity.
Water samples taken at the cabins and the surface stream that supplied the cabins were positive for total coliforms and fecal coliforms. Stool samples from ill patrons were negative for pathogenic bacteria and parasites, except for one sample, from which Giardia was isolated. Convalescent-phase sera were submitted to CDC for 13 cases and 26 controls (2 per case), matched for age within 5 years, gender, and city of residence. Controls were selected from health department personnel who had not visited the lodge. No difference in Norwalk titers was found between five cases and five controls.
Under the supervision of state environmentalists, the water system was renovated before the lodge reopened, with particular emphasis on filters, the chlorinator, and the storage tank.
Reported by: PA Bonrud, MS, AL Volmer, TL Dosch, W Chalcraft, D Johnson, B Hoon, M Baker, KA Senger, State Epidemiologist, South Dakota State Dept of Health. CF Martinez, TO Madrid, MPA, RM Gallegos, MS, SP Castle, MPH, CM Powers, JA Knott, RM Gurule, MS Blanch, LJ Nims, MS, PW Gray, PA Gutierrez, MS, M Eidson, DVM, MV Tanuz, HF Hull, MD, State Epidemiologist, New Mexico Health and Environment Dept. Respiratory and Enteroviral Br, Div of Viral Diseases, Center for Infectious Diseases, CDC.
Vol. 37/ No.5 MMWR 71
Viral Gastroenteritis - Continued
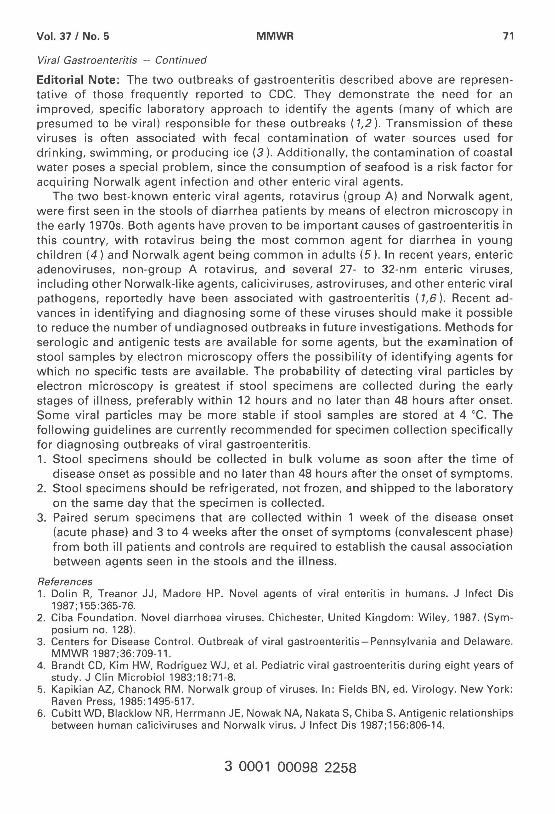
Editorial Note: The two outbreaks of gastroenteritis described above are representative of those frequently reported to CDC. They demonstrate the need for an improved, specific laboratory approach to identify the agents (many of which are presumed to be viral) responsible for these outbreaks ( 1,2 ). Transmission of these viruses is often associated with fecal contamination of water sources used for drinking, swimming, or producing ice (3 ). Additionally, the contamination of coastal water poses a special problem, since the consumption of seafood is a risk factor for acquiring Norwalk agent infection and other enteric viral agents.
The two best-known enteric viral agents, rotavirus (group A) and Norwalk agent, were first seen in the stools of diarrhea patients by means of electron microscopy in the early 1970s. Both agents have proven to be important causes of gastroenteritis in this country, with rotavirus being the most common agent for diarrhea in young children (4) and Norwalk agent being common in adults (5 ). In recent years, enteric adenoviruses, non-group A rotavirus, and several 27- to 32-nm enteric viruses, including other Norwalk-like agents, caliciviruses, astroviruses, and other enteric viral pathogens, reportedly have been associated with gastroenteritis ( 1,6 ). Recent advances in identifying and diagnosing some of these viruses should make it possible to reduce the number of undiagnosed outbreaks in future investigations. Methods for serologic and antigenic tests are available for some agents, but the examination of stool samples by electron microscopy offers the possibility of identifying agents for which no specific tests are available. The probability of detecting viral particles by electron microscopy is greatest if stool specimens are collected during the early stages of illness, preferably within 12 hours and no later than 48 hours after onset. Some viral particles may be more stable if stool samples are stored at 4 oc. The following guidelines are currently recommended for specimen collection specifically for diagnosing outbreaks of viral gastroenteritis. 1. Stool specimens should be collected in bulk volume as soon after the time of
disease onset as possible and no later than 48 hours after the onset of symptoms. 2. Stool specimens should be refrigerated, not frozen, and shipped to the laboratory
on the same day that the specimen is collected. 3. Paired serum specimens that are collected within 1 week of the disease onset
(acute phase) and 3 to 4 weeks after the onset of symptoms (convalescent phase) from both ill patients and controls are required to establish the causal association between agents seen in the stools and the illness.
References 1. Dolin R, Treanor JJ, Madore HP. Novel agents of viral enteritis in humans. J Infect Dis
1987; 155:365-76. 2. Ciba Foundation. Novel diarrhoea viruses. Chichester, United Kingdom: Wiley, 1987. (Sym
posium no. 128). 3. Centers for Disease Control. Outbreak of viral gastroenteritis- Pennsylvania and Delaware.
MMWR 1987;36:709-11. 4. Brandt CD, Kim HW, Rodriguez WJ, et al. Pediatric viral gastroenteritis during eight years of
study. J Clin Microbiol1983;18:71-8. 5. Kapikian AZ, Chanock RM. Norwalk group of viruses. In: Fields BN, ed. Virology. New York:
Raven Press, 1985: 1495-517. 6. Cubitt WD, Blacklow NR, Herrmann JE, Nowak NA, Nakata S, Chiba S. Antigenic relationships
between human caliciviruses and Norwalk virus. J Infect Dis 1987;156:806-14.
3 0001 00098 2258

72 MMWR February 12, 1988
Current Trends
Recommendations for Protecting Human Health Against Potential Adverse Effects of Long-Term Exposure to
Low Doses of Chemical Warfare Agents
In 1970, Congress gave the Department of Health and Human Services (DHHS) responsibility for reviewing Department of Defense (DOD) plans for transporting and/or disposing of certain chemical agents and making recommendations for the protection of human health and safety (Public Law [Pub. L.] 91-121/441 [50 USC 1512]). DHHS has delegated this authority to CDC. In 1985, Congress passed Pub. L. 99-145 (50 USC 1521 ), which mandates destruction of the present stockpile of selected chemical agents by September 30, 1994. The specific agents are listed below. In the absence of federal regulatory standards, DOD developed safety and health standards for handling these agents. In reviewing these standards and making its recommendations, CDC sought the assistance of a working group of experts.
The national stockpile of chemical agents includes six chemicals:
Nerve Agents GA (Tabun or ethyl N,N-dimethylphosphoramidocyanidate) GB (Sarin or isopropyl methylphosphonofluoridate) VX (S-[2-diisopropylaminoethyl] 0-ethyl methyl phosphonothiolate)
Vesicants/Blister Agents . H, HD (Sulfur mustard or di-2-chloroethyl sulfide)
T (Bis[2-chloroethylthioethyl] ether) L (Lewisite or dichloro [2-chlorovinyl] arsine)
Like a number of widely used insecticides, the nerve agents GA, GB, and VX are organic compounds containing phosphorus (organophosphorus compounds). They affect nerves, muscles, and glands by inhibiting acetyl cholinesterase, an enzyme required for proper function of these tissues. H and L (an organic compound containing arsenic) are vesicants. They cause chemical burns or blisters of the skin and mucous membranes, such as the conjunctiva of the eyes and the mucosa of airways. The bulk of the national stockpile consists of H, VX, and GB; therefore, CDC, through open meetings, convened a working group of experts to consider adverse effects of acute exposure to these agents.
In 1987, DOD published an environmental impact statement that discussed options for destroying the national chemical stockpile. The preferred alternative was onsite incineration. DOD proposed building an incinerator at each of eight locations and burning the agent for complete chemical breakdown. The recommended control limits are based on air concentrations (Table 1 ). During public meetings held at each of the eight sites, citizens voiced their concerns about chronic low-level exposure to the agents and the delayed effects that acute exposure might cause. To resolve questions about these concerns, CDC gathered data on these agents and held an open meeting with the working group on September 29-30, 1987, in Atlanta, Georgia. The group discussed the potential health hazards that might result from the destruction of the stockpile, including organophosphate-induced delayed neuropathy, electroencephalographic (EEG) changes, cancer, birth defects, and keratitis. The group studied published and unpublished reports of all potential adverse effects, including carcinogenicity, mutagenicity, and teratogenicity, for the aforementioned agents. In addition,

Vol. 37 I No.5 MMWR 73
Exposure - Continued
the U.S. Army Surgeon General's Office summarized a number of studies now under way or recently completed for agents GB, VX, HD, and L.
Nerve degeneration is considered an unlikely outcome either from acute intoxication with any of the nerve agents or from long-term exposure to them. Given the difficulty of demonstrating EEG changes and the absence of clinically significant effects even if the EEG changes are present, members of the working group considered the EEG changes reported after intoxication with GB to be questionable. None of the nerve agents have been shown to be mutagenic or carcinogenic. Results of recently completed studies on GB and initial reports of studies on VX indicate no teratogenic effect.
Available epidemiologic data indicate that H is a human carcinogen. Although the data suggest that H is less potent than such other known human carcinogens as smoking, radon, and chromates, they do not permit an estimate of the carcinogenic potency or the exact degree of the carcinogenic risk with confidence. Very little information is available on the long-term toxicity of agent T, which has much lower volatility than H, with which it is mixed. It is not expected to constitute an airborne hazard unless H is also present at concentrations much higher than permitted. Recommended control limits for agent Tare therefore identical to those for H.
Toxicologic information specific to L is sparse. More is known about arseniccontaining compounds in general, but caution must be used in extrapolation. Some evidence suggests that L might be a carcinogen. The recommended control concentration limit, 0.003 mg/m3 (measured as L), in air should be adequate to protect public health. The Occupational Safety and Health Administration (OSHA) has promulgated a standard of 0.5 mg/m3 (measured as arsenic) for organic arsenic concentrations in workplace air. The National Institute for Occupational Safety and Health (NIOSH) has recommended a standard of 0.002 mg/m 3 for all forms of arsenic. The proposed L control limits are lower than the existing OSHA occupational standard for
TABLE 1. Recommended control limits for selected chemical agents
General Chemical Population Workers Agent* (mg/m3 ) (mg/m3 )
Nerve Agents t
GA, GB 0.000003 (3x10- 6 ) 0.0001 (1x10⁻⁴ )
vx 0.000003 (3x10- 6 ) 0.00001 (1x10- 5 )
Vesicants§
H, HD, HT~ 0.0001 (1x10- 4 ) 0.003 (3x10- 3 )
L 0.003 (3x10- 3 ) 0.003 (3x10- 3 )
Averaging Time 72 hours 8 hours
*Protection against exposure to agents in aerosol and liquid form must be sufficient to prevent direct contact with the skin and eyes. tGA = Tabun or ethyl N,N-dimethylphosphoramidocyanidate; GB = Sarin or isopropyl methylphosphonofluoridate; VX = S-(2-diisopropylaminoethyl) 0-ethyl methyl phosphonothiolate. §H or HD = Sulfur mustard or di-2-chloroethyl sulfide; HT = Bis(2-chloroethylthioethyl) ether (T) in a mixture with sulfur mustard; L = Lewisite or dichloro (2-chlorovinyl) arsine. ~Data supporting the ability to monitor for H at 0.0001 mg/m3 at all sites should be developed. HT is measured as HD.

74 MMWR February 12, 1988
Exposure - Continued
organic arsenic by a factor of approximately 500 and are lower than the NIOSH recommended standard by a factor of 2. Reported by: Special Programs Group, Office of the Director, Center for Environmental Health and Injury Control, Centers for Disease Control. Editorial Note: CDC, in its continuous oversight of demilitarization activity, routinely examines each of the eight chemical storage sites in the United States and a chemical munitions incineration facility that has been in operation in Utah since 1979. Consideration is given to the population centers in the surrounding communities at depots. Standard operating procedures for agent handling and worker safety are also observed. This experience indicates that the control limits in Table 1 are attainable. Questions related to the nerve agents have been relatively easy to resolve. The information bases are fairly complete, and there appears to be little risk either of adverse health effects from long-term exposure to low doses or of delayed health effects from acute exposure.
(Continued on page 79)
TABLE I. Summary - cases of specified notifiable diseases, United States
5th Week Ending I Cumulative, 5th Week Ending Disease Feb. 6, I Feb. 7, I Median I Feb. 6, I Feb. 7, I Median
1988 1987 1983-1987 1988 1987 1983-1987
Acquired Immunodeficiency Syndrome (AIDS) 746 236 156 2,629 1,601 508 Aseptic meningitis 66 86 86 353 454 454 Encephalitis: Primary (arthropod-borne
& unspec) 12 17 17 55 74 75 Post-infectious 3 1 5 5 6
Gonorrhea: Civilian 13,873 15,398 15,802 65,007 85,593 81,008 Military 274 252 407 1,062 1,679 1,819
Hepatitis: Type A 571 435 448 2,027 2,076 2,076 Type 8 378 467 467 1,397 2,006 2,040 Non A, Non B 42 56 71 156 283 283 Unspecified 48 62 94 187 296 365
Legionellosis 11 7 11 40 69 56 Leprosy 4 8 1 8 24 24 Malaria 7 17 14 39 59 55 Measles: Total* 22 23 23 103 112 112
Indigenous 20 19 19 99 91 88 Imported 2 4 4 4 21 21
Meningococcal infections 58 75 71 279 352 273 Mumps 121 468 61 325 1,274 301 Pertussis 33 39 24 95 174 129 Rubella (German measles) 3 2 10 21 23 Syphilis (Primary & Secondary): Civilian 766 670 616 3,172 3,185 2,649
Military 4 3 14 6 17 Toxic Shock syndrome 6 9 9 21 27 35 Tuberculosis 310 361 362 1,241 1,552 1,552 Tularemia 1 2 2 12 9 9 Typhoid Fever 8 3 3 26 19 24 Typhus fever, tick-borne (RMSF) 1 1 6 5 6 Rabies, animal 35 55 77 227 301 335
TABLE II. Notifiable diseases of low frequency, United States Cum. 1988 Cum. 1988
Anthrax Leptospirosis 2 Botulism: Foodborne (Alaska 2) 3 Plague
Infant (Wash. 1) 3 Poliomyelitis, Paralytic Other (Hawaii 1) 2 Psittacosis (Wash. 1) 4
Brucellosis (Calif. 1) 3 Rabies, human Cholera Tetanus (S.C. 1) 3 Congenital rubella syndrome Trichinosis 2 Congenital syphilis, ages < 1 year Diphtheria
*Two of the 22 reported cases for th1s week were 1mported from a fore1gn country or can be directly traceable to a known internationally imported case within two generations.
Vol. 37 I No. 5 MMWR
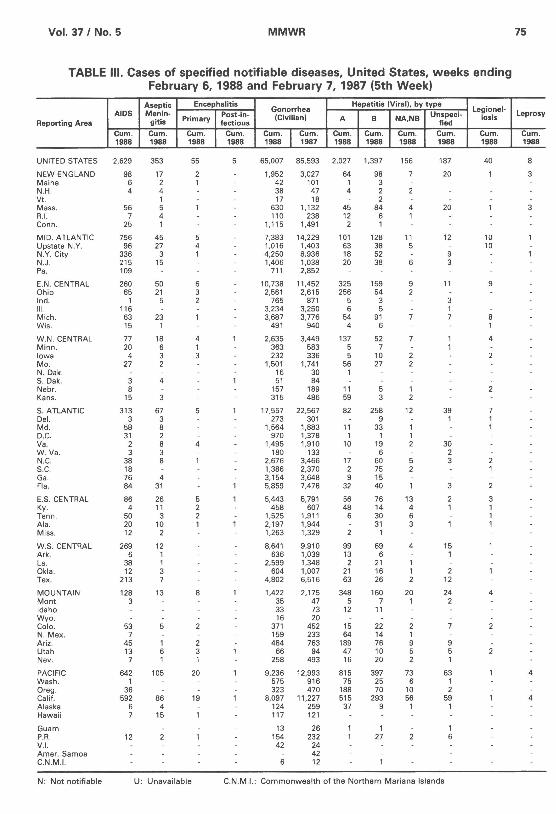
TABLE Ill. Cases of specified notifiable diseases, United States, weeks ending February 6, 1988 and February 7, 1987 (5th Week)
Aseptic Encephalitis Gonorrhea
Hepatitis (Viral). by type Legionel-
AIDS Menin-Primary Post-in- (Civilian) A B I NA NB l Un~peci- losis
Reporting Area gitis factious ' f1ed Cum. Cum. Cum. Cum. Cum. I Cum. Cum. Cum. 1 Cum. I Cum. Cum. 1988 1988 1988 1988 1988 1987 1988 1988 1 1988 1988 1988
UNITED STATES 2,629 353 55 65,007 85,593 2,027 1,397 156 187 40
NEW ENGLAND 98 17 2 1,952 3,027 64 98 20 Maine 6 2 1 42 101 1 3 N.H. 4 4 38 47 4 2 Vt. 1 17 18 2 Mass. 56 5 630 1,132 45 84 4 20 R.I. 7 4 110 238 12 6 1 Conn. 25 1 1,115 1,491 2 1
MID. ATLANTIC 756 45 5 7,383 14,229 101 128 11 12 10 Upstate N.Y. 96 27 4 1,016 1,403 63 38 5 10 N.Y. City 336 3 1 4,250 8,936 18 52 N.J. 215 15 1,406 1,038 20 38 Pa . 109 711 2,852
E.N. CENTRAL 260 50 6 10,738 11,452 325 159 11 9 Ohio 65 21 3 2,561 2,615 256 54 Ind. 1 5 2 765 871 5 3 Ill. 116 3,234 3,250 6 5 Mich. 63 23 3,687 3,776 54 91 Wis. 15 1 491 940 4 6
W.N. CENTRAL 77 18 2,635 3,449 137 52 4 Minn. 20 6 363 583 5 7 Iowa 4 3 232 336 5 10 Mo. 27 2 1,501 1,741 56 27 N. Oak. 16 30 1 S. Oak. 3 4 51 84 Nebr. 8 157 189 11 5 Kans. 15 3 315 486 59 3
S. ATLANTIC 313 67 17,557 22,567 82 258 12 39 Del. 3 3 273 301 9 1 Md. 58 8 1,564 1,883 11 33 D.C. 31 2 970 1,378 1 1 Va. 2 8 4 1,495 1,910 10 19 30 W.Va. 3 3 180 133 6 2 N.C. 38 8 2,676 3,466 17 60 3 S.C. 18 1,386 2,370 2 75 Ga. 76 4 3,154 3,648 9 15 Fla. 84 31 5,859 7,478 32 40
E.S. CENTRAL 86 26 5,443 5,791 56 76 13 Ky. 4 11 458 607 48 14 4 Tenn. 50 3 1,525 1,911 6 30 6 Ala. 20 10 2,197 1,944 31 3 Miss. 12 2 1,263 1,329 1
W.S. CENTRAL 269 12 8,641 9,910 99 69 4 15 Ark. 6 1 636 1,039 13 6 1 La . 38 1 2,599 1,348 2 21 Okla . 12 3 604 1,007 21 16 2 Tex. 213 7 4,802 6,516 63 26 12
MOUNTAIN 128 13 8 1,422 2,175 348 160 20 24 4 Mont. 3 35 47 5 7 1 2 Idaho 33 73 12 11 Wyo. 16 20 Colo. 53 371 452 15 22 N. Mex. 7 159 233 64 14 Ariz . 45 484 763 189 76 9 Utah 13 66 94 47 10 5 Nev. 7 258 493 16 20 1
PACIFIC 642 105 20 9,236 12,993 815 397 73 63 Wash . 1 575 916 75 25 6 1 Oreg. 36 323 470 188 70 10 2 Calif. 592 86 19 8,097 11,227 515 293 56 59 Alaska 6 4 124 259 37 9 1 1 Hawaii 7 15 117 121
Guam 13 26 1 1 P.R. 12 154 232 27 6 V.I. 42 24 Amer. Samoa 42 C.N.M.I. 6 12
N: Not notifiable U: Unavailable C.N .M.I. : Commonwealth of the Northern Mariana Islands
75
Leprosy
Cum. 1988
4
4

76 MMWR February 12, 1988
TABLE Ill. (Cont'd.) Cases of specified notifiable diseases, United States, weeks ending February 6, 1988 and February 7, 1987 (5th Week)
Measles {Rubeola) Men in-Malaria
Indigenous I Imported* I Total gococcal Mumps Pertussis Rubella
Reporting Area Infections Cum. 1988 I Cum. 119881 Cum. I Cum. Cum. 19881 Cum. 19881 Cum. I Cum. 19881 Cum. I Cum. 1988 1988 1988 1987 1988 1988 1988 1987 1988 1987
UNITED STATES 39 20 99 4 112 279 121 325 33 95 174 10 21
NEW ENGLAND 4 29 3 13 Maine N.H. 11 Vt. Mass. 15 R.I. 5 Conn. 4
MID. ATLANTIC 23 32 28 14 4 22 Upstate N.Y. 2 16 2 2 16 N.Y. City 4 4 18 3 N.J. 1 9 Pa . 19 11
E.N. CENTRAL 24 33 22 79 6 33 Ohio 16 15 15 2 15 Ind. 1 6 Ill. 2 1 5 Mich. 22 12 44 4 5 Wis. 3 9 13
W.N. CENTRAL 10 14 37 10 17 Minn. 1 2 Iowa 5 13 2 Mo. 6 3 10 7 N. Oak. 4 1 S. Dak. 2 1 Nebr. 1 Kans. 3 13 4
S. ATLANTIC 6 30 13 3 13 36 Del. 1 Md. D.C. Va . 4 16 W. Va. 3 N.C. 4 8 15 S.C. 5 Ga. 4 Fla . 10
E.S. CENTRAL 31 31 67 Ky. 6 6 7 Tenn. 16 24 58 Ala . 9 1 Miss. N N
W.S. CENTRAL 11 24 Ark. 3 1 La. 7 Okla. 7 Tex. 8 9
MOUNTAIN 8 35 12 19 11 Mont. Idaho Wyo. 1 2 Colo. 35 4 2 6 N. Mex. 4 N N 1 Ariz. 2 5 13 Utah 1 1 Nev. 2
PACIFIC 16 40 49 95 34 69 16 35 46 3 10 16 Wash . 1 5 1 1 3 5 Oreg. 2 1 9 N N 2 8 1 Calif. 12 40 1t 48 77 33 65 14 21 30 14 Alaska 1 1 1 3 1 Hawaii 1t 3 2
Guam P.R. 4 V.I. Amer. Samoa C.N.M.I.
*For measles only, imported cases includes both out-of-state and international importations. N : Not notifiable U: Unavailable tlnternational §Out-of-state

Vol. 37 I No. 5 MMWR 77
TABLE Ill. (Cont'd.) Cases of specified notifiable diseases, United States, weeks ending February 7, 1988 and February 6, 1987 (5th Week)
Syphilis (Civilian) Toxic-Tula- Typhoid Typhus Fever Rabies.
(Primary & Secondary) shock Tuberculosis remia Fever (Tick-borne) Animal
Reporting Area Syndrome (RMSF) Cum.
1 Cum. Cum. Cum. 1 Cum. Cum. Cum. Cum. Cum.
1988 1987 1988 1988 1987 1988 1988 1988 1988
UNITED STATES 3,172 3,185 21 1,241 1,552 12 26 227
NEW ENGLAND 91 45 4 19 27 4 Maine 2 1 2 1 N.H. 1 2 1 Vt. 1 Mass. 34 30 8 6 R.I. 3 1 Conn . 51 15 8 18
MID. ATLANTIC 595 391 240 304 19 Upstate N.Y. 41 6 51 58 N.Y. City 469 257 76 139 N.J . 75 57 60 60 Pa . 10 71 53 47 19
E.N. CENTRAL 87 104 197 217 Ohio 5 7 38 34 Ind. 11 6 13 3 Ill. 46 70 72 101 Mich. 24 11 65 74 Wis. 1 10 9 5 4
W .N. CENTRAL 13 15 4 36 45 45 Minn. 1 4 9 6 18 Iowa 2 2 3 5 11 Mo. 4 9 16 25 4 1 N. Oak. 1 4 S. Oak. 2 6 Nebr. 3 1 Kans. 3 4
S. ATLANTIC 1,128 1,086 271 303 56 Del. 17 10 3 1 Md. 56 50 31 28 21 D.C. 49 22 10 12 Va . 33 32 41 34 14 W.Va. 1 7 12 4 N.C. 68 60 9 36 S.C. 35 72 43 44 1 Ga. 186 175 14 19 16 Fla. 683 665 113 117
E.S. CENTRAL 185 208 114 181 13 Ky. 3 40 24 8 Tenn . 51 75 18 45 Ala . 73 54 47 59 Miss. 58 79 9 53
W.S. CENTRAL 358 439 78 109 35 Ark. 2 18 5 7 9 La . 50 49 19 25 Okla . 16 18 17 13 4 Tex. 290 354 37 64 22
MOUNTAIN 70 74 16 31 23 Mont. 2 3 19 Idaho 1 Wyo . Colo. 13 8 2 N. Mex. 7 7 6 Ariz . 12 35 18 Utah 4 Nev. 32 20
PACIFIC 645 823 270 335 17 28 Wash . 14 14 10 2 Oreg . 14 13 12 13 1 Calif. 627 795 224 283 12 28 Alaska 3 7 Hawaii 4 17 22
Guam 2 P.R. 69 88 11 15 6 V.I. 1 2 1 Amer. Samoa 2 13 C.N.M .I.
U : Unavailable

78
Reporting Area
NEW ENGLAND Boston, Mass. Bridgeport, Conn. Cambridge, Mass. Fall River, Mass. Hartford, Conn. Lowell, Mass. Lynn, Mass. New Bedford, Mass. New Haven, Conn. Providence, R.I. Somerville, Mass. Springfield, Mass. Waterbury, Conn. Worcester, Mass.
MID. ATLANTiC Albany, N.Y. Allentown, Pa. Buffalo, N.Y.§ Camden, N.J. Elizabeth, N.J. Erie, Pa.t Jersey City, N.J. N.Y. City, N.Y. Newark, N.J. Paterson, N.J. Philadelphia, Pa . Pittsburgh, Pa. t Reading, Pa . Rochester, N.Y. Schenectady, N.Y. Scranton, Pa.t Syracuse, N.Y. Trenton, N.J. Utica, N.Y. Yonkers, N.Y.
E.N. CENTRAL Akron, Ohio Canton, Ohio Chicago, Ill.§ Cincinnati, Ohio Cleveland, Ohio Columbus, Ohio Dayton, Ohio Detroit, Mich. Evansville, Ind. Fort Wayne, Ind. Gary, Ind. Grand Rapids, Mich. Indianapolis, Ind. Madison, Wis. Milwaukee, Wis. Peoria, Ill. Rockford, Ill. South Bend, Ind . Toledo, Ohio Youngstown, Ohio
W.N. CENTRAL Des Moines, Iowa Duluth, Minn. Kansas City, Kans . Kansas City, Mo. Lincoln, Nebr. Minneapolis, Minn. Omaha, Nebr. St. Louis, Mo. St. Paul, Minn. Wichita, Kans.
MMWR February 12, 1988
TABLE IV. Deaths in 121 U.S. cities,* week ending February 6, 1988 (5th Week)
All Causes, By Age (Years) P&l**
All Causes, By Age (Years)
A~~s I ~65145·64125·4411-241 <1 Total Reporting Area
A~~s I ~65,45-64,25·4411-24! <1 632 443 111 40 15 23 56 S. ATLANTIC 1,555 948 356 138 49 63 196 125 36 19 8 8 19 Atlanta, Ga. 214 122 42 20 7 23
51 42 7 1 1 3 Baltimore, Md. 298 172 83 23 10 10 18 13 4 1 6 Charlotte, N.C. 83 47 24 6 4 2 35 26 6 1 2 1 Jacksonville, Fla . 114 70 30 10 2 2 45 31 7 5 1 1 1 Miami, Fla . 239 138 55 28 10 8 23 15 5 3 2 Norfolk, Va. 57 37 13 2 1 4 31 22 6 3 2 Richmond, Va. 86 56 20 6 1 3 27 22 4 1 3 Savannah, Ga. 59 39 13 5 2 27 14 3 2 8 2 St. Petersburg, Fla. 104 87 7 2 5 3 33 24 4 2 2 1 1 Tampa, Fla. 71 47 13 5 2 3
7 5 2 • Washington, D.C. 201 113 50 28 5 5 47 30 11 2 4 4 Wilmington, Del. 29 20 6 3 34 29 5 7 58 45 11 2 5 E.S. CENTRAL 935 631 192 62 23 27
Birmingham, Ala. 113 62 28 13 3 7 2,916 1,970 574 231 77 64 149 Chattanooga, Tenn. 77 60 15 1 1
53 36 11 2 3 1 1 Knoxville, Tenn . 126 92 16 14 4 19 15 3 1 Louisville, Ky. 132 89 30 7 3 3
108 74 23 8 1 2 7 Memphis, Tenn. 255 176 47 15 10 7 28 ,, 13 3 1 Mobile, Ala. 72 46 16 4 1 5 26 21 5 1 Montgomery, Ala. 43 34 8 1 45 31 10 1 1 2 7 Nashville, Tenn. 117 72 32 8 5 54 42 8 2 1 1 2
W.S. CENTRAL 1,525 990 295 158 56 26 73 1.421 890 318 120 51 39 41 17 11 10 1 2 5 Austin, Tex. 74 57 9 6 1 1 27 15 7 1 2 2 3 Baton Rouge, La. 55 33 17 2 1 2
486 335 109 24 6 12 18 Corpus Christi, Tex. 32 29 2 1 78 47 18 3 2 8 Dallas, Tex. 210 118 54 18 10 10 41 36 5 1 El Paso, Tex. 57 32 18 4 1 2
115 86 21 6 1 1 14 Fort Worth, Tex 110 76 19 7 6 2 29 24 2 2 1 1 Houston, Tex.§ 308 176 74 34 13 ,, 40 29 9 2 Little Rock, Ark. 108 63 22 13 2 5 89 72 12 3 2 8 New Orleans, La. 108 65 25 15 3 49 35 7 4 1 2 3 San Antonio, Tex. 215 137 55 12 8 3 20 18 1 1 3 Shreveport, La. 23 18 4 1 43 36 4 1 1 1 2 Tulsa, Okla. 121 86 19 8 5 3
2,377 1,596 507 144 45 79 120 MOUNTAIN 649 447 135 37 16 14 80 57 16 5 1 1 3 Albuquerque, N. Mex. 81 63 9 5 3 1 43 36 6 1 12 Colo. Springs, Colo. 43 31 7 2 1 2
564 362 125 45 10 22 16 Denver, Colo. 66 45 13 5 1 2 134 81 39 7 3 4 10 Las Vegas, Nev. 108 76 24 4 3 1 156 91 48 11 3 3 3 Ogden, Utah 20 13 3 2 1 1 129 84 30 6 3 6 2 Phoenix, Ariz. 137 90 29 10 3 5 115 83 22 6 1 3 4 Pueblo, Colo. 30 21 5 4 223 133 54 16 11 9 6 Salt Lake City, Utah 40 21 14 3 1 1
46 34 10 2 4 Tucson, Ariz. 124 87 31 2 3 1 85 56 18 8 3 6 PACIFIC 2,295 1,581 395 171 66 67 21 10 7 1 3 1 Berkeley, Calif. 17 15 2 58 39 12 4 1 2 6 Fresno, Calif. 123 84 22 7 3 6
173 115 37 8 5 8 4 Glendale, Calif. 49 37 6 4 1 45 30 8 5 1 1 4 Honolulu, Hawaii 81 56 18 3 3 1
148 119 23 5 1 10 Long Beach, Calif. 53 41 6 4 1 1 60 42 10 3 2 3 9 Los Angeles Calif. 646 431 115 53 23 11 47 37 7 2 1 7 Oakland, Calif. 80 63 11 3 1 2 16 13 3 1 Pasadena, Calif. 56 40 10 1 2 3
133 97 21 6 3 6 11 Portland, Oreg. 149 108 24 6 3 8 101 77 11 5 2 1 Sacramento, Calif. 184 133 23 15 5 8 965 684 181 49 19 32 71 San Diego, Calif. 198 131 37 19 6 5
50 38 10 1 1 2 San Francisco, Calif. 185 112 38 26 2 7 20 15 3 1 1 2 San Jose, Calif. 192 132 31 14 9 6 40 32 6 1 1 Seattle, Wash. 165 115 31 12 2 5
113 66 27 11 5 4 4 Spokane, Wash. 54 40 11 1 2 43 33 7 2 1 6 Tacoma, Wash. 63 43 10 3 5 2
322 237 49 17 7 12 35 TOTAL 13,745tt 9,190 2,769 992 361 408 65 51 10 3 1 8
151 98 38 4 3 8 5 83 58 16 6 1 2 2 78 56 15 4 1 2 7
P&l*'
Total
69 5
15 5 6 1 1
11 7 7 5 5 1
64 1 6 9
14 22
4 3 5
66 7 2 1 3 3 5 7 6
23 1 8
45 3 6 3
13 2 5 1
12
180 2
19 2
11 7
30 1
10 9
16 20 10 25
4 4
10
820
*Mortality data in this table are voluntarily reported from 121 cities in the United states, most of which have populations of 100,000 or more. A death is reported by the place of its occurrence and by the week that the death certificate was filed. Fetal deaths are no1 included.
**Pneumonia and influenza. tBecause of changes in reporting methods in these 3 Pennsylvania cities, these numbers are partial counts for the current week. Complete counts will be available in 4 to 6 weeks.
ttTotal includes unknown ages. §Data not available. Figures are estimates based on average of past 4 weeks.

Vol. 37 I No. 5 MMWR 79
Exposure - Continued
Exposure to or contact with H by any route- respiratory, skin, or oral- should be limited to the extent practicable. This can be accomplished by use of appropriate engineering controls, personal protective equipment, and work practices. Concentrations in the workplace and surrounding air should be measured and verified by instruments that can reliably detect concentrations at or below the control limits. At this time, the most sensitive monitors can reliably measure 0.003 mg/m3 of H and L in the workplace air. Because of dispersion and dilution, this level would be adequate protection for the general population.
The members of the working group also considered DOD's proposal for agent stack emission levels during incineration. These limits should be 1) attainable by a well-designed, constructed, and operated incineration facility, 2) capable of offering an early indication of disturbed operating conditions, and 3) able to be accurately measured in a timely manner. The allowable stack concentrations proposed by DOD meet these criteria and appear to restrict emissions to concentrations well below those that would endanger health. They must be evaluated by air dispersion modeling of credible worst-case events and conditions specific to each site to ensure that they will not result in emissions exceeding the permissible level for the general population and the workplace.
On the basis of the evidence reviewed, members of the working group concluded that human health will be adequately protected from exposure to the chemical agents at the recommended concentrations in this report. Even long-term exposure to these concentrations would not create adverse health effects. The relatively short duration of the disposal program provides an additional margin of safety.
Epidemiologic Notes and Reports
La Crosse Encephalitis in West Virginia
Between July 6 and September 1, 1987, in central West Virginia, 19 cases of La Crosse encephalitis were serologically confirmed (Figure 1 ). After a cluster of meningo-encephalitis cases was reported from a referral pediatric service in Charleston, active hospital-based surveillance was undertaken in 15 counties in central and southern West Virginia, where La Crosse encephalitis had previously occurred. Cases were identified in five of these counties.
Eleven (58%) of the 19 patients were diagnosed as having viral encephalitis. Four (21%) had symptoms of meningitis alone, and four (21%) had meningo-encephalitis. The patients ranged in age from 1 to 14 years (mean = 7 years). Fifteen (79%) patients were male; the male-to-female ratio was 3.8:1. Eighteen (95%) children were hospitalized, and one child was treated as an outpatient. One patient, a 9-year-old boy with cerebral edema, died despite intensive supportive care.
All patients lived in rural areas of central West Virginia, a region with thick hardwood forests conducive to mosquito breeding. Attack rates varied by the patients' sex and place of residence (Table 1 ). Males were at much greater risk of becoming ill than females. The attack rate among children under 15 years of age in Nicholas County was over four times the rate in any other county. A case-control study is under way to test hypotheses regarding possible behavioral and environmental risk factors.

80 MMWR February 12, 1988
Encephalitis - Continued
For six (32%) of the patients, diagnosis was based on compatible clinical findings and a single immunofluorescent antibody (IFA) titer >128 during the convalescent stage of illness. For the other 13 (68%), a fourfold rise in antibody titer was demonstrated between the acute and convalescent stages of illness.
In the past, few cases of La Crosse encephalitis have been reported in West Virginia. Of 223 cases of encephalitis reported to the West Virginia Department of Health from 1980 through 1986, only eight (4%)-six in 1984 and two in 1985-were attributed to a California serogroup virus. Much of the increase in reported incidence in 1987 may be the result of intensive case-finding efforts. A change in the state laboratory's serologic procedure for La Crosse virus diagnosis may also have contributed to the increase in the number of identified cases. Previously, serologic diagnoses were made by measuring complement-fixing antibodies. The more sensitive IFA was adopted in 1987.
FIGURE 1. Reported cases of LaCrosse encephalitis, by week of onset - West Virginia, 1987
3
~ 2 (..)
0 28
JUN
5 12 19
JUL
26 2 9
WEEK BEGINNING
16 23 30
AUG
6
SEP
TABLE 1. Attack rates of La Crosse encephalitis, by sex and county of residence -West Virginia, July &-September 1, 1987
Males Females Total
County No. Rate* No. Rate* No. Rate*
Nicholas 5 129 3 84 8 107
Greenbrier 2 45 0 2 23
Fayette 3 41 0 3 21
Kanawha 4 16 4 5 10
Logan 1 14 0 7
Total 15 31 4 9 19 20
*Attack rate = number of patients < 15 years of age per 100,000 population of the same age.

Vol. 37 I No. 5 MMWR 81
Encephalitis - Continued
Reported by: AA Kindle, JE McJunkin, MD, JR Meek, MD, Charleston Area Medical Center; MM Tomsho, MD, Summersville; DL Holbrook, DL Smith, MD, Nicholas County Health Dept; BA Crowder, OM Rosenberg, MD, Kanawha County Health Dept; JA Burke, DC Newell, DO, Fayette County Health Dept; SL Sebert, MD, Greenbrier County Health Dept; JH Wright, DO, Logan County Health Dept; JW Brough, DrPH, OM Cupit, MS, LE Haddy, MS, RC Baron, MD, Acting State Epidemiologist, West Virginia Dept of Health. Div of Field Svcs, Epidemiology Program Office; Div of Vector-Borne Viral Diseases, Center for Infectious Diseases, CDC. Editorial Note: La Crosse virus, a bunyavirus in the California serogroup, and its mosquito vector, Aedes triseriatus, are widely distributed in the central and eastern United States ( 1,2 ). Central nervous system (CNS) infections from La Crosse virus have been recognized chiefly in the upper Midwest. However, reports of sporadic cases from other states suggest that the disease may be endemic in a broader geographic distribution (3,4 ). The focus of cases in West Virginia in 1987 illustrates the high levels of endemic transmission that may remain undetected unless specific diagnoses are sought.
CNS infections from La Crosse virus occur nearly exclusively among children. Of the 929 cases reported to CDC from 1971-1983,833 (89.7%) involved children under 15 years of age. Boys are affected more often than girls, presumably because they spend more time outdoors where they are exposed to the vector. Boys accounted for 66.3% of the 833 reported cases involving children. Although the proportion of reported cases involving males in West Virginia in 1987 was higher than the proportion reported elsewhere, it was not significantly greater than expected (p>0.17, binomial distribution).
The incidence of La Crosse encephalitis in the five-county area of central West Virginia (20/100,000 children <15 years of age, 4.7/100,000 total population) was similar to rates reported from other locations where the disease is endemic. In 1978, active, hospital-based surveillance in 20 Wisconsin and Minnesota counties showed an incidence of 31.6/100,000 children under 15 years of age and 6.3/100,000 total population (5 ).
La Crosse encephalitis is infrequently recognized as a cause of childhood morbidity from CNS infection. Incidence rates for La Crosse encephalitis in endemic areas are similar to rates for Haemophilus influenzae meningitis, which range from 35 to 40/100,000 for children under 5 years of age and from 2.2 to 7.7/100,000 for the total population (6 ). The fatality rate for La Crosse encephalitis is <1%; however, during acute illness, convulsions occur in 50% of cases, and focal weakness, paralysis, or other localized signs occur in 25% (3 ). Residual convulsive disorders may persist in 10% of cases, and some recovered patients have impaired cognitive performance (3 ).
Public health measures to control La Crosse encephalitis have focused on eliminating breeding sites for Ae. triseriatus, but the importance oftree holes and breeding sites such as tires and other discarded containers in the spread of La Crosse encephalitis has not been well defined. The current case-control study addresses this issue; results of the study will help public health officials planning mosquito control programs to target breeding sites that pose the greatest risk. References 1. Calisher CH. Taxonomy, classification, and geographic distribution of California serogroup
bunyaviruses. Prog Clin Bioi Res 1983;123:1-16. 2. Craig GB Jr. Biology of Aedes triseriatus: some factors affecting control. Prog Clin Bioi Res
1983; 123:329-41. 3. Tsai TF, Monath TP. Viral diseases in North America transmitted by arthropods or from
vertebrate reservoirs. In: Feigin RD, Cherry JD, eds. Textbook of pediatric infectious diseases. Vol II. 2nd ed. Philadelphia: WB Saunders, 1987;1417-56.

82 MMWR February 12, 1988
Encephalitis - Continued
4. Kappus KD, Monath TP, Kaminski RM, Calisher CH. Reported encephalitis associated with California serogroup virus infections in the United States, 1963-1981. Prog Clin Bioi Res 1983;123:31-41 .
5. Hurwitz ES, Schell W, Nelson D, Washburn J, LaVenture M. Surveillance for California encephalitis group virus illness in Wisconsin and Minnesota, 1978. Am J Trop Med Hyg 1983;32:595-601.
6. Fraser OW, Geil CC, Feldman RA. Bacterial meningitis in Bernalillo County, New Mexico: a comparison with three other American populations. Am J Epidemiol 1974;100:29-34.
Epidemiologic Notes and Reports
Influenza Update - United States
The following are indicators of influenza activity in the United States for the weeks ending January 16, 23, 30, and February 6. Numbers and percentages in this table are provisional and may change as additional reports are received for the given weeks.
Influenza-associated morbidity levels reported by state and territorial epidemiologists
Number of states reporting sporadic activity* Number of states reporting regional activityt Number of states reporting widespread activity§
Reports from sentinel physicians'~~ Patients seen with influenza-like illness, expressed as percent of total patient visits
Sentinel physicians reporting outbreaks, expressed as percent of total number of reports received for week
Isolates reported by WHO Collaborating Laboratories and other laboratories
Cumulative number of states reporting isolates of influenza A(H3N2)**
Cumulative number of states reporting isolates of influenza 8 tt
*Sporadically occurring cases, no known outbreaks.
Report Week Ending Jan Jan Jan 16 23 30
1988 1988 1988
25 29 31 5 10 11 2 2 4
5% 4% 6%
21% 18% 19%
16 23 26
6 6 6
Feb 6
1988
23 17 6
6%
36%
32
9
toutbreaks in counties whose total population comprises less than 50% of total state population. §Outbreaks in counties whose total population comprises 50% or more of total state population. ~Members of the American Academy of Family Physicians who submit weekly influenza surveillance reports based on their patient population. **States reporting isolates of influenza A(H3N2) to date: Alabama, Arizona, Arkansas, California, Colorado, Connecticut, Florida, Georgia, Idaho, Iowa, Kansas, Louisiana, Michigan, Minnesota, Mississippi, Missouri, Montana, New Mexico, North Dakota, New York, Ohio, Oklahoma, Oregon, South Carolina, South Dakota, Tennessee, Texas, Utah, Washington, West Virginia, Wisconsin, and Wyoming. ttstates reporting isolates of influenza B to date: Arizona, Hawaii, Montana, Nevada, New York, Ohio, Tennessee, Washington, and Wisconsin.

Vol. 37 I No. 5 MMWR • llllllllllll~rllml~llllllll~mlll~lll1~flrllllllllllll • 83
3 0001 00098 2258
FIGURE I. Reported measles cases - United States, Weeks 1-4, 1988
1888 CASES REPORTED c::::::J NO REPORTED CASES

84 MMWR February 12, 1988
The Morbidity and Mortality Weekly Report is prepared by the Centers for Disease Control, Atlanta, Georgia, and available on a paid subscription basis from the Superintendent of Documents, U.S. Government Printing Office, Washington, D.C. 20402, (202) 783-3238.
The data in this report are provisional, based on weekly reports to CDC by state health departments. The reporting week concludes at close of business on Friday; compiled data on a national basis are officially released to the public on the succeeding Friday. The editor welcomes accounts of interesting cases, outbreaks, environmental hazards, or other public health problems of current interest to health officials. Such reports and any other matters pertaining to editorial or other textual considerations should be addressed to: Editor, Morbidity and Mortality Weekly Report, Centers for Disease Control, Atlanta, Georgia 30333.
Director, Centers for Disease Control James 0. Mason, M.D., Dr.P.H.
Director, Epidemiology Program Office Carl W. Tyler, Jr., M .D.
Editor Michael B. Gregg, M.D.
Managing Editor Gwendolyn A. Ingraham
t:rU.S. Government Printing Office: 1988-530-111/60059 Region IV
DEPARTMENT OF HEALTH & HUMAN SERVICES Public Health Service Centers for Disease Control Atlanta, GA 30333
Official Business Penalty for Private Use $300
YJ 68178C RE 83 8646 CR. E I G H TON UN I V H L f H SC IE NC E S
LIBRARY 28TH£. BURT STREETS OMAHA, NE 68178
FIRST -CLASS MAIL POSTAGE & FEES PAID
PHS/CDC Permit No. G-284
HHS Publication No. (CDC) 88-8017 Redistribution using indicia is illegal.
Related Documents