MOPAC CHALLENGE 11 th DECEMBER 2014 PERFORMANCE – INTRUSIVE TACTICS 1

Welcome message from author
This document is posted to help you gain knowledge. Please leave a comment to let me know what you think about it! Share it to your friends and learn new things together.
Transcript
MOPAC CHALLENGE
11th DECEMBER 2014
PERFORMANCE – INTRUSIVE TACTICS
1

2
Scope
Main areas: Taser, Firearms, Stop & Search, Covert PolicingMain areas: Taser, Firearms, Stop & Search, Covert Policing
Intrusive Tactics: - challenge public opinions- often thought to intrude into a persons liberty- most likely to receive media attention, public scrutiny & complaints- linked to when police officers could overstep their use of lawful intervention- carry a higher range of associated risk/harm
Intrusive Tactics: - challenge public opinions- often thought to intrude into a persons liberty- most likely to receive media attention, public scrutiny & complaints- linked to when police officers could overstep their use of lawful intervention- carry a higher range of associated risk/harm
Key questions: How often are we using Intrusive Tactics?
Are we using them appropriately?
Key questions: How often are we using Intrusive Tactics?
Are we using them appropriately?

PERFORMANCE DASHBOARD
3
< Please see online tool >
The Dashboard is…
• A high level tool• Will allow the public to have an overview of performance
• Presents data not previously readily accessible
The Dashboard is…
• A high level tool• Will allow the public to have an overview of performance
• Presents data not previously readily accessible
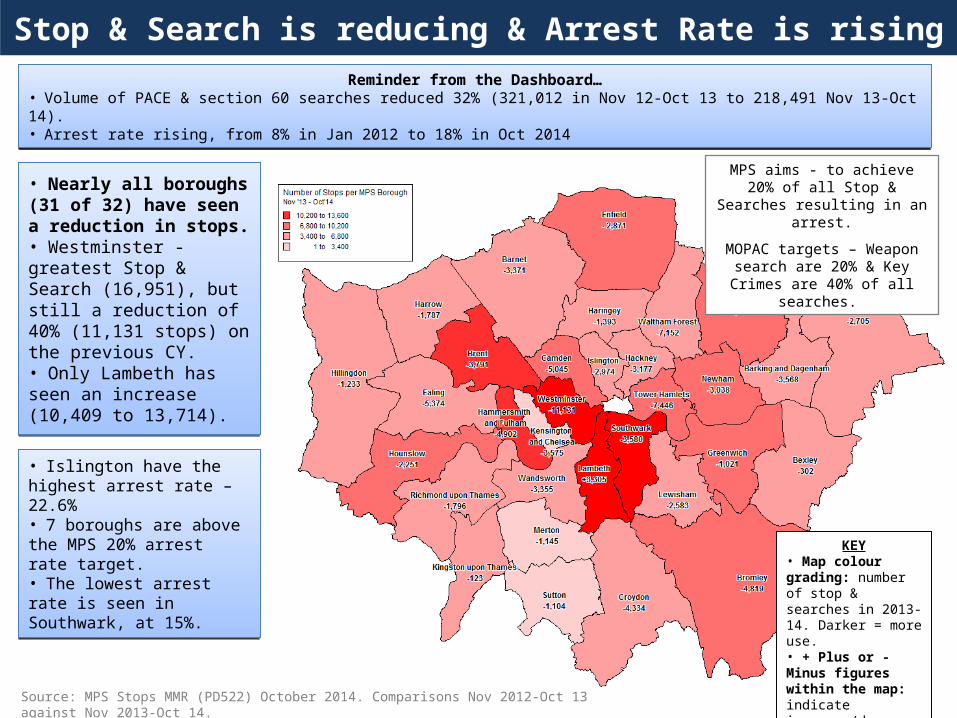
Reminder from the Dashboard…• Volume of PACE & section 60 searches reduced 32% (321,012 in Nov 12-Oct 13 to 218,491 Nov 13-Oct 14). • Arrest rate rising, from 8% in Jan 2012 to 18% in Oct 2014
Reminder from the Dashboard…• Volume of PACE & section 60 searches reduced 32% (321,012 in Nov 12-Oct 13 to 218,491 Nov 13-Oct 14). • Arrest rate rising, from 8% in Jan 2012 to 18% in Oct 2014
Stop & Search is reducing & Arrest Rate is rising
4
MPS aims - to achieve 20% of all Stop & Searches resulting in an
arrest.
MOPAC targets – Weapon search are 20% & Key Crimes are 40% of
all searches.
KEY• Map colour grading: number of stop & searches in 2013-14. Darker = more use. • + Plus or - Minus figures within the map: indicate increase/decrease upon FY2012-13Source: MPS Stops MMR (PD522) October 2014. Comparisons Nov 2012-Oct 13 against Nov 2013-Oct 14.
• Nearly all boroughs (31 of 32) have seen a reduction in stops. • Westminster - greatest Stop & Search (16,951), but still a reduction of 40% (11,131 stops) on the previous CY.• Only Lambeth has seen an increase (10,409 to 13,714).
• Nearly all boroughs (31 of 32) have seen a reduction in stops. • Westminster - greatest Stop & Search (16,951), but still a reduction of 40% (11,131 stops) on the previous CY.• Only Lambeth has seen an increase (10,409 to 13,714).
• Islington have the highest arrest rate – 22.6%• 7 boroughs are above the MPS 20% arrest rate target.• The lowest arrest rate is seen in Southwark, at 15%.
• Islington have the highest arrest rate – 22.6%• 7 boroughs are above the MPS 20% arrest rate target.• The lowest arrest rate is seen in Southwark, at 15%.

Londoners support Stop & Search: how it's conducted is key
5
Sources: MPS PAS Q3 13-14 - Q2 14/15 – 7,876 of 10,543 residents; Evidence & Insight survey – Youth Talk (2013) Youth Talk: The Voice of Young London. Internal MPS report; Bradford, B. (2011). Assessing the impact of police-initiated stop powers on individuals and communities: the UK picture; Morrell et al (2011) and Riot Victims Panel (2011) as cited from Three Days in August (2011).
• 75% of London residents agree with the use of Stop & Search. PAS younger groups (16-24 yrs) are less supportive of the police being able to use Stop & Search. However, over half (56%, n=6626 of 11,899) of 11-15 year olds agreed the police should be allowed to stop people.
• Most residential Londoners & the majority of surveyed youth have not experienced a stop themselves (2013-14) just 3.2% of Londoners report being 'stopped by the police during the last 12 months'; 83%, n=9900 never been stopped themselves).
• Generally - those stopped have a more negative view of police & lower levels of confidence (people stopped average 16% points less confident than those not stopped).
• Stop & Search is related to recent criminal activity – in one month 60% of individuals S&S could be identified through PNC or CRIS. The majority with a PNC id (85%) had a recorded sanction (47% within the last year). This group had an average of 9 previous sanctions.
• Differences in how youth and BME individuals experience S&S - of the youth who had been stopped, 37% (n=734) stated they were not told why & 63% (n=1258) thought there was no good reason for the tactic being used. Other survey data indicate BME groups less likely to receive a full explanation and less likely to report being fully treated with respect than white.
• Most important aspect for all groups - police have a good reason to use the tactic & treat people politely during the procedure.

Taser deployments does not mean they have been ‘fired’
'Passive' useDrawn: Removed from holster. Aimed: Pointed at an individual/subject. Red Dot: Pointed at an individual/subject with red dot laser sight active, so red dot appears. Arced: No cartridge attached. Taser switched on & trigger squeezed. Electric current arcs on front of Taser.
Applied physical forceFired: Cartridge attached. Taser switched on & trigger squeezed causing cartridge to fire. Drive Stun: No cartridge attached. Front of Taser placed against subject & activated/arced. Angled drive stun: Cartridge on. After an ineffective firing (barb placements too close together or failure of one barb to attach) , front of Taser placed on subject away from the barbs & Taser activated
Understanding the data…
• Taser use is counted by 'deployments' - does not refer to when it is fired.
• Deployments split into 7 categories. ‘Passive’ means force is not physically applied to the person.
• One officer carrying out any of the 7 constitute a 'deployment'/use. Two officers carrying out any (e.g. 1 draws & 1 aims) on the same person will count as 2 'deployments' but 1 incident. • Taser deployment figures also do not indicate the number of individuals involved. For example, 5 Taser officers who enter a premises with Tasers drawn to search for a suspect will result in 5 deployments, but only one individual/subject.

More deployments, but more officers & fewer firings
Dashboard shows us…• Large increase in deployments, but firings decreased from 2013 (2,110 Taser deployments with 12%, 247 fired) compared to 2012 (755Taser deployments with 18%, 136 fired. • Increase in usage (2012 to 2013) proportionate to the increase in officers trained to use it.• By August 2013 approximately 4,000 Taser trained officers across the MPS. This equates to 13% of warranted officers.
Dashboard shows us…• Large increase in deployments, but firings decreased from 2013 (2,110 Taser deployments with 12%, 247 fired) compared to 2012 (755Taser deployments with 18%, 136 fired. • Increase in usage (2012 to 2013) proportionate to the increase in officers trained to use it.• By August 2013 approximately 4,000 Taser trained officers across the MPS. This equates to 13% of warranted officers.
Source: MPS Portfolio & Planning. Data from SC&O22 Performance Unit.
By September 2014 there
was a total of 992
deployments with a 11.5% firing rate.

Officers in different roles have different deployment & firing rates
• Majority of Taser deployments attended by borough officers (77%, 1661 of 2158, 2013 deployments).
• Firearms officers (AFOs) more likely to be involved in incidents when Taser is fired (2013 – 32% for AFOs compared with 12% for BOCUs & 4% for Territorial Support Group (TSG)).
• Majority of Taser deployments attended by borough officers (77%, 1661 of 2158, 2013 deployments).
• Firearms officers (AFOs) more likely to be involved in incidents when Taser is fired (2013 – 32% for AFOs compared with 12% for BOCUs & 4% for Territorial Support Group (TSG)).
Borough deployment variations - viewed with the understanding more than 1 officer can deploy at 1 incident/subject (e.g. 3 officers drawing on 1 person = 3 deployments).
Source: MPS SC&O22 Performance Data. 2013 CY. 8
Need to remember… Taser tactical use is different
depending on officer role - Firearms officers use it as a less than lethal alternative at serious
incidents. - Borough officers may perceive a
higher level of threat. They are deployed in pairs, so will often have multiple deployments per
individual/subject.
Lambeth have a high proportion of specialist officers deploying, whereas Richmond only have borough officers deploying.
25%24%31%
8%8%
6%
55% 54%49%
0%1%0%
12%14% 12%
0% 1%
0%
10%
20%
30%
40%
50%
60%
70%
80%
90%
100%
Female Male Total
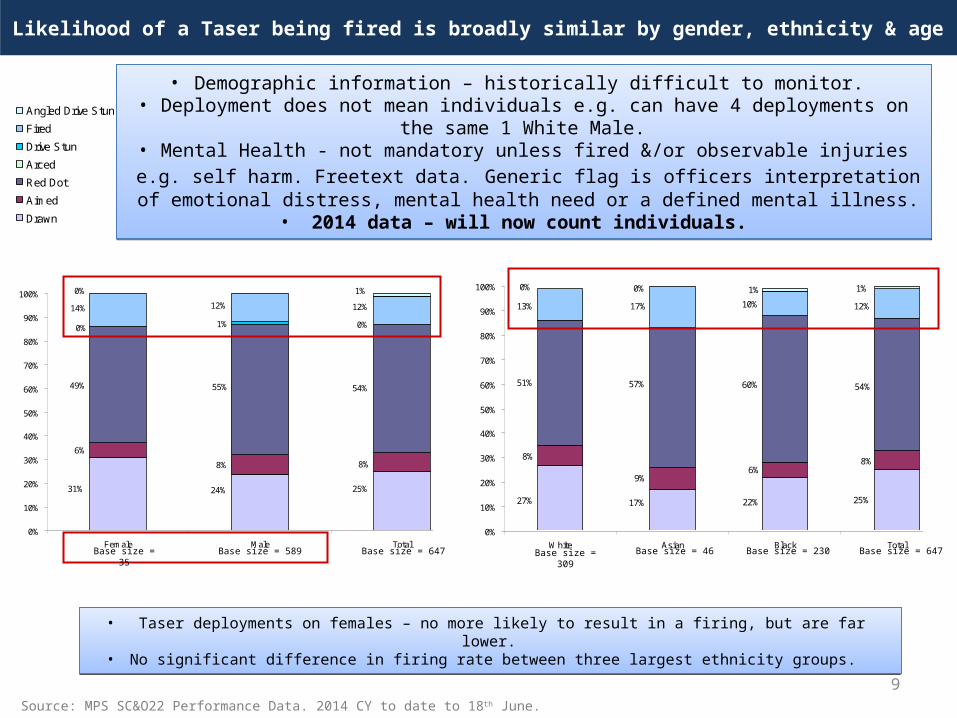
Likelihood of a Taser being fired is broadly similar by gender, ethnicity & age
Source: MPS SC&O22 Performance Data. 2014 CY to date to 18th June.9
• Demographic information – historically difficult to monitor. • Deployment does not mean individuals e.g. can have 4 deployments on the same 1 White Male.
• Mental Health - not mandatory unless fired &/or observable injuries e.g. self harm. Freetext data. Generic flag is officers interpretation of emotional distress, mental health need or a
defined mental illness.• 2014 data – will now count individuals.
• Taser deployments on females – no more likely to result in a firing, but are far lower. • No significant difference in firing rate between three largest ethnicity groups.
• Taser deployments on females – no more likely to result in a firing, but are far lower. • No significant difference in firing rate between three largest ethnicity groups.
Base size = 35 Base size = 589 Base size = 647
25%22%17%27%
8%6%
9%
8%
54%60%57%51%
12%10%17%13%
0% 0% 1% 1%
0%
10%
20%
30%
40%
50%
60%
70%
80%
90%
100%
White Asian Black TotalBase size = 309 Base size = 46 Base size = 230 Base size = 647
0%
10%
20%
30%
40%
50%
60%
70%
80%
90%
100%
Under 18 18-24 25-34 35-44 45-54 55-64 65 or over Total
Angled Drive Stun
Fired
Drive Stun
Arced
Red Dot
Aimed
Drawn

0%
10%
20%
30%
40%
50%
60%
70%
80%
90%
100%
Under 18 18-24 25-34 35-44 45-54 55-64 65 or over Total
Angled Drive Stun
Fired
Drive Stun
Arced
Red Dot
Aimed
Drawn
Likelihood of a Taser being fired is broadly similar by gender, ethnicity & age
Source: MPS SC&O22 Performance Data. 2014 CY to date to 18th June.10
• Deployments similar across ages. Under 18s - lower firing rate.•Deployment appear more highly linked to levels of threat/potential harm.
•Sep 2011 - August 2012 figures indicate 42% (78 of 186) incidents flagged as EMD (Emotional or Mental Distress). May illustrate wider considerations influencing use.
Base size = 56 Base size = 186 Base size = 204 Base size = 95 Base size = 63 Base size = 19 Base size = 2 Base size = 647

Firearms operations are reducing & police shots fired remain very low
11
Reminder from the Dashboard…• Authorised firearms operations are reducing – 1,703 in 2010 to 1,203 in 2013.• Although consistently higher - firearms related calls are also reducing – 6,249 in 2010 to 4,222 in 2013. • Since 2005 (to Oct 2014) there have been 10 fatalities.• There are wide borough variations, increases/decreases across the years.
Reminder from the Dashboard…• Authorised firearms operations are reducing – 1,703 in 2010 to 1,203 in 2013.• Although consistently higher - firearms related calls are also reducing – 6,249 in 2010 to 4,222 in 2013. • Since 2005 (to Oct 2014) there have been 10 fatalities.• There are wide borough variations, increases/decreases across the years.
Source: MPS SC&O19 Performance: 2010-2014 (end of October).
Year
Total number of SC&O19 ARV deployments
SC&O19 ARV Firearms
related calls
SC&O19 ARV Non-Firearms related
calls
Authorised Firearms Operations within
MPD Gun Crime Offences Gun Discharges Firearms Seizures Shots Fired2010 12908 6249 6659 1703 3017 670 12011 12138 4939 7199 1387 2430 543 42012 13020 4390 8630 1182 1987 421 52013 13262 4222 9040 1203 1733 312 155 10
Jan-Oct 2014 10034 3485 6549 636 1336 264 127 4

12
• Survey (2,035 responses - over half were MPS (n=1,174, 58%) to understand officer opinions about potential IPCC changes to PIP (Post-Incident Procedures).• Officers are proud, but have more negative attitudes to their wider command & organisation. • High levels of support from immediate team. This diminishes with higher management levels. Large number do not believe organisation has their best interest at heart. • Uncertainty about the types & usefulness of support provided. Occupational Health viewed sceptically.• Whilst MPS officers agree they can cope, majority would like to see more support.
• Survey (2,035 responses - over half were MPS (n=1,174, 58%) to understand officer opinions about potential IPCC changes to PIP (Post-Incident Procedures).• Officers are proud, but have more negative attitudes to their wider command & organisation. • High levels of support from immediate team. This diminishes with higher management levels. Large number do not believe organisation has their best interest at heart. • Uncertainty about the types & usefulness of support provided. Occupational Health viewed sceptically.• Whilst MPS officers agree they can cope, majority would like to see more support.
Source: MOPAC & MPS National firearms survey, 2014.
87%
98% 96%
38%
4%10%
92%
78% 80%
40%
5%
19%
4%
0%
10%
20%
30%
40%
50%
60%
70%
80%
90%
100%
Proud to be afirearms officer
Confident inown ability
Confidentcarrying a
firearm
Positiveworking
environment inthe firearmscommand
My police forcehas my bestinterests at
heart
My police forceunderstandshow this jobeffects your
personal/homelife
I am supportedby my team
I feel respectedby my
colleagues
I am supportedby my linemanager
Nature of mywork is
understood bysenior firearms
commandmanagers
Nature of mywork is
understood bysenior MPS
(non firearms)managers
I feel supportedby my police
force
I am confidentin the IPCC
(IndependentComplaints
Commission)
Firearms appear to be appropriately used, but officers need support…

Work needs to be done to boost morale of firearms officers
13
• MPS 2014 Staff Survey indicates, although SC&O and SO officers exhibit more job satisfaction than other departments, there are also greater feelings of disconnect with the organisation. • MPS 2014 Staff Survey indicates, although SC&O and SO officers exhibit more job satisfaction than other departments, there are also greater feelings of disconnect with the organisation.
Source: MPS Staff Survey 2014
51%
57%
48%
52%
46%
56%
60%
46%44%
29%
42%41%
33%
38%
27%
22%
27%25%
30%
37%36%
29%
39%
28%
23%
31%
23%
0%
10%
20%
30%
40%
50%
60%
70%
MPS average DeputyCommissioners
Portfolio
Digital Policing HumanResources
(inc MetTraining)
ResourcesDirectorate
Specialist Crimeand Operations
SpecialistOperations
TerritorialPolicing
(Boroughs)
TerritorialPolicing
(non-Boroughs)
I am satisfied with mycurrent job
I would speak highly ofthe Met as an employerto those outside theorganisation
If I contacted the Met asa member of thepublic, I would beconfident of receiving agood service

Authorisation levels for Covert Undercover Policing tactics have changed
14
Types of Covert Operations
Foundation undercover operatives (UCFs): act in limited supporting role; testing the availability of commodities, namely controlled drugs and stolen property. UCFs act as a decoy in soliciting, acquisitive crime and sexual offences
Advanced undercover operatives (UCs): undertake deployments in more complex investigations and infiltrations involving controlled drugs, firearms, serious acquisitive crime & paedophiliaUCs are deployed to gather evidence in the most challenging investigations and complex criminal groups
• Regulation of Investigatory Powers Act 2000 (RIPA) regulates how public bodies to carry out surveillance, investigation & the interception of communications. All undercover activity is governed by RIPA. • January 1st 2014 - new authorisation procedures for covert human intelligence sources.
- When a source is authorised the Office of the Surveillance Commissioners must be notified. - If a source authorisation exceeds 12 months, it shall not be granted or renewed until it has
been approved by a Assistant Commissioner. • MPS authorise approximately 50% of undercover operations nationally.
Source: MPS SC&O35 2014.
Post OSC and HMIC inspection• Performance data & prioritisation systems, measuring success/demand• Enhanced authorisation processes & raised level of authorisation, including proportionality, necessity & collateral intrusion• Risk management process at deployment stage and review, bespoke to the operational objectives and each UC authorised• Enhanced record keeping documenting all activity• Strict compliance with RIPA 29(a) regarding day to day management of welfare and security of UCs by dedicated supervisors• Responded to OSC 'Managing Capacity'. Supervision levels increased regarding day to day deployments of UCs• Licensed training under the supervision of College of Policing
Related Documents