Interfacial Reactivity and Speciation Emerging from Na- montmorillonite Interactions with Water and Formic Acid at 200°C: Insights from Reactive Molecular Dynamics Simulations, Infrared Spectroscopy, and X-ray Scattering Measurements Murali Gopal Muraleedharan, a* Hassnain Asgar, b* Seung Ho Hahn, a* Nabankur Dasgupta, c Greeshma Gadikota, b,† Adri C.T. van Duin a,† a Department of Mechanical Engineering, Pennsylvania State University, State College, PA b School of Civil and Environmental Engineering, Cornell University, Ithaca, NY 14853 c Department of Engineering Science and Mechanics, Pennsylvania State University, State College, PA † Corresponding authors *Equal contribution

Welcome message from author
This document is posted to help you gain knowledge. Please leave a comment to let me know what you think about it! Share it to your friends and learn new things together.
Transcript
Interfacial Reactivity and Speciation Emerging from Na-
montmorillonite Interactions with Water and Formic Acid at 200°C:
Insights from Reactive Molecular Dynamics Simulations, Infrared
Spectroscopy, and X-ray Scattering Measurements
Murali Gopal Muraleedharan,a* Hassnain Asgar,b* Seung Ho Hahn,a* Nabankur Dasgupta,c
Greeshma Gadikota,b,† Adri C.T. van Duin a,†
aDepartment of Mechanical Engineering, Pennsylvania State University, State College, PA
bSchool of Civil and Environmental Engineering, Cornell University, Ithaca, NY 14853
cDepartment of Engineering Science and Mechanics, Pennsylvania State University, State College,
PA
†Corresponding authors
*Equal contribution

Abstract
Reactive organic fluid - mineral interactions at elevated temperatures contribute to the evolution
of planetary matter. One of the less studied but important transformations in this regard involves
the reactions of formic acid with naturally occurring clays such as sodium montmorillonite. To
advance a mechanistic understanding of these interactions, we use ReaxFF reactive molecular
dynamics simulations in conjunction with infrared (IR) spectroscopy and X-ray scattering
experiments to investigate the speciation behavior of water-formic acid mixtures on sodium
montmorillonite interfaces at 473 K and 1 atm. Using a newly developed reactive forcefield, we
show that the experimental IR spectra of unreacted and reacted mixture can be accurately
reproduced by ReaxFF/MD. We further benchmark the simulation predictions of sodium carbonate
and bicarbonate formation in the clay interlayers using Small and Wide-Angle X-ray Scattering
measurements. Subsequently, leveraging the benchmarked forcefield, we interrogate the pathway
of speciation reactions with emphasis on carbonate, formate, and hydroxide groups elucidating the
energetics, transition states, intermediates, and preferred products. We also delineate the
differences in reactivities and catalytic effects of clay edges, facets, and interlayers owing to their
local chemical environments, which have far reaching consequences in their speciation behavior.
The experimental and simulation approaches described in this study and the transferable
forcefields can be applied translationally to advance the science of clay-fluid interactions for
several applications including subsurface fluid storage and recovery and clay-pollutant dynamics.
Keywords: ReaxFF, Molecular Dynamics, IR spectroscopy, X-ray scattering, clay minerals,
speciation, surface chemistry, reactive interfaces
1. Introduction
Advancing experimentally supported predictive insights into reactive phenomena at fluid-solid
interfaces is essential for gaining scientific insights into the evolution of matter on planets. In this
context, reactions involving montmorillonite clays in aqueous and formic acid environments is of
particular interest. Montmorillonite clays are identified in different carbonaceous chondrites 1–3
that are pieces of asteroids that remained unprocessed on earth since the formation of our solar
system.4 These chondrites contain various forms of organic matter including aliphatic and aromatic
hydrocarbons, carboxylic acids, and alcohols.4 Moreover, the organic materials were also
deposited in the early earth at metamorphic conditions with the weathering products of
intermediate and mafic rocks, which are primarily montmorillonite clays.1,5 Furthermore, formic
acid is the simplest carboxylic acid and is often observed to be remaining or left over after the
building of meteorites and comets.6 Additional organic materials could be buried in Earth’s
subsurface through geologic and tectonic processes.1 In this context, the aim of this study is to
probe the reaction mechanisms involved in the interactions of sodium montmorillonite with formic
acid and water at an elevated temperature of 200 0C, especially how the hierarchical 2D nanoscale
structure of Na-montmorillonite 7 and the intercalation of Na+ ions contribute to differences in the
chemical interactions at the basal plane, edge or facet of Na-montmorillonite.
Several complex and competing reactions occur as Na-montmorillonite reacts with aqueous
formic acid environments. 8–10 Na-montmorillonite undergo surface hydroxylation and proton
generation reactions in aqueous environments, which further triggers a chain of other reactions,
such as the formation of hydroxides. 11–13 These reactions contribute to structural and
morphological changes of clay solids. 14–16 Chemical interactions between organic acids and water
with montmorillonites can result in the formation of carbonate species that eventually neutralize
the dissolved cations and precipitate within the interlayers. 17,18 The formation of carbonates has
been shown to change the interlayer spacing and the resulting swelling behavior in sodium
montmorillonite. 17,18 Despite these observations, significant knowledge gaps remain in the
interactions of Na-montmorillonite with water and formic acid at elevated temperatures.
Uncertainties regarding the intermediates that are formed leading to the observed phases,
associated reaction energy barriers, and differences in the reactivity of the clay mineral facet,
interlayers, and edge exist. To address these challenges, the following questions are addressed in
this study:
1. What new phases and species are formed as Na-montmorillonite clay reacts with water and
formic acid? How does reactivity influence the interlayer basal spacing of the clay structure?
2. What are the possible reaction pathways leading to the formation of observed phases?
3. How do the differences in the chemistry of the facet, interlayer, and edge of sodium
montmorillonite influence reactivity?
To address these questions, computational models such as ReaxFF/MD and experimental
approaches such as Fourier-Transform Infrared Spectroscopy (FT-IR) and X-ray scattering
measurements are used to investigate reactivity and speciation when sodium montmorillonite
reacts with formic acid and water. Although numerical simulation approaches such as Monte Carlo
(MC) methods, 19–21 Molecular Dynamics (MD), 22–24 and Density Functional Theory (DFT) 25,26
have been used to study the interfacial dynamics of fluids in clays, ReaxFF/MD methodology 27,28
is uniquely suited to elucidate the interfacial chemical reaction mechanisms 29 and to estimate
early-stage kinetics 16 in reactive fluid-solid systems. ReaxFF allows the user to set up an
appropriate initial geometry and then harness the reaction-diffusion processes to drive the system
towards local chemical equilibria. In contrast with a non-reactive MD simulation with non-reactive
empirical potentials, where the system topology remains constant throughout the simulation, this
feature of ReaxFF methodology makes it much more general. ReaxFF forcefields are trained
against the dataset obtained from accurate electronic structural calculations such as density
functional theory (DFT), which enables near-quantum mechanical accuracy, especially for
reaction barriers and enthalpies, circumventing the high computational costs of ab-initio based
methods. For these reasons, ReaxFF based MD simulations have been used to accurately simulate
the dynamics of mineral/fluid interfacial chemistry in prior studies 15,16,29,30.
Advancements in spectroscopy techniques now allow us to benchmark ReaxFF/MD models
for mineral reactivity. The ability to accurately predict the infrared (IR) spectroscopy patterns of a
reactive system using ReaxFF/MD simulations opens the feasibility for applying this approach to
investigate complementary fluid-particle interactions. In principle, if there is a good agreement,
these systems can be further interrogated using ReaxFF/MD to delineate reactivity of different
types of interfaces within the system that are challenging to probe experimentally, like the
difference in reactivity of a mineral edge, facet, and the interlayer regions when exposed to the
same fluidic environments. Furthermore, the likelihood of producing a given set of products when
several competing reactions occur can also be determined. In this study, we probe the reactive
interactions of Na-montmorillonite with formic acid and water using a hybrid simulation and
experimental approach.
2. Materials and Methods
To investigate the mechanisms and the products resulting from the interactions of Na-
montmorillonite with formic acid and water, FT-IR spectroscopy and X-ray scattering
measurements were performed on Na-montmorillonite clay samples before and after reacting with
pure formic acid, 1:1 mixture of formic acid and water, and pure water. The pathways underlying
the formation of these products were determined using ReaxFF/MD simulations using a newly
developed forcefield whereby we elucidate the mechanisms, energetics, and products of various
reactions by juxtaposing the experimental results.
2.1 Experimental Methods and Materials
Na-montmorillonite (SWy-3) clay was obtained from The Source Clays Repositories (Purdue
University, West Lafayette, IN) and used as received. Formic acid with purity in the range of 98-
100% (EMSURE® ACS, Reag. Ph Eur) was purchased from Millipore Sigma. To determine the
reaction products, ~500 mg of clay powder was reacted with 100% water and 1:1 mixture of formic
acid and water at 200°C, 1 atm for 2 hours. The reactions were carried out in an acid digestion
vessel (Parr Instrument Company). After the reactions, the powders were filtered to remove the
liquids and air-dried at 90 °C for 48 hours. To evaluate changes in the chemical bonds as a result
of reaction, the infrared (IR) spectra were acquired in an Attenuated Total Reflection (ATR) mode
using an Attenuated Total Reflection-Fourier Transform Infrared spectrometer (ATR-FTIR,
NicoletTM iS50, Waltham, MA). The spectrum of unreacted clay was also acquired as a control.
The IR spectra were acquired in the range of 4000 – 500 cm-1 with the spectral resolution of 1 cm-
1 and signal averaged over 32 scans. Additionally, to uncover the changes in various functional
groups, spectra in specific range were also deconvoluted into Gaussian profiles using the OriginPro
2017 with the help of ‘Multiple Peak Fit’ analysis tool. The deconvolutions were performed in two
different frequency ranges of 3800-2650 cm-1, and 1800-1300 cm-1 since dominant changes to the
spectra were observed in these regions. The R-squared (R2) values corresponding to the coefficient
of determination (COD) for each deconvolution fit were also reported. The R2 value is the
percentage of the response variable variation that explains the fitted regression line. A typical R2
value is always between 0 and 1. If the value is 0, it indicates that the fitted line does not explain
any variability of the response data around its mean. However, if R2 is 1, it indicates that the fitted
line explains all the variability of the response data around its mean. In our fits, we noted an R2
value of > 0.99 in all cases, which indicates a good fitness of fits and reliable agreement between
the modeling fits and the experimental data.
To determine the changes in the microstructure and structure, multi-scale Ultra-Small, Small
and Wide-Angle X-ray Scattering (USAXS/SAXS/WAXS) measurements were performed at
Sector 9-ID-C at Advanced Photon Source (APS) in Argonne National Laboratory (ANL). The
instrument at 9-ID-C uses the original Bonse-Hart double-crystal setup 31,32. To obtain the scans,
the powdered samples were sandwiched between a clear scotch tape and loaded on the acquisition
plate. The scattering from the empty tape was also taken as background and subtracted from the
data. The X-ray wavelength, energy and total flux during the measurements were 0.59 Å, 21.0
keV, and ~1013 photon mm-2 s−1, respectively. Calibrations for sample-to-detector distance and
instrument were performed using silver behenate for SAXS33 and LaB6 for WAXS. USAXS,
SAXS, and WAXS data were obtained by reducing the collected data using the Irena34 and Nika35
macros in the IgorPro software (Wavemetrics, Lake Oswego, OR).
2.2 ReaxFF/reactive Molecular Dynamics Simulations
ReaxFF is a bond-order dependent potential, wherein the total energy of the system consists of
contributions from bond-order dependent terms and nonbonded interaction terms. The ReaxFF
bond order is calculated based on the interatomic distances of all atom pairs in every time step.
Energy contributions from bond-order dependent terms such as bond, valence angle, and torsion
angle disappear upon bond dissociation, and only the nonbonded interactions such as van der
Waals and Coulombic energies need to be considered thereafter. The connectivity between all
atom pairs is calculated on-the-fly from the local atomic environment and updated every time step
of the simulation. This feature allows ReaxFF to capture the chemical reaction process
systematically. Atomic charges required to calculate the non-bonded interaction energies is a
dynamic quantity and derived using the electronegativity equalization method (EEM) 36. More
details on the ReaxFF functional form and implementation can be found in references [21] and
[47] .
To model atomic interactions in Na-montmorillonite, we started with the Na/Si/O/H ReaxFF
parameterization from Hahn et al. 38 and combined it with the Si/Al/O/H ReaxFF parameters which
were previously reported by Pitman and van Duin 30 for clay-zeolite composites. We then
augmented the training set with the sodium carbonate (Na2CO3) and bicarbonate (NaHCO3) groups
as well as the vibrational normal modes of carbonate ion to ensure accurate reproduction of the IR
spectra (ref: Supplementary Material, Section 1). Although the Pitman and van Duin parameter set
were extensively tested to study the structure of Ca-montmorillonite within the zeolite housing and
cation/water diffusion under conditions of dynamic chemical equilibrium, a well-trained Na-
related parameter set is critical for describing the hydration of the Na-montmorillonite surfaces
and the subsequent leaching processes. The Na/Si/O/H parameters used in this study were trained
against a DFT-based training set which describes, sodium-water binding energies, hydration of
sodium hydroxide with water and sodium ion interactions with silanol (Si-OH). All the given
training dataset are relevant to the chemical dissolution of silica/silicate/silicalite surfaces in the
presence of sodium cations and therefore, could provide a reliable description of sodium leaching
dynamics, chemisorption and physisorption of water molecules at the Na-montmorillonite surface.
Furthermore, the parameterization of the Pitman and van Duin model along with its extensions had
been tested for different crystalline and amorphous structures.39–43 This has also captured the
enhanced sodium ion diffusion behavior in water at elevated temperatures due to the disruption of
hydrogen bonds of water in solvation shell.44,45 The Na/Si/Al/O/H parameter set employed herein
are suitable for studying the structure and dynamics of sodium transport under varying temperature
and solvation conditions.
Na-montmorillonite is a dioctahedral phyllosilicate with a 2:1 arrangement of tetrahedral
silicate and octahedral aluminum layers. The crystalline Na-montmorillonite structure used for the
simulations consisted of 11200 atoms created using a unit cell with lattice parameters a = 5.22 Å,
b = 9.02 Å, and c = 12.4 Å. This structure was first independently energy minimized with the (001)
cleavage plane exposed to vacuum and leveraged the reactive forcefield for surface atomic
rearrangements and optimization. Following this, the system is equilibrated at T = 298 K and P =
1 atm with periodic boundary conditions but leaving 2 Å of vacuum on either side of the free
surface. The space between the TOT (tetrahedral-octahedral-tetrahedral) layers contain sodium
cations (Na+). The overall structure of Na-montmorillonite has a negative charge which is balanced
by the positively charged intercalated Na+ ions.
Single water and formic acid molecules were independently created and allowed to relax to the
lowest energy configuration within the force field. We chose 13600 fluid molecules each for both
water and formic acid and were randomly arranged around the Na-montmorillonite structure on
all sides of the system until the desired density was achieved corresponding to the chosen
temperature (T = 473 K) and pressure (P = 1 atm). Thereafter, the energy of the system was
minimized and non-reactively equilibrated at target temperature and pressure, to form a system
geometry (Figure 1), thereby exposing crystal facet, edge, and the interlayers to fluid molecules
to create avenues for protonation and other surface reactions.
We used ReaxFF integrated into the Amsterdam Density Functional (ADF) 46 for reactive MD
simulations. All simulations were run in the anisotropic isothermal-isobaric (NPT) ensemble with
fixed x and y dimensions, using a weak Berendsen thermo/barostat with a temperature damping
constant of 0.1 ps to keep the temperature constant. A time step size of 0.25 fs was used, and the
equations of motion were integrated using the velocity-Verlet integration scheme 47. The system
was run for 0.6 ns allowing for the generation of sufficient statistics. A total of three independent
repetitions of the simulation starting from different initial geometries were performed; their mean
values were obtained to ensure an unbiased statistical sampling of the MD trajectory. We also used
ReaxFF/MD implementation in LAMMPS 48,49 to generate the data necessary for computing IR
spectra. For this, the system was run in NPT ensemble for a maximum of 20 ps. For the IR spectra
calculation, the output in the form of the total dipole moment of the system was obtained every 0.5
fs, which was later post-processed to compute the IR spectra 50.
3. Results and Discussion
3.1 Speciation behavior: Insights from IR spectroscopy and reactive MD simulations
The first step is to benchmark the reactive forcefield by ensuring that the different species
signatures observed in ATR-IR spectra are accurately predicted by the simulation. Figure 2 (a)
and 2 (b) represent the measured and computed IR spectra respectively. As can be seen from these
figures, roughly, three frequency regimes can be identified characteristic of different types of
vibrational modes: 3800-2650 cm-1, 1800-1300 cm-1, and 1300-500 cm-1. These regimes were also

deconvoluted into Gaussian peaks to classify them based on representative species, as shown in
Figures S9 and S10.
In Figure 2 (a), the IR peak around ~515 cm-1 is associated with the bending vibrations of Si-
O-Al of pristine Na-montmorillonite crystal 51. Upon reacting with both the fluids, a slight shift to
a higher wavenumber i.e. from 516.70 cm-1 (unreacted) to 516.74 cm-1 (after reactions), was also
noted for the Si-O-Al linkages. Importantly, heights of these peaks were influenced by the
chemistry of surrounding fluids: reactivity with H2O yielded the largest decrease in height
followed by the 1:1 mixture of H2O and HCOOH and HCOOH. Computed IR peaks also showed
similar characteristics for the Si-O-Al linkages. In Figure 2 (b), the computed IR peak
corresponding to the bending vibrations of Si-O-Al linkages in unreacted Na-montmorillonite
crystal is observed around ~430 cm-1. This peak decreases in height upon reaction with various
fluids and also shifts marginally to higher wavenumber (~440 cm-1), similar to the experimental
IR data. To further investigate the physical reasons behind peak intensity shifts, we calculated the
angle distribution of Si-O-Si (Figure S5(a)) and Si-O-Al (Figure S5(b)) before and after the
reactions. It is evident from Figure S5 that there is a broadening of these angles after reaction,
which could be attributed to the peak shifts to higher frequencies. This observation is further
validated by prior studies reporting the broadening of angles due to the formation of surface silanol
(Si-OH) groups 15,16.
Corroborating evidences were also observed from the peaks associated with the hydroxyl
groups, where it is interesting to note that no shifts were observed in the bending vibrations of
hydroxyl groups (d OH) of Al-Al-OH (~914.7 cm-1) and tridymite (~796 cm-1) in Na-
montmorillonite. This observation also directed our attention to investigate changes in silanol (Si-
OH) groups. The IR bands around ~1115 cm-1 and ~1000 cm-1 which are typically attributed to the
Si-O (out-of-plane) and Si-O (in-plane) stretching vibrations, respectively 51–53 were determined
for Na-montmorillonite samples. However, a reduced intensity of IR spectra that corresponds to
Si-O bonds when Na-montmorillonite is reacted in water is observed, which may be attributed to
the bond dissociation of Si-O-Si followed by silanol formation. We also observed a shift from
982.81 to 1000.78 cm-1 for Si-O in-plane stretching vibrations as a result of the reactions. However,
for the ReaxFF/MD case, the frequencies were slightly underpredicted (red-shift) for the Si-O (in-
plane) case which is located at ~800 cm-1 whereas for the Si-O (out-of-plane) case, the predictions
fall in place of ~1100 cm-1. Nonetheless the general trend of reduction in intensity post-reaction
remained unchanged.
Furthermore, as seen in the deconvoluted peaks in Figures S9, in the unreacted clay, the
prominent bending vibrations were observed at 1647.54 cm-1 and 1632.94 cm-1. These peaks
correspond to -OH bending vibrations. In the reacted Na-montmorillonite, similar vibrations were
observed but the peaks were slightly shifted. For example, in Na-montmorillonite reacted with
water, the aforementioned peaks were observed at 1626.77, 1581.65, 1544.31, and 1366.57 cm-1,
respectively. In addition to a slight shift in the peak positions, the peak around 1581.65 cm-1
became prominent and appeared as a shoulder peak. Similarly, peaks at lower wavenumbers
(1544.31, and 1366.57 cm-1) also became prominent as compared with the ones observed in the
unreacted clay. A small peak at 1720.34 cm-1 corresponding to O-H bending vibrations was also
noted as a result of reaction. We also computed similar peaks that followed the same qualitative
trends as shown in Figure 2 (b).
Most importantly, we were able to capture the IR signatures of carbonate species with
unprecedented levels of accuracy. In the deconvoluted IR spectra (Figure S9), we noted the
emergence of a sharp peak at 1444.07 cm-1 that was associated with the bending vibration of C-O

in carbonate ion (CO32-) formed as a result of different carbonation reactions 54,55. Simulated C-O
bending peak for CO32- was also observed at ~1450 cm-1 suggesting that the carbonate formation
reactions may have been simulated accurately. Additionally, a weak peak ~3500 cm-1
corresponding to the C-O stretching vibrations for CO32- was observed in both experiments and
simulations, further confirming the efficacy of the forcefield.
Figure S9 also shows peaks corresponding to various other expected reaction products. In case
of the sample reacted with H2O-HCOOH mixture, besides the peaks appearing at 1715.09,
1633.28, 1580.20, 1544.81, 1374.58 cm-1 for OH bending vibrations and 1442.84 cm-1 for C-O
due to carbonation of NaOH, we also observed peaks around 1715.09 cm-1 (sharp), and 1664.73
cm-1, which corresponded to the COO- vibrations in HCOONa. A peak attributed to the vibrations
of C=O groups was observed at 1685.83 cm-1. Additionally, we also noted the vibrations from C-
O group in carboxylic acid salts i.e., HCOONa in our case, at 1607.00 and 1392.96 cm-1 56–59.
These peaks, however, are not quite apparent in the computed IR spectra, partly because the
forcefield was not trained against these vibrational modes and partly because the concentration of
these formed species was negligible to produce a characteristic signature.
3.2. Precipitation of solids at the interlayer and changes in interlayer spacing: Insights from
X-ray scattering and reactive MD simulations
Reactions between the (bi)carbonate species and dissolved Na+ cations result in the
precipitation of Na2CO3 and NaHCO3 solids that can potentially deposit at the interlayer 60. As
evident from the concentration profiles of the (bi)carbonate salts shown in Figure S14 and Figure
S15, the propensity to form NaHCO3 and Na2CO3 is higher at the interlayer regime owing to the
high concentration of Na+ and H2CO3. The mechanism of NaHCO3 precipitation as obtained from
our MD simulations is shown in Figure 3. In this mechanism, dissolved Na+ ion attacks the oxygen
of H2CO3, followed by the formation of intermediate species, Na--H2CO3 (Figure 3 (b)), which
dissociates to produce NaHCO3 and proton, as shown in Figure 3 (c). To form Na2CO3, Na+ ion
attack the NaHCO3 releasing a proton via Na+/H+ exchange reaction.
One direct consequence of this precipitation is the change in the interlayer basal spacing. To
determine if salt precipitation alters the interlayer spacing, we inspect the peak positions in X-ray
scattering measurements. The changes in the interlayer basal spacing of Na-montmorillonite as a
result of reactions was determined using SAXS measurements. The combined USAXS and SAXS
curves for samples in the study are shown in the Figure 4, wherein the zoomed-in SAXS portion
is shown in Figure 4 (b). Changes in the interlayer basal spacing of Na-montmorillonite were
noted, depending on the reacting fluid. The interlayer spacing was noted to be 12.36 Å in the
unreacted clay, which slightly increased to 14.01 Å after reaction with H2O. A slight hump was
also noted in the H2O case around q = 0.26 Å-1, corresponding to basal spacing of 24.17 Å. This
increase in the basal spacings and new peaks were more prominent after reactions in the presence
of acid. This could be attributed to the precipitation of different species in the interlayer of swelling
clays like Na-montmorillonite as mentioned in the previous studies 17,18,61. In case of reaction with
both HCOOH and 1:1 mixture of H2O and HCOOH, additional peaks were noted around 0.26 Å-
1, corresponding to the interlayer basal spacing of 24.17 Å. Moreover, in both cases, the original
interlayer basal spacing of ~12 Å was also noted, which indicates that the original clay spacing
has been largely preserved.
Other species with the potential to swell clays are NaOH and HCOONa. As shown in Figure
9 and Figure S11, we observe an increasing concentration of NaOH and HCOONa molecules
respectively, observed in MD simulations. In Figure 5, the WAXS intensities for Na-
montmorillonite clay before and after reactions are shown. Some additional peaks were also noted
in the WAXS pattern after reaction with the fluids. After reaction with H2O, two prominent new
peaks were noted around q = 2.99 and 3.48 Å-1, corresponding to the d-spacing of 2.10 and 1.81
Å, respectively. These peaks correspond to the (200) and (220) planes of cubic NaOH 62, which
was formed during the reaction.
Na-montmorillonite reacted with pure HCOOH and H2O+HCOOH mixture resulted in the
formation of Na2CO3 and HCOONa salts. These characteristic peak noted t q = 1.67 and 1.81 Å-1,
in Na-montmorillonite (1:1, H2O:HCOOH), correspond to (111) and (111) planes of monoclinic
Na2CO3 63 with a d-spacing of 3.74 and 3.44 Å, respectively. However, in case of acid (HCOOH)
only, (201) and (111) planes of monoclinic NaOH were noted around 1.63 and 1.81 Å-1,
corresponding to d-spacings of 3.86 and 3.48 Å, respectively. Moreover, additional peaks were
also noted in both cases with formic acid. In 1:1 mixture, the peak around q = 3.93 Å-1, having a
d-spacing of 1.59 Å corresponds to the precipitation of HCOONa 64. Na-montmorillonite reacted
in HCOOH resulted in two peaks around 1.74 and 3.98 Å-1 (and a corresponding d-spacing of 3.62
and 1.58 Å) which correspond to HCOONa 64. These experimental results confirm predictions
from ReaxFF/MD simulations of the formation of carbonate and formate phases when Na-
montmorillonite is reacted with HCOOH. In the following sections, we investigate the pathway of
these reactions with the help of ReaxFF/MD simulation trajectory with emphasis on the differences
in reactivity between Na-montmorillonite facets, edges, and interlayer regions.
3.3. Mechanistic understanding of the differences in the reactivities of facets, edges, and
interlayers using reactive MD simulations

Three distinct reactive surfaces can be identified on the Na-montmorillonite structure in Figure
1: facets, edges, and the interlayers. Edge surfaces are assumed to have the same stoichiometry
and structure as the bulk crystal, with slight bond-length relaxation to account for over- or under-
coordinated surface O atoms. 65 However, recent ab initio MD simulation results indicate that
cations in the octahedral layer adopt a 5-fold coordination making it highly reactive. 66 Interlayers
are like facets but consist of Na+ counterions at the surface to balance the excess surface charge.
They also have adsorbed water and formic acid near the surface that result in the formation of
reactive surface hydroxyl groups. The presence of excess charge, adsorbed molecules, and surface
hydroxyl groups make the edge and interlayers relatively more reactive than the facets. In this
section, we explore the various reaction mechanisms stemming from these reactivity differences.
3.3.1. Physisorption properties of Na-montmorillonite surface
The first observed step in these mechanisms is the physisorption of the fluid molecules at the
montmorillonite surfaces. Figure S4 shows the early stage interactions (before 2.5 ps) at the
interface of Na-montmorillonite-water/acid interfaces. These are non-reactive, physical adsorption
events at time scales in the range of 0-2.5 ps, causing an increase in the density of adsorbed layer,
setting stage for surface protonation events (see Figures S4 (a) and (b)). It is important to ensure
that the forcefield accurately captures the adsorbed fluid layer at the montmorillonite surface.
Physisorption is due to van der Waals and Coulombic forces between the dipoles of water and acid
and the induced dipoles on the montmorillonite surface. Hence, a stable physiosorbed layer also
confirms that the nonbonded interactions between the atoms of montmorillonite, water, and formic
acid are modeled accurately by the forcefield. We obtained an adsorbed layer with a thickness of
~1-2 Å as shown in Figure S4, which is comparable with prior MD calculations 16,67 and the energy
of adsorption of ~1 kcal/mol, which is in line with the hydration energy reported elsewhere 68. To
confirm that the adsorption energy is predicted accurately for the right physical reasons, we
characterized the adsorption behavior of the fluid molecules. On the Si-terminated surface, we
found that most of the water is adsorbed by hydrogen bonding to bridging oxygen (BO) of the
surface Si-O-Si linkage. In the case of formic acid, however, the hydrogen bound to C tends to
bind with the bridging oxygen via hydrogen bonding. After complete physisorption, the reactions
are turned on.
The change in concentration of the adsorbed water and formic acid species due to chemical
reactions, as a function of time in the edge, interlayer, and facet regimes from t = 0 (fully
physisorbed state) to t = 0.6 ns (end of simulation) for different fluid environments are shown in
Figure 6 and Figure S6. Note that these the three regimes are defined by considering a cleavage
plane at a perpendicular distance of 0.5 nm from the surfaces on either side. The edge and interlayer
regions have adsorbed the highest concentration of fluid molecules, which may be ascribed to the
presence of Na+ ions resulting in a positively charged surface that attracts the oxygen groups. This
is further corroborated by the fact that water being a polar molecule is in a more physisorbed state
than formic acid (Figure S6).
3.3.2. Formation and utilization of hydroxyl groups
The dissociation of the adsorbed water or formic acid molecules over time and the associated
decrease in the concentrations of these molecules over time is shown in Figure 3. The products of
the dissociation of adsorbed water or formic acid molecules are protons (H+) and hydroxyl (OH-)
ions. The OH- ions are produced from the decomposition of water at the surface by formation of
silanol (Si-OH) groups as a result of surface protonation. 16 The ≡Si-O- (NBO) sites on the
silica/silicate surface react with the adsorbed water molecules to become protonated.15,69,70
Compared with the silica/silicate surface, the exposed surfaces of Na-montmorillonite are the
tetrahedral silicate layers with all the Si atoms being Q4 species, meaning that Si of SiO4
tetrahedron within the layer is connected by four bridging oxygens. OH- ions are highly reactive
and can result in several other crucial reactions that determine the final composition of the mixture.
We also quantified the time dependent changes in concentration of OH- ions, as shown in Figure
7. As seen in the figure, for water + formic acid and pure formic acid cases, OH- concentration
increases to a peak value in 0.2 ns and then reduces (or stays nearly constant) with time for all
three regions. However, for pure water case, OH- concentration decreases as a result of interactions
with the interlayer but increases due to interactions with the edge and facet regions. The decrease
in OH- concentrations is attributed to reactions with formic acid. Formic acid dissociates to release
a proton that combines with OH- to produce water leaving behind formate species following an
acid-base neutralization reaction. These formate ions further react with OH- to produce
formaldehyde as evident from the concentration profile shown in Figure S7(b). In the pure water
case, OH- is mostly only consumed by Na+ ions that are present in the interlayer, resulting in a
steadily decreasing trend, as seen in Figure S6. OH- ions are consumed by Na+ ions as soon as
they form, to produce NaOH molecules, which either deposit in the interlayer or diffuse outwards
(Figure 8), thus contributing to the leaching of Na+ ions.
It is important to note the gradually decreasing trend of OH- concentrations in the interlayer
region where Na-montmorillonite is reacted with formic acid compared with reactions with pure
water at the edge and facet. This may be attributed to multiple competing reactions. In the
interlayer region, OH- concentration decreases because these ions are consumed by Na+ ions as
soon as they are produced, to form NaOH molecules (Figure 9). Moreover, the replenishment of
OH- ions by diffusion of water molecules to the interlayer is a comparatively slow process. For the
edge and facet regions, however, continuous surface protonation constantly produces OH- groups
but the concentrations of NaOH at the edge and facet is substantially lower than that of the
interlayer. Lower than expected consumption of OH- ions is attributed to the slower diffusion of
Na+ ions compared to OH- formation kinetics at the edges and the facets. This hypothesis is
confirmed by the trends in HCOONa production rates as seen in Figure S12. The HCOO-
molecules formed by the deprotonation of formic acid are neutralized with Na+ ion to form sodium
formate (Figure S11). Alternatively, these HCOO- molecules are adsorbed on the surface of Na-
montmorillonite and converted to CO, CO2, and carbonate (CO32-) species based on the local
conditions.
3.3.3. Conversion of HCOOH to CO, CO2, and CO32- groups
The interactions of formic acid and clays at elevated temperatures and pressures result in the
formation of CO, CO2, and CO32- species. CO concentrations are particularly important since CO
molecules are strong reducing agents, and the precursor to CO2 formation which is eventually
converted to bicarbonates and carbonates.
Figure 10 shows the concentration of CO in the different regimes as a function of time. For
edge and interlayer, water + formic acid case yields higher CO concentration but for facets, pure
HCOOH case results in a higher concentration. CO concentration increases with time in the
interlayer but decreases in the facet region. In the edge region, in comparison, CO concentrations
increase marginally up to 0.4 ns and then decrease. Interactions of formic acid and water mixtures
with the edge and the interlayer result in higher levels of CO formation compared to formic acid.
In contrast, formic acid produces more CO molecules due to interactions with the facet region of
sodium montmorillonite. The mechanisms underlying these observations are discussed below.
There are two mechanisms involved in the formation of CO. In the first mechanism, CO is
formed by the simple decomposition of HCOOH without any surface catalytic influences. In a
surface catalyzed mechanism, the adsorbed water decomposes a formic acid molecule creating two
water molecules and CO as shown in Figure 11. We performed independent bond restraint analysis
on these two mechanisms, which yielded an activation energy barrier of ~59 kcal/mol for the
surface catalyzed reaction and an activation energy of ~47 kcal/mol for the HCOOH
decomposition reaction in the absence of a solid interface. Hence, these reactions have nearly equal
probability of occurrence. Nonetheless, in the bulk fluid, we expect more HCOOH decomposition
reactions while in the presence of surfaces, we expect more surface catalyzed CO production
reactions. For instance, the water + formic acid case has substantially more CO concentration for
edge and interlayer regions because the high concentration of surface adsorbed water aids in CO
production. At the facet, CO formation due to the decomposition of HCOOH is dominant.
The strong reducing nature of CO contributes to CO2 formation. The 1:1 mixture of water and
formic acid also produces more CO2 molecules, in all cases, compared to the pure water or formic
acid cases. In principle, HCOOH to CO2 conversion can occur by three different mechanisms:
direct, indirect, and the formate pathway, as represented by the reactions below:
1. HCOOH ⟷ HCOOH!"#$%!,#$'"%⎯⎯⎯⎯⎯⎯⎯' CO$ (Direct pathway) (1)
2. HCOOH ⟷ HCOOH!"#%!,#'"%⎯⎯⎯⎯⎯' HCOO!"# +?
#%!,#'"%⎯⎯⎯⎯⎯'CO$ (Formate pathway) (2)
3. HCOOH ⟷ HCOOH!"#%#(%⎯⎯' CO!"+?
)%#(,#$%!,#$'"%⎯⎯⎯⎯⎯⎯⎯⎯⎯⎯⎯'CO$ (Indirect pathway) (3)
Our simulations showed that the indirect mechanism as illustrated in Figure 13 is the dominant
source of CO2. Here, the adsorbed CO molecules react with water at the surface to form CO2. From
the CO2 concentration profile shown in Figure 12, it is clear that the CO molecules are consumed
at the interlayer and produce more CO2 molecules.
The concentration of CO2 also begins reducing after 0.4 ns owing to the formation of carbonic
acid. This manifests as the decrease in CO2 concentration with time for edge and interlayer cases
(Figure 12). Whereas for the facet, carbonic acid production is low and therefore, we observe a
steady rise in CO2 concentration. CO2 molecules can further react with water and form carbonate
species i.e. conversion of CO2 to CO32-. CO32- concentration (Figure 14) changes only in the
interlayer region whereas at edge and facet, it is non-existent. To interrogate the trends shown in
Figure 14 further, we analyzed the pathways of CO32- formation, yielding two distinct
mechanisms:
1. CO$ + H$O →H$CO*#%!%⎯'HCO*#
#%!%⎯'CO*$# (carbonic acid to carbonate decomposition as
shown in Figure S16 and Figure S17) (4)
2. HCOO!" + O∗ → CO*$# + H) (surface catalyzed oxidation of adsorbed formate ion as
shown in Figure 15). (5)
In the interlayer region, due to multiple clay sheets engulfing the formic acid molecules, both
these reactions were observed in our simulations. To assess which reaction is more probable, we
examined the H2CO3 concentration (Figure 16). For edges, although H2CO3 concentration is high,
no carbonate molecules are formed but for interlayer, although the H2CO3 concentration is lower
than the edges, carbonate concentration is higher. The trends shown in Figure 14 and Figure 16
can be explained by the combined effects of long residence time of adsorbed H2CO3 ions, presence
of interlayer Na+ and OH- ions in the interlayer region. H2CO3 molecules formed at the facets and
edges diffuse out into the bulk fluid whereas those adsorbed at the interlayer decomposes to CO32-
ions over time. The surrounding OH- ions help in abstracting protons from H2CO3 and Na+ ions in

precipitating the carbonate salts. These effects are mutually complementing in the interlayer region
whereas that is not observed at the edge and facet regions.
For the interlayer region, however, H2CO3 is converted to carbonate and HCOO- is converted
in ~1:3 ratio, which left us question which carbonate formation reaction has higher probability of
occurrence. Bond restraint analysis of the decomposition of carbonic acid (as shown in Figure 12)
and bicarbonate ions (as shown in Figure 13) have an activation energy of ~29 kcal/mol and ~34
kcal/mol, respectively. On the other hand, the activation of energy associated with the formation
of CO32- species from HCOO- adsorbed at the interlayer of Na-montmorillonite (as shown in
Figure 14) is ~100 kcal/mol. Therefore, it is energetically more favorable for carbonate production
to proceed in the H2CO3 decomposition pathway, but the presence of mineral surfaces may invoke
a surface catalyzed formate ion oxidation pathway.
The mechanisms of formation of H2CO3 and CO32- ions explain the trends in reprecipitation of
NaHCO3 and Na2CO3 reported in Section 3.2. In other words, two intersecting reaction pathways
occur at the interlayers. In the first, Na+ ions dissolve into water and in the second, CO2 speciates
into bicarbonates and carbonates that neutralizes with the dissolved Na+ to reprecipitate as salts at
the interlayer. These precipitates act as heterogeneous nucleation sites for further metal carbonate
nuclei growth by different growth mechanisms like classical monomer-by-monomer addition and
modern oriented attachment.60,71,72
4. Conclusions
In this study, we determined the speciation behavior when sodium montmorillonite is reacted
in three different fluid environments (water, formic acid, and 1:1 water + formic acid) using
ReaxFF/MD simulations, IR spectroscopy, and X-ray scattering (WAXS, SAXS) measurements.
All the major peaks in the experimental IR spectra of Na-montmorillonite before and after reaction
with water and formic acid, such as those corresponding to Si-O-Al linkages, O-H and CO32-
groups were predicted by ReaxFF/MD with reasonable levels of accuracy. Our MD simulations
predict that bicarbonate (HCO3-) and carbonate (CO32-) ions react with Na+ to produce NaHCO3
and Na2CO3 solid precipitates, respectively. A direct consequence of this precipitation – an
increase in the interlayer spacing was observed as additional peaks in the SAXS intensity plot.
Furthermore, WAXS intensities also showed strong signatures of NaOH and HCOONa which also
have the tendency to precipitate in the interlayer regions. The differences in the reactivities of the
edge, interlayer, and facet regions were noted from the simulations. The interlayer preferentially
aided the formation of CO, CO2, and carbonates over the edge and facet regions. The higher
reactivity of the interlayer is attributed to the presence of Na+ counterions owing to over/under-
coordinated O-atoms and 5-fold coordination of cations in the octahedral layer. The facet region
was the least reactive surface where most reactions were attributed to surface mediated
decomposition of adsorbed species.
Molecular-level mechanistic insights of the speciation behavior of OH- ions, CO, CO2, and
CO32- were obtained from the MD simulations. In a pure water system, OH- ions are consumed by
Na+ ions to form NaOH molecules that either deposit in the interlayer or leach outwards into water.
In acid containing environments, OH- ions are consumed by formic acid to produce water and
formate ions, which further reduce to formaldehyde. Formation of CO due to simple
decomposition of HCOOH and water-assisted surface catalytic decomposition of HCOOH was
observed with both these pathways yielding energetically similar probability of occurrence. CO2
formed by the indirect conversion of CO to CO2 near the clay edge and interlayer surfaces. The
formed CO2 later converts to HCO3- and CO32- molecules. The experimental and simulation
approaches described in this study and the transferable forcefields for fluid-clay interactions can
be applied translationally to advance the science of clay-fluid interactions for several applications
including subsurface fluid storage and recovery and clay-pollutant dynamics.
Associated Content
The Supporting Information is available free of charge on the ACS Publications website.
Supplementary Information (PDF)
AUTHOR INFORMATION
Corresponding authors
Dr. Adri C. T. van Duin,
Phone: +1 814 863 6277, E-mail: [email protected]
Dr. Greeshma Gadikota,
Phone: +1 607-255-4796. E-mail: [email protected]
Author Contributions
M.G.M. and S.H.H. developed the forcefield, performed MD simulations and analysis with
assistance from A.C.T.v.D. providing guidance. N.D. contributed in the forcefield development.
H.A. performed the measurements with assistance from G.G. providing guidance. M.G.M. and
H.A. wrote the majority of the manuscript with guidance from A.C.T.v.D. and G.G. All authors
contributed to the writing and review of the manuscript. A.C.T.v.D. supervised the overall effort.
Funding Sources
This work was supported as part of the Multi-Scale Fluid-Solid Interactions in Architected and
Natural Materials (MUSE), an Energy Frontier Research Center funded by the U.S. Department
of Energy, Office of Science, Basic Energy Sciences under Award # DE-SC0019285. S.H.H.
acknowledges support from NSF DMR grant # 1609107.
References
(1) Montgomery, W.; Tuff, J.; Kohn, S. C.; Jones, R. L. Reactions between Organic Acids
and Montmorillonite Clay under Earth-Forming Conditions. Chem. Geol. 2011, 283 (3–4),
171–176. https://doi.org/10.1016/j.chemgeo.2010.12.023.
(2) Bass, M. N. Montmorillonite and Serpentine in Orgueil Meteorite. Geochim. Cosmochim.
Acta 1971, 35 (2), 139–147. https://doi.org/10.1016/0016-7037(71)90053-6.
(3) Tomeoka, K.; Buseck, P. R. Intergrown Mica and Montmorillonite in the Allende
Carbonaceous Chondrite. Nature 1982, 299 (5881), 326–327.
https://doi.org/10.1038/299326a0.
(4) Sephton, M. A. Organic Compounds in Carbonaceous Meteorites. Nat. Prod. Rep. 2002,
19 (3), 292–311. https://doi.org/10.1039/b103775g.
(5) Ferris, J. P.; Delano, J. W. Chemical Evolution Across Space and Time; American
Chemical Society, 2017; pp 292–308.
(6) Ehrenfreund, P.; Charnley, S. B. Organic Molecules in the Interstellar Medium, Comets
and Meteorites: A Voyage from Dark Clouds to the Early Earth. Rev. Astron. Astrophys.
2000, 38, 427–483.
(7) Gadikota, G.; Zhang, F.; Allen, A. J. Towards Understanding the Microstructural and
Structural Changes in Natural Hierarchical Materials for Energy Recovery: In-Operando
Multi-Scale X-Ray Scattering Characterization of Na- and Ca-Montmorillonite on Heating
to 1150 °C. Fuel 2017, 196, 195–209. https://doi.org/10.1016/j.fuel.2017.01.092.
(8) Kaszuba, J. P.; Janecky, D. R.; Snow, M. G. Carbon Dioxide Reaction Processes in a
Model Brine Aquifer at 200 C and 200 Bars: Implications for Geologic Sequestration of
Carbon. Appl. Geochemistry 2003, 18 (7), 1065–1080.
(9) Herz-Thyhsen, R. J.; Kaszuba, J. P.; Dewey, J. C. Dissolution of Minerals and
Precipitation of an Aluminosilicate Phase during Experimentally Simulated Hydraulic
Fracturing of a Mudstone and a Tight Sandstone in the Powder River Basin, WY. Energy
& Fuels 2019, 33, 3947–3956.
(10) Li, M.; Wei, C.; Fan, G.; Li, C.; Deng, Z.; Li, X. Extraction of Vanadium from Black
Shale Using Pressure Acid Leaching. Hydrometallurgy 2009, 98 (3–4), 308–313.
(11) El Rayah, H. M. E.; Rowell, D. L. The Influence of Iron and Aluminium Hydroxides on
the Swelling of Na-Montmorillonite and the Permeability of Na-Soil. J. Soil Sci. 1973, 24
(1), 137–144. https://doi.org/10.1111/j.1365-2389.1973.tb00749.x.
(12) Brindley, G. W.; Kao, C.-C. Formation, Compositions, and Properties of Hydroxy-Al- and
Hydroxy-Mg- Montmorillonite. Clays Clay Miner. 1980, 28 (6), 435–443.
(13) Lagaly, G.; Mecking, O.; Penner, D. Colloidal Magnesium Aluminum Hydroxide and
Heterocoagulation with a Clay Mineral. II. Heterocoagulation with Sodium
Montmorillonite. Colloid Polym. Sci. 2001, 279 (11), 1097–1103.
https://doi.org/10.1007/s003960100525.
(14) Smith, M. M.; Dai, Z.; Carroll, S. A. Illite Dissolution Kinetics from 100 to 280° C and
PH 3 to 9. Geochim. Cosmochim. Acta 2017, 209, 9–23.
(15) Hahn, S. H.; van Duin, A. C. T. Surface Reactivity and Leaching of a Sodium Silicate
Glass Under Aqueous Environment: A ReaxFF Molecular Dynamics Study. J. Phys.
Chem. C 2019.
(16) Muraleedharan, M. G.; Herz-Thyhsen, R.; Dewey, J. C.; Kaszuba, J.; van Duin, A. C. T.
Understanding the Chemistry of Cation Leaching in Illite/Water Interfacial System Using
Reactive Molecular Dynamics Simulations and Hydrothermal Experiments. Acta Mater.
2020, 186, 564–574.
(17) Hur, T. B.; Baltrus, J. P.; Howard, B. H.; Harbert, W. P.; Romanov, V. N. Carbonate
Formation in Wyoming Montmorillonite under High Pressure Carbon Dioxide. Int. J.
Greenh. Gas Control 2013, 13, 149–155. https://doi.org/10.1016/j.ijggc.2012.12.001.
(18) Giesting, P.; Guggenheim, S.; Koster van Groos, A. F.; Busch, A. Interaction of Carbon
Dioxide with Na-Exchanged Montmorillonite at Pressures to 640 Bars: Implications for
CO2 Sequestration. Int. J. Greenh. Gas Control 2012, 8, 73–81.
https://doi.org/10.1016/j.ijggc.2012.01.011.
(19) Ferrage, E.; Sakharov, B. A.; Michot, L. J.; Delville, A.; Bauer, A.; Lanson, B.; Grangeon,
S.; Frapper, G.; Jiménez-Ruiz, M.; Cuello, G. J. Hydration Properties and Interlayer
Organization of Water and Ions in Synthetic Na-Smectite with Tetrahedral Layer Charge.
Part 2. Toward a Precise Coupling between Molecular Simulations and Diffraction Data.
J. Phys. Chem. C 2011, 115 (5), 1867–1881.
(20) Botan, A.; Rotenberg, B.; Marry, V.; Turq, P.; Noetinger, B. Carbon Dioxide in
Montmorillonite Clay Hydrates: Thermodynamics, Structure, and Transport from
Molecular Simulation. J. Phys. Chem. C 2010, 114 (35), 14962–14969.
(21) Yu, Y.; Yang, X. Molecular Simulation of Swelling and Interlayer Structure for
Organoclay in Supercritical CO 2. Phys. Chem. Chem. Phys. 2011, 13 (1), 282–290.
(22) Suter, J. L.; Coveney, P. V; Greenwell, H. C.; Thyveetil, M.-A. Large-Scale Molecular
Dynamics Study of Montmorillonite Clay: Emergence of Undulatory Fluctuations and
Determination of Material Properties. J. Phys. Chem. C 2007, 111 (23), 8248–8259.
(23) Mazo, M. A.; Manevitch, L. I.; Gusarova, E. B.; Shamaev, M. Y.; Berlin, A. A.; Balabaev,
N. K.; Rutledge, G. C. Molecular Dynamics Simulation of Thermomechanical Properties
of Montmorillonite Crystal. 1. Isolated Clay Nanoplate. J. Phys. Chem. B 2008, 112 (10),
2964–2969.
(24) Aristilde, L.; Marichal, C.; Miehe-Brendle, J.; Lanson, B.; Charlet, L. Interactions of
Oxytetracycline with a Smectite Clay: A Spectroscopic Study with Molecular
Simulations. Environ. Sci. Technol. 2010, 44 (20), 7839–7845.
(25) Voora, V. K.; Al-Saidi, W. A.; Jordan, K. D. Density Functional Theory Study of
Pyrophyllite and M-Montmorillonites (M= Li, Na, K, Mg, and Ca): Role of Dispersion
Interactions. J. Phys. Chem. A 2011, 115 (34), 9695–9703.
(26) Larentzos, J. P.; Greathouse, J. A.; Cygan, R. T. An Ab Initio and Classical Molecular
Dynamics Investigation of the Structural and Vibrational Properties of Talc and
Pyrophyllite. J. Phys. Chem. C 2007, 111 (34), 12752–12759.
(27) Van Duin, A. C. T.; Dasgupta, S.; Lorant, F.; Goddard, W. A. ReaxFF: A Reactive Force
Field for Hydrocarbons. J. Phys. Chem. A 2001, 105 (41), 9396–9409.
(28) Chenoweth, K.; Van Duin, A. C. T.; Goddard, W. A. ReaxFF Reactive Force Field for
Molecular Dynamics Simulations of Hydrocarbon Oxidation. J. Phys. Chem. A 2008, 112
(5), 1040–1053.
(29) Muraleedharan, M. G.; Asgar, H.; Mohammed, S.; Gadikota, G.; van Duin, A. C. T.
Elucidating Thermally Induced Structural and Chemical Transformations in Kaolinite
Using Reactive Molecular Dynamics Simulations and X-Ray Scattering Measurements.
Chem. Mater. 2019.
(30) Pitman, M. C.; Van Duin, A. C. T. Dynamics of Confined Reactive Water in Smectite
Clay–Zeolite Composites. J. Am. Chem. Soc. 2012, 134 (6), 3042–3053.
(31) Bonse, U.; Hart, M. Tailless X-Ray Single-Crystal Reflection Curves Obtained by
Multiple Reflection. Appl. Phys. Lett. 1965, 7 (9), 238–240.
https://doi.org/10.1063/1.1754396.
(32) Ilavsky, J.; Zhang, F.; Allen, A. J.; Levine, L. E.; Jemian, P. R.; Long, G. G. Ultra-Small-
Angle X-Ray Scattering Instrument at the Advanced Photon Source: History, Recent
Development, and Current Status. Metall. Mater. Trans. A Phys. Metall. Mater. Sci. 2013,
44 (1), 68–76. https://doi.org/10.1007/s11661-012-1431-y.
(33) Nyam-Osor, M.; Soloviov, D. V.; Kovalev, Y. S.; Zhigunov, A.; Rogachev, A. V.;
Ivankov, O. I.; Erhan, R. V.; Kuklin, A. I. Silver Behenate and Silver Stearate Powders for
Calibration of SAS Instruments. J. Phys. Conf. Ser. 2012, 351, 012024.
https://doi.org/10.1088/1742-6596/351/1/012024.
(34) Ilavsky, J.; Jemian, P. R. Irena: Tool Suite for Modeling and Analysis of Small-Angle
Scattering. J. Appl. Crystallogr. 2009, 42, 347–353.
(35) Ilavsky, J. Nika: Software for Two- Dimensional Data Reduction. J. Appl. Crystallogr.
2012, 45 (2), 324–326.
(36) Mortier, W. J.; Ghosh, S. K.; Shankar, S. Electronegativity-Equalization Method for the
Calculation of Atomic Charges in Molecules. J. Am. Chem. Soc. 1986, 108 (15), 4315–
4320.
(37) Senftle, T. P.; Hong, S.; Islam, M. M.; Kylasa, S. B.; Zheng, Y.; Shin, Y. K.; Junkermeier,
C.; Engel-Herbert, R.; Janik, M. J.; Aktulga, H. M.; et al. The ReaxFF Reactive Force-
Field: Development, Applications and Future Directions. npj Comput. Mater. 2016, 2
(September 2015). https://doi.org/10.1038/npjcompumats.2015.11.
(38) Hahn, S. H.; Rimsza, J.; Criscenti, L.; Sun, W.; Deng, L.; Du, J.; Liang, T.; Sinnott, S. B.;
Van Duin, A. C. T. Development of a ReaxFF Reactive Force Field for NaSiO x/Water
Systems and Its Application to Sodium and Proton Self-Diffusion. J. Phys. Chem. C 2018,
122 (34), 19613–19624.
(39) Hantal, G.; Brochard, L.; Laubie, H.; Ebrahimi, D.; Pellenq, R. J.-M.; Ulm, F.-J.; Coasne,
B. Atomic-Scale Modelling of Elastic and Failure Properties of Clays. Mol. Phys. 2014,
112 (9–10), 1294–1305.
(40) Sadat, M. R.; Muralidharan, K.; Zhang, L. Reactive Molecular Dynamics Simulation of
the Mechanical Behavior of Sodium Aluminosilicate Geopolymer and Calcium Silicate
Hydrate Composites. Comput. Mater. Sci. 2018, 150, 500–509.
(41) Yu, Y.; Krishnan, N. M. A.; Smedskjaer, M. M.; Sant, G.; Bauchy, M. The Hydrophilic-
to-Hydrophobic Transition in Glassy Silica Is Driven by the Atomic Topology of Its
Surface. J. Chem. Phys. 2018, 148 (7), 74503.
(42) DeAngelis, F.; Muraleedharan, M. G.; Moon, J.; Seyf, H. R.; Minnich, A. J.; McGaughey,
A. J. H.; Henry, A. Thermal Transport in Disordered Materials. Nanoscale Microscale
Thermophys. Eng. 2019, 23 (2), 81–116. https://doi.org/10.1080/15567265.2018.1519004.
(43) Muraleedharan, M. G.; Van Duin, A. Reactive Molecular Dynamics Approach to
Understand the Chemistry-Driven Structural Transformations in Heat-Treated Clay
Minerals. In ABSTRACTS OF PAPERS OF THE AMERICAN CHEMICAL SOCIETY;
AMER CHEMICAL SOC 1155 16TH ST, NW, WASHINGTON, DC 20036 USA, 2019;
Vol. 258.
(44) Dasgupta, N.; Shin, Y. K.; Fedkin, M. V; van Duin, A. ReaxFF Molecular Dynamics
Simulations of Electrolyte–Water Systems at Supercritical Temperature. J. Chem. Phys.
2020, 152 (20), 204502.
(45) Dasgupta, N.; Shin, Y. K.; Fedkin, M. V; van Duin, A. C. T. ReaxFF Molecular Dynamics
Simulations on the Structure and Dynamics of Electrolyte Water Systems at Ambient
Temperature. Comput. Mater. Sci. 2020, 172, 109349.
(46) Baerends, E. J.; Ziegler, T.; Atkins, A. J.; Autschbach, J.; Bashford, D.; Baseggio, O.;
Bérces, A.; Bickelhaupt, F. M.; Bo, C.; Boerritger, P. M.; et al. ADF2019.3, SCM,
Theoretical Chemistry, Vrije Universiteit, Amsterdam, The Netherlands,
Https://Www.Scm.Com.
(47) Allen, M. P.; Tildesley, D. J. Computer Simulation of Liquids; Oxford university press,
2017.
(48) Plimpton, S. Fast Parallel Algorithms for Short-Range Molecular Dynamics; Sandia
National Labs., Albuquerque, NM (United States), 1993.
(49) Plimpton, S.; Crozier, P.; Thompson, A. LAMMPS-Large-Scale Atomic/Molecular
Massively Parallel Simulator. Sandia Natl. Lab. 2007, 18, 43.
(50) Bornhauser, P.; Bougeard, D. Intensities of the Vibrational Spectra of Siliceous Zeolites
by Molecular Dynamics Calculations. I. Infrared Spectra. J. Phys. Chem. B 2001, 105 (1),
36–41.
(51) Tireli, A. A.; Guimarães, I. do R.; Terra, J. C. de S.; da Silva, R. R.; Guerreiro, M. C.
Fenton-like Processes and Adsorption Using Iron Oxide-Pillared Clay with Magnetic
Properties for Organic Compound Mitigation. Environ. Sci. Pollut. Res. 2014, 22 (2),
870–881. https://doi.org/10.1007/s11356-014-2973-x.
(52) Schuttlefield, J. D.; Cox, D.; Grassian, V. H. An Investigation of Water Uptake on Clays
Minerals Using ATR-FTIR Spectroscopy Coupled with Quartz Crystal Microbalance
Measurements. J. Geophys. Res. Atmos. 2007, 112 (21), 1–14.
https://doi.org/10.1029/2007JD008973.
(53) Malhotra, V. M.; Ogloza, A. A. FTIR Spectra of Hydroxyls and Dehydroxylation Kinetics
Mechanism in Montmorillonite. Phys. Chem. Miner. 1989, 16 (4), 386–393.
https://doi.org/10.1007/BF00199560.
(54) Jin, F. Q.; Yang, R.; Zhang, J. C.; Li, M.; Hao, X. M.; Zhang, H. The State of NaOH in
NaOH/Poly(Sodium Acrylate) Composite. J. Dispers. Sci. Technol. 2009, 30 (8), 1148–
1151. https://doi.org/10.1080/01932690802701614.
(55) Using, M.; Transform, F.; Spectroscopy, I.; Joshi, S.; Kalyanasundaram, S.;
Balasubramanian, V. Quantitative Analysis of Sodium Carbonate and Sodium Bicarbonate
in Solid Quantitative Analysis of Sodium Carbonate and Sodium Bicarbonate in Solid
Mixtures Using Fourier Transform Infrared Spectroscopy ( FT-IR ). 2013, No. January
2018, 1–6. https://doi.org/10.1366/12-06915.
(56) Newman, R. Polarized Infrared Spectrum of Sodium Nitrite. J. Chem. Phys. 1952, 20 (3),
444–446. https://doi.org/10.1063/1.1700439.
(57) Maas, J. P. M. The Far Infrared Absorption Spectrum and the Assignment of the Lattice
Modes of Sodium Formate. Spectrochim. Acta Part A Mol. Spectrosc. 1977, 33 (8), 761–
765. https://doi.org/10.1016/0584-8539(77)80114-1.
(58) Spinner, E.; Rowe, J. E. The Effects of Isotopic Dilution on the Infrared Spectrum of Solid
Sodium Formate. Aust. J. Chem. 1979, 32 (3), 481–501.
https://doi.org/10.1071/CH9790481.
(59) Mate, B.; Herrero, V. J.; Escribano, R. Formate Ion : Structure and Spectroscopic
Properties. 2011, 70–75.
(60) Ruiz-Agudo, E.; Putnis, C. V; Putnis, A. Coupled Dissolution and Precipitation at
Mineral–Fluid Interfaces. Chem. Geol. 2014, 383, 132–146.
(61) Yang, W.; Zaoui, A. Capture and Sequestration of CO2 in the Interlayer Space of
Hydrated Calcium Montmorillonite Clay under Various Geological Burial Depth. Phys. A
Stat. Mech. its Appl. 2016, 449 (xxxx), 416–425.
https://doi.org/10.1016/j.physa.2015.12.032.
(62) Natl. Bur. Stand. (U.S.) Managr. 1966, 25 (4), 69.
(63) Technisch Physische Dienst. ICDD Grant-in-Aid: Delft, Netherlands 1967.
(64) Kang, L.; Li, S.; Wang, B.; Li, X. The Effect of High Pressure on the Structure and
Stability of Sodium Formate: Probed by in Situ Synchrotron X-Ray Diffraction
Technique. Solid State Commun. 2019, 289 (October 2018), 67–70.
https://doi.org/10.1016/j.ssc.2018.12.009.
(65) Liu, X.; Lu, X.; Meijer, E. J.; Wang, R.; Zhou, H. Atomic-Scale Structures of Interfaces
between Phyllosilicate Edges and Water. Geochim. Cosmochim. Acta 2012, 81, 56–68.
(66) Bickmore, B. R.; Rosso, K. M.; Nagy, K. L.; Cygan, R. T.; Tadanier, C. J. Ab Initio
Determination of Edge Surface Structures for Dioctahedral 2: 1 Phyllosilicates:
Implications for Acid-Base Reactivity. Clays Clay Miner. 2003, 51 (4), 359–371.
(67) Muraleedharan, M. G.; Sundaram, D. S.; Henry, A.; Yang, V. Thermal Conductivity
Calculation of Nano-Suspensions Using Green-Kubo Relations with Reduced Artificial
Correlations. J. Phys. Condens. Matter 2017, 29 (15). https://doi.org/10.1088/1361-
648X/aa5f08.
(68) Van Olphen, H. Thermodynamics of Interlayer Adsorption of Water in Clays. I.—Sodium
Vermiculite. J. Colloid Sci. 1965, 20 (8), 822–837.
(69) Mahadevan, T. S.; Du, J. Evaluating Water Reactivity at Silica Surfaces Using Reactive
Potentials. J. Phys. Chem. C 2018, 122 (18), 9875–9885.
(70) Fogarty, J. C.; Aktulga, H. M.; Grama, A. Y.; Van Duin, A. C. T.; Pandit, S. A. A
Reactive Molecular Dynamics Simulation of the Silica-Water Interface. J. Chem. Phys.
2010, 132 (17), 174704.
(71) De Yoreo, J.; Mandrus, D.; Soderholm, L. Basic Research Needs for Synthesis Science;
2016.
(72) Putnis, A. Why Mineral Interfaces Matter. Science (80-. ). 2014, 343 (6178), 1441–1442.
List of Figures
Figure 1. Snapshot of the simulated initial configuration of the molecular simulation showing Na-montmorillonite, water and formic acid molecules at 473 K and 1 bar. Figure 2. Comparison of (a) experimental and (b) computed IR spectra for unreacted Na-montmorillonite (Na-MM), Na-MM reacted in water, water and formic acid ratio of 1:1, and in formic acid with a purity of 98-100% at 200 °C and 1 atm for a reaction time of 2 hours. Figure 3. Mechanisms involved in the formation of sodium bicarbonate (NaHCO3) near the interlayer of Na-montmorillonite where (a) represents the interactions between Na+ ion and the oxygen of H2CO3, followed by the formation of intermediate species, Na--H2CO3 as shown in (b). This intermediate species dissociates to produce NaHCO3 and proton, as shown in (c). Figure 4. Changes in the interlayer basal spacing of Na-montmorillonite after reacting with water, HCOOH, and, 1:1 mixture of HCOOH and water at 200 °C and 1 atm for 2 hours using Ultra-Small Angle Scattering/Small Angle X-Ray Scattering (USAXS/SAXS) measurements. Figure 5. Evidence of the formation of Na2CO3, NaOH, and HCOONa due to reaction of Na-montmorillonite with water, 1:1 mixture of water and formic acid, and formic acid (98-100%)) at 200 °C and 1 atm for a reaction time of 2 hours using Wide Angle X-Ray Scattering (WAXS) measurements. Figure 6. The concentration of water (H2O) and formic acid (HCOOH) molecules with a ratio of 1:1 at the edge, interlayer, and facet of sodium montmorillonite are represented. The physisorbed state of the molecules is shown at t = 0. The concentrations of these molecules at reaction times of 0.2, 0.4, and 0.6 ns are shown. Figure 7. The concentration of hydroxyl ions as a function of time at the edge, interlayer and facet of Na-montmorillonite for various fluidic environments such as a 1:1 mixture of water and formic acid, formic acid, and water. Figure 8. Mechanisms involved in the reaction of sodium ions with hydroxyl ions to produce sodium hydroxide molecules where (a) represents the surface oxygen atom of a strained Si-O-Si bond at the elevated temperature, (b) represents the protonation of the surface site and Na+/proton exchange in water, and (c) represents reactive/non-reactive diffusion of NaOH to bulk fluid. Figure 9. NaOH concentrations as a function of reaction time at the edge, interlayer, and facets of Na-montmorillonite in various fluidic environments such as a 1:1 mixture of water and formic acid, formic acid, and water. Figure 10. CO concentrations as a function of reaction time at the edge, interlayer, and facet of Na-montmorillonite in 1:1 mixture of water and formic acid and formic acid are shown.
Figure 11. Mechanisms involved in CO formation due to surface water catalysis where (a) represents the interactions between the water adsorbed on the surface and the formic acid molecule, (b) represents proton abstraction from C-H bond of formic acid to water and from water to oxygen resulting from hydrogen bonding (c) represents the formation of intermediate species: CO-H2O, and (d) shows the formation of CO and H2O molecules. Figure 12. CO2 concentrations as a function of reaction time at the (a) edge, (a) interlayer, and (c) facet of Na-montmorillonite in 1:1 mixture of water and formic acid and formic acid are shown. Figure 13. Mechanisms of CO2 formation resulting from the oxidation of CO catalyzed at Na-montmorillonite surfaces where (a) shows the adsorption of CO on the surface site, (b) represents the formation of intermediate species CO*, (c) represents the formation of intermediate species, H--CO2, and (d) represents the formation of CO2 and a proton. Figure 14. CO32- concentrations as a function of reaction time at the edge, interlayer, and facet of Na-montmorillonite in 1:1 mixture of water and formic acid and formic acid are shown. (Zero error bar indicates that all three simulation runs yielded same concentrations). Figure 15. Mechanisms involved in the formation of CO32- species from HCOO- adsorbed at the interlayer of Na-montmorillonite by binding to the Al or Si site where (a) represents the simultanous attack of one dangling O of montmorillonite on C of HCOO- and weakening of C=O double bond followed by the formation of -C-O-Al/Si bridge as shown in (b), and the formation of CO32- which remains in adsorbed state and is neutralized by protons or Na+ ions as represented by (c). Figure 16. Carbonic acid (H2CO3) concentration as a function of reaction time at the (a) edge, (a) interlayer, and (c) facet of Na-montmorillonite in 1:1 mixture of water and formic acid.

Figure 1. Snapshot of the simulated initial configuration of the molecular simulation showing Na-montmorillonite, water and formic acid molecules at 473 K and 1 bar.
Z
X Y
Na Si Al C O H
Facet Edge Interlayer
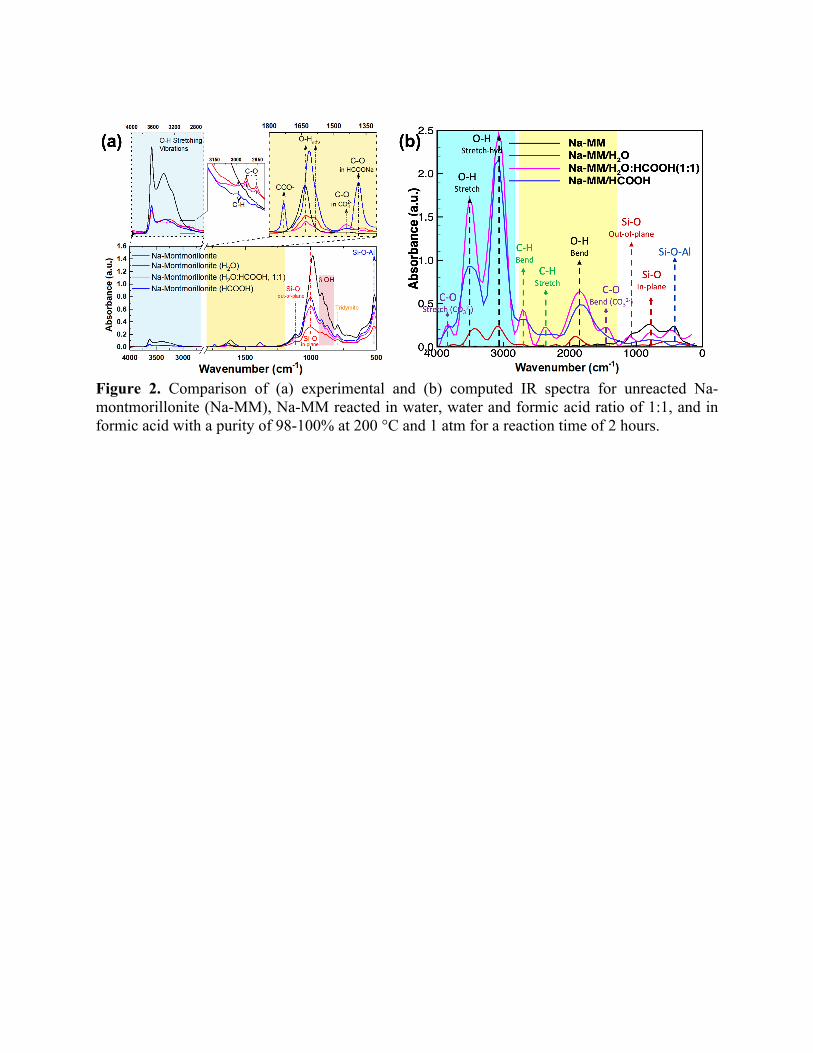
Figure 2. Comparison of (a) experimental and (b) computed IR spectra for unreacted Na-montmorillonite (Na-MM), Na-MM reacted in water, water and formic acid ratio of 1:1, and in formic acid with a purity of 98-100% at 200 °C and 1 atm for a reaction time of 2 hours.
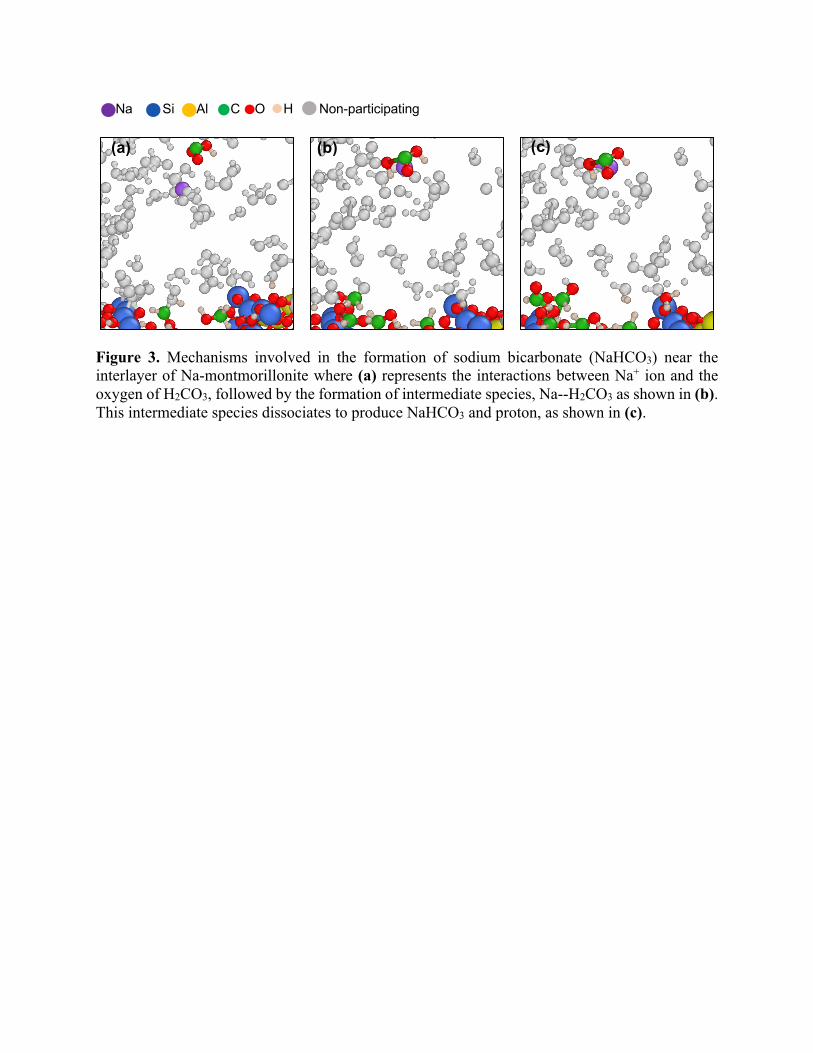
Figure 3. Mechanisms involved in the formation of sodium bicarbonate (NaHCO3) near the interlayer of Na-montmorillonite where (a) represents the interactions between Na+ ion and the oxygen of H2CO3, followed by the formation of intermediate species, Na--H2CO3 as shown in (b). This intermediate species dissociates to produce NaHCO3 and proton, as shown in (c).
(a) (c) (b)
Na Si Al C O H Non-participating
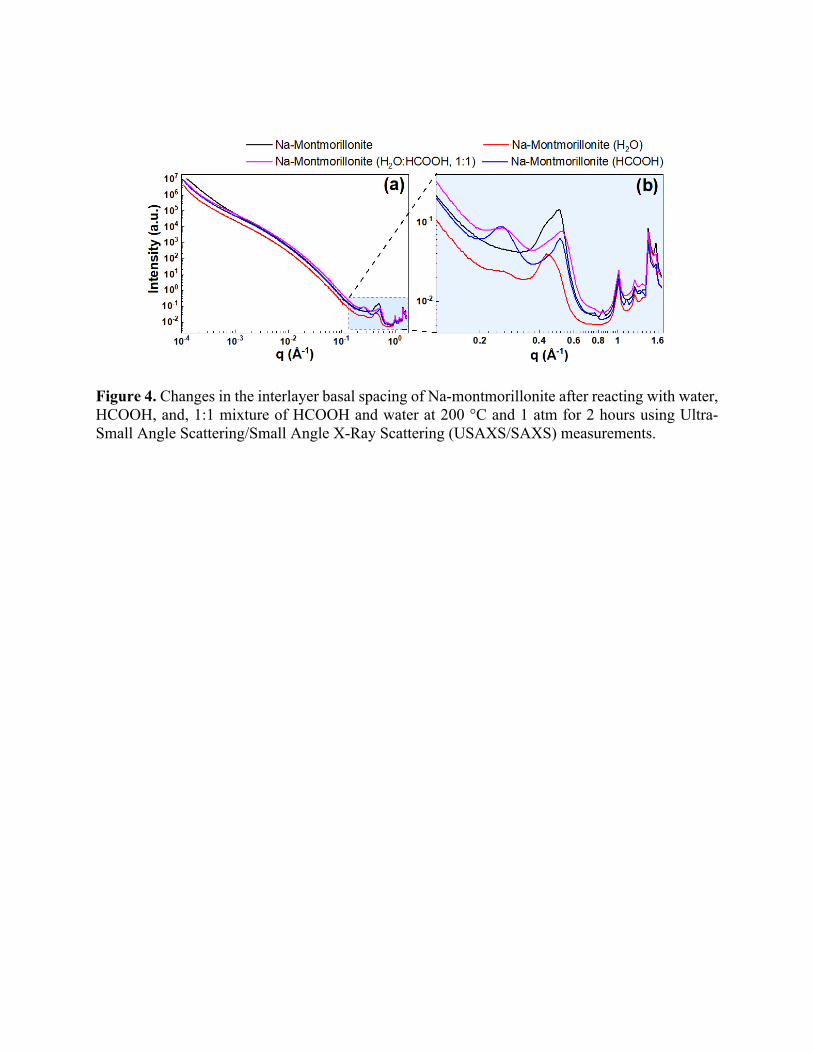
Figure 4. Changes in the interlayer basal spacing of Na-montmorillonite after reacting with water, HCOOH, and, 1:1 mixture of HCOOH and water at 200 °C and 1 atm for 2 hours using Ultra-Small Angle Scattering/Small Angle X-Ray Scattering (USAXS/SAXS) measurements.
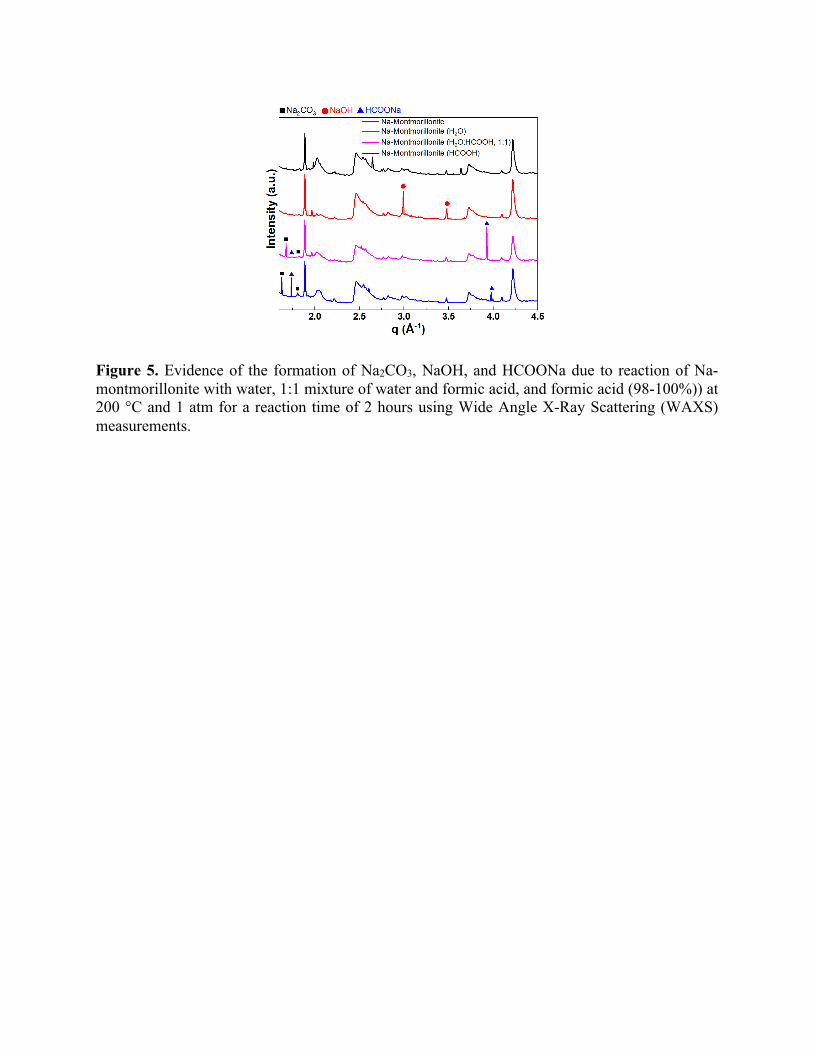
Figure 5. Evidence of the formation of Na2CO3, NaOH, and HCOONa due to reaction of Na-montmorillonite with water, 1:1 mixture of water and formic acid, and formic acid (98-100%)) at 200 °C and 1 atm for a reaction time of 2 hours using Wide Angle X-Ray Scattering (WAXS) measurements.

Figure 6. The concentration of water (H2O) and formic acid (HCOOH) molecules with a ratio of 1:1 at the edge, interlayer, and facet of sodium montmorillonite are represented. The physisorbed state of the molecules is shown at t = 0. The concentrations of these molecules at reaction times of 0.2, 0.4, and 0.6 ns are shown.
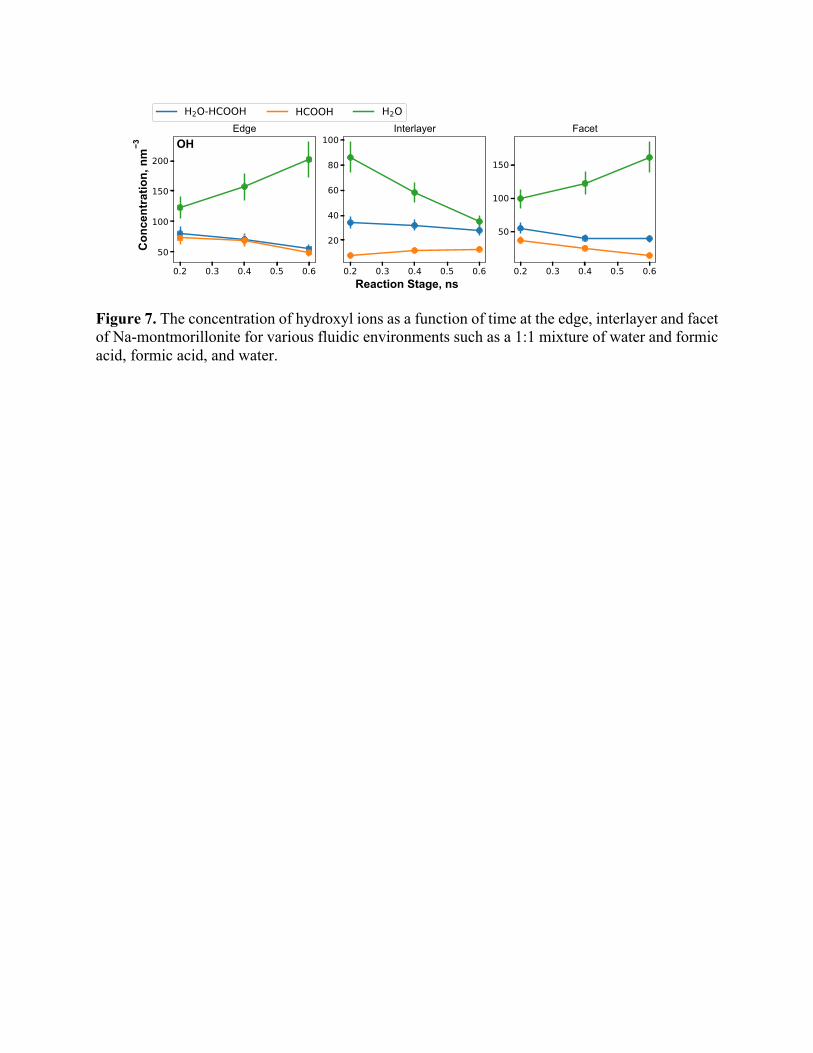
Figure 7. The concentration of hydroxyl ions as a function of time at the edge, interlayer and facet of Na-montmorillonite for various fluidic environments such as a 1:1 mixture of water and formic acid, formic acid, and water.
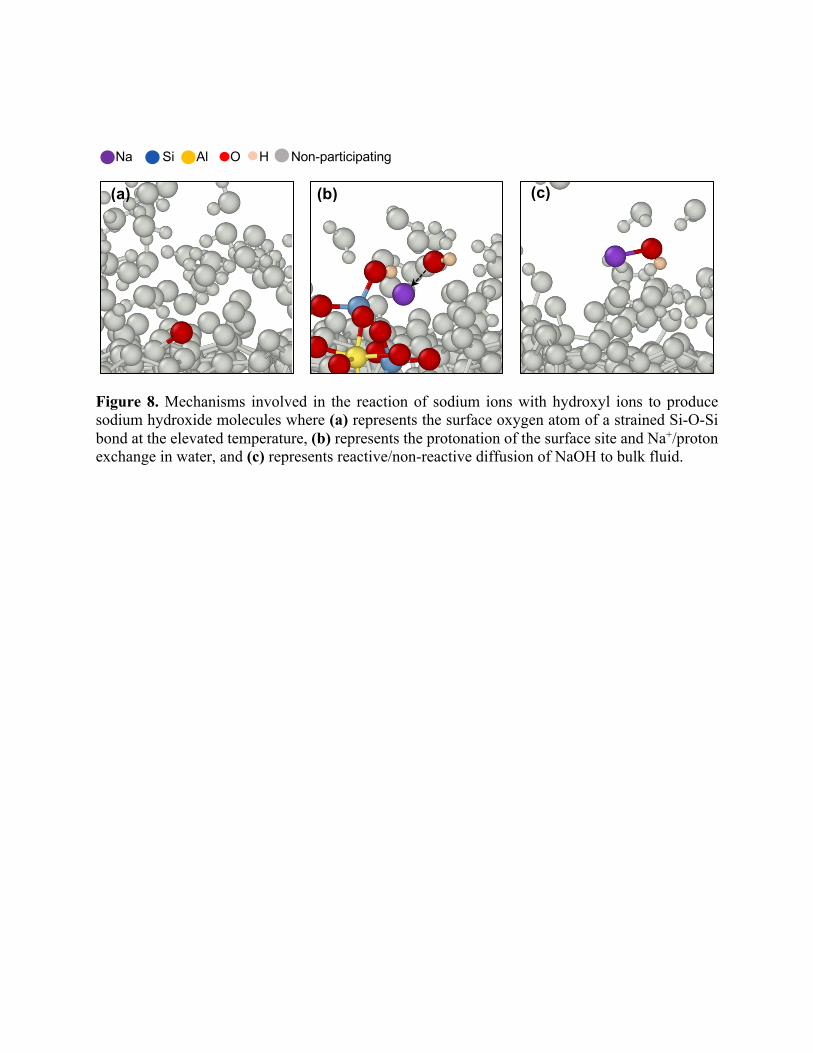
Figure 8. Mechanisms involved in the reaction of sodium ions with hydroxyl ions to produce sodium hydroxide molecules where (a) represents the surface oxygen atom of a strained Si-O-Si bond at the elevated temperature, (b) represents the protonation of the surface site and Na+/proton exchange in water, and (c) represents reactive/non-reactive diffusion of NaOH to bulk fluid.
(a) (c) (b)
Na Si Al O H Non-participating
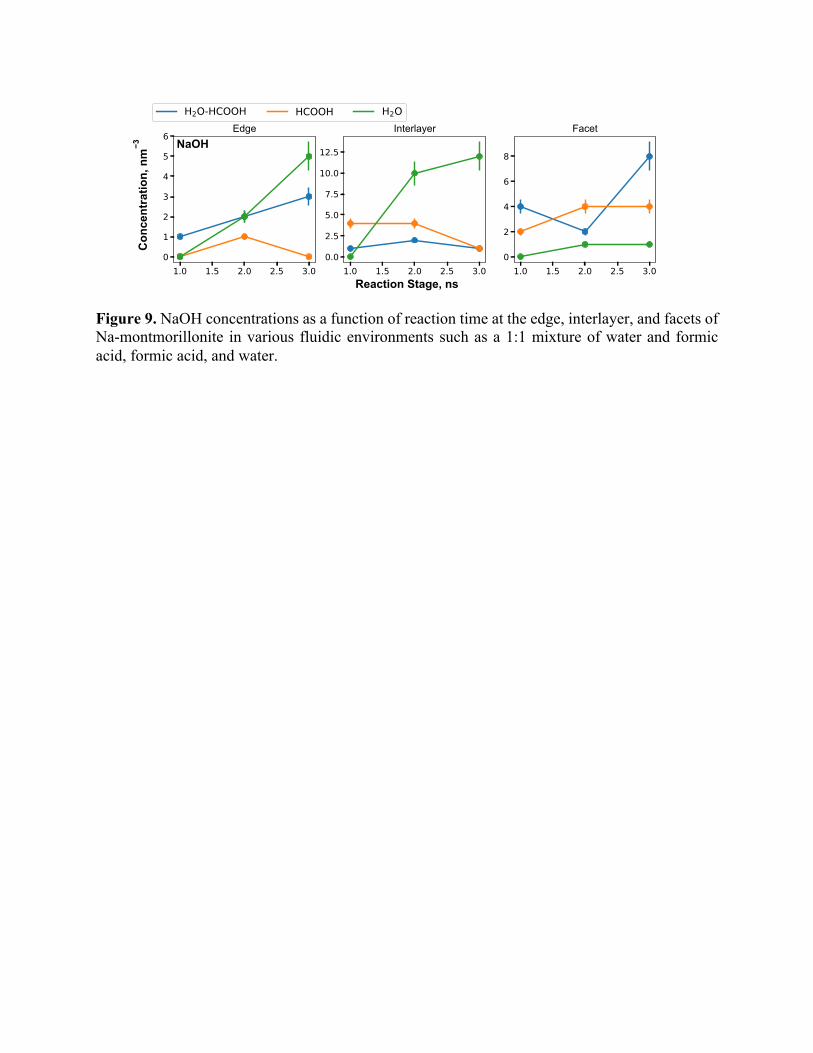
Figure 9. NaOH concentrations as a function of reaction time at the edge, interlayer, and facets of Na-montmorillonite in various fluidic environments such as a 1:1 mixture of water and formic acid, formic acid, and water.
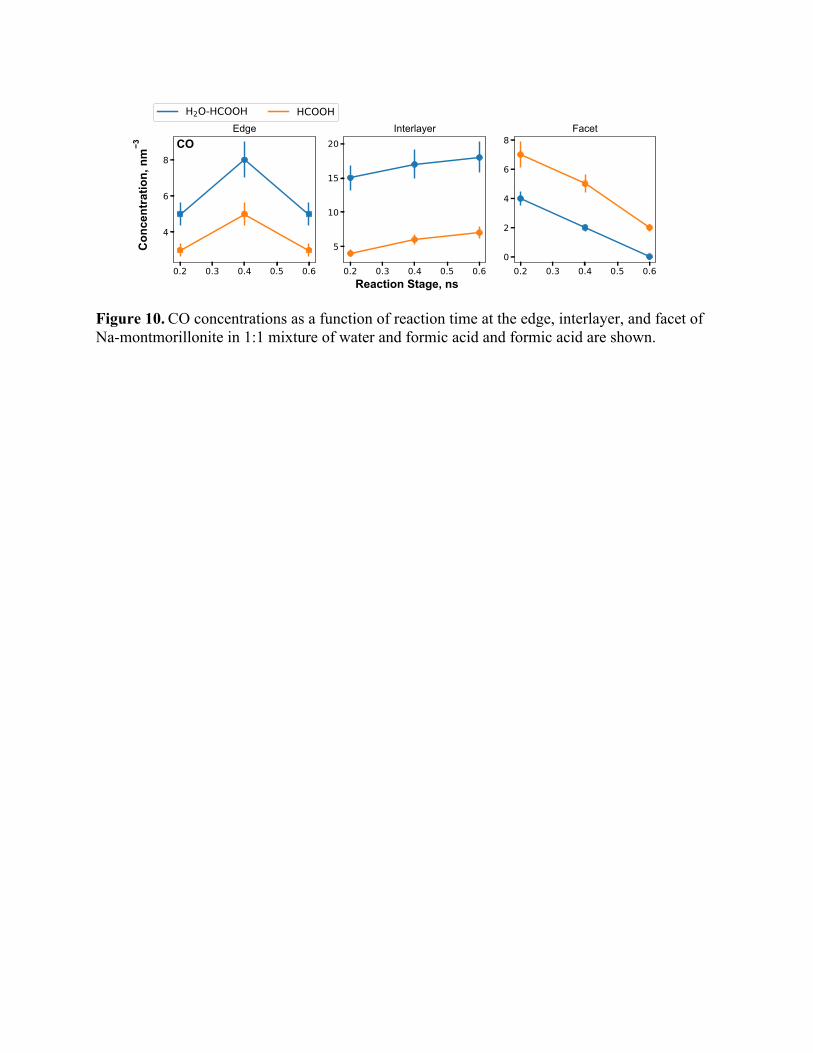
Figure 10. CO concentrations as a function of reaction time at the edge, interlayer, and facet of Na-montmorillonite in 1:1 mixture of water and formic acid and formic acid are shown.
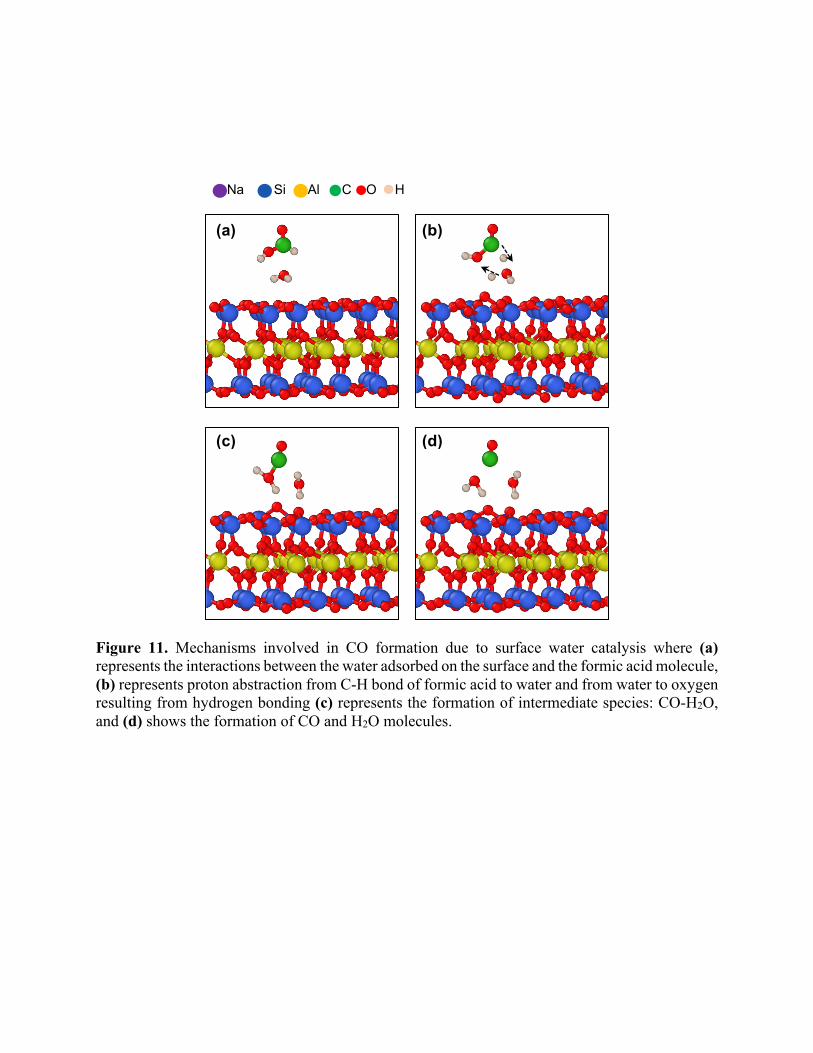
Figure 11. Mechanisms involved in CO formation due to surface water catalysis where (a) represents the interactions between the water adsorbed on the surface and the formic acid molecule, (b) represents proton abstraction from C-H bond of formic acid to water and from water to oxygen resulting from hydrogen bonding (c) represents the formation of intermediate species: CO-H2O, and (d) shows the formation of CO and H2O molecules.
(a)
(c)
(b)
(d)
Na Si Al C O H
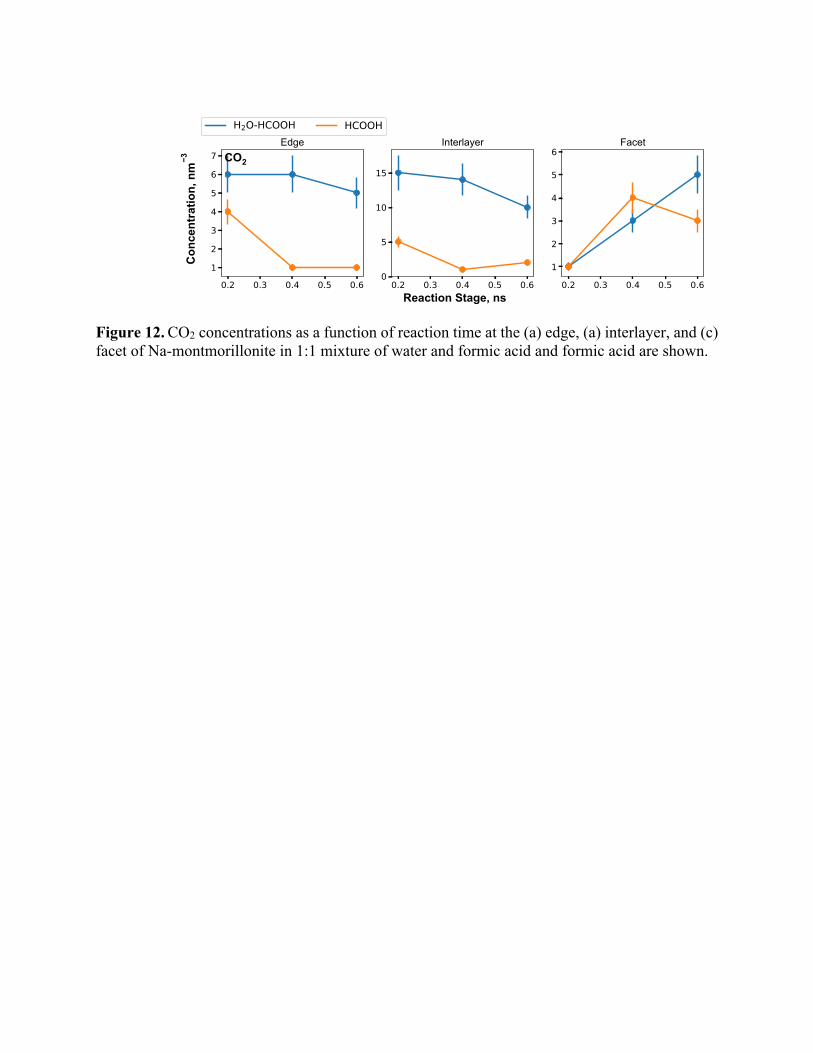
Figure 12. CO2 concentrations as a function of reaction time at the (a) edge, (a) interlayer, and (c) facet of Na-montmorillonite in 1:1 mixture of water and formic acid and formic acid are shown.
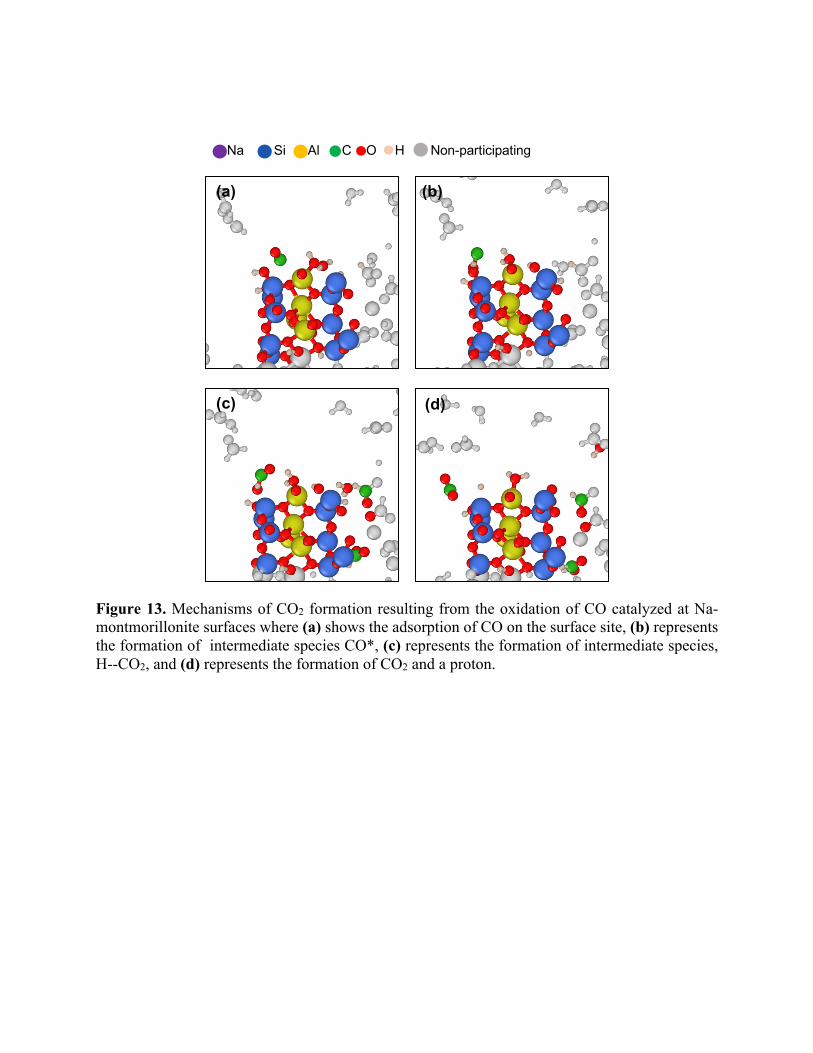
Figure 13. Mechanisms of CO2 formation resulting from the oxidation of CO catalyzed at Na-montmorillonite surfaces where (a) shows the adsorption of CO on the surface site, (b) represents the formation of intermediate species CO*, (c) represents the formation of intermediate species, H--CO2, and (d) represents the formation of CO2 and a proton.
(a)
(c)
(b)
(d)
Na Si Al C O H Non-participating
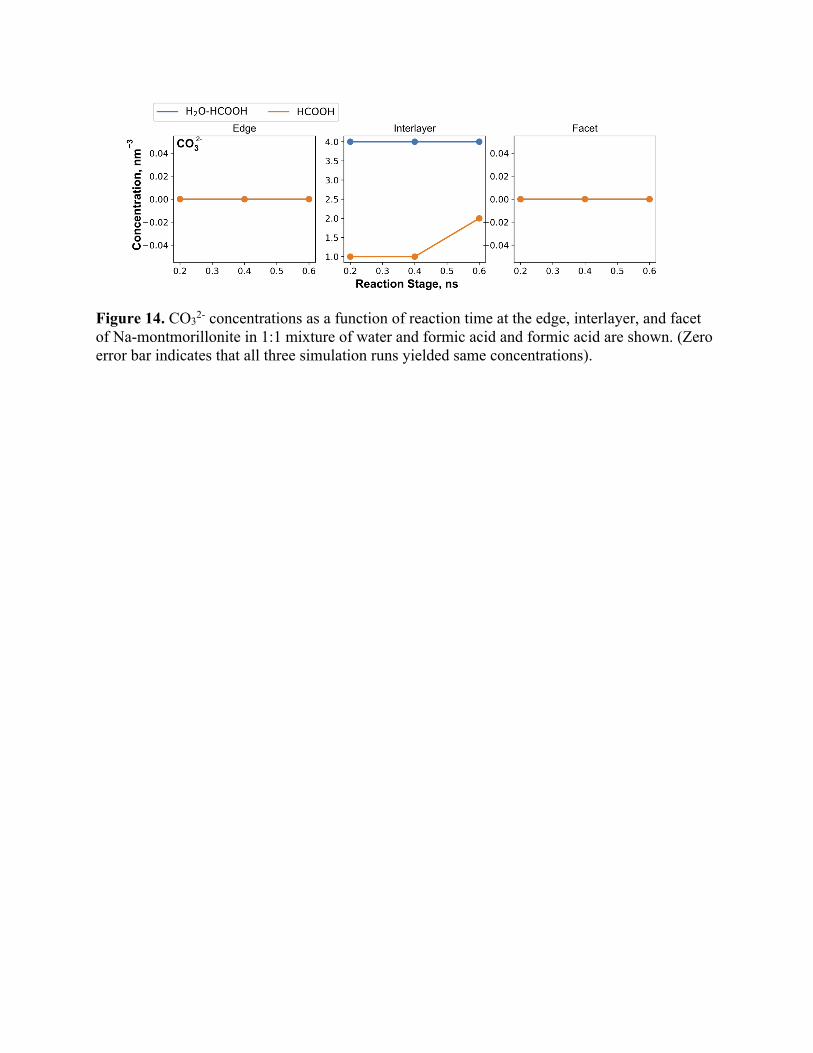
Figure 14. CO32- concentrations as a function of reaction time at the edge, interlayer, and facet of Na-montmorillonite in 1:1 mixture of water and formic acid and formic acid are shown. (Zero error bar indicates that all three simulation runs yielded same concentrations).
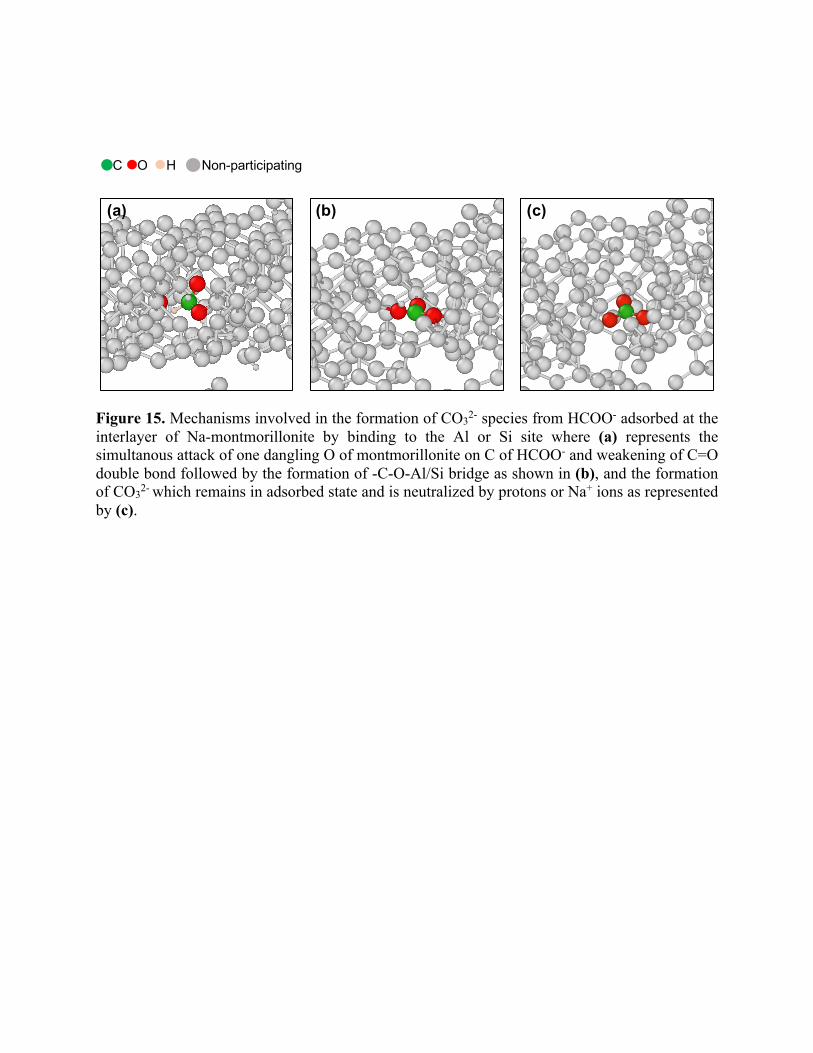
Figure 15. Mechanisms involved in the formation of CO32- species from HCOO- adsorbed at the interlayer of Na-montmorillonite by binding to the Al or Si site where (a) represents the simultanous attack of one dangling O of montmorillonite on C of HCOO- and weakening of C=O double bond followed by the formation of -C-O-Al/Si bridge as shown in (b), and the formation of CO32- which remains in adsorbed state and is neutralized by protons or Na+ ions as represented by (c).
(a) (c) (b)
C O H Non-participating
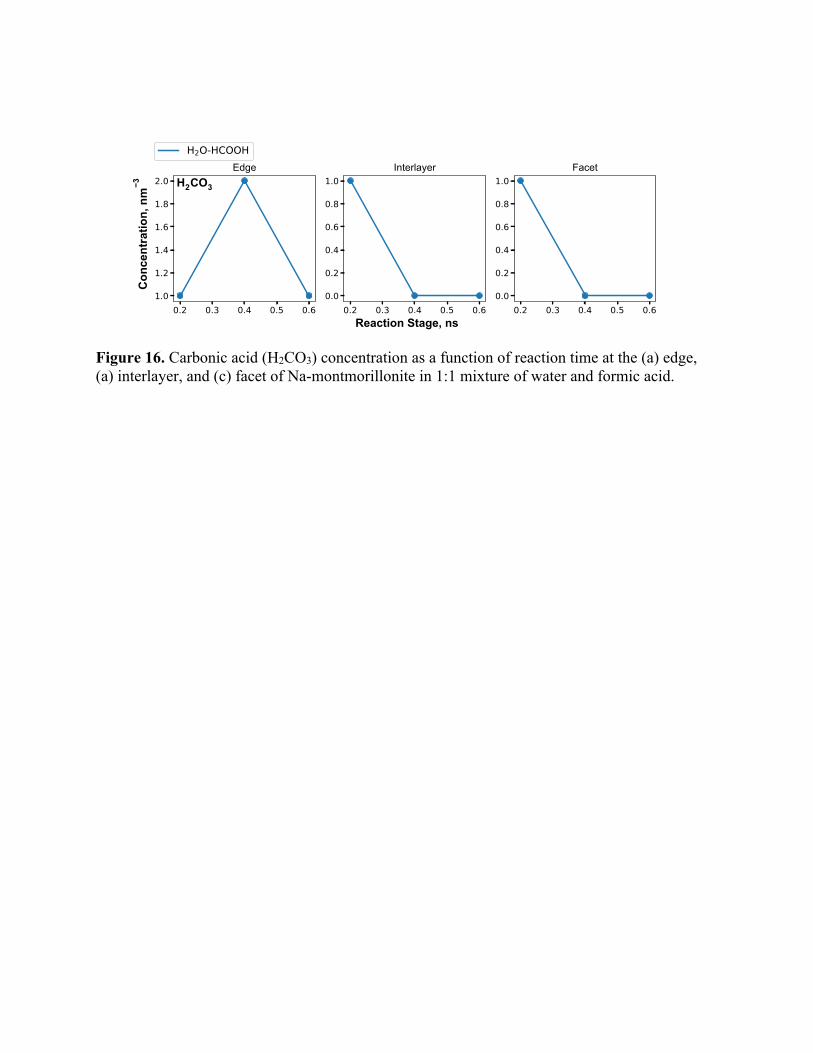
Figure 16. Carbonic acid (H2CO3) concentration as a function of reaction time at the (a) edge, (a) interlayer, and (c) facet of Na-montmorillonite in 1:1 mixture of water and formic acid.
Related Documents


