Monthly Weather Review Northern Territory September 2012

Welcome message from author
This document is posted to help you gain knowledge. Please leave a comment to let me know what you think about it! Share it to your friends and learn new things together.
Transcript
Monthly Weather Review
Northern Territory
September 2012
The Monthly Weather Review - Northern Territory is produced twelve times each year by the Australian Bureau of Meteorology'sNorthern Territory Climate Services Centre.
It is intended to provide a concise but informative overview of the temperatures, rainfall and significant weather events in NorthernTerritory for the month.
To keep the Monthly Weather Review as timely as possible, much of the information is based on electronic reports. Although everyeffort is made to ensure the accuracy of these reports, the results can be considered only preliminary until complete quality controlprocedures have been carried out. Major discrepancies will be noted in later issues.
We are keen to ensure that the Monthly Weather Review is appropriate to the needs of its readers. If you have any comments orsuggestions, please do not hesitate to contact us:
By mail
Northern Territory Climate Services CentreBureau of MeteorologyPO Box 40050Casuarina NT 0811AUSTRALIA
By telephone
(08) 8920 3813
By email
You may also wish to visit the Bureau's home page, http://www.bom.gov.au.
Units of measurementExcept where noted, temperature is given in degrees Celsius (°C), rainfall in millimetres (mm), and wind speed in kilometres per hour(km/h).
Observation times and periodsEach station in Northern Territory makes its main observation for the day at 9 am local time. At this time, the precipitation over thepast 24 hours is determined, and maximum and minimum thermometers are also read and reset. In this publication, the followingconventions are used for assigning dates to the observations made:
Maximum temperatures are for the 24 hours from 9 am on the date mentioned. They normally occur in the afternoon of that day.
Minimum temperatures are for the 24 hours to 9 am on the date mentioned. They normally occur in the early morning of that day.
Mean temperatures are the average of the daily maximum and daily minimum temperatures.
Daily rainfall is for the 24 hours to 9 am on the date mentioned. This means a significant fraction of the rain may have occurred onthe previous calendar day.
Monthly rainfall is for the period from 9 am on the last day of the previous month to 9 am on the last day of this month.
Maximum daily wind gusts are in the 24 hours from midnight to midnight.
Climatological valuesThe climatological averages shown in the text and tables are generally long-term means based on observations from all availableyears of record, which vary widely from site to site. They are not shown for sites with less than 10 years of record, as they cannotthen be calculated reliably. Climatological extremes are generally taken from available observations from all available years of record.The number of years can vary substantially from site to site.
Copyright© Commonwealth of Australia 2012This work is copyright. You may download, display, print and reproduce this material in unaltered form only (retaining this notice) foryour personal, non-commercial use or use within your organisation. Apart from any use as permitted under the Copyright Act 1968,all other rights are reserved. Requests and inquiries concerning reproduction and rights should be addressed to CommonwealthCopyright Administration, Attorney General’s Department, Robert Garran Offices, National Circuit, Barton ACT 2600 or posted athttp://www.ag.gov.au/cca.
Product code IDCKGC22R1. Prepared on 24 October 2012. ISSN 1836-392X
Cover photographDarwin Met Building.Photograph by Brittany Tanner Lisonbee. Used with permission.If you have a photo you think would make a good cover for the Monthly Weather Review, please contact us at the address above.
Monthly Weather Review Northern Territory September 2012

Overview
The month of September is the last month of the dryseason and usually begins a transition to highertemperatures and humidity across the NorthernTerritory. Typically in September, the sub-tropicalridge weakens as troughs with associated moisturepunch into the Territory and the climate begins thetransition into the wet season. This month wasstrongly influenced by the sub-tropical ridge as norainfall was recorded until the last two days of themonth. Alice Springs Airport saw the end of itslongest dry spell on record with 157 days with norain recorded since 24 April this year.
Extremes in September 2012
Hottest day(Highest daily maximum temperature)
41.1 °C at Lajamanu on the 23rdWarmest days on average
(Highest mean daily maximum temperature)37.9 °C at Douglas RiverCoolest days on average
(Lowest mean daily maximum temperature)27.9 °C at Arltunga
Coldest day(Lowest daily maximum temperature)
16.5 °C at Arltunga on the 29thColdest night
(Lowest daily minimum temperature)−0.4 °C at Arltunga on the 10th
Coolest nights on average(Lowest mean daily minimum temperature)
9.4 °C at ArltungaWarmest nights on average
(Highest mean daily minimum temperature)24.5 °C at Darwin Harbour
Warmest night(Highest daily minimum temperature)26.3 °C at Timber Creek on the 30th
Warmest on average overall(Highest mean temperature)
28.9 °C at Jabiru AirportCoolest on average overall(Lowest mean temperature)
18.7 °C at ArltungaWettest overall
(Highest total rainfall)75.3 mm at Mainoru Outstation Store
Wettest day(Highest daily rainfall)
75.3 mm at Mainoru Outstation Store on the 30thHighest wind gust
72 km/h at Central Arnhem Plateau on the 29th
Significant weatherSeptember bushfiresOn the 1st and 2nd, several fires between BerrySprings and Darwin River Dam threatened houses, aservice station and mango orchards, fueled by aburst of dry SE winds across the Top End.
Beginning around the same time, another fireburned for seven days in the area around the BlackJungle Conservation Reserve, in Darwin's rural area,burning parts of the nature reserve and flood plainsand threatening 15 homes in the area.
On the 19th, a fire near Girraween in Darwin's ruralarea, fueled by hot, dry, east to southeast windsthreatened approximately 53 homes. Fire fightersused aerial suppression and on-ground resources tobattle the blaze. All homes were saved.
Also on the 19th, another fire near Ban Ban Springs,north of Adelaide River, burned for two days, nostructures were burnt, but 153 sq km of pasturewere lost to the fire.
During the 26th and 27th a number of firesdeveloped around the Marrakai region of the NWDarwin-Daly District burning pasture and threateninga number of rural properties.
Synoptic summaryThe month started with a weak ridge over theNorthern Territory, the ridge gradually eased as ashallow trough developed over the western boarderand moved across on the 5th. On the 6th, anotherhigh pressure system centred over the southernIndian Ocean extends a ridge over the continent witha cool southeast change and showers werecontracted along the northern coast of the Top End.The high moved eastwards and was located over theTasman Sea on the 11th ahead of a developingshallow weak trough over the western boarder. Asoutheast wind flow affected the Territory until 15thas the high moved over to southeast Australia. Aseries of troughs developed on the 16th withincrease humidity in the area until the 22nd, aheadof another high that developed over the southernIndian Ocean. The high pressure system ridged overAustralia until the 24th before another weak andshallow trough developed over the western boarderon the 25th and propagated eastwards with notmuch precipitation.
On the 28th a trough pushed into the Territorybringing rain for the first time in the month. (See therainfall section for more information on this rainfallevent). The trough pushed to the east as a strongridge replaced it. As the high pressure moved to thenortheast it provided a lifting mechanism thatinitiated convection within a heat-trough that wassituated over the Top End.
Monthly Weather Review Northern Territory September 2012
page 1

Daily mean sea level pressure analyses1 September 2012 2 September 2012 3 September 2012
4 September 2012 5 September 2012 6 September 2012
7 September 2012 8 September 2012 9 September 2012
10 September 2012 11 September 2012 12 September 2012
13 September 2012 14 September 2012 15 September 2012
16 September 2012 17 September 2012 18 September 2012
Monthly Weather Review Northern Territory September 2012
page 2
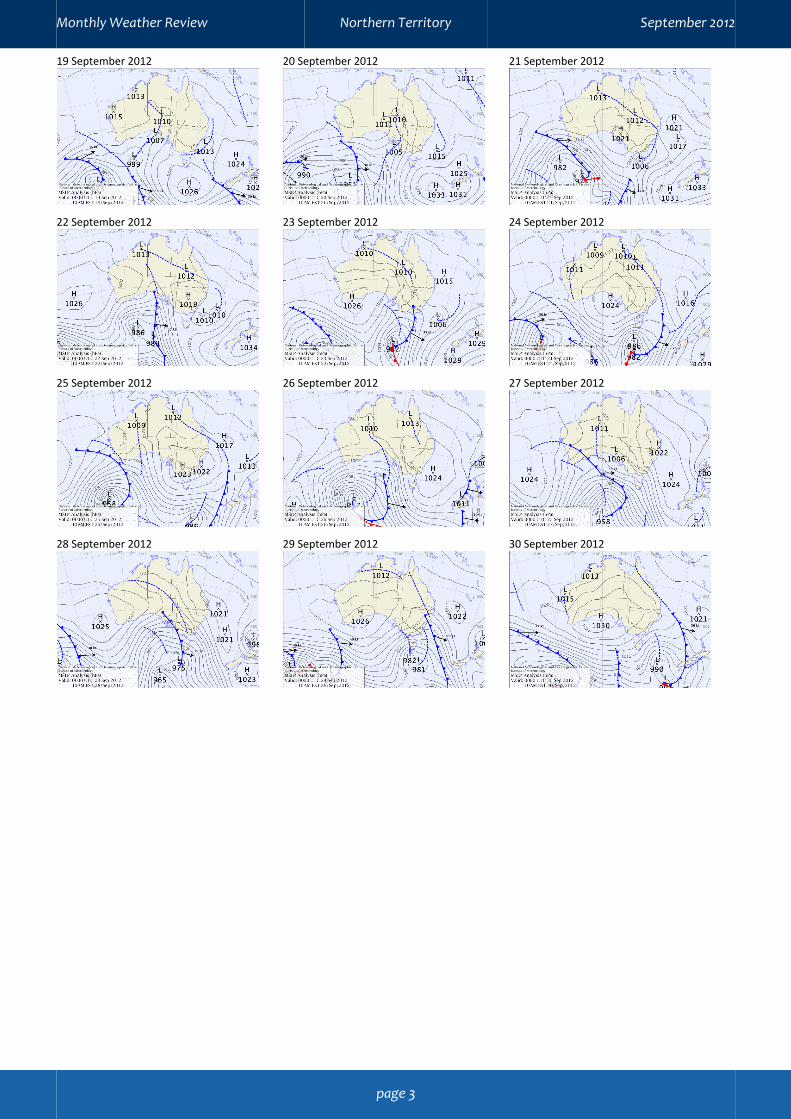
19 September 2012 20 September 2012 21 September 2012
22 September 2012 23 September 2012 24 September 2012
25 September 2012 26 September 2012 27 September 2012
28 September 2012 29 September 2012 30 September 2012
Monthly Weather Review Northern Territory September 2012
page 3

TemperaturesTemperatures gradually increased across theTerritory during the September month due to moresolar exposure and weakening of the sub-tropicalridge. The mean temperature (average of dailymaximum and minimum) for Northern Territory inSeptember 2012 was 24.7 °C, which is 1.1 °C abovethe long-term average.
The warmest on average was Jabiru Airport with28.9 °C, followed by Delamere Weapons Range with28.3 °C, and then both Cape Don and Darwin NTCwith 28.2 °C respectively.
The coolest on average was Arltunga with 18.7 °C,followed by Alice Springs Airport with 19.5 °C, andthen Curtin Springs with 19.8 °C.
New temperature records
Record highest September daily maximum temperature
New record Old recordYears
ofrecord
Alice Springs Airport 38.8 on 22nd = 38.8 on 22nd in 2003 70Daly Waters AWS 40.9 on 27th 40.0 on 26th in 2003 42Tindal RAAF 40.0 on 27th 39.9 on 28th in 1992 24Territory Grape Farm 38.2 on 27th 38.0 on 22nd in 2003 20
Monthly Weather Review Northern Territory September 2012
page 4

Maximum temperaturesMaximum temperatures were mostly above averageacross the Territory. The average maximumtemperature in the NT this month was 33.9 °C, whichis 2.1 °C above the long term average and thewarmest September since 2009. There were severalnew maximum temperature records set this month,including Tindal RAAF which recorded their highestSeptember daily maximum temperature of 40.0 °Con the 27th, only 0.1 °C higher than the previousrecord set in 1992. Alice Springs Airport equaled thehighest September daily maximum temperaturerecord of 38.8 °C set in 2003.
The hottest day was at Lajamanu with 41.1 °C on the23rd, followed by Bulman with 41.0 °C on the 27th,and then Daly Waters with 40.9 °C on the 27th.
The warmest days on average were at Douglas Riverwith 37.9 °C, followed by Timber Creek with 37.5 °C,and then Noonamah with 37.4 °C.
Due primarily to cloud cover on the 29th, the coolestday this month was at Arltunga with 16.5 °C,followed by Alice Springs Airport with 18.4 °C, andthen Jervois with 19.7 °C, all on the 29th.
The coolest days on average were at Arltunga with27.9 °C, followed by McCluer Island with 29.2 °C, andthen Curtin Springs and North East Island with bothrecorded 29.4 °C.
Anomalies of mean daily maximum temperature inSeptember 2012
Decile rank of mean daily maximum temperaturein September 2012
There could be discrepancies between the values shown on these mapsand those at individual locations, as a result of the way the maps aregenerated.
Monthly Weather Review Northern Territory September 2012
page 5
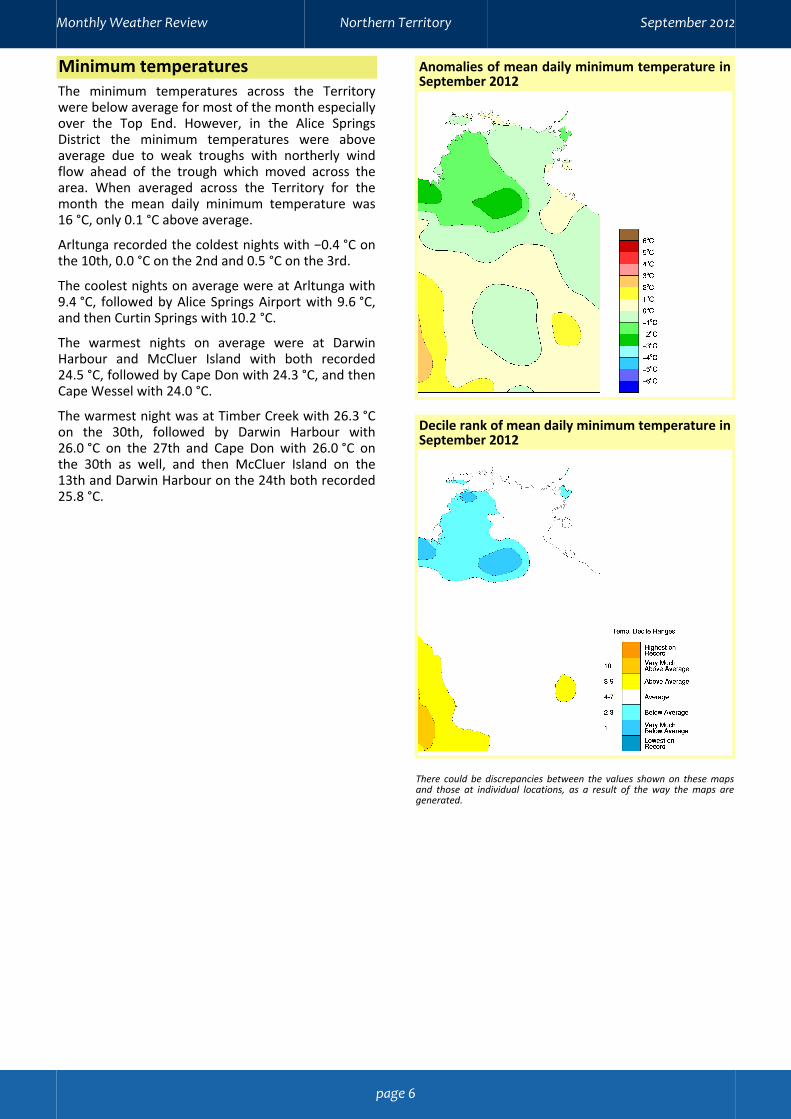
Minimum temperaturesThe minimum temperatures across the Territorywere below average for most of the month especiallyover the Top End. However, in the Alice SpringsDistrict the minimum temperatures were aboveaverage due to weak troughs with northerly windflow ahead of the trough which moved across thearea. When averaged across the Territory for themonth the mean daily minimum temperature was16 °C, only 0.1 °C above average.
Arltunga recorded the coldest nights with −0.4 °C onthe 10th, 0.0 °C on the 2nd and 0.5 °C on the 3rd.
The coolest nights on average were at Arltunga with9.4 °C, followed by Alice Springs Airport with 9.6 °C,and then Curtin Springs with 10.2 °C.
The warmest nights on average were at DarwinHarbour and McCluer Island with both recorded24.5 °C, followed by Cape Don with 24.3 °C, and thenCape Wessel with 24.0 °C.
The warmest night was at Timber Creek with 26.3 °Con the 30th, followed by Darwin Harbour with26.0 °C on the 27th and Cape Don with 26.0 °C onthe 30th as well, and then McCluer Island on the13th and Darwin Harbour on the 24th both recorded25.8 °C.
Anomalies of mean daily minimum temperature inSeptember 2012
Decile rank of mean daily minimum temperature inSeptember 2012
There could be discrepancies between the values shown on these mapsand those at individual locations, as a result of the way the maps aregenerated.
Monthly Weather Review Northern Territory September 2012
page 6

RainfallThere was only one rainfall event in the Territory thismonth. On 29 and 30 September, a mobile troughmoved slowly across the NT creating a northwestcloudband on the 29th which brought light rain tothe Alice Springs District. Although rainfall amountswere small in the Alice Springs District, for manylocations this was the first rainfall in almost fivemonths. The trough pushed to the east as a strongridge replaced it. As the high pressure moved to thenortheast it provided a lifting mechanism thatinitiated convection within a heat-trough that wassituated over the Top End. Early on the 30th, thistrough not only caused broad scale cloudiness andlight rain, but it also induced surface basedconvection in some areas causing significant rainfallwhich exceeded long term monthly mean for manylocations.
On the 29th, As the northwest cloud band movedacross the Alice Springs District 3.2 mm of rain to theAlice Springs Airport, this ended the longest dry spellon record of 157 days with no rain at the airport.
On the 30th, in the western Top End, Channel Islandhad 31.8 mm, Darwin Airport recorded 21.2 mm,Middle Point measured 39.2 mm and Oenpelli had20.0 mm. While none of these were records, theywere all well above the September monthly mean.Two stations did measure their highest Septemberdaily rainfall on record on the 30th; these areNutwood Downs and Nightcliff Sports Club. NutwoodDowns also measured their highest total Septemberrainfall on record.
The wettest overall was Mainoru Outstation Storewith 75.3 mm, followed by Wongalara with 64.8 mm,and then Walker Creek with 56.0 mm.
The wettest single day was at Mainoru OutstationStore with 75.3 mm on the 30th, followed byWongalara with 64.8 mm on the 30th, and thenWalker Creek with 56.0 mm on the 30th.
Total rainfall in September 2012
Decile rank of total rainfall in September 2012
There could be discrepancies between the values shown on these mapsand those at individual locations, as a result of the way the maps aregenerated.
New rainfall records
Record highest September daily rainfall
New record Old recordYears
ofrecord
Nutwood Downs 47.8 on 30th 40.8 on 24th in 1998 74Nightcliff Sports Club 43.0 on 30th 41.0 on 29th in 1981 30
Record highest September total rainfall
New record Old recordYears
ofrecord
Nutwood Downs 47.8 40.8 in 1998 74
Monthly Weather Review Northern Territory September 2012
page 7
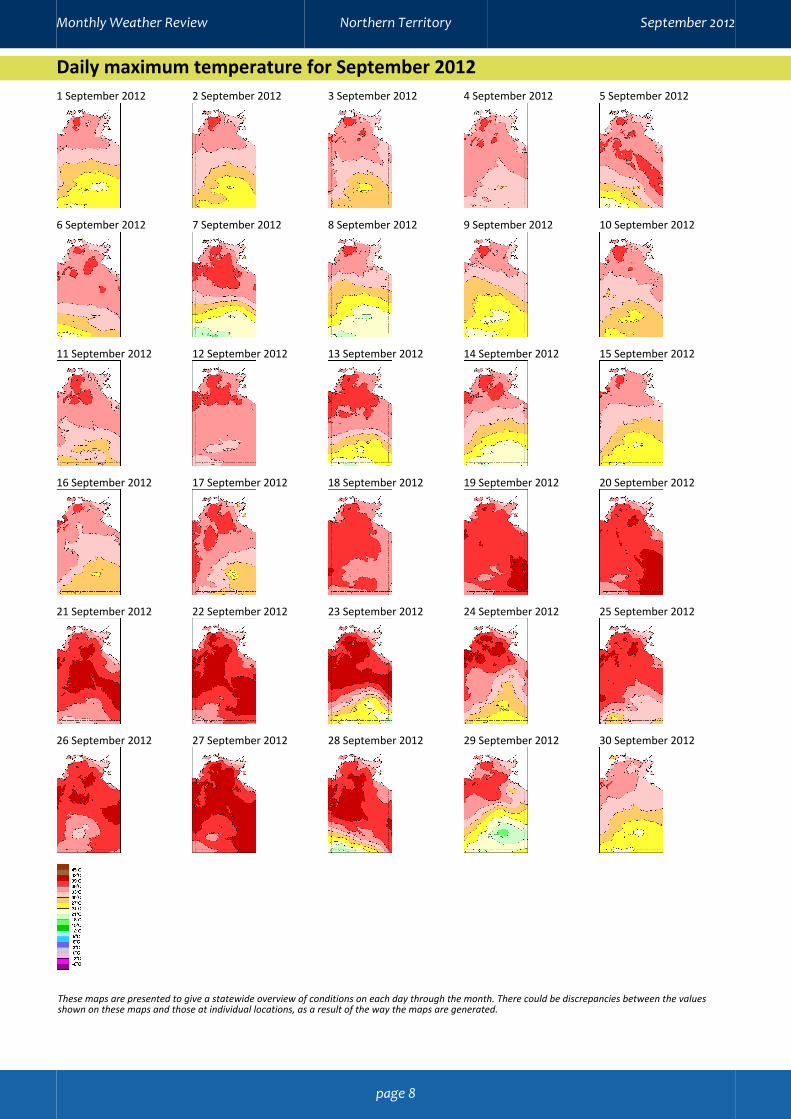
Daily maximum temperature for September 20121 September 2012 2 September 2012 3 September 2012 4 September 2012 5 September 2012
6 September 2012 7 September 2012 8 September 2012 9 September 2012 10 September 2012
11 September 2012 12 September 2012 13 September 2012 14 September 2012 15 September 2012
16 September 2012 17 September 2012 18 September 2012 19 September 2012 20 September 2012
21 September 2012 22 September 2012 23 September 2012 24 September 2012 25 September 2012
26 September 2012 27 September 2012 28 September 2012 29 September 2012 30 September 2012
These maps are presented to give a statewide overview of conditions on each day through the month. There could be discrepancies between the valuesshown on these maps and those at individual locations, as a result of the way the maps are generated.
Monthly Weather Review Northern Territory September 2012
page 8

Daily minimum temperature for September 20121 September 2012 2 September 2012 3 September 2012 4 September 2012 5 September 2012
6 September 2012 7 September 2012 8 September 2012 9 September 2012 10 September 2012
11 September 2012 12 September 2012 13 September 2012 14 September 2012 15 September 2012
16 September 2012 17 September 2012 18 September 2012 19 September 2012 20 September 2012
21 September 2012 22 September 2012 23 September 2012 24 September 2012 25 September 2012
26 September 2012 27 September 2012 28 September 2012 29 September 2012 30 September 2012
These maps are presented to give a statewide overview of conditions on each day through the month. There could be discrepancies between the valuesshown on these maps and those at individual locations, as a result of the way the maps are generated.
Monthly Weather Review Northern Territory September 2012
page 9
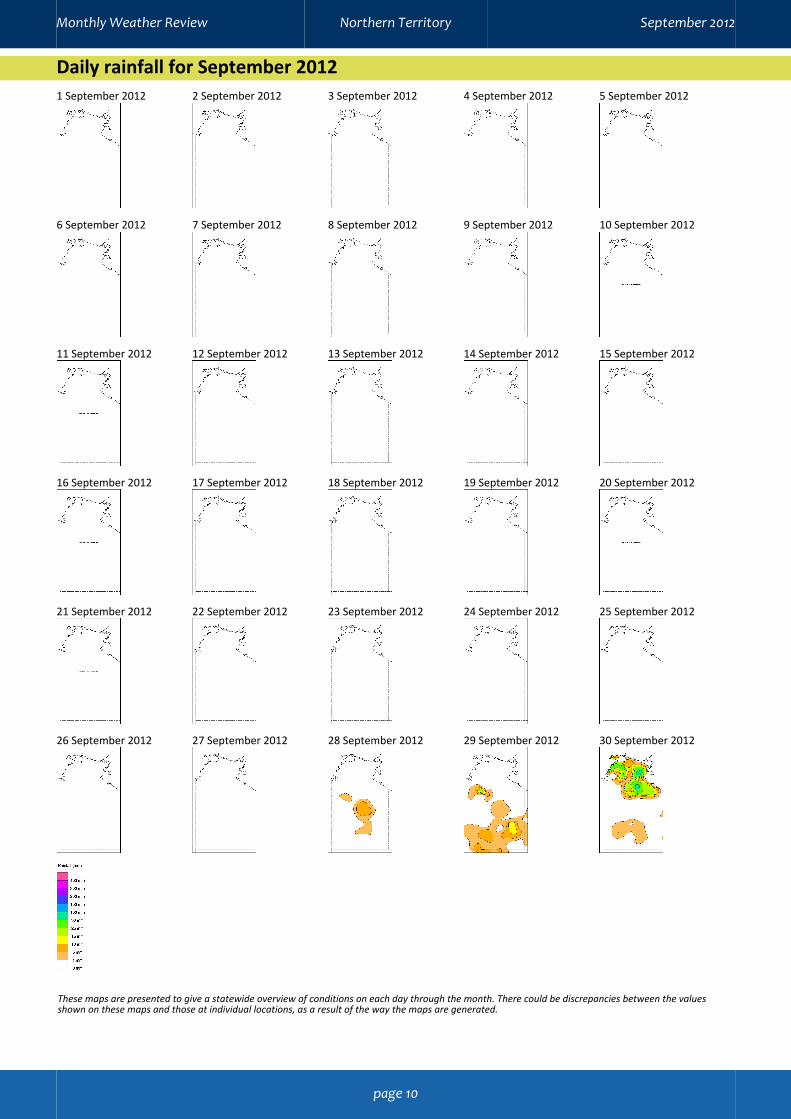
Daily rainfall for September 20121 September 2012 2 September 2012 3 September 2012 4 September 2012 5 September 2012
6 September 2012 7 September 2012 8 September 2012 9 September 2012 10 September 2012
11 September 2012 12 September 2012 13 September 2012 14 September 2012 15 September 2012
16 September 2012 17 September 2012 18 September 2012 19 September 2012 20 September 2012
21 September 2012 22 September 2012 23 September 2012 24 September 2012 25 September 2012
26 September 2012 27 September 2012 28 September 2012 29 September 2012 30 September 2012
These maps are presented to give a statewide overview of conditions on each day through the month. There could be discrepancies between the valuesshown on these maps and those at individual locations, as a result of the way the maps are generated.
Monthly Weather Review Northern Territory September 2012
page 10
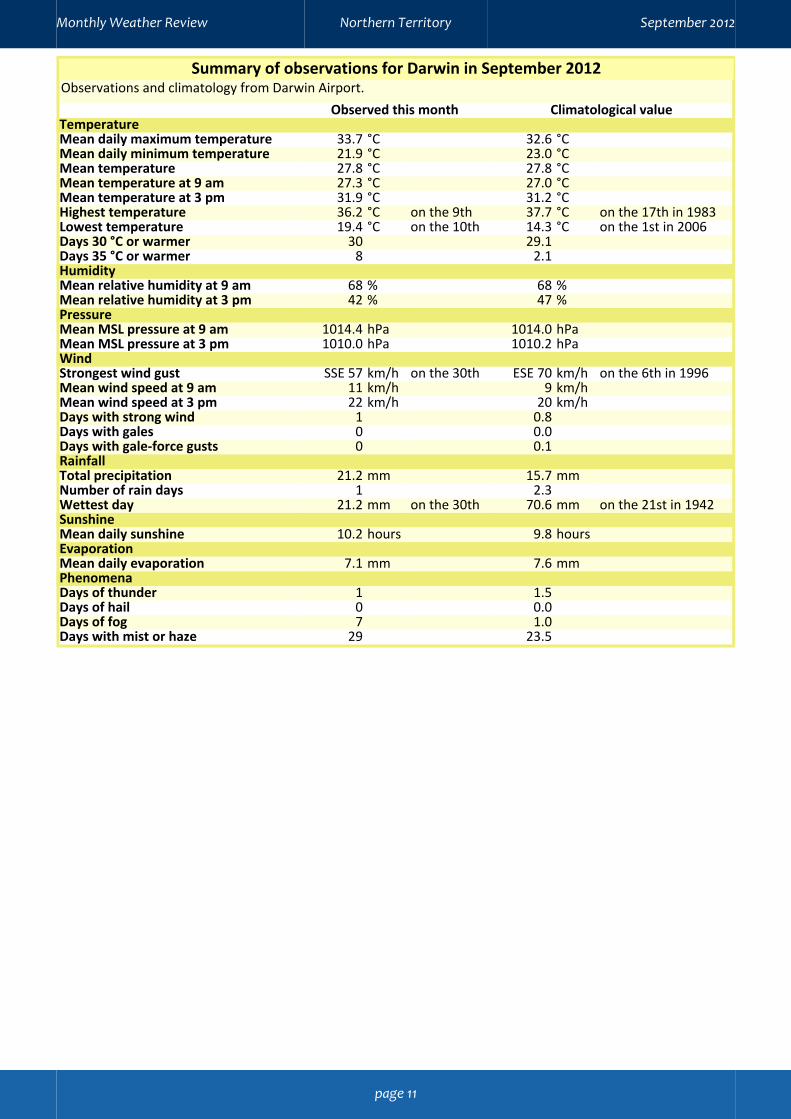
Summary of observations for Darwin in September 2012Observations and climatology from Darwin Airport.
Observed this month Climatological valueTemperatureMean daily maximum temperature 33.7 °C 32.6 °CMean daily minimum temperature 21.9 °C 23.0 °CMean temperature 27.8 °C 27.8 °CMean temperature at 9 am 27.3 °C 27.0 °CMean temperature at 3 pm 31.9 °C 31.2 °CHighest temperature 36.2 °C on the 9th 37.7 °C on the 17th in 1983Lowest temperature 19.4 °C on the 10th 14.3 °C on the 1st in 2006Days 30 °C or warmer 30 29.1Days 35 °C or warmer 8 2.1HumidityMean relative humidity at 9 am 68 % 68 %Mean relative humidity at 3 pm 42 % 47 %PressureMean MSL pressure at 9 am 1014.4 hPa 1014.0 hPaMean MSL pressure at 3 pm 1010.0 hPa 1010.2 hPaWindStrongest wind gust SSE 57 km/h on the 30th ESE 70 km/h on the 6th in 1996Mean wind speed at 9 am 11 km/h 9 km/hMean wind speed at 3 pm 22 km/h 20 km/hDays with strong wind 1 0.8Days with gales 0 0.0Days with gale-force gusts 0 0.1RainfallTotal precipitation 21.2 mm 15.7 mmNumber of rain days 1 2.3Wettest day 21.2 mm on the 30th 70.6 mm on the 21st in 1942SunshineMean daily sunshine 10.2 hours 9.8 hoursEvaporationMean daily evaporation 7.1 mm 7.6 mmPhenomenaDays of thunder 1 1.5Days of hail 0 0.0Days of fog 7 1.0Days with mist or haze 29 23.5
Monthly Weather Review Northern Territory September 2012
page 11

Summary of observations for Alice Springs in September 2012Observed this month Climatological value
TemperatureMean daily maximum temperature 29.5 °C 27.2 °CMean daily minimum temperature 9.6 °C 10.3 °CMean temperature 19.5 °C 18.8 °CMean temperature at 9 am 20.8 °C 18.8 °CMean temperature at 3 pm 28.2 °C 26.3 °CHighest temperature 38.8 °C on the 22nd 38.8 °C on the 22nd in 2003Lowest temperature 1.0 °C on the 1st −1.0 °C on the 7th in 1975Days 30 °C or warmer 14 10.3Days 35 °C or warmer 7 1.5Days 40 °C or warmer 0 0.0Nights 5 °C or cooler 9 4.6Nights 2 °C or cooler 4 0.7HumidityMean relative humidity at 9 am 22 % 34 %Mean relative humidity at 3 pm 12 % 20 %PressureMean MSL pressure at 9 am 1018.9 hPa 1019.1 hPaMean MSL pressure at 3 pm 1014.4 hPa 1015.1 hPaWindStrongest wind gust S 57 km/h on the 28th N 102 km/h on the 22nd in 2008Mean wind speed at 9 am 13 km/h 15 km/hMean wind speed at 3 pm 19 km/h 15 km/hDays with strong wind 5 2.1Days with gales 0 0.3Days with gale-force gusts 0 1.3RainfallTotal precipitation 4.0 mm 8.5 mmNumber of rain days 2 2.3Wettest day 3.2 mm on the 29th 29.0 mm on the 22nd in 1993SunshineMean daily sunshine 10.3 hours 10.0 hoursEvaporationMean daily evaporation 8.9 mm 8.1 mmPhenomenaDays of thunder 1 1.8Days of hail 0 0.0Days of frost 2 3.4Days of fog 0 0.2Days with mist or haze 18 8.0
Monthly Weather Review Northern Territory September 2012
page 12
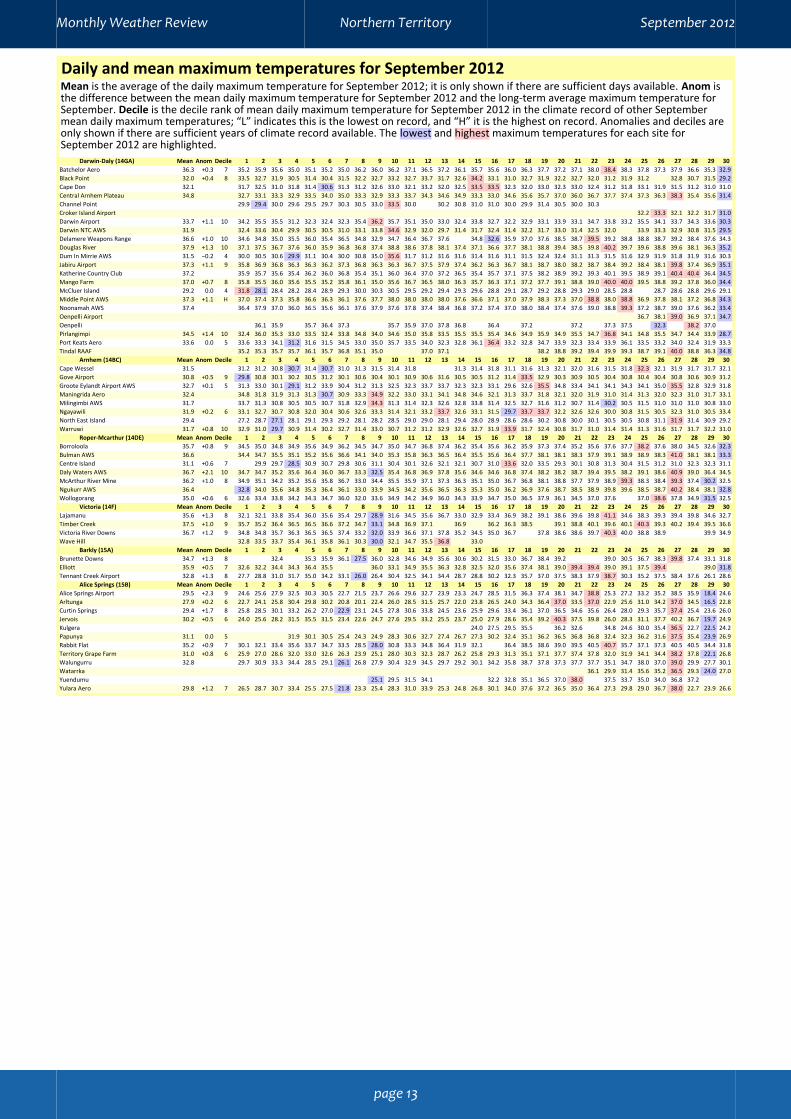
Daily and mean maximum temperatures for September 2012Mean is the average of the daily maximum temperature for September 2012; it is only shown if there are sufficient days available. Anom isthe difference between the mean daily maximum temperature for September 2012 and the long-term average maximum temperature forSeptember. Decile is the decile rank of mean daily maximum temperature for September 2012 in the climate record of other Septembermean daily maximum temperatures; “L” indicates this is the lowest on record, and “H” it is the highest on record. Anomalies and deciles areonly shown if there are sufficient years of climate record available. The lowest and highest maximum temperatures for each site forSeptember 2012 are highlighted.
Darwin-Daly (14GA) Mean Anom Decile 1 2 3 4 5 6 7 8 9 10 11 12 13 14 15 16 17 18 19 20 21 22 23 24 25 26 27 28 29 30Batchelor Aero 36.3 +0.3 7 35.2 35.9 35.6 35.0 35.1 35.2 35.0 36.2 36.0 36.2 37.1 36.5 37.2 36.1 35.7 35.6 36.0 36.3 37.7 37.2 37.1 38.0 38.4 38.3 37.8 37.3 37.9 36.6 35.3 32.9Black Point 32.0 +0.4 8 33.5 32.7 31.9 30.5 31.4 30.4 31.5 32.2 32.7 33.2 32.7 33.7 31.7 32.6 34.2 33.1 31.0 32.7 31.9 32.2 32.7 32.0 31.2 31.9 31.2 32.8 30.7 31.5 29.2Cape Don 32.1 31.7 32.5 31.0 31.8 31.4 30.6 31.3 31.2 32.6 33.0 32.1 33.2 32.0 32.5 33.5 33.5 32.3 32.0 33.0 32.3 33.0 32.4 31.2 31.8 33.1 31.9 31.5 31.2 31.0 31.0Central Arnhem Plateau 34.8 32.7 33.1 33.3 32.9 33.5 34.0 35.0 33.3 32.9 33.3 33.7 34.3 34.6 34.9 33.3 33.0 34.6 35.6 35.7 37.0 36.0 36.7 37.7 37.4 37.3 36.3 38.3 35.4 35.6 31.4Channel Point 29.9 29.4 30.0 29.6 29.5 29.7 30.3 30.5 33.0 33.5 30.0 30.2 30.8 31.0 31.0 30.0 29.9 31.4 30.5 30.0 30.3Croker Island Airport 32.2 33.3 32.1 32.2 31.7 31.0Darwin Airport 33.7 +1.1 10 34.2 35.5 35.5 31.2 32.3 32.4 32.3 35.4 36.2 35.7 35.1 35.0 33.0 32.4 33.8 32.7 32.2 32.9 33.1 33.9 33.1 34.7 33.8 33.2 35.5 34.1 33.7 34.3 33.6 30.3Darwin NTC AWS 31.9 32.4 33.6 30.4 29.9 30.5 30.5 31.0 33.1 33.8 34.6 32.9 32.0 29.7 31.4 31.7 32.4 31.4 32.2 31.7 33.0 31.4 32.5 32.0 33.9 33.3 32.9 30.8 31.5 29.5Delamere Weapons Range 36.6 +1.0 10 34.6 34.8 35.0 35.5 36.0 35.4 36.5 34.8 32.9 34.7 36.4 36.7 37.6 34.8 32.6 35.9 37.0 37.6 38.5 38.7 39.5 39.2 38.8 38.8 38.7 39.2 38.4 37.6 34.3Douglas River 37.9 +1.3 10 37.1 37.5 36.7 37.6 36.0 35.9 36.8 36.8 37.4 38.8 38.6 37.8 38.1 37.4 37.1 36.6 37.7 38.1 38.8 39.4 38.5 39.8 40.2 39.7 39.6 38.8 39.6 38.1 36.3 35.2Dum In Mirrie AWS 31.5 −0.2 4 30.0 30.5 30.6 29.9 31.1 30.4 30.0 30.8 35.0 35.6 31.7 31.2 31.6 31.6 31.4 31.6 31.1 31.5 32.4 32.4 31.1 31.3 31.5 31.6 32.9 31.9 31.8 31.9 31.6 30.3Jabiru Airport 37.3 +1.1 9 35.8 36.9 36.8 36.3 36.3 36.2 37.3 36.8 36.3 36.3 36.7 37.5 37.9 37.4 36.2 36.3 36.7 38.1 38.7 38.0 38.2 38.7 38.4 39.2 38.4 38.1 39.8 37.4 36.9 35.1Katherine Country Club 37.2 35.9 35.7 35.6 35.4 36.2 36.0 36.8 35.4 35.1 36.0 36.4 37.0 37.2 36.5 35.4 35.7 37.1 37.5 38.2 38.9 39.2 39.3 40.1 39.5 38.9 39.1 40.4 40.4 36.4 34.5Mango Farm 37.0 +0.7 8 35.8 35.5 36.0 35.6 35.5 35.2 35.8 36.1 35.0 35.6 36.7 36.5 38.0 36.3 35.7 36.3 37.1 37.2 37.7 39.1 38.8 39.0 40.0 40.0 39.5 38.8 39.2 37.8 36.0 34.4McCluer Island 29.2 0.0 4 31.8 28.1 28.4 28.2 28.4 28.9 29.3 30.0 30.3 30.5 29.5 29.2 29.4 29.3 29.6 28.8 29.1 28.7 29.2 28.8 29.3 29.0 28.5 28.8 28.7 28.6 28.8 29.6 29.1Middle Point AWS 37.3 +1.1 H 37.0 37.4 37.3 35.8 36.6 36.3 36.1 37.6 37.7 38.0 38.0 38.0 38.0 37.6 36.6 37.1 37.0 37.9 38.3 37.3 37.0 38.8 38.0 38.8 36.9 37.8 38.1 37.2 36.8 34.3Noonamah AWS 37.4 36.4 37.9 37.0 36.0 36.5 35.6 36.1 37.6 37.9 37.6 37.8 37.4 38.4 36.8 37.2 37.4 37.0 38.0 38.4 37.4 37.6 39.0 38.8 39.3 37.2 38.7 39.0 37.6 36.2 33.4Oenpelli Airport 36.7 38.1 39.0 36.9 37.1 34.7Oenpelli 36.1 35.9 35.7 36.4 37.3 35.7 35.9 37.0 37.8 36.8 36.4 37.2 37.2 37.3 37.5 32.3 38.2 37.0Pirlangimpi 34.5 +1.4 10 32.4 36.0 35.3 33.0 33.5 32.4 33.8 34.8 34.0 34.6 35.0 35.8 33.5 35.5 35.5 35.4 34.6 34.9 35.9 34.9 35.5 34.7 36.8 34.1 34.8 35.5 34.7 34.4 33.9 28.7Port Keats Aero 33.6 0.0 5 33.6 33.3 34.1 31.2 31.6 31.5 34.5 33.0 35.0 35.7 33.5 34.0 32.3 32.8 36.1 36.4 33.2 32.8 34.7 33.9 32.3 33.4 33.9 36.1 33.5 33.2 34.0 32.4 31.9 33.3Tindal RAAF 35.2 35.3 35.7 35.7 36.1 35.7 36.8 35.1 35.0 37.0 37.1 38.2 38.8 39.2 39.4 39.9 39.3 38.7 39.1 40.0 38.8 36.3 34.8
Arnhem (14BC) Mean Anom Decile 1 2 3 4 5 6 7 8 9 10 11 12 13 14 15 16 17 18 19 20 21 22 23 24 25 26 27 28 29 30Cape Wessel 31.5 31.2 31.2 30.8 30.7 31.4 30.7 31.0 31.3 31.5 31.4 31.8 31.3 31.4 31.8 31.1 31.6 31.3 32.1 32.0 31.6 31.5 31.8 32.3 32.1 31.9 31.7 31.7 32.1Gove Airport 30.8 +0.5 9 29.8 30.8 30.1 30.2 30.5 31.2 30.1 30.6 30.4 30.1 30.9 30.6 31.6 30.5 30.5 31.2 31.4 33.5 32.9 30.3 30.9 30.5 30.4 30.8 30.4 30.4 30.8 30.6 30.9 31.2Groote Eylandt Airport AWS 32.7 +0.1 5 31.3 33.0 30.1 29.1 31.2 33.9 30.4 31.2 31.3 32.5 32.3 33.7 33.7 32.3 32.3 33.1 29.6 32.6 35.5 34.8 33.4 34.1 34.1 34.3 34.1 35.0 35.5 32.8 32.9 31.8Maningrida Aero 32.4 34.8 31.8 31.9 31.3 31.3 30.7 30.9 33.3 34.9 32.2 33.0 33.1 34.1 34.8 34.6 32.1 31.3 33.7 31.8 32.1 32.0 31.9 31.0 31.4 31.3 32.0 32.3 31.0 31.7 33.1Milingimbi AWS 31.7 33.7 31.3 30.8 30.5 30.5 30.7 31.8 32.9 34.3 31.3 31.4 32.3 32.6 32.8 33.8 31.4 32.5 32.7 31.6 31.2 30.7 31.4 30.2 30.5 31.5 31.0 31.0 31.0 30.8 33.0Ngayawili 31.9 +0.2 6 33.1 32.7 30.7 30.8 32.0 30.4 30.6 32.6 33.3 31.4 32.1 33.2 33.7 32.6 33.1 31.5 29.7 33.7 33.7 32.2 32.6 32.6 30.0 30.8 31.5 30.5 32.3 31.0 30.5 33.4North East Island 29.4 27.2 28.7 27.1 28.1 29.1 29.3 29.2 28.1 28.2 28.5 29.0 29.0 28.1 29.4 28.0 28.9 28.6 28.6 30.2 30.8 30.0 30.1 30.5 30.5 30.8 31.1 31.9 31.4 30.9 29.2Warruwi 31.7 +0.8 10 32.9 31.0 29.7 30.9 31.4 30.2 32.7 31.4 33.0 30.7 31.2 31.2 32.9 32.6 32.7 31.9 33.9 31.7 32.4 30.8 31.7 31.0 31.4 31.4 31.3 31.6 31.7 31.7 32.2 31.0
Roper-Mcarthur (14DE) Mean Anom Decile 1 2 3 4 5 6 7 8 9 10 11 12 13 14 15 16 17 18 19 20 21 22 23 24 25 26 27 28 29 30Borroloola 35.7 +0.8 9 34.5 35.0 34.8 34.9 35.6 34.9 36.2 34.5 34.7 35.0 34.7 36.8 37.4 36.2 35.4 35.6 36.2 35.9 37.3 37.4 35.2 35.6 37.6 37.7 38.2 37.6 38.0 34.5 32.6 32.3Bulman AWS 36.6 34.4 34.7 35.5 35.1 35.2 35.6 36.6 34.1 34.0 35.3 35.8 36.3 36.5 36.4 35.5 35.6 36.4 37.7 38.1 38.1 38.3 37.9 39.1 38.9 38.9 38.3 41.0 38.1 38.1 33.3Centre Island 31.1 +0.6 7 29.9 29.7 28.5 30.9 30.7 29.8 30.6 31.1 30.4 30.1 32.6 32.1 32.1 30.7 31.0 33.6 32.0 33.5 29.3 30.1 30.8 31.3 30.4 31.5 31.2 31.0 32.3 32.3 31.1Daly Waters AWS 36.7 +2.1 10 34.7 34.7 35.2 35.6 36.4 36.0 36.7 33.3 32.5 35.4 36.8 36.9 37.8 35.6 34.6 34.6 36.8 37.4 38.2 38.2 38.7 39.4 39.5 38.2 39.1 38.6 40.9 39.0 36.4 34.5McArthur River Mine 36.2 +1.0 8 34.9 35.1 34.2 35.2 35.6 35.8 36.7 33.0 34.4 35.5 35.9 37.1 37.3 36.3 35.1 35.0 36.7 36.8 38.1 38.8 37.7 37.9 38.9 39.3 38.3 38.4 39.3 37.4 30.2 32.5Ngukurr AWS 36.4 32.8 34.0 35.6 34.8 35.3 36.4 36.1 33.0 33.9 34.5 34.2 35.6 36.5 36.3 35.3 35.0 36.2 36.9 37.6 38.7 38.5 38.9 39.8 39.6 38.5 38.7 40.2 38.4 38.1 32.8Wollogorang 35.0 +0.6 6 32.6 33.4 33.8 34.2 34.3 34.7 36.0 32.0 33.6 34.9 34.2 34.9 36.0 34.3 33.9 34.7 35.0 36.5 37.9 36.1 34.5 37.0 37.6 37.0 38.6 37.8 34.9 31.5 32.5
Victoria (14F) Mean Anom Decile 1 2 3 4 5 6 7 8 9 10 11 12 13 14 15 16 17 18 19 20 21 22 23 24 25 26 27 28 29 30Lajamanu 35.6 +1.3 8 32.1 32.1 33.8 35.4 36.0 35.6 35.4 29.7 28.9 31.6 34.5 35.6 36.7 33.0 32.9 33.4 36.9 38.2 39.1 38.6 39.6 39.8 41.1 34.6 38.3 39.3 39.4 39.8 34.6 32.7Timber Creek 37.5 +1.0 9 35.7 35.2 36.4 36.5 36.5 36.6 37.2 34.7 33.1 34.8 36.9 37.1 36.9 36.2 36.3 38.5 39.1 38.8 40.1 39.6 40.1 40.3 39.3 40.2 39.4 39.5 36.6Victoria River Downs 36.7 +1.2 9 34.8 34.8 35.7 36.3 36.5 36.5 37.4 33.2 32.0 33.9 36.6 37.1 37.8 35.2 34.5 35.0 36.7 37.8 38.6 38.6 39.7 40.3 40.0 38.8 38.9 39.9 34.9Wave Hill 32.8 33.5 33.7 35.4 36.1 35.8 36.1 30.3 30.0 32.1 34.7 35.5 36.8 33.0
Barkly (15A) Mean Anom Decile 1 2 3 4 5 6 7 8 9 10 11 12 13 14 15 16 17 18 19 20 21 22 23 24 25 26 27 28 29 30Brunette Downs 34.7 +1.3 8 32.4 35.3 35.9 36.1 27.5 36.0 32.8 34.6 34.9 35.6 30.6 30.2 31.5 33.0 36.7 38.4 39.2 39.0 30.5 36.7 38.3 39.8 37.4 33.1 31.8Elliott 35.9 +0.5 7 32.6 32.2 34.4 34.3 36.4 35.5 36.0 33.1 34.9 35.5 36.3 32.8 32.5 32.0 35.6 37.4 38.1 39.0 39.4 39.4 39.0 39.1 37.5 39.4 39.0 31.8Tennant Creek Airport 32.8 +1.3 8 27.7 28.8 31.0 31.7 35.0 34.2 33.1 26.0 26.4 30.4 32.5 34.1 34.4 28.7 28.8 30.2 32.3 35.7 37.0 37.5 38.3 37.9 38.7 30.3 35.2 37.5 38.4 37.6 26.1 28.6
Alice Springs (15B) Mean Anom Decile 1 2 3 4 5 6 7 8 9 10 11 12 13 14 15 16 17 18 19 20 21 22 23 24 25 26 27 28 29 30Alice Springs Airport 29.5 +2.3 9 24.6 25.6 27.9 32.5 30.3 30.5 22.7 21.5 23.7 26.6 29.6 32.7 23.9 23.3 24.7 28.5 31.5 36.3 37.4 38.1 34.7 38.8 25.3 27.2 33.2 35.2 38.5 35.9 18.4 24.6Arltunga 27.9 +0.2 6 22.7 24.1 25.8 30.4 29.8 30.2 20.8 20.1 22.4 26.0 28.5 31.5 25.7 22.0 23.8 26.5 24.0 34.3 36.4 37.0 33.5 37.0 22.9 25.6 31.0 34.2 37.0 34.5 16.5 22.8Curtin Springs 29.4 +1.7 8 25.8 28.5 30.1 33.2 26.2 27.0 22.9 23.1 24.5 27.8 30.6 33.8 24.5 23.6 25.9 29.6 33.4 36.1 37.0 36.5 34.6 35.6 26.4 28.0 29.3 35.7 37.4 25.4 23.6 26.0Jervois 30.2 +0.5 6 24.0 25.6 28.2 31.5 35.5 31.5 23.4 22.6 24.7 27.6 29.5 33.2 25.5 23.7 25.0 27.9 28.6 35.4 39.2 40.3 37.5 39.8 26.0 28.3 31.1 37.7 40.2 36.7 19.7 24.9Kulgera 24.0 27.5 29.5 35.5 36.2 32.6 34.8 24.6 30.0 35.4 36.5 22.7 22.5 24.2Papunya 31.1 0.0 5 31.9 30.1 30.5 25.4 24.3 24.9 28.3 30.6 32.7 27.4 26.7 27.3 30.2 32.4 35.1 36.2 36.5 36.8 36.8 32.4 32.3 36.2 31.6 37.5 35.4 23.9 26.9Rabbit Flat 35.2 +0.9 7 30.1 32.1 33.4 35.6 33.7 34.7 33.5 28.5 28.0 30.8 33.3 34.8 36.4 31.9 32.1 36.4 38.5 38.6 39.0 39.5 40.5 40.7 35.7 37.1 37.3 40.5 40.5 34.4 31.8Territory Grape Farm 31.0 +0.8 6 25.9 27.0 28.6 32.0 33.0 32.6 26.3 23.9 25.1 28.0 30.3 32.3 28.7 26.2 25.8 29.3 31.3 35.1 37.1 37.7 37.4 37.8 32.0 31.9 34.1 34.4 38.2 37.8 22.1 26.8Walungurru 32.8 29.7 30.9 33.3 34.4 28.5 29.1 26.1 26.8 27.9 30.4 32.9 34.5 29.7 29.2 30.1 34.2 35.8 38.7 37.8 37.3 37.7 37.7 35.1 34.7 38.0 37.0 39.0 29.9 27.7 30.1Watarrka 36.1 29.9 31.4 35.6 35.2 36.5 29.3 24.0 27.0Yuendumu 25.1 29.5 31.5 34.1 32.2 32.8 35.1 36.5 37.0 38.0 37.5 33.7 35.0 34.0 36.8 37.2Yulara Aero 29.8 +1.2 7 26.5 28.7 30.7 33.4 25.5 27.5 21.8 23.3 25.4 28.3 31.0 33.9 25.3 24.8 26.8 30.1 34.0 37.6 37.2 36.5 35.0 36.4 27.3 29.8 29.0 36.7 38.0 22.7 23.9 26.6
Monthly Weather Review Northern Territory September 2012
page 13

Daily and mean minimum temperatures for September 2012Mean is the average of the daily minimum temperature for September 2012; it is only shown if there are sufficient days available. Anom isthe difference between the mean daily minimum temperature for September 2012 and the long-term average minimum temperature forSeptember. Decile is the decile rank of mean daily minimum temperature for September 2012 in the climate record of other Septembermean daily minimum temperatures; “L” indicates this is the lowest on record, and “H” it is the highest on record. Anomalies and deciles areonly shown if there are sufficient years of climate record available. The lowest and highest minimum temperatures for each site forSeptember 2012 are highlighted.
Darwin-Daly (14GA) Mean Anom Decile 1 2 3 4 5 6 7 8 9 10 11 12 13 14 15 16 17 18 19 20 21 22 23 24 25 26 27 28 29 30Batchelor Aero 19.6 −1.1 2 17.7 17.4 15.9 17.4 18.8 19.8 19.4 19.7 19.3 17.9 19.5 20.4 19.3 20.3 20.1 19.1 17.9 19.1 19.0 18.8 18.5 19.8 19.4 21.5 21.6 21.0 22.0 23.3 22.2 22.0Black Point 22.3 −0.8 3 21.2 19.9 20.7 22.2 22.2 22.2 22.3 21.9 21.9 22.1 23.7 23.1 24.1 22.2 22.7 22.0 22.2 21.4 21.0 19.9 22.5 23.6 21.8 23.0 22.2 22.5 22.7 22.7 25.4Cape Don 24.3 23.9 23.3 23.5 23.7 24.3 24.4 24.0 23.2 24.2 24.4 24.9 24.4 24.5 24.8 24.9 23.9 24.4 23.7 24.0 23.2 24.3 24.5 24.0 24.7 24.3 24.5 24.6 24.8 24.8 26.0Central Arnhem Plateau 17.8 15.2 15.7 14.8 15.3 17.5 18.0 19.0 16.5 17.9 14.2 18.5 17.9 18.0 18.6 17.0 16.4 16.2 16.4 18.1 16.2 17.7 17.3 18.5 21.3 18.7 20.5 20.1 21.4 21.1 20.6Channel Point 20.5 18.5 17.9 18.9 19.6 20.3 21.5 20.4 19.8 16.4 17.4 20.5 19.5 20.3 19.6 19.9 20.3 19.4 19.6 21.0 20.4 20.9Croker Island Airport 22.5 23.6 23.2 22.5 24.7Darwin Airport 21.9 −1.1 1 20.8 20.4 19.5 20.0 20.8 21.4 21.6 21.5 22.1 19.4 21.4 23.8 21.2 22.4 21.8 20.8 21.2 20.9 22.6 20.2 20.7 22.9 22.5 24.3 23.3 24.0 23.9 23.8 24.1 22.4Darwin NTC AWS 24.5 23.2 24.0 23.3 23.1 23.6 23.4 23.5 24.6 24.4 23.3 24.3 24.7 24.5 25.5 25.3 24.9 24.9 25.1 25.2 25.1 24.7 25.4 24.8 25.8 25.6 26.0 25.5 25.2 21.6Delamere Weapons Range 20.0 −0.8 3 20.0 19.2 17.2 15.5 17.5 19.4 19.6 22.0 17.5 16.7 18.3 19.2 19.7 20.8 17.5 13.8 18.6 19.4 18.6 18.5 22.0 21.4 22.7 23.6 22.7 24.1 25.7 25.5 22.5Douglas River 16.8 −1.9 2 14.8 11.7 12.8 13.8 15.8 15.9 16.8 16.9 18.2 11.8 13.1 18.3 15.4 18.8 17.0 13.0 13.0 16.8 15.9 15.4 16.8 18.3 17.0 18.4 19.4 19.3 21.0 23.1 22.1 22.7Dum In Mirrie AWS 21.9 −1.3 2 21.4 18.8 18.9 19.7 20.6 23.1 21.9 21.7 21.1 19.3 20.4 23.9 21.4 22.7 23.0 21.9 21.1 21.6 22.1 19.8 21.8 23.1 21.0 23.7 22.1 24.9 24.6 23.9 24.4 22.8Jabiru Airport 20.4 −1.2 3 17.7 19.8 16.2 20.5 19.7 20.8 19.9 19.5 22.0 17.9 22.2 20.9 21.9 21.4 19.8 18.2 20.7 20.1 19.4 16.0 20.2 20.3 20.1 21.5 21.9 21.7 22.6 22.9 22.0 24.5Katherine Country Club 18.5 17.8 14.5 13.3 15.5 16.2 20.1 18.5 18.3 18.3 15.5 16.4 18.0 18.0 21.2 16.8 15.0 12.5 16.9 18.5 16.4 17.8 19.5 19.5 21.5 21.9 23.5 24.1 24.5 24.1 22.2Mango Farm 16.7 −2.6 1 13.7 13.6 12.0 15.5 15.9 16.1 17.4 16.9 18.1 14.8 12.4 16.8 15.5 17.5 16.7 13.2 14.3 16.9 16.7 15.3 16.1 17.4 17.5 19.0 19.0 20.0 20.1 21.1 20.1 22.4McCluer Island 24.5 −0.2 4 22.2 23.0 24.4 24.9 24.9 24.0 22.9 23.4 23.8 24.7 25.4 24.6 25.8 25.4 24.5 25.3 25.4 25.1 22.4 25.5 25.5 24.5 24.9 22.9 25.5 24.4 25.6 24.0 24.9 25.5Middle Point AWS 17.1 −2.2 1 16.4 14.0 13.7 15.8 16.1 17.6 16.2 17.3 16.3 14.0 17.7 18.4 18.1 18.8 17.1 16.5 15.6 16.5 16.7 14.0 15.6 17.7 17.4 18.3 18.8 17.9 19.6 20.2 20.6 21.4Noonamah AWS 18.2 16.5 14.8 14.2 15.9 18.3 18.5 18.7 17.8 17.0 12.8 18.3 18.8 17.8 19.5 18.9 17.6 17.2 17.4 17.5 16.0 16.8 19.1 18.0 19.6 20.6 19.4 21.0 23.9 21.0 21.6Oenpelli Airport 17.9 19.9 20.6 20.5 22.8Oenpelli 16.0 13.6 19.6 18.2 17.9 17.6 14.5 18.6 19.0 19.9 16.1 16.0 16.8 13.7 17.2 20.0 17.8 19.0 22.7Pirlangimpi 20.8 −0.5 4 20.7 20.0 18.1 20.1 20.3 20.9 21.1 20.3 19.6 19.8 22.1 21.8 21.8 21.1 21.3 20.1 20.6 21.1 19.6 19.4 20.2 20.3 20.4 21.1 21.4 21.9 22.7 21.5 21.5 23.9Port Keats Aero 19.5 −1.6 1 19.7 16.4 16.5 20.0 18.0 19.6 19.9 19.6 20.1 22.3 16.6 18.8 18.3 19.4 18.8 15.2 16.2 17.9 18.6 17.9 18.3 20.8 19.6 20.0 21.3 22.5 22.0 24.2 22.9 23.0Tindal RAAF 15.4 14.2 14.6 14.0 16.3 19.8 18.6 17.7 15.8 16.8 15.4 16.8 18.1 18.4 21.5 20.9 23.6 24.2 24.4 24.5 22.9
Arnhem (14BC) Mean Anom Decile 1 2 3 4 5 6 7 8 9 10 11 12 13 14 15 16 17 18 19 20 21 22 23 24 25 26 27 28 29 30Cape Wessel 24.0 23.9 23.7 23.8 23.6 23.3 23.7 22.9 23.3 23.8 24.2 24.4 25.0 24.0 23.9 24.5 23.7 24.1 23.2 24.4 24.3 23.3 24.1 24.3 24.6 24.0 24.0 24.0 24.4 24.3Gove Airport 18.7 −1.1 2 20.8 18.5 18.2 18.0 17.4 19.1 18.2 17.9 21.5 20.8 20.1 22.1 20.4 16.9 17.7 19.8 16.0 16.7 16.1 17.5 17.4 17.1 18.0 18.5 19.7 19.4 18.5 20.3 18.8 20.2Groote Eylandt Airport AWS 17.8 0.0 5 15.6 14.7 16.2 17.2 15.9 19.2 17.9 17.0 21.3 20.8 18.4 16.8 18.9 20.2 16.1 16.5 15.0 16.4 14.3 14.7 18.2 17.5 17.6 17.7 18.3 18.8 19.7 20.6 21.0 21.9Maningrida Aero 19.9 17.5 20.2 16.2 20.5 20.1 20.1 21.0 19.5 18.2 21.3 20.5 20.1 20.3 20.4 16.4 17.0 19.5 19.1 18.4 16.8 22.2 19.8 20.3 21.1 19.7 20.3 20.9 22.0 21.5 24.7Milingimbi AWS 21.0 19.2 19.9 18.7 20.6 21.2 20.7 20.5 20.1 19.6 22.7 22.4 22.4 21.8 20.5 19.6 22.1 19.7 19.3 19.3 19.6 22.0 21.6 21.4 21.3 21.8 21.2 22.0 22.9 22.7 24.4Ngayawili 20.2 −0.4 4 19.1 20.5 21.0 20.9 19.1 19.8 19.6 19.0 21.1 22.9 21.4 22.8 22.5 22.2 19.7 20.1 19.3 18.3 18.0 19.1 19.1 19.2 19.0 18.9 19.9 20.0 19.5 20.6 21.4 22.3North East Island 22.5 21.9 21.8 21.8 21.1 21.8 22.1 21.8 21.7 23.1 23.4 23.2 23.1 23.2 22.4 21.9 22.8 21.0 22.2 21.6 21.6 21.9 21.8 22.5 22.5 22.9 23.3 23.1 24.5 24.6 24.0Warruwi 23.3 −0.3 3 20.2 23.4 22.5 23.4 23.1 24.0 21.8 21.9 23.2 24.2 25.1 25.1 24.7 24.4 24.3 23.8 22.0 24.0 21.4 21.7 24.9 23.4 22.1 23.0 24.3 22.5 24.5 23.6 23.5 22.3
Roper-Mcarthur (14DE) Mean Anom Decile 1 2 3 4 5 6 7 8 9 10 11 12 13 14 15 16 17 18 19 20 21 22 23 24 25 26 27 28 29 30Borroloola 17.4 −0.3 5 13.7 13.1 12.0 16.7 18.5 18.4 19.5 18.2 14.5 14.6 16.7 15.3 20.3 18.5 14.8 13.0 12.9 13.3 15.1 14.3 20.2 18.0 18.4 20.4 20.4 20.6 18.7 22.8 24.1 23.5Bulman AWS 15.7 13.5 11.0 11.0 12.6 14.1 15.7 15.2 17.2 14.3 12.6 16.7 15.4 15.0 16.3 13.2 14.3 12.5 14.4 13.1 12.1 17.0 16.2 16.8 17.7 17.6 20.2 20.2 23.9 22.5 20.1Centre Island 22.1 −0.1 5 21.9 19.7 19.6 20.4 21.3 21.3 21.8 22.0 22.2 21.6 21.7 22.0 22.1 20.4 20.7 20.8 21.1 22.4 22.1 22.7 22.8 23.4 23.6 23.3 24.8 25.1 24.9Daly Waters AWS 14.5 −2.5 2 17.9 9.6 9.1 8.6 10.8 13.4 14.9 19.4 16.3 8.4 12.2 13.4 11.3 17.4 18.4 8.8 7.6 10.5 12.2 12.3 13.4 15.1 18.1 15.4 16.3 17.9 18.4 19.5 25.6 22.2McArthur River Mine 17.0 −0.2 6 14.6 12.5 10.5 15.3 16.4 18.5 18.1 18.9 15.1 13.9 16.3 14.6 19.2 18.5 15.8 11.6 11.4 12.6 14.1 13.8 18.7 17.4 18.6 20.9 20.5 21.6 18.9 24.3 25.1 22.0Ngukurr AWS 18.0 15.5 13.6 13.5 14.8 16.6 18.5 17.1 19.7 14.0 15.2 17.7 21.1 19.0 19.5 15.6 15.2 12.5 16.0 16.6 15.3 20.2 18.4 20.0 20.0 21.4 21.6 20.9 22.6 25.5 22.4Wollogorang 14.7 −1.2 4 12.5 10.3 12.5 13.7 14.8 16.5 10.3 17.0 10.4 17.7 15.3 13.1 16.2 15.8 12.9 11.4 9.5 9.7 11.5 12.0 16.0 15.9 17.4 19.0 18.5 14.4 19.8 20.6 22.8
Victoria (14F) Mean Anom Decile 1 2 3 4 5 6 7 8 9 10 11 12 13 14 15 16 17 18 19 20 21 22 23 24 25 26 27 28 29 30Lajamanu 15.9 −0.7 3 13.9 10.9 13.7 11.2 12.5 13.7 14.9 16.2 13.1 9.8 9.8 12.3 12.1 12.1 13.7 8.3 10.8 15.6 15.3 17.0 21.7 19.1 21.9 23.4 21.4 18.6 23.9 24.4 25.6 20.5Timber Creek 18.7 −1.9 2 17.9 16.4 17.2 11.8 13.6 16.2 17.4 19.6 22.0 17.5 15.5 16.1 19.4 22.0 13.3 13.4 16.7 16.7 20.5 20.0 19.5 19.2 24.0 25.0 25.0 23.7 26.3Victoria River Downs 14.8 −3.4 1 14.6 11.2 11.2 11.6 11.6 14.0 16.8 15.3 12.2 9.9 11.8 14.2 13.7 13.7 11.6 10.9 9.4 12.1 16.9 15.8 18.2 18.4 19.2 19.7 21.6 21.0 23.7Wave Hill 16.5 −1.4 4 13.6 13.6 14.5 11.1 12.9 14.5 17.8 19.8 13.2 10.2 11.7 13.5 14.5 15.1 15.1 14.4 11.6 15.2 16.0 17.7 19.4 19.4 19.3 23.3 20.4 20.2 22.9 25.1 22.2
Barkly (15A) Mean Anom Decile 1 2 3 4 5 6 7 8 9 10 11 12 13 14 15 16 17 18 19 20 21 22 23 24 25 26 27 28 29 30Brunette Downs 16.0 −0.6 4 13.4 10.9 15.9 17.3 15.7 11.5 12.8 15.9 15.1 14.8 15.6 12.9 9.5 15.9 15.3 15.8 18.9 18.4 19.5 20.3 15.7 19.6 22.6 19.3 17.3Elliott 16.3 −1.1 5 14.8 13.0 14.4 10.8 12.0 15.2 16.0 16.6 15.8 15.0 16.4 17.4 13.1 11.6 14.7 13.2 16.4 16.9 17.6 22.4 18.6 22.9 20.1 19.2 21.6 18.9Tennant Creek Airport 18.4 0.0 5 15.3 14.7 14.0 15.8 18.2 18.4 18.3 14.4 13.3 15.3 18.0 18.8 18.8 16.0 15.6 14.3 17.4 18.6 21.0 21.7 21.7 22.4 23.6 21.1 21.9 23.5 23.1 23.3 19.2 14.3
Alice Springs (15B) Mean Anom Decile 1 2 3 4 5 6 7 8 9 10 11 12 13 14 15 16 17 18 19 20 21 22 23 24 25 26 27 28 29 30Alice Springs Airport 9.6 −0.7 4 1.0 3.2 3.7 4.6 18.0 6.7 7.7 1.1 1.4 2.4 3.6 5.6 8.5 5.2 2.0 5.2 7.5 14.6 19.8 18.0 16.1 14.8 19.8 10.4 8.2 13.6 20.6 23.7 14.7 5.5Arltunga 9.4 −1.6 2 2.2 0.0 0.5 1.9 15.4 7.2 8.8 7.1 9.2 −0.4 0.8 1.8 4.7 10.2 4.2 3.4 11.7 15.5 22.6 13.7 15.0 19.4 14.1 14.7 7.2 12.0 19.7 22.0 15.0 2.5Curtin Springs 10.2 +0.2 6 5.5 6.5 6.5 9.0 14.5 2.9 9.2 2.3 5.0 5.2 3.6 5.6 13.0 6.9 4.5 10.0 10.2 12.9 16.1 15.2 15.0 18.7 16.7 9.6 13.1 15.2 14.1 19.9 9.9 10.1Jervois 11.6 +0.3 6 3.0 2.4 4.7 6.0 14.2 13.0 11.5 7.3 7.4 8.6 6.0 6.1 9.9 10.6 4.3 8.4 11.6 18.4 18.3 19.1 17.8 20.8 15.2 11.9 22.2 22.4 15.9 8.4Kulgera 7.4 14.7 15.4 17.6 16.6 16.4 19.5 6.1 14.2 17.4 19.7 18.3 9.9 6.1Papunya 13.6 13.0 7.0 10.7 7.0 9.4 9.2 11.0 9.6 13.7 10.6 8.6 8.4 11.9 14.4 18.7 16.5 16.7 19.9 22.2 16.1 16.4 19.4 18.0 19.4 15.4 9.5Rabbit Flat 14.4 −0.1 4 15.5 12.3 11.2 10.2 12.7 15.2 9.0 14.9 10.7 6.0 7.4 8.3 10.1 14.3 8.6 12.5 15.7 15.9 15.9 17.1 20.8 22.3 16.8 18.6 21.7 19.4 20.7 18.9Territory Grape Farm 11.3 −0.7 4 5.6 5.2 8.1 5.5 9.8 11.1 12.0 6.2 4.7 5.7 7.9 10.2 9.3 8.9 6.1 7.0 7.6 10.3 16.0 16.7 17.2 18.6 18.8 14.8 17.5 13.7 17.9 20.4 17.6 7.2Walungurru 17.5 15.0 17.1 18.2 18.0 17.0 12.9 13.6 12.9 15.5 14.1 16.9 13.0 16.7 15.2 15.0 16.8 18.0 18.0 18.1 17.2 21.2 22.4 21.8 18.9 20.8 24.6 21.8 25.5 13.6 14.9Watarrka 13.9 15.4 11.2 21.3 15.8 19.8 12.0 7.0Yuendumu 9.5 7.5 10.5 7.9 13.2 8.8 6.7 10.2 7.6 9.0 8.0 14.4 17.5 15.0 18.9 18.1 17.4 16.2 16.4 14.0 16.7Yulara Aero 10.3 −0.4 4 6.6 5.8 7.3 8.6 12.2 1.0 10.4 5.2 10.5 3.8 4.4 5.2 13.1 8.0 4.5 10.5 10.0 12.2 12.8 12.5 13.1 17.9 17.4 10.8 15.1 17.0 14.5 20.7 9.2 9.0
Monthly Weather Review Northern Territory September 2012
page 14
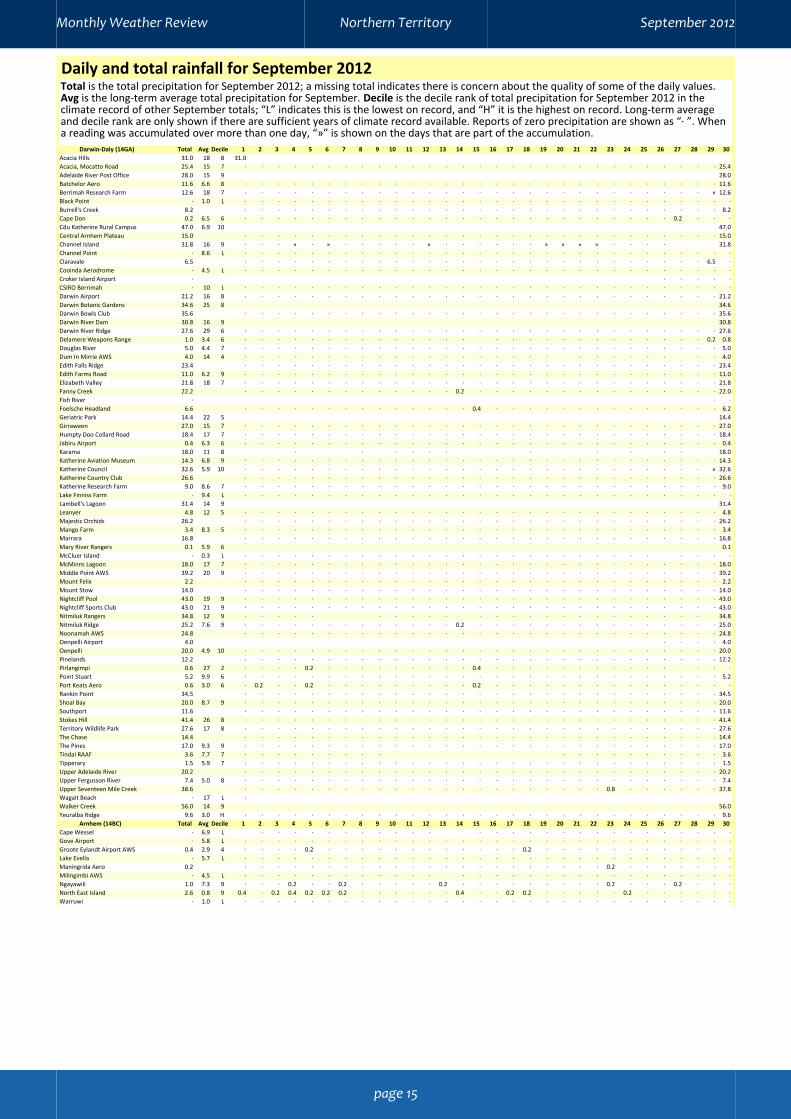
Daily and total rainfall for September 2012Total is the total precipitation for September 2012; a missing total indicates there is concern about the quality of some of the daily values.Avg is the long-term average total precipitation for September. Decile is the decile rank of total precipitation for September 2012 in theclimate record of other September totals; “L” indicates this is the lowest on record, and “H” it is the highest on record. Long-term averageand decile rank are only shown if there are sufficient years of climate record available. Reports of zero precipitation are shown as “· ”. Whena reading was accumulated over more than one day, “»” is shown on the days that are part of the accumulation.
Darwin-Daly (14GA) Total Avg Decile 1 2 3 4 5 6 7 8 9 10 11 12 13 14 15 16 17 18 19 20 21 22 23 24 25 26 27 28 29 30Acacia Hills 31.0 18 8 31.0Acacia, Mocatto Road 25.4 15 7 · · · · · · · · · · · · · · · · · · · · · · · · · · · · · 25.4Adelaide River Post Office 28.0 15 9 28.0Batchelor Aero 11.6 6.6 8 · · · · · · · · · · · · · · · · · · · · · · · · · · · · · 11.6Berrimah Research Farm 12.6 18 7 · · · · · · · · · · · · · · · · · · · · · · · · · · · · » 12.6Black Point · 1.0 L · · · · · · · · · · · · · · · · · · · · · · · · · · · · · ·Burrell's Creek 8.2 · · · · · · · · · · · · · · · · · · · · · · · · · · · · · 8.2Cape Don 0.2 6.5 6 · · · · · · · · · · · · · · · · · · · · · · · · · · 0.2 · · ·Cdu Katherine Rural Campus 47.0 6.9 10 47.0Central Arnhem Plateau 15.0 · · · · · · · · · · · · · · · · · · · · · · · · · · · · · 15.0Channel Island 31.8 16 9 · · · » · » · · · · · » · · · · · · » » » » · · · · 31.8Channel Point · 8.6 L · · · · · · · · · · · · · · · · · · · · · · · · · · · · · ·Claravale 6.5 · · · · · · · · · · · · · · · · · · · · · · · · · · · · 6.5 ·Cooinda Aerodrome · 4.5 L · · · · · · · · · · · · · · · · · · · · · · · · · · · · · ·Croker Island Airport · · · · · ·CSIRO Berrimah · 10 L · · · · · · · · · · · · · · · · · · · · · · · · · · · · · ·Darwin Airport 21.2 16 8 · · · · · · · · · · · · · · · · · · · · · · · · · · · · · 21.2Darwin Botanic Gardens 34.6 25 8 34.6Darwin Bowls Club 35.6 · · · · · · · · · · · · · · · · · · · · · · · · · · · · · 35.6Darwin River Dam 30.8 16 9 30.8Darwin River Ridge 27.6 29 6 · · · · · · · · · · · · · · · · · · · · · · · · · · · · · 27.6Delamere Weapons Range 1.0 3.4 6 · · · · · · · · · · · · · · · · · · · · · · · · · · · 0.2 0.8Douglas River 5.0 4.4 7 · · · · · · · · · · · · · · · · · · · · · · · · · · · · · 5.0Dum In Mirrie AWS 4.0 14 4 · · · · · · · · · · · · · · · · · · · · · · · · · · · 4.0Edith Falls Ridge 23.4 · · · · · · · · · · · · · · · · · · · · · · · · · · · · · 23.4Edith Farms Road 11.0 6.2 9 · · · · · · · · · · · · · · · · · · · · · · · · · · · · · 11.0Elizabeth Valley 21.8 18 7 · · · · · · · · · · · · · · · · · · · · · · · · · · · · · 21.8Fanny Creek 22.2 · · · · · · · · · · · · · 0.2 · · · · · · · · · · · · · · · 22.0Fish River · · ·Foelsche Headland 6.6 · · · · · · · · · · · · · · 0.4 · · · · · · · · · · · · · · 6.2Geriatric Park 14.4 22 5 14.4Girraween 27.0 15 7 · · · · · · · · · · · · · · · · · · · · · · · · · · · · · 27.0Humpty Doo Collard Road 18.4 17 7 · · · · · · · · · · · · · · · · · · · · · · · · · · · · · 18.4Jabiru Airport 0.4 6.3 6 · · · · · · · · · · · · · · · · · · · · · · · · · · · · · 0.4Karama 18.0 11 8 · · · · · · · · · · · 18.0Katherine Aviation Museum 14.3 6.8 9 · · · · · · · · · · · · · · · · · · · · · · · · · · · · · 14.3Katherine Council 32.6 5.9 10 · · · · · · · · · · · · · · · · · · · · · · · · · · · · » 32.6Katherine Country Club 26.6 · · · · · · · · · · · · · · · · · · · · · · · · · · · · · 26.6Katherine Research Farm 9.0 8.6 7 · · · · · · · · · · · · · · · · · · · · · · · · · · · · · 9.0Lake Finniss Farm · 9.4 L · · · · · · · · · · · · · · · · · · · · · · · · · · · · · ·Lambell's Lagoon 31.4 14 9 31.4Leanyer 4.8 12 5 · · · · · · · · · · · · · · · · · · · · · · · · · · · · · 4.8Majestic Orchids 26.2 · · · · · · · · · · · · · · · · · · · · · · · · · · · · · 26.2Mango Farm 3.4 8.3 5 · · · · · · · · · · · · · · · · · · · · · · · · · · · · · 3.4Marrara 16.8 · · · · · · · · · · · · · · · · · · · · · · · · · · · · · 16.8Mary River Rangers 0.1 5.9 6 0.1McCluer Island · 0.3 L · · · · · · · · · · · · · · · · · · · · · · · · · · · · ·McMinns Lagoon 18.0 17 7 · · · · · · · · · · · · · · · · · · · · · · · · · · · · · 18.0Middle Point AWS 39.2 20 9 · · · · · · · · · · · · · · · · · · · · · · · · · · · · · 39.2Mount Felix 2.2 · · · · · · · · · · · · · · · · · · · · · · · · · · · · · 2.2Mount Stow 14.0 · · · · · · · · · · · · · · · · · · · · · · · · · · · · · 14.0Nightcliff Pool 43.0 19 9 · · · · · · · · · · · · · · · · · · · · · · · · · · · · · 43.0Nightcliff Sports Club 43.0 21 9 · · · · · · · · · · · · · · · · · · · · · · · · · · · · · 43.0Nitmiluk Rangers 34.8 12 9 · · · · · · · · · · · · · · · · · · · · · · · · 34.8Nitmiluk Ridge 25.2 7.6 9 · · · · · · · · · · · · · 0.2 · · · · · · · · · · · · · · · 25.0Noonamah AWS 24.8 · · · · · · · · · · · · · · · · · · · · · · · · · · · · · 24.8Oenpelli Airport 4.0 · · · · 4.0Oenpelli 20.0 4.9 10 · · · · · · · · · · · · · · · · · · · · · · · · · · · · · 20.0Pinelands 12.2 · · · · · · · · · · · · · · · · · · · · · · · · · · · · · 12.2Pirlangimpi 0.6 27 2 · · · · 0.2 · · · · · · · · · 0.4 · · · · · · · · · · · · · ·Point Stuart 5.2 9.9 6 · · · · · · · · · · · · · · · · · · · · · · · · · · · · · 5.2Port Keats Aero 0.6 3.0 6 · 0.2 · · 0.2 · · · · · · · · · 0.2 · · · · · · · · · · · · · · ·Rankin Point 34.5 · · · · · · · · · · · · · · · · · · · · · · · · · · · · · 34.5Shoal Bay 20.0 8.7 9 · · · · · · · · · · · · · · · · · · · · · · · · · · · · · 20.0Southport 11.6 · · · · · · · · · · · · · · · · · · · · · · · · · · · · · 11.6Stokes Hill 41.4 26 8 · · · · · · · · · · · · · · · · · · · · · · · · · · · · · 41.4Territory Wildlife Park 27.6 17 8 · · · · · · · · · · · · · · · · · · · · · · · · · · · · · 27.6The Chase 14.4 · · · · · · · · · · · · · · · · · · · · · · · · · · · · · 14.4The Pines 17.0 9.3 9 · · · · · · · · · · · · · · · · · · · · · · · · · · · · · 17.0Tindal RAAF 3.6 7.7 7 · · · · · · · · · · · · · · · · · · · 3.6Tipperary 1.5 5.9 7 · · · · · · · · · · · · · · · · · · · · · · · · · · · · · 1.5Upper Adelaide River 20.2 · · · · · · · · · · · · · · · · · · · · · · · · · · · · · 20.2Upper Fergusson River 7.4 5.0 8 · · · · · · · · · · · · · · · · · · · · · · · · · · · · · 7.4Upper Seventeen Mile Creek 38.6 · · · · · · · · · · · · · · · · · · · · · · 0.8 · · · · · · 37.8Wagait Beach · 17 L ·Walker Creek 56.0 14 9 56.0Yeuralba Ridge 9.6 3.0 H · · · · · · · · · · · · · · · · · · · · · · · · · · · · · 9.6
Arnhem (14BC) Total Avg Decile 1 2 3 4 5 6 7 8 9 10 11 12 13 14 15 16 17 18 19 20 21 22 23 24 25 26 27 28 29 30Cape Wessel · 6.9 L · · · · · · · · · · · · · · · · · · · · · · · · · · ·Gove Airport · 5.8 L · · · · · · · · · · · · · · · · · · · · · · · · · · · · · ·Groote Eylandt Airport AWS 0.4 2.9 4 · · · · 0.2 · · · · · · · · · · · · 0.2 · · · · · · · · · · · ·Lake Evella · 5.7 L · · · · · · · · · · · · · · · · · · · · · · · · · · · · · ·Maningrida Aero 0.2 · · · · · · · · · · · · · · · · · · · · · · 0.2 · · · · · · ·Milingimbi AWS · 4.5 L · · · · · · · · · · · · · · · · · · · · · · · · · · · · ·Ngayawili 1.0 7.3 9 · · · 0.2 · · 0.2 · · · · · 0.2 · · · · · · · · · 0.2 · · · 0.2 · · ·North East Island 2.6 0.8 9 0.4 · 0.2 0.4 0.2 0.2 0.2 · · · · · · 0.4 · · 0.2 0.2 · · · · · 0.2 · · · · · ·Warruwi · 1.0 L · · · · · · · · · · · · · · · · · · · · · · · · · · · · · ·
Monthly Weather Review Northern Territory September 2012
page 15
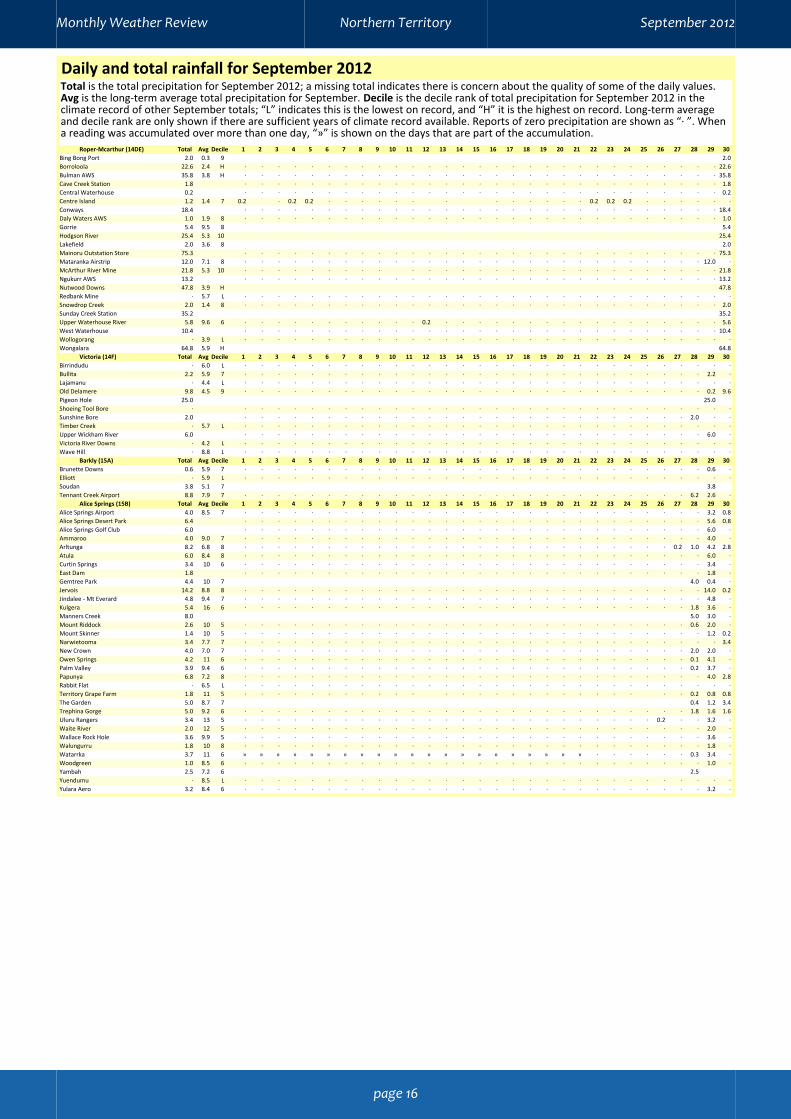
Daily and total rainfall for September 2012Total is the total precipitation for September 2012; a missing total indicates there is concern about the quality of some of the daily values.Avg is the long-term average total precipitation for September. Decile is the decile rank of total precipitation for September 2012 in theclimate record of other September totals; “L” indicates this is the lowest on record, and “H” it is the highest on record. Long-term averageand decile rank are only shown if there are sufficient years of climate record available. Reports of zero precipitation are shown as “· ”. Whena reading was accumulated over more than one day, “»” is shown on the days that are part of the accumulation.
Roper-Mcarthur (14DE) Total Avg Decile 1 2 3 4 5 6 7 8 9 10 11 12 13 14 15 16 17 18 19 20 21 22 23 24 25 26 27 28 29 30Bing Bong Port 2.0 0.3 9 2.0Borroloola 22.6 2.4 H · · · · · · · · · · · · · · · · · · · · · · · · · · · · · 22.6Bulman AWS 35.8 3.8 H · · · · · · · · · · · · · · · · · · · · · · · · · · · · · 35.8Cave Creek Station 1.8 · · · · · · · · · · · · · · · · · · · · · · · · · · · · · 1.8Central Waterhouse 0.2 · · · · · · · · · · · · · · · · · · · · · · · · · · · · · 0.2Centre Island 1.2 1.4 7 0.2 · 0.2 0.2 · · · · · · · · · · · · · 0.2 0.2 0.2 · · · · · ·Conways 18.4 · · · · · · · · · · · · · · · · · · · · · · · · · · · · · 18.4Daly Waters AWS 1.0 1.9 8 · · · · · · · · · · · · · · · · · · · · · · · · · · · · · 1.0Gorrie 5.4 9.5 8 5.4Hodgson River 25.4 5.3 10 25.4Lakefield 2.0 3.6 8 2.0Mainoru Outstation Store 75.3 · · · · · · · · · · · · · · · · · · · · · · · · · · · · · 75.3Mataranka Airstrip 12.0 7.1 8 · · · · · · · · · · · · · · · · · · · · · · · · · · · · 12.0 ·McArthur River Mine 21.8 5.3 10 · · · · · · · · · · · · · · · · · · · · · · · · · · · · 21.8Ngukurr AWS 13.2 · · · · · · · · · · · · · · · · · · · · · · · · · · · · · 13.2Nutwood Downs 47.8 3.9 H 47.8Redbank Mine · 5.7 L · · · · · · · · · · · · · · · · · · · · · · · · · · · · · ·Snowdrop Creek 2.0 1.4 8 · · · · · · · · · · · · · · · · · · · · · · · · · · · · · 2.0Sunday Creek Station 35.2 35.2Upper Waterhouse River 5.8 9.6 6 · · · · · · · · · · · 0.2 · · · · · · · · · · · · · · · · · 5.6West Waterhouse 10.4 · · · · · · · · · · · · · · · · · · · · · · · · · · · · · 10.4Wollogorang · 3.9 L · · · · · · · · · · · · · · · · · · · · · · · · · · · · · ·Wongalara 64.8 5.9 H 64.8
Victoria (14F) Total Avg Decile 1 2 3 4 5 6 7 8 9 10 11 12 13 14 15 16 17 18 19 20 21 22 23 24 25 26 27 28 29 30Birrindudu · 6.0 L · · · · · · · · · · · · · · · · · · · · · · · · · · · · · ·Bullita 2.2 5.9 7 · · · · · · · · · · · · · · · · · · · · · · · · · · · · 2.2 ·Lajamanu · 4.4 L · · · · · · · · · · · · · · · · · · · · · · · · · · · · · ·Old Delamere 9.8 4.5 9 · · · · · · · · · · · · · · · · · · · · · · · · · · · · 0.2 9.6Pigeon Hole 25.0 25.0Shoeing Tool Bore · · · · · · · · · · · · · · · · · · · · · · · · · · · · · · ·Sunshine Bore 2.0 · · · · · · · · · · · · · · · · · · · · · · · · · · · 2.0 · ·Timber Creek · 5.7 L · · · · · · · · · · · · · · · · · · · · · · · · · · · · · ·Upper Wickham River 6.0 · · · · · · · · · · · · · · · · · · · · · · · · · · · · 6.0 ·Victoria River Downs · 4.2 L · · · · · · · · · · · · · · · · · · · · · · · · · · · · · ·Wave Hill · 8.8 L · · · · · · · · · · · · · · · · · · · · · · · · · · · · · ·
Barkly (15A) Total Avg Decile 1 2 3 4 5 6 7 8 9 10 11 12 13 14 15 16 17 18 19 20 21 22 23 24 25 26 27 28 29 30Brunette Downs 0.6 5.9 7 · · · · · · · · · · · · · · · · · · · · · · · · · · · · 0.6 ·Elliott · 5.9 L · · · · · · · · · · · · · · · · · · · · · · · · · · · · · ·Soudan 3.8 5.1 7 3.8Tennant Creek Airport 8.8 7.9 7 · · · · · · · · · · · · · · · · · · · · · · · · · · · 6.2 2.6 ·
Alice Springs (15B) Total Avg Decile 1 2 3 4 5 6 7 8 9 10 11 12 13 14 15 16 17 18 19 20 21 22 23 24 25 26 27 28 29 30Alice Springs Airport 4.0 8.5 7 · · · · · · · · · · · · · · · · · · · · · · · · · · · · 3.2 0.8Alice Springs Desert Park 6.4 · · · · · · · · · · · · · · · · · · · · · · · · · · · · 5.6 0.8Alice Springs Golf Club 6.0 · · · · · · · · · · · · · · · · · · · · · · · · · · · · 6.0 ·Ammaroo 4.0 9.0 7 · · · · · · · · · · · · · · · · · · · · · · · · · · · · 4.0 ·Arltunga 8.2 6.8 8 · · · · · · · · · · · · · · · · · · · · · · · · · · 0.2 1.0 4.2 2.8Atula 6.0 8.4 8 · · · · · · · · · · · · · · · · · · · · · · · · · · · · 6.0 ·Curtin Springs 3.4 10 6 · · · · · · · · · · · · · · · · · · · · · · · · · · · · 3.4 ·East Dam 1.8 · · · · · · · · · · · · · · · · · · · · · · · · · · · · 1.8 ·Gemtree Park 4.4 10 7 4.0 0.4 ·Jervois 14.2 8.8 8 · · · · · · · · · · · · · · · · · · · · · · · · · · · · 14.0 0.2Jindalee - Mt Everard 4.8 9.4 7 · · · · · · · · · · · · · · · · · · · · · · · · · · · · 4.8 ·Kulgera 5.4 16 6 · · · · · · · · · · · · · · · · · · · · · · · · · · · 1.8 3.6 ·Manners Creek 8.0 5.0 3.0 ·Mount Riddock 2.6 10 5 · · · · · · · · · · · · · · · · · · · · · · · · · · · 0.6 2.0 ·Mount Skinner 1.4 10 5 · · · · · · · · · · · · · · · · · · · · · · · · · · · · 1.2 0.2Narwietooma 3.4 7.7 7 · · · · · · · · · · · · · · · · · · · · · · · · · · · · · 3.4New Crown 4.0 7.0 7 · · · · · · · · · · · · · · · · · · · · · · · · · · · 2.0 2.0 ·Owen Springs 4.2 11 6 · · · · · · · · · · · · · · · · · · · · · · · · · · · 0.1 4.1 ·Palm Valley 3.9 9.4 6 · · · · · · · · · · · · · · · · · · · · · · · · · · · 0.2 3.7 ·Papunya 6.8 7.2 8 · · · · · · · · · · · · · · · · · · · · · · · · · · · · 4.0 2.8Rabbit Flat · 6.5 L · · · · · · · · · · · · · · · · · · · · · · · · · · · · · ·Territory Grape Farm 1.8 11 5 · · · · · · · · · · · · · · · · · · · · · · · · · 0.2 0.8 0.8The Garden 5.0 8.7 7 0.4 1.2 3.4Trephina Gorge 5.0 9.2 6 · · · · · · · · · · · · · · · · · · · · · · · · · · · 1.8 1.6 1.6Uluru Rangers 3.4 13 5 · · · · · · · · · · · · · · · · · · · · · · · · · 0.2 · · 3.2 ·Waite River 2.0 12 5 · · · · · · · · · · · · · · · · · · · · · · · · · · · · 2.0 ·Wallace Rock Hole 3.6 9.9 5 · · · · · · · · · · · · · · · · · · · · · · · · · · · · 3.6 ·Walungurru 1.8 10 8 · · · · · · · · · · · · · · · · · · · · · · · · · · · · 1.8 ·Watarrka 3.7 11 6 » » » » » » » » » » » » » » » » » » » » » · · · · · · 0.3 3.4 ·Woodgreen 1.0 8.5 6 · · · · · · · · · · · · · · · · · · · · · · · · · · · · 1.0 ·Yambah 2.5 7.2 6 2.5Yuendumu · 8.5 L · · · · · · · · · · · · · · · · · · · · · · · · · · · · · ·Yulara Aero 3.2 8.4 6 · · · · · · · · · · · · · · · · · · · · · · · · · · · · 3.2 ·
Monthly Weather Review Northern Territory September 2012
page 16
Related Documents