DOE/EIA-0035(93/12) Monthly ,iiI Energy Re ¢iew

Welcome message from author
This document is posted to help you gain knowledge. Please leave a comment to let me know what you think about it! Share it to your friends and learn new things together.
Transcript

DOE/EIA-0035(93/12)
Monthly, i iI
EnergyRe ¢iew
Ordering Information
This publication and other Energy Information Administration (EIA) publications may be purchased from the Superintendentof Documents, U.S. Government Printing Office.
All telephone orders should be directed to:
U.S. Government Printing Office Superintendent of DocumentsMcPherson Square Bookstore U.S. Government Printing Office1510 H Street, N.W. Washington, DC 20402Washington, DC 20005 202-783-3238202-653-2050 FAX: 202-512-2233FAX : 202-376-5055 8 a.m. to 4 p.m., eastern time, M-F9 a.m. to 4:30 p.m., eastern time, M-F
All mail orders should be directed to:
U.S. Government Printing OfficeP.O. Box 371954Pittsburgh, PA 15250-7954
Complimentary subscriptions and single issues are available to certain groups of subscribers, such as public mid academiclibraries, Federal, State, local, and foreign governments, EIA survey respondents, and the media. For further information, andfor answers to questions on energy statistics, please contact EINs Nattonal Energy Information Center. Address, telephonenumbers, and hours are as follows:
National Energy Information Center, EI-231Energy Information AdministrationForrestal Building, Room 1F-048Washington, DC 20585202-586-8800TYY: For people who are deaf or
hard of hearing: 202-586-11819 a.m. to 5 p.m., eastern time, M-F
Electronic Access
! Monthly Energy Review (MER) data are also available electronically. Page images of all MER tables are available via modemon the Energy "Information Administration Electronic Publication System (202-586-2557) and images of selected tables areavailable on the U.S. DeparUnent of Commerce Electronic Bulletin Board (202-482-3870). The data shown in the tables arealso available in database format via modem on the 1J.S. Government Printing Office (GPO) Federal Bulletin Board
(202-512-1524) and on personal computer diskettes by m,'ul from the Gl_) (202-512-1530) and from the National TechnicalInformation Service (703-487-4650).
The Monthly Energy Review (ISSN 0095-7356) is published monthly by the Energy Information Administration, 1000Independence Avenu'e, S.W., Washington, DC 20585, and sells for $77.00 per year (price is subject to change without advancenotice). Second-class postage rates are paid.at Washington, DC 20066-9998, and at additional mailin_ offices.POSTMASTER: Send address changes to Monthly Energy Review, Energy Information Administration, EI-231, 1000Independence Avenue, S.W., Washington, DC 20585.
Printedwithmyinkonrecycledpaper
Released for Printing: December 22, 1993

DOE/EIA-0035(93/12)Distribution Category UC-950
Monthly Energy ReviewDecember 1993
Energy Information AdministrationOffice of Energy Markets and End Use
U.S. Department of EnergyWashington, DC 20585
DISTRIBUTION OF THIS DocUMENT IS UNLIMITED
This reportwaspreparedby the EnergyInformationAdministration,the independentstatisticalandanalyticalagency within the Departmentof Energy. The informationcontained herein should not be construedasadvocatingor reflectingany policypositionof the Departmentof Energyor any other organization.
Contacts
The Monthly Energy Review is prepared by the Energy Infommtion Administration. General information may be obtainedfrom W. Calvin Kilgore, Director, Office of Energy Markets a_d End Use, 202-586-1617; Lynda T. Carlson, Director, EnergyEnd Use and Integrated Statistics Division, 202-586-1112; and Katherine E. Seiferlein, Chief, Integrated Sultistics Branch,202-586-5692. Questions and conunents concerning the contents of tile Monthly Energy Review may be directed to thePrincipal Analyst, Chuck Allen, 202-586-5692, or to Diane D. Perritt, 202-586-2788, Carol Swiggins, 202-586-5743, or thefollowing subject specialists:
Features ...................................................... Barbara T. Fichman 202-586-5737
Section 1. Energ) Overview
Tables 1.1-1.5 ................................... Alethea K. Jennings 202-586-9160Tables 1.6-1.12 .................................. Dianne R. Dunn 202-586-2792
St,cti_m 2. Energy Consumption .............................. Alethea K. Jennings 202-586-9160
Section 3. Petroleum ........................................ Christine D. Gray 202-586-8995
Section 4. Natural Gas ...................................... Donna Guerrina 202-586-6135
Section 5. Oil and Gas Resource Development ............... Herbert T. Black 202-586-4055
Section 6. Coal .............................................. Paulette Young 202-254-5481
Section 7. Electricity ........................................ D bor_dl Bolden 202-254-5663
Section 8. Nuclear Energy ................................... Douglas C. Bonnar 202-254-5560
Section 9. Energy Prices
Petroleum ...................................... Elizabeth Scott 202-586-1258
Natural Gas .................................... Donna Guerrina 202-586-6135
Electricity
Retail Prices .................................. Deborah Bolden 202-254-5663
F_,ssil-Fuel Receipts ............................ Saa_dra Smith 202-254-5632
Section 10. Internatioiaal EnergyPetroleum
Production .................................... Patricia Smith 202-586-6925
Consumption and Stocks ........................ H. Vicky McLaine 202-586-9412
Nuclear ElectJicity Gross Generation .............. Douglas C. Bonnar 202-254-5560
Requests for additional information on other energy statistics available from the Energy Information Administration ,'rodquestions concerning subscriptions and report distribution may be directed to the National Eoergy Information Center,202-586-8800 (TI'Y, for people who are deaf or hard of hearing, 202-586-1181).
ii EnergyInformationAdministration/MonthlyEnergyReviewDecember1993
Contents
Page
Highlights: Emissions of Greenhouse Gases in the United States1985-1990 ........................................... 1
Highlights: Assessment of Energy Use in Multibuilding Facilities ..... 3
Section 1. Energy Overview .................................... 5
Section 2. Energy Consumption ................................. 25
Section 3. Petroleum ........................................... 43
Section 4. Natural Gas ......................................... 73
Section 5. Oil and Gas Resource Development .................... 83
Section 6. Coal ............................................... 87
Section 7. Electricity .......................................... 95
Section 8. Nuclear Energy ...................................... 105
Section 9. Energy Prices ....................................... 111
Section 10. International Energy ................................. 131
Appendix A. Thermal Conversion Factors ......................... 145
Appendix B. Metric and Other Physical Conversion Factors ......... 155
Appendix C. List of Features ..................................... 157
Glossary ....................................................... 161
EnergyInformationAdminisbatJon/MonthlyEnergyReviewDecember1993 iii
Tables
Section 1. Energy Overview Page1.1 Energy Summary for September 1993 .................................................. 51.2 Energy Overview .................................................................... 71.3 Energy Production by Source ......................................................... 91.4 Energy Consumption by Source ....................................................... 111.5 Energy Net hnports by Source ........................................................ 131.6 Merchandise Trade Value ............................................................. 15
1.7 Energy Consumption per Dollar of Gross Domestic Product .............................. 161.8 U.S. Dependence oil Petroleum Net hnports ........................................... 171.9 Cost of Fuels to End Users in Constant (1982-1984) Dollars .............................. 181,10 Passenger C,'u"Efficiency ............................................................. 191.11 Population-Weighted Heating Degree-Days ............................................. 201.12 Population-Weighted Cooling Degree-Days ............................................. 21
Section 2. Energy Consumption2.1 Energy Consumption Summ_u'y for September 1993 ...................................... 252.2 Energy Consumption by End-Use Sector ............................................... 272.3 Residential and Commercial Energy Consumption ....................................... 292.4 Industrial Energy Consumption ........................................................ 312.5 Transportation Energy Consumption ................................................... 332.6 Energy Input at Electric Utilities ...................................................... 35
Section 3. Petroleum3.1 Petroleum Overview
3.1a Field Production, Stock Change, Petroleum Products Supplied, and Ending Stocks ... 443.1b hnports, Exports, and Net hnports ............................................. 45
3.2 Crude Oil Supply and Disposition3.2a Supply ..................................................................... 483.2b Disposition and Ending Stocks ................................................ 49
3.3 Petroleum hnports3.3a Algeria, Iraq, Kuwait, and Libya .............................................. 503.3b Qatar, Saudi Arabia, [J.A.E., and Total Arab OPEC .............................. 513.3c Ecuador, Gabon, Indonesia, and lran ........................................... 52
3.3d Nigeria, Venezuela, Total Non-Arab OPEC, and Total OPI_C ...................... 533.3e Angola, Australia, Bahama Islands, Brazil, Canada, and China .................... 543.3f Colombia, Ecuador, Italy, Malaysia, Mexico, and Netherlands ..................... 553.3g Nethcrland Antilles, Norway, Puerto Rico, Russia, Spain, and Trinidad and "l'_bago .. 563.3h United Kingdom, Virgin Islands, ()tiler Non-OPI:,C, Total Non-_)Pl';( ', and "lk_tal
hnports .................................................................... 573.4 I:inished Motor Gasoline Supply and l)isposition ........................................ 593.5 Distillate Fuel Oil Supply and Disposition .............................................. 613.6 Residual Fuel Oil Supply and Disposition .............................................. 633.7 Jet Fuel Supply and Disposition ....................................................... 653.8 1Aquefied Petroleum Gases Supply and Disposition ...................................... 673.9 Propane and Propylene Supply and Disposition ......................................... 693.10 Other Petroleum Products Supply and Disposition ....................................... 70
Section 4. Natural (,as4.1 Natural Gas Production .............................................................. 75
4.2 Natural Gas Supply and l)isposilion .................................................. 764.3 Natural Gas Trade by Country ........................................................ 774.4 Natural Gas Constlmpticm by Ii:.nd-tlse Sect_>r . .......................................... 784.5 Natural Gas in []ndcrgr(mnd Storage ................................................... 79
Section 5. ()il anti (;as Res_urce l)evehq_ment5.1 ()il and Gas Drilling Activity Mcasurcmexlts ............................................ 845.2 Oil and Gas Wells Drilled ............................................................ 85
iv EnergyInformationAdministration/MonthlyEnergyReviewDecember1993
Tables (Continued)
Section 6. Coal Page6.1 Coal Overview ...................................................................... 89
6.2 Coal Consumption by End-Use Sector ................................................. 906.3 Coal Stocks, End of Period ........................................................... 91
Section 7. Electricity7.1 Electric Utility Net Generation of Electricity ............................................ 977.2 Electricity Sales by End-Use Sector ................................................... 997.3 Electric Utilitiy Consumption of Fossil Fuels to Generate Electricity ....................... 1017.4 Electric Utility Stocks of Coal and Petroleum, End of Period ............................. 102
Section 8. Nuclear Energy8.1 Nuclear Power Plant Operations ....................................................... 1078.2 Nuclear Generating Units, End of Period ............................................... 108
i
Section 9. Energy Prices9.1 Crude Oil Price Summ,'u'y ............................................................ 1139.2 F.O.B. Cost of Crude Oil hnports from Selected Countries ............................... 1149.3 Landed Cost of Crude Oil Imports from Selected Countries ............................... 1159.4 Motor Gasoline Retail Prices, U.S. City Average ........................................ 1169.5 Refiner Prices of Residual Fuel Oil .................................................... 1179.6 Refiner Prices of Petroleum Products for Resale ......................................... 1189.7 Refiner lh'ices of Petroleum Products to End Users ...................................... 1199.8 No. 2 Distillate lh'ices to Residences
9.8a Northeastern States .......................................................... 1209.8b Selected South Atlantic and Midwestem States .................................. 121
9.8c Selected Western States and U.S. Average ...................................... 1229.9 Electricity Retail Prices .............................................................. 1249.10 Quantity and Cost of Fossil-Fuel Receipts at Ste,'un-Electric Utility Plants .................. 1259.11 Natural Gas Prices .................................................................. 127
Section 10. International Energy10.1 World Crude Oil Production
10.1a Algeria Through Venezuela ................................................... 13210.1b "lbtal OPEC, Canada Through Former U.S.S.R., and World ....................... 133
10.2 Petroleum Consumption in OECD Countries ............................................ 13710.3 Petroleum Stocks in OECD Countries, End of Period .................................... 13910.4 Nuclear Electricity Gross Generation
10.4a Argentina Through India ..................................................... 14110.4b Italy Through Spain ......................................................... 14210.4c Sweden Through United States and Total ....................................... 143
Appendix A. Thermal Conversion FactorsA1. Approximate Heat Content of Petroleum Products ....................................... 145A2. Approximate Heat Content of Crude Oil, Crude Oil and Products, and Natural Gas Plant Liquids 146A3. Approximate Heat Content of Petroleum Product Weighted Averages ....................... 146A4. Approximate Heat Content of Natural Gas .............................................. 147A5. Approxtmate Heat Content of Coal .................................................... 147A6. Approxunate Heat Content of Bituminous Coal and Lignite ............................... 148A7. Approximate Heat Content of Anthracite and Coal Coke ................................. 148AS. ApproxHnate Heat Rates for Electricity ................................................ 149
Appendix B. Metric and Other Physical Conversion FactorsB1. Metric Conversion Factors ............................................................. 155
B2. Other Physical Conversion Factors .................................................... 156B3. Metric Prefixes ..................................................................... 156
EnergyInformationAdministration/MonthlyEnergyReviewDecember1993 v
Figures
Section 1. Energy Overview Page1.1 Energy Overview .................................................................... 61.2 Energy Production ................................................................... 81.3 Energy Consumption ................................................................. 101.4 Energy Net Imports ................................................................. 121.5 Merchandise Trade Value ............................................................. 14
1.6 Energy Consumption per Dollar of Gross National Product ............................... 161.7 U.S. Dependence on Petroleum Net Imports ............................................ 171.8 Cost of Fuels to End Users ill Constant (1982-1984) Dollars .............................. 181.9 Passenger Car Efficiency ............................................................. 19
Section 2. Energy Consumption2.1 Energy Consumption by End-Use Sector ............................................... 262.2 Residential eald Commercial Energy Consumption ....................................... 282.3 Industrial Energy Consumption ........................................................ 302.4 Transportation Energy Consumption ................................................... 322.5 Energy Input at Electric Utilities ...................................................... 34
Section 3. Petroleum3.1 Petroleum Overview ................................................................. 463.2 Finished Motor Gasoline ............................................................. 583.3 Distillate Fuel ...................................................................... 603.4 Residual Fuel ....................................................................... 623.5 Jet Fuel ............................................................................ 64
3.6 Liquefied Petroleum Gases ........................................................... 663.7 Propane and Propylene ............................................................... 68
Section 4. Natural Gas4.1 Natural Gas ........................................................................ 74
Section 5. Oil and Gas Resource Development5.1 Oil and Gas Resource Development Indicators .......................................... 83
Section 6. Coal6.1 Coal ............................................................................... 88
Section 7. Electricity7.1 Electric Utility Net Generation of Electricity ............................................ 967.2 Electricity Sales ..................................................................... 987.3 Electric Utility Consumption and Stocks of Fossil Fuels .................................. 100
Section 8. Nuclear Energy8.1 Nucle,'u" Power Plant Operations ....................................................... 106
Section 9. Energy Prices9.1 Petroleum Prices .................................................................... 112
9.2 Electricity Retail Prices .............................................................. 1239.3 Cost of Fossil-Fuel Receipts at Ste,'un-Electric Plants .................................... 1239.4 Natural Gas Prices .................................................................. 126
Section 10. International Energy10.1 Crude Oil Production ................................................................ 134
10.2 Crude Oil Production by Selected Country ............................................. 13510.3 Petroleum Consumptiol_ in OECD Countries ............................................ 13610.4 Petroleum Stocks in OECD Countries .................................................. 138
10.5 Nuclear Electricity Gross Generation: .................................................. 140
vi EnergyInformationAdministration/MonthlyEnergyReviewDecember1993
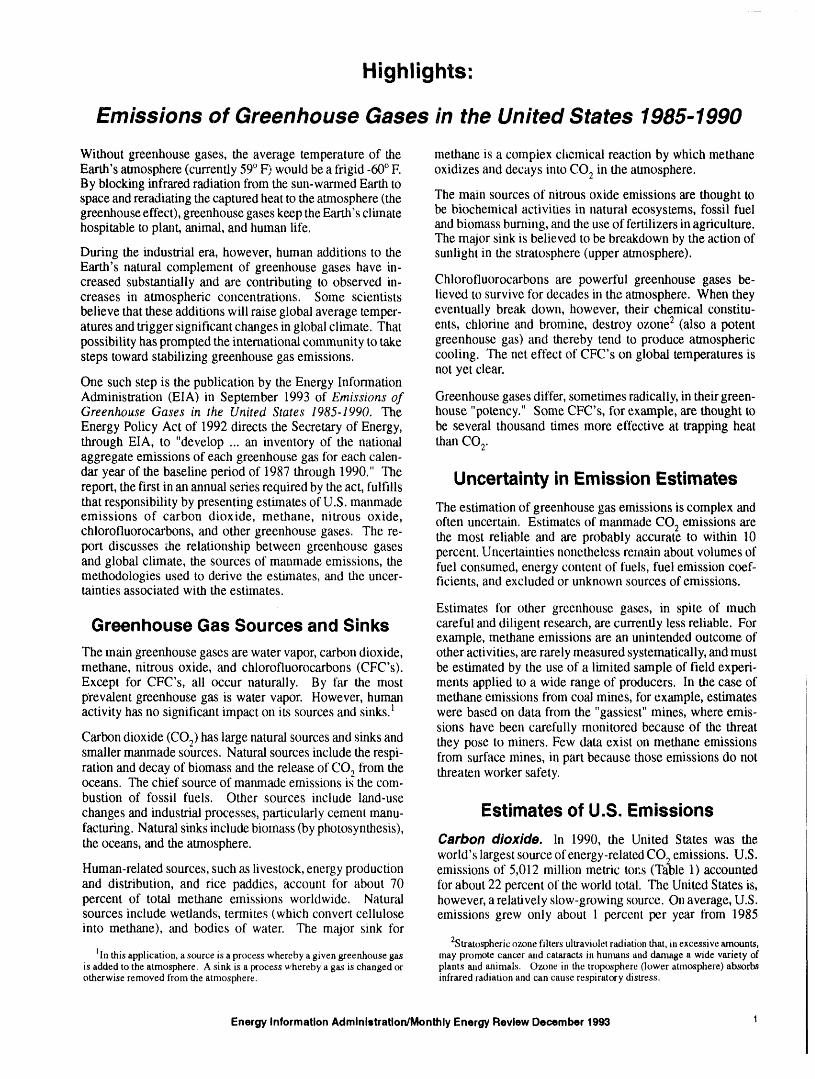
Highlights:
Emissions of Greenhouse Gases in the United States 1985-1990
Without greenhouse gases, the average temperature of the methane is a complex chemical reaction by which methane
Earth's atmosphere (currently 59° F) would be a frigid -60° E oxidizes and decays into CO 2 in the atmosphere.By blocking infrared radiation from the sun-wanned Earth tospace and reradiating the captured heat to the atmosphere (the The main sources of nitrous oxide emissions are thought togreenhouse effect), greenhouse gases keep the Earth's climate be biochemical activities in natural ecosystems, fossil fuelhospitable to plant, animal, and human life. and biomass burning, and the use of fertilizers in agriculture.
The major sink is believed to be breakdown by the action ofDuring the industrial era, however, human additions to the sunlight in the stratosphere (upper atmosphere).Earth's natural complement of greenhouse gases have in-creased substantially and are contributing to observed in- Chlorofluorocarbons are powerful greenhouse gases be-creases in atmospheric concentrations. Some scientists lieved to survive for decades in the atmosphere. When theybelieve that these additions will raise global average temper- eventually bre_ down, however, their chemical constitu-atures and trigger significant changes in global climate. That ents, chlorine and bromine, destroy ozone 2 (also a potentpossibility has prompted the international community to take greenhouse gas) and thereby tend to produce atmosphericsteps toward stabilizing greenhouse gas emissions, cooling. The net effect of CFC's on global temperatures is
not yet clear.One such step is the publication by the Energy InformationAdministration (EIA) in September 1993 of Emissions of Greenhouse gases differ, sometimes radically, in their green-Greenhouse Gases in the United States 1985-1990. The house "potency." Some CFC's, for example, are thought toEnergy Policy Act of 1992 directs the Secretary of Energy, be several thousand times more effective at trapping heatthrough EIA, to "develop ... an inventory of the national than CO 2.aggregate emissions of each greenhouse gas for each calen-
•dar year of the baseline period of 1987 through 1990." The Uncertainty in Emission Estimatesreport, the first in an annual series required by the act, fulfills
that responsibility by presenting estimates of U.S. manmade The estimation of greenhouse gas emissions is complex and
emissions of carbon dioxide, methane, nitrous oxide, often uncertain. Estimates of manmade CO 2 emissions arechlorofluorocarbons, and other greenhouse gases. The re- the most reliable and are probably accurate to within 10port discusses the relationship between greenhouse gases percent. Uncertainties nonetheless remain about volumes ofand global climate, the sources of manmade emissions, the fuel consumed, energy content of fuels, fuel emission coef-methodologies used to derive the estimates, and the uncer- ficients, and excluded or unknown sources of emissions.tainties associated with the estimates.
Estimates lor other greenhouse gases, in spite of much
Greenhouse Gas Sources and Sinks careful and diligent research, arecurrently lessreliable. Forexample, methane emissions are an unintended outcome of
The main greenhouse gases are water vapor, carbon dioxide, other activities, are rarely measured systematically, and mustmethane, nitrous oxide, and chlorofluorocarbons (CFC's). be estimated by the use of a limited sample of field experi-Except for CFC's, all occur naturally. By far the most ments applied to a wide range of producers. In the case ofprevalent greenhou_ gas is water vapor. However, human methane emissions from coal mines, for example, estimatesactivity has no significant impact on its sources and sinks. _ were based on data from the "gassiest" mines, where emis-
sions have been carefully monitored because of the threatCarbon dioxide (CO 2) has large _mtural sources and sinks and they pose to miners. Few data exist on methane emissionssmaller manmade sources. Natural sources include the respi- from surface mines, in part because those emissions do notration and decay of biomass and the release of CO 2 from the threaten worker safety.oceans. The chief source of manmade emissions is the com-bustion of fossil fuels. Other sources include land-use
changes and industrial processes, particularly cement manu- Estimates of U.S. Emissionsfacturing. Natural sinks include biomass (by photosynthesis),the oceans, and the atmosphere. Carbon dioxide. In 1990, the United States was the
world's largest source of energy-related CO 2 emissions. U.S.Human-related sources, such as livestock, energy production emissions of 5,012 million metric tot:s (Table 1) accounted
and distribution, and rice paddies, account for about 70 for about 22 percent of the world total. The United States is,percent of total methane emissions worldwide. Natural however, a relatively slow-growing source. On average, U.S.sources include wetlands, termites (which convert cellulose emissions grew only about 1 percent per year from 1985into methane), and bodies of water. The major sink for
2Stratospheric ozone filters ultraviolet radiation that, in excessive amounts,l ln this application, a source is a process whereby a given greenhouse gas may promote ca,lcer and cataracts in hunums and damage a wide variety of
is added to the atmosphere. A sink is a process whereby a gas is changed or plants aad animals. Ozone in the trt_osphere (lower atmosphere) absorbsotherwise removed from the atmosphere, infrared radiation and can cause respiratory distress.
Energy Information Admlni=tration/Monthly Energy Review December 1993 1
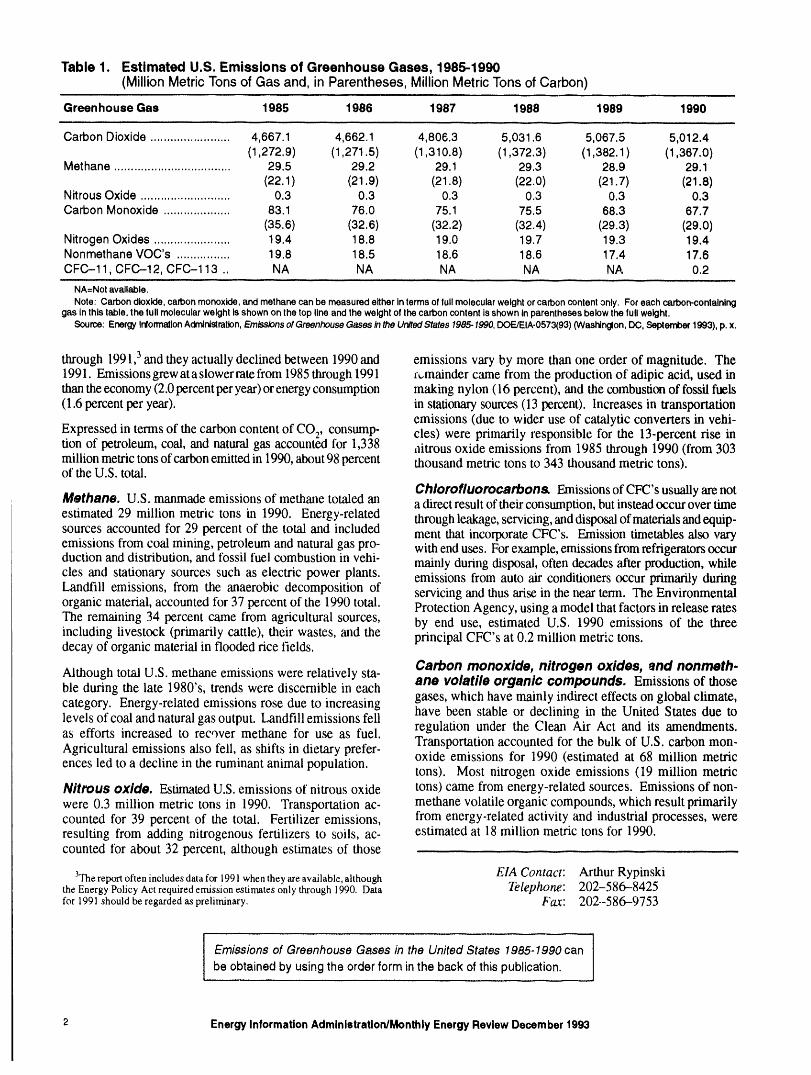
Table 1. Estimated U.S. Emissions of Greenhouse Gases, 1985-1990(Million Metric Tons of Gas and, in Parentheses, Million Metric Tons of Carbon)
Greenhouse Gas 1985 1986 1987 1988 1989 1990
CarbonDioxide........................ 4,667.1 4,662.1 4,806.3 5,031.6 5,067.5 5,012.4(1,272.9) (1,271.5) (1,310.8) (1,372.3) (1,382.1) (1,367.0)
Methane ................................... 29.5 29.2 29.1 29.3 28.9 29.1(22.1) (21.9) (21.8) (22.0) (21.7) (21.8)
Nitrous Oxide ........................... 0.3 0.3 0.3 0.3 0.3 0.3Carbon Monoxide .................... 83.1 76.0 75.1 75.5 68.3 67.7
(35.6) (32.6) (32.2) (32.4) (29.3) (29.0)Nitrogen Oxides ....................... 19.4 18.8 19.0 19.7 19.3 19.4Nonmethane VOC's ................ 19.8 18.5 18.6 18.6 17.4 17.6CFC-11, CFC-12, CFC-113 .. NA NA NA NA NA 0.2
NA=Notavailable.
Note: Carbondloxlde,carbonmonoxide,and methanecanbe measuredeitherintermsof fullmolecularweightor carboncontentonly. Foreachcarbon-containinggas Inthistable, the full molecularweight Isshownon the toplineandthe weightofthe carboncontentIs shownInparenthesesbelowthe fullweight.
Source: EnergyIr_ormatlonAdrntnistratlon,Emissionsof GreenhouseGasesIn the UnltedStates1985.1990,DOE/EIA-0573(93)(Washington,De, September1993),p. x.
through 1991, 3and they actually declined between 1990 and emissions vary by more than one order of magnitude. The1991. Emissions grew at a slower rate from 1985through 1991 __.mainder came from the production of adipic acid, used inthan the economy (2.0 percentper year) orenergy consumption making nylon (16 percent), and the combustion of fossil fuels(1.6 percent per year), in stationary sources (13 percent). Increases in transportation
emissions (due to wider use of catalytic converters in vehi-Expressed in terms of the carbon content of CO 2, consump- cles) were primarily responsible for the 13-percent rise intion of petroleum, coal, and natural gas accounted for 1,338 ,litrous oxide emissions from 1985 through 1990 (from 303million metric tons of carbon emitted in 1990, about 98 percent thousand metric tons to 343 thousand metric tons).of the U.S. total.
Chlorofluorocarbon_ Emissions of CFC's usually are notMethane. U.S. manmade emissions of methane totaled an a direct result of their consumption, but instead occur over timeestimated 29 million metric tons in 1990. Energy-related thr°ugh leakage' servicing' and disp°sal °fmaterials and equip"sources accounted for 29 percent of the total and included ment that incorporate CFC's. Emission timetables also varyemissions from coal mining, petroleum and natural gas pro- with end uses. For example, emissions from refrigerators occurduction and distribution, and fossil fuel combustion in vehi- mainly during disposal, often decades after production, whilecles and stationary sources such as electric power plants, emissions from auto air conditioners occur primarily duringLandfill emissions, from the anaerobic decomposition of servicing and thus arise in the near tenn. The Environmentalorganic material, accounted for 37 percent of the 1990 total. Protection Agency, using a model that factors in release ratesThe remaining 34 percent came from agricultural sources, by end use, estimated U.S. 1990 emissions of the threeincluding livestock (primarily cattle), their wastes, and the principal CFC's at 0.2 million metric tons.decay of organic material in flooded rice fields.
Carbon monoxide, nitrogen oxides, _nd nonmeth-Although total U.S. methane emissions were relatively sta-ane volatile organic compounds. Emissions of thoseble during the late 1980's, trends were discernible in each
category. Energy-related emissions rose due to increasing gases, which have mainly indirect effects on global climate,levels of coal and natural gas output. Landfill emissions fell have been stable or declining in the United States due toas efforts increased to recover methane for use as fuel. regulation under the Clean Air Act and its amendments.
Agricultural emissions also fell, as shifts in dietary prefer- Transportation accounted for the bulk of U.S. carbon mon-oxide emissions for 1990 (estimated at 68 million metricences led to a decline in the ruminant animal population, tons). Most nitrogen oxide emissions (19 million metricNitrous oxide. Esfmaated U.S. emissions of nitrous oxide tons) came from energy-related sources. Emissions of non-
were 0.3 million metric tons in 1990. Transportation ac- methane volatile organic compounds, which result primarilycounted for 39 percent of the total. Fertilizer emissions, from energy-related activity and industrial processes, wereresulting from adding nitrogenous fertilizers to soils, ac- estimated at 18 million metric tons for 1990.counted for about 32 percent, although estimates of those
3The report often includes data for 1991 when they are available, although EIA Contact: Arthur Rypinskithe Energy Policy Act required emission estimates only through 1990. Data Telephone: 202-586-8425for 1991 should be regarded as preliminary. /;'(.iX: 202--586-9753
Emissions of Greenhouse Gases in the United States 1985-1990can
be obtained by using the order form inthe back of this publication.
2 EnergyInformationAdministration/MonthlyEnergyReviewDecember1993

Highlights:
Assessment of Energy Use in Multibuilding Facilities
The initial objectives of the Energy Information Admmistra- CBECS, was designed to detennme tile best way to measuretion's (EIA) pilot survey of multibuilding facilities were to energy consumption in tho_ buildings.improve Conunercial Buildings Energy Consumption Survey 1(CBECS) estimates of district beat2 constunption in commer- Facility Characteristics. The survey gathered uselul datacial buildings that lacked individual metering _md to estmmte on the function, size, and other characteristics of multibuild-p_nary fuel consumption by central physical plaints that pro- ing facilities, defined as "two or more buildings on the same
site owned or o|mrated by a single organization, business, orvide energy to commercial buildings. These objectives wereindividual." Because the facility survey was an adjunct tolater expanded to estimate the mnounts m_d lbnns of energy
consumed (inputs) and the amounts of energy produced (out- CBECS, the facilities surveyed each had at least one commer-puts) at central physical plants m_d to es_nate the extent to cial building. 3 The principal activity of the facility as a wholewhich these buildings engage m cogeneration, may or may not be commercial. The types of multibuilding
facilities with the most conunercial floorspace were offices;
• ) .4Although largely unsuccessful in its initial objectives, the "other sch( ols ; colleges and universities; warehouses;pilot survey nevertheless yielded valuable data on the char- shopping centers and malls; industrial facilities; and hospi-acteristics of those facilities. The survey, which targeted teas. Each of these facility categories encompassed more thanmultibuilding facilities with at least one commercial build- 2 billion square feet of commercial floorspace in 1989.ing and a central physical plant that provides energy to the
Some types of tacilities were more likely than others to havefacilities, sought to gather more accurate information oncentral physical plants. Among hospitals, 79 percent of thedistrict heating and cooling and cogeneration. The survey's
findings, discussed in Assessment of Energy Use in Multi- fl(x)rspace :.ncommerdal buildings was located at t'acilities withbuilding Facilities, include the following: central physical plants. Slightly more till hall"(52 percent) of
the commerc'ud fl(x)rspace at industrial faolities was located at
• In 1989, one third of all commercial buildings and 41 such lacilities. In contrast, warehouse f,_ilities, shopping centers,percent of all co]mnercial floorspace were located m religious facilities, entertaimne,t complexes, and hotels and mo-multibuilding facilities (Table 1). tels were unlikely to have cenlral physical p_ts. At both "other
schools" and office buildings, 21 percent of the colrunercial
• Although only 4 percent of all commercial buildings flcx)rspacewas located at facilities with central physical plants.
were situated in multibuilding facilities with central Ofallofthemultibuildingfacilitieswithacentralphysicalplantphysical plants, those buildings accounted for 13 per- and at least some co_mnercial activities, it is estimated that 42cent of all commercial floorspace and for 28 percent ofall commercial energy consumption in 1989. percent of the facilities are classified in the commercial sector,whereas the remainder are classified in the industrial ,sector
Because cormnercial buildings in multibuilding t'acilities ac- (Figure 1). The cotmnercial sector buildings accounted [br 55count for a disproportionately large share of energy consump- percent of the lltx)rspace contained in multibuilding facilitiestion, it is important to measure energy consumption in those with central physical plants.
buildings. The existing CBECS focuses on individual build. • Overall, 32 percent of 'all multibuilding facilities withings, and it is theretbre fi'equently difficult, using CBECS data, central plants, and 52 percent of such commercial facili-to measure energy use by the interrelated buildings in multi- ties, had four or fewer buildings. The largest facilities inbuilding facilities. The facility survey, an adjunct to the 1989 the sample contained more than 1 thous_mdbuildings.
IThe CBECS report, published every 3 years, is the primary source ofenergy data for commercial buildings in the United States. EIA also pub- . Alnong such conunercial facilities, the largest werelishes statistics on energy consumption by end users in the residential, colleges and universities (1.4 million square feet perresidential transportation (personal vehicle) and manufacturing sectors.
3A2District heating is the use of steam or hot water from an outside source commercial building, as defined by CBECS, is one in which more than
to heat a building. District cooling is the use of chilled water from an outside 50_ercent of the floorspace is used for commercial purposes.source to cool a building. Mainly elementary and secondary schools.
Table 1. Commercial Buildings in Multibuilding Facilities, 1989
Number of Buildings Floorspace Energy Consumption=Type of Commercial Building (thousand) (million square feet) (trillion Btu)
All Buildings ............................................................ 4,528 63,184 5,788Buildings in Multibuilding Facilities
without Central Physical Plants .......................... 1,497 25,947 2,901Buildings in Multibuilding Facilities
with Central Physical Plants ................................ 203 8,346 1,593
aElectrlclly, natural gas, fuel o11,and dlslricl heal (steam and hot waler).Source: Energy Inlormallon Admlnistrallon, Assessment of Energy Usein MuttlbulldingFacilities,DOE/EIA-0555(93)/1(Washington,DC,Augusl 1993),p, vl.
Energy Information Administration/Monthly Energy Review December 1993 3
Figure 1. Number of Multibuilding Facilities with a Central Physical Plant and Average Floorspace perFacility by Principal Facility Activity, 1989
2.267 WE College and University 1,393
6.244 __ Other School l 114
0.947 _ Office ___I__ 805
1.165 _., Other a _ 374
17.241 Industrial __l 298
! ' 1'6 1', ' " I_ ' ' 2 (_ " () () ' ' '20 18 12 10 6 4 0 0 2 0 400 6 0 8 0 1,000 1,200 1,400 1,600
Number of Facilities (thousands) Floorspace per Facility (thousand square feet)
a"other" Includesshoppingcentersandmalls,hotelsand motels,entertainmentcomplexes,warehouses,andreligiousfacilities.Source: EnergyInformationAdministration,Assessmentof Energy Use/n Mutt/bu//d/ngFacM/es, DOF_JEIA-0555(93)/1(Washington,DC, August1993),pp.16and 17.
facility), while the smallest were "other schools" (114 Cogeneration. Cogeneration is the combined productionthousand square feet per facility), of electric power and another form of useful energy (such as
heat or steam) by a single process. Earlier efforts failed toEnergy Consumption. The facility survey attempted to collect cogenerat;,on data, because large physical plantcollect data on the amounts and forms of central plant con- buildings were classified as industrial buildings and weresumption (inputs)and production (outputs). The most serious therefore out of the scope of CBECS. However, due toproblem for input data was that survey respondents reported nonresponses and reporting errors, even the facility surveyfacility-wide consumption rather than central physical plant was unable to identify much more cogeneration activity thanconsumption. In cases where building-level data were lacking, previous CBECS had identified. The facility survey didfacility-level output data also were unavailable, reveal that the incidence of cogeneration systems declined
with decreasing facility size.In addition to the findings mentioned earlier about the
prevalence of multibuilding facilities among commercial The Future of the Facility Survey. The quality of thebuildings and the disproportionate use of energy by multi- facility survey data was a critical factor in determining whetherbuilding facilities with central physical plants, other key to continue, modify, or discontinue the survey. In terms of itsfindings include the following: main objectives, the 1989 facility survey was largely unsuc-
cessful, due in large part to the many data and reporting• Roughly three-quarters of the commercial floorspace problems encountered. Accurate estimates of primary fuel
with district heating or cooling is served by a central consumption by central plants could not be produced due to thephysical plant within the multibuilding facility itself, small sample size, the widespread inability of respondents to
• Buildings in multibuilding facilities (with or without provide good data, and the considerable amount of inherentcentral physical plants) accounted for 50 percent (2.9 variation in the population. Only 35 percent of the eligible
facilities responded with complete data. Another 32 percentquadrillion Btu) of the energy con3amed in all commer-cial buildings in 1989. That amount included 49 percent provided only incomplete information.
oftheelectricity,44percentofthenaturalgas, 34 percent Although the facility survey will not be repeated, the 1989of the fuel oil, and 90 percent of the district heat. survey significantly raised awareness of the importance of
• In 1989, commercial buildings in facilities with c.entral energy consumption in multibuilding facilities. To the ex-tent that the facility, rather than the individual building, isphysical plants consumed 1.6 quadrillion Btu of en-
ergy, accounting for 55 percent of the energy con- targeled for cost-saving measures, facilities represent asumed by all multibuilding facilities, fruitt'ul area for future work on conservation and energy
management.
• The most common energy input was natural gas, whichwas used at 64 percent of the central plants. Fuel oil EIA Contact: Eugene M. Burnsand electricity were each used at about half of the Telephone: 202-586-1125remaining central plants. Fax: 202-586-0018
Assessment of Energy Use in Multibuilding Facilities can beobtained by using the order form inthe back of this publication.
4 Energy Information Administration/Monthly Energy Review December 1993
Section 1. Energy Overview
Energy production during September 1993 totaled 5.4 consumption increased 6.8 percent, petroleum con-quadrillion Btu, a 1.0-percent decrease from the level sumption rose 4.9 percent, and coal consumption wasof production during September 1992. Petroleum up 0.9 percent. Consumption of all other forms ofproduction decreased 3.5 percent, coal production energy combined decreased 0.6 percent from the leveldecreased 1.1 percent, and natural gas production in- 1 year earlier.creased 1.5 percent. All other forms of energyproduction combined were down 1.0 percent from thelevel of production during September 1992. Net imports of energy during September 1993 totaled
1.4 quadrillion Btu, 13.8 percent above the level of netimports 1 year earlier. Net imports of petroleum
Energy consumption during September 1993 totaled 6.6 increased 3.4 percent, and net imports of natural gasquadrillion Btu, 3.7 percent above the level of con- were up 19.5 percent. Net exports of coal fell 40.0sumption during September 1992. Natural gas percent from the level in September 1992.
Table 1.1 Energy Summary for September 1993(Quadrillion Btu)
i i illlll i
September Cumulative January Through September
1603 11)92Percent Dally Oslly Percent
1993 1992 Changea 1093 Rate 1992 Rate Changea,, ,, , ,,,
ProducUon b ........................... $.392 5.445 -1.0 49.420 0.181 SO.O02 0.182 .0.8Coal ................................. 1.794 1.813 -1.1 15.444 .057 16,207 ,059 -4,4NaturalGas (Dry) ............... 1.503 1.481 1.5 14.011 .051 13.612 .050 3.3Petroleumc .......................... 1.364 1.413 -3.5 12.635 .046 13.196 .048 -3.9Otherd .................................. 731 .739 -1,0 7.330 .027 8.987 .025 5.3
Consumption b ....................... 6.593 6.361 3.7 62.635 .226 61.036 .2_Y_ 3.0Coal .................................... 1.599 1.565 .9 14.729 .054 14.145 .052 4,5Natural Gas• ....................... 1.374 1.286 6.8 15.321 .058 14.817 .054 3.8Petroleum ........................... 2,856 2.722 4,9 25.032 .092 24.862 .091 1.1OtherI ................................... 763 .768 o.6 7.552 .028 7.212 .026 5.1
Net Import= ............................ 1,406 1.237 13.8 12.367 .046 10.7611 .036 1S.1Coalg .................................. -.141 -.235 -40.0 -1,389 -.005 -1.981 -.007 -29.6Natural Gas ......................... 179 .149 19.5 1,564 .006 1395 .005 12.5Petroleumh ......................... 1.338 1.294 3.4 11.969 .044 11.149 .041 7.8Othe_ ................................... 032 ,029 11.3 .222 .001 .225 .001 -.9
i i i| ii
a Based on daily rates priorto rounding, f "Or.her- is hydroelectricand nuclear electric power; electricity generatedb Due to a lack o( consistent historical data, s_me renewable energy lor distributionfrom wood, waste, geothermal, wind, photovoltatc,and solar
sources are not included. For example, in 1991, 3.3 quadrillionBlu of thermal energy;and net importsof elecldcttyand coal coke.renewable energy consumed by U.S. electricutilitiesto generate electricityfor g Minussign indicatesexportsare greater than imports.distributionis included, but an estimated 3.4 quadrillion Btu for renewable h Includes crude oil, lease condensate, petroleum products, perCanesenergy used byother sectorsis not included, plus, unfinished oiis, gasolineblendingcomponents,and Importsof crude oil
c Includes crude oil, lease condensate, and naturalgas plant liquids, for the Strategic Petroleum Reserve.d 'Other" is hydroelectric and nuclear electric power, and electricity I "Other"is net imports of electdcltyand coal coke.
generated for distribution from wood, waste, geothermal, wind, pho(ovoltalc, Note: Totals may not equal sum of compor_ents due to independentand solar thermal energy, rounding.
e Includes supplemental gaseous luels. Source3: Tables 1.3, 1,4, and 1.5.
Energy Information Administration 'Monthly Energy Review December 1993 5
Figure 1.1 Energy Overview(Quadrillion Btu)
Consumption, Production, and Imports, 1973-1992
IO0
_ -- .. Consumption _ --75 _
t _ .
Production
50-
25-
.................................... Imports ............................................................. . .... ., . ...... , ............................................... .,, ...................
0 1 i i , i i 1 f' ! i19h 1976 1g'78 19_ 19;2 19'_ 19'_ 19_ 19_ 19_
Consumption, Production, and Imports, Monthly
10
2- Imports.. ............ . ....................................................................................... ..
• ............... .." • . ..........
] , ! i _ i i i l i ! ! I ! = ! = i _ i
o _ '_ ;, ;_ ,; " ^ ; o ;_ ; ; _ _ i M j j , s o . o j F M A M j j A ; ; _ o1991 1992 1993
Overview, September 1993 Net Imports, January-September
10- 1412.367
1_ _o._ i!i!_iiiii!i!iiiiiiii!!i!iiii!iii!iil8 ...................................., iiiiiiiiilii!i!1
6 5.392 : ...." 8 :_:_:_:!:i:_:_:_:_:_:_l
4 ::::::::::::::::::::::::::::::::::::::::::::::::::::::::::::::::
I::!:i_:_i_::::!::.i_!:i:i........................... 0.337 ii#!iii!i!ii!i.................i ::::!i!i::igli::i::i::!ii:i:3:i:i:i:ili:l
0 ..... _ 0 -- _::............; ........Production Consumption Imports _[_rts 1991 1992 1993
Not_: Becausevertical scalesdiffer,graphs shouldnot be compared.Source:Table 1.2.
6 Energy Information Administration/Monthly Energy Review December 1993
Table 1.2 Energy Overview(Quadrillion Btu)
Productlona I Conlumptiona,b 1 Import= J Exports i Ne, lm_m
1973 Total ................................................ 62.060 74.282 14.731 2.051 12.6801974 Total ................................................ 60.835 72.543 14.413 2.223 12.1901975 Total ................................................ 59.860 70.546 14.111 2.359 11.7621978 Total ................................................ 59.892 74.362 16.837 2.18tl 14,6481977 Total ................................................ 60.219 76.288 20.090 2.071 18.019
_.78Total ................................................ 61.103 76.069 19.254 1.931 17.3231979 Total ................................................ 63.801 78.898 19.616 2.870 18.7481980 Total ................................................ 64.761 75.955 15.971 3.723 12.2471981 Total ................................................ 64.421 73.990 13.975 4.329 9.6461982 Total ................................................ 63.962 70,848 12.092 4.833 7.4501963 Total ................................................ 61.279 70.524 12.027 3.717 8.3101964 Total ................................................ 65.962 74.144 12.767 3.804 6.9631986 Total ................................................ 64.871 73.981 12.103 4.231 7.8721986 Total ................................................ 64.3,$0 74.297 14.438 4.055 10.3821987 Total ................................................ 64.952 76.894 15.764 3.853 11.9111988 Total ................................................ 66.105 60.216 17.564 4.41S 13.1491989 Total ................................................ 66.129 81.325 18.947 4.765 14.1611990 Total ................................................ 67.853 81.265 18.987 4.910 14.077
1991 January ............................................ 5,941 7.795 1.483 .397 1.085February .......................................... 5.408 6.643 1.294 .462 .832March ............................................... 5.803 6.893 1.391 395 .996April ................................................. 5.460 6.302 1.462 .326 1.156May .................................................. 5.578 6.394 1.731 .489 1.241June ................................................. 5.429 6.421 1.622 .423 1.199July .................................................. 5.613 6.818 1.593 .457 1.136August ............................................. 5.763 6.798 1.754 .448 1.306September ....................................... 5.450 6.344 1.562 .432 1.130October ............................................ 5.771 6.561 1.562 .432 1.130November ........................................ 5.530 6.740 1.548 .464 1.084December ........................................ 5.708 7.408 1.556 .495 1.062Total ................................................ 67.484 81.116 18.577 6.220 13.357
1992 January ............................................ 5.926 7.684 1.615 .458 1.157February .......................................... 5.421 6.994 1.377 .372 1.006March ............................................... 5.637 7.074 1300 .416 1.084April ................................................. 5.413 6.569 1.639 .413 1.226May .................................................. 5.497 6.440 1.642 .434 1.207June ................................................. 5,468 6.408 1.610 ,426 1,183July .................................................. 5.594 6.828 1.770 .441 1.329August ............................................. 5.601 6.678 1.727 367 1.380September ....................................... 5.445 6.361 1.654 .417 1.237October ............................................ 5.647 6.595 1.762 .3&3 1399November ........................................ 5.485 6,802 1.650 ,428 1.221December ........................................ 5.799 7.771 1.688 .462 1.226Total ................................................ 66.933 82.203 19.652 5.016 14.634
I f_93January ............................................ 5.775 7,698 1.695 398 1.297February .......................................... 5,218 7.216 1330 ,3_?. 1.168March ............................................... 5.684 7.557 1.763 347 1.416April ................................................. 5.434 6.634 1.719 ,344 1.376May .................................................. 5.474 6.396 1,722 382 1340June ................................................. R5.523 R6.573 1.767 .406 1.361July .................................................. R5.410 R7.009 1.914 .375 1.540August ............................................. R5.510 R6.959 1,779 ,317 1.462September ....................................... 5.392 6.593 1.745 337 1.408e-Month Total ................................. 49.420 62.635 15.635 3.268 12.367
1982 S-Month Total ................................. 50.002 61.035 14.532 3.744 10.7981991 e-Month Total ................................. 50.475 50.408 13.910 3.629 10.081•L i i i i ..ll i ..i i . i
a Due Io a lack of consistent histoncal data, some renewable energy Forces in Europe; and adjustments Io account for discrepancies betweensources are no( included. For example, in 1991, 3.3 quadrillion Btu ot reportingsystems.renewable energy consumedby U.S. electdc utilitiesto generate e_ectricilyfor R=Revised dala.distribution is included, bul an estimated 3.4 quadrillion Blu ol renewable No(es: * For definitions, see Notes 1 through 4 at end ol section.en?rgy used byo(her sectorsis no( included. • Geogral:Piccoverage is the 50 States and the Distdct ol Columbia. • Totals
u The sum ot domestic energy productionand net importsof energy does may nol equal sumof componentsdue to Independenl rounding.no( equal domestic energy consumption. The difference is attributedto stock Sources: • Production: Tabte 1.3. * Consumption: Table 1.4. • Import=changes; lossesand gains in conversion,transportation,and distribution; the and Export=: Tables 3.1b, 4.2, 6.1, A2-A8, and Section 2, 'Energyaddition of blending compounds; shipments ol anthracite to U.S. Armed Consumption Notesand Sources,"Notes 8 and 9. • Net Imports: Table 1,5.
Energy Information Administration/Monthly Energy Review December 1993 7
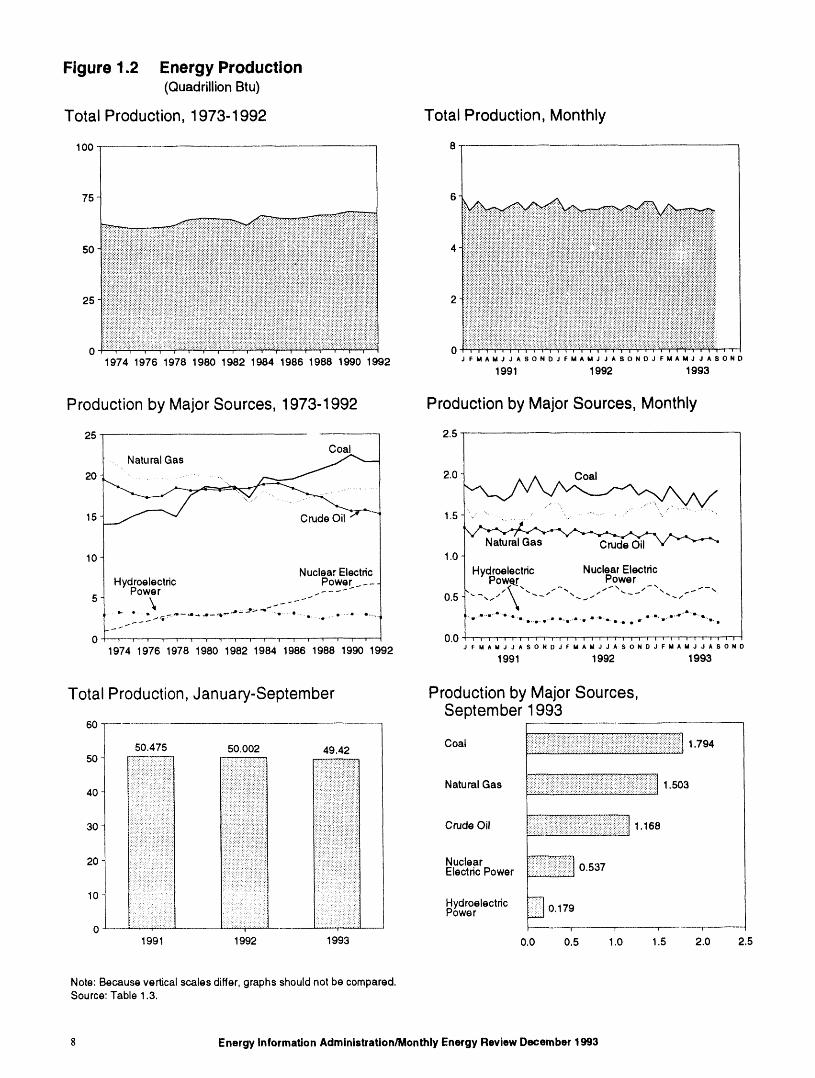
Figure 1.2 Energy Production(Quadrillion Btu)
Total Production, 1973-1992 Total Production, Monthly
100 8
75 6
50 4
25 2
1974 1976 1978 1980 1982 1984 1986 1988 1990 1992 FMAMJ JASONDJ FMAMJ J ASONDJ FMAMJJ ASOND1991 1992 1993
Production by Major Sources, 1973-1992 Production by Major Sources, Monthly
25 2.5Coal
20 2.0
15 _ 1.5 ...................... . " " ................ " ..... _-........."..........
NaturalGas CrudeOil10 1,0
Nuclear Electric Hydroelectric Nuclear ElectricHy_oelectdc Power.... I-'ow_ _ower
5 1 kw°wer ..- - --- _ ",,. ,0.5 ,,,." " - -,"
._.. .4l._ -- _- "- " • .t ' • ...o • ....... i'_ l'rl° • .11 • ,i I• i,,t, I . i I,,v/,i ,ll, • • .! q',.w, ii
0 ," , , I 0.01 ..................................1974 1976 1978 1980 1982 1984 1986 1988 1990 1992 FUAUJ JASO.DJ_UAMJ JASONDJFUA.J JASONO
1991 1992 1993
Total Production, January-September Production by Major Sources,September 1993
60
o.oo co , i:ilZ!i !!! ii!i !iiliiiii!iiiiiii!ii!!iiii!iiiiil,. -i:_i_ii!!:::i:::iiii_i::_i_i_:.:: Natural Gas 1.503
i;!i::,ii::i::i::}:!:iiiii_i::i::!::i!!'-:.:r:-:,'.:: :,:.:.:.:.:+:..- ,, ,,,., ,.,, •, ,.,,,
20 _:_:'_:i_'_'_:"i': '_',_:::_!i!i_',!i:',_i_iii_::i::_::!::_l_::'........................... i_i'_ii_I=========================== :: i ::::10 ::!: :;: :i:: . :...i :::!::i!::i] :!::::::::::::i::iii!::::i::::ii:i :i::.i::::i i ::.i::!:/::!i Hydroelectric O.179
1991 1992 1993 LO 0,5 1,0 1.5 2.0 2.5
Note: Becausevertical scales differ, graphs should not be compared.Source: Table 1.3.
8 Energy Information Administration/Monthly Energy Review December 1993
Table 1.3 Energy Production by Source(Quadrillion Btu)
i,,11
Natural Natural Nuclear Hydro-Gas Crude Gas Plant Electric electric
Coal (Dry) O11a Liquids Power Powerb Otherc Totald
1973 Total ........................ 13.993 22.187 19.493 2.569 0.910 2,861 0.046 62,0601974 Total ........................ 14,074 21.210 18.575 2.471 1.272 3,177 .056 60.8351975 Total ........................ 14.990 19,640 17.729 2,374 1.900 3,155 .072 59.8601976 Total ........................ 15.654 19.480 17.262 2.327 2.111 2,976 .061 59,6921977 Total ........................ 15.755 19.565 17.454 2.327 2.702 2,333 .082 60.2101978 Total ........................ 14.910 19.485 18.434 2.245 3.024 2,937 .068 61.1031979 Total ........................ 17.539 20.076 18.104 2,286 2.776 2.931 .089 63.8011980 Total ........................ 18.597 19.908 18.249 2.254 2.739 2.900 .114 64.7611981 Total ........................ 18.376 19.699 18.146 2.307 3.008 2,758 .127 64.4211982 Total ........................ 18.639 18.319 18.309 2.191 3.131 3.266 .108 83.9621963 Total ........................ 17.246 16,593 18.392 2.184 3.203 3,527 ,133 61,2791964 Total ........................ 19.719 18.008 18.848 2.274 3.553 3,386 .174 65.9621985 Total ........................ 19.325 16.980 18.992 2.241 4.149 2,970 .213 64.8711986 Total ........................ 19.510 16.541 18.376 2.149 4.471 3.071 .232 64,3501987 Total ........................ 20.142 17,136 17.675 2.215 4.906 2.635 .245 64.9521988 Total ........................ 20.737 17.599 17.279 2.260 5.661 2.334 .235 66.1051989 Total ........................ 21.345 17.847 16.117 2.158 5.677 2.767 .217 66.1291990 Total ........................ 22.456 18.362 15.571 2.175 6.161 2,926 .202 67.853
1991 January .................... 1.870 1.658 1.348 .194 .584 .269 .017 5.941February .................. 1.800 1.459 1.240 .181 314 .229 .014 5.438March ....................... 1.853 1.581 1357 .199 .528 .270 .016 5.803APrU ......................... 1.727 1.506 1.306 .190 .447 .269 .015 5.460May .......................... 1.739 1.497 1.332 .196 302 .298 .015 5.578June ......................... 1.673 1.427 1.274 .186 .582 .271 .016 5.429July .......................... 1.738 1.4.41 1.321 .191 .652 .254 .016 5.613August ..................... 1.937 1.447 1.315 .192 .628 .228 .016 5.763Seplemher ............... 1.777 1.440 1.282 .185 .557 .193 .015 5.450October .................... 1.969 1.554 1.337 .199 .512 .184 .016 5.771November ................ 1.782 1.574 1.275 .194 .497 .192 .017 5.530December ................ 1.730 1.645 1.312 .199 .576 .229 .017 5.708Total ........................ 21.594 18,229 15.701 2.306 6.579 2.885 .191 67.484
1992 January .................... 1.906 1.633 1.323 .199 .621 .226 .017 5.926February .................. 1.780 1.440 1.243 .187 .567 .189 .015 5.421March ....................... 1.861 1.519 1.321 .200 .492 .226 .017 5.637April ......................... 1.787 1.491 1.269 .193 .454 .204 .015 5.413May .......................... 1.739 1.529 1.289 .200 .490 .234 .016 5.497June ......................... 1.735 1.488 1.247 .194 .550 .238 .016 5.468,July .......................... 1.753 1.536 1.282 .198 .602 .207 .016 5.594August ..................... 1.832 1.495 1.245 .193 .630 .189 .017 5.601September ............... 1.813 1.481 1.223 .189 .547 .177 .015 5.445October .................... 1.872 1.579 1.281 .203 .524 .172 .016 5.647November ................ 1.741 1.559 1.222 .200 .545 .202 .016 5.485December ................ 1.801 1.626 1.277 206 .624 .249 .016 5.799Total ........................ 21.522 18.375 15.223 2,363 6,546 2.513 .192 66.933
1993 January .................... 1.751 1.654 1.260 .204 .634 .256 .016 5.775February .................. 1.660 1.467 1.130 .188 .551 .207 .015 5.218March ....................... 1.844 1.610 1.254 .212 .501 .247 .016 5.684April ......................... 1.723 1.564 1.200 .204 .464 .264 .015 5.434May .......................... 1.605 1.576 1.229 .203 .541 307 .014 5.474June ......................... 1.762 R1.529 1.176 .198 .565 .279 .014 R5.523July .......................... 1.588 R1.554 1.196 203 .607 .247 .015 R5.410August ..................... 1.716 R1.554 1.210 .204 .604 .206 .015 R5.510September ............... 1.794 1303 1.168 .196 .537 .179 .015 5.3929-Month Total ......... 15.444 14.011 10.823 1.812 5,004 2.192 .135 49,420
1992 9.Month Total ......... 16.207 13,612 11.442 1.754 4.953 1.890 .144 50.0021991 g-Month Total ......... 16.113 13.455 11,776 1.714 4.994 2.281 .141 50,475
a Includes lease condensate. Notes: • See Note 1 al end ol section. • Geographic coverage is the 50b Electric utilityand industrial generation. States and the District of Columbia. • Totals may not equal sum olc "Other" production is electricity generated for dislribution from wood, componentsdue to independent rounding.
waste, geothermal, wind, photovottaic,andsolar thermalenergy. Sources: • Coal: Tables 6.1 and A5-A7. • Natural G_ (Dry): Tablesd Due to a lack of consistent histodcaJdata, some renewable energy 4.1 and A4. • Crude OII and Natural Gas Plant Uqulds: Tables 3.1a and
sources are nol included. For example, in 1991, 3.3 quadrillion Btu of A2. • Nuclear Electric Power: Tab4es 7,1 and A8, • Hydroelectricrenewable energy consumedby U.S. electric utilitiesto generateelectricityfor Power: Table 7.1 ; Section 2, "Energy ConsumptionNotes and Sources,'distribution is included, but an estimate<_3.4 quadrillion Btu ol renewable Note 8; and Table A8. • Other: Section 2, "EnergyConsumptionNotes andenergy used byother sectors is not included. Sources,' Note 7, and Tsble A8.
R=Revised data.
Energy Information Administration/Monthly Energy Review December 1993 9
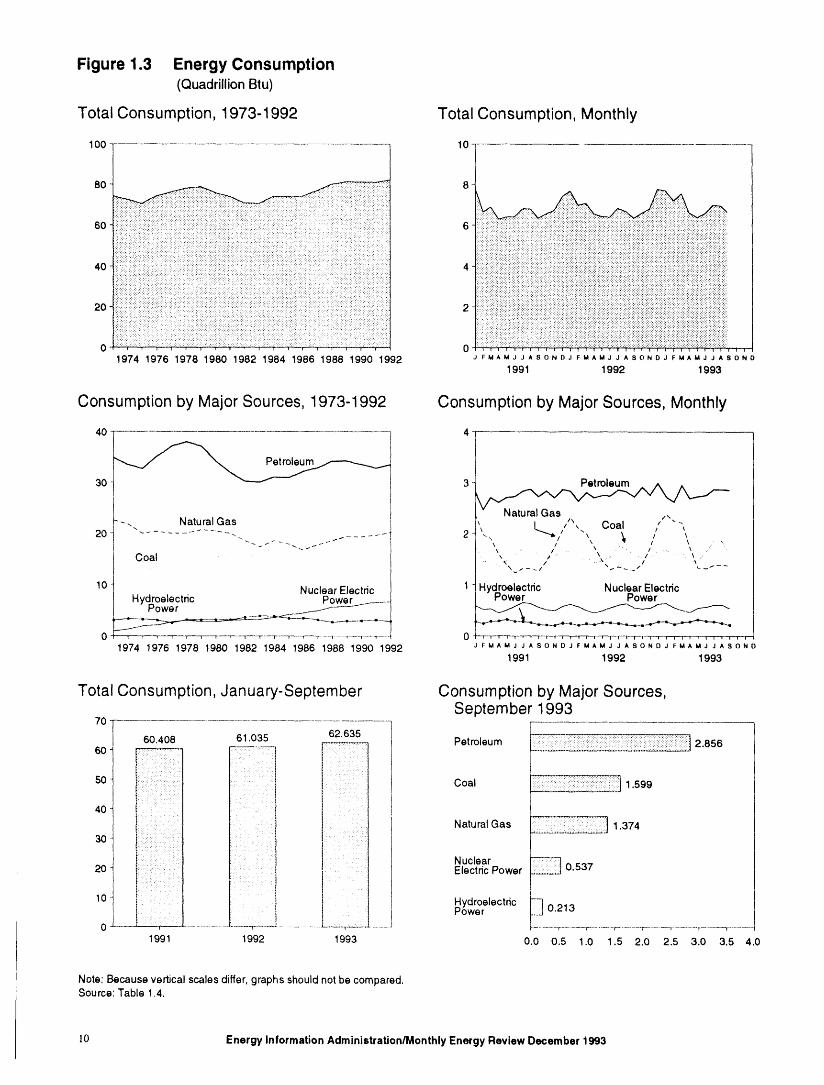
Figure 1.3 Energy Consumption(Quadrillion Btu)
Total Consumption, 1973-1992 Total Consumption, Monthly
100 10
80 8
60 640 4
i!iiiiiii!!!!iiii!!!!ilii!ii!iii!ii!i!!iii!iiiiiiiiiii1974 1976 1978 1980 1982 1984 1986 1988 1990 1992 FM,MJ JASONDJ FMAMJ J ASONDJ FMAMJ JASONO
1991 1992 1993
Consumption by MajorSources, 1973-1992 Consumption by MajorSources, Monthly
40 4
30 3
t--. Natural Gas I NaturalGCs ,, ,/, ..,k It k\\ , /l" \_, ""Coal \, " ......
K . // /
10 1 Hydroelectric Nuclear ElectricNuclear Electric I."ower Power
Hyd.,roelectdc Powers- ___.__._._._
0 _r--"-r----T'----r------F----T'_-r_"--T--"_r----T-_--r---T----'T----T .... T--'--T-----'T---"_ 0 --T-T--T-_I'--r'--_ _ ' v I I v [ I i t l I v i Ir w I I T ' r
1974 1976 1978 1980 1982 1984 1986 1988 1990 1992 J FMAMJ J ASONO J FMAMJ J ASONO J FMAMJ JASOND1991 1992 1993
Total Consumption, Janua_-September Consumption by MajorSources,September 1993
7O
60.408 61.035 62.63560 _.---_ Petroleum
2.856
40 NaturalGas _i!2_::2_ 1.3743O
; I Nuclear
20 i:; ElectricPower _ 0.537
I 1 i L1I 10 I-'owerHydr°electric_ 0.2130 ................................................ J ............,-........ r-.........,-............,.......-7.........., ...... -r-........
1991 1992 1993 0.0 0.5 1,0 1.5 2.0 2.5 3.0 3.5 4.0
Note: Because vertical scalesdiffer, graphs shouldnot be compared.Source: Table 1.4.
l O Energy Information Administration/Monthly Energy Review December 1993
Table 1.4 Energy Consumption by Source(Quadrillion Btu)
Nuclear Hydro-Natural Electric etectrl¢
Coal Gasa Petroleum Power Powerb Otherc Totald
1973 Total ............................ 12.971 22.512 34.840 0.910 3.010 0.039 74.2821974 Total ............................ 12.663 21.732 33.455 1.272 3.309 .112 72.5431975 Total ............................ 12,663 19.948 32.731 1.900 3.219 .086 70.5481978 Total ............................ 13.584 20.345 35.175 2.111 3.066 ,081 74.3621977 Total ............................ 13.922 19.931 37.122 2.702 2.515 .097 76.2881978 Total ............................ 13,765 20,000 37.965 3.024 3.141 .I 93 78.0891979 Total ............................ 15,039 20.666 37,123 2.776 3.141 .152 78,8981960 Total ............................ 15.423 20.394 34.202 2.739 3.118 .070 75.9551981 Total ............................ 15.907 19.928 31,931 3.008 3.105 .111 73.9901982 Total ............................ 15.322 18.505 30.231 3.131 3.572 .086 70.8481983 Total ............................ 15,884 17.357 30.054 3.203 3.899 .118 70.5241984 Total ............................ 17.071 18.507 31.051 3.553 3.800 .163 74.1441985 Total ............................ 17,478 17,834 30.922 4.149 3.398 .199 73.9811986 Total ............................ 17.261 16.708 32.196 4.471 3.446 .215 74.2971987 Total ............................ 18,008 17.744 32.865 4.908 3,117 .253 76.8941988 Total ............................ 18.846 18.552 34.222 5.661 2.862 .274 80.2181989 Total ............................ 18.925 19.384 34.211 5.677 2.861 .248 61,3251990 Total ............................ 19.101 19.296 33,553 6.161 2.946 .207 81.265
1991 January ........................ 1.728 2.367 2.819 .584 .278 .017 7.795February ...................... 1,444 1.969 2.463 .514 .237 .015 6.643March ........................... 1.463 1,895 2.706 .528 283 .018 6.893April .............................. 1.357 1.589 2.607 .447 .287 .O16 6,302May .............................. 1.480 1.377 2.702 .502 .317 .016 6,394June ............................. 1,577 1.235 2.726 .582 .286 .015 6.421July .............................. 1.718 t 322 2.832 ,652 .275 ,019 6.818August ......................... 1.717 1.312 2.868 .628 .259 .014 6.798September ................... 1.558 1.268 2.721 .557 .221 .019 6.344October ........................ 1.523 1.461 2.837 .512 ,213 .015 6.561November .................... 1570 1.742 2.702 .497 .211 .018 6.740Decembar .................... 1.635 2,069 2,862 .576 .249 ,017 7.408Total ............................ 18.770 19.606 32.645 6.579 3.115 .200 81.116
1992 January ........................ 1.654 2.306 2,835 .621 .247 .O21 7.684February ...................... 1.478 2.091 2.634 .567 .206 .018 6.994March ........................... 1.536 1.984 2.804 .492 .238 .020 7.074April ............................. 1.435 1.735 2.704 ,454 .223 .018 6.569May .............................. 1.469 1.460 2.747 .490 .256 .017 6,440June ............................. 1.541 1.302 2.738 .550 .258 .019 6.408July .............................. 1.758 1.351 2.857 .602 .243 ,017 6.828August ......................... 1.688 1.302 2.821 .630 .221 .017 6,678Seplembe r ................... 1,585 1.286 2.722 .547 .205 ,016 6.361October ........................ 1.532 1.409 2.908 .524 .203 .018 6.595November .................... 1.531 1.722 2.756 .545 .231 .017 6.802December .................... 1.680 2,182 2.988 .624 .276 .021 7.771Total ............................ 18.887 20.131 33.514 6.646 2.806 .219 82.203
1993 January ........................ 1.679 2.366 2,720 .634 279 .020 7.698February ...................... 1,563 2.240 2.619 .551 .229 .015 7.216March ........................... 1.620 2.204 2.948 .501 ,268 .019 7.557April ............................. 1.461 1.723 2.689 .464 .279 .018 6.634May .............................. 1.468 1.330 2.723 .541 .318 .016 6.396June ............................. 1.638 R1.316 2.747 .565 .290 .016 R6.573July .............................. 1.858 R1.384 2.868 .607 ,278 .015 R7.009August ......................... 1.844 R1.384 2.862 .604 .248 .017 R6.959September ................... 1.599 1.374 2.856 .537 .213 .014 6.5939-Mont_ Total ............. 14.729 15.321 25.032 5.004 2.400 .149 62.635
1992 9-Month Total ............. 14.145 14.817 24.862 4.953 2.096 .162 81.0351991 9-Month Total ............. 14.043 14.334 24.445 4.994 2.442 .149 60,408
, ,,, J,,,i
a Includes supplemental gaseous fuels R=Reviseddata.b Electric utilityand industrialgeneration and net importsol electricity. Notes: • See Note 2 al end of section. • Geographic coverage is the 50c "Other" consumplion is net imports o( coal coke and electricity States and the District o( Columbia. Totals may not equal sum ol
generated tot distributionlrom wood,waste, geothermal, wind, photovoltaic, componentsdue to independent rounding.*and sotarthermal energy. Sources: , Coal: Tables 6.1 and A5-A7. • Natural Gu: Tables 4.2
d Due to a lack o( consistent historical data, some renewable energy and A4. • Petroleum: Tables 3.1a and A3. • Nuclear Electric Power:sources are not included. For example, in 1991, 3.3 quadrillion Btu of Tables 7.1 and A8. • Hydroelectric Power: Table 7.1; Section 2, 'Energyrenewable energy consumed by U.S. electric utilitiesto generate electricity ConsumptionNotes and Sources," Note 8; and Table A8. , Other: Sectionfor distribution is included, but an estimated 3.4 quadrillionBtu of renewable 2, 'Energy ConsumptionNotes and Sources," Note 7, and Table A8.energy used by othersectors is not included.
Energy Information Administration/Monthly Energy Review December 1993 l i
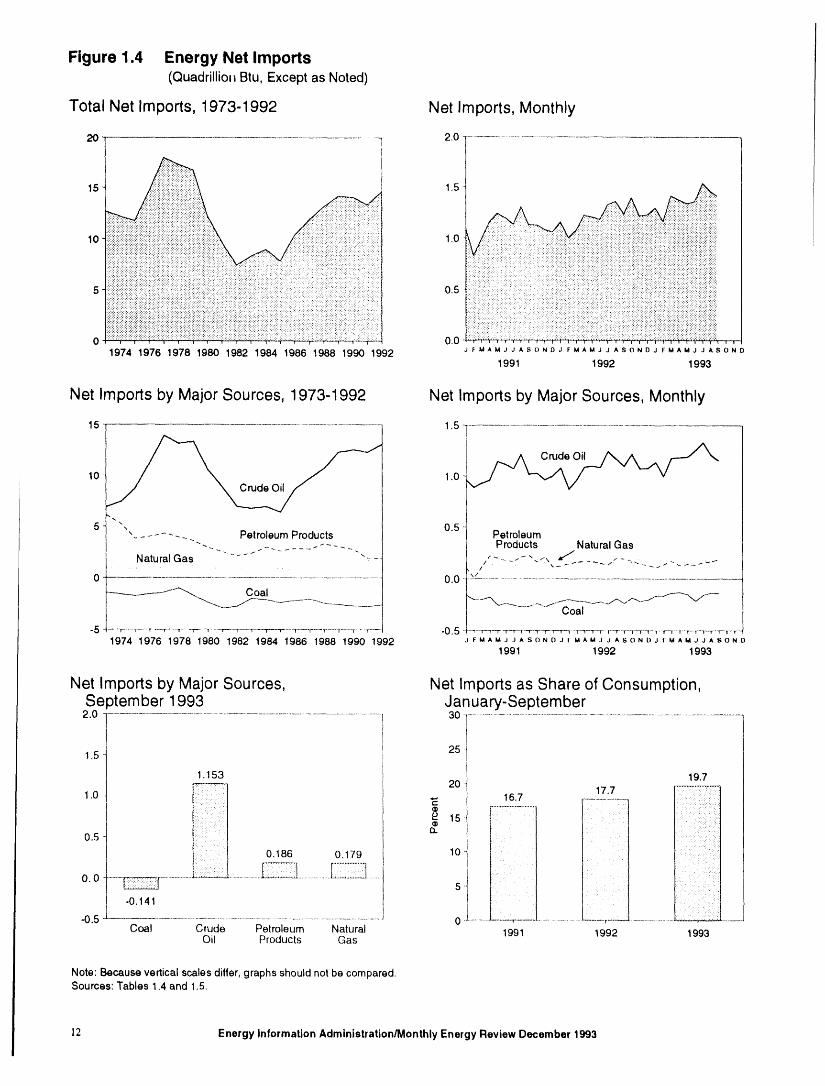
Figure 1.4 Energy Net Imports(Quadrillioi_ Btu, Except as Noted)
Total Net Imports, 1973-1992 Net Imports, Monthly
20 - 2.O
10 ,_.,_.:..>> > 1.0 :
'iliiiiiii!iiiii!iiiii!iiii:iiiiil o.iiiiiiiii!iiiiliiii!ii!iiiii!iiiiii!iiii!iiiil0 0.0 -'-'-¢-w-'-_'_'_t-'_-t-t'-'¢_ _t'-'-'c-'-_'-w_'-'t'_'-'r'-'_ ,, • , ,1974 1976 1978 1980 1982 1984 1986 1988 1990 1992 J FMAMJ JASONDJ FMAMJ J ASOND J FMAMJ JASOND
1991 1992 1993
Net Imports by Major Sources, 1973-1992 Net Imports by Major Sources, Monthly
15 1.5 1
10 . 1,0
5 ,, 0.5" Petroleum Products Petroleum...... --"'- -- Products Natural GasNatural Gas "- ....... -',-\ / ......
0 0.0 ""
"-------_,_, CoalCoal
"5 ---TT-T----3-'-'T--I---T----'T-----T--T----T'----T---T--"T-----_ ...... T-"-7 .....T".... "0.5 --_F-T_1`_T-_T_V-_-T_T_T-T-T_r_l_T-T--T_T_T_-_-T-_TT-T_-C--T-F._-T-_
1974 1976 1978 1980 1982 1984 1986 1988 1990 1992 FMAMJ JASOND J'I-IdAMJ a ASONDJ FIdAMJ JASOND
1991 1992 1993
Net Imports by Major Sources, Net Imports as Share of Consumption,Se )tember 1993 January-September
2.0 ........................................................................................... 30 ........................................................................................................
1,5 25
1.153 19.7
iii1 ..° ,. ..............:. :::: ::::]1.0 --, 16.7 ........... -i .........................
15 - : : ' '
0,5 a. ..... :....• : _ :: ?.:: : ._
:: 0.186 0.179 1 10 : " :, ::.::.::;
o.o .-__j ............................ s .
-0.141 :-0.5 .............................................................................................. J 0 ...................................................Coal Crude Petroleum Natural 1991 1992 1993
Oil Products Gas
Note: Because vertical scales differ, graphs should not be compared,Sources: Tables 1.4 and 1.5,
12 Energy Information Administration/Monthly Energy Review December 1993
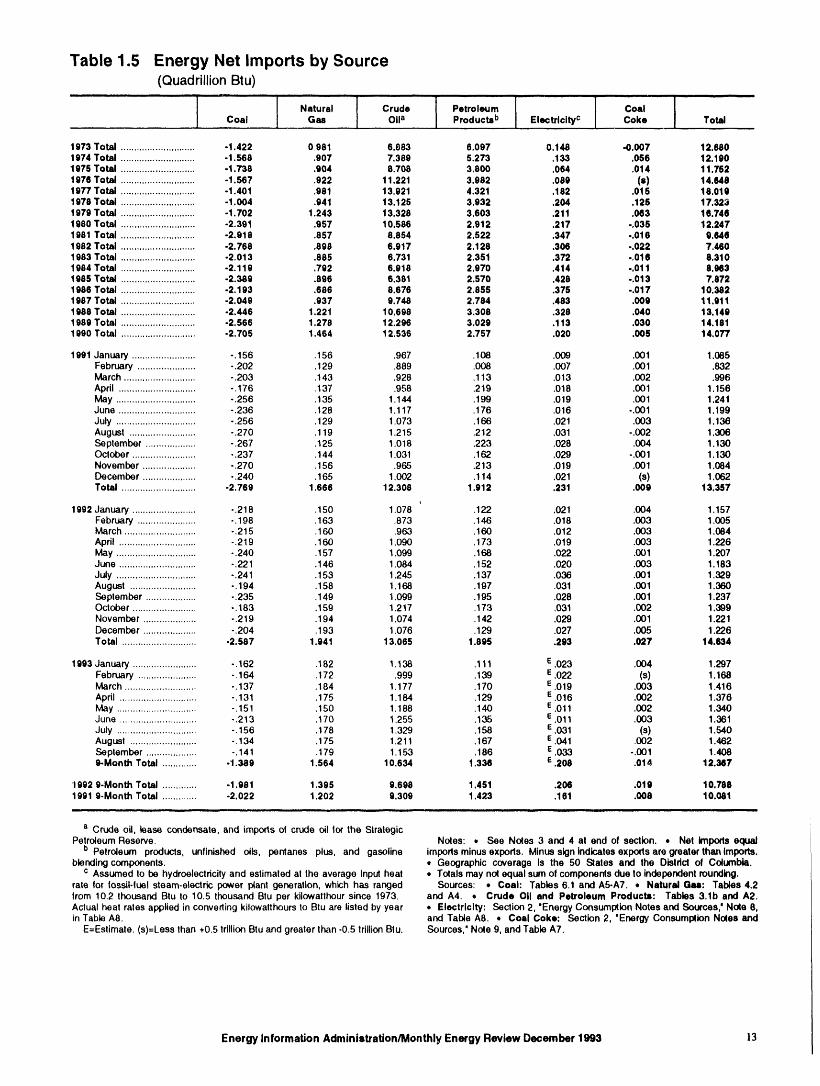
Table 1.5 Energy Net Imports by Source(Quadrillion Btu)
i i , ii, i,, llll
1 I Natural Crude I Petroleum 1 coalCoal Gas O11a Products b Electdcltyc Coke Total
1973 Total ............................ -1.422 0.981 6.883 6.097 0.148 -0.007 12.6801974 Total ............................ -1.568 .907 7.389 5.273 .I 33 .056 12.1901975 Total ............................ -I .738 .904 6.708 3.800 .064 .014 11.7521976 Total ............................ -1.567 .922 11.221 3.982 .069 (a) 14.6481977 Total ............................ -1.401 .981 13.921 4.321 ,182 .015 18.0191978 Total ............................ -I.004 .941 13.125 3.932 .204 .125 17.3231979 Total ............................ -1.702 1.243 13.328 3.603 .211 .063 16.7461960 Total ............................ o2.391 .957 10.586 2.912 .217 -.035 12.2471981 Total ............................ -2.918 .857 8.854 2.522 .347 -.016 9.6481982 Total ............................ -2.768 .899 6.917 2.128 ,306 -.022 7.4601963 Total ............................ -2.013 .885 6.731 2.351 .372 .,016 8.3101984 Total ............................ -2,119 .792 6,918 2.970 .414 -.011 8.9631985 Total ............................ -2.389 .896 6.361 2.570 .428 ..013 7.8721986 Total ............................ -2,193 .666 8.676 2.855 .375 -.017 10.3821987 Total ............................ -2.049 .937 9.748 2.784 .463 .009 11.9111988 Total ............................ -2,446 1.221 10.698 3.308 .320 .040 13.1491989 Total ............................ -2.566 1.278 12.296 3.029 .I 13 .030 14.1811990 Total ............................ -2.705 1.464 12.536 2.757 .020 .005 14.077
1991 January ........................ -. 156 .156 .967 ,108 .009 .001 1,085February ...................... -.202 .129 .889 .008 .007 .001 .832March ........................... -.203 .143 ,928 .113 .013 .002 .996Apdl ............................. -.176 .137 .958 .219 .018 .001 1.156May .............................. -.256 .135 1.144 .199 .019 .001 1.241June ............................. -.236 .128 1.117 .176 .016 -.001 1,199July .............................. -.256 .129 1.073 ,166 .021 .003 1.136August ......................... -.270 .119 1.215 .212 ,031 -.002 1.306September ................... -.267 .125 1.018 .223 .028 .004 1.130October ........................ -.237 .144 1.03t .162 .029 -.001 1.130November .................... -.270 .156 .965 .213 .019 .001 1,684December .................... -,240 .165 1.002 .114 .021 (s) 1.062Total ............................ -2.769 1.666 12.308 1.912 .231 .009 13.357
1992 January ........................ -.218 .150 1.078 .122 .021 .004 1.157February ...................... -.198 .163 ,873 .146 .018 .003 1,005March ........................... -,215 .160 .963 .160 .012 .003 1.084April ............................. -.219 .160 1.090 ,173 .019 .003 1.226May .............................. -,240 .157 1,099 .168 .022 .001 1.207June ............................. -.221 .146 1.084 .152 .020 .003 1.183July .............................. -.241 .153 1,245 .137 .036 .001 1.329August ......................... -.194 .158 1.168 .197 .031 .001 1.360Seplember ................... -.235 .149 I. 099 .195 .028 .001 1.237October ........................ -.183 .159 1.217 .173 ,031 .002 1.399November .................... -.219 .194 1.074 .142 .029 .001 1.221December .................... -,204 .193 1.076 .129 .027 .005 1,226Total ............................ -2.587 1.941 13.065 1.895 .293 .027 14.634
1993 January ........................ -.162 .182 1.138 .111 E ,023 .004 1,297February ...................... -.164 .172 .999 .139 E .022 (S) 1.168March ........................... -.137 .184 1.177 .170 E .019 .003 1.416April ............................. -. 131 .175 1.184 .129 E.016 .002 1.376May .............................. -.151 .150 1.188 .140 E .011 ,002 1.340June ............................. -.213 .170 1.255 .135 E .011 .003 1.361July .............................. -.156 .178 1.329 .158 E.031 (S) 1.540August ......................... -.134 .175 1.211 .167 E.041 ,002 1.462September ................... -. 141 .179 1.153 .186 E.033 -.001 1.4089-.MonthTotal .............. 1.389 1.564 10.634 1.336 E.206 .014 12.387
'19929-Month Total ............. -1.981 1.395 9.698 1.451 .206 .019 10,7881991 9-Month Total ............. -2.022 1.202 9.309 1.423 .161 .008 10.081
a Crude oil, lease condensate, and imports of crude oil for the StrategicPetroleum Reserve. Notes: • See Notes 3 and 4 at end of section. • Net Imports equal
b Petroleum products, unfinished oils, pentanes plus, and gasoline importsminusexports. Minus sign indicatesexportsare greater than Imports.blendingcomponents. • Geographic coverage Is the 50 Slates and the Distdct of Columbia.
c Assumed to be hydroelectricityand estimated al the average inputheat • Totals may no( equal sumof componentsdue to independent rounding.rate for (ossil-tuel steam-electric power plant generation, which has ranged Sources: • Coal: Tables 6.1 and A5-A7. • Natural Gas: Tables 4.2lrom 10.2 lhousand Btu to 10.5 thousand Btu per kilowatthoursince 1973. and A4. • Crude Oil and Petroleum Product=: Tables 3.1b and A2.Actualheat rates applied in convertingkilowatthoursto Btu are listedby year • Electricity: Section 2, *Energy Consumption Notes and Sources,' Note 8,in TableA8. and Table A8. , Coal Coke: Section 2, "EnergyConsumption Notes and
E=Estimate. (s)=Less than +0.5 trillionBtu and greater than -0.5 trillionBtu. Sources,"Note 9, and Table A7.
Energy Information Administration/Monthly Energy Review December 1993 13
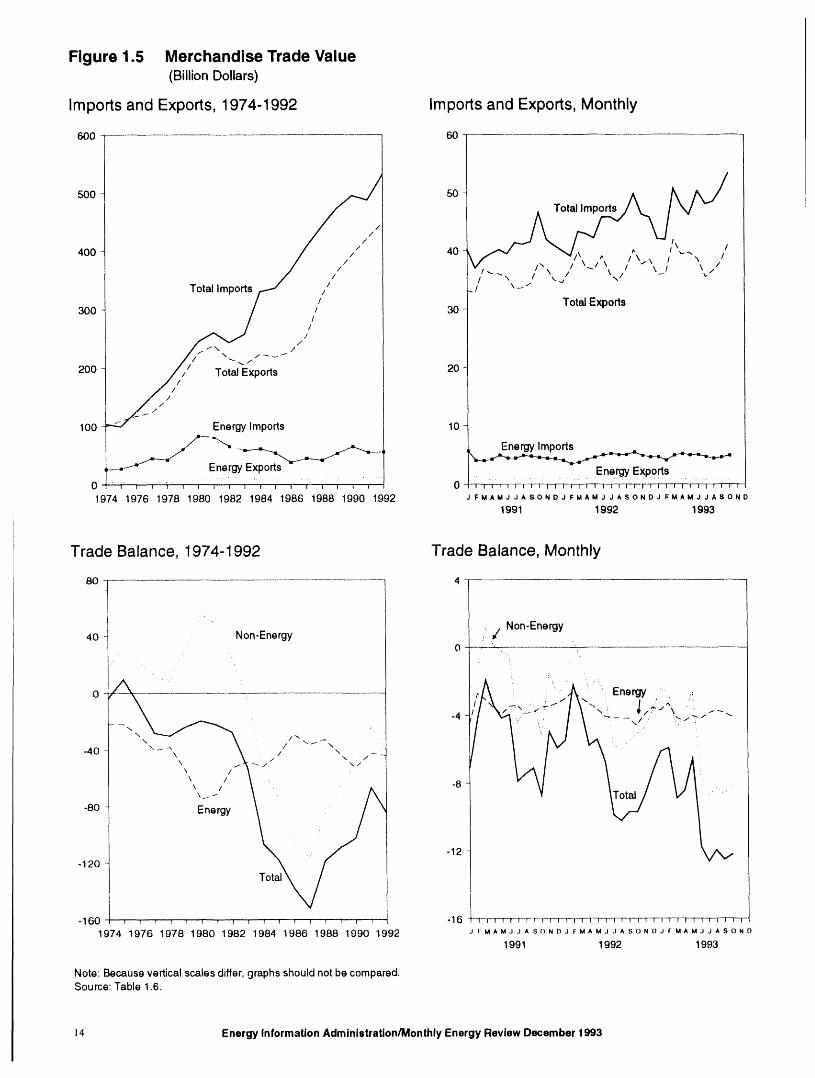
Figure 1.5 Merchandise Trade Value(BillionDollars)
Imports and Exports, 1974-1992 Imports and Exports, Monthly
600 60 --
500 50 aiIm_,__A,°t/
//
400 40 tV_,,J"_/" X_//\\ ./t, jI^\\\--III\_'N\I/I I
Total Import_//_ i/i/,, / I \ - "
300 30 Total Exports
200 /,/// Total Exports 20
1O0 _"_ _/" Energy Imports 10
_,f Ener l=nal'OVExnorts
o , ,, , , , ,...., , -,.:,.--,-_ , i , , ............... ----._..,_r._-- ..........0 -'T"-r-'I_F I I I ! I I I 1 ( I 1 i I-T-'I 1' | , 1 'I"-'['-F i | ! I I
1974 1976 1978 1980 1982 1984 1986 1988 1990 1992 JFMAMJJASONOJFMAMJJASONDJFMAMJJASON01991 1992 1993
-160 -16 -I-FT-T--r-T- -F-I-T-I--r--I--r-P-FT-TTT'I-"F-TT-I-T--r-I-GF-TTG--T-_-1974 1976 1978 1980 1982 1984 1986 1988 1990 1992 FMAMJJASONDJ FMAMJ JASONDJFMAMJJASOND
1991 1992 1993
Note: Because vertical scales differ, graphs should not be compared.Source: Table 1.6.
14 Energy Information Administration/Monthly Energy Review December 1993
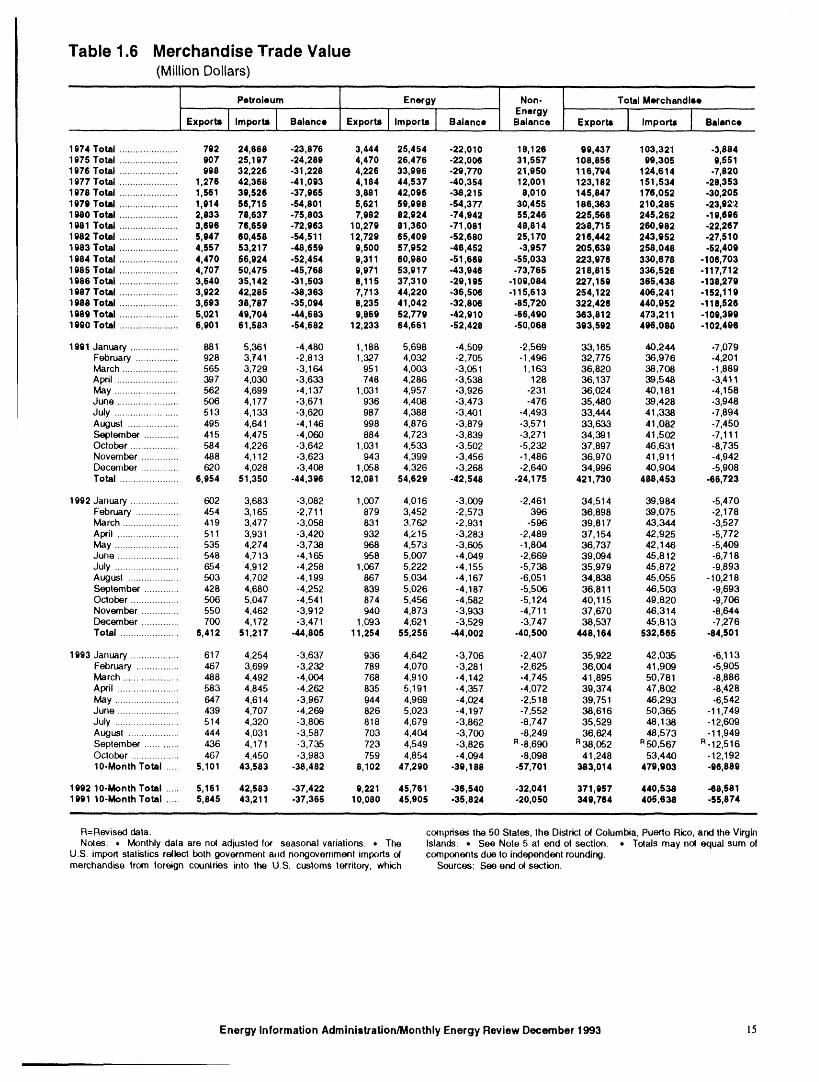
Table 1.6 Merchandise Trade Value(Million Dollars)
Petroleum Energy Non- Total Merchandise....... Energy
Expor..tallmports [ Balance Exports J lmports I Balance Balance Exports ......J Imports l.... Balance
1974 Total ...................... 792 24,668 -23 876 3,444 25,454 -22,010 18,126 98 437 103,321 .3,6841975 Total ...................... 907 25,197 -24 288 4,470 26,476 -22,006 31,557 108 656 99,305 9,5511976 Total ...................... 996 32,226 -31 228 4,226 33,996 -29,770 21,950 116 794 124,614 -7,8201977 Total ...................... 1,276 42,366 -41 093 4,184 44,537 -40,354 12,001 123 182 151,534 .28,3531978 Total ...................... 1,561 39,526 -37 965 3,881 42,096 -38,215 8,010 145 847 176,052 -30,2051979 Total ...................... 1,914 56,715 -54 601 5,621 59,996 -64,377 30,455 186 363 210,265 .23,92',_1980 Total ...................... 2,633 78,637 -75 803 7,982 82,924 -74,942 55,246 225 566 245,262 -19,6961981 Total ...................... 3,696 76,659 -72 963 10,279 81,360 -71,081 48,814 238 715 260,962 -22,2671962 Total ...................... 5,947 60,456 -54 511 12,729 65,409 -52,680 25,170 216 442 243,952 -27,5101983 Total ...................... 4,557 53,217 -48 659 9,500 57,952 -48,452 -3,957 205 639 258,048 .52,4091984 Total ...................... 4,470 56,924 -52 454 9,311 60,980 -51,669 -55,033 223 976 330,676 -106,7031985 Total ...................... 4,707 50,475 -45 768 9,971 53,917 -43,946 -73,765 218 815 336,526 -I 17,7121986 Total ...................... 3,640 35,142 .31 503 8,115 37,310 -29,195 .109,064 227 159 365,438 -138,2791987 Total ...................... 3,922 42,285 -38 363 7,713 44,220 -36,506 -115,613 254122 406,241 -152,1191986 Total ...................... 3,693 38,767 -35 D94 8,235 41,042 -32,606 .85,720 322 426 440,952 -I 18,5261989 Total ...................... 5,021 49,704 .44 583 9,869 52,779 o42,910 .66,490 363 812 473,211 -109,3991990 Total ...................... 6,901 61,583 -54 682 12,233 64,661 -52,428 .50,068 393 592 496,088 -102,496
1991 January .................. 881 5,361 -4,480 1,188 5,698 -4,509 -2,569 33,165 40,244 .7,079February ................ 928 3,741 -2,813 1,327 4,032 -2,705 -1,496 32,775 36,976 -4,201March ..................... 565 3,729 -3,164 951 4,003 -3,051 1,163 36,820 38,708 -1,889April ....................... 397 4,030 -3,633 748 4,286 -3,538 128 36,137 39,548 .3,411May ........................ 562 4,699 -4,137 1,031 4,957 -3,926 -231 36,024 40,181 -4,158June ....................... 506 4,177 -3,671 936 4,408 -3,473 -476 35,480 39,428 -3°948July ........................ 513 4,133 -3,620 987 4,388 -3,401 -4,493 33,444 41,338 -7,894August ................... 495 4,641 -4,146 998 4,876 -3,879 -3,571 33,633 41,082 -7,450September ............. 415 4,475 -4,060 884 4,723 -3,839 .3,271 34,391 41,502 -7,111October .................. 584 4,226 -3,642 1,031 4,533 -3,502 -5,232 37,897 46,631 -8,735November .............. 488 4,112 -3,623 943 4,399 -3,456 -1,486 36,970 41,911 .4,942December .............. 620 4,028 -3,408 1,058 4,326 -3,268 -2,640 34,996 40,904 .5,908Total ...................... 6,954 51,350 -44,396 12,081 54,629 -42,548 .24,175 421,730 488,453 -86,723
1992 January .................. 602 3,683 -3,082 1,007 4,016 -3,009 -2,461 34,514 39,984 .5,470February ................ 454 3,165 -2,711 879 3,452 -2,573 396 36,898 39,075 -2,178March ..................... 419 3,477 -3,058 831 3.762 -2,931 -596 39,817 43,344 -3,527April ....................... 511 3,931 -3,420 932 4,215 -3,283 -2,489 37,154 42,925 -5,772May ........................ 535 4,274 -3,738 968 4,573 -3,605 -1,804 36,737 42,1 46 -5,409June ....................... 548 4,713 -4,165 958 5,007 -4,049 -2,669 39,094 45,812 -6,718July ........................ 654 4,912 -4,258 1,067 5,222 -4,155 -5,738 35,979 45,872 .9,893August ................... 503 4,702 -4,199 867 5,034 -4,167 -6,051 34,838 45,055 -10,218September ............. 428 4,680 -4,252 839 5,026 -4,187 -5,506 36,811 46,503 .9,693October .................. 506 5,047 -4,541 874 5,456 -4,582 -5,124 40,115 49,820 -9,706November .............. 550 4,462 -3,912 940 4,873 -3,933 -4,711 37,670 46,314 .8,644December .............. 700 4,172 -3,471 1,093 4,621 -3,529 -3,747 38,537 45,813 -7,276Total ...................... 6,412 51,217 -44,605 11,254 55,256 -44,002 -40,500 446,164 532,665 -84,501
1993 January .................. 617 4,254 -3,637 936 4,642 -3,706 -2,407 35 922 42 035 -6,113February ................ 467 3,699 -3,232 789 4,070 -3,281 -2,625 36 004 41 909 .5,905March ..................... 488 4,492 -4,004 768 4,910 -4,142 -4,745 41 895 50 781 .8,886April ....................... 583 4,845 -4,262 835 5,191 -4,357 -4,072 39 374 47 802 .8,428May ........................ 647 4,614 -3,967 944 4,969 -4,024 -2,518 39 751 46 293 .6,542June ....................... 439 4,707 -4,269 826 5,023 -4,197 -7,552 38 616 50365 -11,749July ........................ 514 4,320 -3,806 818 4,679 -3,862 -8,747 35 529 48 138 .12,609August ................... 444 4,031 -3,587 703 4,404 -3,700 -8,249 36 62.4 48 573 -11,949September ............ 436 4,171 .3,735 723 4,549 -3,826 R-8,690 938 052 R50 567 R-12,516October .................. 467 4,450 -3,983 759 4,854 -4,094 -8,098 41 248 53 440 -12,192lO-Month Total ..... 5,101 43,583 .38,482 8,102 47,290 -39,168 .57,701 383,014 479,903 -86,689
1992 lO-Month Total ..... 5,161 42,583 -37,422 9,221 45,761 -36,540 .32,041 371,957 440,638 -68,5611991 10-Month Total ..... 5,645 43,211 .37,365 10,080 45,905 -35,624 .20,050 349,764 405,636 -85,874
R=Revised data. cc_npdses the 50 States, the District of Columbia, Puerto Rico, and the VirginNoles: • Monthly data are no_adjusted fo( seasonal variations. • The Islands. • See Note 5 at end ol section. • Tolals may nol equal sum of
U.S. import stalistics reilect both government auld nongovernment imports o4 components due to independent rounding.merchandise trom loreign countries into the U.S. customs territory, which Sources: See end ol section.
Energy Information Administration/Monthly Energy Review December 1993 15
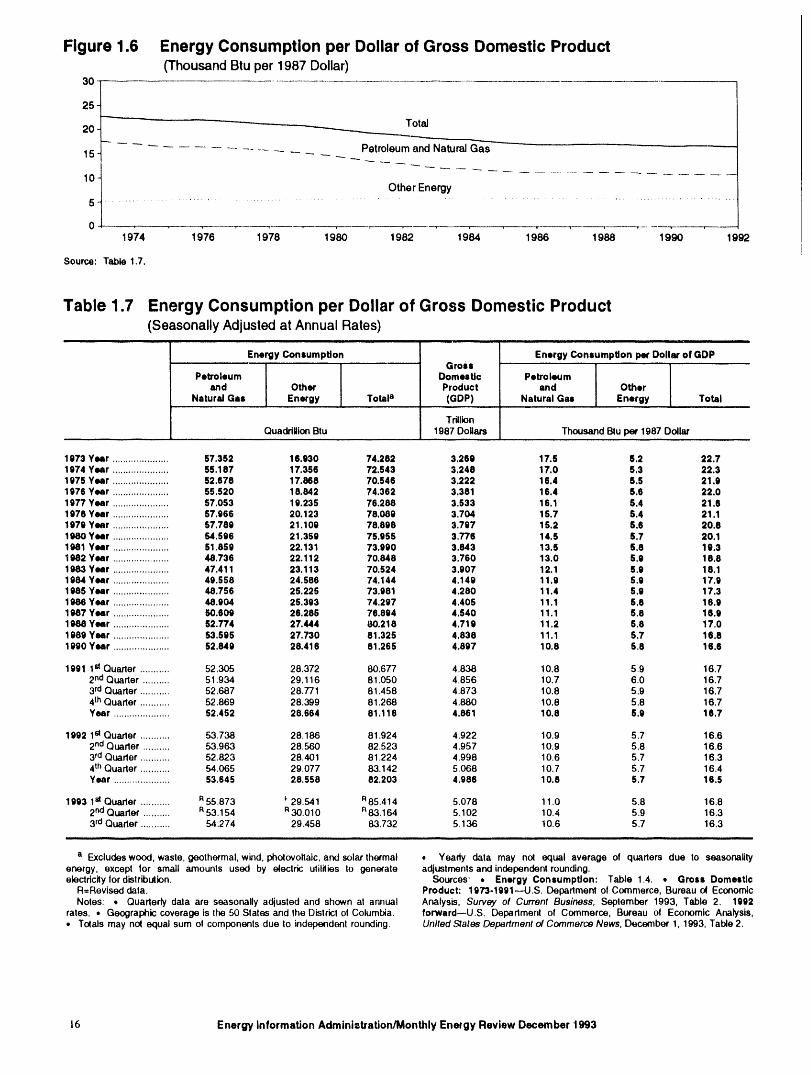
Figure1.6 EnergyConsumptionperDollarofGrossDomesticProduct(Thousand Btu per 1987 Dollar)
30-
25-
20- Total
15- _ _ Petroleum and Natural Gas
10-Other Energy
5 ......... _ ...................................
0471974 1 6 1978 1980 1982 1984 1986 1988 1990 1992
Source: Table 1o7.
Table 1.7 Energy Consumption per Dollar of Gross Domestic Product(Seasonally Adjusted at Annual Rates)
......
Energy Consumption Energy ConaumplJon per Dollar of GDPGrois .........
Petroleum Domestic Petroleumand Other Product and Other
Natural Gas Energy Totala (GDP) Natural Gu Energy Total
TrillionQuaddUionBtu 1987 Dollars Thousand Btuper 1987 Dollar
1973 Year ..................... 57.352 16.930 74.282 3.269 17.5 $.2 22.71974 Year ..................... 55.187 17.358 72,543 3.248 17.0 5.3 22.31975 Year ..................... 52.678 17.868 70.546 3.222 16.4 5.5 21.91976 Year ..................... 55.520 18.842 74.362 3.381 16.4 5.6 22.01977 Year ..................... 57.053 19.235 76.288 3.533 16.1 5.4 21.61978 Year ..................... 57.966 20.123 78.089 3.704 15.7 5.4 21.11979 Year ..................... 57.789 21.109 78.898 3.797 15.2 5.6 20.81980 Year ..................... ,54.596 21.359 75.955 3.776 14.5 5.7 20.11981 Year ..................... 51.859 22.131 73.990 3.843 13.5 5.8 19.31982 Year ..................... 48.736 22.112 70.848 3.760 13.0 5.9 18.81983 Year ..................... 47.411 23.113 70.524 3.907 12.1 5.9 18.11984 Year ..................... 49.558 24.586 74.144 4.149 11.9 5.9 17.91985 Year ..................... 48.756 25.225 73.981 4.280 11.4 5.9 17.31986 Year ..................... 48.904 25.393 74.297 4.405 11.1 5.8 18.91987 Year ..................... 50.609 26.285 76.894 4.540 11.1 5.8 18.91988 Year ..................... 52.774 27.444 80.218 4.719 11.2 5.8 17.01989 Year ..................... 53.595 27.730 81.325 4.838 11.1 5.7 16.81990 Year ..................... 52.849 28.418 81.265 4.897 10.8 5.8 15.6
1991 1st Quarter ........... 52.305 28.372 80,677 4.838 10.8 5.9 16.72nd Quarter .......... 51,934 29.116 81.050 4.856 10.7 6.0 16.73rdQuerier ........... 52.687 28.771 81.458 4.873 10.8 5.9 16.74thQuarter ........... 52.869 28,399 81.268 4.680 10.8 5.8 18.7Year ..................... 52.452 28.664 81.116 4.861 10.8 5.9 16.7
1992 1stQuarter ........... 53.738 28.186 81.924 4.922 10.9 5.7 16.62ndQuarter .......... 53.963 28,560 82.523 4.957 10.9 5.8 16.63rd Quarter ........... 52.823 28.401 81.224 4.998 10.6 5.7 16.34thQuarter ........... 54.065 29.077 83.142 5,068 10.7 5.7 16.4Year ..................... 53.645 28.558 82,203 4.986 10.8 5.7 18.5
1993 1stQuarter ........... R55.873 _"29.541 R85.414 5.078 11.0 5.8 16.82rid Quarter .......... R53.154 R30.010 R83.164 5.102 10.4 5.9 18.33 rdQuarter ........... 54.274 29.458 83,732 5,136 10,6 5.7 16.3
i
a Excludeswood,waste, geothermal, wind, pho(ovoltaic,and solar thermal • Yearly data may no( equal average of quarters due to seasonalityenergy, except for small amounts used by electric utilities to generate adjustrnentsand independent rounding.electricitylor distribution. Sources' • Energy Consumption: Table 1.4. • Gross Domestic
R=Revised data. Product: 1973.1991--U.S. Department of Commerce, Bureau o_ EconomicNotes: • Quarterly data are seasonally adjusted and shown at annual Analysis, Survey of Current Business, September 1993, Table 2. 1992
rates. • Geographic coverage is the 50 Slates and the District of Columbia. forward--U.S. Department of Commerce, Bureau ol Economic Analysis,• Totals may no( equal sum of componentsdue to independenl rounding. United gates Department of Commerce News, December 1, 1993, Table2,
]5 Energy Information Admini=tration/Monthly Energy Review December 1993
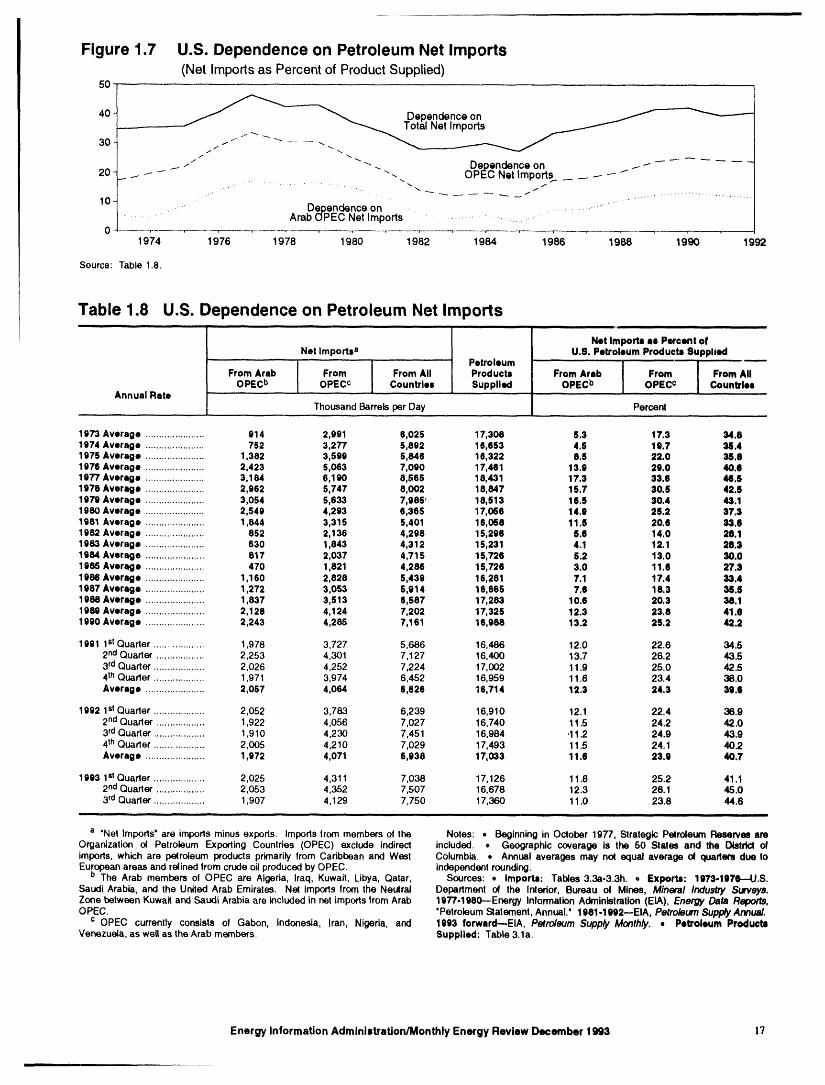
Figure 1.7 U.S. Dependence on Petroleum Net Imports(Net Importsas Percentof ProductSupplied)
40 Dependence on
Dependence on I.---
20 - _..-.t t ----- "" "--. -. OPEC Net Impods _ _ ..-----" ""• ....... . .... , , _.
.. .,. _
10....... Dependence on •.................... ..
........ Arab OPEC Net Imports ...........................0 _-'r. ..... _ 1 T'-----_-r 1
197,, 1978 19 o 19; 2 1986 19'm--' 19 oSource:Table1,8.
Table 1.8 U,S. Dependence on Petroleum Net Imports......
Net Imports as Percent ofNet Import@ U.S. Petroleum Products Supplied
PetroleumFrom Arab From From All Products From Arab From From All
OPECb OPECc Countries Supplied OPECb OPECc CountriesAnnual Rate ....................
ThousandBarrels per Day Percent.....
1973 Average ...................... 914 2,991 6,025 17,308 5.3 17.3 34.81974 Average ...................... 752 3,277 5,892 18,853 4.5 19.7 38.41976 Average ...................... 1,382 3,599 5,848 16,322 8.5 22.0 38.81976 Average ...................... 2,423 5,063 7,090 17,461 13.g 29.0 40.61977 Average ...................... 3,184 6,190 8,565 18,431 17.3 33.8 441.51978 Average ...................... 2,962 5,747 8,002 18,847 15.7 30.5 42.51979 Average ...................... 3,054 5,833 7,985' 18,513 18.5 30.4 43.11980 Average ...................... 2,549 4,293 6,365 17,056 14.9 25.2 37.31981 Average ...................... 1,844 3,315 5,401 16,058 11.5 20.6 33.61982 Average ...................... 852 2,136 4,298 15,296 5.8 14.0 28.11983 Average ...................... 630 1,843 4,312 15,231 4.1 12.1 28.31984 Average ...................... 817 2,037 4,715 16,728 5.2 13.0 30.01985 Average ...................... 470 1,821 4,286 15,728 3.0 11.8 27.31986 Average ...................... 1,160 2,828 5,439 16,281 7.1 17.4 33.41987 Average ...................... 1,272 3,053 5,914 16,865 7.8 18.3 38.51988 Average ...................... 1,837 3,513 6,587 17,283 10.8 20.3 38.11989 Average ...................... 2,128 4,124 7,202 17,325 12.3 23.8 41.81990 Average ...................... 2,243 4,285 7,161 16,988 13.2 25.2 42.2
1991 1stQuarter .................. 1,978 3,727 5,686 16,486 12.0 22.6 34.52ndQuarter .................. 2,253 4,301 7,127 16,400 13.7 26.2 43.53rd Quarter ................... 2,026 4,252 7,224 17,002 11.9 25.0 42.54thQuarter ................... 1,971 3,974 6,452 16,959 11.6 23.4 38.0Average ...................... 2,057 4,064 8,826 16,714 12.3 24.3 =1,9.6
1992 1stQuarter ................... 2,052 3,783 6,239 16,910 12.1 22.4 36.92nd Quarter .................. 1,922 4,056 7,027 16,740 11.5 24.2 42.03rd Quarter ................... 1,910 4,230 7,451 16,984 ,11.2 24.9 43.94thQuarter ................... 2,005 4,210 7,029 17,493 11.5 24.1 40.2Average ...................... 1,972 4,071 6,938 17,033 11.$ 23.9 40.7
1993 1stQuarter ................... 2,025 4,311 7,038 17,126 11.8 25.2 41.12ndQuarter .................. 2,053 4,352 7,507 16,678 12.3 26.1 45.03rd Quarter ................... 1,907 4,129 7,750 17,360 11.0 23.6 44.6
i
a "Net Imports" are imports minus exports. Imports from members of the Notes: , Beginning in October 1977, Strategic Petroleum Reserves areOrganization ol Petroleum Exporting Countries (OPEC) exclude indirect included. • Geographic coverage is the 50 States and the District olimports, which are petroleum products primarily from Cadbbean and West Columbia. • Annual averages may no( equal average ol quaders due toEuropeanareas and relined from crudeoilproducedby OPEC. independentrounding.
u The Arab members of OPEC are Algeria, Iraq, Kuwait, Libya, Qatar, Sources: ,, Imports: Tables 3.3a-3.3h. ,_ Exports: lg73-11t7(I--U.S.Saudi Arabia, and the United Arab Emirates. Net importsfrom the Neutral Department ol the Interior, Bureau ol Mines, Mineral Industry Surveys.Zone between Kuwait and Saudi Arabia are included in net importsfrom Arab 1977-1980--Energy InformationAdministration (EIA), Energy Data Reports,OPEC. 'Petroleum Statement, Annual.' 11)81-1992--EIA, Petroleum Supply Annual.
c OPEC currently consists of Gabon, Indonesia, Iran, Nigeria, and lg93 forward--EIA, Petroleum Supply Monthly. • Petroleum ProductsVenezuela, as well as the Arab members. Supplied: Table 3.1a.
Energy Information Administration/Monthly Energy Review December 1993 17
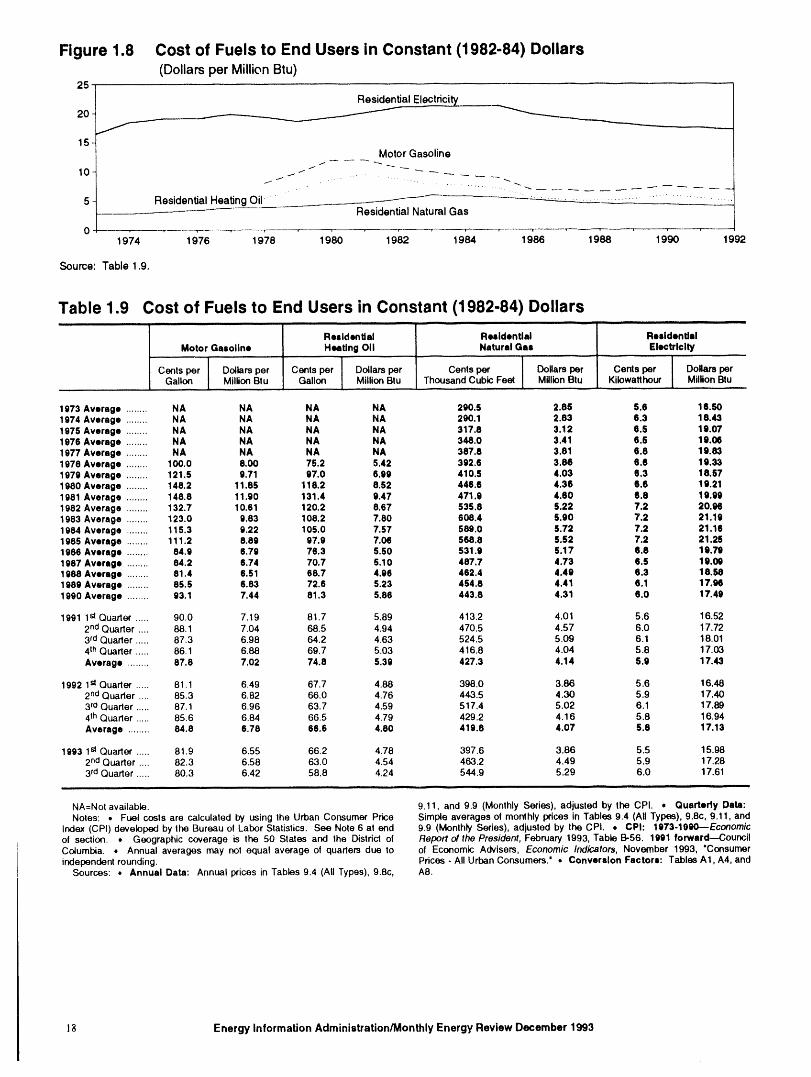
Figure 1.8 Cost of Fuels to End Users in Constant (1982-84) Dollars(DollarsperMillionBtu)
25
Residential Electncity20
15Motor Gasoline
• ,..
5 ResidentialHeatingOil ............................"....................ResidentialNaturalGas
0 r I
1974 1976 1978 1980 1982 1984 1986 1988 1990 1992
Soume: Table 1.9.
Table 1,9 Cost of Fuels to End Users in Constant (1982-84) Dollars, ,, i ill i
Residential Ruldentlal ResidentialMotor Gasoline Heating Oil Natural Gas Electricity
Cents per Dollars per Cents per Dollars per Cents per DoBarsper Cents per DoBarsperGallon MillionBtu Gallon Million Btu ThousandCubic Feel MillionBtu Kilowatthour MillionBtu
......
1973 Average ........ NA NA NA NA 290.5 2.85 5.6 16.S01974 Average ........NA NA NA NA 290.1 2.83 6.3 18.431975 Average ........ NA NA NA NA 317.8 3.12 8.S 19.071976 Average ........NA NA NA NA 348.0 3.41 6.5 19.061977 Average ........ NA NA NA NA 387.8 3.81 6.8 19.831978 Average ........ I00.0 8.00 75.2 5.42 392,6 3.86 6.8 19.331979 Average ........121.5 9.71 97.0 6,99 410.5 4.03 IS.3 18.S71980 Average ........ 148.2 11.85 118.2 8.52 446.6 4.36 6.6 19.211981 Average ........ 148.8 11.90 131.4 9.47 471.9 4.60 6.8 19.991982 Average ........132.7 10.61 120.2 8.67 535.8 S.22 7.2 20.961983 Average ........123.0 9.83 108.2 7.80 608.4 S.90 7.2 21.1e1984 Average ........ 115.3 9.22 105,0 7.57 589.0 S.72 7.2 21.161985 Average ........ 111.2 8.89 97.9 7.08 568.8 S.52 7.2 21.261986 Average ........ 84.9 6.79 76.3 5.50 531.9 S.17 6.8 19.791987 Average ........ 84.2 6,74 70.7 5.10 487,7 4.73 6.5 19.001988 Average ........ 81.4 6.51 68.7 4.96 462.4 4.49 6.3 18.581989 Average ........ 85.5 6.83 72.6 5.23 454.8 4.41 6.1 17.961990 Average ........ 93.1 7.44 81.3 5.86 443.8 4.31 6.0 17.49
1991 1stOuarter ..... 90,0 7,19 81.7 5.89 413,2 4.01 5.6 16.522 ndQuarter .... 88.1 7.04 68.5 4,94 470.5 4,57 6.0 17.723 rdQuarter ..... 87.3 6.98 64.2 4.63 524.5 5.09 6.1 18,014lh Quarter ..... 86,1 6,88 69.7 5.03 416.8 4.04 5.8 17.03Average ........ 87.8 7.02 74.8 5.39 427.3 4.14 5.9 17.43
1992 1st Quarter ..... 81.1 6.49 67.7 4.88 398,0 3.86 5.6 16.482noQuarter .... 85,3 6,82 66.0 4.76 443.5 4.30 5.9 17.403raQuarter ..... 87.1 6.96 63.7 4,59 517.4 5.02 6.1 17.894thOuarter ..... 85.6 6.84 66.5 4.79 429.2 4,16 5.8 16.94Average ........ 84.8 6.78 66.6 4.80 419.8 4.07 5.8 17,13
1993 1stQuarter ..... 81.9 6.55 66.2 4.78 397.6 3.86 5.5 15.982ndQuarter .... 82.3 6.58 63,0 4,54 463.2 4.49 5.9 17.283rd Ouarter ..... 80.3 6.42 58,8 4,24 544.9 5.29 6.0 17.61
ll,ll
NA=NoI available. 9.11, and 9.9 (Monthly Series), adjusted by the CPI, • Quarterly Data:Notes: • Fuel costsare calculated by using the Urban Consumer Price Simple averages of monlhly prices in Tables 9.4 (All Types), 9.8c, 9,11, and
Index (CPI) developed by the Bureau ot Labor Statistics. See Note 6 at end 9,9 (MonthlySeries), adjusted by the CPI, • CPh 1973.1990--Economicof section. • Geographic coverage is Ihe 50 States and the District of Report of the President, February 1993, Table B-56, 1991 forward-CouncilColumbia. • Annual averages may not equal average ot quarters due to of Economic Advisers, Economic Indicators, November 1993, "Consumerindependent rounding. Prices - All Urban Consumers.' • Conversion Factors: Tables AI, A4, and
Sources: • Annual Data: Annual prices in Tables 9.4 (All Types), 9.8c, AS.
18 Energy Information Administration/Monthly Energy Review December 1993
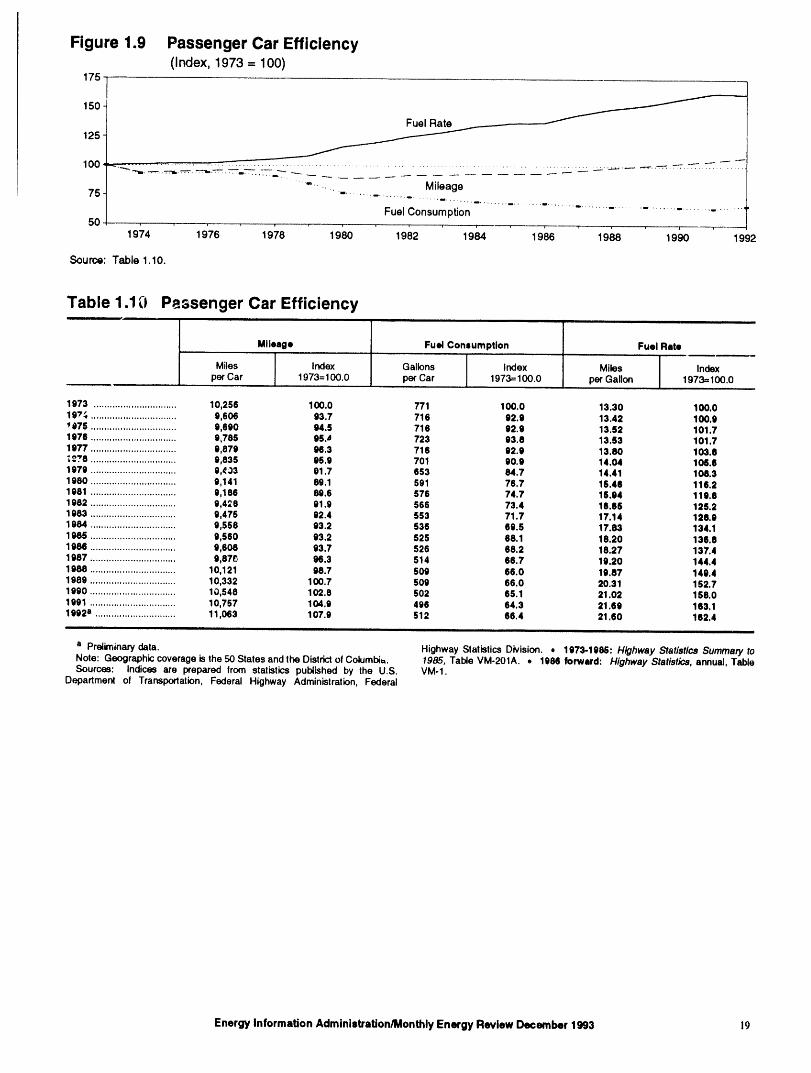
Figure 1.9 Passenger Car Efficiency(Index, 1973 = 100)
175
150 ""__
Fuel Rate125
_.-,_11...-,-_......-;--_11...--_:-.._'..-_i,,. _ _ ::..:.".-_._ . .
...." .... Mileage75- "- ......................... Ii ........ m ........ ii ...... iii ......
Fuel Consumption ............................................50,
' , , " t' , ' " d , , --
1974 19'76 1978 1980 1982 1984 1986 19_ 1990 1992Source:Table1.10.
Table 1.1_-i Passenger Car Efficiency
Mileage Fuel Con=umption Fuel Rate_,,,
Miles Index Gallons Index Miles Index__ per Car 1973=100.0 per Car 1973=100.0 per Gallon 1973=100.0
1973 ............................... 10,256 103.0 771 100.0 13.30 100.019.'x_................................ 9,606 93.7 716 62.9 13.42 100.9
975 ................................ 6,690 e4.6 716 92.9 13.82 101.71676 ................................ 9,786 96.a 723 03.8 13.53 101.719"77................................ 9,879 98.3 716 92.9 13.80 103.81_."8 ................................ 9,835 96.6 701 90.6 14.04 106.61979 ................................ 6,_33 91.7 653 84.7 14.41 108.31980 ................................ 9,141 89.1 591 76.7 15.46 116.21981 ................................ 6,186 89.6 576 74.7 16.84 119.81982 ................................ 9 426 91.9 566 73.4 16.65 125.21983 ................................ 9 475 92.4 553 71.7 17.14 128.61684 ................................ 9 558 93.2 636 69.6 17.83 134.11986 ................................ 9 560 93.2 525 68.1 18.20 136.81986 ................................ 6 608 93.7 526 68.2 18.27 137.41987 ................................ 6 87_ 96.3 S14 66.7 19.20 144.41988 ................................ 10 121 98.7 509 66.0 19.87 140.41989 ................................ I 0 332 100.7 509 66.0 20.31 152.71990 ................................ 10 548 102.8 602 66. I 21.02 158.01991 ................................ 1Q757 104.9 496 64.3 21.69 163.11992a .............................. 11,063 107.9 512 66.4 21.60 162.4
a Preliminary data. Highway StatisticsDivision. • 1673-1985: Highway Statistics Summary toNote: Geographic coverage is the 50 States and the Districtof Columbia., 1985, Table VM-201A. q, 1686 forward: Highway Statistics, annual, TableSources: Indices are prepared trorn statistics published by the U.S. VM-1.
Departmenl of Transportation, Federal Highway Administration, Federal
Energy Information Administration/Monthly Energy Review December 1993 19
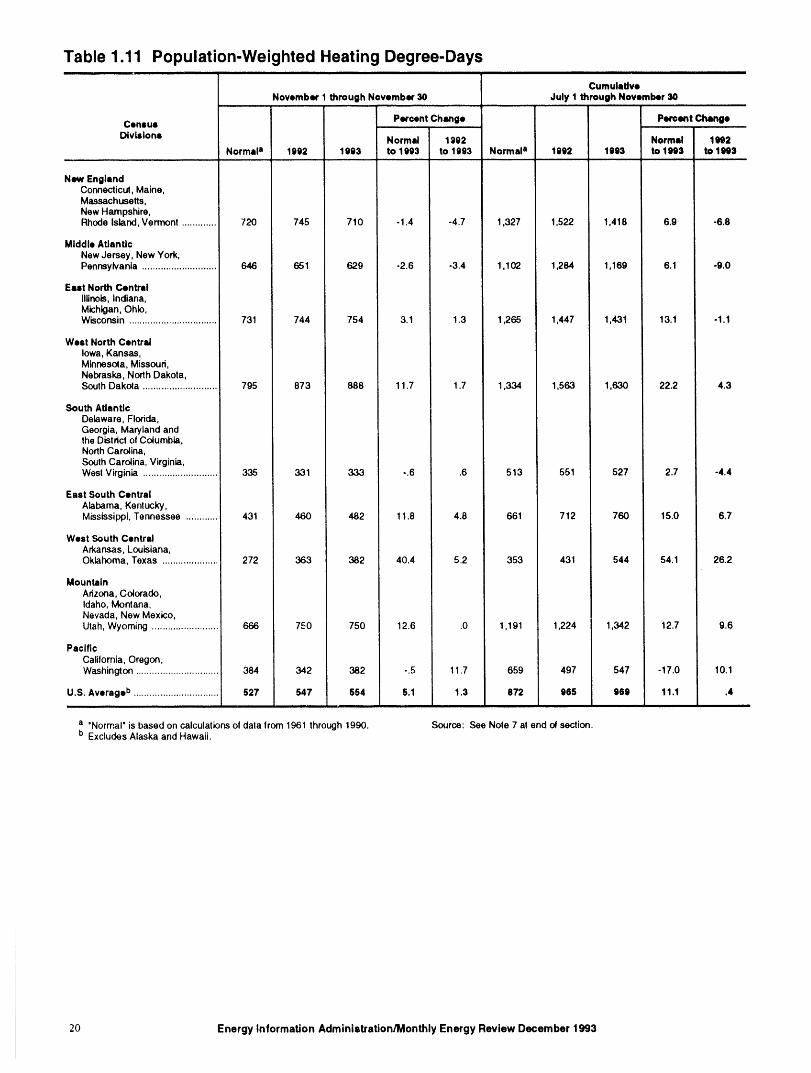
Table 1.11 Population-Weighted Heating Degree-DaysII I I IIII II I II I
CumulativeNovember 1 through November 30 July I through November 30
Census Percent Change Peroent Change
Dtvisiorm Normal 1992 Normal 1002Normala 1992 1993 to 1993 to 1993 Normala 1992 1993 to lU3 to 1993
New EnglandConnecticut,Maine,Massachusetts,NewHampshire,Rhode Island,Vermont ............. 720 745 710 -1.4 -4.7 1,327 1,522 1,418 6.9 -6.8
Middle AtlanticNewJersey, New York,Pennsylvania ............................ 646 651 629 -2.6 -3.4 1,102 1,284 1,169 6.1 -9.0
East North CentralIllinois,indiana,Michigan,Ohio,Wisconsin ................................. 731 744 754 3.1 1.3 1,265 1,447 1,431 13.1 -1.1
West North CentralIowa, Kansas,Minnes(Xa,Missouri,Nebraska, NorthDakota,South Dakota ............................ 795 873 888 11.7 1.7 1,334 1,563 1,630 22.2 4.3
South AtlanticDelaware, Florida,Georgia, Marylandandthe District ol Columbia,NorthCarolina,South Carolina, Virginia,West Virginia ............................ 335 331 333 -.6 .6 513 551 527 2.7 -4.4
East South CentralAlabama, Kentucky,Mississippi,Tennessee ............. 431 460 482 11.8 4.8 661 712 760 15.0 6.7
West South CentralArkansas,Louisiana,Oklahoma, Texas ..................... 272 363 382 40,4 5.2 353 431 544 54.1 26.2
MountainArizona,Colorado,Idaho, Montana,Nevada, New Mexico,Utah, Wyoming ......................... 666 750 750 12.6 .0 1,191 1,224 1,342 12.7 9.6
PacificCalifornia,Oregon,Washington............................... 384 342 382 -.5 11.7 659 497 547 -17.0 1O,1
U.S. Average b ................................ 527 547 554 5,1 1.3 872 965 969 11.1 .4
a 'Normal" is basedon calculationsof datafrom 1961 through1990. Source: See Note 7 at end ol section.b ExcludesAlaska and Hawaii.
20 Energy Information Administration/Monthly Energy Review December 1993
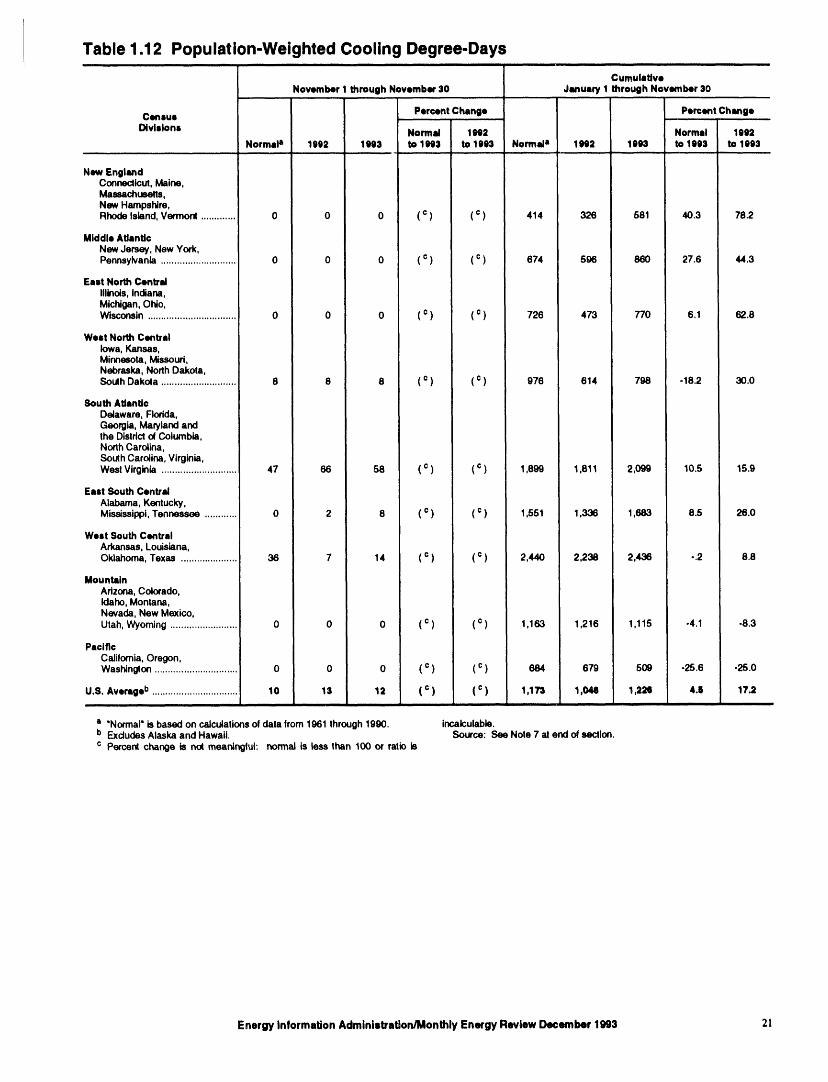
Table 1.12 Population-Weighted Cooling Degree-Days......... i
CumulativeNovember 1 through November 30 Jmtuary 1 through November 30
Census Percent Change Percent Change
Divisions Normal 1002 Normal 1992NormeP 1992 1993 to 1993 to 1003 Normal a 1002 1993 to 1993 to 1993
New EnglandConnecticut,Maine,Massachusetts,New Hampstdre,Rhode Island,Vermont ............. 0 0 0 ( ¢ ) ( c ) 414 326 581 40.3 78.2
Middle AtlanticNewJersey, New York,Pennsylvania ............................ 0 0 0 ( c ) ( c ) 674 596 860 27.6 44.3
East North CentralIllinois0Indiana,Michigan,Ohio,Wisconsin ................................. 0 0 0 ( c ) ( ¢ ) 726 473 770 6.1 62.8
West North CentralIowa, Kansas,Minnesota, Missouri,Nebraska, NorthDakota,South Dakola ............................ 8 8 8 ( c ) ( c ) 976 614 798 -18.2 30.0
South AtlanticDelaware, Rodda,Georgia, Marylandandthe Distdctel Columbia,NorthCarolina,South Carolina, Virginia,West Virginia ............................ 47 66 58 ( c ) ( c ) 1,899 1,811 2,099 10.5 15.9
East South CentralAlabama, Kentucky,Mississippi,Tennessee ............ 0 2 8 ( ¢ ) ( c ) 1,551 1,336 1,683 8.5 26.0
Welt South CentralArkansas,Louisiana,Oklahoma, Texas ..................... 36 7 14 ( ¢ ) ( c ) 2,440 2,238 2,436 -.2 8.8
MountainArizona, Colorado,Idaho,Montana,Nevada, New Mexico,Utah, Wyoming ......................... 0 0 0 ( c ) ( c ) 1,163 1,216 1,115 -4,1 -8.3
PacificCalifornia,Oregon,Washington ............................... 0 0 0 ( c ) ( c ) 684 679 509 -25.6 -25.0
U.S. Averageb ................................ 10 13 12 ( c ) ( c ) 1,173 1,040 1,22e 4.6 17.2i i |-,
'= "Normal" is based on calculations of data from 1961 through 1990. incalculable,b Excludes Alaska and Hawaii, Source: See Note 7 at end of section.c Percent change is no( meaningful: r,ccmalis less than 100 or ratio is
Energy Information Administration/Monthly Energy Review December 1993 21
i
Energy Summary Notes mineral fuels, lubricants, and related material. "Non-Energy Balance" and "Total Merchandise" includeforeign exlx_rts (i.e., reexports) and nonmonetary gold
1. Energy Production: Production of energy includes and Department of Defense Grant-Aid shipments. Theproduction of coal, crude oil and lease condensate, "Non-Energy Balance" is calculated by subtracting thenatural gas plant liquids, natural gas (dry), electric "Energy" from the "Total Merchandise Balance."utility and industrial production of hydroelectric power,and electricity generated from nuclear power. PrCxluc-tion also includes electricity generated for distribution "hnports" consist of government and nongovernmentfrom wood, waste, geothermal, wind, photovoltaic, and shipments of merchandise into the 50 States, the Districtsolar thermal energy but excludes other energy obtained of Columbia, Puerto Rico, the U.S. Virgin Islands, andfrom those sources because consistent historical data are the U.S. Foreign Trade Zones. They reflect the total
not available. Approximate heat contents (Btu values) arrival from foreign countries of merchandise that ira-are derived by using the conversion factors provided in mediately entered consumption channels, warehouses,
the Foreign Trade Zones, or the Strategic PetroleumAppendix A. Reserve. They exclude shipments between the United
States, Puerto Rico, and U.S. pos_ssions, shipments to2, Energy Consumption: Consumption of energy in- U.S. Armed Forces and diplomatic missions abroad foreludes consumption of coal, natural gas (including their own use, U.S. goods returned to the United Statessupplemental gaseous fuels), petroleum products by its Armed Forces, and in-transit shipments.supplied, electric utility and industrial production ofhydroelectric power, net imports of electricity (assumedto be hydroelectricity), net imports of coal coke, and 6. The Consumer Price Index: The values for theelectricity generated from nuclear power. Consumption Consumer Price Index, All Urban Consumers, All Items,also includes electricity generated for distribution from 1982-84=100, _u'e as follows:wood, waste, geothermal, wind, photovoltaic, and solar
1973 44.4 1991 1st Quarter 134.8thermal energy but excludes other energy obtained from
1974 49.3 2nd Quarter 135.6those sources because consistent historical data are not
1975 53.8 3rd Quarter 136.7available. Approximate heat contents (Btu values) are 1976 56.9 4th Quarter 137.7
derived by using the conversion factors provided in 1977 606 Year 136.2Appendix A. 1978 65.2 1992 1st Quarter 138.7
1979 72,6 2nd Quarler 139.8
3. Energy Imports: Energy imports include imports of 1980 82.4 3rdQuarter 140.9coal, crude oil (including crude oil imported for the 1981 90.9 4thQuarter 141.9
Strategic Petroleum Reserve), petroleum products, 1982 96.5 Year 140.3natural gas, electricity (assumed to be hydroelectricity), 1983 99.6 1993 lstQuarter 143.1and coal coke. Approximate heat contents (Btu values) 1984 103.9 2ndQuarter 144.2are derived by using the conversion factors provided in 1985 107.6 3rdQuarter 144.8Appendix A. For further information on electricity, see 1986 109.6"Note for imports and exports of electricity" under Note 1987 113.68 of the Notes and Sources for the Energy Consumption 1988 118.3Section. 1989 1240
1990 130.7
4. Energy Exports: Energy exports include coal, crude 7. Degree-Days: I)egree-days are relative measure-oil, petroleum products, natural gas, electricity produced mcnts of outdoor air temperature. Cooling degree-daysfrom hydroelectric power, and coal coke. Approximate arc defined as deviations of the me_m daily temperatureheat contents (Btu values) are derived by using the con- at a sampling station above a base temperature equal toversion factors provided in Appendix A. For more 65°I 7 by convention, lteating degree-days are deviationsinformation on electricity, see "Note for imports _md ex- of the mean daily temperature below 65° F. For ex-ports of electricity" under Note 8 of the Notes and ample, if a weather station recorded a mean dailySources for the Energy Consumption Section. temperature of 78 °F, cooling degree-days for that station
would be 13 (and heating degree-days, 0). A weather5. Merchandise Trade Value: Import data presented station recording a mean daily temperature of 40 ° Fare based on the customs value. That value does not would report 25 heating degree-days (and 0 cooling de-include insurance and freight and is consequently lower gree-days).than the cost, insurance, and freight (CIF) value, which
is also reported by the Bureau ()t the Census. All cxp_)rt There are several degree-day databases maintained bydata, and import data prior to 1981, arc on a free the National ()ccanic and Aunospl-_cric Administration.alongside ship (f.a.s.) basis. The information published in the Monthly Energy
Review (MER) is developed by the National Weather"Balance" is exports minus imports; a positive bahmce Service Climate Analysis Center, C;unp Springs, MI).indicates a surplus trade value and a negative balance The data are available weekly with monthly summariesindicates a deficit trade value. "Energy" includes and arc based on mean daily temperatures recorded at
22 Energy Information Administration/Monthly Energy Review December 1993
about 200 major weather stations around the country. Trade, 1990 Final Report." 1991" "U.S. MerchandiseThe temperature information recorded at those weather Trade, 1991 Final Report," May 13, 1992, and "U.S.stations is used to calculate statewide degree-day Merchandise Trade, October 1992," December 17, 1992,averages based on population. The State figures are page 3. 1992: "U.S. Merchandise Trade, 1992 Finalthen aggregated into Census Divisions and into the Report," May 12, 1993. 1993: "U.S. Merchandisenational average. The population weights currently Trade," I-,-3'900,monthly.used represent resident State population data estimated
for 1980 by the U.S. Department of Commerce, Bureau • Energy Exports and lmportsm1974.1987: U.S.of the Census. The data shown in the MER are available merchandise trade press releases and database printoutssooner than the Historical Climatology Series 5-1 and for adjustments. 1988: January-July, monthly FT9005-2 developed by the National Climatic Center, supplement, 1989 issues. August-December, monthlyAsheville, Ix!C, which compiles data from some 8,000 FT900, 1989 issues. 1989: Monthly FT900, 1990weather stations, issues. 1990: "U.S. Merchandise Trade, 1990 Final
Report." 1991: "U.S. Merchandise Trade, 1991 Final
Sources for Table 1.6 Report," May 13, 1992, and "U.S. Merchandise Trade,October 1992," December 17, 1992, page 3. 1992:"U.S. Merchandise Trade, 1992 Final Report," May 12,
U.S. Department of Commerce, Bureau of the Census, 1993. 1993: "U.S. Merchandise Trade," FT900,Foreign Trade Division: monthly.
• Petroleum Exportsm1974-1987: "U.S. Exports," * Total Merchandise_1974-1987: U.S. merchandiseFT410, December issues. 1988: "Report on U.S. Met- trade press releases and database printouts for adjust-chandise Trade, 1988 Final Revisions." 1989: "Report ments. 1988: "Report on U.S. Merchandise Trade,on U.S. Merchandise Trade, 1989 Revisions." 1990: 1988 Final Revisions," August 18, 1989. 1989:"U.S. Merchandise Trade, 1990 Final Report." 1991: "Report on U.S. Merchandise Trade, 1989 Revisions,".q
"U.S. Merchandise Trade, 1991 Final Report," May 13, July 10, 1990. 1990: "U.S. Merchandise Trade, 19901992. 1992: "U.S. Merchandise Trade, 1992 Final Final Report," May 10, 1991, and "U.S. MerchandiseReport," May 12, 1993. 1993: "U.S. Merchandise Trade, December 1992," February 18, 1993, page 3.Trade," FT900, monthly. 1991-1992: "U.S. Merchandise Trade, 1992 Final
Report," May 12, 1993. 1993: "U.S. Merchandise
° Petroleum Imports_1974.1987: "U.S. Merchandise Trade," FT900, monthly.Trade," FT900, December issues, 1975-1988. 1988."Report on U.S. Merchandise Trade, 1988 Final ° Petroleum Balance, Energy Balance, and Non-Ener-Revisions." 1989: "Report on U.S. Merchandise gy Balance--Calculated by the Energy InformationTrade, 1989 Revisions." 1990: "U.S. Merchandise Administration.
EnergyInformationAdministration/MonthlyEnergyReviewDecember1993 23
Section 2. Energy Consumption
U.S. total energy consumption in September 1993 was Transportation sector consumption of energy was 1.96.6 quadrillion Btu. Petroleum products accounted for quadrillion Btu in September 1993, up 5 percent from43 percent _ of the energy consumed in September the September 1992 level. The sector accounted for
1993, while coal accounted for 24 percent and natural 29 percent of September 1993 total consumption, aboutgas accounted for 21 percent, the same share as in September 1992.
Residential and commercial sector consumption was2.1 quadrillion Btu in September 1993, up 4 percentfrom the September 1992 level. The sector accounted Electric utility consumption of energy totaled 2.5for 32 percent of September 1993 total consumption, quadrillion Btu in September 1993, up 1 percent from
about the same share as in September 1992. the September 1992 level. Coal contributed 55 percentof the energy consumed by electric utilities in Septem-ber 1993 while nuclear electric power contributed 21
Industrial sector consumption was 2.6 quadrillion Btuin September 1993, up 3 percent from the September percent; natural gas 11 percent; hydroelectric power 81992 level. The industrial sector accounted for 39 per- percent; petroleum 4 percent; and wood, waste,cent of September 1993 total consumption, about the geothermal, wind, photovoltaic, and solar thermalsame share as in September 1992. energy, about 1 percent.
Table 2.1 Energy Consumption Summary for September 1993(Quadrillion Btu)
End-Use Sectors
Ruldentialand Electric
Energy Source Commercial Industrial Transportation Total a Utilities Total...................
Coal ........................................................ 0,011 0,205 ( b) 0.216 1,384 1.599NaturalGasc ............................................ 273 ,795 ,041 1.110 .265 1,374Petroleum ................................................ 165 .721 1.867 2,754 .102 2,856Nuclear ElectricPower ........................... - - - - .537 ,537HydroelectricPowerd .............................. - .002 - .002 .210 ,213Net imports ot Coal Coke ....................... - -.001 - ..001 - -.001Othere ..................................................... - .... .015 .015
Primary Consumption ......................... 449 1.721 1.909 4,080 2.513 6,593Electricity ................................................. 576 .286 .001 .864 - -
Net Consumption ................................ 1.025 2,007 1.910 4.944 - -ElectricalSystem Energy Losses ........... 1.101 .546 .002 1.649 - -
Total Consumption f ............................ 2,125 2,554 1.913 6,593 - -.....
a Totals for coal and naturalgas may not equal sum of sectors due to the sources are not included. For example, in 1991, 3.3 quadrillion Btu eluse of sector-specilicconversionfactors, renewable energy consumedby U,S. electricutilitiesto generate electricitytot
b Small amounts of coal consumed for transportation are reported as distributionis included, but an eslimaled 3.4 quadrillion Blu of renewableindustrialsectorconsumption, energy used by other sectors is not included,
c Includes supplemental gaseous fuels. Transportationsector is pipeline - =Nol applicable, (s)=Less than +0,5 trillion Btu and greater than -0.5fuel only. trillion BIu.
d includes net imports o_electricity. Note: Totals may not equal sum ot components due to independente "Other" is electricity generated for dislribution from wood, waste, rounding.
geq.th_mal, wind, photovollaic, and solar thermal energy. Additional Notes and Sources: See Tables 2.2-2.6 and end el section.v Due to a lack of consistent historical data, some renewable energy
1percentage changes are based on numbers In the following tables.
EnergyInformationAdministration/MonthlyEnergyReviewDecember1993 25
Figure 2.1 Energy Consumption by End-Use Sector(QuadrillionBtu)
Consumption by End-Use Sector, 1973-1992
4O
30 _ _lndustdal .. -- -- -- -- -
Residential and Commercial ...............
20 .... . .r
Transportation
10
0 I t r-'- ......... _ T _......... t T........ _ F ........ _ .... T ....... l ...... "--'-T I T i
1974 1976 1978 1980 1982 1984 1986 1988 1990 1992
Consumption by End-Use Sector, Monthly
4_r-- ................................................................................................................................................................
t -, Residential andCommercial\\ / \ I _,
\ / \ t _ ._...3-_ ', , ,, j
L "-- -., _ /___._._ "- ,, Industrial / ..,,._,
I ".... Transportation
I
Nole:Becauseverticalscalesdiffer,graphsshouldnotbecompared.Source:Table2.2,
26 Energy Information Adminlltration/Monthly En_gy Review December 1993
Table 2.2 Energy Consumption by End-Use Sector(Quadrillion Btu)
..............................................
Reeldentlal and Commercial Industrial Transportation......... i ...............
Net Total Net Total Net Total Net Totala...............
1973 Total ...................... 15.766 24.143 25.917 31.528 18.584 18.605 60.274 74.2821974 Total ...................... 15.246 23.724 24.994 30.696 18.095 18,117 68.341 72.6431975 Total ...................... 15.200 23.900 22.737 28.401 16.219 18.244 56.157 70.5461976 Total ...................... 15.997 25.020 24.038 30.234 19.076 19.101 69.119 74.3621977 Total ...................... 15.828 25.387 24.593 31.075 19.794 19.619 60.223 76.2881978 Total ...................... 16.023 26.088 24.637 31.388 20.589 20.611 61.251 76.0691979 Total ...................... 15.709 25.809 25.679 32.615 20.447 20.472 61,836 78.8981980 Total ...................... 15.075 25.653 23.854 30.609 19.669 19.695 58.597 75.9551981 Total ...................... 14.541 25.243 22.533 29.238 19.480 19.507 56.556 73.9901982 Total ...................... 14.629 25.630 20.020 26.144 19.043 19.069 53.697 70.6481983 Total ...................... 14.395 25.630 19.401 25.756 19,109 19.135 52.907 70.5241984 Total ...................... 14.964 26,478 21.184 27.862 19.773 19.801 55,923 74,1441985 Total ...................... 14.839 26.704 20.520 27,213 20.036 20.067 55.391 73.9811986 Total ...................... 14.791 26.852 20.101 26.529 20.781 20.812 55.676 74.2971987 Total ...................... 15.146 27.621 21.116 27.828 21.419 21.448 57.676 76.6941988 Total ...................... 16.004 28.922 22.085 28.988 22.274 22.305 60.365 60.2181989 Total ...................... 16.261 29.402 22.272 29.355 22.530 22.561 61.070 81,3251990 Total ...................... 15.568 28.790 22.841 29.932 22,504 22.535 80.921 81.255
1991 January ................. 2.141 3.376 2,048 2,620 1,795 1,798 5,984 7.795February ................ 1.754 2.729 1.765 2.261 1.653 1,655 5,170 6.643March ..................... 1.585 2,632 1,856 ?.420 1,842 1.844 5.280 6,893April ....................... 1.234 2.179 1.788 2,339 1,784 1.786 4,805 6.302May ........................ 1024 2,111 1,757 2.397 1,882 1.885 4.663 6394June ........................ 972 2.171 1764 2,381 1,863 1.866 4,603 6.421July ........................ 1.029 2,396 1.822 2.463 1.952 1955 4.808 6.818August ................... 1,002 2.327 1.869 2.511 1953 1,956 4,828 6.798September .............. 982 2,078 1906 2,461 1.802 1.804 4.690 6.344October .................. 1.063 2.076 2,001 2,590 1893 1.896 4.956 6,561November .............. 1,406 2.421 1.960 2.536 1.783 1.785 5,146 6.740December .............. 1.793 2928 2.014 2,591 1888 1.891 5 694 7.408Total ...................... 15,986 29.424 22.549 29.571 22.090 22.120 60.626 81.116
1992 January .................. 2040 3,237 2.060 2.631 1.815 1.817 R5.914 7.684February ................ 1,828 2838 1.889 2,406 1.750 1.753 5,465 6,994March ..................... 1.610 2,636 1997 2.573 1.865 1.868 5.470 7.074April ...................... 1.343 R2286 1896 2.444 1.838 1.840 5.075 6.569May ....................... 1,060 2.049 1888 n 2.485 1.903 1,906 4.850 6.440June ....................... 943 2.040 1864 R2,497 1866 t .869 4,675 6.408July ....................... 1018 R2,325 1.894 R2,549 1,946 1.948 R4.863 6.828August ................... 987 _ 2.216 1923 a2.548 1907 1910 R4.820 6.678September .............. 961 2,0'51 1,896 2.477 1.828 1830 4.687 6.361Oclober .................. 1,096 2,087 2.023 2603 1.902 1,904 R5,022 6595November .............. 1,372 2.389 2,014 2.610 1.802 1.804 5.187 6802December ............ 1.919 3.127 2085 2.677 1.963 1.965 R5.968 7.771Total .................... 15.178 29.279 23,429 30.504 22,384 22.414 61.998 82.203
1993 January ................. 2 099 3.310 2,038 2,609 1,776 1,778 5.913 7.698February ............ 1966 3.017 1.921 2,454 1.743 1.745 5.629 7.216March ............. 1.853 2,950 2.082 2,653 1952 1.954 5.887 7,557April ..................... 1.381 2 320 1900 R2448 1.865 1.868 5.145 6,634May ..................... 1,022 2 O17 1821 2,437 1.941 1.944 4.783 6396June ..................... 979 2,144 1885 2533 R1891 R1894 a 4.758 n 6,573July ..................... 1.067 a 2 482 1.890 2,544 a 1,973 _ 1.976 R4,936 P'7,009August ............... 1047 2.439 R 1.896 R2.542 R 1969 a 1.972 R4.918 R6.959September ............. 1.025 2,125 2 007 2.554 1,910 1,913 4.944 6,5939.Month Total ....... 12,439 22.804 17.440 22.774 17.020 17.043 46.913 62.635
1992 9.Month Total ....... 11.790 21.678 17,307 22,611 16,718 16,740 45.821 61.0351991 9-Month Total ....... 11.723 21.999 16.575 21.853 16,525 16.549 44,830 60,408
a Due to a lack of consistent hislorical data, some renewable energy R=Reviseddata.sources are nol included For example, in 1991, 3.3 quadrillion I_u ol Notes: . GeograpMc coverage is the 50 States and the District ol Cotumbia.renewable energy consumed by US. elecldc utilities to generate electricity for . Totals may not equal sum of components due to independent rounding anddtstnbution is included, but an estimated 3.4 quadrillion Btu of renewable the use ol sector-specilic conversion factors for natural gas and coal.energy used by olher sectors is not included Additional Notes arid Sources: See end of section.
Energy Information Administration/Monthly Energy Review December 1993 27
Figure 2.2 Residential and Commercial Energy Consumption(Quadrillion Btu)
Consumption by Major Sources, 1973-1992
10 ........................................................................................................................................................................................................
8- __ Natural Gas
6 _ _ -_ _ _ _ _ _-
Electricity.............. --
4 " .... I _ _ _ --
Petroleum
2 ............ i
o] ,'r r 1-"----------T .......... 1--- .... _ ....... _".......... T ........ T T--"........... _ ........... r .......... r"- ........... t .......... 1 r ..... -----'r
1974 1976 1978 1980 1982 1984 1986 1988 1990 1992
Consumption by Major Sources, Monthly
1.5
10 f_Natural Gas
0,5 k . ...._.. i t i _ "_ k / -- _" --- ..._ ...I r --" _" "_ i i l
! Petroleum0,0 "_1 t I --'--T-'-"--T---_'-'T----T'----'T'_-T-_-t---'---F---'--T---r----'T ..... T<-_"r .... r-'*'---T"--"_r-'-'-'-r-'----r'_+--r - .... r ....... _ ..........7-'T----_T-----T-+_''--I -- i !
J F M A M J J A $ 0 N D J F M A I_ J J A S 0 N D J F M A M J J A S 0 N O
1991 1992 1993
Total Consumption, January-September Consumption by Major Sources,September 1993
25 22.804 I21.999 21.678 ----_-_ ____,._
f""-"--_ " " Natural Gas I.______ 0.273
....
20 : : .... i .....: :|
........... ;:::: J :::::
................ ..... L:_ :J: "::.::: • ::::..:.;::;:;.;::. ....
i::! i::i;ili:.ii::.!i:.!i!: i :.... Electricity 0.576
iiiiii:,iililil)i!!ii!iiiii?1 : r: ...._ :
5
, Petroleum O.165
i ..................... _ r 1" r T
1991 1992 1993 0.0 0.4 0.8 1.2 .6
Note:Becauseverticalscalesdiffer,graphsshouldnot be compared,Source:Table2.3,
28 Energy Information Administration/Monthly Energy Review December 1993
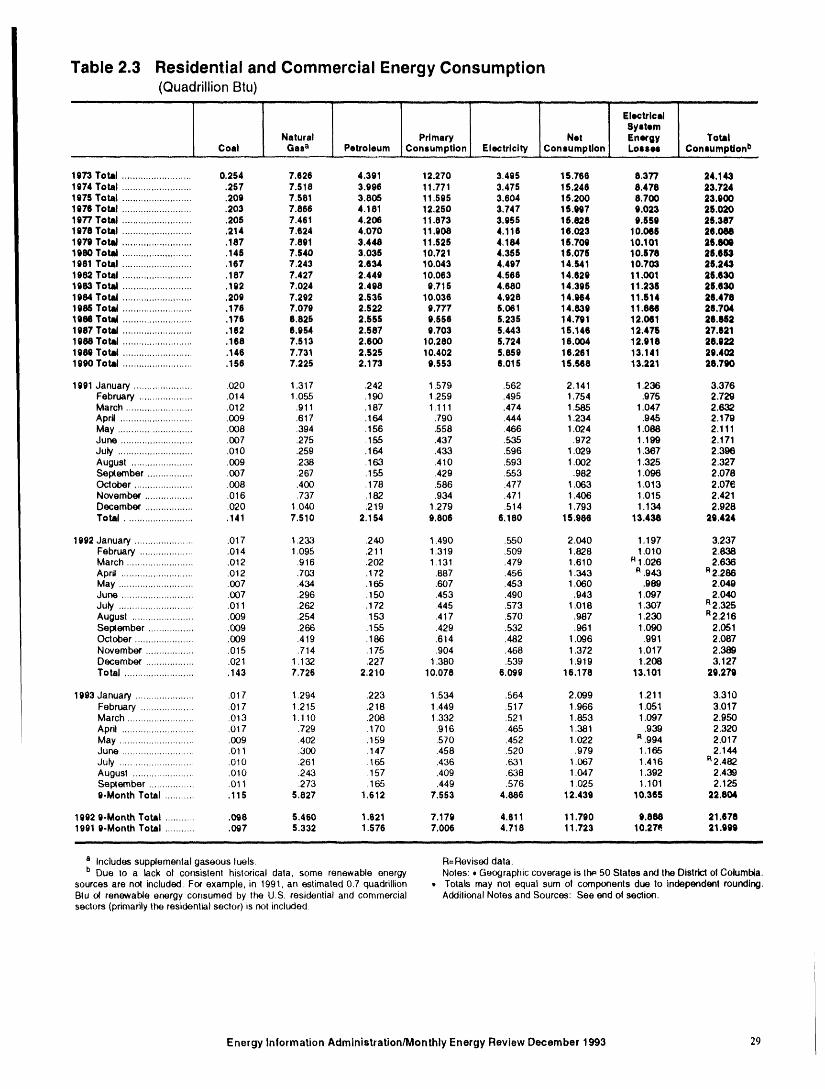
Table 2.3 Residential and Commercial Energy Consumption(Quadrillion Btu)
i , i .=, ii, i i . i, i, i ,, ,,, i ,,i i i i ii i r i
Electrical
SystemNatural Primary Nat Energy Total
Coal Gasa Petroleum Consumption Electricity Consumption Losses Consumptionb
1973 Total .......................... 0.254 7.626 4.391 12.270 3,495 15.766 8.377 24.1431974 Total ........................... 257 7.518 3.996 11.771 3.475 15.246 8.478 23.7241975 Total ........................... 209 7.581 3.805 11.595 3.604 15.200 8.700 23.9001976 Total ........................... 203 7.866 4.181 12.250 3.747 i S.997 9.023 26.0201977 Total ........................... 205 7.461 4.206 11.873 3,955 15.828 9.556 25.3871978 Total ........................... 214 7.624 4.070 11.908 4.116 16.023 10.065 26.0_11979 Total ........................... 187 7.891 3.448 11.525 4.184 15.700 10.101 26.8Oe1980 Total ........................... 145 7.540 3.035 10,721 4.355 15.075 10.578 26.6631981 Total ........................... 167 7.243 2.634 10.043 4.497 14.541 10.703 26.2431982 Total ........................... 187 7.427 2.449 10.063 4.566 14.629 11.001 26.8301983 Total ........................... 192 7,024 2.498 9.715 4.680 14.395 11.236 26.6301984 Total ........................... 209 7,292 2.535 10.036 4.928 14.964 11.514 26.4781985 Total ........................... 176 7.079 2.522 9.777 5.061 14.839 11.866 26.7041989 Total ........................... 176 6.825 2.555 9.556 5.235 14.791 12.O61 26,6521987 Total ........................... 162 6.954 2.587 9203 5.443 15.146 12.475 27.6211989 Total ........................... 168 7.513 2.600 10.280 5.724 16.034 12.918 28.9221989 Total ........................... 146 7.731 2.525 10.402 5.859 16.261 13.141 29.4021990 Total ........................... 156 7.225 2.173 9.553 6.015 15.568 13.221 28.760
1991 January ....................... 020 1.317 .242 1.579 .562 2,141 1.236 3,376February ..................... 014 1.055 .190 1259 .495 1.754 .975 2,729March .......................... 012 .911 .187 1,111 .474 1385 1.047 2.632April ............................ 009 ,617 .164 .790 .444 1.234 .945 2,179May ............................. 008 .394 ,156 .558 .466 1.024 1.088 2,111June ............................ 007 ,275 ,155 .437 ,535 ,972 1.199 2.171July ............................. 010 .259 .164 .433 .596 1.029 1.367 2.396August ........................ 009 .238 .163 .410 .593 1.002 1.325 2,327September .................. 007 267 .155 .429 .553 .982 i .096 2.078October ....................... 008 ,400 .178 ,586 ,477 1.063 1.013 2.078November ................... 016 .737 .182 ,934 .471 1.406 1.015 2.421December ................... 020 1040 219 1.279 514 1.793 1.134 2.928Total .......................... 141 7.510 2.154 9.806 6,180 15,986 13.436 26.424
1992 January ....................... 017 1.233 .240 1.490 .550 2.040 1.197 3.237February ..................... 014 1.095 .211 1.319 ,509 1328 1.010 2.838March .......................... 012 916 .202 1.131 .479 1.610 R1.026 2.636April ............................ 012 203 .172 .687 .456 1.343 R .943 R2.286May ............................. 007 .434 .165 .607 .453 1.060 .989 2.049June ............................ 007 ,296 .150 .453 .490 .943 1.O97 2.040July ............................. 011 262 ,172 445 ,573 1,018 1.307 R2.325August ........................ 009 .254 153 .417 ,570 .987 1.230 R2.216September .................. 009 .266 .155 .429 .532 ,961 1.090 2.051October ....................... 009 .419 .186 .614 .482 1.096 991 2.087November ................... 015 ,714 .175 ,904 .468 1.372 1.017 2.389December ................... 02 1 1.132 .227 1380 .539 1,919 1208 3.127Total ........................... 143 7.726 2.210 10.078 6.099 16,178 13.101 29.279
1993 January ....................... 017 1.294 .223 1.534 ,564 2.099 1.211 3.310February ..................... 017 1.215 .218 1.449 517 1966 1.051 3.017March .......................... 013 1.1t0 208 1,332 .521 1.853 1.097 2.950April ........................... 017 ,729 .170 ,916 ,465 1.381 .939 2.320May ............................. 009 402 ,159 570 .452 1.022 R .994 2,017June ............................ 011 300 .147 .458 .520 .979 1.165 2.144July ............................. 010 .261 ,165 .436 .631 1.067 1.416 R2.482August ........................ 010 243 .157 .409 .638 1.047 1392 2.439September .................. 011 273 .165 .449 .576 1.025 1.101 2.1259-Month Total ............ 115 5.827 1.612 7,553 4.886 12.439 10.365 22.804
1992 g-Month Total ............ 098 5.460 1.621 7.179 4.611 11.790 9.888 21.6781991 9-Month Total ............ 097 5.332 1.576 7.006 4.718 11.723 I0.27_. 21.999_ i i ,, ,,i.,,, i ,.. i ,, i , | , i, i, iiiiii
a Includes supplemental gaseous luels R=Revised data.b Due to a tack el consislent historical data, some renewable energy Notes: • Geographiccoverage is lrm 50 States and the Districtel Columbia.
sources are no_included. For example, in 1991. an estimated 0.7 quadrillion ,, TotaLsmay not equal sum el componentsdue to Independenl rounding.Btu el renewable energy consumed by the US. residential and commercial AdditionalNotes and Sources: See end of section,sectors (primarilythe residentialsector) is not included
Energy Information Administration/Monthly Energy Review December 1993 29
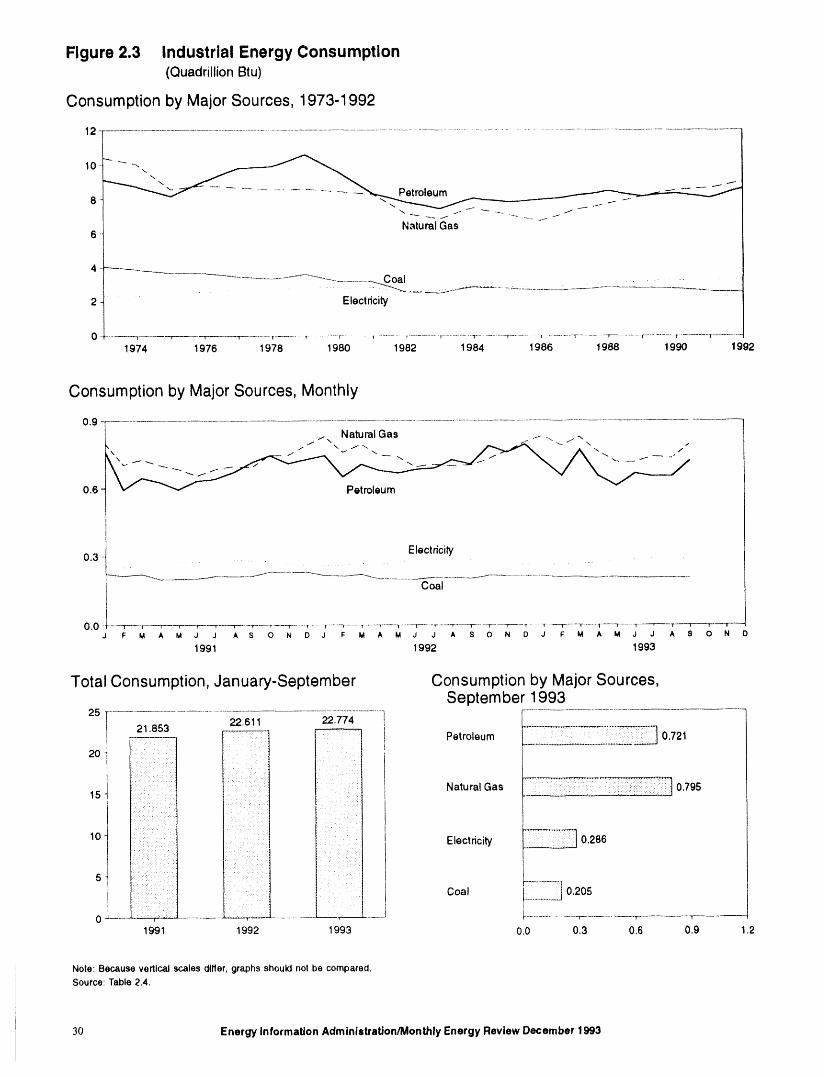
Figure 2.3 Industrial Energy Consumption(Quadrillion Btu)
Consumption by Major Sources, 1973-1992
12 .............................................................................................................................................................................................................................
Natural Gas6
____.I--_ Coal ........
2 Electricity
O 1 _ T ...... T ....... r ....... -_r ................. r ........ _ ......... _ ............ T................ X.......... T .......... l ............. ! ................... _ ....... ---1- ......... _ ......... T ........
1974 1976 1978 1980 1982 1984 1986 1988 1990 1992
Consumption by Major Sources, Monthly
0.9
-[ 1,, Natural Gas t- \ .f --k ./ \ i--.. _ _ "- " ,"
t_', ... _..,,_-J..---_ "-- _/--'_" \ A -. f--,
0.6
I
0.3 -_ . . . Electricity ...
Coal
0,0 -k-'--T--'----r-_r-----x----'--r-_-'--r----m---" --_'---_ .... 1----X---- T----_r---T-'---_-_-'--T - ...... r-----T-----r----n--" =--r ...... r----- r ..... "T ---1----T----r--"T----r----1----x-----r---'-r-----r_
J F M A M J J A S O N D J F: M A M J J A S O N D J F M A M J J A 9 O N O
1991 1992 1993
Total Consumption, January-September Consumption by Major Sources,September 1993
25 ....................................................................................22.611 22.774
21.853 -_t : Petroleum 0,721_----20 _ :: ::t:, : 4
15 :. ::_: ......._ :: ::.......... _ : • : Natural Gas : 0,795: . : :::t:: :] ......: :: : : I : : • 1 :":.: .,: .. i : :: .::: ] . .
" : ' ' 1" : i
::::J : ......... _ : ;: Electricity 0,286
.......... _..... Coal 0.205-, :: .. ,I k : " ,
0 .L_ , ::: ] ........................................... --_ _r r
1991 1992 1993 0.0 0,3 0,6 0.9 .2
Note: Because verlical scales differ, graphs should not be compared.Source: Table 2.4.
30 Energy Information Administration/Monthly Energy Review December 1993
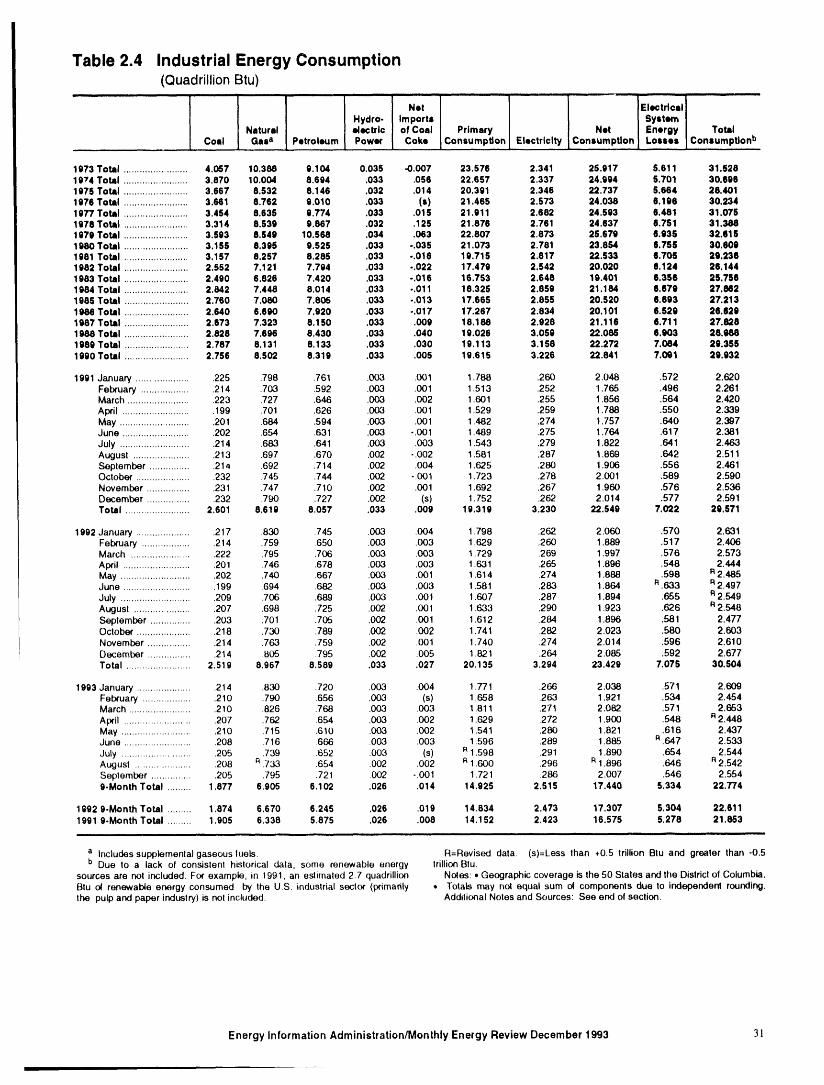
Table 2.4 IndustrialEnergy Consumption(Quadrillion Btu)
!1I ..................... I" '1 ,., '1 .......I Hydro- I Imports I _ System I
Natural I electric I of Coal I Primary Net I Energy I Total[ Coal 1 Gala, I Petroleum I Power i Coke JConsumption Electricity Consumptionl Losses I Consumptionb
1973To,,,,.......................4=7 10.3= 9.19 0.035 .0.007 23.576 2.341 25.917 5.811 31.52819,4Toll........................3.87010.09 8.594 .033 .058 22.857 2.337 24.994 5.701 30.8981975 Total ........................ 3.667 8.532 8.146 .032 .014 20.391 2.346 22.737 5.884 28.4011976Total........................3.,1 8.762 9.010 033 (,) 21.465 2.573 24.033 5.198 30.2341977 Total ........................ 3.454 8.635 9.774 .033 .015 21.911 2.862 24.593 5.481 31,0751978 Total ........................ 3.314 8.539 9,867 .032 .125 21.876 2,761 24.837 8.751 31.3881979 Total ........................ 3.593 8.549 10.568 .034 .063 22.807 2.873 25.679 8,935 32,8151980 Total ........................ 3.155 8.395 9.525 .033 ..035 21.073 2.781 23.864 6.756 30.8091981 Total ........................ 3.157 8.257 8.285 .033 -.016 19.715 2,817 22.533 6.705 29.2361982 Total ........................ 2.552 7.121 7.794 .033 -.022 17.479 2.542 20.020 6.124 26.1441983 Total ........................ 2.490 6,826 7.420 .033 -.016 16,753 2.648 19,401 6.356 25,7561984 Total ........................ 2,842 7.448 8,014 .033 -.011 18.325 2.859 21.184 6.679 27.8621985 Total ........................ 2.760 7.060 7,805 .033 -.013 17.665 2.855 20.520 8.893 27.2131986 Total ........................ 2.640 6.690 7.920 .033 -.017 17.267 2.834 20.101 6.529 26.6291987 Total ........................ 2.673 7.323 8.150 .033 .009 18.188 2,928 21.118 6.711 27.8281988 Total ........................ 2,828 7.696 8,430 .033 .040 19.026 3.059 22.085 8,903 28,9881989 Total ........................ 2.787 8.131 8.133 .033 .030 19,113 3.158 22.272 7.084 29.3551990 Total ........................ 2.756 8.502 8,319 .033 ,005 19.615 3.226 22.841 7.091 29.932
1991 January ..................... 225 .798 .761 .003 .001 1.788 .260 2.048 .572 2.620February ................... 214 .703 .592 .003 .O01 1.513 .252 1.765 .496 2.261March ........................ 223 .727 .648 .003 .002 1.601 .255 1.856 .564 2.420Awil .......................... 199 .701 .626 .003 O01 1.529 .259 1.78,8 .550 2.339May ........................... 201 684 .594 .003 .001 1.482 .274 1.757 .640 2.397June .......................... 202 .654 .631 .003 -.001 1.489 275 1.764 .617 2.381July ........................... 214 683 .641 .003 .003 1.543 .279 1.822 .641 2.463August ...................... 213 .697 .670 .002 -.002 1.581 .287 1.869 .642 2.511September ................ 21,_ .692 .714 .002 .004 1.625 .280 1.906 .556 2.461October ..................... 232 .745 .744 .002 -.001 1.723 .278 2.001 .589 2.590November ................. 231 .747 .710 .002 .001 1.692 .267 1.960 .576 2.536December ................. 232 .790 .727 .002 (s) 1.752 .262 2.014 .577 2.591Total ........................ 2.601 8.619 8.057 .033 .009 19.319 3.230 22.549 7.022 29.571
1992 January ..................... 217 .830 .745 .003 .004 1.798 .262 2.060 .570 2.631February ................... 214 .759 .650 .003 .003 1.629 .260 1.889 .517 2.406March ....................... 222 .795 .706 .003 .OO3 1.729 .269 1.997 .576 2.573Awil .......................... 201 .746 .678 .003 .003 1.631 .265 1.896 .548 2.444May ........................... 202 .740 .667 .003 .001 1.614 .274 1.888 .598 R2.485June .......................... 199 694 .682 .003 .003 1.581 .283 1.864 R.633 R2.497July ........................... 209 .706 .689 .003 .001 1.607 .287 1.894 .655 R2.549August ...................... 207 .698 .725 .002 .001 1.633 .290 1.923 .626 R2.548September ................ 203 .701 .705 .002 .001 1.612 284 1.896 .581 2.477Octob_ ..................... 218 .730 .789 .002 .002 1.741 282 2.023 .580 2.603November ................. 214 .763 .759 002 .001 1.740 274 2.014 .596 2.610December ................. 214 805 795 .002 .005 1.821 .264 2.085 .592 2677Total ........................ 2.519 8.967 8.589 .033 .027 20.135 3.294 23.429 7.075 30.504
1993 January ..................... 214 .830 .720 003 .004 1.771 .266 2.038 .571 2.609February ................... 210 .790 656 .003 (s) 1658 263 1.921 .534 2.454March ........................ 210 .826 .768 .003 .OO3 1.811 .271 2.082 .571 2.653April .......................... 207 .762 .654 .003 002 1.629 272 1.900 .548 R2.448May ........................... 210 .715 .610 .OO3 .002 1.541 .280 1.821 .616 2.437June .......................... 208 .716 666 .003 .003 1.596 .289 1.885 R.647 2.533July .......................... 205 .739 .652 .003 (S) a 1.598 .291 1.890 .654 2.544August ...................... 208 R.73,3 .654 .002 .002 R1.600 .296 n 1.896 .646 R2.542September ................ 205 .795 .721 .002 -.001 1.721 .286 2.007 .546 2.5549-Month Total ......... 1.877 6.905 6.102 .026 ,014 14.925 2.515 17.440 5.334 22.774
1992 9-Month Total ......... 1.874 6.670 6.245 .026 .019 14.834 2.473 17.307 5.304 22.6111991 9-Month Total ......... 1.905 6.338 5.875 .026 .008 14.152 2.423 16.575 5.278 21,853
a Includes supplemenlal gaseous luels. R=Revised data. (s)=Less than +0.5 trillion Blu and greater than -0.5b Due to a lack of consislent historical data, some renewable energy trillion Btu.
sources are not included. For example, in 1991. an estirnaled 2.7 quadrillion Notes: • Geographic coverage is the 50 Stales and the Dislricl of Columbia.Btu o_ renewab4e energy consumed by the U.S. industrial sector (wimarily • Totals may not equal sum o4 components due to independent rounding.the pulp and paper industry) is not included. Additional Notesand Sources: See end ol section.
Energy Information Administration/Monthly Energy Review December 1993 31
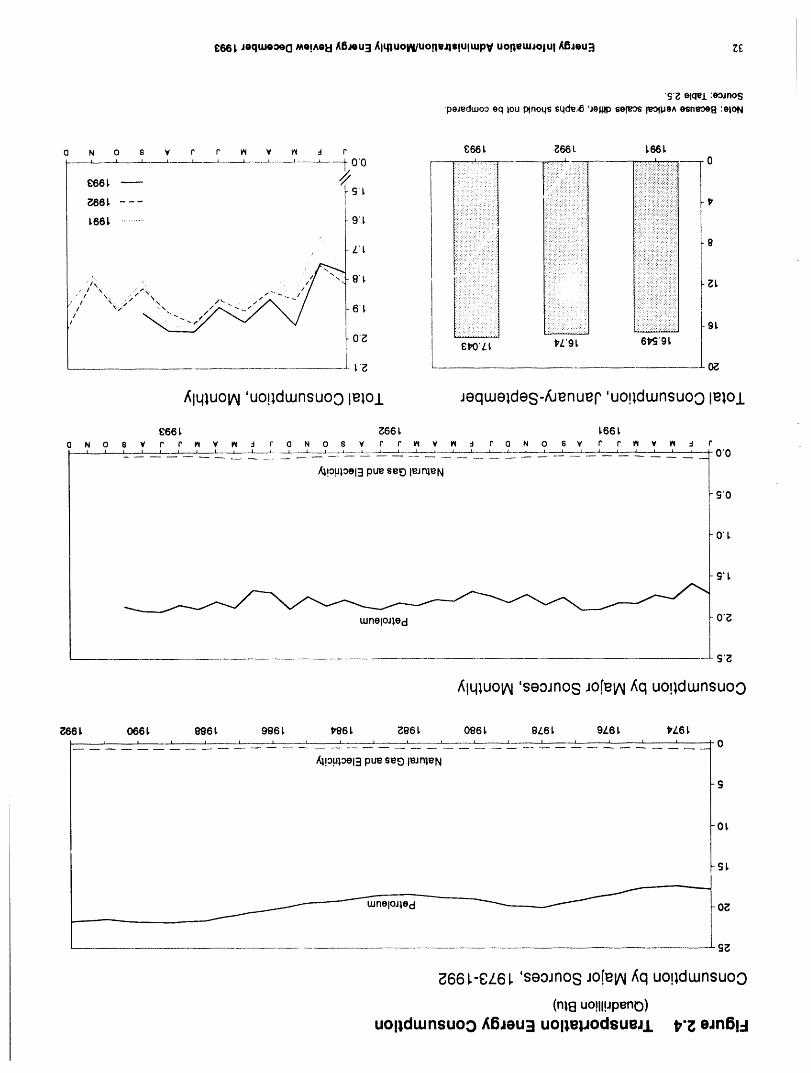
CSS__equJeoeaMo!^oI:IA6Jeu3 AlqlUOlN/UOne,rls!u!mpvuorleLuJotulAISJeu3 _E
I
•s'8 etqel:eoJnos•peJedwooeqlouPlnoqssqche.JO'Jegl_seleo_leOllJe^esneoe8:elON
0 N 0 S V r r m v m _ r £66l _661 L66L
i !:,:ili:ii:i_::,/::;_::i::_il i::;ii?i!_:il::i}!!i:,iiiii::iiiiit_66 L _ /_ ii:'iiii!i;:iii!ii:!i;i!;!ii..............................
!i;;il;i!!i;:i;iii!iii :i!il
L66L .............. 9'I. .......... :!:!;:!!i!/:i:i:i:ii:i?: :,iii:!il_:i:>:?;i:i:::i'ii::?i:'l
::::,: ..,:::.:.::: ,: :. ...... , ,.
0"_ 81_)'L_ t_L'91. 6t_'91.
__ 0_,
/il41UOlAI'uo!ldwnsuoo lelOl Jeqweldes-fuenuer 'uo!ldwnsuoo le),ol
866 L 7_,66I. 166I.0 N 0 8 ¥ r r IN v IN :1 f" (3 N 0 8 V r r iN V I_ d r 0 N 0 8 V r r _i ¥ IN :1 r
| I I _..... L____L____L..__J.----_a___--L_--..__ ..--J. L , , , • -.____.Z---_---L___-S---.__Z_._-L---__,J_.-----.L_----.--I----__ J _ _ _ O' 0
/q!o.uloel3pue seE)leJmeN
g'O
0'1,
S'L
LuneloJleci 0'_
FIq_uoiAl'seoJnos JO[elAI_q uo!ldwnsuoo
_..,66L 066 L 996 I, 986 L t_96L _861 086 I. 8L6L 9L6 L t_L6Li ... i i i . _ i 1 z t l _1______..__. i i , . i ...-.----.J._ ! _ _ 0
/q!ouloel3pue seE)le_nleN
S
O_
S_
kuneloJ|ecl O_._._.__.___
g_
_66 l-8L6 l 'seoJnos JO[elAI_q uo!ldLunsuoo
(n|8 UO!llHpeno)
uop,dmnsuoo_6_eu3UOl_m,JodsueJ1 I,'_ eJn61=l
Table 2.5 Transportation Energy Consumption(QuadrillionBtu)
i.i ,i i ,lllll i i i i ii
ElectricalSystem
Natursl Prlmary Nat Enargy TotalCoal Gasa Petroleum Consumption Electricity Consumption Losses Consumptionb
1973 Tota_l...................... 0,003 0,743 17,831 18.576 0.008 18,584 0,020 18,6051974 Total ....................... 002 ,685 17.399 18,086 ,009 18,095 ,022 16,1171975 Total ....................... 001 .595 17,614 18,209 .010 18.219 ,025 16,2441976 Total ...................... (s) .559 18.506 19.065 ,010 19,076 ,025 10,1011977 Total ...................... (s) .543 19,241 19.784 ,010 19,794 ,025 19,8191978 Total ...................... ( c ) ,539 20,041 20,580 ,009 20,589 ,022 20,8111979 Total ...................... ( c ) .612 19.825 20,436 .010 20,447 ,025 20,4721980 Total ...................... ( c ) ,650 19,008 19,658 ,011 19,669 ,026 16,6961981 Total ...................... ( c ) ,658 18,811 19,469 ,011 19,480 ,026 19,5071982 Total ...................... ( c ) .612 18,420 19,032 ,011 19,043 ,026 19,0691983 Total_...................... ( c ) ,505 18,593 19.098 ,011 19,109 ,026 18,1351984 Total ...................... ( c ) .545 19.216 19,761 .012 19,773 ,028 10,6011985 Total ...................... ( c ) .519 19,504 20,024 ,013 20,036 ,030 20,0071986 Total ...................... ( c ) ,499 20.269 20,768 ,013 20,781 ,031 20,8121987 Total ...................... ( c ) ,535 20.871 21,406 ,013 21,419 ,026 21,4461988 Total ...................... ( c ) .632 21,629 22,260 ,014 22,274 ,031 22,3051989 Total ...................... ( c ) ,649 21,868 22.517 ,014 22,530 ,031 22,S611990 Total ...................... ( c ) ,680 21,810 22,490 .014 22,504 ,031 22,535
1991 Janua_ry.................. ( c ) .076 1.718 1.794 .001 1.795 .003 1.798February ................ ( c ) ,063 1.588 1.652 .001 1.653 .002 1.655March ..................... ( c ) ,060 1.780 1.840 .001 1.842 .002 1.844April ...................... ( c ) .O50 1.732 1.783 .001 1.784 .002 1.786May ....................... ( c ) .043 1.838 1.881 .001 1.882. .003 1.885June ....................... ( c ) ,038 1.823 1.862 O01 1.863 .003 1.866July ........................ ( c ) .041 1910 1951 .001 1.952 .003 1.955August ................... ( c ) .041 1,911 1.952 .001 1.953 .003 1.956September ............. ( c ) .040 1.761 1.800 .001 1,802 .002 1.804October .................. ( c ) .046 1.846 1,892 .001 1.893 .002 1.896November .............. ( c ) ,055 1.726 1.782 ,001 1.783 .002 1.785December .............. ( c ) .066 1.821 1887 .001 1.888 .002 1.891Total ...................... ( c ) ,620 21.456 22,076 ,014 22,090 ,030 22,120
1992 January .................. ( c ) .070 1.743 1.813 .001 1.815 .002 1.817February ................ ( c ) ,064 1.685 1.749 .001 1.750 .002 1.753March ..................... ( c ) 060 1.804 1.864 .001 1.865 .002 1.868April ....................... ( c ) .052 1.785 1837 .001 1.838 .002 1.840May ........................ ( c ) .044 1.859 1.902 .001 1903 .003 1.906June ....................... ( c ) .039 1.826 1865 .001 1.866 .003 1.869July ........................ ( c ) .040 1.904 1.944 .001 1946 .003 1.948August ................... ( c ) .039 1,867 1.906 .001 1907 .003 1.910September ............. ( c ) .038 1.788 1.826 .001 1.828 .003 1.830October .................. ( c ) .042 1,8,59 1.901 ,001 1.902 .002 1.904November .............. ( c ) .052 1,749 1.801 .001 1.802 .002 1.804December .............. ( c ) .066 1.895 1.962 .001 1963 .003 1.965Total ...................... ( c ) .606 21.765 22.371 .014 22.384 .030 22.414
1993 January .................. ( c ) .075 1,700 1.775 .00 1.776 .003 1.778February ................ ( c ) .071 1.671 1.741 .00' 1.743 .002 1.745March ..................... ( c ) .070 1.881 1,950 .00 1.952 .002 1.954April ....................... ( c ) .054 1.810 1.8c_ .00 1.865 .002 1.868May ........................ ( c ) .042 1,898 1.940 .00 1.941 .002 1.944June ....................... ( ¢ ) n .040 1.850 R1.890 .00 R1.891 .003 R1.894July ........................ ( c ) a .042 1.930 R1.972 .00' R1.973 .003 R1.976August ................... ( c ) R ,042 1,926 R1.968 ,00 R1.969 .003 R1.972September ............ ( c ) ,041 1.867 1909 .00 1.910 .002 1.9139-Month Total ....... ( c ) .476 16.533 17.009 .01' 17.020 ,023 17.043
1992 9-Monl_ Total ....... ( c ) ,446 16.262 16.707 .010 16,718 ,022 16,7401991 9-Mon_ Total ....... ( c ) .453 16.062 16,515 .011 16,525 .023 16.549
ill i i HH
a Pipeline fuel only, including supplemental gaseous fuels, reported as industrial sector consumption.b Due to a lack ol consislent historical data. some renewable energy R=Revised data. (s)=Less than 0.5 trillion Blu.
sources are not included For example, in 1991. an estimated 0,1 quadrillion Notes: ,, Geographic coverage is the 50 States and the District ol Columbia.Btu of renewable energy consumed by the U.S. transporlation sector is no! • Totals may not equal sum of components due to Independent rounding.included. Addilional Notes and Sources: See end ol section.
c Since 1978, the small amounts of coal consumed for transportation are
Energy Information Administration/Monthly Energy Review December 1993 33
III I
Figure 2.5 Energy Input at Electric Utilities(QuadrillionBtu)
Total Input, 1973-1992 Total Input, Monthly
35 3.5
25 2.5
olo,, !ii i!ii!iis o.s i i
:::_._:::_::::_:_::_::::_:::::::::_:_:_::::_:::::_::::::::::_::::::`_:_:_::;_::::::::::::::::::::::::::::_;_::::_:;;_;:_::_:::_:::;::;:_:_::::_;:_::_:::_::::::'_:::::::_::_::;`_:;::
_i_iii_!_i;_;_;i_i_!iii_iii_!ii!::i!_i_;:i;_:_i_:_!_i_!ii_iii_;_i_iiiii_i!_!i!_;_i!_!_i_;_!i_i_!ii_!!;_ii_;i_:_!i_i!_ii_i!:_;_i_i_.;!ii_i_:_i_:i!;_i_ii0 _ 0.0 " i"-_'"i "-'-i'-'-'i'-i'_f'':'_T'_'-i''Y '-i-'"Y"-'i'-'-i' "i":*:f'_ _'' "_"-'_-""_""-i "w"'Y'_' '"i""i' '-'i'-'-'i' ""i" , , ,
1974 1976 1978 1980 1982 1984 1986 1988 1990 1992 J FMAMJJ ASONDJ FMAMJ JASONDJ FMAMJ JASOND1991 1992 1993
Input by Major Sources, 1973-1992 Input by Major Sources, Monthly
20 2.O
Coal
12 _ 1.2Nuclear Electric8 Petroleum and Natural Gas Power 0.8 Nuclear Electric.---_ Power Petroleum and NaturalGas
4 0.4
Hy_oelectric Hy_oelectrici-'ower rowe r
0 , , _ r _ _ T _ , , , v _ , _ w w , 0.0 _ _ _ , , , _ , i"-'r-q_"r--r v v _' _' r_ _ , 1
1974 1976 1978 1980 1982 1984 1986 1988 1990 1992 FMAMJ J ASONDJ FMAMJJASONDJ FMAMJJASOND1991 1992 1993
Total Input, January-September Input by Major Sources,September 1993
30
coal ',:_iiiii:,i!iii!_::_;_:_!_!ii_:_:_!_!!i_!_:_!i_i_!:_i_iii_!i_i_i_!_!i_i!ii_!_i_i_:ii]1._25 22.729 22.309 23.133
:::::::::::::::::::::::::::::::
iiiii!iiiiiiiiiii!!ii::ii!iiiiii::iI iii::ii:ii::i!::::iii::i::ii::ii::::_ii!::::::::::::::::::::::::::::::;::: Nuclear:.::,:.:+:.:,.,;,:.:.:.:.'.:,: ::::::::::::::::::::::::::::::: ::::::::::::::::::::::::::::::::
20 iiii;i:ii!:i:i::::i!iiiiiii:iiii!i ii,.i:i::i:ili:::iiiiiii:i::ii! ii:::i:ii:i::!i:ii:ii:ii::iiiii ElectricPower :i:i_i:!!:ii:i!:!i:ii:i:ii!:ii:iiiiiiiiii!!iiiiii:iii:i]0,537!!iii!iiiii::i!i::ili!!iiiiii:i:ii:: ilili!i!:i:::i!ii_i!iii:::ii i::::i_i:i!i!iii:::!iiiii:::i:iiii:!iii:ii:ii:i:ii!ii:;!ii!:;iiii!i:: :::::::::::::::::::::::::::::!.i::::i:i::!i::ii:::iiii!iiii _15 iii!iiiii:i!iii:!iiii!i::i!!iiii!ii::ii!il ::':iii::i:ili::i:.i!ili:iiii!i.......................... ::::::::::::::::::::::;::::::::::::::::: Natural Gas 0.265:::: .:.::.::;:: :.::: -:::::::.:
............... "" """" .... I...,., ...,..,.. .: ::: .:: :::':..::: • ..:., ::::...: .:,,
L10 ::i::_!i!!iili::!i:.:iiiii:::il ::i!:::::i!!i:i::ii?!!ii_:. :.:.::_:i:!_:_:i::: Hydroelectric!:ii:iil!!ii!ii::iii_i:i:i;ii!:i i._ii:_i:::iiii!ii:i_:::_:_ili: i!i::ii::ii_i:::ii;ii::_!_:!_............. _'ower o.21,.,.,.,,,......,..,,....,,.., ,., .. ,., ...,.. . ./.,. ; :: +:.-:::iiii:i!iiii::ili:iiiiii:i!i:!iii! :ii:i:!!ii ::::::i:i:i:ii!::i .: :. ,:::i i: i:::i:::i
5 :i:iiii!iiiiiiii:iiii!i::ii!i!:!il _i!:iii:!::!!i::::::i:,iii i_!i_!i:::::_i;!i:i::!iiil: :. ::::. ::::: :::::.:: .::::i:i:::i:i:ii I::]
!:ii:iii!iiii!ii!i:ii!!ilii:i::iii:!!!il i:!:!iliili:i::!:iii::!:ii:,i ::i:!iiliii.::i:iif::!:,i Petroleum 0.1027............. ...r.::.: :,:.:.:.:.:
1991 1992 1993 0,0 0,5 1,0 1,5 2.0
Note:Becauseverticalscalesdiffer,graphsshouldnotbe compared.Source:Table2.6.
34 Energy Information Administration/Monthly Energy Review December 1993
Table 2.6 Energy Input at Electric Utilities(QuadrillionBtu)
Nuclear Hydro-Natural Electric electric
Coal Gasa Petroleumb Power Powerc Otherd Total
1973 Total ...................... 6.658 3.748 3.515 0.910 2.975 0.046 19.6521974 Total ...................... 6.534 3.519 3.365 1.272 3.276 .056 20.0221975 Total ...................... 8.765 3.240 3.165 1.900 3.167 .072 20.3601_75 Total ...................... 6.720 3.152 3.477 2,111 3,032 .061 21.5741977 ;'otal ...................... 10.262 3.284 3.901 2.702 2.462 .082 22.7131978 Total ...................... 10.238 3.297 3.987 3.024 3.110 .068 23,7241979 Total ...................... 11.260 3.613 3.283 2.776 3.107 .089 24.1281980 Total ...................... 12.123 3.810 2.634 2.739 3.085 .114 24.5051981 Total ...................... 12,583 3,768 2.202 3,008 3.072 .127 24.7501982 Total ...................... 12.582 3.342 1.568 3.131 3.539 .108 24.2701983 Tutal ...................... 13.213 2.998 1.544 3.203 3.866 .133 24.9561984 Total ...................... 14.020 3.220 1.286 3.553 3.767 .174 26.0201985 Total ...................... 14.542 3.160 1.090 4.149 3.365 .213 26.5161986 Total ...................... 14.444 2.691 1.452 4.471 3.413 .232 26.7031987 Total ...................... 15.173 2.935 1.257 4.906 3.084 .246 27.6001988 Total ...................... 15.850 2.709 1.563 5.661 2.630 .236 28.6481989 Total ...................... 15.988 2.871 1.685 5.677 2.848 .217 29.2861990 Total ...................... 16.189 2.882 1.250 6.161 2.914 .202 29.599
1991 January .................. 1.482 .177 .099 .584 .275 .017 2.634February ................ 1,217 .150 .092 ,514 .234 .014 2.221March ..................... 1,230 .198 ,092 .528 .280 .016 2,344April ....................... 1,151 ,221 .084 ,447 ,284 .015 2,201May ........................ 1.271 .255 .115 .502 ,314 ,015 2,472June ....................... 1.366 ,266 ,117 .582 .283 .016 2,631July ........................ 1.491 .338 ,118 .652 ,272 .016 2,887August ................... 1.492 .3..35 .123 .628 ,256 ,016 2,851September ............. 1.337 .269 .O91 .557 .218 ,015 2.488Oclober .................. 1.284 ,270 .068 .512 .211 .016 2,361November .............. 1.324 .203 .O84 .497 ,209 .017 2,333December .............. 1.384 .174 ,094 .576 .247 ,017 2.492Total ...................... 16.028 2.856 1.176 6.579 3.083 .191 29.915
1992 January .................. 1,420 .173 .108 .621 .243 .017 2,563February ................ 1,252 .174 ,087 .567 ,204 ,015 2.299March ..................... 1304 R.212 .092 .492 .235 ,017 a 2.353Alxil ....................... 1.223 R,234 .069 .454 ,220 .015 R2.215May ........................ 1.261 .242 .O56 .490 .252 .016 2,317June ....................... 1.334 ,272 .080 .550 .255 .016 R2.506July ........................ 1.536 R,341 .092 ,602 .240 ,016 R2.826August ................... 1,470 R,309 ,076 .630 ,218 ,017 2,720September ............. 1.372 ,280 .074 ,547 .202 .015 R2.490October .................. 1.307 R,217 .073 .524 .201 .016 I:l2,338November .............. 1.303 R,193 .074 .545 ,228 ,016 2,359December .............. 1.443 R.179 .070 .624 .274 .016 2.607Total ...................... 16.224 2.826 .951 6.646 2.773 .192 29,613
1993 January .................. 1.446 .168 .077 .634 ,276 .016 2,617February ................ 1,336 R.165 ,074 .551 .227 ,015 R2,368March ..................... 1,395 .198 ,090 ,501 .263 .016 R2.463April ....................... 1.239 ,178 .055 .464 .276 .015 R2.227May ........................ 1.250 .171 .056 .541 .314 ,014 R2,346June ....................... 1.417 R,260 .083 .565 ,287 .014 R2.626July ........................ 1.638 .341 .121 ,607 .275 .015 2,996August ................... 1.621 ,365 .126 .604 ,245 .015 2.976Seplember ............. 1.384 .265 .102 .537 ,210 ,015 2.5139-Month Total ....... 12.726 2.110 .785 5.004 2.374 .135 23.133
1992 9.Month Total ....... 12.172 2.236 ,734 4.953 2.070 .144 22.3091991 9-Month Total ....... 12.036 2.210 .931 4.994 2.416 .141 22.729
a Includes supplemental gaseous fuels, c Includes net imports ol electricity,b Petroleum products reported as "oil consumed in steam plants' through d 'Olher" is electricity generated for disldbution from wood, waste,
1979 and "heavy oil" from 1980 forward, which are assumed Io be residual geothermal, wind, photovoltaic, and solar thermal energy.fuel oil; petroleum products reported as "oil consumed in gas turbine and R=Revised dala.internal combustion engine plants" through 1979 and 'light oil" from 1980 Noles: • Geographic coverage is the 50 States arid the Disldct o( Columbia.forward, which are assumed to be distillate fiJel oil, kerosene, and petroleum • Totals may not equal sum ol components due to independent rounding,coke, Additional Notes and Sources: See end of section.
Energy Information Administration/Monthly Energy Review December 1993 35
Energy Consumption Notes and other types of industrial activity (agriculture, min-ing, or construction). Commercial establishments
Sources include hotels, motels, restaurants, wholesale busi-nesses, retail stores, laundries, and other service
The data in this section of the Monthly Energy Review enterprises; religious and nonprofit organizations;(MER) _tre obtained initially from a group of energy-re- health, social, and educational institutions; andlated surveys, typically called "supply surveys," Federal, State, and local governments. Streetconducted by the Energy Information Administration lights, pumps, bridges, and public services are also(EIA). Supply surveys are those surveys directed to included if the establishment operating them issuppliers and m_ketcrs of specific energy sources. They considered commercial.measure the quantities of specific energy sources * Industrial_Manufacturing industries, which makeproduced, or the quantities supplied to the market, or up the largest part of the sector, along with min-both. The data obtained from the EIA's supply surveys ing, construction, agriculture, fisheries, and,are integrated to yield the summary consumption slatis- forestry. Establishments in the sector range fromtics published in this section (and in Section 1) of the steel mills to small farms to companies assemblingMER. Users of the EIA's energy consumption statistics electronic components.
should be aw_u'e of a second group of energy-related • Transportation--Private and public vehicles thatsurveys, typically called "consumption surveys." Con-sumption surveys gather information on the types of move people and commodities. Included areenergy consumed by end users of energy, along with the automobiles, trucks, buses, motorcycles, railroadscharacteristics of those end users that can be associated and railways (including streetcars), aircraft, ships,
with energy use. For ex;unple, the Manufacturing Ener- barges, and natural gas pipelines.gy Consumption Survey belongs to the consumption * Electric Utility_Privately and publicly ownedsurvey group because it collects information directly establishments that generate, transmit, distribute,from end users (the manufacturing establishments), and sell electricity primarily for use by the publicThere are important differences between the supply and and meet the definition of an electric utility. Non-consumpti¢,, surveys that need to be taken into account utility power producers are not included in thein any ,'malysis that uses both &tta sources. For infor- electric utility sector.mation on those differences, see Energy Consumptionby End-Use Sector, A Comparison of Measures by Con-_'umption and Supply Surveys, DOE_IA-0533, Energy Although the end-use allocations are made according toInfonnation Administration, Washington, DC, April 6, these aggregations as closely as possible, some data are1990. The numbered notes that follow elaborate on es- collected by using different classifications. Forsential information in Section 2. example, data on agricultural use of natural gas are col-
lected and reported in the commercial sector, rather thanin the industrial sector. Since agricultural use of natural
1. Total Energ3' Cort,_umed: Total energy consumed in- gas cannot be identified separately, it is included in theeludes coal, natural gas (including supplemental gaseous commercial sector in this report. Another example isfuels), petroleum products supplied, electric utility and master-metered condominiums and apartments, andindustrial generation of hydroelectric power, net imports buildings with a combination of residential and commer-of electricity generated from hydroelectric power, and cial units. In many cases, the metering and billingelectricity generated from puclear power. Total energy practices cause residential energy usage of electricity,consumed also includes electricity generated from wood, natural gas, or fuel oil to be included in the commercialwaste, gcotherm;_:, wind, photovoltaic, and solar thermal sector. No adjustments for these discrepancies wereenergy but excludes other energy obtained from those made.sources because consistent historical data are not avail-
able. 3. Conversion Factors: See the conversion factors
listed in Appendix A.
2. l_onomic Sectors: Energy use is assigned to the
major economic sectors according to the following 4. Coal: Coal is anthracite, bituminous coal (includingguidelines as closely as possible: subbituminous coal), and lignite. Sources:
• Residential_All private residences, whether * 1973-September 1977: U.S. Department of theoccupied or vacant, owned or rented, includingsingle-family homes, multifamily housing units, Interior (DOI), Bureau of Mines (BOM), Minerals,'rod mobile homes. Secondary homes, such as Yearbook and Minerals Industry Surveys.summer homes, are "also included. Institutional * Electric Utilities--October 1977 forward: Energyhousing, such as school dormitories, hospitals, and Information Administration (EIA), Form EIA-759military barracks, generally are not included in the (formerly Form FPC-4), "Monthly Power Plantresidential sector; they are included in the com- Report."
mcrcial sector. * Other Industrial_October 1977-December 1979:
• Commercial_Business establishments that are not EIA, Form EIA-3, "Monthly Coal Consumptionengaged in tr,'msportation or in manufacturing or Report - Manufacturing Plants"; January 1980 for-
36 EnergyInformationAdministration/MonthlyEnergyReviewDecember1993
ward: EIA, Form EIA-3, "Quarterly Coal Con- Specific petroleum products' end-use allocation proce-sumption Report - Manufacturing Plants," and dures follow:
Form EIA-6, "Coal Distribution Report." • Aviation Gasoline--All product supplied is• Coke Plants--October 1977-December 1980: assigned to the transportation sector.
EIA, Form EIA-5/SA, "Coke and Coal Chemicals- Monthly/Annual"; January 1981-December 1984: • Asphalt--All product supplied is assigned to theEIA, Form EIA-5/5A, "Coke Plant Report - industrial sector.Quarterly/Annual Supplement"; January 1985 for- • Distillate FueluProduct supplied is assigned toward: EIA, Form EIA-5/SA, "Coke Plant Report," electric utilities and non-electric utilities asquarterly, follows:
• Residential and CommercialuOctober 1977-
December 1979: EIA, Form EIA-2, "Monthly Electric Utilities, All Periods.Coal Report, Retail Dealers - Upper Lake Docks";January 1980 forward: EIA, Form EIA-6, "CoalDistribution Report." Monthly and annual consumption for 1973-1979 isassumed to be the amount of oil (minus small
amounts of kerosene and kerosene-type jet fuel5. Natural Gas: Natural gas consumption by end use deliveries) reported as consumed in internal corn-is based on data presented in Table 4.3 of this report, bustion and gas turbine engine plants. FromFor Section 2 calculations, lease and plant fuel con- January 1980, electric utility consumption of distil-sumption are added to industrial deliveries, and pipeline late fuel is assumed to be the petroleum productsfuel represents transportation use of natural gas. Values reported as "light oil" (minus small amounts ofin Btu are derived by using the conversion factors kerosene deliveries through 1982) consumed atprovided in Appendix A. Sources: electric utilities.
• 1973-1975: DOI, BOM, Minerals Yearbook,Sources: 1973-September 1977: FPC, Fonn FPC-
"Natural Gas" chapter. 4, "Monthly Power Plant Report"; October 1977-• 1976-1978: EIA, "Energy Data Reports," 1981: FERC, Form FPC-4, "Monthly Power Plant
Natural Gas, Annual. Report"; 1982 forward: EIA, Form EIAo759,• 1979: EIA, Natural Gas Production and Con- "Monthly Power Plant Report."
sumption 1979.
• 1980-i992: EIA, Natural Gas Annual. Sectors Other Than Electric Utilities, Annual Es-
• 1993: EIA, Natural Gas Monthly. timates Through 1991.
• Electric Utilities_1973-1976: Form FPC-4, The aggregate non-electric utility use of distillate"Monthly Power Plant Report"; 1977-1981' fuel is total distillate fuel supplied minus theFederal Energy Regulatory Commission (FERC), electric utility consumption. The non-electricForm FPC-4, "Monthly Power Plant Report"; utility annual consumption totals are allocated to1982 forward: EIA, Form EIA-759, "Monthly the individual non-electric utility sectors (residen-Power Plant Report." tial, commercial, industrial, and transportation) in
• Americ,'m Gas Association, "Monthly Gas Utility proportion to the share of "adjusted sales" of eachStatistical Report," residential and commercial end-use sector, as reported in EIA's Fuel Oil andmonthly sales data for 1973-1979, which are used Kerosene Sales report series (DOE/EIA-0535),to estimate monthly consumption values from EIA which is based primarily on data collected by Formannual consumption values. EIA-821, prev_:.usly Fonn EIA-172. "Adjusted
sales" are sales that have been adjusted at the PAD
6. Petroleum: Petroleum consumption by end use is district level to equal EIA volume estimates ofthe sum of all individual petroleum products estimated petroleum products supplied in the U.S. market.
Following are notes on the individual sectorto be consumed in each end-use sector. First, total con-
sumption by product is determined. Petroleum groupings:consumption in this section of the Monthly EnergyReview (MER) is the series called "petroleum products Since 1979, the residential sector adjusted salessupplied" in Section 3. Sources for petroleum products total is directly from the Sales reports. Prior tosupplied by individual products are: 1979, each year's sales subtotal of the heating plus
industrial category is split into residential, commer-• 1973-1975: I)OI, BOM, Mineral Industry Sur- cial, and industrial (including f,'uan) in proportion
veys, "Petroleum Statement, Annual." to the 1979 shares.
• 1976-1980: EIA, Energy Data Reports,"Petroleum Statement, Annual." - Since 1979, the commercial sector adjusted sales
total is directly from the Sales reports. Prior to• 1981-1991: EIA, Petroleum Supply Annual. 1979, each year's sales subtotal of the heating plus• 1992 and 1993: EIA, Petroleum Supply Monthly. industrial category is split into residential, commer-
EnergyInformationAdministration/MonthlyEnergyReviewDecember1993 37
cial, and industrial (including farm) in proportion estimates of this consumption. All remaining jetto the 1979 shares, fuel (kerosene-type and naphtha-type) is consumed
by the transportation sector.
- Since 1979, the industrial sector adjusted sales • KeroseneMTotal product supplied monthly istotal is the sum of the adjusted sales for industrial, allocated to the major end-use sectors in propor-farm, oil company, off-highway, diesel, and all tion to annual sales grouped into end-use sectorsother uses. Prior to 1979, each year's sales subtotal from EIA's Fuel Oil and Kerosene Sales (Sales)
of the heating plus industrial category is split into reports (based primarily on data collected by Formresidential, commercial, and industrial (including EIA-821, previously Form EIA-172), as follows:farm) in proportion to the 1979 shares, and thisestimated industrial portion is added to oil com- - Residential deliveries are directly from the Salespany, off-highway diesel, and all other uses. reports for 1979-1991. Sales for 1991 are used as
estimates for succeeding periods. Prior to 1979,The transportation sector adjusted sales total is each year's sales category called "heating" is split
the sum of the adjusted sales for railroad, vessel into residential, commercial, and industrial inbunkering, on-highway diesel, and military uses for proportion to the 1979 shares.all years.
- Commercial sales are directly from the SalesSectors Other Than Electric Utilities, Monthly Es- reports for 1979-1991. Sales for 1991 are used astimates Through 1991. estimates for succeeding periods. Prior to 1979,
each year's sales category called "heating" is split- Residential and commercial monthly consumption into residential, commercial, and industrial inis estimated by allocating the annual estimates proportion to the 1979 shares.described above into months in proportion to each
month's share of the year's sales of No. 2 heating - Industrial sales are directly from the Sales reportsoil as reported in the "Monthly Report of Heating for 1979-1991. Sales for 1991 are used as es-
Oil Sales" by the Ethyl Corporation from 1973- timates for succeeding periods. Prior to 1979, each1980 and the American Petroleum Institute for 1981 year's sales category called "heating" is split intoand 1982, and the EIA, Form EIA-782A, residential, commercial and industrial in proportion"Refiners'/Gas Plant Operators' Monthly Petroleum to the 1979 shares, and this estimated industrialProduct Sales Report," No. 2 Fuel Oil Sales to End (including farm) portion is added to all other uses.
Users and for Resale, since 1983. • Liquefied Petroleum Gases (LPG)MThe annual
- The transportation highway use portion is allo- shares of LPG's total consumption that arecared into the months in proportion to each month's estimated to be consumed by each end-use sector
are applied to each month's total LPG consump-share of the year's total sales for highway use asreported by the Federal Highway Administration's tion (i.e., product supplied) to create monthlyTable MF-25, "Private and Commercial Highway end-use consumption estimates. The annual end-Use of Special Fuels by Months." The remaining use shares are calculated in the following manner:transportation use of distillate fuel (i.e., for rail-roads, vessel bunkering, and military use) is evenly - Sales of LPG to the residential and commercial
sector are converted from thousand gallons per yeardistributed over the months, adjusted for the num-ber of days per month, to thousand barrels per year and are assumed to be
the annual consumption of LPG by the sector.
- Industrial monthly estimates are made by subtract-ing the residential and commercial, transportation, - The quantity of LPG sold each year for consump-and electric utility sector estimates from each tion in internal combustion engines is allocatedmonth's total distillate fuel supplied, between the transportation and industrial sectors on
the basis of data for special fuels used on highwayspublished by the U.S. Department of Transporta-
Sectors Other Than Electric Utilities, 1992 and tion, Federal ltighway Administration, in Highway1993 Statistics. The allocations of LPG sold for internal
combustion engine use to the transportation sectorEach month's non-electric utility consumption sub- range from a high of 67 percent in 1981 to a lowtotal is disaggregated into the major end-use sectors of 37 percent in 1987.in proportion to the shares each sector held of the
non-electric utility subtotal in the same month in LPG consumed annually by the industrial sector1991. is estimated as the difference between LPG total
• Jet Fuel--Through 1982, small amounts of supplied and the estimated consumption of LPG bykerosene-type jet fuel were consumed by electric the sum of the residential and commercial sectorutilities. Kerosene-type jet fuel deliveries to and the transportation sector. The industrial sectorelectric utilities as reported on the Form FERC- includes LPG used by chemical plants as raw423 (formerly Form FPC-423) were used as materials or solvents and used in the production of
38 EnergyInformationAdministration/MonthlyEnergyReviewDecember1993
synthetic rubber; refinery fuel use; use as synthetic Power Plant Report" (formerly Form FPC-4). Thenatural gas feedstock and use in secondary recovery remaining petroleum coke is assigned to the in-projects; all farm use; LPG sold to gas utility dustrial sector.
companies for distribution through the mains; and • Residual Fuel--Product supplied is assigned toa portion of the use of LPG as an internal combus- electric utilities and non-electric utilities astion engine fuel. follows:
The sources of the annual sales data for creatingannual end-use shares are: Electric Utilities, All Periods.
1973-1982: EIA's "Sales of Liquefied Petroleum Monthly and annual consumption for 1973-1979 isGases and Ethane" reports, based primarily on data assumed to be the amount of oil reported as con-collected by Form EIA-174. sumed in steam-electric power plants. From
January 1980 forward, electric utility consumption
1983: End-use consumption estimates for 1983 of residual fuel is assumed to be the petroleumare based on 1982 end-use consumption because products reported as heavy oil consumed atthe collection of data under Form EIA-174 was electric utilities.
discontinued after data year 1982.Sources: 1973-September 1977: Form FPC-4,
1984-1991: American Petroleum Institute (API), "Monthly Power Plant Report"; October 1977-"Sales of Natural Gas Liquids and Liquefied 1981: FERC, Form FPC-4, "Monthly Power PlantRefinery Gases," which is based on an LPG sales Report"; 1982 forward: EIA, Form EIA-759,survey jointly sponsored by API, the Gas Proces- "Monthly Power Plant Report."sors Association, and the National LiquefiedPetroleum Gas Association. Sectors Other Than Electric Utilities, Annual Es.
timates Through 1991.1992 and 1993: The 1991 source is used to
estimate succeeding periods. The aggregate non-electric utility use of residualfuel is total residual fuel supplied minus the electricutility consumption. The non-electric utility annual• Lubricants--Total product supplied is allocated to
the industrial and transportation sectors for all totals ace allocated into the individual non-electricmonths according to proportions developed from utility sectors in proportion to the amount ofannual sales of lubricants to the two sectors from residual fuel sold to end users, grouped into sectors
U.S. Department of Commerce, Bureau of the from EIA's Fuel Oil and Kerosene Sales (Sales)Census, Current Industrial Reports, "Sales of reports (based primarily on data collected by FormLubricating and Industrial Oils and Greases." The EIA-821, previously Form EIA-172), as follows:1973 shares are applied to 1973 and 1974; the1975 shares are applied to 1975 and 1976; and the Since 1979, commercial sales data are directly1977 shares are applied to 1977 forward, from the Sales reports. Prior to 1979, each year's
sales subtotal of the heating plus industrial category• Motor Gasoline--Total product supplied monthly is split into commercial and industrial in proportion
is allocated to the major end-use sectors in propor- to the 1979 shares.tion to aggregations of annual sales categoriescreated on the basis of the U.S. Deparunent of -Since 1979, industrial sales data are the sum ofTransportation, Federal Highway Administration, sales for industrial, oil company, and all other uses.Highway Statistics, Tables MF-21, MF-24, and Prior to 1979, each year's sales subtotal of theMF-25, as follows: heating plus industrial category is split into com-
mercial and industrial in proportion to the 1979- Commercial sales are the sum of sales for public shares, and this estimated industrial portion isnon-highway use and miscellaneous and unclass- added to oil company and all other uses.ified uses.
- Transportation sales are the sum of sales for- Industrial sales are the sum of sales for agricul- railroad, vessel bunkering, and military uses for allture, construction, and industrial and commercial years.use as classified in the Highway Statistics.
Sectors Other Than Electric Utilities, Monthly Es.- Transportation sales are the sum of sales for timates Through 1991.highway use (minus the sales of special fuels,
which are primarily diesel fuel and are accounted Commercial sector monthly consumption isfor in the transportation sector of distillate fuel) and estimated by allocating the annual commercialsales for marine use. sector estimates described above into months in l
• Petroleum Coke_'l'he portion consumed by proportion to each month's share of the year's saleselectric utilities is from Form EIA-759, "Monthly of No. 2 fuel oil as reported in the "Monthly Report
EnergyInformationAdministration/MonthlyEnergyReviewDecember1993 39

of lleating Oil Sales" by the Ethyl Corporation for • 1973-1978: FPC, Form FPC-4, "Monthly Power1973-1980 and the ,Mnerican Petroleum Institute Plant Report," for plants with generating capacityfor 1981 and 1982, and the EIA, Form EIA-782A, exceeding 10 megawatts, and FPC, Form FPC-"Refiners'/Gas Plant Operators' Monthly Petroleum 12C, "Industrial Electric Generating Capacity," forProduct Sales Report," No. 2 Fuel Oil Sales to End all other plants.Users and for Resale, since 1983.
• 1979: FPC, Form FPC-4, "Monthly Power Plant
- Transportation monthly estimates are made by Report," for plants with generating capacityevenly distributing the annual sector estimate over exceeding 10 megawatts and EIA estimates for allthe months, adjusting for the number of days per other plants.
month. • 1980 forward: Annual generation estimated byEIA as the average generation over the 6-year
- Industrial monthly estimates are made by subtract- period of 1974-1979; monthly generationing the commercial, transportation, and electric estimated to be in proportion to each month'sutility sector estimates from each month's total hydroelectricity generation in the electric utilityresidual fuel supplied, industry in 1980.
Sectors Other Than Electric Utilities, 1992 and Sources for imparts and exports of electricity:
1993 • 1973-September 1977: Unpublished Federal
Each month's non-electric utility consumption sub- Power Commission data.total is disaggregated into the major end-use sectors • October 1977-1980: Unpublished Economicin proportion to the shares each sector held of the Regulatory Administration (ERA) data.non-electric utility subtotal in the same month in • 1981: DOE, Office of Energy Emergency Opera-1991. tions, "Report on Electric Energy Exchanges with
• Road Oil--All product supplied is assigned to the Canada and Mexico for Calendar Year 1981,"industrial sector. April 1982 (revised June 1982).
• All Other Petroleum ProductsmThe product sup- • 1982 and 1983: DOE, ERA, Electricity Exchan-plied of all remaining petroleum products is ges Across International Borders.
assigned to the industrial sector. • 1984-1986: DOE, ERA, Electricity TransactionsAcross International Borders.
7. Nuclear Electric Power and Wood, Waste, • 1987 and 1988: DOE, ERA, Form ERA-781R,Geothermal, Wind, Photovoltaic, and Solar ThermalEnergy Sources Connected to Electric Utility Dis- "Annual Report of International Electrical Ex-tribution Systems: Sources: port/hnport Data."
• 1989-1991' DOE, Assistant Secretary for Fossil• 1973-1976: FPC, Form FPC-4, "Monthly Power
Energy, Form FE-781-R, "Annual Report of Inter-Plant Report." national Electrical Export/Import Data."
• 1977-1981' FERC, Form FPC-4, "Monthly Power • 1992 forward: EIA estimates based on prelimi-Plant Report." nary data from the National Energy Board of
• 1982 forward: EIA, Form EIA-759, "Monthly Canada and DOE, Assistant Secretary for FossilPower Plant Report." Energy.
8. Hydroelectric Power: Includes electricity 9. Net Imports of Coal Coke: Net imports means im-generated by hydroelectric power at electric utilities, ports minus exports, and a minus sign indicates thatsmall amounts in the industrial sector, and net imports exports are greater than imports. Sources:
of electricity, which are assumed to be generated by • 1973-1975: DOI, BOM, Minerals Yearbook,hydroelectric power and are included in the electric
"Coke and Coal Chemicals" chapter.utilities sector.• 1976-1980: EIA, Energy Data Report, "Coke and
Sources for electric utilities sector: Coal Chemicals" annual.• 1981: EIA, Energy Data Report, "Coke Plant
• 1973-1976: FPC, Form FPC-4, "Monthly Power Report," quarterly.Plant Report."• 1982 forward: EIA, Quarterly Coal Report.
• 1977-1981: FERC, Form FPC-4, "Monthly PowerPlant Report."
10. Electricity: End-use consumption of electricity is• 1982 forward: EIA, Form EIA-759, "Monthly based on Table 7.2 sales data. "Other," which is
Power Plant Report." primarily for use in government buildings, is added tothe commercial sector, except for approximately 4 per-
Sources for industrial sector: cent used by railroads mid railways and attributed to the
40 EnergyInformationAdministration/MonthlyEnergyReviewDecember1993
transportation sector. For 1973-1983 and 19_;2 forward, fossil energy equivalent inputs for hydroelectric and"Monthly Series" data are used directly. For 1984- other energy sources, since thcrc is no generally1991, monthly estimates are created by dividing each accepted practice for measuring those thermal conver-month's "Monthly Series" value by the "Monthly sion rates. In addition to conversitm losst_s, other losses
Series" total for the year and multiplying by the "Annual include power phmt use of electricity, transmission andSeries" value for the year. Kilowatthours are converted distribution of electricity from pt_wer plants to end-useto Btu at the rate of 3,412 Btu per kilowatthour. See consumers (also called "line losses"), and unaccounted
Table 7.2 for sources of the electricity .sales data. for electricity. Total losses are allocatcd to the end-usesectors in proportion to each sector's share of total
11. Electrical System Energy Losses: Electrical sys- electricity sales, Overall, approximately 67 percent oftem energy losses are calculated as the difference total energy input is lost in conversion; of electricitybetween total energy input at electric utilities and the generated, approximately 5 percent is lost in plant usetotal energy content of electricity sold to end-use con- and 9 percent is lost in transmission and distribution.sumers. Most of those losses occur at steam-electric Calculated electrical system energy losses may be lesspower plants (conventional and nuclear) in the conver- than actual losses, because prim_try consumption doession of heat energy into mechanical energy to turn not include the energy equivalent of utility purchases ofelectric generators. The loss is a thermodynamically electricity from non-electric utilities and from Canadanecessary feature of the steam-electric cycle. Part of and Mexico, although they are included in electricitythe energy input-to-output losses is a result of imputing sales.
EnergyInformationAdministration/MonthlyEnergyReviewDecembert993 41
Section 3. Petroleum
Total petroleum imports 2 averaged 8.5 million barrels Distillate fuel oil supplied during November 1993per day in November 1993, 8 percent 3 lower than the averaged 3.3 million barrels per day, 11 percent higherprevious month's rate but 7 percent higher than the than the previous month's rate and 13 percent higherNovember 1992 rate. than the November 1992 rate. Distillate fuel oil
ending stocks for November 1993 were 145 million
In November 1993, 17.2 million barrels per day of barrels, the same as the stock level in the previouspetroleum products were supplied for domestic use, 1 month and 1 million barrels below the stock level 1
percent higher than the November 1992 rate. Motor year earlier.gasoline accounted for 43 percent of the total; distillatefuel oil, 19 percent; and residual fuel oil, 5 percent.
Motor gasoline supplied during November 1993 Residual fuel oil supplied in November 1993 averagedaveraged 7.5 million barrels per day, 1 percent higher 0.9 million barrels per day, 9 percent lower than thethan the previous month's rate and 5 percent higher previous month's rate and 13 percent lower than thethan the November 1992 rate. Total motor gasoline November 1992 rate. Residual fuel oil stocksstocks were 221 million barrels at the end of November1993, 11 million barrels above the stock level in the measured 46 million barrels at the end of Novemberprevious month and 7 million barrels above the level 1993, 1 million barrels below the stock level in both1 year earlier, the previous month and 1 year earlier.
Estimates (except of crude production) for the most current month are based on Energy InformationAdministration (EIA) weekly data and will be revised to conform with data from the EIA PetroleumReporting System as available. For the most recent month, crude production is an EIA estimate "basedon historical and provisional data through August 1993.
2TotalImportdala Include Imports Into the Strategic Pelroleum Reserve.3percentagechanges are based on numbers shownin the followingtables.
Energy Information Administration/Monthly Energy Review December 1993 43
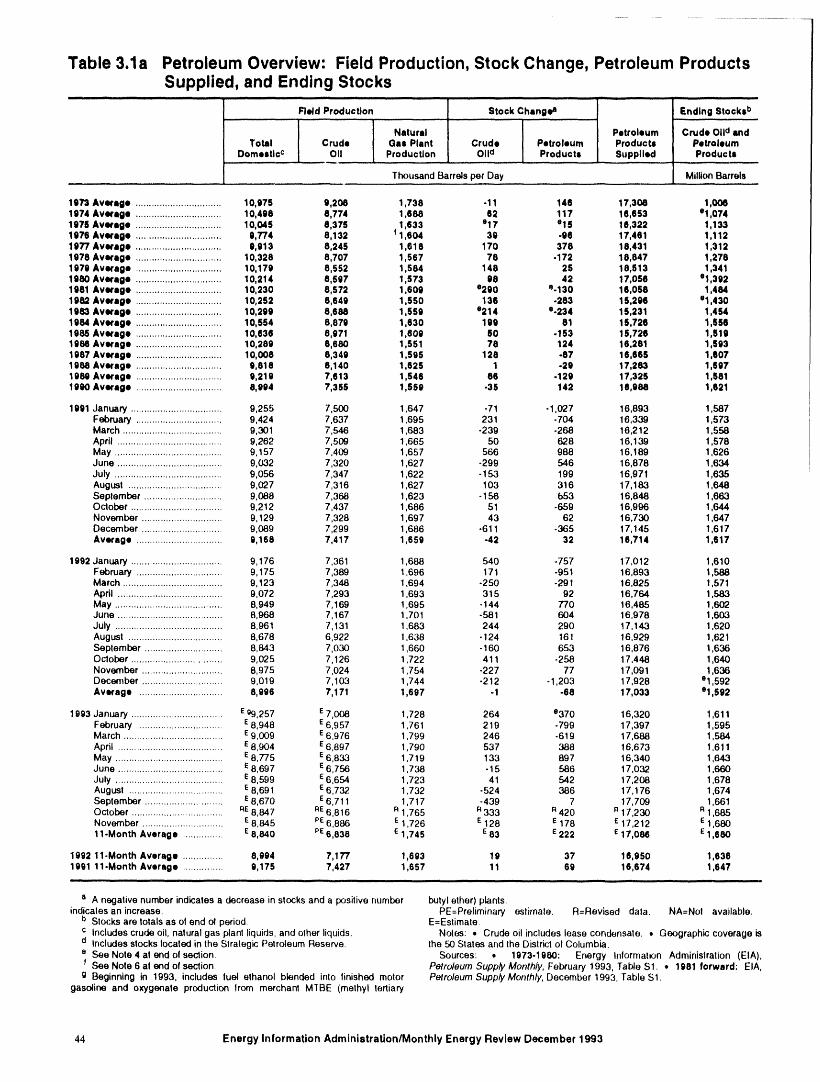
Table 3.1a Petroleum Overview: Field Production, Stock Change, Petroleum ProductsSupplied, and Ending Stocks
..... ii i i iiHll I _ll I I.llll I
Fhdd ProducUon Stock Changea I Ending Stock@
Natural Petroleum Crude Oiid endTotal Crude Gas Plant Crude Petroleum Products Petroleum
Domestic c OII Production OIId Products Supplied Products
ThousandBarrelsper Day MillionBarrels
1973 Average ................................ 10,975 6,208 1,738 -11 146 17,308 1,0061974 Average ................................ 10,498 8,774 1,689 62 117 16,653 91,0741975 Average ................................ 10,045 8,375 1,633 917 e16 16 322 1,1331976 Average ............................... 9,774 8,132 ! 1,604 39 -96 17 461 1,1121977 Average ................................ 9,913 8,245 1,618 170 378 18 431 1,3121978 Average ................................ 10,328 8,707 1,567 78 .172 18 847 1,2781979 Average ................................ 10,179 6,552 1,584 148 25 18 513 1,3411980 Average ................................ 10,214 6,597 1,673 98 42 17 056 el,3921981 Average ................................ 10,230 8,572 1,609 e290 %130 16 058 1,4841982 Average ................................ 10,252 8,649 1,550 136 -283 15 296 91,4301983 Average ................................ 10,299 6,688 1,559 9214 e-234 15 231 1,4541984 Average ................................ 10,554 6,679 1,630 199 81 16 726 1,S561986 Average ................................ 10,636 8,971 1,609 60 -153 15 726 1,5191986 Averago ................................ 10,289 6,680 1,551 76 124 16 281 1,6931987 Average ................................ 10,008 8,349 1,595 126 -87 16 666 1,6071989 Average ................................ 9,818 8,140 1,626 1 -29 17 283 1,6971989 Average ................................ 9,219 7,613 1,546 66 -129 17326 1,5811990 Average ................................ 8,994 7,355 1,659 -35 142 16 989 1,621
1991 January .................................. 9,255 7,500 1 647 -71 -1,027 16,893 1,587February ................................ 9,424 7,637 1 695 231 -704 16,339 1,573March ..................................... 9,301 7,546 1 683 -239 .268 16,212 1,558April ....................................... 9,262 7,509 1 665 50 628 16,139 1,578May ........................................ 9,157 7,409 1 657 566 988 16,189 1,626June ....................................... 9,032 7,320 1 627 -299 546 16,878 1,634 iJuly ........................................ 9,056 7,347 1 622 -153 199 16,971 1,635August ................................... 9,027 7,3t6 1 627 103 316 17,183 1,648Seplember ............................. 9,088 7,368 1 623 -156 653 16,848 1,663October .................................. 9,212 7,437 1 686 51 -6,59 16,996 1,644November .............................. 9,129 7,328 1 697 43 62 16,730 1,647December .............................. 9,089 7,299 1 686 -611 .365 17,145 1,617Average ................................ 9,168 7,417 1 659 -42 32 16,714 1,617
1992 January .................................. 9,176 7,361 1 688 540 -757 17,012 1,610February ................................ 9,175 7,389 1 696 171 -951 16,893 1,588March ..................................... 9,123 7,348 1 694 -250 -291 16,825 1,571Apdl ....................................... 9,072 7,293 1 693 315 92 16,764 1,583May ........................................ 8,949 7,169 1 695 -144 770 16,485 1,602June ....................................... 8,968 7,167 1 701 -581 604 16,978 1,603July ........................................ 8,961 7,131 1 683 244 290 17,143 1,620August ................................... 8,678 6,922 I 638 -124 161 16,929 1,621September ............................. 8,843 7,030 1 660 -160 653 16,876 1,636October .................................. 9,025 7,126 1 722 411 .258 17,448 1,640November .............................. 8,975 7,024 1 754 -227 77 17,091 1,636December .............................. 9,019 7,103 1 744 -212 -1,203 17,928 91,592Average ................................ 8,996 7,171 1 697 -1 -66 17,033 91,592
1993 January .................................. E%,257 S7,008 1,728 264 9370 16,320 1,611February ................................ E8,948 E6,957 1,761 219 -799 17,397 1,595March ..................................... E9,009 E6,976 1,799 246 -619 17,688 1,584April ....................................... E8,904 E6,897 1,790 537 388 16,673 1,611May ........................................ E8,775 E 6,833 1,719 133 897 16,340 1,643June ....................................... E8,697 E6,756 1,738 -15 586 17,032 1,660July ........................................ E8,599 E6,654 1,723 41 542 17,208 1,678August ................................... E8,691 E6,732 1,732 -524 386 17,176 1,674September ............................ E8,670 E6,711 1,717 -439 7 17,709 1,661October .................................. _E8,847 RE6,816 R1,765 R333 R420 R17,230 R1,685November .............................. E8,845 PE6,886 E1,726 E128 E 178 E17,212 E1,68011-Month Average ............... E8,840 PE6,838 E 1,745 E83 E222 E17,086 E1,680
1992 11-Month Average ............... 8,994 7,177 1,693 19 37 16,950 1,6361991 11-Month Average ............... 9,175 7,427 1,657 11 69 16,674 1,647
a A negative number indicates a decrease in stocks and a positivenumber butyl ether) plants.indicalesan increase. PE=Preliminary eslimate. R=Revised data. NA=Nol available.
b Stocksare totalsas ot end ot period. E=Estimate.c Includescrudeoil,natural gas plantliquids, and other liquids. Notes: = Crude oil includes lease condensate. • Geographic coverage isd Includes stockslocated in the Strategic Petroleum Reserve. the 50 Stales and the Districtol Columbia.• See Nole 4 at end ol section. Sources: • 1973-1980: Energy Information Administration (EIA),! See Note 6 al end of section. Petroleum Supp_, Monthly, February 1993, Table $1. • 1981 forward: EIA,
g Beginning in 1993, includes luel ethanol blended into finished motor Petroleum Supp_/Monthly, December 1993, Table $1.gasoline and oxygenate production lrom merchant MTBE (methyl tertiary
44 Energy Information Administration/Monthly Energy Review December 1993
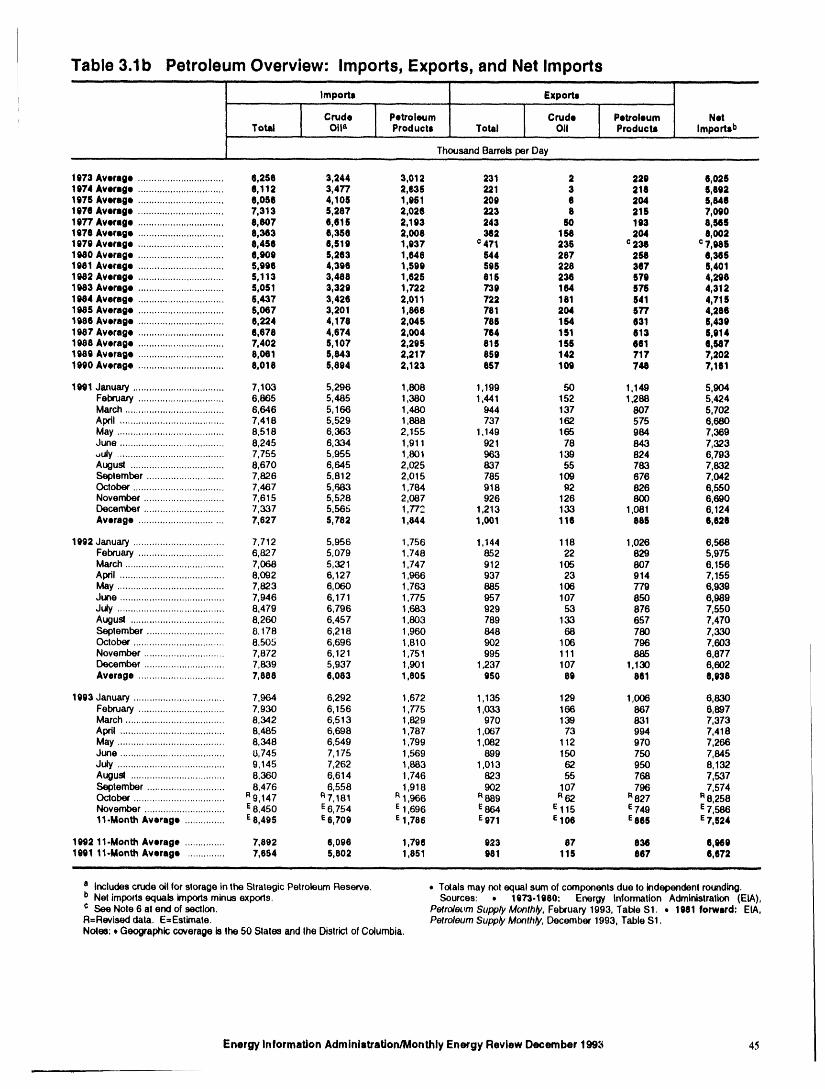
Table 3.1b Petroleum Overview: Imports, Exports, and Net Imports=.1 i i ............................... , ,,,,,,,,
i Imports Exports, , ,...... , ..........i
Crude Petroleum Crude Petroleum NetTotal Oila Prod ucta Total 0tl Products Import@.....................
ThousandBarrelsper Day
i 973 Average ................................ 5,256 3,244 3,012 231 2 229 6,0251974 Average ................................ 8,112 3,477 2,635 221 3 219 5,6921975 Average ................................ 6,056 4,105 1,981 209 8 204 S,8481970 Average ................................ 7,313 5,287 2,026 223 8 215 7,0901977 Avorage ................................ 8,807 6,615 2,193 243 SO 193 8,5651078 Average ................................ 0,363 6,358 2,008 362 158 204 8,0021979 Average ................................ 8,456 6,619 1,937 c 471 235 c 236 c 7,9851980 Average ................................ 5,909 S,263 1,646 544 287 258 6,3651981 Average ................................ 5,996 4,396 1,599 695 228 367 5,4011982 Average ................................ 5,113 3,486 1,625 815 236 579 4,2981983 Average ................................ 5,051 3,329 1,722 739 184 575 4,312199994Average ................................ 5,437 3,426 2,011 722 181 541 4,7151985 Average ................................ 5,067 3,201 1,866 781 204 577 4,2861986 Average ................................ 6,224 4,176 2,045 766 164 631 6,4391967 Average ................................ 6,676 4,674 2,004 764 151 613 5,9141988 Average ................................ 7,402 5,107 2,295 815 155 e61 6,5871989 Average ................................ 8,061 5,843 2,217 859 142 717 7,2021990 Average ................................ 8,018 5,894 2,123 857 109 748 7,161
1(1(}1January .................................. 7,103 5,296 1,808 1,199 50 1,149 5,904February ................................ 6,865 5,465 1,380 1,441 152 1,288 5,424March ..................................... 6,646 5,166 1,480 944 137 807 5,702Apdl ....................................... 7,418 5,529 1,8B8 737 162 575 6,680May ........................................ 8,518 6,363 2,155 1,149 165 984 7,369June ....................................... 8,245 6,334 1,911 921 78 843 7,323,,uly ........................................ 7,755 5,955 1,801 963 139 824 6,793August ................................... 8,670 6,645 2,025 837 55 783 7,832September ............................. 7,82.6 5,812 2,015 785 109 676 7,042October .................................. 7,467 5,683 1,784 918 92 826 6,550November .............................. 7,615 5,528 2,087 926 126 800 6,690December .............................. 7,337 5,565 1,772 1,213 133 1,081 6,124Average ................................ 7,627 S,782 1,844 1,001 116 885 6,628
1992 January .................................. 7,712 5,956 1,756 1,144 118 1,026 6,568February ................................ 6,827 5,079 1,748 852 22 829 5,975March ..................................... 7,068 5,321 1,747 912 105 807 6,156April ....................................... 8,092 6,127 1,966 937 23 914 7,155May ........................................ 7,823 6,060 1,763 885 106 779 6,939June ....................................... 7,946 6,171 1,775 957 107 850 6,989Juhj ........................................ 8,479 6,796 1,683 929 53 876 7,550August ................................... 8,260 6,457 1,803 789 133 657 7,470September ............................. 8,178 6,218 1,960 848 68 780 7,330October .................................. 8,505 6,696 1,810 902 106 796 7,603November .............................. 7,872 6,121 1,751 995 111 885 6,877December .............................. 7,839 5,937 1,901 1,237 107 1,130 6,602Average ................................ 7,686 6,083 1,605 950 89 861 §,938
1993 January .................................. 7,964 6,292 1 672 1,135 129 1,006 6,830February ................................ 7,930 6,156 1 775 1,033 166 867 6,897March ..................................... 8,342 6,513 1 829 970 139 831 7,373April ....................................... 8,485 6,698 1 787 1,067 73 994 7,418May ........................................ 8,348 6,549 1 799 1,082 112 970 7,266June ....................................... _3,745 7,175 1 569 899 150 750 7,845July ........................................ 9,145 7,262 1 883 1,013 62 950 8,132August ................................... 8,360 6,614 1 746 823 55 768 7,537September ............................. 8,476 6,558 1 918 902 107 798 7,574October .................................. R9,147 R7,181 R1 966 R889 R62 R827 R8,258November .............................. E8,450 E6,754 E 1 696 E864 E115 E749 E7,58611-Month Average ............... E8,495 E6,709 E1 786 E971 e 106 E865 E7,524
1992 11-Month Average ............... 7,092 5,096 1,796 923 87 836 (!,969lffi) 1 11-Month Average .............. 7,654 5,802 1,851 981 115 867 6,672
a Includescrudeoil forstoragein the Strategic Petroleum Reserve. • Tolals may not equal sumof componenlsdue to independenl rounding.b Net import3equals importsminus exports. Sources: -- 1973-1980: Energy Information Administration (EIA),c See Note 6 at end of section. Petroleum Supp/y Monthly, February 1993, Table $1. , 1981 forward: EIA,R=Revised data. E=Esttmate. Petroleum Supp/y Monthy, December 1993, Table $1.Noles: ,, Geographic coverage is the 50 States and the District of Columbia.
Energy Information Administration/Monthly Energy Review December 199:_ 45
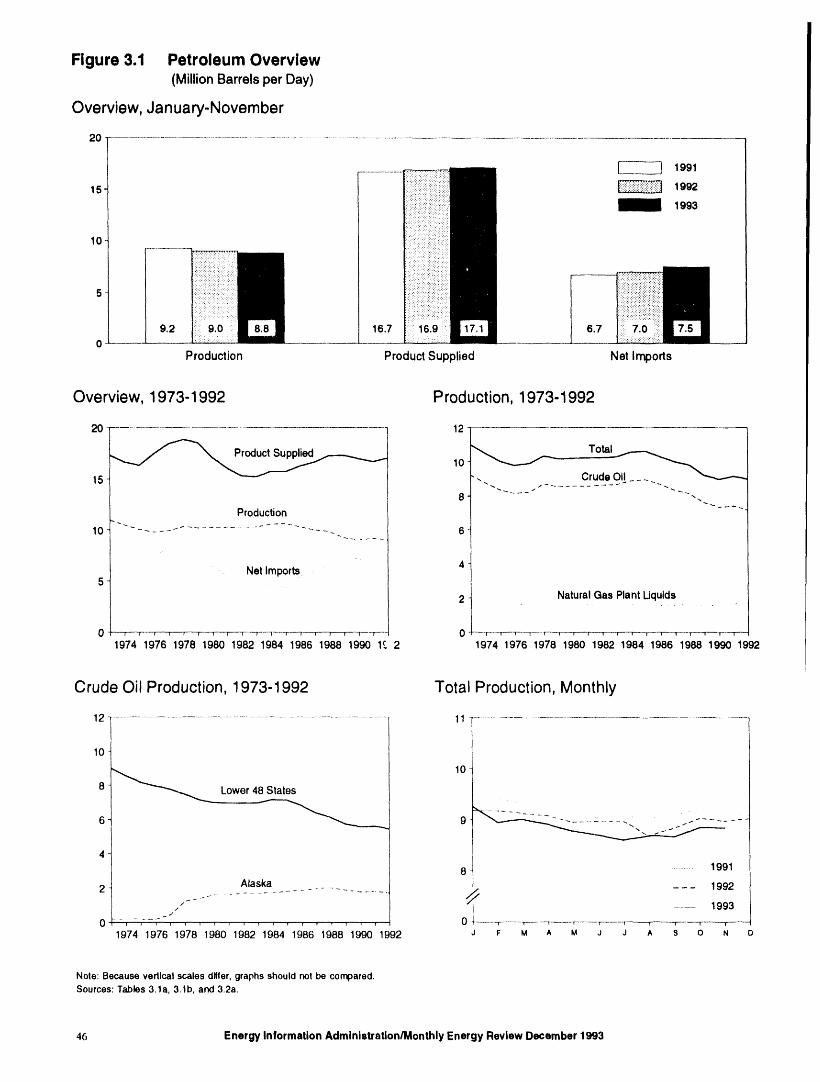
Figure 3.1 Petroleum Overview(MillionBarrelsperDay)
Overview, January-November
20
....... C-_J 199115 _ 1992
1993
10
5-
16,70 .....
Production Product Supplied Net Imports
Overview, 1973-1992 Production, 1973-1992
20 12
t 5 , .. Crude O11__ _
Production
10 ...... " ...................... 6
4• Net Imports
5
2 NaturalGas PlantUquids
_-- "-TT-'T-"-T-°I----T--77T-----T--F-T---" 0 .... F-'--r--l--T-" f-- 7t--'-l"_'7--'l-----1-'-'-l---1-- I --T--t---
1974 1976 1978 1980 1982 1984 1986 1988 1990 1£ 2 1974 1976 1978 1980 1982 1984 1986 1988 1990 1992
Crude Oil Production, 1973-1992 Total Production, Monthly
12 ................................................................................. 11
10
8 _ 10Lower48States
6 _"_- ..___... 9 ........ _....... '
4 f
8 ........... 1991
2 Alaska 1992
_,_" _ 1993197419761978198019821989841 6198819901992 J F M A M J J A S O N O
Note:Becauseverticalscalesdiffer,graphsshouldnotbe compared.Sources:Tables3.1a,3.1b, and3.2a.
4_ Energy Information Administration/Monthly Energy Review December 1993
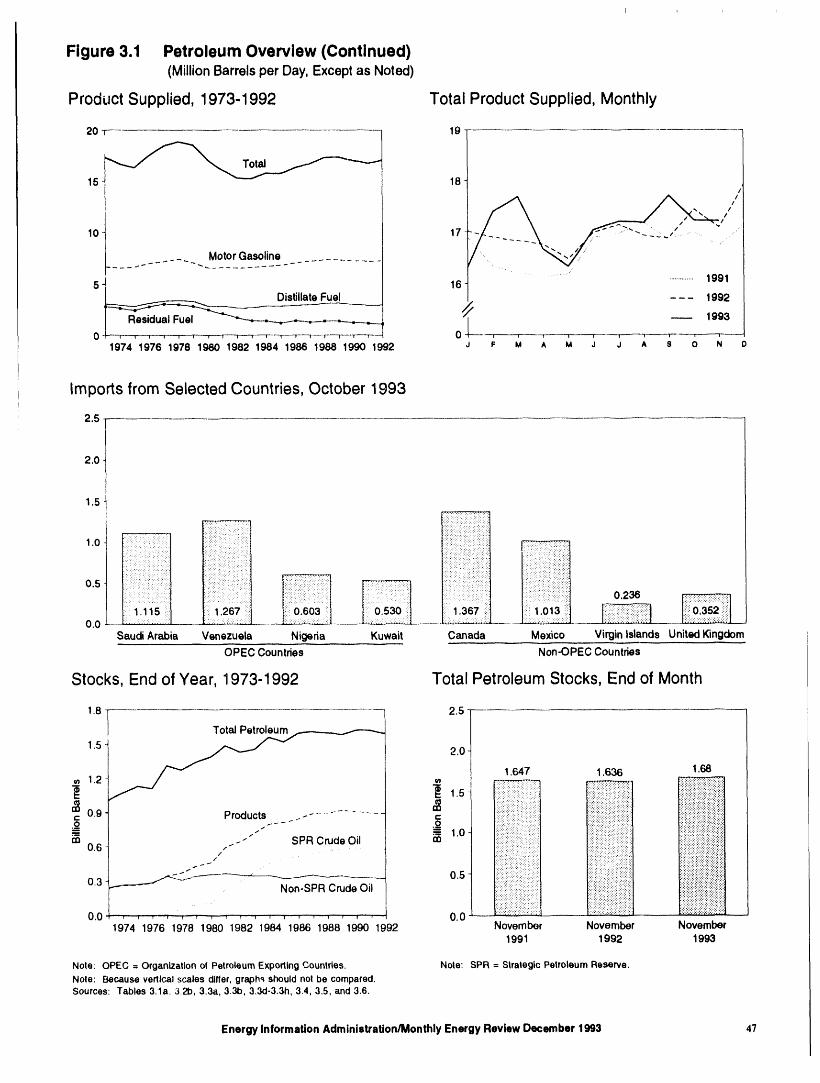
Figure 3.1 Petroleum Overview (Continued)(Million Barrels per Day, Except as Noted)
Product Supplied, 1973-1992 Total Product Supplied, Monthly
20 7 19
15 1B
_ . ,' "-_./ , •.... • ..10 17 - _....
...... _ MotorGasoline """ _ ............ /
..............19915 J 16
Distillate Fuel - - - 1992
_-_ ----------_ // -- 1993ResidualFuel "-"__-.---.__.__0 -----1" • , ' , t t ..... t---'T'--"i _ |.... I t ...., ---t--'--T'----t-----T---- 0 _ ,' , "_'-1-"'----"1--- , ' ' t _--
1974 1976 1978 1980 1982 1984 1986 1988 1990 1992 J F M a M J J A S 0 N D
Imports from Selected Countries, October 1993i
2.5
2.0
1.5_::i!i!:Ti'i::!iT!!:iii_:_i!:::
iii:!ii!i::........ !i!ii!iii:iiiiiiii::i!!:iii!:ii!:
'i:i:!ili! :3 : :i:i,!-i!::i:iiiii!!::.:!i ji_!:ii:!!ii:i!:i i!:iiiii_ili!!i:]
:::?::.::........ :i?:::::::::::::::::::::::::: lili::i:ili::.?iii!!iiiii:!:.::.!i!il 0,236:i:::!:i. : :. ::::.:::i:i-i::.i' :::::
:::i1.267 _il 1.367 ::i I::_ii1,013 iii liili!0,352 i::i::::iI I0.0 .... ......................................... ' ..... -............................
Saudi Arabia Venezuela Nigeria Kuwait Canada Mexico Virgin Islands UnitedKingdom
OPEC Countries Non-OPECCountries
Stocks, End of Year, 1973-1992 Total Petroleum Stocks, End of Month
1.8 2.5 ]-
I1,5 - 2.0
/
I 1.647 1.636 1.68
._ 1.2- _ I i........ _1.51 !:ii:i:i:i:::i!i:i:!:::i:!!::i ::::::::::::::::::::::::::::::::.......::::::: : •iii
_c 0.9- Products - .............. _c II :i:::ii:_:!i!iii:i!:::iii::iii::::i!:i!ii:!iiiiiiii:ziiiiiiiiiiii!ii! :-:-. :i!::!::!I ....................: _:._i___i_i_ -..,,,,_ ,,, ,- _ - - _ ,_ ," . . i.::::: !: .: """:"":" ' ':i!ii:ii -.-:-.::::::::..i:i:i:_ .... ........ ...,.........:.:.:.: .. ......
_n 0.6 ," - SPR Crude Oil m 1.0" I - - .:.:.:.:.:.:...:.:.:-:.!iiiiii :-:,. • I ................................•................._::iiii! .......!
:::::::: . ::::::i
0.3 ___--_ _" Non-SPR CrudeOil i_ii!ii:!iiii!_i_i;ilili!:_ii_i!i!i:i!!ili:.!:.i:.si;iiiiii:;ii:iii_iilliii?::_gi:::.g?iiiiiii!::ii:.iii::i::i::I i!i!i::!i!iiiiiiiiiii!::ii:i:!:! i!ii!i::.i:.i:iiii!iii!iii!i!ii!!i!l-.-.---:-i:i----.!!!i!i!:.:-..:.:,.:.,:..:.:,:.:.:.::, iiiii!iii!iii!ii iii:ii!iiiii!_l ......
0.0 , , , '_ , '_ ..... ' , "' ,....., O.0 _L____-:;:i ii_iiiiiii_i_:.-i_iiiii!iiiii:.i:i;.:-;:;;;_._.i;i::,;:,.;;;.::;_:_1974 1976 1976 1980 1962 1984 1986'1986'1990 1992 November November November
1991 1992 1993
Note: OPEC= Organizationo! PetroleumExportingCountries. Note: SPR= StrategicPetroleumReserve.Nole: Becauseverticalscalesdiffer,graph_shouldnotbe compared.Sources: Tables3.1a, 3.2b, 3.3a,3.3b, 3.3d-3.3h,3.4, 3.5, and3.6.
Energy Information AdminietratiordMonthly Energy Review December 1993 47
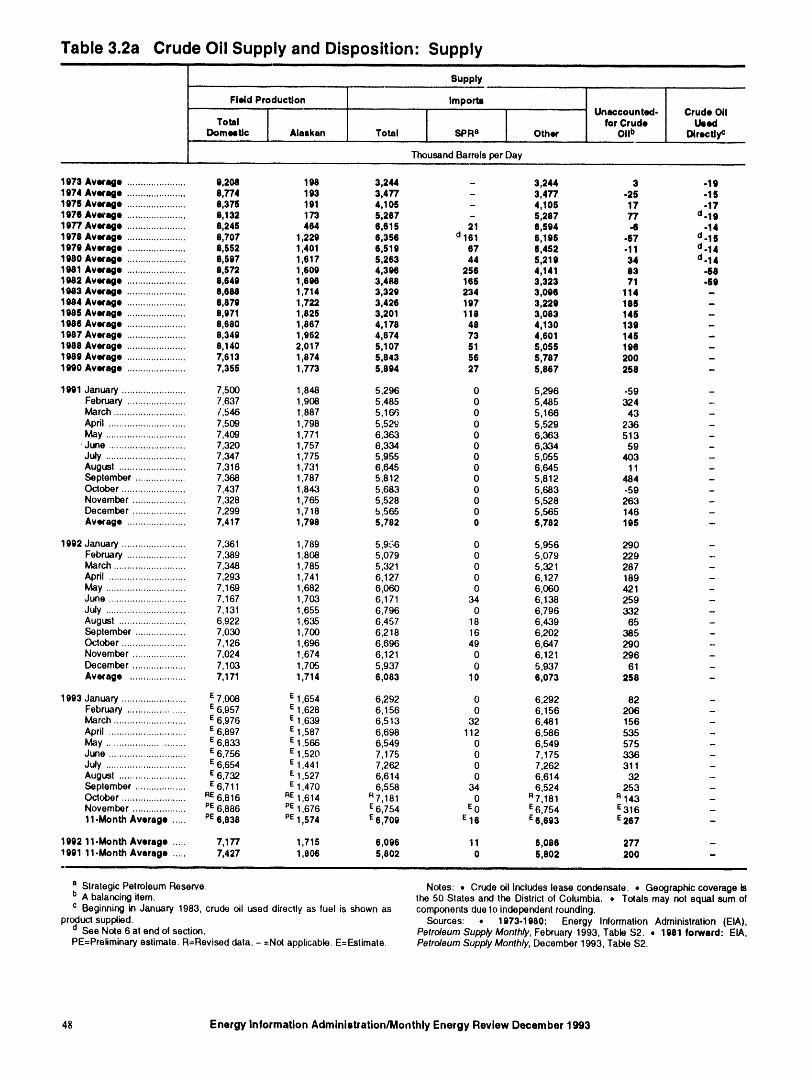
Table 3.2a Crude Oil Supply and Disposition" Supplyi ii i iiiii i i i i i
Supply
Field Production Imports........ Unaccounted. Crude O11
Total for Crude UsedDomestic Alaskan Total S_ORa Other OIIb Directly¢...............
Thousand Barrels per Day
1973 Avwqo ...................... 9,208 198 3,244 - 3,244 3 -191974 Averago ...................... 8,774 193 3,477 - 3,477 -25 -151975 Average ...................... 8,375 191 4,105 - 4,105 17 -171976 Average ...................... 9,132 173 5,287 - 5,287 77 d-191977 Average ...................... 8,245 464 6,615 21 6,594 -6 -141976 Average ...................... 8,707 1,229 8,356 d161 6,195 -57 d-151979 Average ...................... 8,552 1,401 6,519 67 6,452 -11 d.141980 Average ...................... 8,597 1,617 5,263 44 5,219 34 d-141981 Average ...................... 8,572 1,609 4,396 256 4,141 83 -581982 Average ...................... 8,640 1,696 3,488 165 3,323 71 -691983 Averago ...................... 8,688 1,714 3,329 234 3,096 114 -1984 Average ...................... 8,879 1,722 3,426 197 3,229 185 -1985 Average ...................... 8,971 1,825 3,201 118 3,083 145 -1986 Average ...................... 8,660 1,867 4,178 48 4,130 139 -1987 Average ...................... 8,349 1,962 4,674 73 4,601 145 -1988 Average ...................... 8,140 2,017 5,107 51 5,055 196 -1989 Average ...................... 7,613 1,874 5,843 56 5,787 200 -1990 Average ...................... 7,355 1,773 5,894 27 5,867 258 -
1991 January ........................ 7,500 1,848 5,296 0 5,296 -59 -February ...................... 7,637 1,908 5,485 0 5,485 324 -March ........................... 1,546 1,887 5,166 0 5,166 43 -April ............................. 7,509 1,798 5,52_ 0 5,529 236 -May .............................. 7,409 1,771 6,363 0 6,363 513 -
'June ............................. 7,320 1,757 6,334 0 6,334 59 -July .............................. 7,347 1,775 5,955 0 5,055 403 -August ......................... 7,316 1,731 6,645 0 6,645 11 -September ................... 7,368 1,787 5,812 0 5,812 484 -October ........................ 7,437 1,843 5,683 0 5,683 -59 -November .................... 7,328 1,765 5,528 0 5,528 263 -December .................... 7,299 1,718 5,565 0 5,565 146 -Average ...................... 7,417 1,796 5,782 0 5,762 195 -
1992 January ........................ 7,361 1 789 5,956 0 5,956 290 -February ...................... 7,389 1 808 5,079 0 5,079 229 -March ........................... 7,348 1 _'85 5,321 0 5,321 287 -Apdl ............................. 7,293 1 741 6,127 0 6,127 189 -May .............................. 7,169 1 682 6,060 0 6,060 421 -June ............................. 7,167 1 703 6,171 34 6,138 259 -July .............................. 7,131 1 655 6,796 0 6,796 332 -August ......................... 6,922 1 635 6,457 18 6,439 65 -September ................... 7,030 1 700 6,218 16 6,202 385 -October ........................ 7,126 1 696 6,696 49 6,647 290 -November .................... 7,024 1 674 6,121 0 6,121 296 -December .................... 7,103 1 705 5,937 0 5,937 61 -Average ..................... 7,171 1,714 6,083 10 6,073 258 -
1993 January ........................ E7,008 E1,654 6,292 0 6,292 82 -February ...................... E6,957 E1,628 6,156 0 6,156 206 -March ........................... E6,976 E1,639 6,513 32 6,481 156 -April ............................. E6,897 E1,587 6,698 112 6,586 535 -May ............................. E6,833 E1,566 6,549 0 6,549 575 -June ............................. E6,758 E1,520 7,175 0 7,175 336 --July .............................. E6,654 E1,441 7,262 0 7,262 311 -August .........................E6,732 E1,527 6,614 0 6,614 32 --September................... E6,711 E1,470 6,558 34 6,524 253 --October ........................ RE6,816 RE1,614 R7,181 0 R7,181 R143 --November .................... PE6,886 PE1,676 E6,754 E0 E6,754 E316 --11-Month Average ..... PE6,538 PE1,574 E6,709 E16 e 6,693 E287 --
1992 11-Month Average ..... 7,177 1,715 6,096 11 6,086 277 -1991 11-Month Average ..... 7,427 1,806 5,802 0 5,802 200 -
a Strategic Petroleum Reserve. Notes: • Crude oilincludes lease condensate. • Geographiccoverage isb A balancingitem. the 50 States and the District of Columbia. • Totals may not equal sum ofc Beginning in January 1983, crude oil used directly as fuel is _own as componentsdue to independent rounding.
productsupplied. Sources: • 1973-1980: Energy Information Administration (EIA),u See Note 6 at end of section. Petroleum Supply Monthly, February 1993, Table $2. , 1981 forward: EIA,PE=Preliminaryestimate. R=Revised data. - =Not applicable.E=Estimale. Petroleum Supply Monthly, December 1993, Table $2.
48 Energy Information Administration/lVlonthly Energy Review December 1993
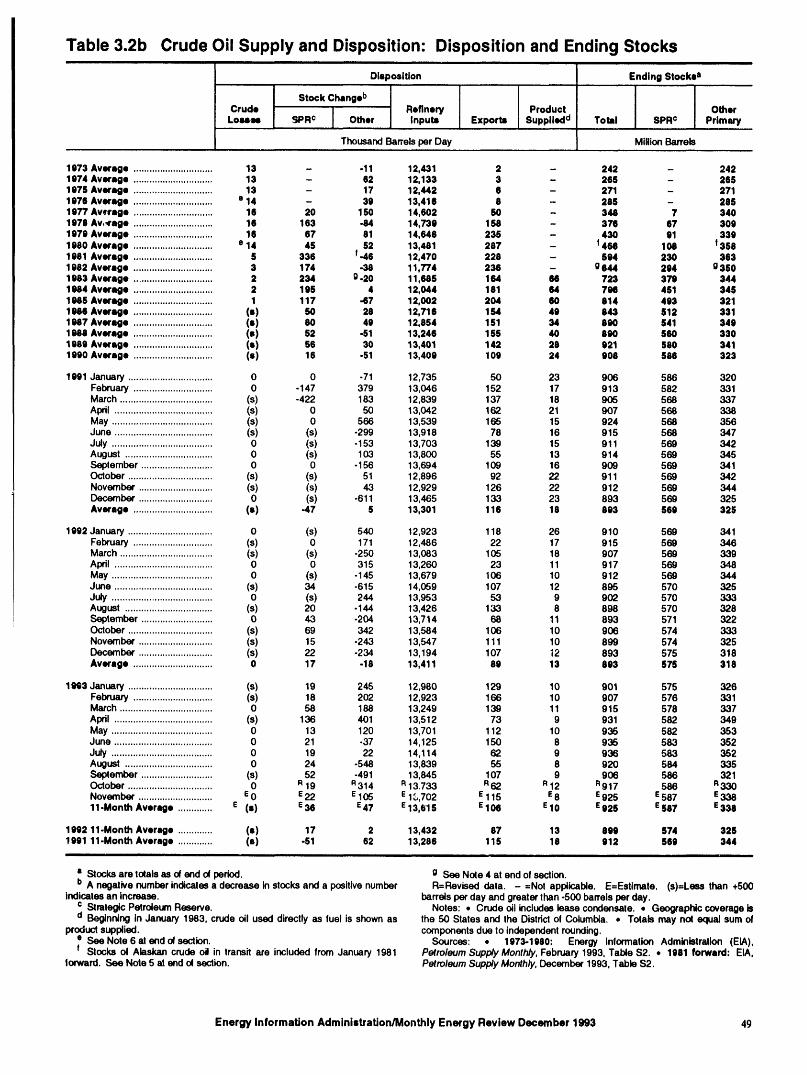
Table 3.2b Crude Oil Supply and Disposition: Disposition and Ending Stocks
Disposition Ending Stocks a
Stock Change bCrude ............. Refinery Product Other
Losses SPRc Other Inputs Exports Suppliedd Total SPR¢ Primary
ThousandBarrelsper Day Million Barrels
1973 Average .............................. 13 - -11 12,431 2 - 242 - 2421974 Average .............................. 13 - 62 12,133 3 - 266 - 2651976 Average .............................. 13 - 17 12,442 6 - 271 - 2711976 Average .............................. • 14 - 38 13,416 8 - 285 - 2851977 Average .............................. 16 20 150 14,602 SO - 348 7 3401978 Av,_rege .............................. 16 163 -84 14,739 158 - 376 67 3091979 Average .............................. 16 67 81 14,646 235 - 430 91 3391980 Average .............................. e 14 45 52 13,481 267 - f458 108 f3561981 Average .............................. S 336 f-46 12,470 228 - 694 230 3631982 Average .............................. 3 174 -38 11,774 236 _ O644 264 g3501983 Average .............................. 2 234 g -20 11,685 164 66 723 379 3441U4 Average .............................. 2 195 4 12,044 161 64 798 451 3461986 Average .............................. 1 117 -67 12,002 204 60 914 493 3211986 Average .............................. (s) 50 28 12,716 164 49 843 612 3311 987 Average .............................. (s) 80 49 12,854 151 34 890 641 3491986 Average .............................. (a) 52 -61 13,246 155 40 890 560 3301989 Averege .............................. (s) 56 30 13,401 142 28 921 680 3411980 Average .............................. (s) 16 -51 13,409 109 24 906 686 323
1991 January ................................ 0 0 -71 12,735 50 23 906 586 320February .............................. 0 -147 379 13,046 152 17 913 582 331March ................................... (s) -422 183 12,839 137 18 905 568 337April ..................................... (s) 0 50 13,042 162 21 907 568 338May ...................................... (s) 0 566 13,539 165 15 924 568 356June ..................................... (s) (s) -299 13,918 78 16 915 568 347July ...................................... 0 (s) -153 13,703 139 15 911 569 342August ................................. 0 (s) 103 13,800 55 13 914 569 345September ........................... 0 0 -156 13,694 109 16 909 569 34 1October ................................ (s) (s) 51 12,896 92 22 911 569 342November ............................ (s) (s) 43 12,929 126 22 912 569 344December ............................ 0 (s) -611 13,465 133 23 893 569 325Average .............................. (s) -47 5 13,301 116 18 893 569 328
1992 January ................................ 0 (s) 540 12,923 118 26 910 568 34 1February .............................. (s) 0 171 12,486 22 17 915 569 346March ................................... (s) (s) -250 13,083 105 18 907 569 339April ..................................... 0 0 315 13,260 23 11 917 569 348May ...................................... 0 (s) -145 13,679 106 10 912 569 344June ..................................... (s) 34 -615 14,059 107 12 895 570 325July ...................................... 0 (s) 244 13,953 53 9 902 570 333August ................................. (s) 20 -144 13,426 133 8 898 570 328September ........................... 0 43 -204 13,714 68 11 893 571 322October ................................ (s) 69 342 13,584 106 10 906 574 333November ............................ (s) 15 .243 13,547 111 10 899 574 325December ............................ (s) 22 -234 13,194 107 12 893 575 318Average .............................. 0 17 -18 13,411 80 13 803 676 318
1eQ3January ................................ (s) 19 245 12,980 129 10 901 575 326February .............................. (s) 18 202 12,923 166 10 907 576 33 1March ................................... 0 56 188 13,249 139 11 915 578 337April ..................................... (s) 136 401 13,512 73 9 931 582 349May ...................................... 0 13 120 13,701 112 10 935 582 353June ..................................... 0 21 -37 14,125 150 8 935 583 352July ...................................... 0 19 22 14,114 62 9 936 583 352August ................................. 0 24 -548 13,839 55 8 920 584 335September ........................... (s) 52 -491 13,845 107 9 906 586 321October ................................ 0 R19 R314 R13.733 R62 R12 R917 586 R330November ............................ E0 E22 E105 E1,3,702 E115 E8 E925 E587 E33811-Month Average ............. s (i) E36 E47 E13,615 E106 El0 E925 E587 E338
1992 11-Month Average ............. (s) 17 2 13,432 87 13 898 674 3261991 11-Month Average ............. (s) -51 62 13,286 115 18 912 569 344
a Stocks are totals as ol end ol period, g See Note 4 at end of section.b A negative number indicales a decrease in stocksand a positivenumber R=Revised data. - =Not applicable. E=Estimate. (s)=Less than +500
indicatesan increase, barrels per day and greater than -500 barrelsper day.c Strategic PetroleumReserve. Notes: • Crude oil includes lease condensate. • Geographic coverageisd Beginning in January 1983, crude oil used directly as fuel is shownas the 50 States and the Distdclof Columbia. • Totals may not equal sum of
productsupplied, componentsdue to independentrounding.• SesNote6alendolsection. Sources: • 1973-1980: Energy Information Administration (EIA),f Stocks of Alaskan crude oH in transit are included from January 1981 Petroleum Supply Monthly, February 1993, Table $2. • 1081 forward: EIA,
forward. See Note 5 al end ol section. Petroleum Supply Monthly, December 1993, Table $2.
Energy Information Administration/Monthly Energy Review December 1993 49
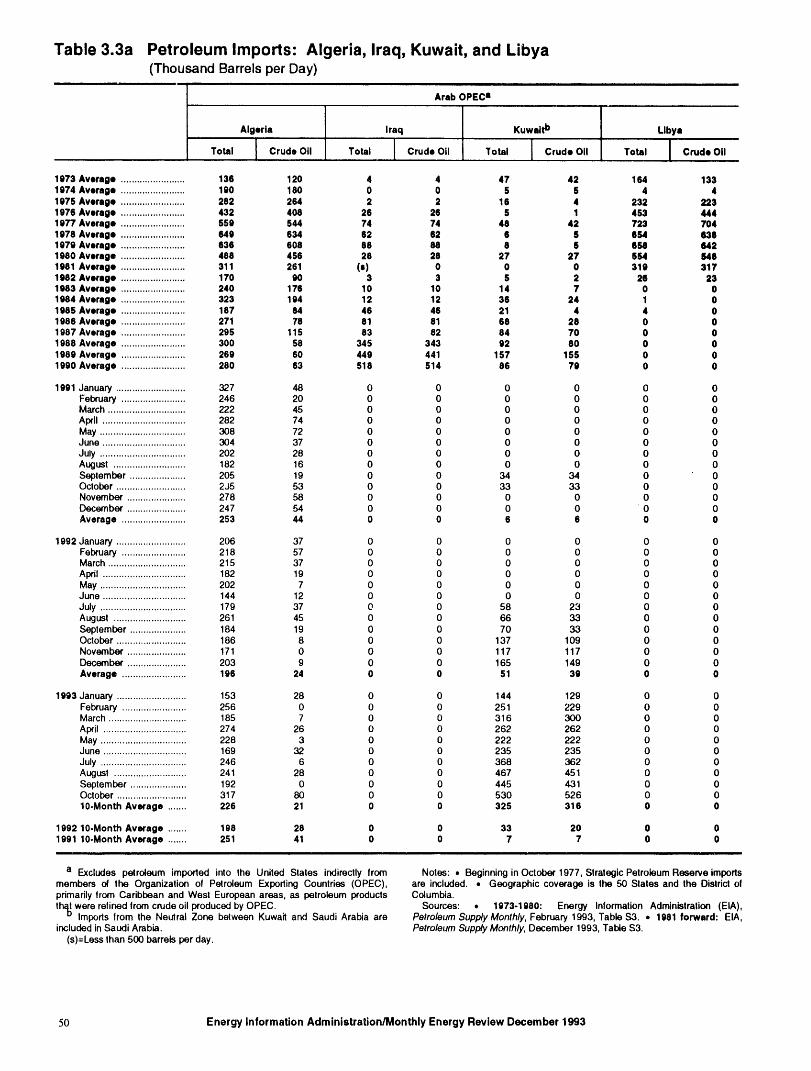
Table 3.3a Petroleum Imports" Algeria, Iraq, Kuwait, and Libya(Thousand Barrels per Day)
Arab OPECai
Algeria Iraq [ Kuwaitb Libya
T°tal ! CrudeOi' T°ta' [ Cr"d'O"! T°" [ cr""°" T°ta' ] Cr"d'O"1973 Avemge ........................ 138 120 4 4 47 42 164 1331974 Average ........................ 190 180 0 0 6 6 4 41976 Average ........................ 282 264 2 2 16 4 232 2231976 Average ........................ 432 408 26 26 5 1 4,53 4441977 Average ........................ 559 544 74 74 48 42 723 7041978 Average ........................ 649 634 62 62 6 $ 664 6361979 Average ........................ 636 608 88 88 8 6 658 6421980 Average ........................ 488 456 28 28 27 27 654 5461981 Average ........................ 311 261 (s) 0 0 0 319 3171982 Average ........................ 170 90 3 3 5 2 26 231983 Average ........................ 240 178 10 10 14 7 0 01984 Average ........................ 323 194 12 12 36 24 1 01986 Average ........................ 187 84 46 46 21 4 4 O1986 Average ........................ 271 78 81 81 68 28 0 O1987 Average ........................ 295 115 83 82 84 70 0 O1988 Average ........................ 300 58 345 343 92 80 O O1989 Average ........................ 269 60 449 441 157 155 0 01990 Average ........................ 280 63 518 514 86 79 0 0
1991 January .......................... 327 48 0 0 0 0 0 0February ........................ 246 20 0 0 0 0 0 0March ............................. 222 45 0 0 0 0 0 0April ............................... 282 74 0 0 0 0 O 0May ................................ 308 72 0 0 0 0 0 0June ............................... 304 37 0 0 0 0 0 0July ................................ 202 28 0 0 0 0 0 0August ........................... 182 16 0 0 0 0 0 0September ..................... 205 19 0 0 34 34 0 0October .......................... 235 53 0 0 33 33 0 0November ...................... 278 58 0 0 0 0 0 0December ...................... 247 54 0 0 0 0 0 0Average ........................ 253 44 0 0 6 6 0 0
1992 January .......................... 206 37 0 0 0 0 0 0February ........................ 218 57 0 0 0 0 0 0March............................. 215 37 0 0 0 0 0 0AI_I ............................... 182 19 0 0 0 0 0 0May ................................ 202 7 0 0 0 0 0 0June ............................... 144 12 0 0 0 0 0 0July ................................ 179 37 0 0 58 23 0 0August ........................... 261 45 0 0 66 33 0 0September ..................... 184 19 0 0 70 33 0 0October .......................... 186 8 0 0 137 109 0 0November ...................... 171 0 0 0 117 117 0 0December ...................... 203 9 0 0 165 149 0 0Average ........................ 196 24 0 0 51 39 0 0
1993 January .......................... 153 28 0 0 144 129 0 0February ........................ 256 0 0 0 251 229 0 0March ............................. 185 7 0 0 316 300 0 0April ............................... 274 26 0 0 262 262 0 0May ................................ 228 3 0 0 222 222 0 0June ............................... 169 32 0 0 235 235 0 0July ................................ 246 6 0 0 368 362 0 0August ........................... 241 28 0 0 467 451 0 0September ..................... 192 0 0 0 445 431 0 0October .......................... 317 80 0 0 530 526 0 010-Month Average ....... 226 21 0 0 325 316 0 O
1992 10-Month Average ....... 198 28 0 0 33 20 0 01991 10-Month Average ....... 251 41 0 0 7 7 0 0
a Excludes petroleum imported into the United States indirectly from Notes: • Beginningin October 1977, StrategicPetroleum Reserve importsmembers el the Organization of Petroleum Exporting Countries (OPEC), are included. • Geographic coverage is the 50 States and the Districtofprimarilytrom Caribbean and West European areas, as petroleum products Columbia.
tl_ were relined trom crude oil producedbyOPEC. Sources: • 1973-1980: Energy Information Administration (EIA),Imports Item the Neutral Zone between Kuwait and Saudi Arabia are Petroleum Supply Monthly, February 1993, Table $3. • 1981 forward: EIA,included inSaudi Arabia. Petroleum Supply Monthly, December 1993, Table S3.
(s)=Lessthan 500 barrels per day.
50 Energy Information Administration/Monthly Energy Review December 1993
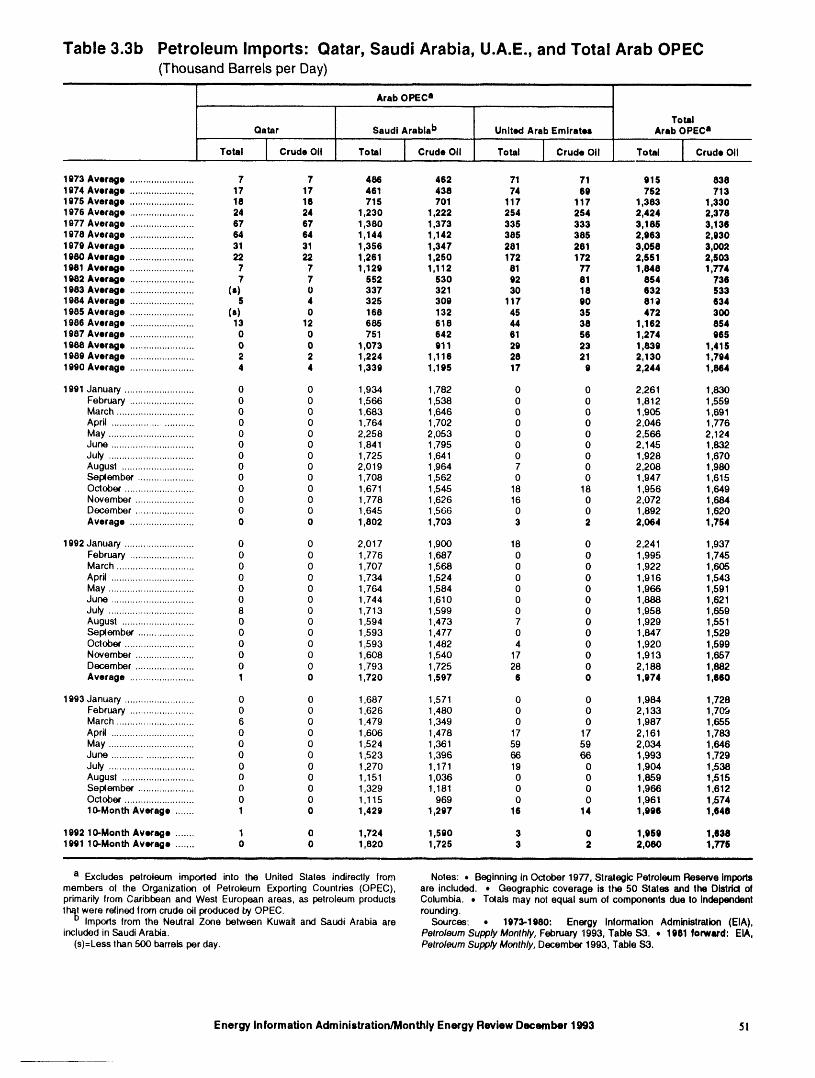
Table 3.3b Petroleum Imports" Qatar, Saudi Arabia, U.A.E., and Total Arab OPEC(Thousand Barrelsper Day)
Arab OPEC a
TotalQatar Saudi Arabiab United Arab Emiratee Arab OPEC e
Total i Crude Oil Total Crude Oil Total J Crude Oil Total Crude Oil
1973 Average ........................ 7 7 486 462 71 71 915 8381974 Average ........................ 17 17 461 438 74 69 752 7131975 Average ........................ 18 18 715 701 117 117 1,383 1,3301976 Average ........................ 24 24 1,230 1,222 254 254 2,424 2,3781977 Average ........................ 67 67 1,380 1,373 335 333 3,165 3,1361978 Average ........................ 64 64 1,144 1,142 385 385 2,963 2,9301979 Average ........................ 31 31 1,356 1,347 281 281 3,058 3,0021980 Average ........................ 22 22 1,261 1,250 172 172 2,551 2,5031981 Average ........................ 7 7 1,129 1,112 81 77 1,848 1,7741982 Average ........................ 7 7 S52 530 92 81 854 7381983 Average ........................ (s) 0 337 321 30 18 632 5331984 Average ........................ 5 4 325 309 117 90 81_ 6341985 Average ........................ (s) 0 168 132 45 35 472 3001986 Average ........................ 13 12 685 618 44 38 1,162 8541987 Average ........................ 0 0 751 642 61 56 1,274 9651988 Average ........................ 0 0 1,073 911 29 23 1,839 1,4151989 Average ........................ 2 2 1,224 1,116 28 21 2,130 1,7941990 Average ........................ 4 4 1,339 1,195 17 9 2,244 1,864
1991 January .......................... 0 0 1,934 1,782 0 0 2,261 1,830February ........................ 0 0 1,566 1,538 0 0 1,812 1,559March ............................. 0 0 1,683 1,646 0 0 1,905 1,691April ............................. 0 0 1,764 1,702 0 0 2,046 1,776May ................................ 0 0 2,258 2,053 0 0 2,566 2,124June ............................... 0 0 1,841 1,795 0 0 2,145 1,832July ................................ 0 0 1,725 1,641 0 0 1,928 1,670August ........................... 0 0 2,019 1,964 7 0 2,208 1,980September ..................... 0 0 1,708 1,562 0 0 1,947 1,615October .......................... 0 0 1,671 1,545 18 18 1,956 1,649November ...................... 0 0 1,778 1,626 16 0 2,072 1,684December ...................... 0 0 1,645 1,566 0 0 1,692 1,620Average ........................ 0 0 1,802 1,703 3 2 2,064 1,754
1992 January .......................... 0 0 2,017 1,900 18 0 2,241 1,937February ........................ 0 0 1,776 1,687 0 0 1,995 1,745March ............................. 0 0 1,707 1,568 0 0 1,922 1,605April ............................... 0 0 1,734 1,524 0 0 1,916 1,543May ................................ 0 0 1,764 1,584 0 0 1,966 1,591June ............................... 0 0 1,744 1,610 0 0 1,888 1,621July ................................ 8 0 1,713 1,599 0 0 1,956 1,659August ........................... 0 0 1,594 1,473 7 0 1,929 1,551September ..................... 0 0 1,593 1,477 0 0 1,847 1,529October .......................... 0 0 1,593 1,482 4 0 1,920 1,599November ...................... 0 0 1,608 1,540 17 0 1,913 1,657December ...................... 0 0 1,793 1,725 28 0 2,188 1,882Average ........................ 1 0 1,720 1,597 6 0 1,974 1,660
1993 January .......................... 0 0 1 687 1,571 0 0 1,984 1,728February ........................ 0 0 1 626 1,480 0 0 2,133 1,709March ............................. 6 0 1 479 1,349 0 0 1,987 1,655April ............................... 0 0 1 606 1,478 17 17 2,161 1,783May ................................ 0 0 1 524 1,361 59 59 2,034 1,646June .............................. 0 0 1 523 1,396 66 66 1,993 1,729July ................................ 0 0 1 270 1,171 19 0 1,904 1,538August ........................... 0 0 1 151 1,036 0 0 1,859 1,515September ..................... 0 0 1 329 1,181 0 0 1,966 1,612October .......................... 0 0 1 115 969 0 0 1,961 1,57410-Month Average ....... 1 0 1 429 1,297 16 14 1,996 1,648
1992 lO-Month Average ....... 1 0 1,724 1,590 3 0 1,959 1,8381991 1O-Month Average ....... 0 0 1,820 1,725 3 2 2,080 1,776
., i i . ,,.,
a Excludes petroleum imported into the United Slates indirectly from Notes: • Beginningin October 1977, Slrategic Petroleum Reserveimportsmembers of the Organization ol Petroleum Exporting Countries (OPEC), are included. • Geographic coverage is the 50 States and the Distdcl ofprimarily lrom Caribbean and West European areas, as petroleum products Columbia. • Tolals may not equal sum of components due 1oIndependentl_.lwerere(inedfromcrudeoilproducedbyOPEC. roundiryj.u ImportsfromtheNeutralZone between Kuwaitand SaudiArabiaare Sources:-- 1973-11)80" Energy InformationAdministration(EIA),
included in Saudi Arabia. Petroleum Supply Monthly, February 1993, Table $3. • 1981 forward: EIA,(s)=Less lhan 500 barrels per day. Petroleum Supply Monthly, December 1993, Table S3.
Energy InformaUon Administration/Monthly Energy Review December 1993 51
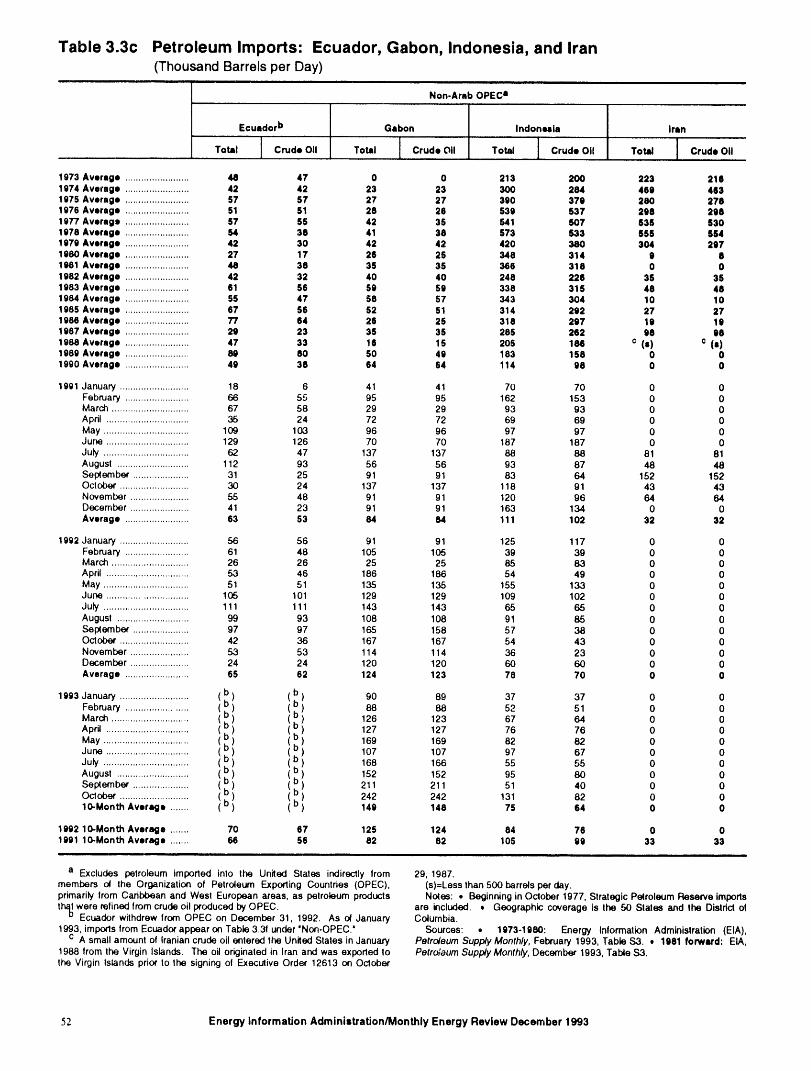
Table 3.3c Petroleum Imports- Ecuador, Gabon, Indonesia, and Iran(ThousandBarrelsper Day)
Non-Arab OPECa
Ecuador b Gabon Indonesia Iran
,.., icro°.o,,,o=,]cr°°.o,'o= Ic.".o"1973 Average ........................ 48 47 0 0 213 200 223 2181974 Average ........................ 42 42 23 23 300 284 469 4631975 Average ........................ S7 57 27 27 390 379 280 2781976 Average ........................ 51 51 28 28 539 837 298 2981977 Average ........................ 57 SS 42 35 641 507 5315 S301978 Average ........................ 54 38 41 38 573 633 SSS aS41979 Average ........................ 42 30 42 42 420 380 304 2871950 Average ........................ 27 17 26 2S 348 314 9 81981 Average ........................ 48 38 35 35 366 318 0 01982 Average ........................ 42 32 40 40 248 228 35 351983 Average ........................ 61 56 59 59 338 31S 48 481984 Average ........................ 55 47 58 57 343 304 10 101985 Average ........................ 67 56 52 51 314 292 27 271986 Average ........................ 77 64 26 25 318 297 19 191987 Average ........................ 29 23 35 35 285 262 98 1181988 Average ........................ 47 33 16 1S 205 186 c (a) c (s)1989 Average ........................ 89 80 50 49 183 158 0 01990 Average ........................ 49 38 64 64 114 98 0 0
1991 January .......................... 18 6 41 41 70 70 0 0February ........................ 66 55 95 95 162 153 0 0March ............................. 67 58 29 29 93 93 0 0April ............................... 35 24 72 72 69 69 0 0May ................................ 109 103 96 96 97 97 0 0June ............................... 129 126 70 70 187 187 0 0July ................................ 62 47 137 137 88 88 81 81August ........................... 112 93 56 56 93 87 48 48September ..................... 31 25 91 91 83 64 152 152October .......................... 30 24 137 137 118 91 43 43November ...................... 55 48 91 91 120 96 64 64December ...................... 41 23 91 91 163 134 0 0Average ........................ 63 53 64 84 111 102 32 32
1992 January .......................... 56 56 91 91 125 117 0 0February ........................ 61 48 105 105 39 39 0 0March ............................. 26 26 25 25 85 83 0 0April ............................... 53 46 186 186 54 49 0 0May ................................ 51 51 135 135 155 133 0 0June ............................... 105 101 129 129 109 102 0 0July ................................ 111 111 143 143 65 65 0 0Augusl ........................... 99 93 108 108 91 85 0 0September ..................... 97 97 165 158 57 38 0 0October .......................... 42 36 167 167 54 43 0 0November ...................... 53 53 114 114 36 23 0 0December ...................... 24 24 120 120 60 60 0 0Average ........................ 65 62 124 123 78 70 0 0
1993 January .......................... ( b ) ( b ) 90 89 37 37 0 0February ....................... ( b ) ( b ) 88 88 52 51 0 0March ............................. ( b ) ( b ) 126 123 67 64 0 0April ............................... ( b ) ( b ) 127 127 76 76 0 0May ................................ ( b ) ( b ) 169 169 82 82 0 0June ............................... ( b ) ( b ) 107 107 97 67 0 0July ................................ ( b ) ( b ) 168 166 55 55 0 0August ........................... ( b ) ( b ) 152 152 95 80 0 0Sel:Xember ..................... ( b ) ( b ) 211 211 51 40 0 0October .......................... ( b ) ( b ) 242 242 131 82 0 010-Month Average ....... ( b ) ( b ) 149 148 75 64 0 0
1992 lO-Month Average ....... 70 67 125 124 84 78 0 01991 10-Month Average ....... 66 56 82 82 105 99 33 33
a Excludes petroleum imported into the United States indirectly from 29, 1987.members el the Organization of Petroleum Exporting Countries (OPEC), (s)=Less than 500 barrels per day.primarily Irom Caribbean and West European areas, as petroleum products Noles: • Beginning in October 1977, Slralegic Petroleum Reserve imports
th_ were refined from crudeoil produced byOPEC. are included. • Geographic coverage is the 50 Stales and the Distdct elEcuador withdrew from OPEC on December 31, 1992. As el January Columbia.
1993, importsfrom Ecuador appear on Table 3.3f under"Non-OPEC." Sources: -- 1973-1980: Energy Inlormalion Administration (EIA),c A small amo_Jntof Iranian cnJdeoil entered the United States in January Petroleum Suppty Monthly, Fel:x'uary1993, Table $3. • 1981 forward: EIA,
1988 from the Virgin Islands. The oil originatedin Iran and was exportedto Petro_'aumSupply Monthly, December 1993, Table $3.the Virgin Islands prior to the signing of Executive Order 12613 on October
52 Energy Information Administration/Monthly Energy Review December 1993
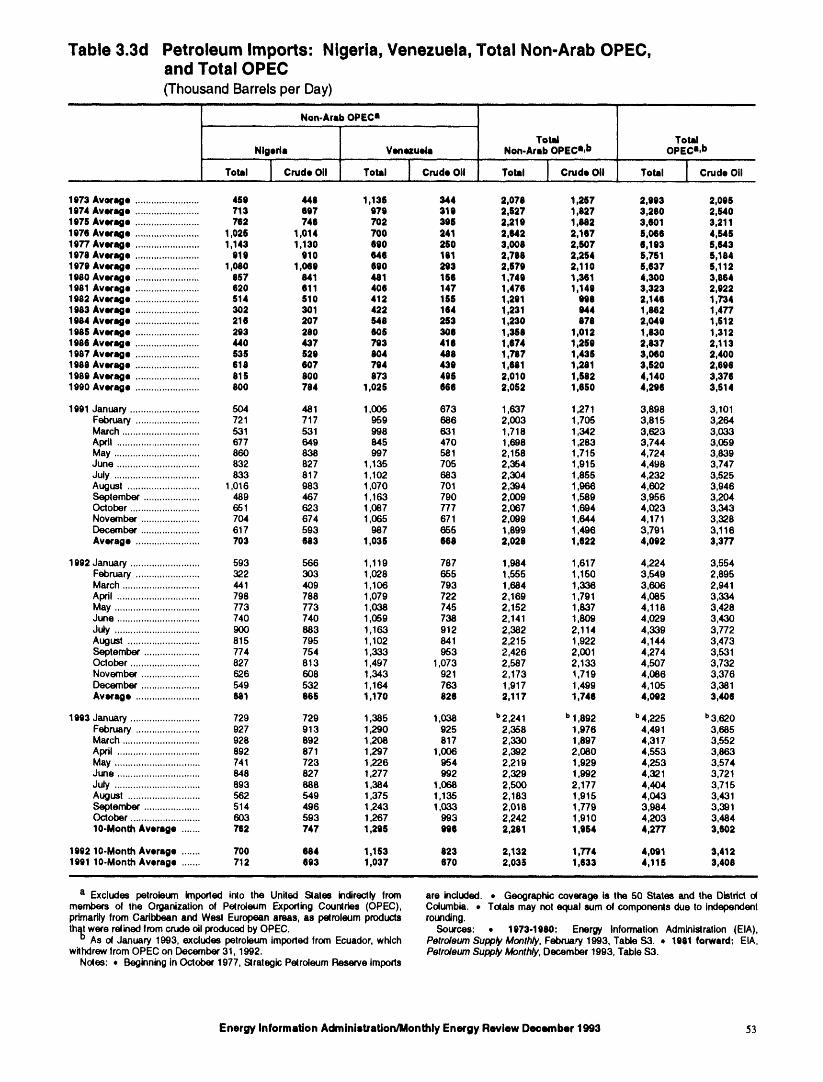
Table 3.3d Petroleum Imports: Nigeria, Venezuela, Total Non-Arab OPEC,and Total OPEC(ThousandBarrelsper Day)
i i ii ,11 i i i i i
Non-Arlb OPECa
TotJd TotalNlgeda Vectexuels Non-Arab OPECa,b OPECa,b
,o.., ,°.-,to ,.o, To= To=Jco,.o,,1073 Average ........................ 450 448 1,136 344 2,078 1,287 2,993 2,0061974 Average ........................ 713 697 979 319 2,527 1,827 3,280 2,5401975 Average ........................ 762 746 702 395 2,219 1,882 3,601 3,2111876 Average ........................ 1,025 1,014 700 241 2,542 2,167 §,066 4,5451977 Average ........................ 1,143 1,130 690 280 3,008 2,507 6,193 5,5431978 Average ........................ 919 910 646 181 2,786 2,254 5,751 5,1841979 Average ........................ 1,080 1,069 690 293 2,579 2,110 5,637 5,1121980 Average ........................ 857 541 481 156 1,749 1,361 4,300 3,8641981 Average ........................ 620 611 406 147 1,476 1,140 3,323 2,9221982 Average ........................ 514 510 412 188 1,291 689 2,146 1,7341983 Averago ........................ 302 301 422 164 1,231 944 1,682 1,4771984 Average ........................ 218 207 548 253 1,230 879 2,048 1,5121985 Average ........................ 293 280 506 306 1,358 1,012 1,830 1,3121986 Average ........................ 440 437 793 418 1,674 1,259 2,837 2,1131987 Average ........................ 535 529 804 488 1,787 1,438 3,060 2,4001988 Average ........................ 619 507 794 439 1,681 1,281 3,820 2,6961989 Average ........................ 815 800 873 496 2,010 1,682 4,140 3,3761990 Average ........................ 800 784 1,025 666 2,052 1,650 4,296 3,514
1991 January .......................... 504 481 1,005 673 1,637 1,271 3,898 3,101February ........................ 721 717 959 686 2,003 1,705 3,815 3,264March ............................. 531 531 998 631 1,718 1,342 3,623 3,033April ............................... 677 649 845 470 1,698 1,283 3,744 3,059May ................................ 860 838 997 581 2,158 1,715 4,724 3,639June ............................... 832 827 1,135 705 2,054 1,915 4,498 3,747July ................................ 833 817 1,102 683 2,304 1,855 4,232 3,525August ........................... 1,016 983 1,070 701 2,394 1,966 4,602 3,946September ..................... 489 467 1,163 790 2,009 1,589 3,956 3,204October .......................... 651 623 1,087 777 2,067 1,694 4,023 3,343November ...................... 704 674 1,065 671 2,099 1,644 4,171 3,328December ...................... 617 593 987 655 1,899 1,496 3,791 3,116Average ........................ 703 683 1,035 688 2,028 1,822 4,0t)2 3,377
1992 January .......................... 593 566 1,119 787 1,984 1,617 4,224 3,554February ........................ 322 303 1 028 655 1,555 1,150 3,549 2,895March ............................. 441 409 1 106 793 1,684 1,336 3,606 2,941April ............................... 798 788 1 079 722 2,169 1,791 4,085 3,334May ................................ 773 773 1 038 745 2,152 1,837 4,118 3,428June ............................... 740 740 1 059 738 2,141 1,809 4,029 3,430July ................................ 900 683 1 163 912 2,382 2,114 4,339 3,772August ........................... 815 795 1 102 841 2,215 1,922 4,144 3,473September ..................... 774 754 1 333 953 2,426 2,001 4,274 3,531October .......................... 827 813 1 497 1,073 2,587 2,133 4,507 3,732November ...................... 626 608 1 343 921 2,173 1,719 4,086 3,376December ...................... 549 532 1 164 763 1,917 1,499 4,105 3,381Average ........................ 681 665 1 170 826 2,117 1,746 4,092 3,406
1893 January .......................... 729 729 1 385 1,038 _2,241 b1,892 b 4,225 b3,620February ........................ 927 913 1 290 925 2,358 1,976 4,491 3,685March ............................. 928 892 1 208 817 2,330 1,897 4,317 3,552April ............................... 892 871 1 297 1,006 2,392 2,080 4,553 3,863May ................................ 741 723 1 226 954 2,219 1,929 4,253 3,574June ............................... 848 827 1 277 992 2,329 1,992 4,321 3,721July ................................ 893 888 1 384 1,068 2,500 2,177 4,404 3,715August ........................... 562 549 1 375 1,135 2,183 1,915 4,043 3,431September ..................... 514 496 1 243 1,033 2,018 1,779 3,984 3,391October .......................... 603 593 1 267 993 2,242 1,910 4,203 3,48410-Month Average ....... 782 747 1 285 eel 2,281 1,684 4,277 3,502
1992 10-Month Average ....... 700 684 1,153 823 2,132 1,774 4,091 3,4121991 10-Month Average ....... 712 893 1,037 870 2,035 1,633 4,115 3,408
a Excludes petroleum imported into the United Stales indirectly from are included. • Geographic coverage is the 50 States and the Distflct o(members ol the Orgardzalion of Petroleum Exporting Countries (OPEC), Columbia. • Totals may not equal sum of components due to independentprimarilyfrom Caribbean and West European areas, as pelmleum products rounding.
thE were relined fromcrudeoil producedbyOPEC. Sources: • 1973-1680: Energy Information Administration (EIA),As o4 January 1983, excludes petroleum imported from Ecuador, which Petroleum Supply Monthly, February 1993, Table $3. , 1981 forward: EIA,
withdrewfrom OPEC on December 31, 1992. Petroleum Supply Monthly, December 1993, Table $3.Notes: • Beginning in October 1977, Stralegic Petroleum Reserve imports
Energy Information Administration/Monthly Energy Review December 1993 5.t
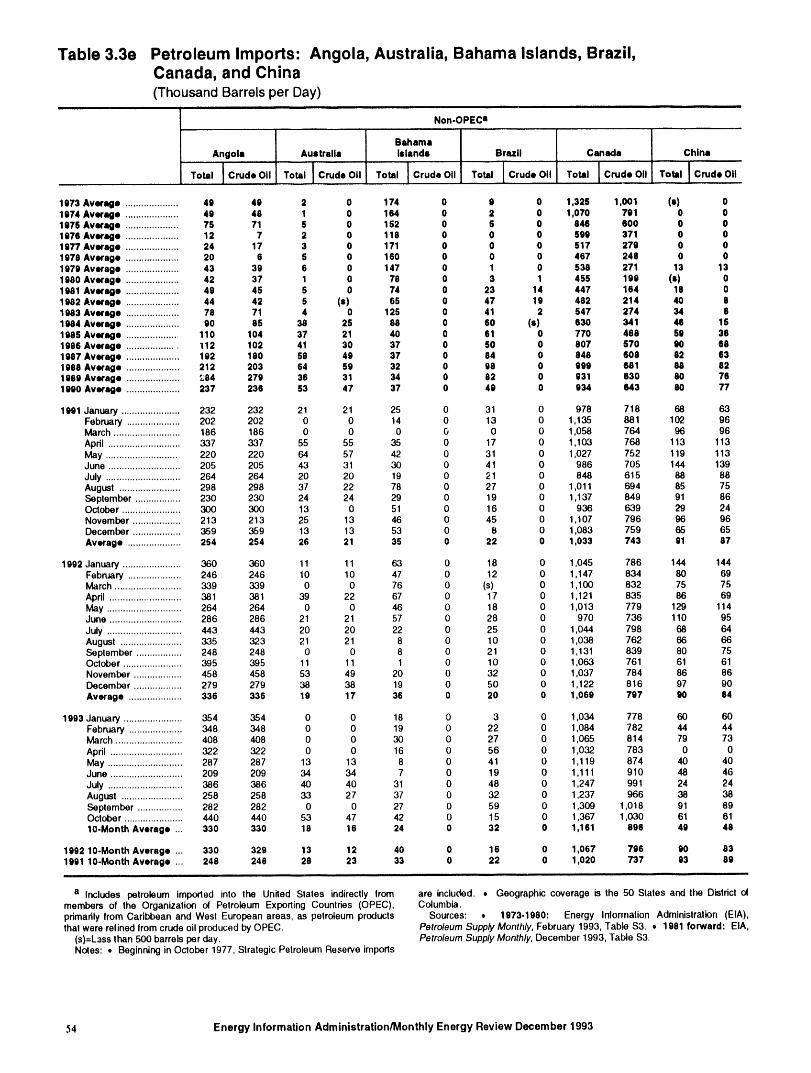
Table 3.3e Petroleum Imports" Angola, Australia, Bahama Islands, Brazil,Canada, and China(Thousand Barrels per Day)
i=|ll i llll i
Non.OPECa
Bahama
Angola Australia Islands Brazil Canada Chins
Total lCrud. Oll Total ICrud. Oil Total ICrud. Oil Total ICrud. Oil Total ICrud. Oll Total ICrud. OII
1973 Average .................... 49 49 2 0 174 0 9 0 1,325 1,001 (s) 01974 Average .................... 49 48 1 0 164 0 2 0 1,070 791 0 01975 Average .................... 75 71 5 0 152 0 5 0 846 600 0 01976 Average .................... 12 7 2 0 118 0 0 0 599 371 0 01977 Average .................... 24 17 3 0 171 0 0 0 517 279 0 01978 Average .................... 20 6 5 0 160 0 0 0 467 248 0 01979 Average .................... 43 39 6 0 147 0 1 0 538 271 13 131980 Average .................... 42 37 1 0 78 0 3 1 455 199 (s) 01981 Average .................... 49 45 5 0 74 0 23 14 447 164 18 01982 Average .................... 44 42 5 (s) 65 0 47 19 482 214 40 81983 Average .................... 78 71 4 0 125 0 41 2 547 274 34 81984 Average .................... 90 85 38 25 88 0 60 (s) 630 341 46 151985 Average .................... 110 104 37 21 40 0 51 0 770 468 59 361986 Average ................... 112 102 41 30 37 0 50 0 807 570 90 681987 Average .................... 192 180 58 49 37 0 54 0 848 608 82 631988 Average .................... 212 203 64 59 32 0 98 0 999 681 88 821989 Average .................... _84 279 36 31 34 0 62 0 931 630 80 761990 Average .................... 237 236 53 47 37 0 49 0 934 643 80 77
1991 January ...................... 232 232 21 21 25 0 31 0 978 718 68 63February .................... 202 202 0 0 14 0 13 0 1,135 881 102 96March ......................... 186 186 0 0 0 O 0 0 1,058 764 96 96April ........................... 337 337 55 55 35 0 17 0 1,103 768 113 113May ............................ 220 220 64 57 42 0 31 0 1,027 752 119 113June ........................... 205 205 43 31 30 0 41 0 986 705 144 139July ............................ 264 264 20 20 19 0 21 0 848 615 88 88August ....................... 298 298 37 22 78 0 27 0 1,011 694 85 75September ................. 230 230 24 24 29 0 19 0 1,137 849 91 86October ...................... 300 300 13 0 51 0 16 0 936 639 29 24November .................. 213 213 25 13 46 0 45 0 1,107 796 96 96December .................. 359 359 13 13 53 0 8 0 1,083 759 65 65Average .................... 254 254 26 21 35 0 22 0 1,033 743 91 87
1992 January ...................... 360 360 11 11 63 0 18 0 1,045 786 144 144February .................... 246 246 10 10 47 0 12 0 1,147 834 80 69March ......................... 339 339 0 0 76 0 (s) 0 1,100 832 75 75April ........................... 381 381 39 22 67 0 17 0 1,121 835 86 69May ............................ 264 264 0 0 46 0 18 0 1,013 779 129 114June ........................... 286 286 21 21 57 0 28 0 970 736 110 95July ............................ 443 443 20 20 22 0 25 0 1,044 798 68 64August ....................... 335 323 21 21 8 0 10 0 1,038 762 66 66September ................. 248 248 0 0 8 0 21 0 1,131 839 80 75October ...................... 395 395 11 11 1 0 10 0 1,063 761 61 61November .................. 458 458 53 49 20 0 32 0 1,037 784 86 86December .................. 279 279 38 38 19 0 50 0 1,122 816 97 90Average .................... 336 336 19 17 36 0 20 0 1,069 797 90 84
1993 January ...................... 354 354 0 0 18 0 3 0 1,034 778 60 60February .................... 348 348 0 0 19 0 22 0 1,084 782 44 44March ......................... 408 408 0 0 30 0 27 0 1,065 814 79 73April ........................... 322 322 0 0 16 0 56 0 1,032 783 0 0May ............................ 287 287 13 13 8 0 41 0 1,119 874 40 40June ........................... 209 209 34 34 7 0 19 0 1,111 910 48 46July ............................ 386 386 40 40 31 0 48 0 1,247 991 24 24August ....................... 258 258 33 27 37 0 32 0 1,237 966 38 38September ................. 282 282 0 0 27 0 59 0 1,309 1,018 91 89October ...................... 440 440 53 47 42 0 15 0 1,367 1,030 61 6110-Month Average ,.. 330 330 18 16 24 0 32 0 1,161 696 49 48
1992 10-Month Average ... 330 329 13 12 40 0 16 0 1,067 796 90 831991 10.Month Average ... 248 248 28 23 33 0 22 0 1,020 737 93 89
a Includes petroleum imported into the United States indirectly from are included.. Geographic coverage is the 50 States and the District olmembers of the Organization ol Petroleum Exporting Countries (OPEC), Columbia.primarily from Caribbean and West Europeanareas, as petroleum products Sources: , 1973-1980: Energy Information Administration (EIA),that were relined from crude oilproducedby OPEC. Petroleum Supply Monthly, February 1993, Table S3. • 1981 forward: EIA,
(s)=L3ssthan 500 barrelsper day. Petroleum Supply Monthy, December t993, Table S3.Noles: • Beginningin October 1977, Strategic PetroleumReserve imports
54 Energy Information Administration/Monthly Energy Review December 1993
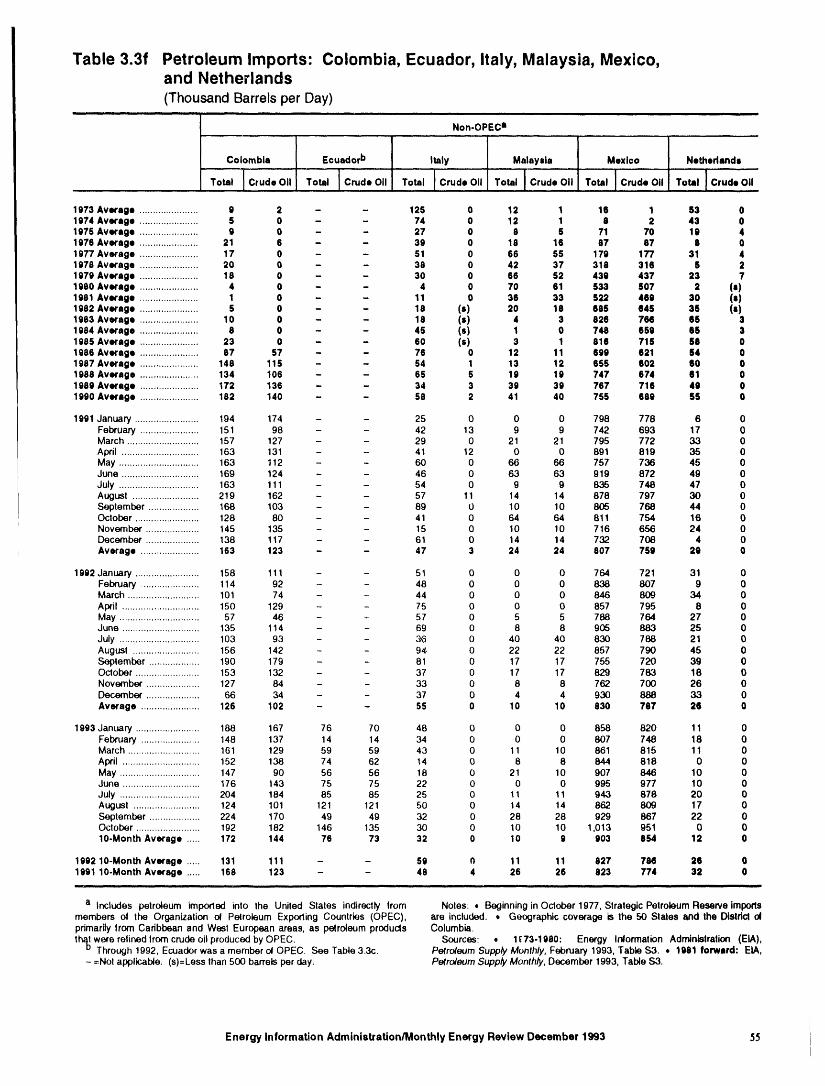
Table 3.3f Petroleum Imports: Colombia, Ecuador, Italy, Malaysia, Mexico,and Netherlands(Thousand Barrels per Day)
i ii i
Non.OPEC =
I ...................Colombia Ecuador b Italy Malaysia Mexico Nethedande..... . .........................
I Total "1 ;rude O,I Total I Crude O,I Total I ...rude O,, Total ! Crude o,, Total ]Crude Oil Total l CrudeO,l
1973 Average ...................... 9 2 - - 125 0 12 1 16 1 53 01974 Average ...................... 5 0 - - 74 0 12 I 8 2 43 0107GAverage ...................... 9 0 - - 27 0 8 6 71 70 10 41976 Average ...................... 21 6 - - 39 0 18 16 87 87 8 01977 Average ...................... 17 0 - - 51 0 66 55 179 177 31 41978 Average ...................... 20 0 - - 38 0 42 37 318 316 S 21979 Average ...................... 18 0 - - 30 0 66 52 430 437 23 71980 Average ...................... 4 0 - - 4 0 70 61 S33 S07 2 (s)1981 Average ...................... 1 0 - - 11 0 36 33 S22 460 30 (e)1982 Average ...................... 5 0 - - 18 (s) 20 18 68S 64S 3S (s)1983 Average ...................... 10 0 - - 18 (I) 4 3 826 766 65 31984 Average ...................... 8 0 - - 45 (s) 1 0 748 659 8S 31985 Average ...................... 23 0 - - 60 (s) 3 1 816 71S S8 01986 Average ...................... 87 57 - - 76 0 12 11 690 621 64 01987 Average ...................... 148 115 - - 54 1 13 12 655 602 60 01988 Average ...................... 134 106 - - 65 5 19 19 747 674 81 01989 Average ...................... 172 136 - - 34 3 39 39 767 716 40 01990 Average ...................... 182 140 - - 58 2 41 40 755 689 S5 0
1991 January ........................ 194 174 - - 25 0 0 0 798 778 6 0February ...................... 151 98 - - 42 13 9 9 742 693 17 0March ........................... 157 127 - - 29 0 21 21 795 772 33 0April ............................. 163 131 - - 41 12 0 0 891 819 35 0May .............................. 163 112 - - 60 0 66 66 757 736 45 0June ............................. 169 124 - - 46 0 63 63 919 872 49 0July .............................. 163 111 - - 54 0 9 9 835 748 47 0August ......................... 219 162 - - 57 11 14 14 878 797 30 0September ................... 168 103 - - 89 0 10 10 805 768 44 0October ........................ 128 80 - - 41 0 64 64 811 754 16 0November .................... 145 135 - - 15 0 10 10 716 656 24 0December .................... 138 117 - - 61 0 14 14 732 708 4 0Average ...................... 163 123 - - 47 3 24 24 807 759 29 0
1992 January ........................ 158 111 - - 51 0 0 0 764 721 31 0February ...................... 114 92 - - 48 0 0 0 838 807 9 0March ........................... 101 74 - - 44 0 0 0 846 809 34 0April ............................. 150 129 - - 75 0 0 0 857 795 8 0May .............................. 57 46 - - 57 0 5 5 788 764 27 0June ............................. 135 114 - - ,69 0 8 8 905 883 25 0July .............................. 103 93 - - 3\_ 0 40 40 830 788 21 0Augusl ......................... 156 142 - - 94 0 22 22 857 790 45 0September ................... 190 179 - - 81 0 17 17 755 720 39 0October ........................ 153 132 - - 37 0 17 17 829 783 18 0November .................... 127 84 - - 33 0 8 8 762 700 26 0December .................... 66 34 - - 37 0 4 4 930 888 33 0Average ...................... 126 102 - - SS 0 10 10 830 787 26 0
1993 January ........................ 188 167 76 70 48 O 0 0 858 820 11 0February ...................... 148 137 14 14 34 0 0 0 807 748 18 0March ........................... 161 129 59 59 43 0 11 10 861 815 11 0Alxil ............................. 152 138 74 62 14 0 8 8 844 818 0 0May .............................. 147 90 56 56 18 0 21 10 907 846 10 0June ............................. 176 143 75 75 22 0 0 0 995 977 10 0July .............................. 204 184 85 85 25 0 11 11 943 878 20 0Augusl ......................... 124 101 121 121 50 0 14 14 862 809 17 0September ................... 224 170 49 49 32 0 28 28 929 867 22 0October ........................ 192 182 146 135 30 0 10 10 1,013 951 0 010-Month Average ..... 172 144 76 73 32 0 10 9 903 854 12 0
1992 10-Month Average ..... 131 111 - - 59 11 11 11 827 786 26 01991 10-Month Average ..... 168 123 - - 48 4 26 26 823 774 32 0
i i ., i
a Inch.ides petroleum imported into the United States indirectly from Notes'. • Beginning in October 1977, Strategic Petroleum Reserve lmportsmembers of the Organization oi Pelroleum Exporting Countries (OPEC), are included. • Geographic coverage is the 50 Slates and Ihe Distdcl olprimarily from Caribbean and West European areas, as petroleum producls Columbia.
th_ we{e relined Irom crude oil produced by OPEC. Sources: • 1(73-1060: Energy Inlormalion Adminislralion (EIA),Through 1992, Ecuador was a member ol OPEC. See Table 3.3c. Petroleum Supply Monthly, February 1993, Table $3. • 1981 forward: EIA,
- =Nol applicab4e. (s)=Less than 500 barrels per day. Petroleum Supply Monthly, December 1993, Table S3.
Energy Information Administration/Monthly Energy Review December 1993 55 i
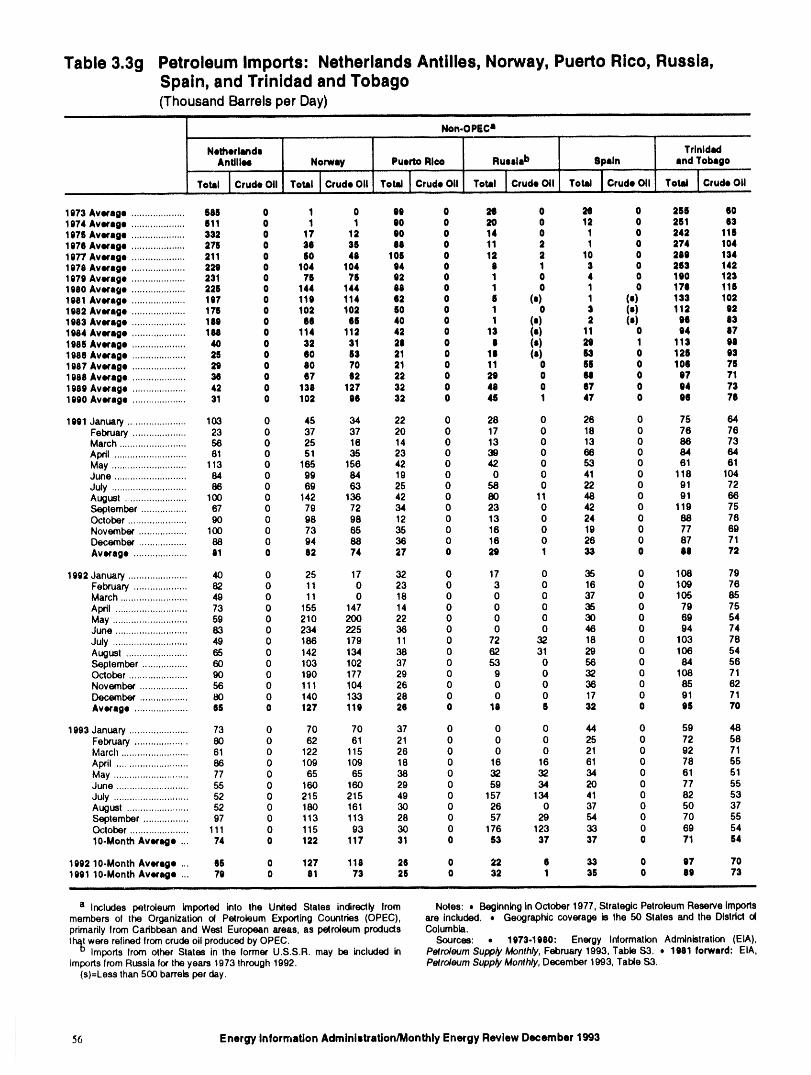
Table 3.3g Petroleum Imports: Netherlands Antilles, Norway, Puerto Rico, Russia,Spain, and Trinidad and Tobago(Thousand Barrels per Day)
i i i ill
Non.OPEC a
Netherlands TrinidadAnUlle4 Norway Puerto Rico Russla b 8pale end Tobago
...........1 i i .........,°,.,ICrod.O,T°=iCro'.O"'o=l°'u"O"'°= °r°,.O,T°=°ro,.O,T°'"°,.0,!1073 Average .................... 686 0 1 0 OO 0 29 0 26 0 266 601974 Average .................... 811 0 1 1 90 0 20 0 12 0 251 831976 Average .................... 332 0 17 12 80 0 14 0 1 0 242 1161970 Average .................... 276 0 88 36 88 0 11 2 I 0 274 1041977 Average .................... 211 0 60 48 106 0 12 2 10 0 288 1341079 Average .................... 229 0 104 104 94 0 e 1 3 0 283 1421079 Average .................... 231 0 76 76 92 0 1 0 4 0 190 1231980 Average .................... 226 0 144 144 88 0 1 0 1 0 178 1161981 Average .................... 197 0 118 114 62 0 8 (e) 1 (s) 133 1021982 Average .................... 176 0 102 102 60 0 1 0 3 (e) 112 921983 Average .................... 180 0 68 86 40 0 1 (e) 2 (s) 86 831684 Average .................... 168 0 114 112 42 0 13 (s) 11 0 94 071086 Average .................... 40 0 32 31 20 0 O (s) 26 1 113 881986 Average .................... 26 0 eo 63 21 0 18 (s) 63 o 126 931987 Average .................... 29 0 80 70 21 0 11 0 66 0 108 761989 Average .................... 34 0 87 62 22 0 29 0 68 0 07 711989 Average .................... 42 0 138 127 32 0 48 0 87 0 04 731990 Average .................... 31 0 102 96 32 0 48 1 47 0 96 76
1991 January ...................... 103 0 45 34 22 0 28 0 26 0 75 64February .................... 23 0 37 37 20 0 17 0 18 0 76 78March ......................... 56 0 25 16 14 0 13 0 13 0 86 73April ........................... 81 0 51 35 23 0 39 0 68 0 64 64May ............................ 113 0 165 156 42 0 42 0 53 0 61 61June ........................... 84 0 99 64 19 0 0 0 41 0 118 104July ............................ 86 0 69 63 25 0 58 0 22 0 91 72August ....................... 100 0 142 136 42 0 80 11 48 0 91 66September ................. 87 0 79 72 34 0 23 0 42 0 119 75October ...................... 90 0 98 98 12 0 13 0 24 0 88 76November .................. 100 0 73 65 35 0 16 0 19 0 77 89December .................. 88 0 94 88 36 0 18 0 26 0 87 71Average .................... 91 0 82 74 27 0 29 1 33 0 88 72
1992 January ...................... 40 0 25 17 32 0 17 0 35 0 108 79February .................... 82 0 11 0 23 0 3 0 16 0 109 78March ......................... 49 0 11 0 18 0 0 0 37 0 105 85April ........................... 73 0 155 147 14 0 0 0 35 0 79 75May ............................ 59 0 210 200 22 0 0 0 30 0 69 54June ........................... 83 0 234 225 36 0 0 0 46 0 94 74July ............................ 49 0 186 179 11 0 72 32 18 0 103 78August ....................... 65 0 142 134 38 0 62 31 29 0 106 54September ................. 60 0 103 102 37 0 53 0 56 0 84 56October ...................... 90 0 190 177 29 0 9 0 32 0 108 71November .................. 56 0 111 104 26 0 0 0 36 0 85 62December .................. 80 0 140 133 28 0 0 0 17 0 91 71Average .................... 86 0 127 119 26 0 18 6 32 0 96 70
1993 January ...................... 73 0 70 70 37 0 0 0 44 0 59 48February .................... 80 0 62 61 21 0 0 0 25 0 72 58March ......................... 61 0 122 115 26 0 0 0 21 0 92 71April .......................... 86 0 109 109 18 0 16 16 61 0 78 55May ............................ 77 0 65 65 38 0 32 32 34 0 61 51June ........................... 55 0 160 160 29 0 59 34 20 0 77 55July ............................ 52 0 215 215 49 0 157 134 41 0 82 53August ....................... 52 0 180 161 30 0 26 0 37 0 50 37September ................. 97 0 113 113 28 0 57 29 54 0 70 55October ...................... 111 0 115 93 30 0 176 123 33 0 69 5410-Month Average ... 74 0 122 117 31 0 63 37 37 0 71 64
1992 10-Month Average .,. 66 0 127 118 26 0 22 6 33 0 97 701991 10-Month Average ... 79 0 81 73 26 0 32 1 36 0 89 73
i
a Includes petro4eum imported into the United States indirectly from Notes: , BeginninginOctober 1977, Strategic Petroleum Reserve Importsmembers el the Organization ot Petroleum Exp<xting Countries (OPEC), are included. • Geographic coverage is the 50 Slates and the Distdct dprimarilyfrom Caribbean and West European areas, as I:_roleum products Columbia.
tl_ were relined fromcrudeoil producedbyOPEC. Sources: • 1973-1980: Energy Information Administration (EIA),Imports from other States in the former U.S.S.R. may be included in Petroleum Supply Monthly, February 1993, Table $3, • 1981 forward: EIA,
imports fromRussia for the years 1973 through 1992. Petroleum Supply Monthly, December 1993, Table $3.(s)=Less than 500 barrelsper day.
:;6 Energy Information Administration/Monthly Energy Review December 1993
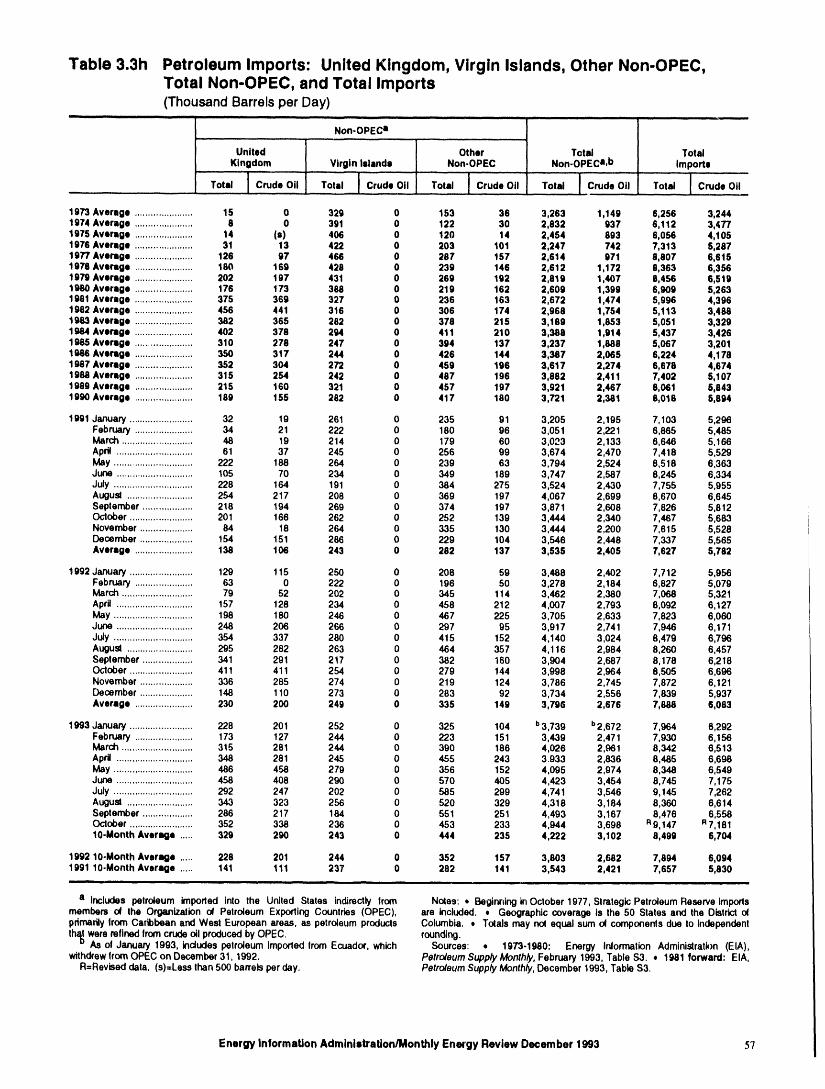
Table 3.3h Petroleum Imports: United Kingdom, Virgin Islands, Other Non-OPEC,Total Non-OPEC, and Total Imports(Thousand Barrels per Day)
-- i iii ii .................. j ,,
Non-OPEC a........ ,.....
United Other Total TotalKingdom Virgin Islands Non-OPEC Non-OPECa,b Imports
,, , ,,, ....................
......,o,.,! ,ot.,Ic.u0.o,,,o,.,lcr--o,,,o,.,lc.o0.o, ,o,.,lc 0.o,,1973 Average ...................... 15 0 329 0 153 36 3,263 1,149 6 256 3,2441974 Average ...................... 8 0 391 0 122 30 2,832 937 6 112 3,4771975 Average ...................... 14 (s) 406 0 120 14 2,454 893 6 056 4,1051976 Average ...................... 31 13 422 0 203 101 2,247 742 7 313 5,2871977 Average ...................... 126 97 466 0 287 157 2,614 971 8 807 6,6151978 Average ...................... 180 169 428 0 239 146 2,612 1,172 8 363 6,3561979 Average ...................... 202 197 431 0 269 192 2,819 1,407 8 456 6,5191980 Average ...................... 176 173 388 0 219 162 2,609 1,399 6 909 5,2631981 Average ...................... 375 369 327 0 236 163 2,672 1,474 5 996 4,3961982 Average ...................... 456 441 316 0 306 174 2,968 1,754 5 113 3,4881983 Average ...................... 382 365 282 0 378 215 3,189 1,853 5 051 3,3291984 Average ...................... 402 378 294 0 411 210 3,386 1,914 5 437 3,4261985 Average ...................... 310 278 247 0 394 137 3,237 1,888 5,067 3,2011986 Average ...................... 350 317 244 0 426 144 3,387 2,065 6,224 4,1781987 Average ...................... 352 304 272 0 459 196 3,617 2,274 6,678 4,6741988 Average ...................... 315 254 242 0 487 196 3,882 2,411 7,402 5,1071989 Average ...................... 215 160 321 0 457 197 3,921 2,467 8,061 5,8431990 Average ...................... 189 155 282 0 417 180 3,721 2,381 8,018 5,894
1991 January ........................ 32 19 261 0 235 91 3,205 2,195 7,103 5,298February ...................... 34 21 222 0 180 96 3,051 2,221 6,865 5,485March ........................... 48 19 214 0 179 60 3,023 2,133 6,646 5,166April ............................. 61 37 245 0 256 99 3,674 2,470 7,418 5,529May .............................. 222 188 264 0 239 63 3,794 2,524 8,518 6,363June ............................. 105 70 234 0 349 189 3,747 2,587 8,245 6,334July .............................. 228 164 191 0 384 275 3,524 2,430 7,755 5,955August ......................... 254 217 208 0 369 197 4,067 2,699 8,670 6,645September ................... 218 194 269 0 374 197 3,871 2,608 7,826 5,812October ........................ 201 166 262 0 252 139 3,444 2,340 7,467 5,683November .................... 84 18 264 0 335 130 3,444 2,200 7,615 5,528December .................... 154 151 286 0 229 104 3,546 2,448 7,337 5,565Average ...................... 138 106 243 0 282 137 3,535 2,405 7,627 5,762
1992 January ........................ 129 115 250 0 208 59 3,488 2,402 7,712 5,956February ...................... 63 0 222 0 196 50 3,278 2,184 6,827 5,079March ........................... 79 52 202 0 345 114 3,462 2,380 7,068 5,321April ............................. 157 128 234 0 458 212 4,007 2,793 8,092 6,127May .............................. 198 180 246 0 467 225 3,705 2,633 7,823 6,060June ............................. 248 206 266 0 297 95 3,917 2,741 7,946 6,171July .............................. 354 337 280 0 415 152 4,140 3,024 8,479 6,796August ......................... 295 282 263 0 464 357 4,116 2,984 8,260 6,457September ................... 341 291 217 0 382 160 3,904 2,687 8,178 6,218October ........................ 411 411 254 0 279 144 3,998 2,964 8,505 6,696November .................... 336 285 274 0 219 124 3,786 2,745 7,872 6,121December .................... 148 110 273 0 283 92 3,734 2,556 7,839 5,937Average ...................... 230 200 249 0 335 149 3,796 2,676 7,888 6,083
1993 January ........................ 228 201 252 0 325 104 b3,739 b2,672 7,964 6,292February ...................... 173 127 244 0 223 151 3,439 2,471 7,930 6,156March ........................... 315 281 244 0 390 186 4,026 2,961 8,342 6,513April ............................. 348 281 245 0 455 243 3.933 2,836 8,465 6,698May .............................. 486 458 279 0 356 152 4,095 2,974 8,348 6,549June ............................. 458 408 290 0 570 405 4,423 3,454 8,745 7,175July .............................. 292 247 202 0 585 299 4,741 3,546 9,145 7,262August ......................... 343 323 256 0 520 329 4,318 3,184 8,360 6,614September ................... 286 217 184 0 551 251 4,493 3,167 8,476 6,558October ........................ 352 338 236 0 453 233 4,944 3,698 R9,147 R7,18110-Month Average ..... 329 290 243 0 444 235 4,222 3,102 8,499 6,704
1992 10-Month Average ..... 228 201 244 0 352 157 3,803 2,682 7,894 6,0941991 10-Month Average ..... 141 111 237 0 282 141 3,543 2,421 7,657 5,830i ,..i =,i i ,| ,,i i i i i i
a Includes petroleum imporled into the United States indirectly from Notes:., E_ginrllngin October 1977, StrategicPetroleum Reserve importsmembers od the Organizallon o4 Petroleum Exporting Countries (OPEC), are included.. Geographic coverage is the 50 States and the Districto(primarilyfrom Cawibbeanand West European areas, as petroleumproducts Columbia.. Totals may not equal sum ol componentsdue to independent
th_ were refinedfromcrudeoilproducedby OPEC. rounding.As of January 1993, includes petroleum imported from Ecuador, which Sources: -- 1973-1980: Energy Inlormalion Administratk)n (EIA),
withdrewfrom OPEC on December 31, 1992, Petroleum Supply Monthly, February 1993, Table $3. • 1981 forward: EIA,R=Revised data. (s)=Lass than 500 barrelsper day. Petroleum Supply Monthly, December 1993, Table $3.
Energy Information Administratlon/Monthly Energy Review December 1993 57
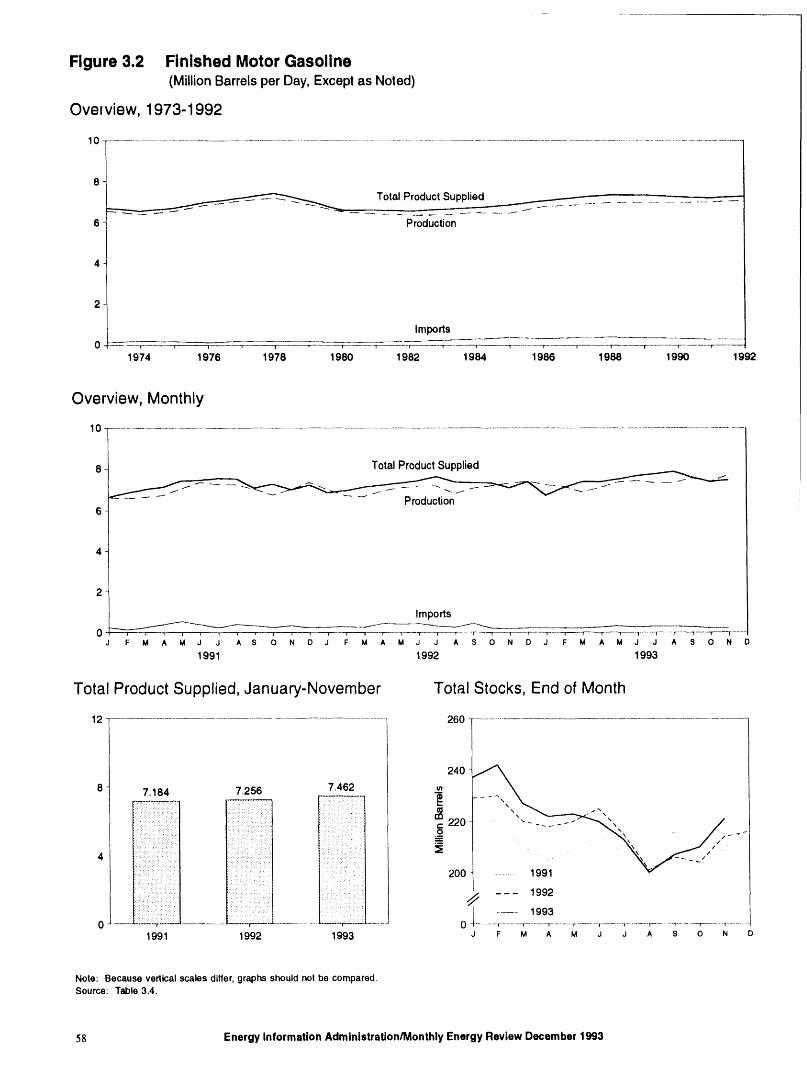
6
_......__ Total ProductSupplied6 Production
2
Imports0 T r T.... I T r T----'-T 'T--_ I T......... T T r T r 1
1974 1976 1978 1980 1982 1984 1986 1988 1990 1992
Overview, Monthly
10
8 TotalProductSuppliedi!
6
2
Impods
J F M A M J J A S 0 N D J F M A M J J A S 0 N D J F M A M J J A S 0 N D
1991 1992 1993
Total Product Supplied, January-November Total Stocks, End of Month
12 ............................ 260
240
8 7.184 7.256 7.462
:::, :.:. :: ,. "r:. ::: :::: : .. t J
4
:i if :: i 200 ............1991"" ' ' ' 1
1991 1992 1993 J F M A M J J A S 0 N D
Note: Becauseverticalscalesdiffer,graphsshouldnotbe compared,Source:Table3,4.
58 Energy Information Administration/Monthly Energy Review December 1993
Table 3.4 Finished Motor Gasoline Supply and Disposition,i ill i1,1iiii ii i ii ii iii .......................
Supply Disposition Motor Gasoline.... Ending Stockea Oxygenates
Total Stock Product - '1 ' ' Ending
Production Importeb Changeb,c Exports Supplied .. T0tald...... l Finished StockJ I
ThousandBarrelsper Day MiNionBarrels...........
1973 Average ........................ 8,535 134 -9 4 6,874 209 NA NA1974 Average ........................ 8,360 204 24 2 6,637 6216 NA NA1975 Average ........................ 6,520 184 628 2 6,675 235 NA NA1976 Averqe ........................ 6,841 131 -I0 3 6,978 231 NA NA1977 Average ........................ 7,033 217 72 2 7,177 258 NA NA1978 Average ........................ 7,169 190 -54 I 7,412 238 NA NA1979 Average ........................ u,_52 181 -2 (s) 7,034 237 NA NA1980 Average ........................ 6,508 140 66 I 6,579 6261 NA NA1961 Averagef 8,405 157 e-28 2 6,588 263 203 NA1982 Average ........................ 6,338 197 -25 20 6,539 6238 6194 NA1983 Average ........................ 6,340 247 645 10 6,622 222 186 NA1984 Average ........................ 6,453 299 54 6 6,693 243 205 NA1985 Average ........................ 6,419 381 -41 10 6,831 223 190 NA1986 Average ........................ 6,752 326 11 33 7,034 233 194 NA1987 Average ........................ 6,841 384 -15 35 7,206 226 189 NA1988 Average ........................ 6,956 405 3 22 7,336 228 190 NA1989 Average ........................ 6,963 369 -35 39 7,328 213 177 NA1990 Average ........................ 6,959 342 10 55 7,235 220 181 NA
1991 January .......................... 6,629 228 162 50 6,645 225 186 NAFebruary ........................ 6,573 115 -252 102 6,838 219 179 NAMarch ............................. 6,643 235 .236 97 7,017 210 171 NAApril ............................... 6,742 381 -67 53 7,137 205 169 NAMay ................................ 7,063 528 95 59 7,437 209 172 NAJune ............................... 7,351 364 160 99 7,456 214 177 NAJuly ................................ 7,274 232 -177 122 7,561 208 172 NAAugusl ........................... 7,247 385 7 96 7,528 209 172 NASeptember ..................... 7,030 312 195 83 7,083 216 178 NAOctober .......................... 6,749 236 -354 58 7,281 203 167 NANovember ...................... 7,018 322 228 104 7,008 209 173 NADecember ...................... 7,354 216 267 79 7,224 219 182 NAAverage ........................ 6,975 297 3 82 7,188 219 182 NA
1992 January .......................... 7,013 246 304 87 6,869 229 191 NAFebruary ........................ 6,726 275 -22 59 6,963 230 191 NAMarch ............................. 6,683 247 -278 71 7,137 220 162 NAApril ............................... 6,954 428 54 90 7,238 218 183 NAMay ................................ 7,092 392 74 82 7,328 220 186 NAJune ............................... 7,198 424 76 86 7,460 225 188 NAJuly ................................ 7,195 303 -249 108 7,639 215 160 I_IAAugust ........................... 6,617 240 -446 123 7,380 201 167 NASeptember ..................... 7,071 418 60 85 7,344 206 168 NAOctober .......................... 7,198 193 -41 94 7,338 204 167 NANovember ...................... 7,323 170 318 74 7,102 214 177 NADecember ...................... 7,411 202 32 184 7,396 216 178 NAAverage ........................ 7,058 294 -11 98 7,268 216 178 NA
1993 January .......................... 97,254 204 571 142 96,746 237 195 h14February ........................ 7,172 216 160 99 7,129 242 200 13March ............................. 6,897 198 -411 109 7,397 227 187 14April ............................... 7,123 253 -137 111 7,401 222 183 15May ................................ 7,394 308 80 90 7,531 223 185 17June ............................... 7,447 251 .75 81 7,602 220 183 18July ................................ 7,344 292 -242 100 7,777 213 176 20August ........................... 7,344 283 -336 77 7,885 200 165 21September ..................... 7,583 269 154 85 7,612 207 170 20October .......................... R7,409 R210 R127 R80 R7,411 R210 R174 17November ...................... E7,718 E204 E370 E71 E7,481 E221 E182 NA1l-Month Average ....... E7,335 E244 S22 E95 E7,462 S221 S182 NA
1992 11-Month Average ....... 7,025 303 -15 87 7,256 214 177 NA1991 11-Month Average ....... 6,940 305 -22 82 7,184 209 173 NA
i i ii ,i i iiii . ii i ,i ii
a Stocksare totalsas ofend o! period, imbalanceof motor gasoline blendingcomponerds. See Note 2 at end otb From 1981 forward,blending componentsare excluded, section.c A negative number indicatesa decrease instocks and a positivenumber h See Note 1 at end of seclion.
indicatesan increase. R=Revised data. NA=Nol available. E=Esttmate. (s)=Leu than 500d Includesmotorgasoline blending components, bul excludesoxygenates, barrelsper day.
which are reportedseparately. Note: Geographiccoverage is the 50 States and the Distflct of Columbia.• See Note 4 al end of section. Sources: , 1973-1980: Energy Information Administration (ETA),f See Note 2 at end of section. Petroleum Supply Monthly, February 1993, Table $4. , 1981 forward: EIA,
g Beginning in 1993, motor gasoline production and product supplied Petroleum Supply Monthly, December 1993, Table $4.include blending of fuel ethanol and an adjustment to correct Ior the
Energy InformaUon Admlnletratlon/Monthly Energy Review December 1993 59
Rgure 3.3 Dlstlllate Fuel(Million Barrels per Day, Except as Noted)
Overview, 1973-1992
4
3 _"'--._.....,_f.. t- " _"_,.._____...._ProductSupplied ......
Production2
.......... Impods ................................0 ' v ..... d - v '"f 1_ r • 1 i r------" r , v v
19, 1Q78 1978 98o 19;2 :98, 19o 19 =
Overview,Monthly
4
ProductSupplied _ . -
Production
2
,t Imports• . .. , .... ....... . . • . ....... .... . • .... . . .. ......................... ... ......
0 " i '-T---"--T"--"'-f--'--'-'T----"-T"_"----T _" v ..... _ _" !
1991 1992 1993
Product Supplied, January-November Stocks, End of Month
4 150 T
140
. .. /////3 2.905 2.948 3.01
...................................ii!i!!ii!::!i! .........................: 130 _ S""--
:::::::::::::::::::::::::::::::: ..... ::::::::::::::::::::::: ::. .,, /
,.:..:.,:.:.:. :,:, .., ///:::;;;:,::;::;:::';::.;:;:';;::;: .............
i!!!iiiii:i!i!iiii!!i;!i_!i!_: _i_i ii_i_!:!i!_
:::::::::::::::::::::::::::::::: ":':: :: : 1:,:,::::'::::: 1 O0::: :::::::-::::::,: :::::;::::. • .. v.,,.,,. ,.
::::::::::'.................... : .........."..........:" . 1992
!::ii!::ii::i[ii:::::i:i!ilili
Table 3.5 Distillate Fuel Oil Supply and Dispositioni iiiiiiiiiiii i i i i ii i iiii ................................ ii
Supply Disposition Ending Sto©ksI....... , .... ,, ,
Sulfur Content
Crude Oil [
Total Uaed Stock Product 0.05 Percent Greater Than
....Produ(:tion .....Imports Oi.r.._tlyb Change c Exports Supplied b Total or Lna d 0.05 Peroentd, , ,,
Thousand Barrels per Day MiNionBarrels......, ......................
1973 Average .................... 2,822 392 2 115 9 3,092 196 NA NA1974 Average .................... 2,669 289 2 e 10 2 2,948 f 200 NA NA1975 Average .................... 2,654 155 2 e,t-41 1 2,851 209 NA NA1978 Average .................... 2,924 146 1 -62 1 3,133 186 NA NA1977 Average .................... 3,278 250 1 176 1 3,352 250 NA NA1978 Average .................... 3,167 173 1 -93 3 3,432 216 NA NA1979 Average .................... 3,153 193 1 34 3 3,311 229 NA NA1980 Average .................... 2,662 142 1 -64 3 2,866 f 205 NA NA1981 Averageg ................... 2,613 173 10 f-38 5 2,829 192 NA NA1982 Average .................... 2,606 93 10 -35 74 2,671 f 179 NA NA1983 Average .................... 2,456 174 - f-124 64 2,890 140 NA NA1984 Average .................... 2,681 272 - 57 51 2,845 161 NA NA1985 Avorage .................... 2,687 200 - -48 67 2,868 144 NA NA1986 Average .................... 2,798 247 - 31 100 2,914 155 NA NA1987 Average .................... 2,731 255 - -56 66 2,976 134 NA NA1988 Average .................... 2,859 302 - -30 69 3,122 124 NA NA1989 Average .................... 2,899 306 - -49 97 3,157 10(; NA NA1990 Average .................... 2,925 278 - 73 109 3,021 132 NA NA
1991 January ...................... 2,845 192 - .662 332 3,367 112 NA NAFebruary .................... 2,870 139 - -359 393 2,976 102 NA NAMarch ......................... 2,865 206 - -112 198 2,984 98 NA NAApril ........................... 2,819 258 - 156 81 2,839 103 NA NAMay ............................ 2,929 186 - 132 218 2,765 107 NA NAJune ........................... 2,941 209 - 225 150 2,775 114 NA NAJuly ............................ 2,998 155 - 356 149 2,648 125 NA NAAugust ....................... 2,961 168 - 214 144 2,770 131 NA NASeptember ................. 3,055 237 - 291 136 2,865 140 NA NAOctober ...................... 3,040 207 - -59 259 3,047 138 NA NANovember .................. 3,103 249 - 206 224 2,921 144 NA NADecember .................. 3,107 252 - -30 302 3,087 144 NA NAAverage .................... 2,962 205 - 31 215 2,921 144 NA NA
1992 January ...................... 2,818 232 - -541 360 3,231 127 NA NAFeb,'uary .................... 2,661 217 - .619 278 3,219 109 NA NAMarch ......................... 2,749 238 - -358 138 3,207 98 NA NAApril ........................... 2,930 202 - -185 278 3,039 92 NA NAMay ............................ 2,933 179 - 139 222 2,753 96 NA NAJune ........................... 2,995 157 - 268 205 2,679 104 NA NAJuly ............................ 3,067 172 - 328 201 2,710 115 NA NAAugust ....................... 2,865 229 - 262 127 2,705 123 NA NASeptember ................. 2,983 237 - 168 145 2,908 128 NA NAOctober ...................... 3,251 263 - 290 169 3,056 137 NA NANovember .................. 3,240 236 - 316 230 2,929 146 NA NADecember .................. 3,179 229 - -163 276 3,316 141 NA NAAverage .................... 2,974 216 - -6 219 2,979 141 NA NA
1993 January ...................... 2,909 182 - -336 287 3,141 130 922 9108February .................... 2,813 224 - -742 301 3,478 109 16 94March. ........................ 2,918 235 - -386 154 3,386 97 12 85April ........................... 3,010 209 - 30 241 2,949 98 13 86May ............................ 2,930 153 - 104 355 2,624 102 14 87June ........................... 3,095 156 - 263 158 2,843 109 17 92July ............................ 3,185 130 - 348 298 2,669 120 23 97August ....................... 3,084 159 - 249 197 2,797 128 45 83September ................. 3,206 137 - 80 262 3,001 130 47 84October ...................... n3,435 R242 _ R467 R241 R2,968 n 145 55 RgONovember .................. E3,482 Z 197 _ E216 E162 E3,301 E 145 E60 lZ8511-Month Average .,. E3,099 E185 - E32 E241 S3,010 E145 NA NA
1992 11-Month Average ... 2,955 215 - 8 213 2,948 146 NA NA1991 11-Month Average ... 2,948 201 - 37 207 2,905 144 NA NA
i ii HI ii
a Stocks aretotals as of end o( period, g See Note 3 at end o( section.b Beginningin January 1963, crudeoil used directlyas distillatefuel oil is R=Reviseddata. NA=Not available. - =No( applicable. E=Estimate.
reporled as crudeoil productsupplied on Table 3.2b rather than as distillate Notes: • Geographic coverage is the 50 States and the Disldct otfueloll productsupplied. Columbia. o Totals may not equal sum of componentsdue to Independent
c A negativenumberindicates a decrease instocks and a positivenumber rounding.indicatesan increase. Sources: • 1973-1980: Energy Information Administration (EIA),
d By weighL Petroleum Supply Monthly, February 1993, Table $5. • 1981 forward: EIA,• See Note 6 atend ol section. Petroleum Supply Monthly, December 1993, Table $5.f See Note 4 at end of section.
Energy Information Administration/Monthly Energy Review Deoember 1993 61
Figure 3.4 Residual Fuel(Million Barrels per Day, Exceptas Noted)
Overview, 1973-1992
3.2
2.4 upplied
. 7/'-.--..... .....1.6 .. "----_.
[ _'- . .... _
f -'" "" --.--.. Production _ _.
0.8 Imports..... • . , .................... •. . ... •
0.0 _r T r _ r T T T T * , T r 1" T r , , --
1974 1976 1978 1980 1982 1984 1986 1988 19_) 1992
Overview, Monthly
3.2
2,4
1.6 -1
0.8 1 _ _ Production _ _ I _ _ -• . . .
• ...... .• . ........... . • . .... ......
0,0 .... _ r T T T-'---_---r-----r-----r_--_ "r-- _ r --'r-----"F_" , T f v -- T 1 v
J F M A M J J A S 0 N D J F M A M J J A S 0 N D J F M A M J J A S 0 N D
1991 1992 1993
Product Supplied, January-November Stocks, End of Month
1.8 55
1.5 50 t ......
1.2 1144 1.074 1.024 I_ "" _".
0.9 i ,_.__40 ..
_ _-ii:_,_::_!I .---
0.8 _:,_..............., aso,_ ............._9919_1
0.3 - : -.: :::: :: :;:::! 30 - - - 1992
i .........'. !;_? -- 19
1991 1992 1993 J F M A M J J A S 0 N O
Note: Because vertical scales differ, graphs should not be compared.Source: Table 3.6.
62 Energy Information Administration/Monthly Energy Review December 1993
Table 3.6 Residual Fuel Oil Supply and Disposition
Supply Disposition
Crude OilTotal Used Stock Product Ending
Production Imports Directlya Changeb Exports SuppUeda Stocks c
ThousandBarrelsper Day MillionBarrels......
1973 Avb,"age ...................... 971 1,853 17 -5 23 2,822 531974 Average ...................... 1,070 1,587 13 17 14 2,639 d 601975 Average ...................... 1,235 1,223 15 d-2 15 2,462 741976 Average ...................... 1,377 1,413 17 -5 12 2,601 721977 Average ...................... 1,754 1,359 13 48 6 3,071 901978 Average ...................... 1,667 1,355 13 1 13 3,023 901979 Average ...................... 1,687 1,151 12 15 9 2,826 961980 Average ...................... 1,580 939 12 -10 33 2,508 d 921981 Average• ..................... 1,321 800 46 d -37 118 2,088 781982 Average ...................... 1,070 776 46 -32 209 1,716 d661983 Average ...................... 652 699 - d -55 185 1,421 491984 Average ...................... 891 681 - 12 190 1,369 531985 Average ...................... 882 510 - -7 197 1,202 501986 Average ...................... 889 669 - -8 147 1,418 471987 Average ...................... 885 565 - (s) 186 1,264 471988 Average ...................... 926 644 - -8 200 1,376 451989 Average ...................... 954 629 - -2 215 1,370 441990 Average ...................... 950 504 - 13 211 1,229 49
1991 January ........................ 1,001 425 - -19 320 1,124 48February ...................... 1,050 384 - -76 299 1,211 46March ........................... 995 332 - -85 178 1,234 43April ............................. 916 416 - 68 145 1,119 45May .............................. 929 425 - 50 300 1,003 47June ............................. 933 _12 - -103 245 1,303 44July .............................. 871 420 - -1 176 1,117 44August ......................... 925 599 - 68 216 1,240 46September ................... 838 481 - 78 168 1,074 48October ........................ 814 438 - 6 217 1,029 48November .................... 896 455 - 24 189 1,139 49December .................... 1,051 547 - 28 264 1,307 50Average ...................... 934 453 - 4 226 1,158 50
1992 January ........................ 965 364 - -144 184 1,289 45February ...................... 957 498 - -55 176 1,334 44March ........................... 990 397 - -77 310 1,154 41April ............................. 900 342 - -78 265 1,055 39May .............................. 964 328 - 67 207 1,019 41June ............................. 894 334 - -11 230 1,009 41July .............................. 838 280 - -37 169 986 40August ......................... 815 347 - 125 96 941 44September ................... 810 349 - 123 149 887 47October ........................ 818 376 - -72 156 1,110 45November .................... 895 411 - 49 216 1,041 47December .................... 862 481 - -127 158 1,312 43Average ...................... 892 375 - -20 193 1,094 43
1993 January ........................ 820 383 - 49 133 1,020 44February ...................... 841 325 - -75 113 1,128 42March ........................... 819 352 - -46 152 1,065 41April ............................. 887 3'/'7 - 24 169 1,070 41May .............................. 896 308 - 53 137 1,014 43June ............................. 797 299 - 92 147 857 46July .............................. 760 337 - -101 122 1,075 43August ......................... 745 370 - 61 120 935 45September ................... 822 420 - -73 110 1,205 42October ........................ R839 R391 _ R141 R94 R995 R47November .................... E818 E316 - E49 E175 E910 E4611-Month Average ..... E822 E353 - E16 E134 E1,024 E46
1992 11-Month Average ..... 895 365 - -10 196 1,074 471991 11-Month Average ..... 924 444 - 1 223 1,144 49
a BeginninginJanuary 1983, crudeoil used directlyas residual fueloil is • See Note3 at end of section.reportedas crudeoil productsuppliedon Table 3.2b rather than as residual R=Revised data. - =Not applicable. E=Estimate. (s)=Less than +500lueloilproduct supplied, barrelsper dayand greater than-500 barrelsper day.
toA negative numberindicatesa decrease instocks and a positivenumber Note: Geographiccoverageis the 50 Stales and the DtstdclofColumbia.indicatesanincrease. Sources: • 1973-1980: Energy Information Administration (EIA),
c Stocksare totalsas of end of period. Petroleum Supply Monthly, February 1993, Table $6. • 1981 forward: EIA,d See Note 4 at end ofsection. Petroleum Supply Monthly, December 1993, Table $6.
Energy Information Administration/Monthly Energy Review December 1993 63
Figure 3.5 Jet Fuel(Million Barrels per Day, Except as Noted)
Total Jet Fuel Overview, 1973-1992 Total Jet Fuel Overview, Monthly
2.0 2.0
ProductSupplied_
1.5 _ 1.51.0 1o0
Production
0.5 0.5
____ -- -- -- _ m, 4 _ ...... _ ..... ._.f,, Exports imports i-" , , , , ' , , , , , , , ,"" .. .............. _.::...._ .....O,O I ! ,,, ................. .............. '............ ' O,O .........
1974'1976 1978'1980 1982 1984 1986 1988 1990 1992 F.aMJ d,S O NOJF M AMJ JAB O NOJFMAMJJABONO
1991 1992 1993
Product Supplied by Type, 1973-1992 Product Supplied by Type, Monthly
2.0 2.0
1.5 _ 1.51.0 1.0 KeroseneTypet
KeroseneType
0.5 0.5
NaphthaType Naphtha Type............................................................................................ . . ., ...-..
0.0 ........... 0.0 _ ..................... "* , , ,19'74 1976 1978 1980 1982 19'84 19'86 1988 1990 1992 FM,MJJ,SONOJFM*MJJ,SONOJFM^MJJ^SONO
1991 1992 1993
Total Product Supplied,January-November Total Stocks,End of Month
2.0 60
1.47 1.445 1.4661.5
iiiiiii!i!iiiiiiiiii!iiiiiiiiii!!il _", ...,"'""'.. ............ -.
........................_:::::_:::_ i!!iiiiiiiiiiiiiiiiiiiiiiiiiiiiii!l" ",. ................................/---_i::::::::::::::::::::::::::::::::: ::::::::_::::::,::,,v.,...:,....!
::::::::::::::::::::::::::::::::: I
i;!ii;ili;i;i;i;!;iil;i;i;i;i;iii ii;iii_!!ii!ii!i!ili!iiiiiil :_ 40_i_i_i_i_i_i_i_i_i_i_i_i_i_!_i_.... iiiiii!iiii!iiiill ..............1991
i!iiii!ili!iiii!iiiil;iiii;:i:i:iil......... ;i!i;i!!;!il;!i!;;ii,.,.,..,..,................. [ 1993;!!ii;ii;;iiiii!iii!ii!iiiiiii!i: iiii!!i!iii!ii:F.'.'.'..,.! :S;:;:i:i:i:i:i:::........
0.0 ::...........:':;................................, '" ;:::;..........._......... 0 r I t '-'-I" v
1991 1992 1993 J F I_ ; I_ J J ; s 0 N D
Source:Table3.7.
64 Energy Information Administration/Monthly Energy Review December 1993
Table 3.7 Jet Fuel Supply and Dispositioni
Supply Dispoeitton
i, ! r --'s'--'Total I Keroiene Type Import= Changeb Exporte
ThousandBarrelsper Day MillionBarrels
1973 Average ...................... 859 679 212 8 4 1,059 842 29 231974 Average ...................... 836 641 163 2 3 993 771 c 29 c 241975 Average ...................... 871 691 133 c2 2 1,001 791 30 251976 Average ...................... 918 731 76 5 2 987 789 32 261977 Average ...................... 973 787 75 7 2 1,039 831 35 281978 Average ...................... 970 791 86 -2 1 1,057 858 34 281979 Average ...................... 1,012 835 78 13 1 1,076 876 39 331980 Average ...................... 999 811 80 10 1 1,068 851 c 42 ¢361981 Average ...................... 968 775 38 c -4 2 1,007 809 41 341982 Average ...................... 978 778 29 -12 6 1,013 804 c 37 c 311983 Average ...................... 1,022 817 29 c (e) 6 1,046 839 39 321984 Average ...................... 1,132 919 62 9 9 1,175 953 42 351985 Average ...................... 1,189 983 39 -4 13 1,218 1,005 40 341986 Average ...................... 1,293 1,097 57 25 18 1,307 1,105 54) 431987 Average ...................... 1,343 1,138 67 (s) 24 1,385 1,181 54) 421968 Average ...................... 1,370 1,164 90 -17 28 1,449 1,236 44 381989 Average ...................... 1,403 1,197 106 -8 27 1,489 1,284 41 341990 Average ...................... 1,488 1,311 108 31 43 1,522 1,340 52 46
1991 January ........................ 1,509 1,354 67 -55 73 1,559 1 378 50 44February ...................... 1,548 1,384 44 -108 159 1,541 1 360 47 41March ........................... 1,299 1,157 65 -99 40 1,423 1 270 44 38April ............................. 1,286 1,135 73 -8 38 1,329 1 173 44 38May .............................. 1,367 1,191 87 85 35 1,334 1 143 47 41June ............................. 1,473 1,300 64 58 13 1,465 1 280 48 43July .............................. 1,426 1,255 67 -47 31 1,509 1 343 47 41August ......................... 1,486 1,316 88 21 11 1,543 1 343 48 42September ................... 1,495 1,322 92 71 10 1,506 1 321 50 45October ........................ 1,415 1,253 59 -66 50 1,489 1 319 48 43November .................... 1,433 1,276 56 15 5 1,469 1 282 48 44December .................... 1,530 1,357 42 22 59 1,492 1 338 49 44Average ...................... 1,438 1,274 67 -9 43 1,471 1 296 49 44
1992 January ........................ 1,352 1 20(; 39 -127 44 1,473 1,314 45 40February ...................... 1,311 1 164 56 -73 42 1,398 1,250 43 38March ........................... 1,347 1 215 56 31 7 1,365 1,218 44 39Aprit ............................. 1,286 1 131 74 -68 18 1,409 1,262 42 37May .............................. 1,393 1 214 93 114 26 1,346 1,198 45 40June ............................. 1,374 1 234 86 -21 45 1,436 1,308 45 39July .............................. 1,473 1 328 81 59 62 1,433 1,280 46 42August ......................... 1,471 1 339 111 -32 28 1,585 1,438 45 41September ................... 1,448 1 296 93 78 20 1,442 1,313 48 43October ........................ 1,408 1 265 105 -12 44 1,480 1,315 47 43November .................... 1,456 1,319 90 -41 59 1,528 1,411 46 41December .................... 1,462 1,336 102 -101 112 1,553 1,410 43 39Average ...................... 1,399 1,254 82 -16 43 1,454 1,310 43 39
1993 January ........................ 1,437 1,306 89 .73 134 1,464 1,371 41 36February ...................... 1,442 1,318 110 46 17 1,488 1,346 42 38March ........................... 1,463 1,332 102 -29 101 1,493 1,371 41 37Aprit ............................. 1,390 1,262 88 -4 68 1,393 1,278 41 37May .............................. 1,426 1,300 75 37 60 1,404 1,289 42 38June ............................. 1,549 1,409 111 78 45 1,538 1,370 45 41July .............................. 1,485 1,359 94 41 73 1,465 1,337 46 42August ......................... 1,358 1,257 91 -91 34 1,506 1,405 43 39September ................... 1,339 1,242 97 -78 21 1,493 1,352 41 38October ........................ R1,330 R1,242 R127 R-24 R23 R1,457 R1,367 R40 R37November .................... _ 1,400 E1,332 Z85 _ 27 e 33 E1,426 E1,356 E41 E3911-Month Average ..... _ 1,420 E1,305 E_7 E-7 E58 e 1,466 e 1,349 e41 E39
1992 11-Month Average ..... 1,393 1,246 80 -8 36 1,445 1,301 46 411991 11-Month Average ..... 1,430 1,267 70 -12 42 1,470 1,292 48 44. ii i
a Stocksare totalsas of end of period, greater than -500 barrels per day.b A negative numberindicates a decrease in stocksanda positivenumber Note: Geographiccoverageis the 50 States and the Districtof Columbia.
indicatesan increase. Sources: = 1973-1980: Energy Information Adrrdnistmtlon(ETA),c See Nole 4 at end of section. Petroleum Supply Monthly, February 1993, Table $7. • 1981 forward: EIA,R=Revised data. E=Estimate. (s)=Less than +500 barrels per day and Petro/eum Supp_ Monthly, December 1993, Table $7.
Energy Information Administrati.-'._/Monthly Energy Review December 1993 65
Figure 3.6 Liquefied Petroleum Gases(Million Barrels per Day, Except as Noted)
Overview, 1973-1992
2,5
2,0 "
Production
1.5- _ _ / 1 -"_ -- -t " ProductSupplied
1.0-
0.5 RefineryInputs
--" ---------_"f Imports0.0 , ........ r-- , , , , , , , ,
1974 1976 1978 1980 1982 1984 1986 1988 1990 1992
Overview, Monthly
2.5
Production i2,0
,f \ / \ //
1,5 ._.. _. / -... / -- ---.../ \ ./'--ProductSupplied
1,0
0,5...... -................... ., Refinery Inputs, ......... •...... ....
............................... _mports ..........................................................
0.0J ; _ i ,_ J.... ,; k ; ; N ; _ ; ;; ;, ,_ J-J............ ;, ; o _ ; ,; ; _' ;, a J J ;, ; O N%
1991 1992 1993
Product Supplied, January-October Stocks, End of Month
3 175
150
2 ,,. -- - -...
1,651 1.678 1.659 _ 125 ,,/" ",ii!ii!iiiii!iiii!iii!!iiil: I "-=100 \_
1 iiii!;!iiii;?ii:?i:;i:ii!iilil;;i! _ //_ ...........1991 "
ii:i!=_;:=_i=_i_iiii:iii.-..,ii:iiiiii l t "
:.i::ili::'.iiii::i;iiiiii!!ii;ilgilit.:...,::;.:.:::::: 75 _ --- 1992:,:,:: ;,:+::,.,.,,.,......J
iiii!iiii!iil:i:.iiilii?:iii:l /I¢ 19930 :::::::::::::::::::::::::::::::: , , "-- 0 , , , , T _ r-----
1991 1992 1993 J F a A M J J A ; O N O
Note: Becauseverticalscalesdiffer,graphsshouldnotbe compared.Source:Table3,8.
66 Energy Information Administration/Monthly Energy Review December 1993
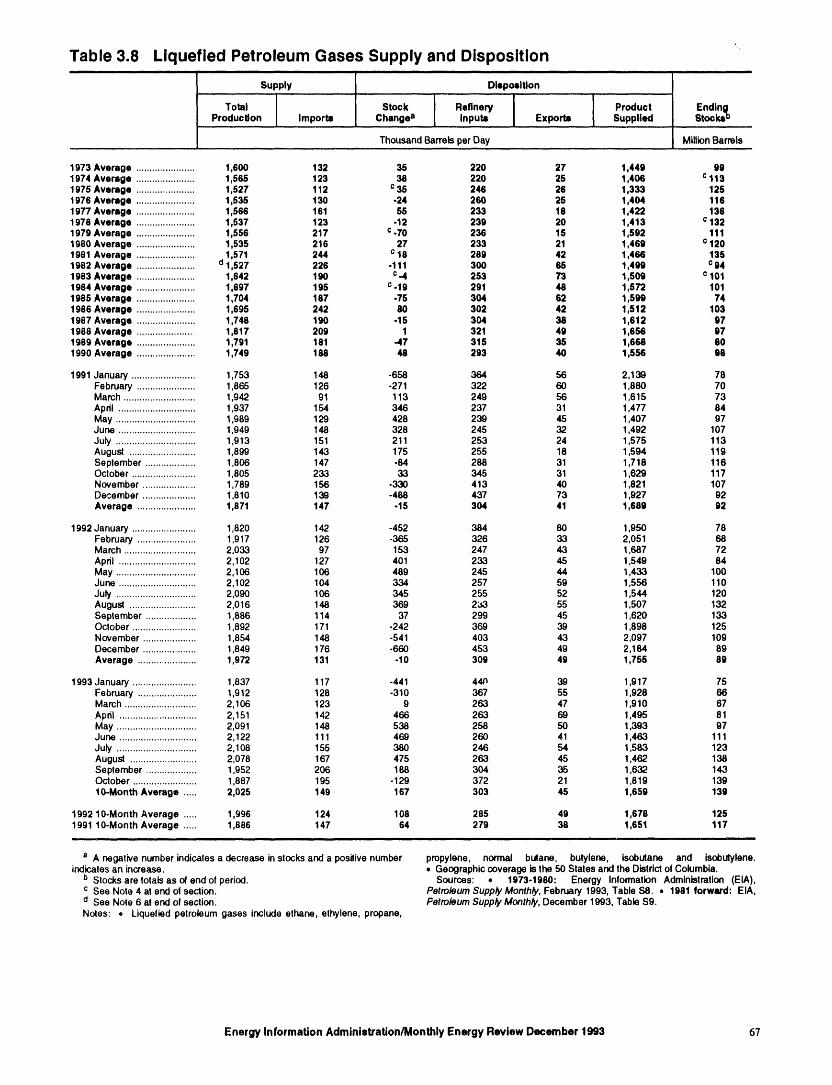
Table 3.8 Liquefied Petroleum Gases Supply and Disposition.......
Supply Disposition
........ ................
Total Stock Refinery Product EndingProduction Imports Changea Inputs Exports Supplied Stock@
ThousandBarrelsper Day MillionBarrels
1973 Average ...................... 1,600 132 35 220 27 1,449 981974 Average ...................... 1,565 123 38 220 25 1,406 c 1131975 Average ...................... 1,527 112 c35 246 26 1,333 1251976 Average ...................... 1,535 130 -24 260 25 1,404 1161977 Average ...................... 1,566 161 55 233 18 1,422 1361978 Average ...................... 1,537 123 -12 239 20 1,413 c 1321979 Average ...................... 1,556 217 c -70 236 15 1,592 1111980 Average ...................... 1,535 216 27 233 21 1,469 ¢ 1201981 Average ...................... 1,571 244 c 18 289 42 1,466 1351982 Average ...................... cl1,527 226 -111 300 65 1,499 c 941983 Average ...................... 1,642 190 c-4 253 73 1,509 c 1011984 Average ...................... 1,697 195 c-19 291 48 1,572 1011985 Average ...................... 1,704 187 -75 304 62 1,599 741986 Average ...................... 1,695 242 80 302 42 1,512 1031987 Average ...................... 1,748 190 -15 304 38 1,612 971988 Average ...................... 1,817 209 1 321 49 1,656 971989 Average ...................... 1,791 181 -47 315 35 1,668 801990 Average ...................... 1,749 188 48 293 40 1,556 98
1991 January ........................ 1,753 148 -658 364 56 2,139 78February ...................... 1,865 126 -271 322 60 1,880 70March ........................... 1,942 91 113 249 56 1,615 73April ............................. 1,937 154 346 237 31 1,477 84May .............................. 1,989 129 428 239 45 1,407 97June ............................. 1,949 148 328 245 32 1,492 107July .............................. 1,913 151 211 253 24 1,575 113August ......................... 1,899 143 175 255 18 1,594 119September ................... 1,806 147 -84 288 31 1,718 116October ........................ 1,805 233 33 345 31 1,629 117November .................... 1,789 156 -330 413 40 1,821 107December .................... 1,810 139 -488 437 73 1,927 92Average ...................... 1,871 147 -15 304 41 1,689 92
1992 January ........................ 1,820 142 -452 384 80 1,950 78February ...................... 1,917 126 -365 326 33 2,051 68March ........................... 2,033 97 153 247 43 1,687 72April ............................. 2,102 127 401 233 45 1,549 84May .............................. 2,106 106 489 245 44 1,433 100June ............................. 2,102 104 334 257 59 1,556 110July .............................. 2,090 106 345 255 52 1,544 120August ......................... 2,016 148 369 2;.t3 55 1,507 132September ................... 1,886 114 37 299 45 1,620 133October ........................ 1,892 171 -242 369 39 1,898 125November .................... 1,854 148 -541 403 43 2,097 109December .................... 1,849 176 -660 453 49 2,184 89Average ...................... 1,972 131 -10 309 49 1,756 89
1993 January ........................ 1,837 117 -441 4¢n 39 1,917 75February ...................... 1,912 128 -310 367 55 1,928 66March ........................... 2,106 123 9 263 47 1,910 67Apdl ............................. 2,151 142 466 263 69 1,495 81May .............................. 2,091 148 538 258 50 1,393 97June ............................. 2,122 111 469 260 41 1,463 111July .............................. 2,108 155 380 246 54 1,583 123August ......................... 2,078 167 475 263 45 1,462 138September ................... 1,952 206 188 304 35 1,632 143October ........................ 1,887 195 -129 372 21 1,819 13910-Month Average ..... 2,025 149 167 303 45 1,659 139
1992 10-Month Average ..... 1,996 124 108 285 49 1,678 1251991 10-Month Average ..... 1,886 147 64 279 38 1,651 117
a A negative number indicatesa decrease instocksand a positivenumber pmpylene, normal butane, butylene, Isobutane and Isobutylene.indicatesan increase. • Geographiccoverage is the 50 States and the Distdct of Columbia.
b Stocksare totalsas of endof period. Sources: • 1973-1980: Energy Information Administration (EIA),c See Note 4 at end o! section. Petro/eum Supply Monthly, February 1993, Table $8. • 1981 forward: EIA,¢1See Note 6 at end of section. Fetroleum Supply Monthly, December 1993, Table $9.Noles: • Liquelled petroleum gases include ethane, elhylene, propane,
Energy Information Administration/Monthly Energy Review December 1993 67
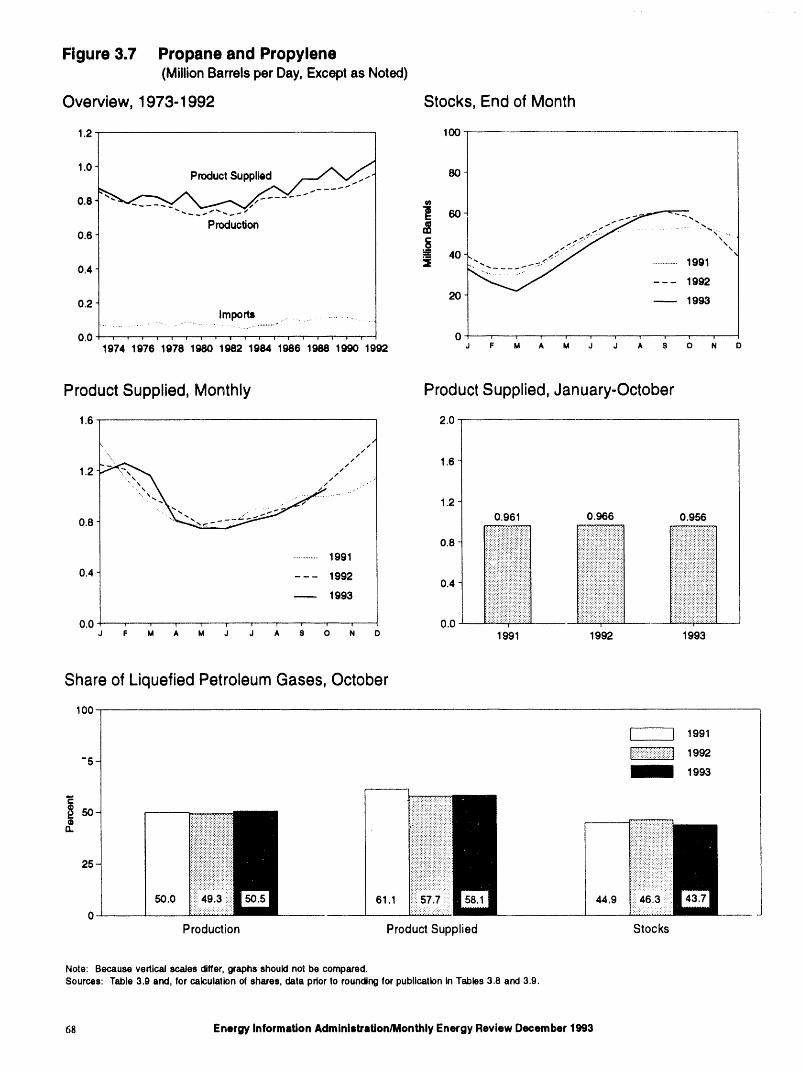
Figure 3.7 Propane and Propylene(MillionBarrelsperDay,ExceptasNoted)
Overview, 1973-1992 Stocks, End of Month
1.2 100
/
1.0 ProductSuppliedd_ _,- 80
0.6 "'- ;,,,....
0.6 8 ..40. ,'.."
0,4 _E _.._-_ ...............--- 1992
0.2 20 _ 1993Imports .........................
! I ! ! i _ i , 0 ' !
0.0 19'74'1976 19'78 1980 1982 19'84 1986 1988'1G190'1992 J F M A M J J A S 0 N D
Product Supplied, Monthly Product Supplied, January-October
1.6 2.0
/v/
",., /
•_". ,," 1.61.2 _-., ,,"
""_'i . . ................. "• "'- .." _, 1.2
0.8 ' .. ",, --'"-.-" 0.961 0.966 0.956
0.8...............1991
0.4 --- 1992 0.4-- 1993
0.0 , , , , , 0.0 .....J F M A M J J ,_ S 0 N D 1991 1992 1993
Share of Liquefied Petroleum Gases, October
100
Iill ' ] 1991
1992
"5 _ 1993
®13. .
25
50.0 !i!ii49 61.1
0
Production Product Supplied Stocks
Note: Becauseverticalscalesdiffer,graphsshouldnotbe compared.Sources:Table3,9 and,forcalculationofshares,datapriorto roundingforpublicationinTables3.8 and 3.9.
58 Energy Information Administration/Monthly Energy Review December 1993
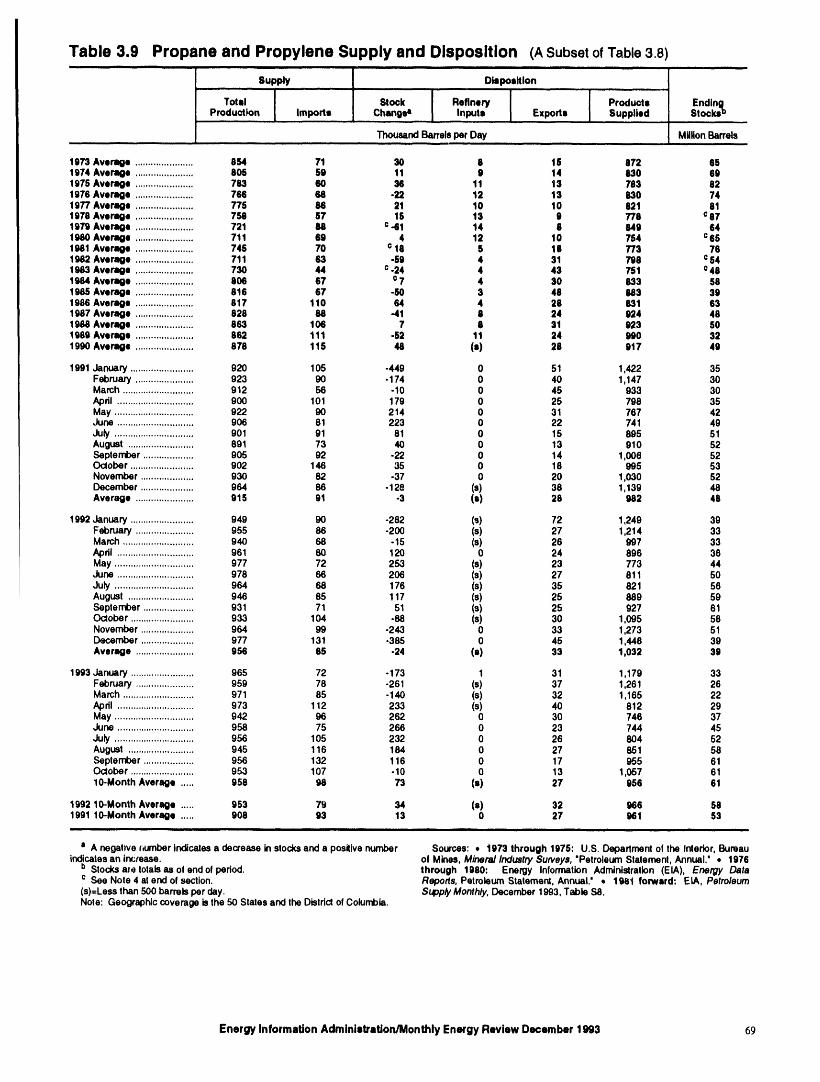
Table 3.9 Propane and Propylene Supply and Disposition (ASubset of Table 3.8, .....
Supply Disposition, ., ,..,,., i, , ,,.,,,, ,,
Total Stock Refinery Produote EndingProduction Imports Changea Inputs Exports Supplied Stock@
, ,,,,
Thousand Barrels per Day MYflonBarrels.....
1973 Average ...................... 854 71 30 Ii 15 B72 651974 Average ...................... 805 59 11 9 14 830 691975 Average ...................... 783 60 36 11 t3 783 821976 Average ...................... 766 68 -22 12 13 D30 741977 Average ...................... 775 86 21 10 19 821 811978 Average ...................... 758 §7 lli 13 9 778 o871979 Average ...................... 721 68 o -61 14 II 849 641980 Average ...................... 711 69 4 12 19 754 o661981 Average ...................... 746 70 o 18 § le 773 791982 Average ...................... 711 63 -59 4 31 798 ¢ 541983 Average ...................... 730 44 c -24 4 43 751 o481984 Averago ...................... 806 67 o7 4 30 833 581985 Average ...................... 816 67 -SO 3 48 883 391986 Average ...................... 817 110 64 4 28 831 631987 Average ...................... 828 88 -41 II 24 924 481988 Average ...................... 863 106 7 8 31 923 501989 AverlM_e ...................... 862 111 -52 11 24 990 321990 Average ...................... 878 115 48 (a) 28 9t 7 49
1991 January ........................ 920 105 -449 0 51 1,422 35February ...................... 923 90 -174 0 40 1,147 30March ........................... 912 56 -10 0 45 933 30April ............................. 900 101 179 0 25 798 35May .............................. 922 90 214 0 31 767 42June ............................. 906 81 223 0 22 741 49July .............................. 901 91 81 0 15 895 51August ......................... 891 73 40 0 13 910 52September ................... 905 92 -22 0 14 1,006 52October ........................ 902 146 35 0 18 995 53November .................... 930 82 -37 0 20 1,030 52December .................... 964 86 -128 (s) 38 1,139 48Average ...................... 915 91 -3 (e) 28 982 48
1992 January ........................ 949 90 -282 (s) 72 1,249 39February ...................... 955 86 -200 (s) 27 1,214 33March ........................... 940 68 -15 (s) 26 997 33Apdl ............................. 961 80 120 0 24 896 36May .............................. 977 72 253 (s) 23 773 44June ............................. 978 66 206 (s) 27 811 50July .............................. 964 68 176 (s) 35 821 56August ......................... 946 85 117 (s) 25 889 59September ................... 931 71 51 (s) 25 927 61October ........................ 933 104 -88 (s) 30 1,095 58November .................... 964 99 -243 0 33 1,273 51December .................... 977 131 -385 0 45 1,448 39Average ...................... 956 65 -24 (s) 33 1,032 39
1993 January ........................ 965 72 -173 1 31 1,179 33February ...................... 959 78 -261 (s) 37 1,261 26March ........................... 971 85 -140 (s) 32 1,165 22April ............................. 973 112 233 (s) 40 812 29May .,............................. 942 96 262 0 30 746 37June ............................. 956 75 266 0 23 744 45July .............................. 956 105 232 0 26 804 52August ......................... 945 116 164 0 27 851 58September ................... 956 132 116 0 17 955 61October ........................ 953 107 -10 0 13 1,057 6110-Month Average ..... 958 98 73 (s) 27 956 61
1992 10-Month Average ..... 953 79 34 (s) 32 966 581991 lO-Month Average ..... 908 93 13 O 27 961 53
a A neget0vehumberindicatesa decrease in stocksand a positivenumber Sources: , 1973 through 1975: U.S. Department of the Interior, Bureauindicatesan irwJtease, of Mines, Mineral Industry Surveys, "Petroleum Statement,Annual." • 1976
b Stocksme totalsas of endof pedod, through 1980: Energy Information Administration (EIA), Energy Datac See Note 4 atend of section. Reports, PetroleumStatement, Annual." • 19B1 forward: EtA, Petroleum(s)=Lees than 500 barrelsper day. Sqpply Monthly, December 1993, Table $8.Note: Geographiccoverage isthe 50 States and the Distdc_ofColumbia.
Energy Information AdministrationJMonthly Energy Review December 1993 69
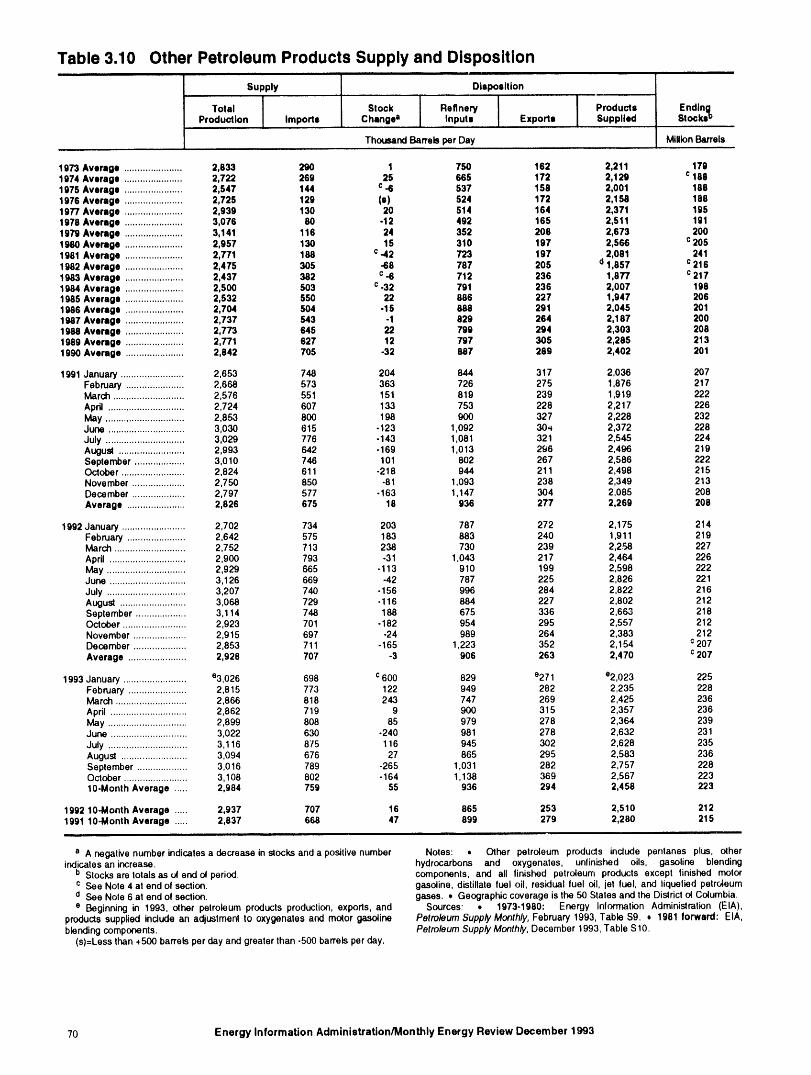
Table 3.10 Other Petroleum Products Supply and Disposition....... i, i ill i
Supply Disposition ....
Total Stock Refinery Products Endln_Production Imports Change a Inputs Exports Supplied Stocks°
ThousandBarrelsper Day MillionBarrels
1973 Average ...................... 2,833 290 1 750 162 2,211 1791974 Average ...................... 2,722 269 25 665 172 2,129 c 1881975 Average ...................... 2,547 144 c -6 537 159 2,001 1581976 Average ...................... 2,725 129 (s) 524 172 2,158 1881977 Average ...................... 2,939 130 20 514 164 2,371 1951978 Average ...................... 3,076 80 -12 492 165 2,511 1911979 Average ...................... 3,141 116 24 352 208 2,673 2001980 Average ...................... 2,957 130 15 310 197 2,566 c 2051981 Average ...................... 2,771 188 c -42 723 197 2,081 2411982 Average ...................... 2,475 305 -68 787 205 d1,957 c 2161983 Average ...................... 2,437 382 c -6 712 236 1,877 c 2171984 Average ...................... 2,500 503 c -32 791 236 2,007 1981985 Average ...................... 2,532 550 22 886 227 1,947 2061986 Average ...................... 2,704 504 -15 888 291 2,045 2011987 Average ...................... 2,737 543 -1 829 264 2,187 2001988 Average ...................... 2,773 645 22 799 294 2,303 2081989 Average ...................... 2,771 627 12 797 305 2,285 2131990 Average ...................... 2,842 705 -32 887 289 2,402 201
1991 January ........................ 2,653 748 204 844 317 2,036 207February ...................... 2,668 573 363 726 275 1,876 217March ........................... 2,576 551 151 819 239 1,919 222April ............................. 2,724 607 133 753 228 2,217 226May .............................. 2,853 800 198 900 327 2,228 232June ............................. 3,030 615 -123 1,092 30_ 2,372 228July .............................. 3,029 776 -143 1,081 321 2,545 224August ......................... 2,993 642 -169 1,013 296 2,496 219September ................... 3,010 746 101 802 267 2,586 222October ........................ 2,824 611 -218 944 211 2,498 215November .................... 2,750 850 -81 1,093 238 2,349 213December .................... 2,797 577 -163 1,147 304 2,085 208Average ...................... 2,826 675 18 936 277 2,269 208
1992 January ........................ 2,702 734 203 787 272 2,175 214February ...................... 2,642 575 183 883 240 1,911 219March ........................... 2,752 713 238 730 239 2,258 227April ............................. 2,900 793 -31 1,043 217 2,464 226May .............................. 2,929 665 -113 910 199 2,598 222June ............................. 3,126 669 -42 787 225 2,826 22 1July .............................. 3,207 740 -156 996 284 2,822 216August ......................... 3,068 729 o116 884 227 2,802 212September ................... 3,114 748 188 675 336 2,663 218October ........................ 2,923 701 -182 954 295 2,557 212November .................... 2,915 697 -24 989 264 2,383 212December .................... 2,853 711 -165 1,223 352 2,154 c 207Average ...................... 2,928 707 -3 906 263 2,470 c 207
1993 January ........................ %,026 698 c 600 829 e271 e2,023 225February ...................... 2,815 773 122 949 282 2,235 228March ........................... 2,866 818 243 747 269 2,425 236April ............................. 2,862 719 9 900 315 2,357 236May .............................. 2,899 808 85 979 278 2,364 239June ............................. 3,022 630 -240 981 278 2,632 231July .............................. 3,116 875 116 945 302 2,628 235August ......................... 3,094 676 27 865 295 2,583 236September ................... 3,016 789 -265 1,031 282 2,757 228October ........................ 3,108 802 -164 1,138 369 2,567 22310-Month Average ..... 2,984 759 55 936 294 2,458 223
1992 10-Month Average ..... 2,937 707 16 865 253 2,510 2121991 10-Month Average ..... 2,837 668 47 899 279 2,280 215
a A negative numberindicatesa decrease in stocksand a positivenumber Notes: n_s Other petroleum products include pentanes plus, otherindicatesan increase, hydrocarbo and oxygenates, unlinished oils, gasoline blendingb Stocksare totals as u4end ol period, components, and all linished petroleum products except finished mot_c See Note 4 at endof section, gasoline, distillatefuel oil, residual luel oil, jet fuel, and liquelled petroleumd See Note 6 at end ot section, gases. ,, Geographiccoverage is the 50 States and the Districtol Columbia.e Beginning in 1993, other petroleum products production, exports, and So_Jrces_ • 1973-1980: Energy Inlormation Administration (EIA),
productssupplied include an adjustment to oxygenates and motor gasoline Petro/eum Supply Monthy, February 1993, Table $9. = 1981 forward: EIA,blendingcomponents. Petroleum Supply Monthly, December 1993, Table S10.
(s)=Lessthan +500 barrelsper dayand greater than -500 barrelsper day.
70 Energy Information Administration/Monthly Energy Review December 1993
Prior to January 1981, the refinery input of unfinishedPetroleum Notes oils typically exceeded the available supply of un-
finished oils. That discrepancy was assumed to be due1. The Energy Information Administration (EIA) uses to the redesignation of distillate and residual fuel oilsa number of sources and methods to maintain the survey received as such but used as unfinished oil inputs byrespondent lists. On a regular basi_, survey managers the receiving refinery. The imbalance between supplyreview such industry publications as the Oil and Gas and disposition of unfinished oils would then be sub-Journal and Oil Daily for information on facilities or tracted from the production of distillate and residual fuelcompanies starting up or closing down operations, oils, Two-thirds of that difference was subtracted fromThose sources are augmented by articles in newspapers, distillate and one-third from residual. Beginning inletters from respondents indicating changes in status, January 1981, the EIA modified its survey forms toand information received from survey systems, account for redesignated product and discontinued the
above-mentioned adjustment.
To supplement routine frames maintenance and to pro-vide more thorough coverage, a comprehensive frames Beginning in January 1993, the end-of.month stocks ofinvestigation is conducted every 3 years. This inves- distillate fuel oil are split into two sulfur categoriestigation results in the reassessment and recompilation of (0.05 percent sulfur or less and greater than 0.05 percentthe complete frame for each survey. The effort also in- sulfur) to meet Environmental Protection Agencycludes the evaluation of the impact of potential frame requirements effective in October 1992. For furtherchanges on the historical time series of data published details, see the EIA, Petroleum Supply Monthly.from these respondents. The results of this frame studyare usually implemented in January to provide a fullyear under the same frame. 4. New Stock Basis: In January 1975, 1979, 1981,
and 1983, numerous respondents were added to bulkterminal and pipeline surveys, affecting subsequent
In 1991, the EIA conducted a frame identifier survey of stocks reported and stock change calculations. Usingcompanies that produce, blend, store, or import the expanded coverage (new basis), the end-of-yearoxygenates. A summary of the results from the iden- stocks, in million barrels, would have been:tification survey was published in the Weekly PetroleumStatus Report dated February 12, 1992, and in the • Crude Oil: 1982--645 (Total) and 351 (OtherFebruary 1992 issue of the Petroleum Supply Monthly. Primary).In order to continue to provide relevant information • Crude Oil and Petroleum Products: 1974--1,121;about U.S. and regional gasoline supply, the EIA con- 1980--1,425; and 1982--1,461.ducted a second frame identifier survey of those • Motor Gasoline: 1974--225; 1980n263; 1982wcompanies during 1992. As a result, numerous respon-dents were added to the monthly surveys effective in 244 (Total) and 202 (Finished).January 1993. See Explanatory Note 7 in the Petroleum • Distillate Fuel Oil: 1974w224; 1980n205; andSupply Monthly. 1982--186.
• Residual Fuel Oil: 1974_75; 1980_91; and2. Motor Gasoline: Beginning in January 1981, the 1982----69.
EIA expanded its universe to include non-refinery • Jet Fuel: 1974_30 (Total) and 24 (Keroseneblenders and separated blending components fromfinished motor gasoline as a reporting category. Also, Type); 1980---42 (Total) and 36 (Kerosene Type);survey forms were modified to describe refinery opera- and 1982--39 (Total) and 32 (Kerosene Type).tions more accurately, • Liquefied Petroleum Gases: 1974---113; 1978_
136; 1980---128; and 1982_102.
Beginning with the reporting of January 1993 data, the • Propane and Propylene: 1978--86; 1980---69;EIA made adjusunents to the product supplied series for and 1982--57.
finished motor gasoline. It was recognized that motor • Other Petroleum Products: 1974---190; 1980_gasoline statistics published by the EIA through 1992 207; and 1982_219.were underreported because the reporting system was(1) not collecting all fuel ethanol blending, and (2) therewas a misreporting of motor gasoline blending corn- Stock change calculations beginning in 1975, 1979,portents that were blended into finished gasoline. 1981, and 1983 were made by using new basis stockThe adjustments are incorporated into EIA's data begin- levels.ning in January 1993. To facilitate data analysis across
the 1992-1993 period, EIA has prepared a table of 1992 In January 19_34, changes were made in the reporting ofdata adjusted according to the 1993 basis. See natural gas liqu!ds. As a result, unfractionated stream,Petroleum Supply Monthly, March 1993, Table tt3. which was formerly included in the "Other Petroleum
Products Supply and Disposition" table, is now reported3. Distillate and Residual Fuel Oils: The requirement on a component basis (ethane, propane, normal butane,to report crude oil in pipelines or burned on leases as isobutane, and pentanes plus). Most of these stockseither distillate or residual fuel oil has been eliminated, now appear i_r the "Liquefied Petroleum Gases Supply
EnergyInformationAdministration/MonthlyEnergyReviewDecember1993 71
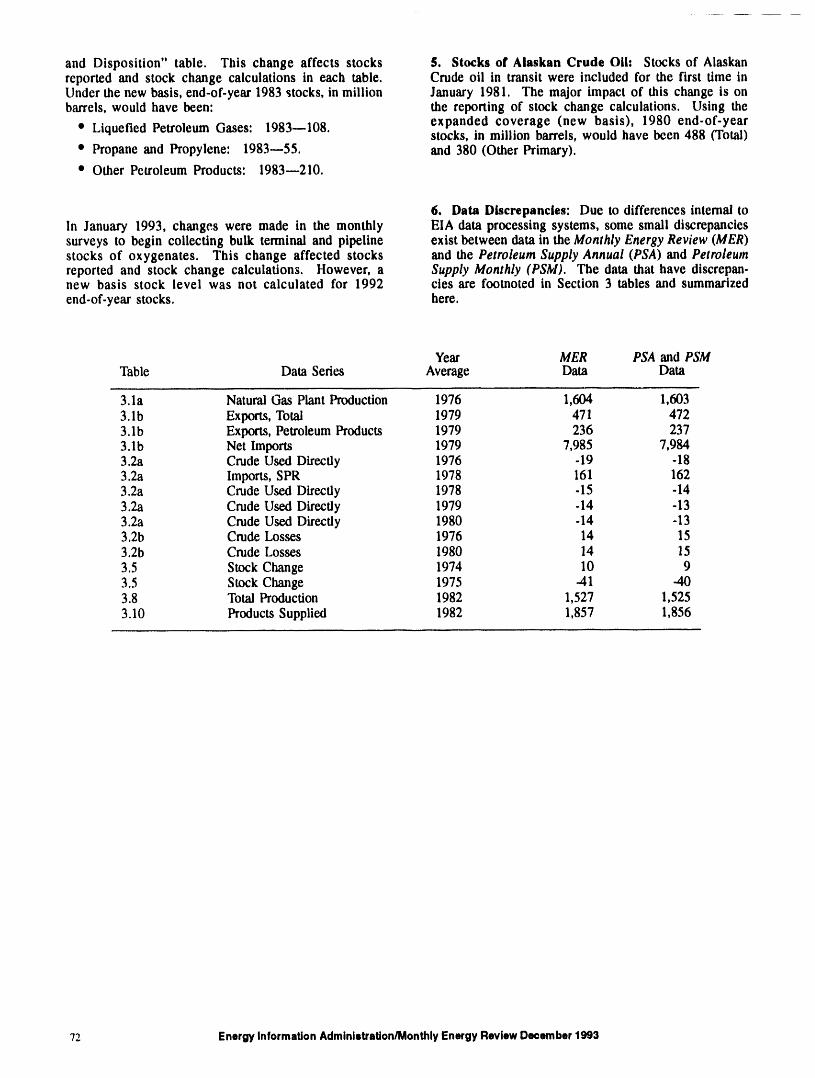
and Disposition" table. This change affects stocks $. Stocks of Alaskan Crude Olh Stocks of Alaskanreported and stock change calculations in each table. Crude oil in transit were included for the first time inUnder the new basis, end-of-year 1983 stocks, in million January 1981. The major impact of this change is onbarrels, would have been: the reporting of stock change calculations. Using the
* Liquefied Petroleum Gases: 1983m108. expanded coverage (new basis), i980 end-of-yearstocks, in million barrels, would have been 488 (Total)* Propane and Propylene: 1983m55. and 380 (Other Primary).
* Other Petroleum Products: 1983--210.
6. Data Discrepancies: Due to differences internal toIn January 1993, changes were made in the monthly EIA data processing systems, some small discrepanciessurveys to begin collecting bulk terminal and pipeline exist between data in the Monthly Energy Review (MER)stocks of oxygenates. This change affected stocks and the Petroleum Supply Annual (PSA) and Petroleumreported and stock change calculations. However, a Supply Monthly (PSM). The data that have discrepan-new basis stock level was not calculated for 1992 cies are footnoted in Section 3 tables and summarizedend-of-year stocks, here.
Year MER PSA and PSMTable Data Series Average Data Data
3.1a Natural Gas Plant Production 1976 1,604 1,603
3. Ib Exports, Total 1979 471 4723.1 b Exports, Petroleum Products 1979 236 2373.1b Net Imports 1979 7,985 7,9843.2a Crude Used Directly 1976 -19 -183.2a Imports, SPR 1978 161 1623.2a Crude Used Directly 1978 -15 -143.2a Crude Used Directly 1979 -14 -133.2a Crude Used Directly 1980 -14 -133.2b Crude Losses 1976 14 153.2b Crude Losses 1980 14 15
3.5 Stock Change 1974 10 93.5 Stock Change 1975 -41 -403.8 Total Production 1982 1,527 1,525
3.10 Products Supplied 1982 1,857 1,856
72 EnergyInformationAdministration/MonthlyEnergyReviewDecember1993
Section 4. Natural Gas
Total drynatural gas production in the United States Total deliveries to industrial consumers during Septem-during October 1993 was an estimated 1.6 trillion cubic bet 1993 were 675 billion cubic feet, 15 percent morefeet, 2 percent4 higher than production during the pre- than the previous September's level. Deliveries to in-vious October. dustrial consumers during the first 3 quarters of 1993
were 5.8 trillion cubic feet, 4 percent more than in-dustrial deliveries during the first 3 quarters of 1992.
Consumption of natural and supplemental gas in Oc-tober 1993 was 1.5 trillion cubic feet, 9 percent above Imports of natural gas in October 1993 were 183 bli-the level in October 1992. lion cubic feet, 4 percent higher than imports in the
previous October.
Deliveries to residential consumers in September 1993 Stocks of working gas5 in underground natural gas(latest date for which data are available) were 142 storage reservoirs at the end of October 1993 totaledbillion cubic feet, 4 percent higher than the previous 3.0 trillion cubic feet, 7 percent below the level ofSeptember's deliveries. Deliveries to residential con- stocks available 1 year earlier. Net injections intosumers during the first 3 quarters of 1993 were 3.5 storage during October 1993 were 150 billion cubictrillion cubic feet, 8 percent more than residential feet, 19 percent below the amount injected during thedeliveries during the first 3 quarters of 1992. previous October.
4Percentagechangesare basedon unfoundeddata.SGasavailableforwithdrawal.
Energy Information Adminls_ration/Mon_ly Energy Review Deceml_r 1993 73
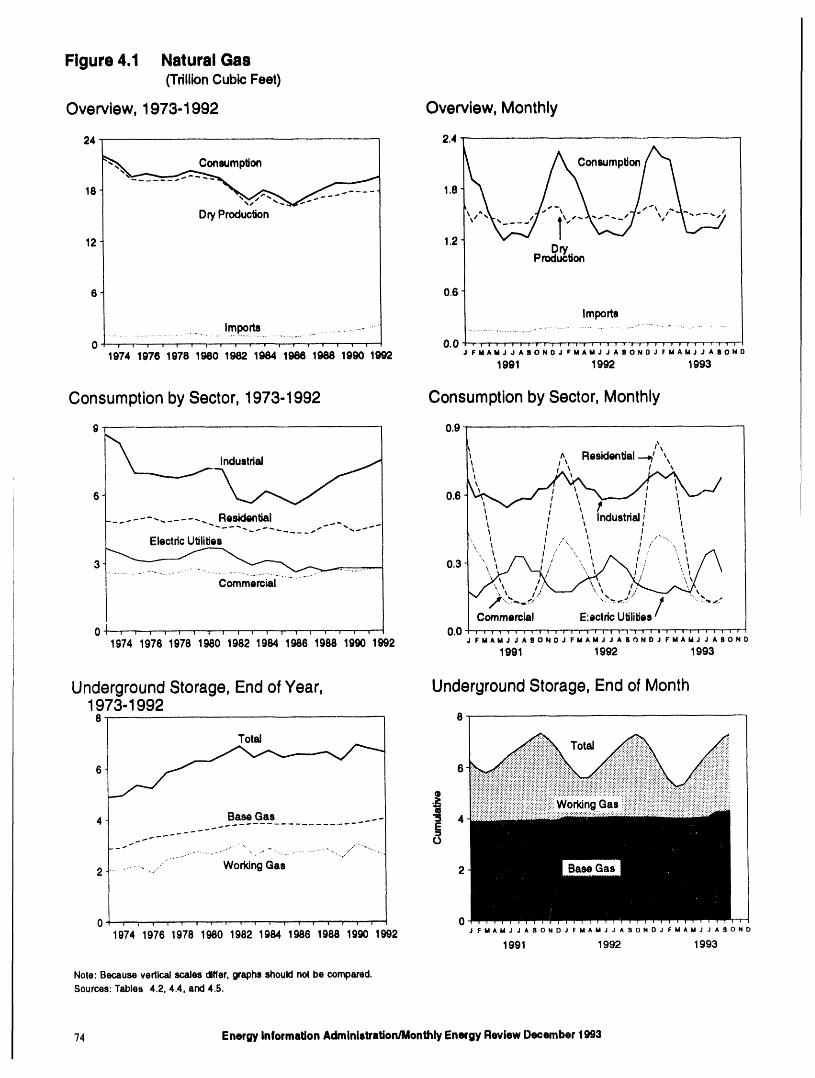
Figure 4.1 Natural Gas(Trillion Cubic Feet)
Overview,1973-1992 Overview,Monthly
24 2.4
18 1.8
Dry Production i_.,"- "" "V-
12 1.2Dry
Production
6 0.6
ImportsImports ..................... ..............................................................................................................
0 --_ _ T , , , _ , , , , _ _''_ t _ _ _ .... 0.0 ., r f _ r _ _ f f , _ _ _ _ _ ,'_ _ _' , w _ _ _ _ , _"', , r-T_r--r--I-
1974 1976 1978 1980 1982 1984 1986 1988 1990 1992 FMAMJJADONOJ FMAMJJABONDJ FMAMJ JABOND1991 1992 1993
Consumption by Sector, 1973-1992 Consumption by Sector, Monthly
9 0.9 '}• _ ^. Residential --_ _II / '_ , ,
6 o.8 J....... -....... .. Residential I \ / \industrial, ,.-._ I I" -J L _ i , •
' / /".-%
ElectricUtilitJes ', _ / / ...... _ , / , _l",. _ r-x ;, ", _ /_ _, ",.l / \
................ "" l i / ,, l I/ _.l
Commercial%,,,_
P
Commemial E!ectricUtilil_e_/
Ot ................. ,- 0.0 , ................. ,'-', .............lg74 1976 1978 1980 1982 1984 1986 1988 1990 1992 JFMAMJJABONDJFMAMJJASONOJFMAMJJABOND
1991 1992 1993
Underground Storage, End of Year, Underground Storage, End of Month1973-1992
8 8
Total
Total
4 BaseGas "=J 4
_ " - (,.)
,,,, ..,. ..... .
2 ......................' WorkingGas 2
! _ v T T i I i i _ , 1 ! ! 1 '; , U'' 0
1974 1976 1978 1980 1982 1984 1986 1988 1990 1992 J FMAMJ JASONDJ FMAMJ JASONDJ FMAMJ JASOND
1991 1992 1993
Note:Becauseverticalscalesdiffer,graphsshouldnotbe compared.Sources:Tables4.2, 4.4, and4.5.
'74 Energy Information Administration/Monthly Energy Review December 1993
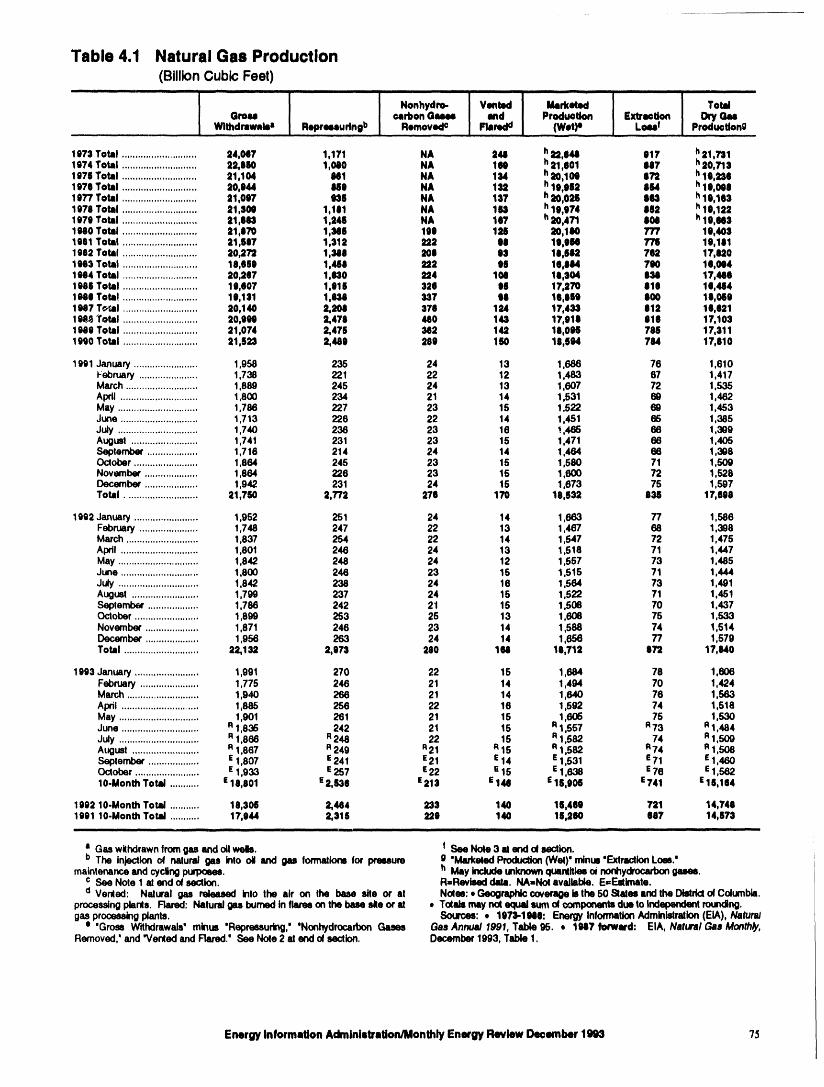
Table 4.1 Natural Gas Productlon(BillionCubicFeet)
ii ill ii ill ii il i ill _ ,ll , i i
Nonhydm- ! Vtmt_l ! Marketed Total
Withdrawals a Repreuudng b RemovecF J Flaredd J.... (Wet)• Lmm! Production0
197:1Total ............................ 24,M7 1,171 NA 2411 h23,1148 917 h21,7311974 Total ............................ 22,9110 1,980 NA 1(14) h21,801 1197 h20,7131976 Total ............................ 21,104 1411 NA 1_4 h20,109 1172 h111,23111976 Total ............................ 20,1144 160 NA 1_12 h19,1182 1134 h19,00111977 Total ............................ 21,097 _III NA 137 h23,02S 116,1 h19,13319711Total ............................ 21,3011 1,1|1 NA 1113 h18,1174 lisa h111,1221979 Total ............................ 21,1133 1,2411 NA 1117 h20,471 1108 h111,1931980 Total ............................ 21,970 1,M6 199 12l 20,1110 777 19,4031081 Total ............................ 21,687 1,312 222 113 19,OH 776 10,11111992 Total ............................ 20,272 1,M| 3011 93 111,8112 782 17,1301983 Total ............................ 18,039 1,4811 222 98 18,11t4 7110 19,0941984 Total ............................ 20,297 1,830 224 198 19,304 $38 17,4891088 Total ............................ 19,907 1,916 329 96 17,370 11111 19,4841989 Total ............................ 19,131 1,¢19 337 119 13,959 300 111,0601987 T_I ............................ 20,140 3,300 379 124 17,433 312 19,821lOll._..Total ............................ 20,998 3,4711 460 143 17,9111 019 17,1031980 Total ............................ 31,074 3,476 M2 143 19,006 766 17,3111990 Total ............................ 21,623 3,480 299 160 10,604 764 17,610
1991 January ........................ 1,958 235 24 13 1,686 76 1,610February ...................... 1,738 221 22 12 1,483 67 1,417March ........................... 1,889 245 24 13 1,607 72 1,535April ............................. 1,800 234 21 14 1,531 60 1,462May .............................. 1,786 227 23 15 1,522 69 1,453June ............................. 1,713 228 22 14 1,451 66 1,385July ............................... 1,740 236 23 18 _,466 66 1,309August ......................... 1,741 231 23 15 1,471 68 1,405September ................... 1,718 214 24 14 1,464 66 1,306October........................ 1,864 245 23 15 1,580 71 1,509November .................... 1,864 226 23 15 1,600 72 1,528December .................... 1,942 231 24 15 1,673 75 1,597Total ........................... 21,760 3,773 279 170 18,6,32 1136 17,800
1992 January ........................ 1,952 251 24 14 1,663 77 1,586February ...................... 1,748 247 22 13 1,487 68 1,396March ........................... 1,837 254 22 14 1,547 72 1,475April ............................. 1,801 246 24 13 1,518 71 1,447May .............................. 1,842 248 24 12 1,557 73 1,485June ............................. 1,800 246 23 15 1,515 7t 1,444Juty .............................. 1,842 238 24 16 1,564 73 1,491August ......................... 1,799 237 24 15 1,522 71 1,451September ................... 1,786 242 21 15 1,508 70 1,4.37October ........................ 1,899 253 25 13 1,608 75 1,533November .................... 1,871 246 23 14 1,588 74 1,514December .................... 1,956 263 24 14 1,856 77 1,579Total ............................ 23,132 2,073 200 1M 19,712 972 17,140
1993 January ........................ 1,991 270 22 15 1,684 78 1,606February ...................... 1,775 246 21 14 1,494 70 1,424March ........................... 1,940 266 21 14 1,640 78 1,563April ............................. 1,885 256 22 18 1,592 74 1,518May .............................. 1,901 261 21 15 1,606 75 1,530June ............................. R1,835 242 21 15 R1,557 R73 R1,484July .............................. R1,868 R248 22 15 R1,582 74 R1,509August ......................... R1,867 R249 R21 R15 R1,582 R74 R1,508September ................... E1,807 E241 E21 E14 e 1,531 e71 £1,460October ........................ e 1,933 F.257 e22 E 15 e 1,838 e 78 e 1,562lO-Month Total ........... E19,901 e3,938 E213 e148 e 16,9(}6 E741 e 18,114
1992 10-Month Total ........... 18,306 3,464 233 140 18,480 721 14,74111901 lO-Month Totid ........... 17,944 2,315 220 140 lS,200 007 14,673
i i. i
a Gas withdrawnfromgas attd ollwelb. ! See Note 3 at end O4section.b The injection of natural gas into oil and gas formations for preuum g 'M_ketad Production(Wat)' minus'Extraction Loas.'
maintenance and cyclingpurposes, h May includeunknownquenlttlu o_nonhydrocatbongases.c See Note I at end O4section. R=Revised data. NA,,No4available. E,=Eatlmate.d Venled: Natural gas releued into the air on the base site or at Nolm:, Geogmphlccoverage is the 50 Stales and the Dlatdd o4Co4umbla.
processingplants. Flared: Natural gas burnedin flares onthe ban de or at • Totlds may not eClU_sum O4oomponentsdue to independentrounding.
gas processingplants. Sources: , 107"&-19811:Energy Infom_tion/_mln_mtlon (EIA), NatunUe Gross Withdrawals' minus 'Repressudng,' 'Nonhydrocarbon Gases Gas Annual 1991, Table 95.. 1987 forward: EIA, Natural Gas Monthly,
Removed,' and "Vented and Flared.' See Note 2 at end o4section. December 1993, Table 1.
Energy InformaUon Administration/Monthly Energy Review Deeember 1993 75
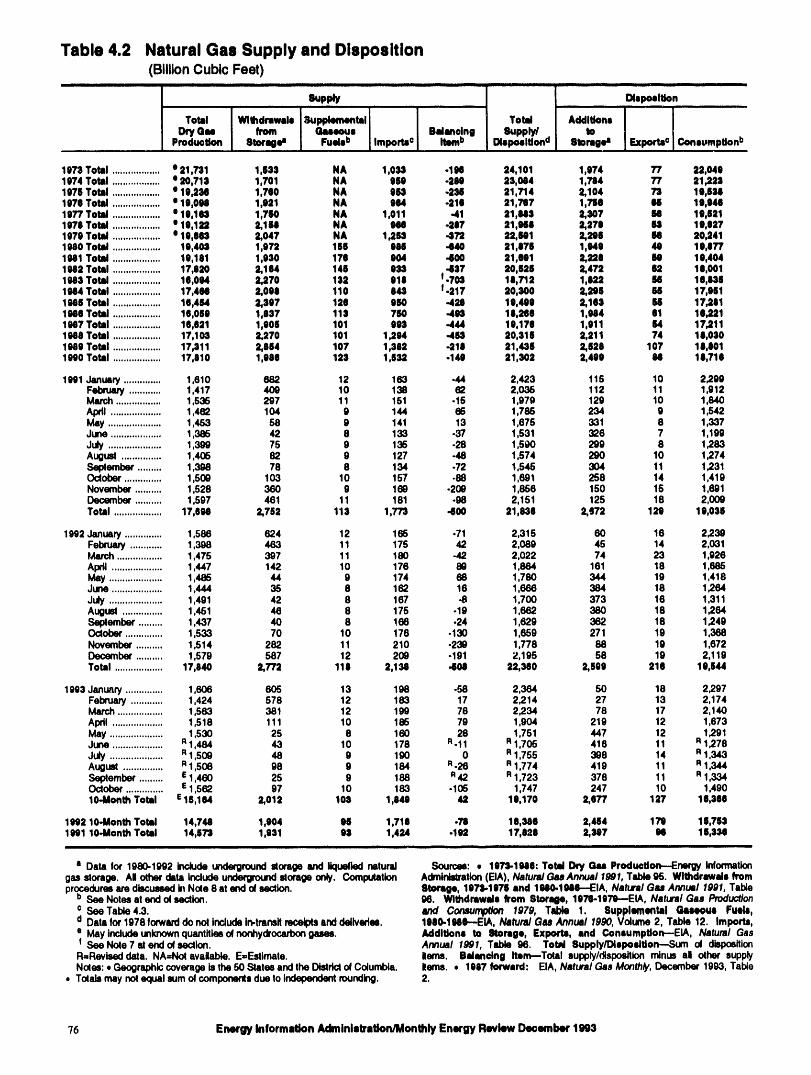
Table 4.2 Natural Gas Supply and Disposition(BillionCubicFeet)
Supply Dispositioni i ,i i
Total WIIhdmwale Supplemental Total AdditionsDqryGM front Gueoue B,danolng 9upplyl . to
Produ_tlon 8tarlge a Fueieb imports 0 Itemb DlsposlUona 8tamge a Exportae CxmsumpUonb.................
1973 Total .................. e 21 731 1,653 NA 1,033 -198 24,101 1,974 77 22,0491974 Total .................. * 20,713 1,701 NA 969 -299 23,084 1,734 77 21,2251976 Total .................. * 19 234 1,780 NA 963 -238 21,714 2,104 73 19,6361070 Total .................. * 19 098 1,921 NA 964 -216 21,737 1,736 98 19,0401977 Total .................. * 10 163 1,710 NA 1,011 -41 21,983 2,207 98 19,6211079 Total .................. o 10 122 2,161 NA 098 -:!t7 21,988 2,270 6,1 10,t271979 Total .................. * 19 663 2,047 NA 1,263 "472 22,981 2,208 98 20,2411880 Total .................. 10 40_1 1,072 166 098 "440 21,976 1,649 48 19,1771981 Total .................. 19 181 1,630 170 904 .400 21,691 2,229 98 19,4041982 Total .................. 17 920 2,184 146 932 .467 20,626 2,472 62 11,0011983 Total .................. 19 ON 2,270 132 019 t-703 18,712 1,622 98 16,8341984 Total .................. 17 464 2,098 110 943 f-217 20,600 2,296 68 17,9611986 Total .................. 16,464 2,297 126 960 -421 19,499 2,163 98 17,2911089 Total .................. 16 069 1,837 116 760 -498 16,206 1,984 91 11,2211987 Total .................. 16 021 1,906 101 983 -444 10,170 1,911 64 17,2111988 Total .................. 17 10_ 2,270 101 1,294 -463 20,616 2,211 74 18,0301989 Total .................. 17 Illl 2,864 107 1,382 -219 21,406 2,626 107 19,6311980 Total .................. 17 010 1,080 126 1,832 -140 2i,302 2,499 98 19,719
1991 January .............. 1,610 682 12 163 -44 2,423 115 10 2,299February ............ 1,417 409 10 138 62 2,038 112 11 1,912March ................. 1,5,35 297 11 151 .16 1,979 129 10 1,840Apdl ................... 1,462 104 9 144 65 1,785 234 9 1,542May .................... 1,453 58 9 141 13 1,675 331 8 1,337June ................... 1,388 42 8 133 -37 1,531 326 7 1,199July .................... 1,399 75 9 135 -28 1,590 299 8 1283August ............... 1,406 82 9 127 -18 1,574 290 10 1,274Se_ember ......... 1,398 78 8 134 -72 1,545 304 11 1231Ootober .............. 1,500 103 10 157 .88 1,691 258 14 1,419November .......... 1,528 360 9 160 -200 1,856 150 15 1,601December .......... 1,597 461 11 181 -98 2,151 125 18 2,039Total .................. 17,698 2,752 116 1,773 -600 21,836 2,872 129 19,038
1992 January .............. 1,586 624 12 165 -71 2,315 60 16 2239February ............ 1,398 463 11 175 42 2,089 45 14 2,031Match ................. 1,475 397 11 180 .42 2,022 74 23 1,926April ................... 1,447 142 10 176 80 1,864 161 18 1,685May .................... 1,486 44 9 174 68 1,780 344 19 1,418June ................... 1,444 35 8 162 16 1,666 384 18 1264July .................... 1,491 42 8 167 -8 1,700 373 16 1,311August ............... 1,451 46 8 175 -19 1,662 380 16 1264September ......... 1,437 40 8 168 -24 1,629 382 18 1249Oclober .............. 1,533 70 10 176 -130 1,659 271 19 1,368November .......... 1,514 262 11 210 -235 1,778 88 19 1,672December .......... 1,579 587 12 209 -191 2,195 58 19 2,119Total .................. 17,640 2,772 119 2,134 .406 22,360 2,899 219 19,644
1993 January .............. 1,606 805 13 198 -58 2,364 50 18 2297February ............ 1,424 578 12 163 17 2214 27 13 2,174March ................. 1,583 381 12 199 76 2234 78 17 2,140April ................... 1,518 111 10 165 79 1,904 219 12 1,673May .................... 1,530 25 8 160 28 1,751 447 12 1291June ................... R1,484 43 10 178 R-11 R1,705 416 11 R1278July .................... R1,500 48 9 190 0 R1,755 398 14 R1,343August ............... R1,508 98 9 184 R-26 R1,774 419 11 R 1,344September ......... [ 1,460 25 9 188 R42 R1,723 378 11 R1,334October .............. [ 1,562 97 10 183 -135 1,747 247 10 1,49010-Month Total E16,164 2,012 106 1,049 42 10,170 2,077 127 16,669
1092 10-Monlh Total 14,748 1,634 96 1,718 .71 18,346 2,484 173 18,7631981 lO-Month Total 14,673 1,961 96 1,424 -132 17,826 2,397 98 16,634
i ill i
a Data for 1980-1992 Include underground storage and itciua_d naturaJ Source: , 1973-1986: Total Dry _u; ProduoUon---Ene_y Informationgas storage. AI other data include underground¢omge only. Computation Admink_mtton(EIA), Natura/Gas Annual 1991, Table 95. Wlthdrmwls fromproceduresare discussedinNote 8 at end of section. Storage, 19711-1976rand 1980-1989-..EIA, Natural Gas Annual 1991, Tab4e
b See Notesat end o4section. 96. WIIhdmwals from Storage, 1976-1979--EIA, Natural Gas Production¢ See Tabie4.3. and Consu_ 1979, Table 1. Supplemental GllSeQUl FUell,d Data for 1978 Ionvarddo not includein-transitreceiptsand deliveries. 1980-1986--EIA, Natural Gas Annual 1990, Vofume 2, Table 12. Imports,e May includeunknownquantities of nonhydrocarbongases. AddlUons to 8torqe, Exports, and ConsumpUon--EIA, Natural Gasf See Note 7 al end o4section. Annual 1991, Table 96. TotAl 8upply/DIspoldUon---Sum of disposition
R=Revised data. NA=NOtavalabte. E=Estimate. ilems. Badanclng Item-Total supply/disposition n_nus al other supplyNotes: • Geographiccoverage is the 50 States and the Districtof Cofumbta. Ilmrm. • 1987 forward: EIA, Natural Gas Monthly, December 1993, Tabte
• Total==may no( equal sum o( componentsdue to Independentrounding. 2.
76 Energy Information Adminletrmtion/Monlhly Energy Review December I
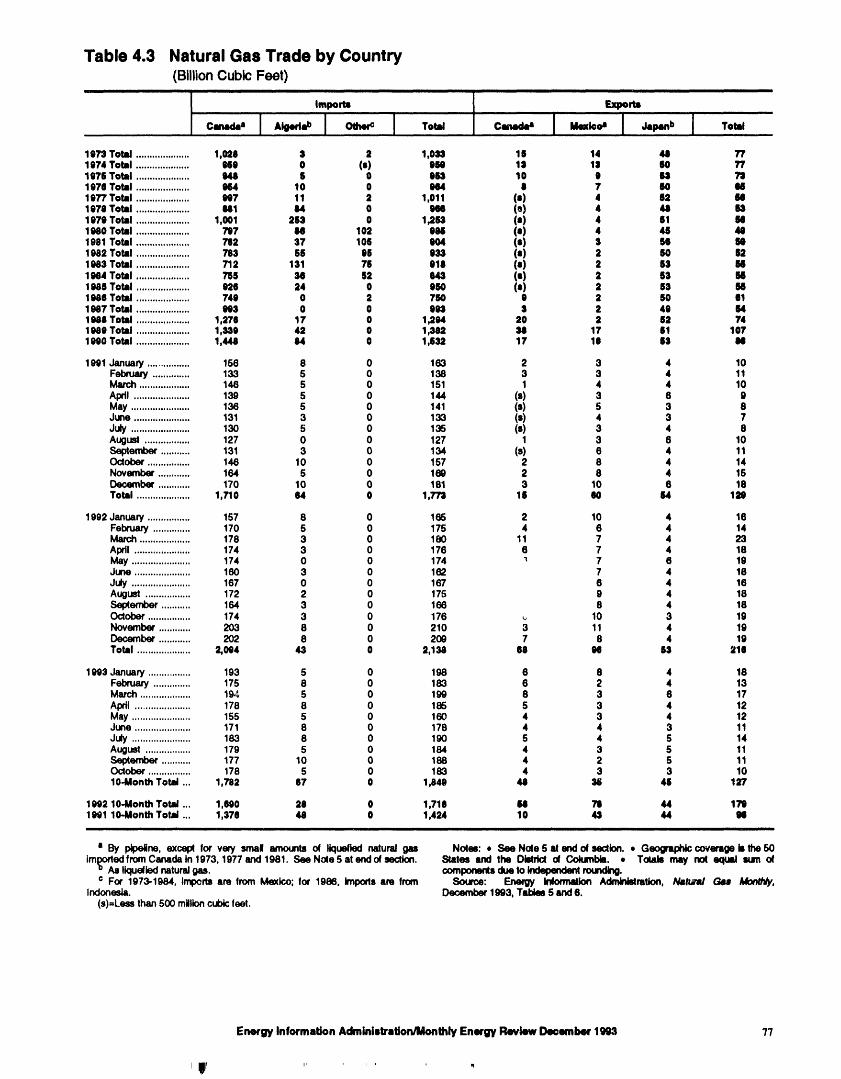
Table 4.3 Natural Gas Trade by Country(Billion Cubic Feet)
i
Import= } Export=
1073 Total .................... 1,028 3 2 1,033 11 14 48 771874 Total .................... U9 0 (e) ON lS 15 80 771073 Total .................... _ S 0 033 10 e sl 731978 Total .................... 964 10 0 984 8 7 SO M1077 Total .................... 987 11 2 1,011 (e) 4 li2 M1978 Total .................... M1 84 0 _ (e) 4 44 141070 Total .................... 1,001 283 0 1,2U (e) 4 61 M1980 Total .................... 797 U 102 9M (e) 4 46 41e1981 Total .................... 762 37 106 904 (s) $ S$ lie1982 Total .................... 793 56 96 933 (e) 2 60 $21983 Total .................... 712 131 76 918 (e) 2 53 M1984 Total .................... 755 30 62 843 (e) 2 68 M1988 Total .................... 828 24 O 850 (s) 2 83 M1988 Total .................... 749 0 2 750 0 2 80 611987 Total .................... 983 0 0 998 _ 2 49 841988 Total .................... 1,278 17 0 1,294 20 2 12 741889 Total .................... 1,339 42 0 1,382 :NI 17 81 1071990 Total .................... 1,448 84 0 1,832 17 18 85 98
1991 January ................ 156 8 0 163 2 3 4 10February .............. 133 5 0 138 3 3 4 11March ................... 146 5 0 151 1 4 4 10April ..................... 139 5 0 144 (s) 3 6 9May ...................... 136 5 0 141 ($) 5 3 8June ..................... 131 3 0 133 ($) 4 3 7July ...................... 130 5 0 135 (s) 3 4 8August ................. 127 0 0 127 1 3 6 10September ........... 131 3 0 134 (s) 6 4 11October ................ 146 10 0 157 2 8 4 14November ............ 164 5 0 180 2 8 4, 15December ............ 170 10 0 181 3 10 6 18Total .................... 1,710 84 0 1,7"/3 18 80 84 1_
1992 January ................ 157 8 0 166 2 10 4 16February .............. 170 5 0 175 4 8 4 14March ................... 178 3 0 180 11 7 4 23Apdl ..................... 174 3 0 176 6 7 4 18May ...................... 174 0 0 174 _ 7 6 19June ..................... 160 3 0 162 7 4 18July ...................... 167 0 0 167 6 4, 16August ................. 172 2 0 175 9 4 18Sep(ember ........... 164 3 0 166 8 4 18October ................ 174 3 0 176 _ 10 3 19November ............ 203 8 0 210 3 11 4 19December ............ 202 8 0 209 7 8 4 19Total .................... 2,094 43 O 2,138 $8 M 85 218
1993 January ................ 193 5 0 198 8 8 4 18Felxuary .............. 175 8 0 183 6 2 4 13March ................... 194 5 0 199 8 3 6 17April ..................... 178 8 0 185 5 3 4 12May ...................... 155 5 0 160 4 3 4 12June ..................... 171 8 0 178 4 4 3 11July ...................... 183 8 0 190 5 4 S 14August ................. 179 5 0 184 4 3 S 11Sept_ ........... 177 10 0 188 4 2 5 11October ................ 178 5 0 163 4 3 3 10lO-Month Total ... 1,782 87 0 1,844) 441 38 48 127
1892 lO-Month Total ... 1,690 20 O 1,718 141 79 44 1791991 lO-Month Total ... 1,378 48 0 1,424 10 43 44 M
ill i|l i i i
a By pipetne, except for very sinai amounts of liquefied natural gas Notes: , See Note 5 at end of section. • Geographic coverage Is the 50imi_ortedfromCanada in1973,1977 and1981. See Note 5 at end of section. Stales and the Dbldot of Cok/Id)ls, , Totals may no( equal lure of
'_Asliqu_iednaturalgas. com_s duetoIndependentrounding.o For 1973-1964, imports am from Mexico; for 1986, Imports am from Source: Enmgy Irdommtlon Admln_mtlon, Natura/ Gas MonU#y,
Indonesia. December 1993, Tsbies S snd 6.(s)=Less than 500 millioncubicfeet.
EnergyInformationAclministration/MonlhlyEnergyReviewDeoember1993 "/7
ilit .....
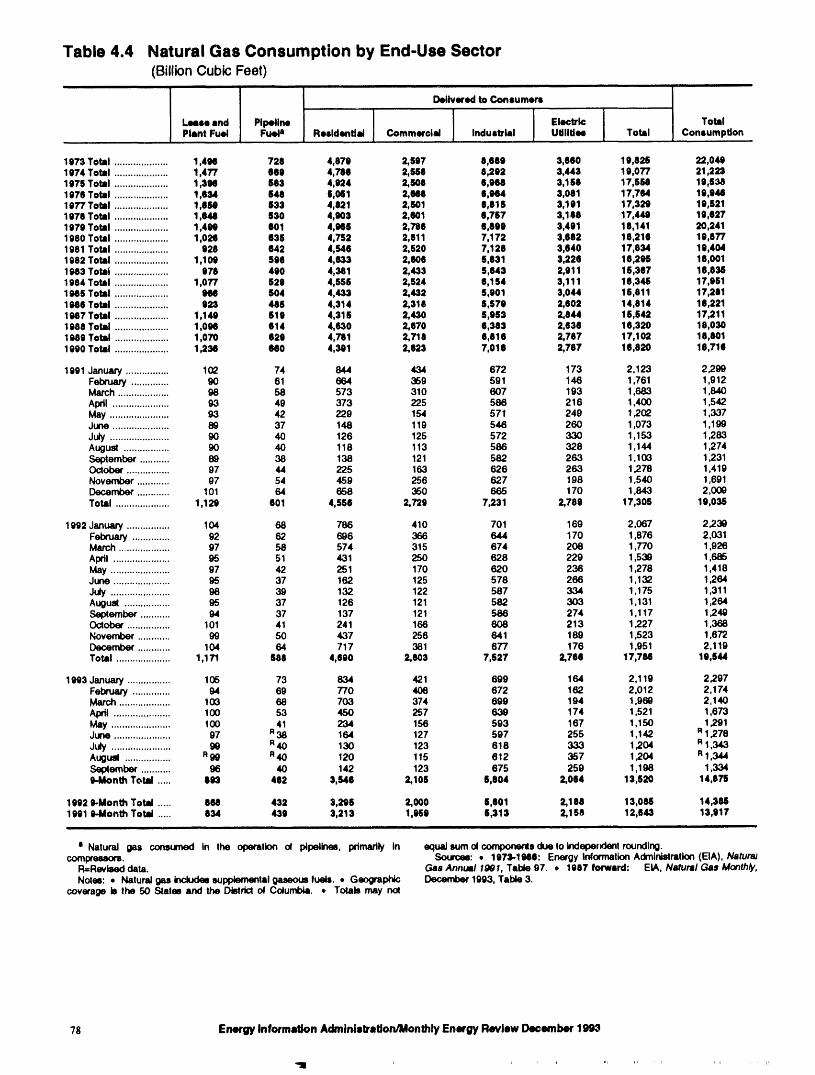
Table 4.4 Natural Gas Consumption by End-Use Sector(BillionCubicFeet)
Delivered to Consumers, ,, ,,
Lease and Pipeline Eiactric TotalPlant Fuel Fuela Residential Commercial Industrial Utilities Total Consumption
1973 Total .................... 1,498 728 4,879 2,697 8,889 3,660 19,826 22,0401074 Total .................... 1,477 889 4,700 2,550 5,292 3,443 19,077 21,2231675 Total .................... 1,3H 683 4,924 2,600 6,968 3,158 17,564 19,5381976 Total .................... 1,834 648 5,061 2,NO 8,0414 3,001 17,764 19,9401077 Total .................... 1,8H 533 4,821 2,601 5,815 3,191 17,329 19,5211970 Total .................... 1,044 630 4,003 2,601 $,787 3,105 17,440 10,0271979 Total .................... 1,498 601 4,965 2,786 8,899 3,491 18,141 20,2411980 Total .................... 1,026 635 4,752 2,811 7,172 3,682 18,216 10,0771981 Total .................... 928 642 4,546 2,520 7,128 3,840 17,834 19,4041982 Total .................... 1,109 598 4,633 2,606 5,031 3,226 18,296 18,0011983 Total .................... 978 490 4,381 2,433 5,643 2,911 15,387 18,8381904 Total .................... 1,077 529 4,555 2,524 8,154 3,111 16,340 17,9511905 Total .................... 988 S04 4,433 2,432 5,901 3,044 15,811 17,2811988 Total .................... 923 485 4,314 2,318 5,570 2,802 14,814 18,2211987 Total .................... 1,140 519 4,310 2,430 5,953 2,844 18,542 17,2111988 Total .................... 1,055 814 4,630 2,570 8,383 2,838 18,320 18,0301989 Total .................... 1,070 829 4,781 2,718 8,818 2,787 17,102 18,0011990 Total .................... 1,238 680 4,34)1 2,623 7,018 2,787 18,820 10,716
1991 January ................ 10_ 74 844 434 672 173 2,123 2,299February .............. 90 61 664 369 591 146 1,761 1,912March ................... 98 58 573 310 607 193 1,683 1,840April ..................... 93 49 373 225 586 216 1,400 1,542May ...................... 93 42 229 154 571 249 1,202 i ,337June ..................... 89 37 148 1lg 546 260 1,073 1,199July ...................... g0 40 126 125 572 330 1,153 1,283August ................. 90 40 118 113 586 328 1,144 1,274September ........... 89 38 138 121 582 263 1.103 1,231October ................ 97 44 225 163 626 263 1,278 1,410November ............ 97 54 459 256 627 198 1,540 1,691December ............ 101 64 658 360 665 170 1,843 2,(X)9Total .................... 1,129 801 4,556 2,729 7,231 2,789 17,306 19,038
1992 January ................ 104 68 786 410 701 169 2.067 2,23GFebruary .............. 92 62 696 366 644 170 1,876 2,031March ................... 97 58 574 315 674 208 1,770 1,926April ..................... 95 51 431 250 628 229 1,53_ 1,686May ...................... 97 42 251 170 620 238 1,278 1,418June ..................... 95 37 162 125 578 266 1,132 1,264July ...................... 98 39 132 122 587 334 1,175 1,311August ................. 95 37 126 121 582 303 1,131 1,264September ........... 94 37 137 121 586 274 1,117 1,249October ................ 101 41 241 168 608 213 1,227 1.388November ............ 99 50 437 256 641 189 1,523 1,672December ............ 104 64 717 381 677 176 1,951 2,119Total .................... 1,171 see 4,800 2,003 7,527 2,788 17,755 19,544
1993 January ................ 105 73 834 421 69g 164 2,119 2,297February .............. 94 69 770 408 672 162 2,012 2,174March ................... 103 68 703 374 699 194 1,968 2.140April ..................... 100 53 450 257 639 174 1,521 1,673May ...................... 100 41 234 156 593 167 1,150 1,291June ..................... 97 R38 164 127 597 255 1,142 R1,278July ...................... 90 R40 130 123 618 333 1,204 R1,343Augusl ................. Rgg R40 120 115 612 357 1,204 R1,344September ........... 96 40 142 123 675 259 1,198 1,3349-Month Total ..... 893 482 3,548 2,105 6,804 2,084 13,520 14,876
1992 9-Month Total ..... 860 432 3,295 2,000 8,801 2,188 13,055 14,3061991 e-Month Total ..... 834 439 3,213 1,939 5,313 2,158 12,843 13,917
= NaturaJ gas consumed in the operation o( pipelines, primarily in equaJsum o( componenlsdue to lndepe,dent rounding.compressors. Sources: • 1971-1946: Energy Irdonnatk_ Administration(EIA), Natunu
R=Revtseddata. Gas Annual 1991, Table 97. • 1907 fonvlrd: EIA, Natural Gas Monthly,Notes: • Natural gas k_Judessupplemental gaseousfuels. • Geographic December 1903, Table 3.
coverage b the 50 Stalm and the Districtat Columbia. • Totab may not
78 Energy Information Adminisbration_Aonthly Energy Review December 1
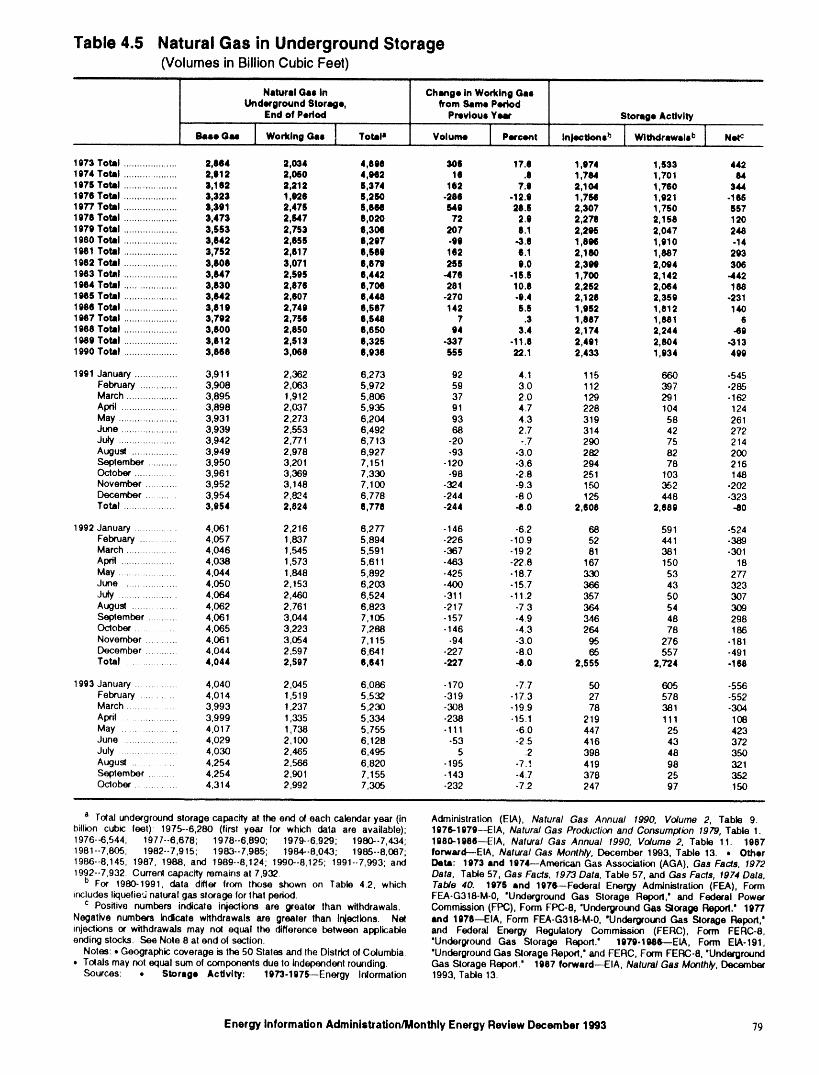
Table 4.5 Natural Gas in Underground Storage(Volumes in Billion Cubic Feet)
Natural Gas in Change in Working GasUnderground Storage, from Same Period
End of Pedod Previous Year Storage Activity
,..o- Jw.,o,o..lT+. v.,o. "+1973 Total .................... 2,684 2,034 4,808 306 17.6 1,974 1,533 4421974 Total .................... 2,612 2,060 4,962 16 .6 1,71M 1,701 841976 Total .................... 3,182 2,212 §,374 162 7.9 2,104 1,760 3441976 Total .................... 3,323 1,926 6,260 -266 -12.9 1,764S 1,921 -1661977 Total .................... 3,391 2,476 6,8(_ 649 28.6 2,307 1,750 5571078 Total .................... 3,473 2,047 8,020 72 2.9 2,278 2,158 1201979 Total .................... 3,553 2,753 6,306 207 6.1 2,21)6 2,047 2481080 Total .................... 3,842 2,658 6,297 -09 -3.6 1,81)6 1,910 -141981 Total .................... 3,752 2,617 6,§60 162 6.1 2,180 1,887 2031082 Total .................... 3,808 3,071 6,878 256 9.0 2,30t) 2,094 3061983 Total .................... 3,847 2,500 6,442 -4711 -lS+S 1,700 2,142 -4421084 Total ................... 3,830 2,876 6,798 281 10.8 2,252 2,064 1881985 Total .................... 3,842 2,607 6,448 -270 -9.4 2,126 2,350 -2311986 Total .................... 3,619 2,749 6,567 142 5.6 1,952 1,812 1401987 Total .................... 3,792 2,756 6,548 7 .3 1,887 1,881 81986 Total .................... 3,800 2,860 6,850 64 3.4 2,174 2,244 -691989 Total .................... 3,612 2,513 6,325 -337 -11.$ 2,491 2,804 -3131990 Total .................... 3,868 3,068 6,936 655 22.1 2,433 1,934 499
1991 January ................ 3,911 2,362 6,273 92 41 115 660 -545February .............. 3,g08 2,063 5,972 59 30 112 397 -265March ................... 3,895 1,912 5,806 37 2.0 129 291 -162April ..................... 3,898 2,037 5,935 91 407 228 104 124May ...................... 3,931 2,273 6,204 93 4.3 319 58 261June ..................... 3,939 2,553 6,492 68 2.7 314 42 272July ...................... 3,942 2,771 6,713 -20 -.7 290 75 214Augusl ................. 3,949 2,978 6,927 -93 -300 282 82 200September ........... 3,950 3,201 7,151 -120 -3.6 294 78 216October ................ 3,961 3,369 7,330 -98 -2.8 251 103 148November ............ 3,952 3,148 7,100 -324 -9.3 150 352 -202December ............ 3,954 2,824 6,778 -244 -8.0 125 448 -323Total .................... 3,954 2,824 8,778 -244 -8.0 2,608 2,689 .80
1992 January ................ 4,061 2,216 6,277 -146 -62 68 591 -524February ............. 4,057 1,837 5,894 -226 -10Jg 52 441 -389March ................... 4,046 1,545 5,591 -387 -19.2 81 381 -301April ..................... 4,038 1,573 5,611 -463 -22.8 167 150 18May ...................... 4,044 1,648 5,892 -425 -18.7 330 53 277June ..................... 4,050 2,153 6,203 -400 -15.7 366 43 323July ..................... 4,064 2,460 6,524 -311 -11.2 357 50 307August ................ 4,062 2,761 6,823 -217 -7+3 364 54 309September ........... 4,061 3,044 7,105 -157 -4.9 346 48 298Oclober ............. 4,065 3,223 7,288 -146 -4.3 264 78 186November ........... 4,061 3,054 7,115 -94 -3.0 95 276 -181December ........... 4,044 2,597 6,641 -227 -80 65 557 -491Total ................. 4,044 2,597 8,841 .227 .8.0 2,555 2,724 -188
1993 January .............. 4,040 2,045 6,086 -170 -7.7 50 605 -5_6February ........... 4,014 1,519 5,532 -319 -173 27 578 -552March .................. 3,993 1,237 5,230 -308 -19.9 78 381 -304April .................. 3,999 1,335 5,334 -238 +15.1 219 111 108May ................. 4,017 1,738 5,755 -111 -6.0 447 25 423June ..................... 4,029 2,100 6,128 -53 -2.5 416 43 372July ............... 4,030 2,465 6,495 5 .2 398 48 350Augus_ ............. 4,254 2,566 6,820 -195 -7.1 419 98 321September .......... 4,254 2,901 7,155 -143 -4.7 378 25 352_o_ ................ 4,314 2,992 7,305 -232 -7.2 247 97 150
a Tolal underground storage capacity at the end ol each calendar year (in Administration (EIA), Natural Gas Annual 1990, Volume 2, Table 9.billion cubic feet): 1975--6,280 (first year for which data are available); 197_1979--EIA, Natural Gas Production and Consumption 1979, Table 1.1976--6,544; 1977-6,678; 1978-6,890; 1979--6,929; 1980--7,434; 1980-1086--EIA, Natural Gas Annual 1990, Volume 2, Table 11. 19871981-7,805; 1982--7,915; 1983-7,985; 1984--8,043; 1985.-8,087; forward--EIA, Natural Gas Monthly, December 1993, Table 13. • Other1986-8,145; 1987, 1988, and 1989--8,124; 1990--8,125; 1991--7,993; and Deta: 1973 end 1974--American Gas Assoclalio_ (AGA), Gas Facts, 19721992--7,932 Current capacity remains at 7,9320 Data, Table 57, Gas Facts, 1973 Data, Table 57, and Gas Facts, 1974 Data,
b For 1980-1991, data differ from thos6 shown on Table 42, which Table 40. 1975 end 1976--Federal Energy Administration (FEA), Formincludes liquelie,3natural gas storage forthal period. FEA-G318-M-0, 'Underground Gas Slorage Report," and Fedecal Power
c Positive numbers indicate injections are greater than withdrawals. Commission (FPC), Form FPC-8, "Under_'ound Gas Slofage Report.' 1077Negative numbers indicate withdrawals ate greater than Injections. Net and 1978--EIA, Form FEA-G318-M.0, 'Under_'ound Gas Slorage Report,'injections or withdrawals may nol equal the difference between applicable and Federal Energy Regulatory Commission (FERC), Form FERC-8,ending slocks See Nole 8 atend ol section. "Underground Gas Slorage Report." 1979-1986---EIA, Form EIA-lgl,
Notes: • Geographiccoverage is the 50 Stales and lhe Districtol Columbia. "UndergroundGas Slorage Report," and FERC, Form FERC-8, "Underground• Tolals may not equal sum of componenls dueIo independenl rounding. Gas Silage Report." 1987 forward--EIA, Natural Gas Monthly, December
F,ources: • Storage Activity: 1973-1975--Energy Inlormalion 1993, Table 13.
Energy Information Administration/Monthly Energy Review December 1993 "/9
Natural Gas Notes Monthly data are revised and considered final after thepublication of the EIA NGA. Final monthly data areestimated by allocating annual extraction loss data to
1. Nonhydrocarbon Gases Removed: Annual data on the months on the basis of total natural gas marketednonhydrocarbon gases removed from marketed produc- production data from the EIA NGA.tion--carbon dioxide, helium, hydrogen sulfide, and
nitrogen--are from the Energy InformationAdministra- 4. Supplemental Gaseous Fuels: Any gaseoustion (EIA) Natural Gas Annual (NGA) 1991. Data are substance that, introduced into or commingled withnot available for periods prior to 1980. Monthly data natural gas, increases the volume available for disposi-arereportedby three States andcomputed forsix States. tion. Such substances include, but are not limited to,Monthly data are preliminary until after publication of propane-air, refinery gas, coke oven gas, still gas,the EIA NGA. Differences between annual data pub- manufactured gas, biomass gas, or air or inert gaseslished in the EIA NGA and the sum of the preliminary added for Btu stabilization.monthly data (January-December)are allocated propor-tionally to the months to create final monthly data. Forfurther information on methods of estimating prelimi- Annual data beginning with 1980 are from the EIAnary monthly data, see the EIA Natural Gas Monthly NGA. Unknown quantities of supplemental gaseous(NGM). fuels are included in consumption data for 1979 and
earlier years.
2. Production. Monthly data are considered preliminary until after the• Annual data: Final annual data are from the EIA publication of the EIA NGA. Monthly estimates are
NGA. based on the annual ratio of supplemental gaseous fuels
• Estimated monthly data: Data for the two most to the sum of dry gas production, net imports, and netrecent months presented are estimated. Some of withdrawals from storage. The ratio is applied to the
monthly sum of the three elements to compute athe data for earlier months are also estimated orcomputed. For a discussion of computation and monthly supplemental gaseous fuels figure.estimation procedures, see the EIA NGM.
5. Imports and Exports: The United States imports• Preliminary monthly data: Monthly data are con- natural gas via pipeline from Canada. Prior to 1985, it
sidered preliminary until after publication of the also imported natural gas via pipeline from Mexico.EIA NGA. Preliminary monthly data are gathered Liquefied natural gas (LNG) arrives via tanker fromfrom reports to the Interstate Oil Compact Corn- Algeria. One shipment of LNG was received frommission and the U.S. Minerals Management Indonesia in December 1986. Very small amounts ofService. Volumetric data are converted, as neces- LNG arrived from Canada in 1973 (667 million cubicsary, to a standard 14.73 psi pressure base. feet), 1977 (572 million cubic feet), and 1981 (6 rail-Unless there are major changes, data are not lion cubic feet). The United States exports natural gasrevised until after publication of the EIA NGA. via pipeline to Canada and Mexico and LNG via tanker
• Final monthly data: Differences between avaual to Japan.data in the EIA NGA and the sum of preliminary
monthly data (January-December) are allocated Annum and final monthly data are from the annual Formproportionally to the months to create final FPC-14, "Annual Report for Importers and Exporters ofmonthly data. Natural Gas," which requires data to be reported by
month for the calendar year.3. Extraction Loss: Extraction loss is the reduction
in volume of natural gas resulting from the removal of Preliminary monthly data are EIA estimates. For a dis-natural gas liquid constituents at natural gas processing cussion of estimation procedures, see the EIA NGM.plants. Preliminary data are revised after the publication of the
EIA U.S. Imports and Exports of Natural Gas.
Annual data for extraction loss are from the EIA NGA,where they are estimated on the basis of the type and 6. Consumption: Consumption includes pipeline fuelquantity of liquid products extracted from the gas stream use, lease and plant fuel use, and deliveries to consum-and the calculated volume of such products at standard ing sectors.conditions. For a detailed explanation of the calcula-
tions used to derive estimated extraction losses, see the Final data are from the EIA NGA. Monthly data areEIA NGA. considered preliminary until after publication of the EIA
NGA. For more detailed information on the methods of
Preliminary monthly data are estimated on the basis of estimating preliminary and final monthly data, see theextraction loss as an annual percentage of marketed EIA NGM.production. This percentage is applied to each month'smarketed production to estimate monthly extraction 7. Balancing Item: The balancing item for natural gasloss. represents the difference between the sum of the corn-
80 EnergyInformationAdministration/MonthlyEnecgyReviewDecember1993
ponents of natural gas supply and the sum of com- 8. Natural Gas Storage: Gas in storage at the end ofponents of natural gas disposition. The differences may a reporting period may not equal the quantity derivedbe due to quantifies lost or to the effects of data report- by adding or subtracting net injections or withdrawalsing problems. Reporting problems include differences from the quantity in storage at the end of the previousdue to the net result of conversions of flow data metered period. The difference is due to changes in the quantityat varying temperature and pressure bases and converted of native gas included in the base gas and/or losses into a standard temperature and pressure base; the effect base gas due to migration from storage reservoirs.of variations in company accounting and billing prac-tices; differences between billing cycle and calendar
period time frames; and imbalances resulting from the Monthly underground storage data are collected frommerger of data reporting systems which vary in scope, the Forms FERC-8 (interstate data) and EIA-191 (intras-formal definitions, and type of respondents, tare data). Beginning in January 1991, all data are
collected on the revised Form EIA-191. Injection andwithdrawal data from the FERC-8/EIA-191 survey are
The increase of 0.2 trillion cubic feet (Tcf) in the adjusted to correspond to data from Form EIA-176 fol-"Balancing Item" category in 1983, followed by a lowing publication of the EIA NGA.decline of 0.5 Tcf in 1984, reflected unusually largedifferences resulting from the use of the annual billingcycle (essentially December 15 through the followingDecember 14) consumption data in conjunction with The final monthly and annual storage and withdrawalcalendar year supply data. Record cold temperatures data for 1980-1989 include both underground and li-during the last half of December 1983 resulted in a queried natural gas (LNG) storage. Annual data onreported 0.3 Tcf increase in net withdrawals from LNG additions and withdrawals are from Form EIA-underground storage for peak shaving as compared with 176. Monthly data are estimated by computing the ratiothe same period in 1982, but the effect of this cold of each month's underground storage additions andweather was reflected primarily in 1984 consumption withdrawals to annual underground storage additionsdata. For underground storage data, see Table F2 in the and withdrawals and applying the ratio to the annualMay 1985 NGM, which was published in July 1985. LNG data.
Energy InformationAclminlstraUon4&on_lyEnergyReviewDecember1993 81
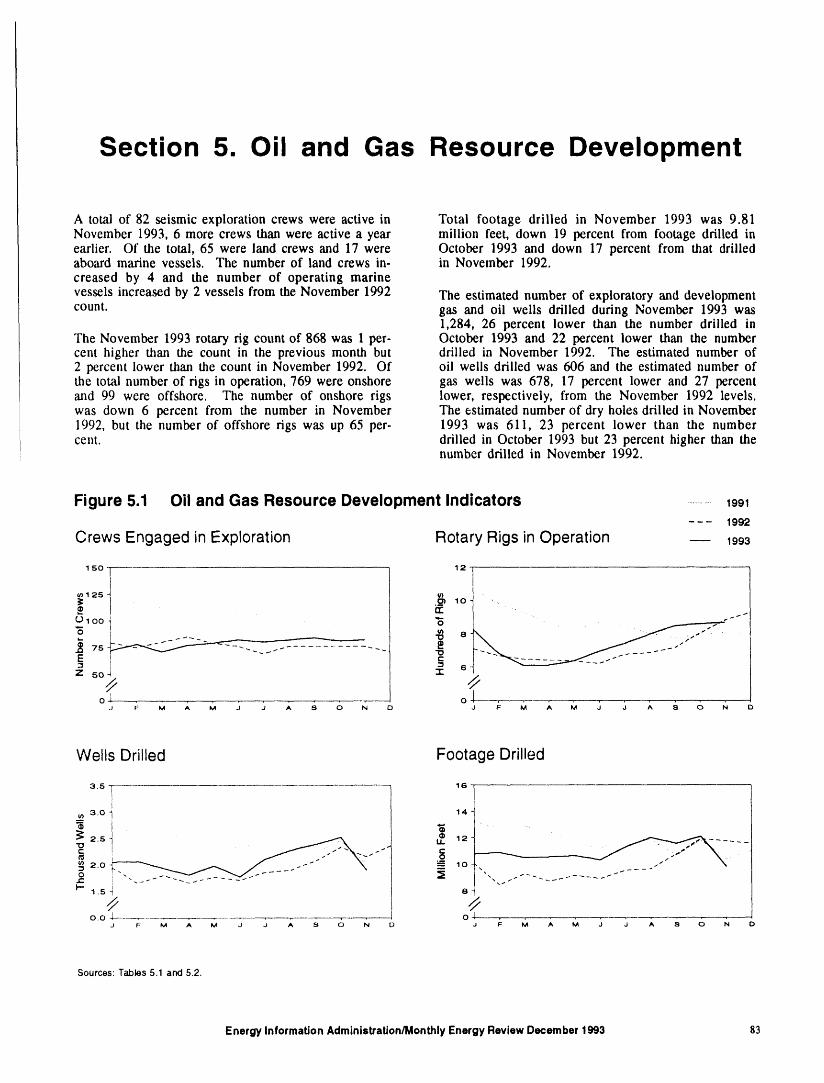
Section 5. Oil and Gas Resource Development
A total of 82 seismic exploration crews were active in Total footage drilled in November 1993 was 9.81November 1993, 6 more crews than were active a year million feet, down 19 percent from footage drilled inearlier. Of the total, 65 were land crews and 17 were October 1993 and down 17 percent from that drilledaboard marine vessels. The number of land crews in- in November 1992.creased by 4 and the number of operating marine
vessels increased by 2 vessels from the November 1992 The estimated number of exploratory and developmentcount, gas and oil wells drilled during November 1993 was
1,284, 26 percent lower than the number drilled inThe November 1993 rotary rig count of 868 was 1 per- October 1993 and 22 percent lower than the numbercent higher than the count in the previous month but drilled in November 1992. The estimated number of2 percent lower than the count in November 1992. Of oil wells drilled was 606 and the estimated number ofthe total number of rigs in operation, 769 were onshore gas wells was 678, 17 percent lower and 27 percentand 99 were offshore. The number of onshore rigs lower, respectively, from the November 1992 levels.was down 6 percent from the number in November The estimated number of dry holes drilled in November1992, but the number of offshore rigs was up 65 per- 1993 was 611, 23 percent lower than the numbercent. drilled in October 1993 but 23 percent higher than the
number drilled in November 1992.
Figure 5.1 Oil and Gas Resource Development Indicators ............1991- - - 1992
Crews Engaged in Exploration Rotary Rigs in Operation -- 199a
1
¢n125 -_¢ I ._m 1o ....
' "0 8
E I "t 6
Z SO4 "I"
o*_ ol
Wells Drilled Footage Drilled
3.5 _ 16
3.0 -_ 14
_'_ 10
l'' ! _. _ _ _._ _ _ -_ _ _ x _._"'_ _ _ _
I'- 1.5 _ 8
// //o.o j o _ . .
J F- M A M J J A S O N O J F M A M J J A S 0 N D
Sources:Tables5,1 and 5.2.
Energy Information Administration/Monthly Energy Review December 1993 83
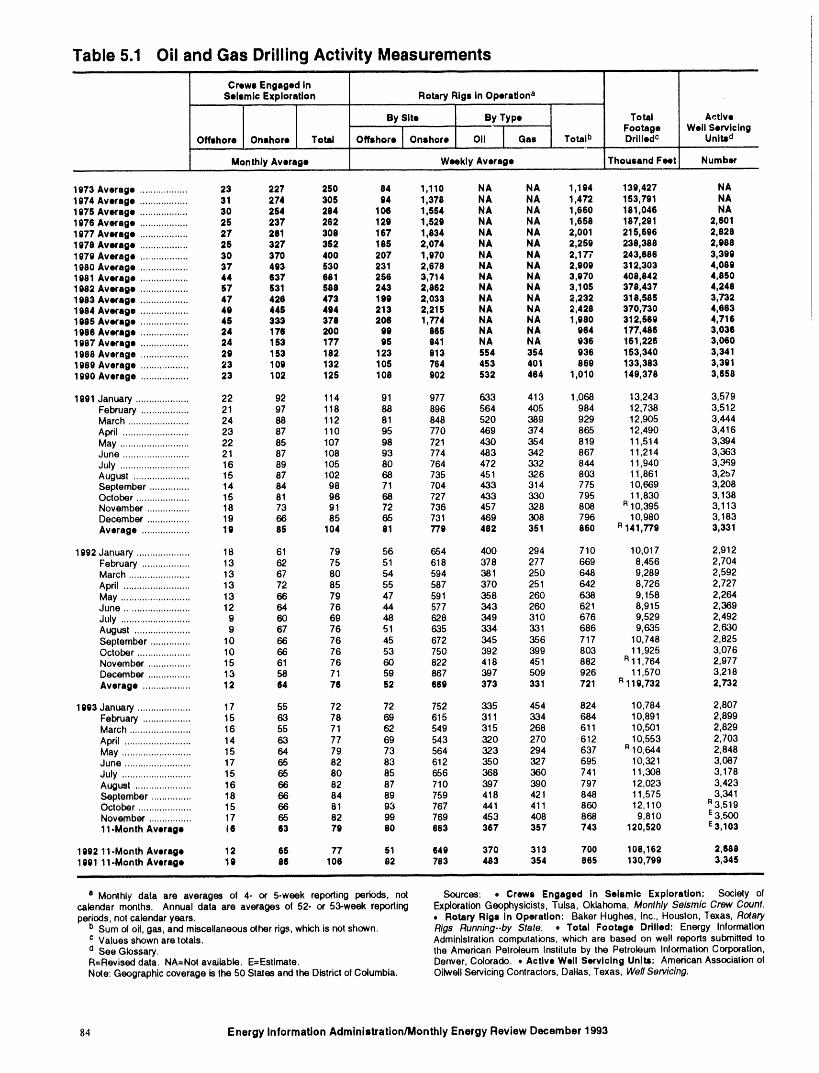
Table 5.1 Oil and Gas Drilling Activity Measurements
Crews Engaged InSeismic Exploration Rotary Rigs in Operationa
........
By Site By Type Total Active
.... I 1 Footage We, ServiclngOffshore Onshore Total Offshore Onshore OII Gas Total b DrilledC Unltad,,,
Monthly Average Weekly Average Thousand Feet Number ....
1973 Average .................. 23 227 250 84 1,110 NA NA 1,194 139,427 NA1974 Average .................. 31 274 306 64 1,378 NA NA 1,472 153,791 NA1975 Average .................. 30 254 284 106 1,554 NA NA 1,660 161,046 NA1976 Average .................. 26 237 262 129 1,529 NA NA 1,659 187,291 2,6011977 Average .................. 27 261 306 167 1,934 NA NA 2,001 215,696 2,6281978 Average .................. 26 327 362 185 2,074 NA NA 2,259 238 388 2,9881979 Average .................. 30 370 400 207 1,970 NA NA 2,177 243 686 3,3991980 Average .................. 37 493 530 231 2,679 NA NA 2,909 312 303 4,0891981 Average .................. 44 637 681 256 3,714 NA NA 3,970 409 842 4,8501982 Average .................. 67 631 588 243 2,862 NA NA 3,105 376 437 4,2481983 Average .................. 47 426 473 199 2,033 NA NA 2,232 318 585 3,7321984 Average .................. 4g 446 494 213 2,215 NA NA 2,428 370 730 4,663 i1985 Average .................. 45 333 378 206 1,774 NA NA 1,980 312 569 4,7161966 Average .................. 24 176 200 99 965 NA NA 964 177 486 3,0361987 Average .................. 24 153 177 95 841 NA NA 936 161 226 3,0601988 Average .................. 29 153 182 123 813 554 354 936 153 340 3,3411989 Average .................. 23 109 132 105 764 453 401 869 133 383 3,3911990 Average .................. 23 102 125 108 902 532 464 1,010 149 378 3,658
1991 January .................... 22 92 114 91 977 633 413 1,068 13,243 3,579February .................. 21 97 118 88 896 564 405 984 12,738 3,512March ....................... 24 88 112 81 848 520 389 929 12,905 3,444April ......................... 23 87 110 95 770 469 374 865 12,490 3,416May .......................... 22 85 107 98 721 430 354 819 11,514 3,394June ......................... 21 87 108 93 774 483 342 867 11,214 3,363July .......................... 16 89 105 80 764 472 3,32 844 11,940 3,369August ..................... 15 87 102 68 735 451 326 803 11,861 3,267September ............... 14 84 98 71 704 433 314 775 10,669 3,208October .................... 15 81 96 68 727 433 330 795 11,830 3,138November ................ 18 73 91 72 736 457 328 808 R10,395 3,113December ................ 19 66 85 65 731 469 308 796 10,980 3,183Average .................. 19 85 104 61 779 482 351 960 R141,779 3,331
1992 January .................... 18 61 79 56 654 400 294 710 10,017 2,912February .................. 13 62 75 51 618 378 277 669 8,456 2,704March ....................... 13 67 80 54 594 38 1 250 646 9,289 2,592April ......................... 13 72 85 55 587 370 251 642 8,726 2,727May .......................... 13 66 79 47 591 358 260 638 9,158 2,264June ........................ 12 64 76 44 577 343 260 621 8,915 2,369July .......................... 9 60 69 46 628 349 310 676 9,529 2,492August ..................... 9 67 76 51 635 334 331 686 9,635 2,630September ............... 10 66 76 45 672 345 356 717 10,748 2,825October .................... 10 66 76 53 750 392 399 803 11,925 3,076November ................ 15 61 76 60 822 418 451 882 R11,764 2,977December ................ 13 58 71 59 867 397 509 926 11,570 3,218Average .................. 12 64 76 62 669 373 331 721 R119,732 2,732
1993 January .................... 17 55 72 72 752 335 454 824 10,784 2,807February .................. 15 63 78 69 615 311 334 684 10,891 2,899March ....................... 16 55 71 62 549 315 268 611 10,501 2,829April ......................... 14 63 77 69 543 320 270 612 10,553 2,703May .......................... 15 64 79 73 564 323 294 637 R10.644 2,848June ......................... 17 65 82 83 612 350 327 695 10,321 3,087July .......................... 15 65 80 85 656 368 360 741 11,308 3,178August ..................... 16 65 82 87 710 397 390 797 12,023 3,423September ............... 18 66 84 89 759 418 421 848 11,575 3,341October .................... 15 66 81 93 767 441 411 860 12,110 R3,519November ................ 17 65 82 99 769 453 408 868 9,810 E3,50011-Month Average i 6 63 79 80 663 367 357 743 120,520 E3,103
1992 11-Month Average 12 65 77 51 649 370 313 700 108,162 2,6881991 11-Month Average 19 66 106 82 783 483 354 865 130,799 3,345
a Monthly data are averages ol 4- or 5-weak reporting periods, not Sources: • Crews Engaged In Seismic Exploration: Sociely ofcalendar months. Annual data are averages of 52- or 53-week reporting Exploration Geophysicists, Tulsa, Oklahoma, Monthly Seismic Crew Count.periods, not calendar years. • Rotary Rigs In Operation: Baker Hughes, Inc., Houston, Texas, Rotary
b Sum ol oil, gas, and miscellaneous other rigs, which is not shown. Rigs Running--by State. _, Total Footage Drilled: Energy Inlormationc Values shown are totals. Administration computations, which are based on well reports submitted to¢1See Glossary. the American Petroleum Institute by Ihe Petroleum Inlormation Corporation,R=Revised data. NA=NoI available. E=Estimete. Denver, Colorado. • Active Well Servlcing Unlta: American Association olNote: Geographic coverage is the 50 States and the District ofColumbia. Oilweil Servicing Contractors, Dallas, Texas, Well Servicing.
84 Energy Information Administration/Monthly Energy Review December 1993
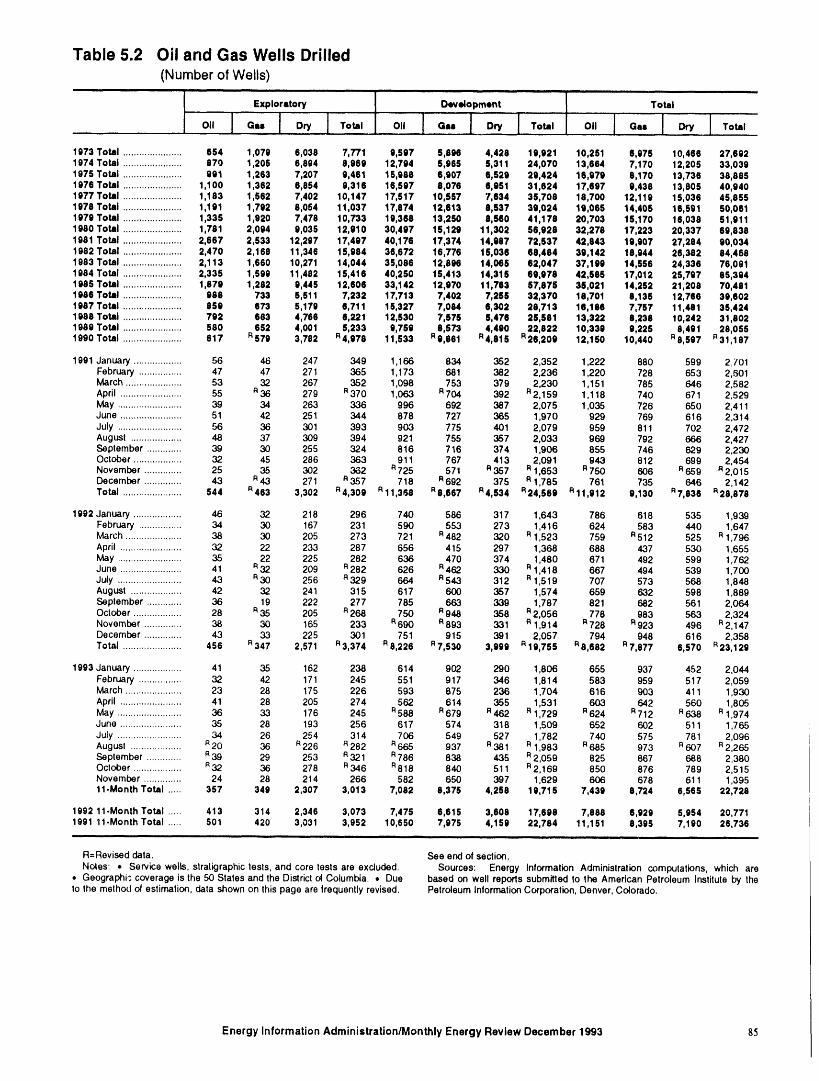
Table 5.2 Oil and Gas Wells Drilled(Number of Wells)
Exploratory ! Development Total
Oil I G" I Dry I T°tal [ Oil ! G,, ,l Dry 1 Total OII J O,, I DRY,'" ! Total
1973 Total ...................... 664 1,079 6,038 7,771 9,697 5,696 4,428 19,921 10,251 6,976 10,466 27,6921974 Total ...................... 870 1,205 6,894 8,969 12,794 5,965 5,311 24,070 13,664 7,170 12,205 33,0391975 Total ...................... 991 1,263 7,207 9,461 15,988 6,907 5,529 29,424 16,979 8,170 13,736 38,8861976 Total ...................... 1,1O0 1,362 6,854 9,316 16,597 8,076 6,961 31,624 17,697 9,438 13,805 40,9401977 Total ...................... 1,183 1,562 7,402 10,147 17,517 10,557 7,634 35,708 18,700 12,119 15,036 46,8651978 Total ...................... 1,191 1,792 8,054 11,037 17,874 12,613 8,537 39,024 19,065 14,405 16,591 50,0611979 Total ...................... 1,335 1,920 7,478 10,733 19,368 13,250 8,560 41,178 20,703 15,170 16,038 51,9111980 Total ...................... 1,781 2,094 9,035 12,910 30,497 15,129 11,302 56,928 32,278 17,223 20,337 69,8381981 Total ...................... 2,667 2,533 12,297 17,497 40,176 17,374 14,987 72,537 42,843 19,907 27,284 90,0341982 Total ...................... 2,470 2,168 11,346 15,984 36,672 16,776 15,036 68,484 39,142 18,944 26,382 84,4681983 Total ...................... 2,113 1,660 10,271 14,044 35,086 12,896 14,065 62,047 37,199 14,556 24,336 76,0911984 Total ...................... 2,335 1,699 11,482 15,416 40,250 15,413 14,315 69,978 42,585 17,012 25,797 85,3941985 Total ...................... 1,879 1,282 9,446 12,608 33,142 12,970 11,753 57,878 38,021 14,252 21,208 70,4611986 Total ...................... 988 733 5,611 7,232 17,713 7,402 7,256 32,370 16,701 8,135 12,766 39,6021987 Total ...................... 959 673 5,179 8,711 18,327 7,084 6,302 26,713 16,186 7,787 11,481 35,4241988 Total ...................... 792 663 4,766 6,221 12,530 7,575 8,476 25,581 13,322 8,238 10,242 31,6021989 Total ...................... 560 652 4,001 5,233 9,759 8,573 4,490 22,822 10,339 9,225 8,491 26,0551990 Total ...................... 617 9579 3,782 94,978 11,533 R9,861 94,815 R26,209 12,150 10,440 98,697 931,187
1991 January .................. 56 46 247 349 1,166 834 352 2,352 1,222 880 599 2,701February ................ 47 47 271 365 1,173 681 382 2,236 1,220 728 653 2,501March ..................... 53 32 267 352 1,098 753 379 2,230 1,151 785 646 2,582April ....................... 55 9 38 279 R370 1,063 R704 392 R2,159 1,118 740 671 2,529May ........................ 39 34 263 336 996 692 387 2,075 1,035 726 650 2,411June ....................... 51 42 251 344 878 727 365 1,970 929 769 616 2,314July ........................ 56 36 301 393 903 775 401 2,079 959 811 702 2,472August ................... 48 37 309 394 921 755 357 2,033 969 792 666 2,427September ............. 39 30 255 324 816 716 374 1,906 855 746 629 2,230October .................. 32 45 286 363 911 767 413 2,091 943 812 699 2,454November .............. 25 35 302 362 9 725 571 R357 R1,653 R750 606 9 659 9 2,015December .............. 43 943 271 9357 718 9692 375 R1,785 761 735 646 2,142Total ...................... 544 9463 3,302 94,309 911,358 96,667 94,634 924,569 911,912 9,130 97,836 926,678
1992 January .................. 46 32 218 296 740 586 317 1,643 786 618 535 1,939February ................ 34 30 167 231 590 553 273 1,416 624 583 440 1,647March ..................... 38 30 205 273 721 R482 320 R1,523 759 9 512 525 R1,796April ....................... 32 22 233 287 656 415 297 1,368 688 437 530 1,655May ........................ 35 22 225 282 636 470 374 1,480 671 492 599 1,762June ....................... 41 9 32 209 R282 626 R462 330 R1,418 667 494 539 1,700July ........................ 43 930 256 9329 664 9543 312 R1,519 707 573 568 1,848August ................... 42 32 241 315 617 600 357 1,574 659 632 598 1,889September ............. 36 19 222 277 785 663 339 1,787 821 682 561 2,064October .................. 28 R35 205 R268 750 R948 358 R2,056 778 983 563 2,324November .............. 38 30 165 233 9690 9893 331 9 1,914 9728 9923 496 R2,147December .............. 43 33 225 301 751 915 391 2,057 794 948 616 2,358Total ...................... 456 9347 2,571 93,374 98,226 R7,530 3,999 919,755 98,682 97,877 6,570 923,129
1993 January .................. 41 35 162 238 614 902 290 1,806 655 937 452 2,044February ................ 32 42 171 245 551 917 346 1,814 583 959 517 2,059March ..................... 23 28 175 226 593 875 236 1,704 616 903 411 1,930April ....................... 41 28 205 274 562 614 355 1,531 603 642 560 1,805May ........................ 36 33 176 245 9588 R679 9462 R1,729 R624 9712 9638 R1,974June ....................... 35 28 193 256 617 574 318 1,509 652 602 511 1,765July ........................ 34 26 254 314 706 549 527 1,782 740 575 781 2,096August ................... R20 36 R226 R282 R665 937 R381 R1,983 R685 973 R607 R2,265Seplember ............. _ 39 29 253 R32 1 R786 838 435 9 2,059 825 867 688 2,380October .................. R32 36 278 R346 R818 840 511 R2,169 850 876 789 2,515November .............. 24 28 214 266 582 650 397 1,629 606 678 611 1,39511-Month Total ..... 357 349 2,307 3,013 7,062 6,375 4,256 19,715 7,439 6,724 6,565 22,726
1992 11-Month Total ..... 413 314 2,346 3,073 7,475 6,615 3,608 17,698 7,888 6,929 5,954 20,7711991 11-Month Total ..... 501 420 3,031 3,952 10,850 7,975 4,158 22,784 11,151 8,395 7,190 26,736
R=Revised data. See end of section.
No_es: • Service wells, stratigraphic tests, and core tests are excluded. Sources: Energy Information Administration computations, which are• Geographi.: coverage is the 50 States and the District of Columbia. • Due based on well reports submitted to the American Petroleum Institute by theIo the method of estimation, data shown on Ihis page are frequenlly revised. Petroleum Intormation Corporation, Denver, Colorado.
Energy Information Administration/Monthly Energy Review December 1993 85
Oil and Gas Resource During 1982, for ex;unple, as-reported well completionsrose, while the number of actual completions fell. Con-
Development Notes sequently, the drilling statistics published since theMarch 1985 MER are Energy Infonnation Administra-
Three well types are considered in the Monthly Energy tion-generated (EIA) estimates produced by statisticallyReview (MER) drilling statistics: "completed for oil," imputing well counts and footage based on the partial"completed for gas," and "dry hole." Wells that produc- data available from the API.tively encounter both crude oil and natural gas are
categorized as "completed for oil." Both development Estimates for a given month are first published in thewells and exploratory wells (new field wildcats, new MER for that month. Revisions of the "oil," "gas," andpool tests, and extension tests) are included in the statis- "dry" components are made in the 6th, 12th, and 24thtics. All other classes of wells drilled in connection subsequent months, as liewly reported data allow refine-with the search for producible hydrocarbons are ex- ment of the estimates. Unscheduled revisions may alsoeluded, occur when the late't estimate differs by more than 15
percent during the first 5 months, more than 10 percentPrior to the March 1985 MER, drilling statistics con- during the next 6 months, or more daan 2 percent there-sisted of completion data for the above types and classes after through 5 years. After 5 years, the reported APIof wells as reported to the American Petroleum Institute data are published in lieu of EIA-generated estimates.(API) during a given month. Due to time lags between Additional information about the EIA estimationthe date of well completion and the date of completion methodology may be found in "Estimating Well Com-reporting to the API, as-reported well completions pletions," the feature article published in the Marchproved to be an inaccurate indicator of drilling activity. 1985 MER.
86 EnergyInformationAdministration/MonthlyEnergyReviewDecember1993
Section 6. Coal
Coal production in October 1993 totaled 82 million Coal exports in September 1993 totaled 6 million shortshort tons, 6 percent6 lower than coal production in tons, 34 percent lower than exports in September 1992.October 1992. Exports for the first 9 months of 1993 totaled 57 mil-
lion short tons, 27 percent less than during the
Electric utility coal consumption in September 1993 comparable period of 1992.totaled 67 million short tons, 1 percent higher than theconsumption level in September 1992. Coal consump-tion at utility plants during the first 9 months of 1993totaled 612 million short tons, compared to 585 million Coal imports in September 1993 totaled 753 thousandshort tons in the comparable period of 1992. short tons, 430 thousand short tons higher than imports
in September 1992. Coal imports during the fast 9
Electric utility coal stocks were 113 million short tons months of 1993 totaled 4 million short tons, 71 percentat the end of September 1993, down from 153 million higher than coal imports during the comparable periodshort tons at the end of September 1992. of 1992.
ePercen_agechanges are based on unfounded data.
EnergyInformationAdminis_ralJonJMonthlyEnergyReviewDecember1993 87
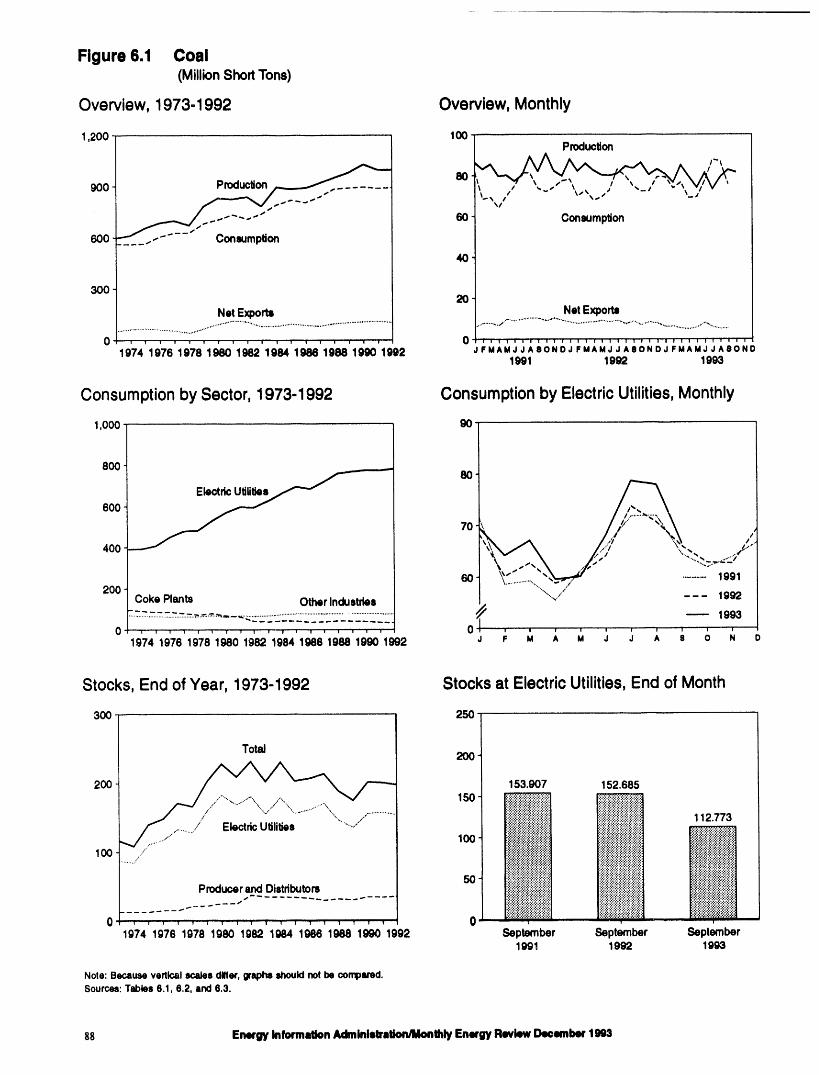
Figure 6.1 Coal(MillionShortTons)
Overview, 1973-1992 Overview, Monthly
1,200 I00 | Productioni
i'-_
900 Production 80 ...
s_ _'_ _' _/
_¢m"" ---. --" 60 Consumption6O0
4O
3O02O
Net Exports NetExports............................................................. •................. . .............................................................. " .................
1 _ ! 1 ! '! i' 1 ! ! ! ! ! ! I i' 0 ! ! ! ! ! ! i i i i ! i I ! ! ! i ! i ! ! ! ! ! ! i I'! ! ! ! i i 1
1974 1976 1978 1980 1982 1984 1986 1988 1_10 1992 J FMAMJJ A8ONDJ FMAMJ J AeON DJ FMAMJJ ASOND1991 1992 1993
Consumption by Sector, 1973-1992 Consumption by Electric Utilities, Monthly
1,000 9O
8O08O
600 I ,"
I ..... '_'_.\.\
400 ..';' _'
200 Coke Rants OtherIndustries I. "_,,...... 1992J I
•.:...-.._:..-...-.-..-.....-....-................_..................................................................................._ _ 1993 II I
T w ! ! ! ! w ! ! ! i i l w ! ! v 0 ! I ! I I I '1 I I II
1976 1978 1980 1982 1984 1988 1988 1990 1992 J F M A M J J A S O N 0974
Stocks, End of Year, 1973-1992 Stocksat ElectricUtilities,End of Month
300 250 t
To_ 200
200 153.907 152.685
.......... ,...,.......................,,.., ,................ ::!iiii::i!iii!_i!iiiiiiiii!i::!i!i!!!!!i!!!i!!ii!i!!!i!!!!! 112.773
100 ..... :::::::::::::::::::::::::::::
so iii!iiiii!iii!iiiiiiiii?iiiProducerand Distributors-- ........ iiiiiii!i!i!iiii!il;iiii!ill,s
0 , , ............., , _ 0 , ;..............;.......... -1974 1976 1978 1980 1982 1984 1986 1988 1990 1992 September September September
1991 1992 1993
Note:Becausevertical_.,alesdllf_, graphsshouldnotbe compared.Source_:Tables6.1, 8.2, and6.3.
88 Energy InformadtionAdmlnletxation/Monthly Energy Review December 1993
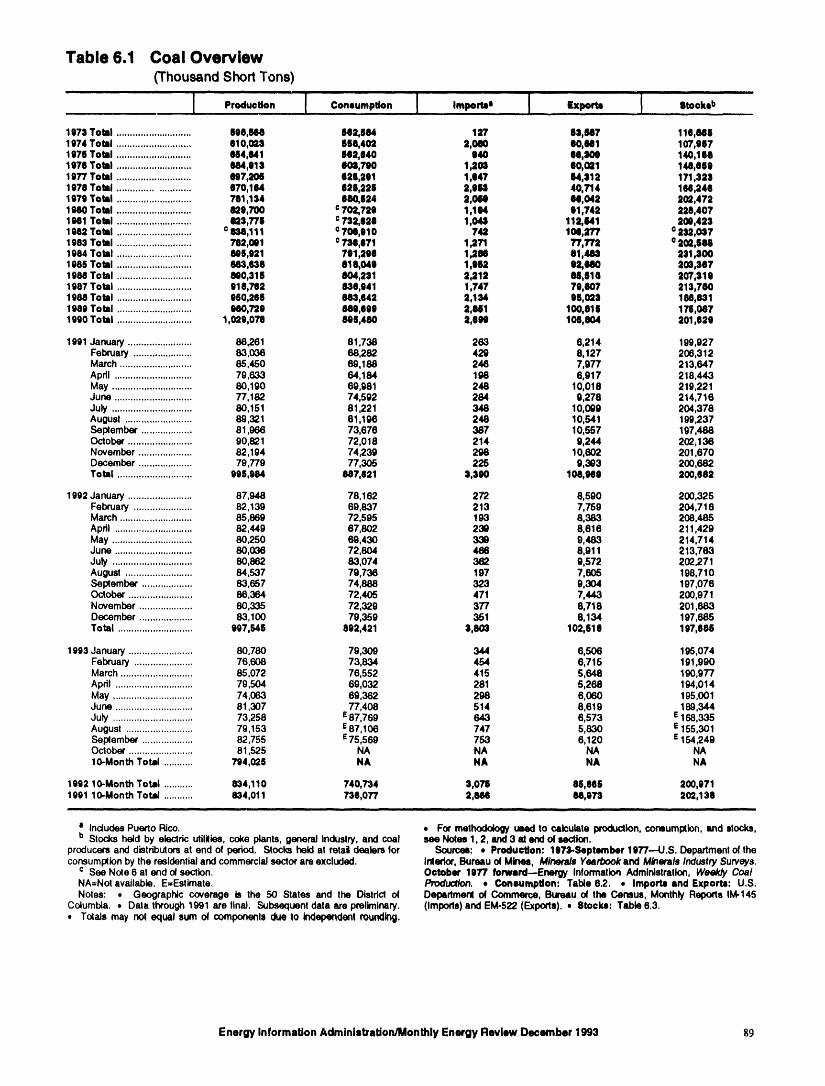
Table 6.1 Coal Overvlew(Thousand Short Tons)
i i iii i ii iiii iiiii ii i I I iilBiii fllRIIB L uBIIIII I I I
1073 Total ............................ 606,6(18 882,664 12"/ 61,607 110,0401974 Total ............................ 0i0,028 666,402 2,040 00,041 107,0671976 Total ............................ 064,941 1t2,040 040 ll,lO6 140,1601076 Total ............................ 684,013 804,760 1,201 80,0_1 19,0101077 Total ............................ 807,204 026,201 1,147 64,112 171,3931078 Total .......................... 070,104 0:16,221 2,01;,II 40,714 i64,2481070 Total ............................ 761 134 680,624 2,048 06,042 202,4721040 Total ............................ 020,700 ¢ 702,720 1,194 81,74:1 228,4071081 Total ............................ m3 771 o7"42,028 1,0441 112,M1 202,4231982 Tokl ............................ o_ 111 ¢ 704,010 7U 100,27'7' o232,0S71963 Total ............................ 762 001 o766,071 1,271 77,1"I2 ©202,6681084 Total ............................ 896 021 701,208 1,280 81,4841 231,$0019elsTotal ............................ 883 636 616,040 1,682 02,980 202,3871960 Total ............................ 800 316 804,231 2,212 66,616 207,3161967 Total ............................ 016 762 830,941 1,747 70,607 213,7001988 Total ............................ 960 206 083,642 2,134 06,02tl 108,8311980 Total ............................ 060 720 8410,009 2,H1 100,616 176,0471990 Total ............................ 1,020,076 806,460 2,009 104,804 201,620
1901 January ........................ 86,261 81,738 283 6,214 199,927February ...................... 83,036 68,282 429 8,127 206,312March ........................... 85,450 69,188 246 7,977 213,647Apdl ............................. 79,633 64,184 198 6,917 218,443May .............................. 80,190 69,981 248 I0,018 219,221June ............................. 77,182 74,502 284 0,278 214,716July .............................. 80,151 81,221 348 10,009 204,378August ......................... 89,321 81,196 246 10,541 199,237Sap(ambar ................... 81,966 73,676 387 10,557 197,488October ........................ 90,821 72,018 214 9,244 202,136November .................... 62,194 74,239 298 10,802 201,670December .................... 79,779 77,305 225 9,303 200,682Total ............................ 996,984 887,621 _1,300 108,040 200,66"1
1992 January ........................ 87,948 78 162 272 8,590 200,325February ...................... 82,139 69 837 213 7,759 204,716March ........................... 85,869 72 595 193 8,383 208,485Apdl ............................. 82,449 67 802 230 8,616 211,429May .............................. 80,250 69 430 330 9,483 214,714June ............................. 80,036 72 804 488 8,911 213,783July .............................. 80,882 83 074 382 9,572 202,271August ......................... 84,537 7g 736 197 7,605 198,710Sel_ember ................... 83,657 74 888 323 9,304 197,076October ........................ 86,364 72 405 471 7,443 200,971November .................... 80,335 72 329 377 8,718 201,883December .................... 83,100 79 359 351 8,134 197,885Total ............................ 997,846 892 421 3,803 102,616 197,686
1993 January ........................ 8(3780 79,309 344 6,506 195,074February ...................... 76 608 73,834 454 6,715 191,990March ........................... 85 072 76,552 415 5,648 190,977Apnl ............................. 79 504 69,032 281 5,268 194,014May .............................. 74 063 69,362 298 6,080 195,001June ............................. 81 307 77,408 514 8,619 189,344July .............................. 73 258 e87,769 643 6,573 e 168,335August ......................... 79 153 e87,106 747 5,830 E155,301Sel:Xember................... 82 755 e75,569 753 6,120 E154,249October ........................ 81 525 NA NA NA NA10-Month Total ........... 794026 NA NA NA NA
1902 10-Month Total ........... 834,110 740,734 3,076 66,606 200,9711901 10-Month Total ........... 834,011 736,077 2,666 86,973 202,136
i , nl i i ..i .,H i ill i i H liH i .,,.q llnl i .HI nH
• IncludesPuerto Rico. * For methodofogy used to cak:u_te production,consumption, and stocks,b Stocks held by electric utililles, coke plants, general induslry,and coal see Notes 1,2, and3 at end of section.
producersand distributorsat end o( period. Stocks held at retail dealers for Sources: • Production: 1976-Septomber 1077---U.S. Departmentof theconsumptionbythe residentialand commercial sector are excluded. Inledor, Bureauof Mines, Minerals Yearbook and Minerals Industry Sun/eys.
c See Note 6 at end of section. October 1077 forw_,rd--Energy Information Administration, Week/y CoalNA=NoI available. E=Esttmate. Produc_on. • Consumption: TaMe 6.2. • Imports and Exports: U.S.Noles: • Geographic coverage is the 50 States and the District of Depertmenl of Commerce, Bureau o( the Census, Monthly Reports IM-145
Columbia. • Data through 1991 are final. Subsequent data are preliminary. (Imports) and EM-522 (Exports). , 8toclus: Table 6.3.• To(als may not equal sum of componentsdue to independent rounding.
Energy InformaUon Adminletrationd_Aonthly Energy Review December 1993 89
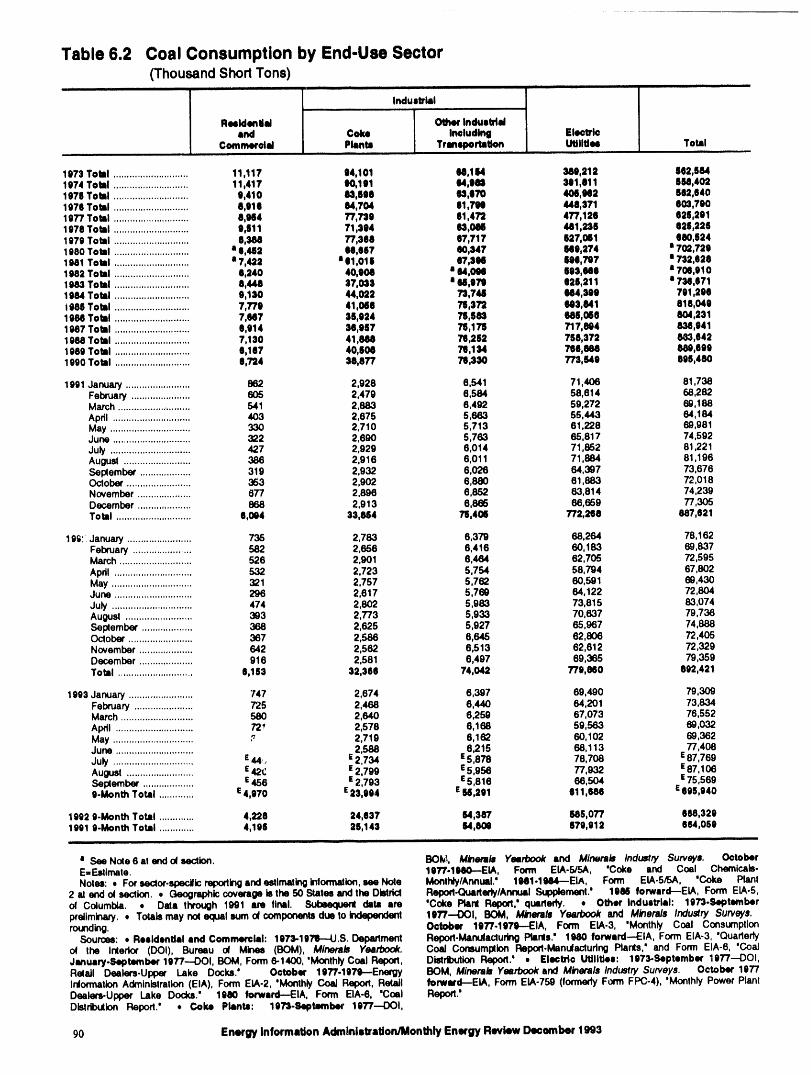
Table 6.2 Coal Consumption by End-Use Sector(ThousandShortTons)
r i i lllll i i i, ,, ,, , ,..... i i i ii i i
Indulllrltl
Reoldenllal Other Induetrllland Coke Inoludlng Ele¢lDrlc
C_mmeroiel Plants Tranq_rtotkm Utilities Total
1973 Toil ............................ 11,117 94,101 68,114 3_l,212 662,6641074 Toll ............................ 11,417 I)0,191 14,88t 3e1,811 6M,4021976 Toll ............................ 9,410 U,918 _1,870 408,N2 982,9401976 Toil ............................ 6,919 84,704 91,7tNt 448,371 602,7301977 Total ............................ 6,N4 77,739 91,472 477,126 926,2911978 Toil ............................ 9,911 71,394 (I3,0M 481,231 928,2281979 Toll ............................ 8,384 77,398 97,717 527,081 980 6241980 Total ............................ • 8,_2 89,867 e0,347 INi9,274 • 702 7291981 Toll ............................ n7,422 a 91,019 97,$INl lee 71)7 • 732 0281982 Toll ............................ 8,240 40,col • 64,0N SO3 688 • 708 9101983 Toll ............................ 8,448 :17,095 • 98,973 926 211 • 736 9711984 Toil ............................ 9,130 44,022 73,748 lied 399 791 298i986 Toll ............................ 7,779 41,068 79,272 (14)3841 818 {)die1_ Toll ............................ 7,987 36,924 73,883 886,08(i 804 2311687 Toll ............................ 9,914 38,967 76,17S 717 894 834104i1988 Toil ............................ 7,130 41,1188 78,292 738 372 883 8421680 Total ............................ 9,187 40,80e 711,134 7el 8M m 6801990 Total ............................ 0,7_4 18,877 79,330 772 549 806 480
1991 January ........................ 862 2,928 6,541 71 406 81 738February ...................... 605 2,479 6,584 58 614 68 282March ............................ 541 2,883 8,492 59 272 60 188Apdl ............................. 403 2,675 5,663 55 443 64 184May .............................. 330 2,710 5,713 81 228 69 981June ............................. 322 2,690 5,763 65 817 74 592July .............................. 427 2,929 8,014 71 652 81 221August ......................... 386 2,916 6,011 71 884 81 196September ................... 319 2,932 6,026 64 397 73 676October ........................ 353 2,902 6,880 61 883 72 018November .................... 677 2,896 8,852 63 814 74 239December .................... 868 2,913 6,866 66 659 77 305Total ............................ 6,094 33,884 76,401 772,268 887 621
199:. January ........................ 735 2,783 8,379 68,264 78 162February ..................... 582 2,656 6,416 60,183 69 837March ........................... 526 2,901 6,484 62,705 72,595Apdl ............................. 532 2,723 5,754 58 794 67 802May .............................. 321 2,757 5,762 60 591 69 430June ............................. 296 2,617 5,760 64 122 72 804July .............................. 474 2,802 5,963 73 815 83 074August ......................... 393 2,773 5,933 70 637 79 736September ................... 368 2,625 5,927 65 967 74 888October ........................ 367 2,586 6,645 62 806 72 405November .................... 642 2,562 6,513 62 812 72 329December .................... 916 2,581 6,497 69 365 79 359Total ............................ $,153 32,369 74,042 779 (160 892 421
1993 January ........................ 747 2,674 6,397 69 490 79,309February ...................... 7'25 2,468 6,440 64 201 73,834March ........................... 580 2,640 6,259 67 073 76,552April ............................. 72_ 2,578 8,168 59 563 69,032May .............................. ,_ 2,719 8,162 60 102 69,382June ............................. 2,588 8,215 68 113 77,408July .............................. E44, E2,734 S5,878 78 708 Z87,769August ......................... S42_: z 2,799 E5,956 77 932 E87,108September ................... E456 s 2,793 s5,816 66 504 E75,5699-Month Total ............. S4,970 S23,994 SM,291 911 6845 E695,940
1992 e.Month Total ............. 4,228 24,937 M,387 585,077 968,3291901 9.Month Total ............. 4,196 26,143 M,80e $70,912 964,o59
a See Note 8 at end of section. BOk_, Mtnerab Yearbook lind Mlnerab Industry Surveyl. OctoberE=Esttmale. 1077-1980--EIA, Form EtA-5/SA, "Coke and Coal Chemicals-Notes: • Fo_sector-specificreporting&ndestimatinginlon'nation,see Note Monthly/Annual,' 1181.1904--EIA, Form EIA-5_, 'Coke Plant
2 at end of section. • Geographic coverage b the 50 States and the District Refx_l-Quartedy/Annual ,Supplement.' 1968 fotwerd--EIA, Form EIA-5,of Cofumbta. • Dats through 1991 are final. Subeequent datl ire 'Coke Planl Rqx_,' quarterly. • Other IndueVlal: 1073.S4ptamberpreliminary. , Totals may no( equal sum d componentsdue to Ind_l 1977--OOi, BOM, Minerals Yearbook snd Minerals Industry Surveys.rounding. October 1077.1971k--EIA, Form EIA-3, 'Monthly Coal Consumption
Sources: • Residential ind Commemlal: 197_.107tl--4J.S. Depa_ment Report-ManufacludngPinls." 1880 forward--EIA, Form EIA-3, "Quarterlyof the Inledor (DOI), Bureau of Mines (BOM), Minerals Yearbook. Coal Consumption Report.Manulactudng Plants,' and Form EIA-6, 'CoalJanuary.Septomber 1077--DOI, BOM, Form 6-1400, 'Monthly Coal Rep(xl, Distribution Rep(xl.' , Elecbto UtiliUes: 1073-September 1077--DOI,Retail Dealers-Upper Lake Docks.' October 1977.1979---Energy BOM, Minerals Yearbook and Minerals Industry Surveys. October 1977InlormationAdministration(EIA), Form ELA-2, 'Monthly Coal Report, Retail forwerd---ELA, Form EIA-759 (former_ Form FPC-4), 'Monthly Power PlantDealers-Upper Lake Docks.' 1090 forward---EIA, Form EIA-6, 'Coal Report.'Distribution Report.' • Coke Plants: 1973-Septomber 1977--OOI,
90 Energy Information Administration/Monthly Energy Review Deoomber 1993
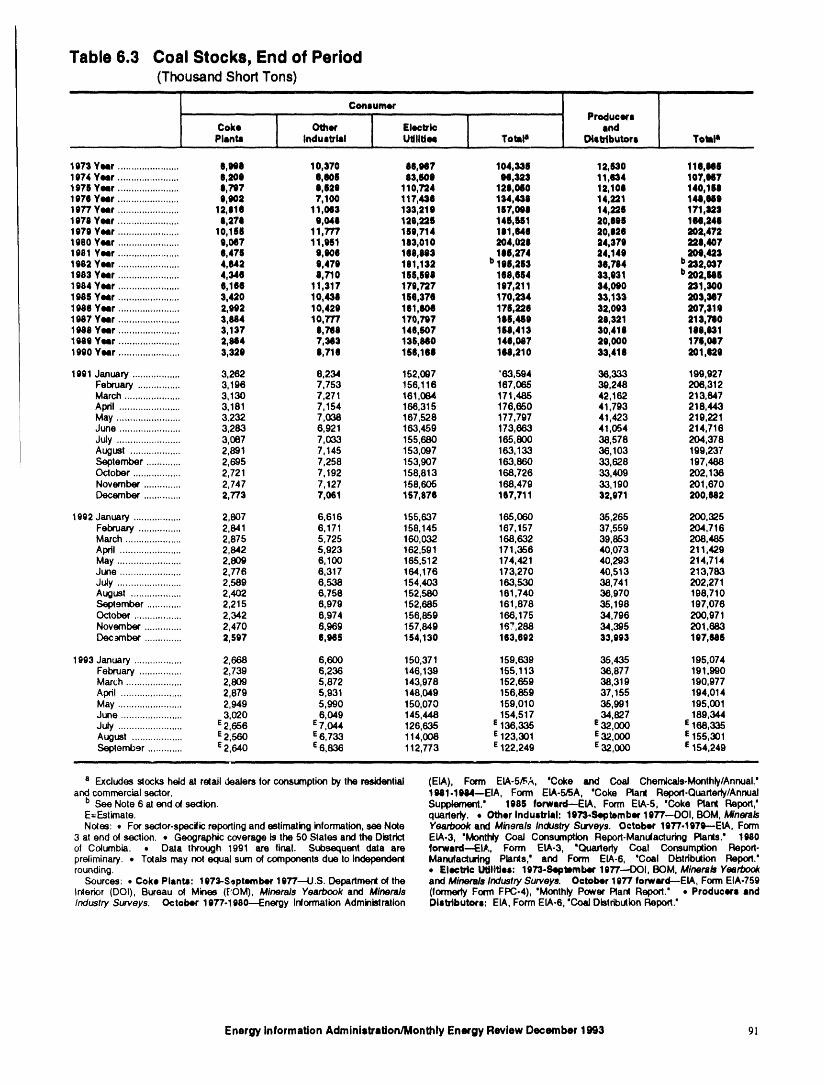
Table 6.3 Coal Stocks, End of Period(Thousand Shod Tons)
II ...................................
Consumer
..........................Coke Other Electric I .... Producersend....... Pli._ IndUStrial ...... Udlltlea ..... Totala DletHb.u.tore ..... Totala
1973 Year ....................... 6,988 10,370 88,u7 104,335 12,830 110,94|1974 Year ....................... 8,209 e,e05 93,600 I)(I,323 11,134 107,9471978 Year ....................... 8,797 1,629 110,794 121,060 12,108 140,1|11OPt Year ....................... 0,002 7,100 117,434 134,438 14,221 lU,9491977 Year ....................... 12,11e 11,063 133,21e 187,091 14,225 171,1211978 Year ....................... 8,271 0,649 128,226 146,$61 20,696 166,2461979 Year ....................... 10,168 11,777 159,714 181,848 20,828 202,4721980 Year ....................... 9,067 11,951 183,010 204,021 24,370 221,4071981 Year ....................... 6,476 9,906 168,945 196,274 24,149 209,4231982 Year ....................... 4,M2 8,479 181,132 b196,253 38,784 b232,0371983 Year ....................... 4,346 8,710 155,598 166,864 33,031 b202,84161984 Year ....................... 6,166 11,317 170,727 107,211 34,090 231,3001986 Year ....................... 3,420 10,436 156,376 170,234 33,133 203,9471988 Year ....................... 2,992 10,429 161,806 175,226 32,093 207,3191987 Year ....................... 3,984 10,777 170,797 166,489 28,321 213,7901988 Year ....................... 3,137 8,788 146,607 168,413 30,418 168,6311989 Year ....................... 2,884 7,343 136,940 14(I,087 29,000 171,0471980 Year ....................... 3,320 6,716 168,166 116,210 33,418 201,929
1991 January .................. 3,262 8,234 152,097 '63,594 36,333 199,927February ................ 3,196 7,753 156,116 167,065 39,248 206,312March ..................... 3,130 7,271 161,064 171,485 42,162 213,647Apdl ....................... 3,181 7,154 166,315 176,650 41,793 218,443May ........................ 3.232 7,038 167,528 177,797 41,423 219,221June ....................... 3,283 6,921 163,459 173,663 41,054 214,716July ........................ 3,067 7,033 155,680 165,800 38,578 204,378August ................... 2,891 7,145 153,097 163,133 36,103 199,237September ............. 2,695 7,258 153,907 163,860 33,628 197,488October .................. 2,721 7,192 158,813 168,726 33,409 202,138November .............. 2,747 7,127 158,605 168,479 33,190 201,670December .............. 2,773 7,061 157,876 187,711 32,971 200,882
1992 January .................. 2,807 6,616 155,637 165 060 35,265 200,325February ................ 2,8.41 6,171 158,145 167 157 37,559 204,716March ..................... 2,875 5,725 160,032 168 632 39,853 208,485April ....................... 2,842 5,923 162,591 171 356 40,073 211,429May ........................ 2,809 6,100 165,512 174 421 40,293 214,714June ....................... 2,776 6,317 164,176 173 270 40,513 213,783July ........................ 2,589 6,538 154,403 163 530 38,741 202,271August ................... 2,402 6,758 152,580 161 740 36,970 198,710September ............. 2,215 6,979 152,685 161 878 35,198 197,076October .................. 2,342 6,974 156,859 166 175 34,796 200,971November .............. 2,470 6,969 157,849 167 288 34,395 201,683Dec acnbet .............. 2,597 8,965 154,130 183 892 33,993 197,685
1993 January .................. 2,668 6,600 150,371 159,639 35,435 195,074February ................ 2,739 6,236 146,139 155,113 36,877 191,990March ..................... 2,809 5,872 143,978 152,659 38,319 190,977April ....................... 2,879 5,931 148,049 156,859 37,155 194,014May ........................ 2,949 5,990 150,070 159,010 35,991 195,001June ....................... 3,020 6,049 145,448 154,517 34,827 189,344July ........................ E2,656 E7,044 126,635 Z136,335 E32,000 E168,335August ................... E2,560 E6,733 114,008 E123,301 E32,000 E155,301Septerrd.,'sr............. E2,640 E6,836 112,773 E122,249 E32,000 E154,249
i i I i i ,,I HH
a Excludess_ocksheld at retail _lealersfor consumptionby the residential (EIA), Form EIA-5/F,_, 'Coke and CoaJ CherrdcaJs.Monthly/Annual.'and commercialsector. 1981.1064--EIA, Form EIA-5/5A, "Coke Ran( Report.Quarterly/Annual
b ,SeeNote 6 at end o_section. Supplement.' 1985 forwerd--EIA, Form EIA-5, 'Coke Rant Repo¢l,'E=Estimate. quarledy. • OOter Induetrlll: 1973-September 1977--OOI, BOM, M/nera/sNotes: • For sector-specilicreportingand estimating information,see Note Yearbook and Minerals Industry Surveys. October 1977-1979--EIA, Form
3 at end of section. • Geographic coverage is the 50 States and the District EIA-3, "Monthty Coal Consumption Report-Manufacturing Rants." 1980of Columbia. -- Data through 1991 are final. Subsequenl date are forward--EI,J., Form EIA-3, 'Quarterly Coal Consumption Report-preliminary. , Totals may not equal sum of componentsdue to Independent Manufectudng Plants,' end Form EIA.6, 'Coal Dbtdbulion Report."rounding. * Elec_c Utilities: 1973.Septlmber 1077---OOI, BOM, Minera/s Yearbook
Sources: , Coke Plants: 1073-Septsmber 1977---U.S. Departmentof the end Minerals Industry Surveys. October 1977 forwsrd--EIA, Form EIA-759interior (DOI), Bureau of Mines ([_OM), Minereds Yearbook and Minerals (formerly Form FPC-4), 'Monthly P(_ver Ran( Report." , Producers and/ndustry Surveys. October 1077-1980--Energy Intormation Administration Distributors: EIA, Form EIA-6, 'Coal DistributionReport"
Energy Information Administration/Monthly Energy Review December 1993 91
Coal Notes ly estimates were derived by proportioningreported quarterly data by using the ratios ofmonthly-to-quarterly consumption data in 1979,
1. Production: Preliminary monthly estimates of the last year in which monthly data were reportednational coal production are the sum of weekly estimates on Form EIA-2. During 1981 and 1982, the es-developed by the Energy Information Administration- timates were also modified to reflect air(EIA) and published in the Weekly Coal Production temperature degree-days. Quarterly consumptionreport. When a week extends into a new month, produc- data were directly from reported data and weretion is allocated on a daily basis and added to the defined as distribution to the residential andappropriate month. Weekly estimates are based on As- commercial sector as reported by coal producerssociation of American Railroads data showing the and distributors on Form EIA-6. Beginning innumber of railcars loaded with coal during the week by January 1988, monthly residential and commercialClass I and certain other railroads. This number is con- consumption estimates are derived from reportedverted into tons of coal by EIA by using the average quarterly data by using monthly national averagenumber of tons of coal per railcar loaded reported in population weighted heating/cooling degree-daysthe most recent "Quarterly Freight Commodity Statis- obtained from the National Oceanic and Atmos-tics" from the Interstate Commerce Commission. If an pheric Administration. The monthly ratios are theaverage coal tonnage per railcar loaded is not available monthly national sum of heating and cooling de-for a specific railroad, the national average is used. To gree-days as a proportion of the quarterly nationalderive the estimate of total weekly production, the total sum. Quarterly consumption data are directlyrail tonnage for the week is divided by the ratio of from reported data.quarterly production shipped by rail and total quarterly
• Coke Plants--Prior to 1980, monthly coke plantproduction. Data for the corresponding quarter of pre-vious years are used to derive this ratio. This method consumption data were taken directly frominsures that the seasonal variations are preserved in the reported data. From 1980-1987, coke plant con-production estimates, sumption estimates were derived by proportioning
reported quarterly data by using the ratios ofmonthly-to-quarterly consumption data in 1979,
When preliminary quarterly data become available, the the last year in which monthly data were reported.monthly and weekly estimates are adjusted to conform Beginning in January 1988, monthly coke plantto the quarterly figure. The adjustment procedure uses consumption estimates are derived from theState-level production data and is explained in EIA's reported quarterly data by using monthly ratios ofQuarterly Coal Report. Initial estimates of annual raw steel production data from the American Ironproduction published in January of the following year and Steel Institute. The ratios are the monthlyare based on preliminary production data covering the raw steel production from open hearth and basicfirst 9 months (three quarters) and weekly/monthly oxygen process furnaces as a proportion of theestimates for the fourth quarter. The fourth quarter quarterly production from those kinds of furnaces.
estimates may or may not be revised when preliminary • Other IndustrialmPrior to 1978, monthlydata become available in March of the following year,depending on the magnitude of the difference between consumption data for the other industrial sector
(i.e., all industrial users minus coke plants) werethe estimates a_d the preliminary data. In any event, derived by using reported data to modify baselineall quarterly, monthly, and weekly production figures areadjusted to conform to the final annual production data consumption figures from the most recent Bureaupublished in the Monthly Energy Review in the fall of of the Census Annual Survey of Manufactures orCensus of Manufactures. For 1978 and 1979,the following year. monthly estimates were derived from data reported
on Forms EIA-3 and EIA-6. From 1980-1987,2. Consumption: Coal consumption data are reported monthly figures were estimated by proportioningby major end-use sector. Estimated data for the most quarterly data by using the ratios of monthly-to-recent months (designated by an "E") are derived from quarterly consumption data in 1979, the last yearforecasted values shown in the EIA Short-Term Energy in which monthly data were reported on FormOutlook (DOE/EIA-0202) table titled "Supply and Dis- EIA-3. Quarterly consumption data were derivedposition of Coal: Mid World Oil Price Case." The by adding beginning stocks at manufacturingmonthly estimates are one-third of the quarterly values plants to current receipts and subtracting endingshown in the then current issue of the publication, stocks at manufacturing plants. In this calcula-regularly released in February, May, August, and tion, current receipts were the greater of eitherNovember. The estimates are revised quarterly as col- reported receipts from manufacturing plants (Formlected data become available from the data sources. EIA-3) or reported shipments to the other in-Sector-specific information follows, dustrial sector (Form EIA-6), thereby ensuring that
agriculture, forestry, fishing, mining, and construc-• Residential and CommercialmPrior to 1980, tion consumption data were included where
monthly consumpt o'_ estimates for the residential appropriate. Starting in January 1988, monthlyand commercial s_c_r were derived by using consumption for the other industrial sector isreported data to mot!il baseline figures developed estimated from reported quarterly data by usingby the Bureau of Mines. From 1980-1987, month-
92 Energ)informationAdmini•bation/lik_lhlyEnergyReviewDecember1993
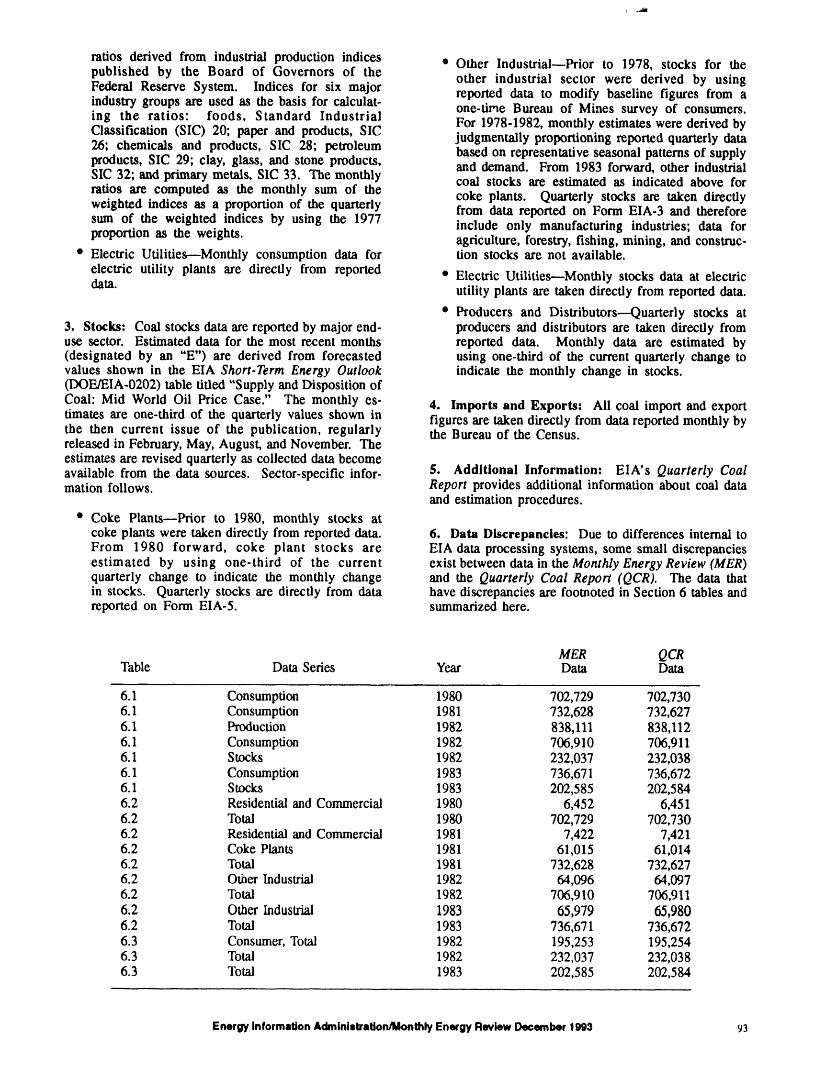
ratios derived from industrial production indices • Other Industrial--Prior to 1978, stocks for thepublished by the Board of Governors of the other industrial sector were derived by usingFederal Reserve System. Indices for six major reported data to modify baseline figures from aindustry groups are used as the basis for calculat- one-time Bureau of Mines survey of consumers.ing the ratios" foods, Standard Industrial For 1978-1982, monthly estimates were derived byClassification (SIC) 20; paper and products, SIC judgmentally proportioning reported quarterly data26; chemicals and products, SIC 28; petroleum based on representative seasonal patterns of supplyproducts, SIC 29; clay, glass, and stone products, and demand. From 1983 forward, other industrialSIC 32; and primary metals, SIC 33. The monthly coal stocks are estimated as indicated above for
ratios are computed as the monthly sum of the coke plants. Quarterly stocks are taken directlyweighted indices as a proportion of the quarterly from data reported on Form EIA.3 and thereforesum of the weighted indices by using the 1977 include only manufacturing industries; data forproportion as the weights, agriculture, forestry, fishing, mining, and construe-
• Electric Utilities---Monthly consumption data for tion stocks are not available.
electric utility plants are directly from reported • Electric Utilities--Monthly stocks data at electricdata. utility plants are taken directly from reported data.
• Producers and Distributors---Quarterly stocks at3. Stocks: Coal stocks data are reported by major end- producers and distributors are taken directly fromuse sector. Estimated data for the most recent months reported data. Monthly data are estimated by(designated by an "E") are derived from forecasted using one-third of the current quarterly change tovalues shown in the EIA Short-Term Energy Outlook indicate the monthly change in stocks.(DOE/EIA-0202) table tiffed "Supply and Disposition of
Coal: Mid World Oil Price Case." The monthly es- 4. Imports and Exports: All coal import and exporttimates are one-third of the quarterly values shown in figures are taken directly from data reported monthly bythe then current issue of the publication, regularly the Bureau of the Census.released in February, May, August, and November. Theestimates are revised quarterly as collected data becomeavailable from the data sources. Sector-specific infor- 5. Additional Information: EIA's Quarterly Coalmation follows. Report provides additional information about coal data
and estimation procedures.
• Coke Plants--Prior to 1980, monthly stocks atcoke plants were taken directly from reported data. 6. Data Discrepancies: Due to differences internal toFrom 1980 forward, coke plant stocks are EIA data processing systems, some small discrepanciesestimated by using one-third of the current exist between data in the Monthly Energy Review (MER)quarterly change to indicate the monthly change and the Quarterly Coal Report (QCR). The data thatin stocks. Quarterly stocks are directly from data have discrepancies are foomoted in Section 6 tables andreported on Form EIA-5. summarized here.
MER QCRTable Data Series Year Data Data
6.1 Consumption 1980 702,729 702,7306.1 Consumption 1981 732,628 732,6276.1 Production 1982 838,111 838,1126.1 Consumption 1982 706,910 706,9116.1 Stocks 1982 232,037 232,0386.1 Consumption 1983 736,671 736,6726.1 Stocks 1983 202,585 202,5846.2 Residential and Commercial 1980 6,452 6,4516.2 Total 1980 702,729 702,7306.2 Residential and Commercial 1981 7,422 7,4216.2 Coke Plants 1981 61,015 61,0146.2 Total 1981 732,628 732,6276.2 Other Industrial 1982 64,096 64,0976.2 Total 1982 706,910 706,911
6.2 Other Industrial 1983 65,979 65,9806.2 Total 1983 736,671 736,6726.3 Consumer, Total 1982 195,253 195,2546.3 Total 1982 232,037 232,0386.3 Total 1983 202,585 202,584
EnergyInformationAdminioluration/MonlhlyEnergyReviewDecember 1993 93
Section 7. Electricity
During September 1993, electric utilities generated 237 During the first 3 quarters of 1993, sales of electricitybillion kilowatthours of electricity, 1 percent 7 more to all ultimate consumers in the United States werethan in September 1992. Coal-fired generation totaled 2,172 billion kilowatthours, 4 percent more than sales134 billion kilowatthours, slightly more than in Sep- during the first 3 quarters of 1992. Sales to residentialtember 1992. Nuclear generation totaled 50 billion consumers were 762 billion kilowatthours, 8 percentkilowatthours, 2 percent below the level 1 year earlier, more than during the same period in 1992. Sales toNatural gas-fired generation was 25 billion industrial consumers in the first 3 quarters of 1993kilowatthours, 4 percent lower than the September were 737 billion kilowatthours, 2 percent above the1992 level. Hydroelectric generation totaled 17 billion level a year ago. Commercial sales during the first 3
i kilowatthours, 1 percent above the September 1992 quarters of 1993 were 600 billion kilowatthours, 4 per-level. Petroleum-fired generation totaled 10 billion cent more than sales to commercial consumers 1 yearkilowatthours, 43 percent above the level 1 year earlier, earlier. During the first 3 quarters of 1993, other sales
totaled 73 billion kilowatthours, 3 percent above thelevel of sales during the first 3 quarters of 1992.
During the first 3 quarters of 1993, electric utilitiesgenerated 2,186 billion kilowatthours of electricity, 4percent above the fh'st 3 quarters of 1992 generation Electric utility consumption of coal during Septemberlevel. Coal-fired generation totaled 1,232 billion kilo- 1993 was 67 million short tons, 1 percent abovewatthours, 4 percent above the first 3 quarters of the consumption in September 1992. Petroleum consump-1992 level. Nuclear generation totaled 466 billion tion (excluding petroleum coke) during Septemberkilowatthours, 1 percent above the level 1 ye"a"earlier. 1993 was 16 million barrels, 39 percent above the Sep-
tember 1992 level. During September 1993, electricNatural gas-fired generation was 198 billionkilowatthours, 5 percent below the fhrst 3 quarters of utilities consumed 259 billion cubic feet of natural gas,the 1992 level. Hydroelectric generation totaled 209 5 percent below the September 1992 consumptionbillion kilowatthours, 16 percent above the first 3 level.quarters of the 1992 level. Petroleum-fired generation
totaled 74 billion kilowatthours, 8 percent above the During the first 3 quarters of 1993, electric utility con-level 1 year earlier, sumption of coal was 612 million short tons, 5 percent
above consumption during the first 3 quarters of 1992.Petroleum consumption (excluding petroleum coke)
Sales of electricity to all ultimate consumers in the during the flu'st 3 quarters of 1993 was 121 millionUnited States in September were 253 billion barrels, 6 percent more than consumption during thekilowatthours, 6 percent more than sales during Sep- first 3 quarters of 1992. Electric utilities consumedtember 1992. Sales to residential consumers during 2,064 billion cubic feet of natural gas, 6 percent belowSeptember 1993 were 89 billion kilowatthours, 12 per- the consumption level 1 year earlier.cent above the level of sales during the previous year.Sales to industrial consumers totaled 84 billion kilo-watthours in September 1993, 1 percent above the level On September 30, 1993, electric utility stocks of alla year ago. Commercial sales were 72 billion kilo- types of coal totaled 113 million short tons, 26 percentwatthours, 5 percent above the level of commercial below the level on September 30, 1992. Stocks ofsales 1 year earlier. In September 1993, other sales petroleum (excluding petroleum coke) on Septembertotaled 9 billion kilowatthours, 3 percent above the 30, 1993, totaled 61 million barrels, 11 percent belowSeptember 1992 level, the level on September 30, 1992.
7percentage changes are based on numbers shownin the folk)wingtables.
Energy Information Administration/Monthly Energy Review December 1993 95
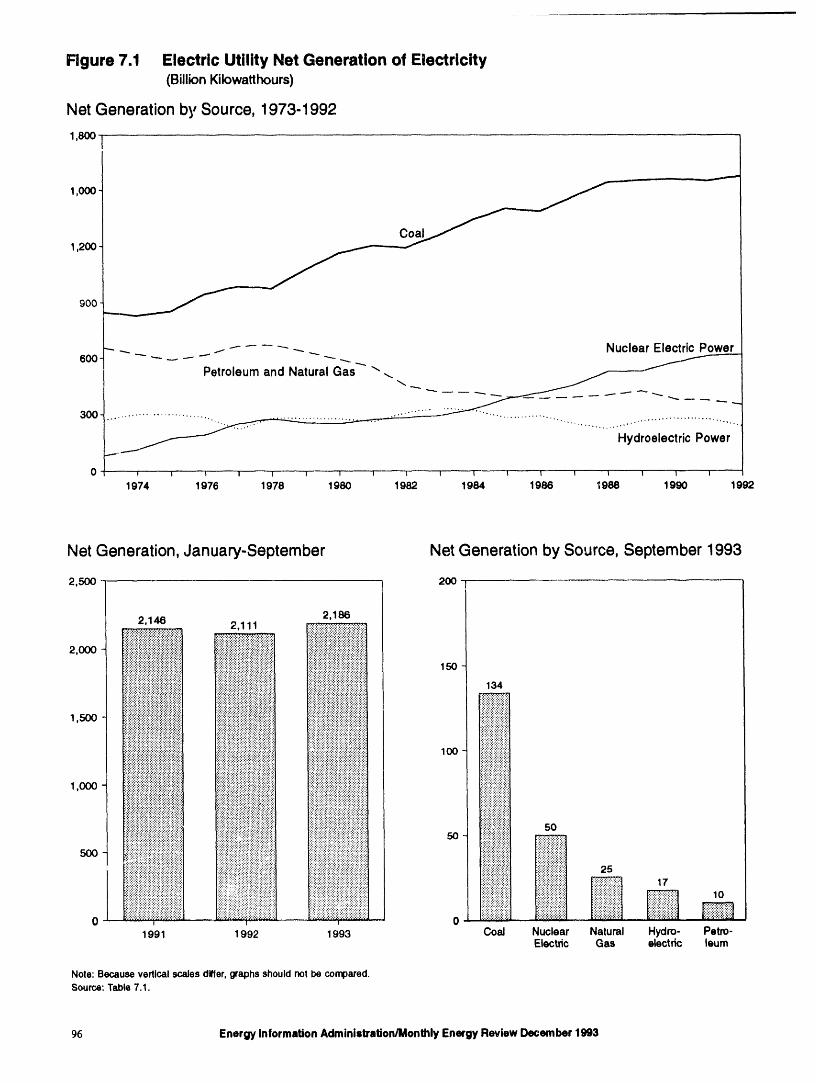
Figure 7.1 Electric Utility Net Generation of Electricity(BillionKilowatthours)
Net Generationby Source,1973-19921,800
,,,, ,,.._=_
1,000-
1,200-
900
---- -- -- ---- Nuclear Electric Power600 -"- ---- --. ---- -" ---- _.__..
Petroleum and Natural Gas "x\.._ _ ___-__ _ I_"
......... , ....... ..'" ..... .,,,
Hydroelectric Power
0 ! I I I I I I J 1 ! I _ 1 t I t 1 I
1974 1976 1978 1980 1982 1984 1986 1988 1990 1992
Net Generation,January-September Net Generation by Source, September 1993
2,50O 2OO
96 Energy Information Administration/Monthly Energy Review December 1993
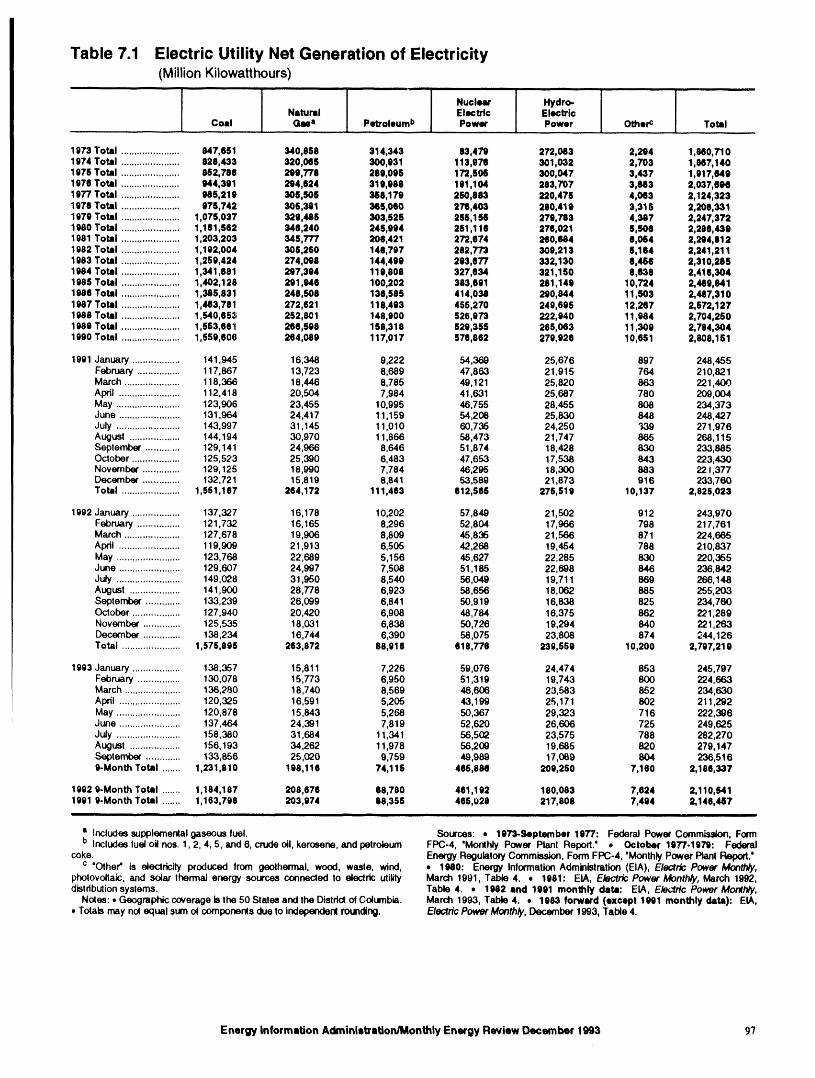
Table 7.1 Electric Utility Net Generation of Electricity(MillionKilowatthours)
i
Nuclear Hydro-Natural Electric Electric
Coal Gasa Petroleumb Power Power Otherc Total
1973 Total ...................... 847,651 340,858 314,343 83,479 272 083 2,294 1,850,TI 01974 Total ...................... 828,433 320,085 300,931 113,976 301 032 2,703 1,85701401976 Total ...................... 852,786 299,776 289,095 172,508 300 047 3,437 1,917,6491976 Total ...................... 944,301 294,624 319,988 181,104 283 707 3,883 2,037,6961977 Total ...................... 985,219 305,506 386,179 250,883 220 475 4,083 2,124,3231978 Total ...................... 975,742 306,391 366,060 273,403 280 419 3,315 2,206,3311979 Total ...................... 1,075,037 329,486 303,525 256,1SS 270 783 4,387 2,247,3721980 Total ...................... 1,161,562 346,240 245,004 251,116 276 021 6,506 2,286,4391981 Total ...................... 1,203,203 345,777 206,421 272,674 260 684 6,084 2,294 8121982 Total ...................... 1,192,004 306,260 146,797 282,773 309 213 5,164 2,241,2111983 Total ...................... 1,259,424 274,098 144,499 293,677 332 130 6,456 2,310,2851984 Total ...................... 1,341,681 297,394 119,808 327,634 321 150 8,638 2,416 3041985 Total ...................... 1,402,128 291,946 100,202 383,691 281 149 10,724 2,469 8411986 Total ...................... 1,385,831 248,508 136,585 414,038 290 844 11,503 2,487 3101987 Total ...................... 1,463,781 272,621 118,493 455,270 249 695 12,267 2,572 1271988 Total ...................... 1,,540,65_J 252,801 148,900 526,973 222 940 11,984 2,704 2501989 Total ...................... 1,563,661_ 266,598 158,318 529,355 265 063 11,309 2,784 3041990 Total ...................... 1,559,606 264,089 117,017 576,862 279 926 10,651 2,808 161
1991 January .................. 141,945 16,348 9,222 54,369 25,676 897 248,455February ................ 117,867 13,723 8,689 47,863 21,915 764 210,821March ..................... 118,366 18,446 8,785 49,121 25,820 863 221,4OOApril ....................... 112,418 20,504 7,984 41 631 25,687 780 209,004May ........................ 123,906 23,455 10,995 46 755 28,455 808 234,373June ....................... 131,964 24,417 11,159 54 208 25,830 848 248,427July ........................ 143,997 31,145 11,010 60 735 24,250 339 271,976August ................... 144,194 30,970 11,866 58 473 21,747 865 268,115September ............. 129,141 24,966 8,646 51 874 18,428 830 233,885October .................. 125,523 25,390 6,483 47 653 17,538 843 223,430November .............. 129,125 18,990 7,784 46 295 18,300 883 22 1,377December .............. 132,721 15,819 8,841 53 589 21,873 916 233,760Total ...................... 1,561,167 264,172 111,463 612565 275,518 10,137 2,825,023
1992 January .................. 137,327 16,178 10,202 57,849 21,502 912 243,970February ................ 121,732 16,165 8,296 52,804 17,966 798 217,761March ..................... 127,678 19,906 8,809 45,835 21,566 871 224,665April ....................... 119,909 21,913 6,505 42,268 19,454 788 210,837May ........................ 123,768 22,689 5,156 45,627 22,285 830 220,355June ....................... 129,607 24,997 7,508 51,185 22,698 646 236,842July ........................ 149,028 31,950 8,540 56,049 19,711 869 268,148August ................... 141,9(X) 28,778 6,923 58,656 18,062 885 255,203September ............. 133,239 26,099 6,841 50,919 16,838 825 234,760October .................. 127,940 20,420 6,908 48,784 16,375 862 221,289November .............. 125,535 18,031 6,838 50,726 19,294 840 221,263December .............. 138,234 16,744 6,390 58,075 23,808 874 244,126Total ...................... 1,575,895 263,872 88,916 618,776 239,559 10,200 2,797,219
1993 January .................. 138,357 15,811 7,226 59,076 24,474 853 245,797February ................ 130,078 15,773 6,950 51,319 19,743 800 224,663March ..................... 136,2_0 18,740 8,569 46,606 23,583 852 234,630
! April ....................... 120,325 16,591 5,205 43,199 25,171 802 211,292May ........................ 120,878 15,843 5,268 50,367 29,323 716 222,396June ....................... 137,454 24,391 7,819 52,620 26,606 725 249,625July ........................ 158,380 31,684 11,341 56,502 23,575 788 282,270August ................... 156,193 34,262 11,978 58,209 19,685 820 279,147September ............. 133,856 25,020 9,759 49,989 17,089 804 238,5169-Month Total ....... 1,231,810 198,116 74,116 465,884 209,250 7,160 2,186,337
1992 9-Month Total ....... 1,184,187 208,676 68,780 461,192 180,083 7,624 2,110,5411991 9-Month Total ....... 1,163,798 203,974 88,355 455,028 217,808 7,494 2,146,457iiiii i i i,i i iiiiii i
i Includessupplementalgaseous fuel. Sources: • 1973-September 1977: Federal Power Commission, Formb Includes fuel oil nos. 1,2, 4, 5, and 6, crudeoil, kerosene,and petroleum FPC-4, "Monlhly Power Planl Report." • Oct,_ber 1977-1970: Federal
coke. Energy RegulatoryCommission,Form FPC-4, 'Monthly Power PlantReport.'c 'Other" is electricity produced lrom geolhermal, wood, waste, wind, • 1080: Energy InformationAdministration(EIA), Electric Power Monthly,
pholov_aic, and so(ar lhermal energy sources connected to electric utility March 1991, Table 4. • 1981: EL&,Electric Power Monthly, March 1992,disldbutionsyslems. Table 4. • 1982 end 1991 monthly data: EL&, E/ectric Power Monthly,
NO(e6:• Geographic coverageislhe 50Slates and the Distdcl of Coiurnbla. March 1993, Table 4. • 1993 forward (except 1981 monthly data): EL&,• Totalsmay no( equal sumol componenls dueto independentrounding. Electdc Power Month/y, December 1993, Table 4.
Energy information Administration/Monthly Energy Review December 1993 9"/
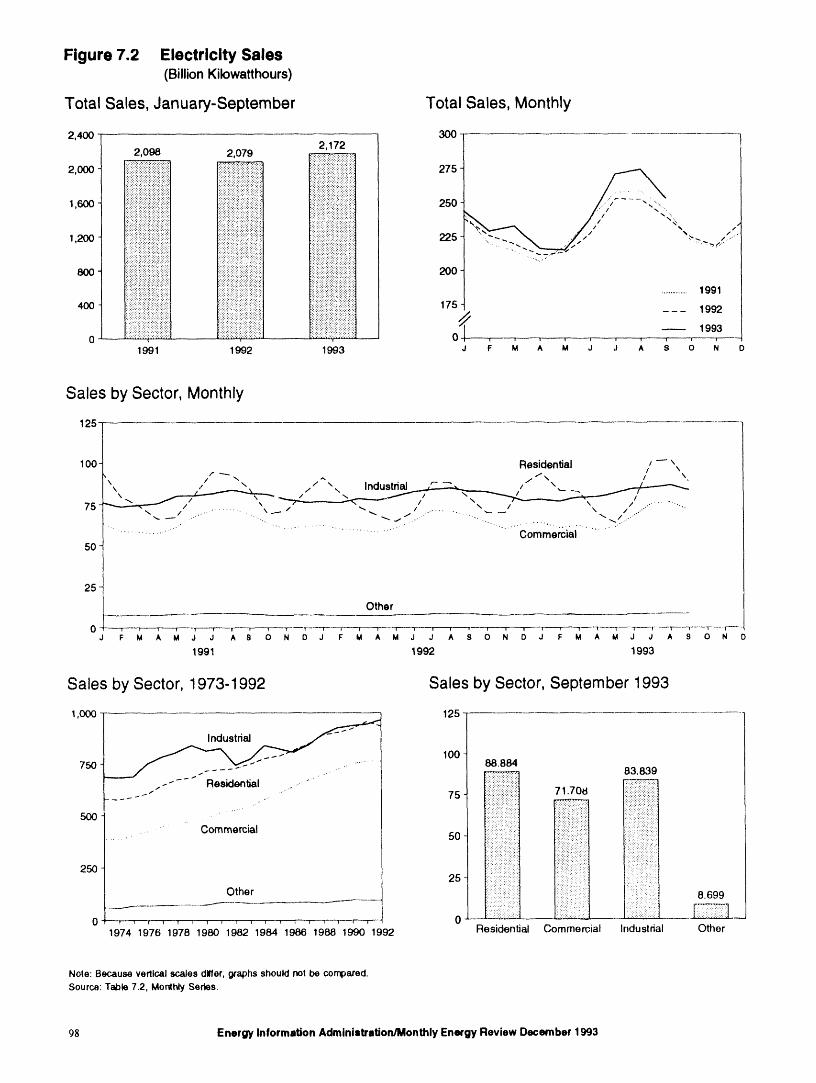
Figure 7.2 Electricity Sales(BillionKilowatthours)
Total Sales, January-September Total Sales, Monthly
2,400 3002,172 1
2,098 2,079 ii'::!iiiii!ii;_iiii!i!i!iiii::i_:::::::::::::::::::::::::::::::::
iiii!
1,200 225 ,,",- ,' ............. i_:i:i_:_:_:ii_i!:!:!:i:i:i:i:::_:liiii:_i::!::iiiiiiiiiiiii!i::iiiiiii! "_,..":.iiiii!_iiii:_iiiiiiiiii!!iiiiii!illiil::ii!ii:_i!iiiiiiii!iiiiiiii:,il ................................. '.., ,,,, :+:,... '_-_ ._
i!ii!i!!;!i;!!i_!!ii!iiiiii_;!iii 2008oo i!iiii!iiiii!iiiiii::iiiiiiiiiiiii!l!iiiiiiiiiii':i:::.ii::!::!iiiii!ii!i!iil
,oo ili!!iii!ili!ii!t ...................................,,,i;!i!!!!ii!!!iii!i,,,,---, iii#iii!i;iiiii!iiiii!iiiil;!i
19930 - .iii!iiii!iiiii!!!iii!iiii!iiiiiiil , 0 --------r--_--r--- ...... _......
1991 1992 1993 J F M ^ M J J i S 0 N D
Sales by Sector, Monthly
125 '
100- Residential / \_, //" ""-- ,... /1\ / \,_\ ," ". / / \_ Industrial _ l- \ __..,c----..-.-.._
,_._ _ ." "\ _ / \ . _. / ........ ,..
, . • • ,, ............ . ""-.. , - ,................. Commercial
5O
!
25-!Other
0 - _ I i _ f _"_----"l'-_r ..... r _ _1" _ _ ' _ "'_t----"'/_'-- T _ I ' "r ...... _ =''--'-'T_ ' _ _ - __"T-- _'-'r-'-'--'_--"---'i'---J F M A M J J A _ 0 N D J F M A M J J A $ 0 N D J F M A M J J A $ 0 N D
1991 1992 1993
Sales by Sector, 1973-1992 Sales by Sector, September 1993
1,000 _ 125
100
750 88.884 83.839
--" ' 75 .........................71,708
- - _ .. "' :!:i:i:i:i:!:i:i:!:i'i'i: __
., ......,.....,...., .,....•...:........... . ....,.._...
50o ,. i::iiii_:.i!_iii_iii!::ii...., ,.,.....•:,::.:..,.:: :.::..
" ii:.',ii!ii.ii:ii:.ii
............................!1 .......................'250 !_i_i!!i__ili::i:i::i:_::: :i_::__-_.!_:_:____
Other i!i;:_i:::i:iiii:!:! ::i!ii:!.ii.: i 8.699--.----------_ ii :i:Z!:ii: iil i ;:i. i!;!i:::' i )_.
0 _- _ _ r _ _ _ _ '_ , _ _ _ 'l......._ _' '_ t'----r-"- 0 :':-_:'"__= .........
1974 1976 1978 1980 1982 1984 1986 1988 1990 1992 Residential Commercial Industrial Other
Note:Becauseverticalscalesdlller,graphsshouldnotbe compared.Source:Table7.2, MonthlySeries.
98 Energy Information Admini=b'ation/Monthly Energy Review December 1993
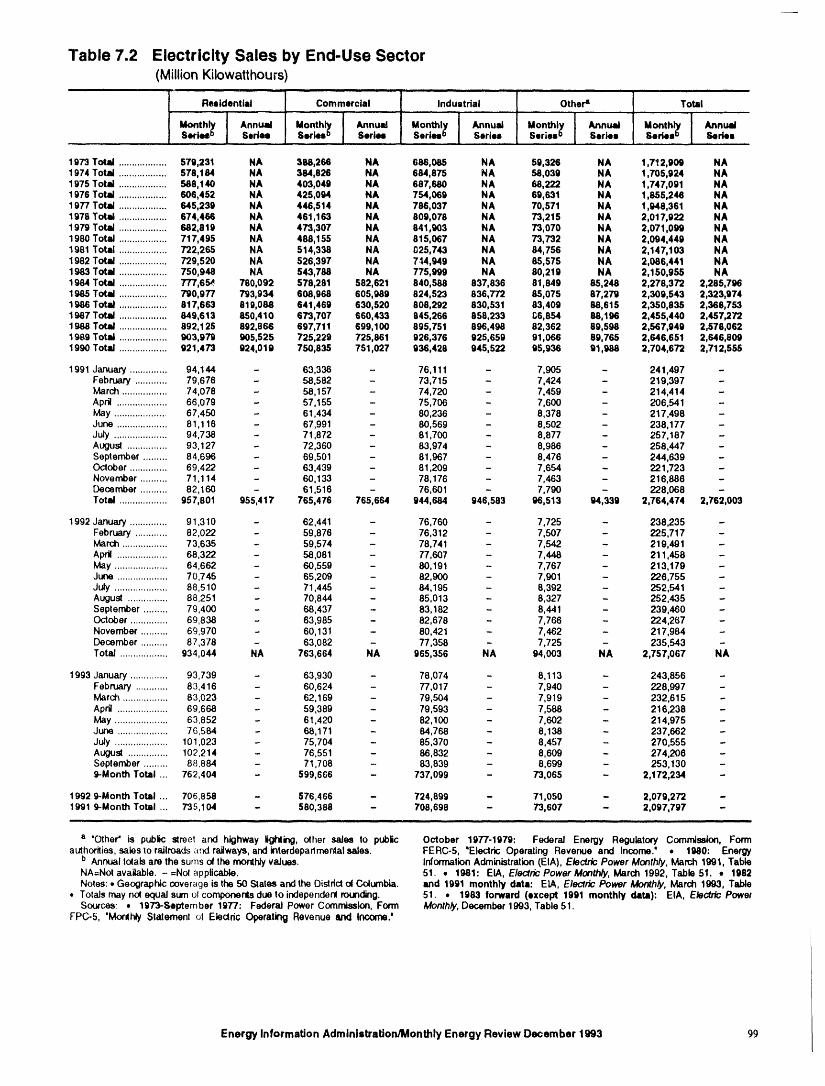
Table 7.2 Electricity Sales by End-Use Sector(MillionKiiowatthours)
.........
Reeidential Commercial Industrial Other= Total............................
Monthly Annual Monthly AnnuzJ Monthly Annual Monthly Annual Monthly AnnumJSeries ° Series Series° Series Series D Series Seriee o 8eriee Sedee o SQrlee
....................
1973 Total .................. 579 231 HA 388,266 NA 686,085 NA 59,326 NA 1,712,909 NA1974 Total .................. 578 184 NA 384,826 NA 684,875 HA 58,039 NA 1,705,924 NA1975 Total .................. 588 140 NA 403,049 NA 687,680 NA 68,222 NA 1,747,091 NA1976 Total .................. 606 452 NA 425,094 NA 754,069 NA 69,631 NA 1,855,246 NA1977 Total .................. 645 239 NA 446,514 NA 786,037 NA 70,571 NA 1,948,361 NA1978 Total .................. 674 466 NA 461,163 NA 809,078 NA 73,215 NA 2,017,922 NA1979 Total .................. 682 819 NA 473,307 NA 841,903 NA 73,070 NA 2,071,099 NA1980 Total .................. 717 495 NA 488,155 NA 815,067 NA 73,732 NA 2,094,449 NA1981 Total .................. 722 265 NA 514,338 NA 025,743 NA 84,756 NA 2,147,103 NA1982 Total .................. 729 520 NA 526,397 NA 7_4,949 NA 85,575 NA 2,086,441 NA1983 Total .................. 750 948 NA 543,788 NA 775,999 NA 80,219 NA 2,150,955 NA1984 Total .................. 777 6_ 780,092 578,281 582,621 840,588 837,836 81,849 85,248 2,278,372 2,285,7961985 Total .................. 790 977 793,934 608,968 605,989 824,523 836,772 85,075 87,279 2,309,543 2,323,9741986 Total .................. 817 663 819,088 641,469 630,520 808,292 830,531 83,409 88,615 2,350,835 2,368,7531987 Totai .................. 649 613 850,410 673,707 660,433 845,266 858,233 [;6,854 68,196 2,455,440 2,467,2721988 Total .................. 892 125 892,866 697,711 699,100 895,751 896,498 82,362 89,598 2,567,949 2,578,0621989 Total .................. 903 979 905,525 725,229 725,861 926,376 925,659 91,066 89,765 2,646,651 2,646,8091990 Totat .................. 921 473 924,019 750,835 751,027 936,428 945,522 95,936 91,988 2,704,672 2,712,555
1991 January .............. 94,144 - 63,336 - 76,111 - 7,905 - 241,497 -February ............ 79,676 - 58,582 - 73,715 - 7,424 - 219,397 -March ................. 74,078 - 58,157 - 74,720 - 7,459 - 214,414 -April ................... 66,079 - 57,155 - 75,708 - 7,600 - 206,541 -May .................... 67,450 - 61,434 - 80,236 - 8,378 - 217,498 -June ................... 81,116 - 67,991 - 80,569 - 8,502 - 238,177 -July .................... 94,738 - 71,872 - 81,700 - 8,877 - 257,187 -August ............... 93,127 - 72,360 - 83,974 - 8,986 - 258,447 -September ......... 84,696 - 69,501 - 81,967 - 8,476 - 244,639 -October .............. 69,422 - 63,439 - 81,209 - 7,654 - 221,723 -November .......... 71,114 - 60,133 - 78,176 - 7,463 - 216,886 -December .......... 82,160 - 61,516 - 76,601 - 7,790 - 228,068 -Total .................. 957,801 955,417 765,476 765,664 944,684 946,583 96,513 94,339 2,764,474 2,762,003
1992 January .............. 91,310 - 62,441 - 76,760 - 7,725 - 238,235 -February ............ 82,022 - 59,876 - 76,312 - 7,507 - 225,717 -March ................. 73,635 - 59,574 - 78,741 - 7,542 - 219,491 -April ................... 68,322 - 58,081 - 77 607 - 7,448 - 211,458 -May .................... 64,662 - 60,559 - 80 191 - 7,767 - 213,179 -June ................... 70,745 - 65,209 - 82 900 - 7,901 - 226,755 -July .................... 88,510 - 71,445 - 84 195 - 8,392 - 252,541 -August ............... 88,251 - 70,844 - 85 013 - 8,327 - 252,435 -September ......... 79,400 - 68,437 - 83 182 - 8,441 - 239,460 -October .............. 69,838 - 63,985 - 82 678 - 7,766 - 224,267 -November .......... 6%970 - 60,131 - 80 421 - 7,462 - 217,984 -December .......... 87,378 - 63,082 - 77 358 - 7,725 - 235,543 -Totai .................. 934,044 NA 763,664 NA 965 356 NA 94,003 NA 2,757,067 NA
1993 January .............. 93,739 - 63,930 - 78 074 - 8,113 - 243,856 -February ............ 83,416 - 60,624 - 77 017 - 7,940 - 228,997 -March ................. 83,023 - 62,169 - 79 504 - 7,919 - 232,615 -April ................... 69,658 - 59,389 - 79 593 - 7,588 - 216,238 -May .................... 63,852 - 61,420 - 82 100 - 7,602 - 214,975 -June ................... 76,584 - 68,171 - 84 768 - 8,138 - 237,662 -July .................... 101,023 - 75,704 - 85 370 - 8,457 - 270,555 -August ............... 102,214 - 76,551 - 86 832 - 8,609 - 274,206 -September ......... 88.884 - 71,708 - 83 839 - 8,699 - 253.130 -9-Month Total ... 762,404 - 599,666 - 737 099 - 73,065 - 2,172,234 -
1992 9-Month Total ... 706,858 - 576,466 - 724,899 - 71,050 - 2,079,272 -1991 9-Month Total ... 735,104 - 580,388 - 708,698 - 73,607 - 2,097,797 -
a "Other" is public street and highway lighting, other sales 1o public October 1977-1979: Federai Energy Regulatory Commission, Formauthorities,sales to railroads_nd raJlw=_ys,andinterdeparlmentalsales. FERC-5, "Electric Operating Revenue and Income.' • 1980: Energy
b Annualtotals are the sums o( the rnonlhJyvaJues. INonnation Administration(EIA), Electric Power Monthly, March 1991, TableNA=Not available. - =Not applicable. 51. • 1981: EtA, Electric Power Month/y, March 1992, Table 51. • 1982Notes: • Geographiccoverage is the 50 States and the Districto( Columbia. and 1991 monthly date: EtA, Electric Power Monthly, March 1993, Table
• Totalsmay no( equalsum of componentsdue to independentrounding. 51. • 1983 forward (except 1991 monthly data): EtA, Electric PowerSources: • 1973-September 1977: Federat Power Commission, Form Monthly, December 1993, Table 51.
FPC-5, 'Mor_h_ Statement el Elecldc Operating Revenue _ld Income.'
Energy Information Administration/Monthly Energy Review December 1993 99
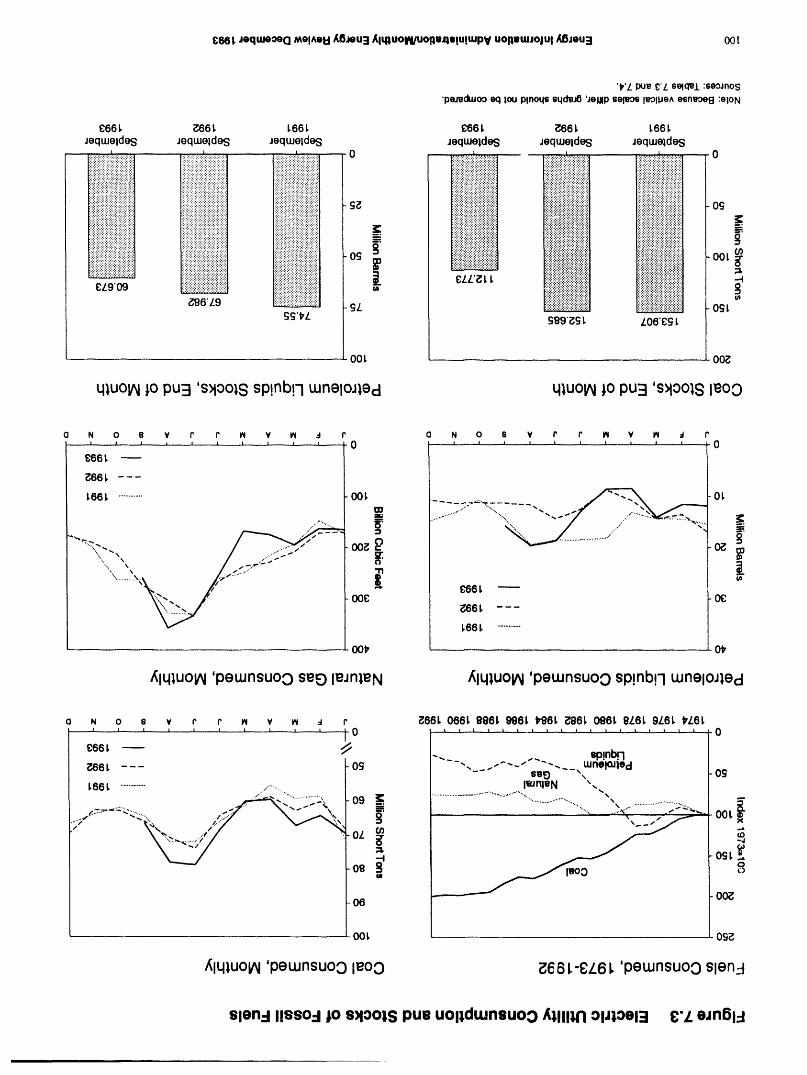
£66L JeqtueoeQMel^eUA§Jeu3 Xlqiuow/uone_lt!ulwpy UOlleWZOlUl_JSJeu3 00t
't,'l pue£'L selqel :seoJnos•pmedmooo<iIouPlnoqs$qde_ 'JeglPsere_ leOIIJeAesneoet]:elON
£66 _ ?.,66L L66L £66 L ?-,66L L66LJeqLueldes JeqLueldes JequJeldes Jeqmeldes Jeqmeldes Jeqme|des
....................... ' ..... 0 0
- iiiiiiiii!iiiii!iliiiiiii !....:....................:!,..... .................................i!!iiii!ii!ii!i!iiiiiiil;!ii!!iiiiiiiii_ii!!ii!iiiiiiiii!iil: ' "..... ???i?i???i:=?:_i??::i?i?i?i?i?iil;i?i_!"i_i_:_i_i_i_==_i:ia::_?_ia=:_:
!!i ..................................iiiiii!iiiii!ii!iii!, ,,i!iiiiiiiii_,:_::::::_:_:_:_:_:_,:_:::,::_::................. i!i::i::::::i::_il;i!iiiii::ili::!iii;i_= ii!iiiiiiii!iii!i!ii;iiii_:!iiiiill
!:!'::'/:::_:: !iii!iiii_'ii?i:'iiiiii?i':i_:i!ii?ilo__]..... ii', lii i i;i ', i iiliii!iiiii!!iiiiii' ii.:.:<,:..,:.:,>:.:,>:,..:.:<,:.....
c_9'o9 !!_i!ii!i!?!i::_::iii!_iiii::i!i_ _ gZz'_t t::::::::::::::::::::::::::::::::::
b"_6'L9 ............. SL O_L =S(:J'I'L 599"g_L 106'C_;L
O0L 00_
q_uolAI_o pub 's_oo_s sptnbt-I LuneloJ_ed qluolAI_opub 's_tools leoo
O N 0 8 V I" I" I_ V _1 :1 O N 0 8 V I" P _ ¥ IN d I", 1 A , I _, J I I,,, I , I I 0 _- _ _ _ _ _ | | 1 I I 0
£661,
g661. - - -
_ .............. oo_ _/_x_ o__'_-'- OOg 0 Og ,..
:'' N / =' t•_ \ _._.,."T''""- ""'............._.%. ._,,
" £66L,.,,'... - ooe og
g66_ ---1,661. ............
OOl, Or,
/_lqluoiN 'peLunsuoo seo leJnleN ,_lqlUOlAI'peLunsuoo sp!nb!-I LuneloJled
0 N 0 8 ¥ P r' IN ¥ I_ :1 f" _66_ 066 L 996 I. 9fl6 L t'961, _'_86_ 0fl6L 8L6L 9L6L I,L6L
g66 _ _ _ sp!n_l"., ,-"--" ""'- wnela_led
?_66L --- OS --" seO --_ O_\%
L661. ............... ............ liunleN ,......" "_" ...................._::. 09 _ ..................................................... ""
_ ._........... ..-- _, --._ ......................,....... _, ...................._-_._," -' ".........."_'-, "< _" OOL
.........._ " _ .-"
o_
06
K)_ 09_
,_lqlUOl/M'peLunsuoo leoo _6 8 L-eL6 L 'peLunsuoo slen:l
slen.-I IlSSOd _o S)loo|s pue UOl|dLunsuoo _),III),I'IOlJiOel3 £'Z oJn61:l
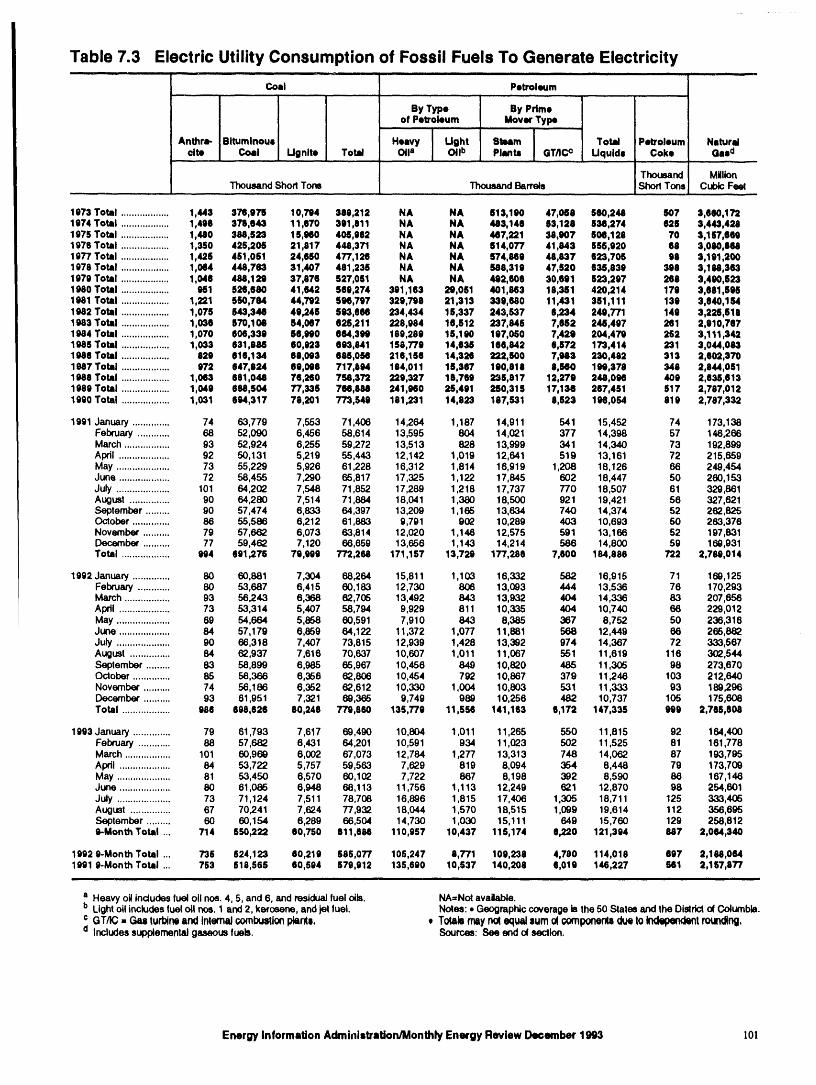
Table 7.3 Electric Utility Consumption of Fossil Fuels To Generate Electricity........... ,, , . .,,.
Coal Petroleum................
By Type By Pdmeof Petroleum Mover Type
'"" J '" ,,_ --
Anthra- Bituminous Heavy I Light Steam ] Total Petroleum Naturalcite Coal Ugnlte Total Olla i Oil b Plants GT/ICc Uquids Coke Geed,............... , .,.,
Thousand MillionThousand Short Tone ThousandBarrels Short Tons CubicFeel
.............
1973 Total .................. 1,443 379,976 10,794 389,212 NA NA 613,190 47,068 560,248 607 3,060,1721974 Total .................. 1,488 379,643 11,870 391,811 NA NA 483,140 83,128 934,274 828 3,443,4281975 Total .................. 1,430 388,523 1IS,N0 406,992 NA NA 447,221 39,907 508,128 70 3,157,8691979 Total .................. 1,3.50 425,206 21,817 448,371 NA NA 814,077 41,643 555,920 68 3,090,8(NI1977 Total .................. 1,438 451,061 24,650 477,126 NA NA 874,869 48,637 923,706 99 3,191,2001978 Total .................. 1,044 448,763 31,407 481,236 NA NA 588,319 47,520 (S35,839 390 3,1U,3931979 Total .................. 1,046 488,129 37,876 527,051 NA NA 492,606 30,691 523,297 268 3,490,6231980 Total .................. 961 826,680 41,942 649,274 391,163 29,051 401,863 18,351 420,214 179 3,681,6961981 Total .................. 1,221 550,764 44,792 596,797 329,798 21,313 239,680 11,431 381,111 139 3,640,1541982 Total .................. 1,075 643,346 49,245 593,664 234,434 15,337 243,537 6,234 249,771 149 3,226,6181983 Total .................. 1,036 570,108 54,067 628,211 228,984 16,512 237,845 7,682 244,497 261 2,910,7671984 Total .................. 1,070 906,339 56,090 064,399 189,289 15,150 197,050 7,429 204,479 262 3,111,3421985 Total .................. 1,033 831,888 80,023 093,841 158,779 14,635 166,842 6,872 173,414 231 3,044,0831986 Total .................. 929 (116,134 66,093 686,064 216,156 14,326 222,600 7,983 230,492 313 2,602,3701987 Total .................. 972 947,624 69,096 717,994 184,011 16,367 190,8111 9,640 199,379 348 2,944,0611988 Total .................. 1,043 691,048 76,260 756,373 229,327 18,769 236,817 12,279 248,096 409 2,636,6131989 Total .................. 1,049 698,504 77,336 764,884 241,960 28,491 260,315 17,136 267,451 617 2,787,0121990 Total .................. 1,031 694,317 78,201 773,549 181,231 14,823 187,531 8,823 196,054 819 2,787,332
1991 January .............. 74 63,779 7,553 71,406 14,264 1,187 14,911 541 15,452 74 173,138February ............ 68 52,090 6,456 58,614 13,595 804 14,021 377 14,398 57 146 266March ................. 93 52,924 6,255 59,272 13,513 828 13,999 341 14,340 73 192 899April ................... 92 50,131 5,219 55,443 12,142 1,019 12,641 519 13,161 72 215 659May .................... 73 55,229 5,926 61,228 16,312 1,814 16,919 1208 18,126 68 249 454June ................... 72 58,455 7,290 65,817 17,325 1,122 17,845 602 18,447 50 260 153July .................... 101 64,202 7,548 71,852 17289 1,218 17,737 770 18,507 61 329 861August ............... 90 64,280 7,514 71,884 18,041 1,380 18,500 921 19,421 56 327 621September ......... 90 57,474 6,833 64,397 13,209 1,165 13,634 740 14,374 52 262 825October .............. 86 55,586 6,212 61,883 9,791 902 10,289 403 10,693 50 263 376November .......... 79 57,662 6,073 63,814 12,020 1,146 12,575 591 13,166 52 197 831December .......... 77 59,462 7,120 66,659 13,656 1,143 14,214 586 14,800 59 160 931Total .................. 994 tj91,276 79,999 772,256 171,157 13,729 177,286 7,600 184,888 722 2,769 014
1992 January .............. 80 60 881 7,304 68,264 15,811 1,103 16,332 582 16,915 71 169,125February ............ 80 53 687 6,415 60,163 12,730 806 13,093 444 13,536 76 170,293March ................. 93 56 243 6,368 62,706 13,492 843 13,932 404 14,336 83 207,656Apdl ................... 73 53 314 5,407 58,794 9,929 811 10,335 404 10,740 66 229,012
i May .................... 69 54 664 5,858 60,591 7,910 843 8,385 367 8,752 50 236,316June ................... 84 57 179 6,859 64,122 11,372 1,077 11,881 568 12,449 66 265,882July .................... 90 66 318 7,407 73,815 12,939 1,428 13,392 974 14,367 72 333,567August ............... 84 62 937 7,616 70,637 10,607 1,011 11,067 551 11,619 116 3(]2,544September ......... 83 56 899 6,985 65,967 10,456 849 10,820 485 11,305 98 273,670October .............. 85 56 366 6,356 62,806 10,454 792 10,867 379 11,246 103 212,640November .......... 74 56 186 6,352 62,612 10,330 1,004 10,803 531 11,333 93 189296December .......... 93 61 951 7,321 69,365 9,749 989 10,256 482 10,737 105 175,608Total .................. 986 698626 80,248 779,860 135,779 11,556 141,163 6,172 147,335 999 2,765,608
1993 January .............. 79 61,793 7,617 69,490 10,804 1,011 11,265 550 11,815 92 164,400February ............ 68 57,682 6,431 64,201 10,591 934 11,023 502 11,525 81 161,778March ................. 101 60,96_ 6,002 67,073 12,784 1,277 13,313 748 14,062 87 193,795April ................... 84 53,722 5,757 59,563 7,629 819 8,094 354 8,448 79 173,709May .................... 81 53,450 6,570 60,102 7,722 867 8,198 392 8,590 86 167,146June ................... 80 61,086 6,948 68,113 11,756 1,113 12,249 621 12,870 98 254,801July .................... 73 71,124 7,511 78,708 16,896 1,815 17,406 1,305 18,711 125 333,406August ............... 67 70241 7,624 77,932 18,044 1,570 18,515 1,099 19,614 112 356,695September ......... 60 60,154 6,289 66,504 14,730 1,030 15,111 649 15,760 129 258,8129-Month Total ... 714 550,222 60,750 611,686 110,957 10,437 116,174 9,220 121,394 987 2,064,340
1992 9-Month Total ... 735 624,123 60,219 685,077 105,247 8,771 109,238 4,780 114,018 697 2,198,0641991 9-Month Total ... 753 518,565 60,594 679,912 135,690 10,537 140,208 6,019 146,227 561 2,157,977
_ __ _
a Heavy oitincludesfuel oilnos. 4, 5, and 6, and residuaJfuel oits. NA=Not available.b Lightoil includesfuel oll nos.1 and 2, kerosene, and jet fuel. Notes: • Geographiccoverage is the 50 States and the Dlslrlcto( Coiumbla.c GT/K; = Gu turbineand Inlerr_ c,ornlx_tion plants. , To_ll may not equal sum of c,omponenla due to indq_ftd_t ro_;Ihlg,d includes sup_ernentaJgaseous fuels. Sources: See end of section.
Energy Information Adminis_aUon/Monthly Energy Review December 1993 10!
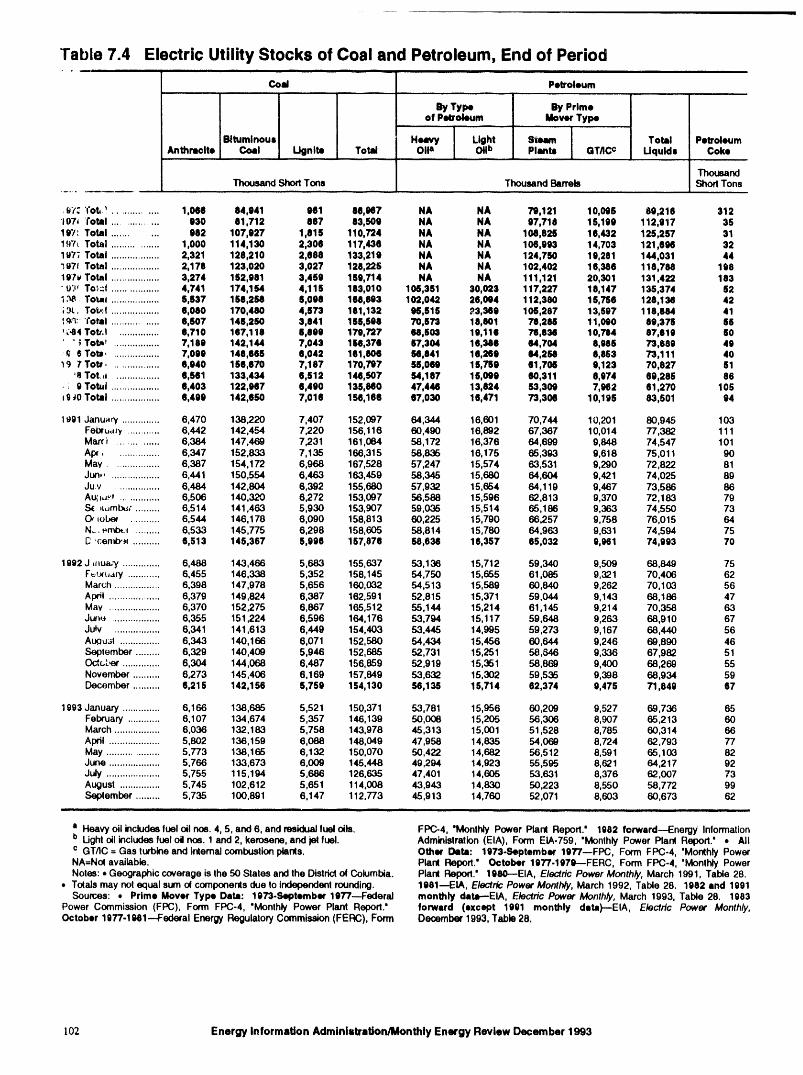
Table 7.4 Electric Utility Stocks of Coal and Petroleum, End of Period
Cod Petroleum.....
By Type By Primeof Petroleum Mover Type
Bituminoue Heavy Light SWmm Total PetroleumAnthracite Coal Ugnlta Total OIIa (31ib Planbl GTIICc I.Jqulde Coke
ThousandThousandShort Tons ThousandBarreb ShortTons
, e(: Tob' .............. 1,0(18 84,941 H1 85,947 NA NA 79 121 10,095 89,216 312"197d rotai .............. 630 81,712 887 83,509 NA NA 97710 lS,188 112,917 35197: Total .......... 982 107,927 1,615 110,724 NA NA 108 826 18,432 125,257 311.q'v_Total ................ 1 000 114,130 2,306 117,436 NA NA 106 993 14,703 121,696 321_i7;'Total .................. 2 321 128,210 2,088 133,219 NA NA 124 750 19,281 144,031 44lg7f Total .................. 2 178 123,020 3,027 128,225 NA NA 102 402 18386 118,788 198197v Total .................. 3274 162,981 3,459 159,714 NA NA 111 121 20.301 131,422 183•u', To_"_ ................. 4 741 174,164 4,118 183,010 106,351 30,023 117 227 18 147 135,374 821,_q To_l .................. 5 537 158,268 8,088 168,893 102,042 28,004 112 380 15,738 128,136 42;3L. Tob:l .................. 6 080 170,480 4,673 181,132 96,616 ?,3,359 106 287 131697 118,884 41_:' Total ................. 6 607 146,250 3,841 185,508 70,673 18,601 78 266 1101)0 69,373 86t_,O4Totr.I ............... 8 710 167,118 8,090 179,727 08,60,1 10,110 76 834 10734 07,610 60' "; Tot,,,, ................. 7 188 142,144 7,043 188,376 87,304 18,358 64 704 8 e88 73,889 49
8 Totm, ................. 7 098 148,888 8,042 181,806 68,841 18,268 64 268 8883 73,111 409 7 Tot_ ................. 8 840 186,870 7,187 170,797 68,069 15,768 81 706 g 123 70,827 61
'8 ToL,I ................ 8 561 133,434 6,512 148,507 64,187 16,088 60 311 8 974 68,285 86• 9 Total .................. 6 403 122,967 6,490 136,080 47,444 13,824 53 309 7962 61,270 105iS_0 Total .................. 6 499 142,650 7,016 158,166 87,030 18,471 73 308 10195 53,501 94
1_91 January .............. 6,470 138,220 7,407 152,097 64 344 16,601 70,744 10,201 80,945 103FeLx_u_/ ............ 6,442 142,454 7,220 156,116 60490 16,892 67,387 10,014 77,382 111Man'i .............. 6,384 147,469 7'231 161 084 58 172 16,376 64,699 9,848 74,547 101Ape................ 6,347 152,833 7,135 166 315 58 836 16,175 65,393 9,618 75,011 90May ................. 6,387 154,172 6,968 167 528 57 247 15,574 63,531 9,290 72,822 81Jun,,.................. 6,441 150,554 6,463 163 459 58 345 15,680 64,604 9,421 74,025 89Juv ................. 6,484 142,804 6,392 155 680 57 932 15,664 64,119 9,467 73,586 86Au_lu._'t.............. 6,506 140,320 6,272 153 097 56 588 15,596 62,813 9,370 72,183 79,S( JtumL_: ......... 6,514 141,463 5,930 153 907 59 035 15,514 65,186 9,363 74,550 73O_iobeq ........... 6,544 146,178 6,090 158 813 60 225 15,790 66,257 9,758 76,015 64N_ _mbtf .......... 6,533 145,775 6,298 158 605 58 814 15,780 64,963 9,631 74,594 75
,centb._l .......... 6,513 145,367 5,996 157876 58 636 16,357 65,032 9,061 74,993 70
1992 J ,.u_y .............. 6,488 143,466 5,683 155,637 53 136 15,712 59,340 9,509 68,849 75Fb_x_,ary ............ 6,455 146,338 5,352 158,145 54 750 15,655 61,065 9,321 70,406 62March ................. 6,398 147,978 5,656 160,032 54 513 15,589 60,840 9,262 70,103 56April ................... 6,379 149,824 6,387 162,591 52 815 15,371 59,044 9,143 68,186 47May ................... 6,370 152,275 6,867 165,512 55 144 15,214 61,145 9,214 70,358 63Ju_.._ .................. 6,355 151,224 6,596 164,176 53 794 15,117 59,648 9,263 68,910 67July ................. 6,341 141,613 6,449 154,403 53 445 14,995 59,273 9,167 68,440 56At_u_t ............... 6,343 140,166 6,071 152,580 54 434 15,456 60,644 9,246 69,890 46Seplember ......... 6,329 140,409 5,946 152,685 52 731 15,251 58,846 9,336 67,982 51Octc.L,er.............. 6,304 144,068 6,467 156,859 52 919 15,361 58,869 9,400 68,269 55November .......... 6,273 145,406 6,169 157,849 53 632 15,302 59,535 9,398 68,934 59December .......... 6,216 142,156 6,759 154,130 50 135 15,714 62,374 9,475 71,840 67
1993 January .............. 6,166 138,685 5,521 150,371 53,781 15,956 60,209 9,527 69,736 65February ............ 6,107 134,674 5,357 146,139 50,006 15,205 56,306 8,907 65,213 60March ................. 6,036 132,163 5,758 143,978 45,313 15,001 51,528 8,785 60,314 66April ................... 5,802 136,159 6,088 148,049 47,958 14,835 54,069 8,724 62,793 77May ................... 5,773 138,165 6,132 150,070 50,422 14,682 56,512 8,591 65,103 82June ................... 5,766 133,673 6,009 145,448 49,294 14,923 55,595 8,621 64,217 92Ju_y .................... 5,755 115,194 5,686 126,635 47,401 14,605 53,631 8,376 62,007 73August ............... 5,745 102,612 5,651 114,008 43,943 14,830 50,223 8,550 58,772 99September ......... 5,735 100,891 6,147 112,773 45,913 14,760 52,071 8,603 60,673 62
= Heavy oil _ctudes fuel oilno•. 4, 5, and 6, and residualfuel oils. FPC-4, "Monthly Power Plant Report." 1982 forward--Energy Informationb Lightoil includesfuel oilnos. 1 and 2, kerosene, and jet fuel. Administration(EIA), Form EIA-759, "Monthly Power Plant Report.' • Allc GT/IC = Gas turbine and internal combustionplants. Other Data: 1873-September 1977--FPC, Form FPC-4, "Monthly PowerNA=Noqavailable. Plant Report." October 1977-1979---FERC, Form FPC-4, 'Monthly PowerNotes:, Geographic coverageis the 50 States and the Districtof Columbia. Plant Report." 1980--EIA, Electric Power Monthly, March 1991, Table 28.
• To(aismay not equalsum o( components due to independentrounding. 1981--EIA, Electric Power Monthly, March 1992, Table 28. 1982 and 1991Sources: • Prime Mover Type Data: 1973-Septamber 1077---Federal monthly data--EIA, Electric Power Monthly, March 1993, Table 28. 1983
Power Commission (FPC), Form FPC-4, "Monlhly Power Plant Report." forward (except 1991 monthly dota)--EIA, Electric Power Monthly,October 1977-19(11--Federal Energy RegulatoryCommission(FERC), Form December 1993, Table 28.
102 Energy InformaUon AdminiubaUon/Monthly Energy Review December 1993
Sources for Table 7.3 • All Other Data: 1973-September 1977--FPC, Fore,FPC-4, "Monthly Power Pla=_tReport." October 1977..1979_FERC, Form FPC-4, "Monthly Power PlantReport." 1980---EIA, Electric Power Monthly, March
• Prime Mover Type Data: 1973-September 1977_ 1991, Table 17. 1981_EIA, Electric Power Monthl);Federal Power Commission (FPC), Form FPC-4, March 1992, Table 17. 1982 and 1991 monthly data_"Monthly Power Plant Report." October 1977.1981_ EIA, Electric Power Monthly, March 1993, Table 17.Federal Energy Regulatory Commission (FERC), Form 1983 forward (except 1991 monthiy data)_EIA,FPC-4, "Monthly Power Plant Report." 1982 forward_ Electric Power Monthly, December 1993, Table 17.Energy II_fo_mation Administratio_i (EIA), FormEIA-759, "Monthly Power Plant Report."
EnergyInformationAdministration/MonthlyEnergyReviewDecember1993 103
Section 8. Nuclear Energy
In September 1993, U.S. nuclear generating units No low- or full power licenses for nuclear power plantsproduced a total of 50 net terawatthours (billion kilo- were issued by the Nuclear Regulatory Commissionwatthours) of electricity, 2 percent 8 less than in during September 1993.September 1992. Nuclear units generated at an
average capacity factor of 70.1 percent, 1 percentage On September 30, 1993, there were 109 operablepoint lower than in September 1992. Nuclear power nuclear generating units in the United States, with asupplied 21.1 percent of the total electric utility- collective net summer capability of 99.0 million kilo-generated electricity in September 1993, compared with watts of electricity. Of the 109 operable units, 21 units21.7 percent in September 1992. generated at less than 25 percent of capacity because
of maintenance, refueling, or repair outage, and 14 ofthe 21 units generated no electricity during the month.
Nuclear generation and the average capacity factor Two operable units, Browns Ferry 1 and 3, have beenwere higher in the first 9 months of 1993 than they shut down since March 1985. Each unit had a capacitywere during the first 9 months of 1992; however, the of 1,065 megawatts electric.share of electricity was lower. Specifically, nucleargeneration for the first 9 months of 1993 was 1 percenthigher than generation during the first 9 months of As of September 30, there were 116 domestic nuclear
generating units in all stages of construction and1992. During the same period, the average capacity operation. The aggregate net design capacity offactor the U.S. nuclear units was 72.1 percent in 1993 operable units was 101.1 million kilowatts, and theand 70.5 percent in 1992. The average nuclear share design capacity of units under construction was 8.5of electricity for the first 9 months of 1993 was 21.3, million kilowatts, for a total design capacity of 109.6compared with 21.9 for the same period in 1992. million kilowatts.
8Percenlage changes are based on numbers shown in the following tables.
EnergyInformationAdministration/MonthlyEnergyReviewDecember1993 105
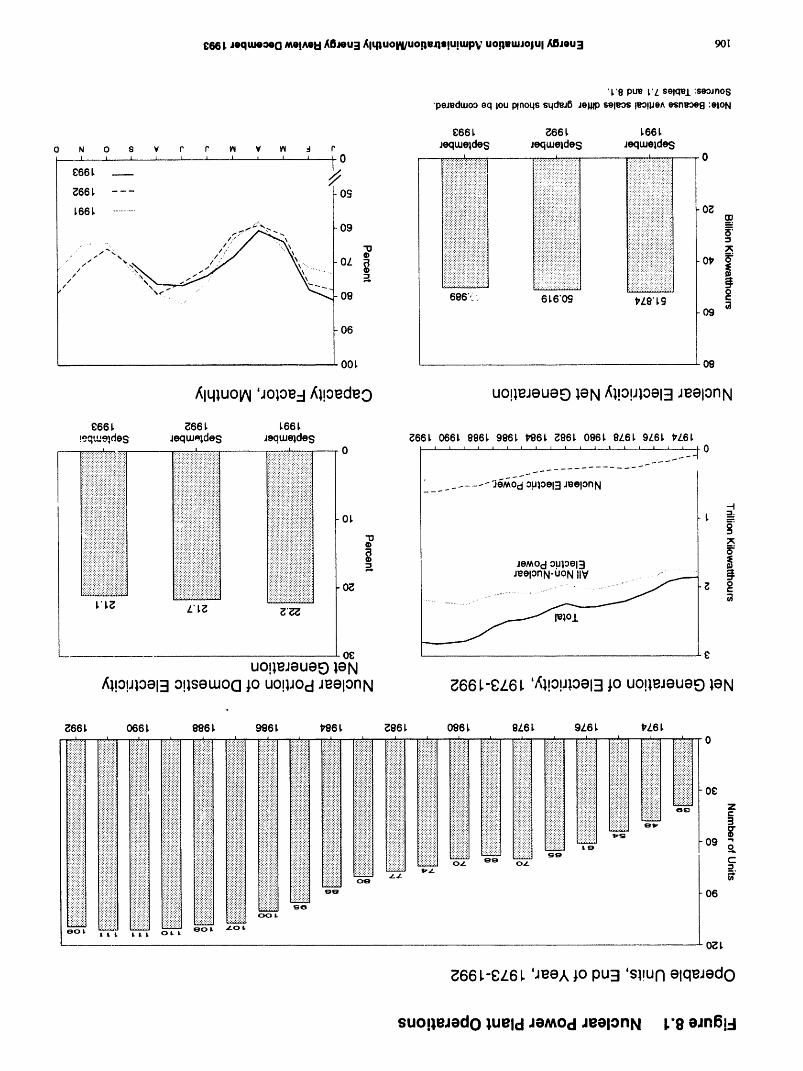
£B6I..0_lum_c! MoI^OUAB,_u3 AlqlUOlAI/uorle4OlUlWpVUOlleWJOtUl/dBJou3 90!
'L'8 ptmL'/.selCl_l:seoJnos'peJeduJooeq lOUPlnoqssqche_JeglPseleosleOllJeAesneoe8:elON
£66L _66L L66L
O N 0 g V P P t_ V lhl d f' Jeqtueldes Jeq_ueldes Jeqtueldes
l - ill!! .............. .................................?:'8?::::::::::::::::::: !:i::::i:i3i:i:!:i:!:i:i:i?i
,_ ........ _izi;_)iiiiili}!iiii!i!i!i iiiii[i!ii!i:ii!?_iii!_i!iii!!!il::::::::::::::::::::.,.,,.., ., ,.,...,....,.,,..,.,,
_6eL .............. :..........................iiill ;!!!i!ii!!!i_iii!iii::.:.:.:.:.:.:.:.i_?ii_iiL::::::.:,:,:.:.:::..::.;_iiiil;;_;iiiii_iii;i_i_iilO_•' _,,_ ::::::::::::::::%:; ::;::::::,:.:.:.:.>,:.>: ::::::::::::::::::::::::::::::::: __,
,._..--"...,.,.:.., 09 iii!i;i:;:!:i:i:i:ii:i:!:i:iiiit ............................ m,i;i;i.liliiiiiiiiiii;i;i_iiiiiii] .........;Usi:;!iiiiiil _;;!i;_ii_iii;;;;;i;_;;:;; _".... "' _ "o Iii;iiiiiiii;i!iiii!iiiii!ii! iliiii!iiiiiii!iiii!ii!i!ii _!;_i;i!_!_i;;#!;;_;_;_
• " ./ ". i ....... OL _ :_:!:_:_ _;_i;ii!iiiii!i!i!_i_; ;;_!;;;;_i;_i_!;_#! -.
" " -- ::::::....... :::::: iii!_ii:iiiiiiiiiiiii!!i:i_i]:ilk
"'_" .... _ 08 6e6":. 61.6"09 t_LS'l.g" _j
O9
06
OOi O8
/_lqluo_ 'Joloe-I/_l!oedeo uo!leJeueo leN/_l!o!Jloel3 JeelonN
866 _ _66_ 1.66I.!eq',._ldeS ,lequseldes ,leqmeldes _661. 066_ 9861.9861. t_'61, _861. 0861. G'L61.9L61.#Z6t.
....... ,:.:.:.:.:.:.: .:.:,:::.,.:.:.:.:, _ _iiiiiiiii!i!! ' i:i:i:i:i:!:i', . i:i:i:!::i:i.!:i:i:! _ _ _ _-:':':':'>:'; :":::::::::::: i_::;:::::!:!:i:!:':;:::::;:: _ _ --
............................. K:_........i:i:i:!:i:i: ._--_-i:i:i:;:!:i:i :::::::::::::', ........:.:.:.:..:.:.:.:.:.:.............................. ouloel3 JeelonN.............. lliii_ii!_!_i_;!i:;::i] ..................... "
::':' ,,,........v .... :';:':':.:':.:.:,:.:.:.:.:.:,:_ .'.'.'.'..:.:.:.:.:.:.: I_i;iii!i:i:i:!:!::::::::::::::'::'::':';"" :::::::;::;::: ...... :':':':':': --4
.........ii;#iiiii.:4 .............. if;::@:i! "_.li::.ili}::iiil_i_i_i_::_i_!_:::: ....i::ii::i:::.i::iill _..:..:.......::_:_:_:_:_:O_ t,:.:.:::.::- ,..::{:_u:.:.:::.:.: n;#_i;_;_:_:_u_;{;_;;_ o_.'.:.:.:.:.:-'..'..:.;.:.:._:.:.:, :':':':':':' ..v... :_
:::::::::::::: =:::_:::::::::'"""'" _ii_ !d:::::.:.:.:,:.:.:.:.:.:.............. ........:.:,:,:,:,:.: - ...,.,.:::::::::;;: _.
t:.:.:.:,:,:..:,:,:.:.:.:.:::: | .:,:.:.:.:+ _ :::': :'::':':':'::;:::::::::::::::::;::_.:.:4 :-:,:.:.:.;.: i;-':;::::;::::;:;:::::::::
I::iii::ii::!:..............._:_:' _ ";::_:>;::!!ii!!i!;iiil, :i:i:i::!:!:!:i:;:! a JeModoul0el=l
...............;:::: i!iiiiiii;i _ i:i:i:i;:!:i:!:i:!: JeelonN-UON IIV
r':::::::::..........':';':';':':':'.............iiii::i] _:!!ii_"........':';':' ii!!iiii!!i! ....__.......... ................ ...... • .......... •...... ' '" '
'::':".':7'::::::::'-:: !:;:;:;'-::::;:::;:::::::::: O.......:.:.:.:.:::::::::::::::!:!ii:l _:':'..:.:.:iiii r"_..,'. '.'::' !ili!ii!;l!i O_ _ _-
_ _ :,:.:.:.:.:.:+:.:=:::...._:::::.::_ _ i3I,'_ L'I._ _'_,-_
I0_ g
uo!le_eueo leN_l!o!Jloel30!lSeLUOOJOUO!lJOclJeelonN _66 I.-f_L6I. '/,l!o!Jloel3 to uo!leJeueco leN
_66I. 066 996 I. 986 t_86I. _96 I. 096 I. 9L6I. 9L6 I. _'L6I.
' ..... ' ....... '.... ' ............::!ii::::::::F:kiiiiiii!iiiiii:4iiii::............'............. ..............i:!-iu:i ..................i¢_:!:_¢_i!ili_i!:;iii:_:i:!:i:_: i!i!i_';ii!ii_i ............ :............ '...........:............ ::.:¢ .............!:i:_:_:i:_: ' ................................. . .... . ..... ........... .:.;.:.:.:.: .:.:.:.:.:.:. ............ v.,.,,,,,, i.:.:,:.:,:.:,l ,:..:,:,.4.....v.... :::::::::::: .:.:.:.:.:.;. ...... :.:.:.:.:.:.: .:.:.:.;.: :.:.:.:.:.:. : :.:.:.:.:.: ........ ._ ..,:::::::::::: : :.:.:.:.:.:....... ....... ::::::::::: i:i:i:!:i:!: :i:i:i:!8!: ':':':':':': :::::::::::: i!ii!ii!!i!!i :.:.:.:.:.:.: . ........ .:.:.:.;.:.: . .:....;.:.:.= _ _ : :::::;;::_:.:.:,:':.:. .:.:...:,:.: iliiiiiii!i! :i:i:i:i:i:i: :::':':':" .:.:.:.:.:,: ..'.'.':........... _ _ ................._i:iiii_i_ilil::ii::!!::iiii:: :!:i:!:_:!:i: :............ ii:/;ii::ii:_ ............... _:;i_i_:;i!:;]............." : " ...... :::::::::::: _:i:!:i:!:i: :'::':':':': ....... !iiiii!ii!i! .........
"""......... : ':':':':':':' ":":':':': '" ........ :i:!:iSi:i: :.:.:.:,:.:.... :.:.:.:.: :i:i:i:i:i:i: i:!:!:i:i:i:i .:.:.:.:':: :'::':+::' :,,._.......... i_.;.:.::'...::'. .:.::.:.:.:. ::;::;:::::'. ':;'::';':': ..11,._:::::::::::: !iiii!iii!_iii " " : :':':':':':': :':':':':':' ':':':':+: i:!:!:iSi: :::::::::::: !:!:i:i:i:i: "'"'"" ...... ::::::::::::: .......'"'"...... : ::::::::::::: :::::::::::'. :':':';'::' .,....,..,,,. %:'::::::1 .... '.;:::::;:::: ,..,..-.,.v,
.......................................; .............. :......................................:_:i:_:iu.............._ f_i!::iiiii::::i.............i:_:i:;:_:;:_ 09........ ..... . ........ ....y.v ......-...... Y,...,,.v , .....
.:.:.;.:.:.: ...... : ................... ;::;:::::::: :.:.:.::.:.: ........... :.:.:.:.:.:.: _::'::'::' ':':':':':':': :'::':':': --- ....'"'"" :i:i:i:i:!:i i:!:i:i:i:!: ":':':':':' .'..'..'.'. _ :.:.:.:-:-:. ,_',_:::::::::::: :::::::::::::: ":'::: :': . : .... _ iiiii_iiiiii! '"""'"' :::::::::::: ::::::::::::: _tg _ C:
...................................................., .............d .....................................;i;i iil;i ii::;::::::::: :::':':':': :':':::': : :i:i:!:i:!:i: :::::::::::: i:!:!:i:i:i: :::::::::::: iiiiiiiiii!i ":"-':':" o_. oz :_":':':':':': ':':':':':':': ':':':+:': .............'- :....:.:+:.: :iii!!!!!i!!i :::::::::::: :::::::::::: :.:.:.:.:.:.: '"'"'"'-----_ 1_',,¢_ --.i:!Si:::i: ':'::':':': :.:.:.:.:.:.... =- .,.........,. '"",'"'" !:i:i:i:i:!: _ ____ _"
..............................ii::iiiiii::i_:_ ...................................,:.:.:.:.:::i:i:i:::i:i: ..._ :i:i:i:i:i:i:i iiiiiii;iii: .:.:.:.:.:.:_ 06....... .......... . -:..-.._ :.:,:.:.:,:.:. :.:.:.:.:.:._ :.:.:.:.:.:.
....'"". ....... i!ii!i!iiiiii '.:'.;i::::::::i ':':':':':':':+:.,,.:.:.: ,....,...,,,. ...... :::::::::',:: i_1_"'""'"" ':':'::':':' :i:i:!:!:i:!: : : :':':':':'::':!ii!ili!iiii!iiF:ii!ili!::::!:i:i:i:i:i:::::::::':'.I:::::::::::::: oo L!iiiiiiii!!!i ii!iiii!iiiii :i:i:i:i:!:!: .... i !!iiii!i!_iiii
•:.:,:.:.:.:. :.:.:.:.:-:.: ::-.,;: .i_o, CT_ _- _ _o,. Lo_
0_,_
866 L-eL6 L 'JeeA jo PU3 'm!urlelqeJedo
suo!leJedo lUeld JeMOd JeelonN I.'9 eJnl_!-I
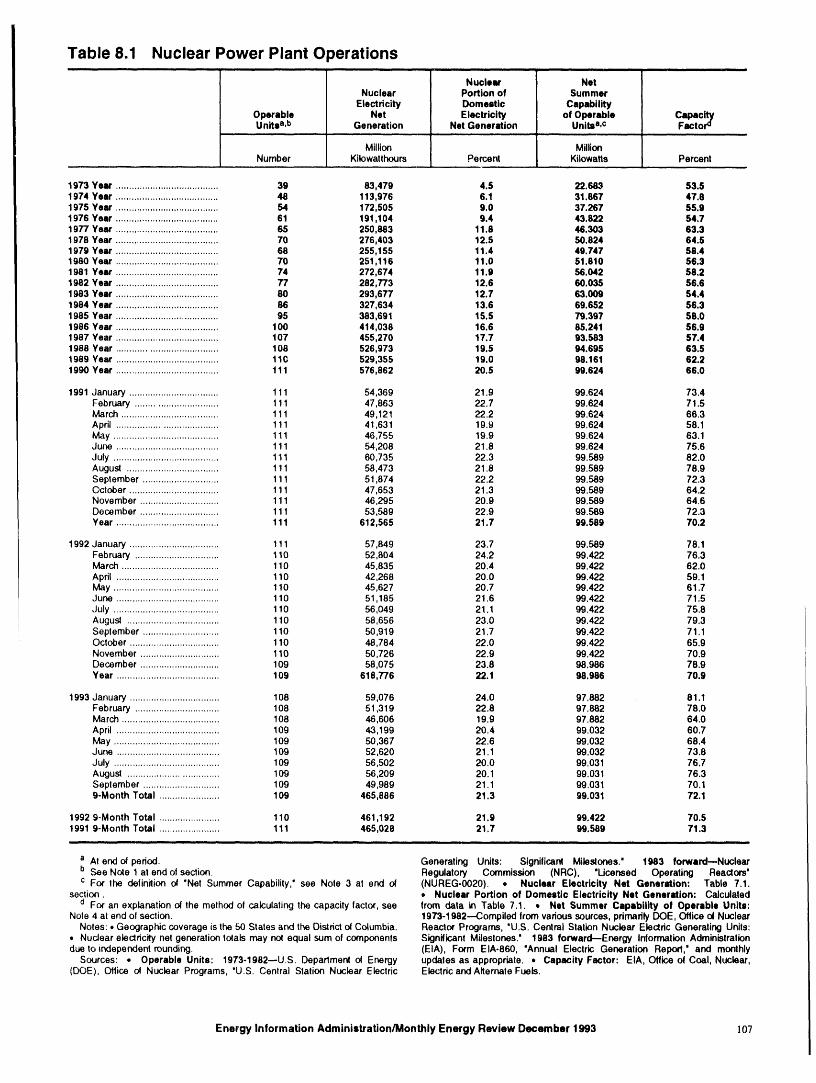
Table 8.1 Nuclear Power Plant O _erations...,.,,
Nuclear NetNuclear Portion of Summer
Electricity Domestic CapabilityOperable Net Electricity of Operable CapacityUnitea,b Generation Net Generation Unitsa,c Factoro
, ,. ,, q ,,,
Million MillionNumber Kiiowatthours Percent Kilowatts Percent
......
1973 Year ....................................... 39 83 479 4.5 22,683 53.51974 Year ....................................... 48 113 976 6.1 31.867 47.81975 Year ....................................... 54 172 505 9.0 37.267 55.91976 Year ....................................... 61 191 104 9.4 43,822 54.71977 Year ....................................... 65 250 883 11.8 48,303 63.31978 Year ....................................... 70 276 403 12.5 50,824 64.51979 Year ....................................... 68 255 155 11.4 49,747 58.41980 Year ....................................... 70 251 116 11.0 51,810 56.31981 Year ....................................... 74 272 674 11.9 56.042 58,21982 Year ....................................... 77 282 773 12.6 60.035 56.61983 Year ....................................... 80 293 677 12.7 63.009 54.41984 Year ....................................... 86 327 634 13.6 69.652 56.31985 Year ....................................... 95 383 691 15.5 79,397 58.01986 Year ....................................... 100 414 038 16.6 85,241 56.91987 Year ....................................... 107 455 270 17.7 93,583 57.41988 Year ...................................... 108 526 973 19.5 94.695 63.51989 Year ....................................... 11(; 529 355 t9.0 98,161 62.21990 Year ....................................... 111 576 862 20.5 99.624 66,0
1991 January .................................. 111 54 369 21.9 99.624 73.4February ............................... 111 47 863 22.7 99.624 71.5March ..................................... 111 49 121 22.2 99.624 66.3April ....................................... 111 41 631 19.9 99,624 58.1May ........................................ 111 46 755 19.9 99,624 63.1June ....................................... 111 54 208 21.8 99,624 75.6July ........................................ 111 60 735 22.3 99,589 82.0August ................................... 111 58 473 21.8 99,589 78.9September ............................. 111 51 874 22.2 99.589 72.3October .................................. 111 47 653 21.3 99.589 64.2November .............................. 111 46 295 20.9 99.589 64,6December .............................. 111 53 589 22.9 99.589 72.3Year ....................................... 111 612 565 21.7 99,589 70.2
1992 January .................................. 111 57,849 23.7 99,589 78.1February ................................ 110 52,804 24.2 99.422 76.3March ..................................... 110 45,835 20.4 99,422 62.0April ....................................... 110 42,268 20.0 99,422 59.1May ........................................ 110 45,627 20.7 99.422 61,7June ....................................... 110 51,185 21.6 99.422 71.5July ........................................ 110 56,049 21.1 99.422 75.8August ................................... 110 58,656 23.0 99.422 79.3September ............................. 110 50,919 21.7 99.422 71,1October .................................. 110 48,784 22.0 99.422 65.9November .............................. 110 50,726 22.9 99,422 70.9December .............................. 109 58,075 23.8 98.986 78.9Year ....................................... 109 618,776 22.1 98.986 70.9
1993 January .................................. 108 59 076 24.0 97.882 81.1February ................................ 108 51 319 22.8 97.882 78.0March ..................................... 108 46 606 19.9 97.882 64.0April ....................................... 109 43 199 20.4 99,032 60.7May ........................................ 109 50 367 22.6 99.032 68.4June ....................................... 109 52 620 21.1 99,032 73.8July ........................................ 109 56 502 20.0 99,031 76.7August .................................. 109 56 209 20.1 99.031 76.3Seplember ............................. 109 49 989 21.1 99,031 70.19-Month Total ....................... 109 465 886 21.3 99,031 72.1
1992 9-Month Total ....................... 110 461,192 21,9 99,422 70.51991 9-Month Total ....................... 111 465,028 21.7 99.589 71.3
a At endof period. Generating Units: Significant Milestones." 1983 forward--Nuclearb See Note 1 at endof section. Regulatory Commission (NRC), 'Ucensed Operating Reactors'c For the definition of "Net Summer Capability,' see Nole 3 at end of (NUREG-0020), • Nuclear Electricity Net Generation: Table 7.1.
section. • Nuclear Portion of Domestic Electricity Net Generation: Calculatedd For an explanation of the method of calculating the capacity factor, see from data in Table 7.1. • Net Summer Capability of Operable Unite:
Nole 4 at end of section. 1973-1982--Compiled from varioussources,pdmadly DOE, Office of NuclearNotes:• Geographiccoverage is the 50 States and the Districtof Columbia. Reactor Programs, "U.S. Central Stalion Nuclear Electdc Generating Units:
• NucJearelectricity net generation tolals may not equal sum of components Significant Milestones." 1983 forward--Energy InformationAdministraliondue to independent rounding. (EIA), Form EIA-860, "Annual Electric Generation Report," and monthly
Sources: • Operable Units: 1973-1982--U,S. Department of Energy updates as appropriate. • Capacity Factor: EIA, Office of Coal, Nuclear,(DOE), Office of Nuclear Programs, 'U.S. Central Station Nuclear Electric Electric and Alternate Fuels.
Energy Information Administration/Monthly Energy Review December 1993 107
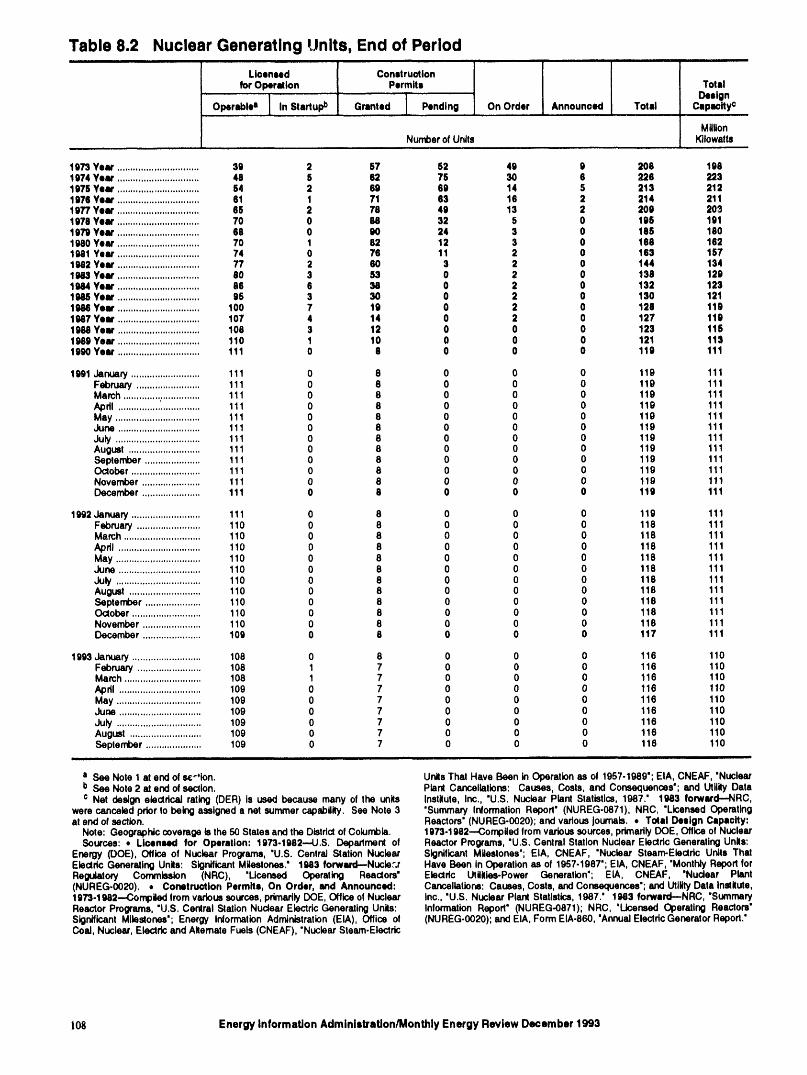
Table 8.2 Nuclear Generating Units, End of Periodii i i..i •
LioanNd Construolionfor Operation Permlta Total
' DesignOperables In Startupb Granted Pending On Order Announoed Total Capacity°
MillionNumberof Units Kilowatts
....
1973 Year ............................... 39 2 87 52 49 9 208 1981974 Year ............................... 48 8 82 75 30 6 226 2231976 Year ............................... 54 2 69 69 14 5 213 3121976 Year ............................... 61 1 71 63 16 2 214 2111977 Year ............................... 65 2 78 49 13 2 209 2031978 Year ............................... 70 0 88 32 5 0 198 1911979 Year ............................... 68 0 00 24 3 0 165 1801980 Year ............................... 70 1 82 12 3 0 168 1621981 Year ............................... 74 0 76 11 2 0 163 1571982 Year ............................... 77 2 60 3 2 0 144 1341983 Year ............................... 80 3 53 0 2 0 130 1291984 Year ............................... 86 6 38 0 2 0 132 1231986 Year ............................... 95 3 30 0 2 0 130 1211986 Year ............................... 100 7 19 0 2 0 128 1191987 Year ............................... 107 4 14 0 2 0 127 1191988 Year ............................... 108 3 12 0 0 0 123 1181989 Year ............................... 110 t 10 0 0 0 121 1131990 Year ............................... 111 0 e 0 0 0 119 111
1991 January .......................... 111 0 8 0 0 0 119 111February ........................ 111 0 8 0 0 0 119 111March ............................. 111 0 8 0 0 0 119 111April ............................... 111 0 8 0 0 0 119 111May ................................ 111 0 8 0 0 0 119 111June ............................... 111 0 8 0 0 0 119 111July ................................ 111 0 8 0 0 0 119 111August ........................... 111 0 8 0 0 0 119 111September ..................... 111 0 8 0 0 0 119 111October .......................... 111 0 8 0 0 0 119 111November ...................... 111 0 8 0 0 0 1lg 111December ...................... 111 0 6 0 0 0 119 111
1982 January .......................... 111 0 8 0 0 0 119 111February ........................ 110 0 8 0 0 0 118 111March ............................. 110 0 8 0 0 0 118 111April ............................... 110 0 8 0 0 0 118 111May ................................ 110 0 8 0 0 0 118 111June ............................... 110 0 8 0 0 0 118 111July ................................ 110 0 8 0 0 0 118 111August ........................... 110 0 8 0 0 0 118 111September ..................... 110 0 8 0 0 0 118 111October .......................... 110 0 8 0 0 0 118 111November ...................... 110 0 8 0 0 0 118 111December ...................... 109 0 8 0 0 0 117 111
1993 January .......................... 108 0 8 0 0 0 116 110February ........................ 108 1 7 0 0 0 116 110March ............................. 108 1 7 0 0 0 116 110Apdl ............................... 109 0 7 0 0 0 116 110May ................................ 109 0 7 0 0 0 116 110June ............................... 109 0 7 0 0 0 116 110July ................................ 109 0 7 0 0 0 116 110August ........................... 109 0 7 0 0 0 116 110September ..................... 109 0 7 0 0 0 116 110
i ll|ll .,
a See Note 1 at end of sz"*ion. UnitsThat Have Been in Operationas of 1957-1989"; EIA, CNEAF, "Nuclearb See Note 2 at end of section. Plant Cancellations: Causes, Costs, and Consequences'; and Utility Datac Net design electrical rating (DER) is used because many of the units Institute, Inc., "U.S. Nuclear Plant Statistics,1987." 1983 forward---NRC,
were canceled prior to being assigneda net summer capability. See Note 3 'Summary InformationReport" (NUREG-0871); NRC, "Licensed Operatingat end of section. Reactors"(NUREG.0020); and vadous journals. • Total Design Capacity:
Note: Geographiccoverageis the 50 States and the Distdct of Columbia. 1973-1982--..Compiledfrom varioussources,primarilyDOE, Office of NuclearSources: • Licensed for Operation: 1973.1982--U.S. Department of Reactor Programs,"U.S. Central Station Nuclear Electdc Generating Units:
Energy (DOE), Office of Nuclear Programs, "U.S. Central Station Nuclear Significant Milestones'; EIA, CNEAF, "Nuclear Steam-Electric Units ThatElectdc Generating Units: SignificantMilestones." 1983 forward--Nucla:.r Have Been in Operationas of 1957-1987"; EIA, CNEAF, "MonthlyReport forRegulatory Commission (NRC), 'Licensed Operating Reactors" Electdc Utilities-Power Generation'; EIA, CNEAF, 'Nudear Plant(NUREG-0020). • Conetruotion Permits, On Order, and Announced: Cancellations: Causes, Costs, and Consequences'; and Ulilily Data Institute,1973-1982--Compiled from various sources, primarilyDOE, Office of Nuclear Inc., "U.S. Nuclear Plant Statistics,1987." 1983 forwerd--NRC, "SummaryReactor Programs, "U.S. Central Station Nuclear Elactdc Generating Units: Information Report" (NUREG-0871); NRC, 'Licensed Operating Reactors"Significant Milestones'; Energy Information Administration(EIA), Office of (NUREG-0020): and EIA, Form EIA-860, 'Annual ElectdcGenerator Report."Coal, Nuclear, Electricand Alternate Fuels(CNEAF), "NuclearSteam-Electrlc
108 Energy Information Administration/Monthly Energy Review December 1993

Nuclear Energy Notes bothretired in 1974;HumboldtBay (65 MW), officiallyretiredin 1976;Dresden1 (200 MW), retiredin August1979; LaCrosse (51 MW), retired in May 1987; Fort
1. Operable Units" Nuclear generating units that have Saint Vrain (217 MW), retired in August 1989; Yankeebeen issued a full-power license by the Nuclear Rowe 1 (185 MW), retired in February 1992; SanRegulatory Commission (NRC). Onofre 1 (436 MW), retired in December 1992; and
Trojan (1,104 MW), retired in January 1993.
Exceptions: The Shippingport (60 megawatts (MW))and the Hanford-N (840 MW) nuclear units were in- 2. In Startup: The period of time between a nucleareluded in the operable units until 1982 and 1988, generating unit's initial fuel loading date and therespectively. The Shippingport unit was excluded from issuance of its full-power license. During that period,the operable category during March 1974-August 1977 the unit is undergoing low-power testing and thedue to a major core modification outage. Hartford-N, maximum level of operation is 5 percent of the unit'san unlicensed unit used for defense materialproduction, design thermal rating.was included in the operable category because power
was produced as by-product and sold commercially. 3. Capacity: Nuclear generating units may have moreThree Mile Island 2 (880 MW) experienced a major ac- than one type of net capacity rating, including the fol-cident in 1979 and, although that unit still retains its lowing:operating license and site cleanup continues, there is noplan to restart it. Therefore, it has not been includedin the operable category since March 1979. Although (a) Net Summer Capability_The steady hourly outputShoreham received a full-power license in April 1989, that generating equipment is expected to supply to sys-the unit is not currently scheduled to operate and, there- tern load, exclusive of auxiliary power, as demonstratedfore, has not been included in the operable category, by test at the time of summer peak demand. AuxiliaryRancho Sect (873 MW) was shut down by the power of atypical nuclear power plant is about5 percentSacramento Municipal Utility District (SMUD) in June of gross generation.1989 following a referendum o, its continued operation.Because there are currently no plans to operate it as a (b) Net Design Capacity or Net Design Electricalnuclear unit, it is no longer included as an operable unit Rating (DER)_The nominal net electrical output of abut is identified as a unit shut down for an extended unit, specified by the utility and used for plant design.period. As soon as SMUD and the NRC formalize the
plant's official retirement, it will be noted as such in 4. Monthly Capacity Factors' The monthly capacitythis report. The Department of Energy-operated Ex- factors are computed as the actual monthly generationperimental Breeder Reactor 2 unit is not a commercial divided by the maximum possible generation for thatreactor and is therefore not included in the operable month. The maximum possible generation is the num-category, ber of hours in the month multiplied by the net summer
capability at the end of the month. That fraction is thenIn addition, nine units have been retired and therefore multiplied by 100 to obtain a percentage. Annualremoved from the operable category. Those units are: capacity factors are averages of the monthly values forPeach Bottom 1 (40 MW) and Indian Point 1 (265 MW), that year.
EnergyInformationAdministration/MonthlyEnergyReviewDecember1993 109
t_
Section 9. Energy Prices
Crude O11. The average price of domestic crude oil than the August 1993 price but 12 percent lower thanpurchased at the wellhead was $13.71 per barrel in the September 1992 price.September 1993, 20 percent below the level in Sep-
tember 1992. The refiner acquisition cost of imported Electricity. The average price of electricity sold tocrude oil in September 1993 was $15.62 per barrel, 19 all ultimate consumers in the United States in Septem-percent below the September 1992 level. The average her 1993 was 7.3 cents per kilowatthour, 1 percentcost of domestic crude oil in September 1993 was above the September 1992 mean price. The price of$16.03, 19 percent less than the September 1992
electricity sold to residential consumers in Septemberaverage. 1993 averaged 8.8 cents per kilowatthour, 2 percent
above the September 1992 price. The price ofMotor Gasoline. The national city average retail price electricity sold to commercial consumers averaged 8.0of unleaded regular gasoline at all types of stations was cents per kilowatthour in September 1993, the same as$1.09 per gallon in October 1993, 6 percent lower than the September 1992 price. The price of electricity soldthe price in October 1992. The price of unleaded to other consumers was 7.1 cents per kilowatthour, 3premium gasoline averaged $1.28 per gallon in October percent above the September 1992 price. The price of1993, 5 percent lower than the price in October 1992. electricity sold to industrial users in September 1993
averaged 5.1 cents per kilowatthour, the same as theprice 1 year earlier.
Residual Fuel Oil. The average r_rice, excludingtaxes, of residual fuel oil sold to era users in Septem-ber 1993 was 32 cents per gallon, .5percent lower than Beginning with January 1986, there were new seriesthe previous month's price and 18 percent below the of national average price estimates based on a statisti- •September 1992 average. The average resale price, cally derived sample of both publicly and privatelyexcluding taxes, of residual fuel oil in September 1993 owned electric utilities. Previously, average price es-was 27 cents per gallon, slightly lower than the August timates were derived from selected privately owned1993 average and 21 percent below the price 1 year electric utilities and were not national averages.earlier.
Natural Gas. The estimated average wellhead priceAviation Fuel. The average price, excluding taxes, of of natural gas for September 1993 was $2.00 peraviation gasoline sold to end users in September 1993 thousand cubic feet, 4 percent above the Septemberwas 99 cents per gallon, 1 percent lower than the pre- 1992 price.vious month's price and 7 percent lower than theSeptember 1992 price. The average price, excludingtaxes, of kerosene-type jet fuel sold to end users in The average price of natural gas delivered to electricSeptember 1993 was 55 cents per gallon, 1 percent utility plants was $2.60 per thousand cubic feet inlower than the previous month's average price and 15 August 1993 (latest date for which data are available),percent lower than the September 1992 average price. 7 percent above the August 1992 price. The average
price of natural gas used by residential consumers inSeptember 1993 was $7.74 per thousand cubic feet, 8
No. 2 Distillate Fuel Oil. The September 1993 percent above the September 1992 price. The averagenational average price, excluding taxes, of heating oil price of natural gas used by commercial consumers insold to residential customers was 84 cents per gallon, September 1993 was $5.26 per thousand cubic feet, 122 percent lower than the August 1993 price and 5 per- percent higher than the September 1992 price. Thecent lower than the September 1992 price. The average average price of natural gas used by industrial con-price of No. 2 fuel oil sold to all end users was 55 sumers in September 1993 was $3.03 per thousandcents per gallon in September 1993, 1 percent higher cubic feet, 7 percent above the September 1992 price.
EnergyInformationAckninis_ration/l_nthlyEnergyReviewDecember1993 111
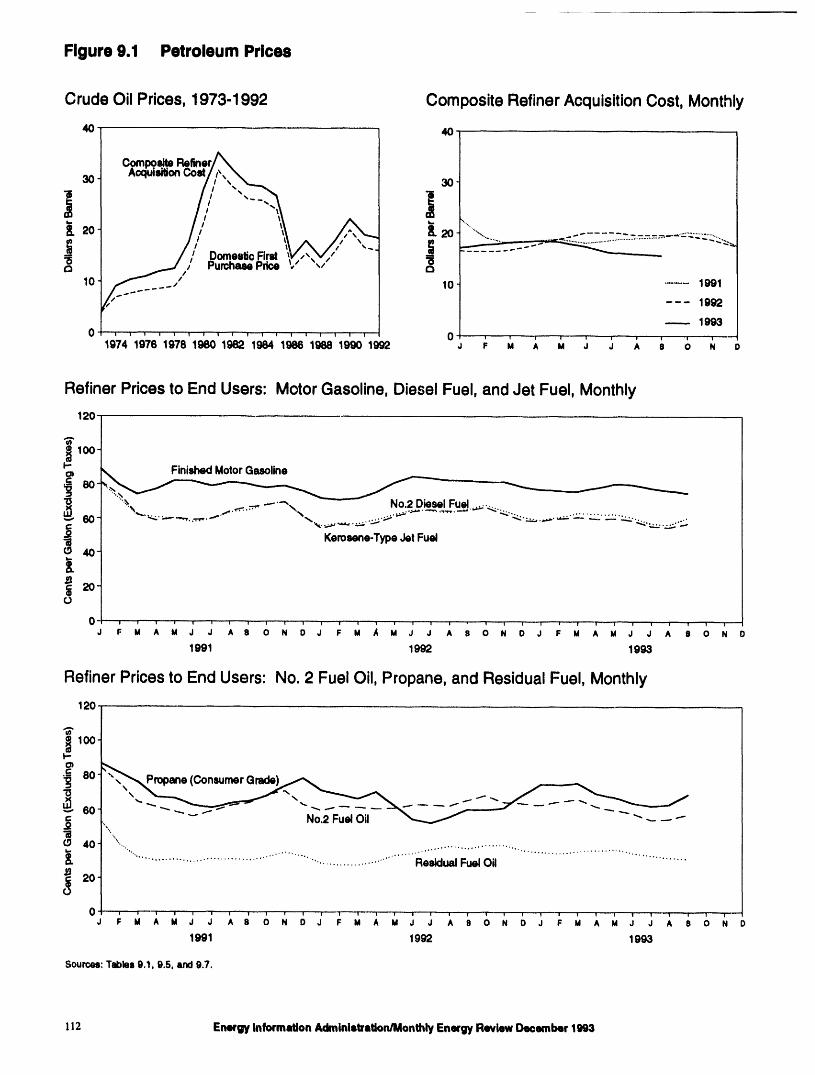
Figure9.1 PetroleumPrices
CrudeOilPrices,1973-1992 CompositeRefinerAcquisitionCost,Monthly4O 4O
Comic. site Flermer/h_
_2o i2o -,.. __...............=,=.............
e.l c)
10 ,, ..... .' 10 .... 1991"" --- 1992
19930 , , , , , , , , , , , m i i _ _ _ , 0 "_ ,1974197e19781_o1_z1_41_198819=:)1992 J F _ ,_ _ _ ,; ,_ . _, _ o
RefinerPricestoEndUsers:MotorGasoline,DieselFuel,andJet Fuel,Monthly120
tFinishedMotorGasolineSO"_,, i_...___
_" 60" "'_ .-,--..""'_'_ .-"'-"\_,_ No.2._D.ieselFuel ,.,._._"%-..._._. _.. ..._. ..=_-......... . ._:......................... :_ ._._ "<. _ ..._. -"-" _ _ _ "L_.. ._ ...... ._. .:__. . .._.__
n Kem=_ne-TypeJet FuelcO 40-
i_-0
0-........ o .... ' i .... '.-'' ' __ ' ' ;' .....J F M A M J J A 8 N O J F M M J J A 0 N O J M A J J A 8 0 N O
1991 1992 1993
RefinerPricestoEndUsers: No.2 FuelOil,Propane,andResidualFuel,Monthly120
80 ConsuPropane(ConsumerGrade)
"" No.2 FuelOd "" -.- _ _"
cO 40 "........... .,'" .... , ....................
................................. ResidualFuelOil"''''".., ........... ..... ...o'" •...............
_ 2o! ...... i ! i
J F I_ A l_i ,J ,J A II (_ I_I I) J' I: M A M -; J k '" r' '- - .. _ .....0 N [) J _: M A M J J A II 0 N D--
1991 1992 1993
Sources:Tables 9.1, g.5, and9.7.
112 En_rW Inlormstion Ackninislration_llonthly Energy Review De_ember 199,1
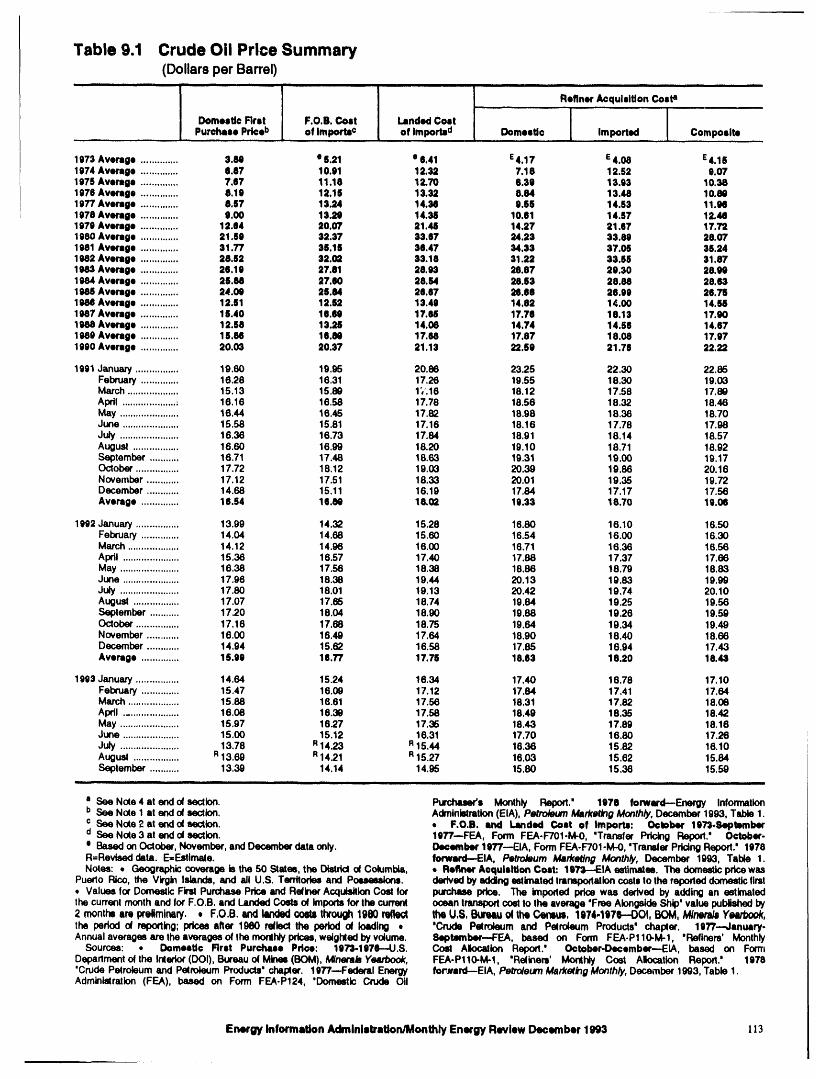
Table 9.1 Crude Oil Price Summary(DollarsperBarrel)
I [1973 Average .............. 3.89 e 6.21 • 6.41 E4.17 E4.08 E4.151974 Average .............. e.e7 10.91 12.32 7.18 12.52 9.071975 Average .............. 7.67 11.18 12,70 8.30 13.93 10.381976 Average .............. 8.19 12.16 13.32 8.84 13.48 10.80
! 1977 Average .............. 8.57 13.24 14.34 0.66 14.63 11.061978 Average .............. 9.00 13.29 14.34 10.61 14.67 12.461979 Average .............. 12.04 20.07 21.46 14.27 21.67 17.721980 Average .............. 21.60 32.37 33.87 24.23 33.80 28.071981 Average .............. 31.77 36.16 36.47 34.33 37.06 35.241982 Average .............. 28.52 32`03 33.18 31.22 33.55 31.871983 Average .............. 28.19 27.81 28.03 28.87 28.30 28.991984 Average .............. 26.88 27.60 28.64 28.83 28.88 28.631986 Average .............. 24.08 26.84 26.67 34.68 26.99 26.761984 Average .............. 12.61 12.62 13.49 14.82 14.00 14.661987 Average .............. 16.40 19,69 17,66 17.76 18.13 17.901988 Average .............. 12.58 13.26 14.08 14.74 14.56 14.671980 Average .............. 16.84 16.80 17.68 17.87 18.08 17.971990 Average .............. 20.03 20.37 21.13 22.68 21.75 22.22
1991 January ................ 19.60 19.95 20.86 23.25 22.30 22.85Febcuary .............. 16.28 18.31 17.26 19.55 18.30 19.03March ................... 15.13 15.80 1"_'.18 18.12 17.58 17.89Apdl .................... ; 16.18 16.58 17.78 18.58 18.32 18.46May ...................... 16.44 16.45 17.82 18.98 18.36 18.70June ..................... 15.58 15.81 17.16 18.16 17.78 17.98July ...................... 16.36 16.73 17.84 18.91 18.14 18.57August ................. 16.60 16.99 18.20 19.10 18.71 18.92September ........... 16.71 17.46 18.63 19.31 19.00 19.17October ................ 17.72 18.12 19.03 20.39 19.86 20.16November ............ 17.12 17.51 18.33 20.01 19.35 19.72December ............ 14.68 15.11 16.19 17.84 17.17 17.56Average .............. 16.54 16.89 18.02 19.33 16.70 19.06
1992 January ................ 13.99 14.32 15.28 16.80 16. I 0 16.50February .............. 14.04 14.68 15.60 16.54 16.00 16.30March ................... 14.12 14.98 16.00 16.71 18.36 16.56Apdl ..................... 15.36 16.57 17.40 17.88 17.37 17.66May ...................... 16.38 17.56 18.38 18.86 18.79 18.83June ..................... 17.96 18.38 19.44 20.13 19.83 19.99July ...................... 17.80 18.01 19.13 20.42 19,74 20,10August ................. 17.07 17.66 18.74 19.84 19.25 19.56September ........... 17.20 18.04 18.90 19.88 19.26 19.59October ................ 17.16 17.68 18.75 19.64 19.34 19.49November ............ 16.00 16.49 17.64 18.90 18.40 18.68December ............ 14.94 15.62 16.56 17.85 18.94 17.43Average .............. 16.99 16.77 17.76 18.63 18.20 18.43
1993 JanuanJ ................ 14.64 15.24 16.34 17.40 16.78 17.10February .............. 15.47 16.08 17.12 17.84 17.41 17.64March ................... 15.88 16.61 17.56 18.31 17.82 18.08April .................... 18.08 16.38 17.58 18.49 18.35 18.42May ...................... 15.97 18.27 17.35 18.43 17.89 18.16June ..................... 15.00 15.12 16.31 17.70 16.80 17.26July ...................... 13.78 R14.23 R15.44 18.36 15.62 18.10August ................. R13.69 R1421 R15.27 16.03 15.62 15.84September ........... 13.38 14.14 14.95 15.80 15.36 15.59
, __ llnnl .....
a See Nole 4 at end of section. Purchaser's Monthly Report.' 1978 forward--Energy Informetionb See No(e 1 at end ofsecUon. Admin_mtion (EIA), Petroleum Marketing Monthly, December 1993, Table 1.c See Note 2 at end of esctk)n. • F.O.B. end Landed Cost of Impom: October 197S-Septemberd See Nole 3 at end of seclkxl. 1977--FEA, Foan FEA-F701-M-O, 'Transfer Pricing Report.' October.• Based onOctober, November, and December data only. December leT/--EIA, Form FEA-F701-M-O, 'Transfer Pridng Report.' 1978R=Revleed data. E=Estimale. forward--.EIA, Petro/eum Marketing Month_/, December 1993, Table 1.Notes: • Geographic coverage is the 50 States, the Districtol Columb_., • Refiner Acquisition Cost: 197=-.-EIA estimates. The domesticprice was
Puerto Rico, the Virgin Islands, =rodall U.S. Territories and Possessions. derived by adding estimated tranepodatloncoststo the reporteddomesticfirst• Values for Domestic Fiml Purchase Price and Re_inerAcquisitionCost for purchase price. The imposed price was derived by adding an estimatedthe currentmonth and for F.O.B. and Landed Costs of Importsfor the current ocean transportcostto the average 'Free AlongsideShip' value publishedby2 months are IxeNminary, • F,O.B, and landed _ through 1960 mlk)(;t the U,,_, Bur_u o( the Cereus, 1974,1971---DOI, BOM, Minerals Yearbook,the period of reporting; prices after 1980 reflect the pedod of loading • 'Crude Petroleum and Pe(roleum Products' chaplet. 1077-.-Jsnuary-Annual averages are the averages o( the monlh_ypdces,welghledbyvotume. 84ptemb4P-FEA, based on Form FEA.P110-M-1, "Refiners' Monthly
Sources: • Ocmeatic Rrst Purchase Pdce: 1975-1976---U.S. Cost Alocation Report.' October-Decembar--EIA, based on FomlDepartment o( the Inledor (DOI), Bureau o4Mines (BOM), M/nerab Yearbook, FEA-P110-M-1, "Re(iners' Monthly Cost Alocation Report.' 1978'Crude Petroleum snd Patroleum Products' chapter, le77--Federal Energy forward---EIA, Petroleum Marketno Monthly, December 1993, Table 1.Admtn_ration (FEA), based on Form FEA-P124, 'Domestic Crude O11
Energy Information Administration/Monthly Energy Review December 1993 113
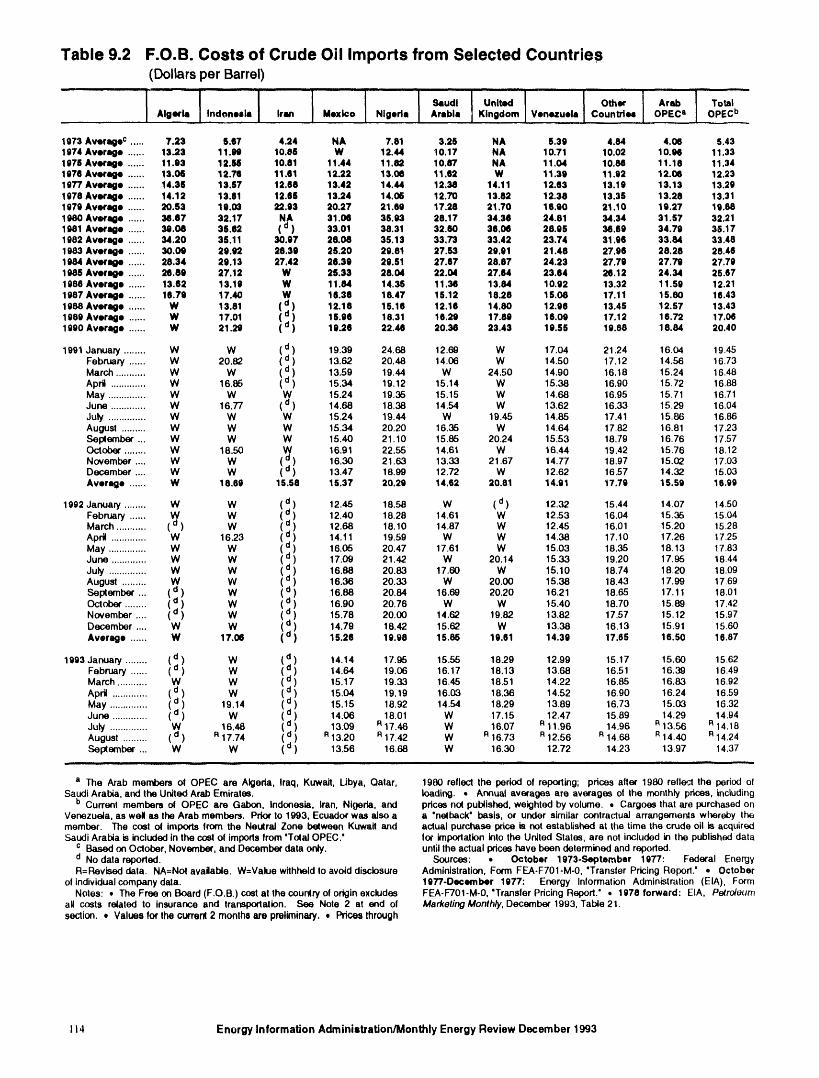
Table 9.2 F.O.B. Costs of Crude Oil Imports from Selected Countries(DollarsperBarrel)
i i i .i i i i
! 1 1 1"'1°°'-I l°°'I "r"'°"Algeria Indonezla Iran Mexico Nigeria Arabia Kingdom Venezuela CounVlex OPECa OPECb
1973 Averagec ..... 7.23 6.87 4.24 NA 7.81 3.25 NA 5.39 4.84 4.06 5.431974 Average ...... 13.23 11.99 10.86 W 12.44 10.17 NA 10.71 10.02 10.94 11.331076 Average ...... 11.93 12.56 10.81 11.44 11.82 10.87 NA 11.04 10.84 11.16 11.341978 Average ...... 13.O6 12.76 11.61 12.22 13.06 11.62 W 11.39 11.92 12.06 12,231977 Average ...... 14.35 13.57 12.68 13.42 14.44 12.38 14.11 12.63 13.19 13.13 13,291978 Average ...... 14.12 13.61 12.66 13.24 14.06 12.70 13.82 12.38 13.35 13.28 13.311979 Average ...... 20.53 19,03 22,93 20.27 21.69 17.28 21.70 16.90 21.10 19.27 19,881980 Average ...... 36.67 32.17 NA 31.06 35.93 28.17 34.36 24.81 34.34 31.57 32,211981 Average ...... 38.08 35.62 ( d ) 33.01 38.31 32.60 36.06 28.06 38.69 34.79 35.171982 Average ...... 34.20 35.11 30.97 28.08 35.13 33.73 33.42 23,74 31.96 33.84 33.481983 Average ...... 30.09 29.92 28.39 25.20 29.81 27.53 29.01 21.48 27.96 28.28 28.461984 Average ...... 28.34 29,13 27.42 26.39 29.51 27.67 28.87 24.23 27.79 27.79 27.791985 Average ...... 26.89 27.12 W 26.33 28.04 22.04 27.64 23.64 26.12 24.34 25.671986 Average ...... 13.62 13.19 W 11.84 14.36 11.38 13.84 10.92 13.32 11.59 12.211987 Average ...... 16.79 17.40 W 16.36 18.47 15.12 18.28 15.08 17.11 15,80 16.431988 Average ...... W 13.81 ( d
( d) 12.18 15.18 12.16 14.80 12,96 13.45 12.S7 13.431989 Average ...... W 17.01 ( d) 15.96 18.31 16.29 17.89 16.09 17.12 18.72 17.061990 Average ...... W 21.29 ) 19.26 22.46 20.36 23.43 10.55 19.88 18.84 20.40
1991 January ........ W W ( d) 19.39 24.68 12.69 W 17.04 21.24 16.04 19.45February ...... W 20.82 ( d) 13.62 20.48 14.06 W 14.50 17.12 14,56 16.73March ........... W W ( d) 13.59 19.44 W 24.50 14.90 16.18 15.24 16.48April ............. W 16.86 ( d) 15.34 19.12 15.14 W 15.38 16.90 15.72 16.88May .............. W W W 15.24 19.35 15.15 W 14.68 16.95 15.71 16.71June ............. W 16.77 ( d) 14.68 18,38 14.54 W 13.62 16.33 15.29 16.04July .............. W W W 15.24 19.44 W 19.45 14.85 17.41 15.86 16.86August ......... W W W 15.34 20.20 16.35 W 14.64 17.82 16.81 17.23Seplember .., W W W 15.40 21.10 15.85 20.24 15.53 18.79 16.76 17.57October ........ W 18.50 W 16.91 22.55 14.61 W 16.44 19.42 15.76 18.12
d ) 16.30 21.63 13.33 21.67 14.77 18.97 15,02 17.03November .... W W ( d )December .... W W ( 13.47 18.99 12.72 W 12.62 16.57 14.32 15.03Average ...... W 18.89 15.58 15.37 20.29 14.62 20.81 14.91 17.79 15.59 16.99
1992 January ........ W W ( d ) 12.45 18.58 W ( d) 12,32 15.44 14.07 14.50February ...... W W ( d ) 12.40 18.28 14.61 W 12,53 16,04 15.35 15.04March ........... (d ) W ( d ) 12.68 18.10 14.87 W 12.45 16.01 15.20 15.28Ap_ ............. W 16.23 ( d ) 14.11 19.59 W W 14.38 17,10 17.26 17,25May .............. W W ( d ) 16.05 20.47 17.61 W 15.03 18,35 18.13 17,83June ............. W W ( d) 17,09 21.42 W 20.14 15.33 19.20 17.95 18,44July .............. W W ( d ) 16.88 20.83 17.60 W 15.10 18,74 18.20 18.09August ......... W W ( d ) 16.36 20.33 W 20.00 15.38 18.43 17.99 17.69Sel_691qber ... ( d ) W ( d) 16.88 20,84 16.69 20.20 16.21 18.65 17,11 18.01October ........ ( d ) W ( d) 16.90 20.76 W W 15.40 18,70 15.89 17.42November .... ( d ) W ( d) 15.78 20.00 14.62 19.82 13,82 17.57 15.12 15.97December .... W W ( d) 14.79 18.42 15,62 W 13.38 16,13 15,91 15.60Average ...... W 17.06 ( d) 15.26 19.98 15.86 19.61 14.39 17.65 16.50 16.87
1993 January ........ (d) W (d) 14.14 17.95 15.55 18.29 12.99 15.17 15.60 15.62February ...... (u) W ( ) 14.64 19.06 16.17 18.13 13.68 16.51 16.39 16.49March ........... W W ( d ) 15.17 19.33 16.45 18.51 14.22 16.65 16.83 16,92April ............. ( d ) W ( u ) 15.04 19.19 16.03 18.36 14.52 16.90 16.24 16.59May .............. (" ) 19.14 ( u.) 15.15 18.92 14.54 18.29 13.89 16.73 15.03 16.32June ............. ( a ) W ( o ) 14.06 18.01 W 17.15 12.47 15.89 14.29 14.94July .............. W 16.48 (u) 13.O9 R17.46 W 16.07 R11.96 14.96 R13.56 R14.18August ......... (d) 917.74 (u) 913.20 917.42 W R16.73 912.56 R14.68 R14.40 914.24Seplember ... W W ( u ) 13.56 16.68 W 16.30 12.72 14.23 13.97 14.37
a The Arab members of OPEC are Aigeda, Iraq, Kuwait, Ubya, Qatar, 1980 rellect the period of reporting; prices after 1980 reflect the period olSaudi Arabia, and the United Arab Emirates. loading. * Annual averages are averages ot the monthly prices, including
b Current members ot OPEC are Gabon, Indonesia, Iran, Nigeria, and pdces no( published,weighted by volume. = Cargoes that are purchasedonVenezueJa, as wen as the Arab members. Prior to 1993, Ecuador was also a a 'nelback" basis, or under similar contractual arrangemerds wheret_ythemember. The cost ot imports from the Neulral Zone between Kuwait and actual purchase price is not established at the time the crude oil is acquiredSaudiArabia is included in the costol importsfrom 'To(al OPEC." tot importationinto the United States, are not included in the publisheddala
c Based on October, November,and December data ordy. untilthe actual priceshave been determined and reported.d No datareported. Sources: • October 1973-September 1977: Federal EnergyR=Revised data. NA=Nol available. W=Value withheld to avoiddisclosure Administration,Form FEA.F701-M.O, 'Transfer Pricing Reporl.' , October
of tndividualcompanydata. 1977-December 1977: Energy Information Administration (EIA), FormNotes: , The Free on Board (F.O.B.) costat the counlry o1originexcludes FEA-F7OI-M-O, "TransferPricing Repofl." • 1978 forward: EIA, Petroleum
all costs related 1o insurance and transportation. See Note 2 at end ol Marketing Monthly, December 1993, Table21.section. , Values forthe currer_2 monthsare preliminary, • Prices through
i] 4 Enorgy Information Administration/Monthly Energy Review December 1993
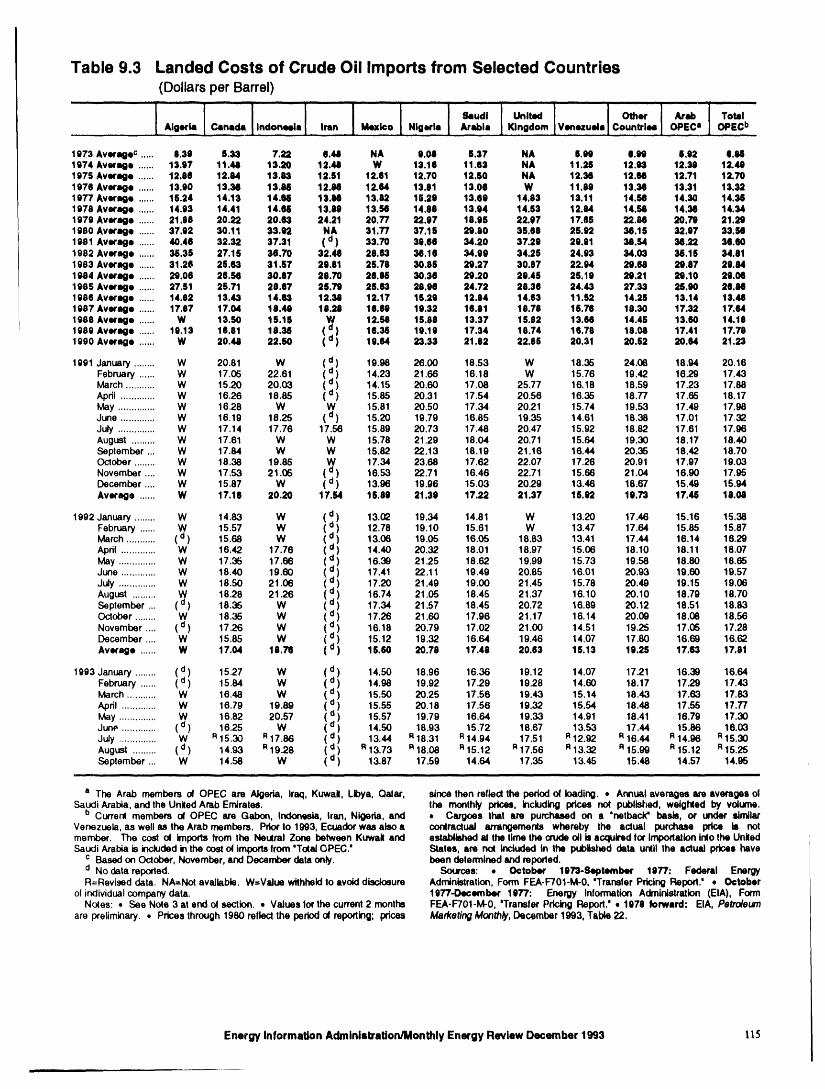
Table 9.3 Landed Costs of Crude Oil Imports from Selected Countries(DollarsperBarrel)
I I I !....I I ! n ! I I I_kkudi United Other Arab Total
. Algeria Ca,nada,, Indoneeia., Iron .. Mexico . Nigeria . Arabia . Kingdom .Vertezuala. Countrlee. OPECm . OPECb
1973 Averagec ..... 11.39 11.3(1 7.22 6.U NA 9.08 8.37 NA 6.8t) 6.89 11.92 11.881974 Average ...... 13.97 11.48 13.20 12.48 W 13.18 11.63 NA 11.28 12.83 12.38 12.481976 Average ...... 12.116 12.84 13.83 12.111 12.61 12.70 12.§0 NA 12.36 12.66 12.71 12.701978 Average ...... 13.90 13.3(I 13.88 12.38 12.M 13.111 13.08 W 11.38 13.35 13.31 13.321977 Averago ...... 15.24 14.13 14.M 13.M 13.82 15.29 13.89 14.113 13.11 14.M 14.30 14,351978 Average ...... 14.93 14.41 14.(LS 13.88 13.M 14.88 13,94 14.53 12.84 14.58 14.M 14.341979 Average ...... 21,118 20.22 20.63 24.21 20.77 22.97 18.98 22.g7 17._5 22.845 20.71) 21.291980 Average ...... 37.92 30.11 33.92 NA 31.77 37.18 21).80 35.68 26.92 36.16 32.117 33.M1981 Average ...... 40.48 32.32 37.31 ( d) 33.70 38.66 34.20 37.29 29.91 38.34 36.22 38.601982 Average ...... 35.35 27.15 36,70 32.46 28.63 35.111 34.99 34.25 24.93 34.63 35.111 34.1111983 Average ...... 31,28 25.63 31.87 29.61 28.78 30.811 29.27 30.117 22.94 29.68 29.117 20.841984 Average ...... 29.06 26.58 30.87 28.70 28.86 30.36 29.20 29.48 25,19 29.21 211.10 29.041985 Average ...... 27.51 211.71 28.$7 25.71) 26.63 28.96 24.72 28.38 24.43 27.3(1 28.110 28.881986 Average ...... 14.82 13.43 14,63 12.38 12.17 16.29 12.84 14.63 11.112 14.26 13.14 13.461987 Average ...... 17.117 17.04 111.48 111.28 16.89 10.32 18.81 10.711 16,78 111.30 17.32 17.64
1988 Average ...... W 13.50 18.16 _/ 12.58 15.811 13.37 15.112 13.58 14.48 13.60 14,1111989 Average ...... 19.13 18.111 18.38 ( ) 16.35 19.19 17.34 18.74 18.78 111.08 17.41 17.7111990 Average ...... W 20.48 22.50 ( d) 19.64 23.33 21.112 22.66 20.31 20.S2 29.84 21.23
1991 January ........ W 20.81 W ( d) 19.98 26,00 18,53 W 18,35 24,06 18.94 20.16February ...... W 17.05 22.61 ( _ ) 14.23 21.66 16.18 W 15.76 19.42 16.29 17.43March ........... W 15.20 20.03 ( _ ) 14.15 20.60 17.08 25,77 16.18 18,59 17.23 17.88April ............. W 16.26 18.85 (") 15.85 20.31 17.54 20.56 16.35 18.77 17.65 18.17May .............. W 16.28 W W 15.81 20.50 17.34 20.21 15.74 19.53 17.49 17.98June ............. W 16.19 18.25 ( d) 15.20 19.79 16.85 19.35 14.61 18.38 17.01 17.32July .............. W 17.14 17.76 17.56 15.89 20.73 17.48 20.47 15.92 18.82 17.61 17.96August ......... W 17.61 W W 15.78 21.29 18.O4 20.71 15.64 19.30 18.17 18.40September ... W 17.84 W W 15.82 22.13 18.19 21.16 16.44 20.35 18.42 18.70October ........ W 18.38 19.85 W 17.34 23.68 17.62 22.07 17.26 20.91 17.97 19.03
d) 16.53 22.71 16.46 22.71 15.66 21.04 16.90 17.95November .... W 17.53 21.0S ( d )December .... W 15.87 W ( 13.96 19.96 15.03 20.29 13.46 18.67 15.49 15.94Average ...... W 17.18 20.20 17.54 1§.08 21.311 17.22 21.37 15.82 19.73 17.46 111.08
d ) 13.02 19.34 14.81 W 13.20 17.46 15.16 15.381992 January ........ W 14.83 W ( d ) 12.78 19.10 15.61 W 13.47 17.64 15.85 15.87
MarchFebruary................. (d)W 15.6815"57 WW ( d ) 13.06 19.05 16.O5 18.83 13.41 17.44 16.14 16.29(d) 14.40 20.32 18.01 18.97 15.06 18.10 18.11 18.07
April ............. W 16.42 17.76 ( d) 16.39 21.25 18.62 19.99 15.73 19.58 18.80 18.65May .............. W 17.35 17.66 ( d) 17.41 22.11 19.49 20.85 16.01 20.93 19.60 19.57June ............. W 18.40 19.60 ( d) 17.20 21.49 19.00 21.45 15.78 20.49 19.15 19.06July .............. W 18.50 21.06 ( d) 16.74 21.05 18.45 21.37 16.10 20.10 18.79 18.70August ......... W 18.28 21.26 ( d) 17.34 21.57 18.45 20.72 16.89 20.12 18,51 18.83September ... ( d) 18.35 W ( d) 17.26 21.60 17.96 21.17 16.14 20.09 18.08 18.56October ........ W 18.35 W ( d) 16.18 20.79 17.02 21.00 14.51 19.25 17.06 17.28November .... ( d) 17.26 W ( d) 15.12 19.32 16.64 19.46 14.07 17.80 16.69 16.62December .... W 15.85 W ( d)Average ...... W 17.04 18.78 ( 16.50 20.711 17.48 20.63 15.13 19.25 17.63 17,111
1993 January ........ ( d) 15.27 W ( d) 14.50 18.96 16.36 19.12 14.07 17.21 16.39 16.64February ...... ( d) 15.84 W ( d) 14.98 19.92 17.29 19.28 14.60 18.17 17.29 17.43March........... W 16.48 W ( d) 15.50 20.25 17.56 19.43 15.14 18.43 17.63 17.63April ............. W 16.79 19,89 ( d) 15.55 20.18 17.56 19.32 15,54 18,46 17.55 17.77May .............. W 16.82 20.57 ( d) 15.57 19.79 16.64 19.33 14,91 18.41 16.79 17.30June ............. ( d) 16.25 W ( d) 14.50 18.93 15.72 18.67 13.53 17.44 15.86 16.03Ju/y .............. W 815.30 R17.86 (d) 13.44 R18.31 R14.94 17.51 R12.92 R16.44 R14.98 R15.30August ......... (el) 14.93 _ 19.28 (d i R13.73 R18.08 R15"12 R17.56 R13"32 R15"99 R15.12 R15.25September ... W 14.58 W ( d) 13.87 17.59 14.64 17.35 13.45 15.48 14.57 14.95
,l, , ,,,, , ,, , n,, , In
a The Arab members ol OPEC are Algeria, Iraq, Kuwail, Libya, Qalar, since then reflect the period (2 loading. • Annual ==verageeare averages olSaudi Arabia, and the Uniled Arab Errdratee. the monthly prices, Including prices not published, weighted by volume.
b Current members ol OPEC ate Gabon, Indonesia, Iran, Nigeria, and • Cargoes that are purchased on a "netback" basis, or under simllatVenezuela, as well as the Arab members. Prior to1993, Ecuador wasalsoa contractual an'angernentswhereby the actual purchase price b notmember. The cost of imports from the Neulral Zone between Kuwail and establbhed al the time the crudeoll is acquired for Importationintothe UniledSaudi Arabia is included inthe costo( importsfrom "TotalOPEC.' States. are no( included in the published data until the actual prices have
c Based on October. November, and December data only. been determinedand reported.
d No data reported. Sources: • Ootober 1973-Sq_,,tember 1977: Fe_l_ral EnergyR=Revised data. NA=Nol available. W=Value withheldto avoiddisclosure Administration,Form FEA-F701-M*O, Transfer Pricing Report. • October
of individualcompanydata. 1977-December 1977: Energy Information Administration (EIA), FormNotes: • See Note 3 at and ol section. • Values lot the current2 months FEA-F701-M-0. 'Transfer Pricing Report.' , 1978 forward: EIA. Petroleum
are preliminary. • Prices through1980 reflect the period ol reportIng; prices Marketing Monthly, December 1993, Table 22,
Energy InformaUon AdministraUon/Monthly Energy Review December 1993 115
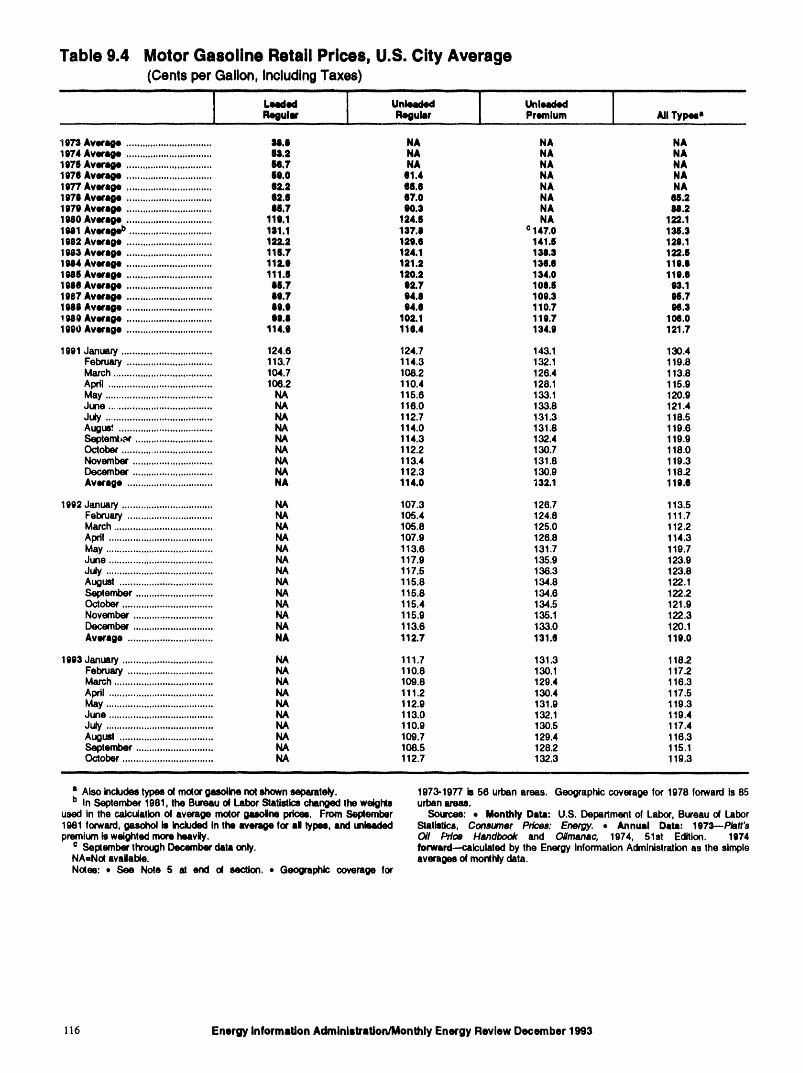
Table 9.4 Motor Gasoline Retail Prices, U.S. City Average(Cents per Gallon, Including Taxes)
i ,a,, ii ii i i i i i i i
Regulx Regular Premium All Typeaa
1973 Average ................................ U.II NA NA NA1974 Average ................................ 14.2 NA NA NA1978 Average ................................ a.7 NA NA NA1978 Average ................................ 69.0 61.4 NA NA1077 Average ................................ 82.2 es.e NA NA1079Averqe................................ 02.8 87.0 NA 06.21070 Average ................................ 116.7 90.3 NA 11tl.21980 Average ................................ 110.1 124.6 NA 122.11981 Averageb ............................... 181.1 137.t c 147,0 138.31082 Average ................................ 122.2 120.6 141.6 128.11983 Average ................................ 116.7 124.1 138.3 122.61984 Average ................................ 112.9 121.2 130.0 110.e1986 Average ................................ 111.6 120.2 134.0 1lo.e1980 Averoge ................................ 11|.7 02.7 108.6 93.11987 Average ................................ 00.7 04.0 109.3 06.71989 Average ................................ Ig.9 04.0 110.7 98.3! 989 Average ................................ 00.8 102.1 119,7 106.01980 Average ................................ 114.9 116.4 134.9 121.7
1991 January .................................. 124.6 124.7 143.1 130.4February ................................ 113.7 114.3 132.1 119.8March ..................................... 104.7 108.2 126.4 113,8April ....................................... 108,2 110.4 128.1 115.9May ........................................ NA 115.6 133.1 120.9June ....................................... NA 118,0 133.8 121.4July ........................................ NA 112.7 131.3 118.5Augur, ................................... NA 114.0 131.8 119.6Seplenlt_r ............................. NA 114.3 132.4 119.9October .................................. NA 112.2 130.7 118.0November .............................. NA 113.4 131.8 119.3December .............................. NA 112.3 130.9 118.2Average ................................ NA 114.0 t 32.1 119.0
1992 January .................................. NA 107.3 126.7 113.5February ................................ NA 105.4 124.8 111.7March ..................................... NA 105.8 125.0 112.2Arxll ....................................... NA 107.9 126.8 114.3May ........................................ NA 113.6 131.7 119.7June ....................................... NA 117.9 135.9 123.9July ........................................ NA 117.5 136.3 123.8August ................................... NA 115.8 134.8 122.1September ............................. NA 115.8 134.6 122.2October .................................. NA 115.4 134,5 121.9November .............................. NA 115,9 135.1 122.3December .............................. NA 113.6 133.0 120.1Average ................................ NA 112.7 131.0 110.0
1993 January .................................. NA 111.7 131.3 118.2February ................................ HA 110,8 130.1 117.2March ..................................... NA 109.8 129.4 116.3April ....................................... HA 111.2 130.4 117.5May ........................................ HA 112.9 131.9 119.3June ....................................... HA 113.0 132.1 119.4July ........................................ HA 110.9 130.5 117.4August ................................... HA 109.7 129,4 118.3September ............................. HA 108.5 128.2 115.1October .................................. HA 112.7 132.3 119.3
a Also includestypes ol motorgasolinenot shownseparately. 1973-1977 is 58 urban areas. Geographic coverage for 1978 fonvard Is 85b In September 1981, the Bureauoi Labor Statisticschanged the weighls urbanareas.
used in the calculationof average motor gasoline pdces. From September Sources: , Monthly Data: U.S. Department of Labor, Bureau of Labor1981 forward, gasohol Is Included in the average for d types, end unleaded Statistics, Consumer Prices: Energy. • Annual Data: 1973--P/att'spren_iumisweightedmoreheavily. Oil Pfloe Handbook and Oilmanac, 1974, 51st Edition. 1974
a Sel:XemberthroughDecember data only. forward---calculated by the Energy InformationAdministrationas the simpleNA=No/available. ave'ages of mo_hly data.Noies: • See Note S at end ot section. • Geographic coverage for
]16 Energy Information Administration/Monthly Energy Review December 1993
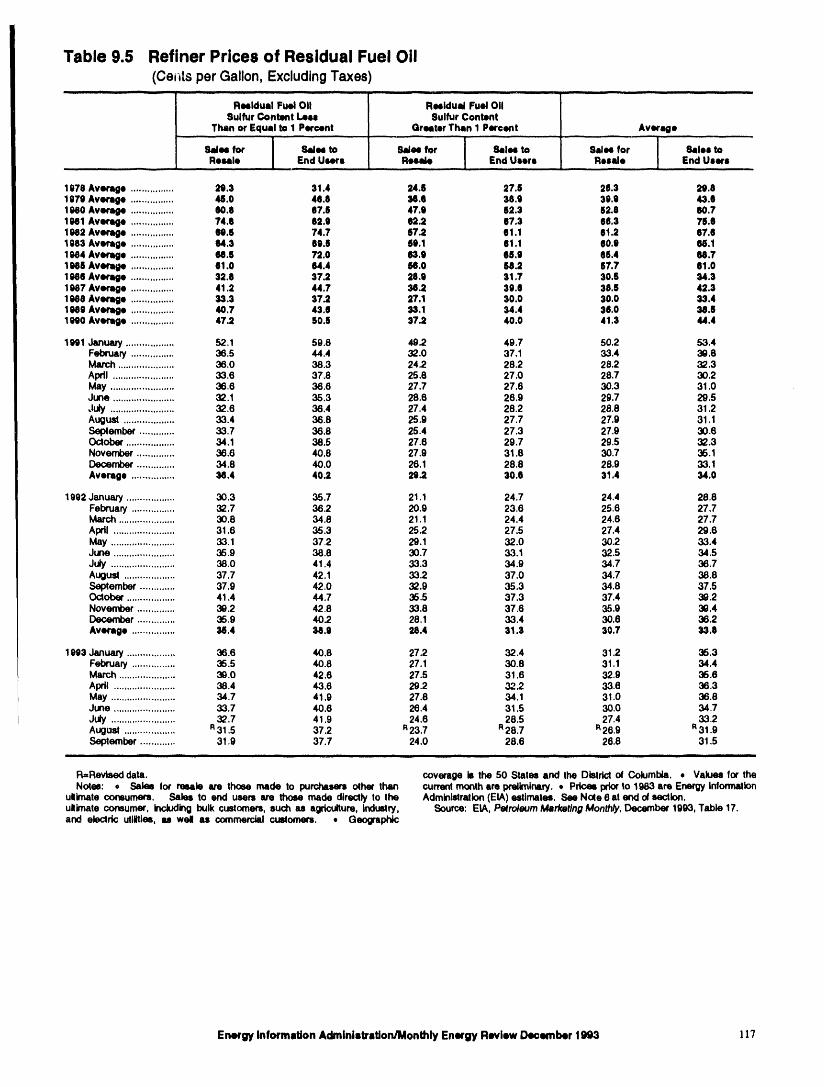
Table 9.5 Refiner Prices of Residual Fuel Oil(Cew_tsperGallon,ExcludingTaxes)
all - ... HI ill ,, ,i
Rasldual Fuel OII Reeiduml Fuel OIISulfur Content Leas Sulfur Content
Than or Equal to 1 Percent Greeter Than I Percent Average,,,, . ,, , , ..... , , ,
I
9alia for I 8idea to 8atee for 841o4 to Salee for I klee toResale ! End Users Reside End Users Resale I End Users.........
1970 Average ................ 29.3 31.4 24.6 27.8 26.3 29.81070 Average ................ 46.0 46.e 36.e 38.9 39.9 43.61980 Average ................ 60.6 07.6 47.0 62.3 62.8 60.71981 Average ................ 74.6 62.0 666.2 07.3 06.3 78.01982 Avecage ................ 98.6 74.7 67.2 61.1 01.2 67.61063 Average ................ 64.3 60.6 60.1 01.1 60.0 08.11984 Average ................ M.6 72.0 (13,0 66.0 66.4 M.71986 Average ................ 61.0 64.4 66.0 68.2 67.7 61.01986 Average ................ 32.0 37.2 26,0 31.7 30.5 34.31987 Average ................ 41.2 44.7 36.2 30.6 38.6 42.31986 Average ................ 33.3 37.2 27.1 30.0 30,0 33.41980 Average ................ 40.7 43.6 33.1 34.4 36.0 34.61990 Average ................ 47.2 60.6 37.2 40.0 41.3 44.4
1991 January .................. 52,1 59.8 49.2 49.7 50.2 53.4February ................ 36.5 44.4 32.0 37,1 33.4 39.8March ..................... 36,0 38.3 24.2 28.2 28.2 32.3April ....................... 33.6 37,8 25,8 27.0 28.7 30.2May ........................ 36.8 38.8 27.7 27.6 30.3 31.0June ....................... 32.1 35.3 28.6 26.9 29.7 29.5July ........................ 32.6 36,4 27.4 28.2 28.8 31.2August ................... 33.4 36.8 25.8 27.7 27.9 31.1September ............. 33.7 36.8 25.4 27.3 27,9 30.6October .................. 34.1 38.5 27.6 29.7 29,5 32.3November .............. 36.6 40.8 27,9 31.8 30.7 36.1December .............. 34.8 40.0 26.1 28.8 28.9 33.1Average ................ 36,4 40.2 29.2 30.6 31,4 34.0
1992 January .................. 30.3 35.7 21.1 24.7 24.4 28.8February ................ 32.7 36.2 20.9 23.6 25.6 27,7March ..................... 30.8 34.8 21.1 24.4 24.8 27.7April ....................... 31.6 35.3 25.2 27.5 27,4 29.6May ........................ 33.I 37.2 29. I 32.0 30.2 33.4June ....................... 36,9 38.8 30.7 33.1 32.5 34.5July ........................ 38.0 41.4 33.3 34.9 34.7 36.7August ................... 37.7 42.1 33.2 37.0 34.7 38.8September ............. 37.9 42.0 32.9 35.3 34.8 37.5October .................. 41.4 44.7 35.5 37.3 37.4 39.2November .............. 30.2 42.8 33.8 37,6 35.9 30.4December .............. 36.9 40.2 28.1 33.4 30.8 36.2Average ................ 36.4 30.0 20.4 31.3 30.7 33.6
1093 January .................. 36.6 40.6 27.2 32.4 312. 35.3February ................ 35.5 40.8 27.1 30.8 31.1 34.4March ..................... 39.0 42.6 27.5 31.6 32.9 36.6Apdl ....................... 38.4 43.8 29.2 ,32.2 33,6 38.3May ........................ 34.7 41,9 27.8 34.1 31.0 36.8June ....................... 33.7 40.8 26.4 31.5 30.0 34.7July ........................ 32,7 41.9 24.6 28,5 27.4 33.2August ................... R31.5 37.2 R23.7 R28.7 P'26.9 R31.9September ............. 31.9 37.7 24.0 28.6 26.8 31.5
i H HI,H I
R=Revised data. coverage b the 50 Stales and the District ot Columbia. • Values for theNo4u: = Sales for ro_le ate those made to purchasers other thetl currentmonthere prelimlrl,ry. • Pdc_ priorto 1983 are Energy Information
ullimale consumers. Sales to end usem are those made directly to the Admln_rallon (ETA)estimates. See No(e 6 at end d =ruction.ultimate consumer, Includingbulk customers, such ns agriculture, industry, Source: EtA. Pelroleum Marketing Monthly, December 1993, Table 17.and electric utilities, as well as commercial customers. • Geographic
Energy Information Admlnistration/Mon_ly Energy Review December 1993 ]]7
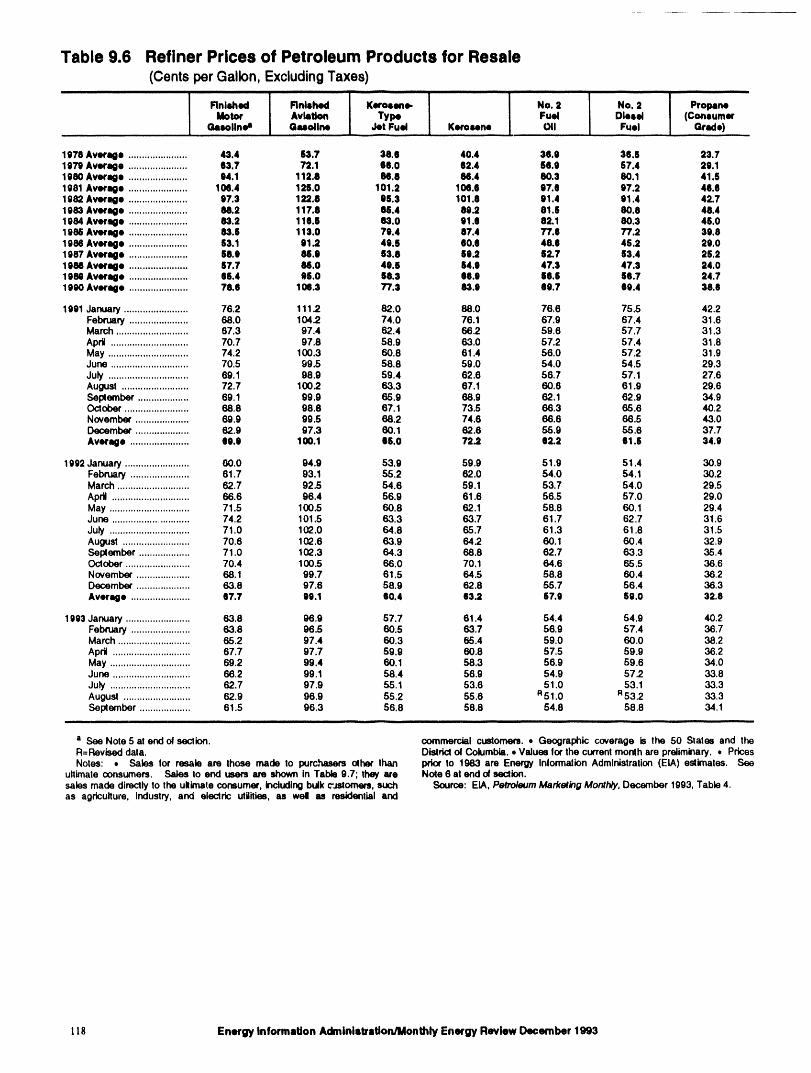
Table 9.6 Refiner Prices of Petroleum Products for Resale(CentsperGallon,ExcludingTaxes)
-- II ii i iiBill I iiiiii ii iiii i i iiiiBi iiiBi
Motor Avistkm Type Fuel Diesel (Consumer
OaNIIne a Gas(dine , Jet Fual Kerosene , OU Fuel Grade)
1978 Average ...................... 43.4 63.7 38.6 40.4 36.9 38.5 23.71979 Average ...................... 83.7 72.1 66.0 62.4 56.9 57.4 29.11980 Averago ...................... 94.1 112.8 e8.8 86.4 eO.3 80.1 41 .S1981 Average ...................... 106.4 126.0 101.2 106.8 07.9 97.2 49.91982 Average ...................... 97.3 122.8 95.3 101.8 91.4 91.4 42.71983 Average ...................... U.2 117.8 U.4 89.2 81.S 80.8 48.41984 Average ...................... 83.2 118.6 83.0 91.$ 82.1 80.3 45.01986 Average ...................... 93.6 113.0 79.4 87.4 77.6 77.2 39.81986 Average ...................... 63.1 91.2 49.5 60.9 48.9 45.2 29.01987 Average ...................... 68.9 86.9 83.8 89.2 82.7 53.4 25.21986 Average ...................... 87.7 88.0 40.6 64.0 47.3 47.3 24.019N Average ...................... 66.4 96.0 68.3 66.9 66.6 56.7 24.71990 Average ...................... 78.0 108.3 77.3 83.0 60.7 69.4 38.8
1991 January ........................ 76.2 1112 82.0 88.0 76,6 75.5 42.2February ...................... 68,0 1042. 74.0 76.1 67.9 67.4 31.6March ........................... 67.3 97.4 62.4 66.2 59.6 57.7 31.3April ............................. 70.7 97,8 58.9 63,0 57.2 57.4 31.8May .............................. 74.2 100.3 60.8 61.4 56.0 57.2 31.9June ............................. 70.5 99.5 58.8 59.0 54,0 54.5 29.3July .............................. 69.1 98.9 59.4 62.6 56.7 57.1 27.6August ......................... 72.7 1002. 63.3 67.1 60.6 61.9 29.6September ................... 69.1 99.9 65.9 68,9 62,1 62.9 34.9October ........................ 68.8 98.8 67.1 73.5 66.3 65.6 40.2November .................... 69.9 99.5 68,2 74.6 66,6 66.5 43.0December .................... 62.9 97.3 60.1 62.6 55.9 55.6 37.7Average ...................... 98.0 100.1 66.0 72.2 82.2 01 .$ 34.9
1992 January ........................ 60.0 94.9 53.9 59.9 51.9 51.4 30.9February ...................... 81.7 93.1 55.2 62.0 54.0 54.1 30.2March ........................... 62.7 92.5 54.8 59.1 53.7 54.0 29.5April ............................. 68.6 96.4 56.9 61.6 56.5 57.0 29.0May .............................. 71.5 100.5 60.8 62.1 58.8 60.1 29.4June ............................. 74.2 101.5 63.3 63.7 61.7 62.7 31.6July .............................. 71.0 102.0 64.8 65.7 61.3 61.8 31.5August ......................... 70.6 102.6 63.9 64.2 60.1 60.4 32,9September ................... 71.0 102.3 64.3 68.8 62.7 63.3 35.4October ........................ 70.4 100.5 66.0 70.1 64.6 6,5.5 36.6November .................... 68.1 99.7 61.5 64.5 58.8 60.4 36.2December .................... 63.8 97.6 58.9 62.8 55.7 56.4 36.3Average ...................... 17.7 89.1 60.4 83.2 67.9 59.0 32.8
1993 January ........................ 63.8 96.9 57.7 61.4 54.4 54.9 40.2February ...................... 63.8 96.5 60.5 63.7 56.9 57.4 36.7March ........................... 65.2 97.4 60.3 65.4 59.0 60.0 38.2April ............................. 67.7 97.7 59.9 60.8 57.5 59.9 38,2May .............................. 69.2 99.4 60.1 58.3 56.9 59.6 34.0June ............................. 68.2 99.1 58.4 56.9 54.9 57.2 33.8July .............................. 62.7 97.9 55.1 53.6 51.0 53.1 33.3August ......................... 62.9 96.9 55.2 55.8 R51.0 R53.2 33.3September ................... 61.5 96.3 56.8 58.8 54.8 58,8 34.1
a See Note 5 at end 04section, commercial customers. • Geographic coverage is the 50 Sxates and theR=Revised dala. District04Columbia. • Values for the currentmonth are preliminary. • PricesNotes: • Sales tor resale are those made to purchasers other than prior to 1983 are Energy Inlormatlon Administration(ETA) estimates. See
ultimate consumers. Sales to end users are shown in Table 9.7; they are Note 6 at end 04section.sales made directly to the ultimate consumer, includingbulk c'Jstomers,such Source: EtA, Petroleum Marketing Monthly, December 1993, Table 4.as agriculture, industry, and electric utilities, as wel as residential and
t18 Energy InformaUon Administration/Monthly Energy Review December 1993
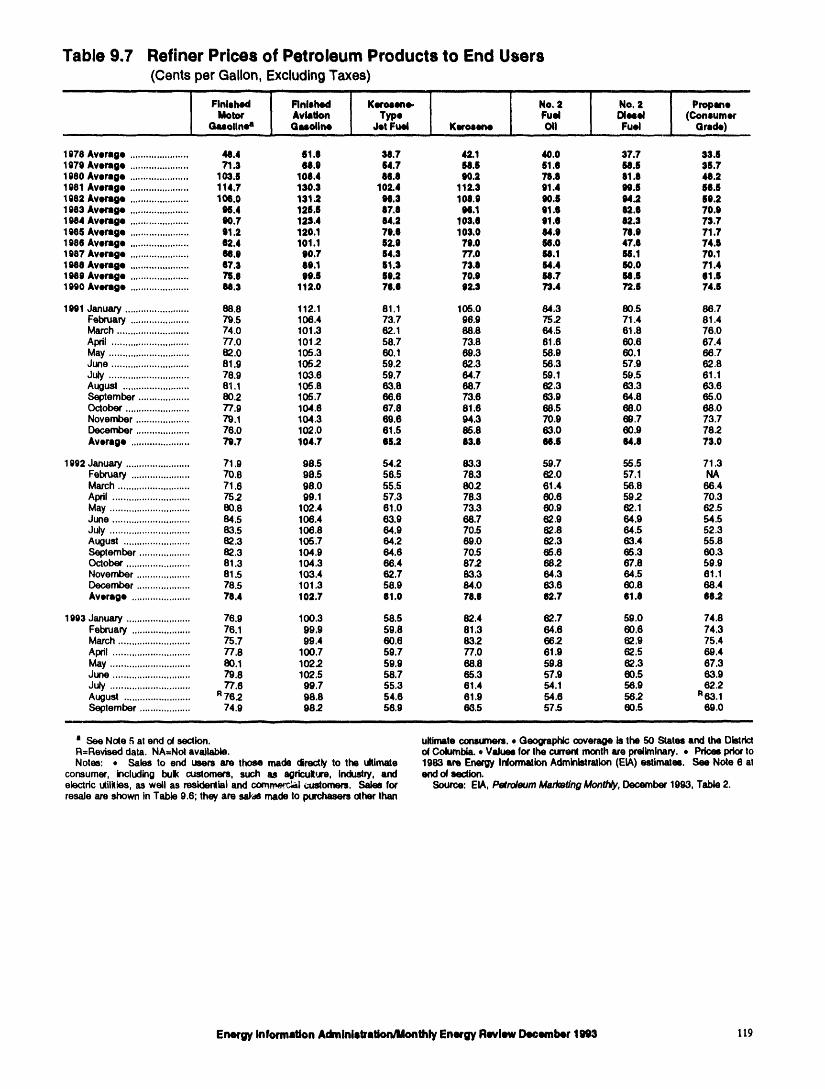
Table 9.7 Refiner Prices of Petroleum Products to End Users(centsperGallon,ExcludingTaxes)
i i i ilal HI IIII IIII I I II III I II
Finished I Finished Kerosene. No, 2 No. 2 Propane
Motor I Aviation Type Fuel Diesel (ConsumerGasoline a Gasoline Jet Fuel Kerosene (HI Fuel Grade)
1978 Average ...................... 44.4 51.1 38.7 42.1 40.0 37,7 33.51979 Average ...................... 71.3 61.9 54.7 68.6 51.8 64.6 35.71980 Average ...................... 103.6 100.4 88.1 90.2 76.6 11.8 48.21981 Average ...................... 114.7 130.3 102.4 112.3 91.4 99.6 68.61982 Average ...................... 106.0 131_ H.3 108.9 90.6 64,2 69.21983 Average ...................... 96.4 126.6 87,8 66.1 91.6 62.8 70.91984 Average ...................... 90.7 128,4 84.2 103.1 11.O 82.3 73.71985 Average ...................... 91.2 120.1 79.6 103.0 84.9 74.1 71.71986 Average ...................... 62.4 101.1 62.9 79.0 64.0 47.8 74.61987 Average ...................... 66.9 90.7 64.3 77.0 64.1 U.1 70.11986 Average ...................... 67.3 69.1 61.3 73.8 64.4 64.0 71.41989 Average ...................... 76.6 69.S 89.2 70.9 M.7 M.6 61.11990 Average ...................... 84.3 112.0 76.0 02.3 73.4 72.6 74.6
1991 January ........................ 88.8 112.1 81.1 105.0 84.3 80.5 86.7Febnmry ...................... 79.5 106.4 73.7 96.9 75,2 71.4 81.4March ........................... 74.0 101.3 62,1 88.8 64.5 61.8 76.0Apdl ............................. 77.0 101.2 58.7 73.8 61.6 60.6 67.4May .............................. 82.0 105.3 60.1 69.3 58.9 60.1 66.7June ............................. 81.9 105.2 59.2 62.3 58.3 57.9 62.8July .............................. 78.9 103.8 59.7 84.7 59.1 59.5 61.1August ......................... 81.1 105.8 63.8 68.7 62.3 63.3 63.6September ................... 80.2 105.7 66.8 73.6 63.9 64.8 65.0October ........................ 77.9 104.8 67.8 81.6 68.5 68.0 68.0November .................... 79.1 104.3 69.6 94.3 70.9 69.7 73.7December .................... 76.0 102.0 61.5 65.8 63.0 60.9 78.2Average ...................... 79.7 104.7 15.2 13,8 64.6 64.8 73.0
1992 January ........................ 71.9 98.5 54.2 63.3 59.7 55.5 71.3February ...................... 70.8 98.5 56.5 78.3 62.0 57.1 NAMarch ........................... 71.6 98.0 55.5 80.2 61.4 56.8 66.4Apdl ............................. 752 99,1 57.3 78.3 60.6 592 70.3May .............................. 80.8 102.4 61.0 73.3 60.9 62.1 62.5June ............................. 84.5 106.4 63.9 68.7 62.9 64.9 54.5July .............................. 83.5 106.8 64.9 70.5 62.8 64.5 52.3August ......................... 82.3 105.7 64.2 69.0 62.3 63.4 55.8September ................... 82.3 104.9 64.6 70.5 66.6 65.3 60.3October ........................ 81.3 104.3 66.4 872 682 67.8 59.9November .................... 81.5 103.4 62.7 63.3 64.3 64.5 61.1December .................... 78.5 101.3 58.9 84.0 63.6 60.8 68.4Average ...................... 78.4 102.7 81,0 78.0 62.7 81.8 16
1993 January ........................ 76.9 100.3 58.5 62.4 62.7 59.0 74.8February ...................... 76.1 99.9 59.8 81.3 64.8 60.6 74.3March ........................... 75.7 99.4 60.8 832 66.2 62.9 75.4Apdl ............................. 77.8 100.7 59,7 77.0 61.9 62.5 69.4May .............................. 80.1 1022 59.9 68.8 59.8 62.3 87.3June ............................. 79.8 102.5 58,7 65.3 57.9 60.5 63.9July .............................. 77.6 99.7 55,3 81.4 54.1 56.9 62.2August ......................... R76.2 98.8 54.6 61.9 54.6 56.2 R63.1September ................... 74.9 98.2 56.9 66.5 57.5 60.5 69.0
roll ,,i iii ill I I I IIIIIIII IIIII
a See Note _ at end of section, ultimate consumers. • Geographic ooverage is the 50 States and the DistrictR=Revised data. NA=NoI available, of Columbia., Values lot the currentmonth are preliminary. • Prices prkx toNotes: , Sales to end users _re those made directly to the ultimate 1983 ,:re Energy InlormattonAdministration(ETA)estimates. See Note 8 at
consumer, including bulk customers, such as agriculture, industry, and end o4seclion.electric utilities,as well as residential and cornrr_.,;:i (,-ustomers. Sakm for Source: ETA,Petroleum Marketing Monthly, December 1993, Table 2.resale are shown in Table 9.6; they are saJ_aemade to purchasersoiher than
Energy information AdminisiTation/Monlhly Energy Review December 1993 t t9
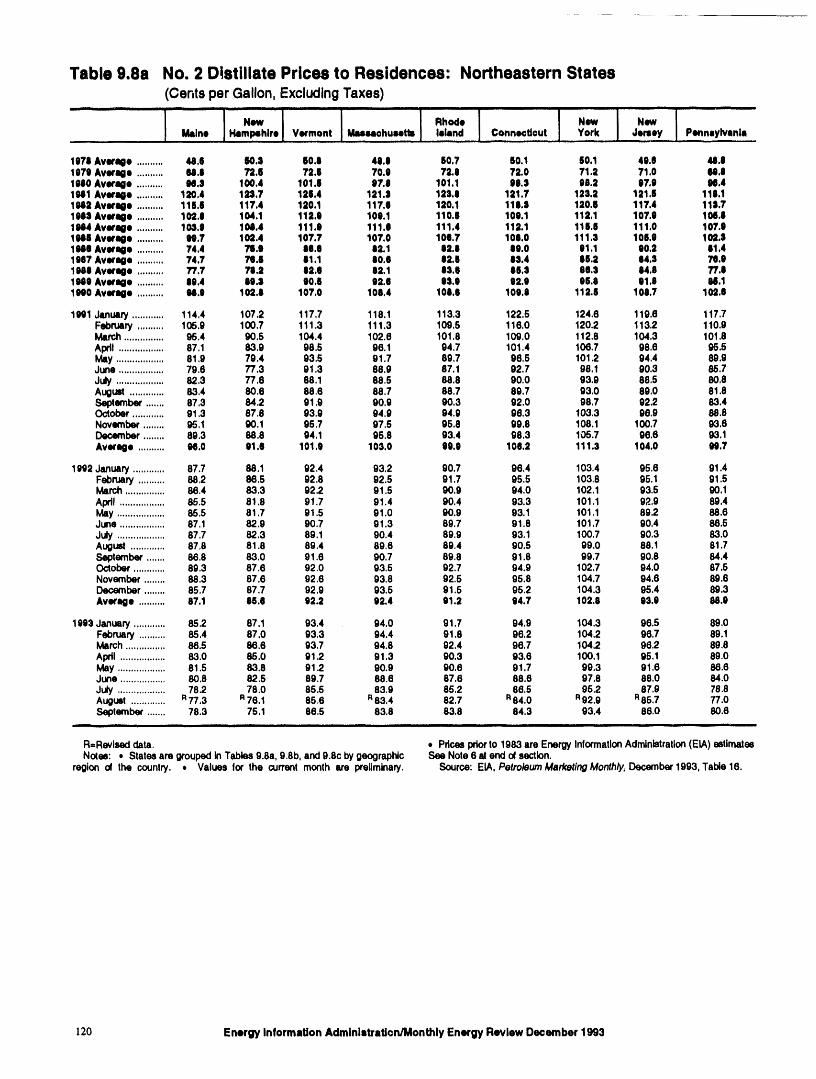
Table 9.88 No. 2 Distillate Prices to Residences: Northeastern States(CentsperGallon,ExcludingTaxes)
ii Ill I
1 ! 1 ! ! I I INew Rhode New NewMaine Hampehire Vermont MuMohuimttl island Gonnectl©ut York Jersey Pennsylvlinki
1978 Average .......... 48,8 80.8 60.8 48.8 80,7 50.1 80,1 49,8 U.81879 &verq • .......... U.8 72.8 72.8 70,9 72.8 72.0 71.2 71,0 60,81940 Averqo .......... 94.8 100.4 101.8 97.8 101.1 08,$ 98.2 97.9 04.41941 Average .......... 120.4 123.7 126.4 121.8 123.8 121.7 123.2 121.6 118.11942 Average .......... 116.6 117.4 120.1 117.6 120.1 118.3 120.8 117,4 115,71088 &verqo .......... 102,8 104.1 112.9 109.1 110.8 109.1 112,1 107.9 194.81944 Average .......... 103,8 194.4 111.0 111.0 t11.4 112.1 118.8 111,0 107.81948 Average .......... 09.7 102.4 107.7 107.0 100.7 108,0 111.3 106.0 102.81948 Average .......... 74.4 70.0 88.8 82.1 82.8 89.0 01.1 00.2 81,41987 Average .......... 74.7 72.8 81.1 80.0 82.6 88.4 88.2 84.$ 70.01988 Average .......... 77.7 70.2 12.O 82.1 8$.8 86.8 80.3 84.8 77.01940 Average .......... 89.4 80.8 90.6 92.0 03.9 02.0 06.8 01.8 94.11940 Average .......... U,O 102.8 107.0 108,4 108,0 109.8 112.6 108.7 102.8
1991 January ............ 114.4 107.2 117.7 118,1 113,3 122,5 124.6 119.6 117,7February .......... 106,9 100,7 111,3 111,3 109,5 116.0 120.2 113.2 110,9March ............... 95,4 90.5 104,4 102.6 101,8 109.0 112.8 104.3 101,8Apdl ................. 87,1 83,9 98.5 96,1 94.7 101.4 106.7 98.6 95,5May .................. 81,9 79.4 93,5 91.7 89,7 96,5 101,2 94,4 89,9June ................. 79,8 77.3 91,3 88,9 87.1 02.7 08,1 90.3 85,7Juty .................. 82,3 77.6 88.1 88,5 88.8 90.0 93.9 88.5 80,8August ............. 83.4 80.6 88,6 88.7 88.7 89.7 93.0 89,0 81.8September ....... 87.3 84.2 91.9 90.0 90.3 92.0 98.7 92.2 83.4October ............ 91.3 87.8 93.0 04.9 94.0 96.3 103.3 98.9 88.8November ........ 95.1 90.1 96,7 07.5 95.8 99.8 108.1 100.7 93.6December ........ 89.3 88.8 94.1 95.8 93.4 98.3 106.7 96.6 93.1Average .......... 04.0 01.0 101.8 103.0 99.9 100.2 111.3 104.0 99.7
1992 January ............ 87.7 88.1 92.4 93,2 90.7 96,4 103.4 95,8 91.4February .......... 88,2 86.5 92.8 92.5 91.7 95.5 103.8 95.1 91,5March ............... 86,4 83.3 92,2 91.5 90,9 94.0 102.1 93.5 90,1April ................. 85,5 81.8 91.7 91.4 90.4 93.3 101.1 92,9 89.4May .................. 85.5 81.7 91,5 91,0 90.9 93.1 101.1 89.2 88.6June ................. 87.1 82.9 90,7 91.3 89,7 91.8 101,7 90.4 88,5July .................. 87.7 82,3 89,1 90.4 89.9 93,1 100,7 90,3 83.0August ............. 87.8 81.8 89.4 89.6 89.4 90.5 99,0 88.1 81.7Seplember ....... 86.8 83.0 91.6 90.7 89.8 91.8 99,7 90.8 84.4October ............ 89.3 87.6 92.0 93.5 92.7 94.9 102,7 94.0 87.5November ........ 88.3 87.6 92.6 93.8 92.5 95.8 104.7 94.6 89.8Oecember ........ 85,7 87.7 92,9 93.5 91.5 95.2 104.3 95,4 89.3Average .......... 87.1 85.6 02.2 92.4 01.2 04.7 102.8 93.0 88.9
1993 January ............ 85.2 87,1 93,4 94.0 91,7 94,9 104,3 96.5 89,0February .......... 85.4 87,0 93.3 94.4 91.8 96.2 104.2 96,7 89.1March ............... 86.5 86,6 93.7 94.8 92.4 96,7 104,2 96,2 89.8April ................. 83.0 85.0 91.2 91.3 90.3 93.6 100,1 95.1 89.0May .................. 81.5 83.8 91.2 90.9 90.6 91.7 99.3 91.6 86.6June ................. 80.8 82.5 89.7 88.6 87.6 88.6 97.8 88.0 84.0July .................. 78.2 78.0 85.5 83.9 85.2 86.5 95.2 87.9 78,8August ............. R77.3 R76.1 85.6 R83.4 82.7 R84.0 R92.9 R85.7 77.0September ....... 78,3 75,1 86.5 83,8 83.8 84.3 93.4 86,0 80,6
..........
R=Revlsed data, • Pdces priorto 1983 are Energy InformationAdministration(ETA)estimatesNotes: • States are grouped in Tables 9.88, 9,8b, and 9.8c bygeographic See Note 6 at end of section.
region d the country. . Values tot the current month are IXeliminary. Source: EtA, Petroleum MarketlngMonthly, December 1993, Table 16.
120 Energy Information Administration/Monthly Energy Review December 1993
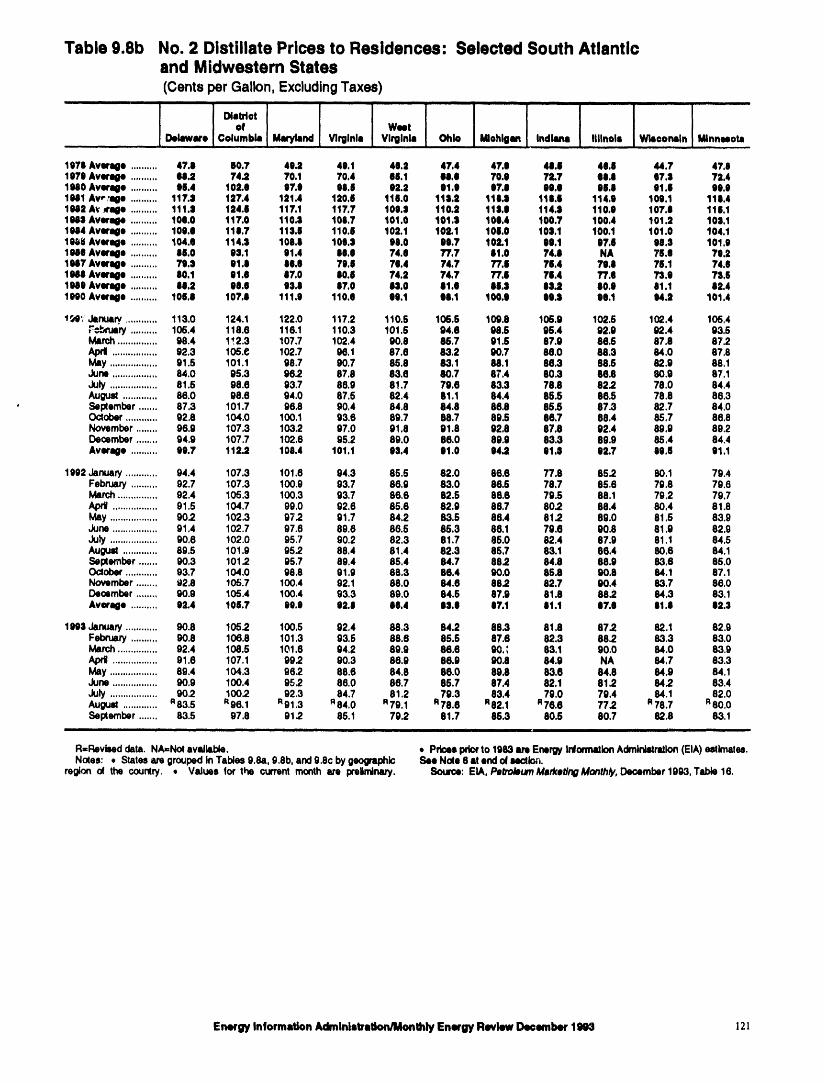
Table 9.8b No. 2 Distillate Prices to Residences: Selected South Atlanticand Midwestem States(CentsperGallon,ExcludingTaxes)
i iIIl IUll III I iI I
-*E.o, E [ I- .I[ IDelaware Columbia nd rglnla Virginia Ohio Idlohlg Indiana Illinois Wiooormln Minnesota
1978 Average .......... 47.8 00.7 40.2 40.t 40.2 47.4 47.0 41.0 40.8 44.7 47.01070 Average .......... 08.2 74.2 70.1 70.4 08.1 80.0 70.0 72.7 08.8 07.0 72.41080 Average .......... 06.4 102.e 07.0 90.8 02.2 el.e eT.e 00.e ol.e 01.8 08.01081 Avr ;age .......... 117.8 127.4 121.4 120.6 1t8.0 118.2 110.8 118.8 114.0 100.1 118.41082 Av d'age .......... 111.0 124.8 117.1 117.7 100.0 110.2 118.8 114.0 110.8 107.0 110.11088 Average .......... 10e.O 117.0 110.8 100.7 101.0 101.0 100.4 100.7 100.4 101.2 100.11084 Average .......... 109.8 110.7 113.8 110.| 102.1 102.1 101.0 10L1 100.1 101.0 104.11086 Average .......... 104.6 114.$ 108.8 100.$ 90.0 00.7 102.1 00.1 07.6 08.$ 101.01080 Average .......... 08.0 03.1 01.4 00.0 74.0 77.7 01.0 74.0 NA 76.0 70.21087 Average .......... 70.$ 01.0 08.0 70.8 70.4 74.7 77.1 78.4 7O.l 78.1 74.01080 Average .......... 80.1 01.0 07.0 00.| 74.2 74.7 77.8 76.4 77.0 73.0 73.61080 Average .......... 08.2 00.0 03.0 07.0 02.0 01.0 06.0 08.2 80.0 01.1 02.41000 Average .......... 106.8 107.e 111.0 110.e 00.1 ee.1 100.0 00.$ 08.1 i)4.2 101.4
lr.A)'_f Januaw ............ 113.0 124.1 122.0 117.2 110.6 106.5 109.8 106.0 102.5 102.4 106.4F-..btlary .......... 106.4 118.6 116.1 110.3 101.5 04.0 98.5 95.4 g2.g 92.4 93.5March ............... 98.4 1_2.3 107.7 102.4 90.8 85.7 91.5 87.9 86.5 87.8 87.2Apdl ................. 92.3 105.8 102.7 96.1 87.6 83.2 90.7 86.0 88.3 84.0 87.8May .................. 91.6 101.1 98.7 90.7 85.8 83.1 88.1 Be.3 88.5 92.9 88.1June ................. 84.0 95.3 962 87.8 83.6 80.7 87.4 80.3 86.8 e0.9 87.1July .................. 81.5 98.6 93.7 88.9 8t.7 79.6 83.3 78.8 82.2 78.0 84.4August ............. 86.0 98.6 94.0 87.5 82.4 81.1 64.4 85.5 86.5 78.8 86.3
• Sel_ember ....... 87.3 101.7 96.8 90.4 84.8 84.8 80.8 85.5 87.3 82.7 84.0October ............ 92.8 104.0 100.1 93.6 89.7 88.7 89.5 86.7 88.4 85.7 80.8November ........ 96.9 107.3 1032 97.0 91.8 91.8 92.8 eT.e 92.4 89.9 89.2De(ember ........ 94.9 107.7 102.6 95.2 89.0 80.0 89.9 83.3 89.9 85.4 84.4Average .......... 00.7 112.2 108.4 101.1 03.4 01.0 04.2 01.8 02.7 lea 01.1
1002 January ............ 94.4 107.3 101.6 94.3 85.5 82.0 66.6 77.8 85.2 80.1 79.4February .......... 92.7 107.3 100.9 93.7 86.9 83.0 86.8 78.7 85.6 79.8 79.6March ............... 92.4 105.3 100.3 93.7 86.6 82.5 86.8 79.5 88.1 79.2 79.7April ................. 91.5 104.7 99.0 92.6 85.6 82.9 80.7 802 88.4 80.4 81.8Msy .................. 902 102.3 97.2 91.7 84.2 83.5 86.4 812 80.0 81.5 83.9June ................. 91.4 102.7 97.6 89.6 86.5 85.3 86.1 79.6 90.8 81.9 82.9July .................. 90.6 102.0 95.7 90.2 82.3 81.7 85.0 82.4 87.9 81.1 84.5August ............. 89.5 101.9 95.2 88.4 81.4 82.3 86.7 83.1 66.4 80.6 84.1Seplernber ....... g0.3 101.2 95.7 80.4 85.4 84.7 88.2 84.8 68.9 83.8 85.0Oclobet ............ 93.7 104.0 98.8 01.9 66.3 86.4 IK).0 85.8 90.8 84.1 87.1November ........ 92.8 105.7 100.4 92.1 88.0 84.6 88.2 82.7 90.4 83.7 86.0December ........ 90.9 105.4 100.4 93.3 89.0 84.5 87.9 81.8 88.2 84.3 83.1Average .......... 02.4 106.7 90.9 02.1 06.4 es.o 07.1 81.1 07.0 01.1 82.3
1083 January ............ 90.8 1052. 100.5 92.4 88.3 84.2 88.3 81.8 87.2 82.1 82.9February .......... 90.8 106.8 101.3 93.5 88.6 85.6 87.6 82.3 88.2 83.3 83.0March ............... 92.4 108.5 101.6 94.2 89.9 86.6 gO.; 63.1 90.0 84.0 83.9Ap_ ................. 91.6 107.1 992 g0.3 86.9 86.9 90.8 84.0 NA 84.7 83.3May .................. 89.4 104.3 962. 86.6 64,8 86.0 89.8 63.8 84.8 84.9 84.1June ................. 90.9 100.4 952 86.0 66.7 85.7 87.4 82.1 81.2 642 83.4July .................. 90.2 100.2 92.3 84.7 81.2 79.3 83.4 79.0 79.4 84.1 82.0Augu= ............. R83.5 R96.1 R91.3 "84.0 _ 79.1 R78.6 n 82.1 n76.6 77.2 n78.7 _ 60.0Seplember ....... 83.5 97.8 912. 85.1 70.2 81.7 85.3 80.5 80.7 82.8 83.1
ii u
R=Revbed data. NA,=Nolavailsble. • Pd(es IXiOrto 1983 are Energy Inlomtldion Admlnk=trslion(EIA) estlmales.No(es: , States ars groupedin Tables 9.88, 9.8b, and 9.8c by geographic See Nolo 6 st end o4sectio;-,.
region ol the country. • Vidues for the current month m preliminary. Source: ELk, Peb-oburn Marketing Monthly, December 1903, Table 16.
Energy Information Administration/Monthly Energy Review December l gg3 ]2!
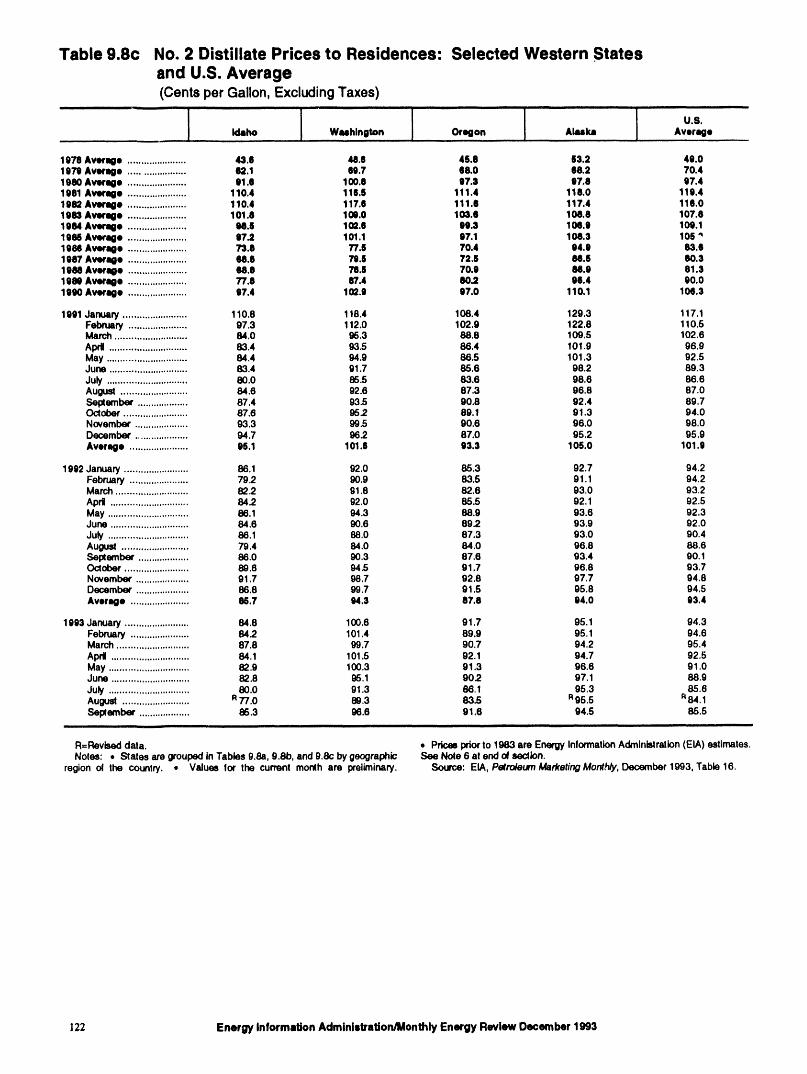
Table 9.8c No. 2 Distillate Prices to Residences: Selected Western Statesand U.S. Average(CentsperGallon,ExcludingTaxes)
1973 Average ...................... 43.8 U.tl 4S.8 63.2 4g.01gTg Averago ..................... 62.1 60.7 68.0 68.2 70.41980 Averago ...................... 01.O 100.8 07.$ 97.8 97.41981 Averago ...................... 110.4 118.8 111.4 118.0 119.41982 Averago ...................... 110.4 117.0 111.0 117.4 118.01983 Averago ...................... 101.8 109.0 103.0 108.8 107.81984 Average ...................... 08.§ 102.11 00.3 108.O 10g,11986 Averqo ...................... 07.2 101.1 07.1 108.3 10S _IGM Averago ...................... 73.8 77.6 70.4 04.0 83.01987 Averqo ...................... 68,8 79.$ 72,6 86.6 80.3IOM Averqo ...................... 68.8 73.5 70.0 M.9 81.3lgN Average ...................... 77.8 87.4 80.2 96.4 90.01900 Average ...................... 97.4 10_.0 97.0 110.1 106.3
1991 January ........................ 110.8 118.4 108.4 129.3 117.1February ...................... 97.3 112.0 102.9 122.8 110.5March ........................... 84.0 96.3 88.8 109.5 102.6April ............................. 83.4 93.5 86.4 101,g 96,9May .............................. 84.4 94.9 86,5 101.3 92,5June ............................. 83.4 91.7 85.6 98.2 89.3July .............................. 80.0 86.5 83.6 98.6 86.6August ......................... 84.6 92.6 87.3 96.8 87.0September ................... 87.4 93.5 90.8 92.4 89.7October ........................ 87.6 95.2 89.1 91.3 94.0November .................... 93.3 99.5 90.6 96.0 98.0December .................... 94.7 96.2 87.0 95.2 95.9Average ...................... g5.1 101.$ 93.3 105,0 101.0
1992 January ........................ 86.1 92.0 85.3 92.7 94.2February ...................... 79.2 90.9 83.5 91.1 94.2March ........................... 82.2 81.8 82.6 93.0 93.2April ............................. 84.2 92.0 85.5 92.1 92.5May .............................. 86.1 94.3 88.9 93.6 92.3June ............................. 84.6 90.6 89.2 93.9 92.0July .............................. 86.1 88.0 87.3 93.0 90.4Augu_ ......................... 79.4 84.0 84.0 96.8 88.6September ................... 86.0 90.3 87,6 93.4 90.1October ........................ 89.6 94.5 91.7 96.8 93.7November .................... 91.7 98,7 92.8 97.7 94.8December .................... 86.8 99.7 91.5 95.8 94.5Average ...................... 85.7 94.3 87.8 94.0 93.4
1O93January ........................ 84.8 100.6 91.7 95.1 94.3February ...................... 842 101.4 89.9 95.1 94.6March........................... 87.8 99.7 90.7 94.2 95.4Apri ............................. 84.1 101.5 92.1 94.7 92.5May .............................. 82.9 100.3 g1.3 96.6 g1.0June ............................. 82.8 95.1 902. 97.1 88.9July .............................. 80,0 91.3 86.1 95.3 85.6August ......................... R77.0 89.3 83.5 R95.5 R84.1Seplember ................... 86.3 96.6 91.6 94,5 85,5
inl i
R=Revised data. • Pdces prior to 1983 are Energy InformationAdministration(EIA) estimates,Notes: • States are grouped inTables 9.8a, g.Sb, and 9.8c bygeographic See Nole 6 at end o_section.
region ol the country. • Values for the current month are preliminary. Source: EIA, Petroleum Marketing Monthly, December 1993, Table 16.
122 Energy Information Administration/Monthly Energy Review December 1993
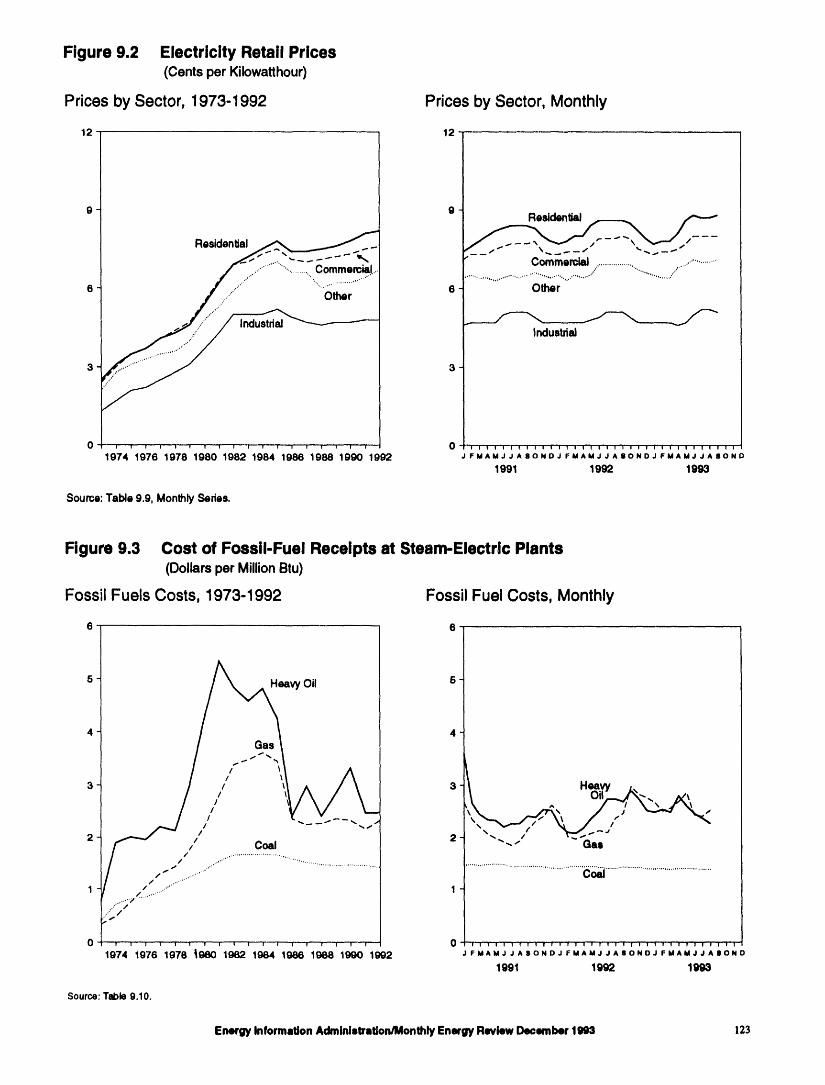
Figure 9.2 Electricity Retail Prices(Cents per Kilowatthour)
Prices by Sector, 1973-1992 Pricesby Sector,Monthly
12 12
9 9
Residential ...... / ,-. "
.............................. •'"',, ...... .',, ,,., ........ :". ,,,." '. .............. ..,"" . ....... ."
6 / ............"......... Other 6 Other
0 i i i I i ! i i i ' 1 i i i i i i i i 0 I I'1 i 'l 1 'l I 1 I I I T I I I 1 i i "|' i i I I i i" i I'1 I I ! '1 !
1974 1976 1978 1980 1982 1984 1986 1988 1990 1992 JFMAMJJASONDJFMAMJJASONDJFMAMJJAaOND
1991 1992 1993
Source: Table 9.9, Monlhly Series.
Figure 9.3 Cost of Fossil-Fuel Receipts at Steam-Electric Plants(Dollars per Million Btu)
Fossil Fuels Costs, 1973-1992 FossilFuel Costs,Monthly
6 6
5 6
4 4
3 3 / Heaw _,,,\ ^
2 ///' Coal " " 2 "- / -- ""--" Gas
/ • .' ,, ,,
/ .... " I
1 ....._.7./...........," /
0 i " I ' I i l " I I' I I " I ....I' i I I" I I I "I - 0 I I I I I I l I I I I I I I I I I ! I l I I I I I I I ! I I I I I I
1974 1976 1978 _980 1982 1984 1966 1988 1990 1992 JFMAMJJASONDJFMAMJJAIIONDJFMAMJJAIIOND
1991 1992 1993
Source:Table 9.10.
EnergyInformationAdministration/MonthlyEnergyReviewDecember1993 123
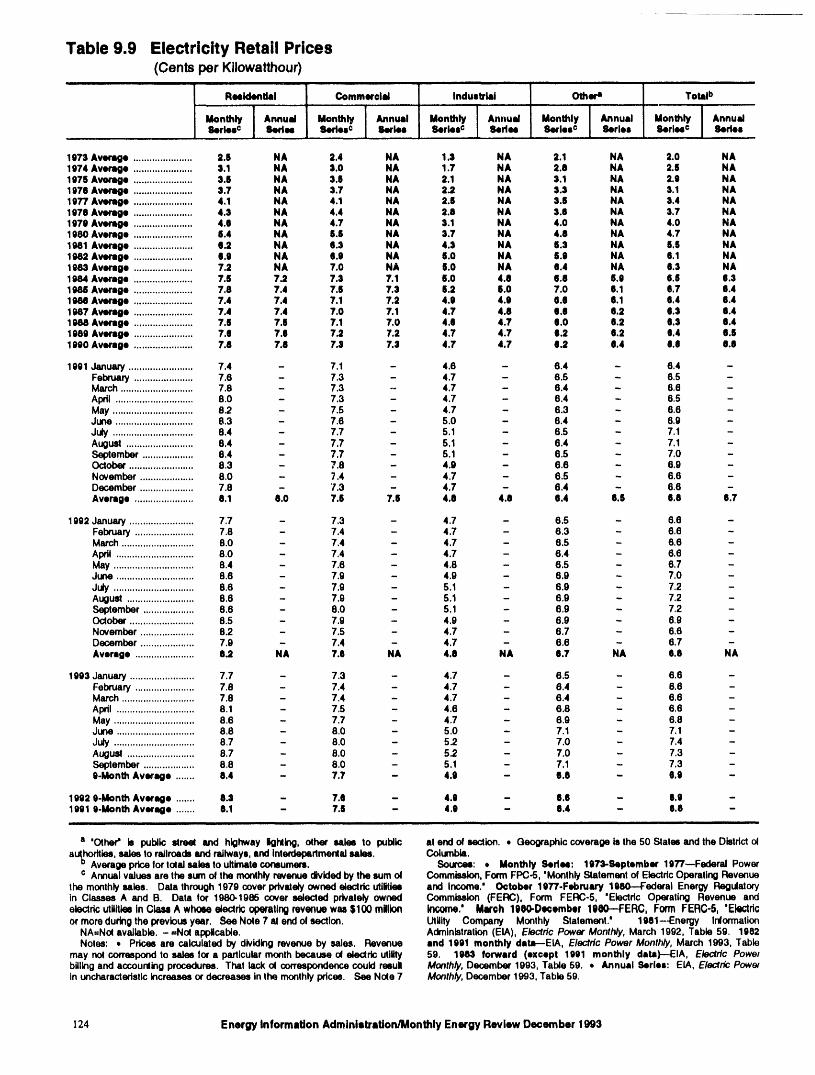
Table 9.9 Electricity Retail Prices(CentsperKilowatthour)
i ....
ResidenUal Commer¢lei Industrial Othera Totalb
Monthly J Annual Mon_ I Annul Monthly J Annual Menthlv ! Annual Month_ I Annu_fleries ¢ liedma aeries0 If_ries Series o Sede4 fierlee ° Series 6erlma¢ Series ....
1973 Average ...................... 2.6 NA 2.4 NA 1.3 NA 2.1 NA 2.0 NA1974 Average ...................... 3.1 NA 3.0 NA 1.7 NA 2.8 NA 2.5 NA1975 Average ...................... 3.11 NA 3.5 NA 2,1 NA 3.1 NA 2.9 NA1976 Average ...................... 3.7 NA 3.7 NA 2.2 NA 3.3 NA 3.1 NA1977 Average ...................... 4,1 NA 4.1 NA 2.11 NA 3.5 NA 3.4 NA1978 Average ...................... 4.3 NA 4.4 NA 2.8 NA 3.9 NA 3.7 NA1979 Average ...................... 4.9 NA 4.7 NA 3.1 NA 4.0 NA 4.0 NA1980 Average ...................... 5.4 NA li.li NA 3.7 NA 4.8 NA 4.7 NA1981 Average ...................... 9.2 NA 9.3 NA 4.3 NA 5.3 NA ILS NA1982 Average ...................... i1.9 NA 9.9 NA li.0 NA 5.9 NA 9.1 NA1983 Average ...................... 7.2 NA 7.0 NA 5.0 NA 6.4 NA 9.3 NA1984 Average ...................... 7.5 7.2 7.3 7.1 S.0 4.8 6.8 5.9 e.S $.31988 Average ...................... 7.8 7.4 7.8 7.3 8.2 6.0 7.0 e.1 9.7 6.419841Avenlge ...................... 7.4 7.4 7.1 7.2 4.9 4.0 0.8 0.1 11,4 6.41987 Average ...................... 7.4 7.4 7.0 7.1 4.7 4.8 9.0 8,2 g.3 9.41988 Average ...................... 7.6 7.6 7.1 7.0 4.6 4.7 e.o 9.2 9.3 6.41980 Average ...................... 7.8 7.8 7.2 7.2 4.7 4.7 9.2 9.2 9.4 9.61990 Average ...................... 7.8 7.8 7.3 7.3 4.7 4.7 8.2 8.4 8.9 8.8
1991 January ........................ 7.4 - 7.1 - 4.6 - 6.4 - 6.4 -February ...................... 7.6 - 7.3 - 4.7 - 6.5 - 6.5 -March ........................... 7.8 - 7.3 - 4.7 - 6.4 - 6.6 -Apdl ............................. 8.0 - 7.3 - 4.7 - 8.4 - 6.5 -May .............................. 8.2 - 7.5 - 4.7 - 6.3 - 6.6 -June ............................. 8.3 - 7.6 - 5.0 - 6.4 - 6.9 -July .............................. 8.4 - 7.7 - 5.1 - 6.5 - 7.1 -August ......................... 8.4 - 7.7 - 5.1 - 6.4 - 7,1 -September ................... 8.4 - 7.7 - 5.1 - 6.5 - 7.0 -October ........................ 8.3 - 7.8 - 4.9 - 6.6 - 6.9 -November .................... 8.0 - 7.4 - 4.7 - 6.5 - 6.6 -December .................... 7.8 - 7.3 - 4.7 - 6.4 - 6.6 -Avemge ...................... 8.1 8.0 7.6 7.6 4.8 4.8 0.4 6.5 9.8 0.7
1992 January ........................ 7,7 - 7.3 - 4.7 - 6.5 - 8.6 -February ...................... 7.8 - 7.4 - 4.7 - 6.3 - 6.8 -March ........................... 8.0 - 7.4 - 4.7 - 6.5 - 6.6 -April ............................. 8.0 - 7.4 - 4.7 - 6.4 - 6.6 -May .............................. 8.4 - 7.8 - 4.8 - 6.5 - 6.7 -June ............................. 8.8 - 7.9 - 4.9 - 6.9 - 7.0 -July .............................. 8.6 - 7.9 - 5.1 - 6,9 - 7.2 -August ......................... 8.6 - 7.9 - 5.1 - 6.9 - 7.2 -September ................... 8.6 - 8.0 - 5.1 - 6.9 - 7.2 -Oclober ........................ 8.5 - 7.9 - 4.9 - 6.9 - 8,9 -November .................... 8.2 - 7.5 - 4.7 - 6.7 - 6.6 -December .................... 7.9 - 7.4 - 4.7 - 6.6 - 6.7 -Average ...................... 8.2 NA 7.9 NA 4.8 NA t.7 NA 9.8 NA
1993 January ........................ 7.7 - 7.3 - 4.7 - 6.5 - 6.6 -February ...................... 7.8 - 7.4 - 4.7 - 8.4 - 8.8 -March........................... 7.8 - 7.4 - 4,7 - 6.4 - 6.6 -April ............................. 8.1 - 7.5 - 4.6 - 6.8 - 6.6 -May .............................. 8.6 - 7.7 - 4.7 - 6.9 - 6.8 -June ............................. 8.8 - 8.0 - 5.0 - 7.1 - 7.1 -July .............................. 8.7 - 8.0 - 5.2 - 7.0 - 7.4 -Augu_ ......................... 8.7 - 8.0 - 5.2 - 7.0 - 7.3 -September ................... 8.8 - 8.0 - 5.1 - 7.1 - 7.3 -g.Month Average ....... 8.4 - 7.7 - 4.9 - 6.8 - 9.9 -
1992 O-Month Average ....... 8.$ - 7.e - 4.0 - e.e - e.o -1991 9.Month Average ....... 8.1 - 7.6 - 4.9 - 8.4 - 0.8 -
i i i ill,
m 'Other" b public street lind highway lighting, other sales to public at end of section. • Geographic coverage is the 50 Stales and the Distdct o(authorities,sales to railroadsand railways,and inleldepertmeo(alsales. Columbia.
= Average pricefor to(at sales to ultimateconsumers. Sources: , Monthly Sedes: 1973-September 1977--Federal Powerc Annualvalues are the sum of the monthlyrevenue dividedby the sum el Commbalon, Form FPC-5, 'Monthly Statement of ElectdcOperatingRevenue
the monthlymales. Data through 1979 cover privately owned electric utilities and Income.' October 1977.Februmy 19_T-.F'ederal Energy Regulatoryin Classes A and B. Data lot 1980.1986 cover selected privately owned Commission (FERC), Form FERC-5, 'Electric Operating Revenue andelectric utMltleein Clam=A whose electrk; operatingrevenue was $100 million Inc,,mini," March 1000-D_ember 1000--FERC, Form FERC-5, 'Eki_'trl¢or moreduringthe previousyear. See Note 7 at end el section. Ullltty Company Monthly Statement.' 1981--Energy Inlormatlon
NA=NO(avalleble. - =No( applicable. Administration (EL&,),Elecfric Power Monthly, March 1992, Table 59. 1982Noles: • Prices are calculated by dividingrevenue by sales. Revenue and 1991 monthly data--EIA, Electric Power Monthly, March 1993, Table
may no( con'espondto sales for a particularmonth because ot electric utlltty 59. 1983 forward (except 1991 monthly dati)--EIA, Electric Powerbillingand accountingprocedure. That lack of oorrespondencacould resull Monthly, December 1993, Table 59. , /mnu=l Series: EIA, Electric Powelin uncharacteristicincreasesor decreases inthe monthlypdces. See Note 7 Monthly, December 1993, Table 59.
124 Energy Information AdmlnlstraUon/Monthly Energy Review December 1993
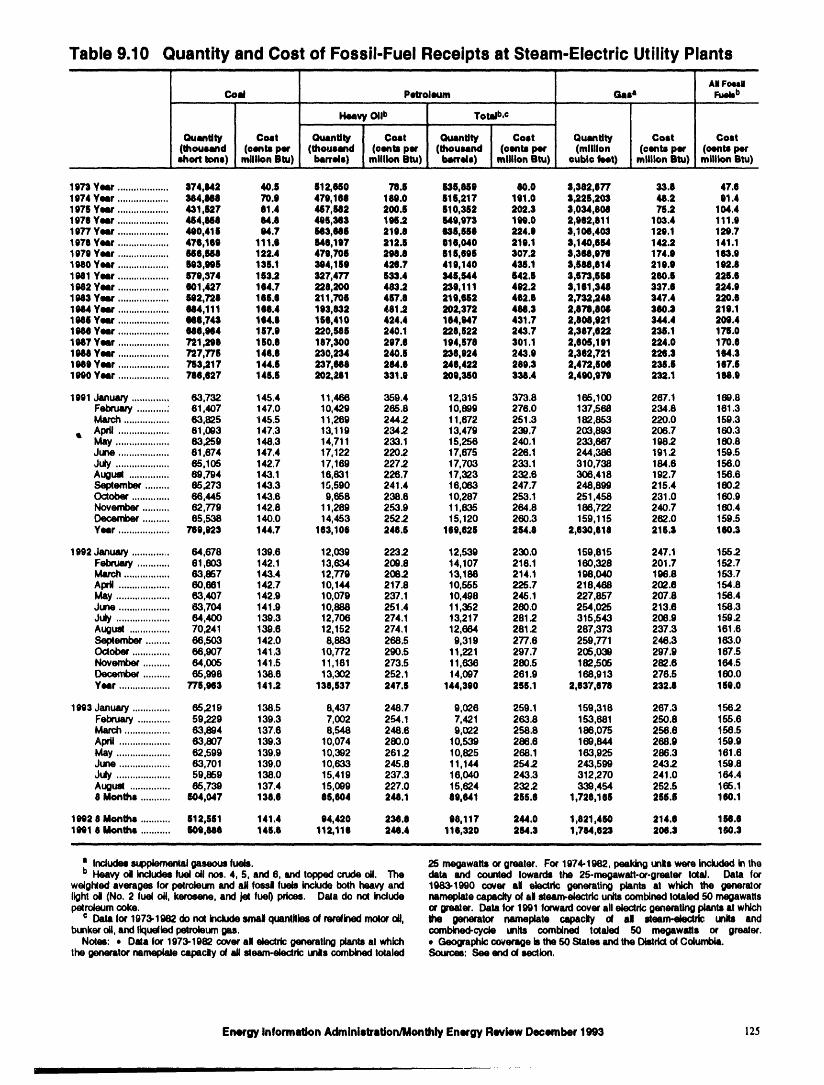
Table 9.10 Quantity and Cost of Fossil-Fuel Receipts at Steam-Electric Utility Plants
AMFouMCoal Petroleum Gasa Fuobb
,, ,, ,,,,
Heavy Oil b Totstb,¢,,,, ,,,
Quantity Cost QuanUty Cest Quantity Cost QuanUty Cost Cost(thoua.md (cents per (thousand (cents per (thouund (cents per (million (cents per (esnts per
short tons) million Btu) bands) million Btu) barrels) million Btu) cubic feet) million Btu) million Btu)
1973 Yesr ................... 374,842 40.6 612,980 78.6 636,989 80.0 3,382,677 33.8 47.61974 Yur ................... 344,068 70.9 470,160 180.0 816,217 101.0 3,228,203 46.2 91.41076 Yw ................... 431,627 81.4 487,982 200.6 610,362 202.3 3,034,800 76.2 104.41670 Yesr ................... 484,888 64.8 496,343 198.2 649,973 199.0 2,962,811 103.4 111.91077 Year ................... 400,418 84.7 843,086 210.8 636,488 224.0 3,10(I,403 129.1 129.71078 Yes ................... 478,160 111.9 M6,187 212.8 018,040 219.1 3,140,034 142.2 141.11679 Year ................... 688,988 122.4 470,796 298.8 616,986 307.2 3,398,978 174.0 163.91960 Yesr ................... 64)3,998 136.1 344,189 426.7 410,140 436.1 3,688,014 210.0 192.81981 Yesr ................... 679,374 163.2 327,477 633.4 346,644 642.6 3,673,698 260.6 226.61982 Yesr ................... (101,427 164.7 220,200 463.2 230,111 402.2 3,181,348 337.8 224.01983 Yw ................... 602,728 166.8 211,708 457.6 219,662 462.6 2,732,248 347.4 220.61984 Yesr ................... M4,111 186.4 103,632 481.2 202,372 498.3 2,870,808 360.3 219.11986 Yw ................... 168,743 164.8 166,410 424.4 164,347 431.7 2,808,021 344.4 209.41986 Yesr ................... 638,984 167,0 220,686 240.1 228,622 243.7 2,387,822 236.1 176.01987 Yew ................... 721,298 160.6 107,300 207.0 104,678 301.1 2,808,101 224.0 170.6I e61 Ymr ................... 727,778 148.8 230,234 240.6 238,324 243.0 2,382,721 229.3 1(14.31900 Yesr ................... 733,217 144.6 237,988 2114.0 246,422 280,3 2,473,606 236.6 167.61990 Yesr ................... 768,827 146.6 202,281 331.9 200,340 338,4 2,490,973 232.1 168.0
1091 January .............. 63 732 145.4 11,466 359.4 12,315 373.8 165 100 267.1 168.8FebnJery • 61 407 147.0 10,429 265.8 10,899 276.0 137 568 234.8 161.3Match ................. 63 825 145.5 11,269 2442 11 672 251.3 182 853 220.0 159.3
t April ................... 61 003 147.3 13,119 234.2 13 479 230.7 203 893 206.7 160.3May .................... 63 259 148.3 14,711 233.1 15 256 240.1 233 667 198.2 160.8June ................... 81 674 147.4 17,122 2202 17 675 226.1 244 388 191 2. 159.5July .................... 65 105 142.7 17,169 227.2 17 703 233.1 310 738 184.8 156.0Augua ............... 69 794 143.1 16,831 226.7 17 323 232.6 306 418 192.7 156.8September ......... 65 273 143.3 15,590 241.4 18 063 247.7 248 899 215.4 1602October .............. 66 445 143.6 9,658 238.8 10 287 253,1 251 458 231.0 160.9November .......... 62 779 142,8 11,289 253.9 11 835 264.8 188 722 240.7 160.4December .......... 65538 140.0 14,453 252.2 15 120 260.3 159 115 262.0 159.5Yesr ................... 789 923 144.7 163,106 248.6 189 626 264.8 2,630,818 216.3 160.3
1092 January .............. 64,678 139.6 12,039 2232 12 539 230.0 159,815 247.1 1552Felxuery ............ 61,603 142.1 13,634 200.8 14 107 216.1 160,328 201.7 152.7Match ................. 63,657 143.4 12,779 2062. 13 188 214.1 198,040 196.8 153.7Apdt ................... 60,681 142.7 10,144 217.8 10 555 225.7 218,468 202.8 154.8May .................... 63,407 142.9 10,079 237.1 10 498 245.1 227,857 207.8 156.4June ................... 63,704 141.9 10,888 251.4 11 352 260,0 254,025 213.8 158.3July .................... 64,400 139.3 12,706 274.1 13217 281.2 315,543 208.9 159.2Augul ............... 70241 139.8 12,152 274.1 12 864 281 2. 287,373 237.3 161.6Sep(ember ......... 63,503 142.0 8,883 268.5 9 319 277.8 259,771 248.3 183.0Oclober .............. 66,907 141.3 10,772 290.5 11 221 297.7 205,039 297.9 167.5November .......... 64,005 141.5 11,181 273.5 11,636 280.5 182,505 282.8 164.5December .......... 65,998 138.8 13,302 252.1 14,097 281.9 168,913 278.5 180.0Yesr ................... 776,983 141.2 138,637 247.S 144,300 266.1 2,837,678 232.8 160.0
1983 January .............. 65219 138.5 8,437 248.7 9,026 259.1 159,318 267.3 156.2February ............ 59 229 139.3 7,002 254.1 7,421 263.8 153,681 250.8 155.8March ................. 63,894 137.6 8,548 248.6 9,_2 256.8 168,075 256.8 156.5Apdl ................... 63,807 139.3 10,074 280.0 10,539 286.8 160,844 268.9 159.9May .................... 62,599 139.9 10,302 261.2 10,825 268.1 163,925 286.3 181.6June ................... 63,701 139.0 10,633 245.8 11,144 2542 243,599 2432 159.8J_t .................... 59,659 138.0 15,419 237.3 18,O40 243.3 312270 241.0 164.4Augtnll ............... 65,739 137.4 15,089 227.0 15,624 2322 339,454 252.5 165.18 Months ........... 804,047 138.6 86,604 248.1 80,641 266.0 1,728,186 266.8 180.1
1092 0 Months ........... 612,661 141.4 84,420 2341.8 08,117 244.0 1,821,400 214.6 16(5.81981 0 Months ........... 608,686 146.6 112,116 248.4 116,320 234.3 1,734,62:1 200.3 100.3
• IncludessUpplemen_l gaseous fuels. 25 megawalta or grester. For 1974-1982, peaking unils were included in theb Heavy oil includes fuel oil nos. 4, 5, and 6, and lopped crude oil. The data and counled towards the 25-megawall-or-gresler IolaL Data for
weiohled averagesfor pe4roioumand sll fossil fuels include both heaw and 1983-1990 cover sl electric generating plants at which the generalorlight oil (No. 2 fuel oil, kerosene, and jel fuel) lXiOU. Dala do not include nameplate capacity o4sl alesm-eieclric unitscombined lotaled 50 megawaflspetroieum coke. or greater. Data for 1991 forward cover aH eleclrlc oenerallng plants at wl'_..h
¢ Data for 1973,.1962 do nol includesmall quanttlies o4rerdlned molor oIJ, Ihe generator namep4ale capacily of aJ ltesm-eks:_, units andbunkeroil, axldliqueliedpelroleumgu, cornbined-cyoie units combined to(aJed 50 megawatts or gresler.
Noles: • Data for 1973-1982 cover aft eiocffic generating plants st which , Geographic coverage Is the 50 Slates and the Dtstdd O4Coiumb_.the generator nameplale capecly O4_ _esm-electrtc urdls com_ totaled Sources: See end d eecflon.
EnergyInformationAclminletraUon/MonthlyEnergyReviewDecember1993 125
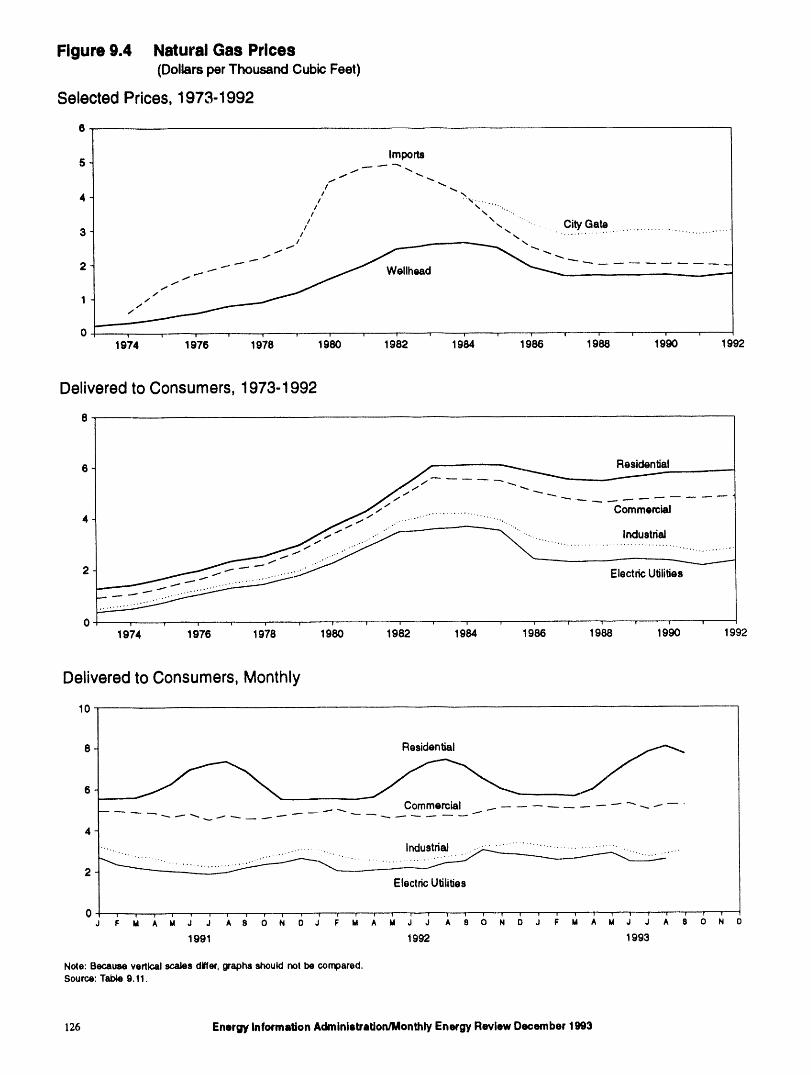
Figure 9.4 Natural Gas Prices(Dollars per ThousandCubicFeet)
Selected Prices, 1973-1992
6
5 Imports
4 tii _ _, .... ,+..
I \,,, ,...... City Gate/ ._ +.+ ..............................• . ..................3 / ,.
,If
O ! i v i 1 i ! '! ' '1 i '
1974 19'76 1978 1980 19_32 1984 19'86 i988 19'90 1992
Delivered to Consumers, 1973-1992
8
6 .... _ Residential
,- . Commercial4 f .'" ............ " ....
,I, .J ..... ..,
t I ....•......... Industrial
2 _ "'' +'+'........ Electric Utilities.--.-- t ....... .'"
! ! i i ! i i i I 1 T ! !
0 197'4 1976 1978 1980 1982 19_t 19'86 1988 199'0 1992
Delivered to Consumers, Monthly
10
8 Residential
Commercial ...., ..... ---.I"
4
2ElectricUtilities
v l i ! ! l T v I_ ........ _ ......
1991 1992 1993
No_e:BecauseverticalscaJesdMfar,graphsshouldnolbe compared.Source:Table9.11.
126 Energy Information Administration/Monthly Energy Review December 1993
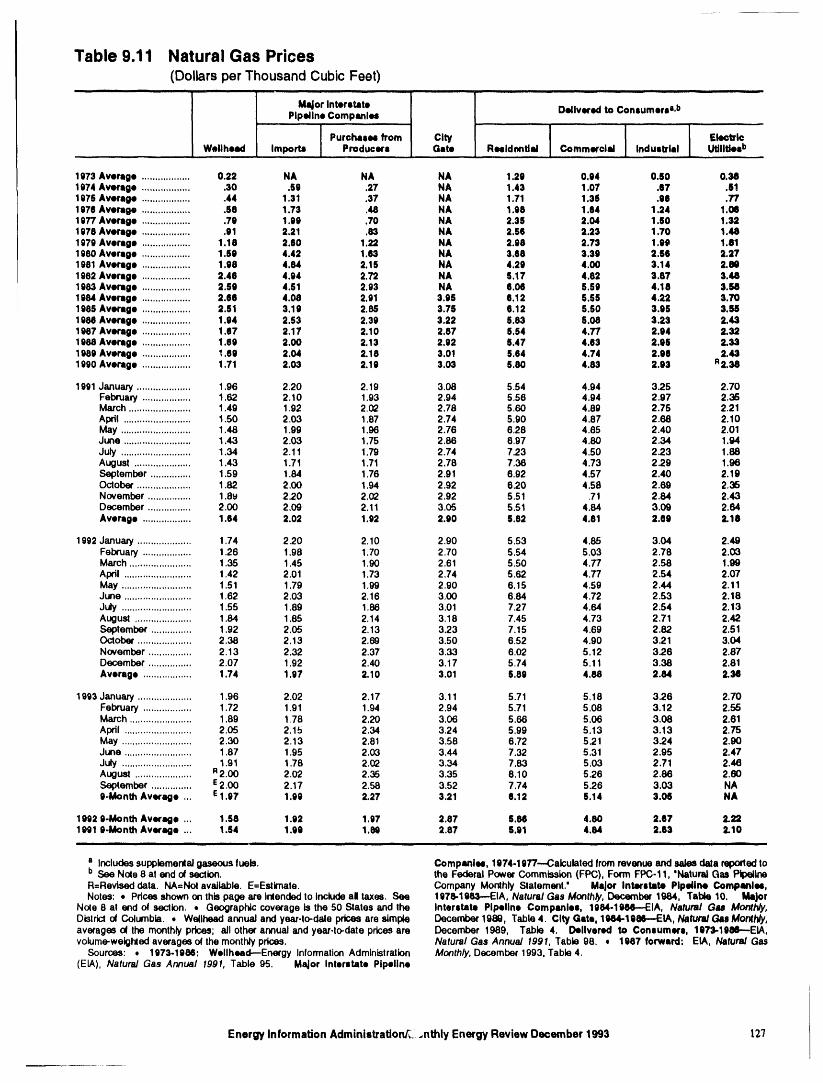
Table 9.11 Natural Gas Prices(Dollars per Thousand Cubic Feet)
, i .,
Major Interstate Delivered to Consumera=,bPIpeline Companies
., ,, "
Purchases from City Eleetrte
.......... Wellhead Imports Producers Gate Resid_nUal Commercial Induab'i=l UtiliUeab....
1973 Average .................. 0.22 NA NA NA 1.29 0.94 0.50 0.381974 Average ................... 30 .59 .27 NA 1.43 1.07 .87 .611976 Average ................... 44 1.31 .37 NA 1.71 1.35 .95 .771975 Average ................... 58 1.73 .48 NA 1.98 1.64 1.24 1.061977 Average ................... 79 1.99 .70 NA 2.35 2.04 1.60 1.321978 Average ................... 91 2,21 .83 NA 2.56 2.23 1.70 1.481979 Average .................. 1.18 2.60 1.22 NA 2.98 2.73 1.99 1.811980 Average .................. 1.69 4.42 1.63 NA 3.68 3.39 2.68 2.271981 Average .................. 1.98 4.84 2.15 NA 4.29 4.00 3.14 2.801982 Average .................. 2.46 4.94 2.72 NA 5.17 4.82 3.87 3.481983 Average .................. 2.59 4.51 2.93 NA 6.06 5.59 4.18 3.681984 Average .................. 2.66 4.08 2.91 3.96 6.12 5.55 4.22 3.70
i 1985 Average .................. 2.51 3.19 2.85 3.75 5.12 5.50 3.95 3.581988 Average .................. 1.94 2.53 2.39 3.22 5.83 5.08 3.23 2.431987 Average .................. 1.67 2.17 2,10 2.87 5.54 4.77 2.94 2.321988 Average .................. 1.69 2.00 2.13 2.02 6.47 4.63 2,96 2.331989 Average .................. _.69 2.04 2.18 3.01 5.64 4.74 2.95 2.431990 Average .................. 1.71 2.03 2.19 3.03 5.80 4.83 2.93 R2.38
1991 January .................... 1.96 2.20 2.19 3.08 5.54 4.94 3.25 2.70February .................. 1,62 2.10 1.93 2.94 5.56 4.94 2.97 2.36March ....................... 1.49 1.92 2.02 2.78 5.60 4.89 2.75 2.21April ......................... 1.50 2,03 1.87 2.74 5.90 4.87 2.68 2.10May .......................... 1.48 1.99 1.96 2.76 6.28 4.85 2.40 2.01June ......................... 1.43 2.03 1.75 2.86 6.97 4.80 2.34 1.94July .......................... 1.34 2.11 1.79 2.74 7.23 4.50 2.23 1.88August ..................... 1.43 1.71 1.71 2.78 7.36 4.73 2.29 1.96September ............... 1.59 1.84 1,76 2.91 6.92 4,57 2.40 2.19October .................... 1.62 2.00 1,94 2.92 62.0 4.58 2.69 2,36November ................ 1.8y 2.20 2.02 2.92 5.51 .71 2.84 2.43December ................ 2.00 2.09 2.11 3.05 5.51 4.84 3.09 2.64Average .................. 1.54 2.02 1.92 2.90 6.82 4.81 2.69 2.18
1992 January .................... 1.74 2.20 2.10 2.90 5.53 4.85 3.04 2.49February .................. 12.6 1.98 1.70 2.70 5.54 5.03 2.78 2.03March ....................... 1.35 1.45 1.90 2.61 5.50 4.77 2.58 1.99April ......................... 1.42 2.01 1.73 2.74 5.62 4.77 2.54 2.07May .......................... 1.51 1.79 1.99 2.90 6.15 4.59 2.44 2.11June ......................... 1.62 2.03 2.16 3.00 6,84 4,72 2.53 2.18July .......................... 1.55 1.89 1.86 3.01 7.27 4.64 2.54 2.13August ..................... 1.84 1.85 2.14 3,18 7.45 4,73 2.71 2.42September ............... 1.92 2.05 2.13 3.23 7.15 4.69 2.82 2.51October .................... 2.38 2.13 2,69 3.50 6.52 4.90 32.1 3,04November ................ 2.13 2.32 2.37 3.33 6.02 5.12 3.26 2.87December ................ 2.07 1.92 2.40 3.17 5.74 5.11 3.38 2.81Average .................. 1.74 1.97 2.10 3.01 5.89 4.88 2.84 2.34
1993 January .................... 1.96 2.02 2,17 3.11 5.71 5,18 3,26 2.70February .................. 1.72 1.91 1.94 2.94 5.71 5.08 3.12 2.55March ....................... 1.89 1.78 2.20 3,06 5.66 5.06 3,08 2.61April ......................... 2.05 2.15 2.34 3.24 5.99 5.13 3.13 2.75May .......................... 2.30 2.13 2.81 3.58 6.72 5.21 3.24 2.90June ......................... 1.87 1,95 2.03 3.44 7.32 5.31 2.95 2,47July .......................... 1.91 1.78 2.02 3.34 7.83 5.03 2.71 2.46August ..................... R2.00 2.02 2.35 3,35 8.10 5.26 2.86 2.60September ............... E2.00 2.17 2.58 3.52 7.74 5.26 3.03 NA9-Month Average ... s 1.97 1.99 2.27 3.21 5.12 5.14 3.06 NA
1092 e-Month Average .,. 1.58 1.92 1.97 2.87 5.86 4.80 2.87 2.221991 9-Month Average ... 1,54 1.99 1.og 2.87 5.91 4.84 2.63 2.10
ii i i
a Includessupplementalgaseous fuels. Compamles, 1974,1977.--Calculated from revenue and salesdata reportedtob See Note 8 at end of section, the Federal Power Commission (FPC), Form FPC-11, 'Natural Gas PipelineR=Revised data. NA=Nol available. E=Estimate. Company Monthly Statement.' Major Interstate Plpaline Compamles,Notes: • Pdcesshown on thispage are Intended to Includeal taxes. See 1976-1963--EIA, Natural Gas Monthly, December 1984, Teble 10. Major
Note 8 at end of section, t Geographic coverage is the 50 Slates and Ihe Intarstete Pipeline Companies. 1984-19e6--EIA. Natural Gu Monthly,Dislricl ot Columbia. , Wellhead annual and year-to-dale pdces are simple December 1989, Table 4. City Gate, 1684-196t----EIA, Natural Gas Mor_h/y,averages ot the monthly prices; all other annual and year.to-date pricesare December 1989, Table 4. Delivered to Consumers, 197_1911_---EIA,volume-weighledaverages of the monthlyprices. Natural Gas Annual 1991, Table 98. • 1987 forward: EIA, Natura/Gas
Sources: • 1973-1986: Wellhead--Energy InformationAdministration Monthty, December 1993, Table 4.(E[A), Natura/ Gas Annual 1991, Table 95. Major Interstate Pipeline
EnergyInformationAdministration/_._..,n_lyEnergyReviewDecember19g3 12"/
Energy Prices Notes ERA-49 exclude oil purchased for SPR, whereas the com-posite averages derived from Form ERA-49 include SPR.None of the prices derived from Form EIA.14 include
1. The average domestic first purchase price represents either unfinished oils or SPR.the average price at whtch all domestic crude oil is pur-chased. Prior to February 1976, the price representedan estimate of the average of posted prices; beginning 5. Several different series of motor gasoline prices arewith February 1976, the price represents an average of published in this section. U.S. City Average Retail Prices
of Motor Gasoline are calculated monthly by the Bureauactual first purchase prices. The data series was pre-viously called "Actual Domestic Wellhead Price." of Labor Statistics during the development of the Con-
sumer Price Index (CPI). These prices include allFederal, State, and local taxes paid at the time of sale.
2. EO.B. literally means "Free on Board." It denotes For the period 1974-1977, prices were collected in 56a transaction whereby the seller makes the product avail- urban areas. For the period 1978 forward, prices wereable with an agreement on a given port at a given price; collected from a new sample of service stations in 85it is the responsibility of the buyer to arrange for the urban areas selected to represent all urban consumerswtransportation and insurance, about 80 percent of the total U.S. population. The service
stations are selected initially, and on a replacement basis,3. The landed cost of imported crude oil from selected in such a way that they represent the purchasing habitscountries does not represent the total cost of all imported of the CPI population. Service stations in the currentcrude. Prior to March 1975, imported crude costs to sample include those providing all types of service (i.e.,U.S. company-owned refineries in the Caribbean were full-, mini-, and self-serve).not included in the landed cost, and costs of crude oilfrom countries that export only small amounts to theUnited States were also excluded. Beginning in March Refiner prices of finished motor gasoline for resale and1975, however, coverage was expanded to include U.S. to end users are determined by the Energy Informationcompany-owned refineries in the Caribbean. Landed Administration (EIA) in a monthly survey of refiners andcosts do not include supplemental fees. gas plant operators (Form EIA-782A). The prices do not
include any Federal, State, or local taxes paid at the timeof sale. Estimates of prices prior to January 1983 are
4. Beginning with January 1981, refiner acquisition based on Form FEA-P302-M-1/EIA-460, "Petroleum In-costs of crude oil are from data collected on Form EIA- dustry Monthly Report for Product Prices," and also14, "Refiners' Monthly Cost Report." Those costs were exclude all Federal, State, or local taxes paid at the timepreviously published from data collected on Form ERA- of sale. Sales for resale are those made to purchasers49, "Domestic Crude Oil Entitlements Program Refiners who are other-than-ultimate consumers. Sales to endMonthly Report." Form ERA-49 was discontinued with users are sales made directly to the consumer of thethe decontrol of crude oil on January 28, 1981. Crude product, including bulk consumers, such as agriculture,oil purchases and costs are defined for Form EIA-14 in industry, and utilities, as well as residential and commer-accordance with conventions used for Form ERA-49. cial consumers.Also, the respondents for the two forms are essentiallythe same. However, due to possible different interpreta-tions of the filing requirements and a different method 6. Starting in January 1983, Form EIA-782, "Monthlyfor handling prior period adjustments, care must be Petroleum Product Sales Report," replaced 10 previoustaken when comparing the data collected on the two surveys. Every attempt was made to continue the mostforms, important price series. However, prices published
through December 1982 and those published sinceJanuary 1983 do not necessarily form continuous data
The refiner acquisition cost of crude oil is the average series due to changes in survey forms, definitions, instruc-price paid by refiners for crude oil booked into their tions, populations, samples, processing systems, andrefineries in accordance with accounting procedures statistical procedures. To provide historical data, con-generally accepted and consistently and historically ap- tinuous series were generated for annual data 1978-1982plied by the refiners concerned. Domestic crude oil is and for monthly data 1981 and 1982 by estimating thethat oil produced in the United States or from the outercontinental shelf as defined in 43 USC Section 1331. prices that would have been published had Form EIA-782
survey and system been in operation at that time. ThisImported crude oil is either that oil reported on Form form of estimation was performed after detailed adjust-ERA-51, "Transfer Pricing Report," or any crude oil that ment was made for product and sales type matching andis not domestic oil. The composite cost is the weighted for discontinuity due to other factors. An important dif-average of domestic and imported crude oil costs, ference between the previous and present prices is the
distinction between wholesale and resale and betweenCrude oil costs and volumes reported on Form ERA-49 retail and end user. The resale category continues toexcluded unfinished oils but included the Strategic include sales among resellers, tIowever, bulk sales toPetroleum Reserve (SPR). Crude oil costs and volumes utility, industrial, and commercial accounts previouslyreported on Form FEA-Pll0-M-1, "Refiners' Monthly included in the wholesale category are now counted asCost Allocation Report," included unfinished oils but made to end users. The end-user category continues toexcluded SPR. Imported averages derived from Form include retail sales through company owned and operated
128 EnergyInformationAdministration/MonlhlyEnergyReviewDecember1993

outlets but also includes the bulk utility, industrial, and Electric utility data for 1973-1982 cover all electriccommercial sales. Additional information may be found generating plants at which the generator nameplatein Estimated Historic Time Series for the EIA-782, a capacity of all steam-electric units combined totaled 25feature article reprinted from the December 1983 [3] megawatts or greater. From 1974-1982, peaking unitsPetroleum Marketing Monthly, published by EIA. were included in the data and counted towards the 25-
megawatt-or-greater total. Data for 1983-1990 cover allelectric generating plants at which the generator
7. National average electricity prices are shown in two nameplate capacity of all steam-electric units combineddata series. The "Annual Series" is based on data from totaled 50 megawatts or greater. Data for 1991 forwardmore than 3,000 publicly and privately owned electric cover all electric generating plants at which the generatorutilities that report on Form EIA-861, "Annual Electric nameplate capacity of all steam-electric units and corn-Utility Report." The "Monthly Series" is based on data bined-cycle units together totaled 50 megawatts orfrom over 400 utilities statistically chosen as a stratifiedsample of the utilities that report on Form EIA-861. greater.The selected utilities report monthly on Form EIA-826,"Monthly Electric Utility Sales and Revenue Report Sources for Table 9.10with State Distributions," formerly the "Electric Utility
Company Monthly Statement." Annual values shown • 1973.1979. Annual data for quantity &re simple sumsfor the monthly series are the sum of the monthly of unfounded monthly values and for cost are averagesrevenue divided by the sum of the monthly sales. Prior of monthly values, weighted by quantities, from theto January 1986, only privately owned utilities were in- following: 1973-May 1977--Federal Power Commis-eluded in the monthly survey and the sample was chosen sion, Form FPC-423, "Monthly Report on Cost andby using cut-off, rather than stratification, techniques. Quality of Fuels for Electric Utility Plants." June 1977-
December 1977--Federal Energy Regulatory
8. Natural gas prices are intended to include all taxes. Commission, Form FERC-423, "Monthly Report on CostInstructions on the data collection forms specifically and Quality of Fuels for Electric Utility Plants." 1978direct that all Federal, State, and local taxes, surcharges, and 1979--Energy Information Administration (EIA),and/or adjustments billed to consumers are to be in- Form FERC-423, "Monthly Report on Cost and Quality
of Fuels for Electric Utility Plants."eluded. However, sales and other taxes itemized onconsumers' bills are sometimes excluded by thereporting utilities. ° 1980: EIA, Electric Power Monthly, April 1991,
Table 33.
Delivered-to-consumers prices for 1987 forward • 1981: EIA, Electric Power Monthly, April 1992,represent natural gas delivered and sold to residential, Table 33.commercial, industrial, and electric utility consumers.They do not include the price of natural gas deliveredto industrial and commercial consumers on behalf of • 1982 and 1991 monthly data: EIA, Electric Powerthird parties. Volumes of natural gas delivered on be- Monthly, April 1993, Table 33.half of third parties are included in the consumption datashown in Table 4.3. Additional information is available • 1983 forward: (except 1991 monthly data): EIA,in the EIA Natural Gas Monthly, Appendix C. Electric Power Monthly, December 1993, 1"able 33.
EnergyInformationAdministration/MonthlyEnergyReviewDecember1993 129
Section 10. International Energy
Crude Oil Production. World crude oil production per day, in the former U.S.S.R. by 15 thousand barrelsduring September 1993 was 60 million barrels per day, per day, and in Canada by 10 thousand barrels per day.down slightly from the level in the previous month. Production remained unchanged in Mexico.World crude oil production in the first 3 quarters of
1993 averaged 60 million barrels per day, down 0.2 Petroleum Consumption. In July 1993, consumptionpercent compared with production in the first 3 in all Organization for Economic Cooperation andquarters of 1992. Development (OECD) countries was 38.3 million bar-
rels per day, 1 percent9 lower than the July 1992 rate.
Organization of Petroleum Exporting Countries (OPEC) The consumption rate was higher than it was 1 yearproduction during September 1993 averaged 26 million ago in Canada (+2 percent) and slightly higher in theUnited States. Consumption was lower in Japan (-6barrels per day, up 0.1 million barrels per day from percent), France and Italy (each -4 percent), Germanythe level during the previous month. OPEC productionduring the first 3 quarters of 1993 averaged 26 million (-3 percent), and in the United Kingdom (-1 percent).barrels per day, up 4 percent compared with productionin the same period in 1992. Production by the Arabmembers of OPEC in September 1993 averaged 16 Petroleum Stocks. For all OECD countries, petroleummillion barrels per day, down 0.1 million barrels per stocks at the end of July 1993 totaled 3.7 billion bar-day from the August 1993 level. Production by the rels, 3 percent higher than the ending stock level inArab members of OPEC during the first 3 quarters of July 1992. Stock levels were higher than the levels 11993 averaged 16 million barrels per day, 4 percent year ago in Japan and Germany (each +5 percent) andabove the level in the first 3 quarters of 1992. During the United States and Canada (each +3 percent).September 1993, production increased in the United Stocks were lower in July 1993 than in July 1992 inArab Emirates by I0 thousand barrels per day. Italy (-6 percent), United Kingdom (-4 percent), andProduction decreased in Saudi Arabia by 75 thousand France (-3 percent)compared with levels 1 year earlier.b_u'rels per day and in Kuwait by 25 thousand barrelsper day, Production remained unchanged in Algeria,lraq, Libya and Qatar. Among the non-Arab members Nuclear Electricity Generation. Based on Nucleonicsof OPEC, production during September 1993 increased Week information for September 1993, reportingin lran by 150 thousand barrels per day and in Nigeria countries with nuclear capacity generated 154 grossby 20 thousand barrels per day. Production decreased terawatthours of nuclear-generated electricity, 5 percentin Venezuela by 10 thousand barrels per day and more than in September 1992.remained unch_ged in Indonesia.
As of September 30, 1993, there were 358 operablenuclear generating units in the reporting countries.
Among the non-OPEC nations, production during Sep- The units had a collective gross generating capacity oftember 1993 increased in both the United Kingdom and 304.7 gigawatts. The 109 U.S. units accounted forChina by 5 thousand barrels per day. Production 105.3 gross gigawatts, 34.5 percent of the total reporteddecreased in the United States by 21 thousand barrels nuclear generating capacity.
Percentage changes are based on unrounded data._°One lerawalthour equals 1 billion kilowatthours,_One megawall equals 1 lhousand kilowalts._20ne gigawatt equals 1 million kilowatts.
Energy Information Adminlstratlon/Monthly Energy Review December 1993 131
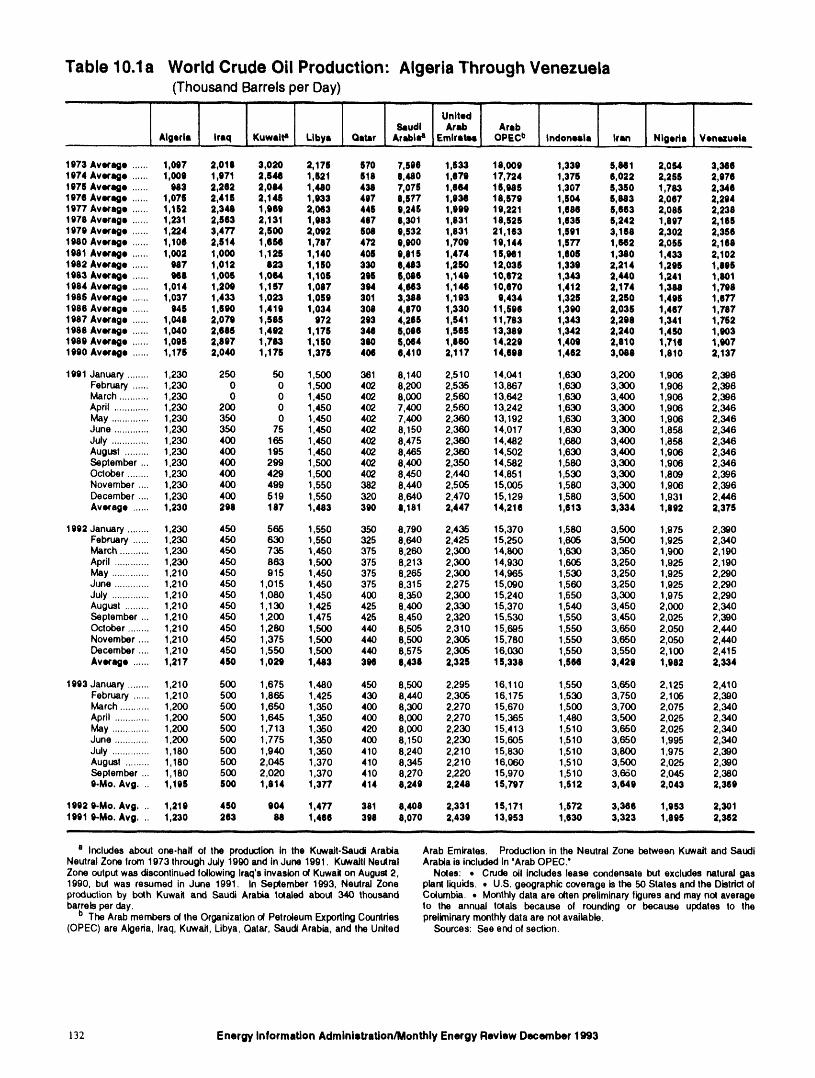
Table 10.1a World Crude Oil Production: Algeria Through Venezuela(Thousand Barrels per Day)
i lll l i, i iii i i _
=:.1973 Average ...... 1,087 2,018 3,020 2,176 570 7,598 1,633 19 009 1,339 5,661 2,08,1 3,3681974 Average ...... 1,006 1,971 2,546 1,521 618 8,480 1,879 17 724 1,375 6,022 2,255 2,9761976 Average ...... U3 2,282 2,084 1,480 438 7,075 1,664 16 966 1,307 5,350 1,783 2,3481976 Average ...... 1,076 2,416 2,148 1,933 497 8,577 1,036 18 579 1,504 8,883 2,067 2,2941977 Average ...... 1,152 2,346 1,989 2,063 448 9,245 1,999 19 221 1,686 5,663 2,085 2,2381978 Average ...... 1,231 2,563 2,131 1,983 487 8,301 1,831 18 525 1,835 5,242 1,897 2,1651979 Average ...... 1,224 3,477 2,500 2,092 508 9,532 1,831 21 163 1,891 3,168 2,302 2,3561980 Average ...... 1,106 2,514 1,89 1,787 472 9,900 1,709 19 144 1,877 1,662 2,055 2,1681981 Average ...... 1,002 1,000 1,125 1,140 406 9,818 1,474 15 961 1,605 1,380 1,433 2,1021982 Average ...... 987 1,012 823 1,150 330 6,483 1,250 12 036 1,339 2,214 1,296 1,8951983 Average ...... 968 1,005 1,064 1,106 296 6,086 1,149 10 672 1,343 2,440 1,241 1,8011984 Average ...... 1,014 1,209 1,157 1,087 304 4,643 1,146 10 870 1,412 2,174 1,388 1,7981985 Average ...... 1,037 1,433 1,023 1,059 301 3,389 1,193 9 434 1,325 2,250 1,496 1,6771986 Average ...... 845 1,820 1,419 1,034 308 4,870 1,330 11 896 1,390 2,035 1,467 1,7871987 Average ...... 1,048 2,079 1,585 972 293 4,265 1,541 11 783 1,343 2,298 1,341 1,7521988 Average ...... 1,040 2,885 1,492 1,175 344 5,088 1,565 13 389 1,342 2,240 1,450 1,9031989 Average ...... 1,085 2,897 1,783 1,150 380 5,084 1,860 14,229 1,409 2,810 1,716 1,9071990 Average ...... 1,176 2,040 1,175 1,375 408 6,410 2,117 14,699 1,462 3,086 1,810 2,137
1991 January........ 1,230 250 50 1,500 361 8,140 2,510 14,041 1,630 3,200 1,906 2,396February ...... 1,230 0 0 1,500 402 8,200 2,535 13,867 1,630 3,300 1,906 2,396March ........... 1,230 0 0 1,450 402 8,000 2,560 13,642 1,630 3,400 1,906 2,396April ............. 1,230 200 0 1,450 402 7,400 2,560 13,242 1,630 3,300 1,906 2,346May .............. 1,230 350 0 1,450 402 7,400 2,360 13,192 1,630 3,300 1,906 2,346June ............. 1,230 350 75 1,450 402 8,150 2,360 14,017 1,630 3,300 1,858 2,346July .............. 1,230 400 165 1,450 402 8,475 2,360 14,482 1,680 3,400 1,858 2,346August ......... 1,230 400 195 1,450 402 8,465 2,360 14,502 1,630 3,400 1,906 2,346September ... 1,230 400 299 1,500 402 8,4(X) 2,350 14,582 1,580 3,300 1,906 2,346October ........ 1,230 400 429 1,500 402 8,450 2,440 14,851 1,530 3,300 1,809 2,396November .... 1,230 400 499 1,550 382 8,440 2,505 15,005 1,580 3,300 1,906 2,396December .... 1,230 400 519 1,550 320 8,640 2,470 15,129 1,580 3,500 1,931 2,446Average ...... 1,230 298 187 1,483 390 8,181 2,447 14,218 1,813 3,334 1,892 2,375
1992 January ........ 1,230 450 565 1,550 350 8,790 2,435 15,370 1,580 3,500 1,975 2,390February ...... 1,230 450 630 1,550 325 8,640 2,425 15,250 1,605 3,500 1,925 2,340March ........... 1,230 450 736 1,450 375 8,260 2,300 14,800 1,630 3,350 1,900 2,190April ............. 1,230 450 863 1,500 375 8,2t3 2,300 14,930 1,605 3,250 1,925 2,190May .............. 1,210 450 915 1,450 375 8,265 2,300 14,965 1,530 3,250 1,925 2,290June ............. 1,210 450 1,015 1,450 375 8,315 2,275 15,090 1,560 3,250 1,925 2,290July .............. 1,210 450 1,080 1,450 400 8,350 2,300 15,240 1,550 3,300 1,975 2,290August ......... 1,210 450 1,130 1,425 425 8,400 2,330 15,370 1,540 3,450 2,000 2,340September ... 1,210 450 1,200 1,475 425 8,450 2,320 15,530 1,550 3,450 2,025 2,390October ........ 1,210 450 1,280 1,500 440 8,505 2,310 15,695 1,550 3,650 2,050 2,440November .... 1,210 450 1,375 1,500 440 8,500 2,306 15,780 1,550 3,650 2,050 2,440December .... 1,210 450 1,550 1,500 440 8,575 2,305 16,030 1,550 3,550 2,100 2,415Average ...... 1,217 450 1,029 1,483 396 8,438 2,325 15,338 1,564 3,429 1,982 2,334
1993 January ........ 1,210 500 1,675 1,480 450 8,500 2,295 16,110 1,550 3,650 2,125 2,410February ...... 1,210 500 1,865 1,425 430 8,440 2,305 16,175 1,530 3,750 2,106 2,390March ........... 1,200 500 1,650 1,350 400 8,300 2,270 15,670 1,500 3,700 2,075 2,340April ............. 1,200 500 1,645 1,350 400 8,000 2,270 15,365 1,480 3,500 2,025 2,340May .............. 1,200 500 1,713 1,350 420 8,000 2,230 15,413 1,510 3,650 2,025 2,340June ............. 1,2OO 500 1,775 1,350 400 8,150 2,230 15,605 1,510 3,650 1,995 2,340July .............. 1,180 500 1,940 1,350 410 8,240 2,210 15,830 1,510 3,800 1,975 2,390August ......... 1,180 500 2,O45 1,370 410 8,345 2,210 16,060 1,510 3,500 2,025 2,390September ... 1,180 500 2,020 1,370 410 8,270 2,220 15,970 1,510 3,650 2,045 2,3809.Mo. Avg... 1,195 500 1,814 1,377 414 8,249 2,248 15,797 1,512 3,649 2,043 2,369
t992 9-Mo. Avg... 1,219 450 904 1,477 381 8,408 2,331 15,171 1,572 3,386 1,953 2,3011991 9-Mo. Avg... 1,230 263 88 1,486 399 8,070 2,439 13,953 1,630 3,323 1,895 2,382
a Includes about one.half of the production in the Kuwalt-Saudi Arabia Arab Emirates. Production in the Neutral Zone between Kuwait and SaudtNeutralZone from 1973 through July 1990 and in June 1991. Kuwaltl Neutral Arabia is included in 'Arab OPEC.'Zone outputwas discont_LJedfollowingIraq'sinvasion ol Kuwait on August2, Notes: • Crude oil Includes lease condensate but excludes natural gas1990, but was resumed in June 1991. In Sel:Xember1993, Neutral Zone plant liquids. • U.S. geographiccoverage is the 50 States andthe Distdctolproduction by both Kuwait and Saudi Arabia totaled about 340 thousand Columbia. • Monthlydata are o(ten preliminaryfiguresand may not averagebarretsper day. to the annual totals because of rounding or because updates to the
b The Arab members o( the Organizationo( PetroleumExportingCountries preliminarymonthlydata are not available.(OPEC) are Aigeda, Iraq, Kuwait, Libya, Qatar, SaudtArabia, and the United Sources: See end of section.
132 Energy Information Administration/Monthly Energy Review December 1993
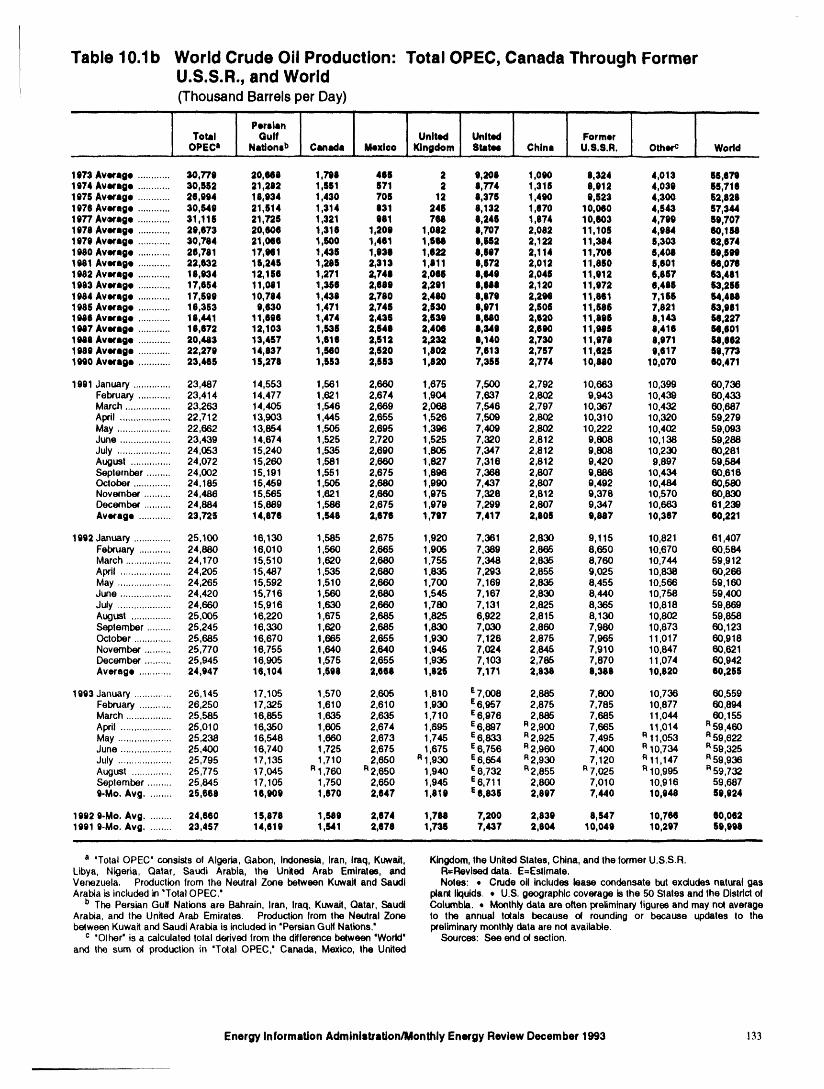
Table 10.1b World Crude Oil Production: Total OPEC, Canada Through FormerU.S.S.R., and World(ThousandBarrelsperDay)
Total Gulf United United FormerOPEC= Nationsb Canada Mexi©o Kingdom State4 China U.S.S.R. Otherc Wodd
,., , , ,, , ,,,
1973 Average ............ 30,779 20,668 1,799 466 2 9,206 1,090 8,324 4,013 68,8791974 Average ............ 30,952 21,262 1,651 671 2 6,774 1,315 6,912 4,039 65,7181975 Average ............ 26,994 18,934 1,430 708 12 8,375 1,490 9,523 4,300 52,8291976 Average ............ 30,549 21,814 1,314 831 246 8,132 1,670 10,060 4,543 67,3441977 Average ............ 31,116 21,726 1,321 881 794 6,246 1,874 10,603 4,709 59,7071978 Average ............ 29,673 20,606 1,316 1,209 1,082 9,707 2,082 11,106 4,954 60,1681979 Average ............ 30,784 21,066 1,600 1,461 1,614 8,662 2,122 11 384 5,303 62,6741980 Avermge ............ 26,781 17 961 1,4,16 1,939 1,922 e,607 2,114 11 706 6,408 69,6991081 Average ............ 22,632 16246 1,296 2,313 1,611 8,872 2,012 11 060 6,601 68,0791982 Average ............ 18,934 12 166 1,271 2,748 2,066 6,649 2,046 11 912 6,867 63,4811983 Average ............ 17,654 11 081 1,366 2,689 2,291 0,689 2,120 11 872 6,486 63,2661984 Average ............ 17,699 10 784 1,438 2,780 2,460 8,870 2,294 11 661 7,166 54,4881985 Average ............ 16,363 9 630 1,471 2,746 2,630 0,971 2,806 11 688 7,821 63,9811988 Average ............ 18,441 11 896 1,474 2,436 2,639 8,940 2,620 11 096 8,143 66,2271947 Average ............ 16,672 12103 1,536 2,649 2,406 0,349 2,690 11 946 8,416 68,6011948 Average ............ 20,483 13.457 1,616 2,512 2,232 8,140 2,730 11 978 8,971 68,8621989 Average ............ 22,279 14 837 1 ,S60 2,620 1,602 7,613 2,757 11 626 9,617 69,7731990 Average ............ 23,485 16 276 1,653 2,663 1,620 7,366 2,774 10 680 10,070 60,471
1991 January .............. 23 487 14,553 1,561 2,660 1,675 7,500 2,792 10,663 10,399 60,736February ............ 23 414 14,477 1,621 2,674 1,904 7,637 2,802 9,943 10,439 60,433March ................. 23 263 14,405 1,546 2,669 2,068 7,546 2,797 10,367 10,432 60,687April ................... 22 712 13,903 1,445 2,655 1,526 7,509 2,802 10,310 10,320 59,279May .................... 22 662 13,654 1,505 2,695 1,396 7,409 2,802 10,222 10,402 59,093June ................... 23 439 14,674 1,525 2,720 1,525 7,320 2,812 9,808 10,138 59,288July .................... 24 053 15,240 1,535 2,690 1,805 7,347 2,812 9,808 10,230 60,281August ............... 24 072 15,260 1,581 2,660 1,827 7,316 2,812 9,420 9,897 59,584September ......... 24 002 15,191 1,551 2,675 1,896 7,368 2,807 9,886 10,434 60,616October .............. 24 185 15,459 1,505 2,680 1,990 7,437 2,807 9,492 10,484 60,580November .......... 24 486 15,565 1,621 2,660 1,975 7,326 2,812 9,378 10,570 60,830December .......... 24 884 15,889 1,566 2,675 1,979 7,299 2,807 9,347 10,663 61,239Average ............ 23 726 14,876 1,548 2,676 1,797 7,417 2,806 9,687 10,367 60,221
1992 January .............. 25,100 16,130 1,585 2,675 1 920 7,361 2,830 9,115 10,821 61,407February ............ 24,880 16,010 1,560 2,665 1 905 7,389 2,865 8,650 10,670 60,584March ................. 24,170 15,510 1,620 2,680 1 755 7,348 2,835 8,760 10,744 59,912April ................... 24,205 15,487 1,535 2,680 1 835 7,293 2,855 9,005 10,838 60,266May .................... 24,265 15,592 1,510 2,660 1 700 7,169 2,835 8,455 10,566 59,160June ................... 24,420 15,716 1,560 2,680 1 545 7,167 2,830 8,440 10,756 59,400July .................... 24,660 15,916 1,630 2,660 1 780 7,131 2,825 8,365 10,818 59,869August ............... 25,005 16,220 1,675 2,685 1 825 6,922 2,815 8,130 10,800 59,858September ......... 25,245 16,330 1,620 2,685 1 830 7,030 2,860 7,980 10,873 60,123October .............. 25,685 16,670 1,665 2,655 1 930 7,126 2,875 7,965 11,017 60,918November .......... 25,770 16,755 1,640 2,640 1,945 7,004 2,845 7,910 10,847 60,621December .......... 25,945 16,905 1,575 2,655 1,935 7,103 2,785 7,870 11,074 60,942Average ............ 24,947 16,104 1,598 2,868 1,826 7,171 2,838 8,388 10,820 60,285
1993 January.............. 26,145 17,105 1,570 2,605 1,810 s7,008 2,885 7,800 10,736 60,559February ............ 26,250 17,325 1,610 2,610 1,930 z6,957 2,875 7,785 10,877 60,894March ................. 25,585 16,855 1,635 2,635 1,710 E6,976 2,885 7,685 11,044 60,155April ................... 25,010 16,350 1,605 2,674 1,695 Z6,897 R2,900 7,665 11,014 R59,460May .................... 25,238 16,548 1,660 2,673 1,745 s 6,833 R2,925 7,495 R11,053 m59,622June ................... 25,400 16,740 1,725 2,675 1,675 E6,756 R2,960 7,400 R10,734 R59,325July .................... 25,795 17,135 1,710 2,650 R1,930 E6,654 92,930 7,120 R11,147 R59,936August ............... 25,775 17,045 R1,760 R2,650 1,940 E6,732 P_2,855 R7,025 _ 10,995 R59,732September ......... 25,845 17,105 1,750 2,650 1,945 66,711 2,860 7,010 10,916 59,6879-Mo. Avg ......... 25,668 16,909 1,870 2,847 1,819 E6,836 2,897 7,440 10,948 68,924
1992 9-Mo. Avg......... 24,660 15,878 1,589 2,674 1,788 7,200 2,839 8,547 10,766 60,0821991 9-Mo. Avg ......... 23,457 14,619 1,541 2,678 1,736 7,437 2,804 10,049 10,297 59,908
. i .lll l i i i i i i
a 'Total OPEC' consistsof Algeria, Gabon, Indonesia, Iran, Imq, Kuwait, Kingdom, the United Slates, China, and the formerU.S.S.R.Libya, Nigeria, Qatar, Saudi Arabia, the United Arab Emirates, and R=Revlsed data. E=Estlmale,Venezuela. Productionfrom the Neutral Zone between Kuwait and Saudi Notes: • Crude oil includes lease condensate but excludes natural gasArabia is includedin "TotalOPEC.' plant liquids. • U.S. geographiccoverage is Ihe 50 States and the Disldctof
b The Persian Gulf Nations are Bahrain, Iran, Iraq, Kuwait, Qatar, Saudl Columbia. • Monthly data are often preliminary figures and may not averageArabia, and the United Arab Emirates. Production Irom the Neutral Zone to the annual totals because o( rounding or because updates to thebetween Kuwait and SaudiAral_a is included in "PersianGut( Nations.' preliminarymonthly data are no( available.
c "Olher" is a calculaled lotal derived from the difference between 'World' Sources: See end o( section.and the sum o( production in 'To(al OPEC," Canada, Mexico, the United
Energy Information Administration/Monthly Energy Review December 1993 133
Figure 10.1 Crude 011Production(MillionBarrelsperDay)
World Production, 1973-1992 World Production, Monthly
75 75
World
5O 50
OPEC25 ..... 25 ............... •........................
........
PersianGulfNations
PersianGulfNations
0 _'_'--T"'-"I-" i-- i I I'-'-"T_I ..... l l I 1 I 1 0 / I I I I 'l I I i I I I I I I I I I w I I I I ! I I I I I I I _ I I
1974 1976 1978 1980 1982 1984 1986 1988 1990 1992 FMAMJ J ASONDJFMAMJJASONDJFMAMJJASOND
1991 1992 1993
Leading Producers, 1973-1992 Leading Producers, Monthly
14 i 14 q --I
Former U.S.S.R.12 12 -_
/- 10 _,,_ormerU.S.S.R.. ^
10
/ _ United States//\ / I . .............. , .
8 /\ \ /'1........ _ •'. / t 8 "_'_ // -- \ _ _ _"__ "'\ "" "" _ -
\1 X ...../ ___p
/ United States .....6 \ /\ / 6
Saudi Arabia\\I
,,, f -- /•,, I X I
\ I \1
4 \ / 4\/
v
2 2
0 0 "-T-'T"T3-'TT'T-_-T-r"I--T-T7TT'--F-T--T--T'-I--T--F-T-I"'i 1 I I i i v r-
1974 1976 1978 1980 1982 1984 1986 1988 1990 1992 J FMAMJ J ASONDJFMAMJ JASONDJ FMAMJ J ASOND1991 1992 1993
Note: OPEC is the Organization of PetroleumExportingCountries.Sources: Tables 10.1a and 10.1b.
134 Energy Information Administration/Monthly Energy Review December 1993
Figure 10.2 Crude Oil Production by Selected Country(Million Barrels per Day)
Canada il.751,62
China 2.862,86
.2
2,65Mexico=8
O 2.685tOtOU.Io. UnitedKingdom
z United States 6.7117.03
Former U.S.S,R. 7.017.98
Algeria 1.181.21
Indonesia 1.511.85
Iran
Iraq 0.50.45
Kuwait 2.02I1,,,,
c
O
tO Libya 1.37tO 1.475UJO.
O Nigeria 2.o452.025
Qatar _ 0,410.425
Saudi Arabia 8.278.45
United Arab 2.22Emirates 2.32 _j_!_i_i_!_i_ September 1993
_ _::_:__::__:_i_:_.__ 2.38 September 1992Venezuela 2,39
1 T r T
0 2 4 6 8 10 12 4
Note: OPEC is the Organization ol Petroleum Exporting Countries.Sources: Tables 10.1a and 10.1b.
Energy Information Administration/Monthly Energy Review December 1993 135
Figure 10.3 Petroleum Consumption in OECD Countries(Million Barrels per Day)
OECD Consumption, 1973-1992 OECD Consumption
45 45
__ 38,6 38,254
37,327
3O 30
" _ \ UnitedStates/ \
_ "_ ,._ ..s I _ ,_ ,.,_ _ _ .,_ _,., _ .._ "_ _ _ "_ _ _ "_ '15 15
'"".,... ....................... '.%..
"'"'%... ............................................................. *"" .......
OECD Europe
I r r r _ I I r r r x I I f I r l f O
1974 1976 1978 1980 1982 1984 1986 1988 1990 1992 July July July1991 1992 1993
Consumptionby Selected OECD Country
Canada 1.68311.642 t.i:_:_:_:_:_:_:_:_:i:!:i:_:_:_:_:_:_:_:_:_'._:i;:,_July 1993
France 1.854 July 19921,929
Germany 2,_5"3.029
Italv 1,81 51.9
Japan 4.8335. 24
_:inn,_om 1,795United1.804
United States 17,20817.,143
I I
0 2 4 6 8 10 12 14 16 18 20 22
Note:OECDIs theOrganizationfor EconomicCooperationandDevelopmenl.Source:Table10.2.
]36 Energy Information Admlai.tralion/Moalhly Energy Rwlew December 11)93
Table 10.2 Petroleum Consumption in OECD Countries(ThousandBarrelsper Day)
........ 1 ! 1l I I I !, uo"-oo'--°oCanada France Germany" Italy J pan Kingdom States Europeb OECDc OECD
1973 Average .................. 1,729 2,601 3,058 2,086 4,949 2,341 17,306 14,826 988 39,9001974 Average .................. 1,779 2,447 2,748 2,004 4,864 2,210 16,653 13,988 1,096 38,3791975 Average .................. 1,779 2,252 2,650 1,855 4,821 1,911 16,322 13,217 1,041 36,9801976 Average .................. 1,818 2,420 2,877 1,971 4,837 1,892 17,481 14,124 1,119 39,3581977 Average .................. 1,850 2,294 2,865 1,897 4,880 1,986 18,431 13,818 1,160 40,2371978 Average .................. 1,902 2,408 2,927 1,952 4,946 1,938 18,847 14,290 1,204 41,1871979 Average .................. 1,971 2,463 3,003 2,039 5,050 1,971 16,513 14,667 1,178 41,3791980 Average .................. 1,873 2,256 2,707 1,934 4,960 1,728 17,056 13,634 1,072 38,5951981 Average .................. 1,768 2,023 2,449 1,874 4,948 1,590 16,058 12,516 1,080 36,2691982 Average .................. 1,578 1,880 2,372 1,781 4,582 1,S90 15,296 12,053 1,006 34,5171983 Average .................. 1,448 1,835 2,324 1,750 4,395 1,S31 15,231 11,765 954 33,7931984 Average .................. 1,472 1,764 2,322 1,646 4,576 1,648 15,726 11,736 989 34,6001985 Average .................. 1,504 1,775 2,338 1,717 4,384 1,634 15,728 11,681 976 34,2711988 Averago .................. 1,506 1,772 2,408 1,738 4,439 1,649 16,281 12,102 861 35,2791987 Average .................. 1,548 1,789 2,424 1,665 4,484 1,503 16,665 12,258 958 35,9111988 Average .................. 1,683 1,797 2,422 1,636 4,752 1,697 17,263 12,427 939 37,0931989 Average .................. 1,733 1,857 2,280 1,930 4,983 1,738 17,328 12,531 998 37,5701990 Average .................. 1,690 1,818 2,382 1,872 5,140 1,752 16,988 12,629 1,027 37,478
1991 January .................... 1 599 2,294 2,998 2,185 5,852 1,819 16,893 14,564 1,063 39,971February .................. 1 613 2,009 2,783 2,025 6,155 1,837 16,339 13,804 1,039 R38,949March ....................... 1 484 1,759 2,858 1,660 5,789 1,725 16,212 12,609 1,091 37,185April ......................... 1 595 1,808 2,953 1,813 5,025 1,793 16,139 13,073 1,082 36,914May .......................... 1 637 1,773 2,912 1,722 4,880 1,799 16,189 12,965 1,104 36,775June ......................... 1 589 1,807 3,269 1,535 4,765 1,769 16,878 13,184 947 37,363July .......................... 1 707 1,989 2,272 1,665 5,000 1,853 16,971 12,648 1,001 37,327August ..................... 1 693 1,795 2,609 1,546 4,888 1,812 17,183 12,727 989 37,480September ............... 1 583 1,824 2,679 1,824 4,724 1,753 16,848 12,999 1,024 37,178October .................... 1 693 2,075 2,919 2,126 4,848 1,864 16,996 14,178 1,113 38,827November ................ 1 602 1,953 2,860 2,031 5,581 1,829 16,730 13,736 1,128 38,777December ................ 1 662 2,132 2,829 2,231 5,952 1,765 17,145 14,228 1,043 40,029Average .................. 1 622 1,935 2,826 1,863 5,284 1,801 16,714 13,391 1,052 38,063
1992 January .................... 1,627 2,213 2,968 2,237 5,776 1,832 17,012 14,459 1,014 39,888February .................. 1,623 2,108 2,814 2,149 6,347 1,819 16,893 14,052 1,045 39,959March ....................... 1,595 1,939 2,809 1,886 5,873 1,818 16,825 13,682 t,054 R39,029April ......................... 1,581 1,993 2,893 1,891 5,212 1,858 16,764 13,667 1,042 38,267May .......................... 1,589 1,632 2,588 1,671 4,845 1,694 16,485 12,347 1,002 36,269June ......................... 1,647 1,817 2,699 1,801 4,949 1,725 16,978 13,036 1,086 37,696July .......................... 1,642 1,929 3,029 1,900 5,124 1,804 17,143 13,662 1,027 R38,600August ..................... 1,676 1,735 2,829 1,655 4,964 1,699 16,929 12,909 946 R37,423Seplember ............... 1,655 1,956 3,072 2,003 5,147 1,870 16,876 14,224 1,046 38,947October .................... 1,705 1,942 2,752 1,930 5,310 1,825 17,448 13,475 1,014 38,953November ................ 1,714 1,890 2,823 2,053 5,644 1,852 17,091 13,806 1,049 39,304December ................ 1,670 2,000 2,841 2,076 6,285 1,839 17,928 13,991 1,103 40,977Average .................. 1,644 1,929 2,843 1,936 5,454 1,$03 17,033 13,606 1,036 38,772
1993 January .................... 1,591 1,950 2,521 1,859 5,937 1,721 16,320 12,823 R944 37,614February .................. 1,728 2,138 R2,931 2,106 6,286 1,872 17,397 14,214 1,104 40,729March ....................... 1,696 2,010 R2,954 2,005 6,238 1,881 17,688 R14,036 R1,144 R40,803April ......................... r_1,614 R1,930 2,814 R1,805 R5,458 1,726 16,673 R13,341 1,099 R38,185May .......................... R1,622 R1,695 2,584 R1,701 94,766 1,671 16,340 R12,208 1,110 936,047June ......................... R1,713 R1,970 3,037 R1,856 R4,960 1,802 17,032 R13,775 R1,091 r_38,570July .......................... 1,683 1,854 2,950 1,815 4,833 1,795 17,208 13,502 1,028 38,2547-Mo. Average ........ 1,663 1,932 2,625 1,675 5,488 1,780 16,946 13,401 1,074 38,572
1992 7-Mo. Average ........ 1,615 1,946 2,829 1,932 5,442 1,793 16,871 13,555 1,038 38,5211991 7-Mo. Average ........ 1,603 1,920 2,862 1,798 5,345 1,799 16,520 13,256 1,047 37,773,i i i i i ii llql
a Through December 1990, the data forGermany are for the former West Notes: • The Organization for EconomicCooperation and DevelopmentGermany only. Beginni,g with January 1991, the data for Germany are for (OECD) consistsot Canada, Japan, and the United States, as well as "OECDthe unifiedGermany, i.e., the formerEast Germany and West Germany. Europe" and 'Other OECD." • U.S. geographic coverage is the 50 States
I:)'OECD Europe' consistsof Austria,Belgium, Denmark, Finland, France, and the Districtof Columbia. • Totals may not equal sum of componentsGermany, Greece, Iceland, Ireland, Italy, Luxembourg, the Netherlands, due to independent rounding. • Data through 1990 are final. SubsequentNorway, Portugal, Spain, Sweden, Switzerland, Turkey, and the United data are preliminary.Kingdom. Sources: q, United States: Table 3.1a. -- All Other Data:
c "Other OECD" consists of Australia, New Zealand, and the U.S. 1973.1976---International Energy Agency (IEA), Annual Oil andGasStatisticsTerritories. of OECD Countries. 1960 forwerd--iEA, quarterly and monthly computer
R=Revised data. tapes supportingQuarterly Oil Statistics and Energy Balances.
Energy Information Administration/Monthly Energy Review December 1993 137
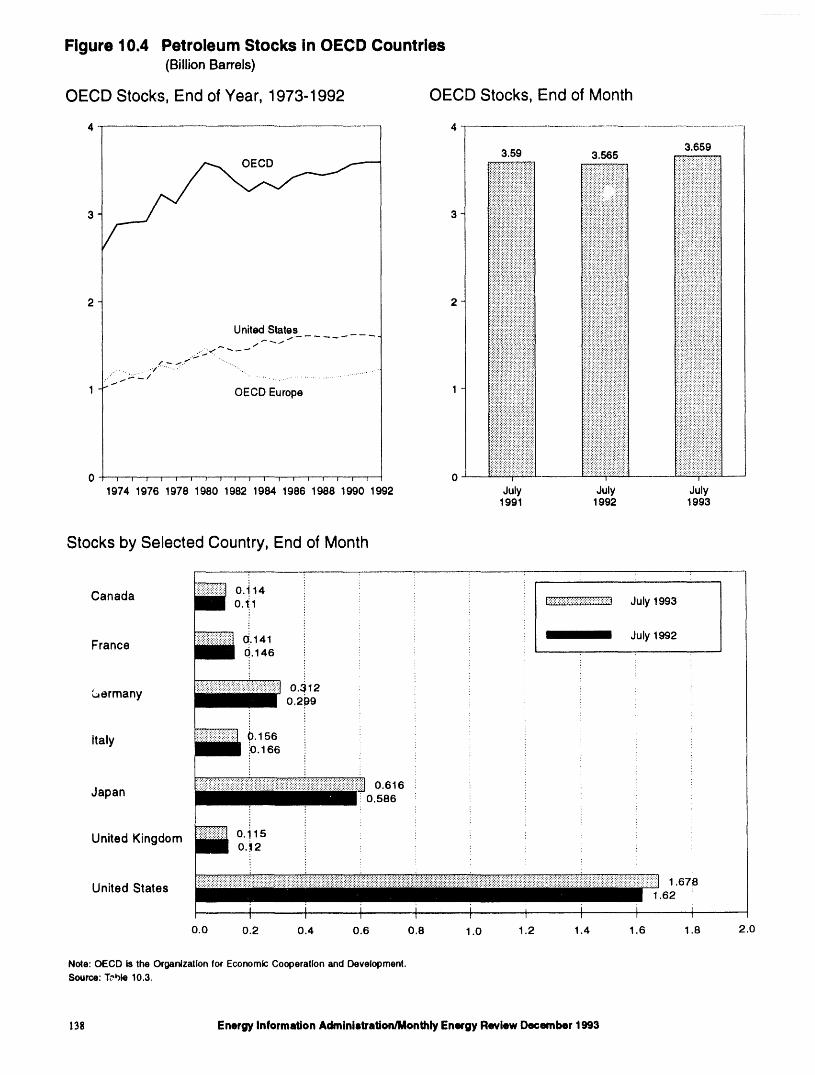
Figure 10.4 Petroleum Stocks in OECD Countries(Billion Barrels)
OECD Stocks, End of Year, 1973-1992 OECD Stocks, End of Month
4 4
3.6593.59 3.565
iiii!!!iiiiiiil !i!I2 2 i!:_i::i::!ii::i':iii_!!i::iiiii':iii!;iil_,
--- i"iiiiiiiiii!!ili!i',i..S_"<-" - " !iii:,ii!i::!ii::::!ii::i::i!ii!::ili::il
iiiiiiii!iiiiii!iii)i!!!ii!)iiii!iilOECD Europe 1 i::iii::i::i!i::i::i::i::!!!iiiiii::iii!iii ii ................................;::'':':':':':':':':';':';':':';':':':! ;: ::::::::::::::::::::::::::::::::::::
iiiiiiii?!ii?!?iiiii!!iii!iiii!ili!l
',i_,_,_',_',
i::i_::::i::ii_i_i_::_::i_:,i_::_::_i:::_i[i !iiiiiiiiii!ii!ii!i::iiiiiiii!i;iiills::_::s::ii_::_i!::!::!iiiii_ii]i::i::ii:.il i':!iii:.::i!!::_i_iiiii_:/:i!i:::.iSii]:.l0 _ _ _ , , , , , , _ , _ , , , , , , 0 ........i........'-_ '...............i_...............
1974 1976 1978 1980 1982 1984 1986 1988 1990 1992 July July July1991 1992 1993
Stocks by Selected Country, End of Month
i i '
Canada o.'1140. 't I I:_'.!....................................:::!_::.'.:1July 1993
O.141 July 1992France o. 146
L,ermany 0.3120.2gg
Italy 0.1560.166
0.616Japan 0.566
1.678United States 1.62
i t!
O.0 0.2 0.4 0.6 0.8 1.0 1.2 1.4 1.6 1.8 2.0
Note: OECD Is the Organization for EconomicCooperation and Development.Source:Tc,bte 10.3,
138 Energy Information Administration/Monthly Energy Review December 1993
Table 10.3 Petroleum Stocks in OECD Countries, End of Period(Million Barrels)
..... 1 11 t] 1 I I 1 °'h"Canada France Germany a Italy Japan Kingdom States Europeb OECDc OECD
1973 Year ......................... 140 201 181 152 303 156 1,008 1,070 67 2,5881974 Year ......................... 145 249 213 167 370 191 1,074 1,227 64 2,8801975 Year ......................... 174 225 187 143 375 165 1,133 1,154 57 2,9031976 Year ......................... 153 234 208 143 380 165 1,112 1,205 68 2,9181977 Year ......................... 167 239 225 161 409 148 1,312 1,268 68 3,2241978 Year ......................... 144 201 238 154 413 157 1,278 1,219 68 3,1221979 Year ......................... 150 228 272 163 460 169 1,341 1,353 75 3,3791980 Year ......................... 164 243 319 170 495 168 1,392 1,464 72 3,5871981 Year ......................... 161 214 297 167 482 143 1,484 1,337 67 3 5311982 Year ......................... 136 193 272 179 484 125 1,430 1,258 68 3 3781983 Year ......................... 121 153 249 149 470 116 1,454 1,142 68 3 2551984 Year ......................... 128 152 239 159 479 112 1,556 1,130 69 3 3621985 Year ......................... 113 139 233 157 494 123 1,519 1,092 66 3 2641998 Year ......................... 111 127 252 155 509 124 1,593 1,133 72 3 4181987 Year ......................... 126 127 259 169 540 121 1,607 1,130 72 3 4741988 Year ......................... 116 140 266 155 538 112 1,597 1,118 71 3 4401989 Year ......................... 114 138 271 164 577 116 1,581 1,133 71 3 4761990 Year ......................... 121 140 265 172 590 112 1,621 1,163 73 3 568
1991 January .................... 116 133 278 174 591 116 1,587 1,164 73 3,531February .................. 114 137 278 169 572 119 1,573 1,162 72 3,493March ....................... 117 142 280 178 593 124 1,558 1,178 75 3,521April ......................... 110 138 277 177 585 119 1,578 1,161 75 3,509May .......................... 107 138 279 174 586 113 1,626 1,157 75 3,551June ......................... 107 144 274 173 590 118 1,634 1,161 72 3,564July .......................... 118 145 285 169 594 113 1,635 1,170 73 3,590August ..................... 116 152 284 171 610 118 1,648 1,186 76 3,636September .............. 117 150 287 170 622 120 1,663 1,195 74 3,671October .................... 118 148 286 165 625 119 1,644 1,190 71 3,649November ................ 122 152 289 163 607 120 1,647 1,198 70 3,643December ................ 119 153 288 160 607 119 1,617 1,182 65 3,589
1992 January .................... 117 149 293 167 601 116 1,610 1,168 68 3,564February .................. 111 145 303 172 596 118 1,588 1,181 66 3,542March ....................... 111 142 303 169 586 115 1,571 1,162 66 3,495April ......................... 111 140 307 165 578 115 1,583 1,172 62 3,505May .......................... 108 147 311 171 588 115 1,602 1,189 63 R3,551June ......................... 112 148 307 166 583 114 1,603 1,190 69 3,557July .......................... 110 146 299 166 586 120 1,620 1,182 67 3,565August ..................... 113 150 303 169 604 117 1,621 1,211 69 R3,617September ............... 110 148 299 165 608 112 1,636 1,194 69 R3,616October .................... 108 148 302 166 613 113 1,640 1,201 69 3,631November ................ 110 149 306 172 611 116 1,636 1,207 71 3,6,34December ................ 107 146 310 174 603 113 1,592 1,219 67 3,589
1983 January .................... 110 148 319 171 614 120 1,611 1,231 68 R3,635February .................. 106 142 317 163 606 120 1,595 1,213 68 3,588March ....................... 107 138 311 156 593 120 1,584 1,192 66 R3,541April ......................... 110 139 311 158 584 116 1,611 R1,187 73 93,565May .......................... R106 145 320 164 592 117 1,643 1,201 R69 R3,611June ......................... 108 139 310 164 601 119 1,660 R1,185 69 R3,623July .......................... 114 141 312 156 616 115 1,678 1,180 70 3,659
a Through December 1990, the data for Germany are for the former West exclude oil hel_ i,_ pipelines (excep( for those in the United States), rail andGermany only. Beginning with January 1991, the data for Germany are for truck cars, sea-going ships' bunkers, service stations, retail stores, andthe unifiedGermany, i.e., the formerEast Germanyand West Germany. tankers at sea. ,, The Organization lor Economic Cooperation and
b 'OECD Europe' consistsof Austria,Belgium, Denmark, Finland, France, Deveiopmenl (OECD) consisls ol Canada, Japan, and the United States, asGermany, Greece, Iceland, Ireland, Italy, Luxembourg, the Netherlands, well as "OECD Europe"and "Other OECD." ,, U.S. geographiccoverage isNorway, Portugal, Spain, Sweden, Switzerland, Turkey, and the United the 50 States and the Districtol Columbia. ,J Totals may not equal sum ofKingdom. componentsdue to independent rounding. ,, In the UnitedStates in January
c 'Other OECD" consists ol Australia, New Zealand, and the U.S. 1975, 1981, and 1983, numerous respondents were added to bulk terminalTerritories. and pipeline surveys, thereby affecting subsequent stocks reported. New-
R=Revised data. basis end-of-year U.S. stocks, in million barrels, would have been 1,121 inNotes: • Petroleumstocksincludecrude oil (includingstrategicreserves), 1974, 1,425 in 1980, and 1,461 in 1982. • Dala through 1990 are final.
unfinished oils, natural gas plant liquids, and refined products. Petroleum Subsequentdata are preliminary.stocks include all nonmilitary pelroleum held for storage, regardless of Sources: • United States: Table3.1a. • All Other Data: Inlernalionalownership, within each counlry in bulk terminals, refinery tanks, pipeline Energy Agency, quarterly and monthly computer tapes supportingQuarterlytankage, inlercoastaltankers, tankers in port, and inland ship bunkers. Dala Oil Statistics and Energy Balances.
Energy Information Administration/Monthly Energy Review December 1993 139
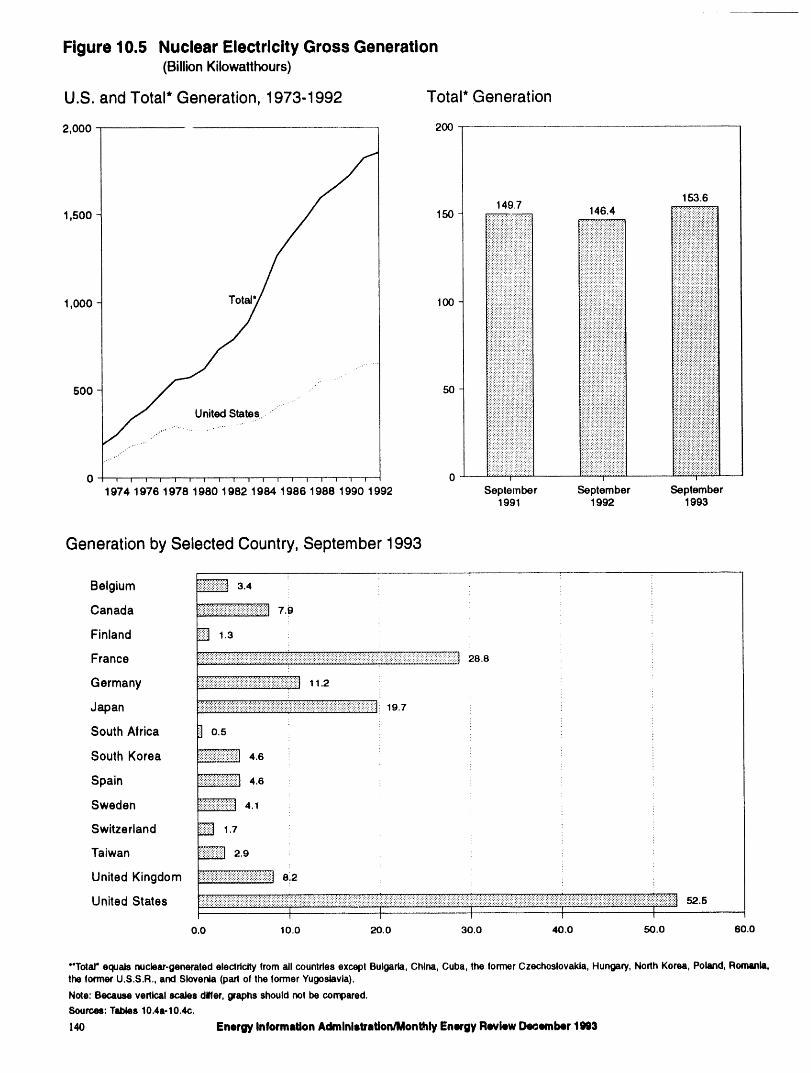
Figure 10.5 Nuclear Electricity Gross Generation(Billion Kilowatthours)
U.S. and Total*Generation,1973-1992 Total*Generation
2,000 200
Generation by Selected Country, September 1993
Belgium _ 3.4 _
Canada ._:_:_:_:_:_)7.t)
Finland _ 1.3 ! !
Germany i!.:i:_i:_i::iii:_:/:i::iiiii_iii:_:::i::_::i:_:_i_iii_i!!!_i_iii_:iiiiii!i_iiii_i!!ii_11.2
Japan _!_i_i_::_i_:_i:_:!_i_i_::_i_i_::_ii_ii_i_::i_iiiii_iiii:_ii_ii_!:/:!iii#::_::::_::_!!::::::_:_!!i::i:_i_::_ii::!ii_::ii::i:_ii::i::i::!i::ii::_119.7
South Africa 0.5
South Korea _ 4.6
Spain _ 4.6
Sweden _ 4.1
Switzerland _ 1.7
Taiwan _ 2.9
United Kingdom ::::::::::::::::::::::::::::::::::::::::::::::::::::::::::::::::::::::::::::::::::::8.2 i
...........,.....,.......,...,....................................:.._`.._._._._`_`_._._`._.._._._`_`_._.`_`_._:_:_:._:_:_'_._.._``_`_`_`_`._`._`_`_`_._`_._._`_._`_`_._'_``_``_`_._t_:_.._:._
United States :_:;:;;;;3;_;_::_;_;;_;_:;_;;_;_;_;;_;:_:_;:;:;:;:;:_:::_:;:;_;;_;_;_;;_;_;_;_:;:_;;;_::_:_:_:_::_;_;:_;;_;_;:;_:_;_;;:_;_;_:;_;;_;;;_;_:;_;_;;;;_::;::_3_;_:_:_:_;_;:;::_;_:_;:_:_::;_;_::_::_;;:::_:;:.;_:_;_;:;::;_:_::_:;::;:_:_;::_::_:::_::_;:_:._::;:::_:_::;_;::_:_52.5t t I I I
0.0 10.0 20.0 30.0 40.0 50.0 60.0
*'Total" equals nuclear-generated electricity from all countriesexcept Bulgaria, China, Cuba, the formerCzechoslovakia, Hungary, North Korea, Poland,Romania,the former U.S.S.R., and Slovenia (part of the loaner Yugoslavia).
Note: Because vertical scales differ,graphs should not be compared.Sources:Tables 10.4a-10.4c.
140 EnergyInformationAdminlstrmtionlMonthlyEnergyReviewD_mber lm)3
Table 10.4a Nuclear Electricity Gross Generation: Argentina Through India(Billion Kilowa_hours)
!,r.-,.°. '""i °'°'"i I i '°'"1973 Total .............................. 0.0 0.0 0.0 15.3 0.0 14.7 11.9 2.51974 Total .............................. 1.0 .1 ,0 15.4 .0 14.7 12.0 1.91975 Total .............................. 2.6 6.8 .0 13.2 .0 18.3 21.7 2.51976 Total .............................. 2.6 10.0 .0 18.0 .0 15.8 24.5 3.21977 Total .............................. 1.6 11.9 .0 26.6 2.7 17.9 36.0 2.81978 Total .............................. 2.9 12.5 .0 33.0 3.3 30.6 35.7 2.31979 Total .............................. 2.7 11.4 .0 38.4 6.7 39.9 42.2 3.21980 Total .............................. 2.3 12.5 .0 40.4 7.0 61.2 43.7 2.61961 Total .............................. 2.8 12.6 .0 43.3 14.5 105.2 53.4 3.11982 Total .............................. 1.9 15.6 .1 42.6 16.5 106.9 63.4 2.21983 Total ............................. 3.4 24.1 .2 53.0 17.4 144.2 65.8 2.61984 Total .............................. 4.5 27.7 2.1 63.8 16.5 191.2 92.6 4.11985 Total .............................. 5.6 34.5 3.4 62.9 18.8 224.0 125. $ 4.51986 Total .............................. 5.7 38.6 .1 74.6 18.8 254.3 118.9 8.11987 Total .............................. 5.2 41.9 1.0 80.6 19.4 265.5 130.2 5.51988 Total .............................. 5.1 43.1 .3 85.6 19.3 ,74.9 145.2 6.11989 Total .............................. 5,0 41.2 1.6 83.2 18.8 302,5 149.6 4.01990 Total .............................. 7.4 42.7 2.0 75.8 18.9 314.1 147.2 6.3
1991 January ........................... 5 4.2 .2 7.6 1.8 33.5 15.2 .5February ......................... 6 3.9 .2 7.3 1.6 30.0 13.6 .4March .............................. 6 4.2 .2 7.8 1.8 26.4 14.3 .6April ................................ 7 3.5 .2 6.7 1.4 25.3 12.5 .4May ................................. 7 3.4 .2 7.2 1.5 25.3 10.6 .4June ................................ 7 2.9 .2 7.1 1.6 23.6 10.0 .4July ................................. 7 3.5 .2 7.7 1.7 23.9 11.7 .3August ............................ 7 3.8 .0 8.6 1.4 24.5 10.0 .4September" ...................... 5 3.0 .0 6.7 1.3 25.8 10.8 .4October ........................... 7 3.2 .0 6.6 1.7 28.4 11.7 .5November ....................... 7 3.3 .0 6.3 1.7 29.8 12.9 .6December ....................... 5 4.0 .0 6.5 1.7 32.8 14.2 .5Total .............................. 7.7 42.9 1.4 86.1 19.2 331.4 147.3 5.4
1992 January ........................... 6 4.3 .0 6.9 1.8 33.5 15.6 .5February ......................... 7 4.0 .0 6.4 1.7 29.8 15.2 .5March .............................. 6 4.0 .0 7.4 1.8 30.7 15.8 .5April ................................ 6 3.4 .0 6.4 1.7 28.0 14.1 .4May ................................. 5 3.8 .0 4.8 1.3 25.6 11.8 .4June ................................ 6 3.6 .1 5.6 1.4 22.4 11.8 .3July ................................. 7 3.1 .3 7.2 1.6 23.7 12.0 .4August ............................ 7 3.4 .4 6.9 1.4 24.6 10.9 .5September ...................... 7 3.1 .3 6.9 1.3 25.6 11.6 .5October ........................... 3 3.6 .1 7.2 1.6 28.5 13.2 .6November ....................... 4 3.3 .3 7.4 1.7 29.5 13.0 .7December ...................... E.6 3.9 .1 8.0 1.8 33.1 13.R .8Total .............................. E7.1 43.5 1.5 66.4 19.0 337.5 156.8 6.6
1993 January ........................... 6 4.3 .2 8.2 1.8 36.3 15.1 .7February ......................... 4 3.7 .2 7.4 1.6 32.7 13.9 .6March .............................. 6 3.4 (s) 7.8 1.8 34.3 14.2 .6April ................................ 7 3.3 .0 7.3 1.7 30.5 12.4 .2May ................................. 7 3.1 .0 6.7 1.3 26.9 11.8 .4June ............................... E.7 3.0 .0 7.1 1.6 25.4 12.0 .5July ................................. 7 3.2 .0 9.3 1.8 26.9 12.3 .7August ............................ 7 3.4 .0 9.1 1.5 25.9 11.1 .5September ...................... 7 3.4 .0 7.9 1.3 28.8 11.2 .49-Month Total ............... E6.0 30.8 .4 70.8 14.4 267.7 114.0 4.6
1992 g-Month Total ............... 5.7 32.7 1.2 58.6 13.9 243.9 118.8 4.21991 g-Month Total ............... 5.6 32.4 1.4 66.7 14.2 240.3 108.5 3.9
a Through December 1990, the data for Germany are 1orthe tormer West themselves. • U.S. geographiccoverage is the 50 States and the DistdclolGermany only. Beginningwith January 1991, the data for Germany are tor Columbia. • Monthly data may not sum to annual tolalsdue to independentthe unifiedGermany, i.e., the lormer East Germanyand West Germany. roundingand because precommercialgeneration is includedin some annual
E=Estimate. totalsbut not inthe monthlydata.Notes: • Net figures are generally less than gross figures by about 5 Source: McGraw-Hill Publishing Company, Nucleonics Week.
percent, the difference being the energy consumed by the generaling plants
Energy Information Administration/Monthly Energy Review December 1993 14!
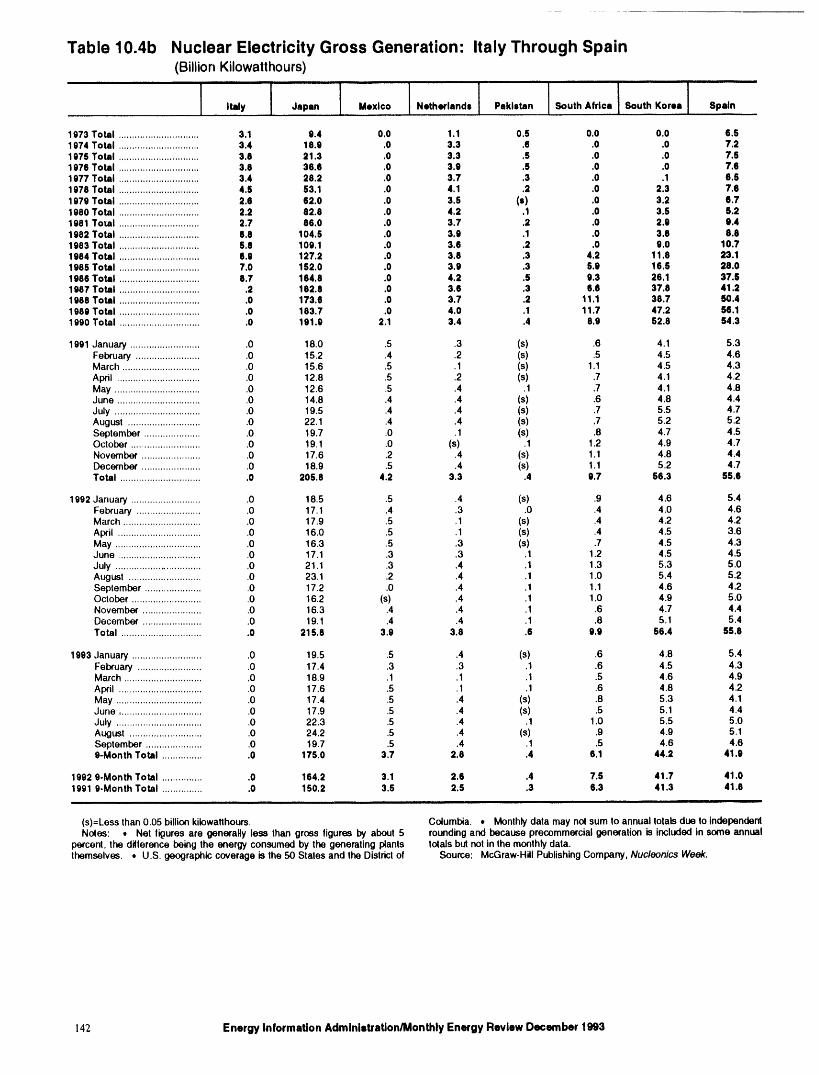
Table 10.4b Nuclear Electricity Gross Generation: Italy Through Spain(Billion Kilowatthours)
1973 Total .............................. 3.1 9.4 0.0 1.1 0,5 0.0 0.0 6.51974 Total .............................. 3.4 18.8 .0 3.3 .6 .0 .0 7.21975 Total .............................. 3.8 21.3 .0 3.3 .5 .0 .0 7.51976 Total .............................. 3,8 36.6 ,0 3.9 .5 .0 .0 7.61977 Total .............................. 3.4 28.2 .0 3.7 ,3 .0 .1 6.51978 Total .............................. 4.5 53.1 .0 4.1 .2 .0 2.3 7.61079 Total .............................. 2.8 62.0 .0 3.5 (s) .0 3.2 8.71980 Total .............................. 2.2 82.8 .0 4.2 .1 ,0 3.5 5.21981 ToNI .............................. 2.7 86.0 .0 3.7 .2 .0 2.8 9.41982 Total .............................. 8.8 104.8 ,0 3.9 .1 .0 3,8 8.81983 Total .............................. 5.8 10g.1 .0 3.8 .2 .0 g.0 10.71584 Total .............................. 8.9 127.2 .0 3.8 .3 4.2 11.8 23.11985 Total .............................. 7.0 152.0 .0 3.9 .3 5.9 16.5 28.01088 Total .............................. 8.7 184,8 .0 4.2 ,§ 9.3 26,1 37.51987 Total ............................... 2 182.8 .0 3.6 .3 8.6 37.8 41.21988 Total ............................... 0 173,6 .0 3,7 .2 11.1 38.7 50.41980 Total ............................... 0 183.7 .0 4.0 .1 11.7 47.2 56.11980 Total ............................... 0 191.0 2.1 3.4 .4 8.9 52.8 54.3
1091 January ........................... 0 18.0 .5 .3 (s) .6 4.1 5,3February ......................... 0 15.2 .4 .2 (s) .5 4.5 4.6March .............................. 0 15.6 .5 .1 (s) 1.1 4.5 4.3April ................................ 0 12.8 .5 .2 (s) .7 4.1 4.2May ................................. 0 12.6 .5 .4 .1 .7 4.1 4.8June ................................ 0 14.6 .4 .4 (s) .6 4.8 4.4July ................................. 0 19.5 .4 .4 (s) .7 5.5 4.7August ............................ 0 22.1 .4 .4 (s) .7 5.2 5.2September ...................... 0 19.7 .0 .1 (s) .8 4,7 4.5October ........................... 0 19.1 .0 (s) .1 1.2 4.9 4.7November ....................... 0 17.6 ,2 .4 (s) 1.1 4.8 4.4December ....................... 0 18.9 .5 .4 (s) 1.1 5.2 4.7Total ............................... 0 205.8 4.2 3.3 .4 9.7 56.3 55.6
1992 January ........................... 0 18.5 .5 .4 (s) .9 4.6 5.4February ......................... 0 17.1 .4 .3 .0 .4 4.0 4.6March .............................. 0 17.9 .5 .1 (s) .4 4.2 4.2April ................................ 0 16.0 .5 .1 (s) .4 4.5 3.6May ................................. 0 16.3 .5 .3 (s) .7 4.5 4.3June ................................ 0 17.1 .3 .3 .1 1,2 4.5 4.5July ................................. 0 21.1 .3 .4 .1 1.3 5.3 5.0August ............................ 0 23.1 .2 .4 .1 1.0 5.4 5,2Seplember ...................... 0 17.2 .0 .4 .1 1.1 4.6 4.2October ........................... 0 16.2 (s) .4 .1 1.0 4,9 5.0November ....................... 0 16.3 .4 .4 .1 .6 4.7 4.4December ....................... 0 19.1 .4 .4 .1 .8 5.1 5.4Total ............................... 0 215.8 3.9 3.8 .6 9.9 56.4 55.8
1993 January ........................... 0 19.5 .5 .4 (s) .6 4.8 5.4February ......................... 0 17.4 .3 .3 .1 .6 4.5 4.3March .............................. 0 18.9 .1 .1 .1 .5 4.6 4.9April ................................ 0 17.6 .5 .1 .1 .6 4.8 4.2May ................................. 0 17.4 .5 .4 (s) .8 5.3 4.1June ................................ 0 17.9 .5 .4 (s) .5 5.1 4.4July ................................. 0 22.3 .5 .4 .1 1,0 5.5 5.0August ............................ 0 24.2 .5 .4 (s) .9 4.9 5.1September ...................... 0 19.7 .5 .4 .1 .5 4.6 4.69-Month Total ................ 0 175.0 3.7 2.8 .4 6.1 44.2 41.9
1992 0-Month Total ................ 0 164.2 3.1 2.8 .4 7.5 41.7 41.01991 9-Month Total ................ 0 150.2 3.5 2.5 .3 6.3 41.3 41.8
llll ii
(s)=Less than 0.05 billionkilowalthours. Columbia. • Monthly data may no( sum to annual totals due to independentNoles: • Net figures are generally less than gross figures by about 5 roundingand because precommercialgeneration is included in some annual
percent, the difference being the energy consumed by the generating plants totals but not inthe monthlydata.themselves. • U.S. geographic coverage is the 50 Stales and the District of Source: McGraw-Hill PublishingCompany, Nucleonics Week.
142 Energy Information Administration/Monthly Energy Review December 1993
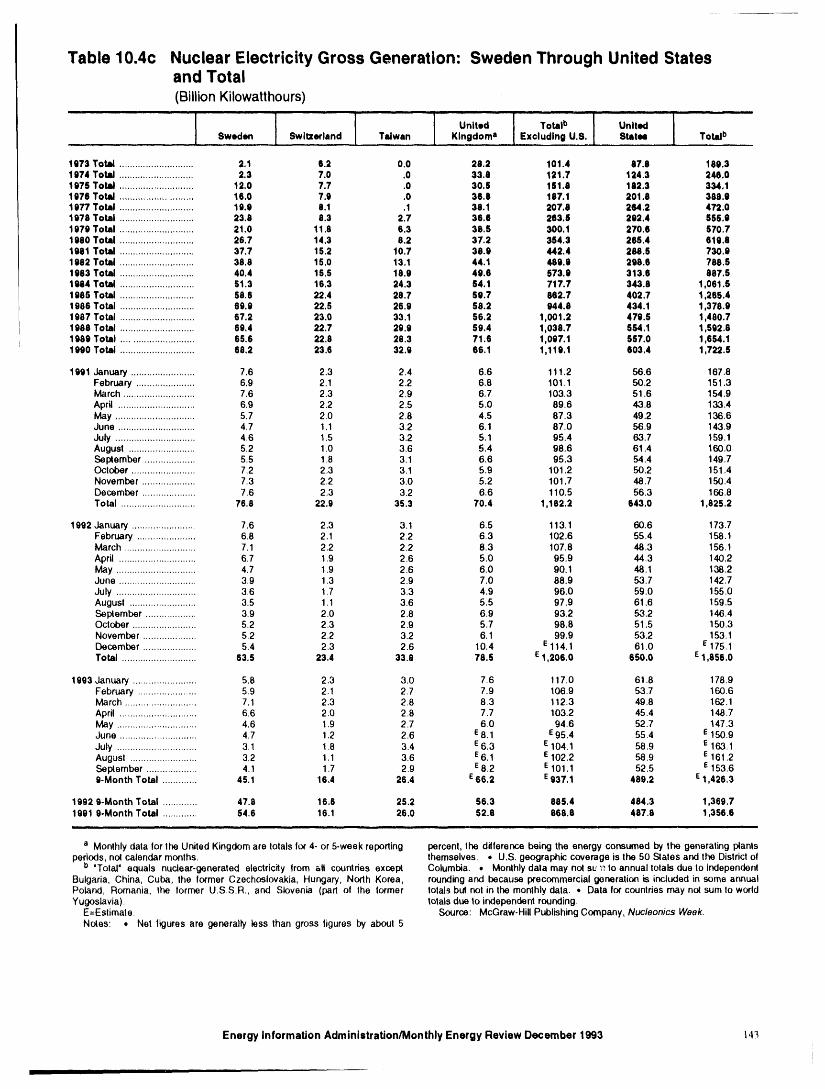
Table 10.4c Nuclear Electricity Gross Generation: Sweden Through United Statesand Total(Billion Kilowatthours)
ii i ,i i ,i H, i ll, i i i j, lll
L 1 I I oo..,! ! uo..ISweden Switzerland Taiwan Kingdoma Excluding U.S. Statee Totalb
1973 Total ............................ 2.1 6.2 0.0 28.2 101.4 87.8 189.31974 Total ............................ 2.3 7.0 .0 33.6 121.7 124.3 248.01975 Total ............................ 12.0 7.7 .0 30.6 151.8 182.3 334,i1976 Total ........................... 16.0 7.9 .0 36.8 187.1 201.8 388.91877 Total ............................ 18.0 8.1 .1 38.1 207.8 264.2 472.01976 Total ............................ 23.8 8.3 2.7 36.6 263.6 292.4 555.91970 Total ............................ 21.0 11.6 6.3 38.5 300,1 270.6 570.71980 Total ............................ 26.7 14.3 8.2 37.2 354.3 265.4 619.81981 Total ............................ 37.7 15.2 10.7 38.9 442.4 288.5 730.91982 Total ............................ 36.8 15,0 13.1 44.1 489.9 298.6 788.51993 Total ............................ 40.4 16.5 18.9 49.6 573.9 313,6 887.51984 Total ............................ 51.3 16.3 24.3 54.1 717.7 343.8 1,061.S1995 Total ............................ 56.6 22.4 28.7 59.7 862.7 402.7 1,255.41986 Total ............................ 59.9 22.5 26.9 58.2 944.8 434.1 1,378.91967 Total ............................ 67.2 23.0 33.1 55.2 1,001.2 479.5 1,460.71968 Total ............................ 68.4 22.7 29.9 59.4 1,038.7 654.1 1,592.81989 Total ........................... 65.6 22.8 28.3 71.6 1,097.1 557.0 1,654.11990 Total ............................ 68.2 23.6 32.9 66.1 1,119.1 603.4 1,722.5
1991 January ........................ 7.6 2.3 2.4 6.6 111.2 56.6 167.8February ...................... 8.9 2,1 2.2 6,8 101.1 50.2 151.3March ........................... 7.6 2.3 2.9 6.7 103.3 51.6 154.9April ............................. 6.9 2.2 2.5 5.0 89.6 43.8 133.4May .............................. 5.7 20 2.8 4.5 87.3 49,2 136.6June ............................. 4.7 1.1 3.2 6.1 87.0 56.9 143,9July .............................. 4.6 1,5 3.2 5.1 95.4 63.7 159.1August ......................... 5.2 1.0 3,6 5.4 98.6 61.4 160.0Seplember ................... 5.5 1.8 3.1 6.6 95.3 54.4 149.7October ........................ 7,2 2,3 3.1 5.9 101.2 50.2 151.4November .................... 7.3 2.2 3.0 5.2 101.7 48,7 150.4December .................... 7.6 2.3 3.2 6.6 110.5 56.3 166.8Total ............................ 76.8 22.9 35.3 70.4 1,182.2 643.0 1,825.2
1992 January ........................ 7.6 2,3 3.1 6.5 113.1 60.6 173.7February ...................... 6.8 2.1 2,2 6,3 102.6 55.4 158.1March ........................... 7.1 22 2.2 8.3 107.8 48.3 156.1Apdl ............................. 6.7 19 2,6 5.0 95.9 44.3 140.2May .............................. 4.7 1,9 2.6 6.0 90.1 48.1 1.38.2June ............................. 3,9 1.3 2.9 7.0 88.9 53.7 142.7July .............................. 3.6 1.7 3.3 4.9 96.0 59.0 155.0Augusl ......................... 3.5 1.1 3.6 5.5 97.9 61,6 159.5September ................... 3.9 2.0 2.8 6.9 93.2 53.2 146.4October ........................ 5.2 2,3 2,9 5.7 98.8 51.5 150.3November .................... 5.2 2.2 3.2 6.1 99.9 53,2 153.1December .................... 5.4 2.3 2.6 10.4 E114,1 61.0 E175.1Total ............................ 63.5 23.4 33.8 78.5 E1,206.0 650.0 E1,856.0
1993 January ........................ 5.8 2.3 3.0 7.6 117.0 61.8 i 789February ...................... 5,9 2.1 2.7 7,9 106,9 53.7 160.6March ........................... 7.1 2,3 2.8 8.3 112.3 498 162.1April ............................. 6.6 2.0 2.8 7.7 103.2 45.4 148.7May .............................. 4.6 1.9 2.7 6.0 94.6 52.7 147.3June ............................. 4.7 1.2 2.6 E8.1 E95.4 55.4 E 150,9July .............................. 3.1 1,8 3.4 E6.3 E104.1 58.9 E 163,1August ......................... 3.2 1.1 3.6 E6.1 E 102.2 58.9 E 161.2Se_ember ................... 4.1 1.7 2.9 E8.2 E 101.1 52.5 E 153.6g-Month Total ............. 45.1 16.4 26.4 E66.2 E937,1 489.2 E 1,426.3
1992 9-Month Total ............. 47.8 16.6 25.2 56.3 885.4 484.3 1,369.71891 9-Month Total ............. 54.6 16.1 26.0 52.8 668.8 487.8 1,356.5
a Monthly data for the United Kingdom are totals for 4- or 5-week reporting percent, the ditferencebeing the energy consumed by the generating plantsperiods,not calendar months, themselves. • U.S. geographiccoverage is the 50 Slates and the Districtof
I_ "Total' equals nuclear-generated electricity from _,11countries except Columbia. ,, Monthlydata may not st,,"t',to annualtotals due to independentBulgaria, China, Cuba, the former Czechoslovakia, Hungary, North Korea, roundingand because p_ecommercialgeneration is included in some annualPoland, Romania, the Iormer U.S.S.R., and Slovenia (part ol the Iormer totalsbut not in the monthly data. • Data for counlriesmay not sum Io worldYugoslavia). totalsdue to independentrounding.
E=Eslimate. Source: McGraw-HillPublishingCompany, Nucleonics Week.Notes: . Net ligures are generally less than gross figures by about 5
Energy Information Administration/Monthly Energy Review December 1993 i4_
i
IIIIIII I i

Sources for Tables 10.1a and 1992-.-Average of monthly data. Monthly Data=Petroleum Intelligence Weekly, the Oil and Gas Journal,
1 0.1 b and other i,dustry sources.
• United States: Table 3.1a. ° World: Annual Data: 1973-1979--EIA, Interna-tional Energy Annual 1981, "Fable 8. 1980mEIA,
° Other Countries: Annual Data: 1973-1979--Ener- International Energy Annual 1989, Table 1. 1981.--gy Information Administration (EIA), International EIA, International Energy Annual 1990, Table 1.Energy Annual 1981, Table 8. 1980---EIA, Internation- 1982-1991--EIA, International Energy Annual 1991,al Energy Annual 1989, Table 1. 1981--EIA, Table 1. 1992wAverage of monthly data. MonthlyInternational Energy Annual 1990, "Fable 1. 1982. DatamEIA, International Petroleum Statistics Report,1991--EIA, International Energy Annual 1991, "lable 1. sum of all countries' monthly data.
144 EnergyInformation Administration/MonthlyEnecgyReviewDecember1993
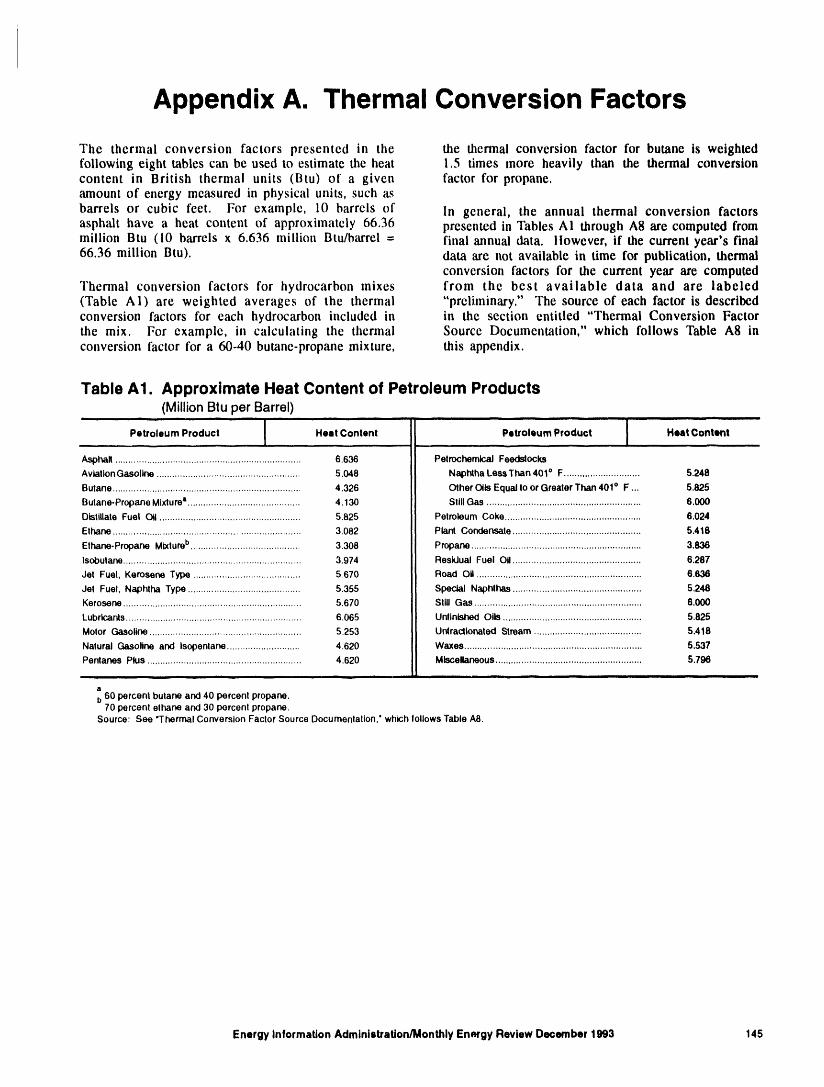
Appendix A. Thermal Conversion Factors
The thermal conversion factors presented in the the thermal conversion factor for butane is weightedfollowing eight tables can be used to estimate the heat 1.5 times more heavily than the thermal conversioncontent in British thermal units (Btu) of a given factor for propane.amount of energy measured in physical units, such as
barrels or cubic feet. For example, 10 barrels of In general, the annual thermal conversion factorsasphalt have a heat content of approximately 66.36 presented in Tables AI through A8 are computed frommillion Btu (10 barrels x 6.636 million Btu/barrel = final annual data. ltowever, if the current year's final66.36 million Btu). data are not available in time for publication, thermal
conversion factors for the current year are computedThermal conversion factors for hydrocarbon mixes from the best available data and are labeled(Table AI) are weighted averages of the thermal "preliminary." The source of each factor is describedconversion factors for each hydrocarbon included in in the section entitled "Thermal Conversion Factorthe mix. For example, in calculating the thermal Source Documentation," which follows Table A8 inconversion factor for a 60-40 butane-propane mixture, this appendix.
Table A1. Approximate Heat Content of Petroleum Products(Million Btu per Barrel)
,ill ,,= i,, ii ,H i ,H i i.H i i i i i i i |1 _ -I
Petroleum Product Heat Content Petroleum Product I Heat Content|
Asphalq....................................................................... 6.636 PetrochemicalFeedstocksAviationGasoline....................................................... 5.048 Naphtha LessThan 4010 F ............................. 5.248
Butane........................................................................ 4.326 Other OilsEqual toor Greater Than 401° F ... 5.825
Butane-PropaneMixturea........................................... 4.130 StillGas ........................................................... 6.000Distillate Fuel Oil ...................................................... 5.825 PetroleumCoke .................................................... 6,024
Ethane ....................................................................... 3.082 Plant Condensate................................................. 5.418r bElhane.Proparm Mlxlu e .......................................... 3.308 Propane................................................................. 3.838
Isobutane.................................................................... 3.974 Residual Fuel Oil................................................. 8.287
Jet Fuel, Kerosene Type ......................................... 5.670 Road Oil ............................................................... 6.838
Jet Fuel, Naphtha Type ........................................... 5.355 Special Naphthas................................................. 5.248Kerosene.................................................................... 5.670 Still Gas ................................................................ 6.000Lubricants................................................................... 6.065 Unfinished Oils ..................................................... 5.825
Motor Gasoline........................................................... 5.253 Unlracllonated Stream ......................................... 5.418
Natural Gasoline and Isopenlane ............................ 4.620 Waxes.................................................................... 5,537Penlanes Plus ........................................................... 4.620 Mlscel_neous ........................................................ 5.796
i m.i i i i=,i , i i. i i i i|l iiiilll
II
b60 percent butane and 40 percent propane.70 percent elhane and 30 percentpropane,
Source: See "ThermalConversionFactorSource Documentation,"whichlollowsTable A8.
Energy Information Administration/Monthly Energy Review December 1993 145
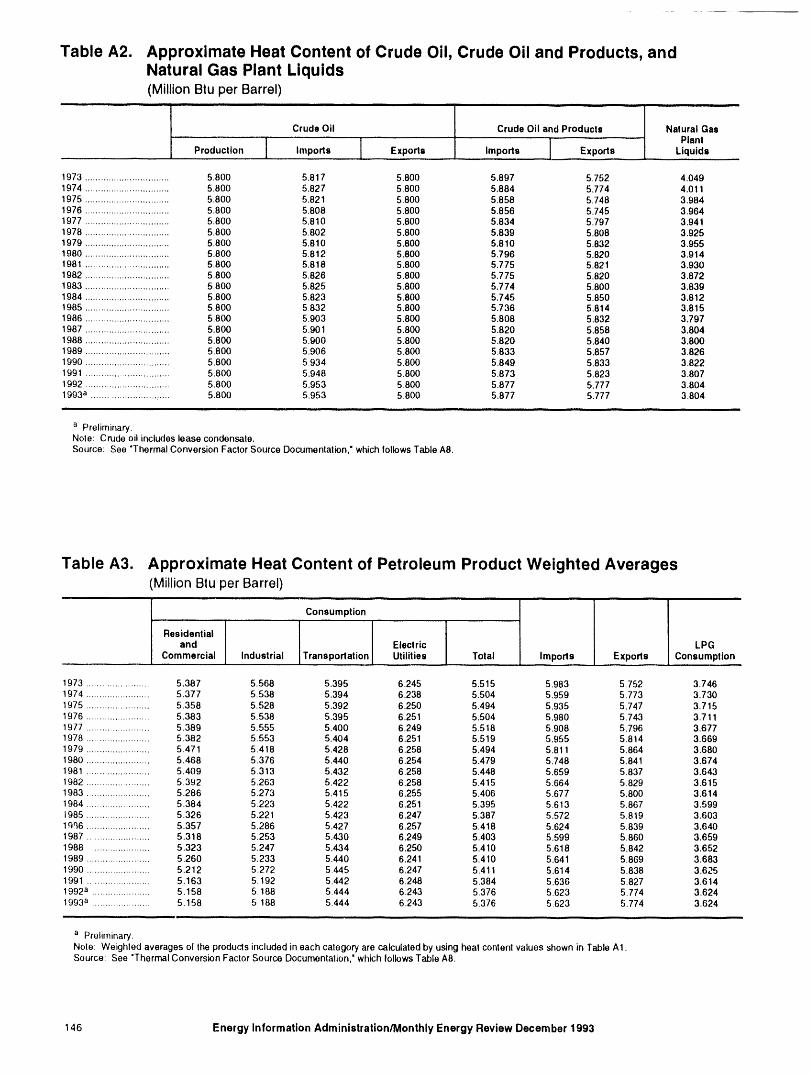
Table A2. Approximate Heat Content of Crude Oil, Crude Oil and Products, andNatural Gas Plant Liquids(MillionBtuper Barrel)
Crude Oil Crude Oil and Products Natural Gas
PlantProduction Imports Exports Imports Exports Liquids
1973 ................................ 5.800 5.817 5.800 5.897 5.752 4.0491974 ................................ 5.800 5.827 5.800 5.884 5.774 4.0111975 ................................ 5.800 5.821 5.800 5.858 5.748 3.9841976 ................................ 5.800 5.808 5.800 5.856 5.745 3.9641977 ................................ 5.800 5.810 5.800 5.834 5.797 3.9411978 ................................ 5.800 5.802 5.800 5.839 5.808 3.9251979 ................................ 5.800 5.810 5.800 5.810 5.832 3.9551980 ................................ 5.800 5.812 5.800 5.796 5.820 3.9141981 ............................... 5.800 5.818 5.800 5.775 5.821 3.9301982 ................................ 5.800 5.826 5.800 5.775 5.820 3.8721983 ................................ 5.800 5.825 5.800 5.774 5.800 3.8391984 ................................ 5.800 5823 5.800 5.745 5.850 3.8121985 ................................ 5.800 5.832 5.800 5.736 5.814 3.8151986 ................................ 5.800 5.903 5.800 5.808 5.832 3.7971987 ................................ 5.800 5.901 5.800 5.820 5.858 3.8041988 ................................ 5.800 5.900 5.800 5.820 5.840 3.8001989 ................................ 5.800 5.906 5.800 5.833 5.857 3.8261990 ................................ 5.800 5 934 5.800 5.849 5.833 3.8221991 ................................ 5.800 5.948 5.800 5.873 5.823 3.8071992 ................................ 5.800 5.953 5.800 5.877 5.777 3.8041993a ............................... 5.800 5.953 5.800 5.877 5.777 3.804
a Preliminary.Nole: Crude oil includes lease condensate.Source: See "Thermal Conversion Factor Source Documentation," which follows Table A8.
Table A3. Approximate Heat Content of Petroleum Product Weighted Averages(MillionBtuperBarrel)
Consumption...............
Residentialand Electric LPG
Commercial Industrial Transportation Utilities Total Imports Exports Consumption.......
1973 ........................ 5.387 5.568 5.395 6.245 5.515 5.983 5.752 3.7461974 ........................ 5.377 5.538 5.394 6.238 5.504 5.959 5.773 3.7301975 ........................ 5.358 5.528 5.392 6.250 5.494 5.935 5.747 3.7151976 ........................ 5.383 5.538 5.395 6.251 5.504 5.980 5.743 3.7111977 ........................ 5.389 5.555 5.400 6.249 5.518 5.908 5.796 3.6771978 ........................ 5.382 5.553 5.404 6.251 5.519 5.955 5.814 3.6691979 ........................ 5.471 5.418 5.428 6.258 5.494 5.811 5.864 3.6801980 ........................ 5.468 5.376 5.440 6.254 5.479 5.748 5.841 3.6741981 ........................ 5.409 5.313 5.432 6.258 5.448 5.659 5.837 3.6431982 ........................ 5.392 5.263 5.422 6.258 5.415 5.664 5.829 3.6151983 ........................ 5.286 5.273 5.415 6.255 5.406 5.677 5.800 3.6141984 ........................ 5.384 5.223 5.422 6.251 5.395 5.613 5.867 3.5991985 ........................ 5.326 5.221 5.423 6.247 5.387 5.572 5.819 3.6031_n.6........................ 5.357 5.286 5.427 6.257 5.418 5.624 5.839 3.6401987 ........................ 5.318 5.253 5.430 6.249 5.403 5.599 5.860 3.6591988 ..................... 5.323 5.247 5.434 6.250 5.410 5.618 5.842 3.6521989 ........................ 5.260 5.233 5.440 6.241 5.410 5.641 5.869 3.6831990 ........................ 5.212 5.272 5.445 6.247 5.411 5.614 5.838 3.6251991 ........................ 5.163 5.192 5.442 6.248 5.384 5.636 5.827 3.6141992a ...................... 5.158 5.188 5.444 6.243 5.376 5.623 5.774 3.6241993a ...................... 5.158 5 188 5.444 6.243 5.376 5.623 5.774 3.624
a Preliminary.Note: Weighted averages ol the products included in each category are calculated by using heat content values shown in Table A1.Source: See "Thermal Conversion Factor Source Documenlation," which IollowsTable AS.
146 Energy Information Administration/Monthly Energy Review December 1993
Table A4. Approximate Heat Content of Natural Gas(Btu per Cubic Foot)
iiiiii ii iii iiiii i IBI iiii lUllll pglllll .......
Production Consumption.,, ......
Sectors OtherMarketed Than Electric Electric
Dry (Wet) UtUitlee Utilities Total Imports Exports......................................
1973 ........................ 1,021 1,093 1,020 1,024 1,021 1,026 1,0231974 ........................ 1,024 1,097 1 024 1,022 1,024 1,027 1,0161975 ........................ 1,021 1,095 1 020 1,026 1,021 1,026 1,0141976 ........................ 1,029 1,093 1 019 1,023 1,020 1,025 1,0131977 ........................ 1,021 1,093 1 019 1,029 1,021 1,026 1,0131978 ........................ 1,019 1,088 1 016 1,034 1,019 1,030 1,0131979 ........................ 1,021 1,092 1 018 1,035 1,021 1,037 1,0131980 ........................ 1,026 1,098 1 024 1,035 1,026 1,022 1,0131981 ........................ 1,027 1,103 1 025 1,035 1,027 1,014 1,0111982 ........................ 1,028 1,107 1 026 1,036 1,028 1,018 1,0111983 ........................ 1,031 1,115 1 031 1,030 1,031 1,024 1,0101984 ........................ 1,031 1,109 1 030 1,035 1,031 1,005 1,0101985 ........................ 1,032 1,112 1,031 1,038 1,032 1,002 1,0111986 ........................ 1,030 1,110 1,029 1,034 1,030 997 1,0081987 ........................ 1,031 1,112 1,031 1,032 1,031 999 1,0111988 ........................ 1,029 1,109 1,029 1,028 1,029 1,002 1,0181989 ........................ 1,031 1,107 1,031 1,030 1,031 1,004 1,0191990 ........................ 1,031 1,105 1,030 1,034 1,031 1,012 1,0181991 ........................ 1,030 1,108 1,031 1,024 1,030 1,014 1,0221992a ...................... 1,030 1,110 1,031 1,022 1,030 1,011 1,018199_ ...................... 1,030 1,110 1,031 1,022 1,030 1,011 1,018
i i ii i =l
a Preliminary.Source: See "ThemudConversionFactor SourceDocumentation,"whichIoliowsTable A8.
Table A5. Approximate Heat Content of Coal(Million Btu per Short Ton)
..................
Consumption
Residentialand Coke Other Electric
Production Commsrc0al Plants Industriala Utilitiesb Total Imports Exports........................
1973 ........................ 23.376 22.831 26.780 22.586 22.246 23.057 25.000 26.5961974 ........................ 23.072 22.479 26.778 22.419 21.781 22.677 25.000 26.7001975 ........................ 22.897 22.261 26.782 22.436 21,642 22.506 25.000 26.5621976 ........................ 22.855 22.774 26.781 22.530 21.679 22.498 25.000 26.6011977 ........................ 22.597 22.919 26.787 22.322 21.508 22.265 25.000 26.5481978 ........................ 22.248 22.466 26.789 22.207 21.275 22.017 25.000 26.4781979 ........................ 22.454 22.242 26.788 22.452 21364 22.100 25.000 26.5481980 ........................ 22.415 22.543 26.790 22.690 21.295 21.947 25.000 26.3841981 ........................ 22.308 22.474 26.794 22.585 21.085 21.713 25.000 26.1601982 ........................ 22.239 22.695 26.797 22.712 21.194 21.674 25.000 26.2231983 ........................ 22.052 22.775 26.798 22.691 21.133 21.576 25.000 26.2911984 ........................ 22.010 22.844 26.799 22.543 21.101 21.573 25.000 26.4021985 ........................ 21.870 22.646 26.798 22.020 20.959 21.366 25.000 26.3071986 ........................ 21.913 22.947 26.798 22.198 21.084 21.462 25.000 26.2921987 ........................ 21.922 23.404 26.799 22.381 21.136 21.517 25.000 26.2911988 ........................ 21.823 23.571 26,799 22.360 20.900 21.328 25.000 26.2991989 ........................ 21.765 23.650 26.800 22.347 20.848 21.272 25.000 26.1601990 ........................ 21.822 23.137 26.799 22.457 20.929 21.331 25.000 26.2021991 ........................ 21.681 23.114 26.799 22.460 20.755 21.146 25.000 26.1881992c ...................... 21.675 23.197 26.799 22.313 20.804 21.164 25.000 26.1621993c ...................... 21.675 23.197 26.799 22.313 20.804 21.164 25.000 26.162
-- i
a IncludesIransporlalion.b Data showninthiscolumnare notthe same as thoseshown inthe Electric Power Monthly (EPM). The EPM data reportcoalreceipts;the dala shown here
representcoal consumption.c Preliminary.Source: See "ThermalConversionFactor SourceDocumentation,"whichfollowsTable A8.
Energy Information Administration/Monthly Energy Review December 1993 147
I i
Table A6. Approximate Heat Content of Bituminous Coal and Lignite(Million Btu per Short Ton)
_ i ii lllll i i i . . , ,
Consumption
Residentialand Coke Other Electric
Production Commercial Plants Industrial a Utilities Total Imports Exports...............
1973 ........................ 23.391 22.887 26.800 22.585 22.262 23.073 25.000 26.6121974 ........................ 23.087 22.523 26.800 22.420 21.799 22.694 25.000 26.7181975 ........................ 22.910 22.258 26.800 22.439 21.659 22.522 25.000 26.5731976 ........................ 22.863 22.819 26.800 22.528 21.692 22.509 25.000 26.6131977 ........................ 22.597 22.594 26.800 22.290 21.521 22.266 25.000 26.5611978 ........................ 22.242 22.078 26.800 22.175 21.284 22.014 25.000 26.5011979 ........................ 22.449 21.884 26.800 22.436 2"l.372 22.100 25.000 26.5701980 ........................ 22.411 22.488 26.800 22.690 21.301 21.950 25.000 26.4041981 ........................ 22.301 22.010 26.800 22.572 21.091 21.710 25.000 26.1761982 ........................ 22.233 22.226 26.800 22.695 21.200 21.670 25.000 26.2311983 ........................ 22. 048 22.438 26.800 22.680 21.141 21.576 25.000 26.3001984 ........................ 22.005 22.406 26.800 22.525 21.108 21.570 25.000 26.4101985 ........................ 21.867 22.568 26.800 22.013 20.965 21.368 25.000 26.3201986 ........................ 21908 22.669 26.800 22.185 21.091 21.462 25.000 26.3081987 ........................ 21.916 22.800 26.800 22.360 21.143 21.514 25.000 26.3041988 ........................ 21.617 23.135 26.800 22.341 20.905 21.324 25.000 26.3081._89........................ 21.759 22.917 26.800 22.324 20.654 21.268 25.000 26.1661990 ........................ 21.819 22.676 26.800 22.444 20.935 21.330 25.000 26.2071991 ........................ 21.678 22.635 26.800 22.448 20.761 21.146 25.000 26.1921992b ...................... 21.672 22.871 26.800 22.305 20.809 21.164 25.000 26.1661993b ...................... 21.672 22.871 26.800 22.305 20.809 21.164 25.000 26.166
i
a Includes Iransportallon.b Preliminary.Source: See "Thermal Conversion Factor Source Documenlallon," which follows Table AS.
Table A7. Approximate Heat Content of Anthracite and Coal Coke(Million Btu per Shod Ton)
Anthracite
ConsumptionCoal Coke
Sectors Other Imports ImportsThan Electric and and
Production Utilities Electric Utilities Total Exports Exports
1973 ............................. 22.132 22.674 17.920 21.464 25.400 24.8001974 .............................. 21.711 22.330 17.200 20.919 25.400 24.8001975 .............................. 21.582 22.272 17.064 20.762 25.400 24.8001976 ............................... 22.045 22.618 17.526 21.254 25.400 24.8001977 ............................... 22.661 24.101 17.244 22.066 25.400 24.8001978 ............................. 23.079 24.388 17.104 22.398 25.400 24.8001979 ............................... 23.170 24.272 17.454 22.069 25.400 24.8001980 ............................... 22.869 22.719 17.652 21.405 25.400 24.8001981 ............................... 23.291 23.749 18.168 22.080 25.400 24.8001982 .............................. 23.289 24.578 18.160 22.518 25 .,tO0 24.8001983 ............................... 22.734 24.536 16.516 21.583 25.400 24.8001984 ................................ 23.107 25.128 17.018 22.322 25.400 24.8001985 ................................ 22.428 23.031 16.784 20.817 25.400 24.8001986 ................................ 23.084 24.399 15.578 21.512 25.400 24.8001987 ................................ 23.108 26.293 15.962 22.435 25.400 24.8001988 ................................ 23.266 26.021 17.312 22.423 25.400 24.8001989 ............................... 23.385 27.196 16.310 22.623 25.400 24.8001990 ................................ 22.574 25.199 16.140 21.668 25.400 24.8001991 ................................ 22.573 25.268 15.858 21.410 25.400 24.8001992a .............................. 22.571 24.660 16.898 21.278 25.400 24.8001993a .............................. 22.571 24.660 16.698 21.278 25.400 24.800
a Preliminary.Scum;e: See 'Thermal Conversion Factor Source Documenlalion," which follows Table A8.
148 Energy Information Administration/Monthly Energy Review December 1993
Table A8. Approximate Heat Rates for Electricity(Btu per Kilowatthour)
Electricity Generation
Fossil-Fueled Nuclear GeothermalSteam-Electric Steam-Electric Energy Electricity
Plantsa Plants Plants Consumption
1973 ................................................ 10,389 10,903 21,674 3,4121974 ................................................ 10,442 11,161 21,674 3,4121975 ................................................ 10,406 11,013 21,611 3,4121976 ................................................ 10,373 11,047 21,611 3,4121977 ................................................ 10,435 10,769 21,611 3,4121978 ................................................ 10,361 10,941 21,611 3,4121979 ................................................ 10,353 10,879 21,545 3,4121980 ................................................ 10,388 10,908 21,639 3,4121981 ................................................ 10,453 11,030 21,639 3,4121982 ................................................ 10,454 11,073 21,629 3,4121983 ................................................ 10,520 10,905 21,290 3,4121984 ................................................ 10,440 10,843 21,303 3,4121985 ................................................ 10,447 10,813 21,263 3,4121986 ................................................ 10,446 10,799 21,263 3,4121987 ............................................... 10,419 10,776 21,263 3,4121988 ................................................ 10,324 10,743 21,096 3,4121989 ................................................ 10,317 10,724 21,096 3,4121990 ................................................ 10,335 10,680 21,096 3,4121991 ............................................... 10,352 10,740 20,997 3,4121992b .............................................. 10,352 10,740 20,997 3,4121993b .............................................. 10,352 10,740 20,997 3,412
a This thermal conversion taclor is used Ior hydroelectric power generation and Ior wood and waste, wind, pholovollaic, and solar thermal energy consumed atelectric utilities.
b Preliminary.Source: See "Thermal Colwersion Factor Source Documentation," which follows this la_'le.
Thermal Conversion Factor based on an assumed mixture of 60 percent butaneand 40 percent propane. See Butane and Propane.Source DocumentationCrude Oil, Exports. Assumed by EIA to be 5.800million Btu per barrel or equal to the thermal
Approximate Heat Content of conversion factor for crude oil produced in the UnitedPetroleum and Natural Gas States. See Crude Oil and Lease Condensate,
Plant Liquids Production.
Crude Oil, hnports. Calcuhtted annually by EIA byAsphalt. The Energy Information Administration weighting the thermal conversion factor of each type(EIA) adopted the thernml conversion factor of 6.636 of crude oil imported by the quantity imported.million British thermal units (Btu) per barrel as Thermal conversion factors for each type wereestimated by the Bureau of Mines and first published calculated on a foreign country basis, by detenniningin tile Petroleum Statement, Annual, 1956. tile average American Petroleum Institute (API)
gravity of crude imported from each foreign countryAviation (;ascdine. I';IA adopted the Bureau of Mines from Form ERA-60 in 1977 and converting averagethermal conversion factor of 5.048 million Btu per API gravity to average Btu cot_tcnt by using Nationalbarrel as published for "Gasoline, Aviation" by the Bureau of Standards, Miscellaneous Publication No.Texas Eastern Transmission Corporation in Appendix 97, Titermal Properties of Petroleum Products, 1933.V of Competition and Growth in American Energy
Markets 1947.1985, a 1968 release ()f historical and Crude Oil and Lease Condensate, Production. l-lAprojected statistics, adopted the thermal cmwersion factor of 5.800 million
Btu per barrel as reported in a Bureau of MinesButane. EIA adopted the Bureau of Mines thermal internal memorandum, "Bureau of Mines Standardconversion factor of 4.326 million Btu per barrel as Average lleating Values of Various l:ucls, adoptedpublished in the California Oil V_t)rld and Petroleum January 3, 1950."Industry, First lssuc, April 1942.
Crude Oil and Petroleum Products, Exi_orts.llutane.ih'opane Mixture. I':IA ad_q_tcd the Bureau Calcuhtted annually by EIA as the average of theof Mines calculation of 4.13() million Btu per bmrel thermal conversion factors l'or each petroleum product
Energy Information Administration/Monthly Energy Review December 1993 149

exported and crude oil exported weighted by the Lubricants. EIA adopted the thermal conversionquantity of each petroleum product and crude oil factor of 6.065 million Btu per barrel as estimated byexported. See Crude Oil, Exports and Petroleum the Bureau of Mines and first published in theProducts, Exports. Petroleum Statement, Annual, 1956.
Crude Oil and Petroleum Products, Imports. Miscellaneous Products. EIA adopted the thermalCalculated annually by EIA as the average of the conversion factor of 5.796 million Btu per barrel asthermal conversion factors for each petroleum product estimated by the Bureau of Mines and first publishedand each type of crude oil imported weighted by the in the Petroleum Statement, Annual, 1956.quantity of each petroleum product and each type ofcrude oil imported. See Crude Oil, Imports and Motor Gasoline. EIA adopted the Bureau of MinesPetroleum Products, Imports. thermal conversion factor of 5.253 million Btu per
barrel as published for "Gasoline, Motor Fuel" by theDistillate Fuel Oil. EIA adopted the Bureau of Mil,es Texas Eastern Transmission Corporation in Appendixthermal conversion factor of 5.825 million Btu per V of Competition and Growth in American Energybarrel as reported in a Bureau of Mines internal Markets 1947-1985, a 1968 release of historical andmemorandum, "Bureau of Mines Standard Average projected statistics.Heating Value of Various Fuels, adopted January 3,1950." Natural Gas Plant Liquids, Production. Calculated
annually by EIA as the average of the thermalEthane. EIA adopted the Bureau of Mines thermal conversion factors of each natural gas plant liquidconversion factor of 3.082 million Btu per barrel as produced weighted by the quantity of each natural gaspublished in the California Oil World and Petroleum phmt liquid produced.Industry, First Issue, April 1942.
Natural Gasoline. EIA adopted the thermalEthane-Propane Mixture. EIA calculated 3.308 conversion factor of 4.620 million Btu per barrel asmillion Btu per barrel based on an assumed mixture estimated by the Bureau of Mines and first publishedof 70 percent ethane and 30 percent propane. See in the Petroleum Statement, Annual, 1956.Ethane and Propane.
Pentanes Plus. EIA assumed the thermal conversion
lsobutane. EIA adopted the Bureau of Mines thermal factor to be 4.620 million Btu per barrel or equal toconversion factor of 3.974 million Btu per barrel as that for natural gasoline. See Natural Gasoline.published in the California Oil World and PetroleumIndustry, First Issue, April 1942. Petrochemical Feedstocks, Naphtha Less Than 401
Degrees Fahrer:.heit. Assumed by EIA to be 5.248
Jet Fuel, Kerosene Type, EIA adopted the Bureau million Btu per barrel, equal to the thermal conversionof Mines thermal conversion factor of 5.670 million factor for special naphtha. See Special Naphtha.B tu per b,'u'rel as published for "Jet Fuel, Commerciar'by the Texas Eastern Transmission Corporation in Petrochemical Feedstocks, Oils Equal to or GreaterAppendix V of Competition and Growth in American Than 401 Degrees Fahrenheit. Assumed by EIA toEnergy Markets 1947-1985, a 1968 release of be 5.825 million Btu per barrel, equal to the thermalhistorical and projected statistics, conversion factor for distillate fuel oil. See Distillate
Fuel Oil.
Jet Fuel, Naphtha Type. EIA adopted the Bureau ofMines thermal conversion factor of 5.355 million Btu Petrochemical Feedstocks, Still Gas. Assumed byper barrel as published for "Jet Fuel, Military" by the EIA to be 6.000 million Btu per barrel, equal to theTexas Eastern Transmission Corporation in Appendix thermal conversion factor for still gas. See Still Gas.V of Competition and Growth in American Energy
Markets 1947-1985, a 1968 release of historical and Petroleum Coke. EIA adopted the thermalprojected statistics, conversion factor of 6.024 million Btu per barrel as
reported in Btu per short ton in the Bureau of MinesKerosene. EIA adopted the Bureau of Mines thermal internal memorandum, "Bureau of Mines Standardconversion factor of 5.670 million Btu per barrel as Average l{eating Value of Various Fuels, adoptedreported in a Bureau of Mines internal memorandum, January 3, 1950." The Bureau of Mines calculated"Bureau of Mines Standard Average Heating Values of this factor by dividing 30,120,000 Btu per short ton,Various Fuels, adopted January 3, 1950." as given in the referenced Bureau of Mines internal
memorandum, by 5.0 barrels per short ton, as given
Liquefied Petroleum Gases (LPG) Consumption. in the Bureau of Mines Form 6-1300-M and successorCalculated annually by EIA as the average of the EIA forms.thermal conversion factors of each liquefied petroleumgas consumed, weighted by the quantity of each Petroleum Products, Total Consumption.liquefied petroleum gas consumed. Calculated annually by EIA as the average of the
150 EnergyInformationAdministration/MonthlyEnergyReviewDecember1993

thermal conversion factors for all petroleum products Residual Fuel Oil. EIA adopted the thermalconsumed, weighted by the quantity of each petroleum conversion factor of 6.287 million Btu per barrel asproduct consumed, reported in the Bureau of Mines internal memorandum,
"Bureau of Mines Stm_dard Average Heating Values ofPetroleum Products, Consumption by Electric Various Fuels, adopted January 3, 1950."Utilities. Calculated annually by EIA as the average
of the thermal conversion factors for all petroleum Road Oil. EIA adopted the Bureau of Mines thermalproducts consumed at electric utilities, weighted by the conversion factor of 6.636 million Btu per barrel,quantity of each petroleum product consumed at which was assumed to be equal to that of asphalt (seeelectric utilities, The quantity of petroleum consumed Asphalt) and was first published by the Bureau ofis estimated in the State Energy Data System as Mines in the Petroleum Statement, Annual, 1970.documented in the State Energy Data Report.
Special Naphtha. EIA adopted the Bureau of MinesPetroleum Products, Consumption by Industrial thermal conversion factor of 5.248 million Btu perUsers. Calculated annually by EIA as the average of barrel, which was assumed to be equal to that of totalthe thermal conversion factors for all petroleum gasoline (aviation and motor) factor and was firstproducts consumed in the industrial sector, weighted published in the Petroleum Statement, Annual, 1970.by the estimated quantity of each petroleum productconsumed in the industrial sector. The quantity of
Still Gas. EIA adopted the Bureau of Mines estimatedpetroleum products consumed is estimated in the State thermal conversion factor of 6.000 million Btu perEnergy Data System as documented in the State barrel and first published in the Petroleum Statement,Energy Data Report. Annual, 1970.
Petroleum Products, Consumption by Residentialand Commercial Users. Calculated annually by EIA Unfinished Oil. EIA assumed the thermal conversionas the average of the thermal conversion factors for factor to be 5.825 million Btu per barrel or equal toall petroleum products consumed by the residential and that for distillate fuel oil (see Distillate Fuel Oil) andcommercial sector, weighted by the estimated quantity first published in the Annual Report to Congress,of each petroleum product consumed in the residential Volume 3, 1977.and commt.rt.ial sector. The quantity of petroleumproducts consumed is estimated in the State Energy Unfractionated Stream. EIA assumed the thermalData System as documented in die State Energy Data conversion factor to be 5.418 million Btu per barrelReport. or equal to that for plant condensate (see Plant
Condensate) and first published in the Annual Report
Petroleum Products, Consumption by to Congress, Volume 2, 1981,Transportation Users. Calculated annually by EIA asthe average of the thermal conversion factor for all Waxes. EIA adopted the thermal conversion factor ofpetroleum products consumed in the transportation 5.537 million Btu per barrel as estimated by thesector, weighted by the estimated quantity of each Bureau of Mines and first published in the Petroleumpetroleum product consumed in the transportation Statement, Annual, 1956.sector. The quantity of petroleum products consumedis estimated in the State Energy Data System as Approximate Heat Content ofdocumented in the State Energy l)ata Report. Natural Gas
Petroleum Products, Exports. Calculated annually Natural Gas, Total Consumption. 1973-1979: EIAby EIA as the average of the thermal conversion adopted the thermal conversion factor calculatedfactors for each petroleum product, weighted by the annually by the American Gas Association (AGA) andquantity of each petroleum product exported, published in Gas Facts, an AGA annual publication.
1980 forward: Calculated annually by EIA byPetroleum Products, Imports. Calculated annually dividing the total heat content of natural gas consumedby EIA as the average of the thermal conversion by the total quantity of natural gas consumed. Thefactors for each petroleum product imported, weighted heat content and quantity consumed are from Fonnby the quantity of each petroleum product imported. EIA-176. Published sources are: 1980-1990: EIA,
Natural Gas Annual 1990, Volume 2, Table 15. 1991Plant Condensate. Estimated to be 5.418 million Btu forward: 1990 value used as an estimate.
per barrel by EIA from data provided by McClan;d_an
Consultants, Inc., llouston, Texas. Natural Gas, Consumption hy Electric Utilities.Calculated annually by EIA by dividing the total heat
Propane. EIA adopted the Bureau of Mines thermal content of natural gas received at electric utilities byconversion factor of 3.836 million Btu per barrel as the total quantity received at electric utilities. Thepublished in the California Oil World and Petroleum heat contents and receipts ,are from Form Iq_RC-423Industry, First Issue, April 1942. and predecessor forms.
EnergyInformationAdministration/MonthlyEnergyReviewDecember1993 151
Natural Gas, Consumption by Sectors Other Than Anthracite, Production. Calculated annually by EIAElectric Utilities. Calculated annually by EIA by by dividing the sum of file heat content of freshlydividing the heat content of all natural gas consumed mined anthracite (estimated to have an average heatless the heat content of natural gas consumed at content of 25.400 million Btu per short ton) and theelectric utilities by the quantity of all natural gas heat content of anthracite recovered from cuhn banksconsumed less the quantity of natural gas consumed and river dredging (estimated to have a heat contentat electric utilities. Data are from Forms EIA-176, of 17.500 million Btu per short ton) by the totalFERC-423, EIA-759, and predecessor forms, quantity of anthracite production.
Natural Gas, Exports. Calculated annually by EIA Bituminous Coal and Lignite, Total Consumption.by dividing the heat content of exported natural gas Calculated annually by EIA by dividing the sum ofby the quantity of natural gas exported, both reported the heat content of bituminous coal and ligniteon Form FPC-14. consumed by electric utilities, coal coke plants, other
industrial plants, the residential and commercial sector,
Natural Gas, Imports. Calculated annually by EIA and the transportation sector by the sum of theirby dividing the heat content of imported natural gas respective tonnages.by the quantity of natural gas imported, both reportedon Form FPC-14. Bituminous Coal and Lignite, Consumption by
Coke Plants. Estimated by EIA to be 26.800 millionBtu per short ton on the basis of an input/outputNatural Gas Production, Dry. Assumed by EIA to
be equal to the thermal conversion factor for the analysis of coal carbot_izati_m.consumption of dry natural gas. See Natural GasConsumption. Bituminous Coal and l_,ignite, Consumption hy
Electric Utilities. Calculated annually by EIA by
Natural Gas Production, Marketed (Wet). dividing the total heat content of bituminous coal andCalculated annually by EI,\ by adding the heat content lignite received at electric utilities by the total quantityof dry natural gas production and the total heat content received at electric utilities, lleat contents andof natural gas plant liquids production and dividing receipts are from Form FERC-423 and predecessorthis sum by the total quantity of marketed (wet) forms.natural gas production.
Bituminous Coal and Lignite, Consumption by
Approximate Heat Content of Other Industrial and Transportation Users. 1973:Coal and Coal Coke Calculated by EIA through regression analysis
measuring the difference between the average Btu
Anthracite, Total Consumption. Calculated annually value of coal consumed by other industrial users andthat of coal consumed at electric utilities in theby EIA by dividing the sum of the heat content ofanthracite consumed by electric utilities and all other 1974-1982 period. 1974 forward' Calculatedsectors combined by the total quantity of anthracite annually by EIA by assuming that the bituminous coal
and lignite delivered to other industrial users fromconsumed, each coal-producing area (reported on Form EIA-6 and
predecessor Bureau of Mines Form 6-1419-Q)Anthracite, Consumption by Electric Utilities. contained a heat value equal to that of bitumineus coalCalculated annually by EIA by dividing the heat and lignite received at electric utilities flora each ofcontent of anthracite receipts at electric utilities by the the same coal-producing areas (reported on Formquantity of anthracite received at electric utilities. FERC-423). The average Btu value of coal byHeat contents and receipts are from Form FERC-423 coal-producing area was applied to the volume ofand predecessor forms, deliveries to other industrial users from each
coal-producing area, and the sum total of the heatAnthracite, Consumption by Sectors Other Than content was divided by the total volume of deliveries.Electric Utilities. Calculated annually by EIA by Coal-producing areas are the Bureau of Minesdividing the heat content of anthracite production less coal-producing districts for 1974 through 1989 andthe heat content of the anthracite consumed at electric coal-producing States for 1990 forward.utilities, net exports, and shipments to U.S. Armed
Forces overseas by the quantity of anthracite Bituminous Coal and Lignite, Consumption byconsumed by sectors other than electric utilities less Residential and Commercial Users. 1973:
the quantity of anthracite stock changes, losses, and Calculated by EIA through regression analysis"unaccounted for." measuring the difference between the average Btu
value of coal consumed by residential and commercialAnthracite, Imports and Exports. EIA assumed the users and that of coal consumed by electric utilitiesanthracite imports and exports to be freshly mined in the 1974-1982 period. 1974 forward: Calculatedanthracite having an estimated heat content of 25.40 annually by EIA by assuming that the bituminous coalmillion Btu per short ton. and lignite delivered to residential and commercial
152 EnergyInformationAdministration/MonthlyEnergyReviewDecember1993

users from each coal-producing area (reported on Form coal and lignite and anthracite exported by the sumEIA-6 and predecessor Bureau of Mines Form of their respective tonnages.6-1419-Q) contained a heat value equal to that of
bituminous coal and lignite received at electric utilities Coal, Imports. Calculated annually by EIA byfrom each of the same coal-producing areas (reported dividing the sum of the heat content of bituminouson Form FERC-423). The average Btu value of coal coal and lignite and anthracite imported by the sumby coal-producing area was applied to the volume of of their respective tonnages.deliveries to residential and commercial users from
each coal-producing area, and the total of the heat Coal, Production. Calculated annually by EIA byvalue was divided by the total volume of deliveries, dividing the sum of the total heat content ofCoal-producing areas are the Bureau of Mines bituminous coal and lignite and anthracite productioncoal-producing districts for 1974 through 1989 and by the sum of their respective tonnages.coal-producing States for 1990 forward.
Coal Coke, Imports and Exports. EIA adopted theBituminous Coal and Lignite, Exports. Calculated Bureau of Mines estimate of 24.800 million Btu perannually by EIA by dividing the sum of the heat short ton.content of exported metallurgical coal (estimated toaverage 27.000 million Btu per short ton) and the heat Approximate Heat Rates for Electricitycontent of exported steam coal (estimated to have anaverage thermal content of 25.000 million Btu per Fossil-Fueled Steam-Electric Plant Generation.short ton) by the total quantity of bituminous coal and There is no generally accepted practice for measuringlignite exported, the thermal conversion rates for power plants that
generate electricity from hydroelectric, wood andwaste, wind, photovoltaic, or solar thermal energy
Bituminous Coal and Lignite, Imports. EIA sources. Therefore, EIA has selected a rate that isestimated the average thermal conversion factor to be equal to the prevailing annual average heat rate factor25.000 million Btu per short ton. for fossil-fueled steam-electric power phmts in the
United States. By using that factor, it is possible toBituminous Coal and Lignite, Production. evaluate fossil fuel requirements for replacing thoseCalculated annually by EIA by dividing the sum of sources during periods of interruption such asthe heat content of bituminous coal and lignite droughts. The heat content of a kilowatthour ofconsumption, net exports, stock changes, and electricity produced, regardless of the generationunaccounted for by the sum of their respective process, is 3,412 Btu per kilowatthour. 1973-1990:tonnages. Consumers' stock changes by sectors were The weighted annual average heat rate forassumed to have the same conversion factor as that of fossil-fueled steam-electric power plants in the Unitedthe consumption sector. Producers' stock changes and States, as published by EIA in Electric Plant Cost andunaccounted for were assumed to have the same Power Production Expenses 1990, Table 11. 1991conversion factor as that for consumption by all users, forward: 1990 value used as an estimate.
Coal, Consumption. Calculated annually by EIA by Geothermal Energy Plant Generation. i973-1981:dividing the sum of the heat conten t of bituminous Calculated annually by EIA by weighting the averagecoal and lignite and anthracite consumption by the annual heat rates of operating geothermal units by thesum of their respective tonnages, installed nameplate capacities as reported on Form
FPC-12. 1982 forward: Estimated annually by EIA
Coal, Consumption by Electric Utilities. Calculated on the basis of an informal survey of relevant plants.annually by EIA by dividing the sum of the heatcontent of bituminous coal and lignite and anthracite Nuclear Steam-Electric Plant Generation.received at electric utilities by the sum of their Calculated annually by FIA by dividing the total heatrespective tonnages received, content consumed in nuclear generating units by the
total (net) electricity generated by nuclear generatingunits. The heat content and electricily generation are
Coal, Consumption by Sectors Other Than Electric reported on Form FERC-1, Form EIA-412, andUtilities. Calculated annually by EIA by dividing the predecessor forms. The factors, beginning with 1982sum of the heat content of bituminous coal and lignite data, are published in the following EIAand anthracite consumed by sectors other than electric reports_1982: Historical Plant Cost and Annualutilities by the sum of their respective tonnages. Production Expenses for Selected Electric Plants
1982, page 215. 1983-1990: l".lectric Plant Cost andCoal, Exports. Calculated annually by EIA by Power Production Expenses 1990, Table 15. 1991dividing the sum of the heat content of bituminous forward: 1990 value used as an estimate.
EnergyInformationAdministration/MonthlyEnergyReviewDecember1993 153
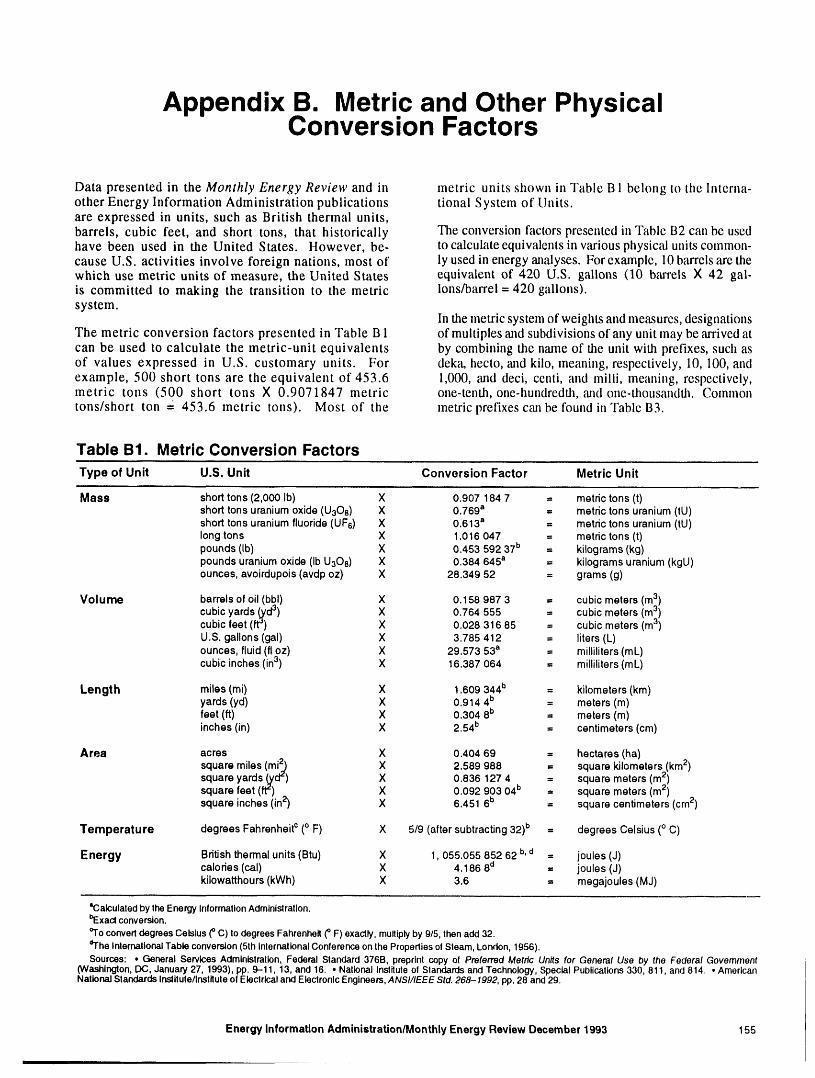
Appendix B. Metric and Other PhysicalConversion Factors
Data presented in the Monthly Energy Review and in metric units shown in Table B 1 belong to tile Interna-other Energy Information Administration publications tional System of Units.are expressed in units, such as British thermal units,barrels, cubic feet, and short tons, that historically The conversion factors presented in Table B2 can be usedhave been used in the United States. However, be- to calculate equivalents in various physic_d units common-
cause U.S. activities involve foreign nations, most of ly used in energy analyses, t-or example, 10 barrels are thewhich use metric units of measure, the United States equivalent of 420 U.S. gallons (10 barrels X 42 gal-
is committed to making the transition to the metric lens/barrel = 420 gallons).system.
In the metric system of weights and measures, designationsThe metric conversion factors presented in "Fable B 1 of multiples and subdivisions of any unit may be arrived at
can be used to calculate the metric-unit equivalents by combining the n,'une of the unit with prefixes, such asof values expressed in U.S. customary units. For deka, hecto, and kilo, meaning, respectively, 10, 100, andexample, 500 short tons are the equivalent of 453.6 1,000, and deci, centi, and milli, meaning, respectively,metric tons (500 short tons X 0.9071847 metric one-tenth, one-hundredth, and one-thousandth. Common
tons/short ton = 453.6 metric tons). Most of the metric prefixes can be found in Table B3.
Table B1. Metric Conversion FactorsType of Unit U.S. Unit Conversion Factor Metric Unit
Mass short tons(2,000 Ib) X 0.907 184 7 = metric tons(t)short tonsuranium oxide (U308) X 0,769a = metric tons uranium (tU)short tons uranium fluoride (UFs) X 0.613" = metric tons uranium (tU)long tons X 1,016 047 = metric tons (t)pounds (Ib) X 0.453 592 37b = kilograms (kg)pounds uranium oxide (Ib U3Oe) X 0,384 645a = kilograms uranium (kgU)ounces, avoirdupois (avdp oz) X 28.349 52 = grams (g)
Volume barrels of oil (bbl) X 0.158 987 3 = cubic meters (m3)cubicyards (,yd3) X 0.764 555 = cubic meters (m3)cubic feet (ft") X 0.028 316 85 = cubicmeters(m3)U.S. gallons (gal) X 3.785 412 = liters (L)ounces, fluid (fl oz) X 29.573 53a = milliliters (mL)cubic inches (in3) X 16.387 064 = milliliters (mL)
Length miles (mi) X 1.609344b = kilometers(km)yards (yd) X 0.914 4b = meters(m)feet (ft) X 0.304 8b = meters(m)inches(in) X 2.54b = centimeters(cm)
Area acres X 0.404 69 = hectares(ha)squaremiles(mi2) X 2.589 988 = squarekilometers(kin2)square yards 0,d':) X 0.836 127 4 = square meters (m2)square feet (ft=) ., X 0.092 903 045 = squaremeters(m2)square inches(in') X 6.451 65 = square centimeters(cm2)
Temperature degrees Fahrenheitc(o F) X 5/9 (after subtracting32)b = degrees Celsius(oC)
Energy Britishthermalunits(Btu) X 1,055.055 852 62 b,d = joules(J)calories(cal) X 4.186 8d = joules (J)kilowatthours(kWh) X 3.6 = megajoules(MJ)
=CalculatedbytheEnergyInlormallonAdministration.%xactconversion.°lo convertdegreesCelsius(oC)todegreesFahrenheit(oF)exactly,multiplyby9/5,thenadd32._TheInternationalTableconversion(5thInternationalConferenceonthePropertiesofSteam,London,1956).Sources:• GeneralServicesAdministration,FederalStandard376B,preprlntcopyof PreferredMetric Unitsfor Genera/Use by the FederalGovernment
(Washington,13(;,January27, 1993),pp.9-11, 13,and16. • NationalInstituteofStandardsandTechnology,SpecialPublicallons330,811,and814. • AmericanNationalStandardsInstitute/InstituteofElectricalandEleclronicEngineers,ANSl//EEEStd.268-1992,pp.28and29.
Energy Information Administration/Monthly Energy Review December 1993 155
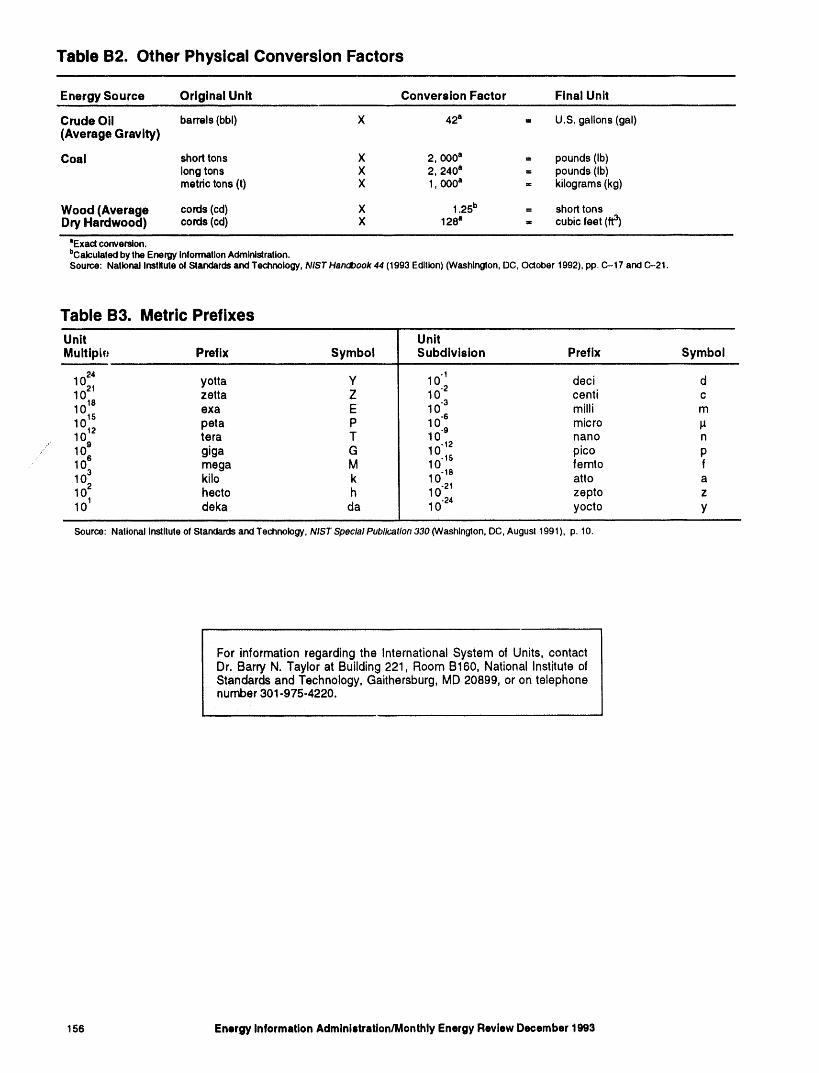
Table B2. Other Physical Conversion Factors
Energy Source Original Unit Conversion Factor Final Unit
Crude Oil barrels(bbl) X 42a = U.S. gallons(gal)(Average Gravity)
Coal shorttons X 2,000 a = pounds(Ib)longtons X 2, 240a = pounds(Ib)metrictons(t) X 1,000a = kilograms(kg)
Wood (Average cords(cd) X 1.25b = shorttonsDry Hardwood) cords (cd) X 128" = cubicfeet (ft3)
=Exaclconversion.bCalculaledbytheEnergyInlormaUonAdmlnislratlon.Source:NationalInstiluteo4StandardsandTechnology,N/STHandbook44(1993Edition)(Washington,DC,October1992),pp.C-17 andC-21.
Table B3. Metric PrefixesUnit Unit
Muitiph: Prefix Symbol Subdivision Prefix Symbol
24
110_18 yotta Y 101 deci dzetta Z 10.2 centi c
10 exa E 10.3 milli m
0"61 lS12 peta P 10.9 micro g. 10_ tera T 1012 nano n
/ 106 giga G 10.1s pico p1 mega M 1 femto f-18
atto a03 kilo k 1 -21
1021 hecto h 1 zepto z101 deka da 10 .2`= yocto y
source:NationalInslltuteofStandardsandTechnology,N/STSpecialPub//cat/on330(Washington,DC,Augus!1991),p.10.
For information regarding the International System of Units, contactDr. Barry N. Taylor at Building 221, Room B160, National Institute ofStandards and Technology, Gaithersburg, MD 20899, or on telephonenumber 301-975-4220.
156 Energy Information Administration/Monthly Energy Review December 1993
Appendix C. List of Features
The following is a complete list of features that have appeared provide brief overviews of EIA preliminary energy data onin the Monthly Energy Review since the first issue was a given topic. "EIA Data News" items present informationpublished in October 1974. There ,are fotn" categories of on recent changes in the scope, design, methodology, andfeatures on the list. "Articles" cover a wide range of energy- findings of the EIA's energy surveys and data bases.related subjects in depth. "Highlights" summ,-uize the most Questions and conunents about features may be directed toimportant information presented in the subject Energy Barbara T. Fichrman by telephone on 202-586-5737 or by faxInformation Administration _IA) report. "Energy Previews" on 202-586--0018.
Feature Cover Date
1993Energy Preview: Residential Transportation Energy Consumption Survey,
Preliminary Estimates, 1991 ....................................................... January 1993EIA Data News: Natural Gas Transported for the Account of Others ........................ February 1993Highlights: Federal Energy Subsidies: Direct and Indirect Interventions in Energy Markets ...... July 1993Highlights: Household Energy Consumption and Expenditures 1990 ........................ August 1993Article: Demand, Supply, and Price Outlook for Low-Sulfur Diesel Fuel ...................... August 1993Energy Preview: Manufacturing Energy Consumption Survey, Preliminary Estimates, 1991 ...... September 1993Highlights: Natural Gas 1992: Issues and Trends ....................................... September 1993Highlights: International Energy Outlook 1993 .......................................... October 1993Highlights: The Changing Structure of the U.S. Coal Industry: An Update .................... November 1993
1992Energy Preview: Residential Energy Consumption and Expenditures
Preliminary Estimates, 1990 ....................................................... April 1992EIA Data News: Oxygenate Data Collection Begins ..................................... May 1992Highlights: Lighting in Commercial Buildings ........................................... June 1992Article: Demand, Supply, and Price Outlook for Oxgenated Gasoline, Winter 1992-1993 ........ August 1992EIA Data News: EIA Statistics on Electric Utility Demand-Side Management ................. September 1992EIA Data News: EIA Statistics on Nonutility Power Producers ............................. October 1992Highlights: Derived Annual Estimates of Manufacturing Energy Consumption, 1974.1988 ........ November 1992Article: Energy Efficiency in the Manufacturing Sector .................................. December 1992
1991Highlights: U.S. Energy Industry Financial Developments, 1990 Fourth Quarter ............... March 1991Article: U.S. Wholesale Electricity Transactions ........................................ April 1991
1990Article: Refining Results Highlight Energy Companies' First-Half Profit Performance ........... June 1990Highlights: U.S. Oil and Gas Reserves by Year of Field Discovery .......................... August 1990
1989Article: A Review of Valdez Oil Spill Market Impacts ..................................... March 1989Article: Monthly U.S. Crude Oil Production Estimates .................................... March 1989Article: Superconductivity and Energy Production and Consumption ........................ May 1989Highlights: Commercial Buildings Consumption and Expenditures 1986 ..................... May 1989Article: Higher Prices Yield Improved Energy Industry Financial Results
in the First Half of 1989 .......................................................... June 1989Article: The Future Structure of the U.S. Commercial Nuclear Power Equipment
Manufacturing Industry .......................................................... July 1989Highlights: Potential Costs of Restricting Chlorofluorocarbon Use .......................... September 1989Highlights: Manufacturing Energy Consumption Survey: Changes inEnergy Efficiency, 1980-1985 ...................................................... October 1989
Highlights: Household Energy Consumption and Expenditures 1987, Part 1: National Data ..... November 1989Article: Improved Energy ProfitsOffset by Refining Results in 1989 ......................... December 1989
EnergyInformationAdministration/MonthlyEnergyReviewDecember1993 157
Feature Cover Date
1988Article: Measures of EnergyConsumption, Expenditures,and Prices ........................ May 1988Highlights: Characteristics of Commercial Buildings 1986 ................................. June 1988Article: The U.S. Energy Industry's Financial Recovery Continued in the First Half of 1988 ....... June 1988Article: A U.S. Perspective on Condensate ............................................ June 1988Article: State Energy Severance Taxes, 1972-1987 ...................................... July 1988Highlights: Manufacturing Energy Consumption Survey: Consumption of Energy, 1985 ......... September 1988Highlights: Profiles of Foreign Direct Investment in U.S. Energy 1987 ........................ October 1988Highlights: Manufacturing Energy Consumption Survey: Fuel Switching, 1985 ................ November 1988Article: Increased Refining Income Led U.S. Energy Industry Financial Recovery in 1988 ........ December 1988
1987Article: Manufacturing Sector Energy Consumption, 1985 Provisional Estimates ............... January 1987Highlights: Consumption and Expenditures, April 1984Through March 1985,
Part 1: National Data ............................................................. April 1987Highlights: Consumption and Expenditures, April 1984Through March 1985,
Part 2: Regional Data ............................................................. May 1987Article: U.S. Energy Industry Financial Developments, 1987 SecondQuarter .................. June 1987Article: End-Use Consumption of Residential Energy ..................................... July 1987Highlights: Uranium Industry Annual 1986 ............................................. September 1987Highlights: PotentialOil Productionfrom ANWR ......................................... October 1987Highlights: Profiles of Foreign Direct Investment in U.S. Energy 1986 ........................ November 1987Article: The U.S. Energy Industry in 1987: A Slow Recovery ............................... December 1987
1986Article: State Motor Gasoline Taxes, 1960-1985 ......................................... March 1986Article: The Impact of Low Oil Prices on Electric Utility Fuel Choice ......................... June 1986Article: U.S. Energy Industry Financial Developments, 1986 Second Quarter .................. June 1986Highlights: International Energy Annual 1985 ........................................... September 1986Article: U.S. Energy Industry Financial Developments, 1986 ............................... December 1986
1985Highlights: Annual Energy Review 1984 ............................................... January 1985Highlights: Performance Profiles of Major Energy Producers 1983 .......................... February 1985Article: Estimating Well Completions .................................................. March 1985Highlights: State Energy Price and Expenditure Report 1970-1982 .......................... March 1985Highlights: State Energy Data Report, Consumption Estimates, 1960-1983 ................... April 1985Highlights: Annual Outlook for U.S. Electric Power 1985 .................................. June 1985Highlights: Short-Term Energy Outlook, Volume 1, October 1985 ........................... August 1985Highlights: Analysis of Growth in Electricity Demand, 1980-1984 ........................... August 1985Highlights: Profiles of Foreign Direct Investment in U.S. Energy 1984 ........................ November 1985Highlights: Performance Profiles of Major Energy Producers 1984 .......................... December 1985
1984Highlights: Annual Energy Review 1983 ............................................... February 1984Highlights: Annual Energy Outlook 1983 ............................................... March 1984Highlights: State Energy Data Report, Consumption Estimates, 1960-1982 ................... March 1984Highlights: State Energy Price and Expenditure Report, 1970-1981 .......................... May 1984Highlights: Solar Collector Manufacturing Activity 1983 ................................... June 1984Highlights: International Energy Annual 1983 ........................................... September 1984Highlights: Estimates of U.S. Wood Energy Consumption, 1980-1983 ....................... September 1984Highlights: Energy Conservation Indicators 1983Annual Report ............................ November 1984Highlights: Annual Energy Outlook 1984 ............................................... December 1984
158 EnergyInformationAdministration/MonthlyEnergyReviewDecember1993
Feature Cover Date
1983Highlights: Residential Energy ConsumptionSurvey: Consumption and Expenditures ........... January 1983Highlights: Residential Energy Consumption Survey: Housing Characteristics ................. February 1983Article: The Effect of Weather on Energy Use ........................................... April 1983Article: Trends in U.S. Energy Since 1973 ............................................. May 1983Article: Data Series on Petroleum Use at Electric Utilities ................................. July 1983Highlights: Energy Price and Expenditure Data Report, 1970-1980 .......................... July 1983Highlights: Railroad Deregulation: impact on Coal ....................................... August 1983Highlights: Port Deepening and User Fees: Impact on U.S. Coal Exports .................... August 1983Highlights: U,S. Crude Oil, Natural Gas, and Natural Gas Liquids Reserves,
1982 Annual Report .............................................................. September 1983Article: Residential Energy Consumption, 1978 Through 1981 ............................. September 1983
Article: Exploring for Oil and Gas ..................................................... November 1983Article: The Influence of Federal Actions on Petroleum Exploration .......................... December 198312]Article: Aggregate Statistics: Accurate or Misleading? .................................... December 198313]
1982Article: The Interstate and Intrastate Natural Gas Markets ................................. January 1982Article: Natural Gas Drillingand Production Under the Natural Gas Policy Act ................. February 1982Highlights: U.S. Crude Oil, Natural Gas, and Natural Gas Liquids Reserves, 1981Annual Report .. September 1982Article: Impacts of Financial Constraints on the Electric Utility Industry ....................... October 1982Highlights: Energy Company Development Patterns in the Postembargo Era .................. November 1982
1981Article: Changes in 1981 Petroleum Data Series ........................................ May 1981Article: Information Services of the Energy Information Administration ....................... September 1981Article: An Overview of Natural Gas Markets ........................................... December 198i
1980Article: The Solar Collector Industry and Solar Energy .................................... February 1980Article: Trends in the Installation of Energy Using Equipment in New Residential Buildings ....... March 1980Article: The Energy Information Administration's Oil and Gas Reserves
Program--The First Year's Report ................................................... June 1980Article: Energy From Urban Waste ................................................... August 1980Article: Natural Gas Liquids: Revisions to 1979 Data ..................................... October 1980Article: EIA Weekly Petroleum Data: Data Collection and Methods of Estimation .............. November 1980Article: The Department of Energy Disclosure Policy for Individually IdentifiableInformation Maintained by the Energy Information Administration ........................... December 1980
1979Article: The Energy Requirements of U.S. Agriculture .................................... July 1979Article: Three Mile Island--Possible Regulatory Responses and Their Impactson the Nation's Short-Term Electric Utility Fuel Outlook .................................. October 1979
Article: Reduction in Natural Gas Requirements Due to Fuel Switching ....................... December 1979
1978Article: Short-Term Petroleum Supply and Demand ...................................... May 1978
1977Article: Crude Oil Entitlements Program .............................................. January 1977Article: Motor Gasoline Supply and Demand ............................................ July 1977
EnergyInformationAdministration/MonthlyEnergyReviewDecember1993 159
Feature Cover Date
1976Article: Curtailmentsof Natural Gas Service ........................................... January1976Article: HomeHeatingConservationAlternativesandthe Solar CollectorIndustry .............. March 1976Article: Trends inUnitedStatesPetroleumImports ...................................... September1976
1975Article: EnergyConsumption ....................................................... March 1975Article: Nuclear Power ............................................................ April 1975Article: The Priceof CrudeOil ...................................................... June 1975Article:U.S. Coal Resourcesand Reserves ............................................ July 1975Article: Propane--A NationalEnergyResource ......................................... September 1975Article: Short-TermEnergySupply andDemand Forecastingat FEA ........................ October 1975
16o EnergyInformationAdministration/MonthlyEnergyReviewDecember1993
Glossary
Anthracite: A hard, black, lustrous coal containing a Butane: A normally gasuous straight-chain orhigh percentage of fixed carbon and a low percentage branched-chain hydrocarbon (C4lllo). It is extractedof volatile matter. Often referred to as hard coal. It from natural gas or refinery gas streams. It includesconforms to ASTM Specification D388-84 for isobutane and normal butane and is designated inanthracite, meta-anthracite, and semianthracite. ASTM Specification 1)1835 and Gas Processt,r.,
Association Specifications for commercial butane.• lsobutane: A normaUy gaseous branched-chainAsphalt: A dark-brown-to-black cement.like material
containing bitumens as the predominant constituents hydrocarbon. It is a colorless _araffinic gas thatobtained by petroleum processing. The definition boils at a temperature of 10.9 F. It is extractedincludes crude asphalt as well as the following from natural gas or refinery gas streams.
• Normal Butane: A normally gaseousfinished products: cements, fluxes, the asphalt contentof emulsions (exclusive of water), and petroleum straight.chain hydrocarbon. It is a colorless
paraffinic gas that boils at a temperature _fdistillates blended with asphalt to make cutback 3 °asphalts. .1.1 F. It is extracted from natural _as or_,_refinery gas strea ns.
ASTM: The American Society for Testing and Butylene: An olel'inic hydrocarbotl (C411_) recoveredMaterials. from refinery processes.
Aviation Gasoline Blending Components: Naphthas Capacity Factor: The ratio of the electrical energythat are used for blending or compounding into produced by a generating unit for a given period offinished aviation gasoline (e.g., straight-run gasoline, time to the electrical energy that could have beenaikylate, and reformate). Excludes oxygenates produced at continuous full-power operation during the(alcohols and ethers), butan.., and pentanes plus. same period.
Aviation Gasoline, Finished: All special grades of CIF: See Cost, Insurance, Freight.gasoline for use in aviation reciprocating engines, as
given in ASTM Specification D910 and Military City Gate: A point or measuring station at which aSpecification MIL-G-5572. Excludes blending distribution gas utility receives gas from a natural gascomponents that will be used in blending or pipeline company or transmission system.compounding into finished aviation gasoline.
Coal: A black or brownish-black solid, combustible
Barrel (petroleum): A unit of volume equal to 42 substance formed by the partial decomposition ofU.S. gallons, vegetable matter without access to air. The rank of
coal, which includes anthracite, bituminous coal,subbituminous coal and lignite, is based on fixed
Base (Cushion) Gas: The volume of gas needed as apermanent inventory to maintain adequate underground carbon, volatile matter, and heating value. Coal rank
indicates the progressive alteration, or coalification,storage reservoir pressures and deliverability rates from lignite to anthracite. Lignite containsthroughout the withdrawal season. All native gas is approximately 9 to 17 million Btu per ton. The heatincluded in the base gas volume, contents of subbituminous and bituminous coal range
from 16 to 24 million Btu per ton, and from 19 to 30Bituminous Coal: A dense black coal, often with million Btu per ton, respectively. Anthracite containswell-defined braids of bright and dull material, with a approximately 22 to 28 million Btu per ton.moisture content usually less than 20 percent. Often
referred to as soft coal. It is the most common coal Coal Coke: A hard, porous product made from bakingand is used primarily for generating electricity, making bituminous coal in ovens at temperatures as high ascoke, and space heating. It conforms to ASTM 2,000 ° E It is used both as a fuel and as a reducingSpecification D388-84 for bituminous coal. In this agent in smelting iron ore in a blast furnace.report, bituminous coal includes subbituminous coal.
Commercial Sector: The commercial sector, as
British Thermal Unit (Btu): The quantity of heat defined economically, consists of business
needed to raise the temperature of 1 pound of water establishments that are not engaged in transportationby 1° F at or near 39.2_F. See Heat Content of a or in manufacturing or other types of industrialQuantity of Fuel, Gross and Heat Content of a activity (agriculture, mining, or construction).Quantity of Fuel, Net. Commercial establishments include hotels, motels,
EnergyInformationAdminlstration/MonthlyEnergyReviewDecember1993 161

restaurants, wholesale businesses, retail stores, Crude O11 Refinery Input: The total crude oil putlaundries, and other service enterprises; religious and into processing units at refineries.nonprofit organizations; health, social, and educationalinstitutions; and Federal, State, and local governments. Crude O11 Stocks: Stocks of crude oil and lease
Street lights, pumps, bridges, and public services are condensate held at refineries, in pipelines, at pipelinealso included if the establishment operating them is terminals, and on leases.considered commercial.
Crude O11 Used Directly: Crude oil consumed as fuelCompletion: The installation of permanent equipment by crude oil pipelines emd on crude oil leases.for the production of oil or gas. If a well is equipped
to produce only oil or gas from one zone or reservoir, Cuhic Foot (natural gas): A unit of volume equal tothe definition of a well (classified as an oil well or 1 cubic foot at a pressure base of 14.73 poundsgas well) and the definition of a completion are st,'mdard per square inch absolute and a temperatureidentical, l lowever, if a well is equipped to produce base of 60° F.oil and/or gas separately from more than one reservoir,
a well is not synonymous with a completion. Degree-Day Normals: Simple arithmetic averages ofmonthly or annual degree-days over a long period of
Conversion Factor: A number that translates units of time (usually the 30-year period 1951-1980). Theone system into corresponding values of another averages may be simple degree-day normals orsystem. Conversion factors can be used to translate population-weighted degree-day nonnals.physical units of measure for v,'u'ious fuels into Btu
equivalents. Degree-Days, Cooling (CDD): The number of degreesper day that the daily average temperature is above
Cost, Insurance, Freight (CIF): A type of sale in 65° E The daily average temperature is the mean ofwhich the buyer of the product agrees to pay a unit the maximum and minimum temperatures for aprice that includes the f.o.b, value of the product at 24-hour period.the point of origin plus all costs of insurance andtransporultion. This type of transaction differs from a Degree-Days, Heating (HDD): The number of degrees"delivered" purchase in that the buyer accepts the per day that the daily average temperature is belowqtmntity as determined at the loading port (as certified 65 ° F. The daily average temperature is the mean ofby the Bill of Loading and Quality Report) rather than the maximum and minimum temperatures for apay on the basis of the quantity and quality 24-hour period.ascerUlined at the unloading port. It is similar to the
terms of an f.o.b, sale, except that the seller, as a Degree-Days, Population-Weighted: It eating orservice for which he is compensated, arranges for cooling degree-days weighted by the population of thetransportation and insurance, area in which the degree-days are recorded. To
compute State population-weighted degree-days, eachCrude Oil f.o.b, Price: The crude oil price actually State is divided into from one to nine climaticallycharged at the oil-producing country's port of loading, homogeneous divisions, which ,are assigned weightsIncludes deductions for any rebates and discounts or based on the ratio of the population of the division toadditions of premiums, where applicable. It is the the total population of the State. Degree-day readingsactual price paid with no adjusunent for credit terms, for each division ,are multiplied by the corresponding
population weight for each division and those productsCrude Oil (Including Lease Condensate): A mixture are then summed to arrive at the Stateof h>drocarbons that exists in liquid phase in population-weighted degree-day figure. To computeunderground reservoirs and remains liquid at national population-weighted degree-days, the Nationatmospheric pressure after passing through surface is divided into nine Census regions comprised of fromsep_ating facilities. Included are lease condensate and three to eight States, which are assigned weights basedliquid hydrocarbons produced from tar sands, gilsonite, on the ratio of the population of the region to the totaland oil shale. Drip gases are also included, but topped population of the Nation. Degree-day readings for eachcrude oil (residual oil) and other unfinished oils ,are region are multiplied by the corresponding populationexcluded. Where identifiable, liquids produced at weight for each region and those products are thennatural gas processing plants and mixed with crude oil summed to arrive at the national population-weighted_u'e likewise excluded, degree-day figure.
Crude Oil Landed Cost: The price of crude oil at Design Electrical Rating, Net: The nominal netthe port of discharge, including charges associated electrical output of a nuclear unit as specified by thewith the purchase, transporting, and insuring of a electric utility for the purpose of phnt design.cargo from the purchase point to tl_e port of discharge.The cost does not include charges incurred at the Development Well: A well drilled within the proveddischarge port (e.g., import t,'u'iffs or fees, wharfage area of an oil or gas reservoir to the depth of acharges, and demurrage), stratigraphic horizon known to be productive.
162 EnergyInformationAdministration/MonthlyEnergyReviewDecember1993

Distillate Fuel OU: A general classification for one of privately owned electric utilities. Excludes industrialthe petroleum fractions produced in conventional electricity generation (except autogcneration ofdistillation operations, Included ,are products known as hydroelectric power).No. 1, No. 2, and No. 4 fuel oils and No. 1, No. 2,
and No. 4 diesel fuels. It is used primarily for space Electricity Sales: The _unount of kilowatthours soldheating, otA- and off-highway diesel engine fuel in a given period of time; usually grouped by classes(including railroad engine fuel and fuel for agricultural of service, such as residential, commercial, industrial,machinery), and electric power generation. ,arid other. "Other" sales include sales for public street
and highway lighting and other sales to publicDry Hole: An exploratory or development well found authorities, sales to railroads and railways, andto be incapable of producing either oil or gas in interdepartmental sales.sufficient quantities to justify completion as an oil or
gas well. Electric Power Plant: A station containing primemovers, electric generators, and auxiliary equipmc|_t
Dry Natural Gas Production (as a decrement from for converting mechanical, chemical, and/or fissiongas reserves): The volume of natural gas withdrawn energy into electric energy.from reservoirs during the report year less (1) thevolume returned to such reservoirs in cycling, Electric Utility: A corporation, person, agency,repressuring of oil reservoirs, and conservation authority, or other legal entity or instrumentality thatoperations; (2) shrinkage resulting from the removal owns and/or operates facilities for the generation,of lease condensate and plant liquids; and (3) transmission, distribution, or sale of electric energy,nonhydrocarbon gases, where they occur in sufficient primarily for use by the public, and that files formsquantity to render the gas unmarketable. Volumes of listed in the Code of Federal Regulations, Title 18,gas withdrawn from gas storage reservoirs and native Part 141. Facilities that qualify as cogcnerators orgas that has been transferred to the storage category small power producers under the Public Utilityare not considered production. This is not the same as Regulatory Policies Act are not considered electricmarketed production, since the latter also excludes utilities.vented and flared gas but contains liquids.
Electric Utility Sector: The electric utility sectorDry Natural Gas Production (as an increment to consists of privately and publicly ownedgas supply): Gross withdrawals from production establishments that generate, transmit, distribute, orreservoirs less gas used in reservoir repressuring, sell electricity primarily for use by the public and thatamounts vented and flared, nonhydrocarbons removed, meet the definition of an electric utility. Nonutilityand various natural gas constituents, such as ethane, power producers are not included in the electric utilitypropane, and butane, removed at natural gas sector,processing plants. The pareaneters for measurement are
60° F and 14.73 pounds standard per square inch End.Use Sectors: The residential, commercial,
absolute, industrial, and transportation sectors of the economy.
Electrical System Energy Losses: The amount of Energy: The capacity for doing work as measured byenergy lost during generation, transmission, and the capability of doing work (potential energy) or thedistribution of electricity, including plant and conversion of this capability to motion (kineticunaccounted-for uses. energy). Energy has several forms, some of which ,are
easily convertible and can be changed to another formElectricity Generation: The process of producing useful for work. Most of the world's convertible
electric energy or transfonning other forms of energy energy comes from fossil fuels that are burned tointo electric energy. Also the amount of electric energy produce heat that is then used as a transfer mediumproduced or expressed in watthours (Wh). to mechanical or other means in order to accomplish
tasks. Electrical energy is usually measured inElectricity Generation, Gross: The total amount of kilowatthours, while heat energy is usually measuredelectric energy produced by the generating station or in British thermal units.stations, measured at the generator terminals.
Energy Consumption: The use of energy as a sourceElectricity Generation, Net: Gross generation less of heat or power or as an input in the manufacturingelectricity consumed at the generating plant for station process.use. Electricity required for pumping at
pumped-storage plants is regarded as plaat use and is Energy Consumption, End-Use: Primary end.usededucted from gross generation, energy consumption is the sum of fossil fuel
consumption by the four end-use sectors (residential,Electricity Production: Net electricity (gross commercial, industrial, and transportation) andelectricity output measured at generator terminals generation of hydroelectric power by nonelectricminus power plant use) generated by publicly and utilities. Net end-use energy consumption includes
EnergyInformationAdmlnlstratlon/MonthlyEnergyReviewDecember1993 163 iI!
electric utility sales to those sectors but excludes l:nergy and tile Federal l:_uergy Regulatoryelectrical system energy losses. 7btal end.use energy Commission, an independent regulatory agency.consumption includes both electric utility sales to tilefour end-use sectors anti electrical system energy First Purchase Price: The marketed first sales pricelosses, of domestic crude oil, consistent with the removal
price defined by tile provisions of the Windfall ProfitsEnergy Consumption, Ibtal: The sum of fossil fuel Tax on Domestic Crude Oil (Public Law 96-223, Sec.consumption by the five sectors (residential, 4998 (c)).commercial, industrial, transportation, and electric
utility) plus hydroelectric power, nuclear electric Flared Natural (;as: Natural gas burned in flares onpower, net imports of coal coke, and electricity the base site or at gas processing phmts.generated for distribution from wood, waste,
geothermal, wind, photovoltaic, and solar thermal f.o.b.: See Free on Board.energy.
Footage Drilled: "lk_tal footage for wells in variousEnergy Source: A substance, such as petroleum, categories, as reported for any specified period,natural gas, or coal, that supplies heat or power. In includes (1) the deepest total depth (length of wellEnergy Information Administration reports, electricity bores) of all wells drilled from the surface, (2) the
and renewable forms of energy, such as biomass, total of all bypassed footage drilled in connection withgeothermal, wind, and solar, are considered to be reported wells, and (3) all new footage drilled forenergy sources, directional sidetrack wells. Footage reported for
directional sidetrack wells does not include footage inEthane: A normally gaseous straight-chain the common bore, which is reported as footage for thehydrocarbon (C2116). It is a colorless, paraffinic gas original well. In the case of old wells drilled deeper,that boils at a temperature of -127.48 ° F. It is extracted the reported footage is that which was drilled belowfrom natural gas and refinery gas stremns, the total depth of tile old well.
Ethylene: An olefinic hydrocarbon (C:II 4) recovered Former U.S.S.R.: See U.S.S.R.from refinery processes or petrochemical processes.
Fossil Fuel: Any naturally occurring organic fuel, such
Exploratory Well: A well drilled to find and produce as petroleum, coal, and natural gas.oil or gas in an unproved area, to find a new reservoirin a field previously found to be productive of oil or Fossil Fuel Steam-Electric Power Plant: Angas in another reservoir, mr to extend the limit of a electricity generation phmt in which the prime moverknown oil or gas reservoir, is a turbine rotated by high-pressure ste_un produced
in a boiler by heat from burning fossil fuels.
Exports: Shipments of goods from the 50 States andthe District of Columbia to foreign countries and to Free Alongside Ship (f.a.s.): The value of aPuerto Rico, tile Virgin Islands, and other U.S. commodity at the port of exportation, generallypossessions and territories, including the purchase price, plus all charges incurred
in placing the commodity alongside tile carrier at the
f.a.s.: See Free Alongside Ship. port of exportation.
Federal Energy Regulatory Commission (FERC): Free on Board (f.o.b.): A transaction whereby theThe Federal agency with jurisdiction over interstate seller makes the product available within an agreed-onelectricity sales, wholesale electric rates, hydroelectric period at a given port at a given price. It is thelicensing, natural gas pricing, oil pipeline rates, and responsibility of the buyer to arrange for thegas pipeline certification. FEP, C is an independent transportation and insurance.regulatory agency within the Department of Energyand is the successor to the Federal Power Commission. Fuel Ethanol: An anhydrous, denatured aliphatic
alcohol (C2115OII) intended for motor gasoline
Federal Power Commission (FPC): The predecessor blending. See Oxygenates.agency of the Federal Energy Regulatory Commission.The Fedcral Power Commission was crcated by an Act Full-Power Operation: Operation of a nuclearof Congress under the Federal Water Power Act on generating re,it at 100 percent of its design capacity.June 10, 1920. It was charged originally with Full-power operation precedes commercial operation.regulating the electric power and natural gasindustries. It was abolished on September 30, 1977, (;asohoh A blend of finished motor gasoline (leadedwhen the Department of Energy was created. Its or unleaded) and alcohol (generally ethanol butfunctions were divided between the Department of sometimes methanol) limited to 10 percent by volume
164 EnergyInformationAdministration/MonthlyEnergyReviewDecember1993
of alcohol. Gasohol is included in finished leaded and Hydrocarbon: An organic chemical compound ofunleaded motor gasoline, hydrogen and carbon in the gaseous, liquid, or solid
phase. The molecular structure of hydrocarbonGas-Turbine Electric Power Plant: A plant in which compounds varies from the simplest (methane, thethe prime mover is a gas turbine. A gas turbine primary constituent of natural gas) to the very heavytypically consists of an axial-flow air compressor, one and very complex.or more combustion chambers where liquid or gaseous
fuel is burned and the hot gases expand to drive the Hydroelectric Power: The production of electricitygenerator and then are used to run the compressor, from the kinetic energy of falling water.
Gas Well: A well completed for the production of Hydroelectric Power Plant: A plant ill which thenatural gas from one or more gas zones or reservoirs, turbine generators are driven by falling water.(Wells producing both crude oil and natural gas are
classified as oil wells.) Imports: Receipts of goods into the 50 States and theDistrict of Columbia from foreign countries and from
Geothermal Energy: Energy from the internal heat of Puerto Rico, the Virgin Islands, and other U.S.the Earth, which may be residual heat, friction heat, possessions and territories.or a result of radioactive decay. The heat is found inrocks and fluids at various depths and can be extractedby drilling and/or pumping. Industrial Sector: The industrial sector comprises
manufacturing industries, which make up the largestpart of the sector, along with mining, construction,
Geothermal Energy (as used at electric utilities): agriculture, fisheries, and forestry. Establishments inHot water or steam extracted from geothermal the sector range from steel mills, to small farms, toreservoirs in the Earth's crust and supplied to steam companies assembling electronic components.turbines at electric utilities that drive generators to
produce electricity. Internal Combustion Electric Power Plant: A powerplant in which the prime mover is an internal
Gross Domestic Product (GDP): The total value of combustion engine. Diesel or gas-fired engines ,are thegoods and services produced by labor and property principal types used in electric power plants. The plantlocated in the United States. As long as the labor and is usually operated during periods of high demand forproperty are located in the United States, the supplier(that is, the workers and, for property, the owners) electricity.may be either U.S. residents or residents of foreigncountries. Jet Fuel: The term includes kerosene-type jet fuel and
naphtha-type jet fuel, Kerosene-type jet fuel is a
Heat Content of a Quantity of Fuel, Gross: The kerosene-quality product used primarily fortotal amount of heat released when a fuel is burned, commercial turbojet and turboprop aircraft engines.
Coal, crude oil, and natural gas all include chemical Naphtha-type jet fuel is a fuel in the heavy naphthascompounds of carbon and hydrogen. When those range used primarily for military turbojet and
" fuels are burned, the carbon and hydrogen combine turboprop aircraft engines.with oxygen in the air to produce carbon dioxide andwater. Some of the energy released in burning goes Kerosene: A petroleum distillate that has a maximuminto transforming the water into steam and is usually distillation temperature of 401 ° F at the 10-percentlost. The aanount of heat spent in transfonning the recovery point, a final boiling point of 572 ° F, and awater into steam is counted as part of gross heat minimum flash point of 100 ° F. Included are the twocontent but is not counted as part of net heat content, grades designated in ASTM D3699 (No. 1-K and No.Also referred to as the higher heating value. Btu 2-K) and all grades of kerosene called range or stoveconversion factors typically used in EIA represent oil. Kerosene is used in space heaters, cook stoves,gross heat content, and water heaters; it is suitable for use as an
illuminant when burned in wick lamps.
Heat Content of a Quantity of Fuel, Net: Theamount of usable heat energy released when a fuel is Lease and Plant Fuel: Natural gas used in well, field,bun_ed under conditions similar to those in which it and lease operations (such as gas used in drillingis normally used. Also referred to as the lower operations, heaters, dehydrators, and fieldheating value. Btu conversion factors typically used compressors), and as fuel in natural gas processingin EIA represent gross heat content, plants.
Heavy Oil: The fuel oils remaining after the lighter Lease Condensate: A natural gas liquid recoveredoils have been distilled off during the refining process, from gas well gas (associated and non-associated) inExcept for start-up and flame stabilization, virtually lease separators or natural gas field facilities. Leaseall petroleum used in steam-electric power plants is condensate consists primarily of pentanes and heavierheavy oil. hydrocarbons.
_4
EnergyInformationAdministration/MonthlyEnergyReviewDecember1993 165

Light Oil: Lighter fuel oils distilled off during the Excluded are oxygenates (alcohols and ethers), butane,refining process. Virtually all petroleum used in and pentanes plus.internal combustion and gas-turbine engines is light
oil. Motor Gasoline, Finished: A complex mixture ofrelatively volatile hydrocarbons, with or without small
Lignite: A brownish-black coal of low rank with a quantities of additives, that has been blended to formhigh content of moisture and volatile matter. Often a fuel suitable for use in spark-ignition engines. Motorreferred to as brown coal. It is used almost exclusively gasoline, as given in ASTM Specification D439 orfor electric power generation. It conforms to ASTM Federal Specification VV-G-1690B, includes a rangeSpecification I)388-84 for lignite, in distillation temperatures from 122 to 1580 F at the
10-percent recovery point and from 365 to 3740 F atLiquefied Natural Gas (LNG): Natural gas (primarily the 90-percent recovery point. Motor gasolinemethane) that has been liquefied by reducing its includes reformulated motor gasoline, oxygenatedtemperature to -260 ° F at atmospheric pressure, motor gasoline, and other finished motor gasoline.
Biendstock is excluded until blending has beenLiquefied Petroleum Gases (LPG): Ethane, ethylene, completed.propane, propylene, normal butane, butylene, and • Reformulated Motor Gasoline: Motor gasoline,isobutane produced at refineries or natural gas formulated for use in motor vehicles, theprocessing plants, including plants that fractionate new composition and properties of which arenatural gas plant liquids, certified as "reformulated motor gasoline" by
the Environmental Protection Agency.Low-Power Testing: The period of time between a • Oxygenated Motor Gasoline: Motor gasoline,nuclear generating unit's initial fuel loading date and formulated for use in motor vehicles, that hasthe issuance of its operating (full-power) license. The an oxygen content of 1.8 percent or higher bymaximum level of operation during that period is 5 weight.percent of the unit's design thermal rating. • Other Finished Motor Gasoline' Motor
gasoline that is not included in the reformulated
l_ubricants: Substances used to reduce friction or oxygenated categories.between bearing surfaces or as process materials eitherincorporated into other materials used as processing Motor Gasoline, Finished Gasohol: A blend ofaids in the manufacturing of other products or as finished motor gasoline (leaded or unleaded) andcarriers ot" other materials. Petroleum lubricants may alcohol (generally ethanol, but sometimes methanol)be produced either from distillates or residues. Other in which 10 percent or more of the product is alcohol.substances _nay be added to impart or improve certainrequired properties. Excluded are byproducts of Motor Gasoline, Finished Leaded: Motor gasolinelubricating oil refining, such as aromatic extracts that contains more than 0.05 gr,'un of lead per gallonderived from solvent extraction or tars derived from
or more than 0.005 gr_un of phosphorus per gallon.deasphalting. Included are all grades of lubricating oils
Premium and reguh'u" grades ,are included, dependingfrom spindle oil to cylinder oil and those used in on the octane rating. Includes leaded gasohoi.greases. Lubricant categories are paraffinic and Blendstock is excluded until blending has beennaphthenic, completed. Alcohol that is to be used in the blending
of gasohol is also excluded.Marketed Production: Gross withdrawals less gasused for repressuring, quantities vented and flared, and
Motor Gasoline, Finished Leaded Premium: Motornonhydrocarbon gases removed in treating orprocessing operations. Includes all quantities of gas gasoline having an antiknock index, calculated asused in field and processing operations. (R+M)/2, greater than 90 and containing more than
0.05 gram of lead per gallon or more than 0.005 gramof phosphorus per gallon.Methanol: A light, volatile alcohol (CH3OIt) eligible
for motor gasoline blending. See Oxygenates.Motor Gasoline, Finished Leaded Regular: Motor
Miscellaneous Petroleum Products: All finished gasoline having an antiknock index, calculated as
petroleum products not classified elsewhere--.for (R,M)/2, greater than or equal to 87 and less than orexample, petrolatum, lube refining byproduct:_, equal to 90 and containing more thaz_ 0.05 gr_un of(aromatic extracts and t_u's), absorption oils, ram-jet lead or 0.005 gram of phosphorus per gallon.fuel, petroleum rocket fuels, synthetic natural gasfeedstocks, and specialty oils. Motor Gasoline, Finished Unleaded: Motor gasoline
containing not more than 0.05 gram of lead per gallonMotor Gasoline Blending Components: Naphthas and not more than 0.005 gram of phosphorus perthat will be used for blending or compounding into gallon. Premium and regular grades are included,finished motor gasoline (e.g., straight-run gasoline, depending on the octane rating. Includes unleadedalkylate, reformate, benzene, toluene, and zylene), gasohol. Blendstock is excluded until blending has
166 EnergyInformationAdministration/MonthlyEnergyReviewDecember1993

been completed. Alcohol that is to be used in the nonhydrocarbon gases removed in treating andblending of gasohol is also excluded, processing operations; and quantities vented and
flared.
Motor Gasoline, Finished Unleaded Midgrade:
Motor gasoline having an antiknock index, calculated Natural Gas Plant Liquids (NGPL): Natural gasas (R+M)/2, greater than or equal to 88 and less than liquids recovered from natural gas in processing phmtsor equal to 90 and containing not more than 0.05 gram and, in some situations, from natural gas fieldof phosphorus per gallon, facilities, as well as those extracted by fractionators.
Natural gas plant liquids are defined according to theMotor Gasoline, Finished Unleaded Premium: published specifications of the Gas ProcessorsMotor gasoline having an antiknock index, calculated Association and the American Society for Testing andas (R+M)/2, greater than 90 and containing not more Materials as follows: ethane, propane, normal butane,than 0.05 gram of lead or 0.005 gram of phosphorus isobutane, pentanes plus, and other products fromper gallon, natural gas processing plants (i.e., products meeting
the standards for finished petroleum products producedMotor Gasoline, Finished Unleaded Regular: Motor at natural gas processing plants, such as finished motorgasoline having an antiknock index, calculated as gasoline, finished aviation gasoline, special naphthas,(R+M)/2, of 87 containing not more than 0.05 gram kerosene, distillate fuel oil, and miscellaneousof lead per gallon and not more than 0.005 gram of products).phosphorus per gallon.
Natural Gas Wellhead Price: The wellhead price ofMotor Gasoline Retail Prices: Motor gasoline prices natural gas is calculated by dividing the total reportedcalculated each month by the Bureau of Labor value at the wellhead by the total quantity producedStatistics (BLS)in conjunction with the construction as reported by the appropriate agencies of individualof the Consumer Price Index (CPI). Those prices are producing States and the U.S. Minerals Managementcollected in 85 urban areas selected to represent all Service. The price includes all costs prior to shipmenturban consumers--about 80 percent of the total U.S. from the lease, including gathering and compressionpopulation. The service stations are selected initially, costs, in addition to State production, severance, andand on a replacement basis, in such a way that they similar charges.represent the purchasing habits of the CPI population.Service stations in the current sample include thoseproviding all types of service (i.e., full-, mini-, and Natural Gas, Wet: Natural gas prior to the extractionself-service), of liquids and other miscellaneous products.
Motor Gasoline, Total: Includes finished leaded Net Consumption: See Energy Consumption,motor gasoline (premium and regular), finished End-Use.unleaded motor gasoline (premium, midgrade, and
regular), motor gasoline blending components, and Nonhydrocarbon Gases: Typical nonhydrocarbongasohol, gases that may be present in reservoir natural gas are
carbon dioxide, helium, hydrogen sulfide, andMTBE (Methyl Tertiary Butyl Ether): An ether, nitrogen.(CH3)3COCH 3, intended for motor gasoline blending.
See Oxygenates. Nuclear Electric Power: Electricity generated by an
Naphtha: A genetic term applied to a petroleum electric power plant whose turbines are driven byfraction with an approximate boiling range between steam generated in a reactor by heat from the122 and 400 ° E fissioning of nuclear fuel.
Natural Gas: A mixture of hydrocarbons (principally Nuclear Electric Power Plant: A single-unit ormethane) and small quantities of various multiunit facility in which heat produced in one ornonhydrocarbons existing in the gaseous phase or in more reactors by the fissioning of nuclear fuel is usedsolution with crude oil in underground reservoirs, to drive one or more steam turbines.
Natural Gas, Dry: The marketable portion of natural Nuclear Reactor: An apparatus in which the nucleargas production, which is obtained by subtracting fission chain can be initiated, maintained, andextraction losses, including natural gas liquids controlled so that energy is released at a specific rate.removed at natural gas processing plant.s, from total The reactor includes fissionable material (fuel), suchproduction, as uranium or plutonium; fertile material; moderating
material (unless it is a fast reactor); a heavy-walledNatural Gas Marketed Production: Gross pressure vessel; shielding to protect personnel;withdrawals of natural gas from production reservoirs, provision for heat removal; and control elements andless gas used for reservoir repressuring; instrumentation.
EnergyInforrnnt;onAdministration/MonthlyEnergyReviewDecember1993 167

Offshore: That geographic area that lies seaward of such that the total oxygen content does notthe coastline. In general, the coastline is the line of exceed 3.5 percent by weight and the ratio ofordinary low water along with that portion of the coast methanol to GTBA is less than or equal to 1.that is in direct contact with the open sea or the line It is also specified that this blended fuel mustmarking the seaward limit of inland water, meet ASTM volatility specifications.
Blends of up to 5.0 percent by volume methanol
Oil: See Crude Oil (Including Lease Condensate). with a minimum of 2.5 percent by volume co-solvent alcohols having carbon number of 4 or
Oil Well: A well completed for the production of less (i.e., ethanol, propanol, butanol, and/orcrude oil from one or more oil zones or reservoirs. GTBA). The total oxygen must not exceed 3.7
Wells producing both crude oil and natural gas are percent by weight, and the blend must meetclassified as oil wells. ASTM volatility specifications as well as phase
separation and alcohol purity specifications.• MTBE (Methyl tertiary butyl ether). Blends up
Operable (nuclear): A U.S. nuclear generating unit isconsidered operable after it completes low-power to 15.0 percent by volume MTBE that mustmeet the ASTM D4814 specifications.testing and is issued a full-power operating license by Blenders must take precautions that the blendsthe Nuclear Regulatory Commission. A foreign nucleargenerating unit is considered operable once it has are not used as base gasolines for othergenerated electricity to the grid. oxygenated blends.
Pentanes Plus: A mixture of hydrocarbons, mostlyOrganization for Economic Cooperation and pentanes and heavier, extracted from natural gas.Development (OECD): Current members are Includes isopentane, natural gasoline, and plantAustralia, Austria, Belgium, Canada, Denmark, condensate.Finland, France, Greece, Iceland, Ireland, Italy, Japan,Luxembourg, the Netherlands, New Zealand, Norway,Portugal, Spain, Sweden, Switzerland, Turkey, the Petrochemical Feedstocks: Chemical feedstocksUnited Kingdo_:t, the United States and its territories derived from petroleum principally for the(Guam, Puerto Rico, and the Virgin Islands), and manufacture of chemicals, synthetic rubber, and aGermany. variety of plastics. The categories reported are
naphthas less than 4010 F endpoint and other oils
Organization of Petroleum Exporting Countries equal to or greater than 401 ° F endpoint.(OPEC): Countries that have organized for the
Petroleum: A generic term applied to oil and oilpurpose of negotiating with oil companies on mattersof oil production, prices, and future concession rights, products in all forms, such as crude oil, leaseCurrent members are Algeria, Gabon, Indonesia, Iran, condensate, unfinished oils, petroleum products,lraq, Kuwait, Libya, Nigeria, Qatar, Saudi Arabia, the natural gas plant liquids, and nonhydrocarbonUnited Arab Emirates, and Venezuela. compounds blended into finished petroleum products.
Oxygenated Motor Gasoline: See Motor Gasoline, Petroleum Coke: A residue that is the final productFinished. of the condensation process in cracking. The product
is either marketable petroleum coke or catalystpetroleum coke.
Oxygenates: Any substance which, when added tomotor gasoline, increases the amount of oxygen in thatmotor gasoline blend. Through a series of waivers Petroleum Coke, Catalyst: The carbonaceous residueand interpretive rules, the Environmental Protection that is deposited on and deactivates the catalyst usedAgency (EPA) has determined the allowable limits for in many catalytic operations (e.g., catalytic cracking).oxygenates in unleaded gasoline. The "Substantially Carbon is deposited on the catalyst, thus deactivatingSimilar" Interpretive Rules (56 FR [February 11, the catalyst. The catalyst is reactivated by burning off1991]) allows blends of aliphatic alcohols other than the carbon, which is used as a fuel in the refiningmethanol and aliphatic ethers, provided the oxygen process. That carbon or coke is not recoverable in acontent does not exceed 2.7 percent by weight. The concentrated form."Substantially Similar" Interpretive Rules also providefor blends of methanol up to 0.3 percent by volume Petroleum Coke, Marketable: Those grades of cokeexclusive of other oxygenates, and butanol or alcohols produced in delayed or fluid cokers that may beof a higher molecular weight tip to 2.75 percent by recovered as relatively pure carbon. Marketableweight. Individual waivers pertaining to the use of petroleum coke may be sold as is or further purifiedoxygenates in unleaded motor gasoline have been by calcining.issued by the EPA. They include:
• Fuel Ethanol. Blends of up to 10 percent by Petroleum Consumption: The sum of all refinedvolume anhydrous ethanol (200 proof), petroleum products supplied. For each refined
• Methanol. B I e n d s o f m e t h a n o I an d petroleum product, the ,'unount supplied is calculatedgasoline-grade tertiary butyl alcohol (GTBA) by adding production and imports, then subtracting
168 EnergyInformationAdministration/MonthlyEnergyReviewDecember1993

changes in primary stocks (net withdrawals are a plus Refiner Acquisition Cost of Crude Oil: The cost ofquantity and net additions are a minus quantity) and crude oil to the refiner, including transportation andexports, fees. The composite cost is the weighted average of
domestic and imported crude oil costs.
Petroleum Imports: Imports of petroleum into the 50
States and the District of Columbia from foreign Refinery (petroleum): A n i n s t a I Ia t i o n t h a tcountries and from Puerto Rico, the Virgin Islands, manufactures finished petroleum products from crudeand other U.S. territories and possessions. Included are oil, unfinished oils, natural gas liquids, otherimports for the Strategic Petroleum Reserve and hydrocarbons, and alcohol.withdrawals from bonded warehouses for onshore
consumption, offshore bunker use, and military use. Renewable Energy: Energy obtained from sourcesExcluded are receipts of foreign petroleum into that are essentially inexhaustible (unlike, for example,bonded warehouses and into U.S. territories and U.S.
the fossil fuels, of which there is a finite supply).Foreign Trade Zones. Renewable sources of energy include wood, waste,
photovoltaic, and solar thermal energy.Petroleum Products: Products obtained from the
processing of crude oil (including lease condensate),natural gas, and other hydrocarbon compounds. Repre_suring: The injection of a pressurized fluidPetroleum products include unfinished oils, liquefied (such as air, gas, or water) into oil and gas reservoirpetroleum gases, pentanes plus, aviation gasoline, formations to effect greater ultimate recovery.motor gasoline, naphtha-type jet fuel, kerosene-type jetfuel, kerosene, distillate fuel oil, residual fuel oil, Residential Sector: The residential sector ispetrochemical feedstocks, special naphthas, lubricants, considered to consist of all private residences, whetherwaxes, petroleum coke, asphalt, road oil, still gas, and occupied or vacant, owned or rented, includingmiscellaneous products, single-family homes, multifamily housing units, and
mobile homes. Secondary homes, such as summer
Petroleum Products Supplied: See Petroleum homes, are also included. Institutional housing, suchConsumption. as school dormitories, hospitals, and military barracks,
generally are not included in the residential sector;
Petroleum Stacks, Primary: For individual products, they are included in the commercial sector.quantities that are held at refineries, in pipelines, andat bulk terminals that have a capacity of 50,000 barrels Residual Fuel Oil: The heavier oils that remain afteror more, or that are in transit thereto. Stocks held by the distillate fuel oils and lighter hydrocarbons areproduct retailers and resellers, as well as tertiary distilled away in refinery operations and that conformstocks held at the point of consumption, are excluded, to ASTM Specifications D396 and 975. Included areStocks of individual products held at gas processing No. 5, a residual fuel oil of medium viscosity; Navyplants are excluded from individual product estimates Special, for use in steam-powered vessels inbut are included in other oils estimates and total, government service and in shore power plants; and No.
6, which includes Bunker C fuel oil and is used for
Photovoltaic and Solar Thermal Energy (as used at commercial and industrial heating, electricityelectric utilities): Energy radiated by the sun as generation, and to power ships. Imports of residualelectromagnetic waves (electromagnetic radiation) that fuel oil include imported crude oil burned as fuel.is converted at electric utilities into electricity by
means of solar (photovoltaic) ceils or concentrating Road Oil: Any heavy petroleum oil, including residual(focusing) collectors, asphaltic oil used as a dust palliative and surface
treatment on roads and highways. It is generallyPipeline Fuel: Gas consumed in the operation of produced in six grades, from 0, the most liquid, to 5,pipelines, primarily in compressors, the most viscous.
Primary Consumption: See Energy Consumption, Rotary Rig: A machine used for drilling wells thatEnd-Use. employs a rotating tube attached to a bit for boring
holes through rock.Propane: A normally gaseous straight-chainhydrocarbon (C31t8). It is a colorless paraffinic gas that Short Ton (coal): A unit of weight equal to 2,000boils at a temperature of -43.67 ° F. It is extracted from pounds.natural gas or refinery gas streams. It includes allproducts designated in ASTM Specification D1835 andGas Processors Association Specifications for SIC: See Standard Industrial Classification.commercial propane and HD-5 propane.
Solar Energy: The radiant energy of the sun, whichPropylene: An olefinic hydrocarbon (C3H 6) recovered can be converted into other forms of energy, such asfrom refinery or p,_trochemical processes, heat or electricity.
EnergyInformationAdministration/MonthlyEnergyReviewDecember1993 169

Standard Industrial Classification (SIC): A set of Underground Storage: The storage of natural gas incodes developed by the Office of Management and underground reservoirs at a different location fromBudget which categorizes industries into groups with which it was produced.similar economic activities.
United States: Unless otherwise noted, "UnitedStartup Test Phase of Nuclear Power Plant: A States" in this publication means the 50 States and thenuclear power plant that has been licensed by the District of Columbia. U.S. exports include shipmentsNuclear Regulatory Commission to operate but is still to U.S. territories, and imports include receipts fromin the initial testing phase, during which the U.S. territories.production of electricity may not be continuous. In
general, when the electric utility is satisfied with the U.S.S.R.: The Union of Soviet Socialist Republicsplant's performance, it formally accepts the plant from consisted of 15 constituent republics: Armenia,the manufacturer and places it in commercial operation Azerbaijan, Belorussia, Estonia, Georgia, Kazakhstan,status. A request is then submitted to the appropriate Kirghizia, Latvia, Lithuania, Moldavia, Russia,utility rate commission to include the power plant in Tadzhikistan, Turkmenistml, Ukraine, and Uzbekistan.
the rate base calculation. As a political entity, the U.S.S.R. ceased to exist asof December 31, 1991.
Steam-Electric Power Plant: A plant in which theprime mover is a steam turbine. The steam used to Vented Natural Gas: Gas released into the air on thedrive the turbine is produced in a boiler where fossilfuels ,are burned, base site or at processing plants.
Strategic Petroleum Reserve (SPR): Petroleum Wellhead Price: The value of crude oil or natural gasat the mouth of the well.stocks maintained by the Federal Government for useduring periods of major supply interruption.
Well Servicing Unit: Truck-mounted equipment
Supplemental Gaseous Fuels: Any gaseous substance generally used for downhole services after a well isdrilled. Services include well completions andthat, introduced into or commingled with natural gas,
increases the volume available for disposition. Such recompletions, maintenance, repairs, workovers, andsubstances include, but are not limited to, propane-air, well plugging and abandonments. Jobs range fromrefinery gas, coke oven gas, still gas, manufactured minor operations, such as pulling the rods and rodgas, biomass gas, or air or inert gases added for Btu pumps out of an oil well, replacing the pump andstabilization, rerunning the assemblage into the well, to major
workovers, such as milling out and repairing collapsed
Synthetic Natural Gas (SNG): A manufactured casing. Well depth and characteristics determine theproduct chemically similar in most respects to natural type of equipment used.gas, resulting from the conversion or reforming ofpetroleum hydrocarbons. It may easily be substituted Wind Energy (as used at electric utilities): Thefor, or interchanged with, pipeline quality natural gas. kinetic energy of wind converted at electric utilitiesAlso referred to as substitute natural gas. into mechanical energy by wind turbines (i.e., blades
rotating from a hub) that drive generators to produceelectricity for distribution.Total Consumption: See Energy Consumption,
End-Use.Wood and Waste (as used at electric utilities): Wood
Transportation Sector: The transporation sector energy, garbage, bagasse, sewerage gas, and otherindustrial, agricultural, and urban refuse used toconsists of private and public vehicles that move
people and commodities. Included are automobiles, generate electricity for distribution.trucks, buses, motorcycles, railroads and railways(including streetcars), aircraft, ships, barges, and Wood Energy: Wood and wood products used as fuel,natural gas pipelines, including round wood (cord wood), limb wood, wood
chips, bark, sawdust, forest residues, charcoal, pulpUnaccounted-for Crude Oil: Arithmetic difference waste, and spent pulping liquor.
between the calculated supply and the calculateddisposition of crude oil. The calculated supply is the Working Gas: The gas in a reservoir that is insum of crude oil production an_j imports, less changes addition to the base (cushion) gas. It may or may notin crude oil stocks. The calculated disposition of crude be completely withdrawn during any particularoil is the sum of crude cil input to refineries, crude withdrawal season. Conditions permitting, the totaloil exports, crude oil burned as fuel, and crude oil working capacity could be used more than once duringlosses, any given season.
170 EnergyInformationAdministration/MonthlyEnergyReviewDecember1993
Statement of Ownership,Management and
"--'-=" Circulation41Emtt(Required by 39 U.S.C. 3685)
1A. Title of Publication ....... 1B PUBLICATION NOI 2. Date of Filing
ill 131MONTHLY ENERGY REVIEW 0 19 5 - 7 5 6 09/28/93I
3. Frequency or'Issue 3A. No o Issues Publishedf .... 38. Annual S_bscription Price
MONTHLY Annue,V 12 Domestic $77.00
Foreign $96.25
4 CompleteMailingAddressofKnownOfficeofPubllcatio,(_,t._. Croup,S_ae_ ZIP+4Code)(At.p,_._¢.)U.S. Department of Energy 1000 Independence Avenue, SW
Energy Information Administration Washington, DC 20585
5. Complete Mailing Address of the HalKIcluartars of General Businet'| Offices of the Pu'bliaher (Not primer)
U.S. Department of Energy i000 Independence Avenue, SWEnergy Information ._ninistration Washington, DC 20585
6. Full Names and Complete Mailing Address of Publisher, Editor, and Managing Editor _/¢em MUST NOT be kkudt)
Publisher (Name and Complete Mailinlt Address)U.S. Depart_nent of Energy i000 Independence Avenue, SWEnergy Information Ac_ninistration Washington, DC 20585
Editor (Name am/Complel, Mailm8 44dm:)
Mary Ellen Golby i000 Independence Avenue, SWU.S. Department of Energy Washington, DC 20585
Managing Editor (Name and Co_ete Mailin 8 Alddre,,)
Nancy Nicoletti i000 Independence Avenue, SW
U.S. Department of Energy Washington, DC 20585
7. Owner (If owned by a corporotio., its _m¢ amd _ktre_ m_sl be J1ated and also immediot¢ly theecwldcr the _mes a_d addre**cs of stocf_lders ocmin& or holdinlI percenl or more of Iokll amo_l of stock. _ tier owned by a corporation, the names and address¢, of the iredividual gyrates mat be |ive.. If o._¢d by a parmer_ipor other anincorporaNtJ _rm. itJ _ and address, _f well a_ that of each individual must b¢ 8iven. If the publication is IHddlshed by a _flproflt organization, itsn.m¢ a.d address m_t be stated. ) (Item m_t b¢ completed.)
Full Name Complete Mailing Address
N/A .... N/A
8. Known Bondholders, Mortgagees. and Other Security Holders Owning or Holding 1 Percent or More of Total Amount of Bonds, Mortgages or OtherSecurities (If there are none, so state)
r-ull Nm Compk.l Mllin9 Address
N/A N/,_,
9. For Completion by Nonprofit Organizations Authorized To Mail at Special Rates (DMM Section 424.12 on6')The purpose, function, and nonprofit status of this organization and the exempt status for Federal ;ncome tax purposes (Check one/
(1) (2)
Has Not Changed During _ His Changed Outing (If ctmnaed, publisher m_L_tsubmit ¢¢pianation ofPreceding 12 Months 1 I Preceding 12 Months ckan&e with this statement.)
tQ Extant and Nature of Circulation Average No. Copies Each Issue During Actual No. Copies of Single Issue(3ee instrv,rtior_ on reverse side) Preceding 12 Months Published Nearest to Filing Date
A, Total No. Copies (Net Press Run/ 4046 4095
B. Paid end/or Requested Circulation 1401 14181. Sales through dealers and carriers, street vendors and counter sales
2. Mail Subscription 2431 2452(Paid and/or reql_sttd)
C. Total Paid and/or Requested Circulation 3832 3870($.m o/IOB/ and IOB2J
O. Free Distribution by Mail, Carrier or Other Means 167 164Samples, Complimentary, and Other Free Copies
E. Total Distribution (._umo[C and DJ 3999 4034
F. Copies Not Distributed 47 611. Office use, left over, unaccounted, spoiled after printing
2 Return from News Agents 0 0
G TOTAL (SamorE, FI and 2--should _I net press _. sho._n i. A) 4046 4095
Signature and Title of Editor. Publisher. Business Manager, or Owner_' I certify that the statements made by Inez E. Allen
me above are co.act and complete Management Analyst
I)8 Form 3526, January 1991 (See in_trv,tion,t em reverse)

mmI I

Related Documents