November 2015 Monthly Infectious Diseases Surveillance Report Volume 4, Issue 11 The Monthly Infectious Diseases Surveillance Report is produced by Public Health Ontario (PHO) for the public health community of Ontario. We welcome feedback by email to: [email protected]. Past issues and additional information are available online. In Focus ........................................................................................................................ 1 Significant Reportable Disease Activity .......................................................................... 7 Errata............................................................................................................................ 9 Infectious Disease Activity in Other Jurisdictions ......................................................... 10 Recently Discontinued Enhanced Surveillance Directives ............................................. 12 Appendix – Reportable Diseases.................................................................................. 13 IN FOCUS Legionella Legionellosis is caused by infection with Legionella bacteria, most commonly L. pneumophila, which are ubiquitous in the environment. Legionellosis presents clinically as Legionnaires’ disease, typically with pneumonia and fever greater than 39 C, or Pontiac Fever. 1 For further information on legionellosis clinical presentations, reservoirs, and risk factors, please refer to the May 2014 Monthly Infectious Diseases Surveillance Report.

Welcome message from author
This document is posted to help you gain knowledge. Please leave a comment to let me know what you think about it! Share it to your friends and learn new things together.
Transcript
November 2015
Monthly Infectious Diseases
Surveillance Report
Volume 4, Issue 11
The Monthly Infectious Diseases Surveillance Report is produced by Public Health Ontario (PHO) for the
public health community of Ontario. We welcome feedback by email to: [email protected]. Past issues
and additional information are available online.
In Focus ........................................................................................................................ 1
Significant Reportable Disease Activity .......................................................................... 7
Errata ............................................................................................................................ 9
Infectious Disease Activity in Other Jurisdictions ......................................................... 10
Recently Discontinued Enhanced Surveillance Directives ............................................. 12
Appendix – Reportable Diseases .................................................................................. 13
IN FOCUS
Legionella
Legionellosis is caused by infection with Legionella bacteria, most commonly L. pneumophila, which are
ubiquitous in the environment. Legionellosis presents clinically as Legionnaires’ disease, typically with
pneumonia and fever greater than 39 C, or Pontiac Fever. 1 For further information on legionellosis
clinical presentations, reservoirs, and risk factors, please refer to the May 2014 Monthly Infectious
Diseases Surveillance Report.

Monthly Infectious Diseases Surveillance Report Page 2 of 14
Laboratory testing for the detection of Legionella may include PCR (polymerase chain reaction) on
respiratory specimens, urine antigen testing (UAT), serum antibody testing, and culture. PCR can detect
Legionella to the genera level (Legionella spp.) as well as identify L. pneumophila. The urine antigen test
is the most frequently used testing method among clinicians, but is able to identify only L. pneumophila
serogroup 1.2 Culture is attempted on PCR positive specimens and allows either species identification (if
not L. pneumophila) or serogroup detection (if L. pneumophila). Culture is required to identify a match
to other clinical isolates or environmental samples. For additional information on laboratory testing for
Legionella, refer to the Public Health Ontario Laboratory (PHOL) Test Directory Index3 and the April 2012
Labstract.4 For guidance on environmental sampling refer to the Legionella Questions and Answers
document.5
Several jurisdictions in the United States have experienced recent legionellosis outbreaks associated
with significant morbidity and mortality, as well as with considerable public and media attention.6-9
Outbreaks involved cases residing in the community in urban neighbourhoods,8 residents of a
retirement home for veterans,9 and inmates of a correctional facility.7 Environmental investigations
included environmental sampling of cooling towers. Although a common source was not identified for
multiple investigations,6-9 a local cooling tower was identified as the likely common source of one
outbreak.6
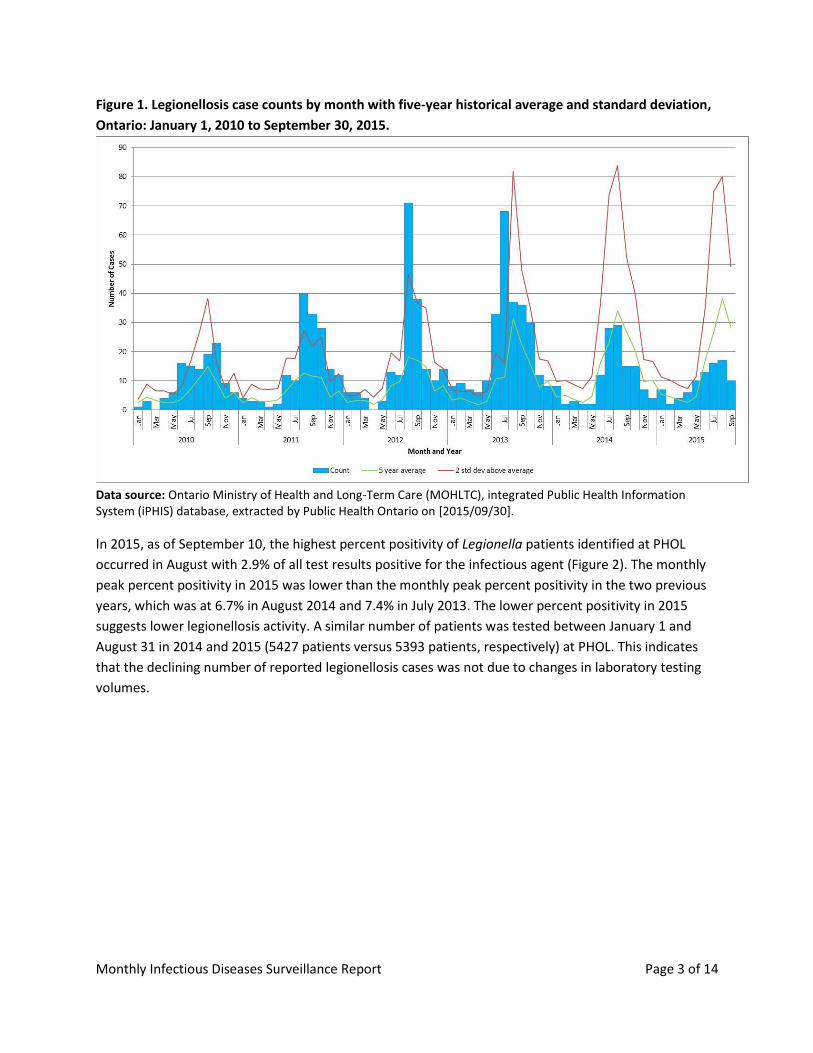
From 2006 to 2013, the incidence of legionellosis in Ontario gradually increased from 0.5 cases per
100,000 population to 2.0 cases per 100,000 population.10 Legionellosis follows a seasonal pattern, with
the majority of cases occurring between June and October every year (Figure 1). Two hundred and sixty-
four cases were reported in the integrated Public Health Information System (iPHIS) during the peak
year in 2013 (Figure 1). In 2014, Ontario observed a substantially smaller season with half the number of
cases reported (127 cases, or 0.94 cases per 100,000 population). In 2015, the number and rate of cases
continued to decline, with 85 cases (0.63 cases per 100,000 population) reported as of September 30.
No legionellosis outbreaks or clusters with a known common exposure were identified in Ontario in
2015.
Monthly Infectious Diseases Surveillance Report Page 3 of 14
Figure 1. Legionellosis case counts by month with five-year historical average and standard deviation,
Ontario: January 1, 2010 to September 30, 2015.
Data source: Ontario Ministry of Health and Long-Term Care (MOHLTC), integrated Public Health Information System (iPHIS) database, extracted by Public Health Ontario on [2015/09/30].
In 2015, as of September 10, the highest percent positivity of Legionella patients identified at PHOL
occurred in August with 2.9% of all test results positive for the infectious agent (Figure 2). The monthly
peak percent positivity in 2015 was lower than the monthly peak percent positivity in the two previous
years, which was at 6.7% in August 2014 and 7.4% in July 2013. The lower percent positivity in 2015
suggests lower legionellosis activity. A similar number of patients was tested between January 1 and
August 31 in 2014 and 2015 (5427 patients versus 5393 patients, respectively) at PHOL. This indicates
that the declining number of reported legionellosis cases was not due to changes in laboratory testing
volumes.

Monthly Infectious Diseases Surveillance Report Page 4 of 14
Figure 2. Percent positivity of Legionella patients identified at PHOL, Ontario: January 1, 2013 to
September 10, 2015.
Data Source: Public Health Ontario Laboratories (PHOL), Laboratory Information Management System (LIMS), extracted on [2015/09/10]. Notes: Date reported was used for the extraction and date when the specimen was received at the lab was used for the analysis. Out-of-province patients were excluded from the analysis.
The majority of legionellosis cases have occurred in the Southern Ontario region since 2010, particularly
within the Greater Golden Horsehoe Area.11 From January 1 to September 30, 2015, cases reported
from Toronto, Peel Region, and the City of Hamilton comprised 48.2% (41/85) of legionellosis cases
reported in Ontario. The highest number of cases was also reported from the same three public health
units (PHUs) in 2014, comprising 44.9% (57/127) of legionellosis cases.
In 2015, the highest rates were reported from Brant County, Chatham-Kent, and the City of Hamilton
with incidence rates of 2.1, 1.9, and 1.8 per 100,000 population, respectively. In 2014, the highest rates
were reported from the City of Hamilton, Region of Waterloo, Oxford County, and Niagara Region in
2014 (3.1, 1.9, 1.8, and 1.8 per 100,000 population, respectively). In 2013, when Ontario observed the
highest number of reported legionellosis cases to date, the top rates were reported from Timiskaming,
Niagara Region, and Peel Region at 5.8, 5.4, and 3.7 cases per 100,000 population, respectively.
Although comparatively high rates were reported among several smaller PHUs, this is a reflection of
their small populations.
The reported legionellosis rates among males have been consistently higher than the rates among
females in Ontario since 2010. The overall male rate in 2015 was 0.8 per 100,000 population, while the
female rate was 0.4 per 100,000 population. From 2010 to 2014, the highest age-specific incidence rates
Monthly Infectious Diseases Surveillance Report Page 5 of 14
were observed in the 80 year and older age groups for both males and females. In 2015, the highest
incidence rate among males was observed in the 75 to 79 year age category (4.2 per 100,000
population) and females aged 65 to 69 years (1.8 per 100,000 population).
From 2013 to 2015, the percentage of legionellosis cases in iPHIS with at least one reported risk factor
ranged from 90.6% to 92.1%. From 2013 through 2015, the top three consistently reported risk factors
each year were: chronic illness and/or underlying medical conditions and/or being immuno-
compromised (53.8% to 55.8% of cases); being a smoker (41.6% to 50.4% of cases); and recent exposure
to aerosolized water, water fountain, or stream (22.1% to 28.2%). In 2014, diabetes was also reported as
a risk factor for 28.2% of cases with at least one reported risk factor.
PHO continues to monitor legionellosis cases on a regular basis to identify unusual increases in trends
and potential clusters. The use of the Legionella Case Report Form will resume in the summer of 2016 to
support the collection of additional exposure information on confirmed cases of legionellosis. This
additional data can help to further characterize the epidemiology of legionellosis in Ontario each season.
Monthly Infectious Diseases Surveillance Report Page 6 of 14
References
1. Heymann DL, editor. Control of communicable diseases manual. 20th ed. Washington, DC: American Public Health Association; 2015.
2. Yang G, Benson R, Pelish T, Brown E, Winchell JM, Fields B. Dual detection of legionella pneumophila and legionella species by real-time PCR targeting the 23S-5S rRNA gene spacer region. Clinical Microbiology and Infection. 2010;16(3):255-61.
3. Public Health Ontario. Test directory index [Internet]. Toronto: Ontario Agency for Health Protection and Promotion; 2013 [cited 2015 Nov 09]. Available from: http://www.publichealthontario.ca/en/ServicesAndTools/LaboratoryServices/Pages/Index.aspx?letter=L
4. Public Health Ontario. Labstract – April 2012: Legionella – change in testing methodology to real-time PCR testing [Internet]. Toronto: Public Health Laboratory, Ontario Agency for Health Protection and Promotion; 2012 [cited 2015 Nov 09]. Available from: http://www.publichealthontario.ca/en/eRepository/LAB_SD_084_Legionella_realtime_PCR_testing.pdf
5. Public Health Ontario. Legionella questions and answers [Internet]. Toronto: Ontario Agency for Health Protection and Promotion; 2014 [cited 2015 Nov 09]. Available from: http://www.publichealthontario.ca/en/eRepository/Legionella_Questions_Answers_2014.pdf
6. Bassett M. New York City Department of Health and Mental Hygiene. Statement from health commissioner Dr. Mary T. Bassett on legionnaires' disease [Internet]. New York City: New York City Department of Health and Mental Hygiene; 2015 [cited 2015 Nov 09]. Available from: http://www.nyc.gov/html/doh/downloads/pdf/press/legionnaires-stmt-09022015.pdf
7. California Department of Corrections and Rehabilitation. CDCR today: San Quentin state prison legionnaires' disease case update [Internet]. California: California Department of Corrections and Rehabilitation; 2015 [cited 2015 Nov 09]. Available from: http://cdcrtoday.blogspot.ca/2015/08/san-quentin-state-prison-legionnaires.html
8. City of New York. Legionnaires’ disease – Legionnaires' disease cluster in Morris Park, Bronx [Internet]. New York City: City of New York; 2015 [cited 2015 Nov 09]. Available from: http://www1.nyc.gov/nyc-resources/legionnaires-disease.page
9. Illinois Department of Public Health. Respiratory illness at Illinois Veterans' Home-Quincy [Internet]. Illinois: Illinois Department of Public Health; 2015 [cited 2015 Nov 09]. Available from: http://www.dph.illinois.gov/news/respiratory-illness-illinois-veterans%E2%80%99-home-quincy
10. Ontario Agency for Health Protection and Promotion (Public Health Ontario). Monthly Infectious Diseases Surveillance Report. Toronto: Queen’s Printer for Ontario; 2014 [2015 Nov 09]. Available from: http://www.publichealthontario.ca/en/DataAndAnalytics/Documents/PHO_Monthly_Infectious_Diseases_Surveillance_Report_-_May_2014.pdf
11. Government of Canada. Statistics Canada. Greater Golden Horseshoe: population change, 2001 to 2006 by census subdivision [Internet]. Canada: Geography Division, Statistics Canada; 2007 [cited 2015 Nov 09]. Available from: http://www12.statcan.gc.ca/census-recensement/2006/as-sa/97-550/maps-cartes/pdfs/cma_csd_maps-cartes/goldenhorseshoe_csdchng_ec_v2.pdf
Monthly Infectious Diseases Surveillance Report Page 7 of 14
SIGNIFICANT REPORTABLE DISEASE ACTIVITY
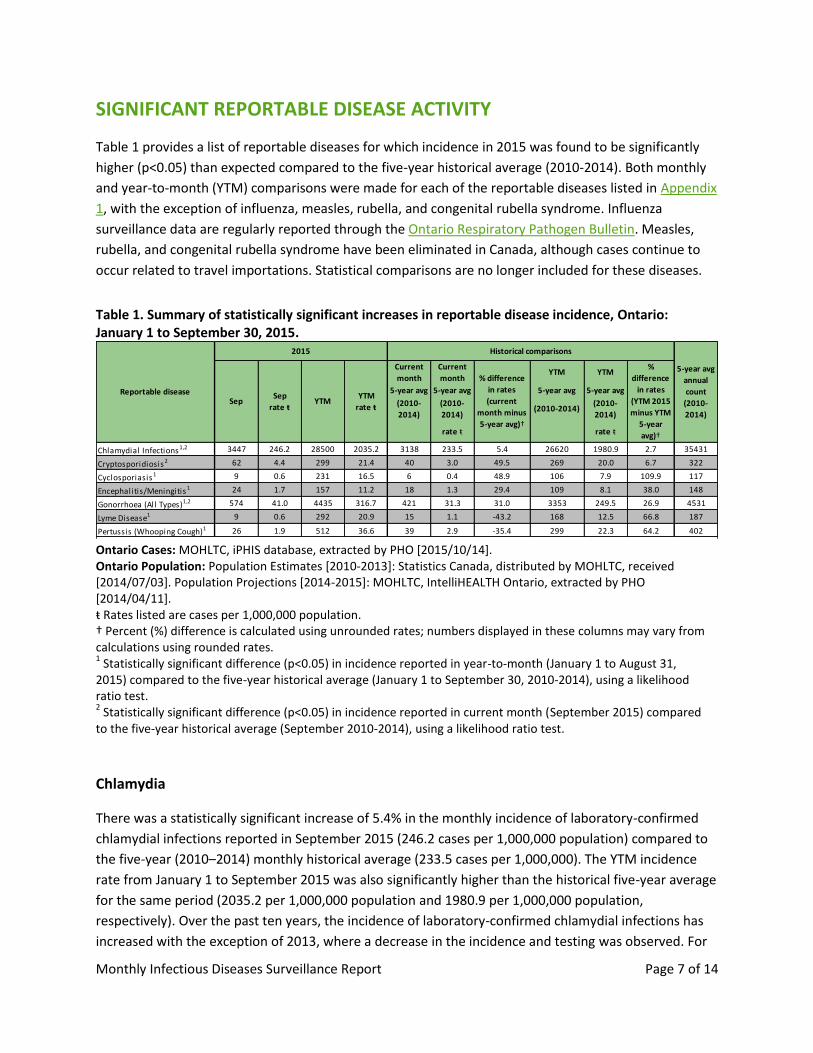
Table 1 provides a list of reportable diseases for which incidence in 2015 was found to be significantly
higher (p<0.05) than expected compared to the five-year historical average (2010-2014). Both monthly
and year-to-month (YTM) comparisons were made for each of the reportable diseases listed in Appendix
1, with the exception of influenza, measles, rubella, and congenital rubella syndrome. Influenza
surveillance data are regularly reported through the Ontario Respiratory Pathogen Bulletin. Measles,
rubella, and congenital rubella syndrome have been eliminated in Canada, although cases continue to
occur related to travel importations. Statistical comparisons are no longer included for these diseases.
Table 1. Summary of statistically significant increases in reportable disease incidence, Ontario: January 1 to September 30, 2015.
Ontario Cases: MOHLTC, iPHIS database, extracted by PHO [2015/10/14]. Ontario Population: Population Estimates [2010-2013]: Statistics Canada, distributed by MOHLTC, received [2014/07/03]. Population Projections [2014-2015]: MOHLTC, IntelliHEALTH Ontario, extracted by PHO [2014/04/11]. ŧ Rates listed are cases per 1,000,000 population. † Percent (%) difference is calculated using unrounded rates; numbers displayed in these columns may vary from calculations using rounded rates. 1 Statistically significant difference (p<0.05) in incidence reported in year-to-month (January 1 to August 31,
2015) compared to the five-year historical average (January 1 to September 30, 2010-2014), using a likelihood ratio test. 2 Statistically significant difference (p<0.05) in incidence reported in current month (September 2015) compared
to the five-year historical average (September 2010-2014), using a likelihood ratio test.
Chlamydia
There was a statistically significant increase of 5.4% in the monthly incidence of laboratory-confirmed
chlamydial infections reported in September 2015 (246.2 cases per 1,000,000 population) compared to
the five-year (2010–2014) monthly historical average (233.5 cases per 1,000,000). The YTM incidence
rate from January 1 to September 2015 was also significantly higher than the historical five-year average
for the same period (2035.2 per 1,000,000 population and 1980.9 per 1,000,000 population,
respectively). Over the past ten years, the incidence of laboratory-confirmed chlamydial infections has
increased with the exception of 2013, where a decrease in the incidence and testing was observed. For
Current
month
Current
monthYTM YTM
5-year avg 5-year avg 5-year avg 5-year avg
(2010-
2014)
(2010-
2014)(2010-2014)
(2010-
2014)
rate ŧ rate ŧ
Chlamydial Infections 1,2 3447 246.2 28500 2035.2 3138 233.5 5.4 26620 1980.9 2.7 35431
Cryptosporidiosis2 62 4.4 299 21.4 40 3.0 49.5 269 20.0 6.7 322
Cyclosporiasis1 9 0.6 231 16.5 6 0.4 48.9 106 7.9 109.9 117
Encephalitis/Meningitis1 24 1.7 157 11.2 18 1.3 29.4 109 8.1 38.0 148
Gonorrhoea (All Types)1,2 574 41.0 4435 316.7 421 31.3 31.0 3353 249.5 26.9 4531
Lyme Disease1 9 0.6 292 20.9 15 1.1 -43.2 168 12.5 66.8 187
Pertussis (Whooping Cough)1 26 1.9 512 36.6 39 2.9 -35.4 299 22.3 64.2 402
Reportable disease
2015 Historical comparisons
5-year avg
annual
count
(2010-
2014)
SepSep
rate ŧYTM
YTM
rate ŧ
% difference
in rates
(current
month minus
5-year avg)†
%
difference
in rates
(YTM 2015
minus YTM
5-year
avg)†

Monthly Infectious Diseases Surveillance Report Page 8 of 14
further details about this decrease, please refer to Reportable Disease Trends in Ontario, 2013. The
increase noted this month may be a continuation of the increase in incidence observed over the past ten
years. PHO will continue to monitor the number of chlamydia infections in subsequent months.
Cryptosporidiosis
The 2015 monthly incidence of cryptosporidiosis in September was significantly higher than the five-year
historical average (September 2010-2014). Sixty-two cases of cryptosporidiosis were reported during
September compared to a five-year expected average of 40 cases. The September incidence rate of
cryptosporidiosis was 4.4 cases per 1,000,000 population compared to the historical five-year average of
3.0 cases per 1,000,000 population, an increase of 49.5%. Cryptosporidiosis case counts peak in the mid
to late summer and transmission is often associated with recreational water contact. The cause of the
increase in September compared to previous years is unknown at this time.
Cyclosporiasis
Statistically significant increases in both the monthly and YTM incidence rates of cyclosporiasis were
observed in September 2015. This was the second consecutive month with a significant increase in the
incidence of cyclosporiasis. As described in Volume Four, Issue 11 of this report, most of the cases in
August were due largely to travel, specifically to resorts in Mexico, while others were associated with a
national investigation that occurred during the summer months for which a source could not be
identified. The increase in September was due to a provincial outbreak that has continued into October.
This outbreak was associated with consumption of Alpine brand sugar snap peas imported from
Guatemala and sold exclusively at Costco retail stores in Ontario. The retailer voluntarily recalled the
suspected product on October 17, 2015. It is important to note that cyclosporiasis is not endemic in
Canada and its occurrence is most frequently associated with travel to or consumption of contaminated
food imported from endemic countries in tropical and subtropical regions of the world.
Encephalitis/Meningitis
There was a statistically significant increase in the incidence of encephalitis/meningitis from January 1 to
September 30, 2015, compared to the historical five-year average for the same period. An increase from
a five-year average of 8.1 cases per 1,000,000 population to 11.2 cases per 1,000,000 population in 2015
was observed, representing an increase of 38.0%. For further information, please refer to the October
Monthly Report.
Gonorrhea
Compared to the five-year historical averages, there were statistically significant increases in both the
monthly and YTM incidence rates of gonorrhea reported in September 2015 and cumulatively from
January 1 to September 30, 2015 (31.0% and 26.9%, respectively).
Monthly Infectious Diseases Surveillance Report Page 9 of 14
With the exception of January 2015, Ontario has experienced a statistically significant increase in the
monthly and YTM incidence of gonorrhea, compared to five-year historical averages, since September
2013. The cause of this ongoing provincial increase in reported gonorrhea cases is not yet well
understood and is likely multifactorial. For a summary of the analyses conducted to date, please refer to
the Infectious Disease In Focus section of the February 2015 issue of this report. Also, to download the
slides and/or audio recording of a recent PHO Rounds presentation on gonorrhea (May 2015), please
click here.
Lyme disease
The YTM incidence rate of Lyme disease was significantly higher in 2015 for the period January to
September in comparison to the five-year expected average for the same period. The number of cases
reported in 2015 to date has exceeded the five-year average annual count of 187 cases, although it is
within the range of values seen over the past five years. The number of cases reported in September
2015 (nine cases) is consistent with the expected decrease in case counts that typically occurs in the late
summer/early fall. Annually, the incidence of Lyme disease peaks in June and July, and this is consistent
with trends in other Lyme disease-endemic regions in the United States and Canada. The occurrence of
Lyme disease in the summer coincides with both greater participation in outdoor activities and
increased presence of infectious nymphal ticks in the environment, both of which increase the
opportunity for exposure to Lyme disease.
ERRATA
OCTOBER 2015 ISSUE (VOLUME 4, ISSUE 10)
Two updates have been made under the Significant Reportable Disease Activity section of the October
monthly report: (1) the rate of chlamydial infections was statistically significant for the YTM period from
January 1 to August 31, 2015 compared to the historical five-year average over the same period (which
was not statistically significant for the month of August as originally indicated); and (2) the cases per
population should read ‘per 1,000,000’ for encephalitis/meningitis (and not ‘per 100,000’, as originally
indicated).
Monthly Infectious Diseases Surveillance Report Page 10 of 14
INFECTIOUS DISEASE ACTIVITY IN OTHER JURISDICTIONS
This section of the report provides a snapshot of current activity related to infectious diseases across
Canada and/or globally. The items included in this section are selected based on ongoing or potential
implications for public health in Ontario.
Current high profile infectious disease activity in other jurisdictions has been described in recent issues
of this report. Please refer to the August 2014 issue for a review of the ebola outbreak in West Africa,
and to the October 2014 issue for a review of enterovirus D68.
Zika virus spread to the Americas
Summary
In May 2015, Brazilian public health officials announced an investigation into outbreaks of a febrile
illness, accompanied by a rash, of unknown etiology in northwestern Brazil. Although these infections
were initially thought to be due to chikungunya or dengue virus, Zika virus (ZIKV) was eventually isolated
from patients and identified as the causative agent. From February to April 2015, Brazil reported over
6,800 locally-acquired ZIKV infections; more recently, Columbia and Suriname have reported ZIKV
infections.2,5
ZIKV is a mosquito-borne virus named for the Zika Forest of Uganda, where it was first isolated from a
rhesus macaque.1 Historically, ZIKV infection was a disease restricted to Sub-Saharan Africa and
southern Asia until 2007, when an outbreak occurred on Yap Island, Micronesia. Since 2013, areas in the
South Pacific such as the Cook Islands, French Polynesia and New Caledonia have reported locally
acquired ZIKV infections.2,3,4 A number of Aedes mosquito species have been implicated in transmission
of ZIKV; however, in South America, the primary vector is considered to be the yellow fever mosquito
Aedes aegypti with potential involvement of the Asian tiger mosquito Aedes albopictus.
Although ZIKV infection is primarily mosquito-borne, rare cases of perinatal and sexual transmission
occur.2 The incubation period of ZIKV is 3 to 12 days, with ZIKV-infected patients displaying fever,
arthralgia, arthritis, maculopapular rash and conjunctivitis.2,3 In rare instances, neurological (especially
Guillain-Barré syndrome) and autoimmune complications have been reported.2 There is no vaccine and
treatment is supportive. ZIKV infection is considered a mild illness that resolves in 2 to 7 days, although
it is estimated that 75% of ZIKV infections are asymptomatic.
Implications
Imported cases of ZIKV infection may occur in Ontario due to returning travelers. However, local
transmission in Ontario is not possible as Aedes aegypti and Aedes albopictus do not occur here and the
province’s Aedes species are not competent vectors for this viral infection.7 In June 2015, the Public
Health Agency of Canada (PHAC) issued a Travel Health Notice for ZIKV infection in Brazil,
recommending that travelers use appropriate personal protective measures against mosquito bites,
such as the use of a DEET-containing repellent, while visiting ZIKV-affected regions.4
Monthly Infectious Diseases Surveillance Report Page 11 of 14
Sources
1. Hayes EB. Zika virus outside Africa. Emerg Infect Dis. 2009;15(9):1347-1350. Available from:
http://wwwnc.cdc.gov/eid/article/15/9/09-0442_article
2. European Centre for Disease Prevention and Control [homepage on the internet]. Stockholm: ECDC.
Rapid risk assessment: Zika virus infection outbreak, Brazil and the Pacific region; 2015 May 25
[cited 2015 Nov 5]. Available from: http://ecdc.europa.eu/en/publications/Publications/rapid-risk-
assessment-Zika%20virus-south-america-Brazil-2015.pdf
3. Pan American Health Organization [Internet]. Washington: PAHO. Epidemiological update: Zika virus
infection; 2015 Oct 26 [cited 2015 Nov 5]. Available from:
http://www.paho.org/hq/index.php?option=com_docman&task=doc_view&Itemid=270&gid=32021
&lang=en
4. Public Health Agency of Canada [Internet]. Winnipeg: PHAC. Travel health notice: Zika virus infection
in Brazil; 2015 Jun 26 [cited 2015 Nov 5]. Available from: http://www.phac-aspc.gc.ca/tmp-
pmv/notices-avis/notices-avis-eng.php?id=143
5. ProMED-mail. Zika virus - Suriname, Cape Verde. ProMED-mail 2015; 6 Nov: 20151106.3770696.
http://www.promedmail.org/post/3770696 Accessed 23 Nov 2015.
6. Fonseca K, Meatherall B, Zarra D, Drebot M, MacDonald J, Pabbaraju K, et al. First case of Zika virus
infection in a returning Canadian traveler. Am J Trop Med Hyg. 2014;91(5):1035-38. Available from:
http://www.ajtmh.org/content/91/5/1035.long
7. Public Health Ontario [Internet]. Toronto: PHO. Monthly Infectious Diseases Surveillance Report;
2013 January [cited 2015 Nov 5]. Available from:
http://www.publichealthontario.ca/en/DataAndAnalytics/Documents/PHO_Monthly_Infectious_Dis
eases_Surveillance_Report_-_January_2014.pdf

Monthly Infectious Diseases Surveillance Report Page 12 of 14
RECENTLY DISCONTINUED ENHANCED SURVEILLANCE DIRECTIVES
Salmonella Newport
On September 4, 2015 an Ontario Outbreak Investigation Coordinating Committee (ON-OICC) was
established by PHO and provincial and federal partners to investigate a cluster of Salmonella Newport
cases with the pulsed-field gel electrophoresis (PFGE) pattern combinations NewpXAI.0497,
NewpBNI.0297 and NewpXAI.0497, NewpBNI.0298. The PFGE pattern combinations of interest are new
to the national laboratory database and represent 0.55% of all Salmonella Newport patterns in the
national database. Eleven outbreak-confirmed cases were reported within Ontario from 8 different
public health units (PHUs): City of Hamilton (2), Toronto (2), Wellington-Dufferin-Guelph (2), Algoma (1),
Niagara Region (1), Peel Region (1), Sudbury (1), and York (1). Episode onset dates for outbreak-
confirmed cases ranged from July 31 to August 20, 2015. Of the 11 outbreak-confirmed cases, 64% were
male, and the age range for all cases was 2 to 60 years (median: 46 years). No hospitalizations or deaths
were reported among all cases. Re-interviews of outbreak-confirmed cases were conducted by PHO
using the single-interviewer approach. Seven cases were reached for re-interview, and although there
was a number of identified risk factors/exposures of interest, there were no commonalities in place of
purchase or product type/brand identified. No further cases were identified during the 16-day window
(calculated by the incubation period for Salmonella infection of three days plus the 75th percentile of the
reporting lag in this investigation of 13 days) from the onset of the last outbreak-confirmed case. Given
that cases interviews and further investigation did not lead to a confirmed etiology for the outbreak and
no further cases were detected, the outbreak was declared over on September 5, 2015; the Enhanced
Surveillance Directive (ESD) was discontinued on October 2, 2015.
Monthly Infectious Diseases Surveillance Report Page 13 of 14
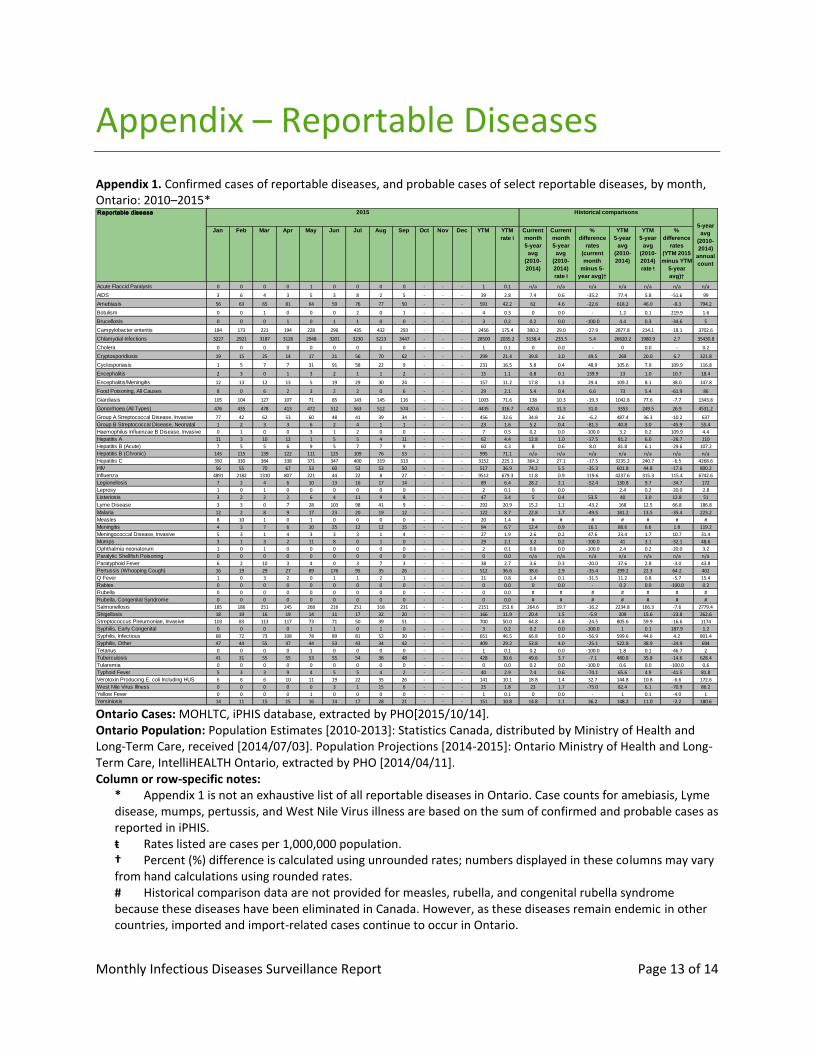
Appendix – Reportable Diseases
Appendix 1. Confirmed cases of reportable diseases, and probable cases of select reportable diseases, by month, Ontario: 2010–2015*
Ontario Cases: MOHLTC, iPHIS database, extracted by PHO[2015/10/14]. Ontario Population: Population Estimates [2010-2013]: Statistics Canada, distributed by Ministry of Health and Long-Term Care, received [2014/07/03]. Population Projections [2014-2015]: Ontario Ministry of Health and Long-Term Care, IntelliHEALTH Ontario, extracted by PHO [2014/04/11]. Column or row-specific notes:
* Appendix 1 is not an exhaustive list of all reportable diseases in Ontario. Case counts for amebiasis, Lyme disease, mumps, pertussis, and West Nile Virus illness are based on the sum of confirmed and probable cases as reported in iPHIS. ŧ Rates listed are cases per 1,000,000 population. † Percent (%) difference is calculated using unrounded rates; numbers displayed in these columns may vary from hand calculations using rounded rates. # Historical comparison data are not provided for measles, rubella, and congenital rubella syndrome because these diseases have been eliminated in Canada. However, as these diseases remain endemic in other countries, imported and import-related cases continue to occur in Ontario.
Jan Feb Mar Apr May Jun Jul Aug Sep Oct Nov Dec YTM YTM
rate ŧ
Current
month
5-year
avg
(2010-
2014)
Current
month
5-year
avg
(2010-
2014)
rate ŧ
%
difference
rates
(current
month
minus 5-
year avg)†
YTM
5-year
avg
(2010-
2014)
YTM
5-year
avg
(2010-
2014)
rate ŧ
%
difference
rates
(YTM 2015
minus YTM
5-year
avg)†
Acute Flaccid Paralysis 0 0 0 0 1 0 0 0 0 - - - 1 0.1 n/a n/a n/a n/a n/a n/a n/a
AIDS 3 6 4 3 5 3 8 2 5 - - - 39 2.8 7.4 0.6 -35.2 77.4 5.8 -51.6 99
Amebiasis 56 63 65 81 64 59 76 77 50 - - - 591 42.2 62 4.6 -22.6 618.2 46.0 -8.3 794.2
Botulism 0 0 1 0 0 0 2 0 1 - - - 4 0.3 0 0.0 - 1.2 0.1 219.9 1.6
Brucellosis 0 0 0 1 0 1 1 0 0 - - - 3 0.2 0.2 0.0 -100.0 4.4 0.3 -34.6 5
Campylobacter enteritis 184 173 221 194 228 296 435 432 293 - - - 2456 175.4 390.2 29.0 -27.9 2877.8 214.1 -18.1 3702.6
Chlamydial Infections 3227 2921 3187 3126 2948 3201 3230 3213 3447 - - - 28500 2035.2 3138.4 233.5 5.4 26620.2 1980.9 2.7 35430.8
Cholera 0 0 0 0 0 0 0 1 0 - - - 1 0.1 0 0.0 - 0 0.0 - 0.2
Cryptosporidiosis 19 15 25 14 17 21 56 70 62 - - - 299 21.4 39.8 3.0 49.5 269 20.0 6.7 321.8
Cyclosporiasis 1 5 7 7 31 91 58 22 9 - - - 231 16.5 5.8 0.4 48.9 105.6 7.9 109.9 116.8
Encephalitis 2 3 0 1 3 2 1 1 2 - - - 15 1.1 0.8 0.1 139.9 13 1.0 10.7 18.4
Encephalitis/Meningitis 12 13 12 13 5 19 29 30 24 - - - 157 11.2 17.8 1.3 29.4 109.2 8.1 38.0 147.8
Food Poisoning, All Causes 8 0 6 2 3 2 2 0 6 - - - 29 2.1 5.4 0.4 6.6 73 5.4 -61.9 86
Giardiasis 105 104 127 107 71 85 143 145 116 - - - 1003 71.6 138 10.3 -19.3 1042.8 77.6 -7.7 1343.8
Gonorrhoea (All Types) 476 435 478 413 472 512 563 512 574 - - - 4435 316.7 420.6 31.3 31.0 3353 249.5 26.9 4531.2
Group A Streptococcal Disease, Invasive 77 42 62 53 60 48 41 39 34 - - - 456 32.6 34.8 2.6 -6.2 487.4 36.3 -10.2 637
Group B Streptococcal Disease, Neonatal 1 2 3 3 6 2 4 1 1 - - - 23 1.6 5.2 0.4 -81.5 40.8 3.0 -45.9 55.4
Haemophilus Influenzae B Disease, Invasive 0 1 0 0 3 1 2 0 0 - - - 7 0.5 0.2 0.0 -100.0 3.2 0.2 109.9 4.4
Hepatitis A 11 3 10 12 1 5 5 4 11 - - - 62 4.4 12.8 1.0 -17.5 81.2 6.0 -26.7 110
Hepatitis B (Acute) 7 5 5 6 9 5 7 7 9 - - - 60 4.3 8 0.6 8.0 81.8 6.1 -29.6 107.2
Hepatitis B (Chronic) 145 115 139 122 111 125 109 76 53 - - - 995 71.1 n/a n/a n/a n/a n/a n/a n/a
Hepatitis C 350 330 384 338 371 347 400 319 313 - - - 3152 225.1 364.2 27.1 -17.5 3235.2 240.7 -6.5 4268.6
HIV 56 55 70 67 53 60 53 53 50 - - - 517 36.9 74.2 5.5 -35.3 601.8 44.8 -17.6 800.2
Influenza 4891 2182 1310 807 221 44 22 8 27 - - - 9512 679.3 11.8 0.9 119.6 4237.6 315.3 115.4 6742.6
Legionellosis 7 2 4 6 10 13 16 17 14 - - - 89 6.4 28.2 2.1 -52.4 130.8 9.7 -34.7 172
Leprosy 1 0 1 0 0 0 0 0 0 - - - 2 0.1 0 0.0 - 2.4 0.2 -20.0 2.8
Listeriosis 3 2 2 2 6 4 11 9 8 - - - 47 3.4 5 0.4 53.5 40 3.0 12.8 51
Lyme Disease 3 3 0 7 28 103 98 41 9 - - - 292 20.9 15.2 1.1 -43.2 168 12.5 66.8 186.8
Malaria 12 2 8 9 17 23 20 19 12 - - - 122 8.7 22.8 1.7 -49.5 181.2 13.5 -35.4 223.2
Measles 8 10 1 0 1 0 0 0 0 - - - 20 1.4 # # # # # # #
Meningitis 4 3 7 6 10 25 12 12 15 - - - 94 6.7 12.4 0.9 16.1 88.6 6.6 1.8 119.2
Meningococcal Disease, Invasive 5 3 1 4 3 3 3 1 4 - - - 27 1.9 2.6 0.2 47.6 23.4 1.7 10.7 31.4
Mumps 3 1 3 2 11 8 0 1 0 - - - 29 2.1 3.2 0.2 -100.0 41 3.1 -32.1 48.6
Ophthalmia neonatorum 1 0 1 0 0 0 0 0 0 - - - 2 0.1 0.6 0.0 -100.0 2.4 0.2 -20.0 3.2
Paralytic Shellfish Poisoning 0 0 0 0 0 0 0 0 0 - - - 0 0.0 n/a n/a n/a n/a n/a n/a n/a
Paratyphoid Fever 6 2 10 3 4 0 3 7 3 - - - 38 2.7 3.6 0.3 -20.0 37.6 2.8 -3.0 43.8
Pertussis (Whooping Cough) 16 19 29 27 89 176 95 35 26 - - - 512 36.6 38.6 2.9 -35.4 299.2 22.3 64.2 402
Q Fever 1 0 3 2 0 1 1 2 1 - - - 11 0.8 1.4 0.1 -31.5 11.2 0.8 -5.7 15.4
Rabies 0 0 0 0 0 0 0 0 0 - - - 0 0.0 0 0.0 - 0.2 0.0 -100.0 0.2
Rubella 0 0 0 0 0 0 0 0 0 - - - 0 0.0 # # # # # # #
Rubella, Congenital Syndrome 0 0 0 0 0 0 0 0 0 - - - 0 0.0 # # # # # # #
Salmonellosis 185 186 251 245 268 216 251 318 231 - - - 2151 153.6 264.6 19.7 -16.2 2234.8 166.3 -7.6 2779.4
Shigellosis 18 19 16 19 14 11 17 32 20 - - - 166 11.9 20.4 1.5 -5.9 209 15.6 -23.8 262.6
Streptococcus Pneumoniae, Invasive 103 83 113 117 73 71 50 39 51 - - - 700 50.0 64.8 4.8 -24.5 805.6 59.9 -16.6 1174
Syphilis, Early Congenital 0 0 0 0 1 1 0 1 0 - - - 3 0.2 0.2 0.0 -100.0 1 0.1 187.9 1.2
Syphilis, Infectious 68 72 73 108 78 89 81 52 30 - - - 651 46.5 66.8 5.0 -56.9 599.6 44.6 4.2 801.4
Syphilis, Other 47 44 55 47 44 53 43 34 42 - - - 409 29.2 53.8 4.0 -25.1 522.8 38.9 -24.9 694
Tetanus 0 0 0 0 1 0 0 0 0 - - - 1 0.1 0.2 0.0 -100.0 1.8 0.1 -46.7 2
Tuberculosis 41 31 55 55 53 55 54 36 48 - - - 428 30.6 49.6 3.7 -7.1 480.8 35.8 -14.6 628.4
Tularemia 0 0 0 0 0 0 0 0 0 - - - 0 0.0 0.2 0.0 -100.0 0.6 0.0 -100.0 0.6
Typhoid Fever 5 3 3 9 4 5 5 4 2 - - - 40 2.9 7.4 0.6 -74.1 65.6 4.9 -41.5 81.8
Verotoxin Producing E. coli Including HUS 6 6 6 10 11 19 22 35 26 - - - 141 10.1 18.8 1.4 32.7 144.8 10.8 -6.6 172.6
West Nile Virus Illness 0 0 0 0 0 3 1 15 6 - - - 25 1.8 23 1.7 -75.0 82.4 6.1 -70.9 86.2
Yellow Fever 0 0 0 0 1 0 0 0 0 - - - 1 0.1 0 0.0 - 1 0.1 -4.0 1
Yersiniosis 14 11 15 15 16 14 17 28 21 - - - 151 10.8 14.8 1.1 36.2 148.2 11.0 -2.2 180.6
Reportable disease 2015 Historical comparisons
5-year
avg
(2010-
2014)
annual
count

Monthly Infectious Diseases Surveillance Report Page 14 of 14
n/a Acute Flaccid Paralysis and Paralytic Shellfish Poisoning became reportable in Ontario in December 2013. No historical data are available for comparisons. Also, a provincial case definition for chronic hepatitis B was released in January 2012. Please note that chronic and acute hepatitis B case counts are not mutually exclusive and should not be added to obtain a total for hepatitis B cases in Ontario. Historical comparisons are not available as cases of chronic hepatitis B may have been entered using varying criteria prior to this time.
Does not include cases for which the Ministry of Health and Long-Term Care was selected as the Diagnosing Health Unit or cases with a Disposition Description set to “DOES NOT MEET” or “ENTERED IN ERROR.”
Differentials in year over year comparisons are reflective of changes in disease incidence and changes in the size of the population.
Statistical tests comparing rates were not performed when the YTM rate in previous years was zero.
Case counts for tuberculosis and AIDS are based on diagnosis date and not episode date. HIV case counts are based on encounter date. Case counts for all other diseases are based on episode date.
Related Documents