1. SERVICE CONNECTION DATA Current Month Year-to-Date 1.1 Total Service 5,393 1.2 Total Active 4,585 1.3 Total Metered 4,585 1.4 Total Billed 4,618 1.5 Total Population Billed 23,090 1.6 Changes: New 30 30 Reconnected 24 24 Disconnected YTD 808 33 33 1.7 Customers in Arrears: 2,674 2. PRESENT WATER RATES: Effective JAN. 1, 2011 LWUA Approved YES / x / NO / / Date Approved: May 26, 2009 Minimum Curr. Mo. Yr. to Date Charge Domestic/Gov't - 4,420 208.00 Commercial/Ind.: ( x 2 ) - 47 416.00 ( x 1.75 ) - 77 364.00 ( x 1.5 ) - 69 312.00 ( x 1.25 ) - 5 260.00 Bulk/Wholesale - 0 624.00 TOTAL 4,618 11-20 21-30 31-40 41-up Domestic/Gov't 23.00 25.50 27.50 29.50 Full Comm. 46.00 51.00 55.00 59.00 Commercial A 40.25 44.60 48.10 51.60 Commercial B 34.50 38.25 41.25 44.25 Commercial C 28.75 31.85 34.35 36.85 Bulk/Wholesale 69.00 76.50 82.50 88.50 3. BILLING & COLLECTION DATA 3.1 BILLINGS (Water Sales) Current Month Year to Date a. Current (Metered) 2,402,162.41 2,402,162.41 b. Arrears (Flat Rate) - - c. Penalty Charges 86,905.57 86,905.57 TOTALS 2,489,067.98 2,489,067.98 3.2 COLLECTION (Water Sales) Current Month Year to Date a. Current Accounts 1,505,255.06 1,505,255.06 b. Arrears(Curr Yr.) 790,859.64 790,859.64 c. Arrears(Prev. Yrs.) 262,217.46 262,217.46 TOTALS 2,558,332.16 2,558,332.16 1 SABLAYAN WATER DISTRICT Sablayan, Occidental Mindoro MONTHLY DATA SHEET For the Month Ending JANUARY 2019 COMMODITY CHARGES No. of Concessionaire P P P P

Welcome message from author
This document is posted to help you gain knowledge. Please leave a comment to let me know what you think about it! Share it to your friends and learn new things together.
Transcript

1. SERVICE CONNECTION DATA
Current Month Year-to-Date
1.1 Total Service 5,393
1.2 Total Active 4,585
1.3 Total Metered 4,585
1.4 Total Billed 4,618
1.5 Total Population Billed 23,090
1.6 Changes:
New 30 30
Reconnected 24 24
Disconnected YTD 808 33 33
1.7 Customers in Arrears: 2,674
2. PRESENT WATER RATES: Effective JAN. 1, 2011
LWUA Approved YES / x / NO / / Date Approved: May 26, 2009
Minimum
Curr. Mo. Yr. to Date Charge
Domestic/Gov't - 4,420 208.00
Commercial/Ind.:
( x 2 ) - 47 416.00
( x 1.75 ) - 77 364.00
( x 1.5 ) - 69 312.00
( x 1.25 ) - 5 260.00
Bulk/Wholesale - 0 624.00
TOTAL 4,618
11-20 21-30 31-40 41-up
Domestic/Gov't 23.00 25.50 27.50 29.50
Full Comm. 46.00 51.00 55.00 59.00
Commercial A 40.25 44.60 48.10 51.60
Commercial B 34.50 38.25 41.25 44.25
Commercial C 28.75 31.85 34.35 36.85
Bulk/Wholesale 69.00 76.50 82.50 88.50
3. BILLING & COLLECTION DATA
3.1 BILLINGS (Water Sales) Current Month Year to Date
a. Current (Metered) 2,402,162.41 2,402,162.41
b. Arrears (Flat Rate) - -
c. Penalty Charges 86,905.57 86,905.57
TOTALS 2,489,067.98 2,489,067.98
3.2 COLLECTION (Water Sales) Current Month Year to Date
a. Current Accounts 1,505,255.06 1,505,255.06
b. Arrears(Curr Yr.) 790,859.64 790,859.64
c. Arrears(Prev. Yrs.) 262,217.46 262,217.46
TOTALS 2,558,332.16 2,558,332.16
1
SABLAYAN WATER DISTRICT
Sablayan, Occidental Mindoro
MONTHLY DATA SHEET
For the Month Ending JANUARY 2019
COMMODITY CHARGES
No. of Concessionaire
P
P
P
P

Current Month Year to Date
3.3 ON-TIME-PAID, THIS MONTH ™
(3.2a/3.1a + 3.1b x 100) 62.66% 62.66%
COLLECTION EFFICIENCY-CM
(3.2a + 3.2b/3.1total x 100) 92.25% 92.25%
COLLECTION RATIO-CM
(3.2 total/3.1 total x 100) 84.88%
+ A/R Ending Bal. Dec. 2018 (P525,158.54)
4. FINANCIAL DATA
4.1 REVENUE Current Month Year to Date
a. Operating 2,867,659.72 2,867,659.72
b. Non-Operating - -
TOTALS 2,867,659.72 2,867,659.72
4.2 EXPENSES Current Month Year to Date
a. Salaries & Wages 714,897.00 714,897.00
b. Fuel, Oil & Electricity 255,795.18 255,795.18
c. Chemicals (equipment) 60,144.00 60,144.00
d. Other O & M Expenses 361,615.26 361,615.26
e. Depreciation Expense 149,916.47 149,916.47
f. Interest Expense 38,940.00 38,940.00
g. Others 673,671.38 673,671.38
TOTALS 2,254,979.29 2,254,979.29
4.3 NET INCOME (LOSS) 612,680.43 612,680.43
Current Month Year to Date
4.4 CASH FLOW REPORT
a. Cash Receipts 3,054,353.05 3,054,353.05
b. Disbursements 3,020,786.27 3,020,786.27
c. Total Receipts (Disb.) 33,566.78 33,566.78
d. Cash Balance-Beginning 1,254,954.00 1,254,954.00
e. Cash Balance-Ending 1,288,520.78 1,288,520.78
4.5 MISCELLANEOUS FINANCIAL DATA
a. Loan Funds (Total) - c. Inventories 2,294,027.24
1. Cash on Hand d. A/R (Net of Allow. For Doubtful) 444,877.18
2. Cash in Bank - e. Customer Deposit Payable 3,760,540.63
b. WD Funds (Total) 7,832,506.79 f. Loans Payable (LWUA & Others) 5,651,734.00
1. Cash Collecting Officer 3,000.00 g. Other Payables -
2. Local Currency on Hand 12,764.12
3. Advances to Officers & Employees 27,140.00
4. Cash in Bank
a. General Fund 508,575.23
b. Guaranty Deposit 744,181.43
Total 1,252,756.66
4. Special Deposit (GD) 3,022,406.74
5. Working Fund 20,000.00
6. Cash Reserves 3,494,439.27
_2_
P
P
P
P
P
P
P
P
P
P
P
P
P
PPP

5. WATER PRODUCTION DATA
TOTAL RATED
5.1 SOURCE OF SUPPLY Curr. Month Year to Date CAPACITY
a. Wells
a.1. Maugong #2 1 1 15 LPS
a.2. Maugong #3 1 1 10 LPS
a.3. Abaca 1 1 20 LPS
a.4. Brgy. Ligaya 1 1 10 LPS
a.5. Brgy. Tuban 1 1 7 LPS
a.6. Alipid 1 1 12 LPS
a.7 Tagumpay 1 1 7 LPS
a.8 GEA 1 1 7 LPS
a. 9 San Francisco 1 1 8 LPS
a.10 Tuburan 1 1 7 LPS
a.11 Sta. Luicia 1 1 2 LPS
TOTALS 11 11 105 LPS
5.2 WATER PRODUCTION Curr. Month Year to Date METHOD OF
a. Pumped MEASUREMENT
a.1 Maugong #2 26,671.888 26,671.888
a.2 Maugong #3 10,759.027 10,759.027 Flow Meter
a.3 Abaca 25,897.966 25,897.966
a.4 Brgy. Ligaya 6,552.301 6,552.301
a.5. Brgy. Tuban 3,555.505 3,555.505
a.6. Alipid 15,780.373 15,780.373
a.7. Tagumpay 1,607.889 1,607.889
a.8 GEA 1,519.928 1,519.928
a. 9 San Francisco 978.387 978.387
a.10 Tuburan 5,357.660 5,357.660
a.11 Sta. Lucia 984.916 984.916
TOTALS 99,665.840 99,665.840
5.3 WATER PRODUCTION Curr. Month Year to Date
5.3.A WATER PRODUCTION COST
a. Total fuel cost for pumping 39,324.76 39,324.76
b. Total chlorine cost 51,854.04 51,854.04
c. Total Power Purchased for Pump 190,443.20 190,443.20
TOTALS 281,622.00 281,622.00
5.3.B. OTHER DATA FOR WATER PRODUCTION:
Curr. Month Year to Date 5.3b1 Pumping Hours
a. Total pumping hours Brgy. Ligaya engine/OMECO 26.13 / 556.61 26.13 / 556.61
b. Total pumping hours Maugong #2 & #3 genset 43.65 / 43.65 43.65 / 43.65
c . Total pumping hours Maugong #3 OMECO 564.78 564.78
d . Total pumping hours Maugong #2 OMECO 569.53 569.53
e . Total pumping hours Abaca genset/OMECO 32.32 / 460.52 32.32 / 460.52
f. Total pumping hours Tuban engine/OMECO 19.60 / 433.78 19.60 / 433.78
g. Total pumping hours Alipid engine/OMECO 21.87 / 596.14 21.87 / 596.14
h. Total pumping hours Tagumpay engine / OMECO 25.55 / 468.45 25.55 / 468.45
i. Total pumping hours GEA Engine / OMECO 16.98 / 464.95 16.98 / 464.95
j. Total pumping hours San Francisco engine / OMECO 32.14 / 461.91 32.14 / 461.91
k. Total pumping hours Tuburan engine / OMECO 12.86 / 229.19 12.86 / 229.19
l. Total pumping hours Sta. Lucia engine / OMECO 26.21 / 471.08 26.21 / 471.08
5.3b2 Chlorine Granules consumed
a. Total chlorine granules consumed (kg.) 20.67 20.67
b. Total chlorine dioxide consumed (liter) - Tuburan PH (TP) 142.5 142.5
5.3b3 Kilowatthour consumed
a. Total kwhr cons. Maugong #3 4,188.39 4,188.39
b. Total kwhr cons. Maugong #2 4,223.61 4,223.61
c. Total kwhr cons. Brgy. Ligaya 1,231 1,231
d.. Total kwhr cons. Abaca 5,938 5,938
e. Total kwhr cons. Tuban 698 698
f. Total kwhr cons. Alipid 3,278 3,278
g. Total kwhr hours Tagumpay 653 653
h. Total kwhr cons. GEA 542 542
i. Total kwhr cons. San Francisco 548 548
j. Total kwhr cons. Tuburan 1,726 1,726
k. Total kwhr cons. Sta. Lucia 589 589
5.4 ACCOUNTED WATER USED (cu. m.) Curr. Month
a. Metered Bill 90,033 90,033
b. Unmetered Bill - -
c. Total Billed (5.4.a + 5.4.b) 90,033 90,033
d. Unmetered unbilled 1279.985 1,279.985
e. Total Accounted (5.4.c+5.4.d) 91,312.985 91,312.985
NUMBER
3
P
P
(cu. meter)
P
PP
PP
PP
PP
PP
PP
PP
PP
PP
PP
PP
PP
PP
PP
PP
PP
PP
PP
PP
PP
PP
PP
PP
PP
PP
PP
PP
PP
PP
PP
PP
PP
PP
PP
PP
PP
PP
PP
PP
PP
PP
PP
PP
PP
PP
PP
PP
PP
PP
PP
PP
PP
PP
PP
PP
PP
PP
PP
PP
PP
PP
PP
PP
PP
PP
PP
PP
PP
PP
PP
PP
PP
PP
PPPPPPPP
PP
PP
PP
PP
PP
PP
PP
PP
PP
PP
PP
PP
PP
PP
PPPPPPPPPPPPPPPPPPPPPPPPPP
PP
PP
PP
PP
PP
PP
PP
PP
PP
PP
PP
PP
PP
PP
PPPPPPPPPPPPPPPPPPPPPPPPPP
PP
PP
PP
PP
PP
PP
PP
PP
PP
PP
PP
PP
PP
PP
PP
PP
PP
PP
PP
PPPPPPPPPPPPPPPPPPPPPPPPPP
PP
PP
PP
PP
PP
PP
PP
PP
PP
PP
PP
PP
PP
PP
PP
PP
PP
PP
PP
PPPPPPPPPPPPPPPPPPPPPPPPPP
PP
PP
PP
PP
PP
PP
PP
PP
PP
PP
PP
PP
PP
PP
PP
PP
PP
PP
PP
PPPPPPPPPPPPPPPPPPPPPPPPPP
PP
PP
PP
PP
PP
PP
PP
PP
PP
PP
PP
PP
PP
PP
PP
PP
PP
PP
PP
PPPPPPPPPPPPPPPPPPPPPPPPPP
PP
PP
PP
PP
PPPPPPPPPPPP

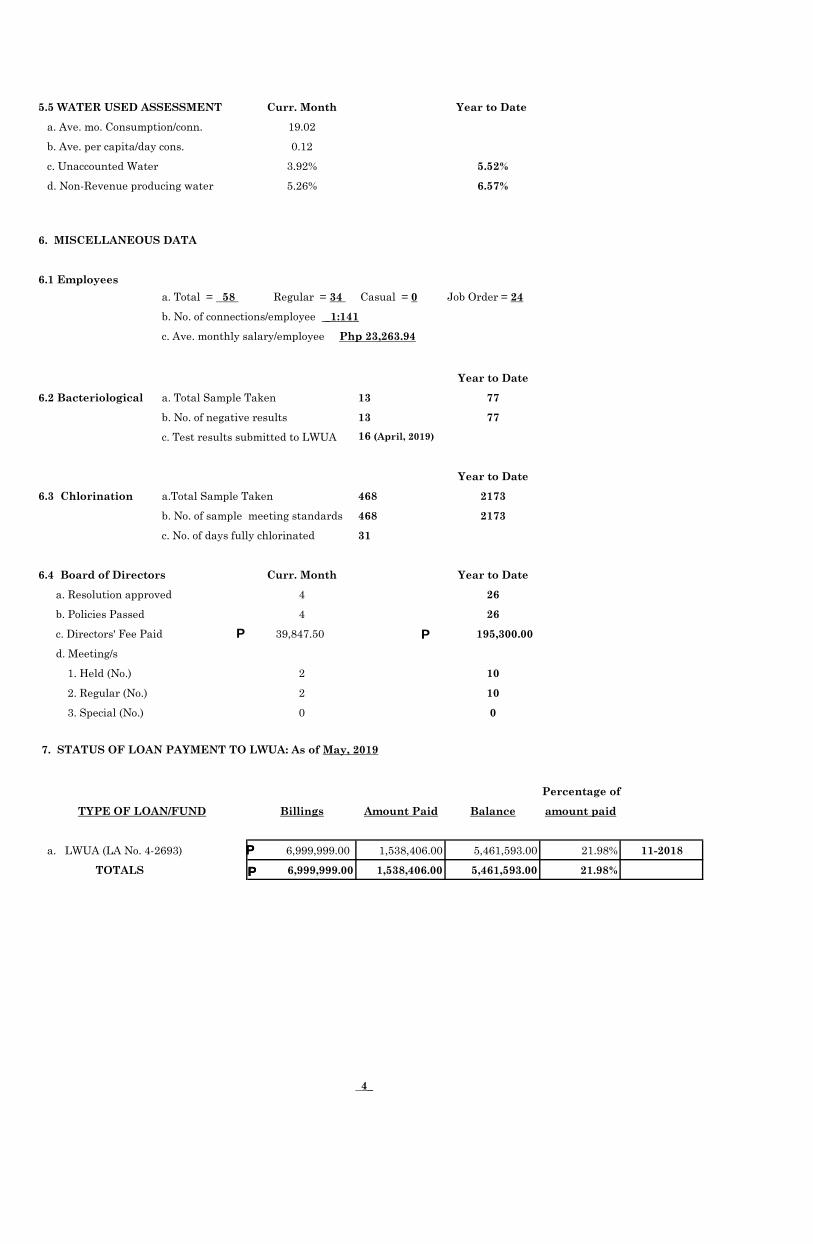
5.5 WATER USED ASSESSMENT Curr. Month Year to Date
a. Ave. mo. Consumption/conn. 19.50
b. Ave. per capita/day cons. 0.13
c. Unaccounted Water 8.38% 8.38%
d. Non-Revenue producing water 9.67% 9.67%
6. MISCELLANEOUS DATA
6.1 Employees
a. Total = 55 Regular = 33 Casual = 0 Job Order = 22
b. No. of connections/employee _1:139
c. Ave. monthly salary/employee Php 21,663.55
Year to Date
6.2 Bacteriological a. Total Sample Taken 16 16
b. No. of negative results 16 16
c. Test results submitted to LWUA
Year to Date
6.3 Chlorination a.Total Sample Taken 366 366
b. No. of sample meeting standards 366 366
c. No. of days fully chlorinated 31 31
6.4 Board of Directors Curr. Month Year to Date
a. Resolution approved 4 4
b. Policies Passed 4 4
c. Directors' Fee Paid 44,572.50 44,572.50
d. Meeting/s
1. Held (No.) 2 2
2. Regular (No.) 2 2
3. Special (No.) 0 0
7. STATUS OF LOAN PAYMENT TO LWUA: As of January, 2019
Percentage of
Billings Amount Paid Balance amount paid
a. LWUA (LA No. 4-2693) 6,999,999.00 1,348,265.00 5,651,734.00 19.26% 11-2018
6,999,999.00 1,348,265.00 5,651,734.00 19.26%
_4_
16 (December, 2018)
TYPE OF LOAN/FUND
TOTALS
P P
P
P
P
P
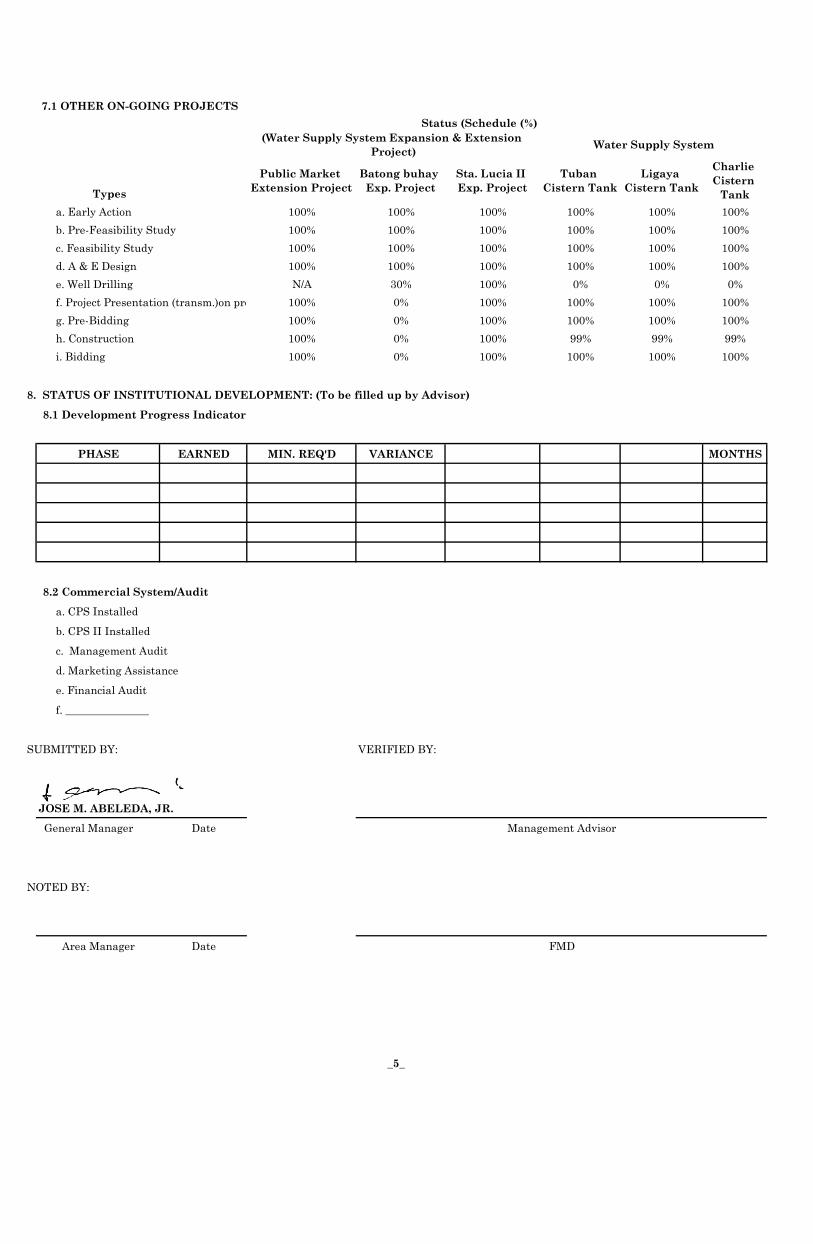
7.1 OTHER ON-GOING PROJECTS
Types
Public Market
Extension Project
Batong buhay
Exp. Project
Sta. Lucia II
Exp. Project
Tuban
Cistern Tank
Ligaya
Cistern Tank
Charlie
Cistern
Tank
a. Early Action 100% 100% 100% 100% 100% 100%
b. Pre-Feasibility Study 100% 100% 100% 100% 100% 100%
c. Feasibility Study 100% 100% 100% 100% 100% 100%
d. A & E Design 100% 100% 100% 100% 100% 100%
e. Well Drilling N/A 30% 100% 0% 0% 0%
f. Project Presentation (transm.)on process 100% 0% 100% 100% 100% 100%
g. Pre-Bidding 100% 0% 100% 100% 100% 100%
h. Construction 100% 0% 100% 99% 99% 99%
i. Bidding 100% 0% 100% 100% 100% 100%
8. STATUS OF INSTITUTIONAL DEVELOPMENT: (To be filled up by Advisor)
8.1 Development Progress Indicator
PHASE EARNED MIN. REQ'D VARIANCE MONTHS
8.2 Commercial System/Audit
a. CPS Installed
b. CPS II Installed
c. Management Audit
d. Marketing Assistance
e. Financial Audit
f. _______________
SUBMITTED BY: VERIFIED BY:
JOSE M. ABELEDA, JR.
General Manager Date
NOTED BY:
Area Manager Date
(Water Supply System Expansion & Extension
Project)Water Supply System
Management Advisor
FMD
_5_
Status (Schedule (%)
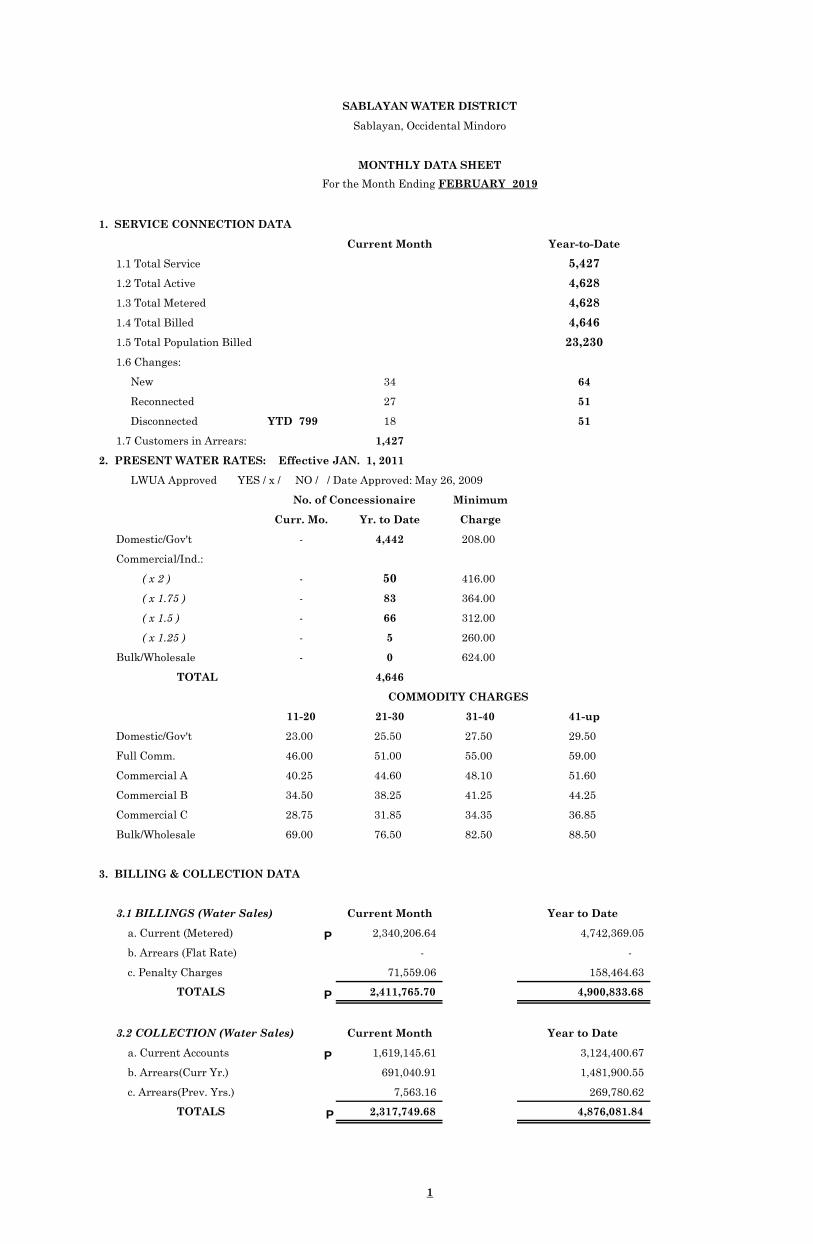
1. SERVICE CONNECTION DATA
Current Month Year-to-Date
1.1 Total Service 5,427
1.2 Total Active 4,628
1.3 Total Metered 4,628
1.4 Total Billed 4,646
1.5 Total Population Billed 23,230
1.6 Changes:
New 34 64
Reconnected 27 51
Disconnected YTD 799 18 51
1.7 Customers in Arrears: 1,427
2. PRESENT WATER RATES: Effective JAN. 1, 2011
LWUA Approved YES / x / NO / / Date Approved: May 26, 2009
Minimum
Curr. Mo. Yr. to Date Charge
Domestic/Gov't - 4,442 208.00
Commercial/Ind.:
( x 2 ) - 50 416.00
( x 1.75 ) - 83 364.00
( x 1.5 ) - 66 312.00
( x 1.25 ) - 5 260.00
Bulk/Wholesale - 0 624.00
TOTAL 4,646
11-20 21-30 31-40 41-up
Domestic/Gov't 23.00 25.50 27.50 29.50
Full Comm. 46.00 51.00 55.00 59.00
Commercial A 40.25 44.60 48.10 51.60
Commercial B 34.50 38.25 41.25 44.25
Commercial C 28.75 31.85 34.35 36.85
Bulk/Wholesale 69.00 76.50 82.50 88.50
3. BILLING & COLLECTION DATA
3.1 BILLINGS (Water Sales) Current Month Year to Date
a. Current (Metered) 2,340,206.64 4,742,369.05
b. Arrears (Flat Rate) - -
c. Penalty Charges 71,559.06 158,464.63
TOTALS 2,411,765.70 4,900,833.68
3.2 COLLECTION (Water Sales) Current Month Year to Date
a. Current Accounts 1,619,145.61 3,124,400.67
b. Arrears(Curr Yr.) 691,040.91 1,481,900.55
c. Arrears(Prev. Yrs.) 7,563.16 269,780.62
TOTALS 2,317,749.68 4,876,081.84
1
SABLAYAN WATER DISTRICT
Sablayan, Occidental Mindoro
MONTHLY DATA SHEET
For the Month Ending FEBRUARY 2019
COMMODITY CHARGES
No. of Concessionaire
P
P
P
P
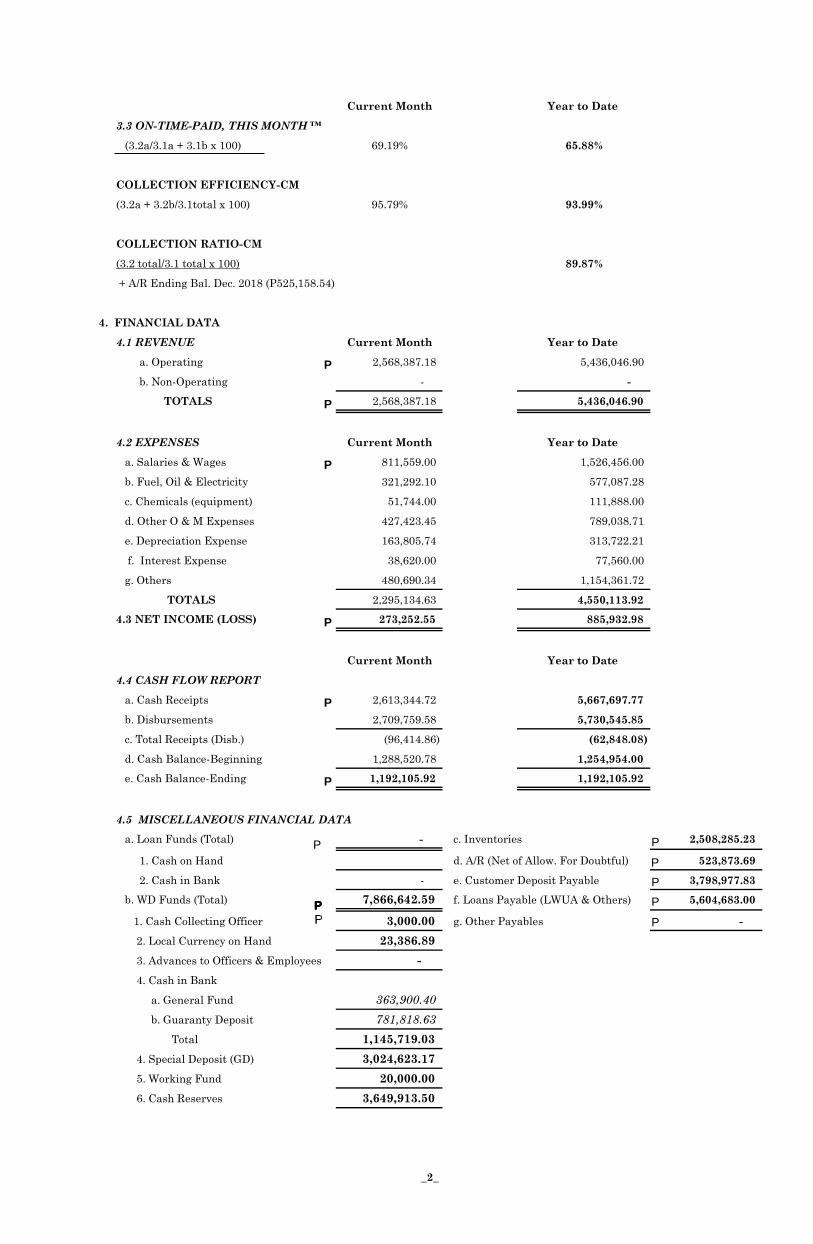
Current Month Year to Date
3.3 ON-TIME-PAID, THIS MONTH ™
(3.2a/3.1a + 3.1b x 100) 69.19% 65.88%
COLLECTION EFFICIENCY-CM
(3.2a + 3.2b/3.1total x 100) 95.79% 93.99%
COLLECTION RATIO-CM
(3.2 total/3.1 total x 100) 89.87%
+ A/R Ending Bal. Dec. 2018 (P525,158.54)
4. FINANCIAL DATA
4.1 REVENUE Current Month Year to Date
a. Operating 2,568,387.18 5,436,046.90
b. Non-Operating - -
TOTALS 2,568,387.18 5,436,046.90
4.2 EXPENSES Current Month Year to Date
a. Salaries & Wages 811,559.00 1,526,456.00
b. Fuel, Oil & Electricity 321,292.10 577,087.28
c. Chemicals (equipment) 51,744.00 111,888.00
d. Other O & M Expenses 427,423.45 789,038.71
e. Depreciation Expense 163,805.74 313,722.21
f. Interest Expense 38,620.00 77,560.00
g. Others 480,690.34 1,154,361.72
TOTALS 2,295,134.63 4,550,113.92
4.3 NET INCOME (LOSS) 273,252.55 885,932.98
Current Month Year to Date
4.4 CASH FLOW REPORT
a. Cash Receipts 2,613,344.72 5,667,697.77
b. Disbursements 2,709,759.58 5,730,545.85
c. Total Receipts (Disb.) (96,414.86) (62,848.08)
d. Cash Balance-Beginning 1,288,520.78 1,254,954.00
e. Cash Balance-Ending 1,192,105.92 1,192,105.92
4.5 MISCELLANEOUS FINANCIAL DATA
a. Loan Funds (Total) - c. Inventories 2,508,285.23
1. Cash on Hand d. A/R (Net of Allow. For Doubtful) 523,873.69
2. Cash in Bank - e. Customer Deposit Payable 3,798,977.83
b. WD Funds (Total) 7,866,642.59 f. Loans Payable (LWUA & Others) 5,604,683.00
1. Cash Collecting Officer 3,000.00 g. Other Payables -
2. Local Currency on Hand 23,386.89
3. Advances to Officers & Employees -
4. Cash in Bank
a. General Fund 363,900.40
b. Guaranty Deposit 781,818.63
Total 1,145,719.03
4. Special Deposit (GD) 3,024,623.17
5. Working Fund 20,000.00
6. Cash Reserves 3,649,913.50
_2_
P
P
P
P
P
P
P
P
P
P
P
P
P
PPP
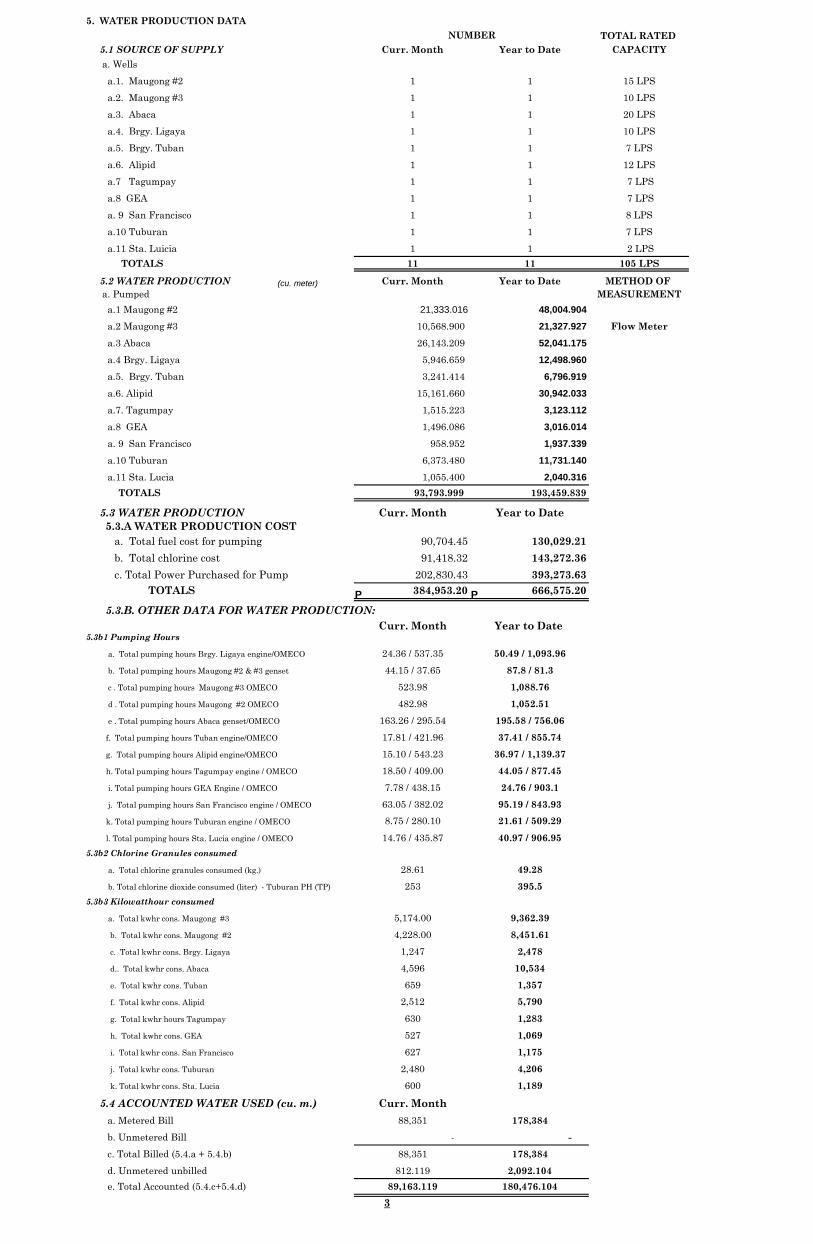
5. WATER PRODUCTION DATA
TOTAL RATED
5.1 SOURCE OF SUPPLY Curr. Month Year to Date CAPACITY
a. Wells
a.1. Maugong #2 1 1 15 LPS
a.2. Maugong #3 1 1 10 LPS
a.3. Abaca 1 1 20 LPS
a.4. Brgy. Ligaya 1 1 10 LPS
a.5. Brgy. Tuban 1 1 7 LPS
a.6. Alipid 1 1 12 LPS
a.7 Tagumpay 1 1 7 LPS
a.8 GEA 1 1 7 LPS
a. 9 San Francisco 1 1 8 LPS
a.10 Tuburan 1 1 7 LPS
a.11 Sta. Luicia 1 1 2 LPS
TOTALS 11 11 105 LPS
5.2 WATER PRODUCTION Curr. Month Year to Date METHOD OF
a. Pumped MEASUREMENT
a.1 Maugong #2 21,333.016 48,004.904
a.2 Maugong #3 10,568.900 21,327.927 Flow Meter
a.3 Abaca 26,143.209 52,041.175
a.4 Brgy. Ligaya 5,946.659 12,498.960
a.5. Brgy. Tuban 3,241.414 6,796.919
a.6. Alipid 15,161.660 30,942.033
a.7. Tagumpay 1,515.223 3,123.112
a.8 GEA 1,496.086 3,016.014
a. 9 San Francisco 958.952 1,937.339
a.10 Tuburan 6,373.480 11,731.140
a.11 Sta. Lucia 1,055.400 2,040.316
TOTALS 93,793.999 193,459.839
5.3 WATER PRODUCTION Curr. Month Year to Date
5.3.A WATER PRODUCTION COST
a. Total fuel cost for pumping 90,704.45 130,029.21
b. Total chlorine cost 91,418.32 143,272.36
c. Total Power Purchased for Pump 202,830.43 393,273.63
TOTALS 384,953.20 666,575.20
5.3.B. OTHER DATA FOR WATER PRODUCTION:
Curr. Month Year to Date 5.3b1 Pumping Hours
a. Total pumping hours Brgy. Ligaya engine/OMECO 24.36 / 537.35 50.49 / 1,093.96
b. Total pumping hours Maugong #2 & #3 genset 44.15 / 37.65 87.8 / 81.3
c . Total pumping hours Maugong #3 OMECO 523.98 1,088.76
d . Total pumping hours Maugong #2 OMECO 482.98 1,052.51
e . Total pumping hours Abaca genset/OMECO 163.26 / 295.54 195.58 / 756.06
f. Total pumping hours Tuban engine/OMECO 17.81 / 421.96 37.41 / 855.74
g. Total pumping hours Alipid engine/OMECO 15.10 / 543.23 36.97 / 1,139.37
h. Total pumping hours Tagumpay engine / OMECO 18.50 / 409.00 44.05 / 877.45
i. Total pumping hours GEA Engine / OMECO 7.78 / 438.15 24.76 / 903.1
j. Total pumping hours San Francisco engine / OMECO 63.05 / 382.02 95.19 / 843.93
k. Total pumping hours Tuburan engine / OMECO 8.75 / 280.10 21.61 / 509.29
l. Total pumping hours Sta. Lucia engine / OMECO 14.76 / 435.87 40.97 / 906.95
5.3b2 Chlorine Granules consumed
a. Total chlorine granules consumed (kg.) 28.61 49.28
b. Total chlorine dioxide consumed (liter) - Tuburan PH (TP) 253 395.5
5.3b3 Kilowatthour consumed
a. Total kwhr cons. Maugong #3 5,174.00 9,362.39
b. Total kwhr cons. Maugong #2 4,228.00 8,451.61
c. Total kwhr cons. Brgy. Ligaya 1,247 2,478
d.. Total kwhr cons. Abaca 4,596 10,534
e. Total kwhr cons. Tuban 659 1,357
f. Total kwhr cons. Alipid 2,512 5,790
g. Total kwhr hours Tagumpay 630 1,283
h. Total kwhr cons. GEA 527 1,069
i. Total kwhr cons. San Francisco 627 1,175
j. Total kwhr cons. Tuburan 2,480 4,206
k. Total kwhr cons. Sta. Lucia 600 1,189
5.4 ACCOUNTED WATER USED (cu. m.) Curr. Month
a. Metered Bill 88,351 178,384
b. Unmetered Bill - -
c. Total Billed (5.4.a + 5.4.b) 88,351 178,384
d. Unmetered unbilled 812.119 2,092.104
e. Total Accounted (5.4.c+5.4.d) 89,163.119 180,476.104
NUMBER
3
P
P
(cu. meter)
P
PP
PP
PP
PP
PP
PP
PP
PP
PP
PP
PP
PP
PP
PP
PP
PP
PP
PP
PP
PP
PP
PP
PP
PP
PP
PP
PP
PP
PP
PP
PP
PP
PP
PP
PP
PP
PP
PP
PP
PP
PP
PP
PP
PP
PP
PP
PP
PP
PP
PP
PP
PP
PP
PP
PP
PP
PP
PP
PP
PP
PP
PP
PP
PP
PP
PP
PP
PP
PP
PP
PP
PP
PP
PPPPPPPP
PP
PP
PP
PP
PP
PP
PP
PP
PP
PP
PP
PP
PP
PP
PPPPPPPPPPPPPPPPPPPPPPPPPP
PP
PP
PP
PP
PP
PP
PP
PP
PP
PP
PP
PP
PP
PP
PPPPPPPPPPPPPPPPPPPPPPPPPP
PP
PP
PP
PP
PP
PP
PP
PP
PP
PP
PP
PP
PP
PP
PP
PP
PP
PP
PP
PPPPPPPPPPPPPPPPPPPPPPPPPP
PP
PP
PP
PP
PP
PP
PP
PP
PP
PP
PP
PP
PP
PP
PP
PP
PP
PP
PP
PPPPPPPPPPPPPPPPPPPPPPPPPP
PP
PP
PP
PP
PP
PP
PP
PP
PP
PP
PP
PP
PP
PP
PP
PP
PP
PP
PP
PPPPPPPPPPPPPPPPPPPPPPPPPP
PP
PP
PP
PP
PP
PP
PP
PP
PP
PP
PP
PP
PP
PP
PP
PP
PP
PP
PP
PPPPPPPPPPPPPPPPPPPPPPPPPP
PP
PP
PP
PP
PPPPPPPPPPPP

5.5 WATER USED ASSESSMENT Curr. Month Year to Date
a. Ave. mo. Consumption/conn. 19.02
b. Ave. per capita/day cons. .014
c. Unaccounted Water 4.94% 6.71%
d. Non-Revenue producing water 5.80% 7.79%
6. MISCELLANEOUS DATA
6.1 Employees
a. Total = 55 Regular = 33 Casual = 0 Job Order = 22
b. No. of connections/employee _1:140
c. Ave. monthly salary/employee Php 24,592.70
Year to Date
6.2 Bacteriological a. Total Sample Taken 16 32
b. No. of negative results 16 32
c. Test results submitted to LWUA
Year to Date
6.3 Chlorination a.Total Sample Taken 411 777
b. No. of sample meeting standards 411 777
c. No. of days fully chlorinated 28
6.4 Board of Directors Curr. Month Year to Date
a. Resolution approved 8 12
b. Policies Passed 8 12
c. Directors' Fee Paid 35,122.50 79,695.00
d. Meeting/s
1. Held (No.) 2 4
2. Regular (No.) 2 4
3. Special (No.) 0 0
7. STATUS OF LOAN PAYMENT TO LWUA: As of February, 2019
Percentage of
Billings Amount Paid Balance amount paid
a. LWUA (LA No. 4-2693) 6,999,999.00 1,395,316.00 5,604,683.00 19.93% 11-2018
6,999,999.00 1,395,316.00 5,604,683.00 19.93%
_4_
16 (January, 2019)
TYPE OF LOAN/FUND
TOTALS
P P
P
P
P
P
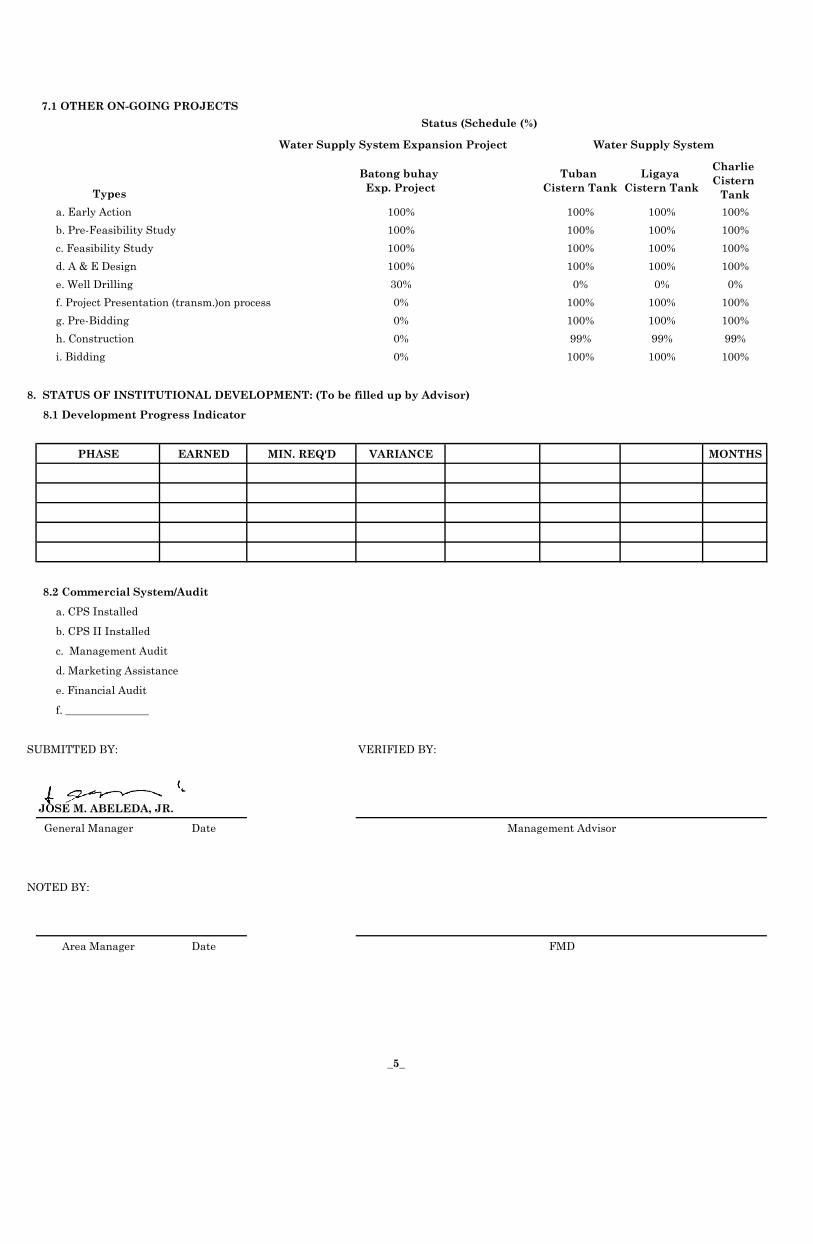
7.1 OTHER ON-GOING PROJECTS
Types
Batong buhay
Exp. Project
Tuban
Cistern Tank
Ligaya
Cistern Tank
Charlie
Cistern
Tank
a. Early Action 100% 100% 100% 100%
b. Pre-Feasibility Study 100% 100% 100% 100%
c. Feasibility Study 100% 100% 100% 100%
d. A & E Design 100% 100% 100% 100%
e. Well Drilling 30% 0% 0% 0%
f. Project Presentation (transm.)on process 0% 100% 100% 100%
g. Pre-Bidding 0% 100% 100% 100%
h. Construction 0% 99% 99% 99%
i. Bidding 0% 100% 100% 100%
8. STATUS OF INSTITUTIONAL DEVELOPMENT: (To be filled up by Advisor)
8.1 Development Progress Indicator
PHASE EARNED MIN. REQ'D VARIANCE MONTHS
8.2 Commercial System/Audit
a. CPS Installed
b. CPS II Installed
c. Management Audit
d. Marketing Assistance
e. Financial Audit
f. _______________
SUBMITTED BY: VERIFIED BY:
JOSE M. ABELEDA, JR.
General Manager Date
NOTED BY:
Area Manager Date
Water Supply System Expansion Project Water Supply System
Management Advisor
FMD
_5_
Status (Schedule (%)

1. SERVICE CONNECTION DATA
Current Month Year-to-Date
1.1 Total Service 5,481
1.2 Total Active 4,687
1.3 Total Metered 4,687
1.4 Total Billed 4,712
1.5 Total Population Billed 23,560
1.6 Changes:
New 54 118
Reconnected 30 81
Disconnected YTD 794 25 76
1.7 Customers in Arrears: 1,578
2. PRESENT WATER RATES: Effective JAN. 1, 2011
LWUA Approved YES / x / NO / / Date Approved: May 26, 2009
Minimum
Curr. Mo. Yr. to Date Charge
Domestic/Gov't - 4,430 208.00
Commercial/Ind.:
( x 2 ) - 66 416.00
( x 1.75 ) - 116 364.00
( x 1.5 ) - 95 312.00
( x 1.25 ) - 5 260.00
Bulk/Wholesale - 0 624.00
TOTAL 4,712
11-20 21-30 31-40 41-up
Domestic/Gov't 23.00 25.50 27.50 29.50
Full Comm. 46.00 51.00 55.00 59.00
Commercial A 40.25 44.60 48.10 51.60
Commercial B 34.50 38.25 41.25 44.25
Commercial C 28.75 31.85 34.35 36.85
Bulk/Wholesale 69.00 76.50 82.50 88.50
3. BILLING & COLLECTION DATA
3.1 BILLINGS (Water Sales) Current Month Year to Date
a. Current (Metered) 2,304,426.57 7,046,795.62
b. Arrears (Flat Rate) - -
c. Penalty Charges 70,865.42 229,330.05
TOTALS 2,375,291.99 7,276,125.67
3.2 COLLECTION (Water Sales) Current Month Year to Date
a. Current Accounts 1,572,038.43 4,696,439.10
b. Arrears(Curr Yr.) 880,799.53 2,362,700.08
c. Arrears(Prev. Yrs.) 5,687.20 275,467.82
TOTALS 2,458,525.16 7,334,607.00
1
SABLAYAN WATER DISTRICT
Sablayan, Occidental Mindoro
MONTHLY DATA SHEET
For the Month Ending MARCH 2019
COMMODITY CHARGES
No. of Concessionaire
P
P
P
P

Current Month Year to Date
3.3 ON-TIME-PAID, THIS MONTH ™
(3.2a/3.1a + 3.1b x 100) 68.22% 66.65%
COLLECTION EFFICIENCY-CM
(3.2a + 3.2b/3.1total x 100) 103.26% 97.02%
COLLECTION RATIO-CM
(3.2 total/3.1 total x 100) 94.02%
+ A/R Ending Bal. Dec. 2018 (P525,158.54)
4. FINANCIAL DATA
4.1 REVENUE Current Month Year to Date
a. Operating 2,565,739.72 8,001,786.62
b. Non-Operating - -
TOTALS 2,565,739.72 8,001,786.62
4.2 EXPENSES Current Month Year to Date
a. Salaries & Wages 777,760.00 2,304,216.00
b. Fuel, Oil & Electricity 368,059.48 945,146.76
c. Chemicals (equipment) 81,107.50 192,995.50
d. Other O & M Expenses 348,188.56 1,137,227.27
e. Depreciation Expense 137,197.74 450,919.95
f. Interest Expense 38,299.00 115,859.00
g. Others 617,495.57 1,771,857.29
TOTALS 2,368,107.85 6,918,221.77
4.3 NET INCOME (LOSS) 197,631.87 1,083,564.85
Current Month Year to Date
4.4 CASH FLOW REPORT
a. Cash Receipts 2,796,262.03 8,463,959.80
b. Disbursements 2,911,009.37 8,641,555.22
c. Total Receipts (Disb.) (114,747.34) (177,595.42)
d. Cash Balance-Beginning 1,192,105.92 1,254,954.00
e. Cash Balance-Ending 1,077,358.58 1,077,358.58
4.5 MISCELLANEOUS FINANCIAL DATA
a. Loan Funds (Total) - c. Inventories 2,106,469.79
1. Cash on Hand d. A/R (Net of Allow. For Doubtful) 428,333.16
2. Cash in Bank - e. Customer Deposit Payable 3,845,860.69
b. WD Funds (Total) 7,754,613.56 f. Loans Payable (LWUA & Others) 5,557,311.00
1. Cash Collecting Officer 3,000.00 g. Other Payables -
2. Local Currency on Hand 4,760.60
3. Advances to Officers & Employees -
4. Cash in Bank
a. General Fund 220,007.46
b. Guaranty Deposit 829,590.52
Total 1,049,597.98
4. Special Deposit (GD) 3,026,639.59
5. Working Fund 20,000.00
6. Cash Reserves 3,650,615.39
_2_
P
P
P
P
P
P
P
P
P
P
P
P
P
PPP

5. WATER PRODUCTION DATA
TOTAL RATED
5.1 SOURCE OF SUPPLY Curr. Month Year to Date CAPACITY
a. Wells
a.1. Maugong #2 1 1 15 LPS
a.2. Maugong #3 1 1 10 LPS
a.3. Abaca 1 1 20 LPS
a.4. Brgy. Ligaya 1 1 10 LPS
a.5. Brgy. Tuban 1 1 7 LPS
a.6. Alipid 1 1 12 LPS
a.7 Tagumpay 1 1 7 LPS
a.8 GEA 1 1 7 LPS
a. 9 San Francisco 1 1 8 LPS
a.10 Tuburan 1 1 7 LPS
a.11 Sta. Luicia 1 1 2 LPS
TOTALS 11 11 105 LPS
5.2 WATER PRODUCTION Curr. Month Year to Date METHOD OF
a. Pumped MEASUREMENT
a.1 Maugong #2 22,114.840 70,119.744
a.2 Maugong #3 11,594.110 32,922.037 Flow Meter
a.3 Abaca 30,630.311 82,671.486
a.4 Brgy. Ligaya 7,033.975 19,532.935
a.5. Brgy. Tuban 3,312.240 10,109.159
a.6. Alipid 16,854.730 47,796.763
a.7. Tagumpay 1,812.879 4,935.991
a.8 GEA 1,817.761 4,833.775
a. 9 San Francisco 1,101.124 3,038.463
a.10 Tuburan 5,358.030 17,089.170
a.11 Sta. Lucia 1,379.398 3,419.714
TOTALS 103,009.398 296,469.237
5.3 WATER PRODUCTION Curr. Month Year to Date
5.3.A WATER PRODUCTION COST
a. Total fuel cost for pumping 148,452.64 278,481.85
b. Total chlorine cost 49,248.36 192,520.72
c. Total Power Purchased for Pump 138,477.33 531,750.96
TOTALS 336,178.33 1,002,753.53
5.3.B. OTHER DATA FOR WATER PRODUCTION:
Curr. Month Year to Date 5.3b1 Pumping Hours
a. Total pumping hours Brgy. Ligaya engine/OMECO 14.04 / 663.88 64.53 / 1,757.84
b. Total pumping hours Maugong #2 & #3 genset 10.32 / 10.32 98.12 / 91.62
c . Total pumping hours Maugong #3 OMECO 628.92 1,717.68
d . Total pumping hours Maugong #2 OMECO 560.47 1,612.98
e . Total pumping hours Abaca genset/OMECO 346.28 / 79.42 541.86 / 835.48
f. Total pumping hours Tuban engine/OMECO 7.23 / 578.30 44.64 / 1,434.04
g. Total pumping hours Alipid engine/OMECO 8.93 / 610.25 45.9 / 1,749.62
h. Total pumping hours Tagumpay engine / OMECO 12.90 / 481.95 45.95 / 1,359.4
i. Total pumping hours GEA Engine / OMECO 7.89 / 483.65 32.65 / 1,386.75
j. Total pumping hours San Francisco engine / OMECO 103.29 / 389.72 198.48 / 1,233.65
k. Total pumping hours Tuburan engine / OMECO 66.20 / 186.08 87.81 / 695.37
l. Total pumping hours Sta. Lucia engine / OMECO 16.06 / 478.43 57.03 / 1,385.38
5.3b2 Chlorine Granules consumed
a. Total chlorine granules consumed (kg.) 38.03 87.31
b. Total chlorine dioxide consumed (liter) - Tuburan PH (TP) 129.5 525
5.3b3 Kilowatthour consumed
a. Total kwhr cons. Maugong #3 3,846.31 13,208.70
b. Total kwhr cons. Maugong #2 3,428 11,879.61
c. Total kwhr cons. Brgy. Ligaya 1,183 3,661
d.. Total kwhr cons. Abaca 1,480 12,014
e. Total kwhr cons. Tuban 838 2,195
f. Total kwhr cons. Alipid 2,988 8,778
g. Total kwhr hours Tagumpay 594 1,877
h. Total kwhr cons. GEA 512 1,581
i. Total kwhr cons. San Francisco 397 1,572
j. Total kwhr cons. Tuburan 1,434 5,640
k. Total kwhr cons. Sta. Lucia 611 1,800
5.4 ACCOUNTED WATER USED (cu. m.) Curr. Month
a. Metered Bill 96,364 274,748
b. Unmetered Bill - -
c. Total Billed (5.4.a + 5.4.b) 96,364 274,748
d. Unmetered unbilled 836.889 2,928.993
e. Total Accounted (5.4.c+5.4.d) 97,200.889 277,676.993
NUMBER
3
P
P
(cu. meter)
P
PP
PP
PP
PP
PP
PP
PP
PP
PP
PP
PP
PP
PP
PP
PP
PP
PP
PP
PP
PP
PP
PP
PP
PP
PP
PP
PP
PP
PP
PP
PP
PP
PP
PP
PP
PP
PP
PP
PP
PP
PP
PP
PP
PP
PP
PP
PP
PP
PP
PP
PP
PP
PP
PP
PP
PP
PP
PP
PP
PP
PP
PP
PP
PP
PP
PP
PP
PP
PP
PP
PP
PP
PP
PPPPPPPP
PP
PP
PP
PP
PP
PP
PP
PP
PP
PP
PP
PP
PP
PP
PPPPPPPPPPPPPPPPPPPPPPPPPP
PP
PP
PP
PP
PP
PP
PP
PP
PP
PP
PP
PP
PP
PP
PPPPPPPPPPPPPPPPPPPPPPPPPP
PP
PP
PP
PP
PP
PP
PP
PP
PP
PP
PP
PP
PP
PP
PP
PP
PP
PP
PP
PPPPPPPPPPPPPPPPPPPPPPPPPP
PP
PP
PP
PP
PP
PP
PP
PP
PP
PP
PP
PP
PP
PP
PP
PP
PP
PP
PP
PPPPPPPPPPPPPPPPPPPPPPPPPP
PP
PP
PP
PP
PP
PP
PP
PP
PP
PP
PP
PP
PP
PP
PP
PP
PP
PP
PP
PPPPPPPPPPPPPPPPPPPPPPPPPP
PP
PP
PP
PP
PP
PP
PP
PP
PP
PP
PP
PP
PP
PP
PP
PP
PP
PP
PP
PPPPPPPPPPPPPPPPPPPPPPPPPP
PP
PP
PP
PP
PPPPPPPPPPPP

5.5 WATER USED ASSESSMENT Curr. Month Year to Date
a. Ave. mo. Consumption/conn. 20.45
b. Ave. per capita/day cons. 0.13
c. Unaccounted Water 5.64% 6.34%
d. Non-Revenue producing water 6.45% 7.33%
6. MISCELLANEOUS DATA
6.1 Employees
a. Total = 54 Regular = 34 Casual = 0 Job Order = 20
b. No. of connections/employee _1:138
c. Ave. monthly salary/employee Php 22,875.29
Year to Date
6.2 Bacteriological a. Total Sample Taken 16 48
b. No. of negative results 16 48
c. Test results submitted to LWUA
Year to Date
6.3 Chlorination a.Total Sample Taken 472 1249
b. No. of sample meeting standards 472 1249
c. No. of days fully chlorinated 31
6.4 Board of Directors Curr. Month Year to Date
a. Resolution approved 9 21
b. Policies Passed 9 21
c. Directors' Fee Paid 32,760.00 112,455.00
d. Meeting/s
1. Held (No.) 2 6
2. Regular (No.) 2 6
3. Special (No.) 0 0
7. STATUS OF LOAN PAYMENT TO LWUA: As of March, 2019
Percentage of
Billings Amount Paid Balance amount paid
a. LWUA (LA No. 4-2693) 6,999,999.00 1,442,688.00 5,557,311.00 20.61% 11-2018
6,999,999.00 1,442,688.00 5,557,311.00 20.61%
_4_
16 (February, 2019)
TYPE OF LOAN/FUND
TOTALS
P P
P
P
P
P
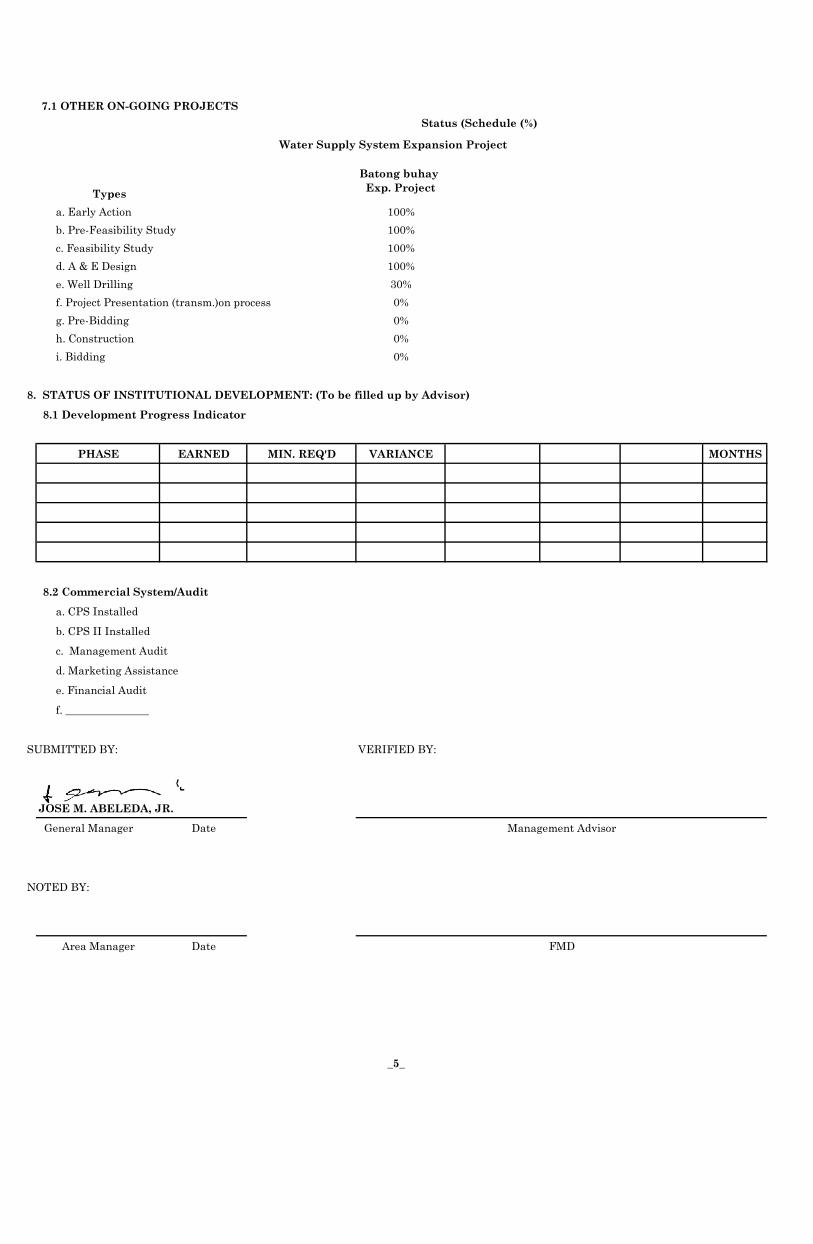
7.1 OTHER ON-GOING PROJECTS
Types
Batong buhay
Exp. Project
a. Early Action 100%
b. Pre-Feasibility Study 100%
c. Feasibility Study 100%
d. A & E Design 100%
e. Well Drilling 30%
f. Project Presentation (transm.)on process 0%
g. Pre-Bidding 0%
h. Construction 0%
i. Bidding 0%
8. STATUS OF INSTITUTIONAL DEVELOPMENT: (To be filled up by Advisor)
8.1 Development Progress Indicator
PHASE EARNED MIN. REQ'D VARIANCE MONTHS
8.2 Commercial System/Audit
a. CPS Installed
b. CPS II Installed
c. Management Audit
d. Marketing Assistance
e. Financial Audit
f. _______________
SUBMITTED BY: VERIFIED BY:
JOSE M. ABELEDA, JR.
General Manager Date
NOTED BY:
Area Manager Date
Status (Schedule (%)
Water Supply System Expansion Project
Management Advisor
FMD
_5_

1. SERVICE CONNECTION DATA
Current Month Year-to-Date
1.1 Total Service 5,545
1.2 Total Active 4,747
1.3 Total Metered 4,747
1.4 Total Billed 4,780
1.5 Total Population Billed 23,900
1.6 Changes:
New 64 182
Reconnected 29 110
Disconnected YTD 798 33 109
1.7 Customers in Arrears: 1,767
2. PRESENT WATER RATES: Effective JAN. 1, 2011
LWUA Approved YES / x / NO / / Date Approved: May 26, 2009
Minimum
Curr. Mo. Yr. to Date Charge
Domestic/Gov't - 4,499 208.00
Commercial/Ind.:
( x 2 ) - 63 416.00
( x 1.75 ) - 119 364.00
( x 1.5 ) - 94 312.00
( x 1.25 ) - 5 260.00
Bulk/Wholesale - 0 624.00
TOTAL 4,780
11-20 21-30 31-40 41-up
Domestic/Gov't 23.00 25.50 27.50 29.50
Full Comm. 46.00 51.00 55.00 59.00
Commercial A 40.25 44.60 48.10 51.60
Commercial B 34.50 38.25 41.25 44.25
Commercial C 28.75 31.85 34.35 36.85
Bulk/Wholesale 69.00 76.50 82.50 88.50
3. BILLING & COLLECTION DATA
3.1 BILLINGS (Water Sales) Current Month Year to Date
a. Current (Metered) 2,550,841.12 9,597,636.74
b. Arrears (Flat Rate) - -
c. Penalty Charges 88,201.46 317,531.51
TOTALS 2,639,042.58 9,915,168.25
3.2 COLLECTION (Water Sales) Current Month Year to Date
a. Current Accounts 1,240,567.70 5,937,006.80
b. Arrears(Curr Yr.) 1,309,670.61 3,672,370.69
c. Arrears(Prev. Yrs.) 14,801.67 290,269.49
TOTALS 2,565,039.98 9,899,646.98
1
SABLAYAN WATER DISTRICT
Sablayan, Occidental Mindoro
MONTHLY DATA SHEET
For the Month Ending APRIL 2019
COMMODITY CHARGES
No. of Concessionaire
P
P
P
P

Current Month Year to Date
3.3 ON-TIME-PAID, THIS MONTH ™
(3.2a/3.1a + 3.1b x 100) 48.63% 61.86%
COLLECTION EFFICIENCY-CM
(3.2a + 3.2b/3.1total x 100) 96.63% 96.92%
COLLECTION RATIO-CM
(3.2 total/3.1 total x 100) 94.82%
+ A/R Ending Bal. Dec. 2018 (P525,158.54)
4. FINANCIAL DATA
4.1 REVENUE Current Month Year to Date
a. Operating 2,797,368.70 10,799,155.32
b. Non-Operating - -
TOTALS 2,797,368.70 10,799,155.32
4.2 EXPENSES Current Month Year to Date
a. Salaries & Wages 793,957.81 3,098,173.81
b. Fuel, Oil & Electricity 289,307.06 1,234,453.82
c. Chemicals (equipment) 80,424.00 273,419.50
d. Other O & M Expenses 408,543.23 1,545,770.50
e. Depreciation Expense 149,782.67 600,702.62
f. Interest Expense 37,975.00 153,834.00
g. Others 795,245.06 2,567,102.35
TOTALS 2,555,234.83 9,473,456.60
4.3 NET INCOME (LOSS) 242,133.87 1,325,698.72
Current Month Year to Date
4.4 CASH FLOW REPORT
a. Cash Receipts 2,946,834.20 11,410,794.00
b. Disbursements 2,946,122.95 11,587,678.17
c. Total Receipts (Disb.) 711.25 (176,884.17)
d. Cash Balance-Beginning 1,077,358.58 1,254,954.00
e. Cash Balance-Ending 1,078,069.83 1,078,069.83
4.5 MISCELLANEOUS FINANCIAL DATA
a. Loan Funds (Total) - c. Inventories 2,165,896.94
1. Cash on Hand d. A/R (Net of Allow. For Doubtful) 490,828.02
2. Cash in Bank - e. Customer Deposit Payable 3,937,342.19
b. WD Funds (Total) 7,903,838.63 f. Loans Payable (LWUA & Others) 5,509,615.00
1. Cash Collecting Officer 3,000.00 g. Other Payables -
2. Local Currency on Hand 20,769.00
3. Advances to Officers & Employees -
4. Cash in Bank
a. General Fund 118,428.81
b. Guaranty Deposit 915,872.02
Total 1,034,300.83
4. Special Deposit (GD) 3,028,657.35
5. Working Fund 20,000.00
6. Cash Reserves 3,797,111.45
_2_
P
P
P
P
P
P
P
P
P
P
P
P
P
PPP

5. WATER PRODUCTION DATA
TOTAL RATED
5.1 SOURCE OF SUPPLY Curr. Month Year to Date CAPACITY
a. Wells
a.1. Maugong #2 1 1 15 LPS
a.2. Maugong #3 1 1 10 LPS
a.3. Abaca 1 1 20 LPS
a.4. Brgy. Ligaya 1 1 10 LPS
a.5. Brgy. Tuban 1 1 7 LPS
a.6. Alipid 1 1 12 LPS
a.7 Tagumpay 1 1 7 LPS
a.8 GEA 1 1 7 LPS
a. 9 San Francisco 1 1 8 LPS
a.10 Tuburan 1 1 7 LPS
a.11 Sta. Luicia 1 1 2 LPS
TOTALS 11 11 105 LPS
5.2 WATER PRODUCTION Curr. Month Year to Date METHOD OF
a. Pumped MEASUREMENT
a.1 Maugong #2 20,927.123 91,046.867
a.2 Maugong #3 12,631.910 45,553.947 Flow Meter
a.3 Abaca 26,416.410 109,087.896
a.4 Brgy. Ligaya 6,920.905 26,453.840
a.5. Brgy. Tuban 5,064.694 15,173.853
a.6. Alipid 16,742.556 64,539.319
a.7. Tagumpay 1,670.702 6,606.693
a.8 GEA 1,972.700 6,806.475
a. 9 San Francisco 1,092.642 4,131.105
a.10 Tuburan 4,650.400 21,739.570
a.11 Sta. Lucia 1,282.209 4,701.923
TOTALS 99,372.251 395,841.488
5.3 WATER PRODUCTION Curr. Month Year to Date
5.3.A WATER PRODUCTION COST
a. Total fuel cost for pumping 80,005.25 358,487.10
b. Total chlorine cost 67,713.80 260,234.52
c. Total Power Purchased for Pump 188,625.36 720,376.32
TOTALS 336,344.41 1,339,097.94
5.3.B. OTHER DATA FOR WATER PRODUCTION:
Curr. Month Year to Date 5.3b1 Pumping Hours
a. Total pumping hours Brgy. Ligaya engine/OMECO 39.43 / 620.62 103.96 / 2,378.46
b. Total pumping hours Maugong #2 & #3 genset 11.42 / 11.42 109.54 / 103.04
c . Total pumping hours Maugong #3 OMECO 672.44 2,390.12
d . Total pumping hours Maugong #2 OMECO 600.86 2,213.84
e . Total pumping hours Abaca genset/OMECO 86.45 / 354.90 628.31 / 1,190.38
f. Total pumping hours Tuban engine/OMECO 24.55 / 445.79 69.19 / 1,879.83
g. Total pumping hours Alipid engine/OMECO 9.03 / 590.06 54.93 / 2,339.68
h. Total pumping hours Tagumpay engine / OMECO 12.56 / 463.50 58.51 / 1,822.9
i. Total pumping hours GEA Engine / OMECO 22.55 / 455.72 55.2 / 1,842.47
j. Total pumping hours San Francisco engine / OMECO 25.85 / 436.55 224.33 / 1,670.2
k. Total pumping hours Tuburan engine / OMECO 30.57 / 218.08 118.38 / 913.45
l. Total pumping hours Sta. Lucia engine / OMECO 11.47 / 456.96 68.5 / 1,842.34
5.3b2 Chlorine Granules consumed
a. Total chlorine granules consumed (kg.) 37.4 124.71
b. Total chlorine dioxide consumed (liter) - Tuburan PH (TP) 181.5 706.5
5.3b3 Kilowatthour consumed
a. Total kwhr cons. Maugong #3 4,943.09 18,151.79
b. Total kwhr cons. Maugong #2 4,416.91 16,296.52
c. Total kwhr cons. Brgy. Ligaya 1,265 4,926
d.. Total kwhr cons. Abaca 5,824 17,838
e. Total kwhr cons. Tuban 810 3,005
f. Total kwhr cons. Alipid 3,452 12,230
g. Total kwhr hours Tagumpay 663 2,540
h. Total kwhr cons. GEA 557 2,138
i. Total kwhr cons. San Francisco 695 2,267
j. Total kwhr cons. Tuburan 1,568 7,208
k. Total kwhr cons. Sta. Lucia 640 2,440
5.4 ACCOUNTED WATER USED (cu. m.) Curr. Month
a. Metered Bill 93,797 368,545
b. Unmetered Bill - -
c. Total Billed (5.4.a + 5.4.b) 93,797 368,545
d. Unmetered unbilled 938.666 3,867.659
e. Total Accounted (5.4.c+5.4.d) 94,735.666 372,412.659
NUMBER
3
P
P
(cu. meter)
P
PP
PP
PP
PP
PP
PP
PP
PP
PP
PP
PP
PP
PP
PP
PP
PP
PP
PP
PP
PP
PP
PP
PP
PP
PP
PP
PP
PP
PP
PP
PP
PP
PP
PP
PP
PP
PP
PP
PP
PP
PP
PP
PP
PP
PP
PP
PP
PP
PP
PP
PP
PP
PP
PP
PP
PP
PP
PP
PP
PP
PP
PP
PP
PP
PP
PP
PP
PP
PP
PP
PP
PP
PP
PPPPPPPP
PP
PP
PP
PP
PP
PP
PP
PP
PP
PP
PP
PP
PP
PP
PPPPPPPPPPPPPPPPPPPPPPPPPP
PP
PP
PP
PP
PP
PP
PP
PP
PP
PP
PP
PP
PP
PP
PPPPPPPPPPPPPPPPPPPPPPPPPP
PP
PP
PP
PP
PP
PP
PP
PP
PP
PP
PP
PP
PP
PP
PP
PP
PP
PP
PP
PPPPPPPPPPPPPPPPPPPPPPPPPP
PP
PP
PP
PP
PP
PP
PP
PP
PP
PP
PP
PP
PP
PP
PP
PP
PP
PP
PP
PPPPPPPPPPPPPPPPPPPPPPPPPP
PP
PP
PP
PP
PP
PP
PP
PP
PP
PP
PP
PP
PP
PP
PP
PP
PP
PP
PP
PPPPPPPPPPPPPPPPPPPPPPPPPP
PP
PP
PP
PP
PP
PP
PP
PP
PP
PP
PP
PP
PP
PP
PP
PP
PP
PP
PP
PPPPPPPPPPPPPPPPPPPPPPPPPP
PP
PP
PP
PP
PPPPPPPPPPPP

5.5 WATER USED ASSESSMENT Curr. Month Year to Date
a. Ave. mo. Consumption/conn. 19.62
b. Ave. per capita/day cons. 0.13
c. Unaccounted Water 4.67% 5.92%
d. Non-Revenue producing water 5.61% 6.90%
6. MISCELLANEOUS DATA
6.1 Employees
a. Total = 58 Regular = 34 Casual = 0 Job Order = 24
b. No. of connections/employee _1:140
c. Ave. monthly salary/employee Php 23,351.70
Year to Date
6.2 Bacteriological a. Total Sample Taken 16 64
b. No. of negative results 16 64
c. Test results submitted to LWUA
Year to Date
6.3 Chlorination a.Total Sample Taken 456 1705
b. No. of sample meeting standards 456 1705
c. No. of days fully chlorinated 30
6.4 Board of Directors Curr. Month Year to Date
a. Resolution approved 1 22
b. Policies Passed 1 22
c. Directors' Fee Paid 42,997.50 155,452.50
d. Meeting/s
1. Held (No.) 2 8
2. Regular (No.) 2 8
3. Special (No.) 0 0
7. STATUS OF LOAN PAYMENT TO LWUA: As of April, 2019
Percentage of
Billings Amount Paid Balance amount paid
a. LWUA (LA No. 4-2693) 6,999,999.00 1,490,384.00 5,509,615.00 21.29% 11-2018
6,999,999.00 1,490,384.00 5,509,615.00 21.29%
_4_
16 (March, 2019)
TYPE OF LOAN/FUND
TOTALS
P P
P
P
P
P

7.1 OTHER ON-GOING PROJECTS
Status (Schedule (%)
Types
Batong buhay
Exp. Project
a. Early Action 100%
b. Pre-Feasibility Study 100%
c. Feasibility Study 100%
d. A & E Design 100%
e. Well Drilling 30%
f. Project Presentation (transm.)on process 0%
g. Pre-Bidding 0%
h. Construction 0%
i. Bidding 0%
8. STATUS OF INSTITUTIONAL DEVELOPMENT: (To be filled up by Advisor)
8.1 Development Progress Indicator
PHASE EARNED MIN. REQ'D VARIANCE MONTHS
8.2 Commercial System/Audit
a. CPS Installed
b. CPS II Installed
c. Management Audit
d. Marketing Assistance
e. Financial Audit
f. _______________
SUBMITTED BY: VERIFIED BY:
JOSE M. ABELEDA, JR.
General Manager Date
NOTED BY:
Area Manager Date
Water Supply System Expansion Project
Management Advisor
FMD
_5_

1. SERVICE CONNECTION DATA
Current Month Year-to-Date
1.1 Total Service 5,597
1.2 Total Active 4,806
1.3 Total Metered 4,806
1.4 Total Billed 4,840
1.5 Total Population Billed 24,200
1.6 Changes:
New 52 234
Reconnected 41 151
Disconnected YTD 791 34 143
1.7 Customers in Arrears: 1,739
2. PRESENT WATER RATES: Effective JAN. 1, 2011
LWUA Approved YES / x / NO / / Date Approved: May 26, 2009
Minimum
Curr. Mo. Yr. to Date Charge
Domestic/Gov't - 4,550 208.00
Commercial/Ind.:
( x 2 ) - 65 416.00
( x 1.75 ) - 125 364.00
( x 1.5 ) - 95 312.00
( x 1.25 ) - 5 260.00
Bulk/Wholesale - 0 624.00
TOTAL 4,840
11-20 21-30 31-40 41-up
Domestic/Gov't 23.00 25.50 27.50 29.50
Full Comm. 46.00 51.00 55.00 59.00
Commercial A 40.25 44.60 48.10 51.60
Commercial B 34.50 38.25 41.25 44.25
Commercial C 28.75 31.85 34.35 36.85
Bulk/Wholesale 69.00 76.50 82.50 88.50
3. BILLING & COLLECTION DATA
3.1 BILLINGS (Water Sales) Current Month Year to Date
a. Current (Metered) 2,484,627.78 12,082,264.52
b. Arrears (Flat Rate) - -
c. Penalty Charges 79,741.57 397,273.08
TOTALS 2,564,369.35 12,479,537.60
3.2 COLLECTION (Water Sales) Current Month Year to Date
a. Current Accounts 1,678,711.27 7,615,718.07
b. Arrears(Curr Yr.) 923,762.65 4,596,133.34
c. Arrears(Prev. Yrs.) 14,439.50 304,708.99
TOTALS 2,616,913.42 12,516,560.40
1
SABLAYAN WATER DISTRICT
Sablayan, Occidental Mindoro
MONTHLY DATA SHEET
For the Month Ending MAY 2019
COMMODITY CHARGES
No. of Concessionaire
P
P
P
P

Current Month Year to Date
3.3 ON-TIME-PAID, THIS MONTH ™
(3.2a/3.1a + 3.1b x 100) 67.56% 63.03%
COLLECTION EFFICIENCY-CM
(3.2a + 3.2b/3.1total x 100) 101.49% 97.85%
COLLECTION RATIO-CM
(3.2 total/3.1 total x 100) 96.25%
+ A/R Ending Bal. Dec. 2018 (P525,158.54)
4. FINANCIAL DATA
4.1 REVENUE Current Month Year to Date
a. Operating 2,714,771.41 13,513,926.73
b. Non-Operating - -
TOTALS 2,714,771.41 13,513,926.73
4.2 EXPENSES Current Month Year to Date
a. Salaries & Wages 790,974.00 3,889,147.81
b. Fuel, Oil & Electricity 370,887.37 1,605,341.19
c. Chemicals (equipment) 113,508.00 386,927.50
d. Other O & M Expenses 427,824.31 1,973,594.81
e. Depreciation Expense 173,062.45 773,765.07
f. Interest Expense 37,649.00 191,483.00
g. Others 1,340,724.03 3,907,826.38
TOTALS 3,254,629.16 12,728,085.76
4.3 NET INCOME (LOSS) (539,857.75) 785,840.97
Current Month Year to Date
4.4 CASH FLOW REPORT
a. Cash Receipts 5,152,488.93 16,563,282.93
b. Disbursements 2,993,501.37 14,581,179.54
c. Total Receipts (Disb.) 2,158,987.56 1,982,103.39
d. Cash Balance-Beginning 1,078,069.83 1,254,954.00
e. Cash Balance-Ending 3,237,057.39 3,237,057.39
4.5 MISCELLANEOUS FINANCIAL DATA
a. Loan Funds (Total) - c. Inventories 1,912,424.05
1. Cash on Hand d. A/R (Net of Allow. For Doubtful) 426,752.26
2. Cash in Bank - e. Customer Deposit Payable 3,996,327.77
b. WD Funds (Total) 7,914,912.60 f. Loans Payable (LWUA & Others) 5,461,593.00
1. Cash Collecting Officer 3,000.00 g. Other Payables 258,771.15
2. Local Currency on Hand 34,077.71
3. Advances to Officers & Employees -
4. Cash in Bank
a. General Fund 2,203,925.90
b. Guaranty Deposit 976,053.78
Total 3,179,979.68
4. Special Deposit (GD) 3,030,743.76
5. Working Fund 20,000.00
6. Cash Reserves 1,647,111.45
_2_
P
P
P
P
P
P
P
P
P
P
P
P
P
PPP

5. WATER PRODUCTION DATA
TOTAL RATED
5.1 SOURCE OF SUPPLY Curr. Month Year to Date CAPACITY
a. Wells
a.1. Maugong #2 1 1 15 LPS
a.2. Maugong #3 1 1 10 LPS
a.3. Abaca 1 1 20 LPS
a.4. Brgy. Ligaya 1 1 10 LPS
a.5. Brgy. Tuban 1 1 7 LPS
a.6. Alipid 1 1 12 LPS
a.7 Tagumpay 1 1 7 LPS
a.8 GEA 1 1 7 LPS
a. 9 San Francisco 1 1 8 LPS
a.10 Tuburan 1 1 7 LPS
a.11 Sta. Luicia 1 1 2 LPS
TOTALS 11 11 105 LPS
5.2 WATER PRODUCTION Curr. Month Year to Date METHOD OF
a. Pumped MEASUREMENT
a.1 Maugong #2 20,881.887 111,928.754
a.2 Maugong #3 11,228.740 56,782.687 Flow Meter
a.3 Abaca 24,446.755 133,534.651
a.4 Brgy. Ligaya 6,564.956 33,018.796
a.5. Brgy. Tuban 5,701.478 20,875.331
a.6. Alipid 16,751.657 81,290.976
a.7. Tagumpay 1,880.241 8,486.934
a.8 GEA 1,955.529 8,762.004
a. 9 San Francisco 1,158.130 5,289.235
a.10 Tuburan 5,319.300 27,058.870
a.11 Sta. Lucia 1,280.315 5,982.238
TOTALS 97,168.988 493,010.476
5.3 WATER PRODUCTION Curr. Month Year to Date
5.3.A WATER PRODUCTION COST
a. Total fuel cost for pumping 84,979.43 443,466.53
b. Total chlorine cost 69,408.64 329,643.16
c. Total Power Purchased for Pump 227,076.31 947,452.63
TOTALS 381,464.38 1,720,562.32
5.3.B. OTHER DATA FOR WATER PRODUCTION:
Curr. Month Year to Date 5.3b1 Pumping Hours
a. Total pumping hours Brgy. Ligaya engine/OMECO 13.27 / 630.3 117.23 / 3,008.76
b. Total pumping hours Maugong #2 & #3 genset 23.79 / 19.04 133.33 / 122.08
c . Total pumping hours Maugong #3 OMECO 609.37 2,999.49
d . Total pumping hours Maugong #2 OMECO 634.24 2,848.08
e . Total pumping hours Abaca genset/OMECO 142.88 / 360.43 771.19 / 1,550.81
f. Total pumping hours Tuban engine/OMECO 14.65 / 479.35 83.84 / 2,359.18
g. Total pumping hours Alipid engine/OMECO 6.36 / 609.01 61.29 / 2,948.69
h. Total pumping hours Tagumpay engine / OMECO 16.89 / 473.96 75.4 / 2,296.86
i. Total pumping hours GEA Engine / OMECO 8.4 / 485.5 63.6 / 2,327.97
j. Total pumping hours San Francisco engine / OMECO 21.69 / 470.09 246.02 / 2,140.29
k. Total pumping hours Tuburan engine / OMECO 11.16 / 255.61 129.54 / 1,169.06
l. Total pumping hours Sta. Lucia engine / OMECO 16.94 / 476.55 85.44 / 2,318.89
5.3b2 Chlorine Granules consumed
a. Total chlorine granules consumed (kg.) 25.97 150.68
b. Total chlorine dioxide consumed (liter) - Tuburan PH (TP) 85 791.5
5.3b3 Kilowatthour consumed
a. Total kwhr cons. Maugong #3 4,465.87 22,617.66
b. Total kwhr cons. Maugong #2 4,648.00 20,944.52
c. Total kwhr cons. Brgy. Ligaya 1,375 6,301
d.. Total kwhr cons. Abaca 8,306 26,144
e. Total kwhr cons. Tuban 879 3,884
f. Total kwhr cons. Alipid 3,430 15,660
g. Total kwhr hours Tagumpay 650 3,190
h. Total kwhr cons. GEA 603 2,741
i. Total kwhr cons. San Francisco 680 2,947
j. Total kwhr cons. Tuburan 1,925 9,133
k. Total kwhr cons. Sta. Lucia 615 3,055
5.4 ACCOUNTED WATER USED (cu. m.) Curr. Month
a. Metered Bill 92,058 460,603
b. Unmetered Bill - -
c. Total Billed (5.4.a + 5.4.b) 92,058 460,603
d. Unmetered unbilled 1304.89 5,172.549
e. Total Accounted (5.4.c+5.4.d) 93,362.890 465,775.549
NUMBER
3
P
P
(cu. meter)
P
PP
PP
PP
PP
PP
PP
PP
PP
PP
PP
PP
PP
PP
PP
PP
PP
PP
PP
PP
PP
PP
PP
PP
PP
PP
PP
PP
PP
PP
PP
PP
PP
PP
PP
PP
PP
PP
PP
PP
PP
PP
PP
PP
PP
PP
PP
PP
PP
PP
PP
PP
PP
PP
PP
PP
PP
PP
PP
PP
PP
PP
PP
PP
PP
PP
PP
PP
PP
PP
PP
PP
PP
PP
PPPPPPPP
PP
PP
PP
PP
PP
PP
PP
PP
PP
PP
PP
PP
PP
PP
PPPPPPPPPPPPPPPPPPPPPPPPPP
PP
PP
PP
PP
PP
PP
PP
PP
PP
PP
PP
PP
PP
PP
PPPPPPPPPPPPPPPPPPPPPPPPPP
PP
PP
PP
PP
PP
PP
PP
PP
PP
PP
PP
PP
PP
PP
PP
PP
PP
PP
PP
PPPPPPPPPPPPPPPPPPPPPPPPPP
PP
PP
PP
PP
PP
PP
PP
PP
PP
PP
PP
PP
PP
PP
PP
PP
PP
PP
PP
PPPPPPPPPPPPPPPPPPPPPPPPPP
PP
PP
PP
PP
PP
PP
PP
PP
PP
PP
PP
PP
PP
PP
PP
PP
PP
PP
PP
PPPPPPPPPPPPPPPPPPPPPPPPPP
PP
PP
PP
PP
PP
PP
PP
PP
PP
PP
PP
PP
PP
PP
PP
PP
PP
PP
PP
PPPPPPPPPPPPPPPPPPPPPPPPPP
PP
PP
PP
PP
PPPPPPPPPPPP
5.5 WATER USED ASSESSMENT Curr. Month Year to Date
a. Ave. mo. Consumption/conn. 19.02
b. Ave. per capita/day cons. 0.12
c. Unaccounted Water 3.92% 5.52%
d. Non-Revenue producing water 5.26% 6.57%
6. MISCELLANEOUS DATA
6.1 Employees
a. Total = 58 Regular = 34 Casual = 0 Job Order = 24
b. No. of connections/employee _1:141
c. Ave. monthly salary/employee Php 23,263.94
Year to Date
6.2 Bacteriological a. Total Sample Taken 13 77
b. No. of negative results 13 77
c. Test results submitted to LWUA
Year to Date
6.3 Chlorination a.Total Sample Taken 468 2173
b. No. of sample meeting standards 468 2173
c. No. of days fully chlorinated 31
6.4 Board of Directors Curr. Month Year to Date
a. Resolution approved 4 26
b. Policies Passed 4 26
c. Directors' Fee Paid 39,847.50 195,300.00
d. Meeting/s
1. Held (No.) 2 10
2. Regular (No.) 2 10
3. Special (No.) 0 0
7. STATUS OF LOAN PAYMENT TO LWUA: As of May, 2019
Percentage of
Billings Amount Paid Balance amount paid
a. LWUA (LA No. 4-2693) 6,999,999.00 1,538,406.00 5,461,593.00 21.98% 11-2018
6,999,999.00 1,538,406.00 5,461,593.00 21.98%
_4_
16 (April, 2019)
TYPE OF LOAN/FUND
TOTALS
P P
P
P
P
P
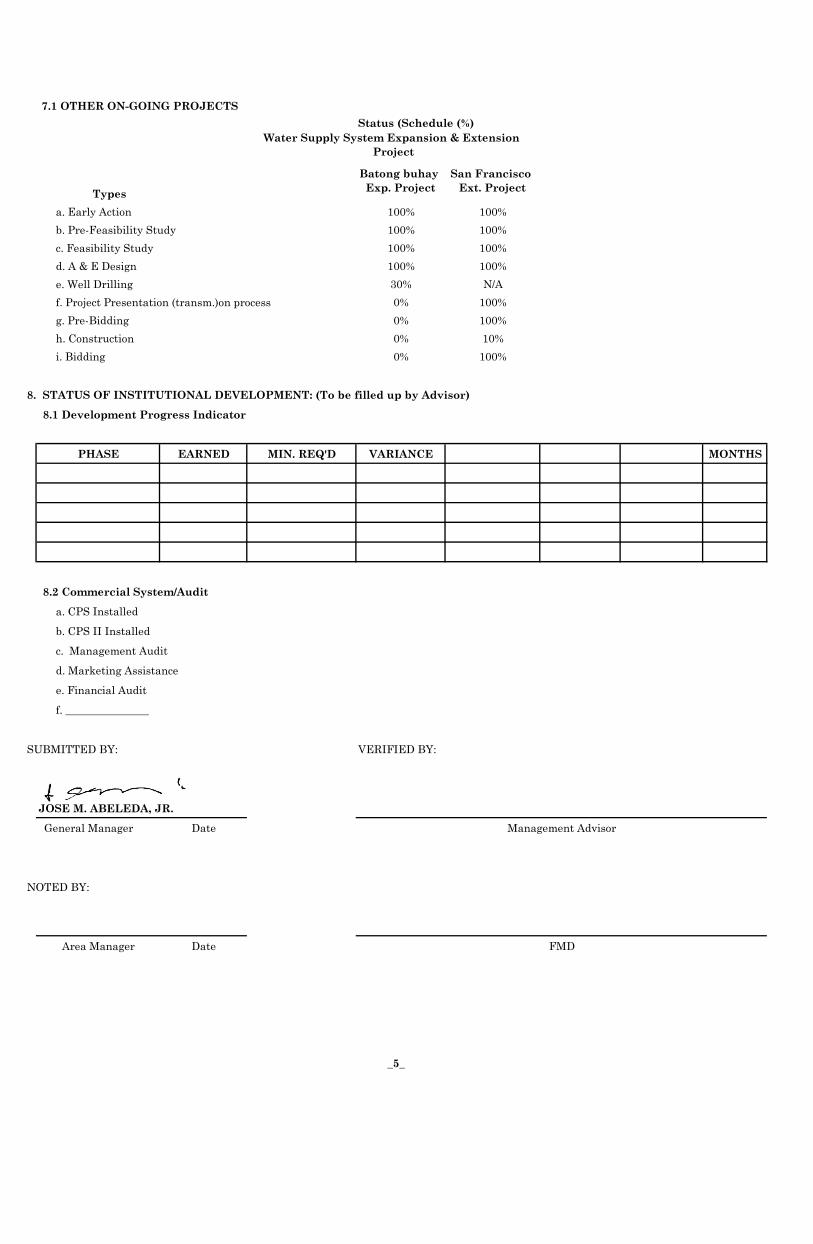
7.1 OTHER ON-GOING PROJECTS
Status (Schedule (%)
Types
Batong buhay
Exp. Project
San Francisco
Ext. Project
a. Early Action 100% 100%
b. Pre-Feasibility Study 100% 100%
c. Feasibility Study 100% 100%
d. A & E Design 100% 100%
e. Well Drilling 30% N/A
f. Project Presentation (transm.)on process 0% 100%
g. Pre-Bidding 0% 100%
h. Construction 0% 10%
i. Bidding 0% 100%
8. STATUS OF INSTITUTIONAL DEVELOPMENT: (To be filled up by Advisor)
8.1 Development Progress Indicator
PHASE EARNED MIN. REQ'D VARIANCE MONTHS
8.2 Commercial System/Audit
a. CPS Installed
b. CPS II Installed
c. Management Audit
d. Marketing Assistance
e. Financial Audit
f. _______________
SUBMITTED BY: VERIFIED BY:
JOSE M. ABELEDA, JR.
General Manager Date
NOTED BY:
Area Manager Date
Water Supply System Expansion & Extension
Project
Management Advisor
FMD
_5_

1. SERVICE CONNECTION DATA
Current Month Year-to-Date
1.1 Total Service 5,632
1.2 Total Active 4,828
1.3 Total Metered 4,828
1.4 Total Billed 4,867
1.5 Total Population Billed 24,335
1.6 Changes:
New 35 269
Reconnected 26 177
Disconnected YTD 804 39 182
1.7 Customers in Arrears: 1,387
2. PRESENT WATER RATES: Effective JAN. 1, 2011
LWUA Approved YES / x / NO / / Date Approved: May 26, 2009
Minimum
Curr. Mo. Yr. to Date Charge
Domestic/Gov't - 4,577 208.00
Commercial/Ind.:
( x 2 ) - 64 416.00
( x 1.75 ) - 126 364.00
( x 1.5 ) - 95 312.00
( x 1.25 ) - 5 260.00
Bulk/Wholesale - 0 624.00
TOTAL 4,867
11-20 21-30 31-40 41-up
Domestic/Gov't 23.00 25.50 27.50 29.50
Full Comm. 46.00 51.00 55.00 59.00
Commercial A 40.25 44.60 48.10 51.60
Commercial B 34.50 38.25 41.25 44.25
Commercial C 28.75 31.85 34.35 36.85
Bulk/Wholesale 69.00 76.50 82.50 88.50
3. BILLING & COLLECTION DATA
3.1 BILLINGS (Water Sales) Current Month Year to Date
a. Current (Metered) 2,436,804.71 14,519,069.23
b. Arrears (Flat Rate) - -
c. Penalty Charges 63,066.07 460,339.15
TOTALS 2,499,870.78 14,979,408.38
3.2 COLLECTION (Water Sales) Current Month Year to Date
a. Current Accounts 1,641,038.28 9,256,756.35
b. Arrears(Curr Yr.) 887,017.22 5,483,150.56
c. Arrears(Prev. Yrs.) 5,220.73 309,929.72
TOTALS 2,533,276.23 15,049,836.63
1
SABLAYAN WATER DISTRICT
Sablayan, Occidental Mindoro
MONTHLY DATA SHEET
For the Month Ending JUNE 2019
COMMODITY CHARGES
No. of Concessionaire
P
P
P
P

Current Month Year to Date
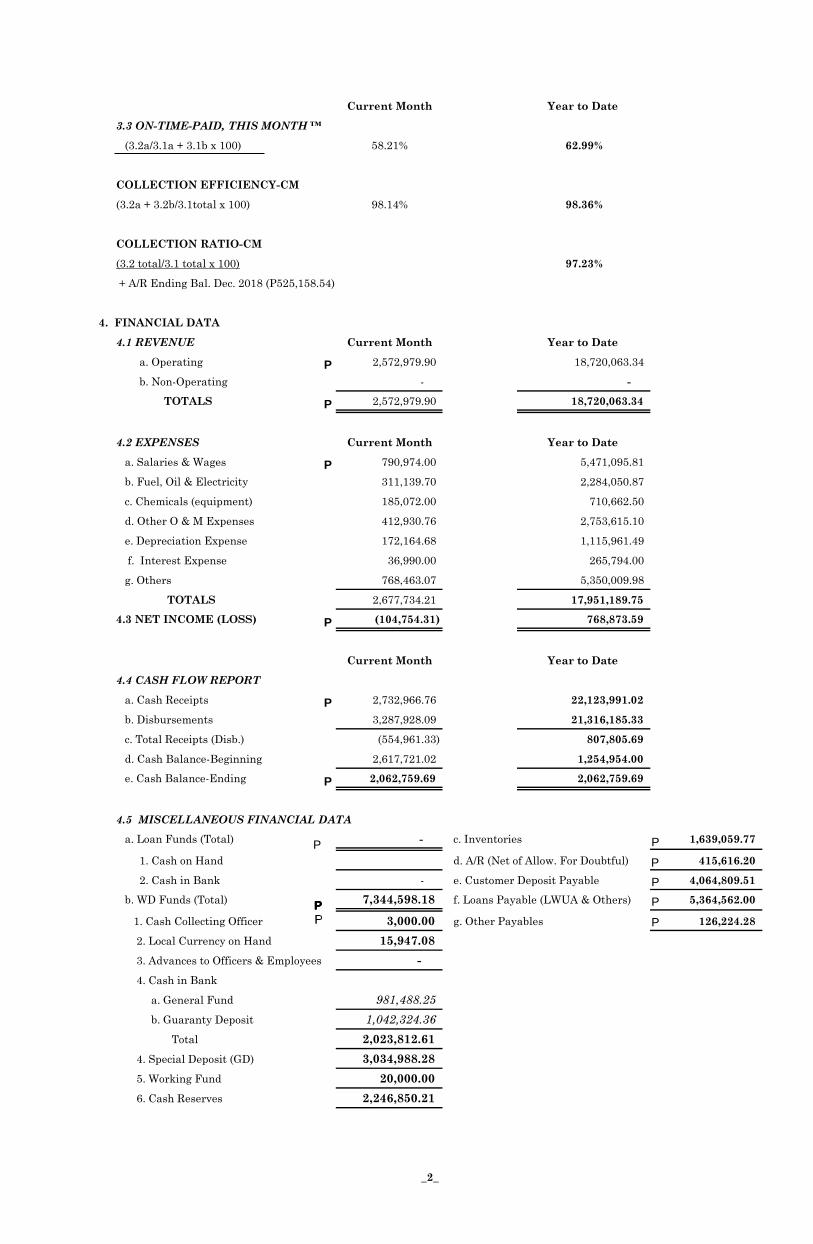
3.3 ON-TIME-PAID, THIS MONTH ™
(3.2a/3.1a + 3.1b x 100) 67.34% 63.76%
COLLECTION EFFICIENCY-CM
(3.2a + 3.2b/3.1total x 100) 101.13% 98.40%
COLLECTION RATIO-CM
(3.2 total/3.1 total x 100) 97.07%
+ A/R Ending Bal. Dec. 2018 (P525,158.54)
4. FINANCIAL DATA
4.1 REVENUE Current Month Year to Date
a. Operating 2,633,156.71 16,147,083.44
b. Non-Operating - -
TOTALS 2,633,156.71 16,147,083.44
4.2 EXPENSES Current Month Year to Date
a. Salaries & Wages 790,974.00 4,680,121.81
b. Fuel, Oil & Electricity 367,569.98 1,972,911.17
c. Chemicals (equipment) 138,663.00 525,590.50
d. Other O & M Expenses 367,089.53 2,340,684.34
e. Depreciation Expense 170,031.74 943,796.81
f. Interest Expense 37,321.00 228,804.00
g. Others 673,720.53 4,581,546.91
TOTALS 2,545,369.78 15,273,455.54
4.3 NET INCOME (LOSS) 87,786.93 873,627.90
Current Month Year to Date
4.4 CASH FLOW REPORT
a. Cash Receipts 2,827,741.33 19,391,024.26
b. Disbursements 3,447,077.70 18,028,257.24
c. Total Receipts (Disb.) (619,336.37) 1,362,767.02
d. Cash Balance-Beginning 3,237,057.39 1,254,954.00
e. Cash Balance-Ending 2,617,721.02 2,617,721.02
4.5 MISCELLANEOUS FINANCIAL DATA
a. Loan Funds (Total) - c. Inventories 1,699,191.56
1. Cash on Hand d. A/R (Net of Allow. For Doubtful) 383,327.95
2. Cash in Bank - e. Customer Deposit Payable 4,016,584.75
b. WD Funds (Total) 7,748,896.35 f. Loans Payable (LWUA & Others) 5,413,243.00
1. Cash Collecting Officer 3,000.00 g. Other Payables -
2. Local Currency on Hand 22,029.25
3. Advances to Officers & Employees -
4. Cash in Bank
a. General Fund 1,576,192.17
b. Guaranty Deposit 996,499.60
Total 2,572,691.77
4. Special Deposit (GD) 3,032,764.26
5. Working Fund 20,000.00
6. Cash Reserves 2,098,411.07
_2_
P
P
P
P
P
P
P
P
P
P
P
P
P
PPP
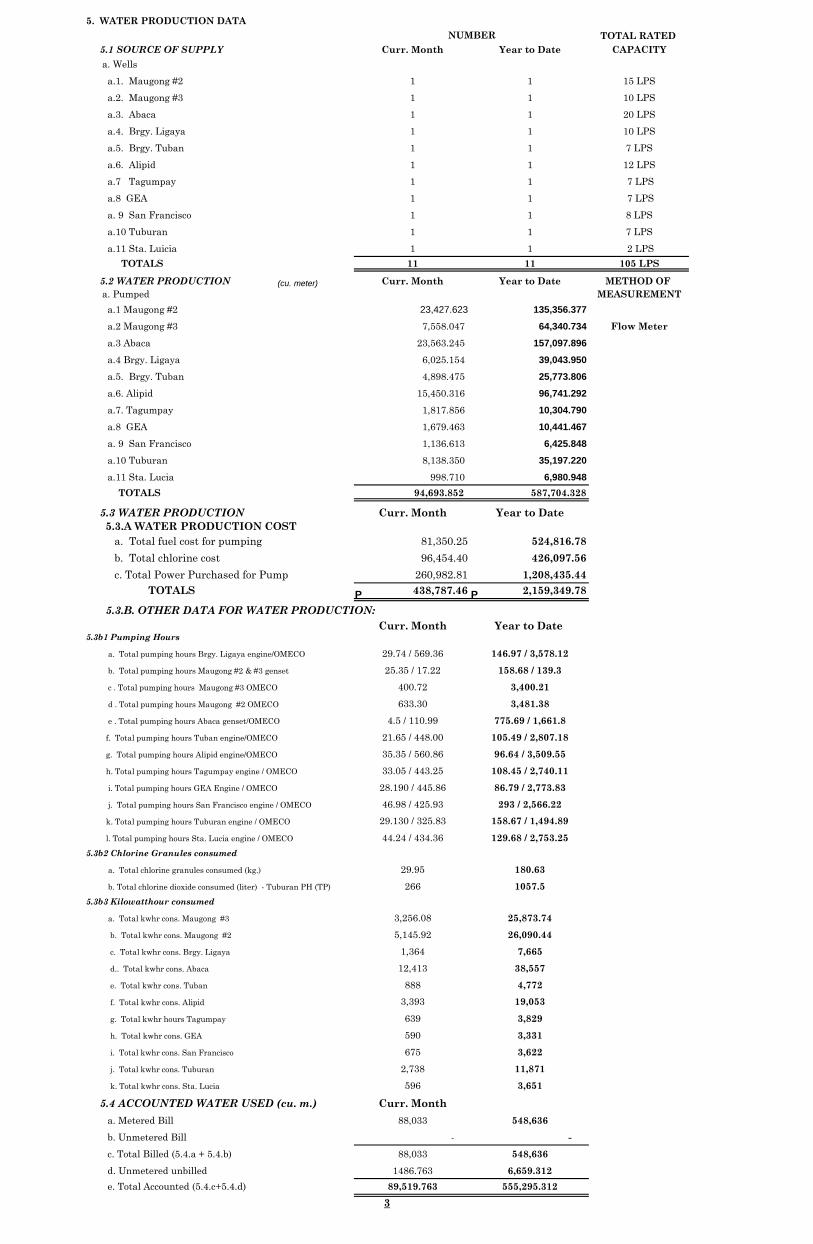
5. WATER PRODUCTION DATA
TOTAL RATED
5.1 SOURCE OF SUPPLY Curr. Month Year to Date CAPACITY
a. Wells
a.1. Maugong #2 1 1 15 LPS
a.2. Maugong #3 1 1 10 LPS
a.3. Abaca 1 1 20 LPS
a.4. Brgy. Ligaya 1 1 10 LPS
a.5. Brgy. Tuban 1 1 7 LPS
a.6. Alipid 1 1 12 LPS
a.7 Tagumpay 1 1 7 LPS
a.8 GEA 1 1 7 LPS
a. 9 San Francisco 1 1 8 LPS
a.10 Tuburan 1 1 7 LPS
a.11 Sta. Luicia 1 1 2 LPS
TOTALS 11 11 105 LPS
5.2 WATER PRODUCTION Curr. Month Year to Date METHOD OF
a. Pumped MEASUREMENT
a.1 Maugong #2 23,427.623 135,356.377
a.2 Maugong #3 7,558.047 64,340.734 Flow Meter
a.3 Abaca 23,563.245 157,097.896
a.4 Brgy. Ligaya 6,025.154 39,043.950
a.5. Brgy. Tuban 4,898.475 25,773.806
a.6. Alipid 15,450.316 96,741.292
a.7. Tagumpay 1,817.856 10,304.790
a.8 GEA 1,679.463 10,441.467
a. 9 San Francisco 1,136.613 6,425.848
a.10 Tuburan 8,138.350 35,197.220
a.11 Sta. Lucia 998.710 6,980.948
TOTALS 94,693.852 587,704.328
5.3 WATER PRODUCTION Curr. Month Year to Date
5.3.A WATER PRODUCTION COST
a. Total fuel cost for pumping 81,350.25 524,816.78
b. Total chlorine cost 96,454.40 426,097.56
c. Total Power Purchased for Pump 260,982.81 1,208,435.44
TOTALS 438,787.46 2,159,349.78
5.3.B. OTHER DATA FOR WATER PRODUCTION:
Curr. Month Year to Date 5.3b1 Pumping Hours
a. Total pumping hours Brgy. Ligaya engine/OMECO 29.74 / 569.36 146.97 / 3,578.12
b. Total pumping hours Maugong #2 & #3 genset 25.35 / 17.22 158.68 / 139.3
c . Total pumping hours Maugong #3 OMECO 400.72 3,400.21
d . Total pumping hours Maugong #2 OMECO 633.30 3,481.38
e . Total pumping hours Abaca genset/OMECO 4.5 / 110.99 775.69 / 1,661.8
f. Total pumping hours Tuban engine/OMECO 21.65 / 448.00 105.49 / 2,807.18
g. Total pumping hours Alipid engine/OMECO 35.35 / 560.86 96.64 / 3,509.55
h. Total pumping hours Tagumpay engine / OMECO 33.05 / 443.25 108.45 / 2,740.11
i. Total pumping hours GEA Engine / OMECO 28.190 / 445.86 86.79 / 2,773.83
j. Total pumping hours San Francisco engine / OMECO 46.98 / 425.93 293 / 2,566.22
k. Total pumping hours Tuburan engine / OMECO 29.130 / 325.83 158.67 / 1,494.89
l. Total pumping hours Sta. Lucia engine / OMECO 44.24 / 434.36 129.68 / 2,753.25
5.3b2 Chlorine Granules consumed
a. Total chlorine granules consumed (kg.) 29.95 180.63
b. Total chlorine dioxide consumed (liter) - Tuburan PH (TP) 266 1057.5
5.3b3 Kilowatthour consumed
a. Total kwhr cons. Maugong #3 3,256.08 25,873.74
b. Total kwhr cons. Maugong #2 5,145.92 26,090.44
c. Total kwhr cons. Brgy. Ligaya 1,364 7,665
d.. Total kwhr cons. Abaca 12,413 38,557
e. Total kwhr cons. Tuban 888 4,772
f. Total kwhr cons. Alipid 3,393 19,053
g. Total kwhr hours Tagumpay 639 3,829
h. Total kwhr cons. GEA 590 3,331
i. Total kwhr cons. San Francisco 675 3,622
j. Total kwhr cons. Tuburan 2,738 11,871
k. Total kwhr cons. Sta. Lucia 596 3,651
5.4 ACCOUNTED WATER USED (cu. m.) Curr. Month
a. Metered Bill 88,033 548,636
b. Unmetered Bill - -
c. Total Billed (5.4.a + 5.4.b) 88,033 548,636
d. Unmetered unbilled 1486.763 6,659.312
e. Total Accounted (5.4.c+5.4.d) 89,519.763 555,295.312
NUMBER
3
P
P
(cu. meter)
P
PP
PP
PP
PP
PP
PP
PP
PP
PP
PP
PP
PP
PP
PP
PP
PP
PP
PP
PP
PP
PP
PP
PP
PP
PP
PP
PP
PP
PP
PP
PP
PP
PP
PP
PP
PP
PP
PP
PP
PP
PP
PP
PP
PP
PP
PP
PP
PP
PP
PP
PP
PP
PP
PP
PP
PP
PP
PP
PP
PP
PP
PP
PP
PP
PP
PP
PP
PP
PP
PP
PP
PP
PP
PPPPPPPP
PP
PP
PP
PP
PP
PP
PP
PP
PP
PP
PP
PP
PP
PP
PPPPPPPPPPPPPPPPPPPPPPPPPP
PP
PP
PP
PP
PP
PP
PP
PP
PP
PP
PP
PP
PP
PP
PPPPPPPPPPPPPPPPPPPPPPPPPP
PP
PP
PP
PP
PP
PP
PP
PP
PP
PP
PP
PP
PP
PP
PP
PP
PP
PP
PP
PPPPPPPPPPPPPPPPPPPPPPPPPP
PP
PP
PP
PP
PP
PP
PP
PP
PP
PP
PP
PP
PP
PP
PP
PP
PP
PP
PP
PPPPPPPPPPPPPPPPPPPPPPPPPP
PP
PP
PP
PP
PP
PP
PP
PP
PP
PP
PP
PP
PP
PP
PP
PP
PP
PP
PP
PPPPPPPPPPPPPPPPPPPPPPPPPP
PP
PP
PP
PP
PP
PP
PP
PP
PP
PP
PP
PP
PP
PP
PP
PP
PP
PP
PP
PPPPPPPPPPPPPPPPPPPPPPPPPP
PP
PP
PP
PP
PPPPPPPPPPPP

5.5 WATER USED ASSESSMENT Curr. Month Year to Date
a. Ave. mo. Consumption/conn. 18.09
b. Ave. per capita/day cons. 0.12
c. Unaccounted Water 5.46% 5.51%
d. Non-Revenue producing water 7.03% 6.65%
6. MISCELLANEOUS DATA
6.1 Employees
a. Total = 58 Regular = 34 Casual = 0 Job Order = 24
b. No. of connections/employee _1:142
c. Ave. monthly salary/employee Php 23,263.94
Year to Date
6.2 Bacteriological a. Total Sample Taken 16 93
b. No. of negative results 16 93
c. Test results submitted to LWUA
Year to Date
6.3 Chlorination a.Total Sample Taken 459 2632
b. No. of sample meeting standards 459 2632
c. No. of days fully chlorinated 30
6.4 Board of Directors Curr. Month Year to Date
a. Resolution approved 8 34
b. Policies Passed 8 34
c. Directors' Fee Paid 49,297.50 244,597.50
d. Meeting/s
1. Held (No.) 2 12
2. Regular (No.) 2 12
3. Special (No.) 0 0
7. STATUS OF LOAN PAYMENT TO LWUA: As of June, 2019
Percentage of
Billings Amount Paid Balance amount paid
a. LWUA (LA No. 4-2693) 6,999,999.00 1,586,756.00 5,413,243.00 22.67% 11-2018
6,999,999.00 1,586,756.00 5,413,243.00 22.67%
_4_
13 (May, 2019)
TYPE OF LOAN/FUND
TOTALS
P P
P
P
P
P

7.1 OTHER ON-GOING PROJECTS
Status (Schedule (%)
Types
Batong buhay
Exp. Project
San Francisco
Ext. Project
a. Early Action 100% 100%
b. Pre-Feasibility Study 100% 100%
c. Feasibility Study 100% 100%
d. A & E Design 100% 100%
e. Well Drilling 30% N/A
f. Project Presentation (transm.)on process 0% 100%
g. Pre-Bidding 0% 100%
h. Construction 0% 50%
i. Bidding 0% 100%
8. STATUS OF INSTITUTIONAL DEVELOPMENT: (To be filled up by Advisor)
8.1 Development Progress Indicator
PHASE EARNED MIN. REQ'D VARIANCE MONTHS
8.2 Commercial System/Audit
a. CPS Installed
b. CPS II Installed
c. Management Audit
d. Marketing Assistance
e. Financial Audit
f. _______________
SUBMITTED BY: VERIFIED BY:
JOSE M. ABELEDA, JR.
General Manager Date
NOTED BY:
Area Manager Date
Water Supply System Expansion & Extension
Project
Management Advisor
FMD
_5_

1. SERVICE CONNECTION DATA
Current Month Year-to-Date
1.1 Total Service 5,692
1.2 Total Active 4,880
1.3 Total Metered 4,880
1.4 Total Billed 4,920
1.5 Total Population Billed 24,600
1.6 Changes:
New 60 329
Reconnected 32 209
Disconnected YTD 812 40 222
1.7 Customers in Arrears: 1,689
2. PRESENT WATER RATES: Effective JAN. 1, 2011
LWUA Approved YES / x / NO / / Date Approved: May 26, 2009
Minimum
Curr. Mo. Yr. to Date Charge
Domestic/Gov't - 4,628 208.00
Commercial/Ind.:
( x 2 ) - 65 416.00
( x 1.75 ) - 125 364.00
( x 1.5 ) - 97 312.00
( x 1.25 ) - 5 260.00
Bulk/Wholesale - 0 624.00
TOTAL 4,920
11-20 21-30 31-40 41-up
Domestic/Gov't 23.00 25.50 27.50 29.50
Full Comm. 46.00 51.00 55.00 59.00
Commercial A 40.25 44.60 48.10 51.60
Commercial B 34.50 38.25 41.25 44.25
Commercial C 28.75 31.85 34.35 36.85
Bulk/Wholesale 69.00 76.50 82.50 88.50
3. BILLING & COLLECTION DATA
3.1 BILLINGS (Water Sales) Current Month Year to Date
a. Current (Metered) 2,317,545.77 16,836,615.00
b. Arrears (Flat Rate) - -
c. Penalty Charges 95,579.52 555,918.67
TOTALS 2,413,125.29 17,392,533.67
3.2 COLLECTION (Water Sales) Current Month Year to Date
a. Current Accounts 1,349,100.70 10,605,857.05
b. Arrears(Curr Yr.) 1,019,123.82 6,502,274.38
c. Arrears(Prev. Yrs.) 3,657.65 313,587.37
TOTALS 2,371,882.17 17,421,718.80
1
SABLAYAN WATER DISTRICT
Sablayan, Occidental Mindoro
MONTHLY DATA SHEET
For the Month Ending JULY 2019
COMMODITY CHARGES
No. of Concessionaire
P
P
P
P
Current Month Year to Date
3.3 ON-TIME-PAID, THIS MONTH ™
(3.2a/3.1a + 3.1b x 100) 58.21% 62.99%
COLLECTION EFFICIENCY-CM
(3.2a + 3.2b/3.1total x 100) 98.14% 98.36%
COLLECTION RATIO-CM
(3.2 total/3.1 total x 100) 97.23%
+ A/R Ending Bal. Dec. 2018 (P525,158.54)
4. FINANCIAL DATA
4.1 REVENUE Current Month Year to Date
a. Operating 2,572,979.90 18,720,063.34
b. Non-Operating - -
TOTALS 2,572,979.90 18,720,063.34
4.2 EXPENSES Current Month Year to Date
a. Salaries & Wages 790,974.00 5,471,095.81
b. Fuel, Oil & Electricity 311,139.70 2,284,050.87
c. Chemicals (equipment) 185,072.00 710,662.50
d. Other O & M Expenses 412,930.76 2,753,615.10
e. Depreciation Expense 172,164.68 1,115,961.49
f. Interest Expense 36,990.00 265,794.00
g. Others 768,463.07 5,350,009.98
TOTALS 2,677,734.21 17,951,189.75
4.3 NET INCOME (LOSS) (104,754.31) 768,873.59
Current Month Year to Date
4.4 CASH FLOW REPORT
a. Cash Receipts 2,732,966.76 22,123,991.02
b. Disbursements 3,287,928.09 21,316,185.33
c. Total Receipts (Disb.) (554,961.33) 807,805.69
d. Cash Balance-Beginning 2,617,721.02 1,254,954.00
e. Cash Balance-Ending 2,062,759.69 2,062,759.69
4.5 MISCELLANEOUS FINANCIAL DATA
a. Loan Funds (Total) - c. Inventories 1,639,059.77
1. Cash on Hand d. A/R (Net of Allow. For Doubtful) 415,616.20
2. Cash in Bank - e. Customer Deposit Payable 4,064,809.51
b. WD Funds (Total) 7,344,598.18 f. Loans Payable (LWUA & Others) 5,364,562.00
1. Cash Collecting Officer 3,000.00 g. Other Payables 126,224.28
2. Local Currency on Hand 15,947.08
3. Advances to Officers & Employees -
4. Cash in Bank
a. General Fund 981,488.25
b. Guaranty Deposit 1,042,324.36
Total 2,023,812.61
4. Special Deposit (GD) 3,034,988.28
5. Working Fund 20,000.00
6. Cash Reserves 2,246,850.21
_2_
P
P
P
P
P
P
P
P
P
P
P
P
P
PPP
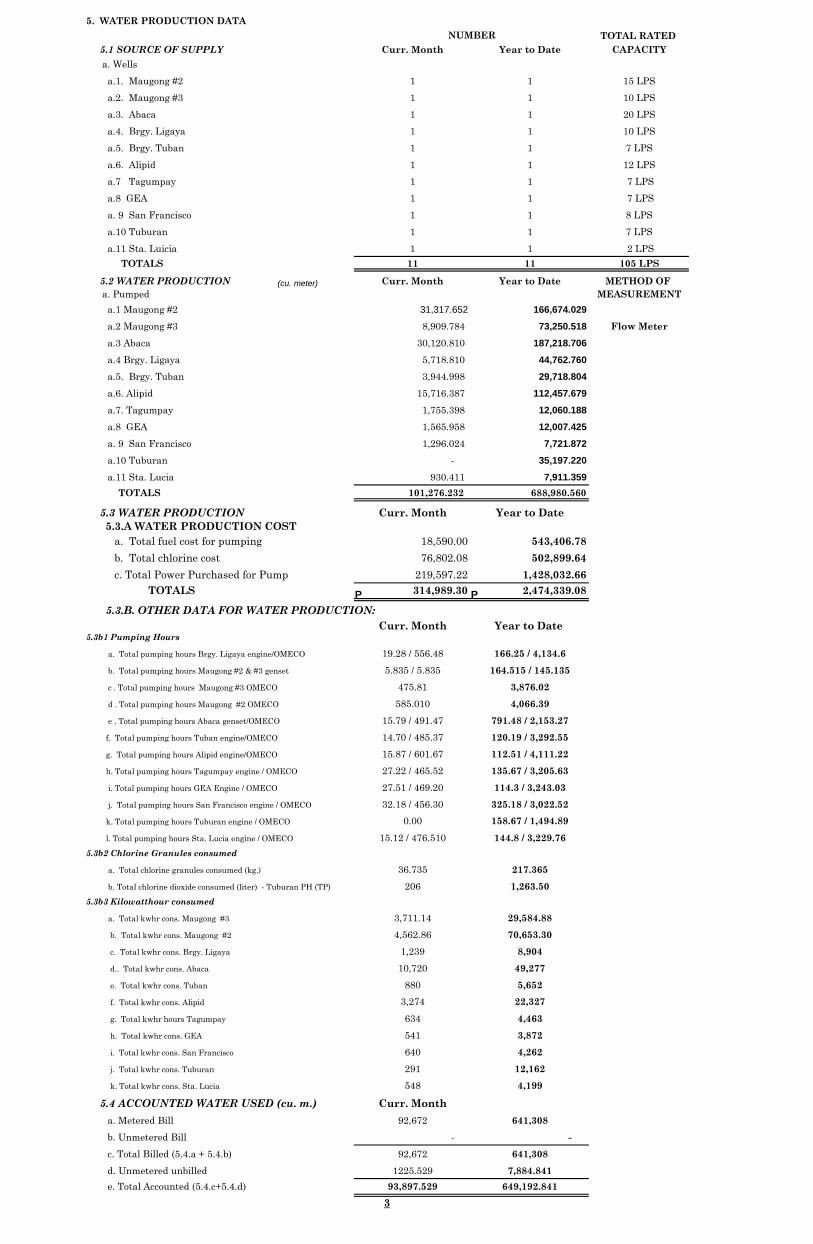
5. WATER PRODUCTION DATA
TOTAL RATED
5.1 SOURCE OF SUPPLY Curr. Month Year to Date CAPACITY
a. Wells
a.1. Maugong #2 1 1 15 LPS
a.2. Maugong #3 1 1 10 LPS
a.3. Abaca 1 1 20 LPS
a.4. Brgy. Ligaya 1 1 10 LPS
a.5. Brgy. Tuban 1 1 7 LPS
a.6. Alipid 1 1 12 LPS
a.7 Tagumpay 1 1 7 LPS
a.8 GEA 1 1 7 LPS
a. 9 San Francisco 1 1 8 LPS
a.10 Tuburan 1 1 7 LPS
a.11 Sta. Luicia 1 1 2 LPS
TOTALS 11 11 105 LPS
5.2 WATER PRODUCTION Curr. Month Year to Date METHOD OF
a. Pumped MEASUREMENT
a.1 Maugong #2 31,317.652 166,674.029
a.2 Maugong #3 8,909.784 73,250.518 Flow Meter
a.3 Abaca 30,120.810 187,218.706
a.4 Brgy. Ligaya 5,718.810 44,762.760
a.5. Brgy. Tuban 3,944.998 29,718.804
a.6. Alipid 15,716.387 112,457.679
a.7. Tagumpay 1,755.398 12,060.188
a.8 GEA 1,565.958 12,007.425
a. 9 San Francisco 1,296.024 7,721.872
a.10 Tuburan - 35,197.220
a.11 Sta. Lucia 930.411 7,911.359
TOTALS 101,276.232 688,980.560
5.3 WATER PRODUCTION Curr. Month Year to Date
5.3.A WATER PRODUCTION COST
a. Total fuel cost for pumping 18,590.00 543,406.78
b. Total chlorine cost 76,802.08 502,899.64
c. Total Power Purchased for Pump 219,597.22 1,428,032.66
TOTALS 314,989.30 2,474,339.08
5.3.B. OTHER DATA FOR WATER PRODUCTION:
Curr. Month Year to Date 5.3b1 Pumping Hours
a. Total pumping hours Brgy. Ligaya engine/OMECO 19.28 / 556.48 166.25 / 4,134.6
b. Total pumping hours Maugong #2 & #3 genset 5.835 / 5.835 164.515 / 145.135
c . Total pumping hours Maugong #3 OMECO 475.81 3,876.02
d . Total pumping hours Maugong #2 OMECO 585.010 4,066.39
e . Total pumping hours Abaca genset/OMECO 15.79 / 491.47 791.48 / 2,153.27
f. Total pumping hours Tuban engine/OMECO 14.70 / 485.37 120.19 / 3,292.55
g. Total pumping hours Alipid engine/OMECO 15.87 / 601.67 112.51 / 4,111.22
h. Total pumping hours Tagumpay engine / OMECO 27.22 / 465.52 135.67 / 3,205.63
i. Total pumping hours GEA Engine / OMECO 27.51 / 469.20 114.3 / 3,243.03
j. Total pumping hours San Francisco engine / OMECO 32.18 / 456.30 325.18 / 3,022.52
k. Total pumping hours Tuburan engine / OMECO 0.00 158.67 / 1,494.89
l. Total pumping hours Sta. Lucia engine / OMECO 15.12 / 476.510 144.8 / 3,229.76
5.3b2 Chlorine Granules consumed
a. Total chlorine granules consumed (kg.) 36.735 217.365
b. Total chlorine dioxide consumed (liter) - Tuburan PH (TP) 206 1,263.50
5.3b3 Kilowatthour consumed
a. Total kwhr cons. Maugong #3 3,711.14 29,584.88
b. Total kwhr cons. Maugong #2 4,562.86 70,653.30
c. Total kwhr cons. Brgy. Ligaya 1,239 8,904
d.. Total kwhr cons. Abaca 10,720 49,277
e. Total kwhr cons. Tuban 880 5,652
f. Total kwhr cons. Alipid 3,274 22,327
g. Total kwhr hours Tagumpay 634 4,463
h. Total kwhr cons. GEA 541 3,872
i. Total kwhr cons. San Francisco 640 4,262
j. Total kwhr cons. Tuburan 291 12,162
k. Total kwhr cons. Sta. Lucia 548 4,199
5.4 ACCOUNTED WATER USED (cu. m.) Curr. Month
a. Metered Bill 92,672 641,308
b. Unmetered Bill - -
c. Total Billed (5.4.a + 5.4.b) 92,672 641,308
d. Unmetered unbilled 1225.529 7,884.841
e. Total Accounted (5.4.c+5.4.d) 93,897.529 649,192.841
NUMBER
3
P
P
(cu. meter)
P
PP
PP
PP
PP
PP
PP
PP
PP
PP
PP
PP
PP
PP
PP
PP
PP
PP
PP
PP
PP
PP
PP
PP
PP
PP
PP
PP
PP
PP
PP
PP
PP
PP
PP
PP
PP
PP
PP
PP
PP
PP
PP
PP
PP
PP
PP
PP
PP
PP
PP
PP
PP
PP
PP
PP
PP
PP
PP
PP
PP
PP
PP
PP
PP
PP
PP
PP
PP
PP
PP
PP
PP
PP
PPPPPPPP
PP
PP
PP
PP
PP
PP
PP
PP
PP
PP
PP
PP
PP
PP
PPPPPPPPPPPPPPPPPPPPPPPPPP
PP
PP
PP
PP
PP
PP
PP
PP
PP
PP
PP
PP
PP
PP
PPPPPPPPPPPPPPPPPPPPPPPPPP
PP
PP
PP
PP
PP
PP
PP
PP
PP
PP
PP
PP
PP
PP
PP
PP
PP
PP
PP
PPPPPPPPPPPPPPPPPPPPPPPPPP
PP
PP
PP
PP
PP
PP
PP
PP
PP
PP
PP
PP
PP
PP
PP
PP
PP
PP
PP
PPPPPPPPPPPPPPPPPPPPPPPPPP
PP
PP
PP
PP
PP
PP
PP
PP
PP
PP
PP
PP
PP
PP
PP
PP
PP
PP
PP
PPPPPPPPPPPPPPPPPPPPPPPPPP
PP
PP
PP
PP
PP
PP
PP
PP
PP
PP
PP
PP
PP
PP
PP
PP
PP
PP
PP
PPPPPPPPPPPPPPPPPPPPPPPPPP
PP
PP
PP
PP
PPPPPPPPPPPP

5.5 WATER USED ASSESSMENT Curr. Month Year to Date
a. Ave. mo. Consumption/conn. 18.36
b. Ave. per capita/day cons. 0.12
c. Unaccounted Water 7.10% 5.77%
d. Non-Revenue producing water 8.31% 6.92%
6. MISCELLANEOUS DATA
6.1 Employees
a. Total = 58 Regular = 34 Casual = 0 Job Order = 24
b. No. of connections/employee _1:144
c. Ave. monthly salary/employee Php 23,263.94
Year to Date
6.2 Bacteriological a. Total Sample Taken 14 107
b. No. of negative results 14 107
c. Test results submitted to LWUA
Year to Date
6.3 Chlorination a.Total Sample Taken 473 3105
b. No. of sample meeting standards 473 3105
c. No. of days fully chlorinated 31
6.4 Board of Directors Curr. Month Year to Date
a. Resolution approved 3 37
b. Policies Passed 3 37
c. Directors' Fee Paid 26,460.00 271,057.50
d. Meeting/s
1. Held (No.) 2 14
2. Regular (No.) 2 14
3. Special (No.) 0 0
7. STATUS OF LOAN PAYMENT TO LWUA: As of July, 2019
Percentage of
Billings Amount Paid Balance amount paid
a. LWUA (LA No. 4-2693) 6,999,999.00 1,635,437.00 5,364,562.00 23.36% 11-2018
6,999,999.00 1,635,437.00 5,364,562.00 23.36%
_4_
16 (June, 2019)
TYPE OF LOAN/FUND
TOTALS
P P
P
P
P
P
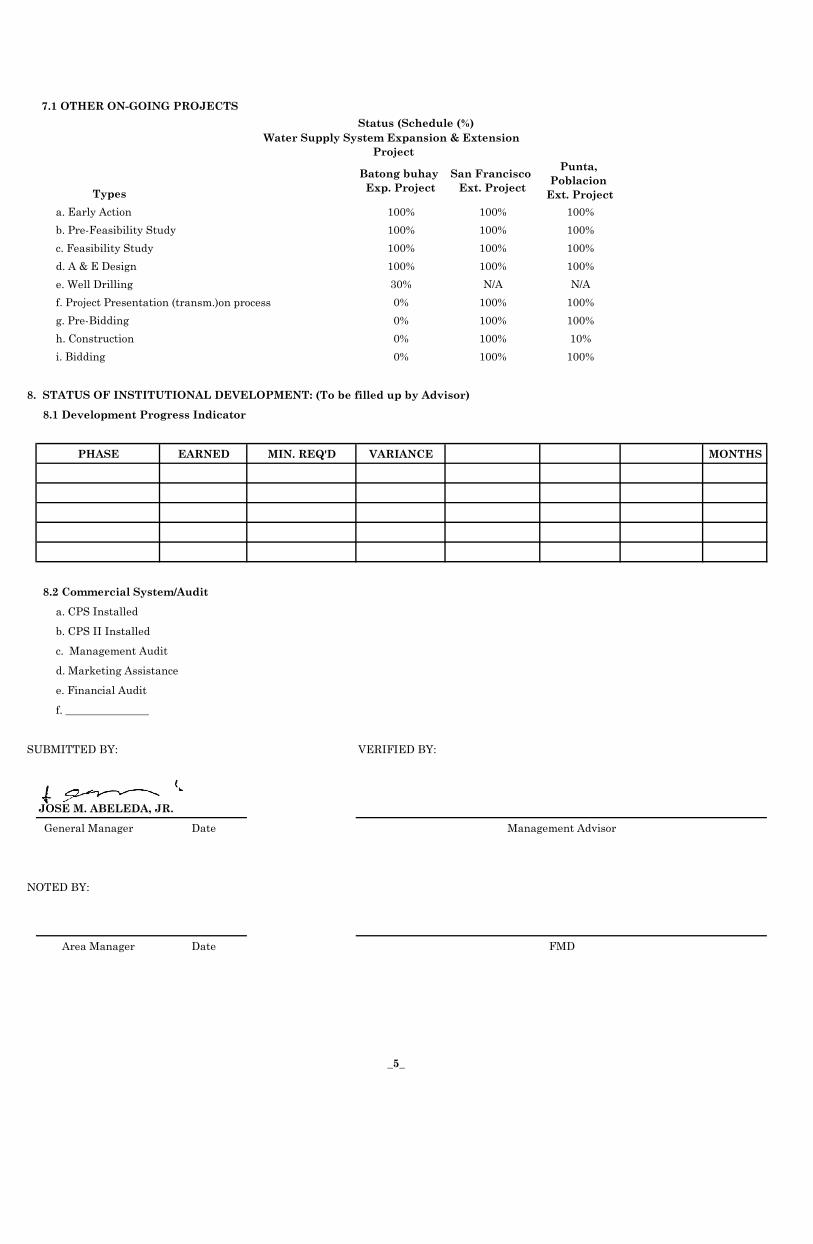
7.1 OTHER ON-GOING PROJECTS
Status (Schedule (%)
Types
Batong buhay
Exp. Project
San Francisco
Ext. Project
Punta,
Poblacion
Ext. Project
a. Early Action 100% 100% 100%
b. Pre-Feasibility Study 100% 100% 100%
c. Feasibility Study 100% 100% 100%
d. A & E Design 100% 100% 100%
e. Well Drilling 30% N/A N/A
f. Project Presentation (transm.)on process 0% 100% 100%
g. Pre-Bidding 0% 100% 100%
h. Construction 0% 100% 10%
i. Bidding 0% 100% 100%
8. STATUS OF INSTITUTIONAL DEVELOPMENT: (To be filled up by Advisor)
8.1 Development Progress Indicator
PHASE EARNED MIN. REQ'D VARIANCE MONTHS
8.2 Commercial System/Audit
a. CPS Installed
b. CPS II Installed
c. Management Audit
d. Marketing Assistance
e. Financial Audit
f. _______________
SUBMITTED BY: VERIFIED BY:
JOSE M. ABELEDA, JR.
General Manager Date
NOTED BY:
Area Manager Date
Water Supply System Expansion & Extension
Project
Management Advisor
FMD
_5_

1. SERVICE CONNECTION DATA
Current Month Year-to-Date
1.1 Total Service 5,720
1.2 Total Active 4,876
1.3 Total Metered 4,876
1.4 Total Billed 4,923
1.5 Total Population Billed 24,615
1.6 Changes:
New 28 357
Reconnected 15 224
Disconnected YTD 844 47 269
1.7 Customers in Arrears: 1,499
2. PRESENT WATER RATES: Effective JAN. 1, 2011
LWUA Approved YES / x / NO / / Date Approved: May 26, 2009
Minimum
Curr. Mo. Yr. to Date Charge
Domestic/Gov't - 4,636 208.00
Commercial/Ind.:
( x 2 ) - 63 416.00
( x 1.75 ) - 125 364.00
( x 1.5 ) - 94 312.00
( x 1.25 ) - 5 260.00
Bulk/Wholesale - 0 624.00
TOTAL 4,923
11-20 21-30 31-40 41-up
Domestic/Gov't 23.00 25.50 27.50 29.50
Full Comm. 46.00 51.00 55.00 59.00
Commercial A 40.25 44.60 48.10 51.60
Commercial B 34.50 38.25 41.25 44.25
Commercial C 28.75 31.85 34.35 36.85
Bulk/Wholesale 69.00 76.50 82.50 88.50
3. BILLING & COLLECTION DATA
3.1 BILLINGS (Water Sales) Current Month Year to Date
a. Current (Metered) 2,468,264.94 19,304,879.94
b. Arrears (Flat Rate) - -
c. Penalty Charges 82,886.17 638,804.84
TOTALS 2,551,151.11 19,943,684.78
3.2 COLLECTION (Water Sales) Current Month Year to Date
a. Current Accounts 1,609,629.61 12,215,486.66
b. Arrears(Curr Yr.) 828,945.17 7,331,219.55
c. Arrears(Prev. Yrs.) 4,646.60 318,233.97
TOTALS 2,443,221.38 19,864,940.18
1
SABLAYAN WATER DISTRICT
Sablayan, Occidental Mindoro
MONTHLY DATA SHEET
For the Month Ending AUGUST 2019
COMMODITY CHARGES
No. of Concessionaire
P
P
P
P

Current Month Year to Date
3.3 ON-TIME-PAID, THIS MONTH ™
(3.2a/3.1a + 3.1b x 100) 65.21% 63.28%
COLLECTION EFFICIENCY-CM
(3.2a + 3.2b/3.1total x 100) 95.59% 98.01%
COLLECTION RATIO-CM
(3.2 total/3.1 total x 100) 97.05%
+ A/R Ending Bal. Dec. 2018 (P525,158.54)
4. FINANCIAL DATA
4.1 REVENUE Current Month Year to Date
a. Operating 2,668,424.68 21,388,488.02
b. Non-Operating - -
TOTALS 2,668,424.68 21,388,488.02
4.2 EXPENSES Current Month Year to Date
a. Salaries & Wages 797,165.00 6,268,260.81
b. Fuel, Oil & Electricity 332,516.00 2,616,566.87
c. Chemicals (equipment) 77,924.60 788,587.10
d. Other O & M Expenses 390,977.34 3,144,592.44
e. Depreciation Expense 173,324.64 1,289,286.13
f. Interest Expense 36,658.00 302,452.00
g. Others 601,723.95 5,951,733.93
TOTALS 2,410,289.53 20,361,479.28
4.3 NET INCOME (LOSS) 258,135.15 1,027,008.74
Current Month Year to Date
4.4 CASH FLOW REPORT
a. Cash Receipts 2,669,691.60 24,793,682.62
b. Disbursements 2,498,652.99 23,814,838.32
c. Total Receipts (Disb.) 171,038.61 978,844.30
d. Cash Balance-Beginning 2,062,759.69 1,254,954.00
e. Cash Balance-Ending 2,233,798.30 2,233,798.30
4.5 MISCELLANEOUS FINANCIAL DATA
a. Loan Funds (Total) - c. Inventories 4,021,483.05
1. Cash on Hand d. A/R (Net of Allow. For Doubtful) 513,229.05
2. Cash in Bank - e. Customer Deposit Payable 4,080,725.89
b. WD Funds (Total) 7,517,660.12 f. Loans Payable (LWUA & Others) 5,315,549.00
1. Cash Collecting Officer 3,000.00 g. Other Payables 137,649.28
2. Local Currency on Hand 25,138.20
3. Advances to Officers & Employees -
4. Cash in Bank
a. General Fund 1,126,384.36
b. Guaranty Deposit 1,059,275.74
Total 2,185,660.10
4. Special Deposit (GD) 3,037,011.61
5. Working Fund 20,000.00
6. Cash Reserves 2,246,850.21
_2_
P
P
P
P
P
P
P
P
P
P
P
P
P
PPP

5. WATER PRODUCTION DATA
TOTAL RATED
5.1 SOURCE OF SUPPLY Curr. Month Year to Date CAPACITY
a. Wells
a.1. Maugong #2 1 1 15 LPS
a.2. Maugong #3 1 1 10 LPS
a.3. Abaca 1 1 20 LPS
a.4. Brgy. Ligaya 1 1 10 LPS
a.5. Brgy. Tuban 1 1 7 LPS
a.6. Alipid 1 1 12 LPS
a.7 Tagumpay 1 1 7 LPS
a.8 GEA 1 1 7 LPS
a. 9 San Francisco 1 1 8 LPS
a.10 Tuburan 1 1 7 LPS
a.11 Sta. Luicia 1 1 2 LPS
TOTALS 11 11 105 LPS
5.2 WATER PRODUCTION Curr. Month Year to Date METHOD OF
a. Pumped MEASUREMENT
a.1 Maugong #2 31,393.820 198,067.849
a.2 Maugong #3 8,128.884 81,379.402 Flow Meter
a.3 Abaca 32,274.309 219,493.015
a.4 Brgy. Ligaya 5,705.755 50,468.515
a.5. Brgy. Tuban 3,702.306 33,421.110
a.6. Alipid 15,885.930 128,343.609
a.7. Tagumpay 1,722.720 13,782.908
a.8 GEA 1,441.287 13,448.712
a. 9 San Francisco 1,400.644 9,122.516
a.10 Tuburan - 35,197.220
a.11 Sta. Lucia 936.871 8,848.230
TOTALS 102,592.526 791,573.086
5.3 WATER PRODUCTION Curr. Month Year to Date
5.3.A WATER PRODUCTION COST
a. Total fuel cost for pumping 32,976.13 576,382.91
b. Total chlorine cost 82,157.02 585,056.66
c. Total Power Purchased for Pump 220,160.64 1,648,193.30
TOTALS 335,293.79 2,809,632.87
5.3.B. OTHER DATA FOR WATER PRODUCTION:
Curr. Month Year to Date 5.3b1 Pumping Hours
a. Total pumping hours Brgy. Ligaya engine/OMECO 22.90 / 523.27 189.15 / 4,657.87
b. Total pumping hours Maugong #2 & #3 genset 7.900 / 7.900 172.415 / 153.035
c . Total pumping hours Maugong #3 OMECO 441.58 4,317.60
d . Total pumping hours Maugong #2 OMECO 571.62 4,638.01
e . Total pumping hours Abaca genset/OMECO 12.55 / 500.38 804.03 / 2,653.65
f. Total pumping hours Tuban engine/OMECO 16.62 / 524.25 136.81 / 3,816.8
g. Total pumping hours Alipid engine/OMECO 24.05 / 589.48 136.56 / 4,700.7
h. Total pumping hours Tagumpay engine / OMECO 114.24 / 345.48 249.91 / 3,551.11
i. Total pumping hours GEA Engine / OMECO 23.22 / 469.62 137.52 / 3,712.65
j. Total pumping hours San Francisco engine / OMECO 37.61 / 455.02 362.79 / 3,477.54
k. Total pumping hours Tuburan engine / OMECO 0.00 158.67 / 1,494.89
l. Total pumping hours Sta. Lucia engine / OMECO 47.41 / 425.03 192.21 / 3,654.79
5.3b2 Chlorine Granules consumed
a. Total chlorine granules consumed (kg.) 24.348 241.713
b. Total chlorine dioxide consumed (liter) - Tuburan PH (TP) 208 1,471.50
5.3b3 Kilowatthour consumed
a. Total kwhr cons. Maugong #3 3,501.87 33,086.75
b. Total kwhr cons. Maugong #2 4,533.13 75,186.43
c. Total kwhr cons. Brgy. Ligaya 1,170 10,074
d.. Total kwhr cons. Abaca 10,859 60,136
e. Total kwhr cons. Tuban 768 6,420
f. Total kwhr cons. Alipid 3,410 25,737
g. Total kwhr hours Tagumpay 617 5,080
h. Total kwhr cons. GEA 546.3 4,418.30
i. Total kwhr cons. San Francisco 685.6 4,947.60
j. Total kwhr cons. Tuburan 0 12,162
k. Total kwhr cons. Sta. Lucia 553 4,752
5.4 ACCOUNTED WATER USED (cu. m.) Curr. Month
a. Metered Bill 92,874 734,182
b. Unmetered Bill - -
c. Total Billed (5.4.a + 5.4.b) 92,874 734,182
d. Unmetered unbilled 1268.648 9,153.489
e. Total Accounted (5.4.c+5.4.d) 94,142.648 743,335.489
NUMBER
3
P
P
(cu. meter)
P
PP
PP
PP
PP
PP
PP
PP
PP
PP
PP
PP
PP
PP
PP
PP
PP
PP
PP
PP
PP
PP
PP
PP
PP
PP
PP
PP
PP
PP
PP
PP
PP
PP
PP
PP
PP
PP
PP
PP
PP
PP
PP
PP
PP
PP
PP
PP
PP
PP
PP
PP
PP
PP
PP
PP
PP
PP
PP
PP
PP
PP
PP
PP
PP
PP
PP
PP
PP
PP
PP
PP
PP
PP
PPPPPPPP
PP
PP
PP
PP
PP
PP
PP
PP
PP
PP
PP
PP
PP
PP
PPPPPPPPPPPPPPPPPPPPPPPPPP
PP
PP
PP
PP
PP
PP
PP
PP
PP
PP
PP
PP
PP
PP
PPPPPPPPPPPPPPPPPPPPPPPPPP
PP
PP
PP
PP
PP
PP
PP
PP
PP
PP
PP
PP
PP
PP
PP
PP
PP
PP
PP
PPPPPPPPPPPPPPPPPPPPPPPPPP
PP
PP
PP
PP
PP
PP
PP
PP
PP
PP
PP
PP
PP
PP
PP
PP
PP
PP
PP
PPPPPPPPPPPPPPPPPPPPPPPPPP
PP
PP
PP
PP
PP
PP
PP
PP
PP
PP
PP
PP
PP
PP
PP
PP
PP
PP
PP
PPPPPPPPPPPPPPPPPPPPPPPPPP
PP
PP
PP
PP
PP
PP
PP
PP
PP
PP
PP
PP
PP
PP
PP
PP
PP
PP
PP
PPPPPPPPPPPPPPPPPPPPPPPPPP
PP
PP
PP
PP
PPPPPPPPPPPP

5.5 WATER USED ASSESSMENT Curr. Month Year to Date
a. Ave. mo. Consumption/conn. 18.87
b. Ave. per capita/day cons. .12
c. Unaccounted Water 8.24% 6.09%
d. Non-Revenue producing water 9.47% 7.25%
6. MISCELLANEOUS DATA
6.1 Employees
a. Total = 60 Regular = 34 Casual = 0 Job Order = 26
b. No. of connections/employee _1:143
c. Ave. monthly salary/employee Php 23,446.03
Year to Date
6.2 Bacteriological a. Total Sample Taken 16 123
b. No. of negative results 16 123
c. Test results submitted to LWUA
Year to Date
6.3 Chlorination a.Total Sample Taken 468 3573
b. No. of sample meeting standards 468 3573
c. No. of days fully chlorinated 31
6.4 Board of Directors Curr. Month Year to Date
a. Resolution approved 3 40
b. Policies Passed 3 40
c. Directors' Fee Paid 45,360.00 316,417.50
d. Meeting/s
1. Held (No.) 2 16
2. Regular (No.) 2 16
3. Special (No.) 0 0
7. STATUS OF LOAN PAYMENT TO LWUA: As of August, 2019
Percentage of
Billings Amount Paid Balance amount paid
a. LWUA (LA No. 4-2693) 6,999,999.00 1,684,450.00 5,315,549.00 24.06% 11-2018
6,999,999.00 1,684,450.00 5,315,549.00 24.06%
_4_
14 (JuLY, 2019)
TYPE OF LOAN/FUND
TOTALS
P P
P
P
P
P

7.1 OTHER ON-GOING PROJECTS
Status (Schedule (%)
Types
Batong buhay
Exp. Project
San Francisco
Ext. Project
Punta,
Poblacion
Ext. Project
a. Early Action 100% 100% 100%
b. Pre-Feasibility Study 100% 100% 100%
c. Feasibility Study 100% 100% 100%
d. A & E Design 100% 100% 100%
e. Well Drilling 30% N/A N/A
f. Project Presentation (transm.)on process 0% 100% 100%
g. Pre-Bidding 0% 100% 100%
h. Construction 0% 100% 10%
i. Bidding 0% 100% 100%
8. STATUS OF INSTITUTIONAL DEVELOPMENT: (To be filled up by Advisor)
8.1 Development Progress Indicator
PHASE EARNED MIN. REQ'D VARIANCE MONTHS
8.2 Commercial System/Audit
a. CPS Installed
b. CPS II Installed
c. Management Audit
d. Marketing Assistance
e. Financial Audit
f. _______________
SUBMITTED BY: VERIFIED BY:
JOSE M. ABELEDA, JR.
General Manager Date
NOTED BY:
Area Manager Date
Water Supply System Expansion & Extension
Project
Management Advisor
FMD
_5_

1. SERVICE CONNECTION DATA
Current Month Year-to-Date
1.1 Total Service 5,749
1.2 Total Active 4,859
1.3 Total Metered 4,859
1.4 Total Billed 4,927
1.5 Total Population Billed 24,635
1.6 Changes:
New 29 386
Reconnected 22 246
Disconnected YTD 890 68 337
1.7 Customers in Arrears: 1,689
2. PRESENT WATER RATES: Effective JAN. 1, 2011
LWUA Approved YES / x / NO / / Date Approved: May 26, 2009
Minimum
Curr. Mo. Yr. to Date Charge
Domestic/Gov't - 4,643 208.00
Commercial/Ind.:
( x 2 ) - 64 416.00
( x 1.75 ) - 121 364.00
( x 1.5 ) - 94 312.00
( x 1.25 ) - 5 260.00
Bulk/Wholesale - 0 624.00
TOTAL 4,927
11-20 21-30 31-40 41-up
Domestic/Gov't 23.00 25.50 27.50 29.50
Full Comm. 46.00 51.00 55.00 59.00
Commercial A 40.25 44.60 48.10 51.60
Commercial B 34.50 38.25 41.25 44.25
Commercial C 28.75 31.85 34.35 36.85
Bulk/Wholesale 69.00 76.50 82.50 88.50
3. BILLING & COLLECTION DATA
3.1 BILLINGS (Water Sales) Current Month Year to Date
a. Current (Metered) 2,447,521.73 21,752,401.67
b. Arrears (Flat Rate) - -
c. Penalty Charges 79,371.37 718,176.21
TOTALS 2,526,893.10 22,470,577.88
3.2 COLLECTION (Water Sales) Current Month Year to Date
a. Current Accounts 1,597,866.13 13,813,352.79
b. Arrears(Curr Yr.) 881,588.31 8,212,807.86
c. Arrears(Prev. Yrs.) 709.86 318,943.83
TOTALS 2,480,164.30 22,345,104.48
1
SABLAYAN WATER DISTRICT
Sablayan, Occidental Mindoro
MONTHLY DATA SHEET
For the Month Ending SEPTEMBER 2019
COMMODITY CHARGES
No. of Concessionaire
P
P
P
P

Current Month Year to Date
3.3 ON-TIME-PAID, THIS MONTH ™
(3.2a/3.1a + 3.1b x 100) 65.29% 63.50%
COLLECTION EFFICIENCY-CM
(3.2a + 3.2b/3.1total x 100) 98.12% 98.02%
COLLECTION RATIO-CM
(3.2 total/3.1 total x 100) 97.17%
+ A/R Ending Bal. Dec. 2018 (P525,158.54)
4. FINANCIAL DATA
4.1 REVENUE Current Month Year to Date
a. Operating 2,670,619.26 24,059,107.28
b. Non-Operating - -
TOTALS 2,670,619.26 24,059,107.28
4.2 EXPENSES Current Month Year to Date
a. Salaries & Wages 797,165.00 7,065,425.81
b. Fuel, Oil & Electricity 279,400.12 2,895,966.99
c. Chemicals (equipment) 57,994.88 846,581.98
d. Other O & M Expenses 394,976.40 3,539,568.84
e. Depreciation Expense 229,931.10 1,519,217.23
f. Interest Expense 36,323.00 338,775.00
g. Others 690,589.54 6,642,323.47
TOTALS 2,486,380.04 22,847,859.32
4.3 NET INCOME (LOSS) 184,239.22 1,211,247.96
Current Month Year to Date
4.4 CASH FLOW REPORT
a. Cash Receipts 2,748,620.44 27,542,303.06
b. Disbursements 3,146,978.60 26,961,816.92
c. Total Receipts (Disb.) (398,358.16) 580,486.14
d. Cash Balance-Beginning 2,233,798.30 1,254,954.00
e. Cash Balance-Ending 1,835,440.14 1,835,440.14
4.5 MISCELLANEOUS FINANCIAL DATA
a. Loan Funds (Total) - c. Inventories 3,784,490.95
1. Cash on Hand d. A/R (Net of Allow. For Doubtful) 548,828.74
2. Cash in Bank - e. Customer Deposit Payable 4,107,317.31
b. WD Funds (Total) 7,268,416.77 f. Loans Payable (LWUA & Others) 5,266,202.00
1. Cash Collecting Officer 3,000.00 g. Other Payables 119,046.79
2. Local Currency on Hand 25,025.75
3. Advances to Officers & Employees -
4. Cash in Bank
a. General Fund 700,399.99
b. Guaranty Deposit 1,087,014.40
Total 1,787,414.39
4. Special Deposit (GD) 3,039,036.28
5. Working Fund 20,000.00
6. Cash Reserves 2,393,940.35
_2_
P
P
P
P
P
P
P
P
P
P
P
P
P
PPP
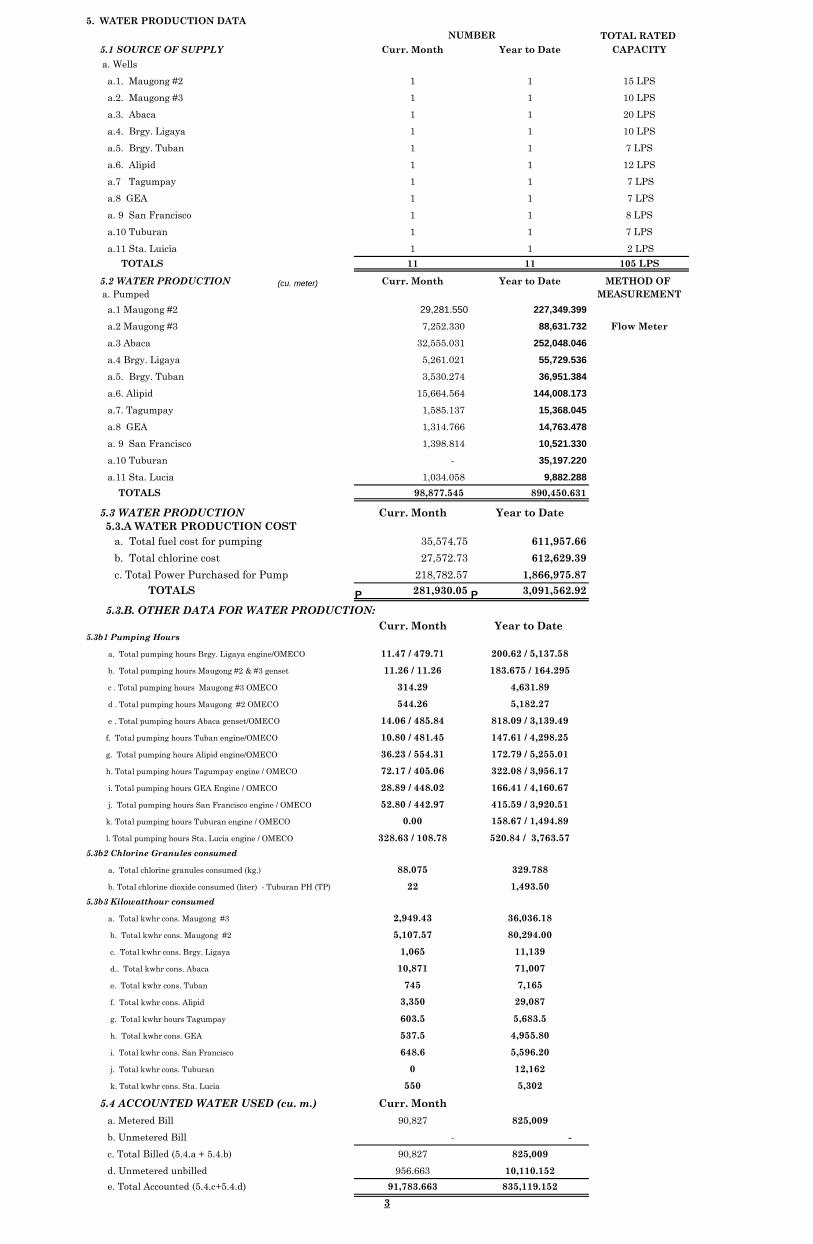
5. WATER PRODUCTION DATA
TOTAL RATED
5.1 SOURCE OF SUPPLY Curr. Month Year to Date CAPACITY
a. Wells
a.1. Maugong #2 1 1 15 LPS
a.2. Maugong #3 1 1 10 LPS
a.3. Abaca 1 1 20 LPS
a.4. Brgy. Ligaya 1 1 10 LPS
a.5. Brgy. Tuban 1 1 7 LPS
a.6. Alipid 1 1 12 LPS
a.7 Tagumpay 1 1 7 LPS
a.8 GEA 1 1 7 LPS
a. 9 San Francisco 1 1 8 LPS
a.10 Tuburan 1 1 7 LPS
a.11 Sta. Luicia 1 1 2 LPS
TOTALS 11 11 105 LPS
5.2 WATER PRODUCTION Curr. Month Year to Date METHOD OF
a. Pumped MEASUREMENT
a.1 Maugong #2 29,281.550 227,349.399
a.2 Maugong #3 7,252.330 88,631.732 Flow Meter
a.3 Abaca 32,555.031 252,048.046
a.4 Brgy. Ligaya 5,261.021 55,729.536
a.5. Brgy. Tuban 3,530.274 36,951.384
a.6. Alipid 15,664.564 144,008.173
a.7. Tagumpay 1,585.137 15,368.045
a.8 GEA 1,314.766 14,763.478
a. 9 San Francisco 1,398.814 10,521.330
a.10 Tuburan - 35,197.220
a.11 Sta. Lucia 1,034.058 9,882.288
TOTALS 98,877.545 890,450.631
5.3 WATER PRODUCTION Curr. Month Year to Date
5.3.A WATER PRODUCTION COST
a. Total fuel cost for pumping 35,574.75 611,957.66
b. Total chlorine cost 27,572.73 612,629.39
c. Total Power Purchased for Pump 218,782.57 1,866,975.87
TOTALS 281,930.05 3,091,562.92
5.3.B. OTHER DATA FOR WATER PRODUCTION:
Curr. Month Year to Date 5.3b1 Pumping Hours
a. Total pumping hours Brgy. Ligaya engine/OMECO 11.47 / 479.71 200.62 / 5,137.58
b. Total pumping hours Maugong #2 & #3 genset 11.26 / 11.26 183.675 / 164.295
c . Total pumping hours Maugong #3 OMECO 314.29 4,631.89
d . Total pumping hours Maugong #2 OMECO 544.26 5,182.27
e . Total pumping hours Abaca genset/OMECO 14.06 / 485.84 818.09 / 3,139.49
f. Total pumping hours Tuban engine/OMECO 10.80 / 481.45 147.61 / 4,298.25
g. Total pumping hours Alipid engine/OMECO 36.23 / 554.31 172.79 / 5,255.01
h. Total pumping hours Tagumpay engine / OMECO 72.17 / 405.06 322.08 / 3,956.17
i. Total pumping hours GEA Engine / OMECO 28.89 / 448.02 166.41 / 4,160.67
j. Total pumping hours San Francisco engine / OMECO 52.80 / 442.97 415.59 / 3,920.51
k. Total pumping hours Tuburan engine / OMECO 0.00 158.67 / 1,494.89
l. Total pumping hours Sta. Lucia engine / OMECO 328.63 / 108.78 520.84 / 3,763.57
5.3b2 Chlorine Granules consumed
a. Total chlorine granules consumed (kg.) 88.075 329.788
b. Total chlorine dioxide consumed (liter) - Tuburan PH (TP) 22 1,493.50
5.3b3 Kilowatthour consumed
a. Total kwhr cons. Maugong #3 2,949.43 36,036.18
b. Total kwhr cons. Maugong #2 5,107.57 80,294.00
c. Total kwhr cons. Brgy. Ligaya 1,065 11,139
d.. Total kwhr cons. Abaca 10,871 71,007
e. Total kwhr cons. Tuban 745 7,165
f. Total kwhr cons. Alipid 3,350 29,087
g. Total kwhr hours Tagumpay 603.5 5,683.5
h. Total kwhr cons. GEA 537.5 4,955.80
i. Total kwhr cons. San Francisco 648.6 5,596.20
j. Total kwhr cons. Tuburan 0 12,162
k. Total kwhr cons. Sta. Lucia 550 5,302
5.4 ACCOUNTED WATER USED (cu. m.) Curr. Month
a. Metered Bill 90,827 825,009
b. Unmetered Bill - -
c. Total Billed (5.4.a + 5.4.b) 90,827 825,009
d. Unmetered unbilled 956.663 10,110.152
e. Total Accounted (5.4.c+5.4.d) 91,783.663 835,119.152
NUMBER
3
P
P
(cu. meter)
P
PP
PP
PP
PP
PP
PP
PP
PP
PP
PP
PP
PP
PP
PP
PP
PP
PP
PP
PP
PP
PP
PP
PP
PP
PP
PP
PP
PP
PP
PP
PP
PP
PP
PP
PP
PP
PP
PP
PP
PP
PP
PP
PP
PP
PP
PP
PP
PP
PP
PP
PP
PP
PP
PP
PP
PP
PP
PP
PP
PP
PP
PP
PP
PP
PP
PP
PP
PP
PP
PP
PP
PP
PP
PPPPPPPP
PP
PP
PP
PP
PP
PP
PP
PP
PP
PP
PP
PP
PP
PP
PPPPPPPPPPPPPPPPPPPPPPPPPP
PP
PP
PP
PP
PP
PP
PP
PP
PP
PP
PP
PP
PP
PP
PPPPPPPPPPPPPPPPPPPPPPPPPP
PP
PP
PP
PP
PP
PP
PP
PP
PP
PP
PP
PP
PP
PP
PP
PP
PP
PP
PP
PPPPPPPPPPPPPPPPPPPPPPPPPP
PP
PP
PP
PP
PP
PP
PP
PP
PP
PP
PP
PP
PP
PP
PP
PP
PP
PP
PP
PPPPPPPPPPPPPPPPPPPPPPPPPP
PP
PP
PP
PP
PP
PP
PP
PP
PP
PP
PP
PP
PP
PP
PP
PP
PP
PP
PP
PPPPPPPPPPPPPPPPPPPPPPPPPP
PP
PP
PP
PP
PP
PP
PP
PP
PP
PP
PP
PP
PP
PP
PP
PP
PP
PP
PP
PPPPPPPPPPPPPPPPPPPPPPPPPP
PP
PP
PP
PP
PPPPPPPPPPPP

5.5 WATER USED ASSESSMENT Curr. Month Year to Date
a. Ave. mo. Consumption/conn. 18.43
b. Ave. per capita/day cons. 0.12
c. Unaccounted Water 7.17% 6.21%
d. Non-Revenue producing water 9.47% 7.35%
6. MISCELLANEOUS DATA
6.1 Employees
a. Total = 60 Regular = 34 Casual = 0 Job Order = 26
b. No. of connections/employee _1:143
c. Ave. monthly salary/employee Php 23,446.03
Year to Date
6.2 Bacteriological a. Total Sample Taken 16 139
b. No. of negative results 16 139
c. Test results submitted to LWUA
Year to Date
6.3 Chlorination a.Total Sample Taken 454 4027
b. No. of sample meeting standards 454 4027
c. No. of days fully chlorinated 30
6.4 Board of Directors Curr. Month Year to Date
a. Resolution approved 1 41
b. Policies Passed 1 41
c. Directors' Fee Paid 28,035.00 344,452.50
d. Meeting/s
1. Held (No.) 2 18
2. Regular (No.) 2 18
3. Special (No.) 0 0
7. STATUS OF LOAN PAYMENT TO LWUA: As of September, 2019
Percentage of
Billings Amount Paid Balance amount paid
a. LWUA (LA No. 4-2693) 6,999,999.00 1,733,798.00 5,266,201.00 24.77% 11-2018
6,999,999.00 1,733,798.00 5,266,201.00 24.77%
_4_
16 (August, 2019)
TYPE OF LOAN/FUND
TOTALS
P P
P
P
P
P

7.1 OTHER ON-GOING PROJECTS
Status (Schedule (%)
Types
Batong buhay
Exp. Project
San Francisco
Ext. Project
Punta,
Poblacion
Ext. Project
a. Early Action 100% 100% 100%
b. Pre-Feasibility Study 100% 100% 100%
c. Feasibility Study 100% 100% 100%
d. A & E Design 100% 100% 100%
e. Well Drilling 30% N/A N/A
f. Project Presentation (transm.)on process 0% 100% 100%
g. Pre-Bidding 0% 100% 100%
h. Construction 0% 100% 10%
i. Bidding 0% 100% 100%
8. STATUS OF INSTITUTIONAL DEVELOPMENT: (To be filled up by Advisor)
8.1 Development Progress Indicator
PHASE EARNED MIN. REQ'D VARIANCE MONTHS
8.2 Commercial System/Audit
a. CPS Installed
b. CPS II Installed
c. Management Audit
d. Marketing Assistance
e. Financial Audit
f. _______________
SUBMITTED BY: VERIFIED BY:
JOSE M. ABELEDA, JR.
General Manager Date
NOTED BY:
Area Manager Date
Water Supply System Expansion & Extension
Project
Management Advisor
FMD
_5_


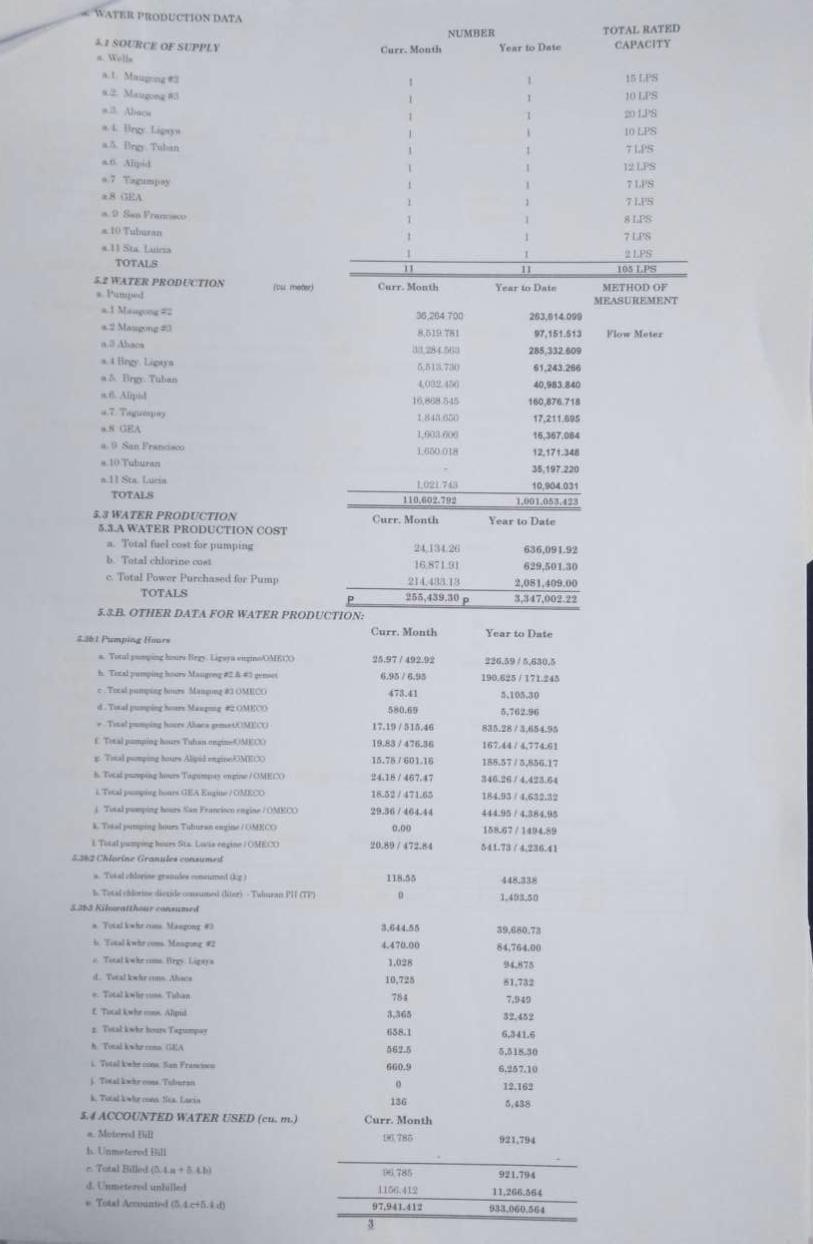
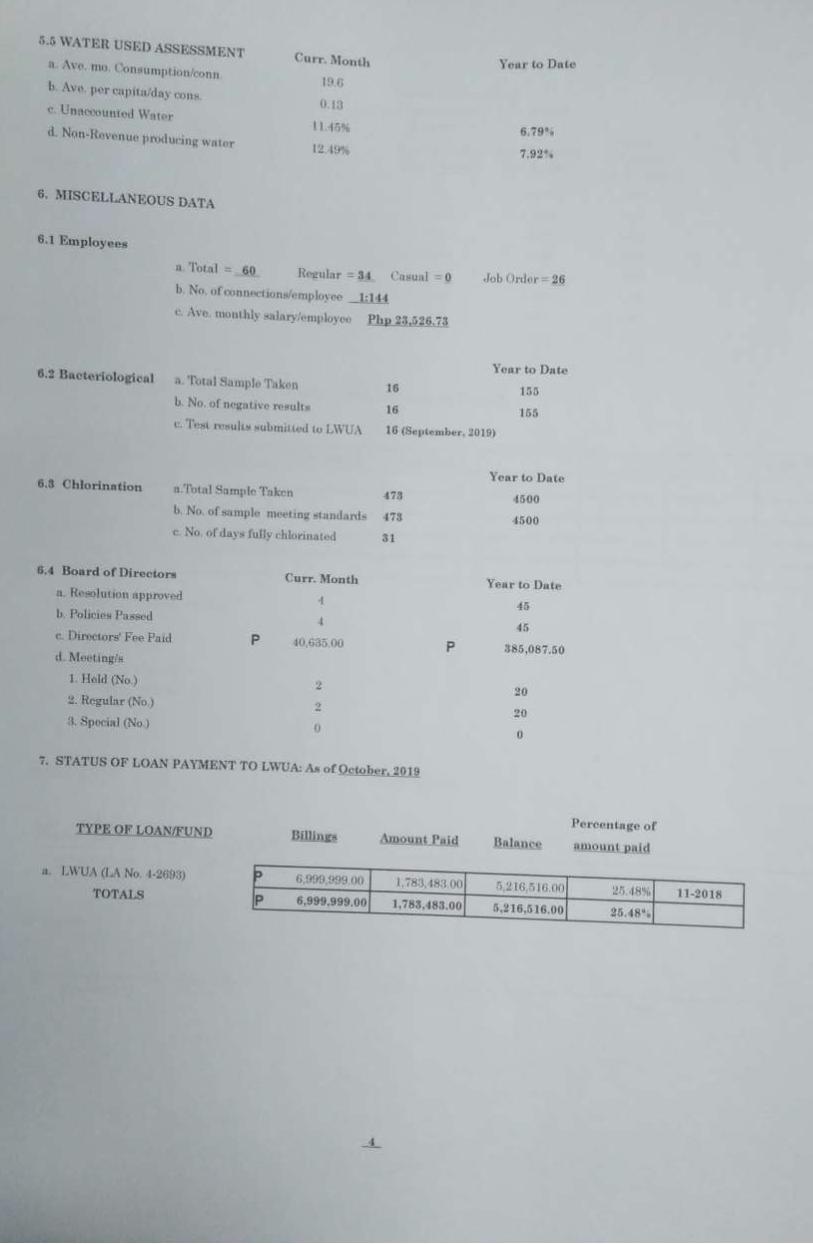
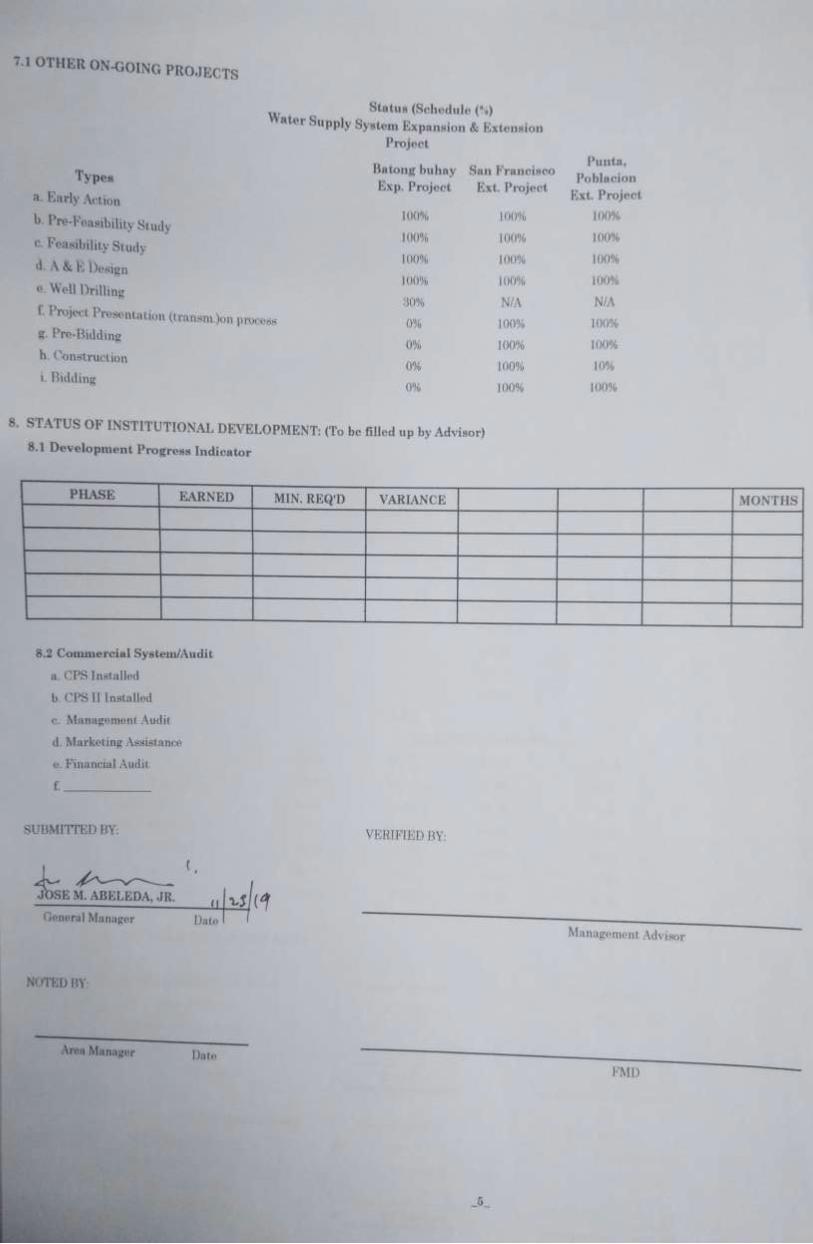


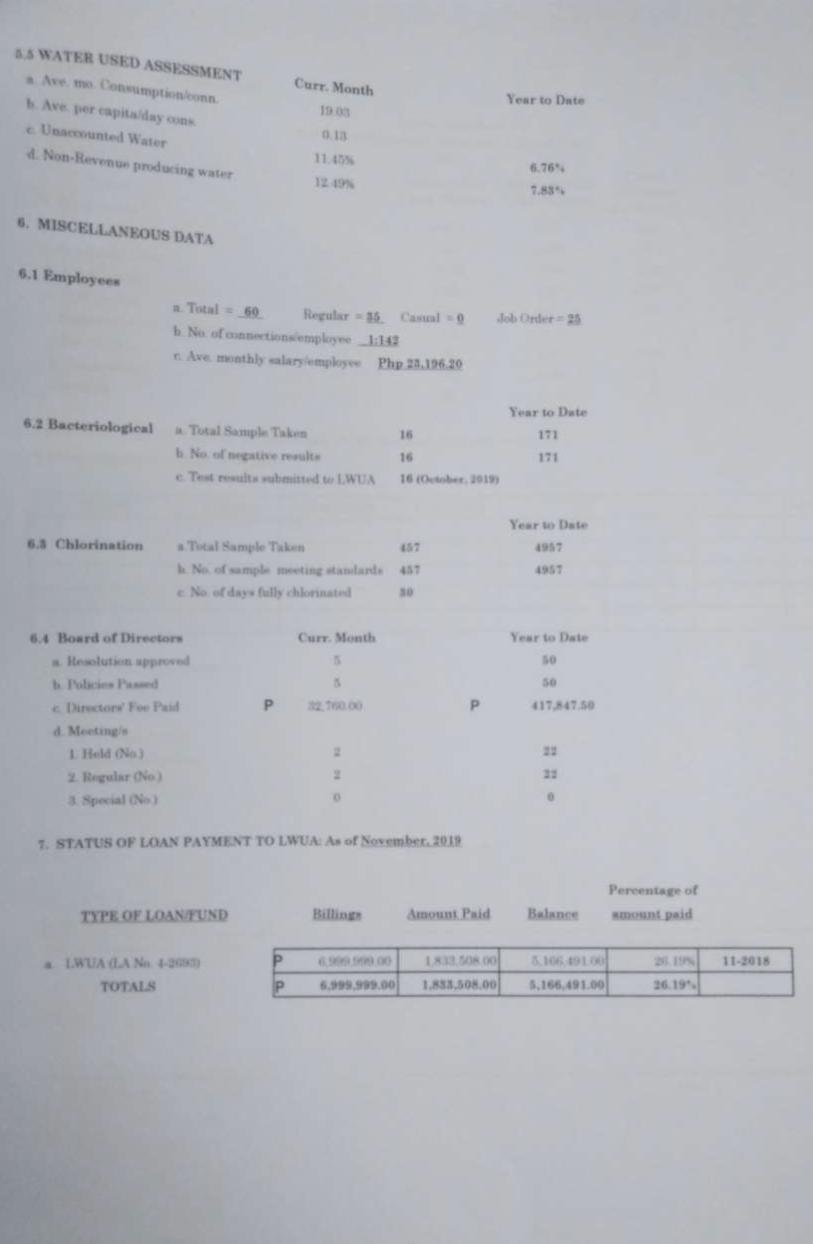
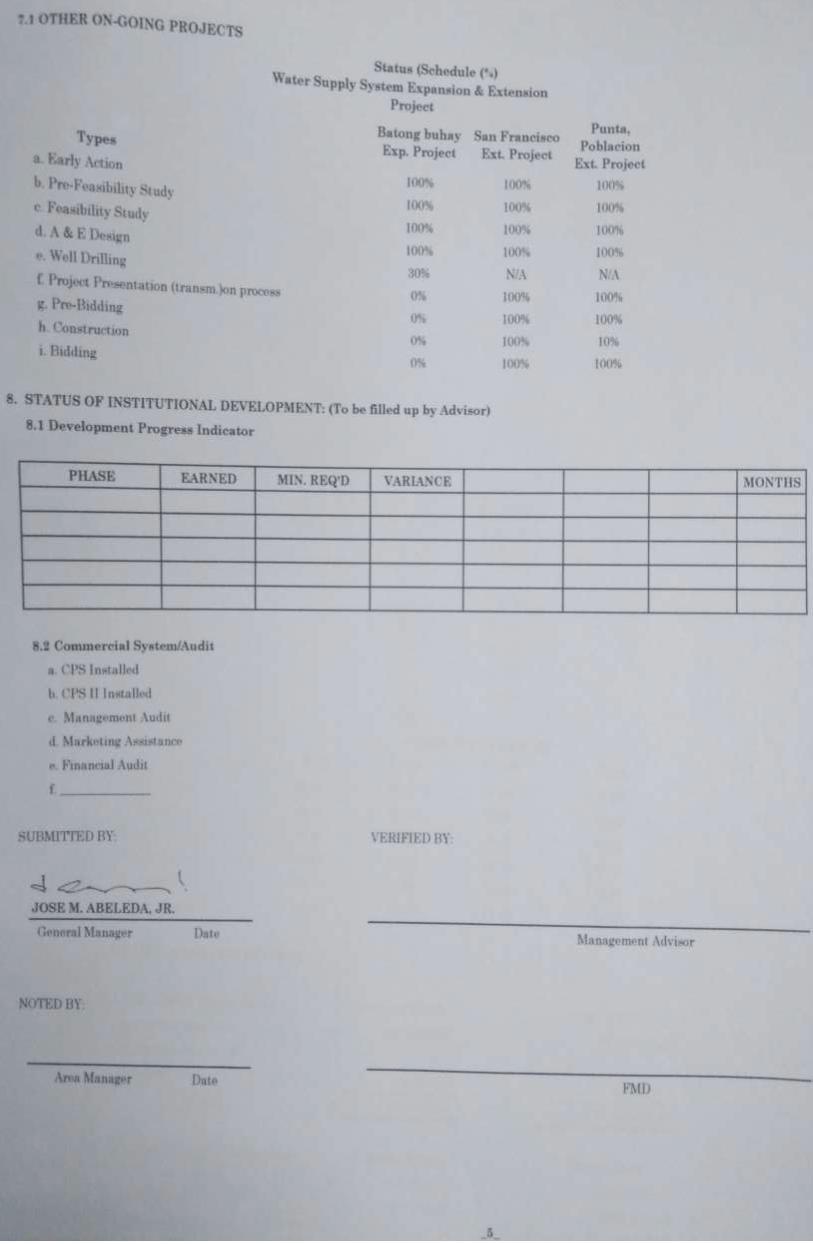

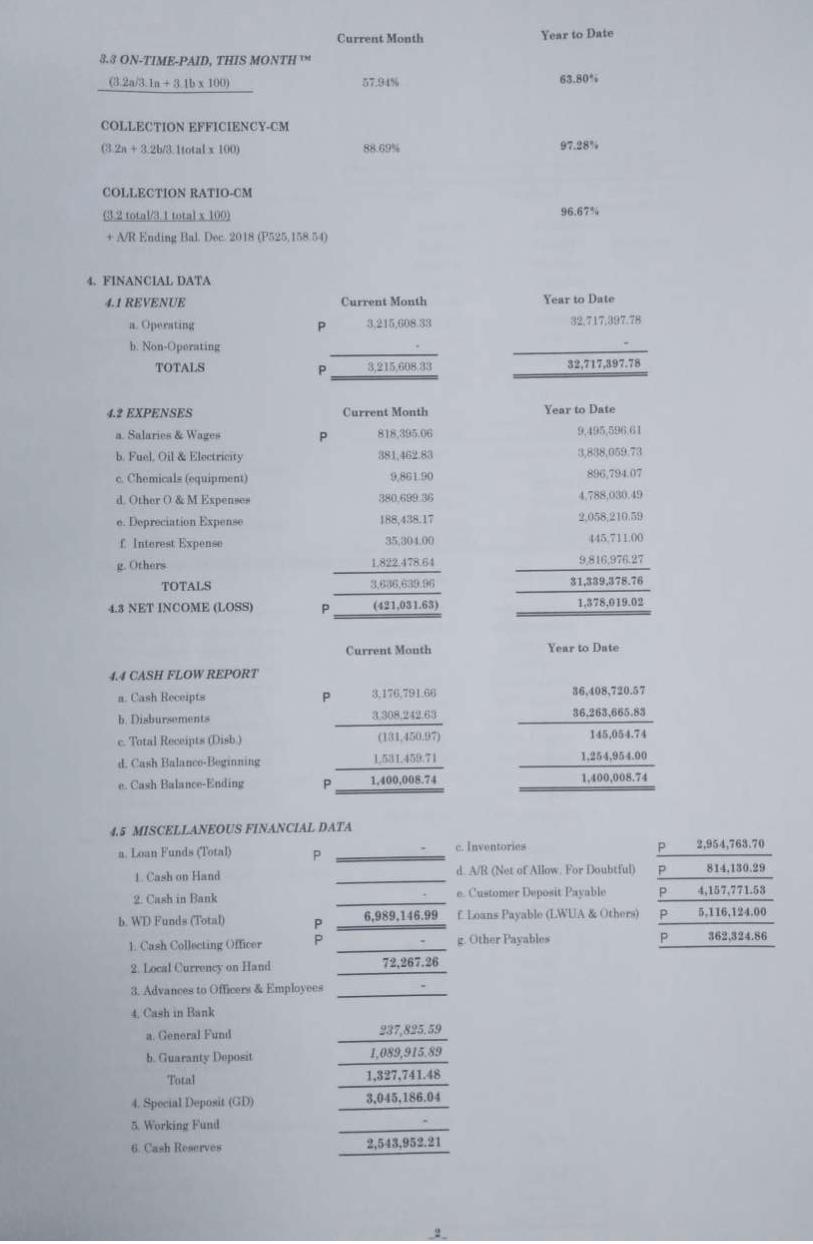
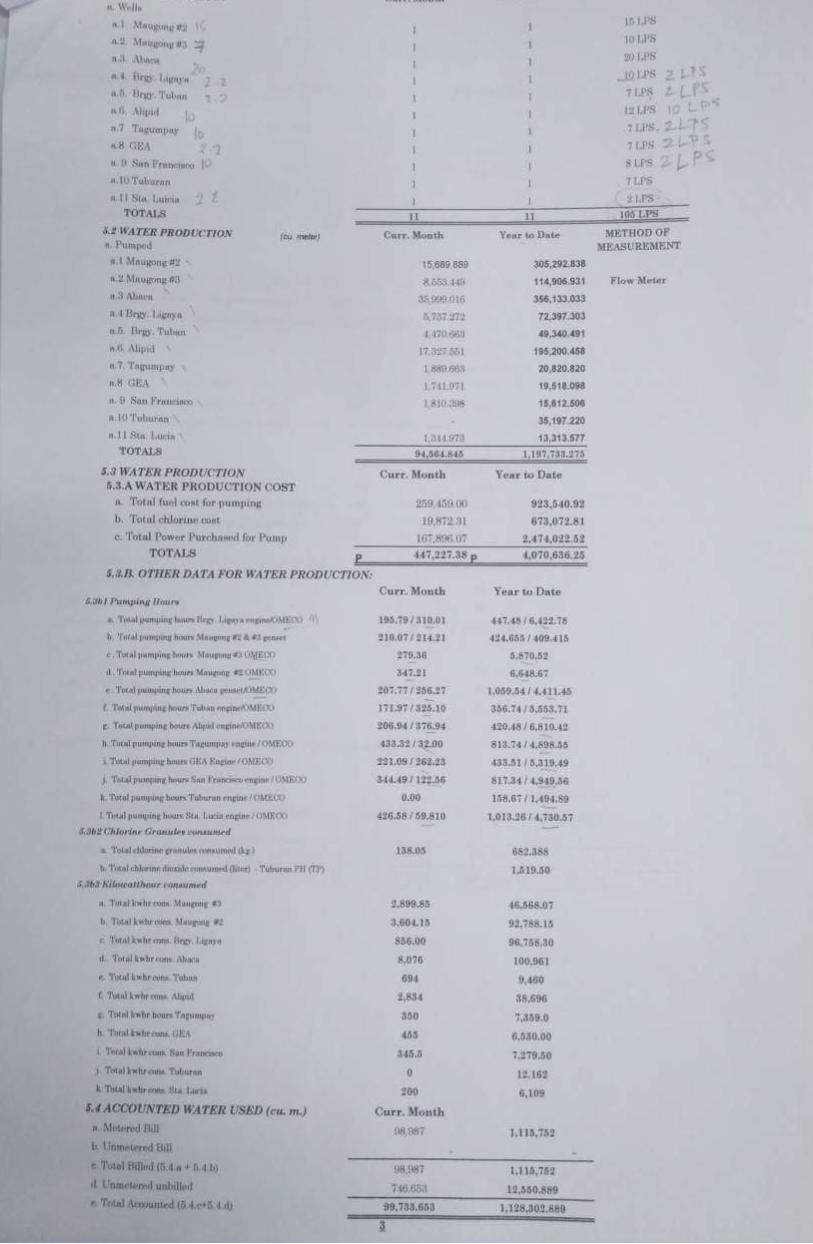
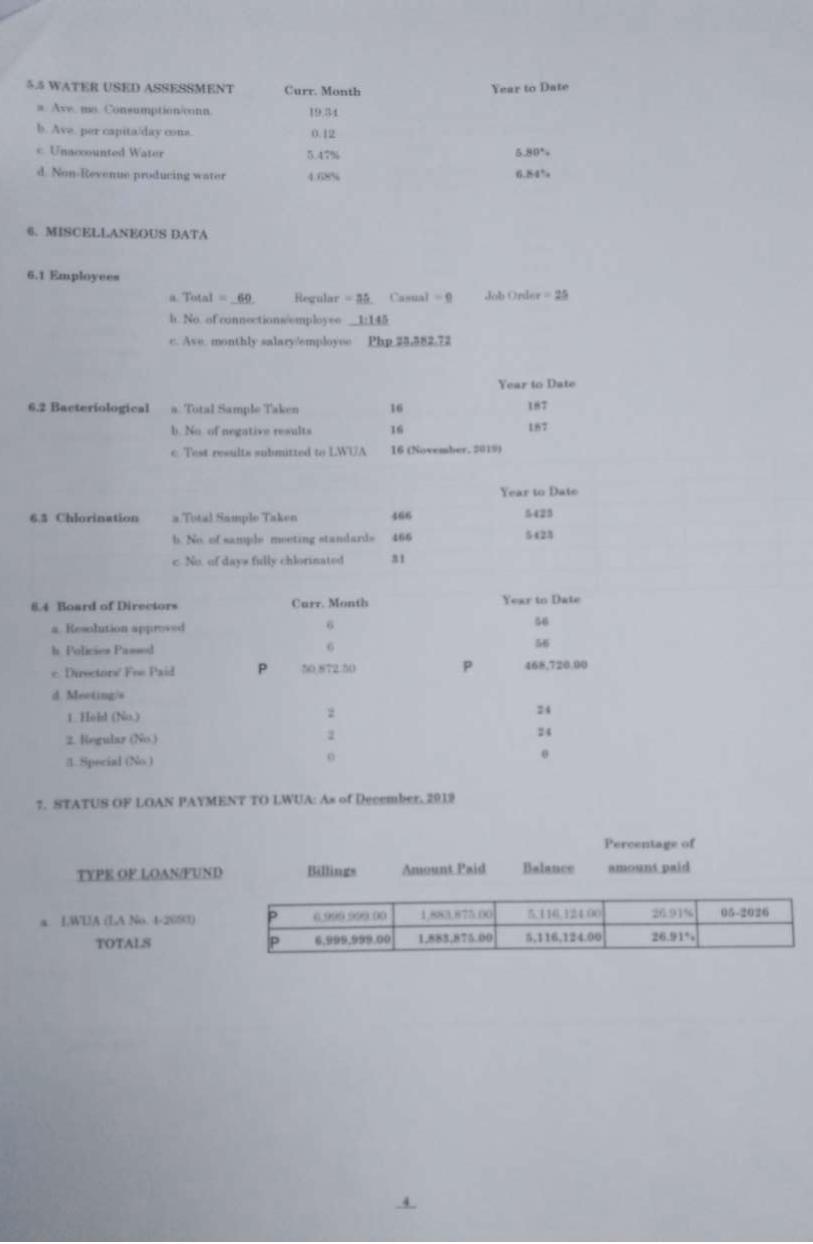

Related Documents


