The Forest Resources of the Northern COllntrles, p. 22. Finland's Balance of Payments for 1980, p. 29. BANK OF FINLA·ND MONTHLY BULLETIN No. 8 AUGUST 1931 THE FINNISH MARKET REVIEW. THE MONEY rhe serious financial crisis whjch has shaken economic conditions· in several European coun- proQ.ucing other results a rise in rates of discount in various quarters, has not directly affected the money market in Fin- l!lnd .. The development on the money market was quiet in July and during the first half of . There was certainly a tendency to- wards a tightening of the position on the Fin- nish money market too, but, for the present at any rate, this is only weak. The de- pression continues without interruption. All is weak, the fall in prices and the number of bankruptcies is considerable. .A. particularly pleasing feature is. nevertheless· worthy of mention: the balance of trade is particularly favourable, which of course helps to ease the financial situation. .. With regard to the Joint Stock banks, the hard direction and the month of July. in. the two preceding years showed a decrease in deposits. . . The position of the Joint Stock banks towards foreign countries showed in July a distinct im- provement as is generally the case at this time of the year when export is. lively .. The banks' foreign. indebtedness decreased from 308.2 to ·255.1 million marks whereas their foreign credits rose from 254.4 to 285.2 million marks. As the. banks at the end of June had a net indebtedness to foreign countries of 53.8 million marks;. thfs has been changed during the course of July to a credit balance abroad of 30.1 million m.arks. The position of the Bank of Finland im.proved to some extent in July. The total credits were decreased in July by 36.1 million marks to 736.8 million marks. At the same time the notes in circulation also· decreased. The reserve of foreign currency at the bank's disposal also sank some- what in July by 20.1 million marks to 642.2 times manHest themselves, ·among other respects, mjIlion marks. The improvement in the Bank's the failU:re of one of the smallest of them, position is most apparent from the fact that its the Export Bank of :finland, Ltd. The import- note reserve rose by 52.2 millions to 754.5 million ance of this was small as its balance sheet total marks. This was thus slightly thiu1 a year was only slightly over 60 million marks, but the earlier (851.4 millions), but much larger than at absence·of this amount influenced of course,.the .. the same time in 1929, when it only am.ounted· development of the bank statistics. The credits granted by the Joint Stock banks thus sank during July by 48.5 million marks while the rt"duction in July 1930 amounted to 205.2 mil- hon marks and in 1929 to 115.5 million marks. Deposits, on the other hand, showed a slight in- crease of 14.2 million marks, which is worthy of notice as the position in this respect during the )ther months of the year has been in the opposite to 347.7 million marks. The ordinary note cover amounted to 70.9 per cent of the aggregate sight engagements. During the two first weeks of August the situation developed to some extent in the same direction. Thus the reserve of foreign currency was decreased by 11.1 mIllion marks. But, on the other hand, total credits granted by the Bank of Finland were increased by 16.6 million marks

Welcome message from author
This document is posted to help you gain knowledge. Please leave a comment to let me know what you think about it! Share it to your friends and learn new things together.
Transcript
The Forest Resources of the Northern COllntrles, p. 22. Finland's Balance of Payments for 1980, p. 29.
BANK OF FINLA·ND
MONTHLY BULLETIN No. 8 AUGUST 1931
THE FINNISH MARKET REVIEW. THE MONEY MARK~T.
rhe serious financial crisis whjch has shaken economic conditions· in several European coun~ries, proQ.ucing ~mong other results a rise in ~he rates of discount in various quarters, has not directly affected the money market in Finl!lnd .. The development on the money market was quiet in July and during the first half of .A.ugust~ . There was certainly a tendency towards a tightening of the position on the Finnish money market too, but, for the present at any rate, this is only weak. The ~eneral depression continues without interruption. All ~nterprise is weak, the fall in prices ~ontinues and the number of bankruptcies is considerable . .A. particularly pleasing feature is. nevertheless· worthy of mention: the balance of trade is particularly favourable, which of course helps to ease the financial situation.
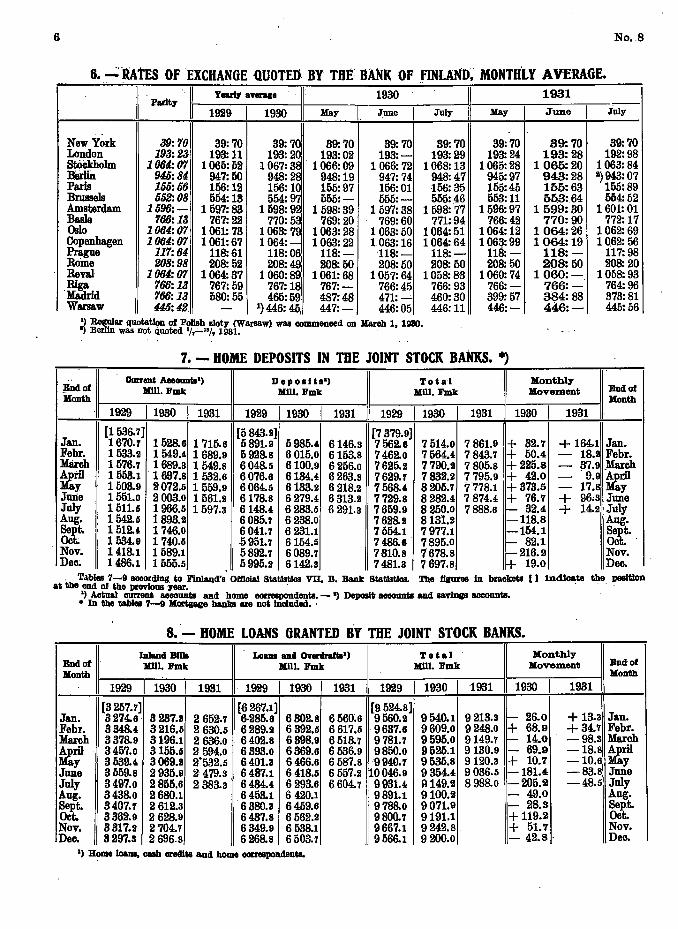
.. With regard to the Joint Stock banks, the hard
direction and the month of July. in. the two preceding years showed a decrease in deposits.
. . The position of the Joint Stock banks towards
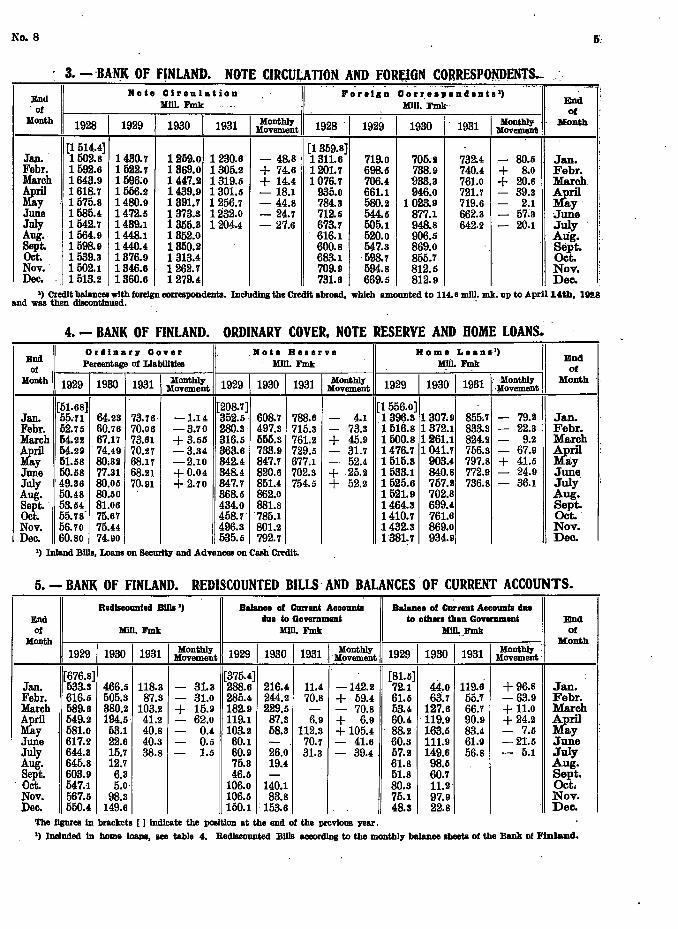
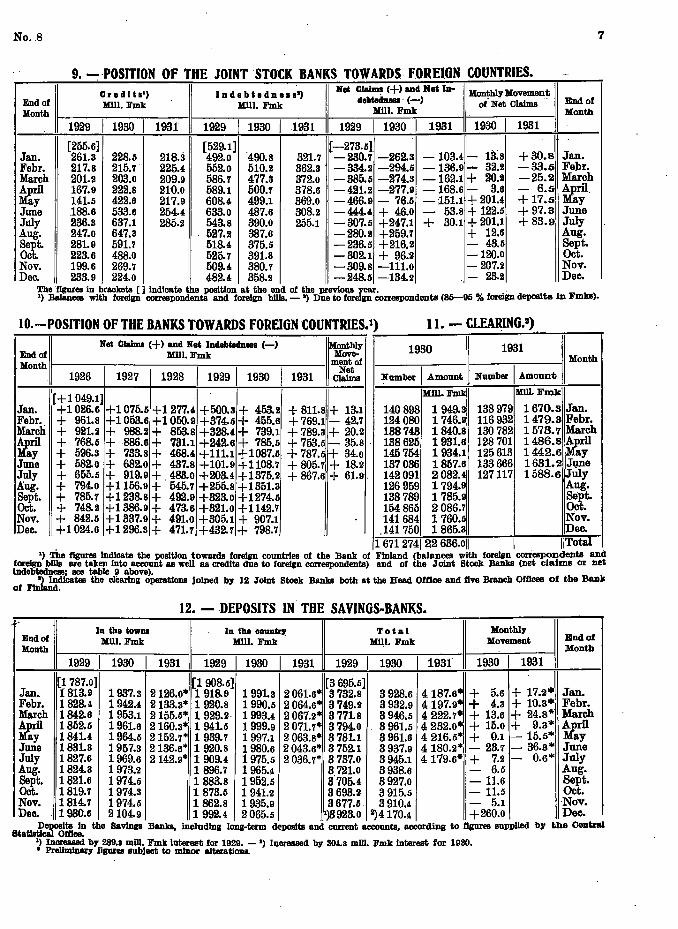
foreign countries showed in July a distinct improvement as is generally the case at this time of the year when export is. lively .. The banks' foreign. indebtedness decreased from 308.2 to
·255.1 million marks whereas their foreign credits rose from 254.4 to 285.2 million marks. As the. banks at the end of June had a net indebtedness to foreign countries of 53.8 million marks;. thfs has been changed during the course of July to a credit balance abroad of 30.1 million m.arks.
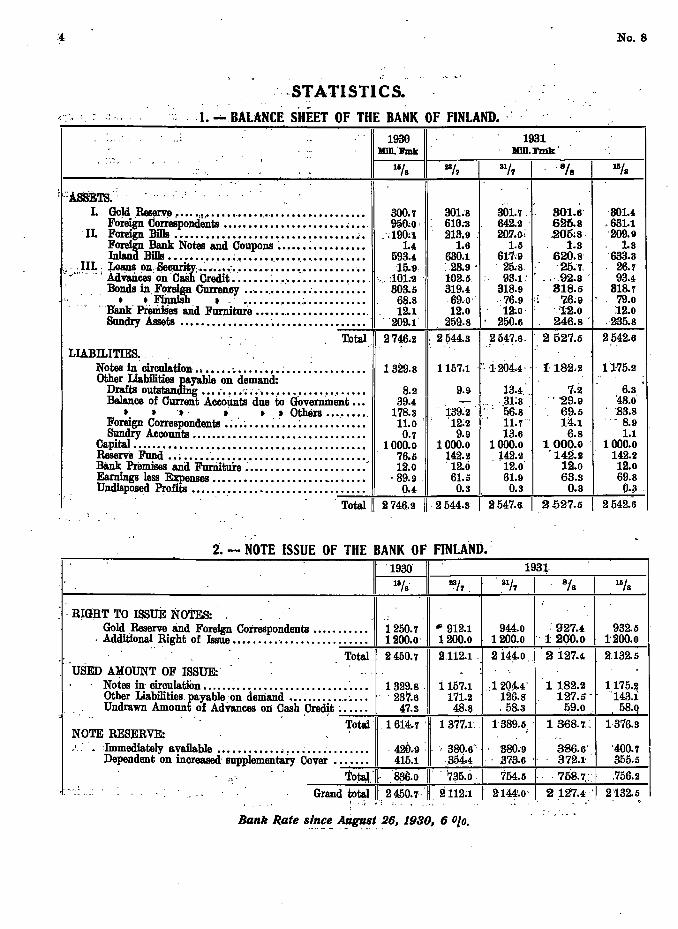
The position of the Bank of Finland im.proved to some extent in July. The total credits were decreased in July by 36.1 million marks to 736.8 million marks. At the same time the notes in circulation also· decreased. The reserve of foreign currency at the bank's disposal also sank somewhat in July by 20.1 million marks to 642.2
times manHest themselves, ·among other respects, mjIlion marks. The improvement in the Bank's i~l the failU:re of one of the smallest of them, position is most apparent from the fact that its the Export Bank of :finland, Ltd. The import- note reserve rose by 52.2 millions to 754.5 million ance of this was small as its balance sheet total marks. This was thus slightly le~s thiu1 a year was only slightly over 60 million marks, but the earlier (851.4 millions), but much larger than at absence·of this amount influenced of course,.the .. the same time in 1929, when it only am.ounted· development of the bank statistics. The credits granted by the Joint Stock banks thus sank during July by 48.5 million marks while the rt"duction in July 1930 amounted to 205.2 milhon marks and in 1929 to 115.5 million marks. Deposits, on the other hand, showed a slight increase of 14.2 million marks, which is worthy of notice as the position in this respect during the )ther months of the year has been in the opposite
to 347.7 million marks. The ordinary note cover amounted to 70.9 per cent of the aggregate sight engagements.
During the two first weeks of August the situation developed to some extent in the same direction. Thus the reserve of foreign currency was decreased by 11.1 mIllion marks. But, on the other hand, total credits granted by the Bank of Finland were increased by 16.6 million marks
2.
owing··to the-fact that re-discounts were increased by 25.3 million marks.. The note reserve and the cover percentage, on the, otller hand, were not altered to any great exteJit.· .' ,
The falling tendency still ' characterises the level of prices. The wholesale price index fell by 1 point to 82 ag~inst 86 'at the e:nd of last yeal' and 90 in July 1930. The cost' of living index on the other hand, rose by 1 point to 1,021, but has fa11e:r;l since the end of last year by 62 points.
TRAi:m '"AND·INDUSTRY.
Foreign ttade developed ;in: July in'the same . manner as during the first half of the current year, i:e .. both imports and exports showed falling figures - especially in respect of value, but ~lso in respect of quantities. The value of imports amounted during July to 303.4 million marks
. against 457.2 and 639.1 millions for 1930 and 1929. The import quantity sank by 20.5 per cent from July i-930andby 33.8 per cent from the same month in 1929. Exports have maintained themselves better. Their value amounted.in July of. tltis year to 520.8 million marks corresponding to 707.9 millions last year and 801.6 millions in the same month 192§. The decrease in export quantities, on the other hand, amounted to only 8.1 and 15.4 per cent. The balance of trade turned out, as is customary during the summer months, favourably. July showed an export surplus of 217.4 million marks, so that the balance of trade for the first seven months of the year closed with a surplus of 439.9 million marks. Finland's balance of trade has hardly ever been to such an extent favourable, even if it has always b~en tile rule that during times of depression exports exceed imports.
No. 8
'.:'- ·With regard to trade in the "different -groups of goods, it is noticeable that the export of butter ,and cheese ,and also of eggs and bacon show considerably higher figures than last year. Imports of rye; wheaten' flour, cattle food, sugar, tobacco, textiles, pig iron, iron plates. motor cars, petrol ~nd othe~ oils, ceme~t' a~d ;~thersimilar goods were, on the other hand, considerably lower than last year. Th~ position on the timber market-continues
unchanged.. During the course of July about 40,000 standards were sold, so that a total of 420,000. standards. of sawn goods had by that time been sold. The fact that the contract between the Central Softwood Buying Corporation and the' Russian sales .organisation Exportless was recently altered in that, among other points, the quantity was reduced from 600,000 to 500,000 standards and prices were reduced, tends to stabilise the market. As the prices offered by the Finnish exporters are partly lower than those mentioned, there should be no reason for expecting a further fall in prices.
The market in cellulose shows a better tendency, especially for sulphate, the enquiry for which has been larger than for some time. Prices: continue, however, to be unsatisfactory. Quite considerable contracts have been closed for delivery of sulphite cellulose for 1931, 1932 a~d. also for 1933.
THE LABOUR MARKET.
The position on the labour market has not undergone any change. As is customary in July ~
. the number of unemployed registered in the employment agency offices rose somewhat, amounting to 6,790 against 4,026 a year ago.
No.8 8
CONTENTS OF THE TABLES . I. MONEY MARKET. . m.,.~E.·
1. 2. 3. 4. 6.
Bank 01 Finland: Balance sheet. Note issue.
. ,
· Note circulation and foreign correspondents. Ordinary cover, note reserve and home loans. Rediscounted bills and balances of current accounts. . .
6. Rates of exchange. J wd Stock banks:
7. Home deposits. 8. Home loans. . 9. Position with regard to fbreign countries. .
22. Value ofimports and exports. .2a . V/ilileof imports and exports in different groups
ofgoods.- .., .. 24. Imports of the most important articles. 26. JJ:xports... • • 26. Foreign Trade with various countries. 27. Import-price index. 28. ExPort-price index. 29. Index numbers for quantities of imports and
exports.· . 00. ·TOtal sales of some· wholesale-firms •.
10. Position of the banks towards foreign countries. 11. Clearing. . .. IV. _ TBAmc. 12. DepoSits in the savin~s banks. . . 31 •. Forei~ shipping.. . . . .
·13. Deposits in Post Office Savin~ Bank and on 82. Ship~ Wlth ·various countries and palisBnger Consumers' Co-operative Societies' Savings AA:.. traffic. - . count. . 38, Railways, goods traffic and rolling stock.
14. Deposits in Co-operative Credit Societies. . 84. Railways' revenue, expenditure· and traffic 16. New.risks insured by Life Assurance Co~es.. surplus. 16. Changes in Number and Capital of ·ted
ComJl&l!ies.. . -17; HeIsmgfors Stock: Exchange. Bankruptcies.'
Protested Bills. 18.. Stock: Exchange index.
V. LEVEL OF PRICES. 36. Index number of cost of living. 36. Wholesale P11C«! Index.
11. STATE FlIIAIlCES. . 19. National Debt. . VI.· LABOUR MARKET • 20. State revenue and expenditure. . . 21. Miscellaneous State receipts collected by Customs.'
37. Number of unemployed. 38. Cessation of Work.
SOME ARTICLES IN EARLIER ISSUES OF BANK OF FINLAND MONTHLY. BULLETIN.
1929 No. 3. The Metal Indust~ of Finland. 1930 No. 6. The Forest Resources of Finland and the • • The Harvest in 1 28 and S£ncial Measures. future. , 4. The Finnish Joint Stock ks in 1928. • • • The Finnish Wholesale Price Index for im-
• 6. Economic '~estions before the Diet. Cd and ~orted goods. • • • The New W oIesale Price Index for Finland. • 7. . ·sh State inances in 1929. • • 6. Finnish State Finances in 1928. • • 8. The State Railways during 1929. • • 7. The Co-operative Agricultural Credit Society • • Finland's Balance of Payments for 1929.
Movement. . • 9. The Tendency of prices in Finland. -• 8. Finland's Balance of Pacents for 1928. Measures for improving the Quality of Export • • The Imatra Power Plant ~s 0catilms. Butter. • • 9. The Growth of Population ID Fin d. , • 10. The Leather and Leather goods Industry. • • • The Cultivation of Garden Produce in Fin- • 11. Exports of Finnish Woodworking Products.
land. .., ,. , • Standardising in Finland. . ,. 10. Traffic in the Finnish Harbours. , • 12. Finland and the Agricultural Crisis. • • • .Atlas of Finland. » • t The Finnish Bu,\et for 1931. • • 11. Agricultural Organisations. 1931 • 1. A Survey of the conomic Position in Fin-
• • ~ecial :Measures for Promoting Small-scale land in 1930. . Farming. . » • Results of the Bank of Finland for 1930. .
• • 12. The Consumption of Fuel in Finnish • 2. Foreign Trade in 1930. Indusgy. • • FinniSh Industry in 1929.
• • • The Finnish B~et for 1930. ,. 3. Recent Developments in Finnish Wholesale 1930 • 1. A Survel! of the conomic Position in Fin~ Trade.
land in 929 •. • ,. • Rates of Interest in Finland. . • t ,. .. Results of the Bank of Finland for 1929. • 4. T.he Finnish Joint Stock Banks in ·1930.
• 2. Fort't Trade in 1929. . ,. ,. o. The New Sa~ .Bank Law. • • » Bull . g in the Towns in recent years. • » 6. Finnish State Fmances in 1930. • • 3. Growth and Cuttings in the Finnish Forests. » » » Air Traffic in ·Finland.
4. The Finnish Joint Stock Banks in 1929. • • 7. The Finnish Highways and their mainte-• o. Devel0l.ment of the Sawmill Industry of nance.
FinIan •
'. -STATISTICS •
. ' .. 1. ~ BALANCE SHEET OF THE BANK OF FINLAND •. :
1980 HiI1:lI'mk
IIJ/s
1981 MIll. FD:ik '
No. 8
t::ASSETS.· .. .'. L Gold Hes!!"" .: .... ,',..... •.•••• •.•.•••••••••••••••••• 000.7 001;8 001..7,. B01.6· '001.4
Fo. Correspondents ....................... ;.... 990;0, 610;3 642.2' 625.8 .681.1 . IL FOre!gn Bills ................................. .... :;190:1 213 •. 9. 207.0, .205:8 ·209.9 ¥cl:!r Bank Notes and Coupons ~ ..... ;.......... 1.4 1.6 1.5 1.3· 1.3
Bills ......... ; ••. ;.............. •.•••••••••• 598.4 680.1 617';9 620.8' '688.3 ",J~I:; lans on:.~ec;uri1;Y;~.~~ •••.• : .............. ~ .......... ;. 15.9 :28;9' " 25;8. 25.7. . 26.7
, ~ . Advances on CaSb: Credit ....... ; .................. , .... :101."9 '102.5. 98.L .. ,·92.3 . 98.4 . Bonds in F!lre!gnCurrency ... ~ ... ~ ............. ~... 808.5 819.4 818.9 B18.5 818.7
• • Finnisn ............... ~........... 68.8 69.0' 76.9 'Z6;9 '79.0 Bank' PrerirlSes &rid Furniture ........ :............. 12.1 12.0 12-.0 . '12.0 12.0 Sundry Assets .............................. ';':':-;";';"..:-' To' _·..,;·2;;,;0,;;,9 • .;;,1_· r' ,,;;2;,;..59;;;,. . .;;;,.8 +~25~0_.6-+-::--=-24-:-6:-._8 -1' i-:" -:23~5:-.8_1
, Total. 2746.2 : 2~44.32547.6 .. 2527.5 2542.6 LIABILITIES., .
Notes in' circuIatioa ....... ~ ........ ; .... : .. .. • .. .. • 1 829.8
~~!::U::a~a~~ ;~~. ~~~~~~ .. . .. ... ... . . .. . 8.2 BaJance of CU;n'ent AccoUnts due to Governmimt... 89.4
• •• . • • • Others......... 178.3 Foreign Correspondents .; ... ~ .... ; ; ... ; .. .. .. .... .. • 11.0 . . Sundry Accounts ....... .. .. .. .. • • .. • • .. .. .. • • • .. • 0.7
Capital...... • • • • .. • • .. .. .. .. • • .. • • • • .. • • • • . • • • .. .. 1 000.0 ReServe Fund· .. ;.... ................................ 76.6 Bank Premises and Furniture; ...................... " 12.0 Earnings less ~enses.............. ................. . 89.9 Undispo.sed Profits ........................... ':";'..:.,' :.: .. ..:.,. +-_..::0:.:.4:.......ji-__ --:;;;.;;,..::-~;.;.;,.,+_-~;.;;....t_-.;..,;;....
'. . . . Total 11 2746.2 11·
1157.1 ·'·1204.4'" . {·182.2 11'75.2
9.9 18.4 7.2 ,6.3. ',31;3 .. "29.9 48.0
189.2 .. ' .56.8 69.5 '88.8 '12:2 11.7' 14.1 " 8.9
9.9 18.6 6.8 1.1 1000.0 1000.0 1000.0 1000.0
142.2 . ~42.2 '142.2 142.2 . 12.0 12.0 12.0 12.0 61.5 61.9 63.3 69.8 0.3 0.3 0.3 0·;1 ,
2544.3 1 2547.6 1 2·527.5 2542.6
2. - NOTE ISSUE OF THE BANK OF FINLAND.:
lml 1931.
Ba/7 . f .31/7 I 8/s I IIJ/s
. RIGJIT TO ISSuE NOTES: ..
.. Go~~erve. and Foreign. Correspondents •••.•.••..• 1250.7 ,. 912.1 944.0 : 927.4 982.5
, Additio~ Right of Issue ......... · ................. 1200.0' 1200.0 1200.0 . 1200·0 1'200.0
Total 2450.7 2.112.1 . 2 i44.0 2127.4 2.182.5 .. USED AMOUNT OF ISSUE:' "", ..
Notes in· circulation ••...• : •••.•••.••..••..•...• ' .•.• 1829.8. i 157.1 . 12Q(I,.4· i 182.2 1175.2
I Other Liabilities payable on deniand ... ; ......... ~ ... . 237.6 17L2 126.8 127.5' '148.1 Undrawn Amount of Advances on Cash Cr~t ; ..•.. 47.3 48.8 ,58.3 59.0 58.Q
". ,
Total .. 1614.7 ' 1377.1 . 1389.5 1 368.7:. 1876.s NOTE RESERVE: c.
, .. :Immediately available ............ , ........ ; ........ ·420.9: . " 880.6" 380.9 386.6' '400-7 . Dependent on increased' supplementary Cover ••••. ~ . 415.1 ..854;4 .' .878.6 372.1 855.5
;-,,.- To~l .8~6.0· [I . '785.0. 1 754.5 [. 758.7,:: 1 .756.2 -.. Grand tal 2450 •.. 2112;1 2'144'.0 2127.4' 2182.5 . - .. _- .. ., 7 11
Bank Rate s.~'!~~ A~gu.~t. 26. 1980. 6 0/0.
No.8 0':
. 3. - -BA-NK OF FINLAND. NOTE CJRCUU TION AND FOREIGN CORRESPONDENTS--- --- .... - -- ... ~ - " .. ...... --- ,,", . -, ,
End Roh GlroulaHon Forllen Go .r, •• p ond.n i.')
MIll. Fmk MIll. Fmk' End 'of
..... of
Month 1928 I 1929 / 1930 I 1931 I Monthly 1928 '/ 1929 I 1930 I- 19B1 I Monthly Month Movement Movement
J8J].. [1514.4] 1502.8 1430.7 1259.0 1230.6 - 48.8
[1359.8] 1311.6 719.0 705.2 732~4 - 80.5 .Jan.
Febr. 1592.6 1622.'1 1369.0 1305.2 + 74.6 1201.7 698.5 738.9 740.4 + 8.0 Febr. March 1643.9 1596;0 1447.2 1319.5 + 14.4 1076.7 706.4 933.3 761.0 + 20.6 March, Aril 1618.7 1556.2 1439.9 1301.5 - 18.1 935.0 661.1 946.0 721.7 - 39.3 Aril ~y 1575.8 14SO.9 1391.7 1256.7 - 44.8 784.3 5SO.2 1023.9 719.6 2.1 ~y ; -June 1585.4 1472.5 1373.3 1232.0 - 24.7 712.5 544.5 877.1 662.3 - 57;s June i July 1542.7 1489.1 1356.3 1204.4 - 27.6 673.7 605.1 948.8 642.2 - 20.1 .July !
Ang., 1664.9 1448.1 1352.0 616.1 620.0 906.5 Aug. !
Sept. 1598.9 1440.4 1350.2 600.8 547.3 869.0 Sept. OCto 1539.3 1376.9 1313.4 683.1 598.7 855.7 OCto Nov. ' 1502.1 1346.6 1262.7 709.9 694.8 812.5 Nov. Dec. 1618.2 1360.6 1279.4 731.6 ' 669.5 812.9 Dee.
') Credit balances with foreign corresJlOD,dents. IncludlDg the Credit abroad, which amonnted to 114.6 mill. mk. up to April 14tb; 1928 and was then discontinued. -
4. - BANK OF FINLAND. ORDINARY COVER, NOTE RESERVE AND HOME LOANS.
End Ordinary Co .... r ,Roil R ••• r .... Hom. Loan .. ')
End Of
Percentage of Liabilities Mm. Fmk MIiI. Fmk of
Month 1929 11980 1 1931 I ::~~::!~t 19291 1930 1 1931 I Jl~~t 1929 1 1930 \1931 I Monthly Month'
,.l\Iovement
[51.68} [208.7] [1556;0] Jan. 55.71 64.23 73.76- -1.14 362.5 608.7 788.6 - 4.1 1396.3 1307.9 85M - 79.2 .Jan. Febr. 52.75 60.76 70.06 -3.70 2SO.3' 497.3 715.3 - 73.3 1516.8 1372.1 833.3 - 22.3 Febr. March 54.22 67.17 73.61 + 3.55 316.5 555.3 761.2 + 45.9 1600.8 1261.1 824.2 - 9.2 March Aril 54.29 ' 74.49 70.27 -3.34 363.6 733.9 729.5 - 31.7 1476.7 1041.7 766.3 - 67.9 Aril ;
~y 51.58 SO.32 68.17 -2.10 342.4 847.7 677.1 -, 52.4 1515.3 903.4 797.8 + 41.5 ~y June 60.58 77.31 68.21 +0.04 848.4 820.6 702.3 + 25.2 1533.1 840.8 772.9 - 24.9 .June July 49.36 SO.05 70.91 + 2.70 847.7 851.4 754.5 + 52.2 1625.6 757.2 736.8 - 36.1 .July Aug. 50.48 SO.50 368.5 862.0 1621.9 702.8 Aug. Sept. ' 53.54- 81.06 434.0 881.8 1464.3 699.4 Sept. Oct. 65.78 75.67 458.7 785.1 1410.7 761.6 Oct. ' Nov. 66.70 75.44 496.3 801.2 1432.3 869.0 Nov. Dec. 60.80 74.110 535.5 792.7 U81.7 934.9 Dec.
') Inland BWs, Loans on Security and Advances on Cash Credit.
5. - BANK OF FINLAND. REDlSCOUNTED BILLS, AND BALANCES' OF CURRENT ACCOUNTS.
Redlsoounied BiIIII') BalaDol 01 Current Aooonnte Batan.1 of Curreni Aocounte dUI End due iD GoVDl'llmeni io others than Governmam End of lIIill. Fmk MIll. Fmk MiJl"Fmk of
Month Month
1929 /1930 \1931 IM~=t 1929 11930 1 1931 I, Monthly 1929 11930 /1931 I ::~~t ' Movement
[676.8] 1[375.4] Jan. 533.3 466.5 118.3 - 31.3 288.6 216.4 1l.4 -142.2
[81.5] 72.1 44.0 119.6 +96.8 .Jan.
Febr. 616.5 605.3 87.3 - 31.0 285.4 244.2 70.8 + 59.4 61.5 63.7 55.7 -63.9 Febr. March 089.6 380.2 103.2 + 15.9 182.9 229.5 - - 70.8 53.4 127.6 66.7 + 11.0 March Aril 549.2 194.5 41.2 - 62.0 119.1 87.3 6.9 + 6.9 60.4 119.9 90.9 + 24.2 Aril ~y 581.0 63.1 40.8 - 0.4 103.2 58.3 112.3 + 105.4 ' 88.2 163.5 83.4 - 7.5 ~y June 617.2 22.6 ' 40.3 - 0.5 60.1 - 70.7 - 41.6 60.3 111.9 61.9 -21.5 .June July 644.3 15.7 38.8 - 1.5 60.9 26.0 31.3 - 39.4, 67.2 149.6 56.8 - 5.1 .July Aug. 645.8 12.7 76.3 19.4 61.8 98.5 Aug. Sept. 603.9 6.3 46.5 - 51.8 60.7 Sept.
. Oct. 547.1 5.0 106.0 140.1 80.3 11.2 Octo Nov. 567.5 98.3 106.5 83.8 75.1 97.9 Nov.
I Dec. 550.' 149.6 150.1 153.6 48.3 22.8 Dec. The figures In brackets [ 1 indicate the position at the end of the previous year.
') Included In home loans, see table 4. RedlBeonnted BUIs according to the monthly balance abeets of the Bank of FmlaDd.
6 No •. S
6 • ....;:~RAtES OF EXCHANGE QUOTED BY TOE: BANK Of fiNLAND, MONTHty AVERAGE. -_.
II . Parity .. ~ Yearl¥ aV8l"lll8
-11 1930
II
1931
1929 1 1930 May 1 June 1 July May 1 June 1 July
. -
1~1 New York 39:70 39:70 39:70 39:70 39:70 39:70 89: 70 39:70 London 193:23 193:11 193:02 193:- 193:29 193:24 198: 28 192: 98 StOCkholm 1064: 07 1065:52 1067: 3 1066:09 1066: 72 1068: 13 1065:28 1065: 20 1063:84 Berlin 945:84 947:50 948:2 948:19 947:74 948:47 945:97 948:28 1)943: 07 Paris 155:56 1Q6:12 156:10 155:97 156:01 156: 35 155:45 155:63 155:89 Brussels 552:08 554:13 554:97 565:- 555:- 555:46 553:11 558:64 554:52 ~Bterda.m 1596:- 1597:83 1598: 92 1598:39 1597:38 1598:77 1596:97 1599: 30 1601: 01 Basle 766:13 767:22 770:5~ 769:20 769:60 771:94 766:42 770:90 772:17 Oslo 1064: 071 1061: 73 1063:7
1
1063: 28 1063: 50 1064:51 1064: 12 1064:26 1062: 69 Copenhagen 1064:07 1061:67 1064:- 1063: 22 1063:16 1064:64 1063:99 1064:19 10.62: 56 !'r&gue 117:64 118:61 118:06
1 118:- 118:- 118:- 118:- 118:- 117:98
Rome 208:98 208:52 208:4~ 208:50 208:50 208:50 208:50 208: 50 208:20 Raval 1064:07 1064:37 1060:89 1061: 68 1057: 64 1058: 83 1060: 74 1060:- 1058: 93
-lrSrid 766:13 767:59 767: 181 767:- 766:45 766:93 766:- 766:- 76.4: 96 766:13 580:55 465:59 487:48 471: ---' 460:30 399:57 884: 88 373:81
Warsaw 445:42. - 1)446: 45/ 447:- 446:05 446:11 446:- 446:- 445:56 I) Regular quotstlon ot PoIIah zloty (Warsaw) was eommenoed on Hareh 1, 1980. ") Berlin was not _quoted '/,-'-u/, 1931. ..
7~ -HOME DEPOSITS IN THE JOINT STOCK BANKS. ")
End. of Ourrem Aaaoanta' ) D epoll ha) To'.1 Montbly
Irfill. Fmk Irfill. Fmk Irfill. Fmk Movement End.ot -Konth Honth
1929 11930 1 1931 1929 11930 I 1931 1929 1 1930 I 1931 1930 I 1931
Jan. [15.!J6.7] [5843.2] [7379.9] 1670.7 1528.6 1715.6 5891.9 5985.4 6146.3 7562.6 7014.0 7861.9 + 32.7 +1~~ Jan.
Febr. 1683.2 1549.4 1689.9 5928.8 6015.0 6153.8 7462.0 7564.4 7843.7 + 50.4 - 18. Febr. March 1576.7 1689.3 1549.8 6048.5 6100.9 6256.0 7625.2 7790.2 7805.8 + 225.8 - 37.9 _March Aril 1558.1 ·1697.8 1532.6 6076.6 6134.4 6263.3 7629.7 7832.2 7795.9 + 42;0 - -9. Am ~y 1503.9 2072.6 1559.9 6064.5 6133.2 6218.2 7568.4 8205.7 '(778.1 +373.5 - 17.8 ~y June 1551.0 2003.0 1561.2 6178.8 6279.4 6313.2 7729.8 8282.4 7874.4 + 76.7 + 96,3 June July 1511.6 1966.5 1597.3 6148.4 6283.6 6291.3 7659.9 8250.0 7888.6 - 32.4 + 14.2 July Aug. 1542.5 1893.2 6085.2 6238.0 7628.2 8131.2 -118.8 Aug. Sept. 1512.4 1746.0 604l.7 6231.1 7554.1 7977.1 -154.1 Sept. OCt; 1534.9 1740.6 ·5951.7 6154.5 7486.6 7895.0 - 82.1 Oct •.
. Nov. 1418.1 1589.1 5892.7 6089.7 7310.8 7678.8 1- 216•2 Nov. Dec; 1486.1 1555.5 5995.2 6142.3 7481.3 7697.8 + 19.0 Dee.
. ToI;bles 7-9 according to Finland's Offtclal Ststlstlos VII, B. Bank Ststlstlos. The figures In brackets [] Indloa&e the JlQllltIoD ., the end of the previouByear.· . _ ..
') Actual oummt acOOllDtB anel home oorreapondentB. -"l DeposIt aceountB and saviDgB aceountB. . • In the abies 7--9 :Mortgage banb IIl'8 not IDolnded. .
8. - HOME LOANS GRANTED BY THE JOINT STOCK BANKS. Inland Bllll Loans and Overtlrafta' ) To '.1
I Monthly
End of Irfill. Fmk Mill. Fmk Mill. Fmk Movement Endot Honth Month
1929 1 1930 I 1931 1929 I 1930 1 1931 1929 I 1930 I 1931 1930 I 1931
[3257.7] [6267.1] [9524.8] 9540.1 9213.3 I-- 26.0 + 13.3 Jan. Jan. 3274.6 3237.3 2652.7 6-285.6 6302.8 6 560~6 9560.2
Febr. 3348.4 3216.5 2630.5 6289.2 6392.6 6617.5 9637.6 9609.0 9248.0 + 68.9 +34.7 Febr. Ma.reh 3378.9 3196.1 2636.0 6402.8 6398.9 6513.7 9781.7 9595.0 9149.7 - 14.0 -98.3 March
~~ 3457.0 3155.6 2594.0 6393.0 6369.6 6536.9 9850.0 9525.1 9130.9 - 69.9 -18.8 ~ril 3539.4 3069.2 2'532.5 6401.3 6466.6 6587.8 '9940.7 9535.8 9120.3 + 10.7 -10.6 I Y JUlle 3559.8 2935.9 2479.3 6487.1 6418.5 6557.2 10046.9 9354,4 9036.5 -181.4 -83.8 June
July 3497.0 2855.8 2383.3 6434.4 6293.6 6604.7 9931.4. A 149.2 8988.0 -205.2 -48.5 July Aug. 3438.0 2680.1 6458.1 6420.1 9891.1 9100.2 - 49.0 Aug. Sept. 3407.7 2612.3 6380.3 6459.6 9788.0 9071.9 - 28.3 Sept._ OCt. 3362.9 2628.9 6437.8 6562.2 9800.7 9191.1 + 119.2 Oct. Nov. 3317.2 2704.7 6349.9 6538.1 9667.1 9242.8. + 51.7 Nov. Dec. 3297.3 2696.3 6268.8 6503.7 9566.1 9200.0 - 42.8- Dee.
I) Home 1oana, oash oredltB aDd home oorrespondentl.
No .. 8 7
9 -·POSITION Of THE JOINT STOCK BANKS TOWARDS fOREION COUNTRIES . Cre dI h') I n d • b t e d n ... ")
Nai ClaIms (--I-) and Net ID-Mon~.bly Movement
End 01 M1l1. Fmk Mill. Fmk debtetin .. · (-) 01 Net Claims End of
Month M1l1. Fmk Month
1929 1 1930 1 1931 1929 1 1930 I 1931 1929 1 19301 1931 1930 1 1931
[255.6] [529.1] [-:-:-273.0} - 13:8 Jan. Jan. 261.3 228.0 218.3 492.0 490.8 321.7 -230.7 -262.3 -103.4 +30.8
Febr. 217.8 215.7 225.4 552.0 510.2 362.3 -334.2 -294.0 -136.9 ~ 32.2 -33.5 Febr. March 201.2 203.0 209.9 586.7 477.3 372.0 -385.0 -274.3 -162.1 + 20.2 -25.2 March Aril 167.9 222.8 210.0 689.1 600.7 378.6 -421.2 -277.9 --168.6 - 3.6 - 6.5
I~~ ~y 141.0 422.6 217.9 608.4 499.1 369.0 -466.9 - 76.0 -1.51.1 + 201.4 + 17.5 June 188.6 533.6 254.4 633.0 487.6 308.2 -444.4 + 46.0 - 53.8 + 122.0 +97.3 June July 236.3 637.1 285.2 543.8 390.0 255.1 -307.0 +247.1 + 30.1 + 201.1 +83.9 July Aug. 247.0 647.3 . 527.2 387.6 -280.2 +259.7 + 12.6 Aug. Sept. 281.9 591.7 518.4 375.0 -236.0 +216.2 - 43.0 Sept. Oct. 223.6 488.0 525.7 391.8 -302.1 + 96."2 -120.0 Oct. Nov. 199.6 269.7 509.4 380.7 -309.8 -111.0 - 207.2 Nov. Dec. 233.9 224.0 482.4 358.2 -248.0 -134.2 - 23.2 Dec.
Tbeflgures in brackets [1 indIcate the position at the end of the previoUB year. ' ') Balances with foreign correspondentB and foreign b1llB. -') Due to fOreign correspondents (86-115 % foreign depoBits iD FmkB).
IO.-POSITION OF THE BANKS TOWARDS FOREIONCOUNTRIES.l) 11. - CLEARINO.2) Net CIaimII H) and Net lDdebtedneu (-) Monthly 1930 1931 I
End of Mlll.Fmk lIIove-Month ment of
I I 1928 I 1929 1 1930 1
Net 1926 1927 1931 Claims
Month
Number I Amount NUlilber 1 Amount
I
[+1049.1] Jan. +1026.6 +1075.5 +1277.4 +500.3 + 453.2 + 811.8 + 13.1 Febr. + 961.8 +1053.6 +1050.9 +374.5 + 455.6 +769.1 - 42.7 Marcli + 921.2 + 988.2 + 853.8 +328.4 + 739.1 + 789.3 + 20.2
tt;; + 768.5 +886.6 + 731.1 +242.6 + 785.5 + 753.5 - 35.8 + 596.3 + 733.8 + 468.4 +111.1 +1087.5 + 787.0 + 34.0
June + 582.0 + 682.0 + 437.8 +101.9 +1108.7 + 805.7 + 18.2 July + 655.0 + 919.9 + 483.0 +203.4 +1375.2 + 867.6 + 61.9. Aug. + 794.0 +1156.9 +' 545.7 +255.8 +1351.3 Sept. + 785.7 +1238.8 + 492.9 +323.0 +1274.5 Oct. + 748.2 +1386.9 + 473.6 +321.0 +1142.7 Nov. + 842.5 +1337.9 + 491.0 +305.1 + 907.1 Dee. +1024.6 +1296.3 + 471.7 +432.7 + 798.7
MIll.Fmk MJll,.Fmk
140898 1949.3 138979 1670.3 Jan. 124080 1746.9 116932 1479.3 Febr. 138743 1840.8 130782 1573.7 March 138625 1931.6 128701 1486.8 Aril 145 754 1934.1 125613 1442.6 ~y 137036 1857.6 133666 1631.2 Jqne 142091 2082.4 127117 1588.6 July 126959 17~l
Aug. 138789 1785. Sept. 154865 2086.7 Oct. 141684 1760.5 Nov. .141750 1865.3 Dec.
I IITotal 1 671 2741 22 636.011 ') The figures indicate the poBitlon towards foreign countries of the Bank 01 Finland (balances with foreign correspondents and
foreign bWs are taken Into account as well aB credits due to foreign correspondents) and of the Joint Stock Banka (net claims or net IndebtedneB!!' Be8 table 9 above) •
• ) IndfuateB the c1ilarlng operations joined by 12 Joint Stock Banks both at the Head Office and five Branch Offices of the Bank of FInland.
12. - ·DEPOSITS IN THE SAVINGS-BANKS • . -
In the towDI In the OOUD~ Total Monthly End of M1l1.Fmk Mill. Fmk M1l1. Fmk Movement End of lIIonth Month
1929 1 1930 1 1931 1929 1 19.30 1 1931 1929 1 1930 1 1931 1930 1 1931
Jan. [1787.0] [1908.5] [3695.0]
+ 17.2*\ 1813.9 1937.3 2126.0* 1918.9 1991.3 2061.6· 8732.8 3928.6 4187.6* + 5.6 Jan. Febr. 1828.4 1942.4 213.3.3* 1920.8 1990.5 2064.6* 3749.2 3932.9 4197.9* + 4.3 + 1Q.3*1 Febr. 'March 1842.6 1953.1 2155.0* 1929.2· 199.3.4 2067.2* 3771.8 8946.0 4222.7* + 13.6 + 24.s* March Aril 1852.5 1961.6 2160.3* ' 1941.5 1999.9 2071.7* 3794.0 3961.5 4232.0* 1+ 15.0 + 9.3* Aril ~y 1841.4 1964.5 2152.7* 1939.7 1997.1 2063.8· .3 781.1 3961.6 4216.5* 1+ 0.1 - 15.5* tfay June 1831.3 1957.3 2136.6* 1920.8 1980.6 2043.6* .3 752.1 3937.9 4180.2* 1- 23.7 - 36.3* June July 1827.6 1969.6 2142.9* 1909.4 1975.5 2036.7* 3737.0 3945.1 4179.6* + 7.2 - 0.6* July Aug. 1824.3 1973.2 1896.7 1965.4 3721.0 3938.6 - 6.0 Aug. Sept. 1821.6 1974.5 188.3.8 1952.0 3'705.4 3927.0 - 11.6 Sept. Oct. 1819.7 1974.3 1873.0 1941.2 3693.2 3915.5 -11.0 Oct. Nov. 1814.7 1974.0 1862.8 1935.9 3677.5 3910.4 - 5.1 Nov. Dee. 1930.6 2104.9 1992.4 2065.0 1)8923.0 2)4170.4 +260.0 Dee.
Deposits In the Savings Banks. including long-term deposits and current accounts, according to figorea snpplled by the Central StatIBtlcal Offiee.
1) Increaaed by 289.1 mW. Fmlt Interest for 1929. - .) Increased by 8O.!.S mW. Fmk interest for 1980. • PreUmlnary figures 8ubjeet to minor alterations.
8 No:··.8
11. :- DEPOSITS IN POSToma SAVINGS BANK AND ON CONSUMERS' CO-OPERATIVE SOCIETIES' . ..... . .. SAVINOS ACCOUNT •.
~1~ Depoalu on Ooasumen'
. ,
DlPOIlu la POBt Office Monthly Co-operativ. Soaietiee'· Monthly
End of SaYiDII Bank Movement Savlags Aaaouat ') Movement End of
Month Mill. Fmk :Mlll. Fmk Konth
1 1929 1 1930 1 1931 1930.11931 1929 1 1930 1 1931 1930 11931
JlLJI.uary [197.9] [419.3]
+2.6 January 199.4 208.2 226.0* 243.7"'1+ 1.8* +1.1* 427~9 444.7 441.4 +0.6 Febf!lHY 200.4 209.8 228.11* 245.4* + 1. 7* + 1.7* 436.1 448.3 443.7 +3.6 + 2.3 February
· March 202.0 210.8 229.9* ·"·'l+ ... ' + 2.3* ·444.11 405.6 447.1 +7.3 +3.5 March Aril 201.0 211.11· 230.4* 247.7* + 0.0* -* 446.7 454.6 444.3 -1.0 -2.8
I=' ~y 199.0 210.1 229.5* 246.4 * ~ 0.9* -1.3* 442.7 448.1 436.0 -6.0 -8.3 June 199.1 209.9 228.8* 246.5* -0.7* +0.1* 408.0 457.1 442.4 +9.0 +6.4· June
· July 200.4 210.6 ·229.5* 248.1 * + 0.7* + 1.6* 451.1 454.0 438.8* -3.1 -3.6* July August 201.0 211.6 230.5* + 1.0* 450.3 450.4 -3.6 August SePtember 201.0 211.8 229.9* -0.6* 447.2 445.7 -4.7 September OCtober 200.4 211.1 228.8* -1.1* 440.0 438.9 -6.8· . October November '199.3 211.4 228.6* 1-0.2* ·437.2 434.8 November I December 1)208.8 -1.4* 442.1 440.8 + 6.0 December
~4.1 ~) 224. 7 8) 242.6* ..
Poet Office Savlaga B~ dlIpOBlta according to Flaalsh Official Statistics VII, D, Bank StatistlcB. Monthly ~eporta. .. . Conaumera' Co-operative Socl8tles' depOBlta according to data from the Finnish Co-operative WhollBale Socnety Ltd. .and the Co-
aperatlve WholeRale SocIety. ' .. . - . · 1) Incre&Bed by 11_8 mill. Fmk IntlreBt tor 1928. _I) Iucreasedby 14.8 miU.Fmklnterest for 1929. _·1) Increased by 15.' mill. Jrmk caloulated Interest for 1980. - ") Iilterest added to capital partly In January, partly in June·and December.
14. - DEPOSITS IN CO-OPERATIVE CREDIT SOCIETIES. .
Deposlu In C:O-op.raUve Quarterly EDdof Credit Soaletie. and Konthly Konth MII\' Fmk Kovement
1929 1 1930 1 1931 1930 1 1931
Jail. [274.3]
353.1 406.3 +4.1 +~.1 Febr. 359.1 414.0 +6.0 +7_7 March 312.1 368.0 423.0 +8.9 +9.0
· A ril 377.0 427.0 +9.0 +4.0 ~y. 379.1 423.7 +2.1 -3.3 1 June· 335.3 387.9 428.7 +8.8 .+5.0
July 394~0 +6.6 Aug. 392.1 -2~4 Sept. a.~.3 397.3 +5.2 Oct. 393.9 -3.4 Nov: . 393~6 ..
~0.3 Dec. I 349.0 402.2 +8.6
AccordIag to Informatloa 8uPflleq ·by the Central Bank for Co-operative AgrIoaltura Credit Socletlea.
15. - NEW RISKS INSURED BY UfE ASSURANCE COMPANIES.
New rIska aoaepted by FlDiIIsh ··LIf. Aaauraao. Companies
192.9 1930 I 1931 End of .
. Amount Month . I Amcunt I Amount
Number I MilI.Fmk .. Number .MIll. Fmk . Number Mill. Fmk
.7185 112.2 7108 110.0 I 4378* 70.0* .JILJI.. 8796 136.0 9262 148.8 6094* 106.7*. Febr.
11899 183.0 15316 240.0 7917* 124.4* March 10187 158.3 9431 145.9 6432* 101.1* Aril 8918 149.0 9615 158.5 5601* 93.5* ~y 8431 133;·0 . 8429 137.7 5812* 90.7* June. 7406 113.0 7073 104.4 4479* 74.2* July 7949 125.0 7797 125.3 :A.ug. 8739 143.6 8926 141.6 Sept. 9986 150.7 8545 140.9 Oct.
10052 157.6 8405 141.6 Nov. 13227 246.8 13255 250.6 Dec.
1127751 62822
1809.2111131621 985.5 66234
1845.811 1 1045.8 40713* 11 Total I
660.6* :Jan.-July . Accordlpg to information supplied by Life Aaaurance Companies.
16: - CHANOES ·IN NUMBER AND CAPITAL OF LIMITED COMPANIES. Cempaniee laar .... of -j Year and foaadad eapital liquidated
Month Num-: 1·~Pltal .. N~m-I Mill. Num-! Oapltal , ber· El. FmlI ber . Fmk. .ber Mill. Fm
1927 . 709 291.8 331 764.41 148 44.0
1928 777 447.6 411 1105.5 126 76.4 1929 058 280.8 346 615.8 207 .276.7 1930
Jan. .,.... March 145 BO.l 65 33.6 68 64.2 ! April - June 116 24.0 56 48.4 52 21.9
July - Sept. 152-· 44.6 40 27.8 47 18.6 Oct. - Dec. .134,· 35.8 45 102.8 52 19.9 ;.", 1931; ; .. ..
Ja.n. - March 132 26.5 ·47" ··31.1 71. ·33.0 ?uril- June 179 29.0 33 24.4 70 20.5
Oct. - Dec. I Uly - Sept.
According to Information supplied by the Central Statistical Office. *Pre1imlnary flgores lubject to minor alterations.
. Companies with Net inoreu. C+) nduoad capital or reducUon (-) Year and
. ! Reductlou .Num-! Capital Month Num- of capital
ber' MIll. Fmk . ber Mill. Fmk
5 2.3 + 661 +1009.4 1927. 12 28.8 + 651 +1452_9 1928 9 19.4 + 351 + 600.5 1929
1930 .4 3.1 + 77 + 46.4 Jan. - March·
3 ··9.0 + 64 + 41.5 .. April - June. 1 0.0 + 105 + .53.8 July - Sept •.. 2 2.4 -\- 82 + 116.3 Oct. - Dec. :.
.•. 1931
1 0,9 + 61 + 24.2 Jan. - M;arch ----' - + 109 + 33.4' April- June
JUly - Sept. Oct. - Dec.
No. 8 9
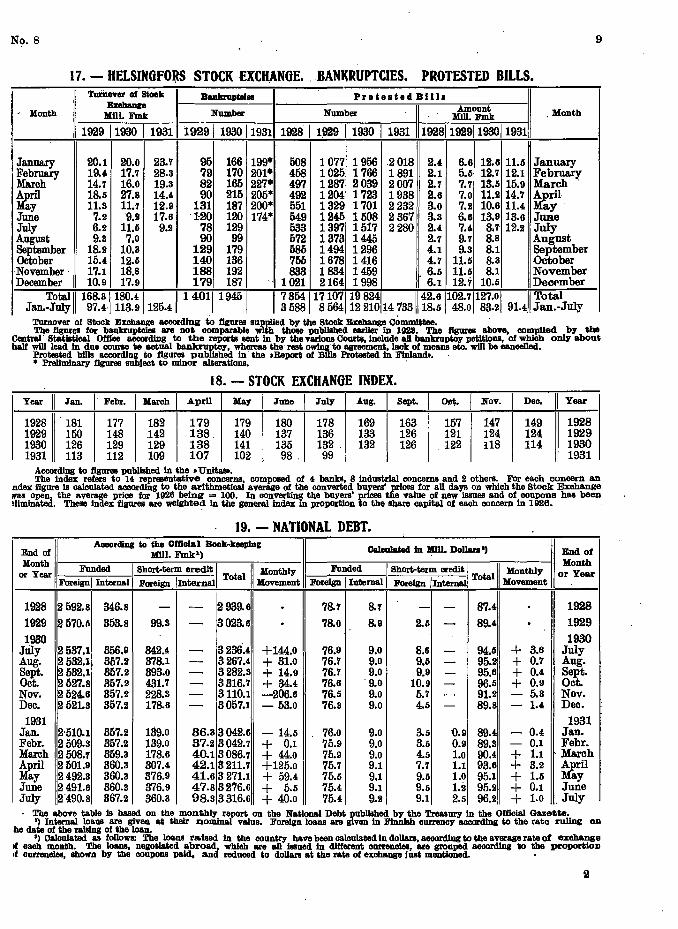
17. - HELSINGFORS STOCK EXCHANGE •. BANKRUPTCIES. PROTESTED BILLS. Turnover of StaeIE Bankruptoill Protelted Billl
Euhange - Month Mill. Fmk Number Amount
.' MIll. Fmk Month
1929 11930 I 1931 19291 1930 11931
Number . I 1928' I 1.929 I 1930 I 1931 ' 1928119291193011931
January 20.1 20.0 23.7 90 166 199* 508 1077 1956 .2018 2.4 6.6 12.6 11;5 January February 19.4 17.7 28.3 79 170 201* 458 1025 1766 1891 2.1 5.5 12.7 12.1 February March 14.7 16.0 19.3 82 165 227* 497 1287 2039 2007 2.7 7.7 1U 15.9 March " Aril 18.5 27.8 14.4 90 215 205* 492 1204 1723 1938 2.6 7.0 11.1 14.7 ~ril ~~ 11.3 11.7 12.9 131 187 200* 551 1329 1701 2232 3.0 7.2 10.6 11.4 y' June 7.2 9.11 17.6 120 120 174* 549 1245 1508 2367 3.3 6.6 13.9 13.6 J\lB.e July 6.2 11.1i 9.2 78 129 533 1397 1517 2280 2.4 7.4 8.7' 12.2 July August 9.3 7.0 90 99 572 1373 1445 2.7 9.7 8.8 August September 18.2 10.3 129 179 585 1494 1296 4.1 9.3 8.1 September October 15.4 12.5 140 136 755 1678 1416 4.7 11.1i 8.3 October
·November· 17.1 18.8 188 192 833 1834 1459 6.6 11.1i 8.1 November December 10.9 17.9 179 187 '" 1021 2164 1998 6.1 12.7 10.5 Deoomber
Total 11 168.3 \ 180.41 /1 401119451 Jan.-July 97.4· 113.9 125.4
/73541171071198241 1142.61102.71127.01 11 Total 3588 8564 1221014733 18.5 48.0 83.2 91.4 Jan.-July
Tllrnover of Stocll: Exohange according to figures supplied by the stook Exchange Committee. . The figures for bankruptcies are not oomparable with thOll8 published earlier in 1923. The fIgnreI above, oomp1led by the
Central' StatistioaJ Office &OCOl'ding to the reporta &eIlt in by the v&1'lous C011l't!l, lDcJude all bankruptcy petitloDB, of which only about baJf will lead in due oourse .. actual baDkruptey, whereas the' rest owiDll:' to &gr88IIIent, Jaok of meaDS eta. wlll be canoelled.
Protested bills according to figures published In' the _Report of BWs Protested in FiDlandt. . • Pl"eJlmlnary figures subject to minor alterations. .
18. - STOCK EXCHANGE INDEX.
Year 11 .Tan. I Febr. 1 March I April I Hay I .Tune 1 .Tuly I Aug. I Sept. I Oct • I Nov. I Dee. I1 Year
1928 181 177 182 179 179 180 178 169 163 157 147 149 1928 1929 150 148 142 138. 140 137 136 133 126 121 124 124 1929 1930 126 129 129 138 141 135 132 . 132 126 122 118 114 1930 1931 113 112 109 107 102 98 . 99 1931
According to fIgnreI published in the • Unltaso. The index refers to 14 representative ooncerns, oompOll8d of 4 banll:e, 8 industriaJ concerns and 2 others. For each ooncern an
ndex flgore is oaIcuJated according to the arithmetloaJ average of the oonverted buyers' 1Il'ices for all days on which the Stook Exchange was open, the average price for 1926 being = 100. In converting the buyers' prices tlie value of new Issues and of ooupons has been 'IIm1nated. These index fIgnres are weighted in the general index in proportion to the share capital of each ooncem in 1926. .
19. - NATIONAL DEBT. According to the Officlal Book-keepiD,
Caleulated In MIll. DoJIan ") End of End of MIll. Fmk1) Month
Funded 1 Short-term credit 1 11 JIonthly . Funded 1 Short-term credit 1 11 JIonthly IIlonth
or Year ForeIgnl Internal Foreign IInternal Total JIovement ForeIgn I Internal Foreign IIn~nal Total Movement
or Year
1928 2592.8 346.8 - - 2939.e . 78.7 8.7 - -
"·1 . 1928
1929 ~ 570.5 353.8 99.3 - 3023.6 . 78.0 8.9 2.5 - 89.4 . 1929
1930 1930 JUly 2537.1 356.9 342.4 - 3236".4 +144.0 76.9 9.0 8.6 - 94.5 + 3.6 July Aug. 2532.1 357.2 378.1 - 3267.4 + 31.0 76.7 9.0 9.5 - 95. + 0.7 Aug. Sept. 2532.1 357.2 393.0 - 3282.3 + 14.9 76.7 9.0 9.9 - 95.6 + 0.4 Sept. Oct. 2527.8 357.2 431.7 - 3316.7 +34.4 76.6 9.0 10.9 - 96.5 + 0.9 Oct. Nov. 2524.6 357.2 228.3 - 3110.1 -206.6 76.5 9.0 5.7 - 91.2 - 5.3 Nov. Dec. 2521.3 357.2 178.6 - 3057.1 - 53.0 76.3 9.0 4.5 - 89.8 - 1.4 Dec.
1931 1931 Jan. 2·510.1 357.2 139.0 36.3 3042.6 -14.5 76.0 9.0 3.5 {l.9 89.4 - 0.4 Jan. Febr. 2509.3 357.2 139.0 37.2 3042.7 + 0.1 75.9 9.0 3.6 0.9 89.3 - 0.1 Febr. March 2508.7 359.3 178.6 40.1 3086.7 + 44.0 75.9 9.0 4.5 1.0 90.4 + 1.1 March April 2501.9 360.3 307.4 42.1 3211.7 +125.0 75.7 9.1 7.7 1.1 93.6 + 3.2 Aril May 2492.3 360.3 376.9 41.6 3271.1 + 59.4 75.5 9.1 9.5 1.0 95.1 + 1.5 ~y June 2491.6 360.3 376.9 47.8 3276.6 + 5.5 75.4 9.1 9.6 1.iI 95.2 + 0.1 June July 2490.8 367.2 360.3 98.3 3316.6 + 40.0 75.4 9.2 9.1 2.5 96.21 + 1.0 . July . The above table is based on· the mon1ihly report on the National Debt pnbllshed by the Treasury in the Official Gaze1ite.
') Internal loans are given at their nominal value. Foreign Io&DS are given In FInnIsh ourrency aooordJng to the rate ruling 011 ,he date of the raising of the loan.
I) Caloulated as follows: The loans raised in the oountry have been calculated In doUam, aooording to the average rate of exchange If each month. The lOaDS. negotiated abroad which are all Issued in different onrrenoles, are grouped &OCOl'ding to the proportiOD ,f ol1l'l'8DciII. shown by the coupons paid, and rednced to dollars at the rate of exohange lust mentioned. •
2
10 ~o. 8
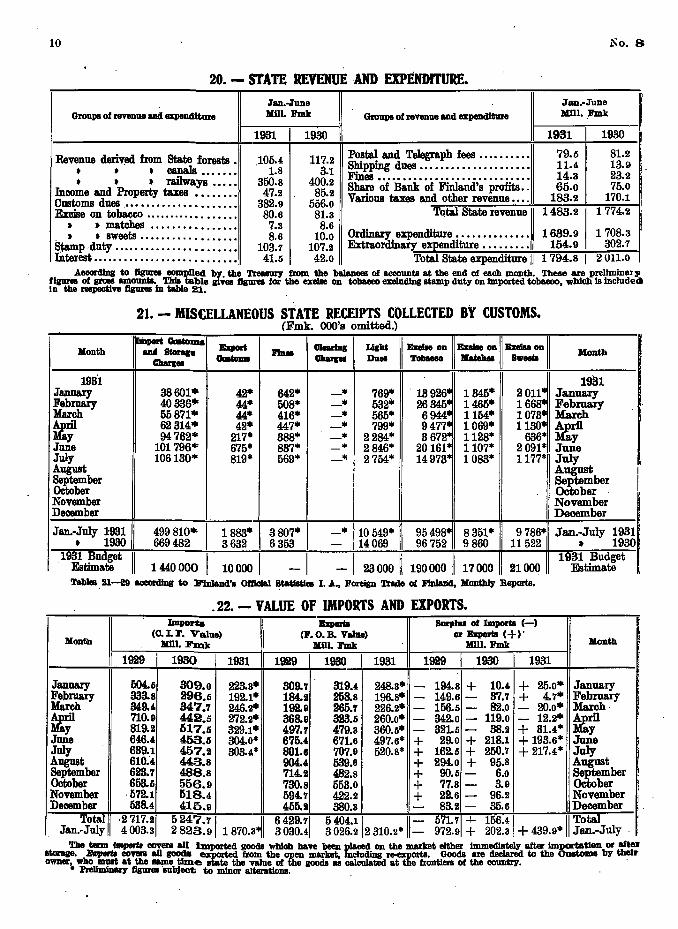
20. - STATE REVENUE AND EXPENDrrURE.
Jan.-lUDe
I 1 Jan.-JuDe
J Groups of revenue &Dd expendlture Iml. Fmk Groups of revenue and expenditure
1
Mill. Fmk
1931 I 1930 1931 I 1930
Revenue deriv!ld from State forests • 105.4 117.2 Postal and Telegraph fees ...•.•.... 79.5 81.2 t t t canals ••••••• 1.8 3.1 Shipping dues •.••••.•.•.•••••.•.•. 11.4 13.9
Fines •••••••.••••••.•••••••.••...• 14.3 23.2 t t t railways ••••• 350.8 400.2 Share of Bank of Finland's profits •. 65.0 75.0 Income and Property taxes ••.••••• 47.2 85.2
Customs dues , •••••.••.•.•.•••••••• 382.9 556.0 Various taxes and other revenue •••. 183.2 170.1
Excise OD tobaeco ........•.••••••.. 80.6 81.3 To"' ............. 1 1483.2 1 774.2 t t matches ...••.••••.•.•.• 7.3 8.6 t t sweets •.••.•.•..••.••.•• 8.6 10.0 Qrdinary expenditure •.•••••••••••• 1639.9 1708.3
S~p,duty •••.••.•..•.•••••..•.•• 103.7 107.2 Extraordinary expenditure •••.•••.• 154.9 302.7 Interest •••••••••....•.•.•......••• 41.5 42.0 Total State expenditure IJ 1794.8 I 2U11.0
AccordIDg to figurea oompDed by. the TreII8ur:v fIOm the b&lances of aooountB at the end of each month. These are preIlmlnal3' figures of glOIlII amounts. Tbla table gl'YIII fIgurea for the excise on tobacco excluding stamp duty on Imported tobacco, which la include .. lu the respective fIgurea In table 21.
Honth
1931 JILJI.IW'Y Feb~ March Aril ~y June July August September OCtober November December
21. - MISCELLANEOUS STATE RECEIPTS COLLECTED BY CUSTOMS. (Fmk. 000'8 omitted.)
Ir:~;:-I =-1 ... 1==1 :: 11::1I==II,~nll 38601· 42* 642* -* 769* ' 13926· 1345* 'Ol~ 40336'" 44* 508* -* 532* 26345* 1465* 166 55871* 44* 416* -* 565* 6944* 1154* 1073* 62314· 42* 447* -* 799* 9477* 1069* 1130 94762* 217* 388* -* 2284* 3672* 1128* 636*
101796* 675* 837* - * 2846* 20161* 1107* 2091* 106130* 819* 569* -'" 2754* 14973* 1 083* 1177*
I
Month
1931 .January Febl1l&lY March Aril ~~ .June .July August September Ocitober November December
Jan.-July 1:981 11 499810· I
1883* I 3807* I -* 110549* 11
95498*11 8351* 11 9 786*II.Jan.-JulY 1931 t 1930 669482 3632 6353 - 14069 96 752 9 860 11 522 • 1930
,1931 Budget 11 Estimate 1440000 1 10000 1 -I 1 I' 1I 11 11 1931 Budget - 23000 11 190000, 17000 21000 Estimate Tables, 21-29 according to Finland's 0ftlcIal BtatlBttcia I. A., Foreign TraIle of FInland, Monthly Beporta •
. 22. - VALUE OF IMPORTS AND EXPORTS. lm.poria BlIporiB S1ll'P11l8 of Import8(-)
Month (C. L F. Value) (F. O. B. Value) or _aria C+)'
Month Iml. FUlk Kill. Fmk Iml. Fmk
1929 I 1930 I 1981 1929 I 1930 I 1931 1929 I 1980 I 1931
January 504.6 309.0 223.3* 309.7 319.4 248.3* - 194.8 + 10.41 + 25.0* January Febnwy 333.8 296.6 192.1* 184.2 258.8 196.8* - 149.6 - 37.7 + 4.7* February March 349.4 347.7 246.2* 192.9 265.'1 226.2* - 156.5 - 82.,0 - 20.0* March '
~ 710.9 442.5 272.2* 368.9 323.6 260.0* 342.0 119.0 12.2* Aril - - - ~Y 819.2 617.6 329.1* 497.'1' 479.3 360.5* - 321.6 - 38.2 + 31.4* Ju!. 646.4 458.5 304.0* 675.4 671.6 497.6* + 29.0 + 218.1 + 193.6* June July 639.1 457.2 303.4* 801.8 707.9 520.8* + 162.5 + 250.7 + 217.4* July A"DglUIt 610.4 443.8 904.4 539.6 + 294.0 + 95.8 August September 623.'1 488.8 714.2 482.8 + 90.6 - 6.0 SePtember october 653.6 556.9 730.8 553.0 + 77.3 - 3.9 october November ,572.1 518.4 594.7 422.2 + 22.6 - 96.2 November December 538.4 415.9 455.11 380.3 - 83.2 - 35.8 December
ToW I1 .2717.21 5247.7 6429.7 5404.1 - 571.71-1- 156.41 11 Total Jan.-July 4003.3 2823.9 1870.3* 3030.4 3026.2 2310.2* - 972.9 + 202.3 + 439.9* Jan.-July,
I
1
I
i
The term CIIIfJIJrlI covers all imported goods whloh have been placed on the market either Immediately after ImportatloD or aftelr ltonp. B,..", coven all IIOIIda exported from the open market, including -.,ortB. Goods are declBred to the CUIltomI by their OWJIer, who mm at the same time state the value of the gooclB as calculated at the frontiers of the OOIlIItry. '
• PreIImiIwy fIgurea 'subject to minor alterations. , '
No.8
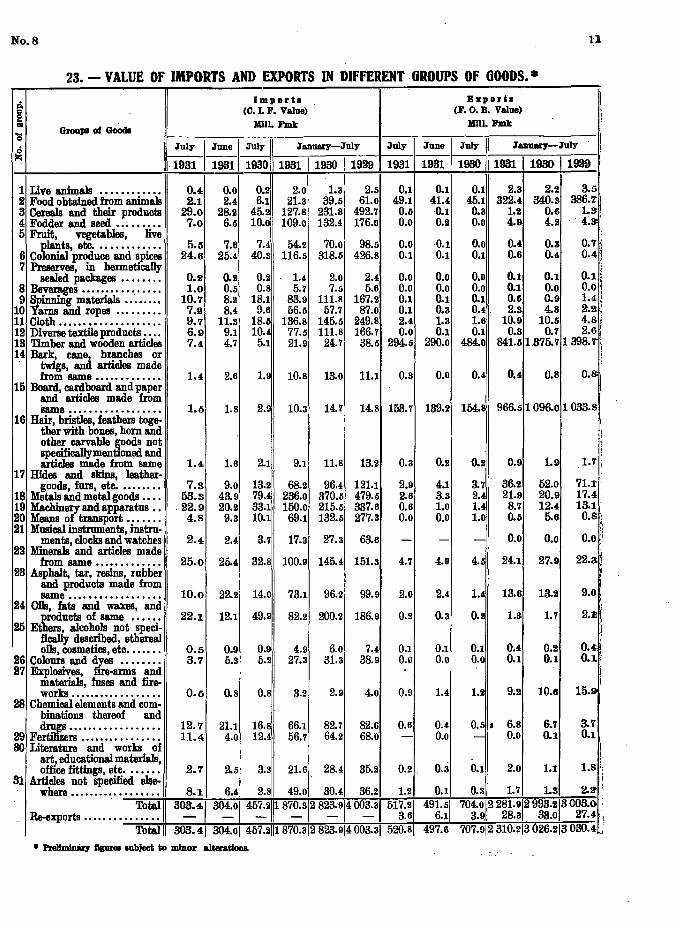
23. - VALUE OF IMPORTS AND EXPORTS IN D1FfERENT6ROUPS OF 600DS.*
GroaPl of Gooda
Imporh ElIporh i (0. L F. Value) (F. O. B. Value) ,
)[IJ.l. Fmk Mill. Fmk!
~I June I~Y 1,I-_J,an_uary-_----,-Ju_Iy __ , __ ;Jul_y_1 June I July I January-July· 11
~ ~1~1~1~1~ ~~ ~ ~11~1~ I~~----------------~~~
0.4 0.0 0.21 1 Live animals ••••••••••.• 2.0 1.3 2.5 0.1 2.1 2.4 6.1 21.3 39.5 61.0 49.1
29.0 28.2 45.2 127.8 231.8 492.7 0.5 7.0 6.5 10.0 109.0 132.4 176.0 0.0
0.1 41.4 0.1 0.11
0.1 2.3 2.2 3.5 45.1 322.4 340.3 386.T 0.3 1.2 ·0.6 1.3 0.0 4.9 4.2 . 4~3
2 Food obta.med from animals 3 Cereals and their products 4 Fodder and seed •..•••.•. 5 Fruit, vegetables, live
plants, etc. . .•......... 5.5 7.6 7.4 54.2 70.0 98.5 0.00.1 0.0 0.4 0.3 0.7 6 Colonial produce and s'pices 7 Preserves, in hermetiCaJly
sealed packages •.•.••..
24.6 25.4 40.3 116.5 318.5 426.8 0.1 0.1 0.1 0.6 0.4 0.4
8 Beverages ••••••..•. '.' •••. 9 Spi,nniriK materials •..•....
10 Yarns &Dd ropes .....•... 11 Cloth •••••••••••.•.•.•... 12 Diverse textile products •... 13 Timber and wooden articles 14 Bark, cane, branches or . twigs, and articles made
from same ••••••.••.... 15 Board, cardboard and paper
and articles made from
0.2 1.0
10.7 7.s 9.7 6.9 7.4
0.2 0.5 8.2 8.4
11.3 9.1 4.7
0.2 0.8
18.1 9.6
18.51 10.4
5.1
1.4 5.7
83.9 56.5
136.8 77.5 21.9
2.0 7.5
111.8 57.7
145.5 111.8
24.7
2.4 5.6
167.2 87.0
249.8 166.7 38.5
0.0 0.0 0.1 0.1 2.4 0.0
294.5
1.4 2.6 1.! 10.8 13.0 11.1 0.3
0.0 0.0 0.1 0.3 1.3 0.1
290.0
0.0 0.0 0.1 0.4. 1.1 0.1
484.0
0.0 O.j
0.1 0.1 0.1 0.1 0.0 0.0 0.6 0.9 1.4 2.3 4.8 2.2,:
10.9 10.5 4.8 i 0.3 0.7 2.6'
841.51.375.71398.'1"!
0.4 0.8 O.s:i
same ••..•.•..•.•.•...•• 1.8 2.9 10.3 14.7 14.8 153.7 139.2 154.1 966.51096.01033.8 16 Hair, bristles, feathers toge-
ther with· bones, hom and other carvable ~oods not specificaJlymentione.d and articles JIiade from same
17 Hides and skins, leather· 1.4
goods, furs, etc. •..••... 7.3 18 Metals and metal goods. • • . 53.3 19 Machinery and apparatus .. I . 22.9 20 Means of transport •.. . . • . 4.8 21 Musical instruments, instru·
ments, clocks and watches 22 Minerals and articles made
2.4
1.6 2'~ 9.0 13.2
43.9 79. 20.21 33.11 9.3 10.1
2.4 3.7
9.1 11.8 13.2
68.2 96.4 121.1 236.0 370.5 479.5 150.0 215.5 337.6 69.1 132.5 277.3
17.3 27.3 63.6
0.3
2.9 2.6
0.61 0.0
from same ••.•••.•...•• 25.0 25.4 32.8 100.9 145.4 151.3 4.7 23 Asphalt, tar, resins, rubbei
and products made from same.... •••• • . • . •. . • • • 10.0 22.2 14.0 73.1 96.2 99.9 2.0
24 Oils, fats and waxes, and products of same •••••• 22.1 12.1 49.9 82.2 200.2 186.9 0.2
25 Etners, alcohols not speci· fically described, ethereal oils, coSll).etics, etc •••••..
26 Colours and dres ••..•..• 27 Explosives, fire·arms and
materials, fuses and fire-
0.5 3.7
0.9 5.3
0.9 5.2
4.9 27.3
28 ch:':i:i~~~~~ts·~d·~~~: 0.5 0.8 0.81 3.2
6.0 31.3
2.9
7.4 38.9
4.0
0.1 0.0
0.9
binations thereof and I' ~s ••••••.•......•••• 12.7 21.1 16.8r 66.1 82.7 82.6 0.6
29 Fertilizers........ ..•...•. 11.4 4.0 12.41 56.7 64.2 68.0 -00 Literature and works of
art, educational materials, 1
office fittings, etc. ..•.•• 2.7 2.5 3.31 21.6 28.4 35.2 0.2 . 31 Articles not specified else-
where.................. 8.1 6.4 2.81 49.0' 30.4 36.2 1.2
Re-exports ...••• ' .•.• ~~~ 11 30'::41 30~01 45~211 87~312 82~914 00~31 51 ~::I Total 11 303.41 304.01 457.2111870.312823.914003.31 520;81
• l'reIIJnIDMr IIgurea subject to minor alterations.
0.2
4.1 3.3 1.0 0.0
4.9
2.4
0.3
0.1 0.0
1.4
0.4 0.0
0.3
0.1 491.51
6.1 497.61
0.2
3.7 2.4
~ ~'J l.
J 0.] 0.1 0.0
1.2
0.9
36.2 21.9
8.'1 0.5
0.0
24.1
13.6
1.3
0.4 0.1
9.2
O.f' 6.8 - 0.0
~ H
" 11 1.9 1.'1-;
52.0 20.9 12.4
5.6
0.0
27.9
O.! 0.1
10.6
6.7 0.1
71.r .. 17.4 13.1' 0.81
<\
0.0 " J
22.3i
9.0
2.11 ,
! 0.4· 0.1,
j
15.!l i
3.7 0.1
0.1
1
2.0 1.1
0.3 1.7 1.3 2.~
704.0112281.912993.213003.0 ; 3.~ 28.338.0 27.4 I
707.9112310.213 026;213 030.4 ~
No. 8
.......... '" .-- . . ... .. _-- ~.- ........ " ......
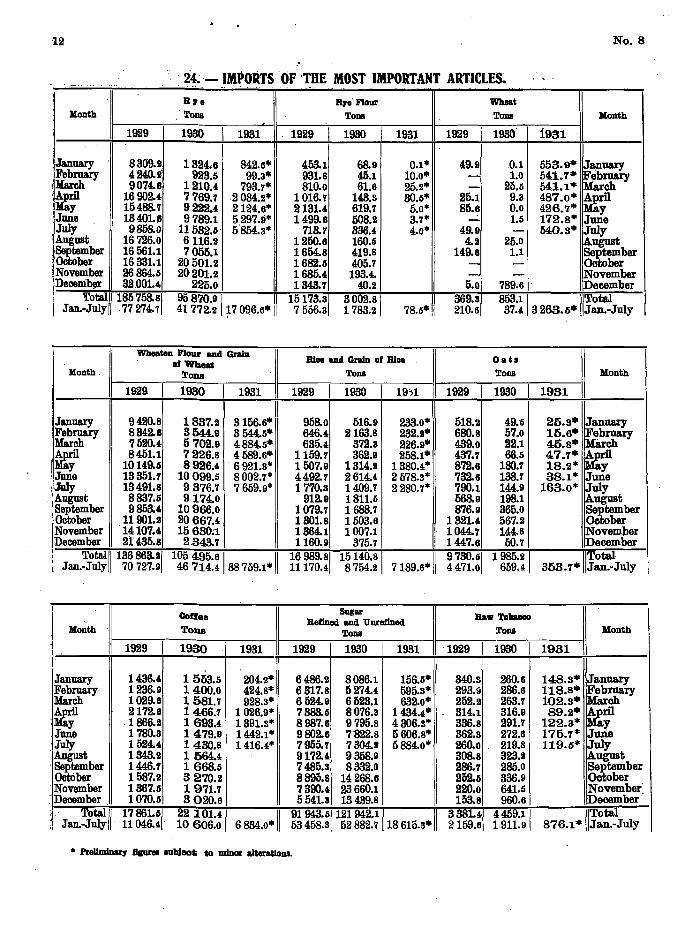
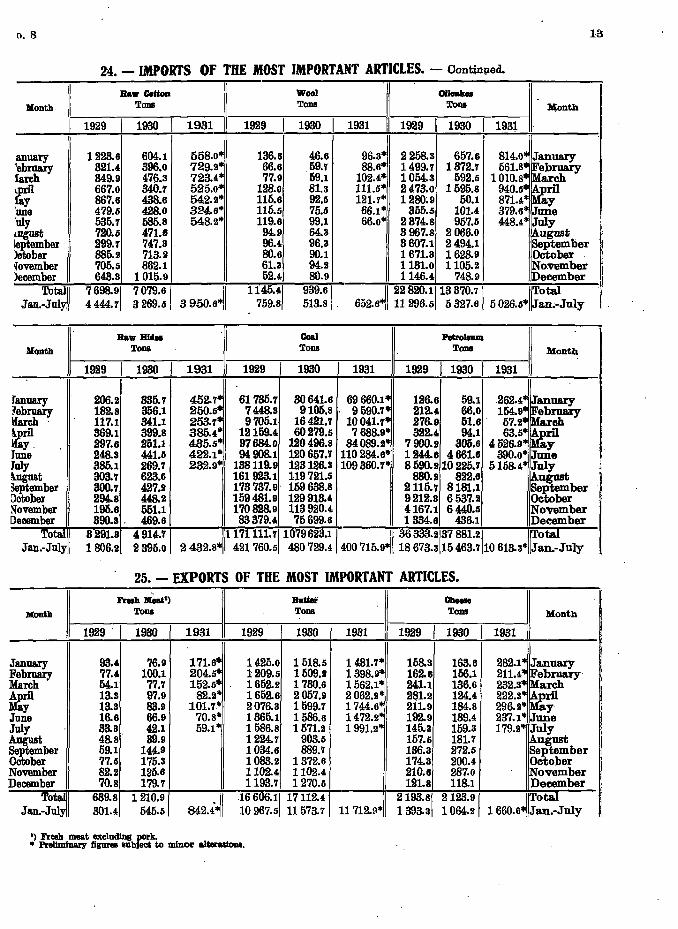
" . 24;-IMPORTS,'OF 'THE MOST IMPORTANT ARTICLES • R,. ar.Flour Wheai
Honth ' 'lODe Tone Tone Month
1929 I 1930 I 1931 1929 I , 1930 I 1931 1929 I 1930 I 1931
January 8309.2 1324.8 1 842.8",1
1 ,0.1 553.9* 453.1 68.9 0.1'" 49.9 January
:Febnwy 424O.~ 923.6 99.3'" 931.8 45.1 10;0'" - 1;0 641.'1* ~_eb~ ,March 9074.8 1210.4 793.7'" 810.0 61.6 25.2'" - 25.5 641.1* ~rr '~ 16902.4 7769.7 2084.2'" 1 016.7 143.3 30.5'" 25.1 9.3 487.0*
15488.7 9222.4 2124.8'" 2131.' 619.7 5.0* 85.8 0.0 426.'1* ~y June 13401.8 9789.1 5297.9* 1499.8 508.2 3.7* - 1.5 172.8* June July , 9858.0 11582.6 5'854.3* 718.1' 836.4 4.0* 49.9 - 640.s* July
'August 16726.0 6116.2 1260.8 160.6 4.2 25.0 ~~ber September 16561.1 7055.1 1664.8 419.8 149.8 1.1 : Otitober 16331.1 20501.2 1682.6 405.7 - - act,ber : November 26864.6 20201.2 1686., 193.4. - - November . Decenih!n' 3200l.4 225.0 1348.71 40.2 5.0 789;6 ' !December
'fatal//185758.8/ I Jan .• July77 274.7 95870.91 11 41 772.2 17 096.6* 1
16173.31 7566.3
3002.81 1783.2 78.6",1/ 369.31 210.5
863.1 1 IITotal 37.4 3263.5* Jan.·July
Wheailm Flour and Gr~ Riea and Grain of Rlea Oats of Wheat
Month ' TODS Tone Tone Month
1929 I 1930 I 1931 1929 I 1930 I 19')1 1929 I 1930 I 1931
January 9420.8 11
516.9 518.2 49.5 25.3* January 1837.2 3166.6'" 968.0 233.0* Febnwy 8342.8 3544.9 3644.5* 64U., 2163.8 232.2* 680.8 67.0 15.6* Feb~ March 7520.4 5702.9 4884.5* 636., 372.3 226.9* 439.0 22.1 45.8* M8.rch Aril 8451.1 7226.8 4689.8· 1159.7 362.9 268.1'" 437.7 66.6 47.'1* ~~ I~y 10149.6 8926.4 ' 6921.3* 1607.9 1314.2 1380.4* 872.8 180.7 18.2*
: June 13351.7 10099.6 8002.7* 4492.7 261404. 2578.3* 732.8 138.7 38.1* June ,!July 13491.8 9376.7 7669.9* 1770.3 1409.7 2280.7* 790.1 144.9 163.0* I-!uly
, August 8837.6, 9174.0 912.9 1811.5 568.9 198.1 August September 9858.' 10966.0 1079.7 1688.7 876.9 365.0 September october 11901.2 20667.4 1301.8 1503.8 1321., 567.2 OCtober November '14107.4. 15630:1 1864.1 1007.1 1044.7 144.8 November December 21: 435.8 2,343.7 1160.,9 375.7 1447.8 50.7 December
Total 11186 868.21 Jan.-July 70 727.9
105 495.8 1 11 46714.4 38759.1*
16989.81 11170.4
16140.81 8754.2 7189.6",11
9730.61 4471.0
1985.21 669.4
IITotal 353.7* Jan.-July I
I Ooff ••
Sugar I Raw Tobllllllo Refined and Unrefl.ned
Month TODS Tone ~T0D8 Month
I 1929 I 1930 I 1931 1929 I 1930 I 1931 '1929 I 1930 I 1931
January 1436., 1553.6 204.2'" 6486.2 8086.1 156.6'" 340.3 260.6 148.3* January Febnwy 1236.9 1400.0 424.8* 6317.8 5274.4 595.3* 293.9 286.8 118.8* Febl"!W'Y March 1029.8 1581.7 928.3'" 6524.9 6523.1 632.0* 252.2 263.7 102.3* March
,~ 2172.8 1466.7 1026.9* 7388.6 8076.3 1434.,'" 314.1 316.9 89.2* ril , Y ,1866.2 1693.4 1391.3* 8987.8 9795.8 4306.3* 336.8 291.7 122.3* ~y June 1780.3 1479.9 1442.1* 9802.8 7822.8 5606.8* 862.3 272.8 175.'1* June July 1524., 1430.8 1416.4* 7955.7 7304.2 5884.0* 260.0 ' 219.8 119.5* July '~ust 1348.2 1564.' 9172., 9358.9 308.8 323.2 ~ugust , September 1446.7 1668.6 7485.3 8332.0 286.7 285.0 September OctOber 1587.2 3270.2 8895.8 14268.6 252.6 336.9 OCtober
'November 1367.5 1971.7 7390.' 23660.1 11
,220.0 64l.5 ~ovember: .'December, 1070.5 3020.6 5541.3 13439.8 153.8 960.8 ecember
f Total 11 :, Jan.-July , 17861.61 11 046.4'
22101.41 10606.0 6834.0*11
91 948. 61121 942.1 1 11 53458.3 62882.7 18 615.3'"
3381·'1 2159.6
4469.11 1911.9
IITotal 876.1 * Jan.-July
• PreIlminarr fI8unI labJect; to minor alteratloJls.
1"1.8
Month. 'I I
~uary Jar~ ~ril .~ une 'ul~ LUgust ieptember >Ctober ~ovember }ecember
TOtall1 Jan.-July
Month
fanuary ~ebf!l&l'Y Karch
~ ~. June July \.ugust 3eptember Dotober S-ovember December
TO" Jan.-Jul
Month
JlLlluary Febl'llal'Y March Aril I ~y June July August September october November December
TOtalll Jan.-July
13
24. - IMPORTS Of THE MOST IMPORTANT ARTICLES. - Oontinp.ed.
Raw ClcRtou Wool Oiloakll
1.~ Tons . Tons Tons M;ontb
1929 I 1930 I 1931 1929 I 1930 I 1931 1929 I 1930 I
1223.6 604.1 558.0* 136.6 46.6 96.3* 2258.3 657.11 81~O~ ~~uary 321.4 396.0 729.2* 66.6 59.7 88.6* 1499.7 1372.7 561.8* ebruary 349.9 476.3 723.4* 77.9 59.1 102.4* 1004.3 592.5 1010.8* ~h 667.0 340.7 525.0" 128.0 813 111.5* 2473.0 1595.8 940.5 867.6 438.6 542.2* 115.6 92.5 121.7* 12BO;9 50.1 871.4* ay 479.5 428.0 324.6* 115.5 75.5 66.1* 355.5 101.4 379.6* June 535.7 585.8 548.2* 119.6 99.1 66.0* 2374.8 957.5 448.4* July
f 720.5 47l.8 94.9 64.3 3967.8 2066.0 ~ugust 299.7 747.3 96.4 96.3 3607.1 2494.1 September 885.2 713.2
I BO.6 90.1 1671.3 1628.9 OCtober .
705.5 862.1 61.3 94.2 1131.0 1105.2 November 643.3 1015.9 I ,
7698.9\ 7079.61 11 4444.'1 3269.5 3950.6*,
52.4
1145.41 759.8
80.9
939.61 513.8 .
! 1146.4 748.9 December . .I
1122820.1113370.71 I\Total iJ
652.6* 11 296.5 5327.6 5026.5* Jan;-July I.
Raw BId. Caal Pelrolnm Tons Tons Tons Month
1929 I 1930 I 1931 1929 I 1930 I 1931 1929 I 1930 I 1931
206.2 335.7 452.7* 61735.7 30641.6 69660.1" 126.6 59.1 262.4* January 182.8 356.1 250.5* 7448.3 9105.8 . 9590.7' 212.4 66.0 154.:: t:r 117.1 341.1 253.7" 9705.1 16421.7 10041.7' 276.9 51.6 57.2 369.1 399.8 385.4* 12159.4 60279.5 7688.9* 322.4 94.1 63.5* ~~ 297.6 251.1 435.5* 97684.0 120496.8 84089.2* 7900.1I 800.6 4526.9* . Y 248.3 441.5 422.1* 94908.1 120657.7 110284.6* 1244.6 4661.6 390.0* June 385.1 269.7 232.9* 138119.9 123126.3 109360.7* 8590.1I 10225.7 5158.4* ~'f-y
;
303.7 623.6 161923.1 119721.5 830.2 822.6 ugust 800.7 427.2 173737.9 159638.8 2115.7 8181.1 September 294.8 448.2 159481.9 129913.4 9212.3 6537.2 OCtober 195.6 551.1 170828.9 113920.4 4167.1 6440.5 November 390.3. 469.6 83379.4 75699.6 1334.6 436.1 December
3291.31 1806.2
4914.71 2395.0
111171111.711079623.11 1136333.2137881.21 IITOtal 2432.8* 421 760.5 480729.4 400715.9* 18673.315463.7 10613.3* Jan.-July
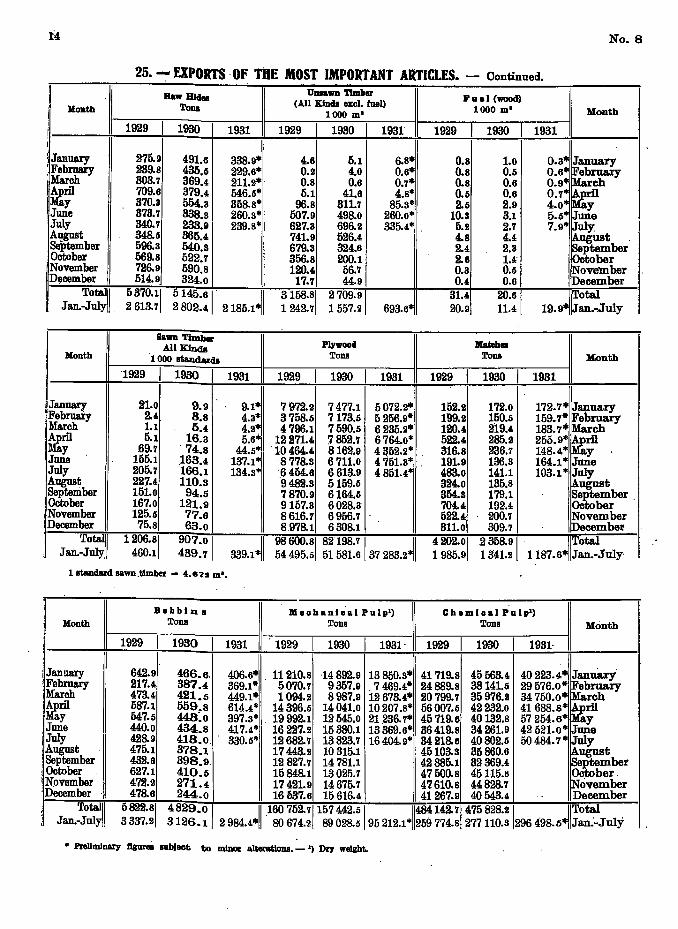
25. - EXPORTS Of THE MOST IMPORTANT ARTICLES.
I'nIh meai' ) Batier ChaM. Tone Tons Tons Montb
1929 . I 1930 I 1931 1929 I 1930 I 1931 1929 I 1930 I 1931
93.4 76.9 171.6* 1425.0 1518.5 1481.7* 158.3 163.6 ~llury 77.4 100.1 204.5* 1209.5 1509.2 1398.9* 162.6 156.1 211.4* eb:r1lal'Y I' 04.1 77.7 152.5" 1652.2 1730.6 1562.1* 241.1 136.6 232.3 arch
13.3 97.9 82.2* 1652.6 2057.9 2062.2* 281.2 124.4 222.3* A ril 13.3 83.9 101.7* 2076.3 1599.7 1744.6* 211.9 184.s 296.2* y 16.6 66.9 70.s* 1365.1 1586.6 1472.2* 192.9 139.4 237.1* June 33.3 42.1 59.1* 1586.s 1571.2 1991.2* 145.3 159.3 179.2*
r I I
48.s 39.9 1224.7 903.5 157.5 181.7 ugust I 59.1 144.9 1034.6 889.7 136.3 272.5 September 77.5 175.3 1083.2 1372.6 174.3 200.4 October I
82.2 125.6 1102.4 1102.4 210.6 287.0 November I 70.8 179.7 1193.7 1270.5 121.8 118.1 December
639.81 1210.91 842.4*11
16606.1117112.41 11 712.!I*1I
2193.81 2123.91 1660.6*1~:n~JulY . i
301.4 545.5 10 967.5 11 573.7 1393.3 1064.2 .
') Fresh meat excludI.Dg pork. • PrelimlllAlT flgur. subject to minor alteraUoDa.
14 No. 8
25. - EXPORTS 'Of TilE MOST IMPORTANT ARTICLES. - Continued. "
Raw Bid .. UDSawn TImber Faa·1 (wood)
Ilonth Tone (All KInds u:cl. fuel) 1000 m" Month I 1000 m" I i 1929 I 1930 i I 1931 1929 I 1930 I 1931 1929 I 1930 I 1931 i·
: January 275.9 491.6 338.9* 4.6 5.1 6.8* 0.8 1.0 O.s* Ja.nuary 'February 239.8 435.5 229.6* 0.2 4.0 0.6* 0.8 0.5 0.6* I¥..ebrua.ry : March 303.7 369.4 211.2* 0.8 0.6 0.7* 0.8 0.6 0.9~ March Aril 709.6 379.4 546.5* 5.1 41.6 4.8* 0.5 0.6 0.7* ~f ~y 370.3 564.3 358.8* 96.8 311.7 85.3* 2.5 2.9 4.0* June 373.7 338.s 260.s* 507.9 498.0 260.0* 10.3 3.1 5.5* June
I July 340.7 233.9 239.8* 627.3 696.2 335.4* 5.2 2.7 7.9* July August 348.5 366.4 741.9 626.4 4.8 4.4 ~ugUst . ~tember 596.3 640.s 679.3 324.6 2.4 2.3 September October 569.8 522.7 356.8 200.1 2.6 1.4' October November 726.9 690.8 120.4 56.7 0.3 0.5 November
IDllcember 514.9 324.0 17.7 44.9 0.4 0.6 li>ecember I
TO~I 5370.11 5145.61' 2185.1*11
3158.81 2709.91 693.6*11
31.4. 20.6' I Total I 11.41 Jan.·JuIYI ' 2613.7 2802.4 1242.7 1557.2 20.9 19.9* Ja.n • .,J'uly
Sawn TiIIlber Plywood Maiob .. AllXinds
Month 1000 Btandards Tom Tom Month
I 1929 I 1930 I 1931 1929 I 1930 I 1931 1929 1 1930 I 1931
January 21.0 9.9 9.1* 7972.2 7477.1 5072.2* 152.2 172.0 172.7* J~uary .Februaiy 2.4 8.8 4.3* 3'758.5 7173.5 5256.9- 199.2 150.5 159.7* February 'March 1.1 5.4 4.2* 4796.1 7590.5 6235.2* 120.4 21.9.4 183.7* March I~ril 5.1 16.s 5.6*1 12271.4 7852.'1 6764.0* 522.4 285.2 255.9* ~~ I Y 69.'1 . 74.8 44.5* '10464.4 8162.9 ~~g~::: 316.8 286.7 148.4* Y , June 155.1 ,168.4 137.1 * 8778.$ 6711.0 191.9 136.3 164.1* June July 205.7 166.1 134.3* '6454.6 6613.9 4851.4* 483.0 141.1 103.1* July August 227.4 110.s 9482.3 5159.5 324.0 135.8 ~ugust September 151.0 94.5 7870.9 6164.5 354.s 179.1 September , OCtober 167.0 121.9 9157.3 6028.a 704.4 192.4 OCtober November 125.5 77.6 8616.7 6956.'1 522.4 200.7 November December 75.8 68.0 8.978.1 6308.1 311.0 309.7 iDecember
: Totalll 1206.81 907.0 I 339.1*11
98 600.81 82198.71 11 4 202~01 2358.91 . IITOtal Ja.:il..·July 460.1 439.7 54 495.5 51 581.6 37 283.2* 1985.9 1341.11 1187.6* Ja.n.-.July
1 Btandard BaWD.tlmber - '4.871 m".
Bobbins M e 0 h ani" alP u 1 p') Ch. m hal Pu 1 p') Month Tons TohB Tom Month
: 1929 I 1930 I 1931 1929 I 1930 I 1931- 1929 I 1930 I 1931-
i January 642.9 466.6. 406.6" 11210.8 '14892.9 13850.3* 41719.8 45563.4 40223.4* Ja.nu&ry' Febl118.lY 217.4 387.4 369.1- 5070.'1 9357.9 ,7469.4* 24889.8 38141.5 29576.0* February March 473.4 421.6 449.1* 1094.2 8987.9 12673.4* 20799.7 35976.2 34750.0* ~ch Aril 587.1 559.8 614.4* 14396.5 14041.0 10207.8* 56007.5 42232.0 41688.8* ~f ~y 547.6 443~0 397.3* , 19992.1 12545.0 21236.'1* 45719.6 40132.8 57254.6* June 440.0 484.8 417.4* 16227.2 15380.1 13369.6* 36419.8 34261.9 42521.0* June July 428.9 413.0 .. 330.5* 12682.7 13823.7 16404.9* 34 218.6 40802.5 50484.7* July
: August ' 475.1 378.1 17443.2 10 315.1 45103.3 35860.6 ~ugust September 432.6 398.9 12827.7 14781.1 42885.1 32369.4 September
I OCtober 627.1 410.5 15848.1 13025.7 47500.8 45115.11 OCtober . N.ovember 472.2 271.4 17421.9 14675.'1 47610.8 44828.'1 November December 478.6 244.0 16537.6 15616.4 41267.9 40543.4 .. December
, ,
Totalll Jan.·July
5822.81 3337.2
4829.0 I 11160752.71157442.51 --r84142·'11475828.21 IITotal 3126.1 2984.4*' 80674.2 89028.5 95212.1* 259774.8 277110.3 296498.5* Ja.n:-.July
• Preliminary flgure8 subject to minor alteratloDB. _.) Dll' weight.
~o. 6 15
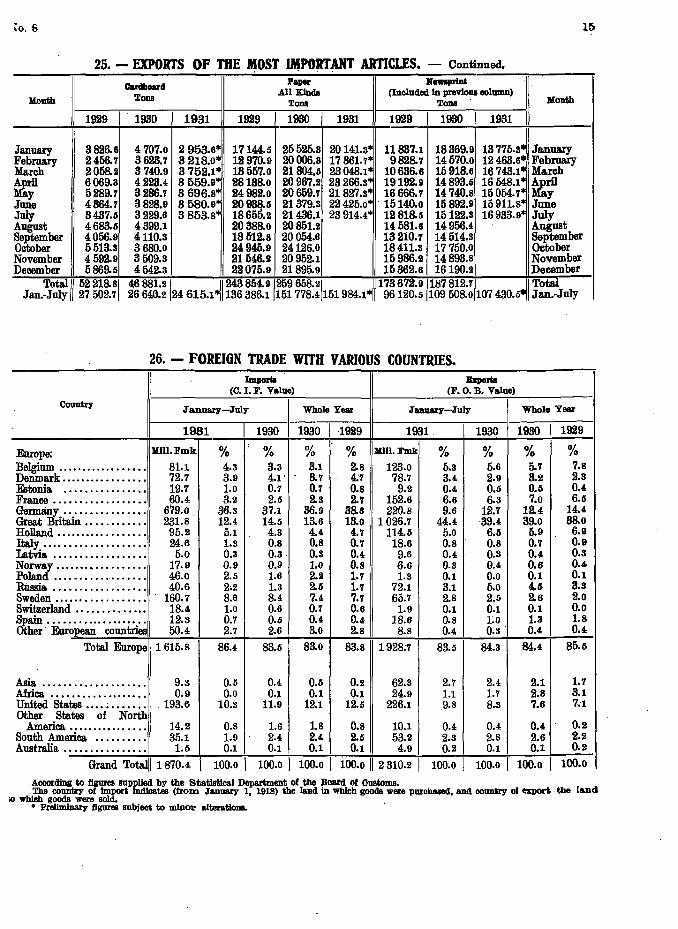
25. - EXPORTS Of THE MOST IMPORTANT ARTICLES. - Continued.
Canlboard Paper IIInnprlnt
All Kinds (Included In previous colUlllll) )((m.th Tons
Tons Tons Konth
1929 I . 1930 I 1931 1929 I 1930 I 1931 1929 I 1930 I 1931
January 3826.6 4707.0 2953.6* 17144.5 25525.3 20141.3* 11837.1 18369.9 13775.3* January February 2456.7 3623.7 -3218.0* 12970.9 20006.3 17 361.~: 9828.7 14570.0 12463.6· February March 2058.2 3740.9 3752.1· 13557.0 21804.5 23048.1 10636.8 15918.6 16743.1* March Am 6069.3 4223.4 3559.9* 28138.0 20967.2 23266.3* 19192.9 14893.5 16548.1* AriI ~~ 5289.7 3286.7 3696.s* 24982.0 20659.7 21827.3* 16666.7 14740.8 150M.'{* ~y June 4364.7 3828.9 3580.9* 20938.5 21379.3 22425.0* 15140.0 15892.9 15911.8* June July 3437.5 3229.8 3853.8* 18655.2 21436.1 23914.4* 12818.5 15122.3 16933.9* i~t August 4683.5 4399.1 20388.0 20851.2 14581.8 14956.4 September 4056.9 4110.3 18512.8 20054.8 13210.7 14514.3 September October 5513.3 3680.0 24945.9 24126.0 18411.3 17750.0 October November 4592.9 3509.3 21546.2 20952.1 15986.2 14893.8 November December 5869.5 4542.3 22075.9 21895.9 15362.8 16190.2 December
Total// 52218.S/ Jan.-July 27502.7
46881.2/ '1243854.9/259658.2/ //173672.9/187812.7/ ~ITotal 26640.2 24615.1*1 136386.1 151778.4151984.1* 96120.5 109508.0 107430.5 Jan.-July
26. - FOREIGN TRADE WITH VARIOUS COUNTRIES. Imporia Ellporia
(c. I. F. Value) (F. O. B. Value)
Country January-July
I Whole Year January-July
I Whole Year
1931 I 1930 1930 I 1929 1931. I 1930 1930 I 1929
Europe: Mlll.Fmk % % % % Mill.Fmk % % % % Belgium .................. 81.1 4.3 3.3 3.1 2.s 123.0 5.3 5.6 5.7 7.s Denmark ................• 72.7 3.9 4.1' 3.7 4.'7 78.7 3.4 2.9 3.2 2.3 Estonia ................ 19.'1 1.0 0.7 0.7 0.8 9.2 0.4 0.5 0.5 0.' France .................. 60.4 3.2 2.5 2.3 2.7 152.6 6.6 6.3 7.0 6.5 Gel'JIlliny .......•..•...•. 679.0 36.3 37.1 36.9 38.3 220.8 9.6 12.7 12.4 14.4 Great Britain ............ 231.8 12.4 14.5 13.6 13.0 1026.7 44.4 39.4 39.0 38.0 Holland .................. 95.2 5.1 4.3 4.4 4.7 114.5 5.0 6.5 5.9 6.9 Italy .................... ' 24.6 1.3 O.S O.S 0.7 18.6 0.8 0.8 0.'1 0.9 Latvia .•..........•..... 5.0 0.3 0.3 0.3 0.4 9.6 0.4 0.3 0.4 0.3 Norway ....••.•.......... 17.9 0.9 0.9 1.0 0.8 6.6 0.3 0.4 0.6 0.4 Poland ..................• 46.0 2.5 l.6 2.2 1.7 1.3 0.1 0.0 0.1 0.1 RUssia .................. 40.6 2:2 1.3 2.5 1.7 72.1 3.1 5.0 4.5 3.3 Sweden .................. 160.'1 8.6 8.4 7.4 7.7 65.7 2.8 .2.5 2.6 2.0 Switzerland .............. 18.4 1.0 0.6 0.7 0.8 1.9 0.1 0.1 0.1 0.0 Spain .................... 12.3 0.7 0.5 0.4 0.4 18.6 0.8 1~0 1.3 1.8 Other' European countries 50.4 2.7 2.6 3.0 2.s 8.8 0.4 0.3 0.4 0.4
Total Europe 1615.8 86.4 83.5 83.0 83.s 1928."1 83.5 84.3 84.4 85.5
Asia ..................... 9.3 0.5 0.4 0.5 0.2 62.3 2.7 2.4 2.1 1.'1 Africa. ................... 0.9 0.0 0.1 0.1 0.1 24.9 1.1 1.7 2.8 3.1 United States .... ; ....... .193.6 10.3 11.9 12.1 12.5 226.1 .9.8 8.3 7.6 7 .. 1 Other States of North
America. ................ 14.2 0.8 1.6 1.8 0.8 10.1 0.4 0.4 0.4 0.2 South America. .......... 35.1 1.9 2.4 2.4 2.5 53.2 2.3 2.8 2.6 2.2 Australia ................ 1.5 0.1 0.1 0.1 0.1 4.9 0.2 0.1 0.1 0.2
Grand Total 1870.4 100.0 100.0 I 100.0 I 100.0 2310.2 100.0 100.0 I 100.0 I 100.0
According to figures supplied by the Statistical Department of the Board of Customs. The country of import indicates (from January I, 1915) the land in Which loods were purchased, and country of export the land
;0 which loods were sold. • Preliminary figures subject to minor alteratiODS. .
16 No. 8
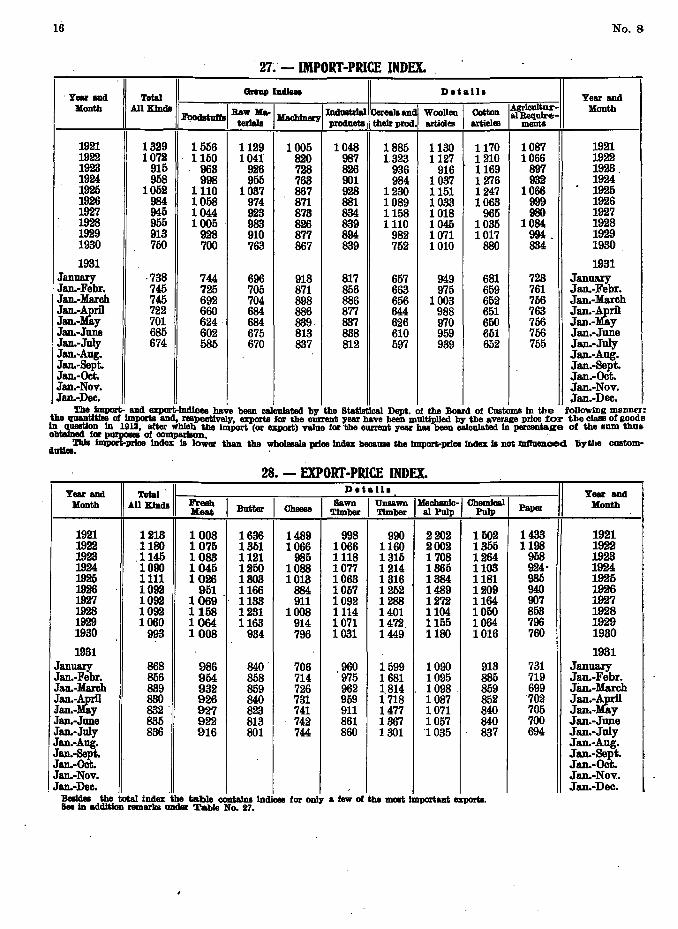
. 27~' - IMPORT ·PRlCE INDEX.
. Year and Total I Grovp~ Deiaill Year and
Month All Klnda I F~I Ra~ IHacblneryI~ua:: CereaJBan~ WooUen I Cotton IAgricultur- Month
81 Requlre:-their prod. articles articles menta
1921 1329 1556 1129 1005 1048 1885 1130 1170 1087 1921 1922 1072 1150 1041 820 987 1323 1127 1210 1066 1922 1923 915 963 926 728 826 936 916 1169 897 1923 . 1924 958 998 955 763 901 984 1037 1276 932 1924 1926 1052 1110 1037 867 928 1230 1151 1247 1066
. 1925 1926 984 1058 974 871 881 1089 1033 1063 999 1926 1927 945 1044 923 873 834 1158 1018 965 980 1927 1928 955 1005 983 826 839 1110 1045 1035 1084 1928 1929 913 928 910 877 894 982 1071 1017 994 .. 1929 1930 750 700 763 867 839 752 1010 880 834 1930
1931 1931 Jan1lllolY ·738 744 696 918 817 657 949 681 723 January Jan.-Febr. 745 725 705 871 856 663 975 659 761 Jan.-Febr. Jan.-March 745 692 704 898 886 656 1003 652 756 Jan.-March Jan.-~ril 722 660 684 886 877 644 988 651 763 Jan.-~ Jan.- y 701 624 684 839 837 626 970 650 756 Jan.- y Jan.-June 685 602 675 813 838 610 959 651 756 Jan.-June Jan.-July 674 585 670 837 812 597 939 652 755 Jan.-July Jan.-Aug. Jan.-Aug. Jan.-Sept. Jan.-Sept. Jan.-Oet. Jan.-OCt. Jan.-Nov. Jan.-Nov. Jan.-Dec. Jan.-Dec.
The Import- and export-lnd1cea have been calculated by the 8tatlst1cal Dept. of the Board of Cuatolllll in the following mannPI: the qaantltlsii of Imports and, resPectively, exports for ue current year have been muIUpUed by the average price for the claBB of good B ~t1on In 1913, after whloh the Import. (or expOl't) value for the current year has been calculated In percentage of the Bnm thus o for pqrpoaea of comparlaon. .
ThIs import-price Index la lower than the wholelale pdae Index ~11811 the Import-price lladex la JlC)$ lDtfuenoed liythe cUBtom-d1Rlel. .
28. - EXPORT ·PRlCE INDEX. Year and IIAI~II
Deialh
~th Fresh I :Butter I Cheese I Sawn I UDSBwn I :Mechan1o-1 Chemical I
Meat Tb;nber TImber aI Pulp Pulp
1921 1213 1008 1636 1489 998 990 2202 1502 1922 .1180 1075 1351 1066 1066 1160 2002 1355 1923 .1145 1083 1121 985 1118 1315 1708 1264 1924 1090 1045 1250 1088 1077 1214 1365 1103 1925 1111 1026 1303 1013 1063 1316 1384 1181 1926 1092 951 1166 884 1057 1252 1489 1209 1927 1092 1069 1133 911 1092 1288 1272 1164 1928 1092 1168 1231 1008 1114 1401 1104 1050 1929 1060 1064 1163 914 1071 1472. 1155 1064 1930 993 1008 934 796 1031 1449 1180 1016
1931 Janua.ry 868 986 840 . 706 960 1599 1090 913 Jan.-Febr. 856 964 858 714 975 1681 1095 885 Jan.-March 839 932 859 726 962 1.814 1098 859 Jan.-~ 830 926 840 731 959 1718 1087 852 Jan.- y 832 . 927 823 741 911 1477 1071 840 Jan.-June 835 922 813 742 861 1367 1057 840 Jan.-July 836 916 801 744 860 1301 1035 837 Jan.-Aug. Jan.-SePt. Jan.-OCt. Jan.-Nov. Jan.-Dec.
:BeaIdea the total index the table contaInB Indioel for oo1y a few of the moat Important exports. 8ee in addition remarks andar Table No. 27.
11
Year and
Paper )[onth
1433 1921 1198 1922
958 1923 924' 1924 935 1926 940 1926 907 1927 803 1928 796 1929 760 1930
1931 731 JanWl.lY 719 Jan.-Febr. , 699 Jan.-March 702 Jan.-~ril 705 Jan.- y 700
I Jan.-June
694 Jan.-July Jan.-Aug •. Jan.-Sept. Jan.-OCt. l Jan.-Nov. Jan.-Dec.
). 8 17
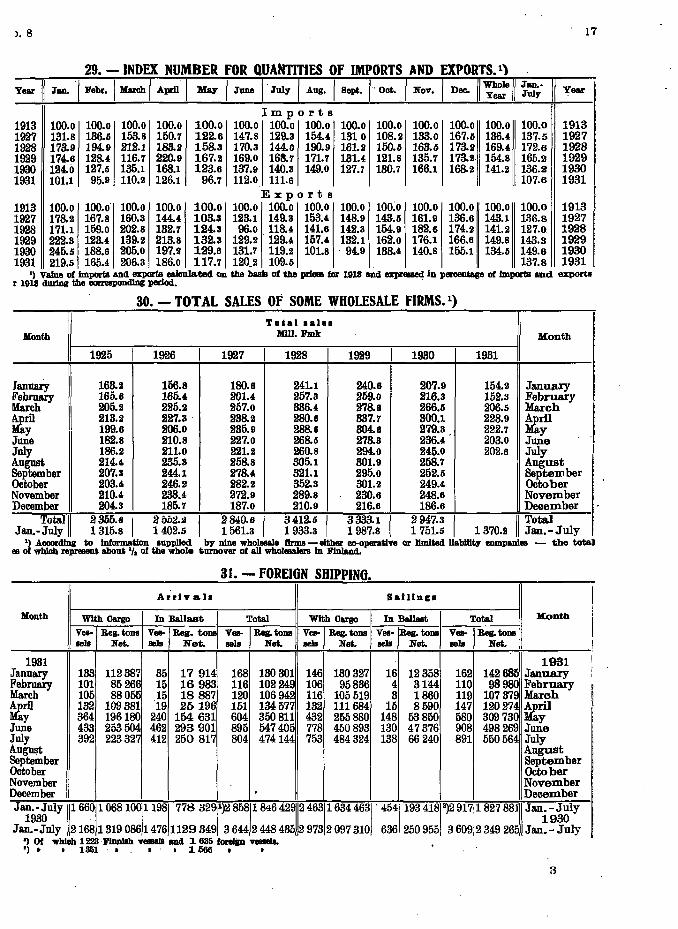
29. - INDEX NUMBER fOR QUANTITIES Of IMPORTS AND EXPORTS.l)
Year 11 Jan., Febr. , March' Aprll' May I JUDe' July , Aug. I sept." Oct. I Nov. / Dec. 11 '=0 I ~:y' 11 Year
Imports 1913 100.0 100.0 100.0 100.0 100.0 100.0 100.0 100.0 100.0 100.0 100.0 100.0 100.0 100.0 1913 1927 131.8 136.5 153.8 150.7 122.6 147.8 129.3 154.4- 1310 108.2 133.0 167.5 136.4- 137.5 1927 1928 178.9 194.9 212.1 183.2 158.3 170.3 144.0 190.9 161.2 150.5 163.5 178.2 16!1.4. 172.6 1928 1929 174.6 12&4- 116.7 220.9 167.2 169.0 168.7 171.7 13l.4. 121.8 135.7 173.2. 154.8 165.2 1929 1930 124.0 127.5 135.1 168.1 123.6 137.9 140.3 149.0 127.7 130.7 166.1 168.2 141.2 136.2 1930 1931 101.1 95.9 110.2 126.1 96.7 112.0 111.6 107.6 1931
Exports 1913 100.0 100.0· 100.0 100.0 100.0 100.0 100.0 100.0 100.0 100;0 100.0 100.0 100.0 100.0 1913 1927 178.2 167.8 160.3 144.4- 103.3 123.1 149.3 153.4. 148.9 143.5 161.9 136.6 143.1 1116.8 1927 1928 171.1 159.0 202.8 132.7 124.3 96.0 118.4- 141.6 142.3 154.9 182.6 174.2 141.2 127.0 1928 1929 222.3 128.4- 139.2 213.8 132.3 129.2 129.4- 157.4- 132.1 162.0 176.1 166.6 149.8 143.3 1929 1930 245.5 188.6 205.0 197.2 129.6 131.7 119.2 101.8 ·94.9 133.4. 140.8 155.1 134.5 149.6 1930 1931 219.5 165.4 206.3 186.0 117.7 120_2 109.5 137.8 1931
') Value of Imports and exporta eaIcula.ted on the basis of the prIeee fOIl 1918 and expreued In percentage of Importa and exports r 1918 durIDg the corresponding period. .
30. - TOTAL SALES OF SOME WHOLESALE fIRMS. 1)
TDtallal11
Jr£onth MIll. Fmk Month
1925 I 1926 I 1927 I 1928 I 1929 I 1930 I 1931
Janualy 163.2 156.8 180.6 241.1 240.6 207.9 154.2 January I.l'ebrnary 165.6 165.' 201.' 257.3 259.0 216.3 152.3 February March 205.2 225.2 257.0 336.4- 278.6 266.5 206.5 March Aril 213.2 227.3· 23&2 280.6 337.7 300.1 228.9 Aril :&y 199.6 206.0 235.9 288.6 304.6 279.8 222.7 ~~ June 182.8 210.8 227.0 268.5 273.3 236.4 203.0 June
I July 186.2 211.0 221.2 260.8 294.0 245.0 202.6 July August 214.4 235.s 258.8 305.1 301.9 258.7 August September 207.3 244.1 278.4- 321.1 295.0 252.5 September October 203.4- 246.2 282.2 352.3 301.2 249.4 OCtober November 210.4- 238.4 272.9 289.8 230.6 248.6 November December 204.3 185.7 187.0 210.9 216.6 186.6 December ,
Tot&lll 2355.6 I 2bl>a.:4 I 2840.6 , 3412.5 I 3333.1 , 2947.3 , 11 Total Jan.· July 1315.8 1402.5 1561.3 1933.3 1987.8 1751.5 1370.2 Jan.-July
') Acoordfng io lDformatlon supplied by nine wholesale firms - either co-operative or IImfted lfablllty IlOIDpanies - the total ea of which represent about 'I. of the whole turnover of all wholesalers In FInland.
31. - fOREION SHIPPING . Arrlva .. SaillnCI I
Month With Cargo In Ballast I Total With Cargo I In Ballast I Total Month I vos-, Beg. ions ves-, Beg. tons Ves- / Beg. tons ves./ Beg. ions ves./Reg. ions Ves- ,Beg. ions aels Net. eels Net. sels Net. aels Net. aels Net. aels Net. !
1931 I 1931 I
January 133 112387 35 17914 168 130301 146 130327 16 12358 162 142685 January ; I
February 101 8526e 15 16983 116 1022~~ 106 95836 4 3144 110 98~~ February
! March 105 88055 15 18887 120 10694~ 116 105519 3 1860 119 107379 March Aril 132 109381 19 25196 151 134577 132 111684 15 8590 147 1202?~ Aril ~y 364 196180 240 154 631 604 350811 432 255880 148 53850 580 309 730 ~y Jlme 433 253504 462 293901 895 547405 778 450893 130 47376 908 498269 June July 392 223327 412 250817 804 474144 753 484324 138 66240 891 550564 July A.ug~t August September September October October November November , DeCl'mber . December
J~93~uIY It 66011 0681O~11981778 32~1)2 858)1846 42~k 463116344631.4(41193418111)291711827 881l\ Jani9~OIY Jan.·July 2168131908614761129349 3644 2 448 435' 9732097310 636 250955 36092349265 Jan. - July
') Of wWoh 1223FInnlah vesaeIIi and 1. 635 foreign ~ .). • 1·351·. . • • 1. 566. •
3
J8 . No. 8
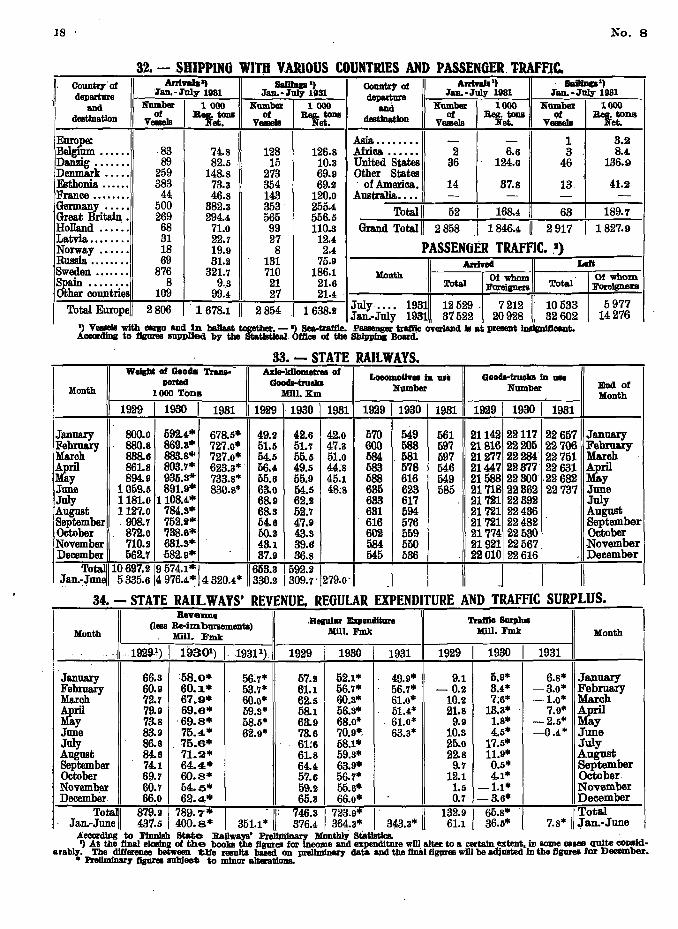
32. - SBIPPINO WITH VARIOUS COUNTRIES AND PASSENOER lRAFFJC.
/. CountryofJ'an~J'~11131 J'~~!=~~31 c .. ~~ J'':'~:;'1031 J'an.~~~1I31 " departure __ .~U
I and Number I 1 000 Number I 1 000 . and Number I 1000 Number I 1000 1 __ des_tln_lItIo_n----1f-'v..;;;:e=IB-i-_~......;;;.:·et;;;~_!l__v;..:e:,=18~i...~......;;;.:·ettona;;..-1 __ destlna. __ tIo_n_!f---:v..;;':;;:.eIa=--+-~~·;.::-;;..-+!--V;..:':=eIa;""'I__~~·et..;;;.to-D8_1
I=~ ...... ·83 74.8 128 126.8 ~~:::::: 11 -; Danzig . . . . . . . 89 82.5 15 10.3 United States 36
6.6 124.0
1 3
46
France ........ 44 46.8 143 120.0 Australia..... - - -
3.2 8.4-
136.9
41.2 Demnark . . . . . 259 148.8 273 69.9 Other States I Esthonia ...... 383 73.3 354 69.2' of America. 14 37.8 13. 1
. g:anlriiaj;; : ~g~ ~~!:! g~g . ~~~:! Total 11 52 1 168.4 11 63 1
t~. :: : : : : g~ ~~:~ ~~ l~g:: Grand Total 11 2 858 J 1 846.4 11 2 917 1
189.7 1827.9
Norwa.y ...... 18 19.9 8 2.4 PASSENOER TRAFfiC •. 1)
-r;~·.:.::::::I!11 8~i 3~H ~~~ l~H Month\\ TotalArrii~=\\ Total \~~ . Other countries 109 99.4 27 21.4 II I 11 1
TotaJ Europell 2806 1 1 678.1 11 2 854 1 1 638 2 July. • • • 1931 12 529. 7 212 10 533 5 977
1
. . Jan.-July 1931 37522 20928 32 602 14 276 ') VeueJs with CIIlIJO and In ballast together. - I) Sea-traffle. PtIs8enger traffIe overland la lit preeeut Inofgnlflaant. AocordIng to figures BUppUed by tbe StatlBtlcal Office of tbe SbI.pplnc Board.
33. - STATE RAILWAYS . Weight of Gooda TraJw.- Az1e-kIlomeVea of
Loeomotivea iD usi Goodl-truoka iD 1IH poriad GoodHrueb Number Number Month 1000 TOns lWll. Km
1929 1 1930 I 1931 1929 11930 I 1931 1929 11930 1 1931 1929 1 1930 1 1931
January 800.0 592.4* 678.5* 49.2 42.6 42.0 570 549 561 21142 22117 22657 February 880.8 869.3* 727.0* 51.5 51.7 47.3 600 588 597 21816 22205 22706 March 838.6 883.8* 727.0* 54.5 55.5 51.0 584 581 597 21277 22284 22751
End of Month
Janus.ry Februa.ry March .
Aril 861.8 803.7* 623.3* 56.4 49.5 44;8 583 578 546 21447 22377' 22631 Aril ,~y 894.9 935.3* 733.8* 55.6 55.9 45.1 588 616 549 21588 22300 .22682 ~y 1059.5 891.9* 635 June 830.8* 63.0 54.5 48;8 623 585 21718 22362 22737 June
. July 1181.0 1108.4* 68.9 62;2 633 617 21721 22392 July
. August 1127.0 784.3* 68.3 52.7 631 594 21721 22436 August September .908.7 752.2* 54.6 4'7.9 . 616 576 21721 22482 September October 872.0 738.6* 50.3 43.3 602 559 21774 22530 October November 710.2 631.3* 48.1 39.11 5B4 550 21921 22567 November December 562.7 ·582.9* 37.9 36.8 545 586 22010 22616 . December
To 10697.2 9574.1* 653.3 592.2 Ja.n.-June 5 335.6 4 976.4* 4 320.4 * 830.2 809.7' 279.0' .~I I .1 j
34. - STATE RAILWAYS' REVENUE REOULAR EXPENDITURE AND TRAFFIC SURPLUS. ,
I Revenue
.RIIUlIl1' ElqJancliiure
~'009 Traffio Surplus
Month (11BB Re-m bursemantB)
Mill. Fmk Mill. Fmk Month Mill. Fmk
"' _. .... 19291)1 19301) I· 19311) 1929 1 1930 1 1981 1 1930 1 1931
January 66.3 :58_0* 56:7* 57.2 52.1* 49.9* 9.1 5.9* 6.8* January Febl!lUY 60.9 . 60.1* 58.7* 61.1 56.7* 56.7* -0.2 8.4* -8.0* February March 72.7 67.0* 60.0* 62.5 60.3* 61.0* 10.2 7;6* -1.0* March Aril 79.9 69.6* 59:3* 58.1 56.3* 51.4* 21.s 13.3* 7.9* Aril ~y 73.8 . 69.8* 58.5* 68.9 68.0· . 61.0* 9.9 1.8* -2.5* ~y June 83.9 75.4* 62.9* 73.6 70.9*. 63.3* 10.3 4.5* -0.4* June July 86.8 75.6* 61:6 58.1* 25.0 17.5* July August 84.6 71.2* 61.8 59.3* 22.8 11.9* August September 74.1 64.4* 64.4 63.9* 9.7 0.5* September October
I 69.7 60.8* 57.6 56.7* 12.1 4.1* October.
November 60.7 54.6* 59.2 00.6* 1.5 -1.1* November December
" 66.0 62.4* I 65.3 66.0* 0.7 -3.6* December
JanJ~~1 879.21 789•7 * 1 851.1~ Ir
746.3 I 723.9* I' 343.3* 11
132.91 65.s* 1
j/Total 437.5 400.8* 876.4 364.3* 61.1 86.5* 7.8* "'-an.-June
I
I Aecardlng to FInDIah State . RaIlW&J8' PrellJIiInary' Monthly statistics. . ') At the final elOBlng of the books the figures for income and upenditure '!I'ill alter to 11 certain ~tent. in BOme eases quite conald·
arab!y. Tbe diUerence between tll'e resultB based on prellJnlnary data and the fIniII filnJl'tlll wD! be adjuated In the figmea for Deeember. • PrelImInary figureB Bubject to minor alterations.
No. 8 19
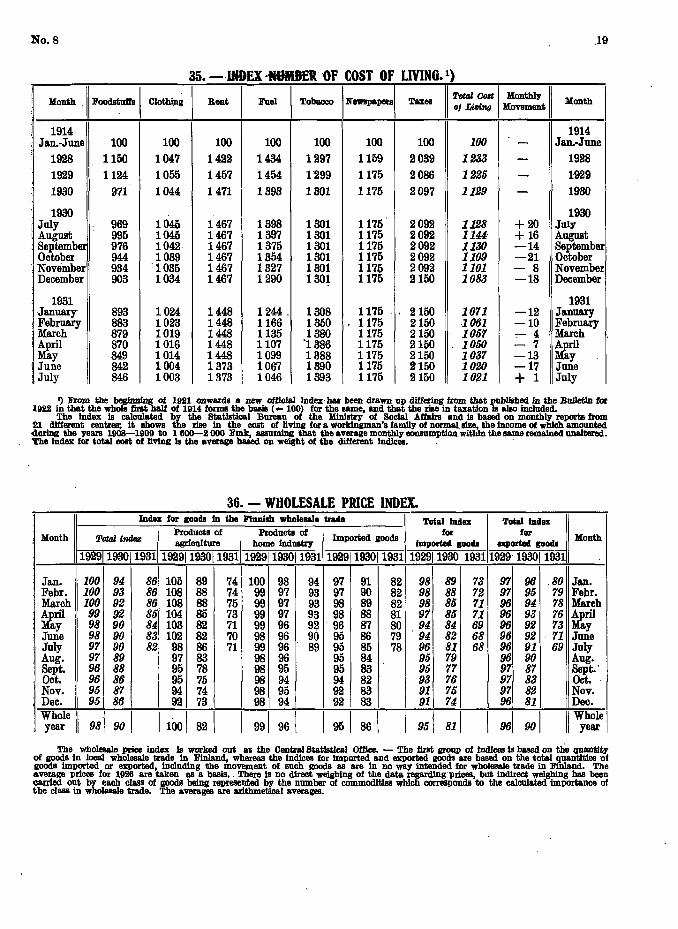
I Month ·11 Foodstufta I C~~ 1 Rent I Fnel I Tobacco I N8WBp
apersl Taxes 11 ~~: I =:!!t 11 Month I 1914 1914
Jan.-June 100 100 100 100 100 100 100 100 - Jan.-June
1928 1150 1047 1422 1434 1297 1159 2039 1233 - 1928
1929 1124 1055 1457 1454 1299 1175 2086 1226 - 1929 1930 971 1044 1471 1393 1301 1175 2097 1129 - 1930
1930 1930 July 969 1045 1467 1398 1301 1175 2092 1128 + 20 July August 995 1045 1467 1397 1301 1175 2092 1144' + 16 August Septembm: 976 1042 1467 1375 1301 1175 2092 1130 -14 September Octobm: 944 1039 1467 1354 1301 1175 2092 1109 -21 October November 934 '1035 1467 1327 1301 1175 2092 1101 - 8 November December 903 1034 1467 1290 1301 1175 2150 1083 -18 December
1931 1931 January 893 1024 1448 1244 . 1308 1175 .. 2150 1071 -12 Jamary February 883 1023 1448 1166 1350 1175 2150 1061 -10 February March 879 1019 1448 1135 1380 1175 2150 1057 .,.- 4 March ~ril 870 1016 1448 1107 ·1386 1175. 2150 1050 - 7 Aril
ay 849 1014 1448 1099 1388 1175 2150 1037 -13 :ay June 842 1004 1373 1067 1390 1175 2150 1020 -17 June July 846 1003 1373 1046 1393 1175 2150 1021 + 1 July
') From the beIIInnfng of 1921 onwards a new offlcla1 Indez' has been drawn up dillering from that published In the BnIIetIn fol 1922 In that the whole first lIIllf of 1914 forms the basis ( .. 100) for the same, and that the rise In taxation Is also Included.
The Index is calculated by the Statistical Bureau of the. MInistry of Social Affairs Bnd Is baeed on monthly reports from 21 different centres; It shows the rise In the cost of living for a worldngman's family of normal. size, the Income of wbieb amounted during the years 1908-1909 to 1600-2000 Fmk, aesumingthat the a't'erage monthly consumption within the eame remained unaltered. The Index for total cost of living Is the average based on weight of the different Indices.. .
Mouth
Jan. I Febr. March
tfa~ June July Aug. Sept. Oct. I N ' ov. I Dec. I
: Whole 11 . year 11
36. - WHOLESALE PRICE INDEX. Index for goods In the I'Innilh wholesale trade Total indn: Total Index
Total indfla: a.grIcolture home Industry goo imported goods exported goods
I Products of I Products of I Imported ds for for Month
19291193011931 19291.193011931 19291193011931 19291193011931 1929119301193119291193011931
100 94 100 93 100 92 99 92 98 90 98 90 97 90 97 89 96 88 96 86 95 87 951 86
981 90 I
86 105 89 86 108 88 86 108 88 85 104 85 84 103 82 83 102 82 82 98 86
97 83 95 78 95 75 94 74 92 73
I 74 100 98 74 99 97 75 99 97 73 99 97 71 99 96 70 98 96 71 99 96
98 96 98 95 98 94 98 95 98 94
I 991 961
94971
91 93 97 90 93 98 89 93 98 88 92 96 87 90 95 86 89 95 85
95 84 95 83 94 82 92 83 92 83
I 951 861
82 98 89 82 98 88 82 98 85 81 97 85 80 94 84 79 94 82 78 96 81
95 79 95 77 93 76 91 75 91 74
73 97 96 72 97 95 71 96 94 71 96 93 69 96 92 68 96 92 68 96 91
96 90 97 87 97 83 97 82 96 81
.80 Jan. 79 Febr. 78 March 76 A ril 73 ~y
. 71 June 69 July
Aug. Sept. Ocl;. Nov. Dec.
Tbe wholeaale price Index is worked out at the Central Statistical Offlee. - The first group of IlldIcee is based on tlie Quantity of goods in local wholesale trade In FlnIand, whereas the indices for Imported and exported goods are based on the total Quantities of goods Imported or exported, including the monmeD.t of such goods as are in no way Intended for wholeaale trade In F1i1land. The average prices for 1926 are taken as a basis •. There Is no direct weighing of the data regardlng'pricee, but indirect weighing has been carried. out by eaoh class of goodS being represented by the number of commOdities which corresponds to the calculated importance of the class iu wholesale trade. The averages are arithmetical averages.
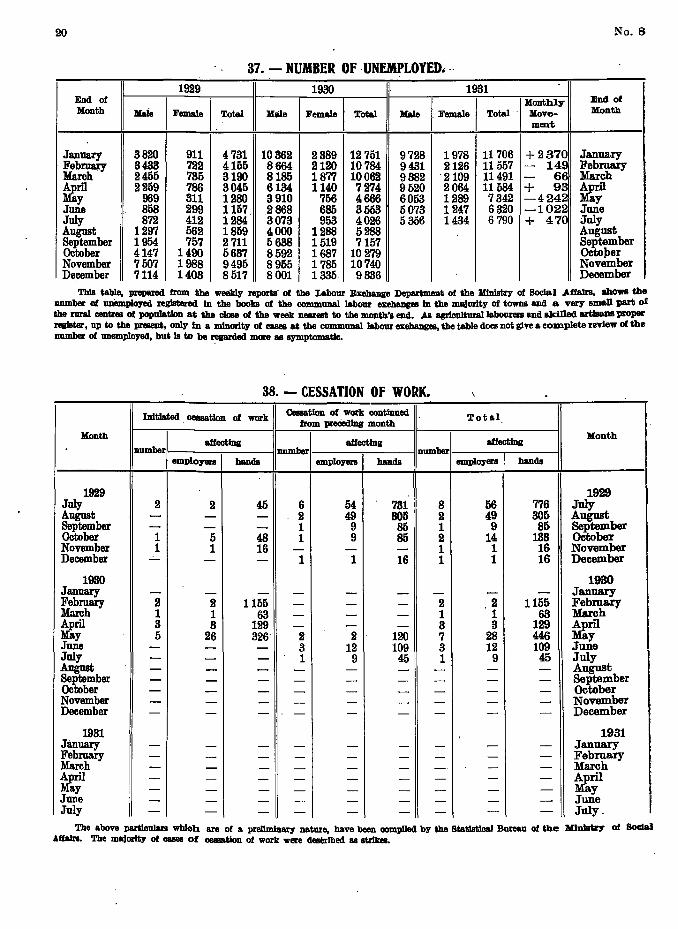
20 No. 8
37. - NUMBER OF UNEMPLOYED. --
1-1~ 1 1930 1931
End of
I Fem~e I I Fem~e I Total fl
:
th1y End of Month IF~I_Total ' M~e Total Male ove- Montb
ment
January 3820 911 4731 10362 2389 12751 9728 1978 11706 +2370 January FebllJ&JY 3433 722 4155 8664 2120 10784 9431 2126 11557 - 149 February March 2466 736 3190 8185 1877 10062 9382 ' 2109 11491 - 66 March Aril 2259 786 3045 6134 1140 7274 9520 2064 11584 + 93 ~ ~y 969 311 1280 3910 766 4666 6053 1289 7342 -4242 June 868 299 1167,. 2868 686 3663 5073 1247 6320 -1022 June July 872 412 1284 3073 953 4026 5356 1434 6790 + 470 July August 1297 562 1859 4000 1288 5288 August September 1954 757 2711 6638 1619 7157 September OCtober 4147 1490 6637 8592 1687 10279 Octo)ler November 7607 1988 9495 8956 1785 10740 November December 7114 1403 8517 8001 1335 9336 December
ThIs table, prepared from the weekly reports- of the Labour Exclumge Departmeat of the Ministry of Social AffallB, tIhowII tbe Dumber of unemployed regjatered In the books of the comm1lDlll labour exclumgell In the majority of towns and a very small part of the rural centres of population at the close of the week nearest to the month's end. As agrIcuJ.turallabourera and sldlled artIsaDB proper reglater, up to the present, only In a minority of cases at the communal labour exclumges, the table does not give a complete review of the number of unemployed, but Is to be regarded more BB symptomatic.
38. - CESSATION OF WORK.
InitIated ,cessation of work Cessation of work continued Total
from preciedIng month Month
I ~Ing I affecting I ~~Ing Montb
Dumber. number number employers I hands employara I bands employers I bands
1929 1929 July 2 2 46 6 64 731 8 66 776 July August - - - 2 49 805 2 49 305 August SePtember - - - 1 9 85 1 9 85 SePtember october 1 5 48 1 9 85 2 14 133 October November 1 1 16 - - - 1 1 16 November December - - - 1 1 16 1 1 16 December
1930 1930 January - - - - - - - - - January February 2 2 1155 - - - 2 2 1155 Febmary March 1 1 63 - - - 1 1 63 March April 3 3 129 - - - 3 3 129 ~~ Ma.y 5 26 326 2 2 120 7 28 446 June - - - 3 12 109 3 12 109 June July - - - 1 9 45 1 9 45 July August - - - - - - -, - - August September - - - - - - - - - September October - - - - - - - - - October November - - - - - - - - - November December - - - - - - - - - December
1931 I 1931 January - - - - - - - - - January February - - - - - - -- - - February March - - - - - - -. - - March ~ril - -- - - - - - - - ~~l ay - - - - - - - - -June - - - -_ ... - - - - - June July - - - - - - - - - July_
Tbe above particulars which are of a preliminary nature, bave been oompUed by the Statlstical Bureau of the MlDlstry of SocIal -Affairs. Tbe majority of 0lIl88 of _tIon of work were desllrlbed 11 strikes.
No. 8 21
CERTAIN PARTICULARS ABOUT FINLAND.
1. FORM OF GOVERNMENT. oWNERSmp OF LAND. The land area Is distributed amOll8 FiDlaDd formed a pan of the klDa:dom 01 Sweden from 1154 dlfferent classes of owners approximately as foUOWB: private 52.1 %,
to 1809; after 1809 it was an autonOlllous Grand Duchy CODJleCted State 39.7%, Joint Stock Compaoiea 6.1 %, commUIlitiell 1.7%. witb BusaIa liP to December 6th, 1917, when' FID1and declared its FOREST RESOURCES. The growlug stock of the forest·1s IDdependence, wh1cb was ackDowledged by all the Powers includJDg 1,620 mI1Iion m 1(57,213 mD110n cublc feet). The mmlhantable tlmber Soviet Rn... It beoamB'a lepubllo in·i919.· The legIIJatlve power . '(meastirmg 20 om a.t breast height - 6 in. at a 'height oilS ft.) of the country fa vested in the Diet aJld the Pnaident. The highest amonntB to 1,557 million trees. Of this number pine Is represented executlve power Is held by the Presldent cbilsen for a period 01 6 by 61 %, spnce by 28 %, the CQDIfers thus constltutlng 89 % or ,ears. The present Pres1den$ P. B. SIIiMII/lIIi4 Is eleoted for the 1,384 mD110n trees, leaftrees, mostly birch, 11 % or 173 mD110n term 1 March, 1931, to 1 March, 1937. trees. The annnall.narement Is ".1 mD110n ml (1,568 mD110n cub.ft.).
The Diet, composed 01 200 members, Is elected by universal The annual feJ1Ings aocordIJIg to earl1er calcoIatlons are 40 mD110n suffrage. The proportions.oI.the dlfferent parties iD·the DJet elected ml (1,413mD11on cub. ft.). In North Finland the incmnent Is much In 1930 are as follows: larger than the fellings, but ID. South Finland excess felling occurs
Per Number cent
UuionIBt party ................................ 42 21.0 AgrarIan party ...... • . . . . . . . . . . • . . . . . . . . . . . . . . • 59 29.1 Progressive party .............................. 11 6.&1 SWlidish party ................................. 20 10.0 Swedish left .......... .. .. .. .. .. .. . .. . .. .. .. .. 1 0.1 Small farmers' party .......................... 1 0.1 SOo1al-Democratic party ........................ 66 88.0
2. LAND. mE AREA Is 888,279 square kilometres - 150,005 square
miles, (Great Britotn's area Is 89,047 sq. m. and Italy's area 117,982 sq. m.). Of the total area 11.1 % are lakes. On an average 10.8 % 01 the land in the south 01 Finland is cultivated, 0.1 % in the North, 6.8 % of the whole land. Of the land area 25.1 mm. ha (62.1 mm. acres) or 78.' % are covered by forests.
THE AVERAGE TEMPERATURE iD the ooIdest month fa In S. W. Finland -5° to ~ C., iD Lappland -15"C. and during the warmest month +15° and +13° to +;l.4°C. reap. The average temperature in BeIsinkI. Is +4.6° (in Oslo +5.,°, in Hontreal +6.,°, In Moscow +3.6°). The ground Is covered by snow iD the South for about 100 days, in Central Finland for 150 to 180 da;vs, in Lappland about 210 days.
3. POPULATION. NUMBER OF lNBA1IITANTS (1929): 8.6 millions (of wh1cb
0.1 mI1Iion emigrants). Sweden (19~9) 6.1, Switserland (1928) ,"0, Denmark (1929) 8.' and Norway (1929) 2.8 millions.
DENSITY OF POPULATION (1929): In South-Finland 18.', in North-Finland 2 •• and in the whole country an average of 10.8 inhabitants to the square kilometre.
LANGUAGE (1920): FiDniBh speaking 88.7 %, Swedish apeakiBg 11.0 %, others 0.1 %.
RELIGION (1928): Lutheran 96.8 %, Greek-Orthodox 1.7 %, others 1 .• %.
DISTRIBUTION (1928): 79.6 % of the population blhabit the country, 20.' % the towns and urbIUI districts. The largest towns are (1928): BelsIn1d (BeIsingfors), the capital, 227,376 inhabitants, Turm (Abo) 63,918, Tampere (TammerforI) 54,015, Vllpurl (Viborg) 54,120.
EDUCATION (1920): AmOD(!llt persons over 15 ,ears of age only 1. ° % are unterate. There are three UIliversltles founded 1040, 1917 and 1920.
INCREASE Ol!' POPULATION (1929): BIrtbs 21.0 I,.., deaths 15.0 "01 (in France in 1928 16.6 ', .. , aDd in England iD 1928 11.7 "..>, ·natural lnorease 6.0 I'H'
4. INDUSTRY. PROPORTIONS OF OCCUPATIONS OF THE POPULATION
(1920): agricu1ture 65.1 %, industry and manual labour 14.8 %, commerce 3.' %, other OOIlupatlons 16.7%.
locaIl:v. AGRICULTURE. Cultivated land 2.1 million heotars, dJvIded
as follows: area nnder cultlvatlon 0._10 heetan 83.7 %, 1D-1iO ha 48.9 %, 5D-100 ha 9.8 %, over 100 ha 8.1 %. Cultivated land Is d1v1ded between the different kinds 01' crops as follows: 46.8 % hay, 20.' % oats,l1.1 % rye, 5.8 % barley, 3.1 % potatoes,18.1 % other. The number 01 dairies iD 1928 amounted to 630.
INDUSTRY (1929): Number 01 iDdustrial concerns 4,109, hands 165,073, gross value of products 01 industry 18,179 million marks.
LENGTH OF RAILWAYS (1980): 5,381 km, 01 wh1cb 5,065 km State raUwayB and 266 km private. The gauge Is 1.11& m'
COMMERCIAL FLEET (1929): Steamships 529 (140,537 leg.
tons net), motor vessels 132 (14,714 r. t.), sailing Bhlps 877 (67,916 r. t.), lighters 3,992 (282,628 r. t.). Total 5,030 (505,795 r. t.).
6, FINANCE AND BANKING. CURRENCY. SiDce 1860 Finland has its own Dlonetary aystem.
From 1877 up to the Great War the currency motntatned its stable gold value and after the disturbances caused by the war FID1and has agotn from January 1at, 1926, a gold standard. The UIlit of currency Is the mark (F1nnlsh tmarkkat) - 100 pennlA. The gold value 01100 markB Is equal to S 2.1181 - £ -. 10 a.4 'I. d.
STATE FINANCES. According to the balance sheet for 11180 the State revenue was 4,398.1 million marks of which 4,276.4 million marks were ordInar1 revenue, and State expenditure 4,788.7 mU· 110n markB, of wh1cb 3,834.0 mWion markB were ordina.ry expend1ture. The principal sources of revenue were as foUOWB: State property and unclertakinga1,458.9, dIreot taxes 604.9,lndlreot taxes 1,615 .• , miscellaneous taxes 212 •• , cbarges 280.1, miscellaneous revenue 154.4. The value of State property in 1922 Is estlmated at 11,150.8 million markB. For Natlonal Debt see table 19 in thislB8ne.
MUNICIPAL FINANCES. AocordIng to the Budget for 1929 expenditure amounted to 1,245.1 mD110n marks. Income from taxation was 428.' mD110n markB, taxed income 6,880.1 mD110n marks. The coDlmunal income tax (not progressive) averaged 6.7 % of the ratepa:vera' iDcome. .
THE BANK OF ISSUE. The Bank of FID1and, (founded In 1811) Is a State Bank. Its head-office Is in BeI&InkI (Belalngfora) with brancbea in Turku (Abo), Pod (BJiirneborg), Vaaaa (Vasa), Oulu (UleAborg), Kuoplo, Joensuu, Sortavala, VlIpurl (Vlborg), Mikke11 (S:t Michei), Tampere (Tammerfors), Blmeenlinna (Tavalltehus). JyvlskylA and Kotka.
THE JOINT STOCK BANKS (1981): Number 16, ~ 565 brancb offioea, where all kinds of banking business Is transaoted. Including all banks, there Is one banking establiBhment per 5,700 blhabitants.
The largest banks are: XansaIlIB-Oaake-Pankld, Ab. N ordIska FiIrenlngBhanken BelsfngfOl'8 Aktiebank and Maakuntaln PankkI Oy., all with head oIfices iD the capital.
OTHER BANKS (1980): Mortgage banks 7, Savings banks 478, Co-operative CredIt Soo1et1es 1,419 aJld a Central Bank for the latter.
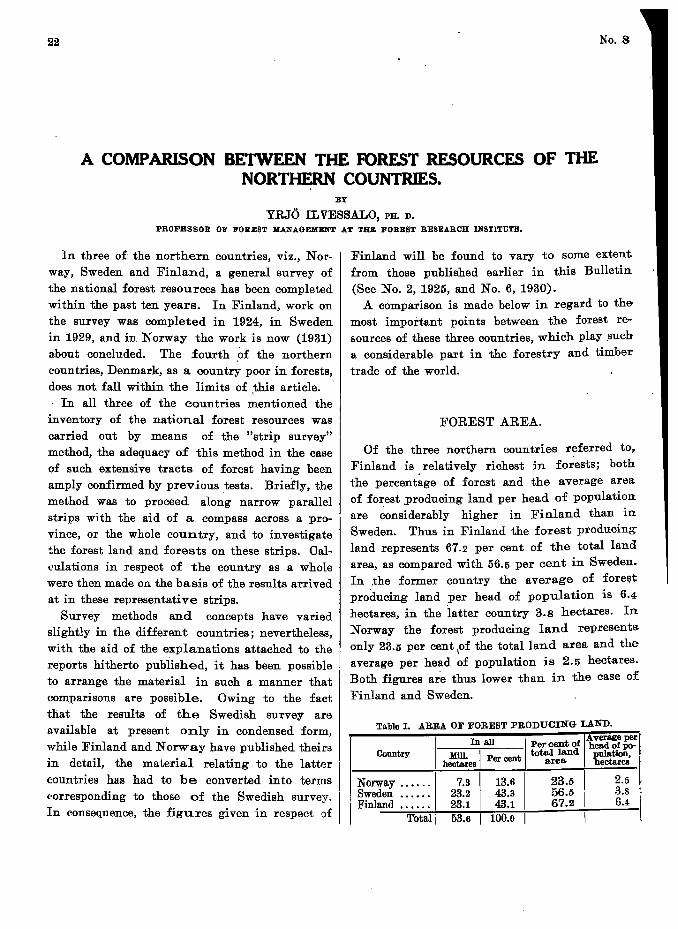
22 No.S
A COMPARISON BETWEEN THE FOREST RESOURCES OF THE NORTHERN COUNTRIES.
:BY
YRJO IL VESSALO, PH. D.
PROFESSOR OF FOREST MANAGEMENT AT THE F'OREST RESEARCH INSTITUTE.
In three of the northern countries, viz., N 01'
way, Sweden and Finland, a general survey of the national forest resources has been completed within the past ten years. In Finland, work on the survey was completed in 1924, in Sweden in 1929, and in Norway the work is now (1931) about concluded. The fourth ,of the northern countries, Denmark, as a country poor in forests, does not. fall within the limits of ,this article . . In all three of the countries mentioned the
inventory of the national forest resources was carried out by means of the "strip survey" method, the adequacy of this method in the case of such extensive tracts of forest having been amply confirmed by previous tests. Briefly, the method was to proceed along narrow parallel strips with the aid of a compass across a province, or the whole country, and to investigate the forest land and forests on these strips. cal~'ulations in respect of the country as a ,whole were then made on the basis of the results arrived at in these representative strips.
Survey methods and concepts have varied slight!y in the different countries; nevertheless, with the aid of the explanations attached to the reports hitherto published, it has been possible to arrange the material in such a manner that comparisons are possible. Owing to the fact that the results of the Swedish survey are available at present only in condensed form, while Finland and Norway have published theirs in detail, the material relating to the lattel'
countries has had to be converted into terms ('orresponding to those of the Swedish survey. In eonsequence, the figures given in respect of
Finland will be found to vary to some extent from those published earlier in this Bulletin (See No. 2, 1925, and No. 6, 1930).
A comparison is made below in regard to the most important points between the forest reE.ources of these three countries, which play ,such a considerable part in the forestry and timber
trade of the world.
FOREST AREA.
Of the three northern countries referred to, Finland is. relatively richest in forests; both. the percentage of forest and the average area. of forest ,producing land per head of population are ~onsiderably higher in Finland than in Sweden. Thus in Finland the forest producing land represents 67.2 per cent of the total land area, as compared with 56.5 per cent in Sweden. In ,the former country the average of foreet producing land per head of population is 6.4 hectares, in the latter country 3.8 hectares. In Norway the forest producing land represents only 23.5 per cent \of the total land area and the average per head of population is 2.5 hectares. Both figures a~e thus lower than in the case of
}t'inland and Sweden.
Table I. AREA OF FOREST PRODUCING LAND.
Oountry
7.3 23.2 23.1 53.6
13.6 43.3 43.1
100.0
23.5 56.5 67.2
2.5 3.8 6.4
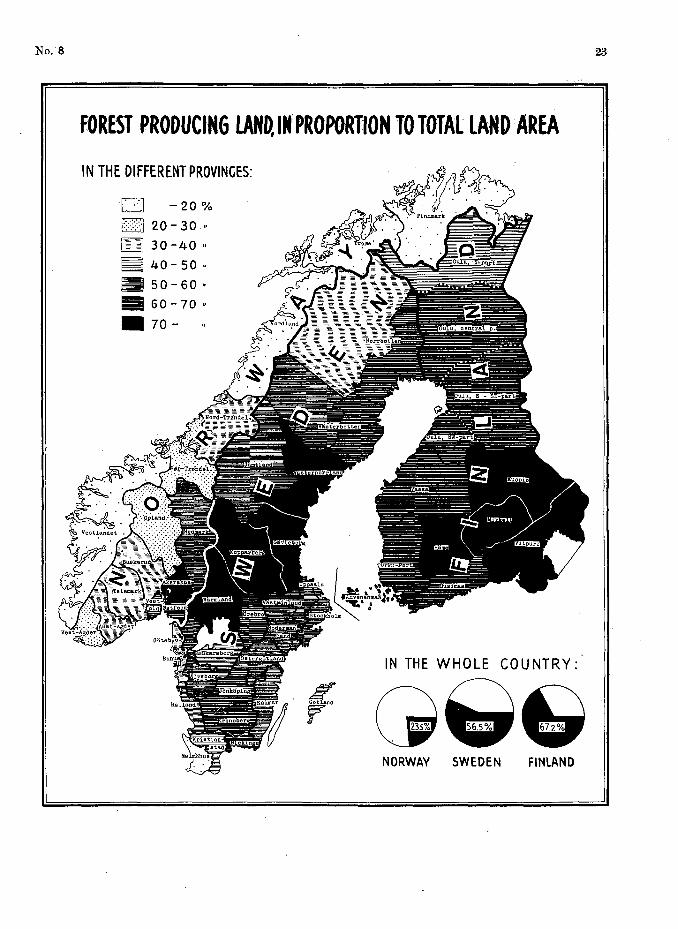
No. 8
FOREST PRODUCING LAND, IN PROPORTION TO TOTAL lAND AREA
IN THE DIFFERENT PROVINCES:
D -20%
1:'::"::";::::1 20 - 30 ..
1111 30 -40 ..
~ 40-50"
.50-60"
EiiI GO - 70 ..
• 70- "
IN THE WHOLE COUNTRY:
"I G~G rnd "235% 56.5% 67.2%
NORWAY SWEDEN FINLAND
23
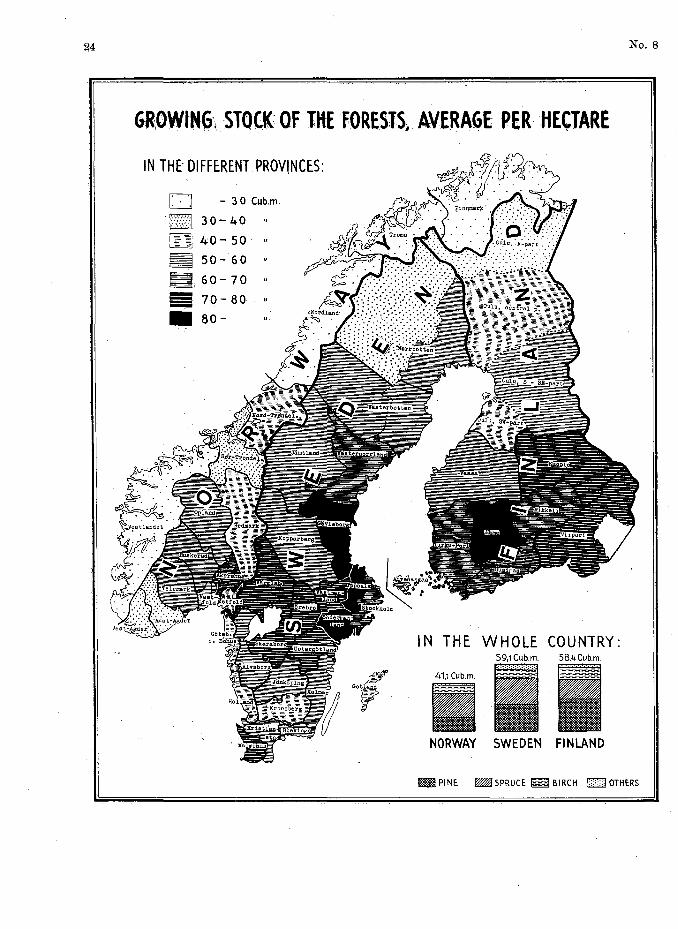
24 No. 8
GR,OWtN6\ STQCK: OF litE FORESfS,AVERAGEPER·HECTARE
IN THE' DIFFERENT PROV!NCE5:
D - 30 Cub.m.
1" .......... ·1 30 40 :.:.:.:,:~:.. -I~~I 40- 50 "
~ 50- 60
iiI, 60 - 70
a 70- 80 "
• 80-
IN THE WHOLE COUNTRY:
41,1 Cub.m.
NORWAY SWEDEN FINLAND
_ PINE ~ SPRUCE ~ BIRCH EJ OTHERS
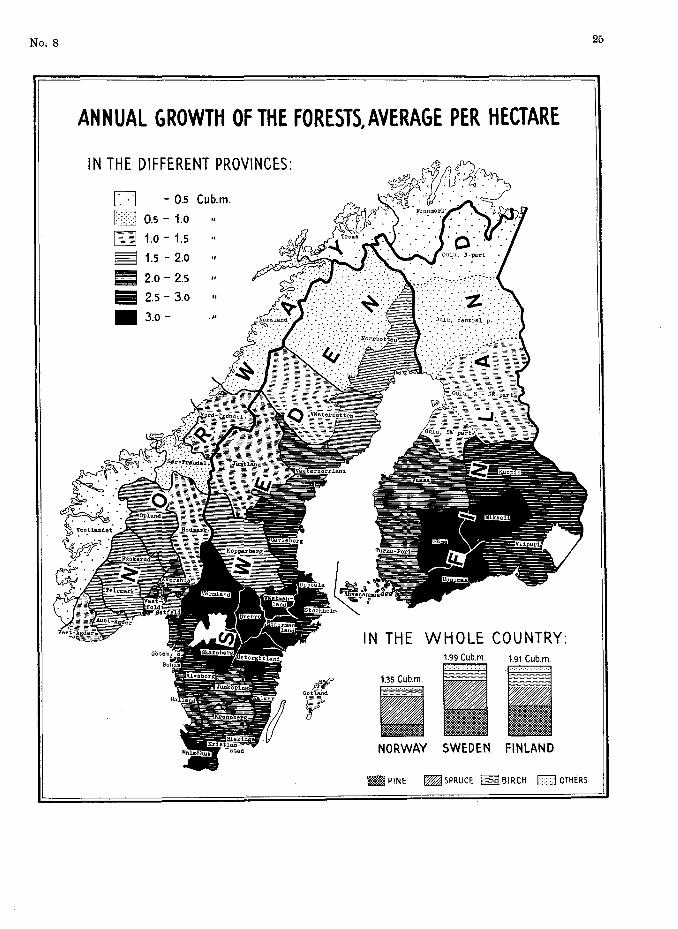
No. 8
ANNUAL GROWTH OF THE FORESTS, AVERAGE PER HECTARE
IN THE DIFFERENT PROVINCES:
D - 0.5 Cub.m.
1::;:-·:1 0.5 - 1.0
[11 1.0 - 1.5 == 1.5 - 2.0
.. 2.0 - 2.5
EiI 2.5 - 3.0
.3.0- "
IN THE WHOLE COUNTRY: 1.99 Cub.m. 1.91 CUb.m.
1.35 Cub.m.
NORWAY SWEDEN FINLAND
I!!!!II!l PINE ~ SPRUCE ~ BIRCH D OTHERS
25
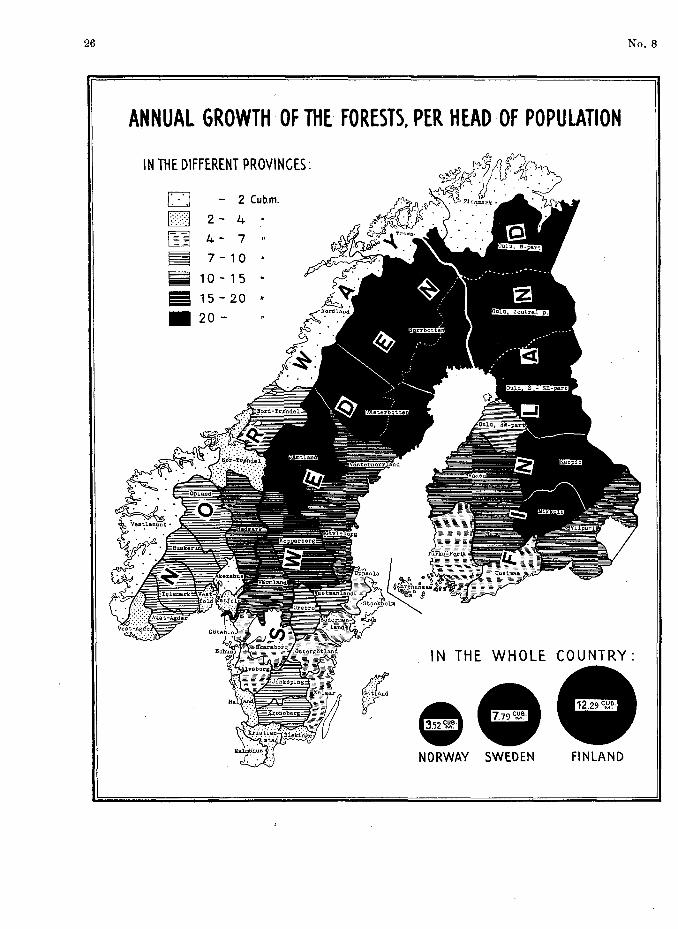
26 No. 8
ANNUAL GROWTH OF THE FORESTS. PER HEAD OF POPULATION
IN THE DIFFERENT PROVINCES:
D - 2 Cub.m.
U 2- 4
I~ll 4. - 7 ..
Iii 7-10 •
!1110-15 •
E 15 - 20 n
.20-
IN THE WHOLE COUNTRY:
NORWAY SWEDEN FINLAND
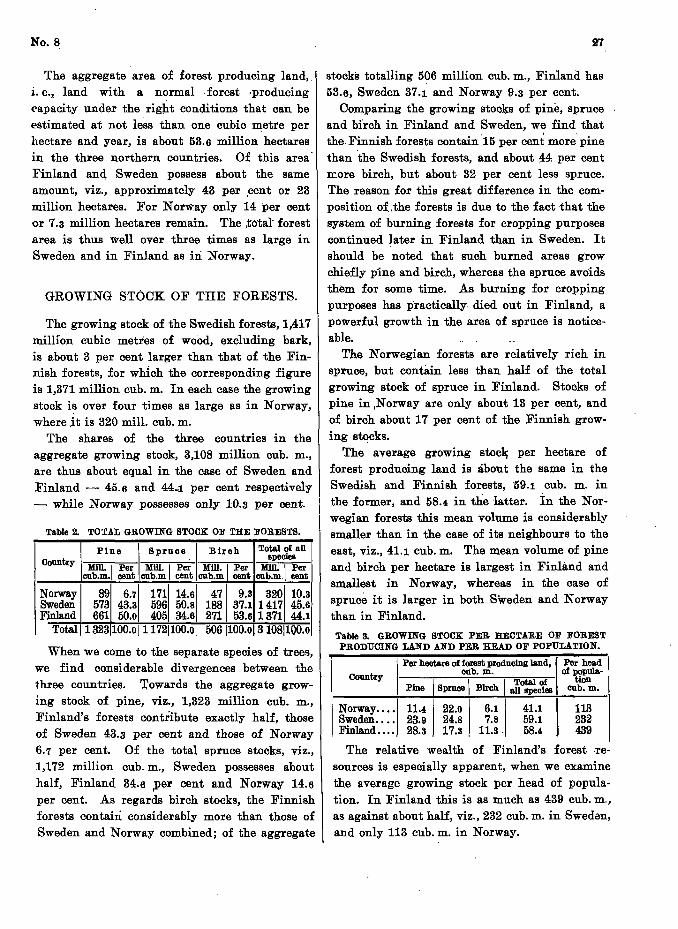
No.S
The aggregate area of forest producing land" i. e., land with a normal ,forest ·producing ('apacity under the right conditions that can be estimated at not less than one cubic metre per hectare and year, is about 53.6 million hectares in the three northern countries. Of this area· Finland and, Sweden possess about the same amount, viz., approximately 43 per ,cent or 23 million hectares. For Norway only 14 per cent or 7.3 million hectares remain. The ,total forest area is thus well over three times as large in Sweden and in Finland as in Norway.
GROWING STOOK OF THE FORESTS.
The growing stock of the Swedish forests, 1,417 milHon cubic metres of wo'od, excluding bark, is about 3 per cent larger than that of the Finnish forests, for whlch the corresponding figure is 1,371 million cub. m. In each case the growing stock is over four times as large as in Norway, where,it is 320 mill. cub. m.
The shares of the three countries in the aggregate growing stock, 3,108 million cub. m., are thus about equal in the case of Sweden and Finland - 45.6 and 44~1 per cent respectiveiy - while Norway possesses only 10.3 per cent.
Table 2. TOTAL GROWING STOCK OF THE FORESTS.
Pine I Sprnoe I Birch Total of all
species Country Mill. Per Mill. Per Mill. Per Mill. I Per
cub.m.1 cent cub.m I cent oub.m I cent cub.m, cent
Norway 1 891 6.71 171114.61 471 9.31 820110.3 Sweden 573 43.3 596 50.8 188 37.1 1417 45.6 Finland 661 50.0 405 ,34.6 271 53.6 1 371 44.1
Total 1 18231100.01 11721100.01 5061100.0131081100.0
When we come to the separate species of trees, we find considerable divergences between the three countries. 'l'owards the aggregate growing stock of pine, viz., 1,323 million cub. m., Finland's forests contribute exactly half, those of Sweden 43.3 per cent and those of Norway 6.7 per cent. Of the total spruce stocks, viz., 1,172 million cub. m., Sweden possesses about half, Finland 34.6 ,per cent and Norway 14.6 per cent. As regards birch stocks, the Finnish forests contain considerably more than those of Sweden and Norway combined; of the aggregate
27
stocks totalling 506 million cub. m., Finland., has 53.6, Sweden 37.1 and Norway 9.3 per cent.
Oomparing the growing stoc~s of pine, spruce and birch in Finland and Sweden, we find that the Finnish forests contain '15 per cent more' pine than the Swedish forests, and about :44 per cent n:ore birch, but about 32 per cent less spruce. The reason for this great difference in the composition of.the forests is due to the fact that the system of burning forests for cropping purposes continued later in Finland than in Sweden. It should be noted that such burned areas grow chiefly pine and birch, whereas the spruce avoids them for some time. As burning for cropping purposes has p'ractically died out in Finland, a powerful growth in the area of spruce is noticeable.
The Norwegian forests are relatively rich in spruce, but contain less than half of the total growing stock of spruce in Finland. Stocks of pine in ,Norway are only about 13 per cent, and of birch about 17 per cent of the Finnish growing stocks.
The average growing stoc~ per hectare of forest producing land is about the same in the Swedish and Finnish forests,59.1 cub. m. iu the former, and 58.4 in the latter. in the Norwegian forests this mean volume is considerably smaller than in the case of its neighbours to the east, viz., 41.1 cub. m. The mean volume of pine and birch per hectare is largest in Finland and smallest in Norway, whereas in the case of spruce it is larger in both Sweden and Norway than in Finland.
Table S. GROWING STOCK PER HECTARE OF FOREST PRODUCING LAND AND PER HEAD OF POPULATION.
\
Per hectare of forest producing land'l Per head I cub. m. of popula-
Country I I I Total of tion Pine Spmce Birch all species CUb. m.
Norway ..•• )11.41 22.0 I 6.1 I 41.1 I 113 Sweden. . . . 23.9 24.8 7.8 59.1 232 Finland ...• 28.3 17.3,11.3, 58,4 439
The relative wealth of Finland's forest ,resources is especially apparent, when we examine the average growing stock per head of population. In Finland this is as much as 439 cub. m" as against about half, viz., 232 cub. m. in Sweden, and only 113 cub. m. in Norway.
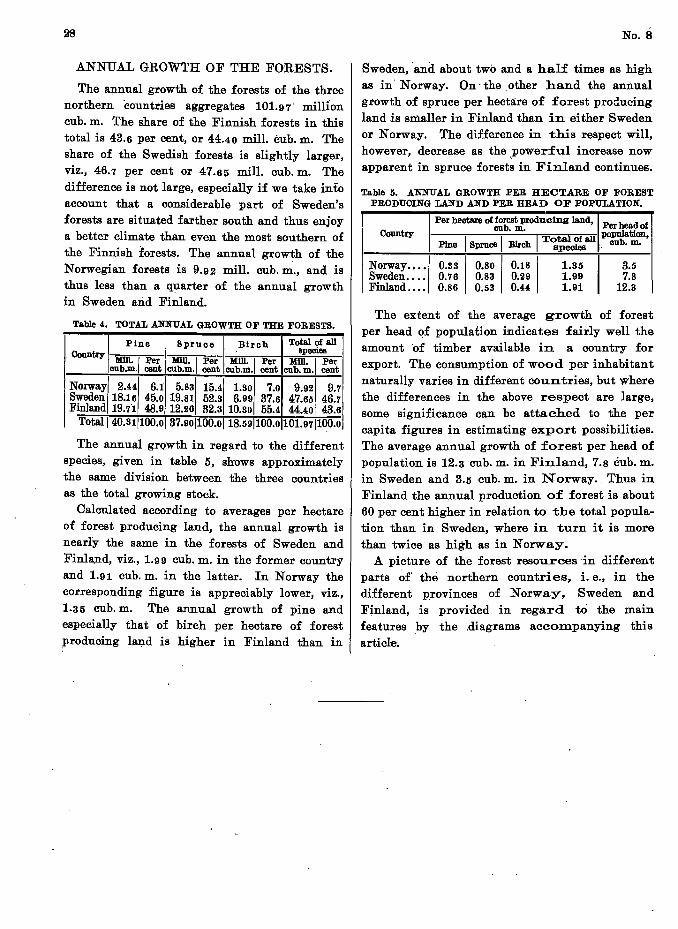
28
ANNUAL GROWTH OF THE FORESTS.
The annual growth of the forests of the three northern countries aggregates 101.97 millIon cub. m. The share of the Finnish forests in this total is 43.6 per cent, or 44.40 mill. cub. m. The share of the Swedish forests is slightly larger, viz., 46.7 per cent or 47.65 mill. cub. m. The difference is not large, especially if we take into account that a considerable part of Sweden's forests are situated farther south and thus enjoy a better climate than even the most southern of the Finnish forests. The annual growth of the Norwegian forests is 9.92 mill. cub. m., and is thus less than a quarter of the annual growth in Sweden arid Finland.
Table 4. TOTAL ANNUAL GROWTH OF THE FORESTS.
1 Pine Spruoe 1 Birch 1 Total C?f all Country MIll. I Per
. speCIes MIll. Per' Mm. Per Mm.---per
cub.m. cent cub.m.1 cent cub.m.1 cent cub. m.1 cent
NorwayI2.441 6.11 5.83115.411.301 7.01 9.921 9.7 Sweden 18.16 45.0 19.81 52.3 6.99 37.6 47.65 46.7 Finland 19.71 48.9 12.26 32.3 10.30 55.4 44.40 43.6
Total 1 40.311100.01 37.901100.01 18.591100.01101.971100.0
The annual grQwth in regard to the different species, given in table 5, shuws approximately the same division between the three countries as the total growing stock.
Oalculated according to averages per hectare of forest producing land, the annual growth is nearly the same in the forests of Sweden and Finla.nd, viz., 1.99 cub. m. in the former country and 1.91 cub. m. in the latter. In Norway the corresponding figure is appreciably lower, viz., 1.35 cub. m. The annual growth of pine and especially that of birch per hectare of forest producing land is higher in Finland than in
No. 8
Swedeil., and about two and a half times as high as in· Norway. On· the .other hand the annual growth of spruce per hectare of £orest producing land is smaller in Finland than in either Sweden or Norway. The difference in this respect will,
. however, decrease as the .power£ul increase now apparent in spruce forests in Finland continues.
Table 5. ANNUAL GROWTH PER HECTARE OF FOREST PRODUCING LAND AND PER HEAD OF POPULATION.
Country cub. m. populatlcn
1
Per hectare of forest producing land, Per head of
Pine I Spruce I Birch I T~t;':c~sall cub. m. '
Norway····1 0.33/ 0.80 / 0.18 11 1.35 1 3.5 Sweden.... 0.76 0.83 0.29 1.99 7.8 Finland.. . . 0.86 0.53 0.44 1.9i 12.3
The extent of the average growth of forest per head Qf population indicates fairly well the amount ·of timber available in a country for export. The consumption of wood per inhabitant naturally varies in different countries, but where the differences in the above respect are large, some significance can be attached to the per capita figures in estimating export possibilities. The average annual growth of forest per head of population is 12.3 cub. m. in Finland, 7.s cub. m. in Sweden and 3.5 cub. m. in Norway .. Thus in Finland the annual production o£ forest is about 60 per cent higher in relation to the total population than in Sweden, where in turn it is more than twice as high as in Norway.
A picture of the forest resources -in different parts ~f the northern countries, i. e., in the different provinces of Norway, Sweden and Finland, is provided in regard to the main features by the .diagrams accom.panying this article.
No. 8 '29
FINLAND'S BALANCE OF. PAYMENTS' FOR 1.930. BY
A. E. TUDEER, PH. D.
STA.TISTICIAN TO THE BANK OF FINLAND.
METHODS OF OALOULATION.
The OentralStatistical O£fice has now completed its calculation of Finland's balance of payments for 1930. It is calculated according to the same principles as similar calculations for previous years, described in earlier issues of this Bulletin (see No. 8, 1930).
In accordance with these principles the balance includes only the actual income and expenditure, but no items" that refer to the movement of capital. The balance consequently does not include either loans taken up abroad nor redemption of old indebtednes,s. Also, a record of the actual payments made ,between Finland and other countries ,during this period has not been attempted, but an attempt has been made to elucidate, how Finland's balance of payments would have turned out, in case all payments had been made in cash.' Thus, for instance, those values have been taken for income and expenditure, as ,such, as exports and imports amounted to according to the trade statistics for 1930, although payment did, not, of course, occur at the time. These principles have been adopted partly because by such means more reliable data ' were 'obtainable, and 'partly because chance had' in this way considerably less opportunity'cof exerting any influence. , As was pointed out in previous reviews, it is unnecessary to go into the question as to 'how the calculation of the separate items in the bal~nae 'of payments has heencarried' out in detail. It is only necessary to point out that both Income 'and expenditure are ,calculated, in some cases on the basis of detaJled statistics, in others more summarily. The figures can, there-
fore not claim to be quite 'exact, but the result may, nevertheless, be regarded on the whole as giving a correct idea of Finland's balance of payments.
INOOME AND EXPENDITURE FOR 1930.
,:' According to the calculations of the Oentral Statistical Office t;he balan;ce of payments la.st year contained the following, income.
,INCOME. 'Mill: mks.
Expol"ts •••....•..•.•......•... 5,405 etowlLglEl .eharges !DOt included •. , 55
He.:rbauir charges .............. .. ~'P-ping freights ............ .. Emi.grwnts' and ,seamen's remit-
rtan.ees ...................... . F,OO'e~gn ,~8IVel ......... ' ••••••••• ForeJ:gI1 lllSUll'ance ••••••••••••••
Post Office;, Te1egrapih Office and State Railways' revenue :from abroad ..................... .
Foreign l"eGlresentatives ....•..... Interest :from abroad ......... .
Mill. mks.
5,460 60
240
160 190 140
35 2.0 40
Altogether the income is calculated as about 6,350 million marks compared with 7,440 millions in 1929. The reduction is principally due to the decrease in, the value of exports, this being a result of falling prices and also of smaller quantities exported. ' The reduction of exports is more th~n balanced, however, by a similar and gl'eater falling off in the value of imports, so that" 'the net differ,ence' in foreign trade was very advantageous, as is shown in:' a subsequent table.
In: other: respects the income, in the balance of payments experienced no great change; seve~al items remain cas they were:, The inconie from' :harbour dues,: shipping ,freights and in-
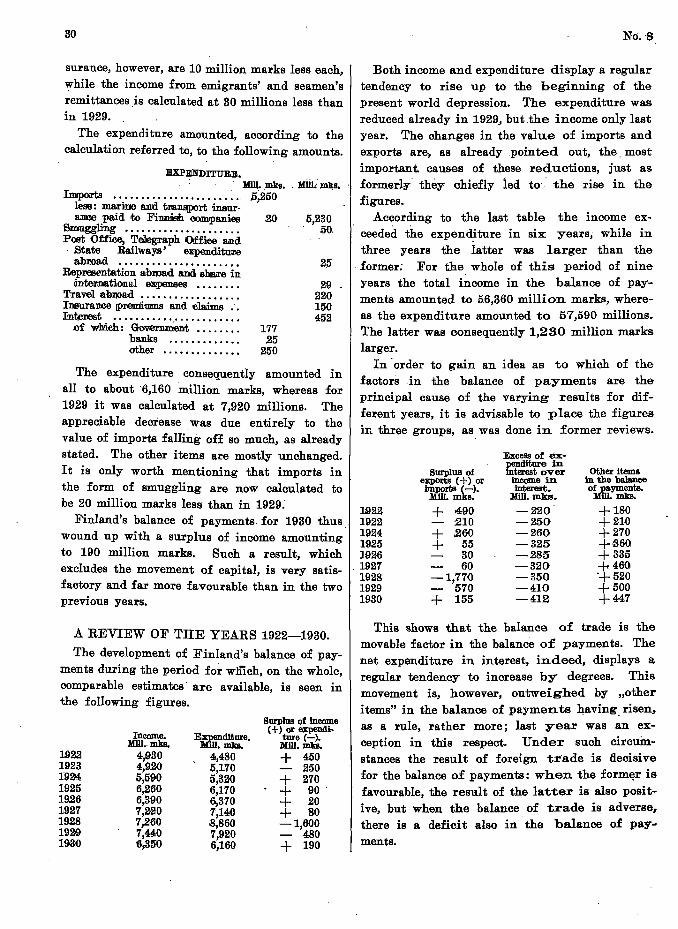
80
surance, however, are 10 million marks less each, lVhile the income from emigrants' and seamen's remittances is calculated at 30 millions less than in 1929.
The expenditure amounted, according to the calculation referred to, to the following amounts.
BXPENDITURE. . Mlll ... mks. . Mill; mll;s.
IID!pOo!t.s •........•.•.•......•.. , .5,250 less: mruri'llle aDJd. tl'lll.I!lIpOrt insur-8.JliCe :paid ro FimlJisb. OODl'Panies 20 5,230
SmJUggling •••••.••.•••.•.•.••.. 50, Post Offfue, Telegraph !Qffioo and
State Railways' e~ndit1m'l6 abl'lOll.<l •••••••••••••••••••••• 25
BepM!eIttation a.bl108ld 8.IId shB.:re in JinoterJlatiOilJ.al ex.penses ........ 29
Trarel 8JbrI08.d .................. 220 lneu:raooe (Pl'Em!!i:ums and el.aims ... 150 IllIIt,erIest •••••••••• '.' • • • • • • • • • • • 452
(If whiclh.: Government ........ 177 bR1lJks ••••••••••••• 25 other .. .............. 250
The expenditure consequently amounted in all to about 6,160 million marks, whereas for 1929 it was calculated at 7,920 millions. The appreciable decieasewas due entirely to the value of imports falling off so much, as already stated. The other items are mostly unchanged. It is only worth mentioning that imports in the form of smuggling are now calculated to be 20 million marks less than in 1929;
Finland's balance of payments. for 1930 thus. wound up with a surplus of income amounting to 190 million marks. Such a result, which excludes the movement of capital, is very satisfactory and far more favourable than in the two previous years.
A REVIEW OF THE YEARS 1922-1930.
The development of Finland's balance of payments during the period for which, on the whole, comparable estimates' are available, is seen in the following figures.
1922 1923 1994 1925 1926 1927 1928 1929 1900
Income. MIll •. mks.
4,930 4,920 5,590 6,260 6,390 7,aaO 7,260 7,440 6,350
Expenditure. Mill. mks.
4,480 5,170 5,320 6,170 6,370 7,14() 8,860 7,920 6,160
Surplus of Income ( +) or expendi
ture (-). MIll. mks. + 450
250 + 270 + 90' + 20 + 80 -1,600
480 + 190
No.·S
Both income and expenditure display a regular tendency to rise up to the beginning of the present world depression. The expenditure was reduced already in 1929, but .the income only last year. The changes in the value of imports and exports are, as already .pointed out, the. most important. causes of these reductions, just as formedy' they chiefly ied to· the rise in the figures.
According to the last table the income ex'. ceeded the expenditure in six years; while in
three years the iatter was larger than the . former: For the whole of this period of nine years the total i~come in the balance of payments amounted to 56,360 million marks, whereas the expenditure amounted to 57,590 millions. The latter was consequently 1,230 million marks larger.
In . order to gain an idea as to which of the factors in the balance of payments are the principal cause of the varying results for different years, it is advisable to place the figures in three groups, as was done in former reviews.
Excess of ex-penditure in
Other Items S:EIUS of mterest over exp s (+) or Income in In the balance imports ~-). Interest. of:r.&tyments. Mill. s. Mill. mks. • mks.
192.2 + 490 -2'20 +180 1922 :210 -250 +210 1924 + .260 -260 +270 19.25 + 55 -325 +;360 1926 30 -285 +335
.1927 60 -320 +460 1928 -1,77'0 -350 +520 1929 570 -410 +500 1930 + 155 -412 +447
This shows that the balance of trade is the movable factor in the balance o£ payments. The net expenditure in interest, indeed, displays a regular tendency to increase by degrees. This movement is, however, outweighed by "other items" in the balance of payments having. risen, as a rule, rather more; last year was an exception in this respect. Under such circui:nstances the result of foreign trade is aecisi ve for the balance of payments: when the form~r is favourable, the result of the latter is also positive, but when the balance of trade is adverse, there is a deficit also in' the balance of payments.
No.S
MOVEMENT OF CAPITAL.
The actual financial condition of a country towards other countries must at all times be in a state of balance. If the supply of commodities and services does not suffice to cover the value of commodities and services received, the foreign indebtedness of the country grows. If the reverse il! the case, the indebtedness is reduced or the foreign balances rise. Suc;h an adjustment need not take the form of a· visible movement of capital, i. e; in the taking up of fresh loans or the redemption of loans. The change in the net financial position can occur equally well in the form of increased or reduced book debts or balances. As an example, the prolongation or curtailment of the term of payment for imported or exported goods represents such a change.
If it were possible to obtain complete statistics of the movement of capital between. Finland .and foreign c~untries, it would be possible to check the abov.e figures regarding the balance of payments with their. help. Unfortunately, the available data in this respect are not exhaustive. Only the. following important points can be stated here. As was mentioned in a 'previous issue (see No. 1, 1931), three foreign bond loans were taken up in 1930. The Central Bank of the Agricult:ural Co-operative Credit Banks Ltd. obtained a loan of 300 million francs from :France at a nominal rate of 5 0/0. The Helsingfors Municipality negotiated a loan of 8 million dollars at 6% 0/0 and the Industrial Mortgage Bank of Finlimd a loan of 2 million pounds sterling at 6 o/o.interest. Together these loans represent a capital value of approximately 1,170 million marks. A small part of the stock belonging to these loans was, however, sold in Finland. Besides, about 400 million marks of the proceeds were employed directly for converting short-:term foreign indebtedness, in ad'dition to which considerable . sums we're also utilised in other ways for redeeming foreign indebtedness. The fresh capital introduced into
!U.
the country was, therefore, considerably less than the nominal amount of the loans. This is evident, for instance, from the fact that foreign credits against bank guarantee were reduced last year by close on 300 million. marks. The banks did not secure fresh capital abroad, but took advantage of the position: created by the new
-loans and the favourable balance of payments in order to improve their position abroad. - Thus, the net f~reign indebtedness of the' j ~int Stock banks was reduced in the course·. of, ,last year by 114 million marks, while the foreign balances of the Bank of Finland increased by. 251.7 mil~ lions.
. Important parts o.f the changes in Finland's indebtedness to foreign countries and its foreign balances can, of course, not be dealt with statistically. In view of the result of the balance of payments, however, it can be concluded that Finland's national economy reduced its foreign indebtedness last year,if not by ·190 million marks exactly, at any rate by something like that figUre.
CONCLUSION.
Two significant points deserve attention in the' above review. In the first place, thanks to a favourable balance of trade Finland was able to reduce its foreign indebtedness. In the second; Finland's national economy converted a by no means insignificant part of its floating foreign indebtedness and funded it in long-term bond loans. In both respects the past year represents a considerable improvement in the payment position towards other countries. We have consequently a repetition of a circumstance that had occurred for decades before the Great War: in good years, i. e., while business conditions are improving, Finland increases its indebte~ess to foreign countries in order to obtain the possihi~ity of making larger desirable investments of capital; in times of depression, on the other hand, when investments are slight, part of the indebtedness is repaid.
82 No. 8
ITEMS. Bank' failure. At the end of July' the.
!ffxport Ban7c of Finland, Ltd. (Suomen VientiPan7cki, Os.a7ce'!lhtio - Finlands Export-Ban7c, Aktiebolag). filed their petition of bankruptcy.
. Thebililkin question, which is one of the ~mallest ill. the ~oun~ry, was founded in 1920. Its share capital is 12 million, reserve funds 4 million and the profit reserve' 0.7 million marks and it~ balance sheet at the end of Junetot~ned 61.1 million marks.
Org;:misation of credits for agriculture .. A government committee, appointed to consider the question of credit for agriculture, p~oposed, among other matters, that Oy. Maan7ciinteistopan7c7ci - Landsfastighetsban7cen Ab. should be re-organised and its activities enlarged in order to organise credits for agriculture and the consolidation of the short-time loans. In consequence of thi.s, the share holders in this banking company, at an extraordinary share-holders' meeting, decided to increase the share capital £rom 4 to 20 million marks. It was further decided that the bank,. with a government guarantee, should take up a loan in bonds for about 200 million marks. At the' ~ame time a ·:modification of the bank'~' statutes was approved, to the effect that credit can be gr~nted up to 70 per cent of the value of' t1i.~ land and, b~ldings of any estate or farm 'and 'up'to 30 per cent of the. value of the for~sts. arid implements. As the reorganJ,satiQn of the bank and its activities ~uring the coming years will demand considerable ou.tlays, it is. b.opedthat the state wili s~pport, th~ bank and take over a part of.the increased.capitaL . .
... Coloniz~tion activities in 1930. Through. the
colonization funds 8,600 loans of a total of 73 million marks were granted in 1930. Of these
loans 696 (13.4 milli<}lls marks) were granted , for the purchase of farm . land, 524 loans (2.6
millions) for the purchase of building sites, . 1,087 loans (9.5. millions) for the purchase of
additional· land, 5;404 (42.3 millions) for build- . ing ini1-pose8' ana. 889' for other purposes. For starting .:farm8'~ 15,693 hectares were bought, for building sites 1,071 hectares and for additional land 8,706 hectares.
75 years' jubilee. In July one of Finland's bigger industrial 'undertakings, Tammerfors Linne- och J ern~ManrJ,falctur Aktie-B()lag, celebrated its 75 years'jubilee. According to the balance sheet 'for 1930 the company's share capital is 100 millions and its other own funds about 51 million marks, while the plant and timber' estates are booked at a value of 122 million marks and the movable assets at 99 millions. In regard to the company's activities it may be mentioned that the linen factory's production inclt~des yarn and textiles made from flax, hemp and jute to an annual invoice am.ount· of 60-70 million marks. The iron worksembraCEid earlier a blast furnace, but in the year 1884 this branch was definitely closed down. In its place a manysided machinery industry has been developed, among the products "of which m.ay chiefly, be
. mentioned a number of" steamships, steam machines and' boilers and,.' later, oomplete machinery equipmentsfor industrial needs, watert1:lrbines and locomotives. Moreover the company's activities in-cludepulp :i:ri.ills in Tampere (Tamnierfors) and·I:iikeroiil:en. 'Further, the company owns· since ·1928 the' m.ajority' of the share capital in Etelii-Suomen Voima Oy. ~ Sydfinska Kraft Ab. and a moiety in the power .station Oy. Abborfors Ab.
•
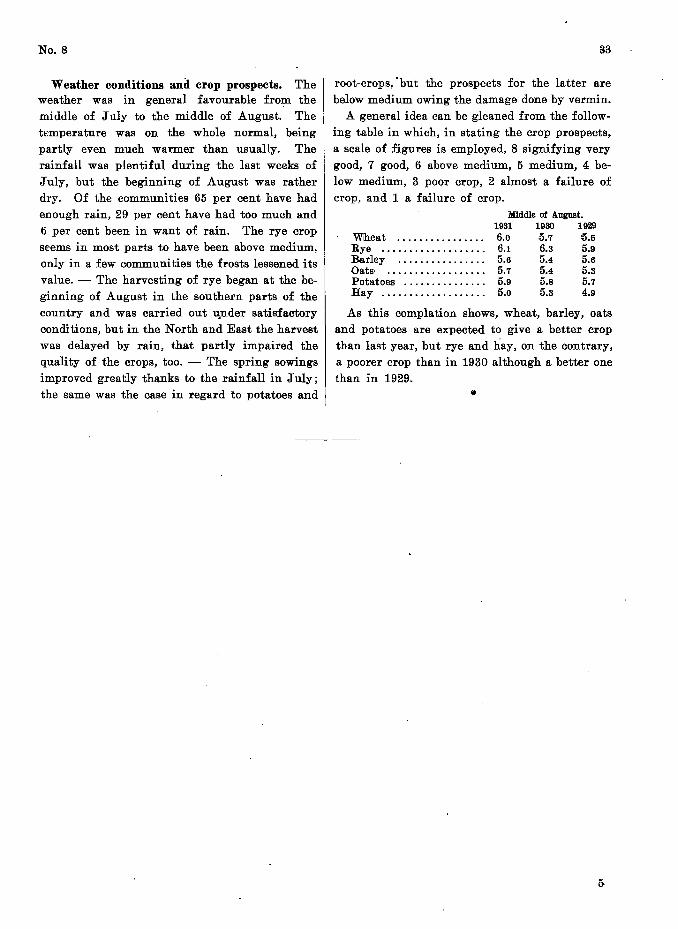
No. 8
Weather conditions and crop prospects. The weather was in general favourable from the middle of July to the middle of August. The tt'mperature was on the whole normal, being partly even much warmer than usually. The rainfall was plentiful during the last weeks of July, but the beginning of August was rather dry. Of the communities 65 per cent have had enough rain, 29 per cent have had too much and 6 per cent been in want of rain. The rye crop seems in most parts to have been above medium, only in a few communities the frosts lessened its value. - The harvesting of rye began at the beginning of August in the southern parts of the country and was carried out u.nder satisfactory conditions, but in the North and East the harvest was delayed by rain, that partly impaired the quality of the crops, too. - The spring sowings improved greatly thanks to the rainfall in July; the same was the case in regard to potatoes and
33
root-crops, . but the prospects for the latter are below medium owing the damage done by vermin.
A general idea can be gleaned from the following table in which, in stating the crop prospects, a scale of figures is employed, 8 signifying very good, 7 good, 6 above medium, 5 medium, 4 below medium, 3 poor crop, 2 almost a failure of crop, and 1 a failure of crop.
Middle of August. 1931 1930 1929
Wheat ............... . 6.05.7 :5.5 Rye .................. . 6.1 6.3 5.9 Barley ............... . 5.6 5.4 5.6 Oats· ................. . 5.7 5.4 5.3 Potatoes .............. . 5.9 5.8 5.7 Hay .................. . 5.0 5.3 4.9
As this complation shows, wheat, barley, oats and potatoes are expected to give a better crop than last year, but rye and hay, on the contrary, a poorer crop than in 1930 although a better one than in 1929.
THE BANK OF FINLAND MONTHLY
BULLETIN is sent free of charge to anyone wishing to
receive it. Finnish booksellers are, however, allowed to sell it at a price of 2 marks per oopy. Back numbers ar~ also willingly supplied. Should extracts from -the Bulletin 'be printed, the source should be stated. Oorrespondence with regard to the Bulletin should be addressed to the Bank of Finland, Statistical Department, Helsinki (Helsingfors), Finland.
HELSINKI - HELSINGFORS 1981. GOVERNMENT PB.lNTIl!I'G OFFICE.
Related Documents