Monte Carlo Simulation Techniques for Optimisation of Phase Shifter Settings J.Verboomen * , D. Van Hertem † , P.H.Schavemaker * , F.J.C.M.Spaan ‡ , J-M.Delinc´ e § , R.Belmans †§ , W.L.Kling *‡ Summary The Netherlands has installed two phase shifting transformers in order to more evenly distribute the load on the interconnectors with Germany. Belgium is planning to install four devices to tackle the problem of transit flows between France and Germany and to control the flow on the parallel paths between Belgium and France. One phase shifter on the border of the Netherlands and Germany was already installed for a long time. The coordination of all the phase shifters is very important in order to take full advantage of these devices, but also to guarantee a safe situation and not to mutually counteract control actions. In this paper, a new Monte Carlo based approach is proposed to find the optimal settings of different phase shifters. The goal is to maximise the import capacity for both the Netherlands and Belgium. KEYWORDS: Phase Shifting Transformer, Monte Carlo Simulation, Power Flow Control, Transit Flow, Total Transfer Capacity. 1 Introduction Due to uneven loading of interconnectors in meshed networks, the total cross-border capacity, available for import and export of electrical energy, is not equal to the capacity one might expect when summing up all the capacities of the different lines. This problem led to the installation of two phase shifting transformers (PSTs) at the Meeden substation in the north of the Netherlands (Fig. 1) [1, 2]. The southern part of the country is closer to the center of the meshed European grid than the northern, which may lead to congestion problems on the southern interconnectors with Germany. The PST can divert power to the northern interconnector, loading the lines more evenly. This is a well-known feature of this kind of devices. The liberalisation of the electricity market and the increasing use of wind energy in the European power system are two factors that have substantially increased the power flows between countries. Up to one decade ago, international flows were only due to long term contracts and to flows caused by mutual help between control areas at times of lacking generation capacity. Without any means of control, the grid of a country can become overloaded if it is involved in a power transfer as a third party. This is exactly what is happening to the Netherlands and Belgium; transit flows induced by * TU Delft, Power Systems Group, Mekelweg 4, 2628 CD Delft, The Netherlands. Correspondence to J. Verboomen: [email protected], Tel: +31 15 27 84051, Fax: +31 15 27 81182 † KU Leuven, ELECTA ‡ TenneT TSO § Elia TSO 1

Welcome message from author
This document is posted to help you gain knowledge. Please leave a comment to let me know what you think about it! Share it to your friends and learn new things together.
Transcript
Monte Carlo Simulation Techniques for Optimisation of Phase
Shifter Settings
J.Verboomen∗, D. Van Hertem†,
P.H.Schavemaker∗, F.J.C.M.Spaan‡, J-M.Delince§,
R.Belmans†§, W.L.Kling∗‡
Summary
The Netherlands has installed two phase shifting transformers in order to more evenly distribute theload on the interconnectors with Germany. Belgium is planning to install four devices to tackle theproblem of transit flows between France and Germany and to control the flow on the parallel pathsbetween Belgium and France. One phase shifter on the border of the Netherlands and Germany wasalready installed for a long time. The coordination of all the phase shifters is very important in orderto take full advantage of these devices, but also to guarantee a safe situation and not to mutuallycounteract control actions. In this paper, a new Monte Carlo based approach is proposed to find theoptimal settings of different phase shifters. The goal is to maximise the import capacity for both theNetherlands and Belgium.
KEYWORDS: Phase Shifting Transformer, Monte Carlo Simulation, Power Flow Control, TransitFlow, Total Transfer Capacity.
1 Introduction
Due to uneven loading of interconnectors in meshed networks, the total cross-border capacity, availablefor import and export of electrical energy, is not equal to the capacity one might expect when summingup all the capacities of the different lines. This problem led to the installation of two phase shiftingtransformers (PSTs) at the Meeden substation in the north of the Netherlands (Fig. 1) [1, 2]. Thesouthern part of the country is closer to the center of the meshed European grid than the northern,which may lead to congestion problems on the southern interconnectors with Germany. The PSTcan divert power to the northern interconnector, loading the lines more evenly. This is a well-knownfeature of this kind of devices.
The liberalisation of the electricity market and the increasing use of wind energy in the Europeanpower system are two factors that have substantially increased the power flows between countries. Upto one decade ago, international flows were only due to long term contracts and to flows caused bymutual help between control areas at times of lacking generation capacity. Without any means ofcontrol, the grid of a country can become overloaded if it is involved in a power transfer as a thirdparty. This is exactly what is happening to the Netherlands and Belgium; transit flows induced by
∗TU Delft, Power Systems Group, Mekelweg 4, 2628 CD Delft, The Netherlands. Correspondence to J. Verboomen:[email protected], Tel: +31 15 27 84051, Fax: +31 15 27 81182
†KU Leuven, ELECTA‡TenneT TSO§Elia TSO
1

Figure 1: Location of different PSTs in the Netherlands and Belgium
increased trade between Germany and France and loop flows because of surplus of power in noncentralproduction sites (wind energy in the north of Germany or nuclear energy in the north of France) causeadditional loading of the Belgian and Dutch grid, leading to several critical operational situations. Itis in this framework that PSTs become a valuable means of control [3, 4, 5].
In response to the growing problem of transit flows, Belgium has decided to install several PSTs,because a single device can only shift power to other lines but not fully control it. The plans are toinstall one device in Zandvliet and two in Kinrooi, both on the Belgian-Dutch border. Furthermore, aPST will be installed in Monceau, near the French border solving a local problem. Together with thetwo PSTs in Meeden, this leads to a total of 6 PSTs. In this paper, the PST of Gronau in Germanyis taken into account too, and the two devices in Meeden are considered as one, because they areoperated in that way. Fig. 1 shows the location of all the devices.
It must be stated that there is no interconnection between Belgium and Germany. So with all thePSTs mentioned installed, the flows on the network between Belgium and the Netherlands can be fullycontrolled and the same is more or less the case for the flows between the Netherlands and Germanyand between Belgium and France.
The use of several PSTs must be studied carefully, because a poor coordination can lead to inefficientuse of investments or even to situations where the security of grid operation is no longer guaranteed.The goal of this paper is to study how the PSTs must be controlled in order to obtain an optimal ornear-optimal situation for both the Netherlands and Belgium.
The ETSO (European Transmission System Operators) provides definitions and rules for the cal-culation of the transfer capacities between countries [6]. The maximum amount of power that canbe transferred between countries A and B without violating any security criterion is called the TotalTransfer Capacity (TTC) between A and B. The aim of the research is to maximise this TTC bycoordinating PST control.
2

−8000 −7000 −6000 −5000 −4000 −3000 −2000 −1000 0 1000 20000
200
400
600
800
1000
1200
TTC (MW)
freq
uenc
y
Figure 2: Histogram of a 50000 sample MCS of the import TTC of the Netherlands and Belgium
2 Monte Carlo Simulation
A straightforward approach to the problem of finding the optimal PST settings would be the calculationof the TTC for every combination of phase shifter settings. However, there are so many possibleconfigurations, that this calculation would take years. This is why a Monte Carlo Simulation (MCS)approach is proposed [7].
The TTC is calculated for a number of random combinations of PST settings, and the results areplotted in a histogram. The shape of this histogram converges to a certain distribution, becomingclearer with an increasing amount of samples. A judgement can be made on the maximum attainableTTC and the settings to obtain this value. Conversely, the worst case scenario can also be investigatedby looking at the other side of the histogram.
The calculations are performed using PSS/E and controlled by a script written in Python. Forevery set of random settings, a TTC analysis is performed by using DC load flows to increase thecomputation speed. The Netherlands and Belgium are considered as one system and France andGermany as another. Calculations are performed on the import TTC from the German-French systemto the Dutch-Belgian system.
The model used is the situation of the grid of the Netherlands, Belgium, and the neighbouringcountries on the 19th of January 2000, at 10h30, representing a typical state of the grid.
Fig. 2 shows the results of an MCS with 50000 samples. Favourable TTC values have a negativesign as import is considered as an optimising target. It can be seen that a maximum value of about7500 MW can be obtained. Furthermore, in the worst case a positive value is obtained. This meansthat the system can not import any power because of overloading problems. These problems occurwhen there is a large loopflow passing through the Netherlands and Belgium. This flow, which canbecome as large as 1500 MW, depends largely on the setting of the Zandvliet and Kinrooi 1 PSTs, ormore precisely, on the coordination of both devices.
As demonstrated, an approximation of the maximum TTC can be obtained by looking at the
3
0 0.5 1 1.5 2 2.5 3 3.5 4 4.5 5
x 104
-7500
-7000
-6500
-6000
-5500
-5000
-4500
-4000
Maxim
um
TT
C(M
W)
samples
0 0.5 1 1.5 2 2.5 3 3.5 4 4.5 5
x 104
-1
0
1
2
3
4
5
6x 10
4
Min
imum
TT
C(M
W)
Maximum TTC (MW)
Minimum TTC (MW)
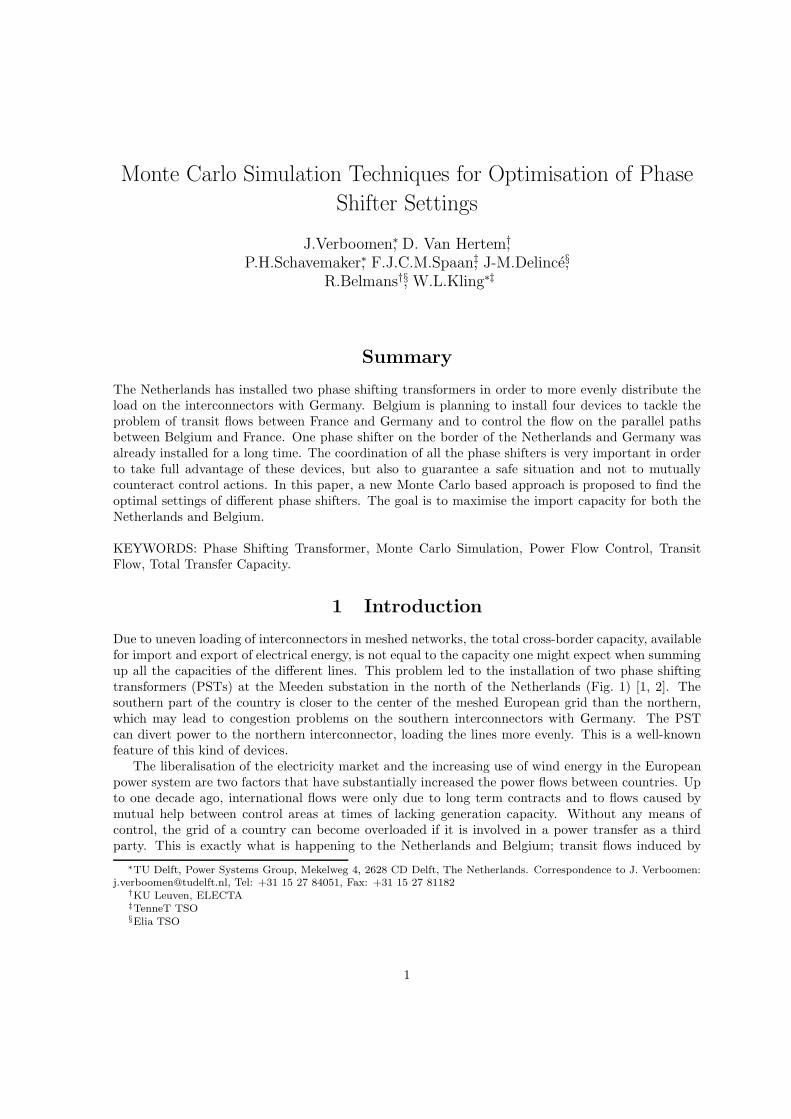
Figure 3: Evolution of the minimum and maximum TTC values with an increasing amount of samples
histogram. An important question is how many samples are needed to find a good approximation. InFig. 3, the minimum and maximum TTC values with an increasing number of samples can be seen.From the figure, it becomes clear that 20000 samples are enough to reach the maximum value in thissimulation. It is also evident that the absolute minimum value is very sharp, as it is only reached witha large amount of samples. It can be concluded that the amount of samples needed depends on thearea of interest.
3 Multistage Monte Carlo Simulation
In the classical MCS approach, samples are generated in a certain multidimensional search volume SV:
SV =d∏
i=1
(maxi − mini) (1)
In this expression, mini and maxi are the minimum and maximum values respectively of variablei. The larger the range of the variables, the larger the SV becomes. In the case of this research, thedimension d is 6. A high dimension leads to a large SV, which in its turn leads to a high requiredamount of samples. Furthermore, from the MCS it is not clear which PST settings are the best,as the information on the optimal region of the histogram is not sufficiently detailed. In order toreduce the search volume and increase the accuracy, the Multistage Monte Carlo Simulation (MMCS)is introduced.
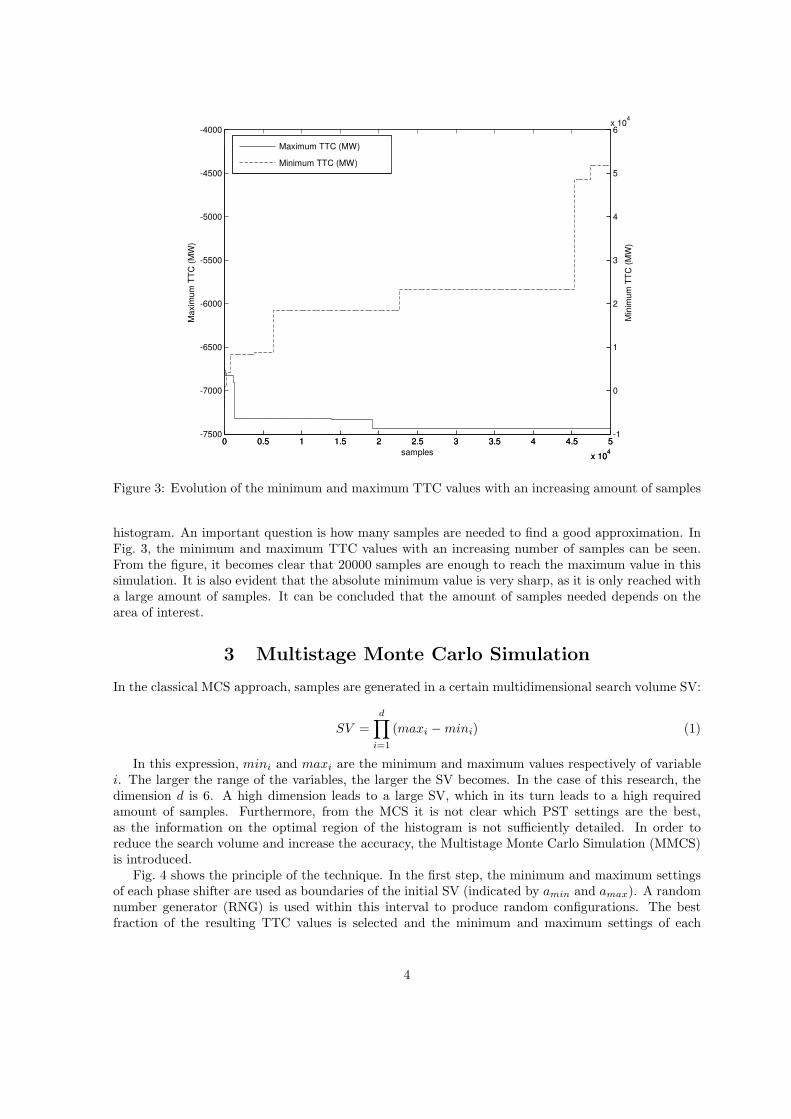
Fig. 4 shows the principle of the technique. In the first step, the minimum and maximum settingsof each phase shifter are used as boundaries of the initial SV (indicated by amin and amax). A randomnumber generator (RNG) is used within this interval to produce random configurations. The bestfraction of the resulting TTC values is selected and the minimum and maximum settings of each
4
Figure 4: Principle of the Multistage Monte Carlo Simulation technique
variable within this fraction define the boundaries of the SV of the next MCS. The new SV is smallerthan the previous one and still contains the optimal point. This process of zooming can be repeatedseveral times. The SV in the MMCS can be described by:
SVz =
d∏
i=1
(maxi,z − mini,z) (2)
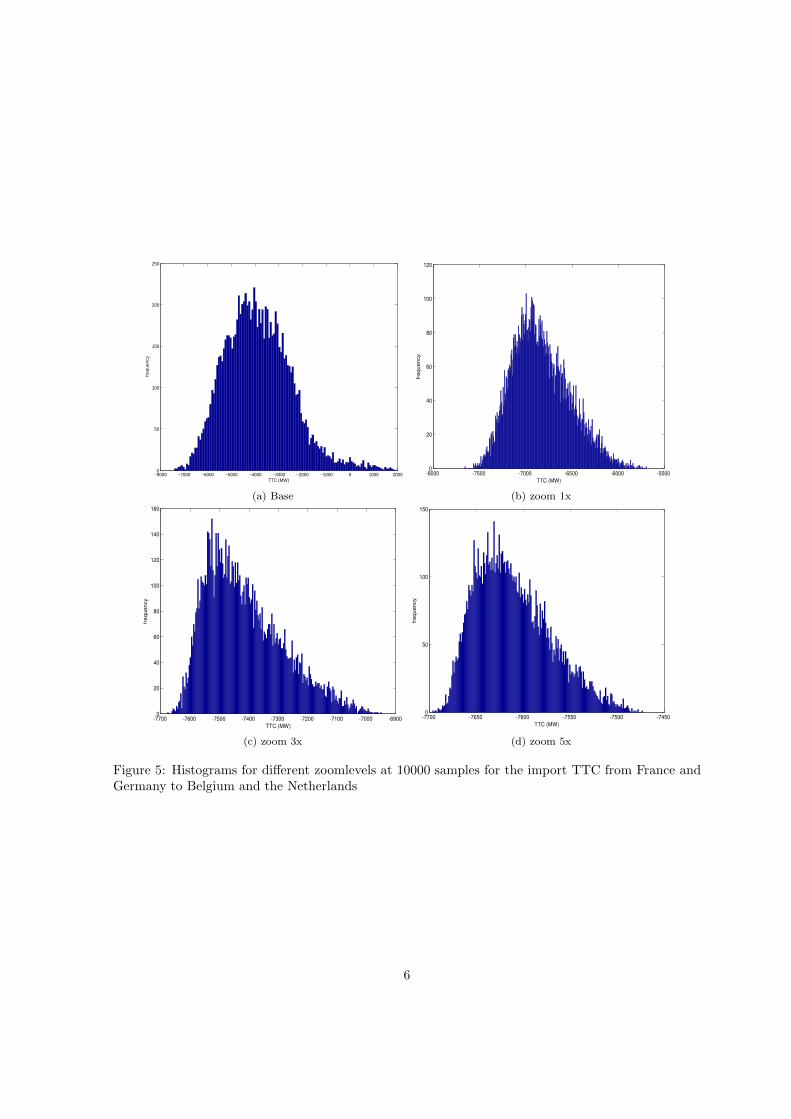
where z is the zoomlevel (ZL).Fig. 5 shows the histograms for different zoomlevels. In this simulation, 10000 samples per zoomlevel
are used and the 20 best are selected for the definition of the new SV. It is clear from the picture thatthe range of the TTC values decreases with each ZL, especially from the base case to ZL 1. At ZL 5,the range has decreased to less than 300 MW.
After ZL 5, the minimum and maximum settings of the 20 best TTC values are used as boundariesfor a final MCS with 50000 samples. From this calculation, it appears that a TTC between 7750 and7500 MW can be expected if the final PST setting intervals are respected.
4 Transit Flow Analysis with MMCS
4.1 Simulation results
The MMCS is also used to investigate how the coordination of PSTs should be under transit flow(TF) conditions. In order to obtain a transit flow between France and Germany, a power shift (PS)
5
−8000 −7000 −6000 −5000 −4000 −3000 −2000 −1000 0 1000 20000
50
100
150
200
250
TTC (MW)
fre
qu
en
cy
(a) Base
-8000 -7500 -7000 -6500 -6000 -55000
20
40
60
80
100
120
TTC (MW)
frequency
(b) zoom 1x
-7700 -7600 -7500 -7400 -7300 -7200 -7100 -7000 -69000
20
40
60
80
100
120
140
160
TTC (MW)
frequency
(c) zoom 3x
-7700 -7650 -7600 -7550 -7500 -74500
50
100
150
TTC (MW)
frequency
(d) zoom 5x
Figure 5: Histograms for different zoomlevels at 10000 samples for the import TTC from France andGermany to Belgium and the Netherlands
6
-4000 -3000 -2000 -1000 0 1000 2000 3000 4000-8000
-7500
-7000
-6500
-6000
-5500
-5000
-4500
-4000
-3500
-3000
power shift (MW)
TT
C(M
W)
no PST
PST always optimal
PST optimal for base
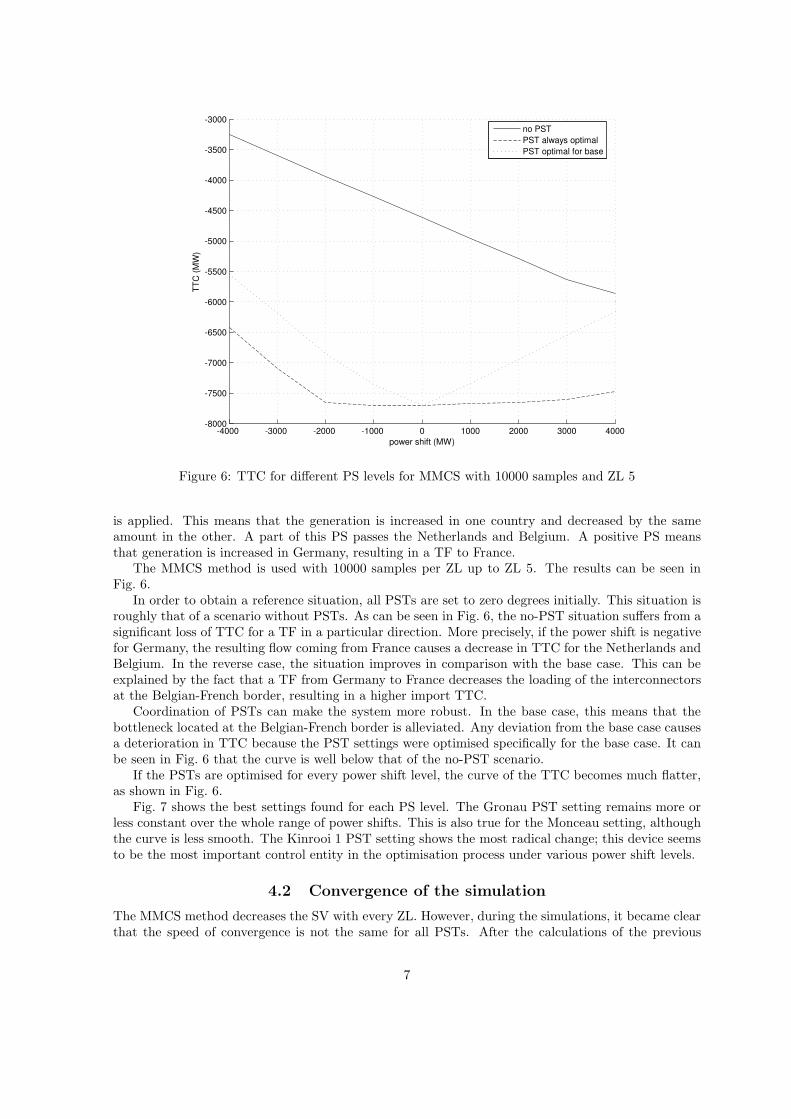
Figure 6: TTC for different PS levels for MMCS with 10000 samples and ZL 5
is applied. This means that the generation is increased in one country and decreased by the sameamount in the other. A part of this PS passes the Netherlands and Belgium. A positive PS meansthat generation is increased in Germany, resulting in a TF to France.
The MMCS method is used with 10000 samples per ZL up to ZL 5. The results can be seen inFig. 6.
In order to obtain a reference situation, all PSTs are set to zero degrees initially. This situation isroughly that of a scenario without PSTs. As can be seen in Fig. 6, the no-PST situation suffers from asignificant loss of TTC for a TF in a particular direction. More precisely, if the power shift is negativefor Germany, the resulting flow coming from France causes a decrease in TTC for the Netherlands andBelgium. In the reverse case, the situation improves in comparison with the base case. This can beexplained by the fact that a TF from Germany to France decreases the loading of the interconnectorsat the Belgian-French border, resulting in a higher import TTC.
Coordination of PSTs can make the system more robust. In the base case, this means that thebottleneck located at the Belgian-French border is alleviated. Any deviation from the base case causesa deterioration in TTC because the PST settings were optimised specifically for the base case. It canbe seen in Fig. 6 that the curve is well below that of the no-PST scenario.
If the PSTs are optimised for every power shift level, the curve of the TTC becomes much flatter,as shown in Fig. 6.
Fig. 7 shows the best settings found for each PS level. The Gronau PST setting remains more orless constant over the whole range of power shifts. This is also true for the Monceau setting, althoughthe curve is less smooth. The Kinrooi 1 PST setting shows the most radical change; this device seemsto be the most important control entity in the optimisation process under various power shift levels.
4.2 Convergence of the simulation
The MMCS method decreases the SV with every ZL. However, during the simulations, it became clearthat the speed of convergence is not the same for all PSTs. After the calculations of the previous
7

-4000 -3000 -2000 -1000 0 1000 2000 3000 4000-30
-20
-10
0
10
20
30
40
power shift (MW)
optim
alP
ST
settin
g(d
egre
es)
Meeden
Gronau
Zandvliet
Kinrooi1
Kinrooi2
Monceau
Figure 7: Optimal PST settings for different PS levels calculated with MMCS with 10000 samples andup to ZL 5
paragraph, the range in the settings of the best 20 samples is examined and scaled as a percentage ofthe total range of that particular PST. This action is performed for every PS level. The results can beseen in Fig. 8.
Clearly, the range of the Meeden, Gronau and Kinrooi 2 PST settings is smaller than 10%, indicatingthat these devices converge reasonably fast in the MMCS calculations. The other PSTs however showa significant larger setting range, especially for additional flows from Germany to France.
For the Monceau PST setting, this can be explained from the fact that this device is not veryimportant in the optimisation proces. A sensitivity analysis shows that the TTC only varies a fewMW per degree of change in the setting. This means that the optimum value is not very well defined,and that convergence is slow.
For the Kinrooi 1 and Zandvliet PST settings, a similar sensitivity analysis is performed. Theresults show a variation of a few tens of MW per degree of deviation from the calculated optimalsetting. A correlation analysis between the PST settings of Kinrooi 1 and Zandvliet shows that thecorrelation coefficient of the best 20 values reaches values of up to 0.99, indicating that the optimalsettings of these devices are highly dependent. This is the reason why these PSTs do not convergevery fast to one optimal setting.
5 Conclusions
A method for the optimisation of settings of multiple phase shifters is developed. This algorithm isapplied for the situation in the Netherlands and Belgium, where multiple devices are installed. Theparameter that is optimised is the TTC.
A classical Monte Carlo Simulation offers an estimate of the best and worst import TTC values,and the number of samples needed can be relatively limited for this purpose. However, the settingsrequired to obtain optimal or near optimal results do not come out of this approach with an accuracy
8

-4000 -3000 -2000 -1000 0 1000 2000 3000 40000
5
10
15
power shift (MW)
rela
tive
range
(%)
Meeden
Gronau
Zandvliet
Kinrooi 1
Kinrooi 2
Monceau
Figure 8: Procentual range of the best 20 samples at ZL 5 for MMCS with 10000 samples
that is sufficiently high.Therefore, a new approach is developed in which the search volume of the MCS is narrowed in
several subsequent steps. In this way, the optimal settings for each phase shifter are defined in detail.Calculation of transit flow conditions indicates that a good coordination of the PSTs leads to a
more robust system: the sensitivity to these flows is greatly reduced.
6 Abbreviations
CDF Cumulative Distribution FunctionETSO European Transmission System OperatorsMCS Monte Carlo SimulationMMCS Multistage Monte Carlo SimulationPS Power ShiftPST Phase Shifting TransformerRNG Random Number GeneratorSV Search VolumeTF Transit FlowTTC Total Transfer CapacityZL Zoomlevel
Acknowledgments
The research at the TU Delft has been performed within the framework of the research program“intelligent power systems” that is supported financially by SenterNovem. SenterNovem is an agencyof the Dutch ministry of Economic Affairs. The research performed at the KU Leuven is financiallysupported by the Belgian ‘Fonds voor Wetenschappelijk Onderzoek (F.W.O.)–Vlaanderen’. Dirk VanHertem is a doctoral research assistant of the F.W.O.–Vlaanderen.
9

References
[1] Kling WL, et al. Phase shifting transformers installed in the Netherlands in order to increaseavailable international transmission capacity. In CIGRE Session 2004 - C2-207. 2004.
[2] Spoorenberg CJG, van Hulst BF, Reijnders HF. Specific aspects of design and testing of a phaseshifting transformer. In XIIIth International Symposium on High Voltage Engineering. 2003.
[3] Bresesti P, et al. Application of Phase Shifting Transformers for a secure and efficient operation ofthe interconnection corridors. In IEEE Power Engineering Society General Meeting. 2004, 1192–1197.
[4] Bladow J, Montoya A. Experiences with Parallel EHV Shifting Transformers. IEEE Transactions
on Power Delivery, July 1991; 6(3):1096–1100.
[5] Verboomen J, et al. Phase Shifting Transformers: Principles and Applications. In Future Power
Systems Conference 2005. Amsterdam, 2005.
[6] European Transmission System Operators (ETSO). Definitions of Transfer Capaci-ties in liberalized Electricity Markets, April 2001. Available online: http://www.etso-net.org/upload/documents/Transfer%20Capacity%20Definitions%20-%20Final.pdf.
[7] Anders GJ. Probability Concepts in Electric Power Systems. John Wiley & Sons: New York, 1990;581-651.
Biographies
Jody Verboomen obtained his M.Eng. in Electronical Engineering fromGroup T Technical School in Leuven, Belgium in 2001. He obtained his M.Sc.in Electrical Engineering from the Catholic University of Leuven (KUL),Belgium in 2004. He is currently working towards a Ph.D. on the applicationof FACTS in transmission systems in the Electrical Power System (EPS)laboratory of the Delft University of Technology, The Netherlands.
Dirk Van Hertem graduated as a M.Eng. in 2001 from the KHK,Geel/Belgium and as a M.Sc. in Electrical Engineering from theK.U.L./Leuven Belgium in 2003. From 2003 he has been working towards aPh.D. in the ELECTA research group, department of Electrical Engineeringof the K.U.Leuven, Belgium. From October 2004, he is a research assistantfor the F.W.O.-Vl. In 2001, his masters thesis received the ‘V.I.K. award’ andin 2004, he received the ‘K.B.V.E. R&D award’ for his second masters thesis.His special fields of interest are power system control and optimisation.
Pieter H. Schavemaker obtained his M.Sc. in Electrical Engineering fromthe Delft University of Technology in 1994 and he obtained his Ph.D. inElectrical Engineering from the Delft University of Technology in 2002. Since1996 he has been with the Power Systems Laboratory where he is currentlyAssistant Professor.
10
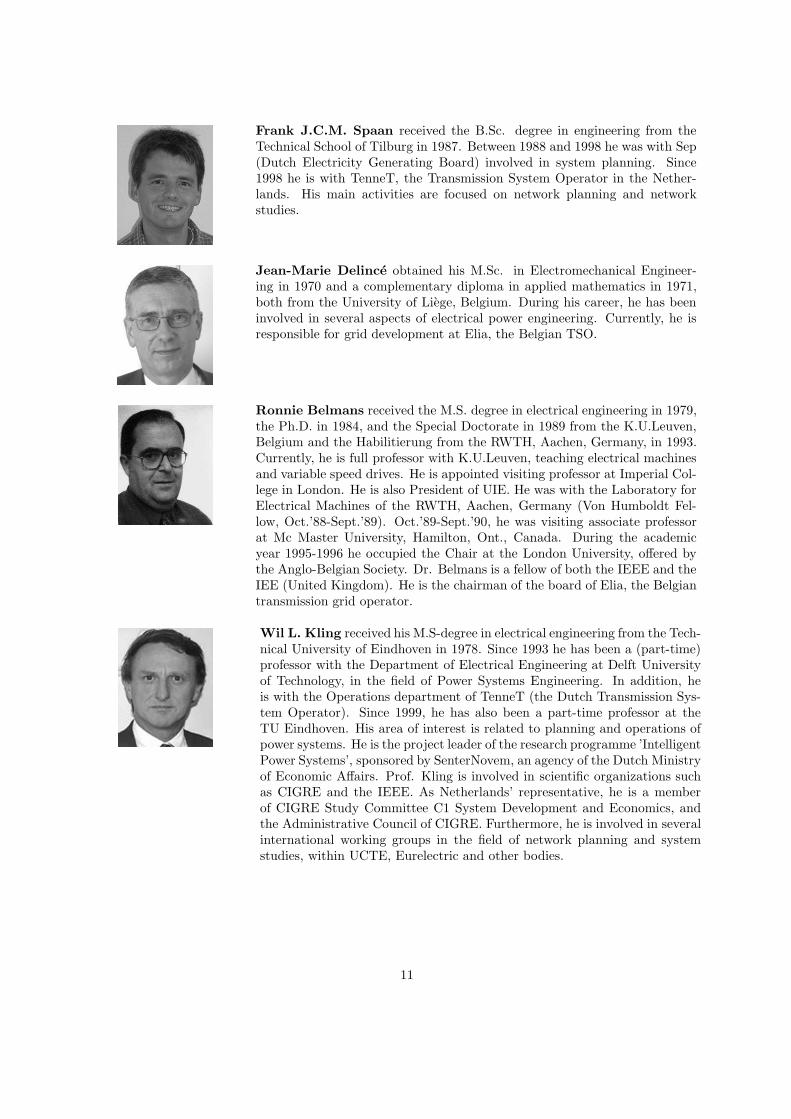
Frank J.C.M. Spaan received the B.Sc. degree in engineering from theTechnical School of Tilburg in 1987. Between 1988 and 1998 he was with Sep(Dutch Electricity Generating Board) involved in system planning. Since1998 he is with TenneT, the Transmission System Operator in the Nether-lands. His main activities are focused on network planning and networkstudies.
Jean-Marie Delince obtained his M.Sc. in Electromechanical Engineer-ing in 1970 and a complementary diploma in applied mathematics in 1971,both from the University of Liege, Belgium. During his career, he has beeninvolved in several aspects of electrical power engineering. Currently, he isresponsible for grid development at Elia, the Belgian TSO.
Ronnie Belmans received the M.S. degree in electrical engineering in 1979,the Ph.D. in 1984, and the Special Doctorate in 1989 from the K.U.Leuven,Belgium and the Habilitierung from the RWTH, Aachen, Germany, in 1993.Currently, he is full professor with K.U.Leuven, teaching electrical machinesand variable speed drives. He is appointed visiting professor at Imperial Col-lege in London. He is also President of UIE. He was with the Laboratory forElectrical Machines of the RWTH, Aachen, Germany (Von Humboldt Fel-low, Oct.’88-Sept.’89). Oct.’89-Sept.’90, he was visiting associate professorat Mc Master University, Hamilton, Ont., Canada. During the academicyear 1995-1996 he occupied the Chair at the London University, offered bythe Anglo-Belgian Society. Dr. Belmans is a fellow of both the IEEE and theIEE (United Kingdom). He is the chairman of the board of Elia, the Belgiantransmission grid operator.
Wil L. Kling received his M.S-degree in electrical engineering from the Tech-nical University of Eindhoven in 1978. Since 1993 he has been a (part-time)professor with the Department of Electrical Engineering at Delft Universityof Technology, in the field of Power Systems Engineering. In addition, heis with the Operations department of TenneT (the Dutch Transmission Sys-tem Operator). Since 1999, he has also been a part-time professor at theTU Eindhoven. His area of interest is related to planning and operations ofpower systems. He is the project leader of the research programme ’IntelligentPower Systems’, sponsored by SenterNovem, an agency of the Dutch Ministryof Economic Affairs. Prof. Kling is involved in scientific organizations suchas CIGRE and the IEEE. As Netherlands’ representative, he is a memberof CIGRE Study Committee C1 System Development and Economics, andthe Administrative Council of CIGRE. Furthermore, he is involved in severalinternational working groups in the field of network planning and systemstudies, within UCTE, Eurelectric and other bodies.
11
Related Documents