Monsoonal affected dynamics of nitrate and dissolved organic carbon in a mountainous catchment under intensive land-use Dissertation to attain the academic degree of Doctor of Natural Science (Dr. rer. nat.) of the Bayreuth Graduate School of Mathematical and Natural Sciences (BayNAT) of the University of Bayreuth presented by Svenja Bartsch born 2 January 1981 in Friedrichshafen (Germany) Bayreuth, August 2013

Welcome message from author
This document is posted to help you gain knowledge. Please leave a comment to let me know what you think about it! Share it to your friends and learn new things together.
Transcript
Monsoonal affected dynamics of nitrate and dissolved organic
carbon in a mountainous catchment under intensive land-use
Dissertation
to attain the academic degree of Doctor of Natural Science (Dr. rer. nat.) of the Bayreuth
Graduate School of Mathematical and Natural Sciences (BayNAT) of the University of
Bayreuth
presented by
Svenja Bartsch
born 2 January 1981
in Friedrichshafen (Germany)
Bayreuth, August 2013

This doctoral thesis was prepared at the department of Hydrology at the University of Bayreuth from April 2009 until August 2013 and was supervised by Dr. Jan H. Fleckenstein, Prof. Dr. Stefan Peiffer, and Dr. Christopher L. Shope. This is a full reprint of the dissertation submitted to attain the academic degree of Doctor of Natural Science (Dr. rer. nat.) and approved by the Bayreuth Graduate School of Mathematical and Natural Sciences (BayNAT) of the University of Bayreuth.
Date of submission: 27.08.2013
Date of scientific colloquium: 20.12.2013
Acting director : Prof. Dr. Franz X. Schmid
Doctoral committee:
Dr. Johannes Lüers (chairman)
Prof. Dr. Stefan Peiffer (first reviewer)
Prof. John Tenhunen, Ph.D. (second reviewer)
Dr. Jan H. Fleckenstein

ii
iii
Abstract
In recent decades, complex mountainous landscapes have been increasingly under pressure by deforestation and intensified highland agriculture. This trend not only compromises the quality of water in the highlands, but also impacts the availability of water resources downstream. Hence, an effective and sustainable management of these mountainous regions is essential and needed to mitigate this risk. Developing sustainable management principles to ensure the freshwater supply, however, requires a profound understanding of decisive factors and processes that control the water quality in mountainous landscapes. Amongst other substances, nitrate and dissolved organic carbon (DOC) play a critical role in the ecosystem health of water bodies. The major focus of this dissertation is on determining the nitrate and DOC mobilization processes and dynamics in the Haean Catchment, a mountainous watershed located in South Korea, which is agriculturally productive and strongly influenced by the prevailing East-Asian monsoon. The primary objective was to identify decisive factors that control the nitrate and DOC mobilization processes and dynamics in such catchments.
To these ends, we conducted stream water quality and discharge measurements during a range of conditions, from monsoonal rainfall events to dry, baseflow conditions. Assessments were completed along the topographic elevation gradient of the catchment, from an upland deciduous forest, over areas intensively used for agriculture, down to the catchment outlet. In order to gain a better understanding of nutrient fate within the Haean Catchment, we investigated river-aquifer exchange fluxes. In addition to hydraulic gradient monitoring, we used heat as tracer. To resolve the river-aquifer exchange fluxes, we set up a two-dimensional flow and heat transport model using the numerical code HydroGeoSphere (HGS). Potential effects of river-aquifer exchange dynamics on local water quality were investigated by collecting both, river and groundwater samples. Furthermore, we determined the impact of the ridge and furrow cultivation that is commonly applied in South Korean dryland agriculture, on nitrate leaching and evaluated fertilizer best management practices (FBMPs) using a three-dimensional flow and solute transport model (HGS).
Our results show that DOC and nitrate sources as well as their mobilization differ between the forest and agricultural river sites. In the forest, elevated in-stream DOC concentrations during rainfalls were due to hydrologic flushing of soluble organic matter in upper soil horizons with a strong dependency on pre-storm wetness conditions. Nitrate contributions to the stream occurred predominantly along interflow transport pathways.
At the agricultural sites, in-stream DOC concentrations were considerably higher and supplied from adjacent rice paddies. The highest in-stream nitrate concentrations occurred in the lower agricultural part of the catchment. Through hydraulic gradient monitoring, we identified in this part of the catchment a distinct connection between the river and aquifer, and nitrate-rich groundwater inputs to the river elevated the in-stream nitrate concentration. In the mid-elevation portion of the catchment, however, a limited connectivity between the river and aquifer was identified and river water quality was consequently unaffected in these areas.
iv
The results of our HGS modeling study show a high temporal and spatial variability in river-aquifer exchange fluxes with frequent flow reversals during the monsoon season. Our results also suggest that these flow reversals may enhance the natural attenuation of nitrate in the shallow groundwater below the stream. The simulation results on evaluating FBMPs demonstrate that applying a combination of several FBMPs such as an adapted placement and timing is recommended to minimize the risk of groundwater nitrate contamination.
Overall, this dissertation demonstrates that the hydrologic pathways resulting from the monsoon climate drive the in-stream DOC dynamics in the forested catchment, whereas sources and mobilization of DOC in downstream agricultural areas are mainly controlled by the specific land-use type. In particular, the widely used rice paddy “plot-to-plot” irrigation system in Korean highlands was shown to control in-stream DOC concentrations. Nitrate dynamics in streams and aquifers in the agricultural areas of the catchment reflect the combined effects of land-use type and monsoonal hydrology. Particularly, the highly variable river-aquifer exchange fluxes with frequent flow reversals, which may enhance the nitrate attenuation, are driven by monsoonal extreme precipitation events. Since it has been forecasted that global warming will increase the frequency and the intensity of extreme precipitation events also in other regions of the world, our results will become increasingly important in future water quality assessments and research.
v
Zusammenfassung
In den letzten Jahrzehnten sind komplexe Bergregionen durch Kahlschläge zugunsten einer intensivierten Landwirtschaft im Hochland zunehmend unter Druck geraten. Diese Entwicklung gefährdet nicht nur die Wasserqualität im Hochland, ferner sind die natürlichen Ressourcen stromabwärts einem erhöhten Risiko ausgesetzt. Um dieses Risiko möglichst effektiv einzudämmen, bedarf es einer nachhaltigen Bewirtschaftung von Bergregionen. Die Entwicklung nachhaltiger Management-Prinzipien zur Sicherung der Trinkwasserversorgung erfordert jedoch profunde Kenntnisse über entscheidende Faktoren und Prozesse, die die Wasserqualität regulieren. Neben anderen Substanzen spielen Nitrat und gelöster organischer Kohlenstoff (DOC) eine wichtige Rolle für die ökosystemare Gesundheit von Gewässern. Das Hauptaugenmerk dieser Arbeit liegt auf der Ermittlung von Nitrat- und DOC Dynamiken und Mobilisierungsprozessen in Haean, ein landwirtschaftlich intensiv genutztes sowie stark durch das ostasiatische Monsunklima beeinflusstes Einzugsgebiet im Hochland Südkoreas. Primäres Ziel dieser Arbeit war es die entscheidenden Faktoren, die die Nitrat- und DOC Mobilisierungsprozesse und Dynamiken steuern, zu identifizieren.
Zu diesem Zweck führten wir vorwiegend während monsunaler Regenereignisse Fluss-wasserqualitäts- und Abflussmessungen entlang des topographischen Höhengradienten des Einzugsgebietes durch, beginnend auf den bewaldeten Hängen, über landwirtschaftlich intensiv genutzte Flächen bis hin zum Einzugsgebietsauslass. Um ein besseres Verständnis über den Nährstoffverbleib im Einzugsgebiet zu gewinnen, untersuchten wir die Austausch-dynamiken zwischen Fluss und Grundwasserleiter. Neben der Überwachung hydraulischer Gradienten verwendeten wir Wärme als „Tracer“. Die Berechnung der Austauschflüsse erfolgte anhand eines zweidimensionalen Strömungs- und Wärmetransportmodells, unter der Verwendung des numerischen Codes HydroGeoSphere (HGS). Mögliche Auswirkungen der Grundwasser-Fluss-Interaktionen auf die Wasserqualität ermittelten wir anhand von Fluss- und Grundwasserbeprobungen. Zudem untersuchten wir die Auswirkung des dort weitver-breiteten Dammkultivierungssystems auf die Nitratauswaschung und evaluierten „Fertilizer-Best-Management Practices“ (FBMPs) mittels eines dreidimensionalen Strömungs- und Stofftransportmodells (HGS).
Unsere Ergebnisse zeigen, dass die Nitrat und DOC Quellen und deren Mobilisierung sich im Wald deutlich von denen in den landwirtschaftlich genutzten Flächen unterscheiden. Im Wald führten während monsunaler Niederschläge hydrologische Auswaschungsprozesse von gelösten organischen Substanzen aus dem Oberboden zu erhöhten DOC-Konzentrationen im Flusswasser. Nitrat wurde im Wald vorwiegend über den Zwischenabfluss in den Fluss eingetragen.
In den landwirtschaftlich dominierten Flüssen höherer Ordnung identifizierten wir wesentlich höhere DOC-Konzentrationen, welche auf den DOC-Eintrag aus Reisfeldern zurückzuführen sind. Die höchsten Nitratkonzentrationen im Flusswasser wurden in der landwirtschaftlich genutzten Beckenebene gemessen und beruhen auf nitratbelastetem Grundwasserzustrom. Durch die Überwachung der hydraulischen Gradienten identifizierten wir hier eine gute Anbindung des Flusses an das Grundwasser, wohingegen in mittlerer

vi
Höhenlage des Einzugsgebiets lediglich eine eingeschränkte Verbindung zwischen Fluss und Aquifer vorliegt. Generell zeigen unsere HGS-Simulationen eine hohe zeitliche und räum-liche Variabilität der Austauschflüsse zwischen Fluss und Grundwasserleiter in der Becken-ebene, mit zahlreichen Strömungsumkehrungen während monsunaler Niederschläge. Unsere Wasserqualitätsmessungen weisen zudem darauf hin, dass diese Strömungsumkehrungen den Abbau von Nitrat im flachen Grundwasser unter dem Fluss begünstigen. Desweiteren zeigen die Simulationen der Düngermanagement-Szenarien, dass die Anwendung kombinierter FBMPs empfehlenswert ist, um das Risiko der Nitratbelastung des Grundwassers deutlich zu minimieren.
Insgesamt wird in dieser Dissertation gezeigt, dass das Monsunklima eine bedeutende Rolle für die DOC- und Nitratmobilisierung in den bewaldeten Bereichen des Einzugs-gebietes spielt, wohingegen der Landnutzungstyp stromabwärts die DOC Quellen und Mobilisierung bestimmt. Insbesondere scheint das angewandte „Plot-to-Plot“ Bewässerungs-system der Reisfelder die DOC-Dynamiken in den Oberflächengewässern zu kontrollieren. Im Gegensatz dazu sind die Nitratdynamiken in den landwirtschaftlich dominierten Flüssen und Grundwasserleitern sowohl durch die Landnutzung als auch durch das Monsunklima geprägt. Besonders die hoch variablen Austauschdynamiken zwischen Fluss und Aquifer und die damit einhergehenden Strömungsumkehrungen, die evtl. den Nitratabbau begünstigen, werden durch monsunale Extremniederschläge bestimmt. Diese Erkenntnis wird durch die prognostizierte weltweit zunehmende Häufigkeit von Extremniederschlägen infolge der globalen Erwärmung auch zentraler Gegenstand zukünftiger Forschung sein.
vii
Acknowledgements
I would like to take this opportunity to thank all those who have contributed in any way or form to the completion of my dissertation. First of all, I am sincerely grateful to my advisers Jan H. Fleckenstein, Stefan Peiffer, and Christopher L. Shope for their good ideas, their guidance and critical comments but also for their valuable help with writing and editing the manuscripts of this dissertation thesis. Furthermore, I want to thank Sven Frei for his great help with HGS modeling. I’m also sincerely grateful to the head of TERRECO, John Tenhunen, who always motivated me during my PhD especially with his interest in my work.
This dissertation in its current form would not have been possible without the support of TERRECO members. Best example, is the immense support I received from my colleagues during high-frequency storm event sampling for water quality. Even it was very tough work, especially the night-time sampling, everyone was willing to help. Thanks a lot again, I’m still touched by your effort and happy to be one of this amazing group.
Particularly, I want to thank my colleagues and friends Sebastian Arnhold and Bumsuk Seo for their excellent technical support during field work, their help with GIS but also for numerous interesting scientific and non-scientific discussions in Korea and Bayreuth. Many thanks also to my Bachelor student Axel Müller, field work with him was always fun. I’m also grateful to Jaesung Eum and Kiyong Kim for organizing and completing most water quality analyzes at their laboratory in Korea. Furthermore, I would like to acknowledge the substantial efforts in translation done by my colleagues and friends Eunyoung Jung, Bora Lee, Bumsuk Seo, Youngsun Kim and Heera Lee during field work. Christiane Neumann I want to thank for numerous very helpful and interesting discussions about using heat as a natural tracer. I also want to thank my colleagues and room-mates in Korea, Marianne Ruidisch and Janine Kettering who became close friends during the last years. Many “Kamsa Hamnida” to Mrs. Kwon and Mr. Park, who always gave me the feeling like coming home when I arrived at their guesthouse in Korea and who always supported me during my numerous stays in Korea. I also want to thank the local driller and his wife as well as the tool shop owner of Haean; we spent a great time together even we don’t have a language in common. I am also sincerely grateful to Jihyung Park for his valuable help and contributions to my work. Furthermore, I would like to thank all members of the Hydrology Department and also of the Plant Ecology Department. Particularly, I want to thank Marga Wartinger, Martina Rohr, Frederieke Rothe, Bettina Kuppinger, Jutta Eckert, and Bärbel Tenhunen for their great help concerning laboratory and administration matters.
Most importantly, I want to thank my parents Jürgen & Kicki and my sister Kerstin, my friend Margit and my partner Jochen, who always patiently listened to my problems and supported and encouraged me a lot, especially during the challenging phases of my dissertation.
viii
Table of contents
Abstract ................................................................................................................................................. iii Zusammenfassung ................................................................................................................................... v Acknowledgements .............................................................................................................................. vii Table of contents ................................................................................................................................. viii List of figures ......................................................................................................................................... xi List of tables ......................................................................................................................................... xiv List of abbreviations ............................................................................................................................. xv List of symbols ................................................................................................................................... xvii
Chapter 1
Synopsis .................................................................................................................................................. 1
1.1. Introduction ............................................................................................................................... 1 1.1.1. Framework of this dissertation project: TERRECO ....................................................... 1 1.1.2. Background, research objectives and state of knowledge ................................................ 2
1.2. Material and Methods ................................................................................................................ 8 1.2.1. Research area and study sites ........................................................................................... 8 1.2.2. Analysis of nitrate and DOC sources, dynamics and mobilization processes ................. 9 1.2.3. Analysis of river-aquifer exchange fluxes under monsoonal climate conditions .......... 11 1.2.4. Analysis of fertilizer best management practices for reducing nitrate leaching ............ 13
1.3. Results and discussion ............................................................................................................. 16 1.3.1. Nitrate and DOC sources, dynamics and mobilization processes in the Haean Catchment ................................................................................................................................ 16 1.3.2. River-aquifer exchange fluxes under monsoonal climate conditions ............................ 19 1.3.3. Evaluation of fertilizer best management practices for reducing nitrate leaching ......... 22
1.4. Conclusions and recommendations for future research ........................................................... 24
1.5. List of manuscripts and specification of individual contributions ........................................... 27
1.6. Literature ................................................................................................................................. 29
Chapter 2
Monsoonal-type climate or land-use management: Understanding their role in the mobilization of nitrate and DOC in a mountainous catchment ............................................................................ 33
Abstract ................................................................................................................................................. 33
2.1. Introduction ............................................................................................................................. 34
2.2. Materials and Methods ............................................................................................................ 36 2.2.1. Study site ........................................................................................................................ 36 2.2.2. Instrumentation, data collection and data analysis ......................................................... 38
2.3. Results ..................................................................................................................................... 41 2.3.1. Monsoonal storm characteristics and stream hydrology ................................................ 41 2.3.2. Groundwater hydrology ................................................................................................. 42 2.3.3. Soil moisture conditions at the forested site (S1) .......................................................... 43 2.3.4. Nitrate and DOC concentrations observed at river and groundwater monitoring locations ................................................................................................................................... 44
ix
2.3.5. Nitrate, DOC and discharge dynamics during storms .................................................... 46
2.4. Discussion ............................................................................................................................... 50 2.4.1. Hydrological dynamics in the catchment ....................................................................... 50 2.4.2. DOC sources and mobilization ...................................................................................... 50 2.4.3. Nitrate sources and pathways within the Haean Catchment .......................................... 53
2.5. Conclusions ............................................................................................................................. 56
2.6. References ............................................................................................................................... 58
Chapter 3
River-aquifer exchange fluxes under monsoonal climate conditions ............................................. 61
Abstract ................................................................................................................................................. 61
3.1. Introduction ............................................................................................................................. 62
3.2. Materials and Methods ............................................................................................................ 63 3.2.1. Study Area and Site ....................................................................................................... 63 3.2.2. Field Instrumentation and Data Collection .................................................................... 64 3.2.3. Modeling Approach ....................................................................................................... 66
3.3. Results ..................................................................................................................................... 69 3.3.1. Observed Field Data ...................................................................................................... 69 3.3.2. Model Results ................................................................................................................ 71 3.3.3. Water chemistry and simulated exchange fluxes ........................................................... 77
3.4. Discussion ............................................................................................................................... 79 3.4.1. Simulation of exchange fluxes ....................................................................................... 79 3.4.2. Variability of exchange fluxes ....................................................................................... 80 3.4.3. Potential implications of exchange fluxes for local water chemistry............................. 81
3.5. Summary and Conclusions ...................................................................................................... 83
3.6. References ............................................................................................................................... 85
Chapter 4
The effect of fertilizer best management practices on nitrate leaching in a plastic mulched ridge cultivation system ................................................................................................................................ 89
Abstract ................................................................................................................................................. 89
4.1. Introduction ............................................................................................................................. 90
4.2. Material and Methods .............................................................................................................. 91 4.2.1. Study site ........................................................................................................................ 91 4.2.2. Experimental set up ........................................................................................................ 92 4.2.3. Modeling approach ........................................................................................................ 94
4.3. Results ..................................................................................................................................... 99 4.3.1. Model evaluation and parameter optimization ............................................................... 99 4.3.2. The effect of plastic mulch on nitrate dynamics .......................................................... 103 4.3.3. The effect of plastic mulch on nitrate leaching loss ..................................................... 105 4.3.4. Fertilizer best management practices (FBMPs) ........................................................... 106 4.3.5. Combination of plastic mulching, fertilizer placement and split applications ............. 108
4.4. Discussion ............................................................................................................................. 110

x
4.5. Conclusion ............................................................................................................................. 112
4.6. References ............................................................................................................................. 113
Appendix ............................................................................................................................................ 115
List of other publications .............................................................................................................. 115
Declaration / Erklärung ................................................................................................................ 117
xi
List of figures
Chapter 1
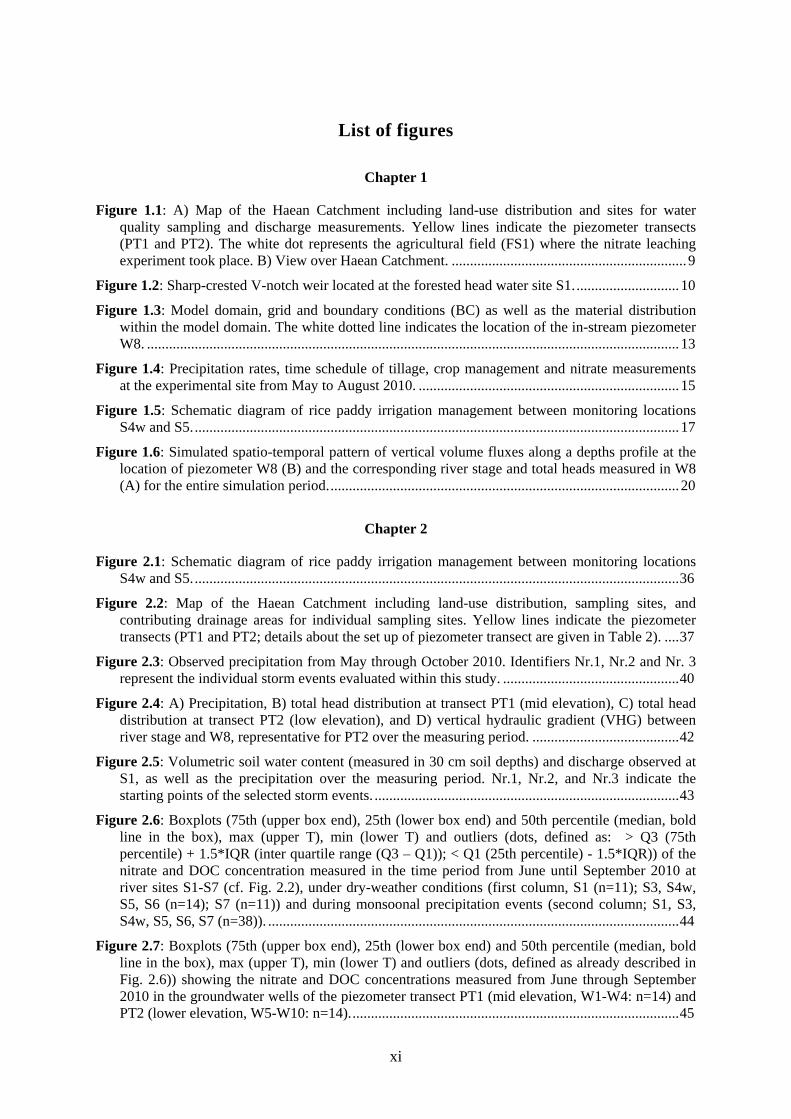
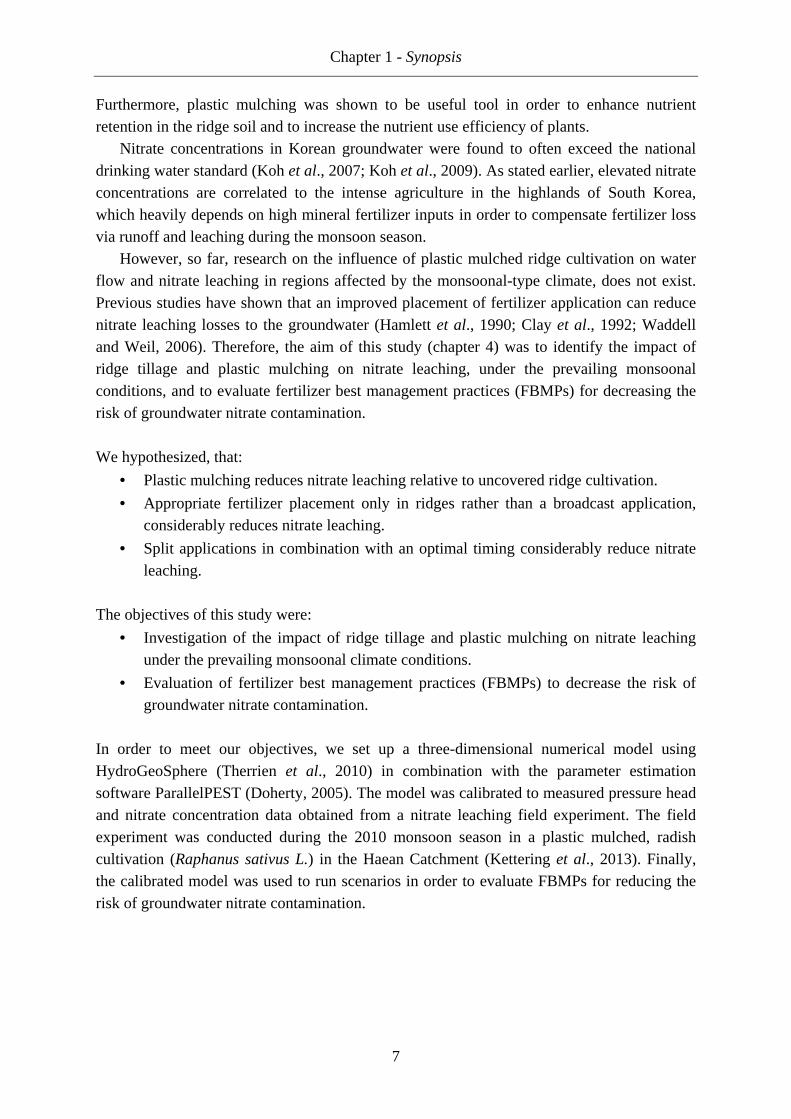
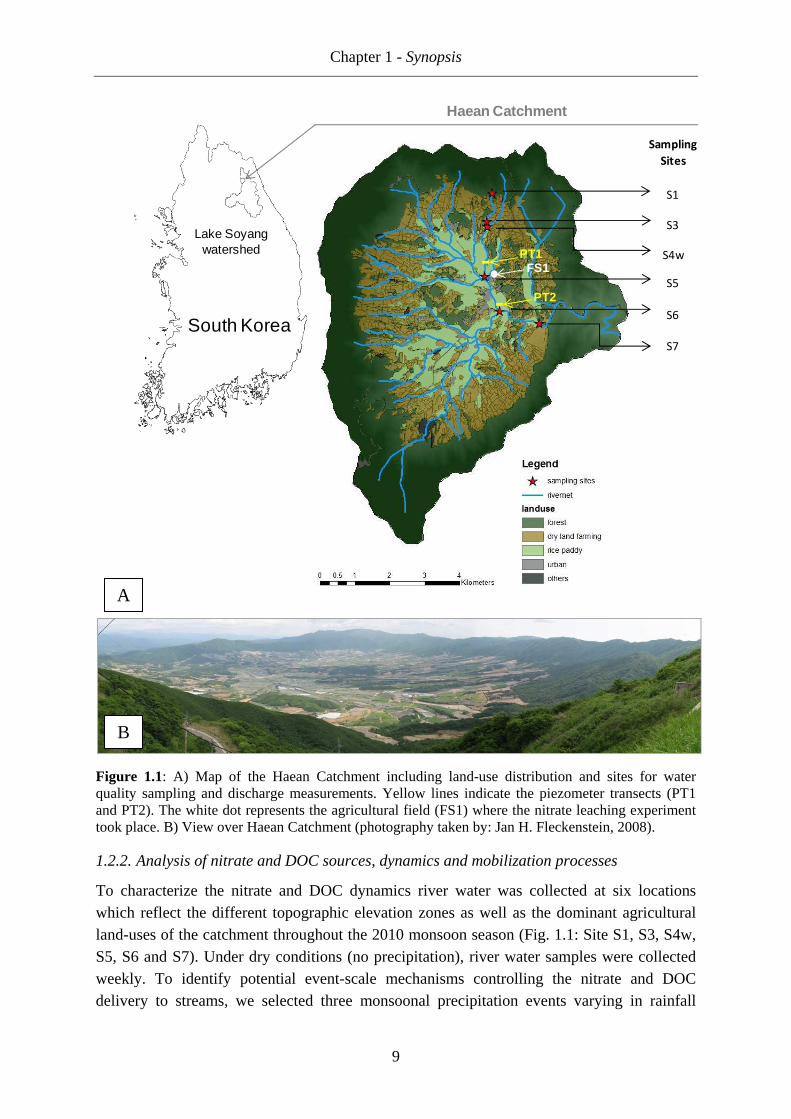
Figure 1.1: A) Map of the Haean Catchment including land-use distribution and sites for water quality sampling and discharge measurements. Yellow lines indicate the piezometer transects (PT1 and PT2). The white dot represents the agricultural field (FS1) where the nitrate leaching experiment took place. B) View over Haean Catchment. ................................................................ 9
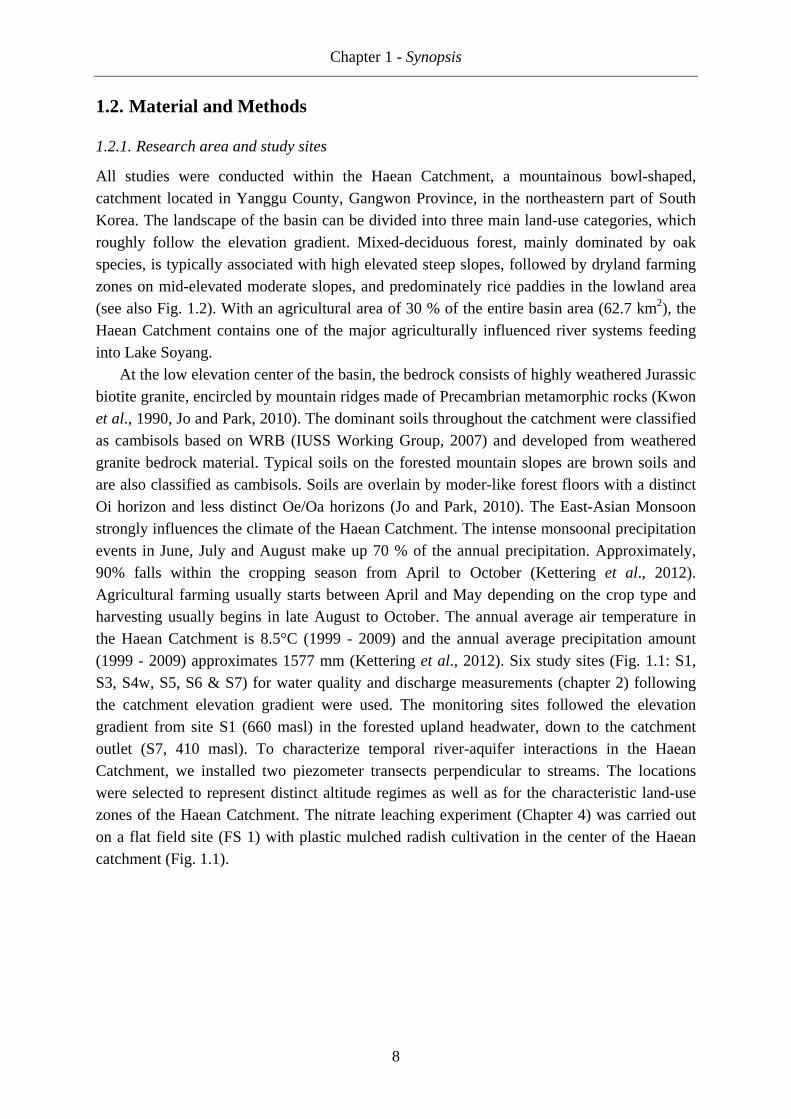
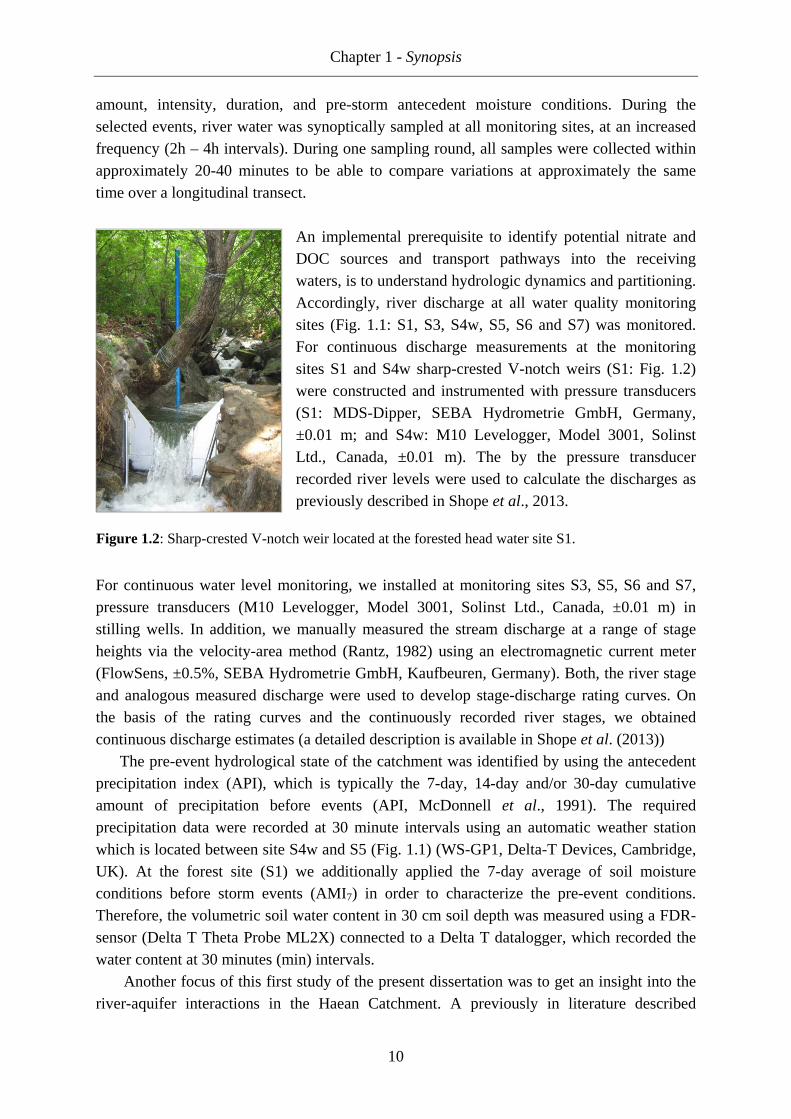
Figure 1.2: Sharp-crested V-notch weir located at the forested head water site S1. ............................ 10
Figure 1.3: Model domain, grid and boundary conditions (BC) as well as the material distribution within the model domain. The white dotted line indicates the location of the in-stream piezometer W8. ................................................................................................................................................. 13
Figure 1.4: Precipitation rates, time schedule of tillage, crop management and nitrate measurements at the experimental site from May to August 2010. ....................................................................... 15
Figure 1.5: Schematic diagram of rice paddy irrigation management between monitoring locations S4w and S5. .................................................................................................................................... 17
Figure 1.6: Simulated spatio-temporal pattern of vertical volume fluxes along a depths profile at the location of piezometer W8 (B) and the corresponding river stage and total heads measured in W8 (A) for the entire simulation period. ............................................................................................... 20
Chapter 2
Figure 2.1: Schematic diagram of rice paddy irrigation management between monitoring locations S4w and S5. .................................................................................................................................... 36
Figure 2.2: Map of the Haean Catchment including land-use distribution, sampling sites, and contributing drainage areas for individual sampling sites. Yellow lines indicate the piezometer transects (PT1 and PT2; details about the set up of piezometer transect are given in Table 2). .... 37
Figure 2.3: Observed precipitation from May through October 2010. Identifiers Nr.1, Nr.2 and Nr. 3 represent the individual storm events evaluated within this study. ................................................ 40
Figure 2.4: A) Precipitation, B) total head distribution at transect PT1 (mid elevation), C) total head distribution at transect PT2 (low elevation), and D) vertical hydraulic gradient (VHG) between river stage and W8, representative for PT2 over the measuring period. ........................................ 42
Figure 2.5: Volumetric soil water content (measured in 30 cm soil depths) and discharge observed at S1, as well as the precipitation over the measuring period. Nr.1, Nr.2, and Nr.3 indicate the starting points of the selected storm events. ................................................................................... 43
Figure 2.6: Boxplots (75th (upper box end), 25th (lower box end) and 50th percentile (median, bold line in the box), max (upper T), min (lower T) and outliers (dots, defined as: > Q3 (75th percentile) + 1.5*IQR (inter quartile range (Q3 – Q1)); < Q1 (25th percentile) - 1.5*IQR)) of the nitrate and DOC concentration measured in the time period from June until September 2010 at river sites S1-S7 (cf. Fig. 2.2), under dry-weather conditions (first column, S1 (n=11); S3, S4w, S5, S6 (n=14); S7 (n=11)) and during monsoonal precipitation events (second column; S1, S3, S4w, S5, S6, S7 (n=38)). ................................................................................................................ 44
Figure 2.7: Boxplots (75th (upper box end), 25th (lower box end) and 50th percentile (median, bold line in the box), max (upper T), min (lower T) and outliers (dots, defined as already described in Fig. 2.6)) showing the nitrate and DOC concentrations measured from June through September 2010 in the groundwater wells of the piezometer transect PT1 (mid elevation, W1-W4: n=14) and PT2 (lower elevation, W5-W10: n=14). ......................................................................................... 45
xii
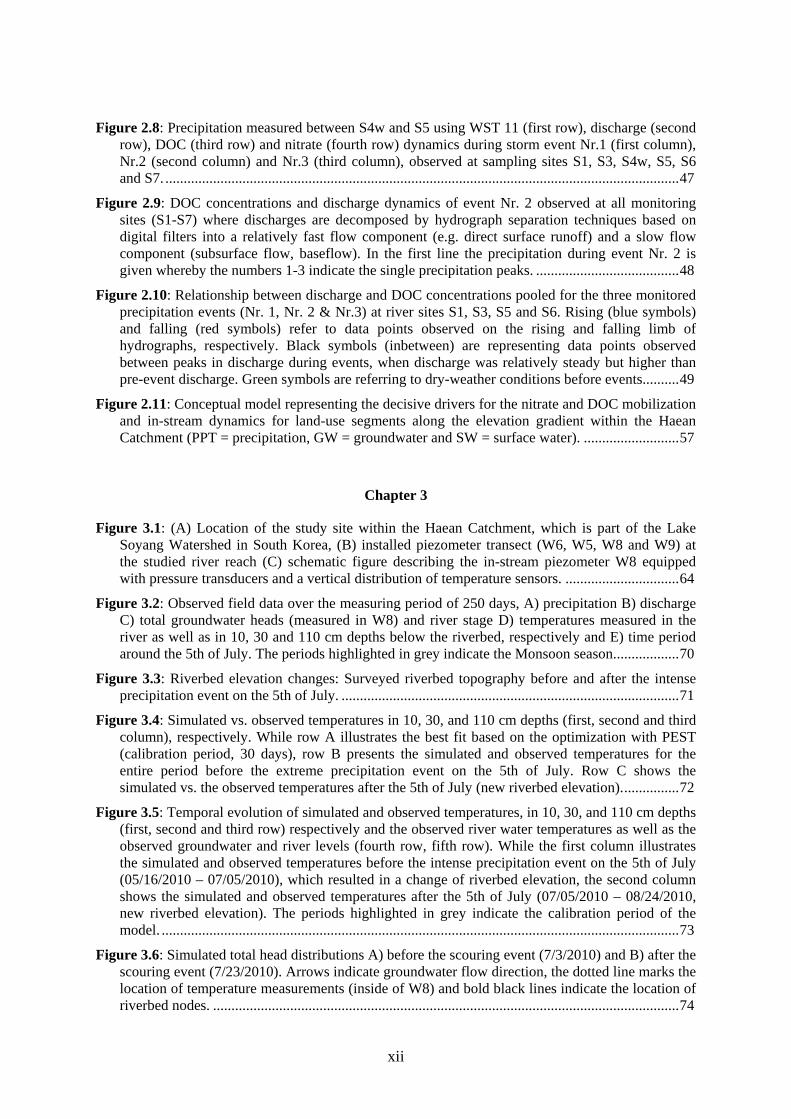
Figure 2.8: Precipitation measured between S4w and S5 using WST 11 (first row), discharge (second row), DOC (third row) and nitrate (fourth row) dynamics during storm event Nr.1 (first column), Nr.2 (second column) and Nr.3 (third column), observed at sampling sites S1, S3, S4w, S5, S6 and S7. ............................................................................................................................................ 47
Figure 2.9: DOC concentrations and discharge dynamics of event Nr. 2 observed at all monitoring sites (S1-S7) where discharges are decomposed by hydrograph separation techniques based on digital filters into a relatively fast flow component (e.g. direct surface runoff) and a slow flow component (subsurface flow, baseflow). In the first line the precipitation during event Nr. 2 is given whereby the numbers 1-3 indicate the single precipitation peaks. ....................................... 48
Figure 2.10: Relationship between discharge and DOC concentrations pooled for the three monitored precipitation events (Nr. 1, Nr. 2 & Nr.3) at river sites S1, S3, S5 and S6. Rising (blue symbols) and falling (red symbols) refer to data points observed on the rising and falling limb of hydrographs, respectively. Black symbols (inbetween) are representing data points observed between peaks in discharge during events, when discharge was relatively steady but higher than pre-event discharge. Green symbols are referring to dry-weather conditions before events.......... 49
Figure 2.11: Conceptual model representing the decisive drivers for the nitrate and DOC mobilization and in-stream dynamics for land-use segments along the elevation gradient within the Haean Catchment (PPT = precipitation, GW = groundwater and SW = surface water). .......................... 57
Chapter 3
Figure 3.1: (A) Location of the study site within the Haean Catchment, which is part of the Lake Soyang Watershed in South Korea, (B) installed piezometer transect (W6, W5, W8 and W9) at the studied river reach (C) schematic figure describing the in-stream piezometer W8 equipped with pressure transducers and a vertical distribution of temperature sensors. ............................... 64
Figure 3.2: Observed field data over the measuring period of 250 days, A) precipitation B) discharge C) total groundwater heads (measured in W8) and river stage D) temperatures measured in the river as well as in 10, 30 and 110 cm depths below the riverbed, respectively and E) time period around the 5th of July. The periods highlighted in grey indicate the Monsoon season. ................. 70
Figure 3.3: Riverbed elevation changes: Surveyed riverbed topography before and after the intense precipitation event on the 5th of July. ............................................................................................ 71
Figure 3.4: Simulated vs. observed temperatures in 10, 30, and 110 cm depths (first, second and third column), respectively. While row A illustrates the best fit based on the optimization with PEST (calibration period, 30 days), row B presents the simulated and observed temperatures for the entire period before the extreme precipitation event on the 5th of July. Row C shows the simulated vs. the observed temperatures after the 5th of July (new riverbed elevation). ............... 72
Figure 3.5: Temporal evolution of simulated and observed temperatures, in 10, 30, and 110 cm depths (first, second and third row) respectively and the observed river water temperatures as well as the observed groundwater and river levels (fourth row, fifth row). While the first column illustrates the simulated and observed temperatures before the intense precipitation event on the 5th of July (05/16/2010 – 07/05/2010), which resulted in a change of riverbed elevation, the second column shows the simulated and observed temperatures after the 5th of July (07/05/2010 – 08/24/2010, new riverbed elevation). The periods highlighted in grey indicate the calibration period of the model. ............................................................................................................................................. 73
Figure 3.6: Simulated total head distributions A) before the scouring event (7/3/2010) and B) after the scouring event (7/23/2010). Arrows indicate groundwater flow direction, the dotted line marks the location of temperature measurements (inside of W8) and bold black lines indicate the location of riverbed nodes. ............................................................................................................................... 74
xiii
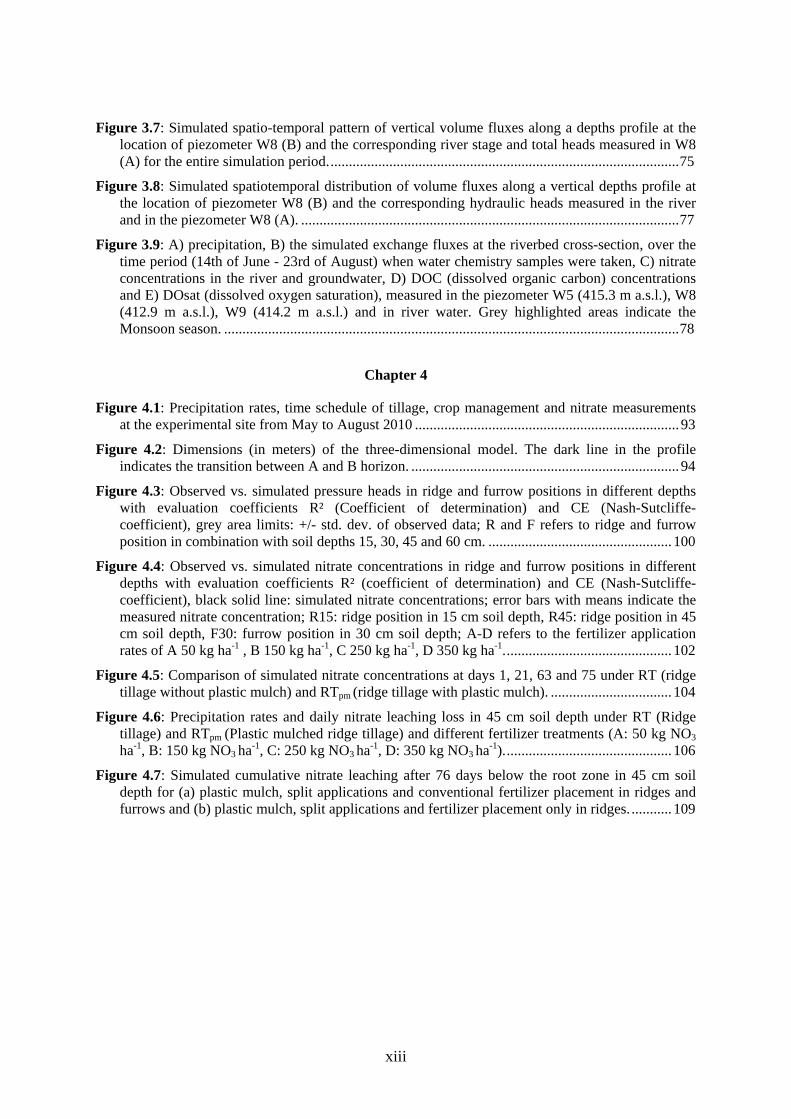
Figure 3.7: Simulated spatio-temporal pattern of vertical volume fluxes along a depths profile at the location of piezometer W8 (B) and the corresponding river stage and total heads measured in W8 (A) for the entire simulation period. ............................................................................................... 75
Figure 3.8: Simulated spatiotemporal distribution of volume fluxes along a vertical depths profile at the location of piezometer W8 (B) and the corresponding hydraulic heads measured in the river and in the piezometer W8 (A). ....................................................................................................... 77
Figure 3.9: A) precipitation, B) the simulated exchange fluxes at the riverbed cross-section, over the time period (14th of June - 23rd of August) when water chemistry samples were taken, C) nitrate concentrations in the river and groundwater, D) DOC (dissolved organic carbon) concentrations and E) DOsat (dissolved oxygen saturation), measured in the piezometer W5 (415.3 m a.s.l.), W8 (412.9 m a.s.l.), W9 (414.2 m a.s.l.) and in river water. Grey highlighted areas indicate the Monsoon season. ............................................................................................................................ 78
Chapter 4
Figure 4.1: Precipitation rates, time schedule of tillage, crop management and nitrate measurements at the experimental site from May to August 2010 ........................................................................ 93
Figure 4.2: Dimensions (in meters) of the three-dimensional model. The dark line in the profile indicates the transition between A and B horizon. ......................................................................... 94
Figure 4.3: Observed vs. simulated pressure heads in ridge and furrow positions in different depths with evaluation coefficients R² (Coefficient of determination) and CE (Nash-Sutcliffe-coefficient), grey area limits: +/- std. dev. of observed data; R and F refers to ridge and furrow position in combination with soil depths 15, 30, 45 and 60 cm. .................................................. 100
Figure 4.4: Observed vs. simulated nitrate concentrations in ridge and furrow positions in different depths with evaluation coefficients R² (coefficient of determination) and CE (Nash-Sutcliffe-coefficient), black solid line: simulated nitrate concentrations; error bars with means indicate the measured nitrate concentration; R15: ridge position in 15 cm soil depth, R45: ridge position in 45 cm soil depth, F30: furrow position in 30 cm soil depth; A-D refers to the fertilizer application rates of A 50 kg ha-1 , B 150 kg ha-1, C 250 kg ha-1, D 350 kg ha-1. ............................................. 102
Figure 4.5: Comparison of simulated nitrate concentrations at days 1, 21, 63 and 75 under RT (ridge tillage without plastic mulch) and RTpm (ridge tillage with plastic mulch). ................................. 104
Figure 4.6: Precipitation rates and daily nitrate leaching loss in 45 cm soil depth under RT (Ridge tillage) and RTpm (Plastic mulched ridge tillage) and different fertilizer treatments (A: 50 kg NO3
ha-1, B: 150 kg NO3 ha-1, C: 250 kg NO3
ha-1, D: 350 kg NO3 ha-1). ............................................. 106
Figure 4.7: Simulated cumulative nitrate leaching after 76 days below the root zone in 45 cm soil depth for (a) plastic mulch, split applications and conventional fertilizer placement in ridges and furrows and (b) plastic mulch, split applications and fertilizer placement only in ridges. ........... 109
xiv
List of tables
Chapter 1
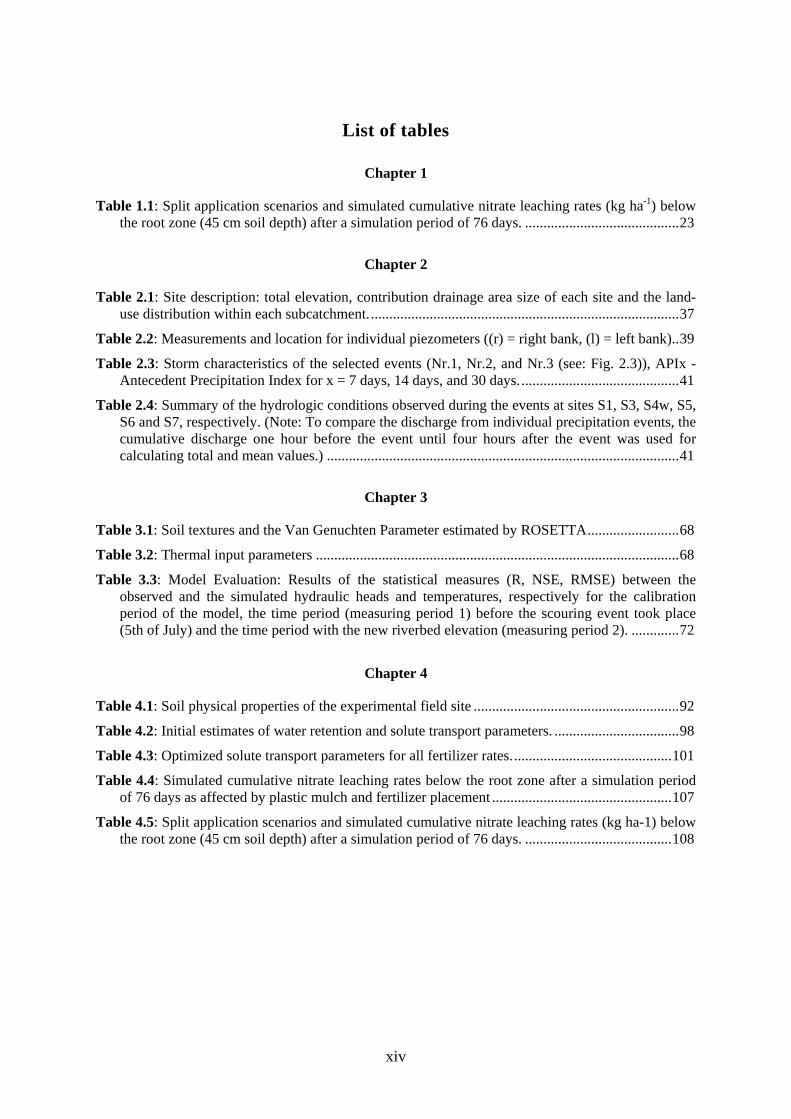
Table 1.1: Split application scenarios and simulated cumulative nitrate leaching rates (kg ha-1) below the root zone (45 cm soil depth) after a simulation period of 76 days. .......................................... 23
Chapter 2
Table 2.1: Site description: total elevation, contribution drainage area size of each site and the land-use distribution within each subcatchment. .................................................................................... 37
Table 2.2: Measurements and location for individual piezometers ((r) = right bank, (l) = left bank) .. 39
Table 2.3: Storm characteristics of the selected events (Nr.1, Nr.2, and Nr.3 (see: Fig. 2.3)), APIx - Antecedent Precipitation Index for x = 7 days, 14 days, and 30 days. ........................................... 41
Table 2.4: Summary of the hydrologic conditions observed during the events at sites S1, S3, S4w, S5, S6 and S7, respectively. (Note: To compare the discharge from individual precipitation events, the cumulative discharge one hour before the event until four hours after the event was used for calculating total and mean values.) ................................................................................................ 41
Chapter 3
Table 3.1: Soil textures and the Van Genuchten Parameter estimated by ROSETTA ......................... 68
Table 3.2: Thermal input parameters ................................................................................................... 68
Table 3.3: Model Evaluation: Results of the statistical measures (R, NSE, RMSE) between the observed and the simulated hydraulic heads and temperatures, respectively for the calibration period of the model, the time period (measuring period 1) before the scouring event took place (5th of July) and the time period with the new riverbed elevation (measuring period 2). ............. 72
Chapter 4
Table 4.1: Soil physical properties of the experimental field site ........................................................ 92
Table 4.2: Initial estimates of water retention and solute transport parameters. .................................. 98
Table 4.3: Optimized solute transport parameters for all fertilizer rates. ........................................... 101
Table 4.4: Simulated cumulative nitrate leaching rates below the root zone after a simulation period of 76 days as affected by plastic mulch and fertilizer placement ................................................. 107
Table 4.5: Split application scenarios and simulated cumulative nitrate leaching rates (kg ha-1) below the root zone (45 cm soil depth) after a simulation period of 76 days. ........................................ 108
xv
List of abbreviations
AMI Antecedent soil moisture index API Antecedent precipitation index masl meter above sea level C Carbon CE Coefficient of Efficiency (also NSE) CF Conventional fertilization in ridges and furrows Corg Organic carbon content DFG Deutsche Forschergemeinschaft DOC Dissolved organic carbon DOsat Dissolved oxygen saturation FAO Food and Agricultural Organization FBMPs Fertilizer best management practices FDR Frequency domain reflectometry FNUE Fertilizer nitrogen use efficiency FP Fertilization placement only in ridges GW Groundwater HGS HydroGeoSpere HTCO method High temperature catalytic oxidation method IGBP International Geosphere-Biosphere Programme IQR Inter quartile range IRTG International Research Training Group IUSS International Union of Soil Sciences KRF Korean Research Foundation N Nitrogen N2O Nitrous oxide NO3 Nitrate NSE Nash sutcliffe efficiency P Phosphorous POC Particulate organic carbon PPT Precipitation PT Piezometer transect Pt Platinum PVC Polyvinyl chloride Q Quartile R Pearson’s correlation coefficient R/F cultivation Ridge and furrow cultivation R2 Coefficient of determination RDA Rural Development Administration of Korea RMSE Root mean square error RP Ridges with plastic

xvi
RT Ridge tillage RTpm Ridge tillage with PE mulch SW Surface water TERRECO Complex Terrain and Ecological Heterogeneity USDA United States Department of Agriculture USGS United States Geological Survey VHG Vertical hydraulic gradient W Well/piezometer WHO World Health Organization of the United Nations WRB World Reference Base for soil resources
xvii
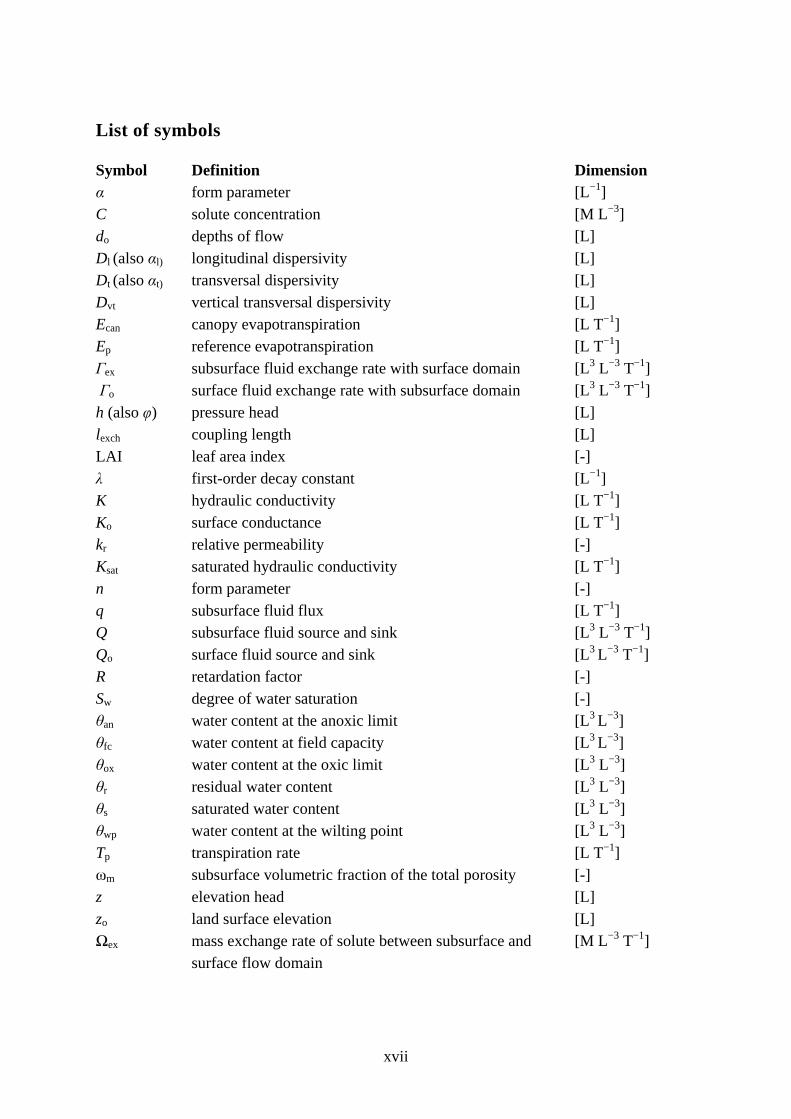
List of symbols
Symbol Definition Dimension α form parameter [L−1] C solute concentration [M L−3] do depths of flow [L] Dl (also αl) longitudinal dispersivity [L] Dt (also αt) transversal dispersivity [L] Dvt vertical transversal dispersivity [L] Ecan canopy evapotranspiration [L T−1] Ep reference evapotranspiration [L T−1] Γex subsurface fluid exchange rate with surface domain [L3 L−3 T−1] Γo surface fluid exchange rate with subsurface domain [L3 L−3 T−1] h (also φ) pressure head [L] lexch coupling length [L] LAI leaf area index [-] λ first-order decay constant [L−1] K hydraulic conductivity [L T−1] Ko surface conductance [L T−1] kr relative permeability [-] Ksat saturated hydraulic conductivity [L T−1] n form parameter [-] q subsurface fluid flux [L T−1] Q subsurface fluid source and sink [L3 L−3 T−1] Qo surface fluid source and sink [L3 L−3 T−1] R retardation factor [-] Sw degree of water saturation [-] θan water content at the anoxic limit [L3 L−3] θfc water content at field capacity [L3 L−3] θox water content at the oxic limit [L3 L−3] θr residual water content [L3 L−3] θs saturated water content [L3 L−3] θwp water content at the wilting point [L3 L−3] Tp transpiration rate [L T−1] ωm subsurface volumetric fraction of the total porosity [-] z elevation head [L] zo land surface elevation [L] Ωex mass exchange rate of solute between subsurface and [M L−3 T−1]
surface flow domain

Chapter 1 - Synopsis
1
Chapter 1 Synopsis
1.
1.1. Introduction
1.1.1. Framework of this dissertation project: TERRECO (Complex Terrain and Ecological
Heterogeneity)
An ecosystem is a dynamic complex of living organisms (i.e. plants, animals, microbes) and the nonliving or abiotic environment (i.e. air, water and mineral soil), interacting as a functional unit (United Nations, 1992). The benefits that people obtain from ecosystems which contribute to human well-being are known as ecosystem services. These benefits include provisioning services which provide goods for direct human use (i.e. food, fresh water, wood and fiber etc.), supporting services (i.e. nutrient- and water cycling, soil formation, primary production etc.), regulating services (i.e. climate-, flood- and water regulations, water purification etc.) and cultural services (i.e. aesthetic, spiritual, education, recreation etc.), (Millennium Ecosystem Assessment, 2005).
Over the past 50 years humans have changed natural ecosystems more rapidly and extensively than ever before (Millennium Ecosystem Assessment, 2005). The reason for these drastic changes in ecosystems by humans is the progressive desire for fresh water, food, fiber and timber to satisfy a rapidly growing global population (Millennium Ecosystem Assessment, 2005). While, changes of natural ecosystems have contributed to considerable net gains in human well-being and economic development, they have also caused the degradation of many ecosystem services (Millennium Ecosystem Assessment, 2005). For instance, a widespread conversion of natural ecosystems to agricultural land, significantly improved the global food supply but in turn caused inadvertent, harmful impacts on the environment (i.e. eutrophication of surface waters, soil degradation, groundwater contamination) and on ecosystem services such as fresh water supply (Tilman et al., 2002).
Complex mountainous regions play a crucial role in the supply of freshwater to the world’s population (i.e. Mountain Agenda, 1998; Viviroli et al 2007). Approximately 20 % of the Earth’s terrestrial surface is represented by mountainous landscapes (IGBP 1997) and most major river systems have their sources in these regions. More than half of the world population depends on freshwater for drinking, livestock, irrigation and hydropower from these mountainous regions (Mountain Agenda, 1998). However, mountains are highly fragile ecosystems and under pressure from deforestation, agriculture and tourism (Liniger and Weingartner, 1998). The land-use change in the highlands from the conversion of natural forests to agriculture, not only compromises the availability and quality of water in the highlands (increased surface runoff, soil erosion, pollution of rivers and groundwater etc.) furthermore, the availability of downstream resources is at high risk (Liniger and Weingartner, 1998). Thus, an effective sustainable management of mountainous regions is
Chapter 1 - Synopsis
2
essential to ensure the availability of resources, services and goods to maintain human well-being (Liniger and Weingartner, 1998).
The international consortium project TERRECO (Complex Terr ain and Ecological Heterogeneity), in which this doctoral thesis was embedded in, aims to i) understand the different ecosystem functions of complex terrain, ii) utilize the gained information to quantitatively describe the derived ecosystem services and iii) predict shifts in ecosystem services due to future changes in land-use, climate change and the social response to global change. Finally, the goal of TERRECO is to provide sustainable management principles to ensure ecosystem services from complex landscapes to maintain human well-being. TERRECO utilizes a transdisciplinary approach, in which researcher of different scientific fields such as hydrology, soil physics, plant ecology, economics and social science work together in an integrative research framework. While TERRECO Phase I projects were grouped into work packages (WP 1: Land surface exchange; WP 2: Soils, transport and hydrology; WP 3: Biological processes; WP 4: Socio economics), the present dissertation is part of the second work package (WP 2) which focuses on quantifying key processes that regulate the water quality.
1.1.2. Background, research objectives and state of knowledge
The main goal of this dissertation study is to identify nitrate and dissolved organic carbon (DOC) mobilization processes and dynamics in a monsoonal affected, complex mountainous catchment under intensive land-use in South Korea.
In recent years, the interest in understanding processes that control the nitrate and DOC delivery to surface waters has steadily grown. Elevated nitrate concentrations in surface waters can cause phytoplankton growth and algal blooms, which in turn reduces the dissolved oxygen content of surface waters leading to eutrophication (i.e. Goolsby et al., 2001; Howarth and Marino, 2006). The primary nitrate input into surface waters originates from agricultural catchment nonpoint source fertilizer run-off (i.e. Howarth and Marino, 2006).
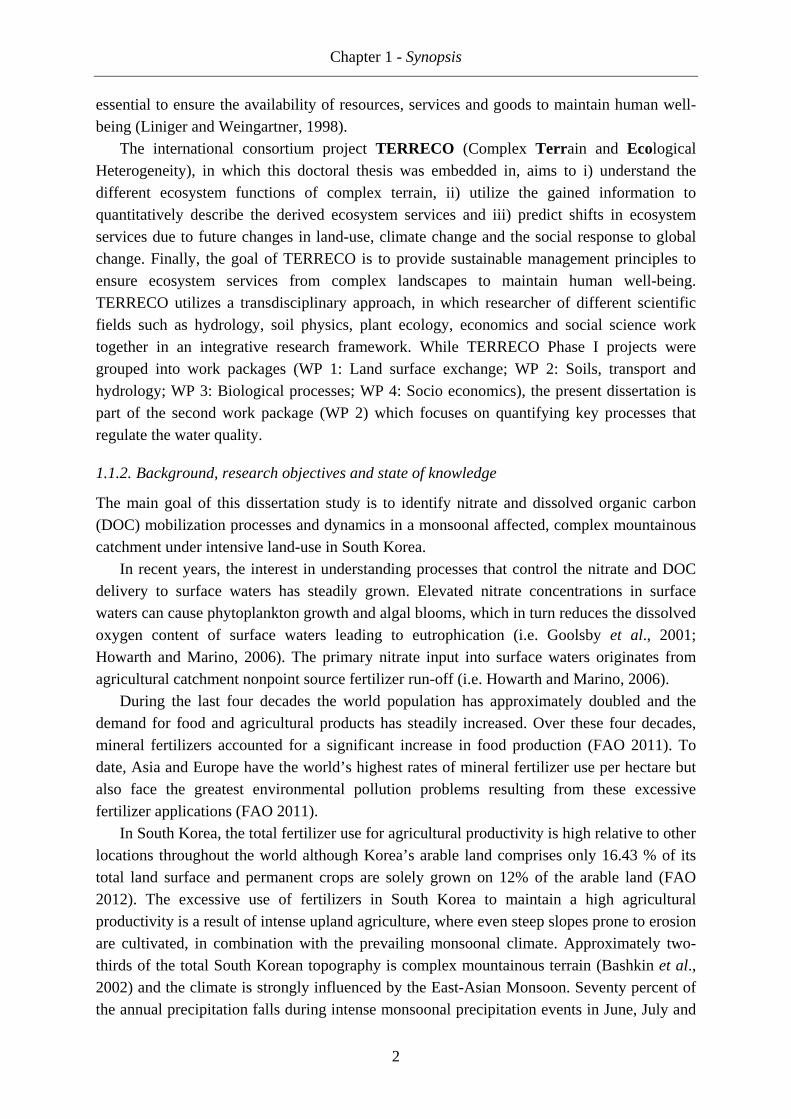
During the last four decades the world population has approximately doubled and the demand for food and agricultural products has steadily increased. Over these four decades, mineral fertilizers accounted for a significant increase in food production (FAO 2011). To date, Asia and Europe have the world’s highest rates of mineral fertilizer use per hectare but also face the greatest environmental pollution problems resulting from these excessive fertilizer applications (FAO 2011).
In South Korea, the total fertilizer use for agricultural productivity is high relative to other locations throughout the world although Korea’s arable land comprises only 16.43 % of its total land surface and permanent crops are solely grown on 12% of the arable land (FAO 2012). The excessive use of fertilizers in South Korea to maintain a high agricultural productivity is a result of intense upland agriculture, where even steep slopes prone to erosion are cultivated, in combination with the prevailing monsoonal climate. Approximately two-thirds of the total South Korean topography is complex mountainous terrain (Bashkin et al., 2002) and the climate is strongly influenced by the East-Asian Monsoon. Seventy percent of the annual precipitation falls during intense monsoonal precipitation events in June, July and
Chapter 1 - Synopsis
3
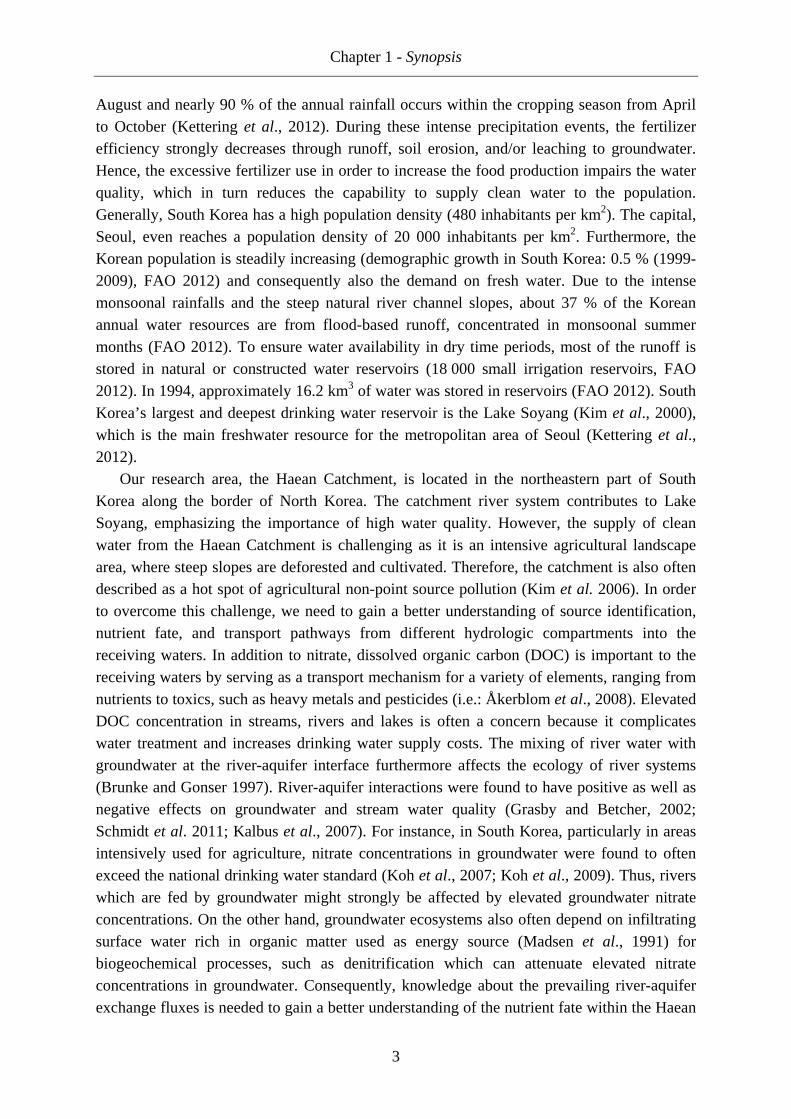
August and nearly 90 % of the annual rainfall occurs within the cropping season from April to October (Kettering et al., 2012). During these intense precipitation events, the fertilizer efficiency strongly decreases through runoff, soil erosion, and/or leaching to groundwater. Hence, the excessive fertilizer use in order to increase the food production impairs the water quality, which in turn reduces the capability to supply clean water to the population. Generally, South Korea has a high population density (480 inhabitants per km2). The capital, Seoul, even reaches a population density of 20 000 inhabitants per km2. Furthermore, the Korean population is steadily increasing (demographic growth in South Korea: 0.5 % (1999-2009), FAO 2012) and consequently also the demand on fresh water. Due to the intense monsoonal rainfalls and the steep natural river channel slopes, about 37 % of the Korean annual water resources are from flood-based runoff, concentrated in monsoonal summer months (FAO 2012). To ensure water availability in dry time periods, most of the runoff is stored in natural or constructed water reservoirs (18 000 small irrigation reservoirs, FAO 2012). In 1994, approximately 16.2 km3 of water was stored in reservoirs (FAO 2012). South Korea’s largest and deepest drinking water reservoir is the Lake Soyang (Kim et al., 2000), which is the main freshwater resource for the metropolitan area of Seoul (Kettering et al., 2012).
Our research area, the Haean Catchment, is located in the northeastern part of South Korea along the border of North Korea. The catchment river system contributes to Lake Soyang, emphasizing the importance of high water quality. However, the supply of clean water from the Haean Catchment is challenging as it is an intensive agricultural landscape area, where steep slopes are deforested and cultivated. Therefore, the catchment is also often described as a hot spot of agricultural non-point source pollution (Kim et al. 2006). In order to overcome this challenge, we need to gain a better understanding of source identification, nutrient fate, and transport pathways from different hydrologic compartments into the receiving waters. In addition to nitrate, dissolved organic carbon (DOC) is important to the receiving waters by serving as a transport mechanism for a variety of elements, ranging from nutrients to toxics, such as heavy metals and pesticides (i.e.: Åkerblom et al., 2008). Elevated DOC concentration in streams, rivers and lakes is often a concern because it complicates water treatment and increases drinking water supply costs. The mixing of river water with groundwater at the river-aquifer interface furthermore affects the ecology of river systems (Brunke and Gonser 1997). River-aquifer interactions were found to have positive as well as negative effects on groundwater and stream water quality (Grasby and Betcher, 2002; Schmidt et al. 2011; Kalbus et al., 2007). For instance, in South Korea, particularly in areas intensively used for agriculture, nitrate concentrations in groundwater were found to often exceed the national drinking water standard (Koh et al., 2007; Koh et al., 2009). Thus, rivers which are fed by groundwater might strongly be affected by elevated groundwater nitrate concentrations. On the other hand, groundwater ecosystems also often depend on infiltrating surface water rich in organic matter used as energy source (Madsen et al., 1991) for biogeochemical processes, such as denitrification which can attenuate elevated nitrate concentrations in groundwater. Consequently, knowledge about the prevailing river-aquifer exchange fluxes is needed to gain a better understanding of the nutrient fate within the Haean
Chapter 1 - Synopsis
4
Catchment. In order to deal with the elevated groundwater nitrate concentrations which were often observed in South Korea (Koh et al., 2007; Koh et al., 2009) it is important to assess and evaluate the risk of nitrate leaching from agricultural fields into the groundwater as well as to develop strategies to minimize this risk of groundwater nitrate contamination.
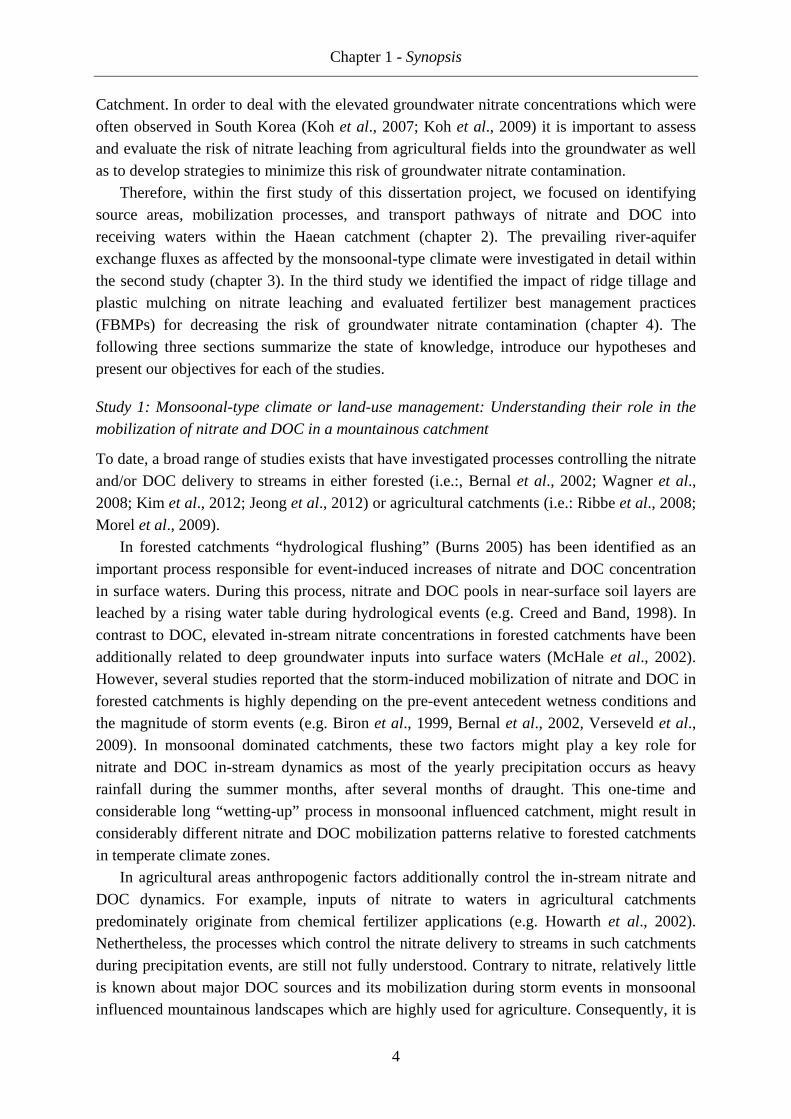
Therefore, within the first study of this dissertation project, we focused on identifying source areas, mobilization processes, and transport pathways of nitrate and DOC into receiving waters within the Haean catchment (chapter 2). The prevailing river-aquifer exchange fluxes as affected by the monsoonal-type climate were investigated in detail within the second study (chapter 3). In the third study we identified the impact of ridge tillage and plastic mulching on nitrate leaching and evaluated fertilizer best management practices (FBMPs) for decreasing the risk of groundwater nitrate contamination (chapter 4). The following three sections summarize the state of knowledge, introduce our hypotheses and present our objectives for each of the studies.
Study 1: Monsoonal-type climate or land-use management: Understanding their role in the
mobilization of nitrate and DOC in a mountainous catchment
To date, a broad range of studies exists that have investigated processes controlling the nitrate and/or DOC delivery to streams in either forested (i.e.:, Bernal et al., 2002; Wagner et al., 2008; Kim et al., 2012; Jeong et al., 2012) or agricultural catchments (i.e.: Ribbe et al., 2008; Morel et al., 2009).
In forested catchments “hydrological flushing” (Burns 2005) has been identified as an important process responsible for event-induced increases of nitrate and DOC concentration in surface waters. During this process, nitrate and DOC pools in near-surface soil layers are leached by a rising water table during hydrological events (e.g. Creed and Band, 1998). In contrast to DOC, elevated in-stream nitrate concentrations in forested catchments have been additionally related to deep groundwater inputs into surface waters (McHale et al., 2002). However, several studies reported that the storm-induced mobilization of nitrate and DOC in forested catchments is highly depending on the pre-event antecedent wetness conditions and the magnitude of storm events (e.g. Biron et al., 1999, Bernal et al., 2002, Verseveld et al., 2009). In monsoonal dominated catchments, these two factors might play a key role for nitrate and DOC in-stream dynamics as most of the yearly precipitation occurs as heavy rainfall during the summer months, after several months of draught. This one-time and considerable long “wetting-up” process in monsoonal influenced catchment, might result in considerably different nitrate and DOC mobilization patterns relative to forested catchments in temperate climate zones.
In agricultural areas anthropogenic factors additionally control the in-stream nitrate and DOC dynamics. For example, inputs of nitrate to waters in agricultural catchments predominately originate from chemical fertilizer applications (e.g. Howarth et al., 2002). Nethertheless, the processes which control the nitrate delivery to streams in such catchments during precipitation events, are still not fully understood. Contrary to nitrate, relatively little is known about major DOC sources and its mobilization during storm events in monsoonal influenced mountainous landscapes which are highly used for agriculture. Consequently, it is
Chapter 1 - Synopsis
5
important to determine whether comparable sources and transport mechanisms are evident as described for the forested catchments. Furthermore, we need to identify the decisive factors (land-use activities or monsoonal-type climate) controlling the DOC and nitrate dynamics in such river systems.
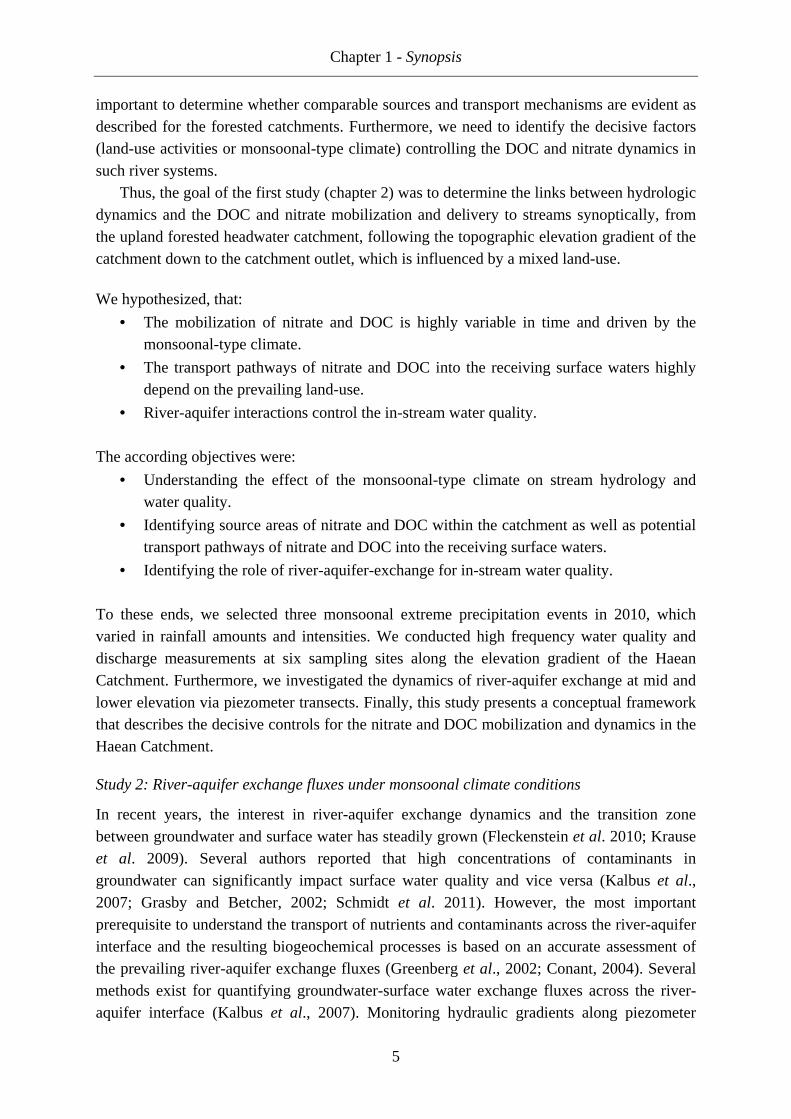
Thus, the goal of the first study (chapter 2) was to determine the links between hydrologic dynamics and the DOC and nitrate mobilization and delivery to streams synoptically, from the upland forested headwater catchment, following the topographic elevation gradient of the catchment down to the catchment outlet, which is influenced by a mixed land-use. We hypothesized, that:
• The mobilization of nitrate and DOC is highly variable in time and driven by the monsoonal-type climate.
• The transport pathways of nitrate and DOC into the receiving surface waters highly depend on the prevailing land-use.
• River-aquifer interactions control the in-stream water quality. The according objectives were:
• Understanding the effect of the monsoonal-type climate on stream hydrology and water quality.
• Identifying source areas of nitrate and DOC within the catchment as well as potential transport pathways of nitrate and DOC into the receiving surface waters.
• Identifying the role of river-aquifer-exchange for in-stream water quality. To these ends, we selected three monsoonal extreme precipitation events in 2010, which varied in rainfall amounts and intensities. We conducted high frequency water quality and discharge measurements at six sampling sites along the elevation gradient of the Haean Catchment. Furthermore, we investigated the dynamics of river-aquifer exchange at mid and lower elevation via piezometer transects. Finally, this study presents a conceptual framework that describes the decisive controls for the nitrate and DOC mobilization and dynamics in the Haean Catchment.
Study 2: River-aquifer exchange fluxes under monsoonal climate conditions
In recent years, the interest in river-aquifer exchange dynamics and the transition zone between groundwater and surface water has steadily grown (Fleckenstein et al. 2010; Krause et al. 2009). Several authors reported that high concentrations of contaminants in groundwater can significantly impact surface water quality and vice versa (Kalbus et al., 2007; Grasby and Betcher, 2002; Schmidt et al. 2011). However, the most important prerequisite to understand the transport of nutrients and contaminants across the river-aquifer interface and the resulting biogeochemical processes is based on an accurate assessment of the prevailing river-aquifer exchange fluxes (Greenberg et al., 2002; Conant, 2004). Several methods exist for quantifying groundwater-surface water exchange fluxes across the river-aquifer interface (Kalbus et al., 2007). Monitoring hydraulic gradients along piezometer
Chapter 1 - Synopsis
6
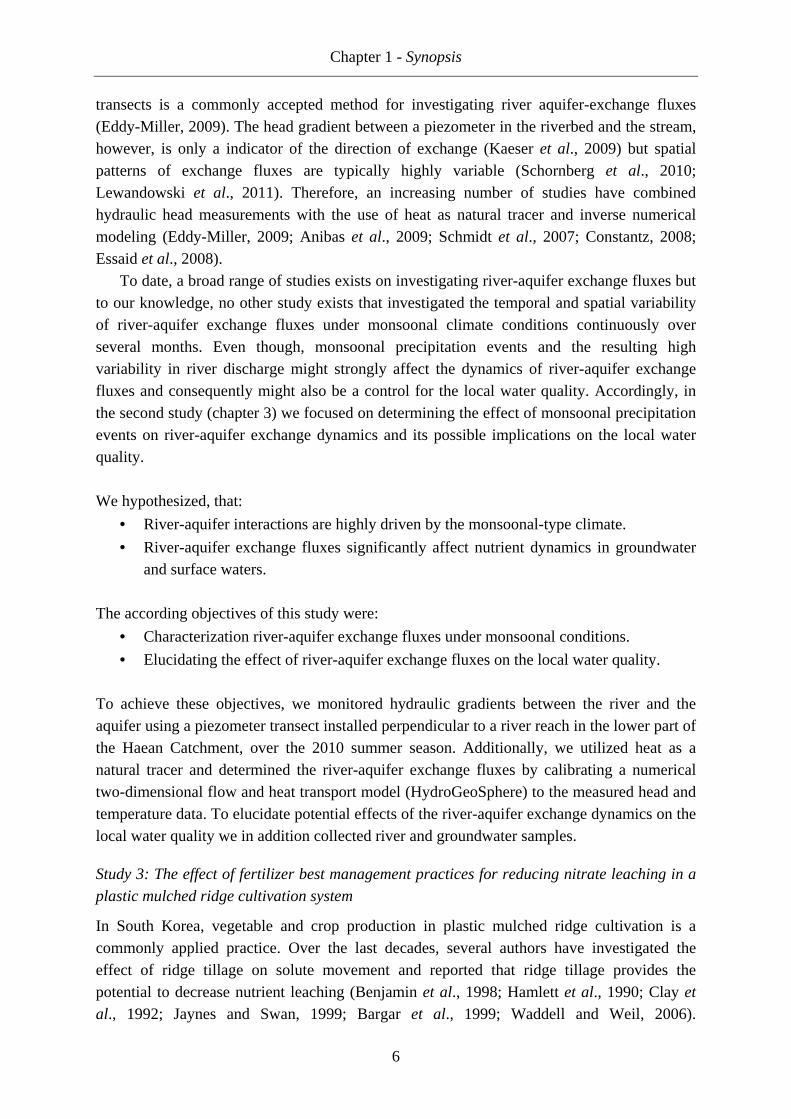
transects is a commonly accepted method for investigating river aquifer-exchange fluxes (Eddy-Miller, 2009). The head gradient between a piezometer in the riverbed and the stream, however, is only a indicator of the direction of exchange (Kaeser et al., 2009) but spatial patterns of exchange fluxes are typically highly variable (Schornberg et al., 2010; Lewandowski et al., 2011). Therefore, an increasing number of studies have combined hydraulic head measurements with the use of heat as natural tracer and inverse numerical modeling (Eddy-Miller, 2009; Anibas et al., 2009; Schmidt et al., 2007; Constantz, 2008; Essaid et al., 2008).
To date, a broad range of studies exists on investigating river-aquifer exchange fluxes but to our knowledge, no other study exists that investigated the temporal and spatial variability of river-aquifer exchange fluxes under monsoonal climate conditions continuously over several months. Even though, monsoonal precipitation events and the resulting high variability in river discharge might strongly affect the dynamics of river-aquifer exchange fluxes and consequently might also be a control for the local water quality. Accordingly, in the second study (chapter 3) we focused on determining the effect of monsoonal precipitation events on river-aquifer exchange dynamics and its possible implications on the local water quality. We hypothesized, that:
• River-aquifer interactions are highly driven by the monsoonal-type climate.
• River-aquifer exchange fluxes significantly affect nutrient dynamics in groundwater and surface waters.
The according objectives of this study were:
• Characterization river-aquifer exchange fluxes under monsoonal conditions.
• Elucidating the effect of river-aquifer exchange fluxes on the local water quality. To achieve these objectives, we monitored hydraulic gradients between the river and the aquifer using a piezometer transect installed perpendicular to a river reach in the lower part of the Haean Catchment, over the 2010 summer season. Additionally, we utilized heat as a natural tracer and determined the river-aquifer exchange fluxes by calibrating a numerical two-dimensional flow and heat transport model (HydroGeoSphere) to the measured head and temperature data. To elucidate potential effects of the river-aquifer exchange dynamics on the local water quality we in addition collected river and groundwater samples.
Study 3: The effect of fertilizer best management practices for reducing nitrate leaching in a
plastic mulched ridge cultivation system
In South Korea, vegetable and crop production in plastic mulched ridge cultivation is a commonly applied practice. Over the last decades, several authors have investigated the effect of ridge tillage on solute movement and reported that ridge tillage provides the potential to decrease nutrient leaching (Benjamin et al., 1998; Hamlett et al., 1990; Clay et al., 1992; Jaynes and Swan, 1999; Bargar et al., 1999; Waddell and Weil, 2006).
Chapter 1 - Synopsis
7
Furthermore, plastic mulching was shown to be useful tool in order to enhance nutrient retention in the ridge soil and to increase the nutrient use efficiency of plants.
Nitrate concentrations in Korean groundwater were found to often exceed the national drinking water standard (Koh et al., 2007; Koh et al., 2009). As stated earlier, elevated nitrate concentrations are correlated to the intense agriculture in the highlands of South Korea, which heavily depends on high mineral fertilizer inputs in order to compensate fertilizer loss via runoff and leaching during the monsoon season.
However, so far, research on the influence of plastic mulched ridge cultivation on water flow and nitrate leaching in regions affected by the monsoonal-type climate, does not exist. Previous studies have shown that an improved placement of fertilizer application can reduce nitrate leaching losses to the groundwater (Hamlett et al., 1990; Clay et al., 1992; Waddell and Weil, 2006). Therefore, the aim of this study (chapter 4) was to identify the impact of ridge tillage and plastic mulching on nitrate leaching, under the prevailing monsoonal conditions, and to evaluate fertilizer best management practices (FBMPs) for decreasing the risk of groundwater nitrate contamination. We hypothesized, that:
• Plastic mulching reduces nitrate leaching relative to uncovered ridge cultivation.
• Appropriate fertilizer placement only in ridges rather than a broadcast application, considerably reduces nitrate leaching.
• Split applications in combination with an optimal timing considerably reduce nitrate leaching.
The objectives of this study were:
• Investigation of the impact of ridge tillage and plastic mulching on nitrate leaching under the prevailing monsoonal climate conditions.
• Evaluation of fertilizer best management practices (FBMPs) to decrease the risk of groundwater nitrate contamination.
In order to meet our objectives, we set up a three-dimensional numerical model using HydroGeoSphere (Therrien et al., 2010) in combination with the parameter estimation software ParallelPEST (Doherty, 2005). The model was calibrated to measured pressure head and nitrate concentration data obtained from a nitrate leaching field experiment. The field experiment was conducted during the 2010 monsoon season in a plastic mulched, radish cultivation (Raphanus sativus L.) in the Haean Catchment (Kettering et al., 2013). Finally, the calibrated model was used to run scenarios in order to evaluate FBMPs for reducing the risk of groundwater nitrate contamination.
Chapter 1 - Synopsis
8
1.2. Material and Methods
1.2.1. Research area and study sites
All studies were conducted within the Haean Catchment, a mountainous bowl-shaped, catchment located in Yanggu County, Gangwon Province, in the northeastern part of South Korea. The landscape of the basin can be divided into three main land-use categories, which roughly follow the elevation gradient. Mixed-deciduous forest, mainly dominated by oak species, is typically associated with high elevated steep slopes, followed by dryland farming zones on mid-elevated moderate slopes, and predominately rice paddies in the lowland area (see also Fig. 1.2). With an agricultural area of 30 % of the entire basin area (62.7 km2), the Haean Catchment contains one of the major agriculturally influenced river systems feeding into Lake Soyang.
At the low elevation center of the basin, the bedrock consists of highly weathered Jurassic biotite granite, encircled by mountain ridges made of Precambrian metamorphic rocks (Kwon et al., 1990, Jo and Park, 2010). The dominant soils throughout the catchment were classified as cambisols based on WRB (IUSS Working Group, 2007) and developed from weathered granite bedrock material. Typical soils on the forested mountain slopes are brown soils and are also classified as cambisols. Soils are overlain by moder-like forest floors with a distinct Oi horizon and less distinct Oe/Oa horizons (Jo and Park, 2010). The East-Asian Monsoon strongly influences the climate of the Haean Catchment. The intense monsoonal precipitation events in June, July and August make up 70 % of the annual precipitation. Approximately, 90% falls within the cropping season from April to October (Kettering et al., 2012). Agricultural farming usually starts between April and May depending on the crop type and harvesting usually begins in late August to October. The annual average air temperature in the Haean Catchment is 8.5°C (1999 - 2009) and the annual average precipitation amount (1999 - 2009) approximates 1577 mm (Kettering et al., 2012). Six study sites (Fig. 1.1: S1, S3, S4w, S5, S6 & S7) for water quality and discharge measurements (chapter 2) following the catchment elevation gradient were used. The monitoring sites followed the elevation gradient from site S1 (660 masl) in the forested upland headwater, down to the catchment outlet (S7, 410 masl). To characterize temporal river-aquifer interactions in the Haean Catchment, we installed two piezometer transects perpendicular to streams. The locations were selected to represent distinct altitude regimes as well as for the characteristic land-use zones of the Haean Catchment. The nitrate leaching experiment (Chapter 4) was carried out on a flat field site (FS 1) with plastic mulched radish cultivation in the center of the Haean catchment (Fig. 1.1).
Chapter 1 - Synopsis
9
Figure 1.1: A) Map of the Haean Catchment including land-use distribution and sites for water quality sampling and discharge measurements. Yellow lines indicate the piezometer transects (PT1 and PT2). The white dot represents the agricultural field (FS1) where the nitrate leaching experiment took place. B) View over Haean Catchment (photography taken by: Jan H. Fleckenstein, 2008).
1.2.2. Analysis of nitrate and DOC sources, dynamics and mobilization processes
To characterize the nitrate and DOC dynamics river water was collected at six locations which reflect the different topographic elevation zones as well as the dominant agricultural land-uses of the catchment throughout the 2010 monsoon season (Fig. 1.1: Site S1, S3, S4w, S5, S6 and S7). Under dry conditions (no precipitation), river water samples were collected weekly. To identify potential event-scale mechanisms controlling the nitrate and DOC delivery to streams, we selected three monsoonal precipitation events varying in rainfall
South Korea
Lake Soyang watershed
Haean Catchment
Sampling
Sites
S1
S3
S4w
S5
S6
S7
FS1
PT2
PT1
A
B
Chapter 1 - Synopsis
10
amount, intensity, duration, and pre-storm antecedent moisture conditions. During the selected events, river water was synoptically sampled at all monitoring sites, at an increased frequency (2h – 4h intervals). During one sampling round, all samples were collected within approximately 20-40 minutes to be able to compare variations at approximately the same time over a longitudinal transect.
An implemental prerequisite to identify potential nitrate and DOC sources and transport pathways into the receiving waters, is to understand hydrologic dynamics and partitioning. Accordingly, river discharge at all water quality monitoring sites (Fig. 1.1: S1, S3, S4w, S5, S6 and S7) was monitored. For continuous discharge measurements at the monitoring sites S1 and S4w sharp-crested V-notch weirs (S1: Fig. 1.2) were constructed and instrumented with pressure transducers (S1: MDS-Dipper, SEBA Hydrometrie GmbH, Germany, ±0.01 m; and S4w: M10 Levelogger, Model 3001, Solinst Ltd., Canada, ±0.01 m). The by the pressure transducer recorded river levels were used to calculate the discharges as previously described in Shope et al., 2013.
For continuous water level monitoring, we installed at monitoring sites S3, S5, S6 and S7, pressure transducers (M10 Levelogger, Model 3001, Solinst Ltd., Canada, ±0.01 m) in stilling wells. In addition, we manually measured the stream discharge at a range of stage heights via the velocity-area method (Rantz, 1982) using an electromagnetic current meter (FlowSens, ±0.5%, SEBA Hydrometrie GmbH, Kaufbeuren, Germany). Both, the river stage and analogous measured discharge were used to develop stage-discharge rating curves. On the basis of the rating curves and the continuously recorded river stages, we obtained continuous discharge estimates (a detailed description is available in Shope et al. (2013))
The pre-event hydrological state of the catchment was identified by using the antecedent precipitation index (API), which is typically the 7-day, 14-day and/or 30-day cumulative amount of precipitation before events (API, McDonnell et al., 1991). The required precipitation data were recorded at 30 minute intervals using an automatic weather station which is located between site S4w and S5 (Fig. 1.1) (WS-GP1, Delta-T Devices, Cambridge, UK). At the forest site (S1) we additionally applied the 7-day average of soil moisture conditions before storm events (AMI7) in order to characterize the pre-event conditions. Therefore, the volumetric soil water content in 30 cm soil depth was measured using a FDR-sensor (Delta T Theta Probe ML2X) connected to a Delta T datalogger, which recorded the water content at 30 minutes (min) intervals.
Another focus of this first study of the present dissertation was to get an insight into the river-aquifer interactions in the Haean Catchment. A previously in literature described
Figure 1.2: Sharp-crested V-notch weir located at the forested head water site S1.
Chapter 1 - Synopsis
11
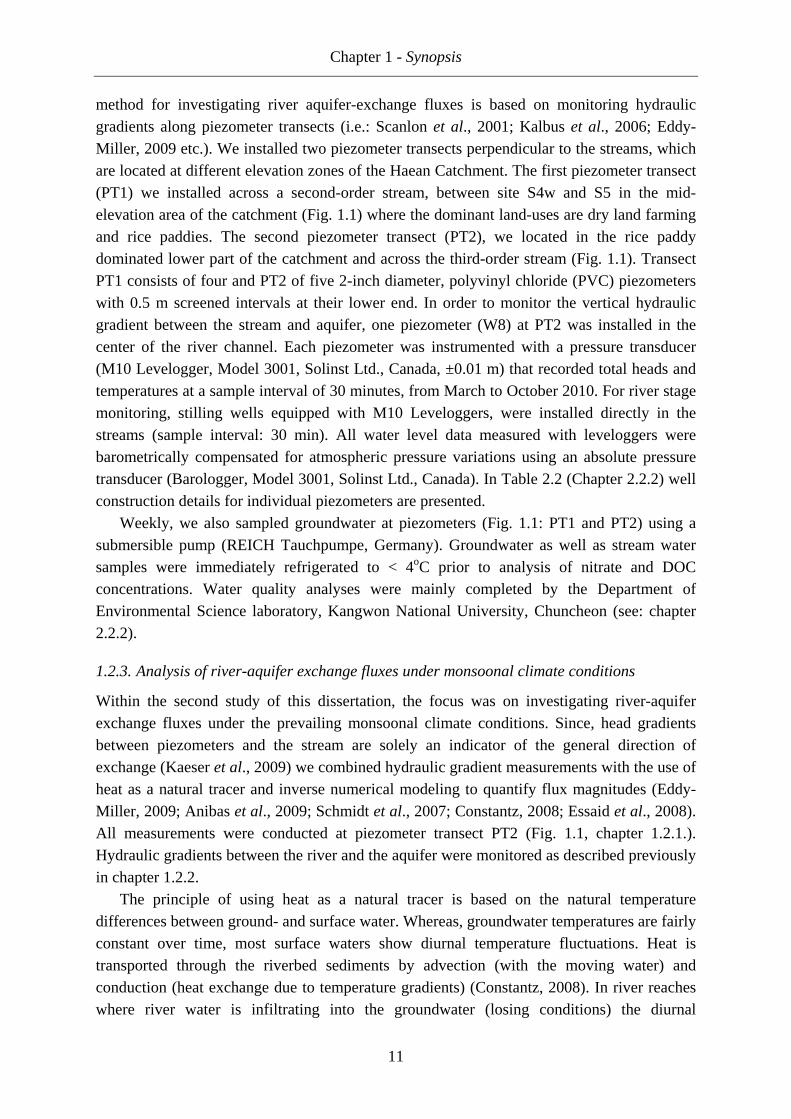
method for investigating river aquifer-exchange fluxes is based on monitoring hydraulic gradients along piezometer transects (i.e.: Scanlon et al., 2001; Kalbus et al., 2006; Eddy-Miller, 2009 etc.). We installed two piezometer transects perpendicular to the streams, which are located at different elevation zones of the Haean Catchment. The first piezometer transect (PT1) we installed across a second-order stream, between site S4w and S5 in the mid-elevation area of the catchment (Fig. 1.1) where the dominant land-uses are dry land farming and rice paddies. The second piezometer transect (PT2), we located in the rice paddy dominated lower part of the catchment and across the third-order stream (Fig. 1.1). Transect PT1 consists of four and PT2 of five 2-inch diameter, polyvinyl chloride (PVC) piezometers with 0.5 m screened intervals at their lower end. In order to monitor the vertical hydraulic gradient between the stream and aquifer, one piezometer (W8) at PT2 was installed in the center of the river channel. Each piezometer was instrumented with a pressure transducer (M10 Levelogger, Model 3001, Solinst Ltd., Canada, ±0.01 m) that recorded total heads and temperatures at a sample interval of 30 minutes, from March to October 2010. For river stage monitoring, stilling wells equipped with M10 Leveloggers, were installed directly in the streams (sample interval: 30 min). All water level data measured with leveloggers were barometrically compensated for atmospheric pressure variations using an absolute pressure transducer (Barologger, Model 3001, Solinst Ltd., Canada). In Table 2.2 (Chapter 2.2.2) well construction details for individual piezometers are presented.
Weekly, we also sampled groundwater at piezometers (Fig. 1.1: PT1 and PT2) using a submersible pump (REICH Tauchpumpe, Germany). Groundwater as well as stream water samples were immediately refrigerated to < 4oC prior to analysis of nitrate and DOC concentrations. Water quality analyses were mainly completed by the Department of Environmental Science laboratory, Kangwon National University, Chuncheon (see: chapter 2.2.2).
1.2.3. Analysis of river-aquifer exchange fluxes under monsoonal climate conditions
Within the second study of this dissertation, the focus was on investigating river-aquifer exchange fluxes under the prevailing monsoonal climate conditions. Since, head gradients between piezometers and the stream are solely an indicator of the general direction of exchange (Kaeser et al., 2009) we combined hydraulic gradient measurements with the use of heat as a natural tracer and inverse numerical modeling to quantify flux magnitudes (Eddy-Miller, 2009; Anibas et al., 2009; Schmidt et al., 2007; Constantz, 2008; Essaid et al., 2008). All measurements were conducted at piezometer transect PT2 (Fig. 1.1, chapter 1.2.1.). Hydraulic gradients between the river and the aquifer were monitored as described previously in chapter 1.2.2.
The principle of using heat as a natural tracer is based on the natural temperature differences between ground- and surface water. Whereas, groundwater temperatures are fairly constant over time, most surface waters show diurnal temperature fluctuations. Heat is transported through the riverbed sediments by advection (with the moving water) and conduction (heat exchange due to temperature gradients) (Constantz, 2008). In river reaches where river water is infiltrating into the groundwater (losing conditions) the diurnal
Chapter 1 - Synopsis
12
temperature signal from the surface water is transported downward by advection and conduction (Graf, 2005). Alternatively, in gaining reaches the in-stream temperature signal is attenuated by upward advection of the constant groundwater temperature (Eddy-Miller, 2009). For utilizing heat as a natural tracer in this study, we instrumented the in-stream piezometer W8 with 11 thermistors with data loggers (iBCod Type Z, Alpha Mach Inc, ± 1°C) at 5, 10, 15, 20, 30, 40, 60, 80, 110, 140 and 190 cm below the water sediment interface. One additional sensor was placed into the river water, attached to the outside of the piezometer pipe at about 10 cm above the water sediment interface to monitor the in-stream temperature.
Combining the temperature and head data in the calibration of numerical models of groundwater-surface water interactions can provide more reliable estimates of exchange fluxes as opposed to using head data alone (Anderson, 2005). We set up a 2D numerical model of the river-aquifer system along the piezometer transect using the numerical code HydroGeoSphere (HGS) (Therrien, 2008) which fully integrates surface and subsurface water flow as well as solute and thermal energy transport. HGS solves the Richards' equation using a finite element approach to describe transient subsurface flow in variably-saturated porous media and the advection-dispersion equation for simulating solute and heat transport. In Figure 1.3, the model domain, the grid and the boundary conditions (flow and temperature) are illustrated. We chose a 2D cross section, perpendicular to the direction of stream flow as the model domain. For the upper model boundary, the topography of the land surface (Fig. 1.3: orange lines) and river channel (Fig. 1.3: blue line) was used, which were surveyed using an optical level (Tachymat WILD TC1000). The pre-processing software GRID BUILDER (McLaren, 2008) was applied to generate a finite element mesh within the model domain. Due to scouring during the first extreme rainfall event of the monsoon season (July 5, 2010) we constructed a second mesh for the new river bed geometry. The adjusted mesh was applied for all simulations after the event. As upper time variable boundary condition, the continuously measured river stage served and was applied to the defined river channel nodes. The land surface adjacent to the channel was prescribed as a variable flux boundary, with the observed precipitation rates applied as inflow. The continuously measured river temperatures were applied to the river channel nodes as upper time variable thermal inputs. Model nodes representing the land surface (Fig. 1.3: orange lines) adjacent to the river nodes and the bottom boundaries were treated as no-flow boundaries for heat. The lateral boundaries of the model domain were placed with respect to the locations of the piezometers furthest to the East (W6, (Fig. 1.3: right side light blue line)) and West (W9, (Fig. 1.3: left side light blue line)), respectively. The total heads and temperatures measured in piezometers W6 and W9 were applied as time variable boundary inputs similar to the procedure described by Eddy-Miller (2009). The lower model domain boundary was set to a no-flow boundary condition (Fig. 1.3: red line). All time variable input data were implemented as hourly values. Based on soil samples taken during the installation of the piezometers, the distribution of soil properties within the model domain was determined.
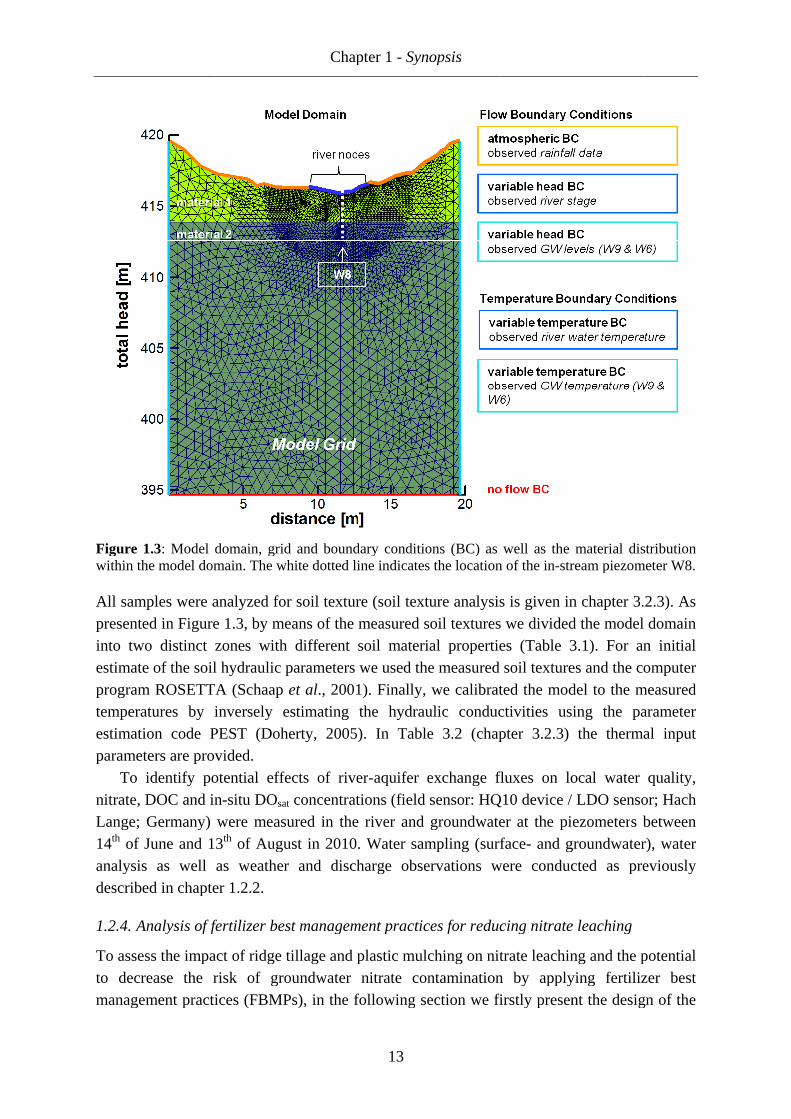
Figure 1.within the All samplespresented in into two distinct zones with different soiestimate of the program ROSETTA temperatures estimation code PEST (Doherty, 2005)parameters
To nitrate, Lange; Germany) were measured in the 14th of analysis as well as weather and discharge observations were conducted as previously described in chapter 1.2.2.
1.2.4. Analysis
To assess the impact of ridge tillage and plastic mulching on nitrate leaching to decrease the risk of groundwater nitrate contamination by applying fertilizer best management practices (FBMPs)
Figure 1.3: Model domain, grid and boundary conditions (BC) as well as the material distribution within the model domain. The white dotted line indicates the location of the in
samples were analyzed for soil texturepresented in Figure 1.3into two distinct zones with different soiestimate of the soil hydraulic parameters program ROSETTA temperatures by inversely estimating the hydraulic conductivities using the parameter estimation code PEST (Doherty, 2005)parameters are provided
To identify potenitrate, DOC and inLange; Germany) were measured in the
June and 13analysis as well as weather and discharge observations were conducted as previously described in chapter 1.2.2.
Analysis of fertilizer
To assess the impact of ridge tillage and plastic mulching on nitrate leaching to decrease the risk of groundwater nitrate contamination by applying fertilizer best management practices (FBMPs)
: Model domain, grid and boundary conditions (BC) as well as the material distribution model domain. The white dotted line indicates the location of the in
were analyzed for soil textureFigure 1.3, by means of
into two distinct zones with different soisoil hydraulic parameters
program ROSETTA (Schaap by inversely estimating the hydraulic conductivities using the parameter
estimation code PEST (Doherty, 2005)provided.
potential effects of riverDOC and in-situ DOsat
Lange; Germany) were measured in the and 13th of August in
analysis as well as weather and discharge observations were conducted as previously described in chapter 1.2.2.
of fertilizer best management practices for reducing
To assess the impact of ridge tillage and plastic mulching on nitrate leaching to decrease the risk of groundwater nitrate contamination by applying fertilizer best management practices (FBMPs)
Chapter 1
: Model domain, grid and boundary conditions (BC) as well as the material distribution model domain. The white dotted line indicates the location of the in
were analyzed for soil textureby means of the measured
into two distinct zones with different soisoil hydraulic parameters
(Schaap et al., 2001). by inversely estimating the hydraulic conductivities using the parameter
estimation code PEST (Doherty, 2005)
ntial effects of river
sat concentrations (Lange; Germany) were measured in the
of August in 2010. Water samplinganalysis as well as weather and discharge observations were conducted as previously
best management practices for reducing
To assess the impact of ridge tillage and plastic mulching on nitrate leaching to decrease the risk of groundwater nitrate contamination by applying fertilizer best management practices (FBMPs), in the following
Chapter 1 - Synopsis
13
: Model domain, grid and boundary conditions (BC) as well as the material distribution model domain. The white dotted line indicates the location of the in
were analyzed for soil texture (soil texture analthe measured soil textures
into two distinct zones with different soil material properties (Tablesoil hydraulic parameters we used the
., 2001). Finally, by inversely estimating the hydraulic conductivities using the parameter
estimation code PEST (Doherty, 2005). In Table 3.2
ntial effects of river-aquifer exchange concentrations (field sensor:
Lange; Germany) were measured in the river and groundwater2010. Water sampling
analysis as well as weather and discharge observations were conducted as previously
best management practices for reducing
To assess the impact of ridge tillage and plastic mulching on nitrate leaching to decrease the risk of groundwater nitrate contamination by applying fertilizer best
in the following section
Synopsis
: Model domain, grid and boundary conditions (BC) as well as the material distribution model domain. The white dotted line indicates the location of the in
(soil texture analysis soil textures
l material properties (Tablewe used the measured soil textures an
ly, we calibrated by inversely estimating the hydraulic conductivities using the parameter
Table 3.2 (chapter 3.2.3
aquifer exchange fluxesfield sensor: HQ10 deviceand groundwater
2010. Water sampling (surfaceanalysis as well as weather and discharge observations were conducted as previously
best management practices for reducing
To assess the impact of ridge tillage and plastic mulching on nitrate leaching to decrease the risk of groundwater nitrate contamination by applying fertilizer best
section we firstly present the
: Model domain, grid and boundary conditions (BC) as well as the material distribution model domain. The white dotted line indicates the location of the in-stream piezometer W8
is is given in chapter 3.2.3soil textures we divided
l material properties (Table 3.measured soil textures an
we calibrated the model by inversely estimating the hydraulic conductivities using the parameter
(chapter 3.2.3)
fluxes on localHQ10 device / LDO sensor; Hach
and groundwater at the piezometer(surface- and groundwater)
analysis as well as weather and discharge observations were conducted as previously
best management practices for reducing nitrate leaching
To assess the impact of ridge tillage and plastic mulching on nitrate leaching to decrease the risk of groundwater nitrate contamination by applying fertilizer best
we firstly present the
: Model domain, grid and boundary conditions (BC) as well as the material distribution stream piezometer W8
in chapter 3.2.3divided the model domain
3.1). For an measured soil textures and the computer
he model to the measured by inversely estimating the hydraulic conductivities using the parameter
) the thermal input
local water quality/ LDO sensor; Hach
the piezometers between and groundwater)
analysis as well as weather and discharge observations were conducted as previously
nitrate leaching
To assess the impact of ridge tillage and plastic mulching on nitrate leaching and the potential to decrease the risk of groundwater nitrate contamination by applying fertilizer best
we firstly present the design
: Model domain, grid and boundary conditions (BC) as well as the material distribution
stream piezometer W8.
in chapter 3.2.3). As the model domain
For an initial d the computer
to the measured by inversely estimating the hydraulic conductivities using the parameter
the thermal input
water quality, / LDO sensor; Hach
between and groundwater), water
analysis as well as weather and discharge observations were conducted as previously
the potential to decrease the risk of groundwater nitrate contamination by applying fertilizer best
design of the
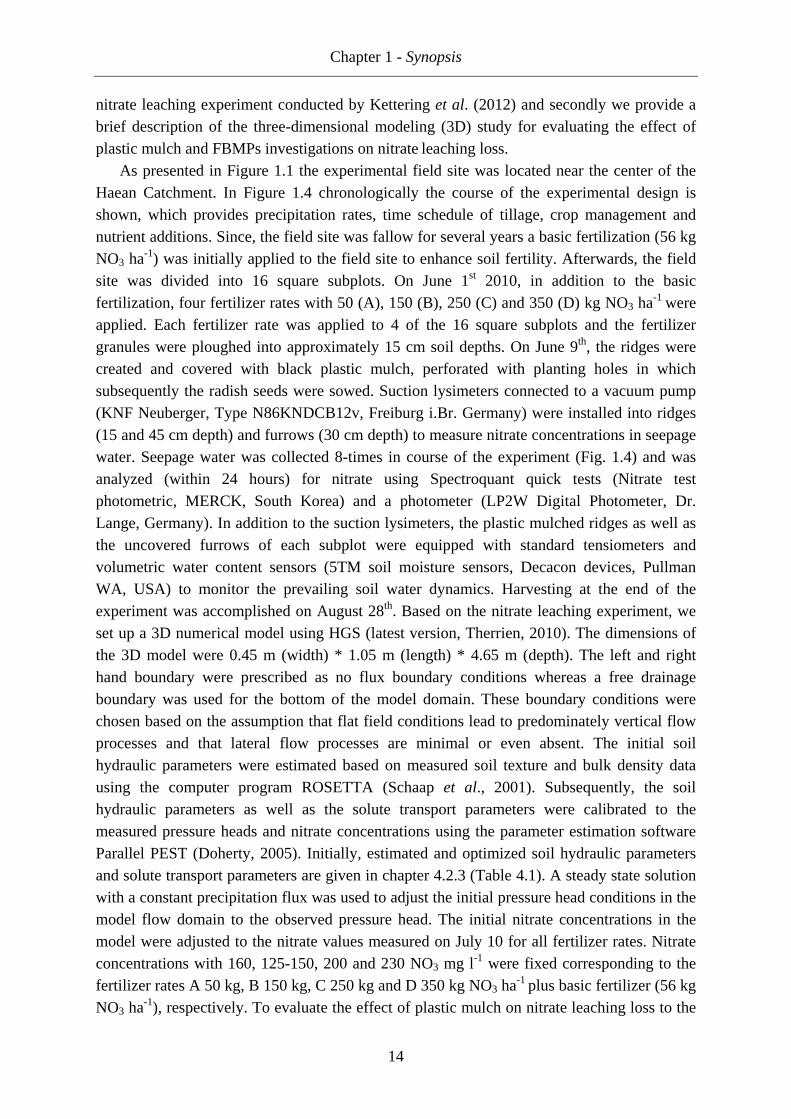
Chapter 1 - Synopsis
14
nitrate leaching experiment conducted by Kettering et al. (2012) and secondly we provide a brief description of the three-dimensional modeling (3D) study for evaluating the effect of plastic mulch and FBMPs investigations on nitrate leaching loss.
As presented in Figure 1.1 the experimental field site was located near the center of the Haean Catchment. In Figure 1.4 chronologically the course of the experimental design is shown, which provides precipitation rates, time schedule of tillage, crop management and nutrient additions. Since, the field site was fallow for several years a basic fertilization (56 kg NO3 ha-1) was initially applied to the field site to enhance soil fertility. Afterwards, the field site was divided into 16 square subplots. On June 1st 2010, in addition to the basic fertilization, four fertilizer rates with 50 (A), 150 (B), 250 (C) and 350 (D) kg NO3 ha-1 were applied. Each fertilizer rate was applied to 4 of the 16 square subplots and the fertilizer granules were ploughed into approximately 15 cm soil depths. On June 9th, the ridges were created and covered with black plastic mulch, perforated with planting holes in which subsequently the radish seeds were sowed. Suction lysimeters connected to a vacuum pump (KNF Neuberger, Type N86KNDCB12v, Freiburg i.Br. Germany) were installed into ridges (15 and 45 cm depth) and furrows (30 cm depth) to measure nitrate concentrations in seepage water. Seepage water was collected 8-times in course of the experiment (Fig. 1.4) and was analyzed (within 24 hours) for nitrate using Spectroquant quick tests (Nitrate test photometric, MERCK, South Korea) and a photometer (LP2W Digital Photometer, Dr. Lange, Germany). In addition to the suction lysimeters, the plastic mulched ridges as well as the uncovered furrows of each subplot were equipped with standard tensiometers and volumetric water content sensors (5TM soil moisture sensors, Decacon devices, Pullman WA, USA) to monitor the prevailing soil water dynamics. Harvesting at the end of the experiment was accomplished on August 28th. Based on the nitrate leaching experiment, we set up a 3D numerical model using HGS (latest version, Therrien, 2010). The dimensions of the 3D model were 0.45 m (width) * 1.05 m (length) * 4.65 m (depth). The left and right hand boundary were prescribed as no flux boundary conditions whereas a free drainage boundary was used for the bottom of the model domain. These boundary conditions were chosen based on the assumption that flat field conditions lead to predominately vertical flow processes and that lateral flow processes are minimal or even absent. The initial soil hydraulic parameters were estimated based on measured soil texture and bulk density data using the computer program ROSETTA (Schaap et al., 2001). Subsequently, the soil hydraulic parameters as well as the solute transport parameters were calibrated to the measured pressure heads and nitrate concentrations using the parameter estimation software Parallel PEST (Doherty, 2005). Initially, estimated and optimized soil hydraulic parameters and solute transport parameters are given in chapter 4.2.3 (Table 4.1). A steady state solution with a constant precipitation flux was used to adjust the initial pressure head conditions in the model flow domain to the observed pressure head. The initial nitrate concentrations in the model were adjusted to the nitrate values measured on July 10 for all fertilizer rates. Nitrate concentrations with 160, 125-150, 200 and 230 NO3 mg l-1 were fixed corresponding to the fertilizer rates A 50 kg, B 150 kg, C 250 kg and D 350 kg NO3 ha-1 plus basic fertilizer (56 kg NO3 ha-1), respectively. To evaluate the effect of plastic mulch on nitrate leaching loss to the
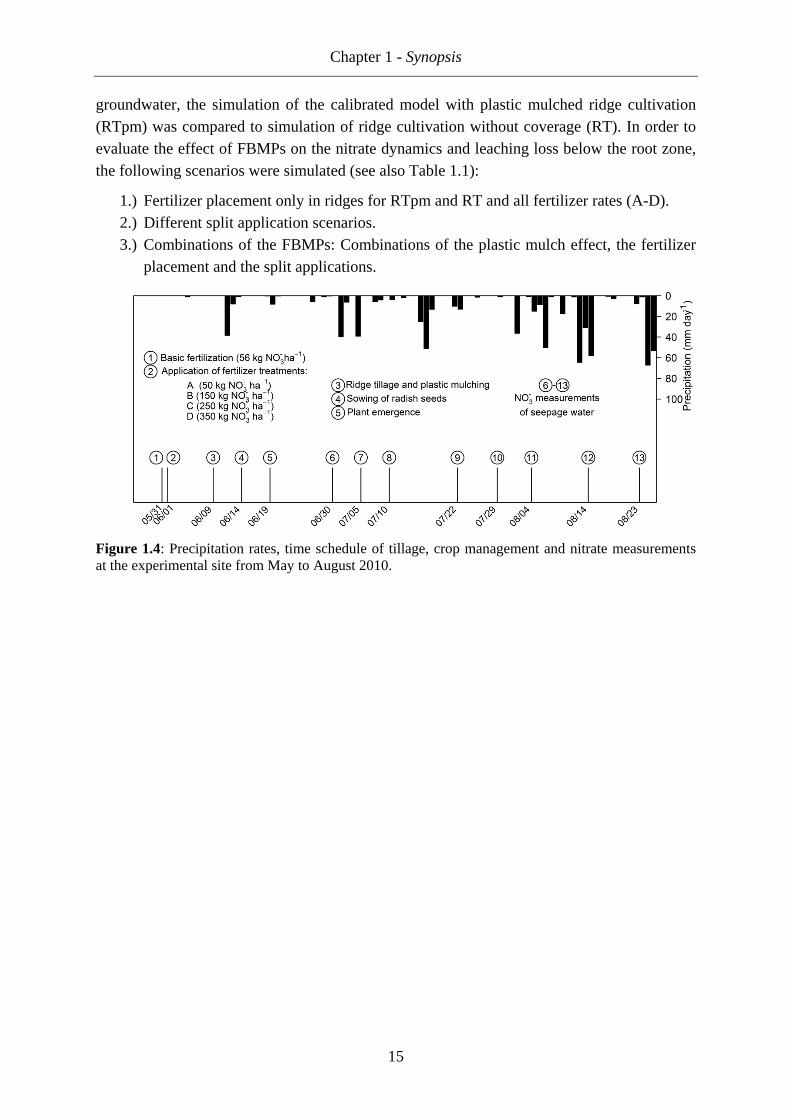
Chapter 1 - Synopsis
15
groundwater, the simulation of the calibrated model with plastic mulched ridge cultivation (RTpm) was compared to simulation of ridge cultivation without coverage (RT). In order to evaluate the effect of FBMPs on the nitrate dynamics and leaching loss below the root zone, the following scenarios were simulated (see also Table 1.1):
1.) Fertilizer placement only in ridges for RTpm and RT and all fertilizer rates (A-D). 2.) Different split application scenarios. 3.) Combinations of the FBMPs: Combinations of the plastic mulch effect, the fertilizer
placement and the split applications.
Figure 1.4: Precipitation rates, time schedule of tillage, crop management and nitrate measurements at the experimental site from May to August 2010.
Chapter 1 - Synopsis
16
1.3. Results and discussion
1.3.1. Nitrate and DOC sources, dynamics and mobilization processes in the Haean
Catchment
We synoptically investigated DOC and nitrate sources, dynamics and the mobilization of these substances, along the elevation gradient of the Haean Catchment. In general, we identified distinguishable differences in nitrate and DOC concentration dynamics in the forest river (S1, Fig. 1.1) compared to the agricultural river sites (S3-S7, Fig. 1.1).
During precipitation events at forest site S1, peak DOC concentrations appeared near the peak discharge. In contrast, at agricultural river sites the DOC reached peak concentrations considerably after the peak in discharge. These results imply that different DOC sources as well as distinguishable differences in transport pathways to the receiving surface waters between these sites were evident. We generally observed a relatively low spatial variability in DOC concentrations under dry weather conditions. Only at the rice paddy influenced site S5 (Fig. 1.1) noticeably higher DOC concentrations were evident. Typically, sites located in the lower part of the catchment (S5 – S6, Fig. 1.1) showed higher DOC concentrations.
In a previous study conducted at this forest site by Jeong et al. (2012), consistent clockwise progressions of the hysteresis loops between the discharge and the DOC concentrations have been demonstrated. They related the clockwise progression to hydrologic flushing of soluble organic matter from upper soil horizons on the rising limb and a limited supply of leachable organic materials during the falling limb of the storm hydrograph. Our results are in accordance with their findings and we build upon this work by additionally investigating the role of the pre-event hydrological state of the catchment and the monsoonal-type climate. We observed the lowest DOC concentrations during events following dry antecedent wetness conditions (Fig. 2.8, Nr.1) and the highest DOC concentration in storm events after wet antecedent wetness conditions (Fig. 2.8, Nr.2 and Nr.3). This observation is contrary to findings of previous studies conducted in temperate forests (Inamdar and Mitchell, 2006). They reported elevated in-stream DOC concentrations during precipitation events after dry conditions with steadily decreasing DOC concentrations during following storms, due to slow production or depletion of DOC reservoirs in soils. We relate this contradiction to the prevailing monsoonal-type climate. Prior to the Monsoon season the forest soils are very dry due to several months of draught. Hence, during the first precipitation event of the monsoonal season, the very dry forest soil may have acted as a “sponge” drawing most of the precipitation into the soil interstices. During subsequent precipitation events, the elevated pre-event volumetric water content of the soil most likely led to a higher pre-event DOC production and consequently resulted in higher in-stream DOC concentrations. However, Jeong et al. (2012) reported generally lower annual DOC exports (6.70 kg C ha-1, July 2009 – July 2010) from this forested catchment relative to forests located in temperate climate zones (e.g. DOC export from temperate forests in Europe: 10.4 – 52.6 kg C ha-1 (Hope et al., 1994)). This observation can be also explained by the prevailing monsoonal climate. As mentioned above, before DOC can be produced and mobilized the forest soils need to be rewetted. This fact is contrary to forests located in temperate climate
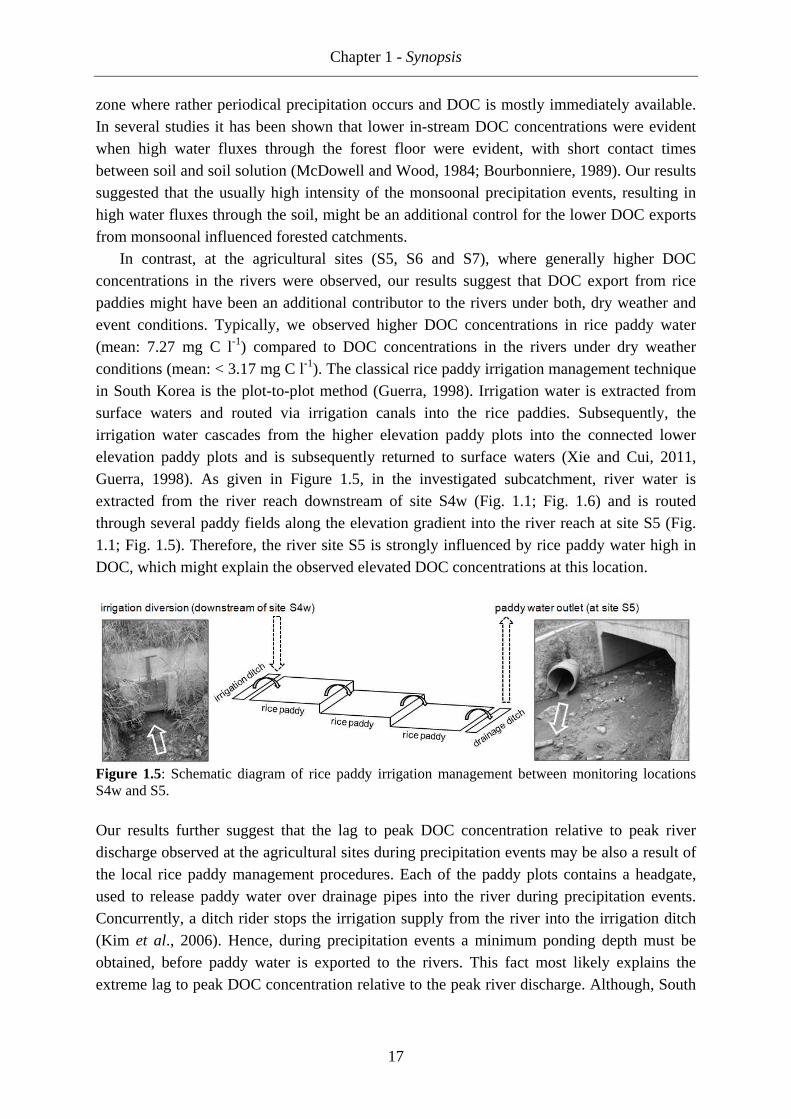
Chapter 1 - Synopsis
17
zone where rather periodical precipitation occurs and DOC is mostly immediately available. In several studies it has been shown that lower in-stream DOC concentrations were evident when high water fluxes through the forest floor were evident, with short contact times between soil and soil solution (McDowell and Wood, 1984; Bourbonniere, 1989). Our results suggested that the usually high intensity of the monsoonal precipitation events, resulting in high water fluxes through the soil, might be an additional control for the lower DOC exports from monsoonal influenced forested catchments.
In contrast, at the agricultural sites (S5, S6 and S7), where generally higher DOC concentrations in the rivers were observed, our results suggest that DOC export from rice paddies might have been an additional contributor to the rivers under both, dry weather and event conditions. Typically, we observed higher DOC concentrations in rice paddy water (mean: 7.27 mg C l-1) compared to DOC concentrations in the rivers under dry weather conditions (mean: < 3.17 mg C l-1). The classical rice paddy irrigation management technique in South Korea is the plot-to-plot method (Guerra, 1998). Irrigation water is extracted from surface waters and routed via irrigation canals into the rice paddies. Subsequently, the irrigation water cascades from the higher elevation paddy plots into the connected lower elevation paddy plots and is subsequently returned to surface waters (Xie and Cui, 2011, Guerra, 1998). As given in Figure 1.5, in the investigated subcatchment, river water is extracted from the river reach downstream of site S4w (Fig. 1.1; Fig. 1.6) and is routed through several paddy fields along the elevation gradient into the river reach at site S5 (Fig. 1.1; Fig. 1.5). Therefore, the river site S5 is strongly influenced by rice paddy water high in DOC, which might explain the observed elevated DOC concentrations at this location.
Figure 1.5: Schematic diagram of rice paddy irrigation management between monitoring locations S4w and S5.
Our results further suggest that the lag to peak DOC concentration relative to peak river discharge observed at the agricultural sites during precipitation events may be also a result of the local rice paddy management procedures. Each of the paddy plots contains a headgate, used to release paddy water over drainage pipes into the river during precipitation events. Concurrently, a ditch rider stops the irrigation supply from the river into the irrigation ditch (Kim et al., 2006). Hence, during precipitation events a minimum ponding depth must be obtained, before paddy water is exported to the rivers. This fact most likely explains the extreme lag to peak DOC concentration relative to the peak river discharge. Although, South
Chapter 1 - Synopsis
18
Korean paddy fields occupy more than 60% of the total farmland (Cho et al., 2000) DOC export from rice paddies has been widely overlooked in previous research.
However, as expected, river nitrate concentrations observed at the agricultural sites were up to eight times higher compared to the river nitrate concentrations measured in the forest stream. Furthermore, our results show that at each of the agricultural sites, nitrate concentrations rapidly decreased during the observed precipitation events, most likely due to dilution effects (i.e.: Poor and McDonnell, 2007; Kim et al., 2012). In contrast, at the forested site nitrate concentrations in the river were found to slightly increase during the events. Typically, among the agricultural sites, we observed higher nitrate concentrations in the river reaches located in the lower parts of the catchment (site S6 & S7, Fig. 1.1).
We suppose that at the forest site S1 nitrate leached from the upper organic soil layer into the deeper mineral soil and finally reached the river via base- or interflow. Our results further suggest that the river reaches in the lower agricultural part of the catchment were influenced by deep groundwater inputs. Nitrate concentrations were generally higher in groundwater than in surface waters, likely due to nitrate leaching processes from the agricultural fields through the unsaturated zone into the groundwater (Kettering et al., 2012). Through the hydraulic head monitoring we identified consistently losing river conditions along PT1 (Fig. 1.1) whereas, the piezometric heads observed along PT2 (Fig. 1.1), indicated time-variable river-aquifer exchange conditions with a distinct connection between the river and aquifer in this lower area of the catchment. Because a limited connectivity between the rivers and groundwater (channelization of the river) in the upper agricultural part of the catchment (PT1, S3-S5, Fig. 1.1) was evident, river water quality was unaffected in these areas. Alternatively, in the lower part of the catchment (PT2, S6 & S7) where the river temporarily received baseflow, the high groundwater nitrate concentrations elevated the in-stream nitrate concentrations. Thus, our results suggest that baseflow contributions to the lower river reaches of the Haean Catchment represent a significant and most likely the main pathway for nitrate into the receiving surface waters, within the Haean Catchment. However, in general we observed lower in-stream and groundwater nitrate concentrations (always under the European drinking water limit of 11.3 mg N l-1) relative to other agriculture regions throughout the world, where even less chemical fertilizers are applied to the fields. We hypothesize three effects to be responsible for the low nitrate concentrations observed in the catchment:
1.) The self-cleaning capacity (in terms of nitrate) of systems like the Haean Catchment might be high under monsoonal climate conditions (see next section 1.3.2.).
2.) Huge amounts of nitrate might be still stored in the system and will be released time-delayed to the waters.
3.) A general “dilution” effect during the monsoon season, when we conducted all of our measurements, might have been responsible for the low nitrate concentrations observed in the catchment.
However, to what extent these three effects might have contributed to the relatively low nitrate concentrations, remains to be clarified in further research.
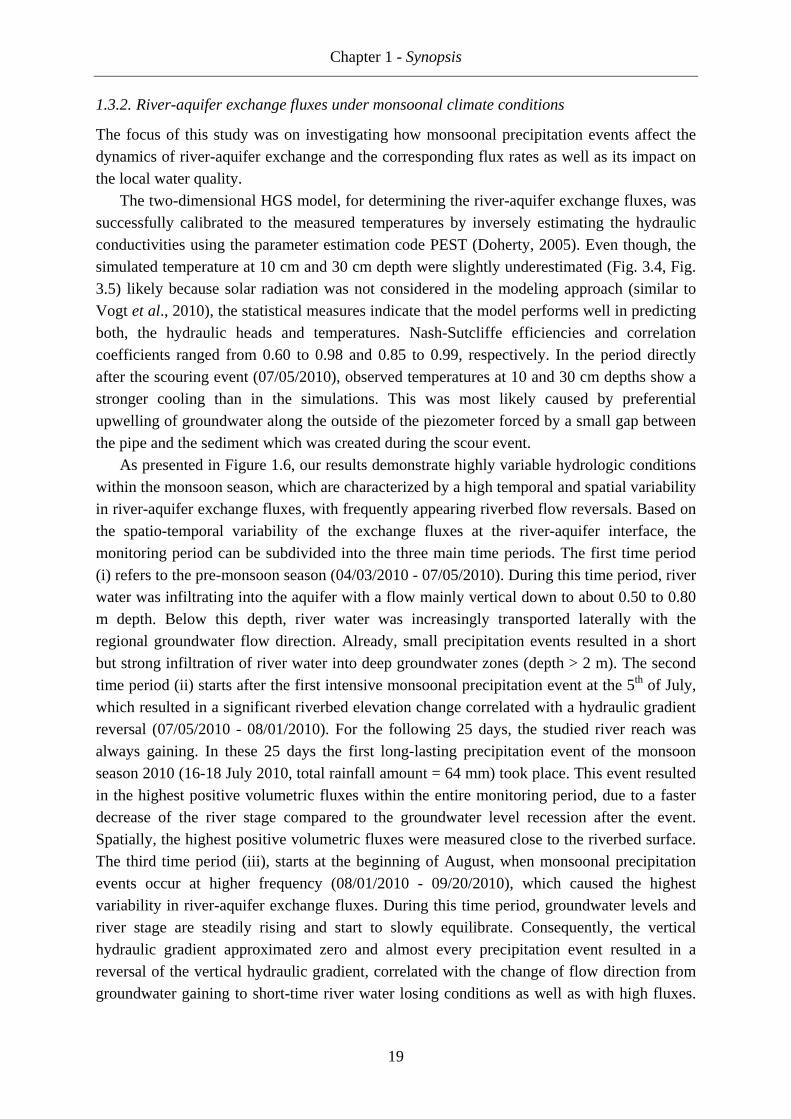
Chapter 1 - Synopsis
19
1.3.2. River-aquifer exchange fluxes under monsoonal climate conditions
The focus of this study was on investigating how monsoonal precipitation events affect the dynamics of river-aquifer exchange and the corresponding flux rates as well as its impact on the local water quality.
The two-dimensional HGS model, for determining the river-aquifer exchange fluxes, was successfully calibrated to the measured temperatures by inversely estimating the hydraulic conductivities using the parameter estimation code PEST (Doherty, 2005). Even though, the simulated temperature at 10 cm and 30 cm depth were slightly underestimated (Fig. 3.4, Fig. 3.5) likely because solar radiation was not considered in the modeling approach (similar to Vogt et al., 2010), the statistical measures indicate that the model performs well in predicting both, the hydraulic heads and temperatures. Nash-Sutcliffe efficiencies and correlation coefficients ranged from 0.60 to 0.98 and 0.85 to 0.99, respectively. In the period directly after the scouring event (07/05/2010), observed temperatures at 10 and 30 cm depths show a stronger cooling than in the simulations. This was most likely caused by preferential upwelling of groundwater along the outside of the piezometer forced by a small gap between the pipe and the sediment which was created during the scour event.
As presented in Figure 1.6, our results demonstrate highly variable hydrologic conditions within the monsoon season, which are characterized by a high temporal and spatial variability in river-aquifer exchange fluxes, with frequently appearing riverbed flow reversals. Based on the spatio-temporal variability of the exchange fluxes at the river-aquifer interface, the monitoring period can be subdivided into the three main time periods. The first time period (i) refers to the pre-monsoon season (04/03/2010 - 07/05/2010). During this time period, river water was infiltrating into the aquifer with a flow mainly vertical down to about 0.50 to 0.80 m depth. Below this depth, river water was increasingly transported laterally with the regional groundwater flow direction. Already, small precipitation events resulted in a short but strong infiltration of river water into deep groundwater zones (depth > 2 m). The second time period (ii) starts after the first intensive monsoonal precipitation event at the 5th of July, which resulted in a significant riverbed elevation change correlated with a hydraulic gradient reversal (07/05/2010 - 08/01/2010). For the following 25 days, the studied river reach was always gaining. In these 25 days the first long-lasting precipitation event of the monsoon season 2010 (16-18 July 2010, total rainfall amount = 64 mm) took place. This event resulted in the highest positive volumetric fluxes within the entire monitoring period, due to a faster decrease of the river stage compared to the groundwater level recession after the event. Spatially, the highest positive volumetric fluxes were measured close to the riverbed surface. The third time period (iii), starts at the beginning of August, when monsoonal precipitation events occur at higher frequency (08/01/2010 - 09/20/2010), which caused the highest variability in river-aquifer exchange fluxes. During this time period, groundwater levels and river stage are steadily rising and start to slowly equilibrate. Consequently, the vertical hydraulic gradient approximated zero and almost every precipitation event resulted in a reversal of the vertical hydraulic gradient, correlated with the change of flow direction from groundwater gaining to short-time river water losing conditions as well as with high fluxes.
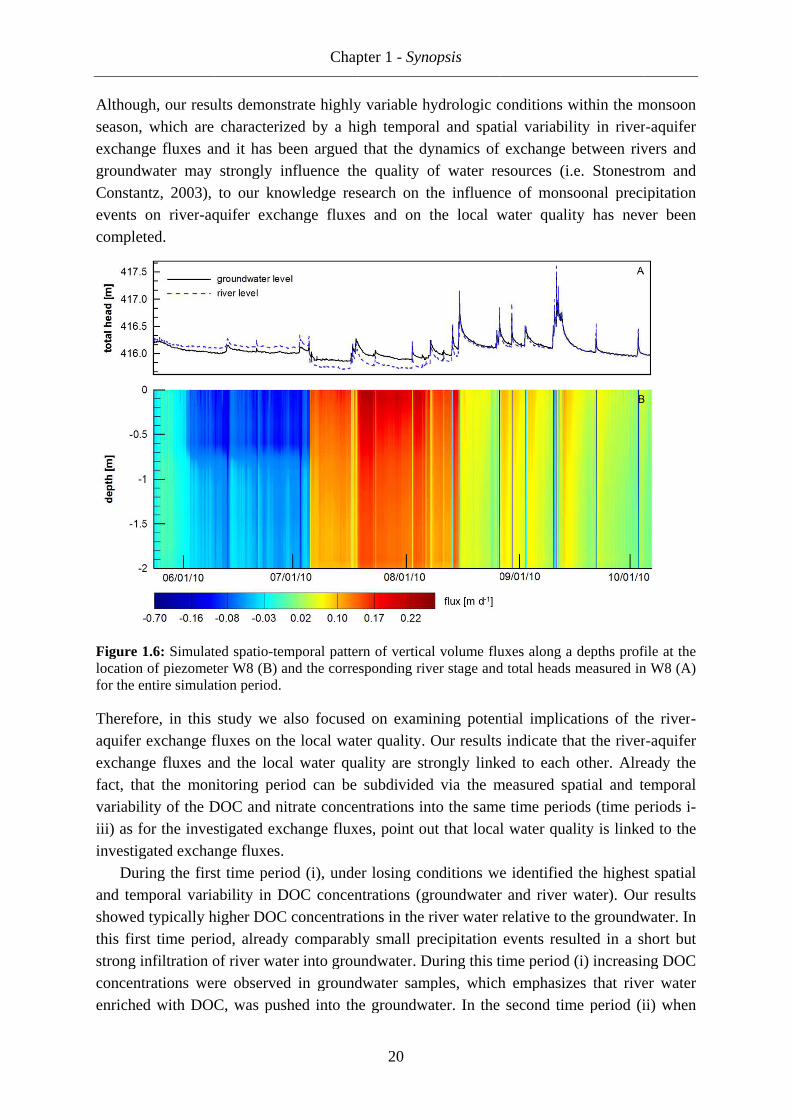
Although, our results demonstrate highly variable hydrologic conditions within the monsoon season, which are characterized by a high temporal and spatial variability in riverexchange fluxesgroundwater may strongly influence the quality of water resources (i.e. Stonestrom and Constantz, 2003), to our knowledge research on the influence of monsoonal precipitation events on rivercompleted.
Figure 1.location of piezometer W8 (B) and the corresponding for the entire simulation period.
Therefore, in this study we aquifer exchange fluexchange fluxesfact, that variability of theiii) as for the investigated exchange fluxesinvestigated exchange fluxes.
During the first time period (i), under losing conditions and temshowed typically higher DOC concentrations in the river water relative to the groundwater. this first strong infiltration of river water into concentrations were observed in groundwater enriched with
Although, our results demonstrate highly variable hydrologic conditions within the monsoon season, which are characterized by a high temporal and spatial variability in riverexchange fluxes and groundwater may strongly influence the quality of water resources (i.e. Stonestrom and Constantz, 2003), to our knowledge research on the influence of monsoonal precipitation events on river-aquifer ecompleted.
Figure 1.6: Simulated spatiolocation of piezometer W8 (B) and the corresponding for the entire simulation period.
Therefore, in this study we aquifer exchange fluexchange fluxes and the local water quality
that the monitorvariability of the DOC and nitrate concentrationsiii) as for the investigated exchange fluxesinvestigated exchange fluxes.
During the first time period (i), under losing conditions and temporal variability in DOC concentrationsshowed typically higher DOC concentrations in the river water relative to the groundwater. this first time periodstrong infiltration of river water into concentrations were observed in groundwater enriched with DOC,
Although, our results demonstrate highly variable hydrologic conditions within the monsoon season, which are characterized by a high temporal and spatial variability in river
and it has been groundwater may strongly influence the quality of water resources (i.e. Stonestrom and Constantz, 2003), to our knowledge research on the influence of monsoonal precipitation
aquifer exchange fluxes and on the local water quality has
Simulated spatio-temporal pattern of vertical volume fluxes along a depths profile at the location of piezometer W8 (B) and the corresponding for the entire simulation period.
Therefore, in this study we also aquifer exchange fluxes on the local water quality.
and the local water quality the monitoring period can be
DOC and nitrate concentrationsiii) as for the investigated exchange fluxesinvestigated exchange fluxes.
During the first time period (i), under losing conditions poral variability in DOC concentrations
showed typically higher DOC concentrations in the river water relative to the groundwater. time period, already comparably small precipitation events result
strong infiltration of river water into concentrations were observed in groundwater
DOC, was pushed into the groundwater.
Chapter 1
Although, our results demonstrate highly variable hydrologic conditions within the monsoon season, which are characterized by a high temporal and spatial variability in river
it has been argued that the dynamics of exchange between rivers and groundwater may strongly influence the quality of water resources (i.e. Stonestrom and Constantz, 2003), to our knowledge research on the influence of monsoonal precipitation
xchange fluxes and on the local water quality has
temporal pattern of vertical volume fluxes along a depths profile at the location of piezometer W8 (B) and the corresponding
also focused on examining potential implications of the riverxes on the local water quality.
and the local water quality period can be
DOC and nitrate concentrationsiii) as for the investigated exchange fluxesinvestigated exchange fluxes.
During the first time period (i), under losing conditions poral variability in DOC concentrations
showed typically higher DOC concentrations in the river water relative to the groundwater. , already comparably small precipitation events result
strong infiltration of river water into groundwaterconcentrations were observed in groundwater
pushed into the groundwater.
Chapter 1 - Synopsis
20
Although, our results demonstrate highly variable hydrologic conditions within the monsoon season, which are characterized by a high temporal and spatial variability in river
argued that the dynamics of exchange between rivers and groundwater may strongly influence the quality of water resources (i.e. Stonestrom and Constantz, 2003), to our knowledge research on the influence of monsoonal precipitation
xchange fluxes and on the local water quality has
temporal pattern of vertical volume fluxes along a depths profile at the location of piezometer W8 (B) and the corresponding river stage and total heads measured in W8 (A)
focused on examining potential implications of the riverxes on the local water quality.
and the local water quality are strongly linked to each other. Already the subdivided
DOC and nitrate concentrations into the same tiii) as for the investigated exchange fluxes, point out
During the first time period (i), under losing conditions poral variability in DOC concentrations (groundwater and river water)
showed typically higher DOC concentrations in the river water relative to the groundwater. , already comparably small precipitation events result
groundwater. Duringconcentrations were observed in groundwater samples
pushed into the groundwater.
Synopsis
Although, our results demonstrate highly variable hydrologic conditions within the monsoon season, which are characterized by a high temporal and spatial variability in river
argued that the dynamics of exchange between rivers and groundwater may strongly influence the quality of water resources (i.e. Stonestrom and Constantz, 2003), to our knowledge research on the influence of monsoonal precipitation
xchange fluxes and on the local water quality has
temporal pattern of vertical volume fluxes along a depths profile at the river stage and total heads measured in W8 (A)
focused on examining potential implications of the riverxes on the local water quality. Our results indicate that the riv
are strongly linked to each other. Already the subdivided via the measured
into the same tpoint out that local water quality is
During the first time period (i), under losing conditions we (groundwater and river water)
showed typically higher DOC concentrations in the river water relative to the groundwater. , already comparably small precipitation events result
During this time periodsamples, which emphasizes that
pushed into the groundwater. In the
Although, our results demonstrate highly variable hydrologic conditions within the monsoon season, which are characterized by a high temporal and spatial variability in river
argued that the dynamics of exchange between rivers and groundwater may strongly influence the quality of water resources (i.e. Stonestrom and Constantz, 2003), to our knowledge research on the influence of monsoonal precipitation
xchange fluxes and on the local water quality has
temporal pattern of vertical volume fluxes along a depths profile at the river stage and total heads measured in W8 (A)
focused on examining potential implications of the riverresults indicate that the riv
are strongly linked to each other. Already the measured spatial and temporal
into the same time periods (time periods ithat local water quality is
we identified(groundwater and river water)
showed typically higher DOC concentrations in the river water relative to the groundwater. , already comparably small precipitation events result
time period , which emphasizes that
second time period (ii) when
Although, our results demonstrate highly variable hydrologic conditions within the monsoon season, which are characterized by a high temporal and spatial variability in river
argued that the dynamics of exchange between rivers and groundwater may strongly influence the quality of water resources (i.e. Stonestrom and Constantz, 2003), to our knowledge research on the influence of monsoonal precipitation
xchange fluxes and on the local water quality has never
temporal pattern of vertical volume fluxes along a depths profile at the river stage and total heads measured in W8 (A)
focused on examining potential implications of the riverresults indicate that the river
are strongly linked to each other. Already the spatial and temporal
ime periods (time periods ithat local water quality is linked
identified the highest spatial (groundwater and river water). Our results
showed typically higher DOC concentrations in the river water relative to the groundwater. , already comparably small precipitation events resulted in a short but
(i) increasing DOC , which emphasizes that river water
time period (ii) when
Although, our results demonstrate highly variable hydrologic conditions within the monsoon season, which are characterized by a high temporal and spatial variability in river-aquifer
argued that the dynamics of exchange between rivers and groundwater may strongly influence the quality of water resources (i.e. Stonestrom and Constantz, 2003), to our knowledge research on the influence of monsoonal precipitation
never been
temporal pattern of vertical volume fluxes along a depths profile at the river stage and total heads measured in W8 (A)
focused on examining potential implications of the river-er-aquifer
are strongly linked to each other. Already the spatial and temporal
ime periods (time periods i-linked to the
the highest spatial Our results
showed typically higher DOC concentrations in the river water relative to the groundwater. In in a short but
ncreasing DOC river water
time period (ii) when
Chapter 1 - Synopsis
21
groundwater was predominantly discharging into the river, we observed a lower temporal and spatial variability in DOC and nitrate concentrations. Finally, within the third time period (iii) when storm events occurred more frequently and the simulated water fluxes were found to be strongest, also the spatial variability of DOC concentrations in the groundwater increased again as frequently DOC enriched river water was pushed into the aquifer.
In contrast, nitrate concentrations in the river water and groundwater (all piezometers) were found to decrease during this time period (iii). Basically two effects might have been responsible for the decreasing nitrate values. The river nitrate concentrations might have decreased during monsoonal precipitation events due to dilution effects as suggested by Rusjan and Miko (2008). But dilution effects fail to explain the even lower nitrate concentrations observed in the groundwater sample at piezometer (W5), relative to river nitrate concentrations.
Further measurements of groundwater, which were extracted out of additional piezometers throughout the Haean Catchment, indicate nitrate concentrations up to four times higher in the groundwater than in the river water. Generally, highest nitrate concentrations measured at the piezometer transect were observed in piezometer W9, which is upstream of the river channel with respect to the groundwater flow direction and hence less influenced by river water. In contrast, at piezometers W5 and W8, which are regularly influenced by the river water, either by strong river water infiltration or in terms of groundwater flow direction, showed lower nitrate concentrations relative to the observed river water concentrations.
During the storm events in August, river water high in DOC was frequently pushed into the anoxic, nitrate enriched groundwater, which created favorable conditions for denitrification. Hence, denitrification might have been the main biogeochemical process responsible for the nitrate attenuation observed in W5. Although, we cannot prove this hypothesis on the basis of the limited chemical data set, we postulate that under prevailing hydrologic conditions the potential for denitrification in the streambed below the river is likely high and therewith also the self-cleaning capacity (in terms of nitrate) of systems like the Haean Catchment.
In summary, this study demonstrates that during the monsoon season a high temporal and spatial variability in river-aquifer exchange fluxes is evident with frequent riverbed flow reversals and that the local water quality is controlled by these river-aquifer-exchange fluxes. We further showed that using hydraulic gradient monitoring along a piezometer transect coupled with heat as a tracer and numerical modeling is a useful combination of methods in order to investigate river-aquifer exchange fluxes under monsoonal climate conditions.
Chapter 1 - Synopsis
22
1.3.3. Evaluation of fertilizer best management practices for reducing nitrate leaching
We investigated the impact of ridge tillage and plastic mulching on nitrate leaching and the potential to decrease the risk of groundwater nitrate contamination by applying fertilizer best management practices (FBMPs).Consequently, we set up a three-dimensional (HGS) model, which was calibrated to measured pressure heads and nitrate concentrations from a nitrate leaching field experiment (Kettering et al., 2012).
Although, the agreement between measured and simulated pressure heads of the water flow model was not satisfying (chapter 4.3.1., Fig. 4.3), the optimization of the solute transport model resulted in a reasonable agreement between measured and simulated nitrate concentrations (chapter 4.3.1., Fig. 4.4). With the exception of a single fertilizer rate (furrow position, 30 cm depth), the Nash Sutcliffe coefficient was ≥ 0.50 and the coefficient of determination (R²) was ≥ 0.54 for all observation points.
The effect of plastic mulching on nitrate dynamics was evaluated by comparing the nitrate concentrations of the calibrated model (RTpm) to a simulation without plastic mulch (RT) using the fertilizer rate B (150 kg ha-1). We identified distinguishable differences between the simulated nitrate concentration pattern of RT and RTpm (chapter 4.3.2., Fig. 4.5). The nitrate concentration under RT decreased fast and comparatively homogeneously throughout the soil profile. In contrast, under RTpm the concentration pattern was heterogeneously with maximum nitrate concentrations underneath the plastic coverage and low nitrate concentrations in the unprotected furrows and planting holes. This enhanced fertilizer retention underneath the plastic coverage was also reported by Locascio et al. (1985) and Cannington et al. (1975). Additionally, we compared the cumulative nitrate leaching loss between RT and RTpm below the root zone and found that for all fertilizer rates, the amounts of leached nitrate was significantly lower under RTpm in comparison to RT. This finding underlines the protective function of the plastic mulch for nitrate leaching and its corresponding potential to decrease the risk of groundwater nitrate contamination.
We then assumed that an optimal fertilizer placement can reduce nitrate leaching especially when the fertilizer is solely placed in the plastic covered ridges where the main roots of radishes are able to take up most of the applied fertilizer. Therefore, nitrate concentrations in the ridges were increased so that the total initial mass in the model was equivalent to the previous simulations of fertilizer placement in ridges and furrows. The received results demonstrated that under RT, the total leaching loss was reduced by 15%, whereas, under RTpm a better fertilizer placement even resulted in 36% lower leaching rates. A reduction of fertilizer leaching through an optimal placement of fertilizers is consistent with previous studies (Hamlett et al., 1990; Waddell and Weil, 2006). Within those studies, the authors reported a decrease of fertilizer leaching by placing the fertilizer only in the elevated part of the ridge.
Kettering et al. (2012) recommended applying the fertilizer in approximately 3-4 applications to meet the crop N needs and to reduce the fertilizer leaching risk. They also stated that particularly at the beginning of the growing season, fertilizer applications should be minimal due to the lower fertilizer use efficiency within this early plant growing stage.
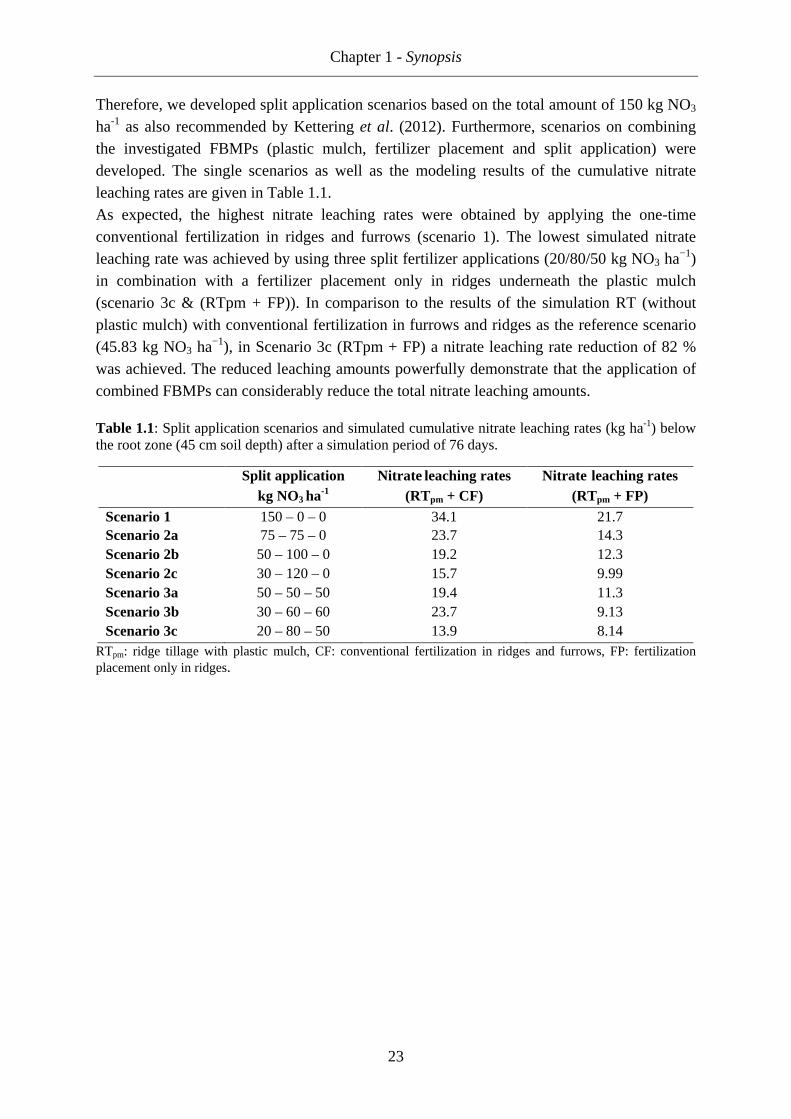
Chapter 1 - Synopsis
23
Therefore, we developed split application scenarios based on the total amount of 150 kg NO3 ha-1 as also recommended by Kettering et al. (2012). Furthermore, scenarios on combining the investigated FBMPs (plastic mulch, fertilizer placement and split application) were developed. The single scenarios as well as the modeling results of the cumulative nitrate leaching rates are given in Table 1.1. As expected, the highest nitrate leaching rates were obtained by applying the one-time conventional fertilization in ridges and furrows (scenario 1). The lowest simulated nitrate leaching rate was achieved by using three split fertilizer applications (20/80/50 kg NO3 ha−1) in combination with a fertilizer placement only in ridges underneath the plastic mulch (scenario 3c & (RTpm + FP)). In comparison to the results of the simulation RT (without plastic mulch) with conventional fertilization in furrows and ridges as the reference scenario (45.83 kg NO3 ha−1), in Scenario 3c (RTpm + FP) a nitrate leaching rate reduction of 82 % was achieved. The reduced leaching amounts powerfully demonstrate that the application of combined FBMPs can considerably reduce the total nitrate leaching amounts.
Table 1.1: Split application scenarios and simulated cumulative nitrate leaching rates (kg ha-1) below the root zone (45 cm soil depth) after a simulation period of 76 days.
Split application kg NO3
ha-1 Nitrate leaching rates
(RTpm + CF) Nitrate leaching rates
(RTpm + FP) Scenario 1 150 – 0 – 0 34.1 21.7 Scenario 2a 75 – 75 – 0 23.7 14.3 Scenario 2b 50 – 100 – 0 19.2 12.3 Scenario 2c 30 – 120 – 0 15.7 9.99 Scenario 3a 50 – 50 – 50 19.4 11.3 Scenario 3b 30 – 60 – 60 23.7 9.13 Scenario 3c 20 – 80 – 50 13.9 8.14
RTpm: ridge tillage with plastic mulch, CF: conventional fertilization in ridges and furrows, FP: fertilization placement only in ridges.
Chapter 1 - Synopsis
24
1.4. Conclusions and recommendations for future research
In this project, we identified nitrate and DOC sources as well as analyzed the mobilization and dynamics of nitrate and DOC in a monsoonal affected, mountainous landscape under intensive land-use, to be specific the Haean Catchment in South Korea. In the first study we assessed (chapter 2) nitrate and DOC dynamics on (sub-) catchment scale and developed conceptual ideas about potential nitrate and DOC sources as well as its mobilization throughout the Haean Catchment, whereas in the second (chapter 3) and third study (chapter 4) we focused on studying the underlying processes (river-aquifer interactions & fertilizer leaching) on river reach and plot scale, respectively. The main conclusions, in relation to the originally stated hypotheses, as well as recommendations for future research are presented in the following sections.
Study 1: Monsoonal-type climate or land-use management: Understanding their role in the
mobilization of nitrate and DOC in a mountainous catchment
We synoptically investigated DOC and nitrate sources, dynamics and the mobilization of these substances, along the elevation gradient of the Haean Catchment. We initially hypothesized that the mobilization of these solutes is highly driven by the monsoonal-type climate; that the transport pathways of nitrate and DOC into surface waters are depending on the prevailing land-use and finally; that river-aquifer interactions are an additional control for in-stream water quality.
Our results confirmed that the monsoonal climate is the most decisive driver for the in-stream nitrate and DOC dynamics in forested part of Haean Catchment. The mobilization of nitrate and DOC was found to be strongly depending on pre-event moisture conditions. By following the topographic elevation gradient down to the agricultural part of the catchment, the prevailing land-use gains in importance for river and groundwater quality. Excessive N fertilization of dryland fields in combination with intensive monsoonal rainfall events likely caused the elevated groundwater nitrate concentrations. In these parts of the catchment, nitrate is predominately introduced in form of chemical fertilizers by farmers while its mobilization from dryland fields into the groundwater is highly depending on the intensity and duration of monsoonal precipitation events. Subsequently, the “land-use effect” and “monsoonal climate effect” are of comparable importance for the groundwater quality. In those parts of the Haean Catchment, where the rice paddy plot-to-plot system is applied, the prevailing land-use type was found to be the most decisive control on in-stream nitrate and DOC dynamics. Our results showed that most in-stream DOC originated from rice paddy water contributions, which were primarily regulated by farmers and their irrigation systems (under dry weather and event conditions) and not by the monsoonal-type climate. The rivers in this part of the catchment are fully channeled to maintain the local rice paddy irrigation system and the connectivity between the rivers and the groundwater is consequently limited. Hence, these rivers were unaffected by groundwater inputs high in nitrate. Concurrently, in the lower part of the Haean Catchment, where we identified a distinct connection between the river and aquifer, groundwater inputs high in nitrate were most likely responsible for the
Chapter 1 - Synopsis
25
observed elevated in-stream nitrate concentrations. Nethertheless, the monitored highly variable river-aquifer interactions driven by the monsoonal-type climate, were identified as major control on in-stream nitrate dynamics in this, lower part of the Haean Catchment.
However, in general lower in-stream and groundwater nitrate concentrations relative to other agriculture regions throughout the world were observed. In order to understand this contradiction of high fertilizer N application versus comparatively low in-stream and groundwater nitrate concentration we highly recommend further research on investigating the self-cleaning capacity (denitrification rates in the hyporheic zone) of monsoonal influenced of systems. Furthermore, it needs to be clarified whether huge amounts of nitrate are still stored in the Haean Catchment as the delayed release of potentially in soils stored and over several decades accumulated nitrate can significantly impair future water quality. In general, we suggest long-term water quality and discharge measurements at the catchment outlet, from a seasonal to annual assessment in order to quantitatively understand the effect of the monsoonal-type climate on total, annual DOC and nitrate export rates from watersheds like the Haean Catchment. As, for instance in Korea, paddy fields occupy more than 60% of the total farmland (Cho et al., 2000) and consequently high DOC export from rice paddies might play an important role for the national water quality, we also recommend detailed investigations of the DOC mobilization from rice paddy fields. A better rice paddy management system may be than considered to minimize these additional DOC contributions to surface waters, which subsequently may reduce the costs for local water treatments and hence the supply of fresh water.
Study 2: River-aquifer exchange fluxes under monsoonal climate conditions
Within this study, we determined how monsoonal precipitation events and the resulting variability in river discharge affect the dynamics of river-aquifer exchange fluxes and evaluated potential impacts of these exchange fluxes on local water quality. We initially hypothesized that river-aquifer interactions are highly controlled by the monsoonal-type climate and that the exchange fluxes between the river and the groundwater significantly affect local groundwater and in-stream water quality.
We found highly variable hydrologic conditions during the monsoon season characterized by a high temporal and spatial variability in river-aquifer exchange fluxes with frequent riverbed flow reversals (changes between gaining and losing conditions). Monsoonal extreme precipitation events were identified as major driver for these riverbed flow reversals. We identified sort of “push & pull effects”. During monsoonal precipitation events, river water is “pushed” into the subjacent aquifer due to a faster raise of river levels relative to groundwater levels. After precipitation has stopped, within a comparable short time the vertical hydraulic gradient reversals and groundwater is “pulled” up again into the stream. We reported the lowest nitrate concentrations within the shallow groundwater zone underneath the river, which is regularly influenced by the described “push & pull effects”. As, during monsoonal events, river water high in DOC is frequently pushed into the anoxic and nitrate-rich groundwater, we postulate that under prevailing hydrologic conditions the potential for denitrification in the streambed below the river is high. Since, we cannot fully prove this
Chapter 1 - Synopsis
26
suggestion by means of our chemical data set, we again highly recommend further research on potential denitrification processes within the streambed, which might be forced by the identified “push & pull effects”. It has been forecasted that the global warming effect will strongly increase the intensity and frequency of extreme rainfall events throughout Europe and the world (e.g. Beniston et al., 2007). In view of this prediction, the identified “push & pull effects” might also become an imperative issue in other regions throughout the world.
Study 3: The effect of fertilizer best management practices for reducing nitrate leaching in a
plastic mulched ridge cultivation system
We assessed the impact of plastic mulch and FBMPs on N leaching losses in ridge cultivation in a flat terrain. We initially hypothesized that plastic mulching as well as an appropriate fertilizer placement only in ridges and split applications in combination with an optimal timing of fertilization, considerably reduce nitrate leaching losses.
All of the initially stated hypotheses were verified by means of the presented simulation results. The plastic mulch coverage but also the topography of the ridges increased the plant available nitrate in the root zone and considerably reduced nitrate leaching losses to deeper soil zones. The simulation results also revealed that a fertilizer placement solely in the ridges is a valuable tool to reduce nitrate leaching losses compared to conventional broadcast fertilizations. The split application scenarios exhibited that small fertilizer application rates at the beginning of the growing season, followed by increased application rates in the crop development stage and again decreased fertilizer application rates in the end of the cropping season considerably reduce nitrate leaching losses in comparison to the conventional one-top dressing at the beginning of the growing season. Nethertheless, the simulations confirmed the multiplicative beneficial effects of combined FBMPs on reduced nitrate leaching losses. In conclusion, the application of combined FBMPs will lead to economic benefits as noticeably less fertilizer needs to be applied and thus, the costs for external fertilizer inputs will be considerably reduced. Furthermore, environmental and ecological benefits will be achieved by reducing substantially the risk of groundwater pollution.
Our simulation results, however, are limited to ridge cultivation on flat terrain, where the precipitation contributes entirely to infiltration through the unsaturated zone. Contrary to flat terrain, ridge cultivation with plastic mulching on hill slopes, as often practiced in the Haean Catchment, might increase surface runoff. In view of the fact that an increased surface runoff supports the transport of nutrients and agrochemicals directly into the rivers we highly recommend additional research on assessing the impact of plastic mulch and FBMPs, including topographical landscape aspects.
Overall, each of the studies included in this dissertation gives valuable insights into the mobilization processes and dynamics of DOC and/or nitrate in monsoonal affected mountainous catchments under intensive land-use. In this dissertation the decisive factors that control nitrate and DOC mobilization processes and dynamics in such catchments were identified, which is an important prerequisites in order to develop sustainable management principles to ensure the freshwater supply from complex mountainous landscapes.
Chapter 1 - Synopsis
27
1.5. List of manuscripts and specification of individual contributions
The three studies described in this thesis refer to three different manuscripts. The first two manuscripts are submitted to Journal of Hydrology and the third manuscript is published online in Agriculture, Ecosystems and Environment. The list below details the contributions of all co-authors.
Manuscript 1 Authors Svenja Bartsch, Stefan Peiffer, Christopher L. Shope, Sebastian
Arnhold, Jong-Jin Jeong, Jihyung Park, Jaesung Eum, Bomchul Kim, Jan H. Fleckenstein
Title Monsoonal-type climate or land-use management: Understanding their role in the mobilization of nitrate and DOC in a mountainous catchment
Journal Journal of Hydrology
Status accepted Contributions S. Bartsch idea, methods, data collection, data analysis, figures, manuscript writing, discussion, manuscript editing, first author
S. Peiffer idea, discussion, manuscript editing C.L. Shope idea, discussion, manuscript editing S. Arnhold discussion, data collection
J.J. Jeong data collection J.H. Park data collection, manuscript editing J. Eum water quality analysis B. Kim water quality analysis J.H. Fleckenstein idea, discussion, manuscript editing,
corresponding author
Manuscript 2 Authors Svenja Bartsch, Sven Frei, Marianne Ruidisch, Christopher L. Shope,
Stefan Peiffer, Bomchul Kim and Jan H. Fleckenstein Title River-Aquifer Exchange Fluxes under Monsoonal Climate Conditions Journal Journal of Hydrology
Status accepted
Chapter 1 - Synopsis
28
Contributions S. Bartsch idea, methods, data collection, data analysis,
modeling, figures, manuscript writing, discussion, manuscript editing, first author
S. Frei modeling, methods, discussion M. Ruidisch modeling, discussion
C.L. Shope idea, discussion, manuscript editing S. Peiffer idea, discussion, manuscript editing
B. Kim water quality analysis J.H. Fleckenstein idea, discussion, manuscript editing
corresponding author
Manuscript 3 Authors M. Ruidisch, S. Bartsch, J. Kettering, B. Huwe, S. Frei Title The effect of fertilizer best management practices on nitrate leaching in
a plastic mulched ridge cultivation system Journal Agriculture, Ecosystems and Environment
Status published Contributions M. Ruidisch idea, methods, data collection, data analysis,
modeling, figures, manuscript writing, discussion, manuscript editing, first and corresponding author
S. Bartsch modeling, discussion, manuscript editing J. Kettering data collection, discussion, manuscript editing
B. Huwe idea, discussion, manuscript editing S. Frei modeling, methods, discussion, manuscript
editing
Chapter 1 - Synopsis
29
1.6. Literature
Åkerblom, S., Meili, M., Bringmark, L., Johansson, K., Kleja, D.B., Bergkvist, B., 2008. Partitioning of Hg between solid and dissolved organic matter in the humus layer of boreal forests. Water Air Soil Pollution 189 (1-4), 239–252.
Anderson, M.P., 2005. Heat as a Ground Water Tracer. Ground Water 43 (6), 951–968. Anibas, C., Fleckenstein, J.H., Volze, N., Buis, K., Verhoeven, R., Meire, P., Batelaan, O., 2009.
Transient or steady-state? Using vertical temperature profiles to quantify groundwater-surface water exchange. Hydrological Processes 23 (15), 2165–2177.
Bargar, B., Swan, J.B., Jaynes, D., 1999. Soil water recharge under uncropped ridges and furrows. Soil Science Society of America Journal 63, 1290–1299.
Bashkin, V.N., Park, S.U., Choi, M.S., Lee C.B., 2002. Nitrogen budgets for the Republic of Korea and the Yellow Sea Region. Biogeochemistry 57/58, 387-403
Beniston, M., Stephenson, D.B., Christensen, O.B., Ferro, C.A.T., Frei, C., Goyette, S., Halsnaes, K., Holt, T., Jylhä, K., Koffi, B., Palutikof, J., Schöll, R., Semmler T., Woth, K., 2007. Future extreme events in European climate: an exploration of regional climate model projections. Climatic Change 81, 71–95, DOI 10.1007/s10584-006-9226-z.
Benjamin, J.G., Porter, L.K., Duke, H.R., Ahuja, L.R., Butters, G., 1998. Nitrogen movement with furrow irrigation method and fertilizer band placement. Soil Science Society of America Journal 62, 1103–1108.
Bernal, S., Butturini, A., Sabater, F., 2002. Variability of DOC and nitrate responses to storms in a small Mediterranean forested catchment. Hydrology and Earth System Sciences Discussions 6 (6), 1031–1041.
Biron, P.M., Roy, A.G., Courschesne, F., Hendershot, W.H., Côté, B. and Fyles, J., 1999. The effects of antecedent moisture conditions on the relationship of hydrology to hydrochemistry in a small forested watershed. Hydrological Processes 13 (11), 1541–1555.
Bourbonniere, R.A., 1989. Distribution patterns of dissolved organic matter fractions in natural waters from eastern Canada. Organic Geochemistry 14 (1), 97–107.
Burns, D., 2005. What do hydrologists mean when they use the term flushing? Hydrological Processes 19 (6), 1325–1327.
Cannington, F., Duggings, R.B., Roan, R.G., 1975. Florida vegetable production using plastic film mulch with drip irrigation. Proceedings of the 12th National Agricultural Plastics Congress, 11-15.
Cho, J.-Y., Han, K.-W., Choi, J.-K., 2000. Balance of nitrogen and phosphorus in a paddy field of central Korea. Soil Science and Plant Nutrition 46 (2), 343–354.
Clay, S., Clay, D., Koskinen, W., Malzer, G., 1992. Agrichemical placement impacts on alachlor and nitrate movement through soil in a ridge tilled system. Journal of Environmental Science and Health B27, 125–138.
Conant, B., 2004. Delineating and Quantifying Ground Water Discharge Zones Using Streambed Temperatures. Ground Water 42 (2), 243‐257.
Constantz, J., 2008. Heat as a tracer to determine streambed water exchanges. Water Resources Research 44, W00D10.
Creed, I.F., Band, L.E., 1998. Export of nitrogen from catchments within a temperate forest: evidence for a unifying mechanism regulated by variable source area dynamics. Water Resources Research 34 (11), 3105–3120.
Doherty, J., 2005. PEST: Model- independent Parameter Estimation. User manual: 5th Edition. Watermark Numerical Computing. Brisbane, Australia.
Eddy-Miller, C.A., Wheeler, J.D., Essaid, H.I., 2009. Characterization of interactions between surface water and near-stream groundwater along Fish Creek, Teton County, Wyoming, by using heat as a tracer: U.S. Geological Survey Scientific Investigations Report 2009–5160, 53p.
Essaid, H.I., Zamora, C.M., McCarthy, K.A., Vogel, J.R., Wilson, J.T., 2008. Using Heat to Characterize Streambed Water Flux Variability in Four Stream Reaches. Journal of Environment Quality 37 (3), 1010-1023.
Chapter 1 - Synopsis
30
Fleckenstein, J.H., Krause, S., Hannah, D.M., Boano, F., 2010. Groundwater-surface water interactions: New methods and models to improve understanding of processes and dynamics, Advances in Water Resources 33 (11), 1291-1295.
Food and Agriculture Organization of the United Nations (FAO), 2011. The state of the world’s land and waterresources for food and agriculture. Managing systems at risk. FAO, Rome.
Food and Agriculture Organization of the United Nations (FAO), 2012. Irrigation in Southern and Eastern Asia in figures. Aquastat survey – 2011. FAO Water Reports No. 37, FAO, Rome.
Goolsby, D.A., Battaglin, W.A., Aulenbach, B.T., Hooper, R.P., 2001. Nitrogen input to the Gulf of Mexico. Journal of Environmental Quality 30 (2), 329–336.
Graf, T., 2005. Modeling coupled thermohaline flow and reactive solute transport in discretely-fractured porous media. PhD thesis, Université Laval, Québec, Canada, 209 pp.
Grasby S.E., Betcher R.N., 2002. Regional hydrogeochemistry of the carbonate rock aquifer, southern Manitoba. Canadian Journal of Earth Sciences 39 (7), 1053–1063.
Greenberg, M.S., Burton, G.A., Rowland, C.D., 2002. Optimizing interpretation of in situ effects of riverine pollutants: Impact of upwelling and downwelling. Environmental Toxicology and Chemistry 21 (2), 289‐297.
Guerra, L. C., Bhuiyan, S.I., Tuong, T.P., Barker, R., 1998. Producing more rice with less water. SWIM Paper 5. Colombo, Sri Lanka: International Water Management Institute.
Hamlett, J.M., Baker, J.L., Horton, R., 1990. Water and anion movement under ridge tillage - A field-study. Transactions of the ASABE 33, 1859–1866.
Hope, D., Billett, M.F., Cresser, M.S., 1994. A review of the export of carbon in river water: fluxes and processes. Environment Pollution 84, 301–324.
Howarth, R.W., Marino, R., 2006. Nitrogen as the limiting nutrient for eutrophication in coastal marine ecosystems: Evolving views over three decades. Limnology and Oceanography 51 (2), 364–376.
IGBP 1997 Predicting global change impacts on mountain hydrology and ecology: Integrated catchment hydrology/altitudinal gradient studies. IGBP Report 43, Stockholm, Sweden
Inamdar, S.P., Mitchell, M.J., 2006. Hydrologic and topographic controls on storm-event exports of dissolved organic carbon (DOC) and nitrate across catchment scales. Water Resources Research 42 (3), W03421.
IUSS Working Group WRB (ed.), 2007. World Reference Base for Soil Resources 2006, first update 2007, World Soil Resources Reports No. 103, FAO, Rome, 132 pp.
Jaynes, D.B., Swan, J.B., 1999. Solute movement in uncropped ridge-tilled soil under natural rainfall. Soil Science Society of America Journal 63, 264–269.
Jeong, J.-J., Bartsch, S., Fleckenstein, J.H., Matzner, E., Tenhunen, J.D., Lee, S.D., Park, S.K., Park, J.-H., 2012. Differential storm responses of dissolved and particulate organic carbon in a mountainous headwater stream, investigated by high-frequency, in situ optical measurements. Journal of Geophysical Research 117 (G3).
Jo, K.-W., Park, J.-H., 2010. Rapid release and changing sources of Pb in a mountainous watershed during extreme rainfall events. Environmental Science & Technology 44 (24), 9324–9329.
Kaeser, D., Binley, A., Heathwaite, L., Krause, S., 2009. Spatio-temporal variations of hyporheic flow in a riffle-step-pool sequence, Hydrological Processes 23, 2138–2149.
Kalbus, E., Schmidt, C., Bayer-Raich, M., Leschik, S., Reinstorf, F., Balcke, G.U., Schirmer M., 2007. New methodology to investigate potential contaminant mass fluxes at the stream–aquifer interface by combining integral pumping tests and streambed temperatures. Environmental Pollution 148 (3), 808–816.
Kalbus, E., Reinstorf, F. and Schirmer, M., 2006. Measuring methods for groundwater - surface water interactions: a review. Hydrology and Earth System Sciences 10, 873-887.
Kettering, J., Park, J.-H., Lindner, S., Lee, B., Tenhunen, J., Kuzyakov, Y., 2012. N fluxes in an agricultural catchment under monsoon climate: A budget approach at different scales. Agriculture, Ecosystems & Environment 161, 101–111.
Kettering, J., Ruidisch, M., Gaviria, C., Ok, Y.-S., Kuzyakov, Y., 2013. Fate of fertilizer 15N in intensive ridge cultivation with plastic mulching under a monsoon climate. Nutrient Cycling in Agroecosystems 95, 57-72.
Chapter 1 - Synopsis
31
Kim, B., 2000. Effects of the summer monsoon on the distribution and loading of organic carbon in a deep reservoir, Lake Soyang, Korea. Water Research 34 (14), 3495–3504.
Kim, B., Park, J.-H., Hwang, G., Jun, M.-S., Choi, K., 2001. Eutrophication of reservoirs in South Korea. Limnology 2 (3), 223–229.
Kim, J.S., Oh, S.Y., Oh, K.Y., 2006. Nutrient runoff from a Korean rice paddy watershed during multiple storm events in the growing season. Journal of Hydrology 327 (1-2), 128–139.
Kim, S.-J., Tae, H., Kim, K., Lee, C., Blanco, J.A., Lo, Y.-H., 2012. Ecohydrology and Biogeochemistry in a Temperate Forest Catchment / Forest ecosystems. More than just trees. InTech, Rijeka, Croatia.
Koh, D.-C., Chae, G.-T., Yoon, Y.-Y., Kang, B.-R., Koh, G.-W., Park, K.-H., 2009. Baseline geochemical characteristics of groundwater in the mountainous area of Jeju Island, South Korea: Implications for degree of mineralization and nitrate contamination. Journal of Hydrology 376, 81-93.
Koh, D.-C., Ko, K.-S., Kim, Y., Lee, S.-G., Chang, H.-W., 2007. Effect of agricultural land use on the chemistry of groundwater from basaltic aquifers, Jeju Island, South Korea. Hydrogeology Journal 15, 727-743.
Krause, S., Heathwaite, L., Binley, A., Keenan, P., 2009. Nitrate concentration changes at the groundwater-surface water interface of a small Cumbrian river. Hydrological Processes 23 (15), 2195‐2211.
Kwon, Y.S., Lee, H.Y., Han, J., Kim, W.H., Kim, D.J., Kim, D.I., Youm, S.J., 1990. Terrain analysis of Haean Basin in terms of earth science. Journal of Korean Earth Science Society 11, 236–241.
Lewandowski, J., Angermann, L., Nuetzmann, G., Fleckenstein, J.H., 2011. A heat pulse technique for the determination of small-scale flow directions and flow velocities in the streambed of sand-bed streams. Hydrological Processes 25, 3244–3255.
Liniger, H., Weingartner, R., 1998. Mountains and freshwater supply. Unasylva, No. 195, 49, 39-46, Rome.
Liniger, H.P., Weingartner, R., Grosjean, M., Kull, C., MacMillan, L., Messerli, B., Bisaz, A., Lutz, U., 1998. Mountains of the world: water towers for the twenty-first century. Mountain Agenda. Paul Haupt., Bern.
Locascio, S.J., Fiskell, J.G. A., Graetz, D.A., Hawk, R.D., 1985. Nitrogen accumulation by peppers as influenced by mulch and time of fertilizer application. Journal of the American Society for Horticultural Science 110, 325–328.
Madsen, E.L., Sinclair, J.L., Ghiorse, W.C., 1991. In situ biodegradation: microbiological patterns in a contaminated aquifer. Science 252 (5007), 830–833.
McDonnell, J.J., Owens, I.F., Stewart, M.K., 1991. A case Study of Shallow Flow Paths in a Steep Zero Order Basin. Journal of the American Water Resources Association 27 (4), 679–685.
McDowell, W.H., Wood, T., 1984. Podzolization: Soil processes control dissolved organic carbon concentrations in stream water. Soil Science 137, 23-32.
McHale, M.R., McDonnell, J.J., Mitchell, M.J., Cirmo, C.P., 2002. A field based study of soil water and groundwater nitrate release in an Adirondack forested watershed. Water Resources Research 38 (4), WR000102.
McLaren, R., 2008. GRID BUILDER: A pre-processor for 2-D, triangular element, finite-element programs. University of Waterloo, Groundwater Simulations Group, Waterloo, Ontario.
Millennium Ecosystem Assessment (MA) (ed.), 2005. Ecosystems and Human Well-Being: Synthesis, Island Press, Washington D.C., 155pp.
Morel, B., Durand, P., Jaffrezic, A., Gruau, G., Molenat, J., 2009. Sources of dissolved organic carbon during stormflow in a headwater agricultural catchment. Hydrological Processes 23 (20), 2888–2901.
Mountain Agenda, 1998. Mountains of the world: water towers for the twenty-first century. Bern, Mountain Agenda.
Poor, C.J., McDonnell, J.J., 2007. The effects of land use on stream nitrate dynamics. Journal of Hydrology 332 (1-2), 54–68.
Chapter 1 - Synopsis
32
Rantz, S.E., 1982b. Measurement and Computation of Streamflow, Vol. 1 - Measurement of Stage and Discharge, USGS Water Supply Paper 2175. U.S. Geological Survey, Washington D.C., pp. 313.
Ribbe, L., Delgado, P., Salgado, E., Flügel, W.-A., 2008. Nitrate pollution of surface water induced by agricultural non-point pollution in the Pocochay watershed, Chile. Desalination 226 (1-3), 13–20.
Rusjan, S., Miko, M., 2008. Assessment of hydrological and seasonal controls over the nitrate flushing from a forested watershed using a data mining technique. Hydrology and Earth System Sciences Discussions 12 (2), 645–656.
Scanlon, B., Healy, R., Cook, P., 2002. Choosing appropriate techniques for quantifying groundwater recharge. Hydrogeology Journal 10 (1), 18–39.
Schaap, M.G., Leij, F.J., van Genuchten, M.Th., 2001. ROSETTA: a computer program for estimating soil hydraulic parameters with hierarchical pedotransfer functions. Journal of Hydrology 251 (3–4), 163–176.
Schmidt, C., Conant, B., Bayer-Raich, M., Schirmer, M., 2007. Evaluation and field-scale application of an analytical method to quantify groundwater discharge using mapped streambed temperatures. Journal of Hydrology 347 (3-4), 292–307.
Schmidt, C., Martienssen M., Kalbus, E. 2011. Influence of water flux and redox conditions on chlorobenzene concentrations in a contaminated streambed. Hydrological Processes, 25 (2), 234–245.
Schornberg, C., Schmidt, C., Kalbus, E., Fleckenstein, J.H., 2010. Simulating the effects of geologic heterogeneity and transient boundary conditions on streambed temperatures - implications for temperature-based water flux calculations, Advances in Water Resources, 33 (11), 1309-1319.
Shope, C. L., Bartsch, S., Kim, K., Kim, B., Tenhunen, J., Peiffer, S., Park, J. H., Ok, Y. S., Fleckenstein, J.H., Köllner, T., 2013. A weighted, multi-method approach for accurate basin-wide streamflow estimation in an ungauged watershed. Journal of Hydrology 494, 72-82.
Stonestrom, D. A., Constantz, J., 2003. Heat as a Tool for Studying the Movement of Ground Water Near Streams. U.S. Geological Survey Circ. 1260, 1–96.
Therrien, R., McLaren, R.G., Sudicky, E.A., Panday, S.M, 2010. HydroGeoSphere: A three dimensional numerical model describing fully-integrated subsurface and surface flow and solute transport (manual). University of Waterloo, Groundwater Simulations Group, Waterloo, Canada.
Therrien, R., McLaren, R.G., Sudicky, E.A., Panday, S.M., 2008. HydroGeoSphere: A three dimensional numerical model describing fully-integrated subsurface and surface flow and solute transport (manual). University of Waterloo, Groundwater Simulations Group, Waterloo, Canada.
Tilman, D., Cassman, K.G., Matson, P.A., Naylor, R., Polasky, S., 2002. Agricultural sustainability and intensive production practices. Nature 418, 671-677.
United Nations, 1992. Convention on biological diversity. UN Conference on Environment and Development, Rio de Janeiro.
van Verseveld, W.J., McDonnell, J.J., Lajtha, K., 2009. The role of hillslope hydrology in controlling nutrient loss. Journal of Hydrology 367 (3-4), 177–187.
Viviroli, D., Dürr, H. H., Messerli, B., Meybeck, M., and Weingartner, R., 2007. Mountains of the world – water towers for humanity: typology, mapping and global significance. Water Resources Research 43, W07447.
Vogt, T., Schneider, P., Hahn-Woernle, L., Cirpka, O.A., 2010. Estimation of seepage rates in a losing stream by means of fiber-optic high-resolution vertical temperature profiling. Journal of Hydrology 380 (1-2), 154–164.
Waddell, J.T., Weil, R.R., 2006. Effects of fertilizer placement on solute leaching under ridge tillage and no tillage. Soil Tillage Research 90, 194–204.
Wagner, L., Vidon, P., Tedesco, L., Gray, M., 2008. Stream nitrate and DOC dynamics during three spring storms across land uses in glaciated landscapes of the Midwest. Journal of Hydrology 362 (3-4), 177–190.
Xie, X., Cui, Y., 2011. Development and test of SWAT for modeling hydrological processes in irrigation districts with paddy rice. Journal of Hydrology 396 (1-2), 61–71.
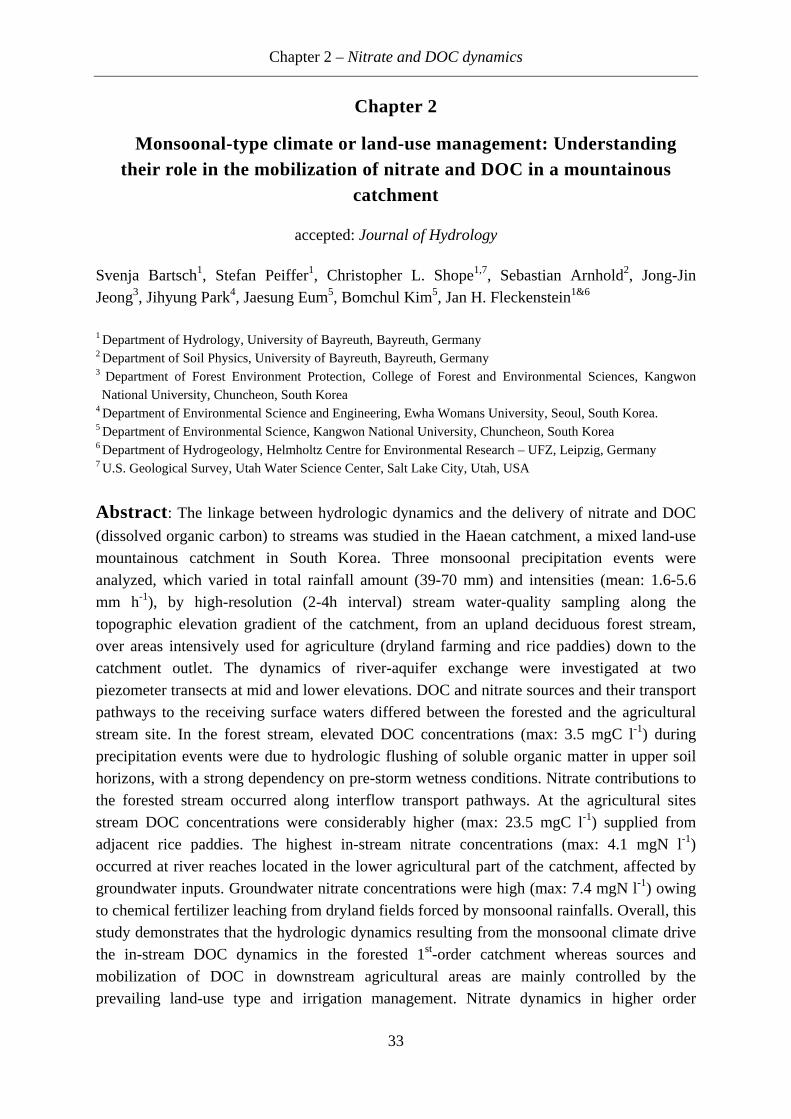
Chapter 2 – Nitrate and DOC dynamics
33
Chapter 2
2. Monsoonal-type climate or land-use management: Understanding their role in the mobilization of nitrate and DOC in a mountainous
catchment
accepted: Journal of Hydrology Svenja Bartsch1, Stefan Peiffer1, Christopher L. Shope1,7, Sebastian Arnhold2, Jong-Jin Jeong3, Jihyung Park4, Jaesung Eum5, Bomchul Kim5, Jan H. Fleckenstein1&6
1 Department of Hydrology, University of Bayreuth, Bayreuth, Germany 2 Department of Soil Physics, University of Bayreuth, Bayreuth, Germany 3 Department of Forest Environment Protection, College of Forest and Environmental Sciences, Kangwon National University, Chuncheon, South Korea
4 Department of Environmental Science and Engineering, Ewha Womans University, Seoul, South Korea. 5 Department of Environmental Science, Kangwon National University, Chuncheon, South Korea 6 Department of Hydrogeology, Helmholtz Centre for Environmental Research – UFZ, Leipzig, Germany 7 U.S. Geological Survey, Utah Water Science Center, Salt Lake City, Utah, USA
Abstract : The linkage between hydrologic dynamics and the delivery of nitrate and DOC
(dissolved organic carbon) to streams was studied in the Haean catchment, a mixed land-use mountainous catchment in South Korea. Three monsoonal precipitation events were analyzed, which varied in total rainfall amount (39-70 mm) and intensities (mean: 1.6-5.6 mm h-1), by high-resolution (2-4h interval) stream water-quality sampling along the topographic elevation gradient of the catchment, from an upland deciduous forest stream, over areas intensively used for agriculture (dryland farming and rice paddies) down to the catchment outlet. The dynamics of river-aquifer exchange were investigated at two piezometer transects at mid and lower elevations. DOC and nitrate sources and their transport pathways to the receiving surface waters differed between the forested and the agricultural stream site. In the forest stream, elevated DOC concentrations (max: 3.5 mgC l-1) during precipitation events were due to hydrologic flushing of soluble organic matter in upper soil horizons, with a strong dependency on pre-storm wetness conditions. Nitrate contributions to the forested stream occurred along interflow transport pathways. At the agricultural sites stream DOC concentrations were considerably higher (max: 23.5 mgC l-1) supplied from adjacent rice paddies. The highest in-stream nitrate concentrations (max: 4.1 mgN l-1) occurred at river reaches located in the lower agricultural part of the catchment, affected by groundwater inputs. Groundwater nitrate concentrations were high (max: 7.4 mgN l-1) owing to chemical fertilizer leaching from dryland fields forced by monsoonal rainfalls. Overall, this study demonstrates that the hydrologic dynamics resulting from the monsoonal climate drive the in-stream DOC dynamics in the forested 1st-order catchment whereas sources and mobilization of DOC in downstream agricultural areas are mainly controlled by the prevailing land-use type and irrigation management. Nitrate dynamics in higher order
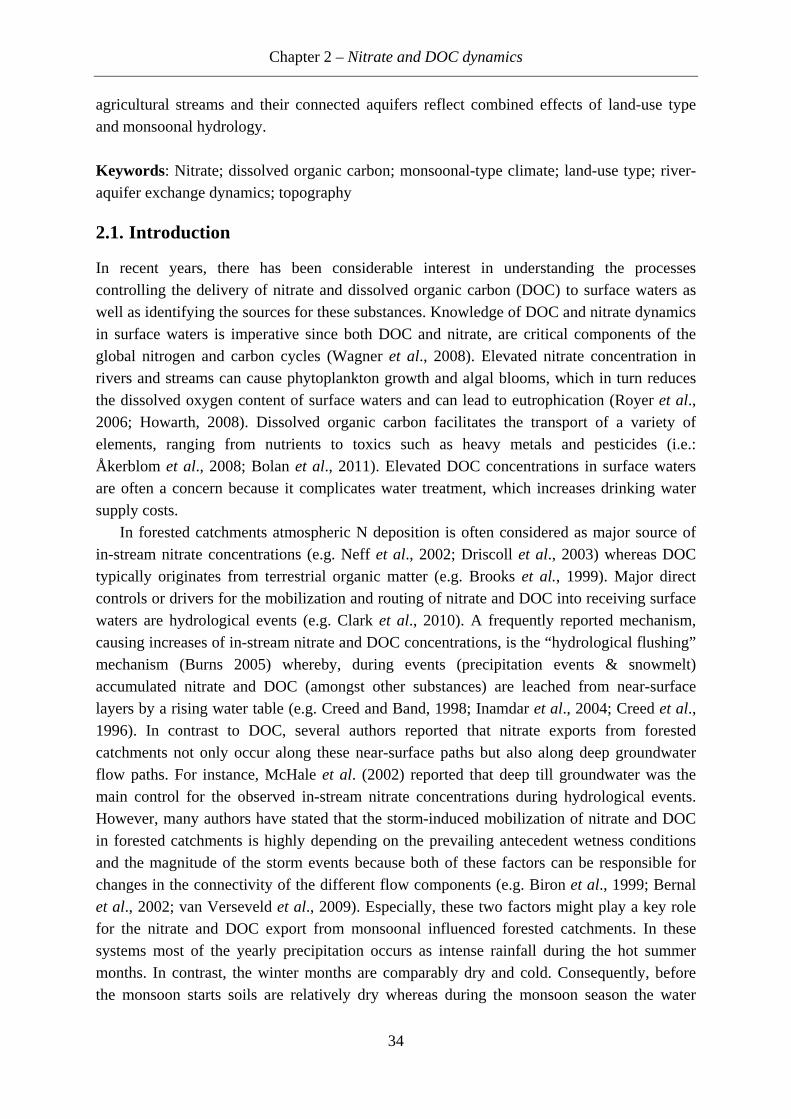
Chapter 2 – Nitrate and DOC dynamics
34
agricultural streams and their connected aquifers reflect combined effects of land-use type and monsoonal hydrology. Keywords: Nitrate; dissolved organic carbon; monsoonal-type climate; land-use type; river-aquifer exchange dynamics; topography
2.1. Introduction
In recent years, there has been considerable interest in understanding the processes controlling the delivery of nitrate and dissolved organic carbon (DOC) to surface waters as well as identifying the sources for these substances. Knowledge of DOC and nitrate dynamics in surface waters is imperative since both DOC and nitrate, are critical components of the global nitrogen and carbon cycles (Wagner et al., 2008). Elevated nitrate concentration in rivers and streams can cause phytoplankton growth and algal blooms, which in turn reduces the dissolved oxygen content of surface waters and can lead to eutrophication (Royer et al., 2006; Howarth, 2008). Dissolved organic carbon facilitates the transport of a variety of elements, ranging from nutrients to toxics such as heavy metals and pesticides (i.e.: Åkerblom et al., 2008; Bolan et al., 2011). Elevated DOC concentrations in surface waters are often a concern because it complicates water treatment, which increases drinking water supply costs.
In forested catchments atmospheric N deposition is often considered as major source of in-stream nitrate concentrations (e.g. Neff et al., 2002; Driscoll et al., 2003) whereas DOC typically originates from terrestrial organic matter (e.g. Brooks et al., 1999). Major direct controls or drivers for the mobilization and routing of nitrate and DOC into receiving surface waters are hydrological events (e.g. Clark et al., 2010). A frequently reported mechanism, causing increases of in-stream nitrate and DOC concentrations, is the “hydrological flushing” mechanism (Burns 2005) whereby, during events (precipitation events & snowmelt) accumulated nitrate and DOC (amongst other substances) are leached from near-surface layers by a rising water table (e.g. Creed and Band, 1998; Inamdar et al., 2004; Creed et al., 1996). In contrast to DOC, several authors reported that nitrate exports from forested catchments not only occur along these near-surface paths but also along deep groundwater flow paths. For instance, McHale et al. (2002) reported that deep till groundwater was the main control for the observed in-stream nitrate concentrations during hydrological events. However, many authors have stated that the storm-induced mobilization of nitrate and DOC in forested catchments is highly depending on the prevailing antecedent wetness conditions and the magnitude of the storm events because both of these factors can be responsible for changes in the connectivity of the different flow components (e.g. Biron et al., 1999; Bernal et al., 2002; van Verseveld et al., 2009). Especially, these two factors might play a key role for the nitrate and DOC export from monsoonal influenced forested catchments. In these systems most of the yearly precipitation occurs as intense rainfall during the hot summer months. In contrast, the winter months are comparably dry and cold. Consequently, before the monsoon starts soils are relatively dry whereas during the monsoon season the water
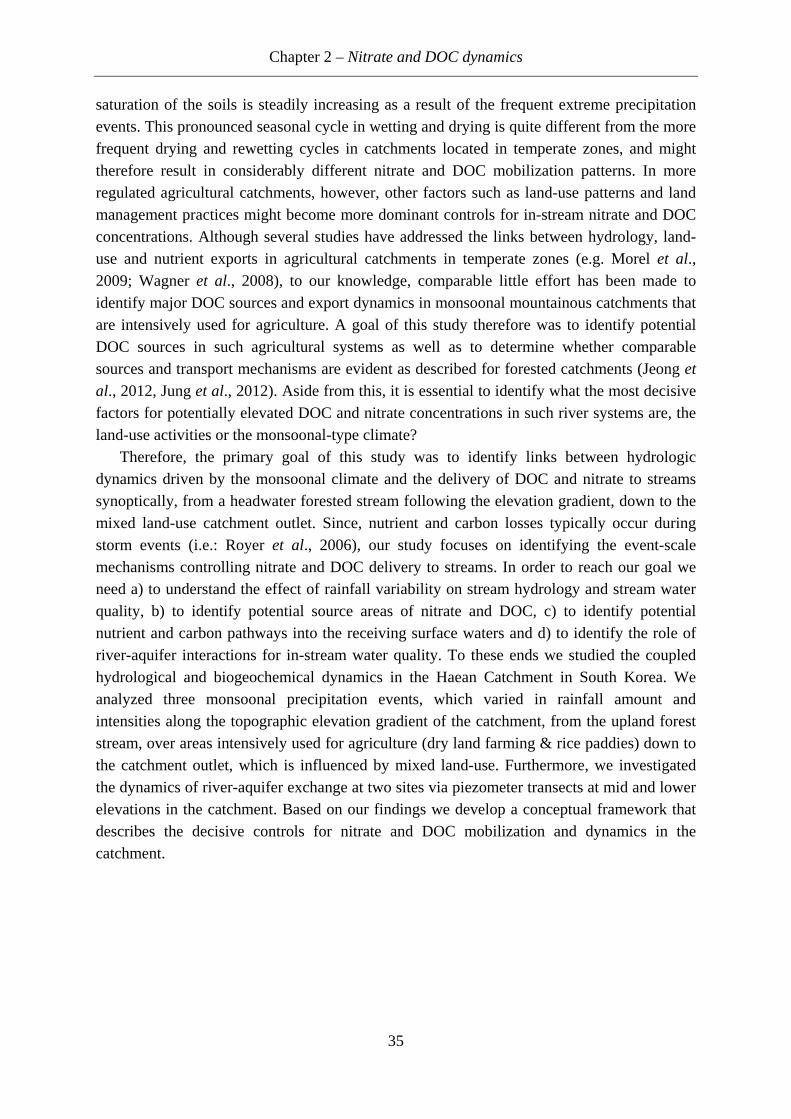
Chapter 2 – Nitrate and DOC dynamics
35
saturation of the soils is steadily increasing as a result of the frequent extreme precipitation events. This pronounced seasonal cycle in wetting and drying is quite different from the more frequent drying and rewetting cycles in catchments located in temperate zones, and might therefore result in considerably different nitrate and DOC mobilization patterns. In more regulated agricultural catchments, however, other factors such as land-use patterns and land management practices might become more dominant controls for in-stream nitrate and DOC concentrations. Although several studies have addressed the links between hydrology, land-use and nutrient exports in agricultural catchments in temperate zones (e.g. Morel et al., 2009; Wagner et al., 2008), to our knowledge, comparable little effort has been made to identify major DOC sources and export dynamics in monsoonal mountainous catchments that are intensively used for agriculture. A goal of this study therefore was to identify potential DOC sources in such agricultural systems as well as to determine whether comparable sources and transport mechanisms are evident as described for forested catchments (Jeong et
al., 2012, Jung et al., 2012). Aside from this, it is essential to identify what the most decisive factors for potentially elevated DOC and nitrate concentrations in such river systems are, the land-use activities or the monsoonal-type climate?
Therefore, the primary goal of this study was to identify links between hydrologic dynamics driven by the monsoonal climate and the delivery of DOC and nitrate to streams synoptically, from a headwater forested stream following the elevation gradient, down to the mixed land-use catchment outlet. Since, nutrient and carbon losses typically occur during storm events (i.e.: Royer et al., 2006), our study focuses on identifying the event-scale mechanisms controlling nitrate and DOC delivery to streams. In order to reach our goal we need a) to understand the effect of rainfall variability on stream hydrology and stream water quality, b) to identify potential source areas of nitrate and DOC, c) to identify potential nutrient and carbon pathways into the receiving surface waters and d) to identify the role of river-aquifer interactions for in-stream water quality. To these ends we studied the coupled hydrological and biogeochemical dynamics in the Haean Catchment in South Korea. We analyzed three monsoonal precipitation events, which varied in rainfall amount and intensities along the topographic elevation gradient of the catchment, from the upland forest stream, over areas intensively used for agriculture (dry land farming & rice paddies) down to the catchment outlet, which is influenced by mixed land-use. Furthermore, we investigated the dynamics of river-aquifer exchange at two sites via piezometer transects at mid and lower elevations in the catchment. Based on our findings we develop a conceptual framework that describes the decisive controls for nitrate and DOC mobilization and dynamics in the catchment.
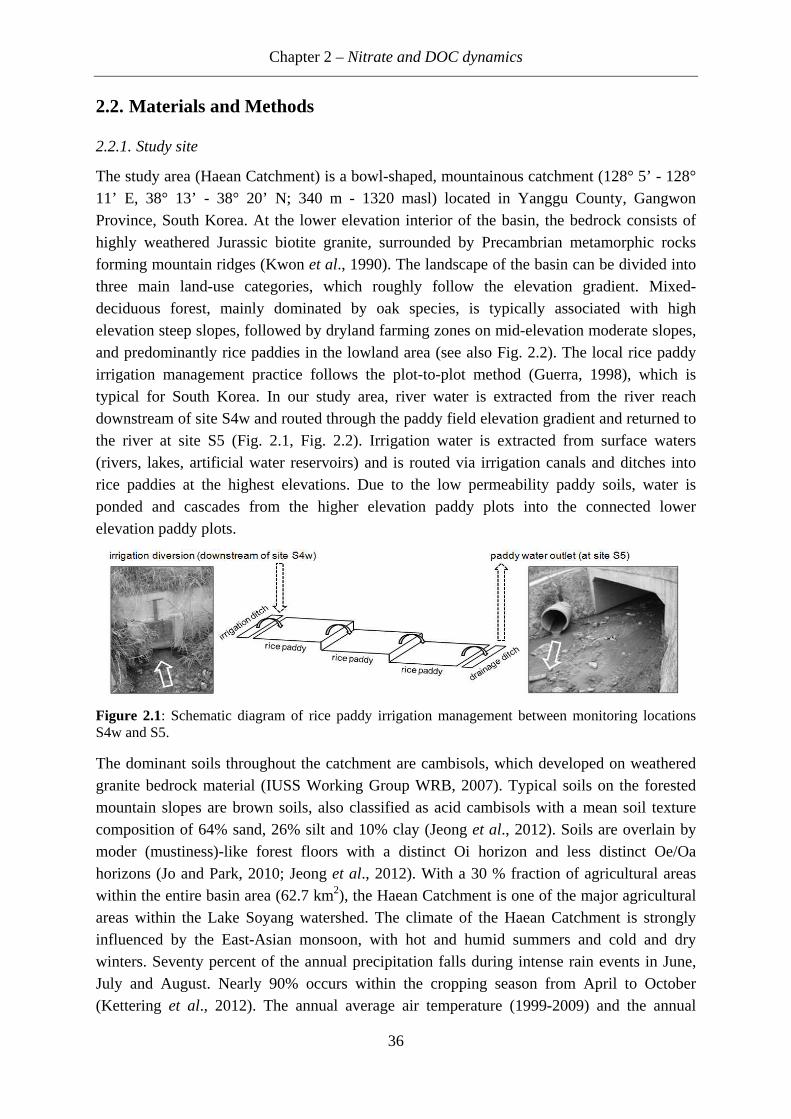
Chapter 2 – Nitrate and DOC dynamics
36
2.2. Materials and Methods
2.2.1. Study site
The study area (Haean Catchment) is a bowl-shaped, mountainous catchment (128° 5’ - 128° 11’ E, 38° 13’ - 38° 20’ N; 340 m - 1320 masl) located in Yanggu County, Gangwon Province, South Korea. At the lower elevation interior of the basin, the bedrock consists of highly weathered Jurassic biotite granite, surrounded by Precambrian metamorphic rocks forming mountain ridges (Kwon et al., 1990). The landscape of the basin can be divided into three main land-use categories, which roughly follow the elevation gradient. Mixed-deciduous forest, mainly dominated by oak species, is typically associated with high elevation steep slopes, followed by dryland farming zones on mid-elevation moderate slopes, and predominantly rice paddies in the lowland area (see also Fig. 2.2). The local rice paddy irrigation management practice follows the plot-to-plot method (Guerra, 1998), which is typical for South Korea. In our study area, river water is extracted from the river reach downstream of site S4w and routed through the paddy field elevation gradient and returned to the river at site S5 (Fig. 2.1, Fig. 2.2). Irrigation water is extracted from surface waters (rivers, lakes, artificial water reservoirs) and is routed via irrigation canals and ditches into rice paddies at the highest elevations. Due to the low permeability paddy soils, water is ponded and cascades from the higher elevation paddy plots into the connected lower elevation paddy plots.
Figure 2.1: Schematic diagram of rice paddy irrigation management between monitoring locations S4w and S5.
The dominant soils throughout the catchment are cambisols, which developed on weathered granite bedrock material (IUSS Working Group WRB, 2007). Typical soils on the forested mountain slopes are brown soils, also classified as acid cambisols with a mean soil texture composition of 64% sand, 26% silt and 10% clay (Jeong et al., 2012). Soils are overlain by moder (mustiness)-like forest floors with a distinct Oi horizon and less distinct Oe/Oa horizons (Jo and Park, 2010; Jeong et al., 2012). With a 30 % fraction of agricultural areas within the entire basin area (62.7 km2), the Haean Catchment is one of the major agricultural areas within the Lake Soyang watershed. The climate of the Haean Catchment is strongly influenced by the East-Asian monsoon, with hot and humid summers and cold and dry winters. Seventy percent of the annual precipitation falls during intense rain events in June, July and August. Nearly 90% occurs within the cropping season from April to October (Kettering et al., 2012). The annual average air temperature (1999-2009) and the annual
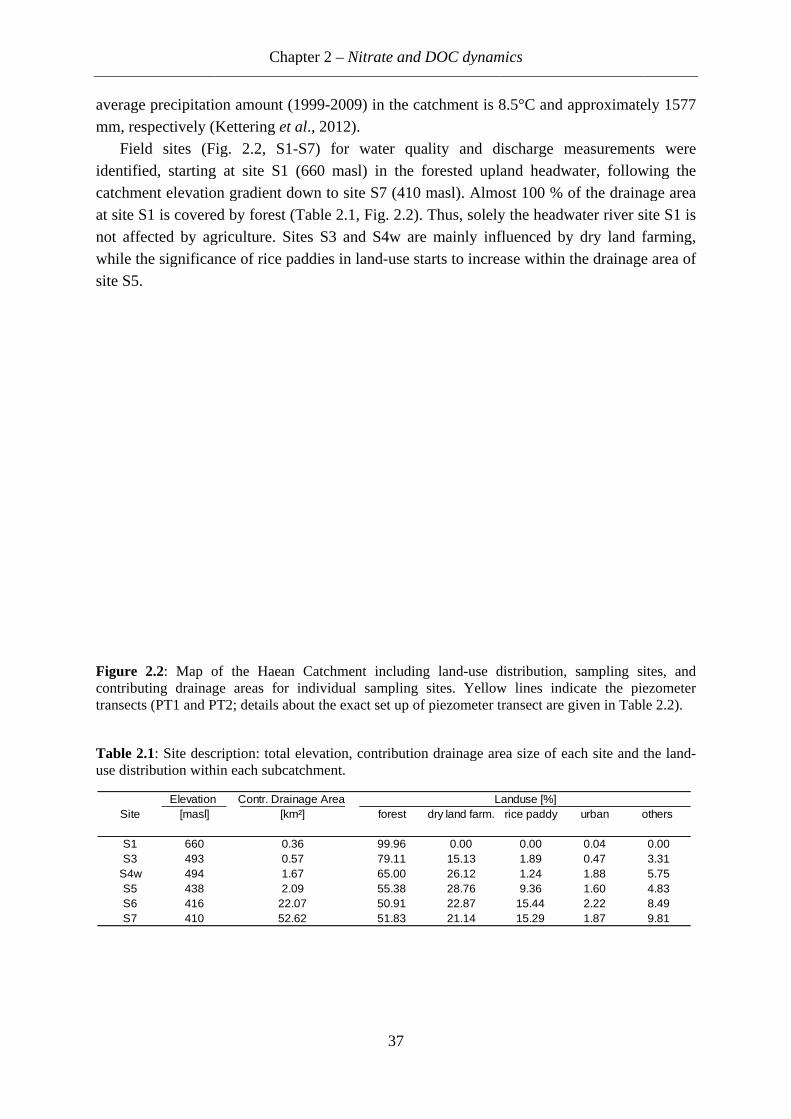
average precipitation amount (1999mm, respectively (Kettering
Field sites (identified, starting at site S1 (660 masl) in the forested upland headwater, following the catchment elevation gradient down to site S7 (410 masl). Almost 100 % of the drainagat site S1 is covered by forest (Table not affected by agriculture. Sites S3 and S4w are mainly influenced by dry land farming, while the significance of rice paddies in site S5.
Figure 2.contributing drainage areas for individual sampling sites. Yellow lines indicate the pietransects (PT1 and PT2; details about the exact set up of piezometer transect are given in Table
Table 2.use distribut
Site
S1S3
S4wS5S6S7
average precipitation amount (1999mm, respectively (Kettering
Field sites (Fig.identified, starting at site S1 (660 masl) in the forested upland headwater, following the catchment elevation gradient down to site S7 (410 masl). Almost 100 % of the drainagat site S1 is covered by forest (Table not affected by agriculture. Sites S3 and S4w are mainly influenced by dry land farming, while the significance of rice paddies in
Figure 2.2: Map of the Haean Catchment including contributing drainage areas for individual sampling sites. Yellow lines indicate the pietransects (PT1 and PT2; details about the exact set up of piezometer transect are given in Table
Table 2.1: Site description: total elevation, contribution drainage area size of each site and the distribution within each subcatchment.
Elevation [masl]
660493494438416410
Chapter 2
average precipitation amount (1999mm, respectively (Kettering et al
Fig. 2.2, S1identified, starting at site S1 (660 masl) in the forested upland headwater, following the catchment elevation gradient down to site S7 (410 masl). Almost 100 % of the drainagat site S1 is covered by forest (Table not affected by agriculture. Sites S3 and S4w are mainly influenced by dry land farming, while the significance of rice paddies in
Map of the Haean Catchment including contributing drainage areas for individual sampling sites. Yellow lines indicate the pietransects (PT1 and PT2; details about the exact set up of piezometer transect are given in Table
: Site description: total elevation, contribution drainage area size of each site and the ion within each subcatchment.
Elevation Contr. Drainage Area [km²]
0.360.571.672.09
22.0752.62
Chapter 2 – Nitrate and DOC dynamics
average precipitation amount (1999-2009) in the catchment is 8.5°C and approximately 1577 et al., 2012).
2, S1-S7) for water quality and discharge measurements were identified, starting at site S1 (660 masl) in the forested upland headwater, following the catchment elevation gradient down to site S7 (410 masl). Almost 100 % of the drainagat site S1 is covered by forest (Table 2.1, not affected by agriculture. Sites S3 and S4w are mainly influenced by dry land farming, while the significance of rice paddies in land
Map of the Haean Catchment including contributing drainage areas for individual sampling sites. Yellow lines indicate the pietransects (PT1 and PT2; details about the exact set up of piezometer transect are given in Table
: Site description: total elevation, contribution drainage area size of each site and the ion within each subcatchment.
Contr. Drainage Area [km²]
0.360.571.672.09
22.0752.62
Nitrate and DOC dynamics
37
2009) in the catchment is 8.5°C and approximately 1577 ., 2012).
S7) for water quality and discharge measurements were identified, starting at site S1 (660 masl) in the forested upland headwater, following the catchment elevation gradient down to site S7 (410 masl). Almost 100 % of the drainag
1, Fig. 2.2). Thus, solely the headwater river site S1 is not affected by agriculture. Sites S3 and S4w are mainly influenced by dry land farming,
land-use starts to
Map of the Haean Catchment including contributing drainage areas for individual sampling sites. Yellow lines indicate the pietransects (PT1 and PT2; details about the exact set up of piezometer transect are given in Table
: Site description: total elevation, contribution drainage area size of each site and the
forest dry land farm.
99.9679.1165.0055.3850.9151.83
Nitrate and DOC dynamics
2009) in the catchment is 8.5°C and approximately 1577
S7) for water quality and discharge measurements were identified, starting at site S1 (660 masl) in the forested upland headwater, following the catchment elevation gradient down to site S7 (410 masl). Almost 100 % of the drainag
2). Thus, solely the headwater river site S1 is not affected by agriculture. Sites S3 and S4w are mainly influenced by dry land farming,
starts to increase within the drainage area of
Map of the Haean Catchment including land-use distribution, sampling sites, and contributing drainage areas for individual sampling sites. Yellow lines indicate the pietransects (PT1 and PT2; details about the exact set up of piezometer transect are given in Table
: Site description: total elevation, contribution drainage area size of each site and the
dry land farm.
0.0015.1326.1228.7622.8721.14
Landuse [%]
Nitrate and DOC dynamics
2009) in the catchment is 8.5°C and approximately 1577
S7) for water quality and discharge measurements were identified, starting at site S1 (660 masl) in the forested upland headwater, following the catchment elevation gradient down to site S7 (410 masl). Almost 100 % of the drainag
2). Thus, solely the headwater river site S1 is not affected by agriculture. Sites S3 and S4w are mainly influenced by dry land farming,
increase within the drainage area of
distribution, sampling sites, and contributing drainage areas for individual sampling sites. Yellow lines indicate the pietransects (PT1 and PT2; details about the exact set up of piezometer transect are given in Table
: Site description: total elevation, contribution drainage area size of each site and the
rice paddy
0.001.891.249.36
15.4415.29
Landuse [%]
2009) in the catchment is 8.5°C and approximately 1577
S7) for water quality and discharge measurements were identified, starting at site S1 (660 masl) in the forested upland headwater, following the catchment elevation gradient down to site S7 (410 masl). Almost 100 % of the drainag
2). Thus, solely the headwater river site S1 is not affected by agriculture. Sites S3 and S4w are mainly influenced by dry land farming,
increase within the drainage area of
distribution, sampling sites, and contributing drainage areas for individual sampling sites. Yellow lines indicate the pietransects (PT1 and PT2; details about the exact set up of piezometer transect are given in Table
: Site description: total elevation, contribution drainage area size of each site and the
urban others
0.040.471.881.602.221.87
2009) in the catchment is 8.5°C and approximately 1577
S7) for water quality and discharge measurements were identified, starting at site S1 (660 masl) in the forested upland headwater, following the catchment elevation gradient down to site S7 (410 masl). Almost 100 % of the drainage area
2). Thus, solely the headwater river site S1 is not affected by agriculture. Sites S3 and S4w are mainly influenced by dry land farming,
increase within the drainage area of
distribution, sampling sites, and contributing drainage areas for individual sampling sites. Yellow lines indicate the piezometer transects (PT1 and PT2; details about the exact set up of piezometer transect are given in Table 2.2).
: Site description: total elevation, contribution drainage area size of each site and the land-
others
0.003.315.754.838.499.81
Chapter 2 – Nitrate and DOC dynamics
38
2.2.2. Instrumentation, data collection and data analysis
Discharge measurements and weather observations
Stream discharge was observed at all water quality monitoring sites presented in Figure 2.2 (S1, S3, S4w, S5, S6 and S7). At sites S1 and S4w sharp-crested V-notch weirs were constructed and instrumented with pressure transducers (S1: MDS-Dipper, SEBA Hydrometrie GmbH, Germany, ±0.01 m; and S4w: M10 Levelogger, Model 3001, Solinst Ltd., Canada, ±0.01 m) for continuous discharge monitoring (sample interval: 30 min). At sites S3, S5, S6 and S7 pressure transducers (M10 Levelogger, Model 3001, Solinst Ltd., Canada, ±0.01 m) for continuous water level monitoring were installed in stilling wells. Stream discharge at a range of stage heights was manually measured with the area-velocity method using an electromagnetic current meter (FlowSens, ±0.5%, SEBA Hydrometrie GmbH, Kaufbeuren, Germany). The monitored river stages and corresponding discharges were used to develop stage-discharge rating curves. By means of the rating curves and the continuously recorded river stages, continuous discharge estimates were obtained as described by Shope et al. (2013). For separating the received discharge into rapid (surface runoff) and delayed and slow flow components (subsurface, base- and interflow) we used the web-based hydrograph analysis tool WHAT (Lim et al., 2005) which is based on a digital filter method, which separates the fast flow component characterized by high frequency waves from the low frequency slow flow component. Precipitation and air temperature were recorded at 30 minute intervals using an automatic weather station WST 11 (WS-GP1, Delta-T Devices, Cambridge, UK) which is located between the sites S4w and S5 (Fig. 2.2).
Assessment of river-aquifer interaction
To examine temporal river-aquifer interactions, we installed two piezometer transects perpendicular to the stream. The first piezometer transect (PT1) was installed across a second-order stream, located in the mid-elevation area of the catchment, between site S4w and S5 (Fig. 2.2) where dry land farming and rice paddies are the dominant land-uses. A second piezometer transect (PT2) was installed across the main stem of the Mandae River (third-order stream) (Fig. 2.2) in the rice-paddy dominated lower part of the catchment. PT1 consists of four and PT2 of five 2-inch diameter, polyvinyl chloride (PVC) piezometers with 0.5 m screened intervals at their lower end. At PT2, we also located one piezometer (W8) in the center of the river channel to monitor the vertical hydraulic gradient between the river and the groundwater. All piezometers were equipped with pressure transducers (M10 Levelogger, Model 3001, Solinst Ltd., Canada, ±0.01 m) that recorded total head and temperature at 30 minute intervals over the time period from March through October 2010. Additionally, stilling wells equipped with M10 Leveloggers, were installed directly in the streams to monitor river stage. Similar to the groundwater levels, river stage elevation was recorded every 30 minutes. Water level readings recorded by leveloggers were barometrically compensated for atmospheric pressure variations with an absolute pressure transducer (Barologger, Model 3001, Solinst Ltd., Canada), attached to the top of piezometer W5. Well construction details for individual piezometers are presented in Table 2.2.
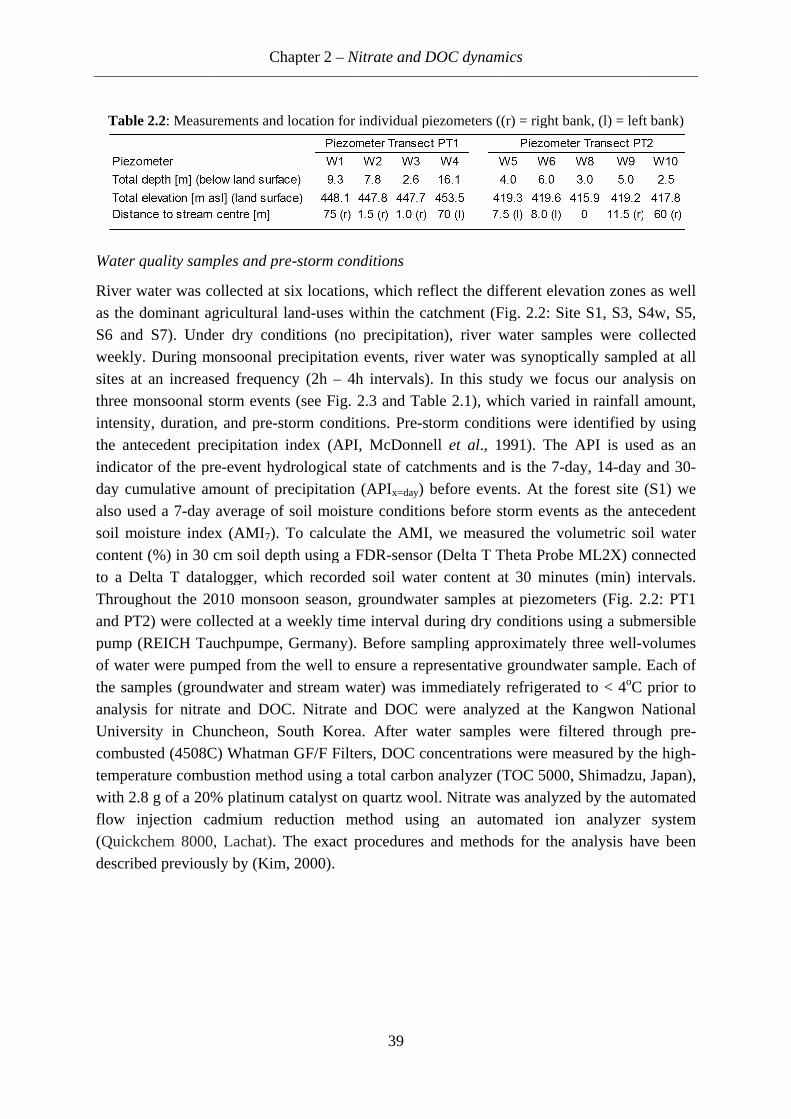
Table 2.
Water quality samples and pre
River water was collected at six locations, which reflect the different elevation zones as well as the dominant agricultural S6 and S7). Under dry conditions (no precipitation), river waweekly. During monsoonal precipitation events, river water was synoptically sampled at all sites at an increased frequency (2h three monsoonal storm events (see intensity, duration, and prethe antecedent precipitation index (API, McDonnell indicator of the preday cumulative amount of precipitation (APIalso used a 7soil moiscontent (%) in 30 cm soil depth using a FDRto a Delta T datalogger, which recorded soil water content at 30 minutes (min) intervals.Throughout the 2010 monsoon season, groundwater samples at piezometers (and PT2) were collected at a weekly time interval during dry conditions using a submersible pump (REICH Tauchpumpe, Germany). Before sampling approximately three wellof water were pumped from the well to ensure a representative groundwater sample. Each of the samples (groundwater and stream water) was immediately refrigerated to < 4analysis for nitrate and DOC. Nitrate and DOC were analyzed at the KanUniversity in Chuncheon, South Korea. After water samples were filtered through precombusted (4508C) Whatman GF/F Filters, DOC concentrations were measured by the temperature combustionwith 2.8 g of a 20% flow injection (Quickchem 8000, Lachat)described previously by (Kim, 2000).
Table 2.2: Measurements and location for individual piezometers ((r) = right bank, (l) = left bank)
Water quality samples and pre
River water was collected at six locations, which reflect the different elevation zones as well as the dominant agricultural S6 and S7). Under dry conditions (no precipitation), river waweekly. During monsoonal precipitation events, river water was synoptically sampled at all sites at an increased frequency (2h three monsoonal storm events (see intensity, duration, and prethe antecedent precipitation index (API, McDonnell indicator of the preday cumulative amount of precipitation (APIalso used a 7-day average of soil moisture conditions before storm events as the antecedent soil moisture index (AMIcontent (%) in 30 cm soil depth using a FDRto a Delta T datalogger, which recorded soil water content at 30 minutes (min) intervals.Throughout the 2010 monsoon season, groundwater samples at piezometers (and PT2) were collected at a weekly time interval during dry conditions using a submersible pump (REICH Tauchpumpe, Germany). Before sampling approximately three wellof water were pumped from the well to ensure a representative groundwater sample. Each of the samples (groundwater and stream water) was immediately refrigerated to < 4analysis for nitrate and DOC. Nitrate and DOC were analyzed at the KanUniversity in Chuncheon, South Korea. After water samples were filtered through precombusted (4508C) Whatman GF/F Filters, DOC concentrations were measured by the temperature combustionwith 2.8 g of a 20% flow injection cadmium Quickchem 8000, Lachat)
described previously by (Kim, 2000).
Chapter 2
: Measurements and location for individual piezometers ((r) = right bank, (l) = left bank)
Water quality samples and pre
River water was collected at six locations, which reflect the different elevation zones as well as the dominant agricultural landS6 and S7). Under dry conditions (no precipitation), river waweekly. During monsoonal precipitation events, river water was synoptically sampled at all sites at an increased frequency (2h three monsoonal storm events (see intensity, duration, and pre-storm conditions. Prethe antecedent precipitation index (API, McDonnell indicator of the pre-event hydrological state of catchments and is the 7day cumulative amount of precipitation (API
day average of soil moisture conditions before storm events as the antecedent ture index (AMI7). To calculate the AMI, we measured the volumetric soil water
content (%) in 30 cm soil depth using a FDRto a Delta T datalogger, which recorded soil water content at 30 minutes (min) intervals.Throughout the 2010 monsoon season, groundwater samples at piezometers (and PT2) were collected at a weekly time interval during dry conditions using a submersible pump (REICH Tauchpumpe, Germany). Before sampling approximately three wellof water were pumped from the well to ensure a representative groundwater sample. Each of the samples (groundwater and stream water) was immediately refrigerated to < 4analysis for nitrate and DOC. Nitrate and DOC were analyzed at the KanUniversity in Chuncheon, South Korea. After water samples were filtered through precombusted (4508C) Whatman GF/F Filters, DOC concentrations were measured by the temperature combustion method using a total carbon analyzer with 2.8 g of a 20% platinum catalyst on quartz wool. Nitrate was analyzed by the automated
admium reduction method using aQuickchem 8000, Lachat). The exact procedures and methods for the a
described previously by (Kim, 2000).
Chapter 2 – Nitrate and DOC dynamics
: Measurements and location for individual piezometers ((r) = right bank, (l) = left bank)
Water quality samples and pre-storm condi
River water was collected at six locations, which reflect the different elevation zones as well land-uses within the catchment (
S6 and S7). Under dry conditions (no precipitation), river waweekly. During monsoonal precipitation events, river water was synoptically sampled at all sites at an increased frequency (2h – 4h intervals). In this study we focus our analysis on three monsoonal storm events (see Fig. 2.
storm conditions. Prethe antecedent precipitation index (API, McDonnell
drological state of catchments and is the 7day cumulative amount of precipitation (API
day average of soil moisture conditions before storm events as the antecedent ). To calculate the AMI, we measured the volumetric soil water
content (%) in 30 cm soil depth using a FDRto a Delta T datalogger, which recorded soil water content at 30 minutes (min) intervals.Throughout the 2010 monsoon season, groundwater samples at piezometers (and PT2) were collected at a weekly time interval during dry conditions using a submersible pump (REICH Tauchpumpe, Germany). Before sampling approximately three wellof water were pumped from the well to ensure a representative groundwater sample. Each of the samples (groundwater and stream water) was immediately refrigerated to < 4analysis for nitrate and DOC. Nitrate and DOC were analyzed at the KanUniversity in Chuncheon, South Korea. After water samples were filtered through precombusted (4508C) Whatman GF/F Filters, DOC concentrations were measured by the
method using a total carbon analyzer latinum catalyst on quartz wool. Nitrate was analyzed by the automated
eduction method using a. The exact procedures and methods for the a
described previously by (Kim, 2000).
Nitrate and DOC dynamics
39
: Measurements and location for individual piezometers ((r) = right bank, (l) = left bank)
storm conditions
River water was collected at six locations, which reflect the different elevation zones as well s within the catchment (
S6 and S7). Under dry conditions (no precipitation), river waweekly. During monsoonal precipitation events, river water was synoptically sampled at all
4h intervals). In this study we focus our analysis on 2.3 and Table
storm conditions. Pre-storm conditions were identified by using the antecedent precipitation index (API, McDonnell
drological state of catchments and is the 7day cumulative amount of precipitation (APIx=day) before events. At the forest site (S1) we
day average of soil moisture conditions before storm events as the antecedent ). To calculate the AMI, we measured the volumetric soil water
content (%) in 30 cm soil depth using a FDR-sensor (Delta T Theta Probe ML2X) connected to a Delta T datalogger, which recorded soil water content at 30 minutes (min) intervals.Throughout the 2010 monsoon season, groundwater samples at piezometers (and PT2) were collected at a weekly time interval during dry conditions using a submersible pump (REICH Tauchpumpe, Germany). Before sampling approximately three wellof water were pumped from the well to ensure a representative groundwater sample. Each of the samples (groundwater and stream water) was immediately refrigerated to < 4analysis for nitrate and DOC. Nitrate and DOC were analyzed at the KanUniversity in Chuncheon, South Korea. After water samples were filtered through precombusted (4508C) Whatman GF/F Filters, DOC concentrations were measured by the
method using a total carbon analyzer latinum catalyst on quartz wool. Nitrate was analyzed by the automated
eduction method using a. The exact procedures and methods for the a
Nitrate and DOC dynamics
: Measurements and location for individual piezometers ((r) = right bank, (l) = left bank)
River water was collected at six locations, which reflect the different elevation zones as well s within the catchment (Fig.
S6 and S7). Under dry conditions (no precipitation), river waweekly. During monsoonal precipitation events, river water was synoptically sampled at all
4h intervals). In this study we focus our analysis on Table 2.1), which varied in rainfall amount,
storm conditions were identified by using the antecedent precipitation index (API, McDonnell et al., 1991). The API is used as an
drological state of catchments and is the 7) before events. At the forest site (S1) we
day average of soil moisture conditions before storm events as the antecedent ). To calculate the AMI, we measured the volumetric soil water
sensor (Delta T Theta Probe ML2X) connected to a Delta T datalogger, which recorded soil water content at 30 minutes (min) intervals.Throughout the 2010 monsoon season, groundwater samples at piezometers (and PT2) were collected at a weekly time interval during dry conditions using a submersible pump (REICH Tauchpumpe, Germany). Before sampling approximately three wellof water were pumped from the well to ensure a representative groundwater sample. Each of the samples (groundwater and stream water) was immediately refrigerated to < 4analysis for nitrate and DOC. Nitrate and DOC were analyzed at the KanUniversity in Chuncheon, South Korea. After water samples were filtered through precombusted (4508C) Whatman GF/F Filters, DOC concentrations were measured by the
method using a total carbon analyzer (TOC latinum catalyst on quartz wool. Nitrate was analyzed by the automated
eduction method using an automated . The exact procedures and methods for the a
Nitrate and DOC dynamics
: Measurements and location for individual piezometers ((r) = right bank, (l) = left bank)
River water was collected at six locations, which reflect the different elevation zones as well Fig. 2.2: Site S1, S3, S4w, S5,
S6 and S7). Under dry conditions (no precipitation), river water samples were collected weekly. During monsoonal precipitation events, river water was synoptically sampled at all
4h intervals). In this study we focus our analysis on 1), which varied in rainfall amount,
storm conditions were identified by using ., 1991). The API is used as an
drological state of catchments and is the 7-day, 14) before events. At the forest site (S1) we
day average of soil moisture conditions before storm events as the antecedent ). To calculate the AMI, we measured the volumetric soil water
sensor (Delta T Theta Probe ML2X) connected to a Delta T datalogger, which recorded soil water content at 30 minutes (min) intervals.Throughout the 2010 monsoon season, groundwater samples at piezometers (and PT2) were collected at a weekly time interval during dry conditions using a submersible pump (REICH Tauchpumpe, Germany). Before sampling approximately three wellof water were pumped from the well to ensure a representative groundwater sample. Each of the samples (groundwater and stream water) was immediately refrigerated to < 4analysis for nitrate and DOC. Nitrate and DOC were analyzed at the KanUniversity in Chuncheon, South Korea. After water samples were filtered through precombusted (4508C) Whatman GF/F Filters, DOC concentrations were measured by the
(TOC 5000, latinum catalyst on quartz wool. Nitrate was analyzed by the automated
utomated ion . The exact procedures and methods for the a
: Measurements and location for individual piezometers ((r) = right bank, (l) = left bank)
River water was collected at six locations, which reflect the different elevation zones as well 2: Site S1, S3, S4w, S5,
ter samples were collected weekly. During monsoonal precipitation events, river water was synoptically sampled at all
4h intervals). In this study we focus our analysis on 1), which varied in rainfall amount,
storm conditions were identified by using ., 1991). The API is used as an
day, 14-day and 30) before events. At the forest site (S1) we
day average of soil moisture conditions before storm events as the antecedent ). To calculate the AMI, we measured the volumetric soil water
sensor (Delta T Theta Probe ML2X) connected to a Delta T datalogger, which recorded soil water content at 30 minutes (min) intervals.Throughout the 2010 monsoon season, groundwater samples at piezometers (Fig. 2.and PT2) were collected at a weekly time interval during dry conditions using a submersible pump (REICH Tauchpumpe, Germany). Before sampling approximately three well-voof water were pumped from the well to ensure a representative groundwater sample. Each of the samples (groundwater and stream water) was immediately refrigerated to < 4oC prior to analysis for nitrate and DOC. Nitrate and DOC were analyzed at the Kangwon National University in Chuncheon, South Korea. After water samples were filtered through precombusted (4508C) Whatman GF/F Filters, DOC concentrations were measured by the
, Shimadzu, Japan),latinum catalyst on quartz wool. Nitrate was analyzed by the automated
on analyzer syst. The exact procedures and methods for the analysis have been
: Measurements and location for individual piezometers ((r) = right bank, (l) = left bank)
River water was collected at six locations, which reflect the different elevation zones as well 2: Site S1, S3, S4w, S5,
ter samples were collected weekly. During monsoonal precipitation events, river water was synoptically sampled at all
4h intervals). In this study we focus our analysis on 1), which varied in rainfall amount,
storm conditions were identified by using ., 1991). The API is used as an
day and 30-) before events. At the forest site (S1) we
day average of soil moisture conditions before storm events as the antecedent ). To calculate the AMI, we measured the volumetric soil water
sensor (Delta T Theta Probe ML2X) connected to a Delta T datalogger, which recorded soil water content at 30 minutes (min) intervals.
2.2: PT1 and PT2) were collected at a weekly time interval during dry conditions using a submersible
volumes of water were pumped from the well to ensure a representative groundwater sample. Each of
C prior to gwon National
University in Chuncheon, South Korea. After water samples were filtered through pre-combusted (4508C) Whatman GF/F Filters, DOC concentrations were measured by the high-
, Japan), latinum catalyst on quartz wool. Nitrate was analyzed by the automated
nalyzer system nalysis have been
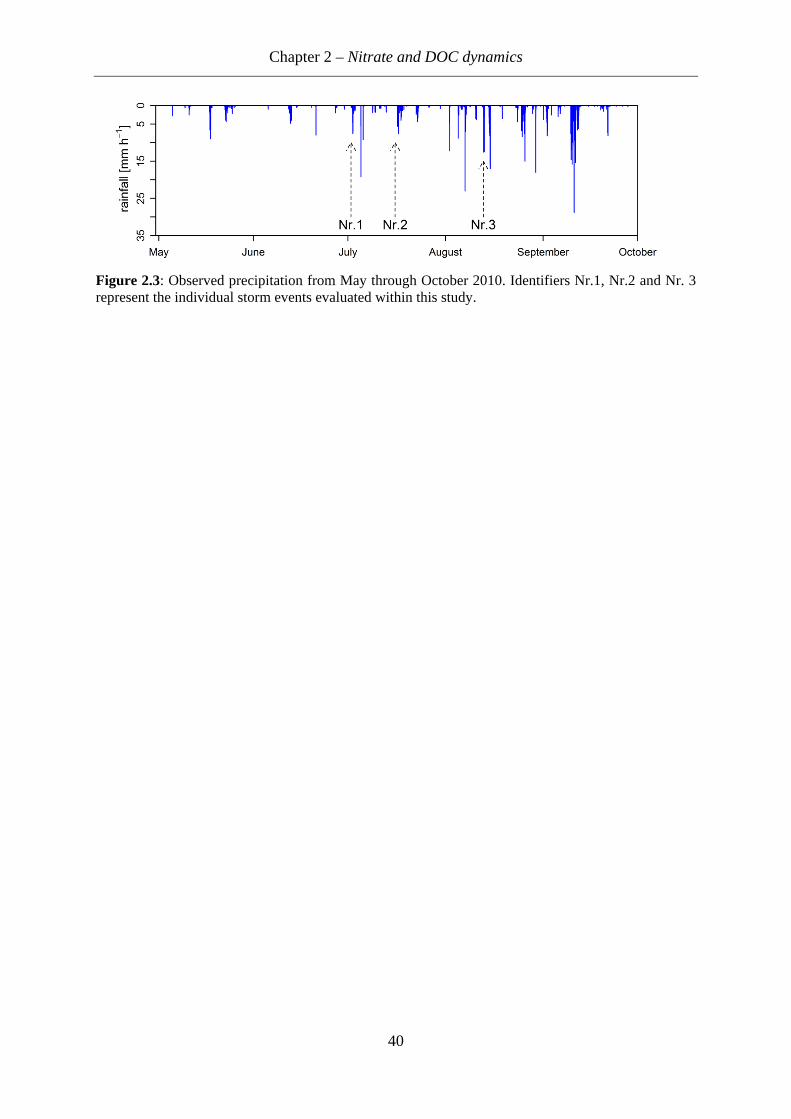
Chapter 2 – Nitrate and DOC dynamics
40
Figure 2.3: Observed precipitation from May through October 2010. Identifiers Nr.1, Nr.2 and Nr. 3 represent the individual storm events evaluated within this study.
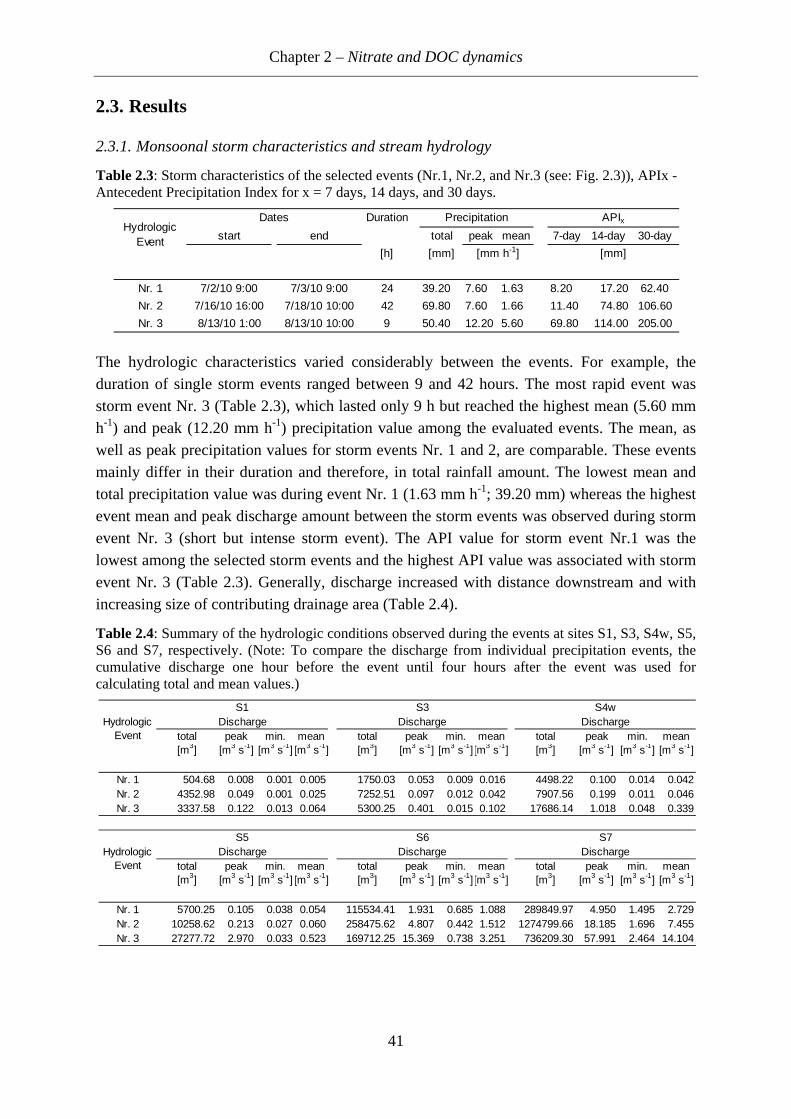
Chapter 2 – Nitrate and DOC dynamics
41
2.3. Results
2.3.1. Monsoonal storm characteristics and stream hydrology
Table 2.3: Storm characteristics of the selected events (Nr.1, Nr.2, and Nr.3 (see: Fig. 2.3)), APIx - Antecedent Precipitation Index for x = 7 days, 14 days, and 30 days.
The hydrologic characteristics varied considerably between the events. For example, the duration of single storm events ranged between 9 and 42 hours. The most rapid event was storm event Nr. 3 (Table 2.3), which lasted only 9 h but reached the highest mean (5.60 mm h-1) and peak (12.20 mm h-1) precipitation value among the evaluated events. The mean, as well as peak precipitation values for storm events Nr. 1 and 2, are comparable. These events mainly differ in their duration and therefore, in total rainfall amount. The lowest mean and total precipitation value was during event Nr. 1 (1.63 mm h-1; 39.20 mm) whereas the highest event mean and peak discharge amount between the storm events was observed during storm event Nr. 3 (short but intense storm event). The API value for storm event Nr.1 was the lowest among the selected storm events and the highest API value was associated with storm event Nr. 3 (Table 2.3). Generally, discharge increased with distance downstream and with increasing size of contributing drainage area (Table 2.4).
Table 2.4: Summary of the hydrologic conditions observed during the events at sites S1, S3, S4w, S5, S6 and S7, respectively. (Note: To compare the discharge from individual precipitation events, the cumulative discharge one hour before the event until four hours after the event was used for calculating total and mean values.)
Duration
start end total peak mean 7-day 14-day 30-day
[h] [mm]
Nr. 1 7/2/10 9:00 7/3/10 9:00 24 39.20 7.60 1.63 8.20 17.20 62.40
Nr. 2 7/16/10 16:00 7/18/10 10:00 42 69.80 7.60 1.66 11.40 74.80 106.60
Nr. 3 8/13/10 1:00 8/13/10 10:00 9 50.40 12.20 5.60 69.80 114.00 205.00
[mm]
Hydrologic Event
Dates Precipitation APIx
[mm h-1]
total peak min. mean total peak min. mean total peak min. mean[m3] [m3 s-1] [m3 s-1] [m3 s-1] [m3] [m3 s-1] [m3 s-1][m3 s-1] [m3] [m3 s-1] [m3 s-1] [m3 s-1]
Nr. 1 504.68 0.008 0.001 0.005 1750.03 0.053 0.009 0.016 4498.22 0.100 0.014 0.042Nr. 2 4352.98 0.049 0.001 0.025 7252.51 0.097 0.012 0.042 7907.56 0.199 0.011 0.046Nr. 3 3337.58 0.122 0.013 0.064 5300.25 0.401 0.015 0.102 17686.14 1.018 0.048 0.339
total peak min. mean total peak min. mean total peak min. mean[m3] [m3 s-1] [m3 s-1] [m3 s-1] [m3] [m3 s-1] [m3 s-1][m3 s-1] [m3] [m3 s-1] [m3 s-1] [m3 s-1]
Nr. 1 5700.25 0.105 0.038 0.054 115534.41 1.931 0.685 1.088 289849.97 4.950 1.495 2.729Nr. 2 10258.62 0.213 0.027 0.060 258475.62 4.807 0.442 1.512 1274799.66 18.185 1.696 7.455Nr. 3 27277.72 2.970 0.033 0.523 169712.25 15.369 0.738 3.251 736209.30 57.991 2.464 14.104
S7Discharge
Hydrologic Event
S1 S3Discharge
S4wDischarge
Hydrologic Event
DischargeS5
Discharge
S6Discharge
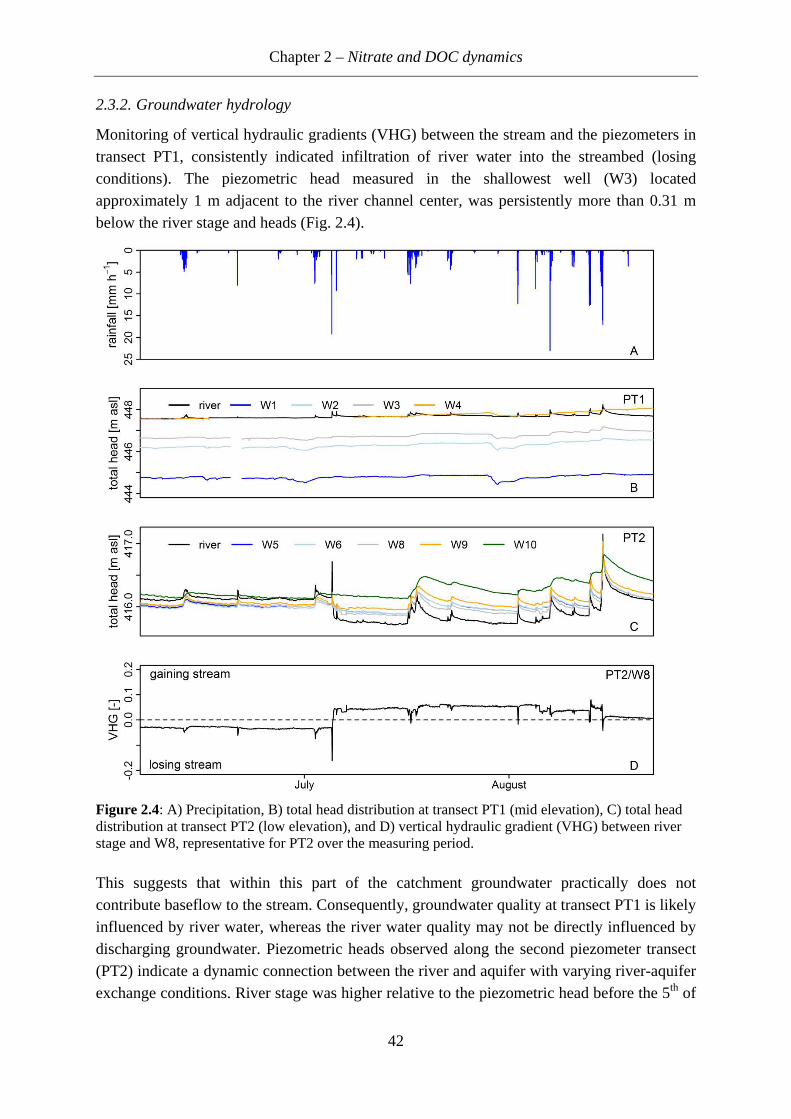
Chapter 2 – Nitrate and DOC dynamics
42
2.3.2. Groundwater hydrology
Monitoring of vertical hydraulic gradients (VHG) between the stream and the piezometers in transect PT1, consistently indicated infiltration of river water into the streambed (losing conditions). The piezometric head measured in the shallowest well (W3) located approximately 1 m adjacent to the river channel center, was persistently more than 0.31 m below the river stage and heads (Fig. 2.4).
Figure 2.4: A) Precipitation, B) total head distribution at transect PT1 (mid elevation), C) total head distribution at transect PT2 (low elevation), and D) vertical hydraulic gradient (VHG) between river stage and W8, representative for PT2 over the measuring period. This suggests that within this part of the catchment groundwater practically does not contribute baseflow to the stream. Consequently, groundwater quality at transect PT1 is likely influenced by river water, whereas the river water quality may not be directly influenced by discharging groundwater. Piezometric heads observed along the second piezometer transect (PT2) indicate a dynamic connection between the river and aquifer with varying river-aquifer exchange conditions. River stage was higher relative to the piezometric head before the 5th of
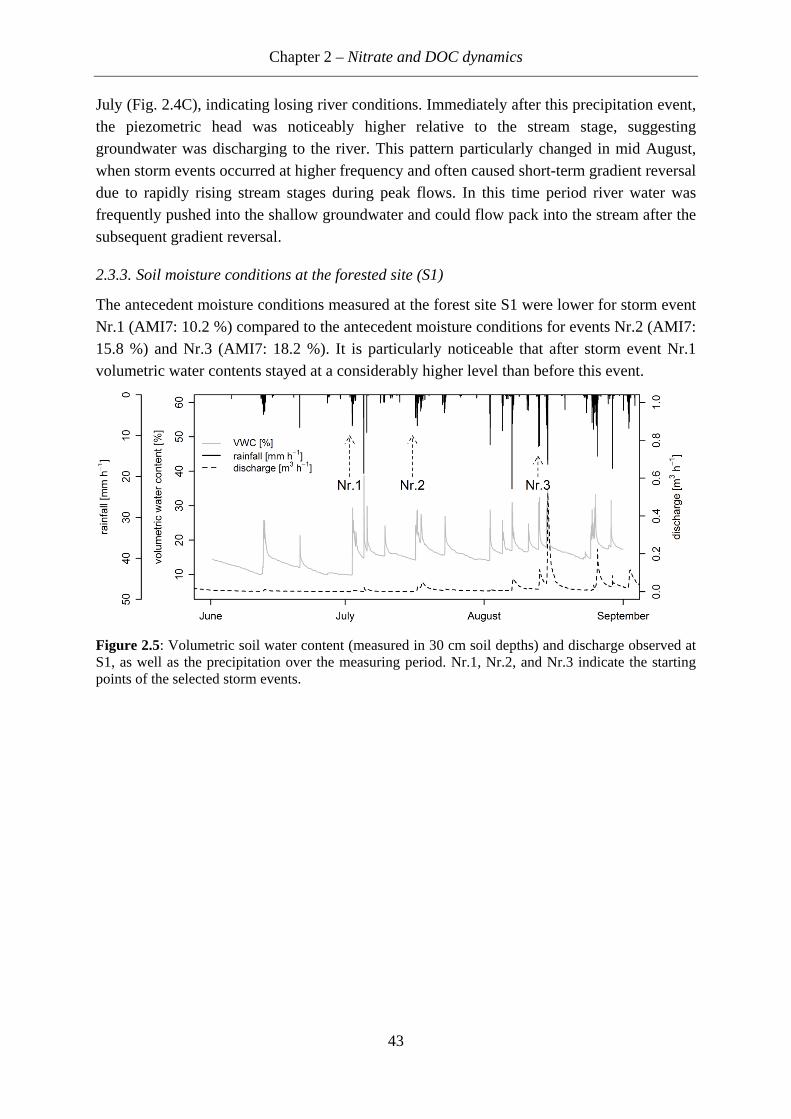
Chapter 2 – Nitrate and DOC dynamics
43
July (Fig. 2.4C), indicating losing river conditions. Immediately after this precipitation event, the piezometric head was noticeably higher relative to the stream stage, suggesting groundwater was discharging to the river. This pattern particularly changed in mid August, when storm events occurred at higher frequency and often caused short-term gradient reversal due to rapidly rising stream stages during peak flows. In this time period river water was frequently pushed into the shallow groundwater and could flow pack into the stream after the subsequent gradient reversal.
2.3.3. Soil moisture conditions at the forested site (S1)
The antecedent moisture conditions measured at the forest site S1 were lower for storm event Nr.1 (AMI7: 10.2 %) compared to the antecedent moisture conditions for events Nr.2 (AMI7: 15.8 %) and Nr.3 (AMI7: 18.2 %). It is particularly noticeable that after storm event Nr.1 volumetric water contents stayed at a considerably higher level than before this event.
Figure 2.5: Volumetric soil water content (measured in 30 cm soil depths) and discharge observed at S1, as well as the precipitation over the measuring period. Nr.1, Nr.2, and Nr.3 indicate the starting points of the selected storm events.
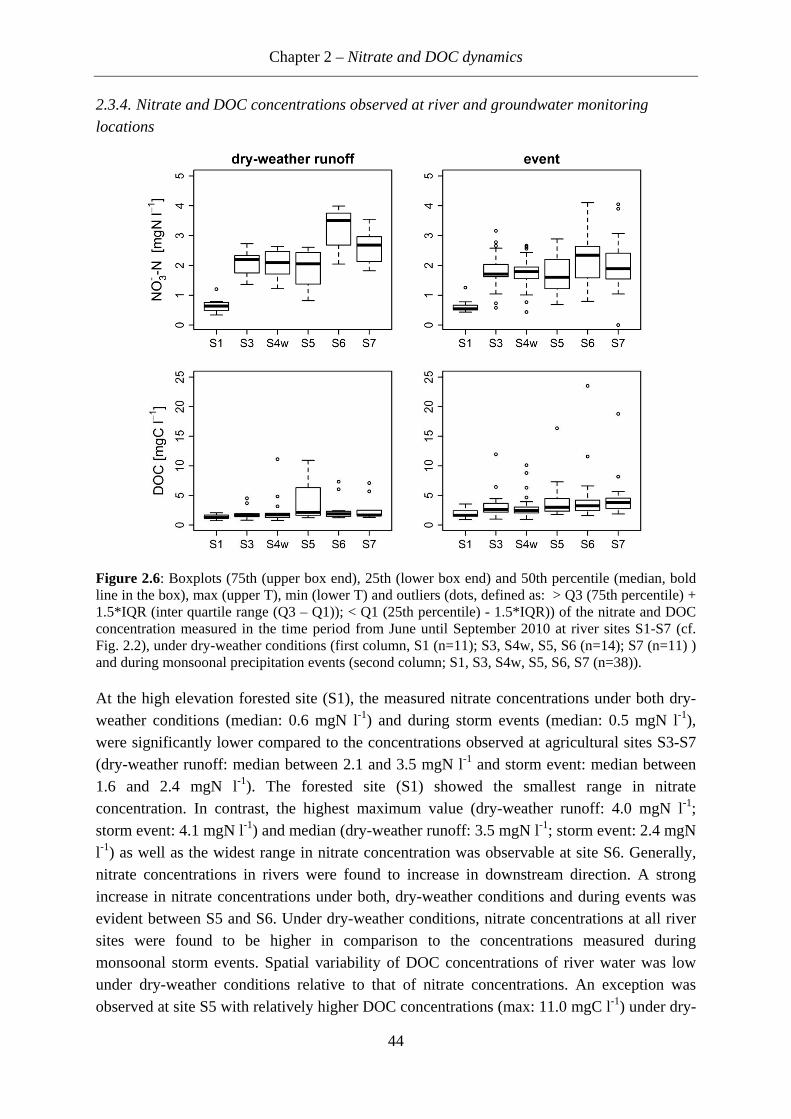
Chapter 2 – Nitrate and DOC dynamics
44
2.3.4. Nitrate and DOC concentrations observed at river and groundwater monitoring
locations
Figure 2.6: Boxplots (75th (upper box end), 25th (lower box end) and 50th percentile (median, bold line in the box), max (upper T), min (lower T) and outliers (dots, defined as: > Q3 (75th percentile) + 1.5*IQR (inter quartile range (Q3 – Q1)); < Q1 (25th percentile) - 1.5*IQR)) of the nitrate and DOC concentration measured in the time period from June until September 2010 at river sites S1-S7 (cf. Fig. 2.2), under dry-weather conditions (first column, S1 (n=11); S3, S4w, S5, S6 (n=14); S7 (n=11) ) and during monsoonal precipitation events (second column; S1, S3, S4w, S5, S6, S7 (n=38)). At the high elevation forested site (S1), the measured nitrate concentrations under both dry-weather conditions (median: 0.6 mgN l-1) and during storm events (median: 0.5 mgN l-1), were significantly lower compared to the concentrations observed at agricultural sites S3-S7 (dry-weather runoff: median between 2.1 and 3.5 mgN l-1 and storm event: median between 1.6 and 2.4 mgN l-1). The forested site (S1) showed the smallest range in nitrate concentration. In contrast, the highest maximum value (dry-weather runoff: 4.0 mgN l-1; storm event: 4.1 mgN l-1) and median (dry-weather runoff: 3.5 mgN l-1; storm event: 2.4 mgN l-1) as well as the widest range in nitrate concentration was observable at site S6. Generally, nitrate concentrations in rivers were found to increase in downstream direction. A strong increase in nitrate concentrations under both, dry-weather conditions and during events was evident between S5 and S6. Under dry-weather conditions, nitrate concentrations at all river sites were found to be higher in comparison to the concentrations measured during monsoonal storm events. Spatial variability of DOC concentrations of river water was low under dry-weather conditions relative to that of nitrate concentrations. An exception was observed at site S5 with relatively higher DOC concentrations (max: 11.0 mgC l-1) under dry-
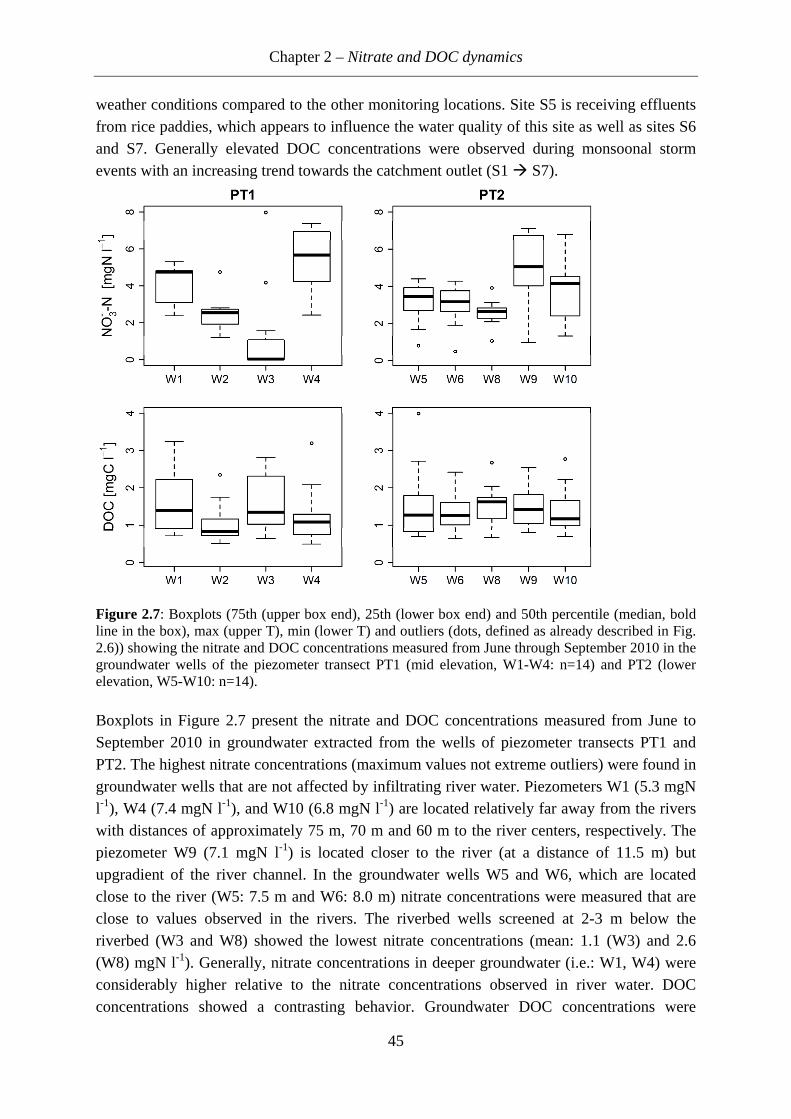
Chapter 2 – Nitrate and DOC dynamics
45
weather conditions compared to the other monitoring locations. Site S5 is receiving effluents from rice paddies, which appears to influence the water quality of this site as well as sites S6 and S7. Generally elevated DOC concentrations were observed during monsoonal storm events with an increasing trend towards the catchment outlet (S1 S7).
Figure 2.7: Boxplots (75th (upper box end), 25th (lower box end) and 50th percentile (median, bold line in the box), max (upper T), min (lower T) and outliers (dots, defined as already described in Fig. 2.6)) showing the nitrate and DOC concentrations measured from June through September 2010 in the groundwater wells of the piezometer transect PT1 (mid elevation, W1-W4: n=14) and PT2 (lower elevation, W5-W10: n=14).
Boxplots in Figure 2.7 present the nitrate and DOC concentrations measured from June to September 2010 in groundwater extracted from the wells of piezometer transects PT1 and PT2. The highest nitrate concentrations (maximum values not extreme outliers) were found in groundwater wells that are not affected by infiltrating river water. Piezometers W1 (5.3 mgN l-1), W4 (7.4 mgN l-1), and W10 (6.8 mgN l-1) are located relatively far away from the rivers with distances of approximately 75 m, 70 m and 60 m to the river centers, respectively. The piezometer W9 (7.1 mgN l-1) is located closer to the river (at a distance of 11.5 m) but upgradient of the river channel. In the groundwater wells W5 and W6, which are located close to the river (W5: 7.5 m and W6: 8.0 m) nitrate concentrations were measured that are close to values observed in the rivers. The riverbed wells screened at 2-3 m below the riverbed (W3 and W8) showed the lowest nitrate concentrations (mean: 1.1 (W3) and 2.6 (W8) mgN l-1). Generally, nitrate concentrations in deeper groundwater (i.e.: W1, W4) were considerably higher relative to the nitrate concentrations observed in river water. DOC concentrations showed a contrasting behavior. Groundwater DOC concentrations were
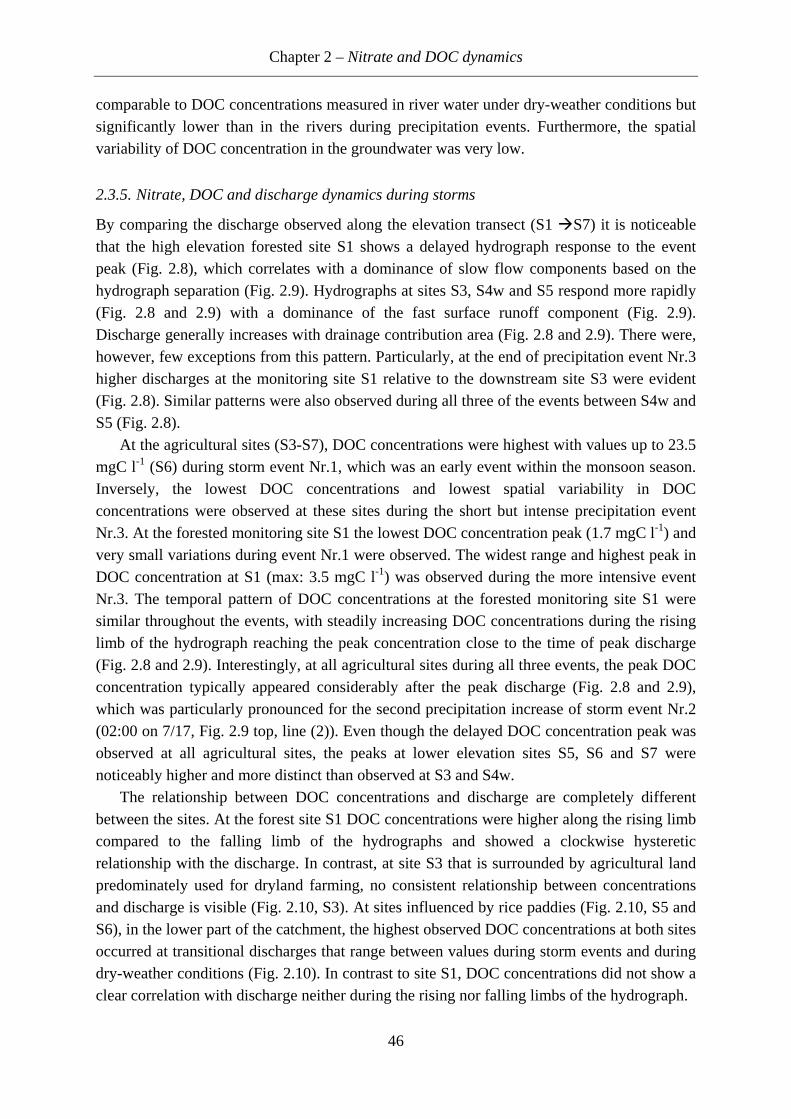
Chapter 2 – Nitrate and DOC dynamics
46
comparable to DOC concentrations measured in river water under dry-weather conditions but significantly lower than in the rivers during precipitation events. Furthermore, the spatial variability of DOC concentration in the groundwater was very low.
2.3.5. Nitrate, DOC and discharge dynamics during storms
By comparing the discharge observed along the elevation transect (S1 S7) it is noticeable that the high elevation forested site S1 shows a delayed hydrograph response to the event peak (Fig. 2.8), which correlates with a dominance of slow flow components based on the hydrograph separation (Fig. 2.9). Hydrographs at sites S3, S4w and S5 respond more rapidly (Fig. 2.8 and 2.9) with a dominance of the fast surface runoff component (Fig. 2.9). Discharge generally increases with drainage contribution area (Fig. 2.8 and 2.9). There were, however, few exceptions from this pattern. Particularly, at the end of precipitation event Nr.3 higher discharges at the monitoring site S1 relative to the downstream site S3 were evident (Fig. 2.8). Similar patterns were also observed during all three of the events between S4w and S5 (Fig. 2.8).
At the agricultural sites (S3-S7), DOC concentrations were highest with values up to 23.5 mgC l-1 (S6) during storm event Nr.1, which was an early event within the monsoon season. Inversely, the lowest DOC concentrations and lowest spatial variability in DOC concentrations were observed at these sites during the short but intense precipitation event Nr.3. At the forested monitoring site S1 the lowest DOC concentration peak (1.7 mgC l-1) and very small variations during event Nr.1 were observed. The widest range and highest peak in DOC concentration at S1 (max: 3.5 mgC l-1) was observed during the more intensive event Nr.3. The temporal pattern of DOC concentrations at the forested monitoring site S1 were similar throughout the events, with steadily increasing DOC concentrations during the rising limb of the hydrograph reaching the peak concentration close to the time of peak discharge (Fig. 2.8 and 2.9). Interestingly, at all agricultural sites during all three events, the peak DOC concentration typically appeared considerably after the peak discharge (Fig. 2.8 and 2.9), which was particularly pronounced for the second precipitation increase of storm event Nr.2 (02:00 on 7/17, Fig. 2.9 top, line (2)). Even though the delayed DOC concentration peak was observed at all agricultural sites, the peaks at lower elevation sites S5, S6 and S7 were noticeably higher and more distinct than observed at S3 and S4w.
The relationship between DOC concentrations and discharge are completely different between the sites. At the forest site S1 DOC concentrations were higher along the rising limb compared to the falling limb of the hydrographs and showed a clockwise hysteretic relationship with the discharge. In contrast, at site S3 that is surrounded by agricultural land predominately used for dryland farming, no consistent relationship between concentrations and discharge is visible (Fig. 2.10, S3). At sites influenced by rice paddies (Fig. 2.10, S5 and S6), in the lower part of the catchment, the highest observed DOC concentrations at both sites occurred at transitional discharges that range between values during storm events and during dry-weather conditions (Fig. 2.10). In contrast to site S1, DOC concentrations did not show a clear correlation with discharge neither during the rising nor falling limbs of the hydrograph.
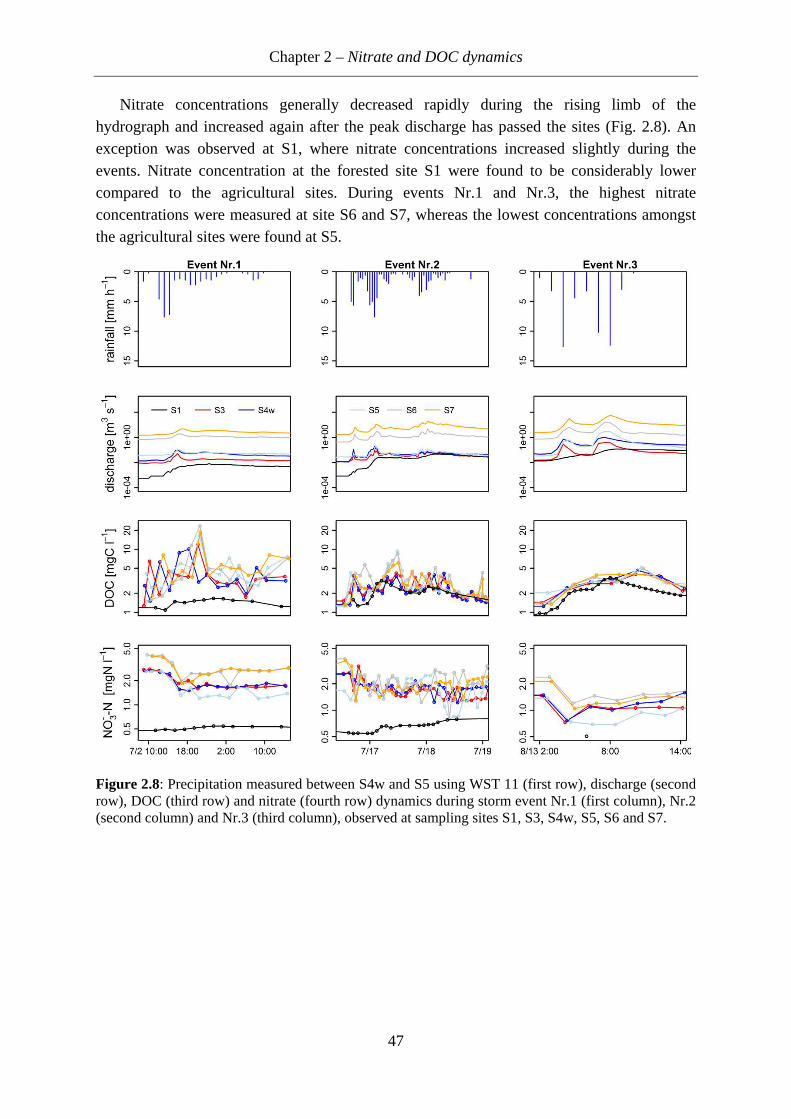
Chapter 2 – Nitrate and DOC dynamics
47
Nitrate concentrations generally decreased rapidly during the rising limb of the hydrograph and increased again after the peak discharge has passed the sites (Fig. 2.8). An exception was observed at S1, where nitrate concentrations increased slightly during the events. Nitrate concentration at the forested site S1 were found to be considerably lower compared to the agricultural sites. During events Nr.1 and Nr.3, the highest nitrate concentrations were measured at site S6 and S7, whereas the lowest concentrations amongst the agricultural sites were found at S5.
Figure 2.8: Precipitation measured between S4w and S5 using WST 11 (first row), discharge (second row), DOC (third row) and nitrate (fourth row) dynamics during storm event Nr.1 (first column), Nr.2 (second column) and Nr.3 (third column), observed at sampling sites S1, S3, S4w, S5, S6 and S7.
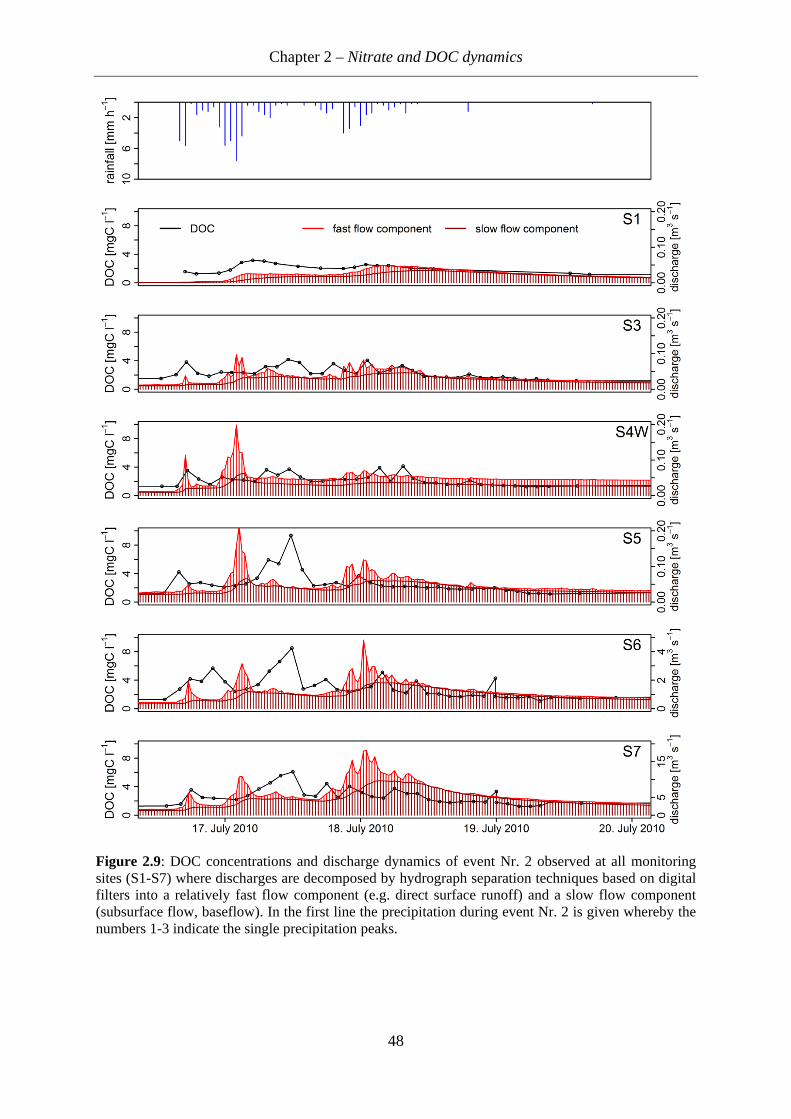
Chapter 2 – Nitrate and DOC dynamics
48
Figure 2.9: DOC concentrations and discharge dynamics of event Nr. 2 observed at all monitoring sites (S1-S7) where discharges are decomposed by hydrograph separation techniques based on digital filters into a relatively fast flow component (e.g. direct surface runoff) and a slow flow component (subsurface flow, baseflow). In the first line the precipitation during event Nr. 2 is given whereby the numbers 1-3 indicate the single precipitation peaks.
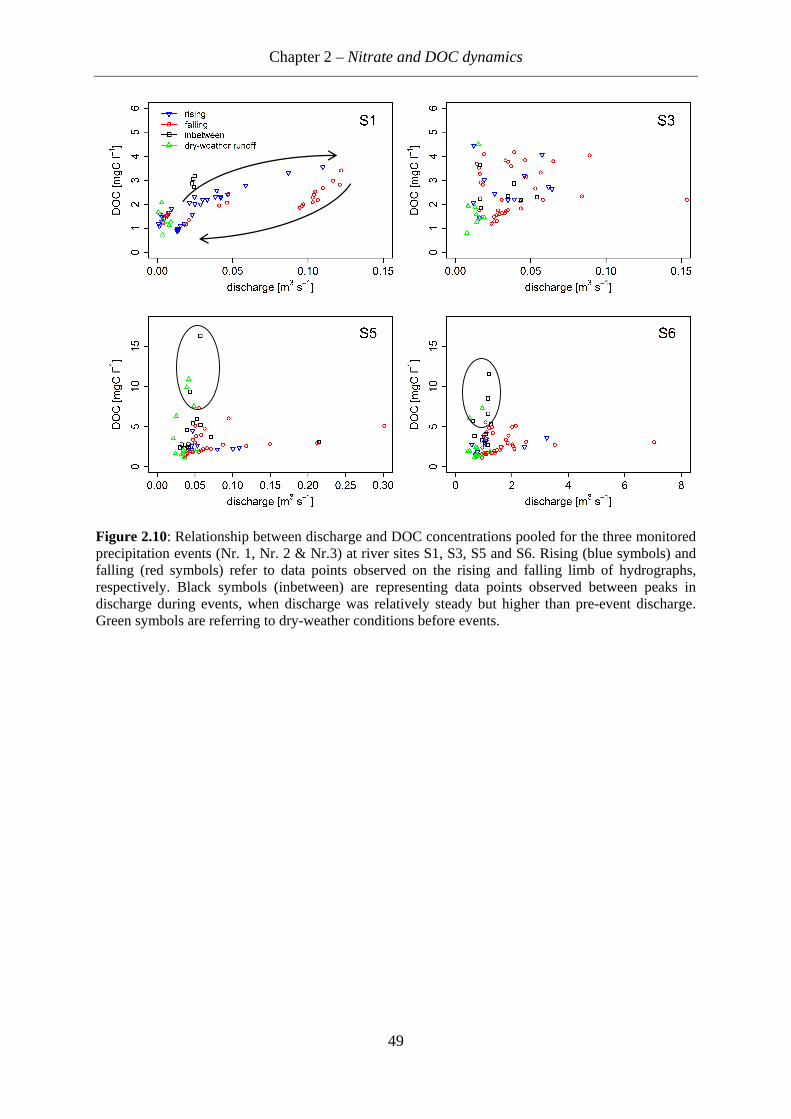
Chapter 2 – Nitrate and DOC dynamics
49
Figure 2.10: Relationship between discharge and DOC concentrations pooled for the three monitored precipitation events (Nr. 1, Nr. 2 & Nr.3) at river sites S1, S3, S5 and S6. Rising (blue symbols) and falling (red symbols) refer to data points observed on the rising and falling limb of hydrographs, respectively. Black symbols (inbetween) are representing data points observed between peaks in discharge during events, when discharge was relatively steady but higher than pre-event discharge. Green symbols are referring to dry-weather conditions before events.
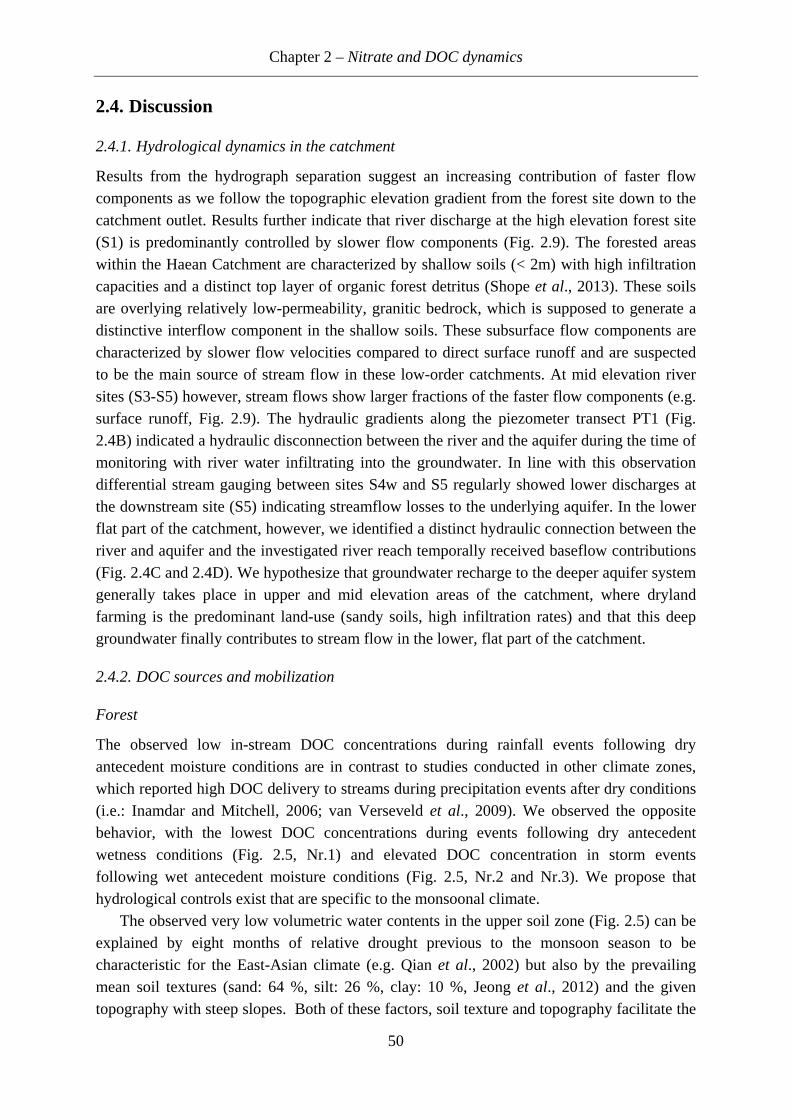
Chapter 2 – Nitrate and DOC dynamics
50
2.4. Discussion
2.4.1. Hydrological dynamics in the catchment
Results from the hydrograph separation suggest an increasing contribution of faster flow components as we follow the topographic elevation gradient from the forest site down to the catchment outlet. Results further indicate that river discharge at the high elevation forest site (S1) is predominantly controlled by slower flow components (Fig. 2.9). The forested areas within the Haean Catchment are characterized by shallow soils (< 2m) with high infiltration capacities and a distinct top layer of organic forest detritus (Shope et al., 2013). These soils are overlying relatively low-permeability, granitic bedrock, which is supposed to generate a distinctive interflow component in the shallow soils. These subsurface flow components are characterized by slower flow velocities compared to direct surface runoff and are suspected to be the main source of stream flow in these low-order catchments. At mid elevation river sites (S3-S5) however, stream flows show larger fractions of the faster flow components (e.g. surface runoff, Fig. 2.9). The hydraulic gradients along the piezometer transect PT1 (Fig. 2.4B) indicated a hydraulic disconnection between the river and the aquifer during the time of monitoring with river water infiltrating into the groundwater. In line with this observation differential stream gauging between sites S4w and S5 regularly showed lower discharges at the downstream site (S5) indicating streamflow losses to the underlying aquifer. In the lower flat part of the catchment, however, we identified a distinct hydraulic connection between the river and aquifer and the investigated river reach temporally received baseflow contributions (Fig. 2.4C and 2.4D). We hypothesize that groundwater recharge to the deeper aquifer system generally takes place in upper and mid elevation areas of the catchment, where dryland farming is the predominant land-use (sandy soils, high infiltration rates) and that this deep groundwater finally contributes to stream flow in the lower, flat part of the catchment.
2.4.2. DOC sources and mobilization
Forest
The observed low in-stream DOC concentrations during rainfall events following dry antecedent moisture conditions are in contrast to studies conducted in other climate zones, which reported high DOC delivery to streams during precipitation events after dry conditions (i.e.: Inamdar and Mitchell, 2006; van Verseveld et al., 2009). We observed the opposite behavior, with the lowest DOC concentrations during events following dry antecedent wetness conditions (Fig. 2.5, Nr.1) and elevated DOC concentration in storm events following wet antecedent moisture conditions (Fig. 2.5, Nr.2 and Nr.3). We propose that hydrological controls exist that are specific to the monsoonal climate.
The observed very low volumetric water contents in the upper soil zone (Fig. 2.5) can be explained by eight months of relative drought previous to the monsoon season to be characteristic for the East-Asian climate (e.g. Qian et al., 2002) but also by the prevailing mean soil textures (sand: 64 %, silt: 26 %, clay: 10 %, Jeong et al., 2012) and the given topography with steep slopes. Both of these factors, soil texture and topography facilitate the
Chapter 2 – Nitrate and DOC dynamics
51
efficient drainage of the upper soil layers. In contrast, the soil moisture contents observed in temperate mountainous forests, with comparable soil types, were found to be considerably higher throughout the year, with values ranging from approximately 30 to 60 % (e.g. Schindlbacher et al., 2011; Hackl et al., 2005). In comparison to regions influenced by the East Asian Monsoon, rainfall in temperate climate zones is typically more evenly distributed over the year. With the strong seasonality of precipitation in monsoonal climate zones, with practically all precipitation occurring between late June and September, steady soil moisture contents at the high levels typically observed in temperate zones can not be maintained (Fig. 2.5). However, DOC production in soils under wet conditions is generally significantly higher than the production in soils under dry conditions (Clark et al., 2010). As a result the build-up of a DOC pool prior to the first event is likely limited at site S1 and export of DOC during intensive rainfall will be supply-limited explaining the pronounced clockwise hysteresis in the concentration-discharge relationship (Fig. 2.10).
During the first precipitation event after the extended pre-monsoon dry period, most of the rainfall went into storage, which explains the relatively low increase in event river discharge with concurrent large increase in volumetric soil water content (Fig. 2.5). As long as discharge remains subsurface (baseflow)-driven, stream flow contributions will be primarily derived from the mineral soil that is low in DOC (Clark et al., 2010), resulting in comparably low DOC stream concentrations (max: 1.7 mgC l-1) (cf. Fig. 2.8).
During the second event, when the forest soil had previously been rewetted, rainfall started to mobilize soil water stored in the upper organic soil horizon. In addition to deeper subsurface flow (baseflow) also shallow lateral subsurface flows through the upper organic soil horizon where DOC is produced (Clark et al., 2010), may contribute to stream flow at this point. This also explains the higher discharges and in-stream DOC concentrations (max: 3.2 mgC l-1) compared to the onset of the rainfall event (Fig. 2.8). In line with our observations, Jeong et al. (2012) observed a consistent clockwise hysteretic relationship between event DOC concentrations and event stream discharge. Jeong et al. (2012) attributed the lower DOC concentrations on the falling limb of the storm hydrograph to a limited supply of leachable or erodible organic materials from the soils of this young forest. In addition to this effect, an increasing proportion of deeper subsurface flow contributions (low in DOC) to the stream, relative to the proportion of shallow subsurface flow contributions (high in DOC), might have been responsible for this observation.
During the third most intense precipitation event, when pre-event soil moisture was highest, rainfall quickly mobilized and steadily replaced soil water in the upper organic soil horizon. These high subsurface fluxes through the soil are characterized by short contact times between soil and soil solution, resulting in slightly but not considerably higher in-stream DOC concentrations (max: 3.5 mgC l-1) relative to less intensive storm events following wet soil conditions, like in storm event Nr.2. During “extreme” precipitation events (e.g. total rainfall amount = 292 mm (in 33 h); mean rainfall intensity = 9 mm h-1) as reported by Jung et al. (2012) and Jeong et al. (2012) at this forest site, peak DOC concentrations in the stream reached comparable values (approximately between 3.0 - 4.0 mgC l-1). Several authors have reported low in-stream DOC concentrations during high water fluxes through
Chapter 2 – Nitrate and DOC dynamics
52
the forest floor with short contact times between soil and soil solution (McDowell and Wood, 1984; Bourbonniere, 1989). Although the prevailing soil texture and the topography of the forest site studied here may have forced fast drainage of the forest soil (Fig. 2.5), our results suggest that intense monsoonal precipitation events (e.g. event Nr. 3) are an additional control for the short contact times between soil and soil solution.
Overall, the monsoonal-type climate might consequently play a key role for general DOC export patterns in such catchments.
Agricultural sites
The data from the agricultural sites (S3-S7) indicate strong influences from the type of land-use. DOC concentrations are generally higher compared to values measured at the forested river site. The differences in timing of peak DOC concentrations during events at the agricultural sites compared to the forested site S1 imply different flow paths and/or different DOC sources (Fig. 2.8 and 2.9). At the agricultural sites S3 and S4w, which are predominately surrounded by dry land farming, DOC concentrations were quite variable and no clear pattern between concentration and discharge was observable (Fig. 2.10). Further downstream, at sites S5, S6 and S7, DOC concentrations were generally higher indicating additional inputs from a larger contributing agricultural area. These sites showed comparable patterns in DOC concentrations with time (Fig. 2.8 and 2.9).
There is some indication that the increase in DOC concentrations in the lower basin, specifically at site S5, is related to the rice paddies. Under dry-weather conditions the DOC concentration measured at site S5 was up to three times higher compared to maximum concentrations measured at the other study sites (Fig. 2.6). Periodical sampling of DOC in rice paddies revealed DOC concentrations (mean: 7.3 mgC l-1) that were distinctly higher compared to the in-stream concentrations (mean: < 3.2 mgC l-1). Slightly downstream of site S4w, the first rice paddy fields are located (Fig. 2.2). Between S4w and S5 river water is diverted for local rice paddy irrigation management with return flows to the channel that have the potential to elevate instream DOC concentrations. In this reach the river bed is channelized and lined minimizing potential inputs from groundwater and riparian wetlands. As DOC concentrations in groundwater were generally found to be lower than in the river, the elevated in-stream concentrations in this reach also support the notion that groundwater inputs, which would dilute DOC concentrations, are negligible (Fig. 2.4). Particularly in dry periods, river water is diverted from the river downstream of site S4w for rice paddy irrigation, routed through a sequence of paddy fields following the elevation gradient and subsequently returns to the river at site S5 (Fig. 2.1, Fig. 2.2). We suspect that under dry-weather conditions export of DOC from the paddy fields is a substantial source of DOC at S5, explaining the elevated concentration levels. But also during precipitation events, rice paddies can be a significant source of DOC. In order to reduce the risk of crop damage by inundation during precipitation events, each rice paddy plot has a headgate, which releases paddy water over drainage pipes into the rivers, after the ponded water in the paddies reaches a certain water level. During precipitation events, ditch riders inhibit excess irrigation supply from the rivers into the irrigation ditches (Kim et al., 2006). Therefore, before paddy water is
Chapter 2 – Nitrate and DOC dynamics
53
exported to the rivers during precipitation events, a minimum ponding depth must be reached, which may explain the lag to peak DOC concentration relative to peak river discharge (Fig. 2.8 and 2.9). Elevated DOC concentrations in surface waters due to the export of DOC from rice paddies have also been observed in a study conducted in Japan (Shim et al., 2005).
We consistently observed higher DOC concentrations at the agricultural sites compared to the forested river site. This suggests that the agricultural areas of the Haean Catchment are of specific importance for total DOC exports from the catchment. The relationship between DOC concentration and discharge (Fig. 2.10) showed a clear clockwise hysteretic behavior at the forested site (S1) as it had previously been reported by Jeong et al. 2012. At the site in the mid-elevation range (S3) the relationship is erratic and no clear pattern could be observed. This probably reflects the increasing complexity of surface flow routes that deliver DOC to the river channel (e.g. return flows which are controlled by hydraulic structures such as ditches and weirs, and direct surface flows from an increasingly more complex pattern of land-uses). At the agricultural sites S5 and S6 the relationship is still somewhat erratic but starts to show effects from local rice paddy irrigation management. Overall, the prevailing rice paddy management system appears to have a significant effect on in-stream DOC dynamics in the lower, agricultural part of the Haean Catchment.
2.4.3. Nitrate sources and pathways within the Haean Catchment
Forest
Forest in-stream nitrate concentrations and dynamics appear to be controlled by deep subsurface inputs high in nitrate. Nitrate stream concentrations increased steadily throughout events whereas DOC concentrations decreased in time periods with less rainfall during events (e.g. Event Nr.2, Fig. 2.8), suggesting different mobilization processes and transport pathways of nitrate into the river, relative to DOC. We hypothesize that during the events nitrate leaches (due to its high mobility) from the upper organic soil layer into the deeper mineral soil (where DOC is retained) and finally reaches the river via subsurface flows (base- or interflow).
Throughout the first event, most rainfall went into storage and nitrate remained in the upper forest soil layer. Hence, during events following dry soil conditions, no clear response in river nitrate concentrations was observed (e.g. event Nr.1, Fig. 2.8). During the second and more intense event, however, rainfall mobilized nitrate from the upper soil layers into the deeper mineral soil where it could be delivered to the stream via the slow subsurface flow component (event Nr.2, Fig. 2.8). Hence, in the course of intense events following wet soil moisture conditions, in-stream nitrate concentrations steadily increase (e.g. event Nr.2, Fig. 2.8). Nitrate contributions to rivers along the groundwater flow paths have also been observed in temperate forests and are not specific for the monsoonal climate (McHale et al., 2002).
Chapter 2 – Nitrate and DOC dynamics
54
Agricultural sites
In the agricultural areas of the lower basin in-stream and groundwater nitrate concentrations are clearly affected by the prevailing land-use and the connectivity between groundwater and the river. Nitrate concentrations at agricultural river sites were up to eight times higher (site S6 and S7) than the concentrations measured at the forest river site (Fig. 2.4, Fig. 2.8), which can be explained by high fertilizer inputs. South Korean fertilizer application rates for the intense agricultural production in mountainous regions are very high (313 kgN ha-1 yr-1, Kim et al., 2008) relative to other locations throughout the world (e.g. north-central USA, 67 - 258 kgN ha-1 yr-1, Kraft and Stites (2003)).
In the Haean Catchment fertilizer N application contributed to more than 90% of the N surplus (Kettering et al., 2012). Groundwater in wells located under fields used for dry land farming had the highest nitrate concentrations (i.e.: W4 at 7.4 mgN l-1). The elevated nitrate concentrations in groundwater are caused by fertilizer leaching from agricultural fields (Ruidisch et al., 2013), which is generally regarded to be one of the major causes of groundwater pollution (Buczko et al., 2010). Particularly in areas with high precipitation rates and coarse-textured soils the potential of nitrate leaching is high (Zotarelli et al., 2007). Kettering et al (2012) reported for radish fields (sandy soils) in the Haean Catchment that more than 50% of the supplied fertilizer N percolated deeper than the root zone.
Nitrate in the rivers is mainly derived from groundwater inputs as frequently reported also from other regions throughout the world (e.g. Tesoriero et al., 2009, Wagner et al., 2008). Rice paddies do not seem to significantly contribute to nitrate concentrations in the adjacent rivers given the low nitrate concentrations in their water (0.01 - 0.9 mgN l-1, data not shown). This assumption is supported by the typically lower nitrate concentrations observed at site S5, which is strongly affected by rice paddy return flows (Fig. 2.4 and Fig. 2.8). Nitrate concentrations were generally higher in groundwater than in surface waters, with the exception of wells in the immediate vicinity of the river. These wells may have been temporarily affected by infiltrating river water low in nitrate concentration or by denitrification processes in the hyporheic zone (Bartsch et al., submitted) (i.e.: W8, W3 in Fig. 2.5). Higher in-stream nitrate concentrations were typically observed in the reaches located in the lower parts of the catchment (S6 and S7) where the river at least temporarily received groundwater inflows (Bartsch et al., submitted). In the upper parts of the catchment the connectivity between the rivers and groundwater seems to be limited (Fig. 2.4). Hence, high nitrate inputs via the groundwater (baseflow) are negligible and river water nitrate concentrations were consequently unaffected in these areas. The observed strong decrease of in-stream nitrate concentrations during precipitation events is due to the dilution of river water by rainfall and direct surface runoff (fast flow component) as observed at the agricultural sites during monsoonal precipitation events (Fig. 2.9, fast flow component). This event-based “dilution” has commonly been reported in other studies (i.e.: Poor and McDonnell, 2007; Kim et al., 2012). Overall, baseflow contributions represent the main pathway for nitrate into the receiving surface waters. During the monsoon season in-stream
Chapter 2 – Nitrate and DOC dynamics
55
nitrate concentrations frequently get diluted by faster runoff components that are low in nitrate.
In-stream and groundwater nitrate concentrations, however, are generally lower in comparison to other regions throughout the world which are also highly used for agriculture, with less fertilizer N inputs. For instance, Kraft and Stites (2003) reported that in the north-central USA, nitrate concentrations in groundwater recharge under comparable agricultural land-use often exceeded the US drinking water standard of 10.0 mgN l-1 by a factor of 2. In the Haean Catchment the highest observed groundwater nitrate concentration was 7.4 mgN l-
1, which is noticeably lower than the US drinking water standard. In-stream nitrate concentrations were always below this value exemplifying that river water is typically a mixture of baseflow and other faster flow components, which usually have lower nitrate concentrations. Additionally reduction of nitrate may occur in the groundwater body (e.g. Liao et al., 2012). Intensive denitrification typically occurs in the riparian zone (Ranalli and Macalady, 2010). Bartsch et al. (submitted) showed frequent flow reversals in river-aquifer exchange fluxes in the lower part of the Haean Catchment, which were strongly driven by the monsoonal climate. During monsoonal precipitation events river water high in DOC is “pushed” into the nitrate rich aquifer when river stages rise more rapidly than the surrounding groundwater levels creating favorable conditions for denitrification. After the event, when river stages drop again, the vertical hydraulic gradient reverses and groundwater is “pulled up” again into the river. In the present study the lowest nitrate concentrations were found in the shallow groundwater zone directly underneath the river (Fig. 2.7), which is frequently affected by the described “push & pull effects”. Bartsch et al. (submitted) suggested a high potential for denitrification in streambed sediments beneath the river following these effects. We suspect that additional denitrification may take place along the subsurface flow path from the zones of infiltration in the upper catchment (dryland fields) to the lower part of the catchment, where deep groundwater finally contributes to stream flow.
Chapter 2 – Nitrate and DOC dynamics
56
2.5. Conclusions
The monsoonal climate can be seen as the most decisive driver for DOC and nitrate delivery to the stream in the forested headwater catchment, while land-use controls are more important at the agricultural sites. We have developed a conceptual model on the decisive drivers for DOC and nitrate dynamics in a mountainous catchment (Fig. 2.11). Our results showed that the mobilization of nitrate and DOC is strongly depending on the pre-event hydrological state of the forested catchment. Contrary to forests in temperate climate zones, characterized by a much more even distribution of rainfall throughout the year, the forest soils in South Korea are exposed to several months of draught prior to the monsoon season. Hence, in the beginning of the monsoon season the forest soils first need to be rewetted before nitrate and DOC can be mobilized. Furthermore, our results suggest that monsoonal extreme precipitation events are decisive drivers for the in-stream DOC dynamics as they control the contact time between soil and soil solution, which has often been stated as crucial a factor for DOC production.
By following the topographic elevation gradient of the Haean Catchment down to the agricultural areas, the “land-use effect” gains in importance for surface- and groundwater quality. The excessive N fertilization of dryland fields most likely causes elevated groundwater nitrate concentrations owing to nitrate leaching losses from dryland fields into the groundwater, forced by monsoonal precipitation events. The availability of nitrate is controlled by farmers and their fertilizer N application rates, but the nitrate mobilization is highly depending on the intensity and duration of monsoonal precipitation events. Consequently, in areas used for dryland farming the “land-use effect” and “monsoonal climate effect” are interdependent and of comparable importance for the groundwater quality in these systems (Fig. 2.11).
In those parts of the catchment that are extremely fragmented by the rice paddy plot-to-plot system, the in-stream nitrate and DOC dynamics are hardly ever controlled by the monsoonal-type climate. In-stream DOC most likely originates from rice paddies, which are primarily regulated by farmers and their irrigation systems (under dry weather and event conditions). In-stream nitrate concentrations are also indirectly controlled by the prevailing land-use management. Most of the rivers in this part of the catchment are fully channelized and lined in order to maintain the rice paddy irrigation. Subsequently, the connectivity between the rivers and groundwater is limited and these rivers are unaffected by groundwater inputs high in nitrate. Thus, in these fragmented agricultural systems, which are strongly controlled by human activities the “land-use effect” is much more prominent and can be seen as the crucial factor for the in-stream solute dynamics (Fig. 2.11).
In the lower part of the catchment rivers are hydraulically connected to the aquifer. Our results revealed that groundwater inputs high in nitrate are most likely the main control for elevated in-stream nitrate concentrations in the lower part of the catchment. This transport pathway of nitrate into surface waters also exists in other catchments which are not influenced by the monsoonal climate. However, the highly variable river-aquifer exchange conditions with frequently appearing hydraulic gradient reversals are specific to the
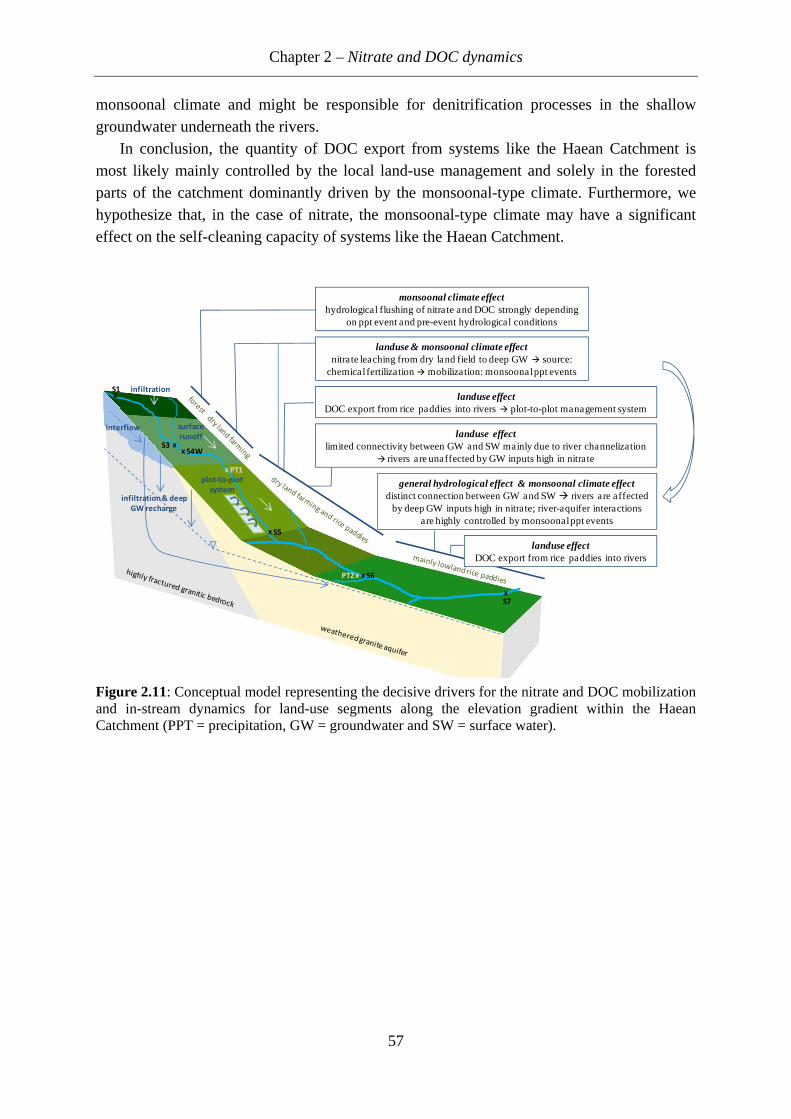
Chapter 2 – Nitrate and DOC dynamics
57
monsoonal climate and might be responsible for denitrification processes in the shallow groundwater underneath the rivers.
In conclusion, the quantity of DOC export from systems like the Haean Catchment is most likely mainly controlled by the local land-use management and solely in the forested parts of the catchment dominantly driven by the monsoonal-type climate. Furthermore, we hypothesize that, in the case of nitrate, the monsoonal-type climate may have a significant effect on the self-cleaning capacity of systems like the Haean Catchment.
Figure 2.11: Conceptual model representing the decisive drivers for the nitrate and DOC mobilization and in-stream dynamics for land-use segments along the elevation gradient within the Haean Catchment (PPT = precipitation, GW = groundwater and SW = surface water).
S1
PT1
S4WS3
S6
S5
S7
x
x
x
x
x
x
x
x
PT2
landuse & monsoonal climate effectnitrate leaching from dry land field to deep GW source:
chemical fertilization mobilization: monsoonal ppt events
monsoonal climate effecthydrological flushing of nitrate and DOC strongly depending
on ppt event and pre-event hydrological conditions
landuse effectDOC export from rice paddies into rivers plot-to-plot management system
general hydrological effect & monsoonal climate effectdistinct connection between GW and SW rivers are affected
by deep GW inputs high in nitrate; river-aquifer interactions are highly controlled by monsoonal ppt events
landuse effectlimited connectivity between GW and SW mainly due to river channelization
rivers are unaffected by GW inputs high in nitrate
interflow surface
runoff
plot-to-plot
system
infiltration
landuse effectDOC export from rice paddies into rivers
infiltration & deep
GW recharge
Chapter 2 – Nitrate and DOC dynamics
58
Acknowledgements This study was carried out within the framework of the International Research Training Group TERRECO (GRK 1565/1), funded by the Deutsche Forschungsgemeinschaft (DFG) at the University of Bayreuth (Germany) and the Korean Research Foundation (KRF) at Kangwon National University, Chuncheon (South Korea). Ji-Hyung Park was supported by a research grant from the National Research Foundation of Korea (2009-0083527). The authors want to thank Axel Müller, Bumsuk Seo, Kiyong Kim, Eunyoung Jung, Bora Lee and Heera Lee for their support and translations during field campaigns.
2.6. References
Åkerblom, S., Meili, M., Bringmark, L., Johansson, K., Kleja, D.B., Bergkvist, B., 2008. Partitioning of Hg between Solid and Dissolved Organic Matter in the Humus Layer of Boreal Forests. Water Air Soil Pollution 189 (1-4), 239–252.
Bartsch, S., Frei, S., Ruidisch, M., Shope, C.L., Peiffer, S., Kim, B., Fleckenstein, J.H., (submitted). River-aquifer exchange fluxes under monsoonal climate conditions. Journal of Hydrology.
Bernal, S., Butturini, A., Sabater, F., 2002. Variability of DOC and nitrate responses to storms in a small Mediterranean forested catchment. Hydrology and Earth System Sciences Discussions 6 (6), 1031–1041.
Biron, P.M., Roy, A.G., Courschesne, F., Hendershot, W.H., Côté, B. and Fyles, J., 1999. The effects of antecedent moisture conditions on the relationship of hydrology to hydrochemistry in a small forested watershed. Hydrological Processes 13 (11), 1541–1555.
Bolan, N. S., Adriano, D. C., Kunhikrishnan, A., James, T., McDowell, R., and Senesi, N., 2011. Dissolved organic matter: biogeochemistry, dynamics, and environmental significance in soils. Advances in Agronomy 110, 1–75.
Bourbonniere, R.A., 1989. Distribution patterns of dissolved organic matter fractions in natural waters from eastern Canada. Organic Geochemistry 14 (1), 97–107.
Brooks, P.D., McKnight D.M., Bencala K.E., 1999. Relationship between over-winter soil heterotrophic activity and DOC export in high elevation catchments. Water Resources Research 35 (6), 1895– 1902.
Buczko, U., Kuchenbuch, R., Lennartz, B., 2010. Assessment of the predictive quality of simple indicator approaches for nitrate leaching from agricultural fields. Journal of Environmental Management 91 (6), 1305–1315.
Burns, D., 2005. What do hydrologists mean when they use the term flushing? Hydrological Processes 19 (6), 1325–1327.
Clark, J., Bottrell, S., Evans, C., Monteith, D., Bartlett, R., Rose, R., Newton, R., Chapman, P., 2010. The importance of the relationship between scale and process in understanding long-term DOC dynamics. Science of the Total Environment 408 (13), 2768–2775.
Creed, I.F., Band, L.E., 1998. Export of nitrogen from catchments within a temperate forest: evidence for a unifying mechanism regulated by variable source area dynamics. Water Resources Research 34 (11), 3105–3120.
Creed, I.F., Band, L.E., Foster, N.W., Morrison, I.K., Nicolson, J.A., Semkin, R.S., Jeffries, D.S., 1996. Regulation of nitrate-N release from temperate forests: a test of the N flushing hypothesis. Water Resources Research 32 (11), 3337–3354.
Driscoll, C.T., Whitall, D., Aber, J.D., Boyer, E.W., Castro, M., Cronan, C., Goodale, C.L., Groffman, P.M., Hopkinson, C., Lambert, K., Lawrence, G.B., Ollinger, S.V., 2003. Nitrogen pollution in the northeastern US: sources, effects, and management options. Bioscience 53, 357–374.
Guerra, L.C., Bhuiyan, S.I., Tuong, T.P., Barker, R., 1998. Producing more rice with less water. SWIM Paper 5. Colombo, Sri Lanka: International Water Management Institute.
Chapter 2 – Nitrate and DOC dynamics
59
Hackl, E., Pfeffer, M., Donat, C., Bachmann, G., Zechmeister-Boltenstern, S., 2005. Composition of the microbial communities in the mineral soil under different types of natural forest. Soil Biology and Biochemistry 37 (4), 661-671.
Hope, D., Billett, M.F., Cresser, M.S., 1994. A review of the export of carbon in river water: Fluxes and processes. Environmental Pollution 84 (3), 301-324.
Howarth, R.W., 2008. Coastal nitrogen pollution: A review of sources and trends globally and regionally. Harmful Algae 8 (1), 14–20.
Inamdar, S.P., Christopher, S.F., Mitchell, M.J., 2004. Export for dissolved organic carbon and nitrate during storm events in a glaciated forested catchment in New York, USA. Hydrological Processes 18, 2651–2661.
Inamdar, S.P., Mitchell, M.J., 2006. Hydrologic and topographic controls on storm-event exports of dissolved organic carbon (DOC) and nitrate across catchment scales. Water Resources Research 42 (3), W03421.
IUSS Working Group WRB (ed.), 2007. World Reference Base for Soil Resources 2006, first update 2007, World Soil Resources Reports No. 103, FAO, Rome, 132 pp.
Jeong, J.-J., Bartsch, S., Fleckenstein, J.H., Matzner, E., Tenhunen, J.D., Lee, S.D., Park, S.K., Park, J.-H., 2012. Differential storm responses of dissolved and particulate organic carbon in a mountainous headwater stream, investigated by high-frequency, in situ optical measurements. Journal of Geophysical Research 117 (G3).
Jo, K.-W., Park, J.-H., 2010. Rapid release and changing sources of Pb in a mountainous watershed during extreme rainfall events. Environmental Science & Technology 44 (24), 9324–9329.
Kettering, J., Park, J.-H., Lindner, S., Lee, B., Tenhunen, J., Kuzyakov, Y., 2012. N fluxes in an agricultural catchment under monsoon climate: A budget approach at different scales. Agriculture, Ecosystems & Environment 161, 101–111.
Kim, B., 2000. Effects of the summer monsoon on the distribution and loading of organic carbon in a deep reservoir, Lake Soyang, Korea. Water Research 34 (14), 3495–3504.
Kim, J.S., Oh, S.Y., Oh, K.Y., 2006. Nutrient runoff from a Korean rice paddy watershed during multiple storm events in the growing season. Journal of Hydrology 327 (1-2), 128–139.
Kim, S.-J., Tae, H., Kim, K., Lee, C., Blanco, J.A., Lo, Y.-H., 2012. Ecohydrology and Biogeochemistry in a Temperate Forest Catchment / Forest ecosystems. More than just trees. InTech, Rijeka, Croatia.
Kim, T., Kim, G., Kim, S., Choi, E., 2008. Estimating riverine discharge of nitrogen from the South Korea by the mass balance approach. Environmental Monitoring and Assessment 136, 371-378.
Kraft, G.J., Stites, W., 2003. Nitrate impacts on groundwater from irrigated-vegetable systems in a humid north-central US sand plain. Agriculture, Ecosystems & Environment 100 (1), 63-74.
Kwon, Y.S., Lee, H.Y., Han, J., Kim, W.H., Kim, D.J., Kim, D.I., Youm, S. J., 1990. Terrain analysis of Haean Basin in terms of earth science. Journal of Korean Earth Science Society 11, 236–241.
Liao, L., Green C.T., Bekins B.A., Böhlke J.K., 2012. Factors controlling nitrate fluxes in groundwater in agricultural areas. Water Resources Research 48, W00L09.
Lim, K.J., Engel, B.A., Tang, Z., Choi, J., Kim, K.-S., Muthukrishnan, S., Tripathy, D., 2005. Automated Web GIS-based Hydrograph Analysis Tool, WHAT. Journal of American Water Resources Association 41 (6), 1407–1416.
McDonnell, J.J., Owens, I.F., Stewart, M.K., 1991. A case Study of Shallow Flow Paths in a Steep Zero Order Basin. Journal of American Water Resources Association 27 (4), 679–685.
McDowell, W.H., Wood, T., 1984. Podzolization: Soil processes control dissolved organic carbon concentrations in stream water. Soil Science 137, 23-32.
McHale, M.R., McDonnell, J.J., Mitchell, M.J., Cirmo, C.P., 2002. A field based study of soil water and groundwater nitrate release in an Adirondack forested watershed. Water Resources Research 38 (4), WR000102.
Morel, B., Durand, P., Jaffrezic, A., Gruau, G., Molenat, J., 2009. Sources of dissolved organic carbon during stormflow in a headwater agricultural catchment. Hydrological Processes 23 (20), 2888–2901.
Neff, J.C., Holland, E.A., Dentener, F.J., McDowell, W.G., Russel, K.M., 2002. The origin, composition and rates of organic nitrogen deposition: a missing piece of the nitrogen cycle? Biogeochemistry 57/58, 99–136.

Chapter 2 – Nitrate and DOC dynamics
60
Poor, C.J., McDonnell, J.J., 2007. The effects of land-use on stream nitrate dynamics. Journal of Hydrology 332 (1-2), 54–68.
Qian, W.H., Kang, H.-S., Lee, D.-K., 2002. Distribution of seasonal rainfall in the East Asian monsoon region. Theoretical and Applied Climatology 73, 151-168.
Ranalli, A. J., Macalady, D. L., 2010. The importance of the riparian zone and in-stream processes in nitrate attenuation in undisturbed and agricultural watersheds - A review of the scientific literature. Journal of Hydrology 389 (3–4), 406-415.
Royer, T.V., David, M.B., Gentry, L.E., 2006. Timing of Riverine Export of Nitrate and Phosphorus from Agricultural Watersheds in Illinois: Implications for Reducing Nutrient Loading to the Mississippi River. Environmental Science & Technology 40 (13), 4126–4131.
Ruidisch, M., Bartsch, S., Kettering, J., Huwe, B., Frei, S., 2013. The effect of fertilizer best management practices on nitrate leaching in a plastic mulched ridge cultivation system, Agriculture, Ecosystems & Environment 169, 21-32.
Schindlbacher, A., Rodler, A., Kuffner, M., Kitzler, B., Sessitsch, A., Zechmeister-Boltenstern, S., 2011. Experimental warming effects on the microbial community of a temperate mountain forest soil. Soil Biology and Biochemistry 43 (7), 1417-1425.
Shim, S., Kim, B., Hosoi, Y., Masuda, T., 2005. Export rate of dissolved organic matter from paddy fields during cultivation-activity events. Paddy Water Environment 3 (4), 211–218.
Shope, C.L., Bartsch, S., Kim, K., Kim, B., Tenhunen, J., Peiffer, S., Park, J.H., Ok, Y.S., Fleckenstein, J.H., Köllner, T., 2013. A weighted, multi-method approach for accurate basin-wide streamflow estimation in an ungauged watershed. Journal of Hydrology 494, 72-82.
Tesoriero, A.J., Duff, J.H., Wolock, D.M., Spahr, N.E., Almendinger, J.E., 2009. Identifying Pathways and Processes Affecting Nitrate and Orthophosphate Inputs to Streams in Agricultural Watersheds. Journal of Environment Quality 38 (5), p. 1892.
van Verseveld, W.J., McDonnell, J.J., Lajtha, K., 2009. The role of hillslope hydrology in controlling nutrient loss. Journal of Hydrology 367 (3-4), 177–187.
Wagner, L., Vidon, P., Tedesco, L., Gray, M., 2008. Stream nitrate and DOC dynamics during three spring storms across land uses in glaciated landscapes of the Midwest. Journal of Hydrology 362 (3-4), 177–190.
Zotarelli, L., Scholberg, J.M., Dukes, M.D., Muñoz-Carpena, R., 2007. Monitoring of nitrate leaching in sandy soils: comparison of three methods. Journal of Environmental Quality 36 (4), 953-962.
Chapter 3 – River-aquifer exchange fluxes
61
Chapter 3
3. River-aquifer exchange fluxes under monsoonal climate conditions
accepted: Journal of Hydrology Svenja Bartsch 1, Sven Frei 1, Marianne Ruidisch 2, Christopher L. Shope 1, 3, Stefan Peiffer 1 Bomchul Kim 4, Jan H. Fleckenstein 1, 5
1 Department of Hydrology, Bayreuth Center of Ecology and Environmental Sciences – BayCEER, University of Bayreuth, Bayreuth, Germany 2 Department of Soil Physics, Bayreuth Center of Ecology and Environmental Sciences – BayCEER, University of Bayreuth, Bayreuth, Germany 3 U.S. Geological Survey, Utah Water Science Center, Salt Lake City, Utah, USA 4 Department of Environmental Science, Kangwon National University, Chuncheon, Republic of Korea 5 Department of Hydrogeology, Helmholtz Centre for Environmental Research – UFZ, Leipzig, Germany
Abstract : An important prerequisite to better understand the transport of nutrients and
contaminants across the river-aquifer interface and possible implications for biogeochemical transformations is to accurately characterize and asses the exchange fluxes. In this study we investigate how monsoonal precipitation events and the resulting variability in river discharge affect the dynamics of river-aquifer exchange and the corresponding flux rates. We evaluate potential impacts of the investigated exchange fluxes on local water quality. Hydraulic gradients along a piezometer transect were monitored at a river reach in a small catchment in South Korea, where the hydrologic dynamics are driven by the East-Asian Monsoon. We used heat as a tracer to constrain river-aquifer exchange fluxes obtained from a two-dimensional flow and heat transport model implemented in the numerical code HydroGeoSphere, which was calibrated to the measured temperature and total head data. To elucidate potential effects of river-aquifer exchange dynamics on biogeochemical transformations at the river-aquifer interface, river water and groundwater samples were collected and analyzed for dissolved organic carbon (DOC), nitrate (NO3) and dissolved oxygen saturation (DOsat). Our results illustrate highly variable hydrologic conditions during the monsoon season characterized by temporal and spatial variability in river-aquifer exchange fluxes with frequent flow reversals (changes between gaining and losing conditions). Intense monsoonal precipitation events and the associated rapid changes in river stage are the dominant driver for the observed riverbed flow reversals. The chemical data suggest that the flow reversals, when river water high in DOC is pushed into the nitrate-rich groundwater below the stream and subsequently returns to the stream may facilitate and enhance the natural attenuation of nitrate in the shallow groundwater.
Keywords: River-aquifer exchange fluxes; heat as a natural tracer; monsoonal-type climate; hydraulic gradient reversals; HydroGeoSphere; natural attenuation of nitrate
Chapter 3 – River-aquifer exchange fluxes
62
3.1. Introduction
The dynamic exchange of water, energy and solutes across the river-aquifer interface affects the ecology of river systems (Brunke and Gonser 1997), pathways of nutrient cycling (Krause et al., 2009) as well as the transformation and attenuation of nutrients and contaminants (Smith et al., 2009, Zarnetzke et al., 2011). Across scientific disciplines interest in the dynamics of river-aquifer exchange and the transition zone between ground- and surface water where differences in chemical, biological and physical properties of the two adjoining compartments result in steep biogeochemical gradients has steadily grown in recent years (Fleckenstein et al., 2010, Krause et al., 2011). River-aquifer interactions were found to have positive as well as negative effects on groundwater and stream water quality (Grasby and Betcher, 2002, Schmidt et al., 2011). High concentrations of contaminants in groundwater can significantly impact surface water quality and vice versa (Kalbus et al., 2007). Groundwater ecosystems often depend on infiltrating surface water that is rich in organic matter as an energy source (Madsen et al., 1991) for biogeochemical reactions.
An important prerequisite to understand the transport of nutrients and contaminants across the river-aquifer interface and the resulting biogeochemical processes in the transition zone is to accurately characterize and asses the exchange fluxes at the river-aquifer interface (Conant, 2004; Greenberg et al., 2002). A broad range of methods exists to quantify groundwater-surface water exchange fluxes (Kalbus et al., 2007). However, the extreme variability of hydrologic conditions in monsoonal systems can make the use of many of them quite challenging. For example direct measurements of exchange fluxes by conventional seepage meters. (Landon et al., 2001; Rosenberry, 2008) are highly impractical under monsoonal conditions. During extreme precipitation events, river discharge can rapidly rise by up to 2 orders of magnitude relative to the discharge under dry conditions making in-stream installations difficult to employ. Additionally extreme flows may result in sediment scour and associated stream bed elevation changes, which further complicates the direct quantification of river aquifer-exchange fluxes in the field.
A commonly accepted conventional method for investigating river aquifer-exchange fluxes is based on monitoring of hydraulic gradients along piezometer transects (Eddy-Miller, 2009). The advantage of this method is that in-stream installations are not imperative. However, the head gradients between a piezometer in the riverbed, river bank, riparian zone and the stream alone is often only a weak indicator for the general direction of exchange (Kaeser et al., 2009) and spatial patterns of exchange fluxes are typically much more variable (Schornberg et al., 2010; Lewandowski et al., 2011, Angermann et al., 2012). Scanlon (2002) therefore suggested the application of multiple methods for an accurate assessment of river-aquifer exchange fluxes. An increasing number of studies have combined hydraulic head measurements with the use of heat as a natural tracer and inverse numerical modeling (Eddy-Miller, 2009; Anibas et al., 2009; Schmidt et al., 2007; Constantz, 2008; Essaid et al., 2008). Using heat as a tracer is based on natural temperature differences between ground- and surface water, which result in temperature distributions in the transition zone that are
Chapter 3 – River-aquifer exchange fluxes
63
indicative of conductive and advective heat transport processes between the two compartments. Most surface waters show diurnal temperature fluctuations, whereas groundwater temperatures are relatively constant over time. Heat is transported by advection (with the moving water) and conduction (heat exchange due to temperature gradients) through the riverbed sediments (Constantz, 2008). In river reaches where surface water is infiltrating into the aquifer (losing conditions) the diurnal temperature signal from the surface water propagates downward by advective and conductive, heat transport (Graf, 2005). In contrast, in gaining reaches the temperature signal, which is conductively transported downwards, is attenuated by upward advection of groundwater with steady temperature, which dampens the diurnal temperature variation originating from the surface water (Eddy-Miller, 2009). Combining both, temperature and head data in the calibration of numerical models of groundwater-surface water interactions can provide more reliable estimates of exchange fluxes as opposed to using head data alone (Anderson, 2005).
In this study, we use head and temperature data from a river-aquifer system in South Korea that is driven by the East-Asian Monsoon to constrain a numerical model of the river-aquifer exchange dynamics. The main objective was to investigate how monsoonal precipitation events and the resulting variability in river discharge affect the dynamics of river-aquifer exchange and the corresponding flux rates. Hydraulic gradients between the river and the aquifer were monitored in a piezometer transect across a typical river reach in the catchment. Temperatures at different depth in the aquifer below the stream were measured in the central piezometer in the Thalweg of the stream. The 2D-model, based on the code HydroGeoSphere, was calibrated to the measured temperature and total head data. To elucidate potential effects of the observed and simulated river-aquifer exchange dynamics on biogeochemical transformations at the groundwater-surface water interface, river and groundwater samples were collected and analyzed for dissolved organic carbon (DOC), nitrate (NO3) and dissolved oxygen saturation (DOsat).
3.2. Materials and Methods
3.2.1. Study Area and Site
The study area is the Haean-myun Catchment (longitude 128° 5’ to 128° 11’ E and latitude 38° 13’ to 38° 20’ N) located in Yanggu County, Gangwon Province, South Korea. With an agricultural area of 30 % of the entire basin area (62.7 km2), the Haean Catchment is one of the major agricultural areas in the region. It contributes significant amounts of agricultural nutrients (N, P) to the downstream receiving waters (Kim et al., 2006), which eventually feed into Lake Soyang an important drinking water reservoir for the metropolitan area of Seoul. Surface elevation within this bowl-shaped mountainous catchment ranges from a minimum of 340 meters above sea level (masl) near the catchment outlet to a maximum of 1320 masl along the surrounding mountain ridges. At the bottom of the basin, the bedrock consists of highly weathered Jurassic biotite granite, surrounded by Precambrian metamorphic rocks forming the mountain ridges (Kwon et al., 1990, Jo and Park, 2010). The land-use pattern in
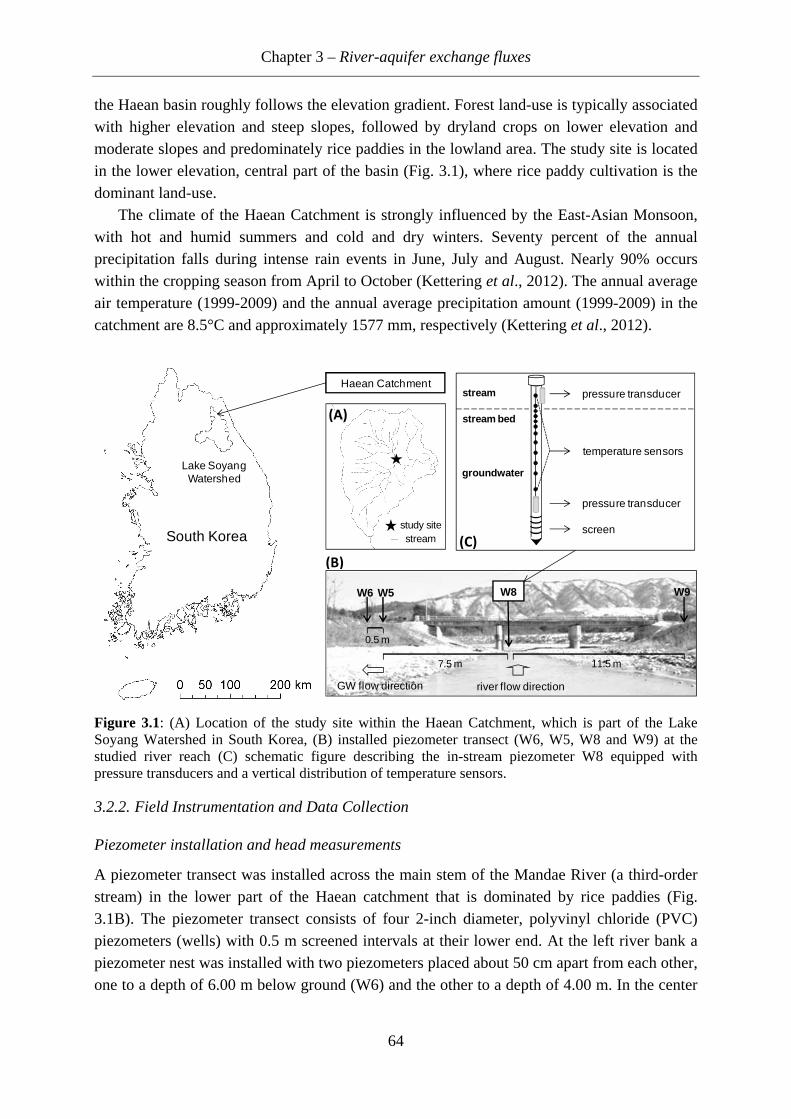
Chapter 3 – River-aquifer exchange fluxes
64
the Haean basin roughly follows the elevation gradient. Forest land-use is typically associated with higher elevation and steep slopes, followed by dryland crops on lower elevation and moderate slopes and predominately rice paddies in the lowland area. The study site is located in the lower elevation, central part of the basin (Fig. 3.1), where rice paddy cultivation is the dominant land-use.
The climate of the Haean Catchment is strongly influenced by the East-Asian Monsoon, with hot and humid summers and cold and dry winters. Seventy percent of the annual precipitation falls during intense rain events in June, July and August. Nearly 90% occurs within the cropping season from April to October (Kettering et al., 2012). The annual average air temperature (1999-2009) and the annual average precipitation amount (1999-2009) in the catchment are 8.5°C and approximately 1577 mm, respectively (Kettering et al., 2012).
Figure 3.1: (A) Location of the study site within the Haean Catchment, which is part of the Lake Soyang Watershed in South Korea, (B) installed piezometer transect (W6, W5, W8 and W9) at the studied river reach (C) schematic figure describing the in-stream piezometer W8 equipped with pressure transducers and a vertical distribution of temperature sensors.
3.2.2. Field Instrumentation and Data Collection
Piezometer installation and head measurements
A piezometer transect was installed across the main stem of the Mandae River (a third-order stream) in the lower part of the Haean catchment that is dominated by rice paddies (Fig. 3.1B). The piezometer transect consists of four 2-inch diameter, polyvinyl chloride (PVC) piezometers (wells) with 0.5 m screened intervals at their lower end. At the left river bank a piezometer nest was installed with two piezometers placed about 50 cm apart from each other, one to a depth of 6.00 m below ground (W6) and the other to a depth of 4.00 m. In the center
South Korea
Lake Soyang Watershed
Haean Catchment
streamstudy site
river flow direction
W6 W5 W8 W9
0.5 m
7.5 m 11.5 m
GW flow direction
temperature sensors
pressure transducer
pressure transducer
screen
stream bed
stream
groundwater
(A)
(B)
(C)
Chapter 3 – River-aquifer exchange fluxes
65
of the river channel, we installed a piezometer (W8) to a depth of 3.0 m, which was capped and sealed to prevent surface water from entering during high river stages. Piezometer W9 on the right bank was installed to a depth of 5.00 m. All piezometers were equipped with absolute pressure transducers (M10 Levelogger, Model 3001, Solinst Ltd., Canada, ±0.01 m), which recorded total head and temperature at 15 min intervals over the period from March to December 2010. A stilling well, equipped with an additional M10 pressure transducer, was attached to W8 to monitor river stage and from that the vertical hydraulic gradient between the river and the groundwater at 2.75 m below the streambed (center of the screened interval of W8). River stage was recorded every 15 minutes. Water level readings recorded by leveloggers were corrected for atmospheric pressure variations by using the atmospheric pressure readings of a Barologger (Barologger, Model 3001, Solinst Ltd., Canada), attached to the outer top of piezometer W5.
Temperature measurements
Using heat as tracer to determine exchange fluxes between ground- and surface water requires temperature measurements in the river and at one or more depths within the riverbed over time. From these data, flux estimates can be obtained by inversion either using analytical methods based on time-series (e.g. Hatch et al., 2006; Keery et al., 2007) or vertical temperature profiles (Schmidt et al., 2006; Anibas et al., 2009), or through numerical models (Brookfield et al., 2009). Numerical modeling requires additional data to define the hydraulic boundary conditions such as river stage and total heads in the adjoining aquifer (Anderson, 2005). To obtain a vertical distribution of temperatures W8 was instrumented using 12 thermistors with dataloggers (iBCod Type Z, Alpha Mach Inc, ± 1°C). Because the highest temperature gradients were assumed near the water sediment interface, temperature sensors were installed at shorter spatial intervals near the interface. One sensor was placed in the river water, attached to the outside of the piezometer pipe at about 10 cm above the water sediment interface. Additional sensors were placed at 5, 10, 15, 20, 30, 40, 60, 80, 110, 140 and 190 cm below the water sediment interface.
Discharge measurements and weather observations
In-stream discharge was manually measured for a representative range of stage heights using the velocity-area method with an electromagnetic current meter for flow velocity (FlowSens, ±0.5%, SEBA Hydrometrie GmbH, Kaufbeuren, Germany). The measured discharges and the continuously monitored river stage were used to develop a stage-discharge rating curve as previously described by Shope et al. (2013) (see also: (Clark et al., 2007). Precipitation and air temperature were additionally recorded at 30 minute intervals using an automatic weather station (WS-GP1, Delta-T Devices, Cambridge, UK).
Water chemistry measurements
Export of nitrate and phosphorous from the Haean catchment, which is heavily used for agriculture is a major societal concern, because it impairs the water quality of the downstream
Chapter 3 – River-aquifer exchange fluxes
66
receiving waters and may ultimately contribute to eutrophication in Lake Soyang (Kim et al., 2006). To elucidate potential effects of river-aquifer exchange dynamics on the biogeochemical processing of solutes at the interface, nitrate and DOC concentrations and in-situ DOsat concentrations using a conventional field sensor (HQ10 device / LDO sensor; Hach Lange; Germany) were measured in the stream and groundwater along the piezometer transect between 06/14/2010 and 08/13/2010. Under dry conditions (between monsoonal precipitation events), river and groundwater samples were collected weekly. During monsoonal precipitation events, river water was sampled every two hours. Groundwater samples were collected from each of the piezometers (see Fig. 3.1) using a submersible pump (REICH Tauchpumpe, Germany). Each of the samples was immediately refrigerated to < 4oC prior to analysis for nitrate and DOC (dissolved organic carbon). Analysis of nitrate and DOC were completed at the laboratory of the Department of Environmental Science, Kangwon National University in Chuncheon. DOC concentrations were measured by the HTCO method using a Shimadzu 5000 total carbon analyzer with 2.8 g of a 20% Pt catalyst on quartz wool subsequent to the filtering of water samples through pre-combusted (4508C) Whatman GF/F Filters. Nitrate was analyzed by the automated flow injection cadmium reduction method using an automated ion analyzer system (Quickchem 8000, Lachat).
3.2.3. Modeling Approach
Model set-up
A 2D numerical model of the river-aquifer system along the piezometer transect was developed based on the numerical code HydroGeoSphere (HGS) (Therrien, 2008). HGS simulates fully-integrated surface and subsurface water flow as well as solute and thermal energy transport. It solves Richards' equation using a finite element approach to describe transient subsurface flow in variably-saturated porous media. Solute and heat transport are simulated based on an advection-dispersion equation (Therrien, 2008).
Corresponding to the experimental design of the monitored piezometer transect, a 2D cross section perpendicular to the direction of stream flow was chosen as the model domain. The upper model boundary corresponds to the topography of the land surface and river channel (cross section width: 20 m), which were surveyed with an optical level (Tachymat WILD TC1000). The pre-processing software GRID BUILDER (McLaren, 2008) was used to generate a finite element mesh within the model domain with an average node spacing of approximately 0.40 m. Discretization of the numerical grid was radially refined in the area around the stream channel (radius = 8 m, node spacing: 0.05 - 0.15 m) yielding a final total number of 3408 nodes Adjustment of river bed geometry resulting from scouring during the first extreme rainfall event of the Monsoon season 2010 (5th of July) was accommodated by an additional mesh (total number of nodes: 3360) that was used for the simulations after the scouring event. The new channel elevations were obtained from a second survey of the piezometer transect again using the optical level. Subsequently several control measurements were conducted to check for further changes in streambed elevation. The continuously
Chapter 3 – River-aquifer exchange fluxes
67
measured river stage served as the upper time variable boundary condition (first-type boundary) for the defined river channel nodes, while the land surface adjacent to the channel was described as a variable flux boundary with the observed precipitation rates applied as inflow. As the upper time-variable thermal input, the continuously measured river water temperatures were applied to the river channel nodes (time variable first-type boundary). Model nodes outside of the river channel were treated as no-flow boundaries for heat. Radiative input of heat at the land surface was neglected. The lateral boundaries of the model domain were placed at the piezometer furthest to the East (W6) and West (W9), respectively. The total heads and temperatures observed in those piezometers were used as time-variable boundary inputs (first-type boundary) similar to (Eddy-Miller, 2009). The lower model domain boundary was defined as a horizontal no-flow boundary located approximately 20 m below the riverbed. The bottom thermal boundary condition was also treated as a no-flow boundary. The model was set up to have hourly recharge periods, and therefore all time variable input data were implemented as hourly values. To obtain reasonable initial conditions the model was run for a 30 day spin-up period with forcing from the first 30 days of the data record and initial uniform temperature based on the mean ambient groundwater temperature measured in W6. Initial conditions for the second simulation period (with the adapted mesh) were obtained by extracting the total head and temperature distribution of the last simulation time step from the original grid and were transcribed to the new grid by using linear interpolation
Hydraulic and thermal properties
The distribution of soil properties within the model domain is based on soil samples taken during piezometer installation. Soil samples were collected over 50 cm intervals for the entire length of the piezometers W6 and W8. The collected samples were analyzed for soil texture by sieving (sand fraction). The silt and clay fractions were estimated using a Mastersizer S laser light scattering system (Model MAM 5004, Malvern Instruments, Herrenberg, Germany). Based on the estimated soil textures the model domain was divided into two distinct zones (first zone: top of the domain down to about 2 m below the river bed; second zone: domain > 2 m below the river bed) with different soil material properties (see Tab. 3.1). The initial soil hydraulic parameters were estimated using the measured soil textures and the computer program ROSETTA, which implements five hierarchical pedotransfer functions to estimate soil hydraulic properties (Schaap et al., 2001). In Table 3.1, the analyzed soil textures and the Van Genuchten parameters estimated by ROSETTA are presented. Since the simulated temperatures and in turn the uncertainties in the advective flux calculations are most sensitive to changes in hydraulic conductivity (K) (Keery et al., 2007), the model was calibrated for the period from 6/5/2010 to 7/5/2010 by inversely estimating the hydraulic conductivities using the parameter estimation code PEST (Doherty, 2005). PEST iteratively adjusted the hydraulic conductivities of the two zones with an objective function (sum of weighted squared deviations between simulated and observed temperatures) until the simulated temperatures optimally approximated the observed values. The optimized saturated
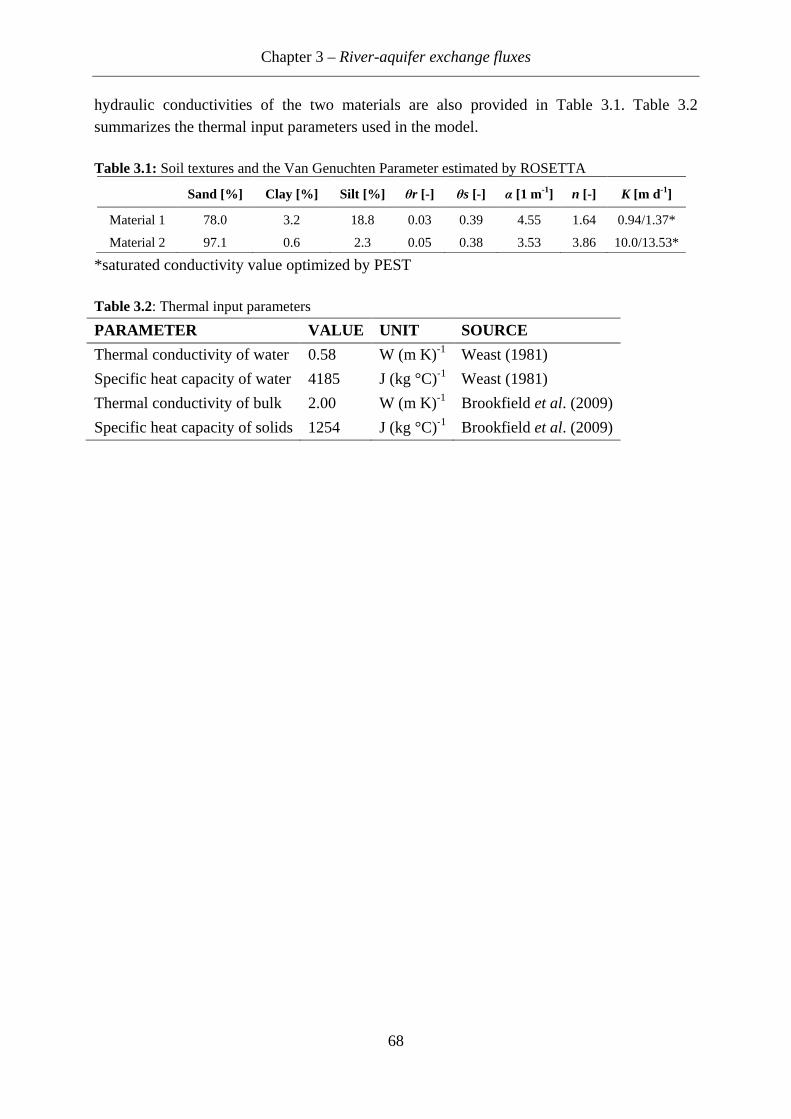
Chapter 3 – River-aquifer exchange fluxes
68
hydraulic conductivities of the two materials are also provided in Table 3.1. Table 3.2 summarizes the thermal input parameters used in the model. Table 3.1: Soil textures and the Van Genuchten Parameter estimated by ROSETTA
*saturated conductivity value optimized by PEST Table 3.2: Thermal input parameters
PARAMETER VALUE UNIT SOURCE
Thermal conductivity of water 0.58 W (m K)-1 Weast (1981)
Specific heat capacity of water 4185 J (kg °C)-1 Weast (1981)
Thermal conductivity of bulk 2.00 W (m K)-1 Brookfield et al. (2009)
Specific heat capacity of solids 1254 J (kg °C)-1 Brookfield et al. (2009)
Sand [%] Clay [%] Silt [%] θr [-] θs [-] α [1 m-1] n [-] K [m d-1]
Material 1 78.0 3.2 18.8 0.03 0.39 4.55 1.64 0.94/1.37*
Material 2 97.1 0.6 2.3 0.05 0.38 3.53 3.86 10.0/13.53*
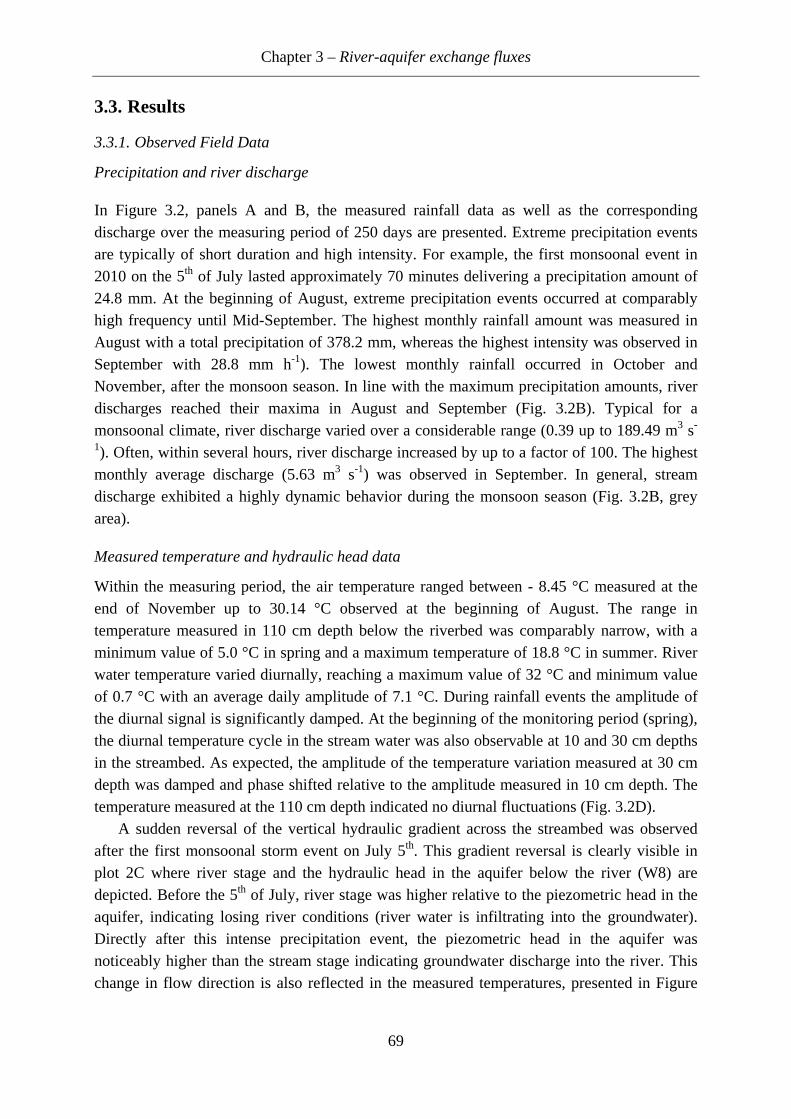
Chapter 3 – River-aquifer exchange fluxes
69
3.3. Results
3.3.1. Observed Field Data
Precipitation and river discharge
In Figure 3.2, panels A and B, the measured rainfall data as well as the corresponding discharge over the measuring period of 250 days are presented. Extreme precipitation events are typically of short duration and high intensity. For example, the first monsoonal event in 2010 on the 5th of July lasted approximately 70 minutes delivering a precipitation amount of 24.8 mm. At the beginning of August, extreme precipitation events occurred at comparably high frequency until Mid-September. The highest monthly rainfall amount was measured in August with a total precipitation of 378.2 mm, whereas the highest intensity was observed in September with 28.8 mm h-1). The lowest monthly rainfall occurred in October and November, after the monsoon season. In line with the maximum precipitation amounts, river discharges reached their maxima in August and September (Fig. 3.2B). Typical for a monsoonal climate, river discharge varied over a considerable range (0.39 up to 189.49 m3 s-
1). Often, within several hours, river discharge increased by up to a factor of 100. The highest monthly average discharge (5.63 m3 s-1) was observed in September. In general, stream discharge exhibited a highly dynamic behavior during the monsoon season (Fig. 3.2B, grey area).
Measured temperature and hydraulic head data
Within the measuring period, the air temperature ranged between - 8.45 °C measured at the end of November up to 30.14 °C observed at the beginning of August. The range in temperature measured in 110 cm depth below the riverbed was comparably narrow, with a minimum value of 5.0 °C in spring and a maximum temperature of 18.8 °C in summer. River water temperature varied diurnally, reaching a maximum value of 32 °C and minimum value of 0.7 °C with an average daily amplitude of 7.1 °C. During rainfall events the amplitude of the diurnal signal is significantly damped. At the beginning of the monitoring period (spring), the diurnal temperature cycle in the stream water was also observable at 10 and 30 cm depths in the streambed. As expected, the amplitude of the temperature variation measured at 30 cm depth was damped and phase shifted relative to the amplitude measured in 10 cm depth. The temperature measured at the 110 cm depth indicated no diurnal fluctuations (Fig. 3.2D).
A sudden reversal of the vertical hydraulic gradient across the streambed was observed after the first monsoonal storm event on July 5th. This gradient reversal is clearly visible in plot 2C where river stage and the hydraulic head in the aquifer below the river (W8) are depicted. Before the 5th of July, river stage was higher relative to the piezometric head in the aquifer, indicating losing river conditions (river water is infiltrating into the groundwater). Directly after this intense precipitation event, the piezometric head in the aquifer was noticeably higher than the stream stage indicating groundwater discharge into the river. This change in flow direction is also reflected in the measured temperatures, presented in Figure
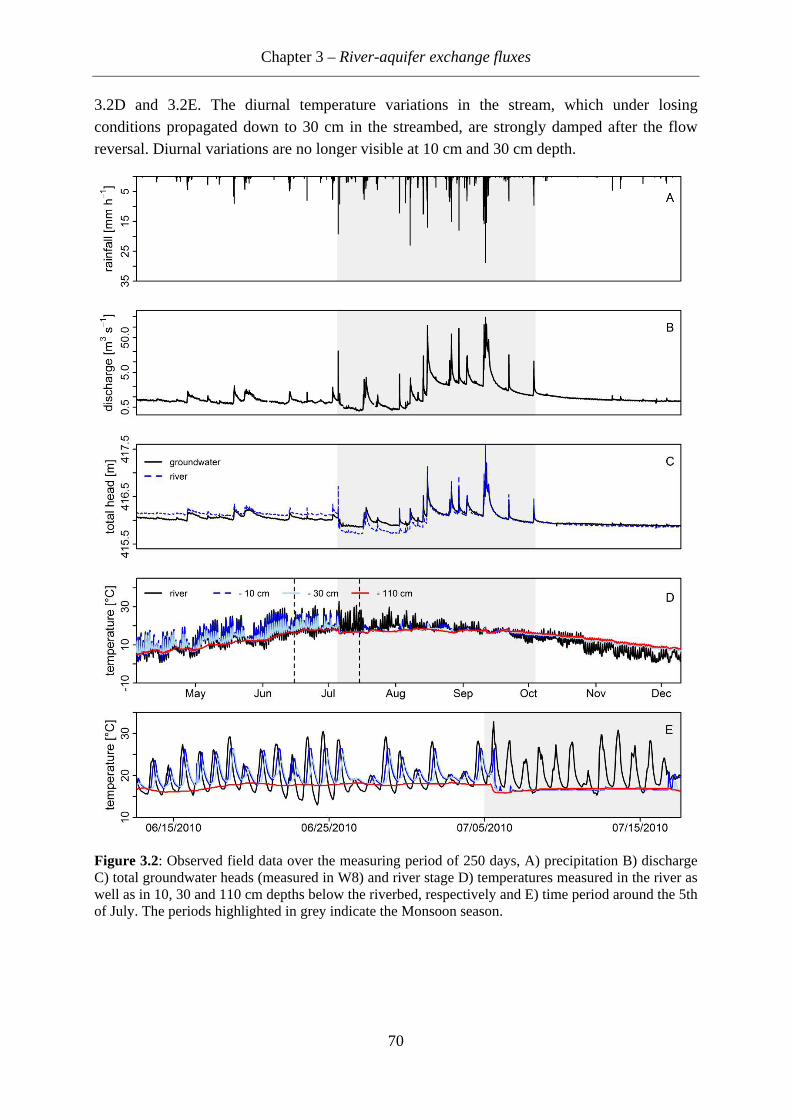
Chapter 3 – River-aquifer exchange fluxes
70
3.2D and 3.2E. The diurnal temperature variations in the stream, which under losing conditions propagated down to 30 cm in the streambed, are strongly damped after the flow reversal. Diurnal variations are no longer visible at 10 cm and 30 cm depth.
Figure 3.2: Observed field data over the measuring period of 250 days, A) precipitation B) discharge C) total groundwater heads (measured in W8) and river stage D) temperatures measured in the river as well as in 10, 30 and 110 cm depths below the riverbed, respectively and E) time period around the 5th of July. The periods highlighted in grey indicate the Monsoon season.
Riverbed elevation changes
The comparably short but very intensive prsignificant riverbed scouring, resulting in a significant change in riverbed elevation (Fig. Observations throughout the Haean Catchment in multiple years indicate that common phenomenon. The fresults in significant scour of the streambed and associated changes in riverbed elevation. sporadic control measurements of channel elevation after the scour in 2010 suggested that after this initial geomorphologically formingstate of W8 the elevation of the streambed was lowered by 30 cm during the event on (Fig. 3.3). Hence the temperature sensors that had been at 5, 10, 15, 20 and 30 cm below the original streambed elevation were now above the waterhad been at 40, 60 and 140 cm below the original streambe30 and 110 cm below the new streambed elevation.
Figure 3.precipitation event on the 5th of July.
3.3.2. Mod
Model calibration and evaluation
The model was calibrated to temperatures observed atthe riverbed and to a time period of 30 days. RMSE coefficient) and NSE (Nash Sutcliffe efficiency) were used to evaluate the model simulations.
Overall3.3). Nash0.85 to 0.99temperatures also show a good agreementobserved tempe
Riverbed elevation changes
The comparably short but very intensive prsignificant riverbed scouring, resulting in a significant change in riverbed elevation (Fig. Observations throughout the Haean Catchment in multiple years indicate that common phenomenon. The fresults in significant scour of the streambed and associated changes in riverbed elevation. sporadic control measurements of channel elevation after the scour in 2010 suggested that
this initial geomorphologically formingstate of dynamic equilibriumW8 the elevation of the streambed was lowered by 30 cm during the event on
3). Hence the temperature sensors that had been at 5, 10, 15, 20 and 30 cm below the original streambed elevation were now above the waterhad been at 40, 60 and 140 cm below the original streambe30 and 110 cm below the new streambed elevation.
Figure 3.3: Riverbed elevation changes: Surveyed riverbed topography before and after the intense precipitation event on the 5th of July.
Model Results
Model calibration and evaluation
The model was calibrated to temperatures observed atthe riverbed and to a time period of 30 days. RMSE coefficient) and NSE (Nash Sutcliffe efficiency) were used to evaluate the model simulations.
Overall, the model represents the observed hydraulic heads and temperatures well (Tab. 3). Nash-Sutcliffe ef
0.85 to 0.99, respectively. temperatures also show a good agreementobserved temperatures for the calibration period (06/05/2010
Chapter 3
Riverbed elevation changes
The comparably short but very intensive prsignificant riverbed scouring, resulting in a significant change in riverbed elevation (Fig. Observations throughout the Haean Catchment in multiple years indicate that common phenomenon. The first intensive precipitation event of the monsoon season typically results in significant scour of the streambed and associated changes in riverbed elevation. sporadic control measurements of channel elevation after the scour in 2010 suggested that
this initial geomorphologically formingequilibrium
W8 the elevation of the streambed was lowered by 30 cm during the event on 3). Hence the temperature sensors that had been at 5, 10, 15, 20 and 30 cm below the
original streambed elevation were now above the waterhad been at 40, 60 and 140 cm below the original streambe30 and 110 cm below the new streambed elevation.
Riverbed elevation changes: Surveyed riverbed topography before and after the intense precipitation event on the 5th of July.
el Results
Model calibration and evaluation
The model was calibrated to temperatures observed atthe riverbed and to the hydraulic heads measured in piezometers W8 and W5a time period of 30 days. RMSE coefficient) and NSE (Nash Sutcliffe efficiency) were used to evaluate the model simulations.
, the model represents the observed hydraulic heads and temperatures well (Tab. Sutcliffe efficiencies and correlation coefficients ranged from 0., respectively. Maximum RMSE values for head
temperatures also show a good agreementratures for the calibration period (06/05/2010
Chapter 3 – River
The comparably short but very intensive prsignificant riverbed scouring, resulting in a significant change in riverbed elevation (Fig. Observations throughout the Haean Catchment in multiple years indicate that
irst intensive precipitation event of the monsoon season typically results in significant scour of the streambed and associated changes in riverbed elevation. sporadic control measurements of channel elevation after the scour in 2010 suggested that
this initial geomorphologically formingwith minimal subsequent changes in channel elevation. At well
W8 the elevation of the streambed was lowered by 30 cm during the event on 3). Hence the temperature sensors that had been at 5, 10, 15, 20 and 30 cm below the
original streambed elevation were now above the waterhad been at 40, 60 and 140 cm below the original streambe30 and 110 cm below the new streambed elevation.
Riverbed elevation changes: Surveyed riverbed topography before and after the intense precipitation event on the 5th of July.
Model calibration and evaluation
The model was calibrated to temperatures observed atthe hydraulic heads measured in piezometers W8 and W5
a time period of 30 days. RMSE (root mean square error), R (Pearson’s correlation coefficient) and NSE (Nash Sutcliffe efficiency) were used to evaluate the model simulations.
, the model represents the observed hydraulic heads and temperatures well (Tab. ficiencies and correlation coefficients ranged from 0.
Maximum RMSE values for headtemperatures also show a good agreement
ratures for the calibration period (06/05/2010
River-aquifer exchange fluxes
71
The comparably short but very intensive precipitation event onsignificant riverbed scouring, resulting in a significant change in riverbed elevation (Fig. Observations throughout the Haean Catchment in multiple years indicate that
irst intensive precipitation event of the monsoon season typically results in significant scour of the streambed and associated changes in riverbed elevation. sporadic control measurements of channel elevation after the scour in 2010 suggested that
this initial geomorphologically forming event the system with minimal subsequent changes in channel elevation. At well
W8 the elevation of the streambed was lowered by 30 cm during the event on 3). Hence the temperature sensors that had been at 5, 10, 15, 20 and 30 cm below the
original streambed elevation were now above the waterhad been at 40, 60 and 140 cm below the original streambe30 and 110 cm below the new streambed elevation.
Riverbed elevation changes: Surveyed riverbed topography before and after the intense
The model was calibrated to temperatures observed atthe hydraulic heads measured in piezometers W8 and W5
(root mean square error), R (Pearson’s correlation coefficient) and NSE (Nash Sutcliffe efficiency) were used to evaluate the model simulations.
, the model represents the observed hydraulic heads and temperatures well (Tab. ficiencies and correlation coefficients ranged from 0.
Maximum RMSE values for headtemperatures also show a good agreement with the measured temperatures
ratures for the calibration period (06/05/2010
aquifer exchange fluxes
ecipitation event onsignificant riverbed scouring, resulting in a significant change in riverbed elevation (Fig. Observations throughout the Haean Catchment in multiple years indicate that
irst intensive precipitation event of the monsoon season typically results in significant scour of the streambed and associated changes in riverbed elevation. sporadic control measurements of channel elevation after the scour in 2010 suggested that
event the system with minimal subsequent changes in channel elevation. At well
W8 the elevation of the streambed was lowered by 30 cm during the event on 3). Hence the temperature sensors that had been at 5, 10, 15, 20 and 30 cm below the
original streambed elevation were now above the water-sediment interface. The sensors that had been at 40, 60 and 140 cm below the original streambed elevation now correspond to 10,
Riverbed elevation changes: Surveyed riverbed topography before and after the intense
The model was calibrated to temperatures observed at 10 cm, 30 cm, and 110 cm depth below the hydraulic heads measured in piezometers W8 and W5
(root mean square error), R (Pearson’s correlation coefficient) and NSE (Nash Sutcliffe efficiency) were used to evaluate the model simulations.
, the model represents the observed hydraulic heads and temperatures well (Tab. ficiencies and correlation coefficients ranged from 0.
Maximum RMSE values for headwith the measured temperatures
ratures for the calibration period (06/05/2010 –
aquifer exchange fluxes
ecipitation event on July 5significant riverbed scouring, resulting in a significant change in riverbed elevation (Fig. Observations throughout the Haean Catchment in multiple years indicate that
irst intensive precipitation event of the monsoon season typically results in significant scour of the streambed and associated changes in riverbed elevation. sporadic control measurements of channel elevation after the scour in 2010 suggested that
event the system quickly reverts back towith minimal subsequent changes in channel elevation. At well
W8 the elevation of the streambed was lowered by 30 cm during the event on 3). Hence the temperature sensors that had been at 5, 10, 15, 20 and 30 cm below the
sediment interface. The sensors that d elevation now correspond to 10,
Riverbed elevation changes: Surveyed riverbed topography before and after the intense
10 cm, 30 cm, and 110 cm depth below the hydraulic heads measured in piezometers W8 and W5
(root mean square error), R (Pearson’s correlation coefficient) and NSE (Nash Sutcliffe efficiency) were used to evaluate the model simulations.
, the model represents the observed hydraulic heads and temperatures well (Tab. ficiencies and correlation coefficients ranged from 0.
Maximum RMSE values for head were 0.04 with the measured temperatures
07/05/2010), as well as for the
July 5th, 2010 caused significant riverbed scouring, resulting in a significant change in riverbed elevation (Fig. Observations throughout the Haean Catchment in multiple years indicate that scouring
irst intensive precipitation event of the monsoon season typically results in significant scour of the streambed and associated changes in riverbed elevation. sporadic control measurements of channel elevation after the scour in 2010 suggested that
quickly reverts back towith minimal subsequent changes in channel elevation. At well
W8 the elevation of the streambed was lowered by 30 cm during the event on July 53). Hence the temperature sensors that had been at 5, 10, 15, 20 and 30 cm below the
sediment interface. The sensors that d elevation now correspond to 10,
Riverbed elevation changes: Surveyed riverbed topography before and after the intense
10 cm, 30 cm, and 110 cm depth below the hydraulic heads measured in piezometers W8 and W5 (Fig. 3.1B) over
(root mean square error), R (Pearson’s correlation coefficient) and NSE (Nash Sutcliffe efficiency) were used to evaluate the model simulations.
, the model represents the observed hydraulic heads and temperatures well (Tab. ficiencies and correlation coefficients ranged from 0.60 to 0.9
4 m. The simulated with the measured temperatures. Simulated versus
07/05/2010), as well as for the
, 2010 caused significant riverbed scouring, resulting in a significant change in riverbed elevation (Fig. 3.3).
scouring is a irst intensive precipitation event of the monsoon season typically
results in significant scour of the streambed and associated changes in riverbed elevation. The sporadic control measurements of channel elevation after the scour in 2010 suggested that
quickly reverts back to a new with minimal subsequent changes in channel elevation. At well
July 5th, 2010 3). Hence the temperature sensors that had been at 5, 10, 15, 20 and 30 cm below the
sediment interface. The sensors that d elevation now correspond to 10,
Riverbed elevation changes: Surveyed riverbed topography before and after the intense
10 cm, 30 cm, and 110 cm depth below 1B) over
(root mean square error), R (Pearson’s correlation coefficient) and NSE (Nash Sutcliffe efficiency) were used to evaluate the model simulations.
, the model represents the observed hydraulic heads and temperatures well (Tab. to 0.98 and
simulated . Simulated versus
07/05/2010), as well as for the
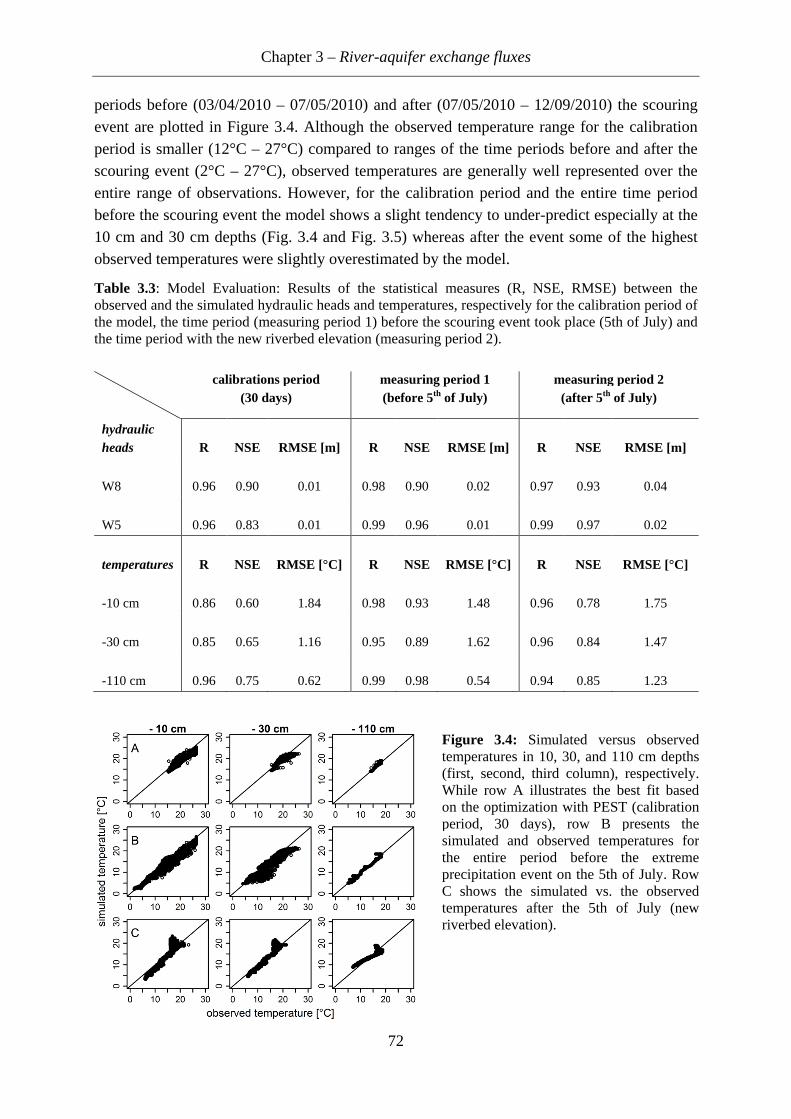
Chapter 3 – River-aquifer exchange fluxes
72
periods before (03/04/2010 – 07/05/2010) and after (07/05/2010 – 12/09/2010) the scouring event are plotted in Figure 3.4. Although the observed temperature range for the calibration period is smaller (12°C – 27°C) compared to ranges of the time periods before and after the scouring event (2°C – 27°C), observed temperatures are generally well represented over the entire range of observations. However, for the calibration period and the entire time period before the scouring event the model shows a slight tendency to under-predict especially at the 10 cm and 30 cm depths (Fig. 3.4 and Fig. 3.5) whereas after the event some of the highest observed temperatures were slightly overestimated by the model.
Table 3.3: Model Evaluation: Results of the statistical measures (R, NSE, RMSE) between the observed and the simulated hydraulic heads and temperatures, respectively for the calibration period of the model, the time period (measuring period 1) before the scouring event took place (5th of July) and the time period with the new riverbed elevation (measuring period 2).
calibrations period (30 days)
measuring period 1 (before 5th of July)
measuring period 2 (after 5th of July)
hydraulic heads R NSE RMSE [m] R NSE RMSE [m] R NSE RMSE [m]
W8 0.96 0.90 0.01 0.98 0.90 0.02 0.97 0.93 0.04
W5 0.96 0.83 0.01 0.99 0.96 0.01 0.99 0.97 0.02
temperatures R NSE RMSE [°C] R NSE RMSE [°C] R NSE RMSE [°C]
-10 cm 0.86 0.60 1.84 0.98 0.93 1.48 0.96 0.78 1.75
-30 cm 0.85 0.65 1.16 0.95 0.89 1.62 0.96 0.84 1.47
-110 cm 0.96 0.75 0.62 0.99 0.98 0.54 0.94 0.85 1.23
Figure 3.4: Simulated versus observed temperatures in 10, 30, and 110 cm depths (first, second, third column), respectively. While row A illustrates the best fit based on the optimization with PEST (calibration period, 30 days), row B presents the simulated and observed temperatures for the entire period before the extreme precipitation event on the 5th of July. Row C shows the simulated vs. the observed temperatures after the 5th of July (new riverbed elevation).
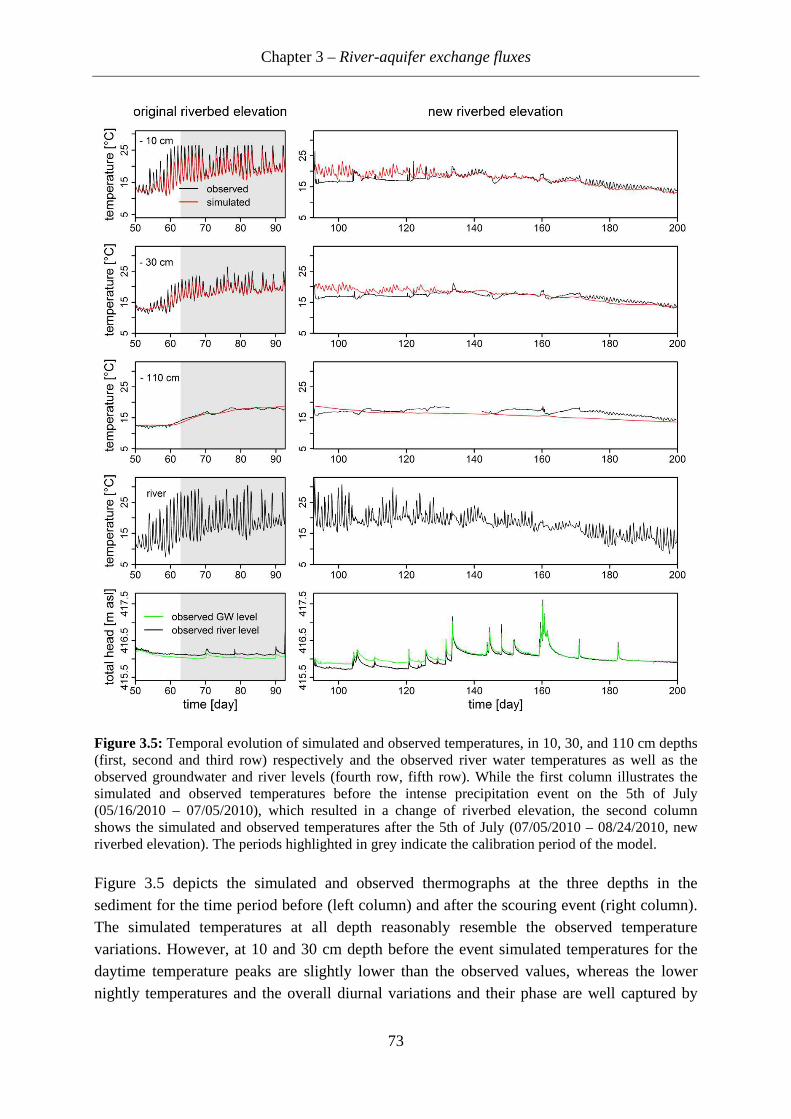
Chapter 3 – River-aquifer exchange fluxes
73
Figure 3.5: Temporal evolution of simulated and observed temperatures, in 10, 30, and 110 cm depths (first, second and third row) respectively and the observed river water temperatures as well as the observed groundwater and river levels (fourth row, fifth row). While the first column illustrates the simulated and observed temperatures before the intense precipitation event on the 5th of July (05/16/2010 – 07/05/2010), which resulted in a change of riverbed elevation, the second column shows the simulated and observed temperatures after the 5th of July (07/05/2010 – 08/24/2010, new riverbed elevation). The periods highlighted in grey indicate the calibration period of the model.
Figure 3.5 depicts the simulated and observed thermographs at the three depths in the sediment for the time period before (left column) and after the scouring event (right column). The simulated temperatures at all depth reasonably resemble the observed temperature variations. However, at 10 and 30 cm depth before the event simulated temperatures for the daytime temperature peaks are slightly lower than the observed values, whereas the lower nightly temperatures and the overall diurnal variations and their phase are well captured by
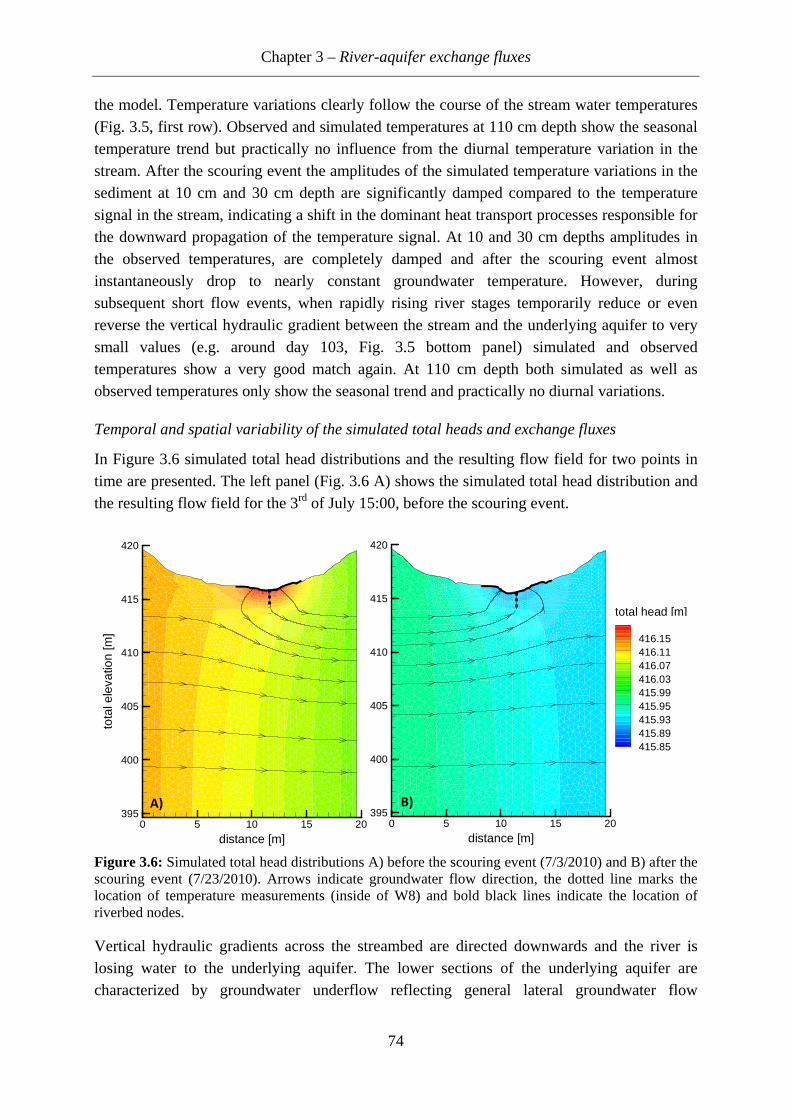
Chapter 3 – River-aquifer exchange fluxes
74
the model. Temperature variations clearly follow the course of the stream water temperatures (Fig. 3.5, first row). Observed and simulated temperatures at 110 cm depth show the seasonal temperature trend but practically no influence from the diurnal temperature variation in the stream. After the scouring event the amplitudes of the simulated temperature variations in the sediment at 10 cm and 30 cm depth are significantly damped compared to the temperature signal in the stream, indicating a shift in the dominant heat transport processes responsible for the downward propagation of the temperature signal. At 10 and 30 cm depths amplitudes in the observed temperatures, are completely damped and after the scouring event almost instantaneously drop to nearly constant groundwater temperature. However, during subsequent short flow events, when rapidly rising river stages temporarily reduce or even reverse the vertical hydraulic gradient between the stream and the underlying aquifer to very small values (e.g. around day 103, Fig. 3.5 bottom panel) simulated and observed temperatures show a very good match again. At 110 cm depth both simulated as well as observed temperatures only show the seasonal trend and practically no diurnal variations.
Temporal and spatial variability of the simulated total heads and exchange fluxes
In Figure 3.6 simulated total head distributions and the resulting flow field for two points in time are presented. The left panel (Fig. 3.6 A) shows the simulated total head distribution and the resulting flow field for the 3rd of July 15:00, before the scouring event.
Figure 3.6: Simulated total head distributions A) before the scouring event (7/3/2010) and B) after the scouring event (7/23/2010). Arrows indicate groundwater flow direction, the dotted line marks the location of temperature measurements (inside of W8) and bold black lines indicate the location of riverbed nodes.
Vertical hydraulic gradients across the streambed are directed downwards and the river is losing water to the underlying aquifer. The lower sections of the underlying aquifer are characterized by groundwater underflow reflecting general lateral groundwater flow
distance [m]
tota
lele
vatio
n[m
]
0 5 10 15 20395
400
405
410
415
420
distance [m]0 5 10 15 20
395
400
405
410
415
420
Head
416.15416.11416.07416.03415.99415.95415.93415.89415.85
total head [m]
A) B)
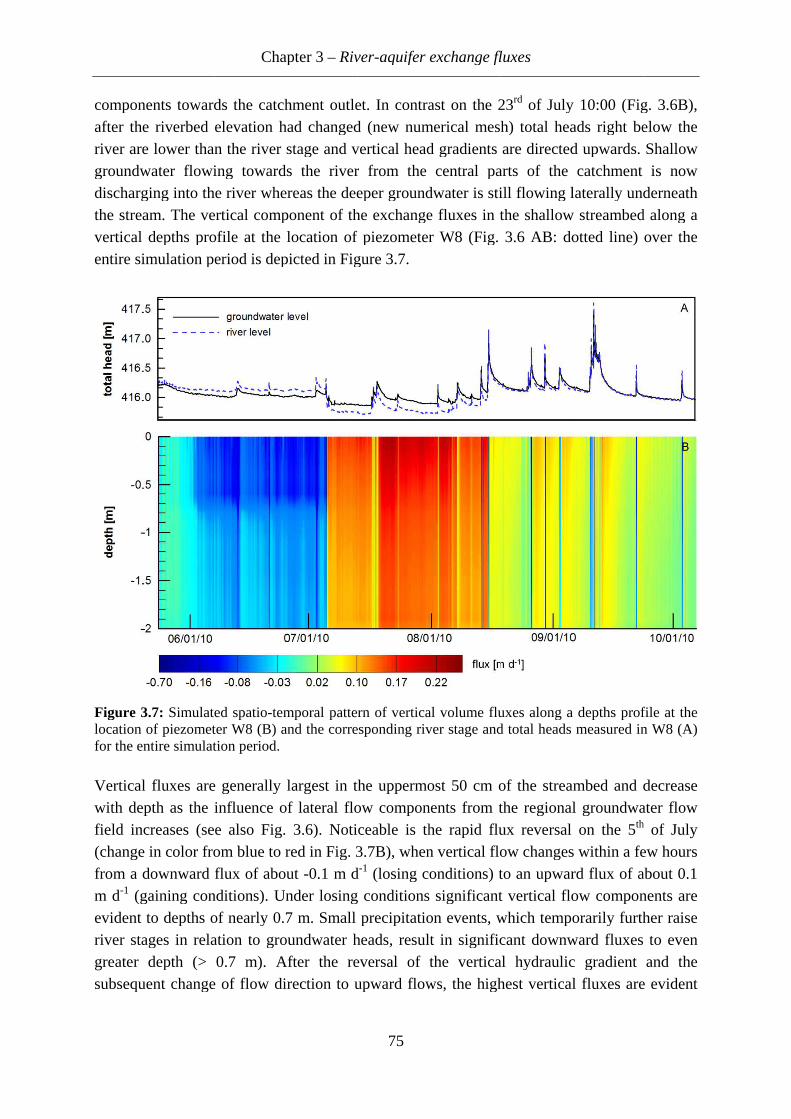
components towards the catchment outlet. In contrast on the 23after the riverbed elevation had changed (new numerical mesh) total heads rigriver are lower than the river stage and vertical head gradients are directed upwards. Shallow groundwater flowing towards the river from the central parts of the catchment is now discharging into the river whereas the deeper groundwater is stthe stream. The vertical component of the exchange fluxes in the shallow streambed along a vertical depths proentire simulation period is depicted in
Figure 3.location of piezometer W8 (B) and the corresponding river stage and total heads measured in W8 (A) for the ent Vertical fluxes are generally largest in the uppermost 50 cm of the streambed and decrease with depth as the influence of lateral flow components from the regional groundwater flow field increases (see also Fig. (change in color from blue to red in Fig.from a downward flux of about m d-1 (gaining conditions)evident to depths of river stagegreater depth (>subsequent change of flow direction to upward flows,
components towards the catchment outlet. In contrast on the 23after the riverbed elevation had changed (new numerical mesh) total heads rigriver are lower than the river stage and vertical head gradients are directed upwards. Shallow groundwater flowing towards the river from the central parts of the catchment is now discharging into the river whereas the deeper groundwater is stthe stream. The vertical component of the exchange fluxes in the shallow streambed along a vertical depths proentire simulation period is depicted in
Figure 3.7: Simulated spatiolocation of piezometer W8 (B) and the corresponding river stage and total heads measured in W8 (A) for the entire simulation period.
Vertical fluxes are generally largest in the uppermost 50 cm of the streambed and decrease with depth as the influence of lateral flow components from the regional groundwater flow field increases (see also Fig. (change in color from blue to red in Fig.
a downward flux of about gaining conditions)
evident to depths of river stages in relation to reater depth (>
subsequent change of flow direction to upward flows,
Chapter 3
components towards the catchment outlet. In contrast on the 23after the riverbed elevation had changed (new numerical mesh) total heads rigriver are lower than the river stage and vertical head gradients are directed upwards. Shallow groundwater flowing towards the river from the central parts of the catchment is now discharging into the river whereas the deeper groundwater is stthe stream. The vertical component of the exchange fluxes in the shallow streambed along a vertical depths profile at the location of piezometer W8 entire simulation period is depicted in
Simulated spatio-temporal pattern of vertical volume fluxes along a depths profile at the location of piezometer W8 (B) and the corresponding river stage and total heads measured in W8 (A)
ire simulation period.
Vertical fluxes are generally largest in the uppermost 50 cm of the streambed and decrease with depth as the influence of lateral flow components from the regional groundwater flow field increases (see also Fig. (change in color from blue to red in Fig.
a downward flux of about gaining conditions). Under losing conditions significant vertical flow components are
evident to depths of nearly 0.7in relation to groundwater
0.7 m). After the reversal subsequent change of flow direction to upward flows,
Chapter 3 – River
components towards the catchment outlet. In contrast on the 23after the riverbed elevation had changed (new numerical mesh) total heads rigriver are lower than the river stage and vertical head gradients are directed upwards. Shallow groundwater flowing towards the river from the central parts of the catchment is now discharging into the river whereas the deeper groundwater is stthe stream. The vertical component of the exchange fluxes in the shallow streambed along a
file at the location of piezometer W8 entire simulation period is depicted in Figure
temporal pattern of vertical volume fluxes along a depths profile at the location of piezometer W8 (B) and the corresponding river stage and total heads measured in W8 (A)
Vertical fluxes are generally largest in the uppermost 50 cm of the streambed and decrease with depth as the influence of lateral flow components from the regional groundwater flow field increases (see also Fig. 3.6). Noticeable is (change in color from blue to red in Fig. 3.
a downward flux of about -0.1 m dUnder losing conditions significant vertical flow components are
nearly 0.7 m. Small precipitation events, which groundwater heads. After the reversal
subsequent change of flow direction to upward flows,
River-aquifer exchange fluxes
75
components towards the catchment outlet. In contrast on the 23after the riverbed elevation had changed (new numerical mesh) total heads rigriver are lower than the river stage and vertical head gradients are directed upwards. Shallow groundwater flowing towards the river from the central parts of the catchment is now discharging into the river whereas the deeper groundwater is stthe stream. The vertical component of the exchange fluxes in the shallow streambed along a
file at the location of piezometer W8 Figure 3.7.
temporal pattern of vertical volume fluxes along a depths profile at the location of piezometer W8 (B) and the corresponding river stage and total heads measured in W8 (A)
Vertical fluxes are generally largest in the uppermost 50 cm of the streambed and decrease with depth as the influence of lateral flow components from the regional groundwater flow
Noticeable is the rapid 3.7B), when vertical flow changes d-1 (losing conditions
Under losing conditions significant vertical flow components are mall precipitation events, which
heads, result in significant downward flux. After the reversal of the
subsequent change of flow direction to upward flows,
aquifer exchange fluxes
components towards the catchment outlet. In contrast on the 23after the riverbed elevation had changed (new numerical mesh) total heads rigriver are lower than the river stage and vertical head gradients are directed upwards. Shallow groundwater flowing towards the river from the central parts of the catchment is now discharging into the river whereas the deeper groundwater is still flowing laterally underneath the stream. The vertical component of the exchange fluxes in the shallow streambed along a
file at the location of piezometer W8 (Fig.
temporal pattern of vertical volume fluxes along a depths profile at the location of piezometer W8 (B) and the corresponding river stage and total heads measured in W8 (A)
Vertical fluxes are generally largest in the uppermost 50 cm of the streambed and decrease with depth as the influence of lateral flow components from the regional groundwater flow
the rapid flux, when vertical flow changes
(losing conditions) to Under losing conditions significant vertical flow components are
mall precipitation events, which , result in significant downward flux
of the vertical hydraulic gradient and the subsequent change of flow direction to upward flows, the highe
aquifer exchange fluxes
components towards the catchment outlet. In contrast on the 23rd of July 10:00 (Fig. after the riverbed elevation had changed (new numerical mesh) total heads rigriver are lower than the river stage and vertical head gradients are directed upwards. Shallow groundwater flowing towards the river from the central parts of the catchment is now
ill flowing laterally underneath the stream. The vertical component of the exchange fluxes in the shallow streambed along a
Fig. 3.6 AB: dotted line
temporal pattern of vertical volume fluxes along a depths profile at the location of piezometer W8 (B) and the corresponding river stage and total heads measured in W8 (A)
Vertical fluxes are generally largest in the uppermost 50 cm of the streambed and decrease with depth as the influence of lateral flow components from the regional groundwater flow
flux reversal on the 5, when vertical flow changes
) to an upward flux of about Under losing conditions significant vertical flow components are
mall precipitation events, which temporarily further raise, result in significant downward flux
vertical hydraulic gradient and the highest vertical
of July 10:00 (Fig. after the riverbed elevation had changed (new numerical mesh) total heads right below the river are lower than the river stage and vertical head gradients are directed upwards. Shallow groundwater flowing towards the river from the central parts of the catchment is now
ill flowing laterally underneath the stream. The vertical component of the exchange fluxes in the shallow streambed along a
6 AB: dotted line)
temporal pattern of vertical volume fluxes along a depths profile at the location of piezometer W8 (B) and the corresponding river stage and total heads measured in W8 (A)
Vertical fluxes are generally largest in the uppermost 50 cm of the streambed and decrease with depth as the influence of lateral flow components from the regional groundwater flow
reversal on the 5th
, when vertical flow changes within a fewan upward flux of about
Under losing conditions significant vertical flow components are temporarily further raise
, result in significant downward fluxesvertical hydraulic gradient and the
st vertical fluxes are evident
of July 10:00 (Fig. 3.6B), ht below the
river are lower than the river stage and vertical head gradients are directed upwards. Shallow groundwater flowing towards the river from the central parts of the catchment is now
ill flowing laterally underneath the stream. The vertical component of the exchange fluxes in the shallow streambed along a
over the
temporal pattern of vertical volume fluxes along a depths profile at the
location of piezometer W8 (B) and the corresponding river stage and total heads measured in W8 (A)
Vertical fluxes are generally largest in the uppermost 50 cm of the streambed and decrease with depth as the influence of lateral flow components from the regional groundwater flow
th of July a few hours
an upward flux of about 0.1 Under losing conditions significant vertical flow components are
temporarily further raise to even
vertical hydraulic gradient and the fluxes are evident

Chapter 3 – River-aquifer exchange fluxes
76
close to the riverbed surface between 0 m and 0.3 m depth. The highest fluxes of groundwater into the river were simulated for the period right after the first long-lasting precipitation event of the monsoon season (16-18 July 2010, total rainfall amount = 64 mm). During this first significant groundwater recharge event groundwater heads steadily build up, while stream stages still quickly revert to low levels after the event, resulting in the most pronounced upward gradients observed during the study period. After several monsoonal precipitation events groundwater levels as well as river flows have generally increased and the heads in the stream (river stage) and in the aquifer below the streambed are starting to equilibrate. Consequently, the vertical hydraulic gradients across the streambed and the resulting fluxes of groundwater into the river are declining to very low values. During this time significant vertical head gradients across the streambed only develop in response to further precipitation events, which cause short-term gradient reversal due to rapidly rising stream stages during peak flows (Fig. 3.7). These dynamics are illustrated in Figure 3.8, which represents a close up of Figure 3.7 for a 6 day period in early September. For example, on the 10th of September the river stage rapidly rises to about 0.18 m above the observed groundwater head below the stream for several hours and then reverts to almost equilibrium with the groundwater head after the event. During these time periods river water is pushed into the streambed and the underlying aquifer. Vertical fluxes reach maximum values of - 0.68 m d-1 (10th of September). Based on the observed head and temperature data and the simulated exchange fluxes at the river-aquifer interface, the monitoring period can be subdivided into the following three main time periods: time period i: the period before the 5th of July when losing conditions prevailed (04/03/2010 - 07/05/2010); time period ii: the period when groundwater predominantly discharged to the river (07/05/2010 - 08/01/2010) and time period iii: the period with very small groundwater fluxes into the stream and short episodes of river water infiltration in response to storm events (08/01/2010 - 09/20/2010).
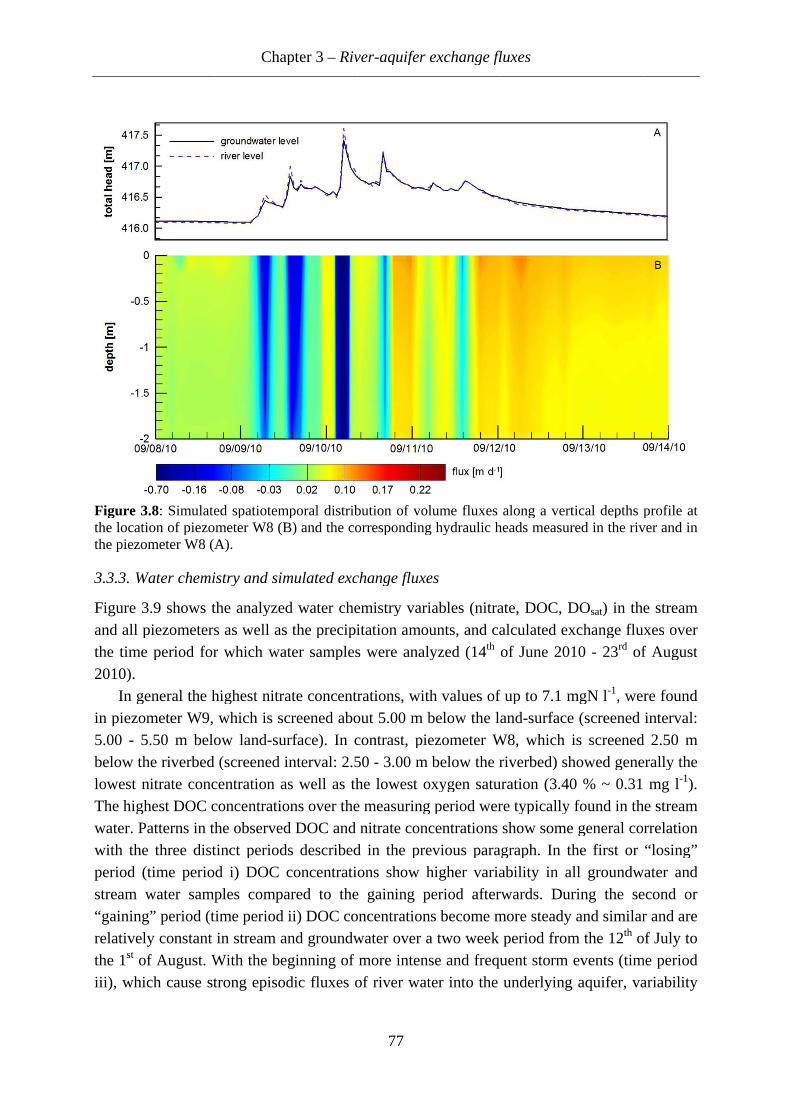
Figure 3.the location of piezometer W8 (B) and the corresponding hydraulic heads measured in the river and in the piezometer W8 (A).
3.3.3. Water
Figure 3.and all piezometers as well asthe time period for which water samples were analyzed (2010).
In general the highest nitrate coin piezometer W9, which is screened 5.00 - 5.50 m below landbelow the riverbelowest nitrate concentration as well as theThe highest DOC concentrations over the measuring period were water. Patterns in the observed DOC and nitrate concentrations show some general correlation with the three distinct periods described in the previous paragraph. In the first or “losing” period (time period i) DOC concentrations show stream “gaining”relatively constant in stream and groundwathe 1st of August. With the iii), which
Figure 3.8: Simulated spatiotemporal distribution of volume fluxes along a verthe location of piezometer W8 (B) and the corresponding hydraulic heads measured in the river and in the piezometer W8 (A).
Water chemistry
3.9 shows the analyzed and all piezometers as well asthe time period for which water samples were analyzed (
In general the highest nitrate co
in piezometer W9, which is screened 5.50 m below land
below the riverbed lowest nitrate concentration as well as the
highest DOC concentrations over the measuring period were Patterns in the observed DOC and nitrate concentrations show some general correlation
with the three distinct periods described in the previous paragraph. In the first or “losing” (time period i) DOC concentrations show
water samples “gaining” period (time period ii) DOC concentrations become more steady and similar and are relatively constant in stream and groundwa
of August. With the which cause strong
Chapter 3
Simulated spatiotemporal distribution of volume fluxes along a verthe location of piezometer W8 (B) and the corresponding hydraulic heads measured in the river and in the piezometer W8 (A).
chemistry and simulated exchange fluxes
shows the analyzed and all piezometers as well asthe time period for which water samples were analyzed (
In general the highest nitrate coin piezometer W9, which is screened
5.50 m below land-surface)d (screened interval: 2.50
lowest nitrate concentration as well as thehighest DOC concentrations over the measuring period were
Patterns in the observed DOC and nitrate concentrations show some general correlation with the three distinct periods described in the previous paragraph. In the first or “losing”
(time period i) DOC concentrations show samples compared to the gaining period afterwards.
(time period ii) DOC concentrations become more steady and similar and are relatively constant in stream and groundwa
of August. With the beginningstrong episodic
Chapter 3 – River
Simulated spatiotemporal distribution of volume fluxes along a verthe location of piezometer W8 (B) and the corresponding hydraulic heads measured in the river and in
and simulated exchange fluxes
shows the analyzed water chemistry variablesand all piezometers as well as the precipitation amountsthe time period for which water samples were analyzed (
In general the highest nitrate concentrations, with values in piezometer W9, which is screened about
surface). In contrast, pi(screened interval: 2.50
lowest nitrate concentration as well as thehighest DOC concentrations over the measuring period were
Patterns in the observed DOC and nitrate concentrations show some general correlation with the three distinct periods described in the previous paragraph. In the first or “losing”
(time period i) DOC concentrations show compared to the gaining period afterwards.
(time period ii) DOC concentrations become more steady and similar and are relatively constant in stream and groundwa
beginning of more intense and frequent storm eventsepisodic fluxes of river water into the
River-aquifer exchange fluxes
77
Simulated spatiotemporal distribution of volume fluxes along a verthe location of piezometer W8 (B) and the corresponding hydraulic heads measured in the river and in
and simulated exchange fluxes
chemistry variablesthe precipitation amounts
the time period for which water samples were analyzed (
ncentrations, with values about 5.00 m below
. In contrast, piezometer W8, which is screened 2.5(screened interval: 2.50 - 3.00 m below the riverbed)
lowest nitrate concentration as well as the lowest oxygen saturation highest DOC concentrations over the measuring period were
Patterns in the observed DOC and nitrate concentrations show some general correlation with the three distinct periods described in the previous paragraph. In the first or “losing”
(time period i) DOC concentrations show highecompared to the gaining period afterwards.
(time period ii) DOC concentrations become more steady and similar and are relatively constant in stream and groundwater over a two week
of more intense and frequent storm eventsfluxes of river water into the
aquifer exchange fluxes
Simulated spatiotemporal distribution of volume fluxes along a verthe location of piezometer W8 (B) and the corresponding hydraulic heads measured in the river and in
and simulated exchange fluxes
chemistry variables (nitrate, DOC, the precipitation amounts, and calculated exchange fluxes
the time period for which water samples were analyzed (14th of June 2010
ncentrations, with values of below the landezometer W8, which is screened 2.5
3.00 m below the riverbed) lowest oxygen saturation
highest DOC concentrations over the measuring period were Patterns in the observed DOC and nitrate concentrations show some general correlation
with the three distinct periods described in the previous paragraph. In the first or “losing” higher variability
compared to the gaining period afterwards. (time period ii) DOC concentrations become more steady and similar and are
ter over a two week of more intense and frequent storm events
fluxes of river water into the
aquifer exchange fluxes
Simulated spatiotemporal distribution of volume fluxes along a vertical depths profile at the location of piezometer W8 (B) and the corresponding hydraulic heads measured in the river and in
ate, DOC, DOand calculated exchange fluxes
of June 2010
of up to 7.1 mgNthe land-surface
ezometer W8, which is screened 2.53.00 m below the riverbed) showed generally the
lowest oxygen saturation (3.40 % highest DOC concentrations over the measuring period were typically
Patterns in the observed DOC and nitrate concentrations show some general correlation with the three distinct periods described in the previous paragraph. In the first or “losing”
r variability in allcompared to the gaining period afterwards. During the
(time period ii) DOC concentrations become more steady and similar and are period from the
of more intense and frequent storm eventsfluxes of river water into the underlying
tical depths profile at the location of piezometer W8 (B) and the corresponding hydraulic heads measured in the river and in
DOsat) in the stream and calculated exchange fluxes
of June 2010 - 23rd of August
up to 7.1 mgN l-1, were found surface (screened interval:
ezometer W8, which is screened 2.5showed generally the
(3.40 % ~ 0.31 typically found in the
Patterns in the observed DOC and nitrate concentrations show some general correlation with the three distinct periods described in the previous paragraph. In the first or “losing”
in all groundwaterDuring the second or
(time period ii) DOC concentrations become more steady and similar and are from the 12th of July
of more intense and frequent storm events (time period underlying aquifer, variability
tical depths profile at
the location of piezometer W8 (B) and the corresponding hydraulic heads measured in the river and in
in the stream and calculated exchange fluxes over
of August
, were found (screened interval:
ezometer W8, which is screened 2.50 m showed generally the
0.31 mg l-1). nd in the stream
Patterns in the observed DOC and nitrate concentrations show some general correlation with the three distinct periods described in the previous paragraph. In the first or “losing”
water and second or
(time period ii) DOC concentrations become more steady and similar and are of July to
(time period variability
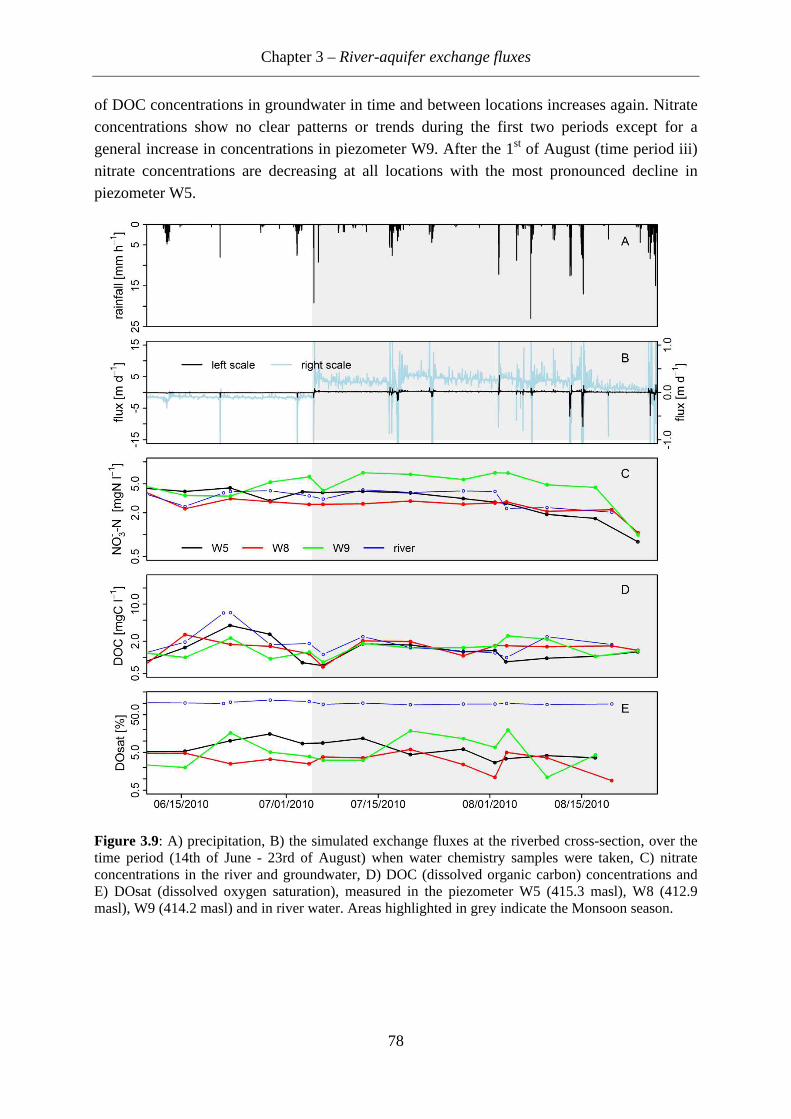
Chapter 3 – River-aquifer exchange fluxes
78
of DOC concentrations in groundwater in time and between locations increases again. Nitrate concentrations show no clear patterns or trends during the first two periods except for a general increase in concentrations in piezometer W9. After the 1st of August (time period iii) nitrate concentrations are decreasing at all locations with the most pronounced decline in piezometer W5.
Figure 3.9: A) precipitation, B) the simulated exchange fluxes at the riverbed cross-section, over the time period (14th of June - 23rd of August) when water chemistry samples were taken, C) nitrate concentrations in the river and groundwater, D) DOC (dissolved organic carbon) concentrations and E) DOsat (dissolved oxygen saturation), measured in the piezometer W5 (415.3 masl), W8 (412.9 masl), W9 (414.2 masl) and in river water. Areas highlighted in grey indicate the Monsoon season.
Chapter 3 – River-aquifer exchange fluxes
79
3.4. Discussion
3.4.1. Simulation of exchange fluxes
The numerical model could successfully be calibrated by inversely estimating the hydraulic conductivities using the parameter estimation code PEST. The statistical measures (Tab. 3.3) indicate that the model performs well in predicting both, the hydraulic heads and temperatures. The simulated dynamics in heads and temperatures compare well with the observed dynamics with low RMSE values (< 0.04 m for head; < 1.75 °C for temperature) and high correlation coefficients (mean = 0.98, min = 0.96 for head; mean = 0.94, min = 0.85 for temperature) and high Nash-Sutcliffe Efficiencies (mean = 0.91, min = 0.83 for head; mean = 0.81, min = 0.60 for temperature). The use of temperature data in addition to head data in the calibration of the model allowed to better constrain the hydraulic conductivity estimates, which had initially been derived from the analysis of the textural data using ROSETTA. The good match between the optimized hydraulic conductivities and the initial estimates based on sediment texture (Tab. 3.2) substantiates the plausibility of the model calibration.
Other recent studies have used similar 2D coupled flow and heat transport simulations based on the finite difference, variably saturated flow and heat transport code VS2DH (Healy, 1996) to quantify river-aquifer exchange fluxes (Eddy-Miller, 2009 Schornberg et al., 2010). Compared to VS2DH the finite element code used in this study provided some more flexibility in local mesh refinement, which proved to be useful in accommodating the observed streambed scour in the model.
The slight underestimation of daily temperature maxima at 10 and 30 cm depth especially during the calibration period (Fig. 3.4, row A, Fig. 3.5, left column) is attributed to effects of radiative heating of the streambed during the day, as also observed by (Vogt et al., 2010). Although HydroGeoSphere provides routines to simulate the full heat balance at the land surface (Brookfield et al., 2009) the required data to parameterize these routines was not available for the entire simulation period. We presume that raising temperatures at the streambed boundary during the day, to mimic the effects of solar radiation, would decrease the observed deviations during that day, but at the same time not significantly alter the overall calibration of the model. Therefore the simulated exchange fluxes and their dynamics are believed to adequately reflect river-aquifer interactions at the site.
In the period immediately after the scouring event, observed temperatures at 10 and 30 cm depths show a stronger cooling than realized in the simulations. Temperatures are nearly constant, close to the ambient groundwater temperature. We suspect that this was caused by preferential upwelling of groundwater along the outside of the piezometer, which affected the temperature readings inside the pipe. The piezometer pipe had been slightly tilted during the flow event that caused the scour and was subsequently returned into its original straight position. This likely created space between the pipe and the sediment for preferential flow along the outside of the piezometer, which was not filled with new sediment as long as the strong upward gradients prevailed. In fact, during stream flow measurements, which were
Chapter 3 – River-aquifer exchange fluxes
80
conducted in this time period, slightly cooler streambed temperatures were repeatedly noticed in the vicinity of the piezometer, supporting this interpretation. Additional simulations to match the observed, steady cool temperatures at 10 and 30 cm in this period (by stronger upwelling of groundwater) not only yielded unrealistically high hydraulic conductivities, but also drastically worsened model fits in the other simulation periods and with that the overall calibration.
3.4.2. Variability of exchange fluxes
The growing body of research on groundwater-surface water interactions in recent years (for a review see Fleckenstein et al., 2010) has clearly demonstrated that exchange fluxes tend to be highly variable in space (e.g. Conant 2004, Schmidt et al., 2006 & 2007) and time (e.g. Anibas et al., 2009, Schmidt et al., 2012). An improved quantification of this variability is an important prerequisite for a better understanding of the biogeochemical processing of nutrients (e.g. Zarnetske et al., 2012, Krause et al., 2013) or pollutants (e.g. Greenberg et al., 2002, Schmidt et al., 2011) in the transition zone between ground- and surface water.
While the majority of studies that have addressed effects of groundwater surface water interactions on biogeochemical processing have focused on spatial variations, e.g. caused by geologic heterogeneities, pronounced temporal variability is a prominent feature in many river-aquifer systems due to the high dynamics of surface water flows (e.g. Schmidt et al., 2012). Our results demonstrate that monsoonal climate, with its pronounced seasonality in precipitation and the high frequency of intensive precipitation events during the monsoon season creates quite distinct temporal exchange patterns with frequent exchange flow reversals.
Although, it has repeatedly been argued that the dynamics of exchange between rivers and groundwater may strongly influence the quality of water resources (e.g. Stonestrom and Constantz, 2003, Fleckenstein et al., 2010), research on the potential effects of frequent riverbed flow reversals on biogeochemical processing at the groundwater-surface water interface and the resulting water quality is lacking. Barlow et al. (2009), investigated riverbed fluxes for high-flow events that occurred on the Bogue Phalia River in Florida caused by the Hurricanes Katrina and Rita. For both high-flow events, a riverbed flux reversal was found, from initially groundwater upwelling into the river to short periods of river water infiltration into the aquifer. They demonstrated that riverbed water fluxes and a critical stage for flow reversals can be determined by using heat as a tracer even with little available hydraulic head data. Whereas they identified one critical river stage, at which flow reversals occurred, our data demonstrates that this threshold can shift in response to a dynamic groundwater flow field. During two days (Fig. 3.8, 9th and 10th of September) flow reversal occurred at four different stages as the shallow groundwater system dynamically responded to the sequence of precipitation events. This not only exemplifies the highly variable hydrologic conditions within the monsoon season, but also underlines the importance of collecting hydraulic head data with sufficient temporal resolution for adequately characterizing river-aquifer exchange fluxes under monsoonal conditions.
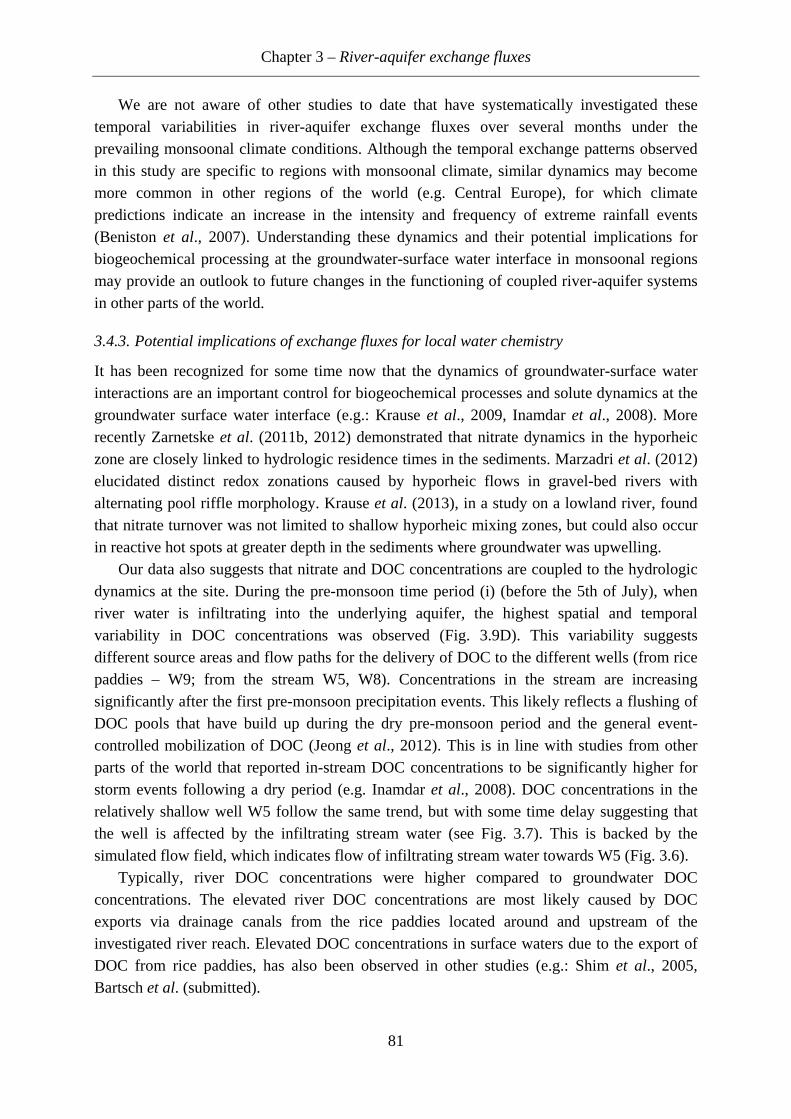
Chapter 3 – River-aquifer exchange fluxes
81
We are not aware of other studies to date that have systematically investigated these temporal variabilities in river-aquifer exchange fluxes over several months under the prevailing monsoonal climate conditions. Although the temporal exchange patterns observed in this study are specific to regions with monsoonal climate, similar dynamics may become more common in other regions of the world (e.g. Central Europe), for which climate predictions indicate an increase in the intensity and frequency of extreme rainfall events (Beniston et al., 2007). Understanding these dynamics and their potential implications for biogeochemical processing at the groundwater-surface water interface in monsoonal regions may provide an outlook to future changes in the functioning of coupled river-aquifer systems in other parts of the world.
3.4.3. Potential implications of exchange fluxes for local water chemistry
It has been recognized for some time now that the dynamics of groundwater-surface water interactions are an important control for biogeochemical processes and solute dynamics at the groundwater surface water interface (e.g.: Krause et al., 2009, Inamdar et al., 2008). More recently Zarnetske et al. (2011b, 2012) demonstrated that nitrate dynamics in the hyporheic zone are closely linked to hydrologic residence times in the sediments. Marzadri et al. (2012) elucidated distinct redox zonations caused by hyporheic flows in gravel-bed rivers with alternating pool riffle morphology. Krause et al. (2013), in a study on a lowland river, found that nitrate turnover was not limited to shallow hyporheic mixing zones, but could also occur in reactive hot spots at greater depth in the sediments where groundwater was upwelling.
Our data also suggests that nitrate and DOC concentrations are coupled to the hydrologic dynamics at the site. During the pre-monsoon time period (i) (before the 5th of July), when river water is infiltrating into the underlying aquifer, the highest spatial and temporal variability in DOC concentrations was observed (Fig. 3.9D). This variability suggests different source areas and flow paths for the delivery of DOC to the different wells (from rice paddies – W9; from the stream W5, W8). Concentrations in the stream are increasing significantly after the first pre-monsoon precipitation events. This likely reflects a flushing of DOC pools that have build up during the dry pre-monsoon period and the general event-controlled mobilization of DOC (Jeong et al., 2012). This is in line with studies from other parts of the world that reported in-stream DOC concentrations to be significantly higher for storm events following a dry period (e.g. Inamdar et al., 2008). DOC concentrations in the relatively shallow well W5 follow the same trend, but with some time delay suggesting that the well is affected by the infiltrating stream water (see Fig. 3.7). This is backed by the simulated flow field, which indicates flow of infiltrating stream water towards W5 (Fig. 3.6).
Typically, river DOC concentrations were higher compared to groundwater DOC concentrations. The elevated river DOC concentrations are most likely caused by DOC exports via drainage canals from the rice paddies located around and upstream of the investigated river reach. Elevated DOC concentrations in surface waters due to the export of DOC from rice paddies, has also been observed in other studies (e.g.: Shim et al., 2005, Bartsch et al. (submitted).
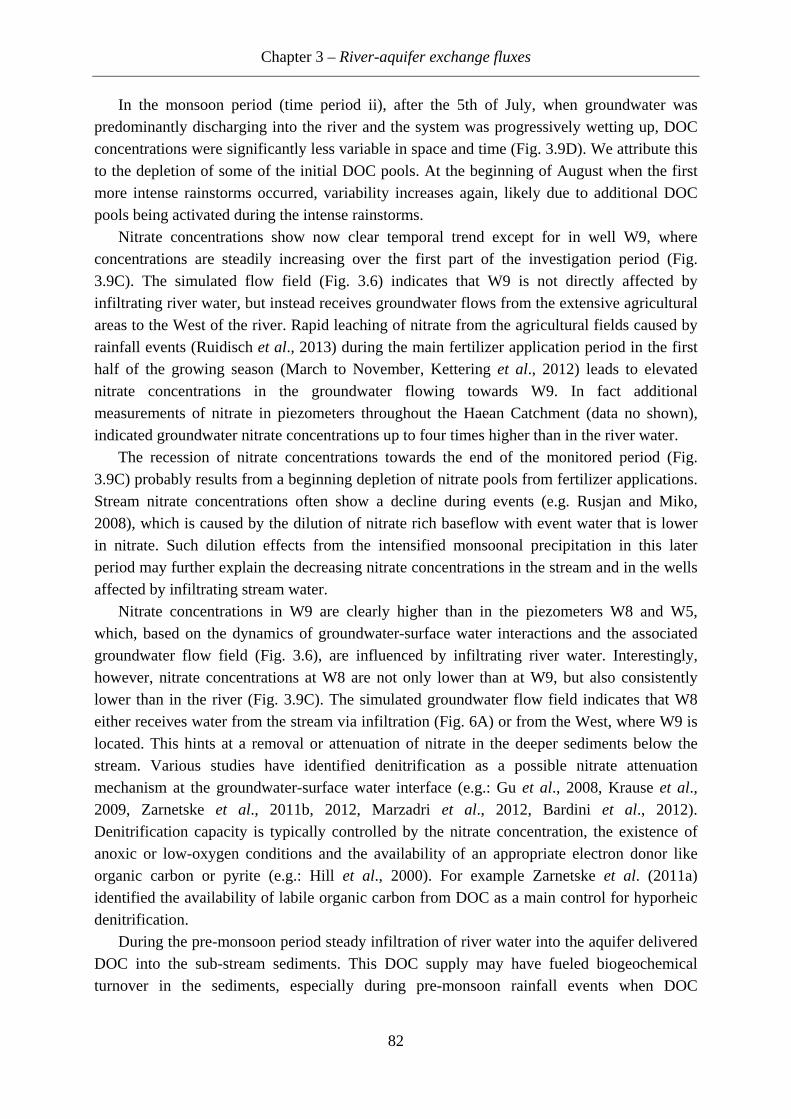
Chapter 3 – River-aquifer exchange fluxes
82
In the monsoon period (time period ii), after the 5th of July, when groundwater was predominantly discharging into the river and the system was progressively wetting up, DOC concentrations were significantly less variable in space and time (Fig. 3.9D). We attribute this to the depletion of some of the initial DOC pools. At the beginning of August when the first more intense rainstorms occurred, variability increases again, likely due to additional DOC pools being activated during the intense rainstorms.
Nitrate concentrations show now clear temporal trend except for in well W9, where concentrations are steadily increasing over the first part of the investigation period (Fig. 3.9C). The simulated flow field (Fig. 3.6) indicates that W9 is not directly affected by infiltrating river water, but instead receives groundwater flows from the extensive agricultural areas to the West of the river. Rapid leaching of nitrate from the agricultural fields caused by rainfall events (Ruidisch et al., 2013) during the main fertilizer application period in the first half of the growing season (March to November, Kettering et al., 2012) leads to elevated nitrate concentrations in the groundwater flowing towards W9. In fact additional measurements of nitrate in piezometers throughout the Haean Catchment (data no shown), indicated groundwater nitrate concentrations up to four times higher than in the river water.
The recession of nitrate concentrations towards the end of the monitored period (Fig. 3.9C) probably results from a beginning depletion of nitrate pools from fertilizer applications. Stream nitrate concentrations often show a decline during events (e.g. Rusjan and Miko, 2008), which is caused by the dilution of nitrate rich baseflow with event water that is lower in nitrate. Such dilution effects from the intensified monsoonal precipitation in this later period may further explain the decreasing nitrate concentrations in the stream and in the wells affected by infiltrating stream water.
Nitrate concentrations in W9 are clearly higher than in the piezometers W8 and W5, which, based on the dynamics of groundwater-surface water interactions and the associated groundwater flow field (Fig. 3.6), are influenced by infiltrating river water. Interestingly, however, nitrate concentrations at W8 are not only lower than at W9, but also consistently lower than in the river (Fig. 3.9C). The simulated groundwater flow field indicates that W8 either receives water from the stream via infiltration (Fig. 6A) or from the West, where W9 is located. This hints at a removal or attenuation of nitrate in the deeper sediments below the stream. Various studies have identified denitrification as a possible nitrate attenuation mechanism at the groundwater-surface water interface (e.g.: Gu et al., 2008, Krause et al., 2009, Zarnetske et al., 2011b, 2012, Marzadri et al., 2012, Bardini et al., 2012). Denitrification capacity is typically controlled by the nitrate concentration, the existence of anoxic or low-oxygen conditions and the availability of an appropriate electron donor like organic carbon or pyrite (e.g.: Hill et al., 2000). For example Zarnetske et al. (2011a) identified the availability of labile organic carbon from DOC as a main control for hyporheic denitrification.
During the pre-monsoon period steady infiltration of river water into the aquifer delivered DOC into the sub-stream sediments. This DOC supply may have fueled biogeochemical turnover in the sediments, especially during pre-monsoon rainfall events when DOC
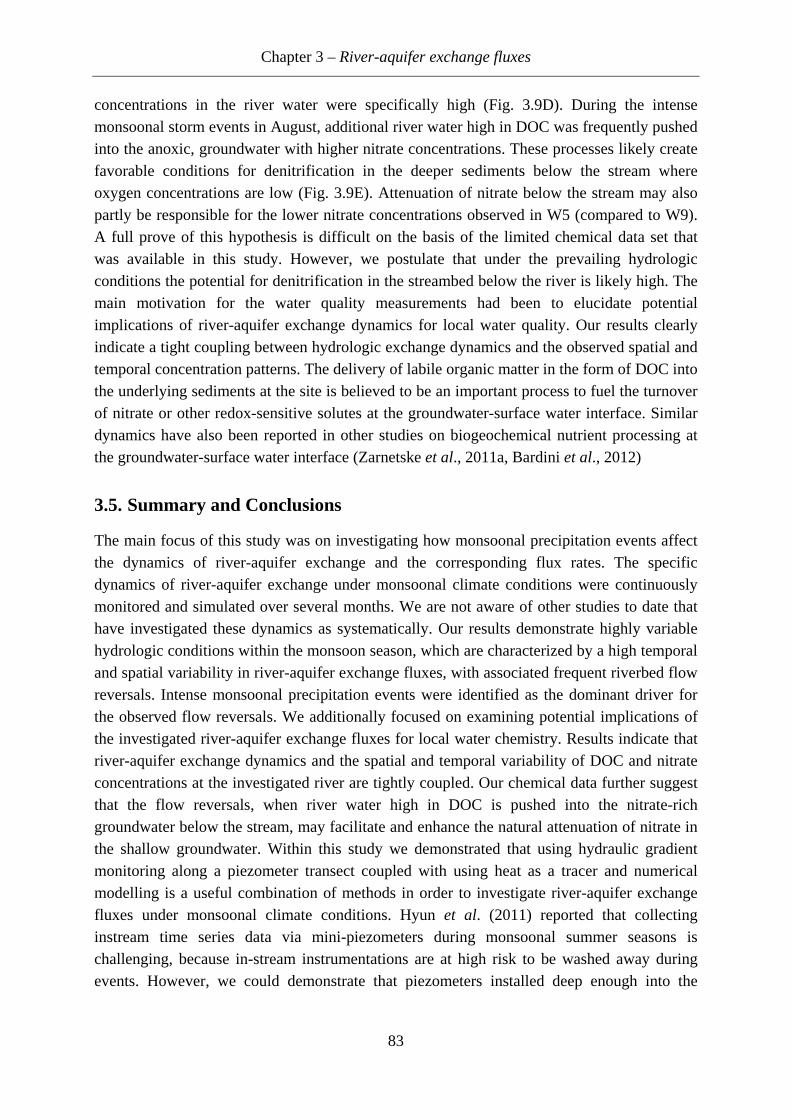
Chapter 3 – River-aquifer exchange fluxes
83
concentrations in the river water were specifically high (Fig. 3.9D). During the intense monsoonal storm events in August, additional river water high in DOC was frequently pushed into the anoxic, groundwater with higher nitrate concentrations. These processes likely create favorable conditions for denitrification in the deeper sediments below the stream where oxygen concentrations are low (Fig. 3.9E). Attenuation of nitrate below the stream may also partly be responsible for the lower nitrate concentrations observed in W5 (compared to W9). A full prove of this hypothesis is difficult on the basis of the limited chemical data set that was available in this study. However, we postulate that under the prevailing hydrologic conditions the potential for denitrification in the streambed below the river is likely high. The main motivation for the water quality measurements had been to elucidate potential implications of river-aquifer exchange dynamics for local water quality. Our results clearly indicate a tight coupling between hydrologic exchange dynamics and the observed spatial and temporal concentration patterns. The delivery of labile organic matter in the form of DOC into the underlying sediments at the site is believed to be an important process to fuel the turnover of nitrate or other redox-sensitive solutes at the groundwater-surface water interface. Similar dynamics have also been reported in other studies on biogeochemical nutrient processing at the groundwater-surface water interface (Zarnetske et al., 2011a, Bardini et al., 2012)
3.5. Summary and Conclusions
The main focus of this study was on investigating how monsoonal precipitation events affect the dynamics of river-aquifer exchange and the corresponding flux rates. The specific dynamics of river-aquifer exchange under monsoonal climate conditions were continuously monitored and simulated over several months. We are not aware of other studies to date that have investigated these dynamics as systematically. Our results demonstrate highly variable hydrologic conditions within the monsoon season, which are characterized by a high temporal and spatial variability in river-aquifer exchange fluxes, with associated frequent riverbed flow reversals. Intense monsoonal precipitation events were identified as the dominant driver for the observed flow reversals. We additionally focused on examining potential implications of the investigated river-aquifer exchange fluxes for local water chemistry. Results indicate that river-aquifer exchange dynamics and the spatial and temporal variability of DOC and nitrate concentrations at the investigated river are tightly coupled. Our chemical data further suggest that the flow reversals, when river water high in DOC is pushed into the nitrate-rich groundwater below the stream, may facilitate and enhance the natural attenuation of nitrate in the shallow groundwater. Within this study we demonstrated that using hydraulic gradient monitoring along a piezometer transect coupled with using heat as a tracer and numerical modelling is a useful combination of methods in order to investigate river-aquifer exchange fluxes under monsoonal climate conditions. Hyun et al. (2011) reported that collecting instream time series data via mini-piezometers during monsoonal summer seasons is challenging, because in-stream instrumentations are at high risk to be washed away during events. However, we could demonstrate that piezometers installed deep enough into the
Chapter 3 – River-aquifer exchange fluxes
84
riverbed (≥ 3 m depths) can be successfully used even when river discharges increase during storm events to values more than hundred times higher than the discharges observed under dry conditions. Preferential flows along the outside of the piezometer due to the development of a small gap between the piezometer casing and the adjacent sediment during extreme rainfall events can be seen as a limitation. Our study additionally underlines that changes in riverbed topography have to be considered in future studies as well as the importance of collecting hydraulic head and temperature data at sufficient temporal resolution to adequately capture river-aquifer exchange dynamics in regions under a monsoonal climate.
Acknowledgements This study was carried out within the framework of the International Research Training Group TERRECO (GRK 1565/1), funded by the Deutsche Forschungsgemeinschaft (DFG) at the University of Bayreuth (Germany) and the Korean Research Foundation (KRF) at Kangwon National University, Chuncheon (South Korea). The authors want to thank Sebastian Arnhold, Axel Müller, Bumsuk Seo, Eunyoung Jung, Bora Lee and Heera Lee for their support and translations during field campaigns. We are also grateful to Jaesung Eum and Kiyong Kim for organizing and completing the chemical analyzes of the water samples.
Chapter 3 – River-aquifer exchange fluxes
85
3.6. References
Anderson, M.P., 2005. Heat as a Ground Water Tracer. Ground Water 43 (6), 951–968. Angermann, L., Lewandowski, J., Fleckenstein, J.H., Nützmann, G., 2012. A 3D analysis algorithm to
improve interpretation of heat pulse sensor results for the determination of small-scale flow directions and velocities in the hyporheic zone. Journal of Hydrology 475, 1-11.
Anibas, C., Fleckenstein, J.H., Volze, N., Buis, K., Verhoeven, R., Meire, P., Batelaan, O., 2009. Transient or steady-state? Using vertical temperature profiles to quantify groundwater-surface water exchange. Hydrological Processes 23 (15), 2165–2177.
Barlow, J.R.B., Coupe, R.H.., 2009. Use of heat to estimate streambed fluxes during extreme hydrologic events. Water Resource Research 45 (1).
Bartsch, S., Shope, C.L., Arnhold, S., Jeong, J.J., Park, J.H., Eum, J., Kim, B., Peiffer, S., and Fleckenstein, J.H. (submitted). Monsoonal-type climate or land-use management: Understanding their role in the mobilization of nitrate and DOC in a mountainous catchment. Journal of Hydrology.
Beniston, M., Stephenson, D.B., Christensen, O.B., Ferro, C.A.T., Frei, C., Goyette, S., Halsnaes, K., Holt, T., Jylhä, K., Koffi, B., Palutikof, J., Schöll, R., Semmler T., Woth, K., 2007. Future extreme events in European climate: an exploration of regional climate model projections. Climatic Change 81, 71–95.
Brookfield, A.E., Sudicky, E.A., Park, Y.-J., Conant, J.B., 2009. Thermal transport modelling in a fully integrated surface/subsurface framework. Hydrological Processes 23 (15): 2150–2164.
Brunke, M., Gonser T., 1997. The ecological significance of exchange processes between rivers and groundwater. Freshwater Biol. 37 (1), 1–33.
Clark, J.M., Lane, S.N., Chapman, P.J., Adamson, J.K., 2007. Export of dissolved organic carbon from an upland peatland during storm events: Implications for flux estimates. Journal of Hydrology 347 (3-4), 438–447.
Conant, B., 2004. Delineating and Quantifying Ground Water Discharge Zones Using Streambed Temperatures. Ground Water 42 (2), 243‐257.
Constantz, J., 2008. Heat as a tracer to determine streambed water exchanges. Water Resource Research 44, W00D10.
Doherty, J., 2005. PEST: Model- independent Parameter Estimation. User manual: 5th Edition. Watermark Numerical Computing. Brisbane, Australia.
Eddy-Miller, C.A., Wheeler, J.D., Essaid, H.I., 2009. Characterization of interactions between surface water and near-stream groundwater along Fish Creek, Teton County, Wyoming, by using heat as a tracer: U.S. Geological Survey Scientific Investigations Report 2009–5160, 53p.
Essaid, H.I., Zamora, C.M., McCarthy, K.A., Vogel, J.R., Wilson, J.T., 2008. Using Heat to Characterize Streambed Water Flux Variability in Four Stream Reaches. Journal of Environment Quality 37 (3), 1010-1023.
Fleckenstein, J.H., Krause, S., Hannah, D.M., Boano, F., 2010. Groundwater-surface water interactions: New methods and models to improve understanding of processes and dynamics, Advances in Water Resources, 33 (11), 1291-1295.
Graf, T., 2005. Modeling coupled thermohaline flow and reactive solute transport in discretely-fractured porous media. PhD thesis, Université Laval, Québec, Canada, 209 pp.
Grasby S.E., Betcher R.N., 2002. Regional hydrogeochemistry of the carbonate rock aquifer, southern Manitoba. Canadian Journal of Earth Sciences 39 (7), 1053–1063.
Greenberg, M.S., Burton, G.A., Rowland, C.D., 2002. Optimizing interpretation of in situ effects of riverine pollutants: Impact of upwelling and downwelling. Environmental Toxicology and Chemistry 21 (2), 289‐297.
Gu, C., Hornberger, G.M., Herman, J.S., Mills, A.L., 2008. Effect of freshets on the flux of groundwater nitrate through streambed sediments. Water Resource Research 44 (5), W05415.
Chapter 3 – River-aquifer exchange fluxes
86
Hatch, C. E., Fisher, A.T., Revenaugh, J. S., Constantz, J., Ruehl, C., 2006. Quantifying surface water&groundwater interactions using time series analysis of streambed thermal records: Method development. Water Resource Research 42 (10), W10410.
Healy, R.W., Ronan, A.D., 1996. Documentation of Computer Program VS2DH for Simulation of Energy Transport in Variably Saturated Porous Media - Modefication of the U.S. Geological Surveys's Computer Program VS2DT. Water-Resources Investigations Report 96-4230. U.S. Geological Survey. Denver. 36
Hill, A.R., Devito, K.J., Campagnolo, S., Sanmugadas, K., 2000. Subsurface denitrification in a forest riparian zone: Interactions between hydrology and supplies of nitrate and organic carbon. Biogeochemistry 51, 193-223.
Hyun, Y., Kim, H., Lee, S.-S., Lee, K.-K., 2011. Characterizing streambed water fluxes using temperature and head data on multiple spatial scales in Munsan stream, South Korea. Journal of Hydrology 402 (3-4), 377-387.
Inamdar, S., Rupp, J., Mitchell, M., 2008. Differences in Dissolved Organic Carbon and Nitrogen Responses to Storm-Event and Ground-Water Conditions in a Forested, Glaciated Watershed in Western New York1. JAWRA Journal of the American Water Resources Association 44 (6), 1458-1473.
Jo, K.-W., Park, J.-H., 2010. Rapid release and changing sources of Pb in a mountainous watershed during extreme rainfall events. Environmental Science Technology 44 (24), 9324-9329.
Kalbus, E., Reinstorf, F. and Schirmer, M., 2006. Measuring methods for groundwater - surface water interactions: a review. Hydrology and Earth System Sciences 10, 873-887.
Kalbus E., Schmidt C., Bayer-Raich M., Leschik S., Reinstorf F., Balcke G.U., Schirmer M., 2007. New methodology to investigate potential contaminant mass fluxes at the stream–aquifer interface by combining integral pumping tests and streambed temperatures. Environmental Pollution 148 (3), 808–816.
Kaeser, D., Binley, A., Heathwaite, L., Krause, S., 2009. Spatio-temporal variations of hyporheic flow in a riffle-step-pool sequence, Hydrological Processes 23, 2138-2149.
Keery, J., Binley, A., Crook, N., Smith, J.W.N., 2007. Temporal and spatial variability of groundwater–surface water fluxes: Development and application of an analytical method using temperature time series. Journal of Hydrology 336 (1–2), 1–16.
Kettering, J., Park, J.-H., Lindner, S., Lee, B., Tenhunen, J., Kuzyakov, Y., 2012. N fluxes in an agricultural catchment under monsoon climate: A budget approach at different scales. Agriculture, Ecosystems & Environment 161, 101–111.
Kim, B., Choi, K., Kim, C., Lee, U., Kim, Y., 2000. Effects of the summer monsoon on the distribution and loading of organic carbon in a deep reservoir, Lake Soyang, Korea. Water Research 34 (14), 3495-3504.
Kim, B., Jung, S., Kim, Y., Kim, J., Sa, S., 2006. The effect of nutrients discharged from agricultural watershed upon the eutrophication of reservoirs in Korea. Proceeding of the International Symposium on Water Conservation and Management in Coastal Area (Nov. 2006), 11-16.
Krause, S., Heathwaite, L., Binley, A., Keenan, P., 2009. Nitrate concentration changes at the groundwater-surface water interface of a small Cumbrian river. Hydrological Processes 23 (15), 2195-2211.
Krause, S., Tecklenburg, C., Munz, M., Naden, E., 2013, Streambed nitrogen cycling beyond the hyporheic zone: Flow controls on horizontal patterns and depth distribution of nitrate and dissolved oxygen in the upwelling groundwater of a lowland river. Journal of Geophysical Research 118 (1), 54-67.
Kwon, Y.S., Lee, H.Y., Han, J., Kim, W.H., Kim, D.J., Kim, D.I., Youm, S.J., 1990. Analysis of Haean Basin in terms of earth science. Journal of Korean Earth Science Society 11, 236–241 (in Korean with an English abstract).
Landon, M.K., Rus, D.L., Harvey, F.E., 2001. Comparison of Instream Methods for Measuring Hydraulic Conductivity in Sandy Streambeds. Ground Water 39 (6), 870-885.
Lewandowski, J., Angermann, L., Nuetzmann. G., Fleckenstein, J.H., 2011. A heat pulse technique for the determination of small-scale flow directions and flow velocities in the streambed of sand-bed streams. Hydrological Processes 25, 3244–3255.
Chapter 3 – River-aquifer exchange fluxes
87
Madsen, E.L., Sinclair, J.L., Ghiorse, W.C., 1991. In situ biodegradation: microbiological patterns in a contaminated aquifer. Science 252 (5007), 830–833.
Marzadri, A., Tonina, D., Bellin, A., 2012. Morphodynamic controls on redox conditions and on nitrogen dynamics within the hyporheic zone: Application to gravel bed rivers with alternate-bar morphology. Journal of Geophysical Research 117, G00N10.
McLaren, R., 2008. GRID BUILDER: A pre-processor for 2-D, triangular element, finite-element programs. University of Waterloo, Groundwater Simulations Group, Waterloo, Ontario
Palmer, C.D., Blowes, D.W., Frind, E.O., Molson, J.W., 1992. Thermal energy storage in an unconfined aquifer: 1. Field Injection Experiment. Water Resource Research 28 (10), 2845–2856.
Rosenberry, D.O., 2008. A seepage meter designed for use in flowing water. Journal of Hydrology 359 (1–2), 118–130.
Ruidisch, M., Bartsch, S., Kettering, J., Huwe, B., Frei, S., 2013. The effect of fertilizer best management practices on nitrate leaching in a plastic mulched ridge cultivation system. Agriculture, Ecosystems & Environment 169, 21-32.
Rusjan, S., Miko, M., 2008. Assessment of hydrological and seasonal controls over the nitrate flushing from a forested watershed using a data mining technique. Hydrology and Earth System Sciences Discussions 12 (2), 645–656.
Scanlon, B., Healy, R., Cook, P., 2002. Choosing appropriate techniques for quantifying groundwater recharge. Hydrogeology Journal 10 (1), 18–39.
Schaap, M.G., Leij, F.J., van Genuchten, M.Th., 2001. ROSETTA: a computer program for estimating soil hydraulic parameters with hierarchical pedotransfer functions. Journal of Hydrology 251 (3–4), 163–176.
Schmidt, C., Bayer-Raich, M., Schirmer, M., 2006. Characterization of spatial heterogeneity of groundwater-stream water interactions using multiple depth streambed temperature measurements at the reach scale. Hydrology and Earth System Sciences 10, 849–859.
Schmidt, C., Conant, B., Bayer-Raich, M., Schirmer, M., 2007. Evaluation and field-scale application of an analytical method to quantify groundwater discharge using mapped streambed temperatures. Journal of Hydrology 347 (3-4), 292–307.
Schmidt, C., Martienssen M., Kalbus, E. 2011. Influence of water flux and redox conditions on chlorobenzene concentrations in a contaminated streambed. Hydrological Processes 25 (2), 234–245.
Schmidt, C., Musolff, A., Trauth, N., Vieweg, M., Fleckenstein, J. H., 2012. Transient analysis of fluctuations of electrical conductivity as tracer in the stream bed, Hydrology and Earth System Sciences 16, 3689–3697.
Schornberg, C., Schmidt, C., Kalbus, E., Fleckenstein, J.H., 2010. Simulating the effects of geologic heterogeneity and transient boundary conditions on streambed temperatures - implications for temperature-based water flux calculations, Advances in Water Resources 33 (11), 1309-1319.
Shanafield, M., Pohll, G., Susfalk, R., 2010. Use of heat-based vertical fluxes to approximate total flux in simple channels. Water Resource Research 46 (3), W03508.
Shope, C.L., Bartsch, S., Kim, K., Kim, B., Tenhunen, J., Peiffer, S., Park, J.H., Ok, Y.S., Fleckenstein, J.H., Köllner, T., 2013. A weighted, multi-method approach for accurate basin-wide streamflow estimation in an ungauged watershed. Journal of Hydrology 494, 72-82.
Stonestrom, D. A., Constantz, J., 2003. Heat as a Tool for Studying the Movement of Ground Water Near Streams. U.S. Geological Survey Circular 1260, 1–96.
Therrien, R., McLaren, R.G., Sudicky, E.A., Panday, S.M., 2008. HydroGeoSphere: A three dimensional numerical model describing fully-integrated subsurface and surface flow and solute transport (manual). University of Waterloo, Groundwater Simulations Group, Waterloo, Ontario
Vogt, T., Schneider, P., Hahn-Woernle, L., Cirpka, O.A., 2010. Estimation of seepage rates in a losing stream by means of fiber-optic high-resolution vertical temperature profiling. Journal of Hydrology 380 (1-2), 154–164.
Weast, R.C., Astle, M.J., 1981. CRC Handbook of Chemistry and Physics, sixty second edition, vol. 2. CRC Press, Boca Raton, p. 2332.
Zarnetske, J. P., Haggerty, R., Wondzell, S. M., Baker, M. A., 2011a. Labile Dissolved Organic Carbon Supply Controls Hyporheic Denitrification, Journal of Geophysical Research 116, G04036.

Chapter 3 – River-aquifer exchange fluxes
88
Zarnetske, J. P., Haggerty, R., Wondzell, S. M., Baker, M. A., 2011b. Dynamics of nitrate production and removal as a function of residence time in the hyporheic zone, Journal of Geophysical Research 116, G01025
Zarnetske, J. P., Haggerty, R., Wondzell, S. M., Bokil, V. A., Gonzalez-Pinzon, R., 2012. Coupled transport and reaction kinetics control the nitrate source-sink function of hyporheic zones, Water Resource Research 48, W11508.
Chapter 4 - Nitrate leaching
89
Chapter 4
4. The effect of fertilizer best management practices on nitrate leaching in a plastic mulched ridge cultivation system
Published in: Agriculture, Ecosystems & Environment
Marianne Ruidisch1, Svenja Bartsch2, Janine Kettering3, Bernd Huwe1, Sven Frei2 1 University of Bayreuth, Soil Physics Group, Bayreuth, Germany 2 University of Bayreuth, Department of Hydrology, Bayreuth, Germany 3 University of Bayreuth, Department of AgroEcoSystem Research, Bayreuth, Germany
Abstract : Groundwater pollution by fertilizer nitrate is a major problem recognized in
many parts of the world. The excessive use of mineral fertilizers to assure high yields in agricultural production intensifies the leaching problem especially in regions affected by a monsoon climate as in South Korea. The extent that leaching occurs depends on several factors such as climatic conditions, agricultural management practices, soil properties and the sorption characteristics of fertilizers and agrochemicals. In the South Korean monsoon season 2010, nitrate concentrations under varying nitrogen fertilizer rates were monitored in a plastic mulched ridge cultivation (RTpm) with radish crops (Raphanus sativus L.). Based on these findings we calibrated a three-dimensional water flow and solute transport model using the numerical code HydroGeoSphere in combination with the parameter estimation software ParallelPEST. Subsequently, we used the calibrated model to investigate the effect of plastic mulch as well as different fertilizer best management practices (FBMPs) on nitrate leaching. We found that cumulative nitrate leaching under RTpm was 26% lower compared to ridge tillage without coverage (RT). Fertilizer placement confined to the ridges resulted in 36% lower cumulative nitrate-leaching rates compared to broadcast applied fertilizer. Splitting the total amount of 150 kg NO3 ha-1 per growing season into three fertilizer applications (1-4-2.5 ratio) led to a reduction of nitrate leaching of 59% compared to the one-top dressing at the beginning of the growing season. However, the combination of a fertilizer rate of 150 kg NO3 ha-1, plastic mulched ridges, fertilizer placement only in the ridges and split applications of fertilizer resulted in the lowest cumulative nitrate leaching rate (8.14 kg ha-1) during the simulation period, which is equivalent to 5.4 % of the total nitrate fertilizer input. Compared to RT with conventional one-top dressing fertilization in ridges and furrows, the nitrate
leaching was reduced by 82%. Consequently, the combination of all FBMPs is highly recommendable to decrease economical costs for fertilizer inputs as well as to minimize nitrate leaching and its impact on groundwater quality.
Keywords: Nitrate leaching; numerical modeling; fertilizer best management practices; ridge tillage; plastic mulch; groundwater

Chapter 4 - Nitrate leaching
90
4.1. Introduction
Agricultural productivity is under considerable strain to meet the food demand of a growing population. This pressure causes high external inputs such as fertilizer and pesticides into the agricultural systems. Thus, the ongoing degradation of water resources by agricultural practices constitutes a challenging problem worldwide (Ongley, 1996; Matson et al., 1997; Tilman et al., 2002; Danielopol et al., 2003; Spiertz, 2009). The risk of fertilizer and pesticides leaching via surface runoff into rivers and lakes or percolation through the unsaturated zone into groundwater is especially high in regions affected by East Asian summer monsoon due to the high frequency and intensity of rainfalls. In China and South Korea, intensively used agricultural areas were identified as hotspots of non-point pollution, which cause water deterioration and eutrophication of important freshwater resources such as lakes and reservoirs (Zhang et al., 1996; Kim et al., 2001; Park et al., 2010).
Apart from manifold agrochemicals, nitrate fertilizer is one of the most critical pollutants due to its excessive input and the low N use efficiency of crops (Spiertz, 2009). A concentration maximum of 50 mg NO3 l
-1 in drinking water was recommended by the World Health Organization, while in the USA and South Korea the official regulations are even less with 10 mg NO3 l
-1 (Choi et al., 2007). Nevertheless, observation of water quality in surface water and groundwater reveal that the nitrate concentrations often exceed established drinking water standards, especially in areas of intense agriculture (Min et al., 2002; Liu et al., 2005; Koh et al., 2007; Koh et al., 2009). To minimize the leaching risk of agrochemicals, precision agriculture was found to be a valuable tool. Wallace (1994) proposed economic and environmental benefits by an adjusted fertilizer placement, an adapted timing of fertilizer application to the plant’s needs and an adapted leveling, draining and contouring of agricultural fields. Furthermore, the effect of ridge tillage has the potential to decrease nitrate leaching by isolating nitrate from the percolating water, especially if fertilizer is placed only in the upper part of the ridges (Hamlett et al., 1990; Clay et al., 1992; Benjamin et al., 1998; Bargar et al., 1999; Jaynes and Swan, 1999; Waddell and Weil, 2006).
Plastic mulching of the ridges is practiced for many crop types worldwide for several reasons. Lament (1993) found an increased temperature in the ridge soil, which in turn induces earlier plant emergence. Furthermore plastic mulching was shown to be useful in terms of weed suppression and reducing evaporation loss. In general an earlier and higher overall yield was found for several crop types. Cannington et al. (1975) and Locascio et al. (1985) observed that plastic mulch protects the fertilizer from infiltrating water and consequently enhances the nutrient retention in the ridge soil and the nutrient use efficiency of crops. Accordingly, uncovered furrow positions are more prone to agrichemical leaching compared to ridge positions due to higher infiltration rates caused by the surface runoff from the ridges to the furrows (Clay et al., 1992; Leistra and Boesten, 2010).
Intensive agriculture in the highlands of Gangwon Province, South Korea involves high mineral N fertilizer inputs. Vegetable production in plastic mulched ridge cultivation is practiced widespread over the region on dominating sandy soils with poor sorption
Chapter 4 - Nitrate leaching
91
characteristics (Kettering et al., 2012). However, the influence of plastic mulched ridge cultivation in regions affected by monsoon climate on water flow and nitrate leaching has not been investigated yet. Based on the findings of a 15N field experiment and the monitoring of nitrate concentrations in soil water during the growing/monsoon season 2010 in a plastic mulched radish cultivation (Raphanus sativus L.) in the Haean catchment in South Korea (Kettering et al., 2013), we set up a three-dimensional numerical model using HydroGeoSphere (Therrien et al., 2010), which simulates fully-integrated surface-subsurface flow and solute transport processes. The model was coupled with Parallel PEST (Doherty, 2005) to calibrate soil hydraulic and solute transport parameters based on the Gauss-Marquardt-Levenberg nonlinear estimation technique. Our objective was to quantify and evaluate the potential of fertilizer best management practices to decrease nitrate leaching losses to groundwater under monsoonal conditions. Thus, the calibrated model was used to run scenarios in terms of precision agriculture such as an enhanced fertilizer placement and fertilizer split applications as well as the combination of both. We hypothesized, that (i) plastic mulching reduces nitrate leaching losses compared to uncovered ridge cultivation, (ii) fertilizer placement only in ridges decreases nitrate leaching losses compared to the conventional fertilization in ridges and furrows, (iii) nitrate leaching losses could be reduced by the right timing and the splitting of fertilizer application.
4.2. Material and Methods
4.2.1. Study site
The Haean catchment (128°1’33.101”E, 38°28’6.231”N, approximately 420-1000 masl) is located in the mountainous northeastern part of South Korea. The basin, which is situated at the upper reach of the Mandae stream, has been identified as a main non-point source pollution area. The Mandae Stream contributes to the Soyang Lake (Park et al., 2010), which in turn constitutes the main fresh water reservoir for the metropolitan area of Seoul.
The annual precipitation amount of 1577 mm (11-years average) is characteristic for the catchment. During the East Asian summer monsoon, which occurs usually between June and August, the catchment receives 50-60% of the annual precipitation sum. Furthermore, the catchment is characterized by three major land-use types, namely forested land, agriculture and residential area. The steep hillslopes are covered by forest accounting for 58% of the total area. Dry land agriculture is practiced mainly on moderate hillslopes with 22% of the total area. Rice paddies in the center of the catchment occupy 8%. The remaining area of 12% constitutes of residential area, grassland and field margins.
Depending on the crop type, the growing period starts usually between April and June. In order to suppress weed growth and to ensure an early plant emergence, ridge tillage with plastic mulching is a widespread practice for cultivating dryland crops such as radish (Raphanus sativus L.), potatoes (Solanum tuberosum L.), cabbage (Brassica rapa susp.
Pekinensis (lour.), Hanelt, Brassica aleracea convar. Capitata var. alba) and beans (Glycine
max. (L.) Merr.). Before ridges are created, fertilizer is commonly applied to the fields and
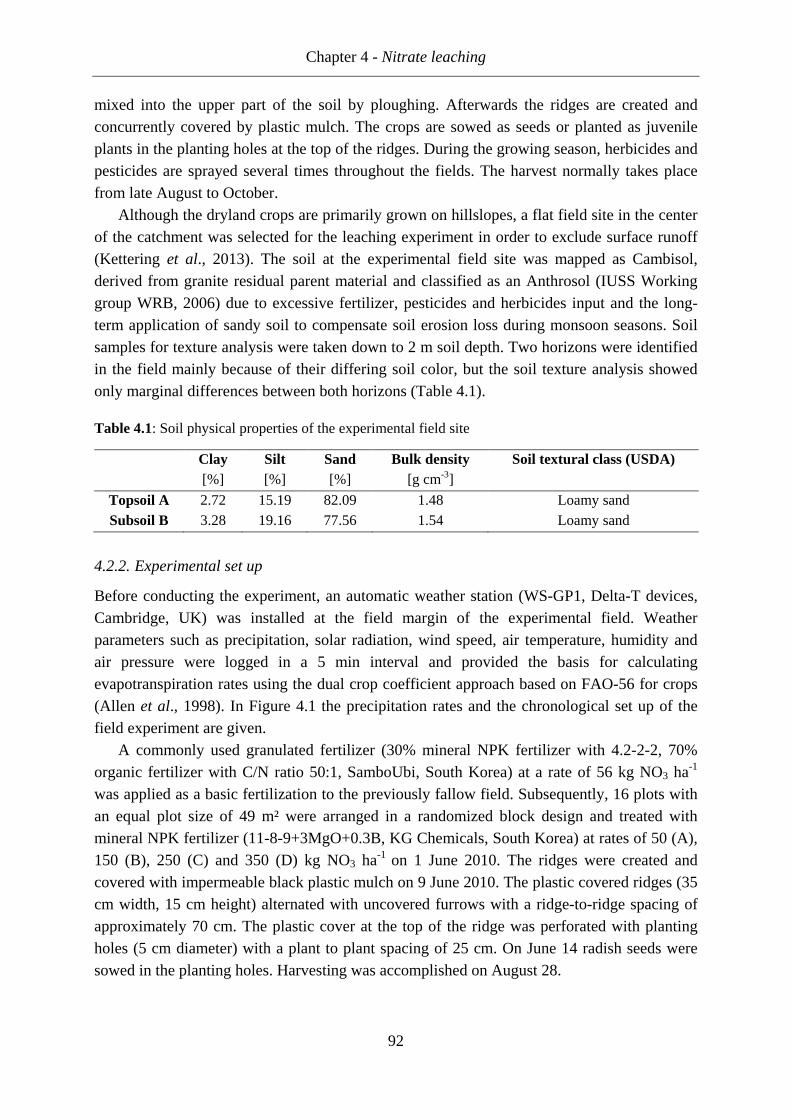
Chapter 4 - Nitrate leaching
92
mixed into the upper part of the soil by ploughing. Afterwards the ridges are created and concurrently covered by plastic mulch. The crops are sowed as seeds or planted as juvenile plants in the planting holes at the top of the ridges. During the growing season, herbicides and pesticides are sprayed several times throughout the fields. The harvest normally takes place from late August to October.
Although the dryland crops are primarily grown on hillslopes, a flat field site in the center of the catchment was selected for the leaching experiment in order to exclude surface runoff (Kettering et al., 2013). The soil at the experimental field site was mapped as Cambisol, derived from granite residual parent material and classified as an Anthrosol (IUSS Working group WRB, 2006) due to excessive fertilizer, pesticides and herbicides input and the long-term application of sandy soil to compensate soil erosion loss during monsoon seasons. Soil samples for texture analysis were taken down to 2 m soil depth. Two horizons were identified in the field mainly because of their differing soil color, but the soil texture analysis showed only marginal differences between both horizons (Table 4.1).
Table 4.1: Soil physical properties of the experimental field site
Clay Silt Sand Bulk density Soil textural class (USDA) [%] [%] [%] [g cm-3]
Topsoil A 2.72 15.19 82.09 1.48 Loamy sand Subsoil B 3.28 19.16 77.56 1.54 Loamy sand
4.2.2. Experimental set up
Before conducting the experiment, an automatic weather station (WS-GP1, Delta-T devices, Cambridge, UK) was installed at the field margin of the experimental field. Weather parameters such as precipitation, solar radiation, wind speed, air temperature, humidity and air pressure were logged in a 5 min interval and provided the basis for calculating evapotranspiration rates using the dual crop coefficient approach based on FAO-56 for crops (Allen et al., 1998). In Figure 4.1 the precipitation rates and the chronological set up of the field experiment are given.
A commonly used granulated fertilizer (30% mineral NPK fertilizer with 4.2-2-2, 70% organic fertilizer with C/N ratio 50:1, SamboUbi, South Korea) at a rate of 56 kg NO3 ha-1 was applied as a basic fertilization to the previously fallow field. Subsequently, 16 plots with an equal plot size of 49 m² were arranged in a randomized block design and treated with mineral NPK fertilizer (11-8-9+3MgO+0.3B, KG Chemicals, South Korea) at rates of 50 (A), 150 (B), 250 (C) and 350 (D) kg NO3 ha-1 on 1 June 2010. The ridges were created and covered with impermeable black plastic mulch on 9 June 2010. The plastic covered ridges (35 cm width, 15 cm height) alternated with uncovered furrows with a ridge-to-ridge spacing of approximately 70 cm. The plastic cover at the top of the ridge was perforated with planting holes (5 cm diameter) with a plant to plant spacing of 25 cm. On June 14 radish seeds were sowed in the planting holes. Harvesting was accomplished on August 28.
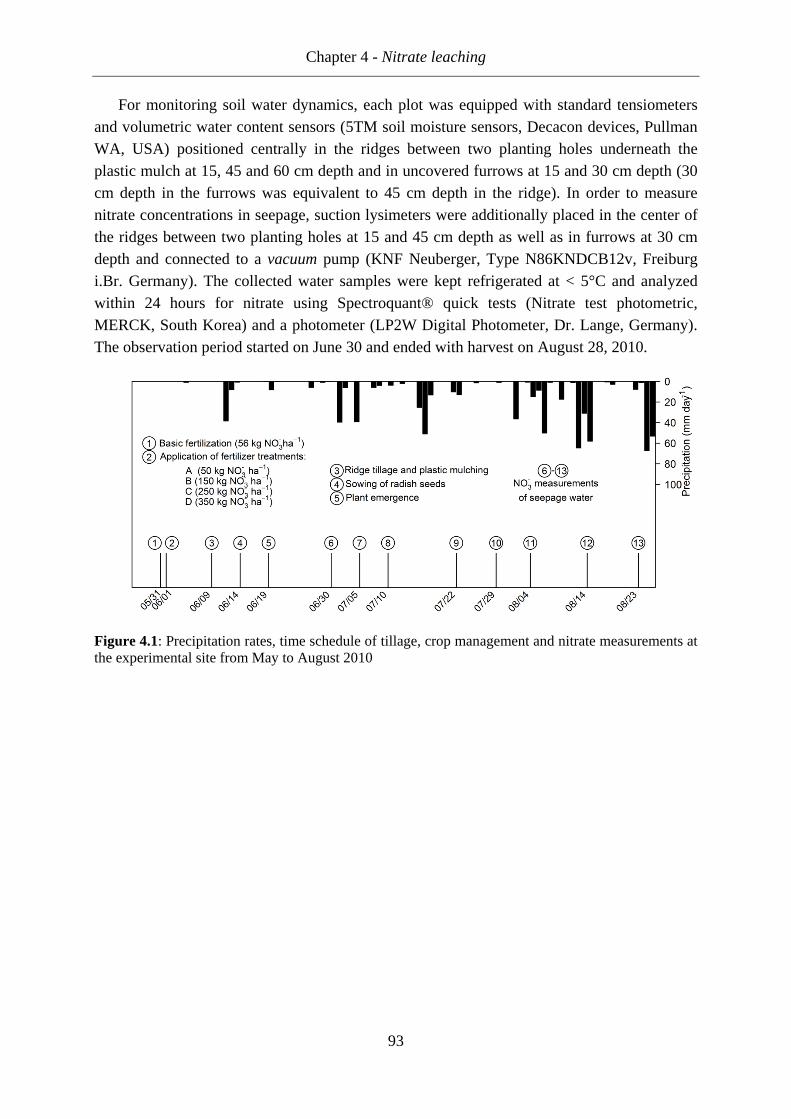
Chapter 4 - Nitrate leaching
93
For monitoring soil water dynamics, each plot was equipped with standard tensiometers and volumetric water content sensors (5TM soil moisture sensors, Decacon devices, Pullman WA, USA) positioned centrally in the ridges between two planting holes underneath the plastic mulch at 15, 45 and 60 cm depth and in uncovered furrows at 15 and 30 cm depth (30 cm depth in the furrows was equivalent to 45 cm depth in the ridge). In order to measure nitrate concentrations in seepage, suction lysimeters were additionally placed in the center of the ridges between two planting holes at 15 and 45 cm depth as well as in furrows at 30 cm depth and connected to a vacuum pump (KNF Neuberger, Type N86KNDCB12v, Freiburg i.Br. Germany). The collected water samples were kept refrigerated at < 5°C and analyzed within 24 hours for nitrate using Spectroquant® quick tests (Nitrate test photometric, MERCK, South Korea) and a photometer (LP2W Digital Photometer, Dr. Lange, Germany). The observation period started on June 30 and ended with harvest on August 28, 2010.
Figure 4.1: Precipitation rates, time schedule of tillage, crop management and nitrate measurements at the experimental site from May to August 2010
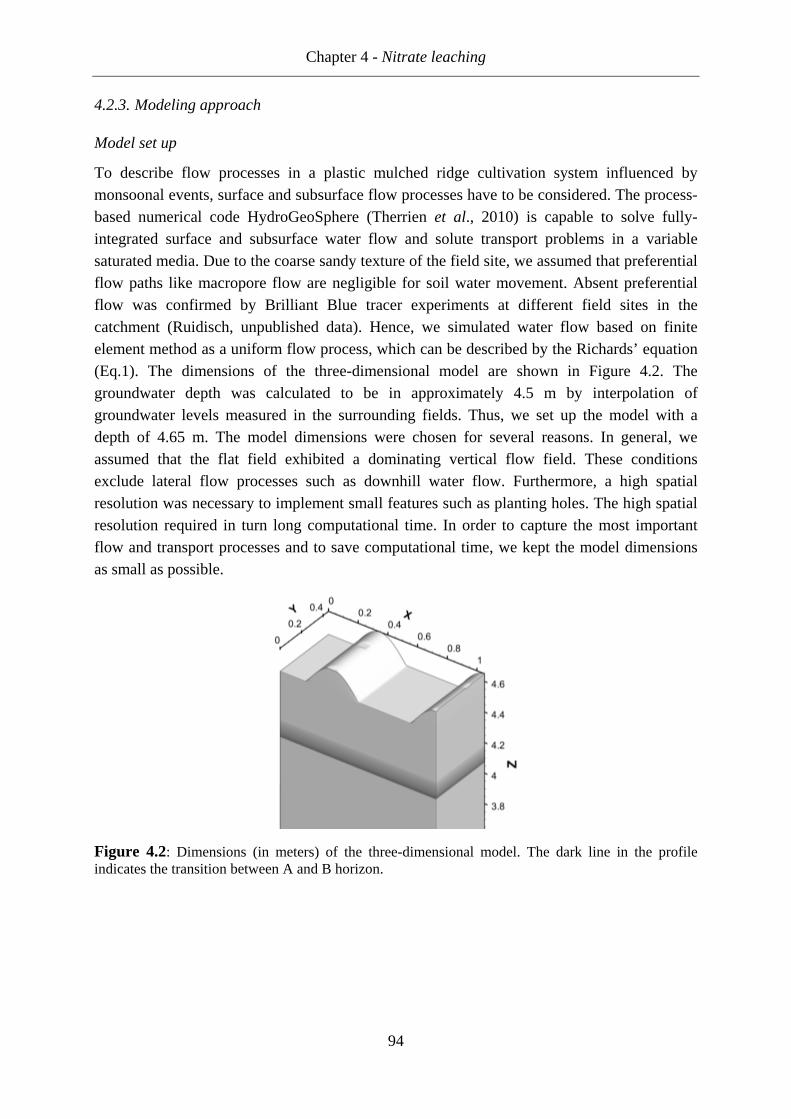
Chapter 4 - Nitrate leaching
94
4.2.3. Modeling approach
Model set up
To describe flow processes in a plastic mulched ridge cultivation system influenced by monsoonal events, surface and subsurface flow processes have to be considered. The process-based numerical code HydroGeoSphere (Therrien et al., 2010) is capable to solve fully-integrated surface and subsurface water flow and solute transport problems in a variable saturated media. Due to the coarse sandy texture of the field site, we assumed that preferential flow paths like macropore flow are negligible for soil water movement. Absent preferential flow was confirmed by Brilliant Blue tracer experiments at different field sites in the catchment (Ruidisch, unpublished data). Hence, we simulated water flow based on finite element method as a uniform flow process, which can be described by the Richards’ equation (Eq.1). The dimensions of the three-dimensional model are shown in Figure 4.2. The groundwater depth was calculated to be in approximately 4.5 m by interpolation of groundwater levels measured in the surrounding fields. Thus, we set up the model with a depth of 4.65 m. The model dimensions were chosen for several reasons. In general, we assumed that the flat field exhibited a dominating vertical flow field. These conditions exclude lateral flow processes such as downhill water flow. Furthermore, a high spatial resolution was necessary to implement small features such as planting holes. The high spatial resolution required in turn long computational time. In order to capture the most important flow and transport processes and to save computational time, we kept the model dimensions as small as possible.
Figure 4.2: Dimensions (in meters) of the three-dimensional model. The dark line in the profile indicates the transition between A and B horizon.
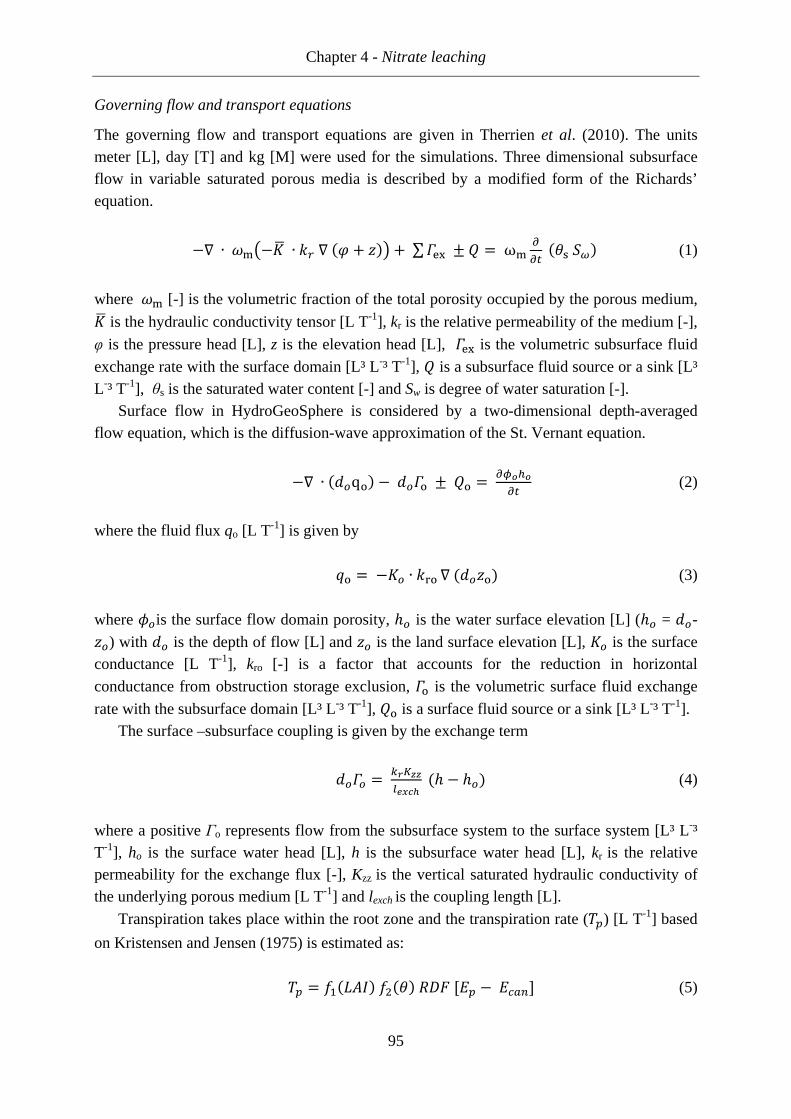
Chapter 4 - Nitrate leaching
95
Governing flow and transport equations
The governing flow and transport equations are given in Therrien et al. (2010). The units meter [L], day [T] and kg [M] were used for the simulations. Three dimensional subsurface flow in variable saturated porous media is described by a modified form of the Richards’ equation.
−∇ ∙ − ∙ ∇ + + ∑ ± = ω (1)
where [-] is the volumetric fraction of the total porosity occupied by the porous medium, is the hydraulic conductivity tensor [L T-1], kr is the relative permeability of the medium [-],
φ is the pressure head [L], z is the elevation head [L], is the volumetric subsurface fluid
exchange rate with the surface domain [L³ L-³ T-1], is a subsurface fluid source or a sink [L³ L-³ T-1], θs is the saturated water content [-] and Sw is degree of water saturation [-].
Surface flow in HydroGeoSphere is considered by a two-dimensional depth-averaged flow equation, which is the diffusion-wave approximation of the St. Vernant equation.
−∇ ∙ !"q$ − !"$ ± $ = %&'& (2)
where the fluid flux qo [L T-1] is given by
($ = −" ∙ )$ ∇ !"$ (3)
where *"is the surface flow domain porosity, ℎ" is the water surface elevation [L] (ℎ" = !"- ") with !" is the depth of flow [L] and " is the land surface elevation [L], " is the surface conductance [L T-1], kro [-] is a factor that accounts for the reduction in horizontal
conductance from obstruction storage exclusion, $ is the volumetric surface fluid exchange
rate with the subsurface domain [L³ L-³ T-1], $ is a surface fluid source or a sink [L³ L-³ T-1]. The surface –subsurface coupling is given by the exchange term
!"" = ,-.//01234 ℎ − ℎ" (4)
where a positive Γo represents flow from the subsurface system to the surface system [L³ L-³ T-1], ho is the surface water head [L], h is the subsurface water head [L], kr is the relative permeability for the exchange flux [-], Kzz is the vertical saturated hydraulic conductivity of the underlying porous medium [L T-1] and lexch is the coupling length [L].
Transpiration takes place within the root zone and the transpiration rate (56) [L T-1] based
on Kristensen and Jensen (1975) is estimated as: 56 = 78 9:; 7< =>? [A6 − ABCD] (5)

Chapter 4 - Nitrate leaching
96
where 78 9:; is a linear function of the leaf area index [-], 7< is a function of nodal
water content [-], and =>? is the time-varying root distribution function, A6 and ABCD are the
reference evapotranspiration and canopy evapotranspiration [L T-1].
7< = FGHGI
0 7KL 0 ≤ ≤ N6 7O 7KL N6 ≤ ≤ PB1 7KL PB ≤ ≤ " 7R 7KL " ≤ ≤ CD 0 7KL CD ≤ S (6)
where θwp , θfc, θo and θan is the moisture content [-] at the wilting point, field capacity, oxic and anoxic limit, respectively.
The three-dimensional transport of solutes considering advection, dispersion, retardation and decay processes in a variably-saturated porous matrix is described in HydroGeoSphere as follows: −∇ ∙ T (U − V >∇U + [TV =WU]XY) + ∑ Ω[\ ± B
= T ] ^_`abc + V =WUd (7)
where T is the subsurface volumetric fraction of the total porosity [-], q is the subsurface fluid flux [L T -1], C is the solute concentration [M L-3], θs is the subsurface saturated water content [-], Sw is the subsurface water saturation [-], D is subsurface hydrodynamic dispersion tensor [L2 T-1], Ωex is the mass exchange rate of solutes between subsurface and surface flow domain and Qc is the fluid source or sink [M L3 T-1], λ is the first-order decay constant [L-1] and R is the retardation factor [-]. In our modeling study, we only considered a conservative transport of nitrate and neglected retardation and decay.
The hydrodynamic dispersion tensor D is given by Bear (1972):
V > = e0 − e ff|f| + e|(|; + V h>i); (8)
where αl and αt are the longitudinal and transversal dipersivities [L], |q| is the magnitude of the Darcy flux, τ is the matrix tortuosity [-], Dfree is the free-solution coefficient [L² T-1] and I is the identity tensor. The product τ Dfree represents an effective diffusion coefficient for the matrix.
Initial and boundary conditions
The initial pressure head conditions in the model flow domain were derived using a steady state solution with a constant precipitation flux of 0.04 m day-1. This flux was chosen because the equilibrium conditions of pressure heads in the simulation showed the closest agreement with the measured pressure heads. The solute transport simulation started on the day of the
Chapter 4 - Nitrate leaching
97
highest measured nitrate concentrations (July 10). The water flow model delivered the initial pressure head conditions for this simulation day. The initial concentration in the models was adjusted to the measured nitrate concentrations on July 10 of 160, 125-150, 200 & 230 NO3 mg l-1 corresponding to the fertilizer rate A 50 kg, B 150 kg, C 250 kg & D 350 kg NO3 ha-1 plus pre-treatment fertilizer (56 kg NO3 ha-1), respectively. The bottom boundary condition of the models was specified as a free drainage boundary in 4.65 m depth. The left and right hand boundary was set to no flux conditions since the flat field conditions led to a mainly vertical flow field. For the scenarios with fertilizer placement only in ridges we defined the initial concentration in a way that the initial mass of nitrate was exactly the same to the previous simulations regarding the different fertilizer rates. Hence, we increased the initial concentration in the ridges, while the initial mass in the model was equivalent to the fertilizer rates A 50 kg, B 150 kg, C 250 kg and D 350 kg NO3 ha-1 plus pre-treatment fertilizer (56 kg NO3 ha-1).
The split applications were implemented in the modeling approach as follows: For the first application, the initial nitrate concentrations related to the specific fertilizer rate were included in the upper part of the model down to approximately 24 cm depth measured from the ridge surface. This translates to the local method of fertilizer application in the upper 15 cm of the soil before the ridges are created. The concentration and head conditions of June 25 were subsequently extracted and used as initial conditions to run the scenarios with a second application. The second application for each scenario was implemented by assuming that a fertilizer solution is applied only to the planting holes. Therefore we defined an initial water depth of 3.1 cm at the surface of the planting holes which equals about 60 ml of fertilizer solution per planting hole and implemented the initial concentration for each scenario at the surface of the planting holes. The third application for the model scenarios 3a, 3b and 3c was implemented in an analogous manner but using the initial head and concentration outputs from July 6 of the second application simulations.
Model parameterization, calibration and evaluation
In order to estimate pressure heads and nitrate concentrations using inverse modeling techniques, we coupled the HydroGeoSphere model with the Parallel PEST Version 12.1.0 (Doherty, 2005). PEST uses a nonlinear estimation technique known as the Gauss-Marquardt-Levenberg method. We derived the initial estimates of the Van Genuchten parameter based on measured texture and bulk density data (Table 4.1) using the ROSETTA model (Schaap et al., 2001), which estimates soil hydraulic parameters with hierarchical pedotransfer functions. The Van Genuchten parameter α & n and saturated hydraulic conductivity were estimated simultaneously for the measurement period of 17 June to 23 August 2010. Based on the water flow model we subsequently implemented the solute transport. We initially estimated the transport parameters longitudinal, transversal and vertical transversal dispersivity based on literature values (Rausch et al., 2005) and optimized them for all fertilizer rates A-D. Initial estimated parameters are given in Table 4.2. We estimated the longitudinal dispersivity for both horizons in a range between 0.1 m and 1 m according to the findings of Gelhar et al.
Chapter 4 - Nitrate leaching
98
(1985), who showed that longitudinal dispersivity is scale-dependent. According to Pickens and Grisak (1981) the ratio of longitudinal and transversal dispersivity is between 0.01 and 0.3. Therefore, we initially estimated the transversal and vertical transversal dispersivity to be 0.01 and optimized them in a range between 0.1 and 0.001. The solute transport parameters were estimated for the observation period from July 10 to August 23. We excluded the first two observations, which were done shortly after the installation of the suction lysimeters from the optimization due to increasing concentrations at these dates. We affiliated these conditions to the stabilization phase of the suction lysimeters (Grossmann and Udluft, 1991).
At the surface of the model, we implemented zones of infiltration (uncovered furrows and planting holes) and non-infiltration zones (plastic mulched ridges) using the model parameter coupling length. A coupling length of 0.1 m and 1000 m was defined for the infiltration zones and non-infiltration zones, respectively. For the simulation of RT (ridge tillage without plastic mulch) we defined a coupling length of 0.1 m for the entire surface of the model domain. The potential evaporation and transpiration rates were calculated based on the dual crop coefficient approach proposed by Allen et al. (1998) using the measured weather parameters rainfall, temperature, humidity, solar radiation and wind speed. Table 4.2: Initial estimates of water retention and solute transport parameters.
θs θr α n Ksat Dl Dt Dvt [m3 m-3] [m3 m-3] [m-1] [-] [m d-1] [m] [m] [m]
A-Horizon 0.3855 0.0386 4.31 1.94 1.74 0.1 0.01 0.01 B-Horizon 0.3662 0.0366 4.55 1.71 0.97 0.1 0.01 0.01
with θs: saturated water content, θr residual water content, α and n form parameters of the retention curve, Ksat saturated hydraulic conductivity, Dl longitudinal dispersivity, Dt transversal dispersivity, Dvt vertical transversal dispersivity. For the evaluation of the models we used the coefficient of determination (R²) and the Nash-Sutcliffe-Efficiency (CE). Moriasi et al. (2007) provided a comprehensive overview of the evaluation statistics for hydrological models. The coefficient of determination ranges from 0 to 1, where 1 indicates the total agreement between measured and simulated values. The Nash-Sutcliffe coefficient (Eq. 9) determines the relative magnitude of the residual variance compared to the observed data variance.
Nash-Sutcliffe-Efficiency varies between -∞ and 1, where 1 indicates a perfect model. Model performance is unacceptable when the value is < 0.
jk = l − m ∑ nopqr s norot²uovl∑ nopqr s ntwxu²uovl y (9)
where Ymean indicates the mean of the observed data, Yi
obs is the ith observation of the observed and Yi
sim the ith observation of the simulated dataset, n is the total number of observations.
Chapter 4 - Nitrate leaching
99
4.3. Results
4.3.1. Model evaluation and parameter optimization
The simultaneous estimation of soil hydraulic parameters n, α and Ksat resulted in similar n-values compared to the initially estimated values with n=1.92 and n=1.85 for the topsoil and subsoil, respectively. In contrast, α-values were estimated to be smaller than initially estimated with 2.89 m-1 for the topsoil and 2.97 m-1 for the subsoil. Relatively large n-values lead to a quick drainage, which is characteristic for course textured material, whereas small α-values indicate drainage under relatively low pressure head conditions, which is more common for finer soil texture. This combination of α and n was also found in a two-dimensional simulation study investigating water flow in sloped potato fields in the Haean catchment (Ruidisch et al., 2013). The saturated hydraulic conductivity (Ksat) was optimized to be 2.99 m d-1 and 1.88 m d-1 for the topsoil and subsoil, respectively, which is higher than the initially estimated Ksat values obtained by the ROSETTA model.
In Figure 4.3 the comparison of simulated and measured pressure heads in different depths of ridge and furrow positions as well as evaluation coefficients R² and Nash-Sutcliffe efficiency (CE) are shown. In all depths and positions, the measured low pressure heads during drying cycles were overestimated by the model. In contrast, wet periods during monsoon were reasonable simulated except in furrow positions (30 cm depth), where simulated pressure heads were overestimated during the entire simulation period.
The optimization of the solute transport parameters (longitudinal, transversal and vertical transversal dispersivity) showed that the parameters were similar among the fertilizer rates (Table 4.3). The highest longitudinal dispersivity was found for the lowest fertilizer rate in both A and B horizon. The longitudinal dispersivity for the subsoil was in a range between 0.012 m and 0.051 m, which was much smaller than longitudinal dispersivity for the top soil. The transversal and vertical transversal dispersivity for the subsoil was comparable with the optimized dispersivity for the topsoil. Due to the similarity of optimized dispersivity among fertilizer treatments, we calculated the mean for each parameter and used the mean parameter set for subsequent model simulations regarding the effect of different fertilizer rates, fertilizer placement and split applications on nitrate leaching loss.
Although the agreement between measured and simulated pressure heads of the water flow model was not satisfying, the optimization for the solute transport model resulted in a reasonable agreement between measured and simulated nitrate concentrations (Fig. 4.4). At all observation points the Nash Sutcliffe coefficient (CE) was ≥ 0.50 except under fertilizer rate C in the furrow position (30cm depth) and the coefficient of determination (R²) was ≥ 0.54 for all observation points. The fertilizer had been applied approximately one month before the nitrate concentration measurements. Hence, the measured nitrate concentrations on July 10 did not reflect the original applied fertilizer rates. For the subsequent modeling we therefore assumed that the applied granule fertilizer was latest solved with the first significant rain event after the application, which occurred on June 12 with a total precipitation amount of 38.4 mm.
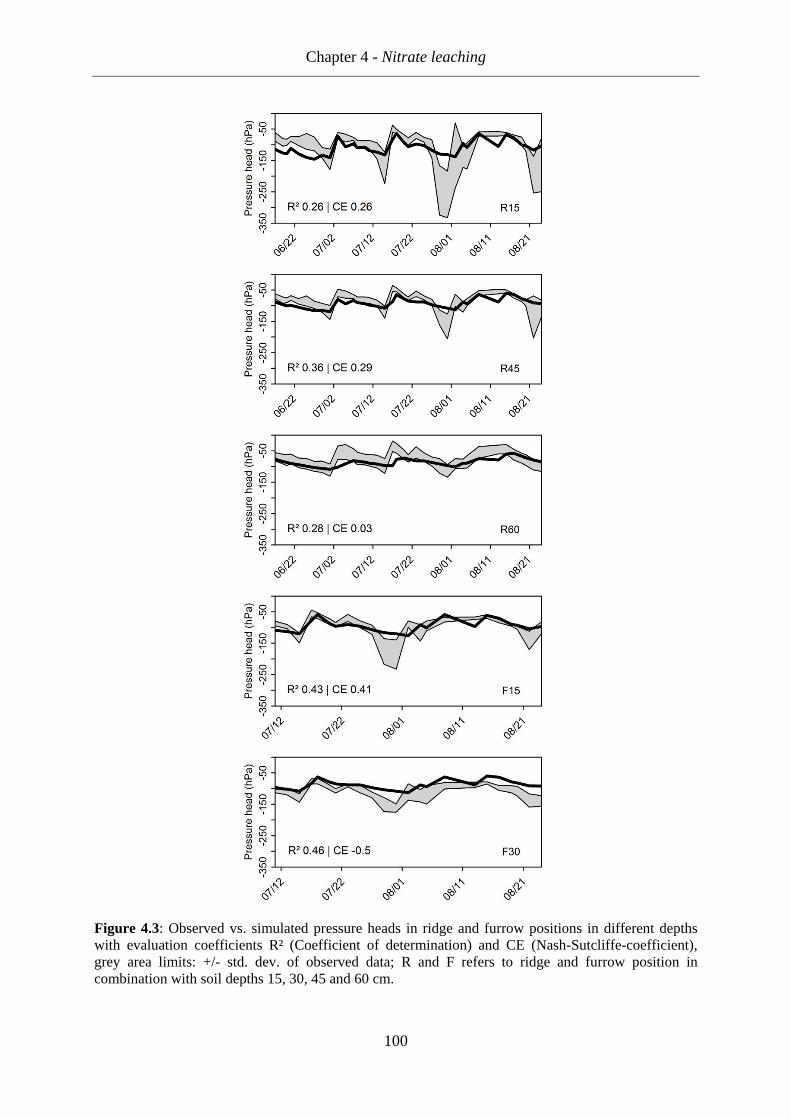
Chapter 4 - Nitrate leaching
100
Figure 4.3: Observed vs. simulated pressure heads in ridge and furrow positions in different depths with evaluation coefficients R² (Coefficient of determination) and CE (Nash-Sutcliffe-coefficient), grey area limits: +/- std. dev. of observed data; R and F refers to ridge and furrow position in combination with soil depths 15, 30, 45 and 60 cm.
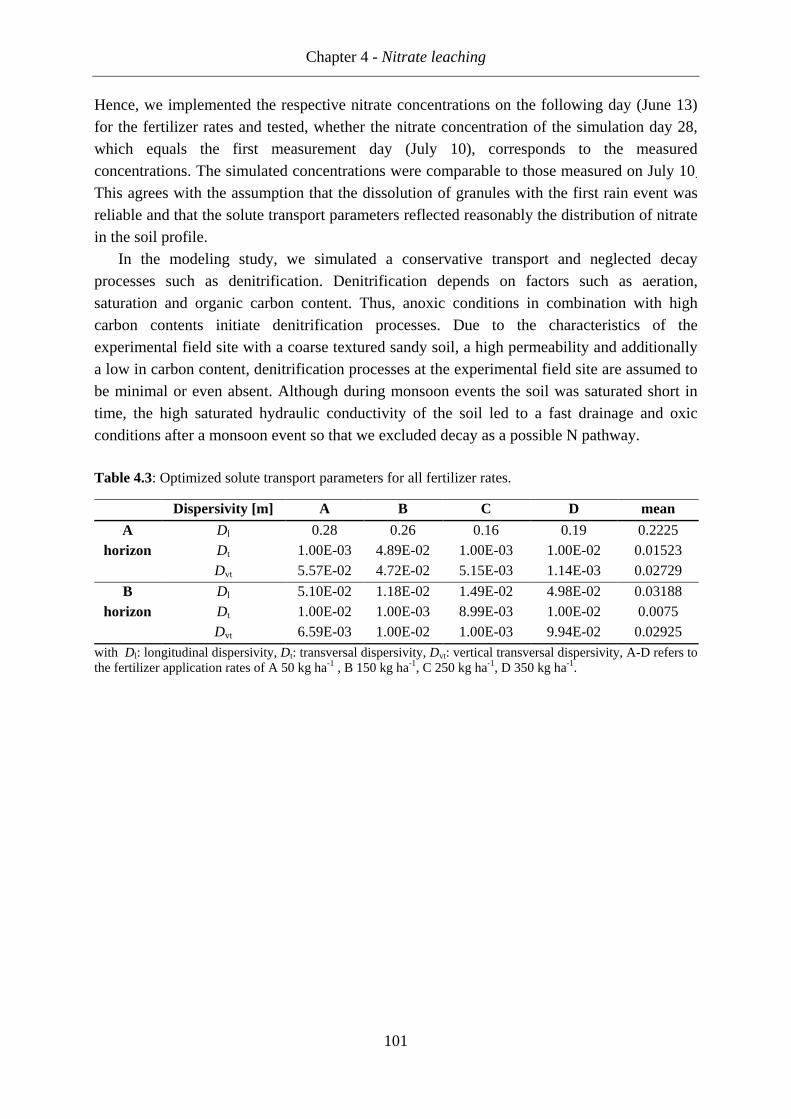
Chapter 4 - Nitrate leaching
101
Hence, we implemented the respective nitrate concentrations on the following day (June 13) for the fertilizer rates and tested, whether the nitrate concentration of the simulation day 28, which equals the first measurement day (July 10), corresponds to the measured concentrations. The simulated concentrations were comparable to those measured on July 10. This agrees with the assumption that the dissolution of granules with the first rain event was reliable and that the solute transport parameters reflected reasonably the distribution of nitrate in the soil profile.
In the modeling study, we simulated a conservative transport and neglected decay processes such as denitrification. Denitrification depends on factors such as aeration, saturation and organic carbon content. Thus, anoxic conditions in combination with high carbon contents initiate denitrification processes. Due to the characteristics of the experimental field site with a coarse textured sandy soil, a high permeability and additionally a low in carbon content, denitrification processes at the experimental field site are assumed to be minimal or even absent. Although during monsoon events the soil was saturated short in time, the high saturated hydraulic conductivity of the soil led to a fast drainage and oxic conditions after a monsoon event so that we excluded decay as a possible N pathway.
Table 4.3: Optimized solute transport parameters for all fertilizer rates.
Dispersivity [m] A B C D mean
A horizon
Dl 0.28 0.26 0.16 0.19 0.2225 Dt 1.00E-03 4.89E-02 1.00E-03 1.00E-02 0.01523 Dvt 5.57E-02 4.72E-02 5.15E-03 1.14E-03 0.02729
B horizon
Dl 5.10E-02 1.18E-02 1.49E-02 4.98E-02 0.03188 Dt 1.00E-02 1.00E-03 8.99E-03 1.00E-02 0.0075 Dvt 6.59E-03 1.00E-02 1.00E-03 9.94E-02 0.02925
with Dl: longitudinal dispersivity, Dt: transversal dispersivity, Dvt: vertical transversal dispersivity, A-D refers to the fertilizer application rates of A 50 kg ha-1 , B 150 kg ha-1, C 250 kg ha-1, D 350 kg ha-1.
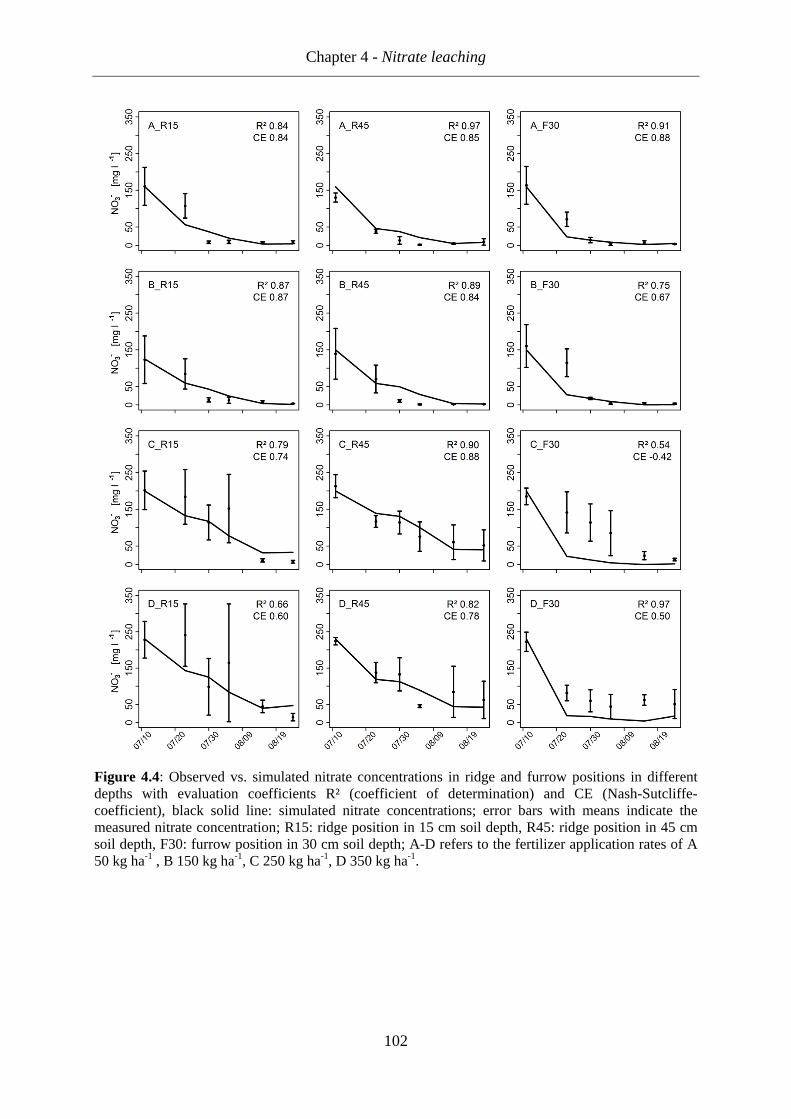
Chapter 4 - Nitrate leaching
102
Figure 4.4: Observed vs. simulated nitrate concentrations in ridge and furrow positions in different depths with evaluation coefficients R² (coefficient of determination) and CE (Nash-Sutcliffe-coefficient), black solid line: simulated nitrate concentrations; error bars with means indicate the measured nitrate concentration; R15: ridge position in 15 cm soil depth, R45: ridge position in 45 cm soil depth, F30: furrow position in 30 cm soil depth; A-D refers to the fertilizer application rates of A 50 kg ha-1 , B 150 kg ha-1, C 250 kg ha-1, D 350 kg ha-1.
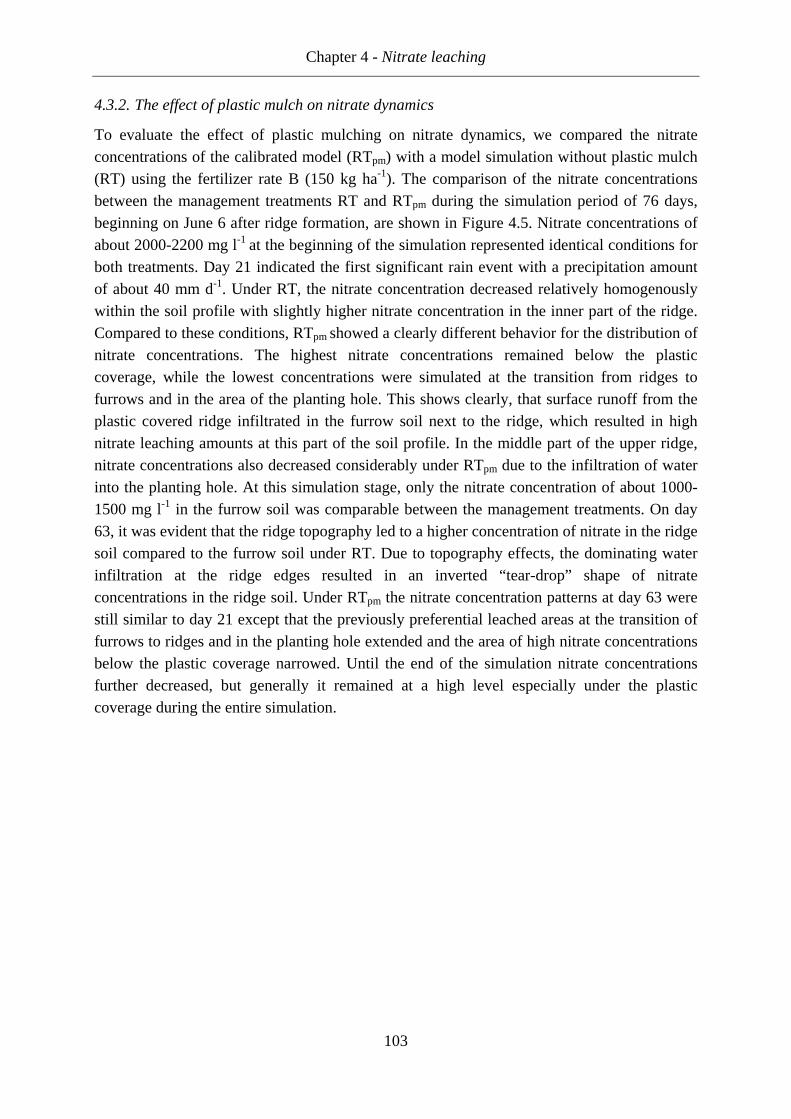
Chapter 4 - Nitrate leaching
103
4.3.2. The effect of plastic mulch on nitrate dynamics
To evaluate the effect of plastic mulching on nitrate dynamics, we compared the nitrate concentrations of the calibrated model (RTpm) with a model simulation without plastic mulch (RT) using the fertilizer rate B (150 kg ha-1). The comparison of the nitrate concentrations between the management treatments RT and RTpm during the simulation period of 76 days, beginning on June 6 after ridge formation, are shown in Figure 4.5. Nitrate concentrations of about 2000-2200 mg l-1
at the beginning of the simulation represented identical conditions for both treatments. Day 21 indicated the first significant rain event with a precipitation amount of about 40 mm d-1. Under RT, the nitrate concentration decreased relatively homogenously within the soil profile with slightly higher nitrate concentration in the inner part of the ridge. Compared to these conditions, RTpm showed a clearly different behavior for the distribution of nitrate concentrations. The highest nitrate concentrations remained below the plastic coverage, while the lowest concentrations were simulated at the transition from ridges to furrows and in the area of the planting hole. This shows clearly, that surface runoff from the plastic covered ridge infiltrated in the furrow soil next to the ridge, which resulted in high nitrate leaching amounts at this part of the soil profile. In the middle part of the upper ridge, nitrate concentrations also decreased considerably under RTpm due to the infiltration of water into the planting hole. At this simulation stage, only the nitrate concentration of about 1000-1500 mg l-1 in the furrow soil was comparable between the management treatments. On day 63, it was evident that the ridge topography led to a higher concentration of nitrate in the ridge soil compared to the furrow soil under RT. Due to topography effects, the dominating water infiltration at the ridge edges resulted in an inverted “tear-drop” shape of nitrate concentrations in the ridge soil. Under RTpm the nitrate concentration patterns at day 63 were still similar to day 21 except that the previously preferential leached areas at the transition of furrows to ridges and in the planting hole extended and the area of high nitrate concentrations below the plastic coverage narrowed. Until the end of the simulation nitrate concentrations further decreased, but generally it remained at a high level especially under the plastic coverage during the entire simulation.
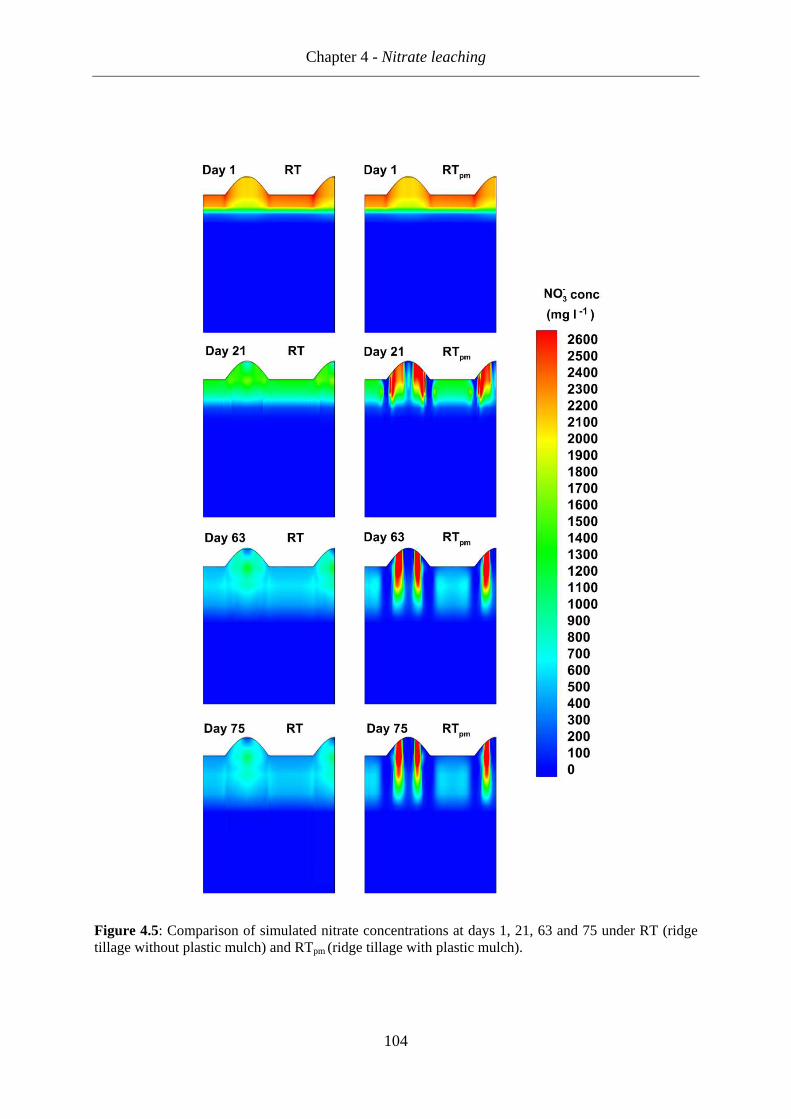
Chapter 4 - Nitrate leaching
104
Figure 4.5: Comparison of simulated nitrate concentrations at days 1, 21, 63 and 75 under RT (ridge tillage without plastic mulch) and RTpm (ridge tillage with plastic mulch).
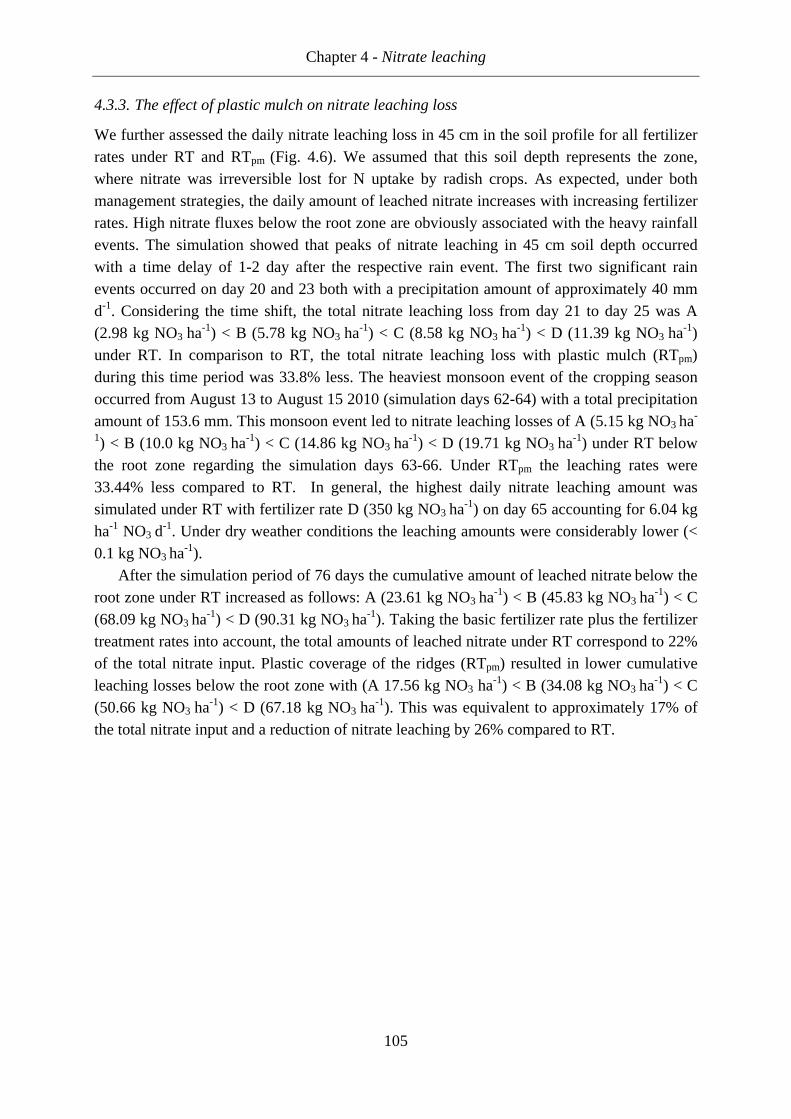
Chapter 4 - Nitrate leaching
105
4.3.3. The effect of plastic mulch on nitrate leaching loss
We further assessed the daily nitrate leaching loss in 45 cm in the soil profile for all fertilizer rates under RT and RTpm (Fig. 4.6). We assumed that this soil depth represents the zone, where nitrate was irreversible lost for N uptake by radish crops. As expected, under both management strategies, the daily amount of leached nitrate increases with increasing fertilizer rates. High nitrate fluxes below the root zone are obviously associated with the heavy rainfall events. The simulation showed that peaks of nitrate leaching in 45 cm soil depth occurred with a time delay of 1-2 day after the respective rain event. The first two significant rain events occurred on day 20 and 23 both with a precipitation amount of approximately 40 mm d-1. Considering the time shift, the total nitrate leaching loss from day 21 to day 25 was A (2.98 kg NO3
ha-1) < B (5.78 kg NO3 ha-1) < C (8.58 kg NO3
ha-1) < D (11.39 kg NO3 ha-1)
under RT. In comparison to RT, the total nitrate leaching loss with plastic mulch (RTpm) during this time period was 33.8% less. The heaviest monsoon event of the cropping season occurred from August 13 to August 15 2010 (simulation days 62-64) with a total precipitation amount of 153.6 mm. This monsoon event led to nitrate leaching losses of A (5.15 kg NO3
ha-
1) < B (10.0 kg NO3 ha-1) < C (14.86 kg NO3
ha-1) < D (19.71 kg NO3 ha-1) under RT below
the root zone regarding the simulation days 63-66. Under RTpm the leaching rates were 33.44% less compared to RT. In general, the highest daily nitrate leaching amount was simulated under RT with fertilizer rate D (350 kg NO3
ha-1) on day 65 accounting for 6.04 kg ha-1 NO3 d
-1. Under dry weather conditions the leaching amounts were considerably lower (< 0.1 kg NO3
ha-1). After the simulation period of 76 days the cumulative amount of leached nitrate below the
root zone under RT increased as follows: A (23.61 kg NO3 ha-1) < B (45.83 kg NO3
ha-1) < C (68.09 kg NO3
ha-1) < D (90.31 kg NO3 ha-1). Taking the basic fertilizer rate plus the fertilizer
treatment rates into account, the total amounts of leached nitrate under RT correspond to 22% of the total nitrate input. Plastic coverage of the ridges (RTpm) resulted in lower cumulative leaching losses below the root zone with (A 17.56 kg NO3 ha-1) < B (34.08 kg NO3
ha-1) < C (50.66 kg NO3
ha-1) < D (67.18 kg NO3 ha-1). This was equivalent to approximately 17% of
the total nitrate input and a reduction of nitrate leaching by 26% compared to RT.
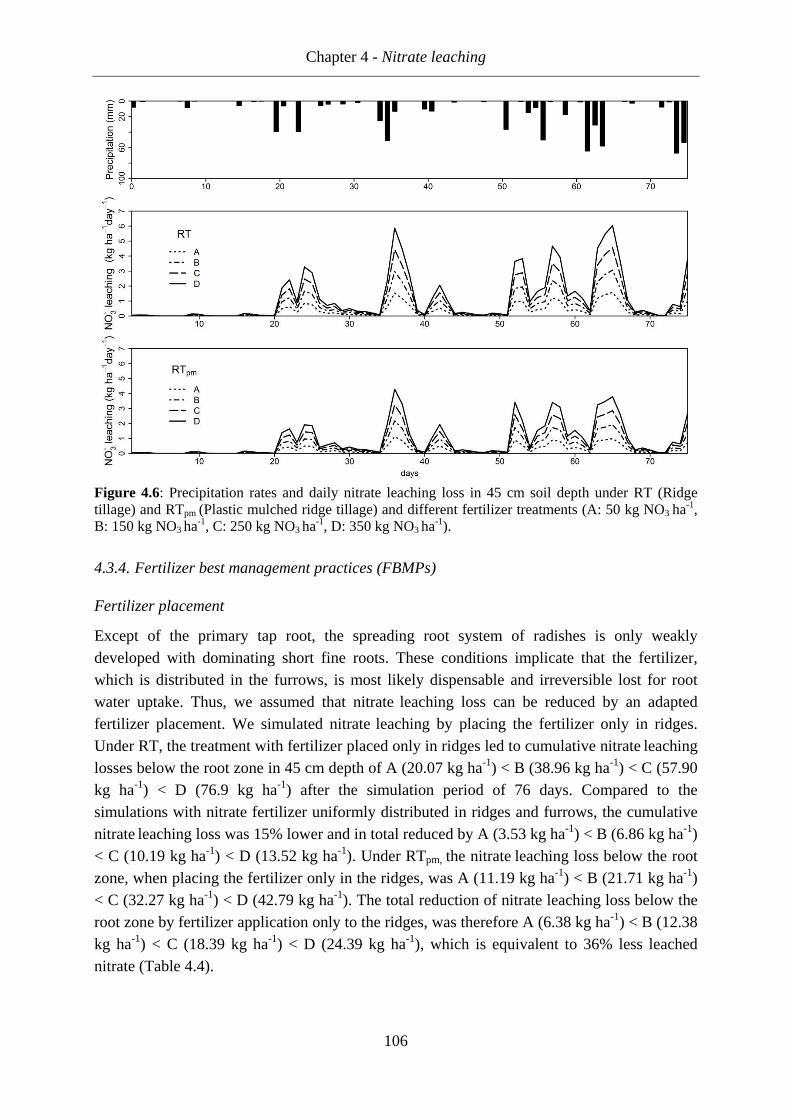
Chapter 4 - Nitrate leaching
106
Figure 4.6: Precipitation rates and daily nitrate leaching loss in 45 cm soil depth under RT (Ridge tillage) and RTpm (Plastic mulched ridge tillage) and different fertilizer treatments (A: 50 kg NO3
ha-1, B: 150 kg NO3
ha-1, C: 250 kg NO3 ha-1, D: 350 kg NO3
ha-1).
4.3.4. Fertilizer best management practices (FBMPs)
Fertilizer placement
Except of the primary tap root, the spreading root system of radishes is only weakly developed with dominating short fine roots. These conditions implicate that the fertilizer, which is distributed in the furrows, is most likely dispensable and irreversible lost for root water uptake. Thus, we assumed that nitrate leaching loss can be reduced by an adapted fertilizer placement. We simulated nitrate leaching by placing the fertilizer only in ridges. Under RT, the treatment with fertilizer placed only in ridges led to cumulative nitrate leaching losses below the root zone in 45 cm depth of A (20.07 kg ha-1) < B (38.96 kg ha-1) < C (57.90 kg ha-1) < D (76.9 kg ha-1) after the simulation period of 76 days. Compared to the simulations with nitrate fertilizer uniformly distributed in ridges and furrows, the cumulative nitrate leaching loss was 15% lower and in total reduced by A (3.53 kg ha-1) < B (6.86 kg ha-1) < C (10.19 kg ha-1) < D (13.52 kg ha-1). Under RTpm, the nitrate leaching loss below the root zone, when placing the fertilizer only in the ridges, was A (11.19 kg ha-1) < B (21.71 kg ha-1) < C (32.27 kg ha-1) < D (42.79 kg ha-1). The total reduction of nitrate leaching loss below the root zone by fertilizer application only to the ridges, was therefore A (6.38 kg ha-1) < B (12.38 kg ha-1) < C (18.39 kg ha-1) < D (24.39 kg ha-1), which is equivalent to 36% less leached nitrate (Table 4.4).
Chapter 4 - Nitrate leaching
107
Table 4.4: Simulated cumulative nitrate leaching rates below the root zone after a simulation period of 76 days as affected by plastic mulch and fertilizer placement
A (50 kg ha-1)
B (150 kg ha-1)
C (250 kg ha-1)
D (350 kg ha-1)
RT + CF 23.61 45.83 68.09 90.31 RT + FP 20.07 38.96 57.90 76.90 RTpm + CF 17.56 34.08 50.66 67.18 RTpm + FP 11.19 21.71 32.27 42.79 All values are given in kg NO3 ha-1, RT: ridge tillage without coverage, RTpm: ridge tillage with plastic mulch, CF: conventional fertilization in ridges and furrows, FP: fertilization placement only in ridges.
Split applications
We developed the split application scenarios based on findings of the field experiment at the same field site (Kettering et al., 2013). The 15N tracer experiment showed low fertilizer nitrogen use efficiencies (FNUE) at the beginning of the growing season because radishes had not yet emerged. Accordingly, high fertilizer amounts during this early stage led to high nitrate leaching losses. This was confirmed by Bartsch, S. (unpublished data), who observed the highest nitrate concentrations of 31-33 mg NO3
l-1 in the groundwater next to the experimental field site from end of June to middle of July 2010. In the crop development stage, the FNUE increased significantly for all fertilizer rates. The highest FNUE with 30% was observed for the fertilizer rate B (150 kg NO3
ha-1). Furthermore, the study showed that the biomass production at harvest time did not significantly differ for the fertilizer rates B (150 kg ha-1), C (250 kg ha-1) and D (350 kg ha-1) so that fertilization above 150 NO3 ha-1 only increased the accumulation of nitrate in the radish root. Thus, Kettering et al. (2013) recommended splitting the fertilizer application according to the plants N needs and suggested a maximum of 150 NO3
ha-1 in total. Hence, all split application scenarios (Table 4.5) were developed based on the total
amount of 150 kg NO3 ha-1. The reference scenario (Scenario1) refers to ridge tillage with
plastic mulching (RTpm) and a fertilizer application of 150 kg NO3 ha-1 at the beginning of the
growing season distributed in ridges and furrows. The distribution of fertilizer in ridges and furrows for the first application was also characteristic for all other scenarios. For the scenarios 2a and 3a, we separated the fertilizer application into equal amounts. The other scenarios represent the application of successive reduced fertilizer amounts at the beginning of the growing season. Generally the second and third application was implemented after rainfall events.
In Figure 4.7a the cumulative nitrate leaching loss in 45 cm depth below the root zone for all scenarios is shown. As expected, the highest cumulative leaching loss was simulated for the reference scenario 1 (34.1 kg NO3
ha-1). The other scenarios resulted in total cumulative nitrate leaching loss in the order of 2a (23.7 kg NO3
ha-1) > 3a (19.4 kg NO3 ha-1) > 2b (19.2
kg NO3 ha-1) > 2c and 3b (15.7 kg NO3
ha-1) > 3c (13.9 kg NO3 ha-1). This was equivalent to a
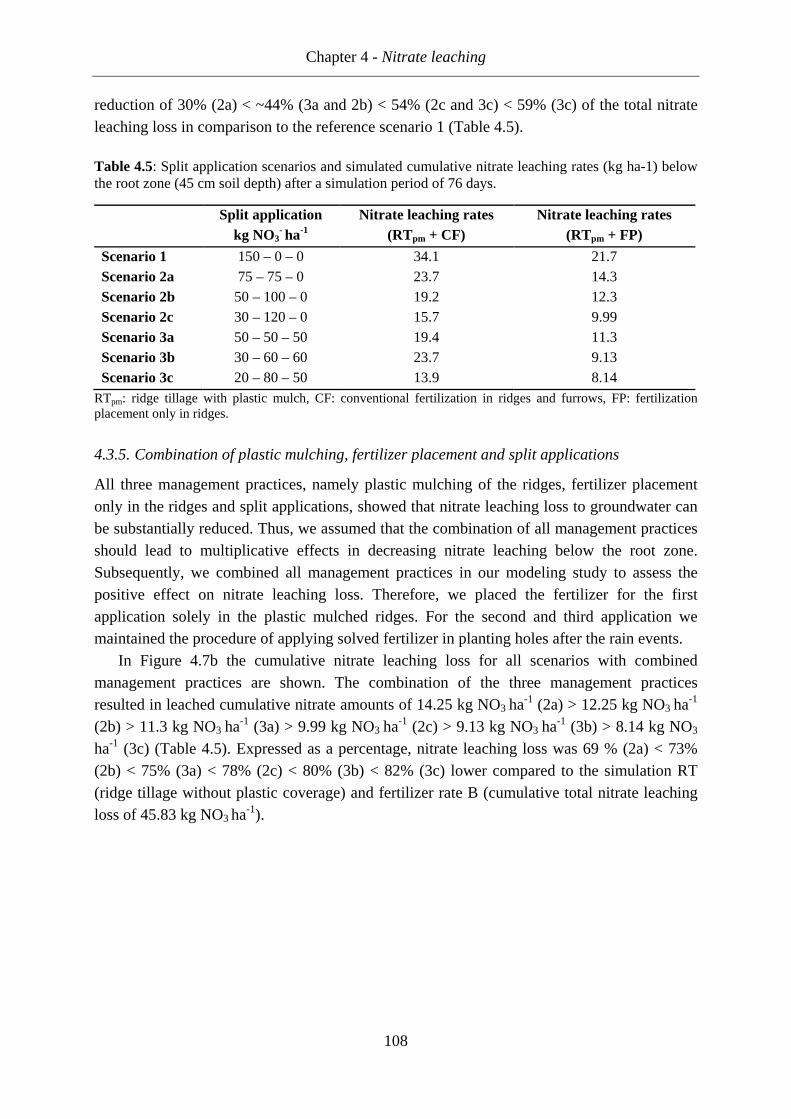
Chapter 4 - Nitrate leaching
108
reduction of 30% (2a) < ~44% (3a and 2b) < 54% (2c and 3c) < 59% (3c) of the total nitrate
leaching loss in comparison to the reference scenario 1 (Table 4.5). Table 4.5: Split application scenarios and simulated cumulative nitrate leaching rates (kg ha-1) below the root zone (45 cm soil depth) after a simulation period of 76 days.
Split application kg NO3
- ha-1 Nitrate leaching rates
(RTpm + CF) Nitrate leaching rates
(RTpm + FP)
Scenario 1 150 – 0 – 0 34.1 21.7 Scenario 2a 75 – 75 – 0 23.7 14.3 Scenario 2b 50 – 100 – 0 19.2 12.3 Scenario 2c 30 – 120 – 0 15.7 9.99 Scenario 3a 50 – 50 – 50 19.4 11.3 Scenario 3b 30 – 60 – 60 23.7 9.13 Scenario 3c 20 – 80 – 50 13.9 8.14
RTpm: ridge tillage with plastic mulch, CF: conventional fertilization in ridges and furrows, FP: fertilization placement only in ridges.
4.3.5. Combination of plastic mulching, fertilizer placement and split applications
All three management practices, namely plastic mulching of the ridges, fertilizer placement only in the ridges and split applications, showed that nitrate leaching loss to groundwater can be substantially reduced. Thus, we assumed that the combination of all management practices should lead to multiplicative effects in decreasing nitrate leaching below the root zone. Subsequently, we combined all management practices in our modeling study to assess the positive effect on nitrate leaching loss. Therefore, we placed the fertilizer for the first application solely in the plastic mulched ridges. For the second and third application we maintained the procedure of applying solved fertilizer in planting holes after the rain events.
In Figure 4.7b the cumulative nitrate leaching loss for all scenarios with combined management practices are shown. The combination of the three management practices resulted in leached cumulative nitrate amounts of 14.25 kg NO3
ha-1 (2a) > 12.25 kg NO3 ha-1
(2b) > 11.3 kg NO3 ha-1 (3a) > 9.99 kg NO3
ha-1 (2c) > 9.13 kg NO3 ha-1 (3b) > 8.14 kg NO3
ha-1 (3c) (Table 4.5). Expressed as a percentage, nitrate leaching loss was 69 % (2a) < 73% (2b) < 75% (3a) < 78% (2c) < 80% (3b) < 82% (3c) lower compared to the simulation RT (ridge tillage without plastic coverage) and fertilizer rate B (cumulative total nitrate leaching loss of 45.83 kg NO3
ha-1).
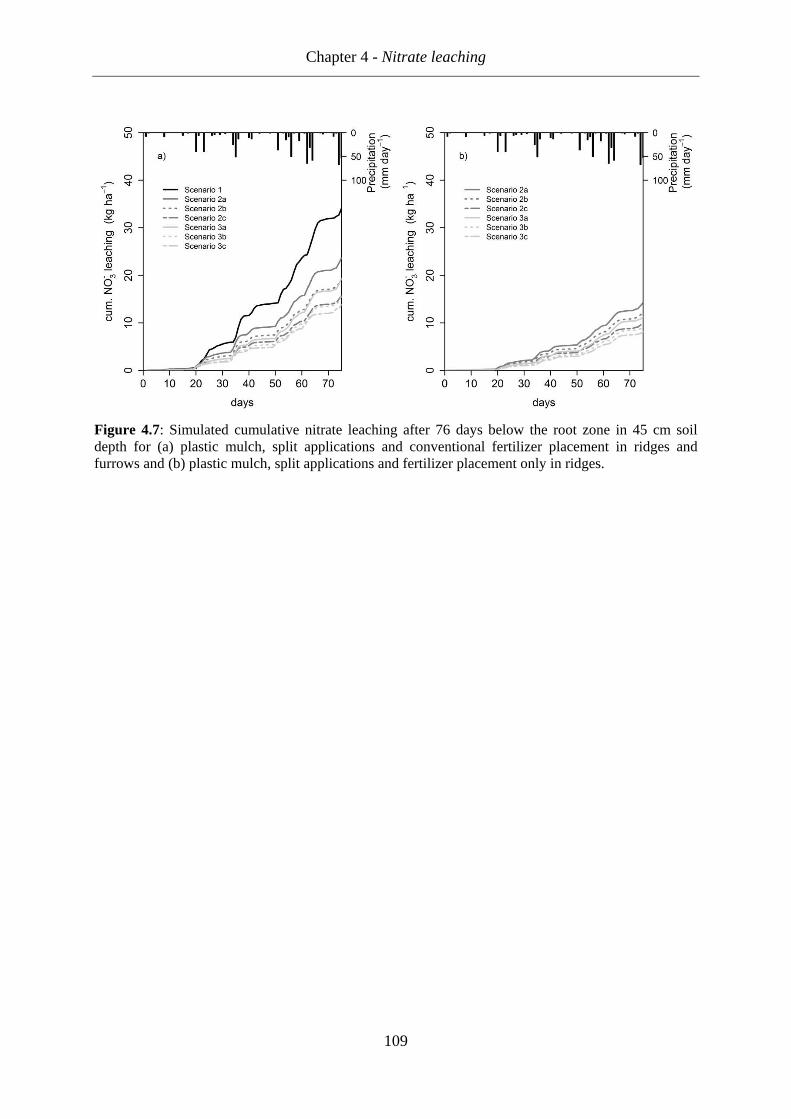
Chapter 4 - Nitrate leaching
109
Figure 4.7: Simulated cumulative nitrate leaching after 76 days below the root zone in 45 cm soil depth for (a) plastic mulch, split applications and conventional fertilizer placement in ridges and furrows and (b) plastic mulch, split applications and fertilizer placement only in ridges.
Chapter 4 - Nitrate leaching
110
4.4. Discussion
In the presented modeling study, we assessed the impact of plastic mulch and fertilizer best management practices (FBMPs) on N leaching losses in ridge cultivation in a flat terrain. The simulation showed that not only the plastic coverage but also the topography of the ridges potentially increased the nitrate availability in the root zone since surface runoff was channeled into the furrows and nitrate in the ridge soil was protected. The results are in accordance to Cannington et al. (1975) and Locascio et al. (1985), who found that the plastic coverage led to enhanced fertilizer retention underneath the ridges and protected the fertilizer from leaching. Furthermore, the simulated nitrate leaching amounts corresponds to findings of Böhlke (2002), who reported in a literature review that commonly 10-50% of applied fertilizer N contributes to groundwater nitrate recharge under heavily fertilized and well-drained fields. Nevertheless, we assume that daily leached and cumulative leached nitrate can be even higher since the observed rain events in 2010 were only moderate compared to other years, when rain events frequently exceed 100 mm d-1 (Park et al., 2010).
Our simulation results revealed that fertilizer placement restricted to the ridges is a valuable tool to considerably reduce nitrate leaching losses up to 36% compared to a broadcast fertilization. Accordingly, Waddell and Weil (2006) found that the fertilizer application in the upper portion of the ridge in corn cultivation led to lower N leaching losses and higher yields. Similar results were also reported by Clay et al. (1992), who found that N placement in the ridge tops reduced N movement, while N movement in furrows increased due to the surface runoff from the ridges. Reduced nitrate leaching by placing nitrate only in the elevated portion of the ridges was further confirmed by Hamlett et al. (1990).
The split application scenarios indicated that a small application of 20 kg NO3 ha-1 at the
beginning of the growing season followed by a high application rate of 80 kg NO3 ha-1 in the
crop development stage and again a smaller application rate of 50 kg NO3 ha-1 in the later
season has the potential to reduce nitrate leaching loss up to 59% compared to an one-top dressing at the beginning of the growing season. This was also proposed by Zhang et al. (1996), who stated that excessive fertilizer application should be prevented and more frequent, but smaller N applications during the rainy season with the additional use of slow-release fertilizer should help to maintain yield increase and minimize nitrate pollution of groundwater in northern China. Finally, the simulations verified the multiplicative effects of combined FBMPs on reduced nitrate leaching losses. The combination of plastic mulch, fertilizer placement restricted to ridges and split applications led to 82% reduction of cumulative nitrate leaching amount compared to uncovered ridge cultivation and one broadcast fertilization before the growing season.
These results have important economic and ecological implications. Firstly, farmers could benefit economically by application of FBMPs due to reduced costs for fertilizer inputs. Secondly, FBMPs could improve groundwater quality and might reduce environmental costs for amelioration of water quality and water purification caused by nitrate contamination. Especially in monsoon affected areas with sandy soils FBMPs should be considered to
Chapter 4 - Nitrate leaching
111
decrease groundwater pollution risk. Consequently, the local method of plastic mulched ridge cultivation in a flat terrain is a good step towards a sustainable management, which can be enhanced by additional FBMPs, when focusing solely on nitrate contamination of groundwater resources.
Nevertheless, a differentiated view of the tillage practice on ecological impacts in relation to topographical aspects is necessary. Other studies showed that plastic mulching in highland agriculture vegetable production on slopes, especially during monsoon periods, have also negative effects by substantially increasing surface runoff (Ruidisch et al., 2013, Arnhold, unpublished data), which causes high soil erosion rates and supports transport of nutrients, particularly particle-bounded phosphorous, via surface runoff into water bodies (Kim et al., 2001; Park et al., 2010). Surface runoff in plastic mulched potato cultivation on slopes was found to increase up to 65%, whereas drainage water was reduced by 16% compared to ridge tillage without plastic coverage (Ruidisch et al., 2013). Based on these findings, it was concluded that the application of perforated plastic mulch supports the advantages of reducing drainage water, controlling weeds and earlier plant emergence and concurrently diminishes the negative effects such as excessive surface runoff. In a flat terrain, an excessive runoff from fields to the river network is not expected. Moreover, water was observed to pond at the surface during monsoon events, when the infiltration capacity was exceeded, but percolated afterwards through the soil matrix and contributed to groundwater. This implicates that plastic mulching in a flat terrain can be recommended, especially in combination with FBMPs such as fertilizer placement in ridges and split applications. Indeed, FBMPs seems to be promising also for the dryland agricultural field on slopes, which makes up the largest part of the catchment.
The given FBMPs implicate that high nitrate rates remain below the plastic cover unless the nitrate was not taken up by the plants during the cropping season. However, in the course of harvesting, plastic mulched ridges are destroyed, so that the protective function of the cropping system is no longer present. This conditions result in a higher leaching risk after harvest, especially if the rain fall variability is taken into account. In the growing season 2010 several high rainfall events occurred in the middle to late September after harvest. A cover crop, which can benefit from the remaining nitrate in the soil, is another conceivably option, which would increase organic carbon content (Corg) for the following growing season and reduce concurrently the nitrate leaching and soil erosion risk after harvest.
Chapter 4 - Nitrate leaching
112
4.5. Conclusion
Excessive mineral fertilizer application in combination with extreme rain event during East-Asian summer monsoon plays a key role in leaching agrochemical contaminants to aquatic systems. In view of the fact that high fertilizer inputs coincide with high economical cost, but also cause negative ecological effects, a prior prevention of ecological damages or more specifically, the reduction of water quality degradation of groundwater and surface water bodies is therefore urgently needed.
The simulation results showed that ridge cultivation and plastic mulching of the ridges constitutes a valuable tool to decrease nitrate leaching in a flat terrain, where the precipitation contributes entirely to infiltration through the unsaturated zone. However, in hill side positions, ridge cultivation and plastic mulching can increase surface runoff, which supports the transport of agrochemicals via surface runoff directly into the rivers. Thus, topographical aspects should be considered when plastic mulched ridge cultivation is practiced.
Fertilizer best management practices (FBMPs) include an appropriate amount of total fertilizer input, right placement and right timing of fertilizer. The timing is important in regions affected by extreme rain events, when daily leaching amounts can be considerably high. Thus, FBMPs can help increase the nutrient use efficiency of the crops and concurrently decrease nitrate leaching below the root zone. Our study revealed that ridge cultivation with plastic mulch and ridge placement of reduced N fertilizer amounts in split applications in a 1-4-2.5 ratio of total N applied according to the plant development stages provide the best reduction in nitrate leaching losses for a sandy soil in a flat terrain. Combining those management practices will lead to economic benefits in terms of decreasing fertilizer inputs as well as ecological benefits by reducing substantially the risk of groundwater pollution. Acknowledgements This study was carried out as part of the International Research Training Group TERRECO (GRK 1565/1) funded by the Deutsche Forschungsgemeinschaft (DFG) at the University of Bayreuth, Germany and the Korean Research Foundation (KRF) at Kangwon National University, Chuncheon, S. Korea. We would like to thank especially Mr. Park und Mrs. Kwon for their excellent support.
Chapter 4 - Nitrate leaching
113
4.6. References
Allen, R., Pereira, L., Raes, D., Smith, M., 1998. Crop evapotranspiration - Guidelines for computing crop water requirements. FAO Irrigation and drainage paper 56, Rome.
Bargar, B., Swan, J.B., Jaynes, D., 1999. Soil water recharge under uncropped ridges and furrows. Soil Science Society of America Journal 63, 1290–1299.
Bear, J., 1972. Dynamics of Fluids in Porous Media. American Elsevier, New York. Benjamin, J.G., Porter, L.K., Duke, H.R., Ahuja, L.R., Butters, G., 1998. Nitrogen movement with
furrow irrigation method and fertilizer band placement. Soil Science Society of America Journal 62, 1103–1108.
Böhlke, J.-K., 2002. Groundwater recharge and agricultural contamination. Hydrogeology Journal 10, 153–179.
Cannington, F., Duggings, R.B., Roan, R.G., 1975. Florida vegetable production using plastic film mulch with drip irrigation. Proc. 12th Natl. Agr. Plastics Congr. p. 11-15. Choi, W.-J., Han, G.-H., Lee, S.-M., Lee, G.-T., Yoon, K.-S., Choi, S.-M., Ro, H.-M., 2007. Impact of
land-use types on nitrate concentration and delta N-15 in unconfined groundwater in rural areas of Korea. Agriculture, Ecosystems & Environment 120, 259–268.
Clay, S., Clay, D., Koskinen, W., Malzer, G., 1992. Agrichemical placement impacts on alachlor and nitrate movement through soil in a ridge tilled system. Journal of Environmental B27, 125–138.
Danielopol, D.L., Griebler, C., Gunatilaka, A., Notenboom, J., 2003. Present state and future prospects for groundwater ecosystems. Environmental Conservation 30, 104–130.
Doherty, J., 2005. PEST Model- independent Parameter Estimation: User manual: 5th Edition. Watermark Numerical Computing.
Gelhar, L.W., Mantoglou, A., Welty, C., Rehfeldt, K.R., 1985. A review of field-scale physical solute transport processes in saturated and unsaturated porous media: Research Project 2485-5, Final Report, Cambridge Massachusetts.
Grossmann, J., Udluft, P., 1991. The extraction of soil water by suction-cup method: a review. Journal of Soil Science 42, 83-93.
Hamlett, J.M., Baker, J.L., Horton, R., 1990. Water and anion movement under ridge tillage - A field-study. Transactions of the American Society of Agricultural Engineers 33, 1859–1866.
IUSS Working Group WRB, 2006. World reference base for soil resources 2006. A framework for international classification, correlation and communication. World Soil Resources Reports No. 103, FAO, Rome. Jaynes, D.B., Swan, J.B., 1999. Solute movement in uncropped ridge-tilled soil under natural rainfall.
Soil Science Society of America Journal 63, 264–269. Kettering, J., Park, J.-H., Lindner, S., Lee, B., Tenhunen, J., Kuzyakov, Y., 2012. N fluxes in an
agricultural catchment under monsoon climate: A budget approach at different scales. Agriculture, Ecosystems & Environment 161, 101–111.
Kettering, J., Ruidisch, M., Gaviria, C., Ok, Y.-S., Kuzyakov, Y., 2013. Fate of fertilizer 15N in intensive ridge cultivation with plastic mulching under a monsoon climate. Nutrient Cycling Agroecosystems 95, 57-72.
Kim, B., Park, J.-H., Hwang, G., Jun, M.-S., Choi, K., 2001. Eutrophication of reservoirs in South Korea. Limnology 2, 223–229.
Koh, D.-C., Ko, K.-S., Kim, Y., Lee, S.-G., Chang, H.-W., 2007. Effect of agricultural land use on the chemistry of groundwater from basaltic aquifers, Jeju Island, South Korea. Hydrogeology Journal 15, 727-743.
Koh, D.-C., Chae, G.-T., Yoon, Y.-Y., Kang, B.-R., Koh, G.-W., Park, K.-H., 2009. Baseline geochemical characteristics of groundwater in the mountainous area of Jeju Island, South Korea: Implications for degree of mineralization and nitrate contamination. Journal of Hydrology 376, 81-93.
Kristensen, K., Jensen, S., 1975. A model for estimating actual evapotranspiration from potential evapotranspiration. Nordic Hydrology 6, 170–188.
Chapter 4 - Nitrate leaching
114
Lament, W.J., 1993. Plastic Mulches for the Production of Vegetable Crops. HortTechnology 3, 35–39.
Leistra, M., Boesten, J.J.T.I., 2010. Pesticide Leaching from Agricultural Fields with Ridges and Furrows. Water Air and Soil Pollution 213, 341–352.
Liu, G.D., Wu, W.L., Zhang, J., 2005. Regional differentiation of non-point source pollution of agriculture-derived nitrate nitrogen in groundwater in northern China. Agriculture, Ecosystems & Environment 107, 211–220.
Locascio, S.J., Fiskell, J.G. A., Graetz, D.A., Hawk, R.D., 1985. Nitrogen accumulation by peppers as influenced by mulch and time of fertilizer application. Journal of the American Society for Horticultural Science 110, 325–328.
Matson, P.A., Parton, W.J., Power, A.G., Swift, M.J., 1997. Agricultural Intensification and Ecosystem Properties. Science 277, 504–509.
Min, J.H., Yun, S.T., Kim, K., Kim, H.S., Hahn, J., Lee, S.M., 2002. Nitrate contamination of alluvial groundwaters in the Nakdong river basin, Korea. Geosciences Journal 6, 35-46.
Moriasi, D.N., Arnold, J.G., Van Liew, M.W., Bingner, R.L., Harmel, R.D., Veith, T.L., 2007. Model evaluation guidelines for systematic quantification of accuracy in watershed simulations. Transactions of the ASABE 50, 885-900.
Ongley, E.D., 1996. Control of water pollution from agriculture: FAO Irrigation and Drainage Paper 55, Rome, Italy.
Park, J.-H., Duan, L., Kim, B., Mitchell, M.J., Shibata, H., 2010. Potential effects of climate change and variability on watershed biogeochemical processes and water quality in Northeast Asia. Environmental International 36, 212–225.
Pickens, J.F., Grisak, G.E., 1981. Scale-dependent dispersion in a stratified granular aquifer. Water Resource Research 17, 1191–1211.
Rausch, R., Schäfer, W., Therrien, R., Wagner, C., 2005. Solute transport modeling: An Introduction to Models and Solution Strategies. Gebr. Borntraeger, Berlin, Stuttgart.
Ruidisch, M., Kettering, J., Arnhold, S., Huwe, B., 2013. Modeling water flow in a plastic mulched ridge cultivation system on hillslopes affected by South Korean summer monsoon. Agricultural Water Management 116, 204-217.
Schaap, M.G., Leij, F.J., van Genuchten, M.T., 2001. ROSETTA: a computer program for estimating soil hydraulic parameters with hierarchical pedotransfer functions. Journal of Hydrology 251, 163–176.
Spiertz, J.H.J., 2010. Nitrogen, sustainable agriculture and food security. A review. Agronomy for Sustainable Development 30, 43-55.
Therrien, R., McLaren, R., Sudicky, E., Panday, S., 2010. HydroGeoSphere: A Three-dimensional Numerical Model Describing Fully-integrated Subsurface and Surface Flow and Solute Transport. Draft. Groundwater Simulations Group. Waterloo, Canada.
Tilman, D., Cassman, K.G., Matson, P.A., Naylor, R., Polasky, S., 2002. Agricultural sustainability and intensive production practices. Nature 418, 671–677.
Waddell, J.T., Weil, R.R., 2006. Effects of fertilizer placement on solute leaching under ridge tillage and no tillage. Soil & Tillage Research 90, 194–204.
Wallace, A., 1994. High-Precision agriculture is an excellent tool for conservation of natural resources. Communications in Soil Science and Plant Analysis 25, 45–49.
Zhang, W.L., Tian, Z.X., Zhang, N., Li, X.Q., 1996. Nitrate pollution of groundwater in northern China. Agriculture, Ecosystems & Environment 59, 223–231.
Appendix
115
Appendix
List of other publications
Arnhold, S., Ruidisch, M., Bartsch, S., Shope, C.L., Huwe, B., 2013. Simulation of runoff patterns and soil erosion on mountainous farmland with and without plastic covered ridge-furrow cultivation in South Korea. Transactions of the ASABE 56 (22), 667-679.
Jeong, J., Bartsch, S., Fleckenstein, J.H., Matzner, E., Tenhunen, J., Lee, S.D., Park, S.K.,
Park, J.H., 2012. Differential storm responses of dissolved and particulate organic carbon in a mountainous headwater stream, investigated by high-frequency, in situ optical measurements. Journal of Geophysical Research 117 (G3), G03013.
Shope, C.L., Bartsch, S., Kim, K., Kim, B., Tenhunen, J., Peiffer, S., Park, J.H., Ok, Y.S.,
Fleckenstein, J.H., Köllner, T., 2013. A weighted, multi-method approach for accurate basin-wide streamflow estimation in an ungauged watershed. Journal of Hydrology 494, 72-82.

116
Appendix
117
Declaration / Erklärung
Erklärungen zur Promotionsarbeit: „Monsoonal affected dynamics of nitrate and dissolved organic carbon in a mountainous catchment under intensive land-use“, eingereicht von Frau Svenja Bartsch geboren am 02.01.1981. Hiermit erkläre ich, dass ich die vorliegende Promotionsarbeit selbständig verfasst und keine anderen als die angegebenen Quellen und Hilfsmittel benutzt habe. Bonn, 24.01.2014
Svenja Bartsch Hiermit erkläre ich, dass ich nicht bereits anderweitig versucht habe, diese Dissertation ohne Erfolg einzureichen oder mich einer Doktorprüfung zu unterziehen.
Bonn, 24.01.2014
Svenja Bartsch Hiermit erkläre ich, dass ich die Hilfe von gewerblichen Promotionsberatern bzw. -vermittlern weder bisher in Anspruch genommen habe, noch künftig in Anspruch nehmen werde.
Bonn, 24.01.2014
Svenja Bartsch
Related Documents


