IOP PUBLISHING PHYSICS IN MEDICINE AND BIOLOGY Phys. Med. Biol. 54 (2009) 1893–1908 doi:10.1088/0031-9155/54/7/003 Monolithic scintillator PET detectors with intrinsic depth-of-interaction correction Marnix C Maas 1 , Dennis R Schaart 1 , D J (Jan) van der Laan 1 , Peter Bruyndonckx 2 , Cedric Lemaˆ ıtre 2 , Freek J Beekman 1,3 and Carel W E van Eijk 1 1 Delft University of Technology, Mekelweg 15, 2629 JB Delft, The Netherlands 2 Vrije Universiteit Brussel, Pleinlaan 2, 1050 Brussels, Belgium 3 University Medical Centre Utrecht, Heidelberglaan 100, Utrecht, The Netherlands E-mail: [email protected] Received 12 October 2008, in final form 6 February 2009 Published 5 March 2009 Online at stacks.iop.org/PMB/54/1893 Abstract We developed positron emission tomography (PET) detectors based on monolithic scintillation crystals and position-sensitive light sensors. Intrinsic depth-of-interaction (DOI) correction is achieved by deriving the entry points of annihilation photons on the front surface of the crystal from the light sensor signals. Here we characterize the next generation of these detectors, consisting of a 20 mm thick rectangular or trapezoidal LYSO:Ce crystal read out on the front and the back (double-sided readout, DSR) by Hamamatsu S8550SPL avalanche photodiode (APD) arrays optimized for DSR. The full width at half maximum (FWHM) of the detector point-spread function (PSF) obtained with a rectangular crystal at normal incidence equals ∼1.05 mm at the detector centre, after correction for the ∼0.9 mm diameter test beam of annihilation photons. Resolution losses of several tenths of a mm occur near the crystal edges. Furthermore, trapezoidal crystals perform almost equally well as rectangular ones, while improving system sensitivity. Due to the highly accurate DOI correction of all detectors, the spatial resolution remains essentially constant for angles of incidence of up to at least 30 ◦ . Energy resolutions of ∼11% FWHM are measured, with a fraction of events of up to 75% in the full-energy peak. The coincidence timing resolution is estimated to be 2.8 ns FWHM. The good spatial, energy and timing resolutions, together with the excellent DOI correction and high detection efficiency of our detectors, are expected to facilitate high and uniform PET system resolution. (Some figures in this article are in colour only in the electronic version) 0031-9155/09/071893+16$30.00 © 2009 Institute of Physics and Engineering in Medicine Printed in the UK 1893

Welcome message from author
This document is posted to help you gain knowledge. Please leave a comment to let me know what you think about it! Share it to your friends and learn new things together.
Transcript
IOP PUBLISHING PHYSICS IN MEDICINE AND BIOLOGY
Phys. Med. Biol. 54 (2009) 1893–1908 doi:10.1088/0031-9155/54/7/003
Monolithic scintillator PET detectors with intrinsicdepth-of-interaction correction
Marnix C Maas1, Dennis R Schaart1, D J (Jan) van der Laan1,Peter Bruyndonckx2, Cedric Lemaıtre2, Freek J Beekman1,3 andCarel W E van Eijk1
1 Delft University of Technology, Mekelweg 15, 2629 JB Delft, The Netherlands2 Vrije Universiteit Brussel, Pleinlaan 2, 1050 Brussels, Belgium3 University Medical Centre Utrecht, Heidelberglaan 100, Utrecht, The Netherlands
E-mail: [email protected]
Received 12 October 2008, in final form 6 February 2009Published 5 March 2009Online at stacks.iop.org/PMB/54/1893
AbstractWe developed positron emission tomography (PET) detectors based onmonolithic scintillation crystals and position-sensitive light sensors. Intrinsicdepth-of-interaction (DOI) correction is achieved by deriving the entry pointsof annihilation photons on the front surface of the crystal from the light sensorsignals. Here we characterize the next generation of these detectors, consistingof a 20 mm thick rectangular or trapezoidal LYSO:Ce crystal read out on thefront and the back (double-sided readout, DSR) by Hamamatsu S8550SPLavalanche photodiode (APD) arrays optimized for DSR. The full width at halfmaximum (FWHM) of the detector point-spread function (PSF) obtained with arectangular crystal at normal incidence equals !1.05 mm at the detector centre,after correction for the !0.9 mm diameter test beam of annihilation photons.Resolution losses of several tenths of a mm occur near the crystal edges.Furthermore, trapezoidal crystals perform almost equally well as rectangularones, while improving system sensitivity. Due to the highly accurate DOIcorrection of all detectors, the spatial resolution remains essentially constantfor angles of incidence of up to at least 30". Energy resolutions of !11%FWHM are measured, with a fraction of events of up to 75% in the full-energypeak. The coincidence timing resolution is estimated to be 2.8 ns FWHM.The good spatial, energy and timing resolutions, together with the excellentDOI correction and high detection efficiency of our detectors, are expected tofacilitate high and uniform PET system resolution.
(Some figures in this article are in colour only in the electronic version)
0031-9155/09/071893+16$30.00 © 2009 Institute of Physics and Engineering in Medicine Printed in the UK 1893

1894 M C Maas et al
1. Introduction
To address the need for improved image quality in preclinical and clinical molecular imaging,various new scintillation detectors for positron emission tomography (PET) have recently beenproposed. Many PET applications benefit from enhanced system resolution, and much efforthas therefore been spent on improving detector spatial resolution.
An important cause for resolution loss is the varying depth of interaction (DOI) ofannihilation quanta within the scintillation crystals. The resulting parallax errors cause a non-uniformly degraded system resolution. Therefore, it is desirable that a PET detector offerssome form of DOI correction. In addition, good energy and timing resolutions as well ashigh detection efficiency are crucial to obtain high image quality. The relative importance ofeach of these performance parameters depends on the specific application and subject size.In small-animal systems for example, image quality is very much determined by the detectorspatial resolution and DOI effects. In clinical applications, image quality suffers from intra-patient scatter and random coincidences, the effects of which can be reduced if the detectorshave good energy and timing resolutions.
Many high-resolution PET detector designs rely on relatively long (!1 cm), thin(!1 mm) scintillation crystals (Lecomte et al 1996, Bloomfield et al 1997, Del Guerraet al 1998, Correia et al 1999, Weber et al 1999, Surti et al 2003, Tai et al 2003, 2005).Although such designs aim to improve resolution by reducing or eliminating light spreading,their performance is still limited by inter-crystal scattering. Furthermore, the reflective materialbetween the crystals increases the fraction of dead space. Finally, without DOI determination,one needs to compromise between high system resolution (shorter crystals to prevent excessiveDOI errors) and sensitivity (longer crystals to improve the detection efficiency).
Other groups have therefore developed (non-monolithic) detectors with DOIdetermination. The approaches taken include estimating the DOI from the ratio of the signalsmeasured at opposite sides of the crystal (Wang et al 2004, Abreu et al 2006, Du et al2008), phoswhich approaches (Seidel et al 2003, Ziemons et al 2005), multi-layer pixelatedscintillators with optical DOI encoding (Orita et al 2005) and radial stacks of individualdetector modules (McElroy et al 2005). In these designs, the benefit of DOI information isoften gained at the expense of other performance parameters. Light losses due to the useof small (pixelated) crystals result in energy resolutions >20% in most and >40% in somedesigns. In addition, the dead space between detector modules and crystal elements decreasesthe system sensitivity. Furthermore, the manufacturing costs of designs based on many smallcrystals tend to increase with decreasing crystal cross-section.
Detectors with monolithic scintillators coupled to one or more position-sensitive lightsensors can offer a solution to the above issues (Clement et al 1998, Bruyndonckx et al 2003).In these detectors, the entry point of an annihilation photon on the front surface of the crystalcan be derived from the measured light distribution, for example using a statistical nearest-neighbour algorithm. By deriving the entry point, the depth of interaction is intrinsicallycorrected for. At the same time, detection efficiency is maximized as there is no deadspace within a monolithic crystal. Moreover, when compact, solid-state light sensors such asavalanche photodiode (APD) arrays are used instead of bulky photomultiplier tubes (PMTs),the detectors can be placed closely together to optimize scanner sensitivity. As an addedadvantage, the use of solid-state light sensors opens up the possibility of integrating the PETsystem with a magnetic resonance imaging (MRI) device (e.g. Catana et al 2006, Judenhoferet al 2008, Woody et al 2007).
Preliminary results obtained with early monolithic scintillator detector prototypes havebeen reported previously (Maas et al 2006). These indicated that 10 mm thick monolithic
Monolithic scintillator PET detectors with intrinsic depth-of-interaction correction 1895
(b)(a)
19.515.4
11.2
20LYSO
APD array
APD array
20
20
10
LYSO
APD array
APD array
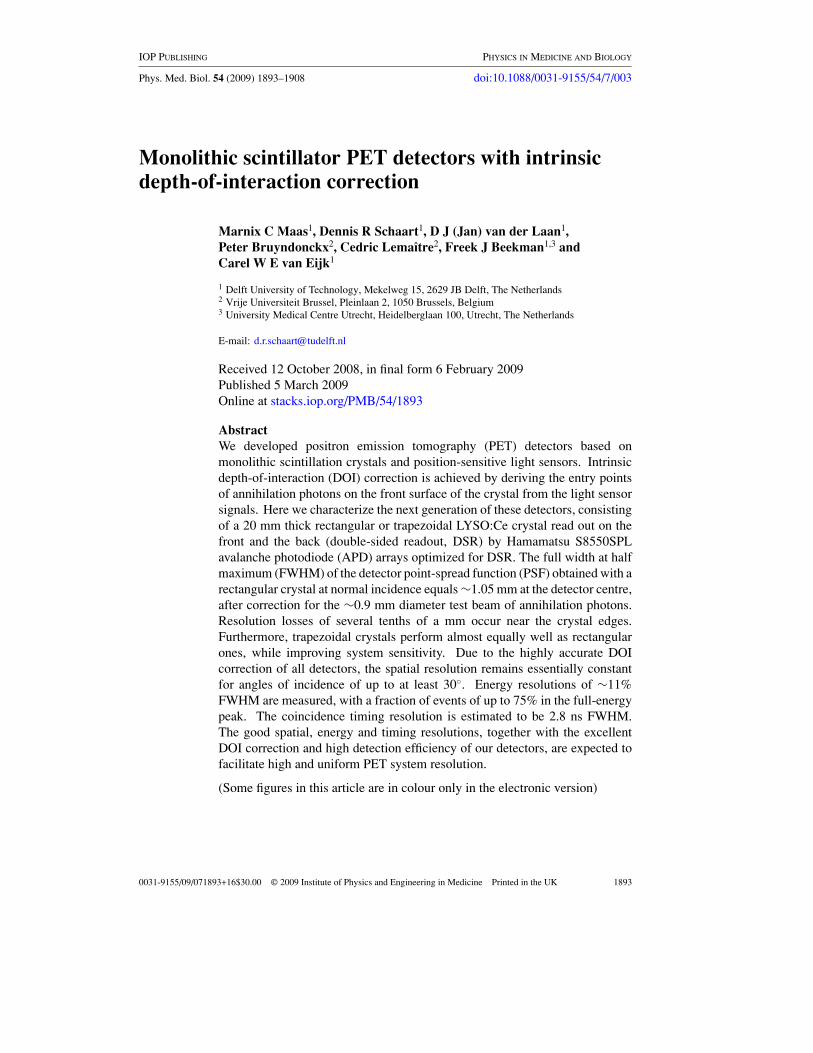
Figure 1. Schematic representation of the trapezoidal (a) and rectangular (b) detector geometrieswith double-sided APD array readout. In both drawings, the arrow indicates the path of anannihilation photon incident on the front surface of the detector. The coordinate system used tospecify the entry point and angle of incidence is also indicated. Dimensions are in mm.
LYSO:Ce crystals perform better with the light sensor placed on the front surface (front-side readout, FSR) than with conventional backside readout (BSR), since the majority of thedetected annihilation photons interact in the front half of the crystal. The same study indicatedthat 20 mm thick monolithic crystals read out on both the front and back surfaces (double-sided readout, DSR) may offer similarly good spatial resolution as 10 mm thick crystals withFSR, with the added benefit of significantly increased detection efficiency. It is emphasizedthat unconventional readout geometries such as FSR and DSR are made possible by thefact that solid-state light sensors such as APD arrays are essentially transparent to 511 keVphotons.
The present study aims to further explore the benefits of double-sided readout. We fullycharacterize the performance of the next generation of monolithic detectors, read out by twoHamamatsu S8550SPL APD arrays in DSR geometry. This APD array, based on the commonlyavailable S8550 array, is a customized product optimized specifically for FSR and DSR (Abreuet al 2006). The performance obtained with 20 mm thick rectangular and trapezoidal LYSO:Cecrystals is compared. Especially in small-bore, high-resolution systems, trapezoidal crystalssignificantly improve system sensitivity by minimizing the dead space within a detector ring(van der Laan et al 2007).
For the first time, the two-dimensional (2D) detector point-spread function (PSF) of ourdetectors is reported. We furthermore use a new method to correct the measured PSF for theinfluence of the finite test beam diameter, in order to estimate the detector PSF applicable toindividual annihilation photons. In addition, the intrinsic DOI correction of the detectors isstudied in detail by varying the angle of incidence in different directions. Finally, the energyand timing resolutions of the detectors are reported.
2. Materials and methods
2.1. Detector hardware
Each detector consists of a 20 mm thick monolithic LYSO:Ce crystal (Crystal Photonics) andtwo position-sensitive Hamamatsu S8550SPL APD arrays in DSR geometry, as indicated infigure 1. The crystal dimensions are indicated in the same figure. The APD arrays are optically

1896 M C Maas et al
coupled to the front and back crystal surfaces using Meltmount (Cargille Laboratories, CedarGrove, NJ, USA). The side surfaces are wrapped in highly reflective Teflon tape.
The performance of trapezoidal crystals (see figure 1(a)), designed for a ring of32 detectors with an inner diameter of 123.8 mm, is compared to a rectangular crystal(figure 1(b)) that was selected for its good performance in preliminary studies. Trapezoidalcrystals with polished and unpolished (as-cut) surfaces are compared. Crystals are identifiedby a code consisting of, respectively, a character indicating the crystal geometry (‘R’ forrectangular, ‘T’ for trapezoidal), a sample number, and either the character ‘P’ for opticallypolished crystals or ‘A’ for crystals that received no surface treatment after cutting.
The Hamamatsu S8550SPL is a customized version of the commonly available S8550array. Both are 4 # 8 arrays of 1.6 # 1.6 mm2 pixels at a pitch of 2.3 mm, subdivided intotwo banks of 2 # 8 pixels with a common cathode per bank. In the S8550SPL, the length ofthe metal readout pins on the back of the device has been reduced from 4.57 mm to 2.60 mm,minimizing the amount of material between radiation source and crystal if the array is placedon the crystal front surface, as in FSR and DSR geometries (Abreu et al 2006). Furthermore,the protective epoxy resin coating on the photosensitive surface is thinner (0.45 mm instead of0.60 mm) and has been polished to a flatness of ±10 µm to facilitate good optical coupling tothe crystal. Finally, the dark currents of the arrays used here (serial numbers 036 and 037) arean estimated factor of 2 lower than those of the S8550 arrays used in our previous experiments(Maas et al 2006), resulting in better detector performance (Maas et al 2008).
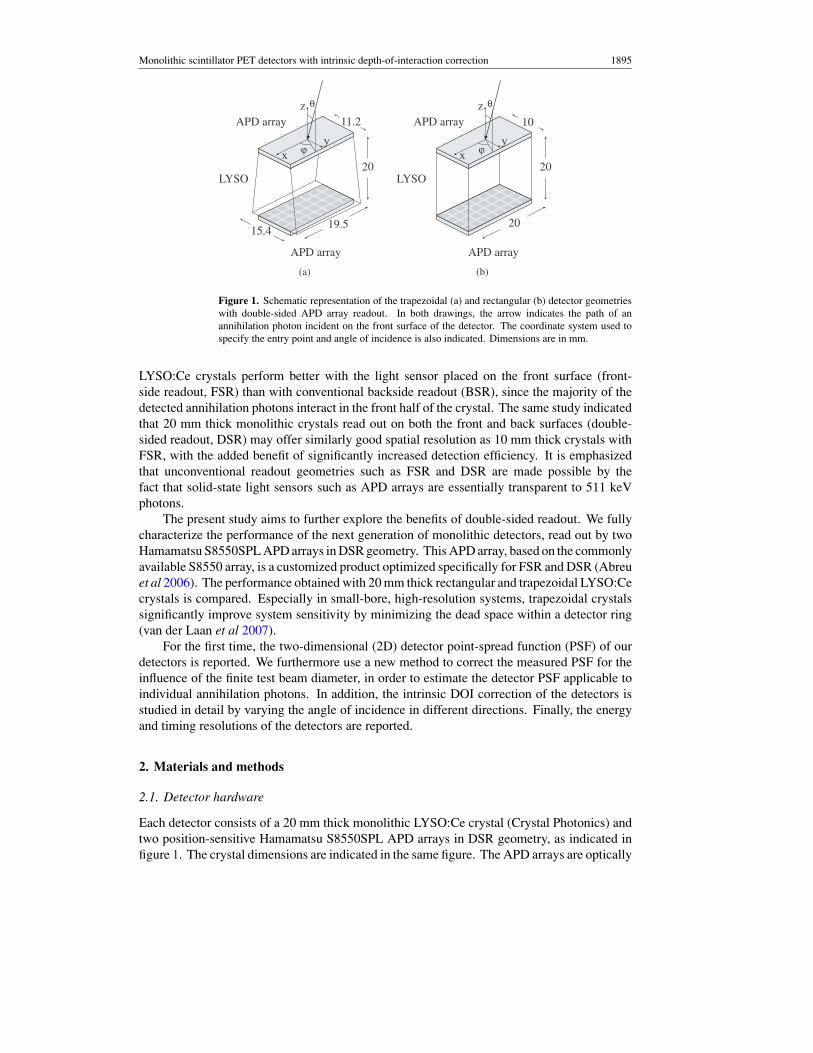
For each of the two pixel banks within an array, the manufacturer specifies the bias voltageV50 (typically !400 V) at which the APD gain M = 50. Differences in V50 of up to !20 Vare common between banks within the same array and between different arrays. We thereforeexpress the bias voltage per bank in terms of
!V $ V % V50, (1)where V is the applied bias voltage. Figure 2 shows the average APD gains per bank of theAPD arrays used, measured as a function of !V with 5.89 keV x-rays from a 55Fe source. Ifall banks are biased at the same value of !V, their average gains coincide within !4% overthe range of bias voltages considered. Furthermore, gain variations on the order of !10% arecommonly observed between individual APD pixels within one bank. It has been confirmedin preliminary experiments that this does not influence the detector spatial resolution, asthe position estimation (section 2.3) is based on reference data measured at the same gaindistribution. The effect on the detector energy resolution also appeared to be negligible(<0.1% FWHM). No corrections for gain non-uniformities have therefore been applied in thiswork.
2.2. Intrinsic DOI correction
In the absence of scattering, the path of a gamma-photon can be described by the coordinates atwhich it intersects the front surface of the detector (the ‘entry point’) and its angle of incidence,see figure 1. In the present detector concept, the entry point of each detected annihilationphoton (event) is estimated from the distribution of the scintillation light measured by theposition-sensitive light sensors. This is done by means of a statistical algorithm that usessets of reference data containing the measured light distributions of a large number of eventsrecorded at known entry points, with each reference set corresponding to a particular angle ofincidence. In a PET system, the angle of incidence can be derived from the positions of thetwo detectors triggering in coincidence (Bruyndonckx et al 2004). Estimating the entry pointrather than the point of interaction within the crystal has the advantage of eliminating parallaxerrors, even though the depth of interaction is not explicitly determined.
Monolithic scintillator PET detectors with intrinsic depth-of-interaction correction 1897
0 101020
20
30
30
40
40
50
60
70
80
!V (V)
Array 036 bnk1, V50
= 402 V
Array 036 bnk2, V50
= 410 V
Array 037 bnk1, V50
= 398 V
Array 037 bnk2, V50
= 393 V
" " " "
aver
age
AP
D X
"ray
gai
n
Figure 2. Average APD gains of each 2 # 8 pixel bank of the Hamamatsu S8550SPL arrays(serial numbers 036 and 037) as a function of !V (see equation (1)), measured with 5.89 keV x-rayphotons directly incident on the APDs.
2.3. Position estimation
Reference data are collected by irradiating the detector with 511 keV photons at a seriesof known positions &xi = (xi, yi), see figure 1, and recording the light distributions of nref
reference events at each position. This is repeated for various angles of incidence. The lightdistribution of each event in the reference set is subsequently normalized such that the sum ofall detector signals equals unity.
The entry point of an unknown annihilation photon can now be estimated by calculatingthe sum-of-squares difference of its normalized light distribution with those of all events inthe reference set recorded at the appropriate angle of incidence. A subset of the referencedata consisting of the L closest matches (‘nearest neighbours’) is selected, and the mostfrequently occurring entry point within this subset is assigned to the unknown event. Thismethod is known as the L-nearest neighbour method. It has the advantage that the probabilityof misclassification approaches the theoretical minimum, the Bayes error probability, forsufficiently large reference sets (Cover and Hart 1967). The algorithm can therefore beexpected to yield results close to the best achievable with the available reference data, providedthat a suitable value of L be used. A method for finding this value has been described elsewhere(Maas et al 2006).
2.4. Measurement setup
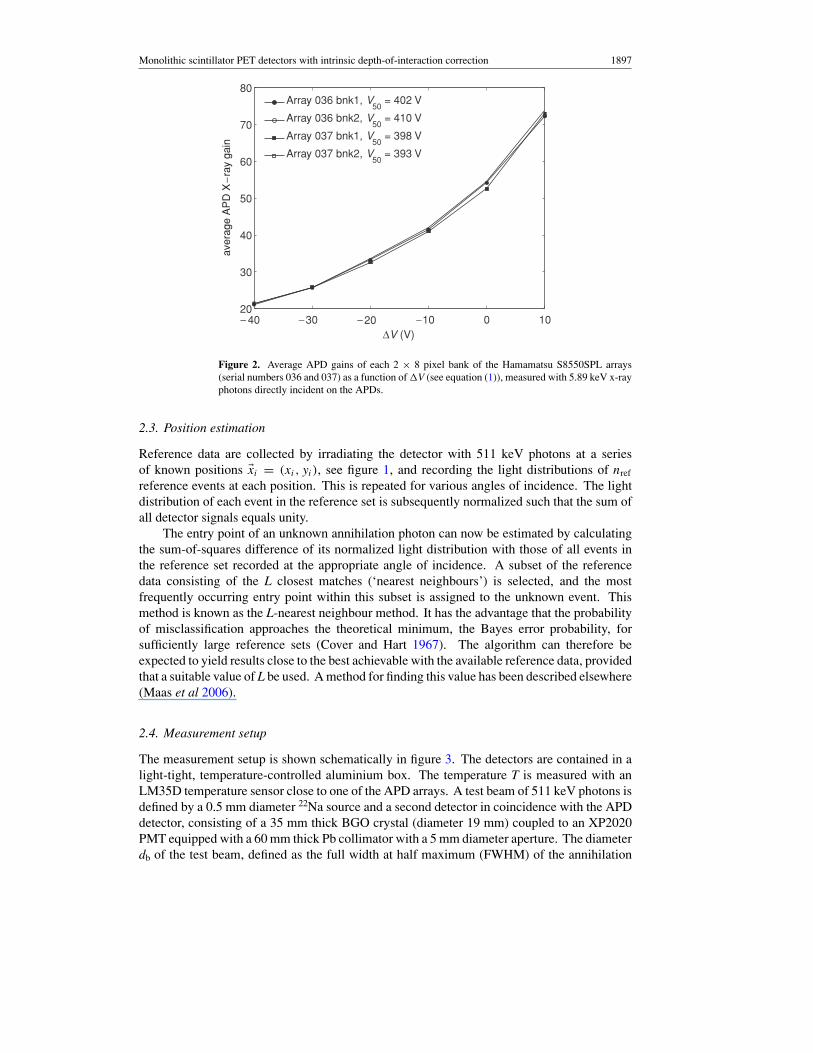
The measurement setup is shown schematically in figure 3. The detectors are contained in alight-tight, temperature-controlled aluminium box. The temperature T is measured with anLM35D temperature sensor close to one of the APD arrays. A test beam of 511 keV photons isdefined by a 0.5 mm diameter 22Na source and a second detector in coincidence with the APDdetector, consisting of a 35 mm thick BGO crystal (diameter 19 mm) coupled to an XP2020PMT equipped with a 60 mm thick Pb collimator with a 5 mm diameter aperture. The diameterdb of the test beam, defined as the full width at half maximum (FWHM) of the annihilation
1898 M C Maas et al
BGO/BaF2
Collimator PMTAPDs
Sourceholder
Crystal
MotorizedXZ #-Stage
Preamplifiers
22Na-source
Rail
ZX
#
Figure 3. Schematic representation of the setup used for the experimental characterization of thedetectors.
TFA
slow
fastHV
SACSP
fast
SA slow
gate
MC-ADC
CFD
CFDPMT
ADC
CC
gate
APD
HV
CSPAPD
$$
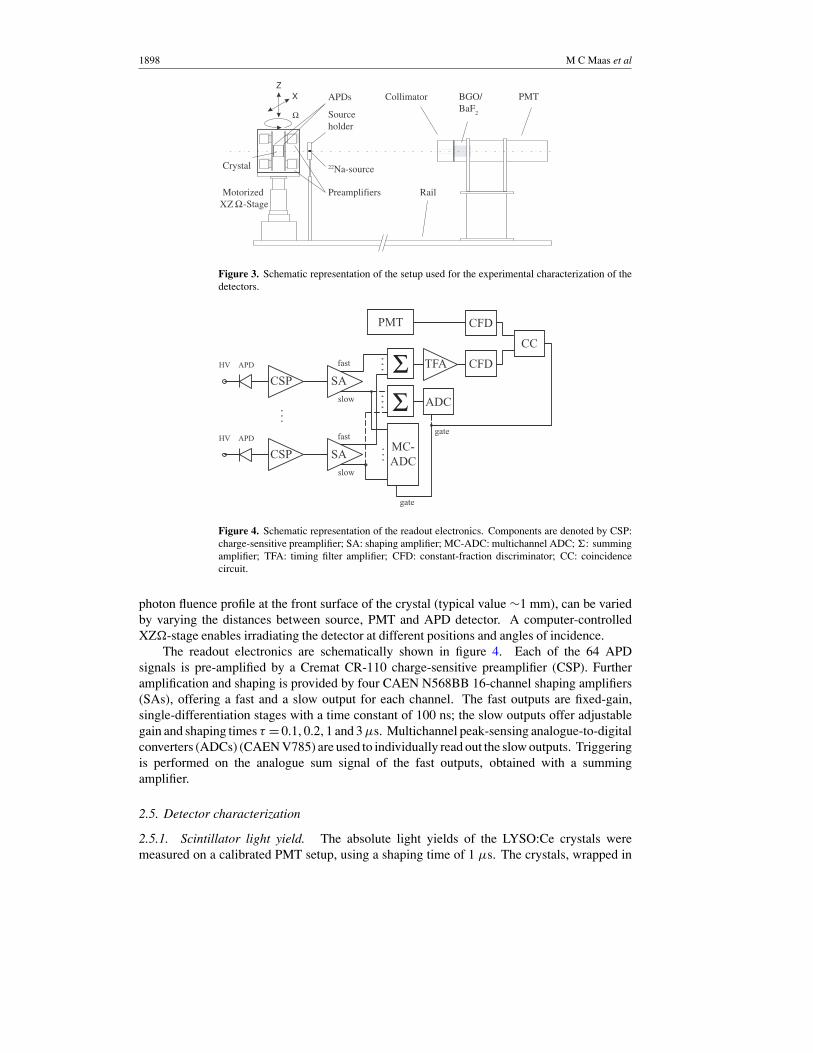
Figure 4. Schematic representation of the readout electronics. Components are denoted by CSP:charge-sensitive preamplifier; SA: shaping amplifier; MC-ADC: multichannel ADC; ": summingamplifier; TFA: timing filter amplifier; CFD: constant-fraction discriminator; CC: coincidencecircuit.
photon fluence profile at the front surface of the crystal (typical value !1 mm), can be variedby varying the distances between source, PMT and APD detector. A computer-controlledXZ#-stage enables irradiating the detector at different positions and angles of incidence.
The readout electronics are schematically shown in figure 4. Each of the 64 APDsignals is pre-amplified by a Cremat CR-110 charge-sensitive preamplifier (CSP). Furtheramplification and shaping is provided by four CAEN N568BB 16-channel shaping amplifiers(SAs), offering a fast and a slow output for each channel. The fast outputs are fixed-gain,single-differentiation stages with a time constant of 100 ns; the slow outputs offer adjustablegain and shaping times $ = 0.1, 0.2, 1 and 3 µs. Multichannel peak-sensing analogue-to-digitalconverters (ADCs) (CAEN V785) are used to individually read out the slow outputs. Triggeringis performed on the analogue sum signal of the fast outputs, obtained with a summingamplifier.
2.5. Detector characterization
2.5.1. Scintillator light yield. The absolute light yields of the LYSO:Ce crystals weremeasured on a calibrated PMT setup, using a shaping time of 1 µs. The crystals, wrapped in

Monolithic scintillator PET detectors with intrinsic depth-of-interaction correction 1899
Teflon tape, were irradiated with 662 keV photons from a 137Cs source, and the photoelectronyield was obtained by comparison of the position of the full-energy peak with the single-electron spectrum. Absolute light yields were calculated by correcting for the effective PMTreflectivity and quantum efficiency (de Haas et al 2005).
2.5.2. Detector energy resolution. The energy resolutions of the assembled detectorswere determined by irradiating them with a !5 mm diameter beam of 511 keV photonsaimed at the detector centre. Pulse height spectra were measured by connecting the CAENN568BB slow outputs via a summing amplifier to an Ortec AD413 A peak-sensing ADC, seefigure 4. FWHM energy resolutions were obtained by fitting the full-energy peaks withGaussians. All energy resolution measurements were performed at !V = 0 V, $ = 0.2 µs andat temperatures between T = 21.6 "C and T = 25.2 "C with temperature variations of less than±0.2 "C during each measurement.
2.5.3. Timing resolution. The detector timing resolution was measured against a 25.4 mmthick BaF2 crystal (diameter 25.4 mm) coupled to an XP2020Q PMT. The PMT signal wasdirectly fed into an Ortec 934 constant fraction discriminator (CFD). Time pickoff on theAPD detector was performed by connecting the CAEN N568BB fast outputs via a summingamplifier and an Ortec 454 timing filter amplifier (TFA) with adjustable differentiation andintegration time constants to an Ortec 934 CFD, see figure 4. An integration time constant of2 ns was used, while the differentiation time constant was set to ‘out’. The timing spectrum wasrecorded using an Ortec 476 time-to-amplitude converter (TAC) and an Ortec AD413A peak-sensing ADC. The time axis was calibrated with an Ortec 462 time calibrator. The FWHMtiming resolution was obtained by fitting the spectrum with a Gaussian. The measurementwas performed at !V = 19 V, Eth ' 250 keV and T = 24.3 ± 0.2 "C.
2.5.4. Spatial resolution measurements. To determine the detector PSF, reference data werefirst collected by irradiating the crystal front surface at a rectangular grid of equidistant beampositions &xi = (xi, yi) and recording a number of nref events at each beam position (thecoordinate system is indicated in figure 1). The PSF in a test position &xt chosen from thepositions &xi was then estimated as follows. An event j recorded at &xt was selected as atest event and its position was estimated with the nearest-neighbour procedure described insection 2.3, using the remaining nref % 1 events recorded at &xt, as well as all events collectedat all other positions &xi (= &xt, as reference data. This procedure was repeated for all of thenref events recorded at &xt (leave-one-out approach). The normalized, two-dimensional (2D)histogram of the errors !&xj = &xj % &xt, where &xj is the estimated position of the jth eventrecorded at &xt, then approaches the point-spread function PSF(x, y) at &xt if the number of testevents is sufficiently large. As the PSF can be determined at any of the beam positions &xi , thisprocedure was also used to e.g. study the FWHM of the PSF as a function of entry positionand to derive the average FWHM over the detector surface.
It is to be noted that the measured histogram still includes the influence of the test beamdiameter db (!1 mm FWHM, see section 2.4). In the remainder of this work, the measuredresult will therefore be denoted as the uncorrected point-spread function PSFb(x, y), or, briefly,PSFb, to distinguish it from the corrected result that will be written without the subscript ‘b’(see section 2.5.5).
We studied the influence of various parameters (such as the crystal type, the angle ofincidence, etc) on the spatial resolution, by varying the parameter of interest in a series ofmeasurements. For efficiency, this was done in a one-dimensional (1D) form of the above
1900 M C Maas et al
experiment, in which reference data were collected only along one of the crystal axes (seefigure 1) and only the coordinate corresponding to that axis was taken into consideration.Specifically, data were collected at e.g. &xi = (xi, y = 0); see figure 1 for the coordinatesystem used. The x-coordinates of the events recorded at test position &xt = (xt, y = 0)
were estimated, and a normalized 1D histogram of the errors !xj = xj % xt was derived.This histogram will be referred to as the one-dimensional point-spread function 1D-PSFb(x),where the subscript ‘b’ again indicates that the result still includes the influence of the beamdiameter. It is emphasized that 1D-PSFb(x) is not equivalent to the cross-section at y = 0of the two-dimensional PSFb(x, y), and that results from 1D and 2D measurements are notdirectly comparable.
All spatial resolution measurements were performed with the setup described insection 2.4. The distance between the beam positions in the x- and/or the y-direction (asapplicable) was kept at 0.25 mm in all cases. A number of nref = 1500 events were recordedper beam position in 1D PSF measurements. This value has previously been shown sufficientfor good results (Maas et al 2006). In 2D PSF measurements, the symmetry of the crystals wasused to increase efficiency: test data were selected from one half (y ! 0) of the crystal only,while reference data were collected for y ! %2 mm to avoid truncating the error histograms aty = 0. At each grid position, nref = 500 events were recorded. For non-perpendicular anglesof incidence, the range of beam positions included the crystal front surface as well as the sidesurface turned towards the beam. The oblique sides of the trapezoidal crystals (see figure 1)were included in all measurements performed in the y-direction.
All spatial resolution measurements were performed at !V = 0 V, $ = 0.2 µs and attemperatures between T = 21.4 "C and T = 25.3 "C with temperature variations of less than±0.2 "C during each measurement. Furthermore, all events above the relatively low energythreshold Eth ' 100 keV were accepted.
2.5.5. Correction for test beam diameter. The relevant quantity for characterizing thespatial resolution of the present type of detector when used in a PET system is the 2D errorprobability distribution of the entry point assigned to individual annihilation photons, i.e. thedetector PSF. To estimate this quantity from the measured distribution PSFb described in theprevious section, we need to correct for the influence of the test beam diameter db (!1 mmFWHM, see section 2.4). However, correcting by straightforward deconvolution has appearedto be difficult, amongst others because of divergence of the beam (!21% over 20 mm).
Instead, a correction was made using a simple model of the PSF that has been presentedand validated elsewhere (Maas 2008). For convenience, we summarize the model briefly inthe following. The model is valid in the central part of the detector and describes the PSFas a convolution of two 2D distributions plus a small background. The first distribution,% , describes the spatial distribution (projected onto the xy plane) of the energy depositedby annihilation photons within the crystal due to interaction processes such as Comptonscattering and x-ray fluorescence. The second distribution, N!, accounts for the positioningerror resulting from the finite signal-to-noise ratio of the detector signals, which is determinedby statistical variations in the number of photons produced per scintillation event and thefraction of photons detected, by the APD excess noise factor and dark current, by electronicnoise, etc (see e.g. Maas et al (2008)).
The 2D distribution % is estimated by means of a Monte Carlo simulation (Maas 2008).This has been done both for the case of a ‘pencil’ beam with zero diameter, the result of whichis denoted by %0, and for a detailed model of the test beam used in our experiments (Maas2008), the result of which is denoted by %b.
Monolithic scintillator PET detectors with intrinsic depth-of-interaction correction 1901
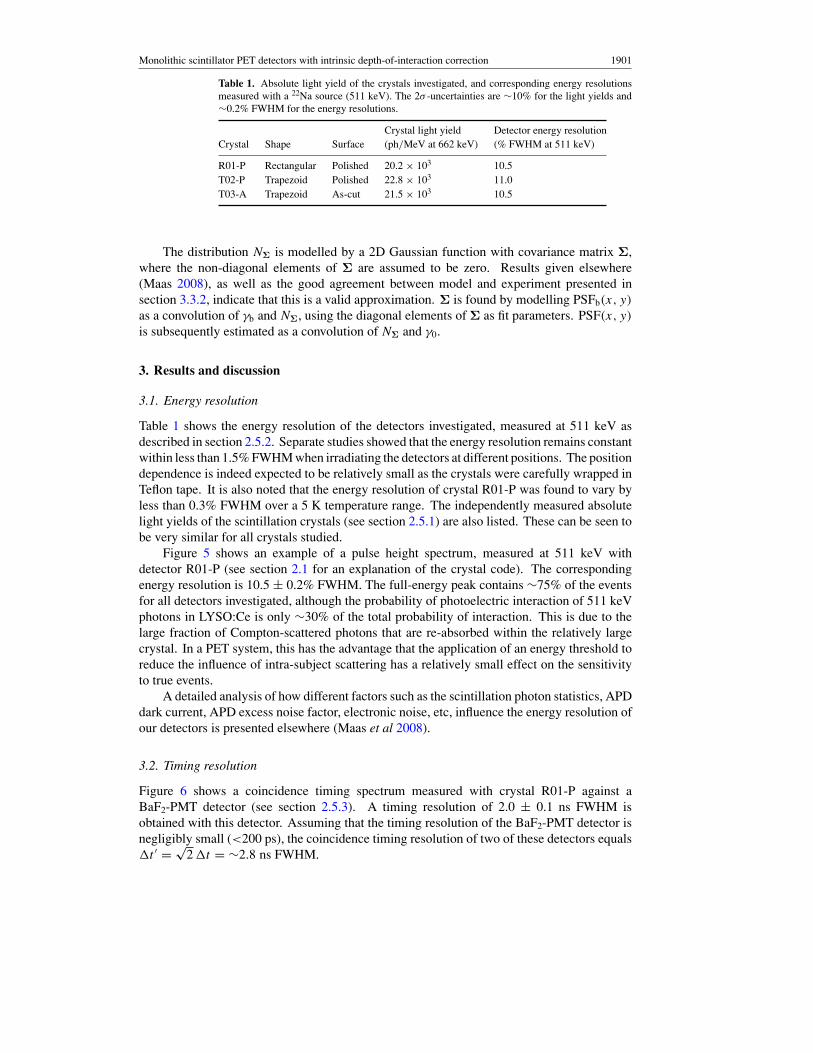
Table 1. Absolute light yield of the crystals investigated, and corresponding energy resolutionsmeasured with a 22Na source (511 keV). The 2& -uncertainties are !10% for the light yields and!0.2% FWHM for the energy resolutions.
Crystal light yield Detector energy resolutionCrystal Shape Surface (ph/MeV at 662 keV) (% FWHM at 511 keV)
R01-P Rectangular Polished 20.2 # 103 10.5T02-P Trapezoid Polished 22.8 # 103 11.0T03-A Trapezoid As-cut 21.5 # 103 10.5
The distribution N! is modelled by a 2D Gaussian function with covariance matrix !,where the non-diagonal elements of ! are assumed to be zero. Results given elsewhere(Maas 2008), as well as the good agreement between model and experiment presented insection 3.3.2, indicate that this is a valid approximation. ! is found by modelling PSFb(x, y)
as a convolution of %b and N!, using the diagonal elements of ! as fit parameters. PSF(x, y)
is subsequently estimated as a convolution of N! and %0.
3. Results and discussion
3.1. Energy resolution
Table 1 shows the energy resolution of the detectors investigated, measured at 511 keV asdescribed in section 2.5.2. Separate studies showed that the energy resolution remains constantwithin less than 1.5% FWHM when irradiating the detectors at different positions. The positiondependence is indeed expected to be relatively small as the crystals were carefully wrapped inTeflon tape. It is also noted that the energy resolution of crystal R01-P was found to vary byless than 0.3% FWHM over a 5 K temperature range. The independently measured absolutelight yields of the scintillation crystals (see section 2.5.1) are also listed. These can be seen tobe very similar for all crystals studied.
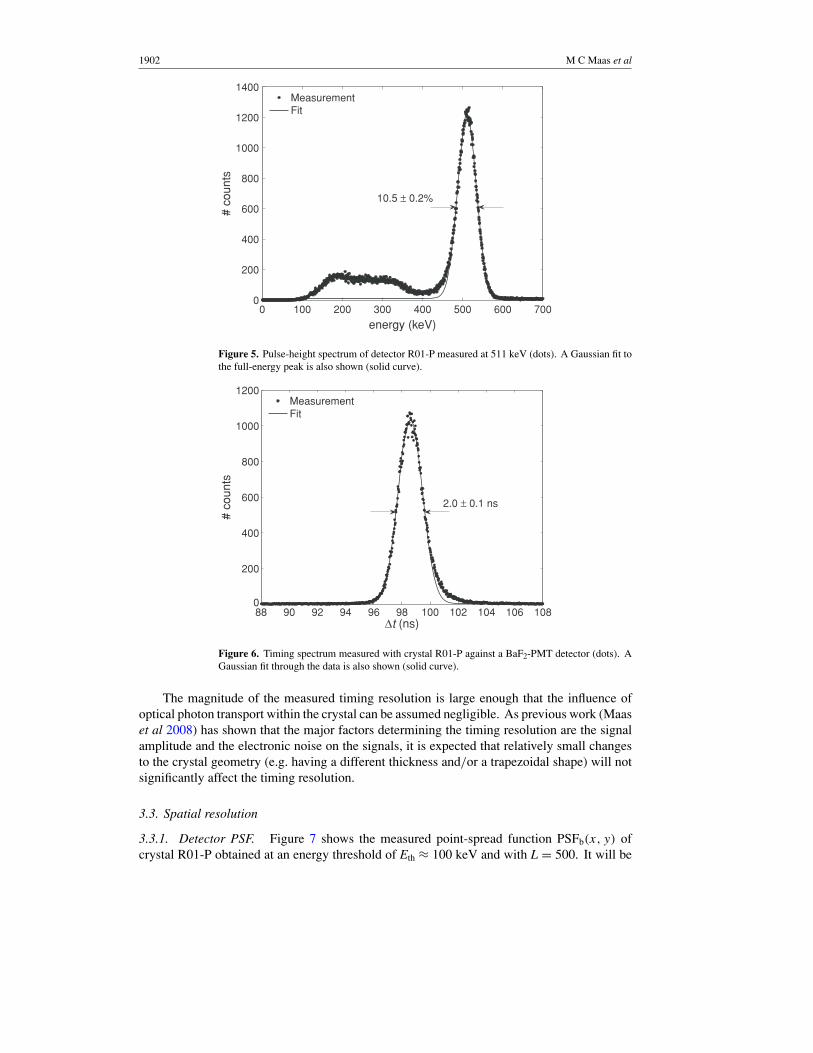
Figure 5 shows an example of a pulse height spectrum, measured at 511 keV withdetector R01-P (see section 2.1 for an explanation of the crystal code). The correspondingenergy resolution is 10.5 ± 0.2% FWHM. The full-energy peak contains !75% of the eventsfor all detectors investigated, although the probability of photoelectric interaction of 511 keVphotons in LYSO:Ce is only !30% of the total probability of interaction. This is due to thelarge fraction of Compton-scattered photons that are re-absorbed within the relatively largecrystal. In a PET system, this has the advantage that the application of an energy threshold toreduce the influence of intra-subject scattering has a relatively small effect on the sensitivityto true events.
A detailed analysis of how different factors such as the scintillation photon statistics, APDdark current, APD excess noise factor, electronic noise, etc, influence the energy resolution ofour detectors is presented elsewhere (Maas et al 2008).
3.2. Timing resolution
Figure 6 shows a coincidence timing spectrum measured with crystal R01-P against aBaF2-PMT detector (see section 2.5.3). A timing resolution of 2.0 ± 0.1 ns FWHM isobtained with this detector. Assuming that the timing resolution of the BaF2-PMT detector isnegligibly small (<200 ps), the coincidence timing resolution of two of these detectors equals!t ) =
*2 !t = !2.8 ns FWHM.
1902 M C Maas et al
0 100 200 300 400 500 600 7000
200
400
600
800
1000
1200
1400
energy (keV)
# co
unts
MeasurementFit
10.5 ± 0.2%
Figure 5. Pulse-height spectrum of detector R01-P measured at 511 keV (dots). A Gaussian fit tothe full-energy peak is also shown (solid curve).
88 90 92 94 96 98 100 102 104 106 1080
200
400
600
800
1000
1200
!t (ns)
# co
unts
MeasurementFit
2.0 ± 0.1 ns
Figure 6. Timing spectrum measured with crystal R01-P against a BaF2-PMT detector (dots). AGaussian fit through the data is also shown (solid curve).
The magnitude of the measured timing resolution is large enough that the influence ofoptical photon transport within the crystal can be assumed negligible. As previous work (Maaset al 2008) has shown that the major factors determining the timing resolution are the signalamplitude and the electronic noise on the signals, it is expected that relatively small changesto the crystal geometry (e.g. having a different thickness and/or a trapezoidal shape) will notsignificantly affect the timing resolution.
3.3. Spatial resolution
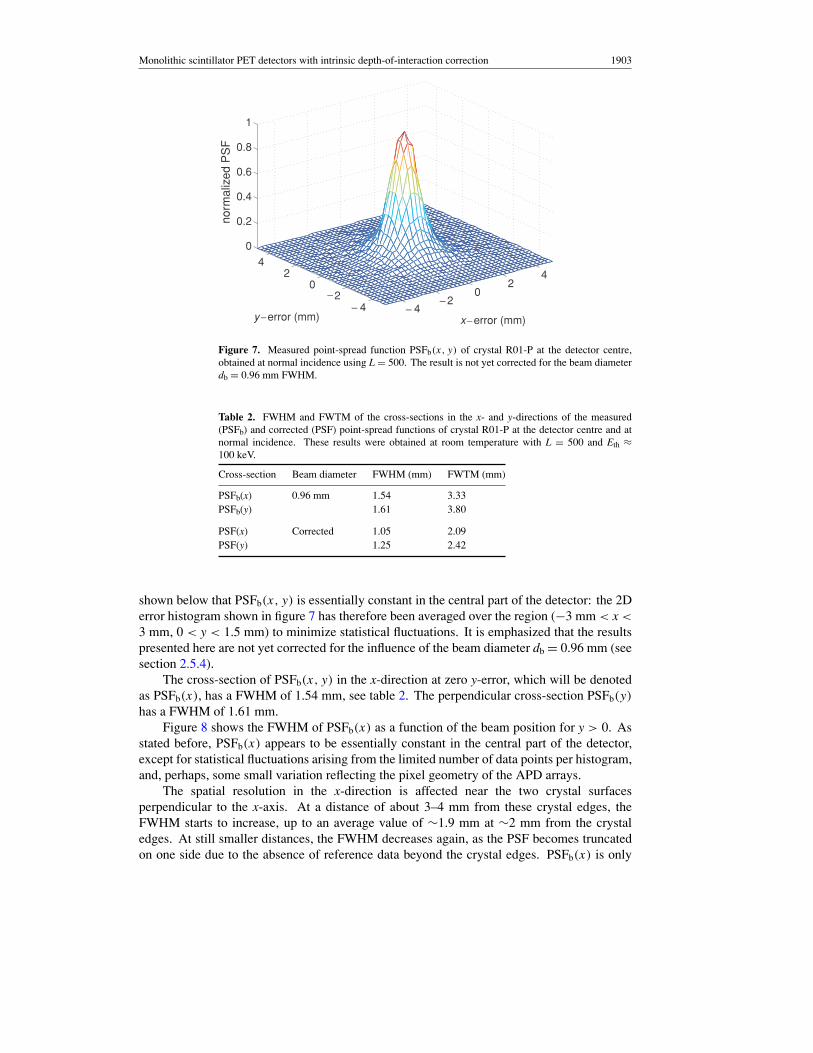
3.3.1. Detector PSF. Figure 7 shows the measured point-spread function PSFb(x, y) ofcrystal R01-P obtained at an energy threshold of Eth ' 100 keV and with L = 500. It will be
Monolithic scintillator PET detectors with intrinsic depth-of-interaction correction 1903
02
40
2
2 2
4
4 4
0
0.2
0.4
0.6
0.8
1
norm
aliz
ed P
SF
"" "
"
x"error (mm)y"error (mm)
Figure 7. Measured point-spread function PSFb(x, y) of crystal R01-P at the detector centre,obtained at normal incidence using L = 500. The result is not yet corrected for the beam diameterdb = 0.96 mm FWHM.
Table 2. FWHM and FWTM of the cross-sections in the x- and y-directions of the measured(PSFb) and corrected (PSF) point-spread functions of crystal R01-P at the detector centre and atnormal incidence. These results were obtained at room temperature with L = 500 and Eth '100 keV.
Cross-section Beam diameter FWHM (mm) FWTM (mm)
PSFb(x) 0.96 mm 1.54 3.33PSFb(y) 1.61 3.80
PSF(x) Corrected 1.05 2.09PSF(y) 1.25 2.42
shown below that PSFb(x, y) is essentially constant in the central part of the detector: the 2Derror histogram shown in figure 7 has therefore been averaged over the region (%3 mm < x <
3 mm, 0 < y < 1.5 mm) to minimize statistical fluctuations. It is emphasized that the resultspresented here are not yet corrected for the influence of the beam diameter db = 0.96 mm (seesection 2.5.4).
The cross-section of PSFb(x, y) in the x-direction at zero y-error, which will be denotedas PSFb(x), has a FWHM of 1.54 mm, see table 2. The perpendicular cross-section PSFb(y)
has a FWHM of 1.61 mm.Figure 8 shows the FWHM of PSFb(x) as a function of the beam position for y > 0. As
stated before, PSFb(x) appears to be essentially constant in the central part of the detector,except for statistical fluctuations arising from the limited number of data points per histogram,and, perhaps, some small variation reflecting the pixel geometry of the APD arrays.
The spatial resolution in the x-direction is affected near the two crystal surfacesperpendicular to the x-axis. At a distance of about 3–4 mm from these crystal edges, theFWHM starts to increase, up to an average value of !1.9 mm at !2 mm from the crystaledges. At still smaller distances, the FWHM decreases again, as the PSF becomes truncatedon one side due to the absence of reference data beyond the crystal edges. PSFb(x) is only

1904 M C Maas et al
0 22"""""
44
6
6
8
8
10
1001
23
450
1
2
3
4
x-position (mm)y-position (mm)
FWH
M s
patia
l res
olut
ion
(mm
)
x-direction
Figure 8. FWHM of PSFb(x) of crystal R01-P measured at normal incidence as a function of thetest beam position, using L = 500. Values are derived from 2D error histograms averaged over1 # 1 mm2 segments and are not corrected for db = 0.96 mm FWHM.
affected near the crystal edges perpendicular to the x-axis. These effects have been predictedby optical simulations (van der Laan et al 2006) and have also been measured with 10 mmthick crystals read out by a single APD array in FSR or BSR geometry (Maas et al 2006).
Similar results were found in the y-direction: the FWHM of PSFb(y) is best in the centralpart of the detector, while some deterioration of the spatial resolution in the y-direction isfound near the crystal edges perpendicular to the y-axis only.
3.3.2. Correction for test beam diameter. The results presented in the previous section stillinclude the influence of the finite test beam diameter. This influence can be corrected foras described in section 2.5.5, in order to estimate the detector PSF applicable to individualannihilation photons.
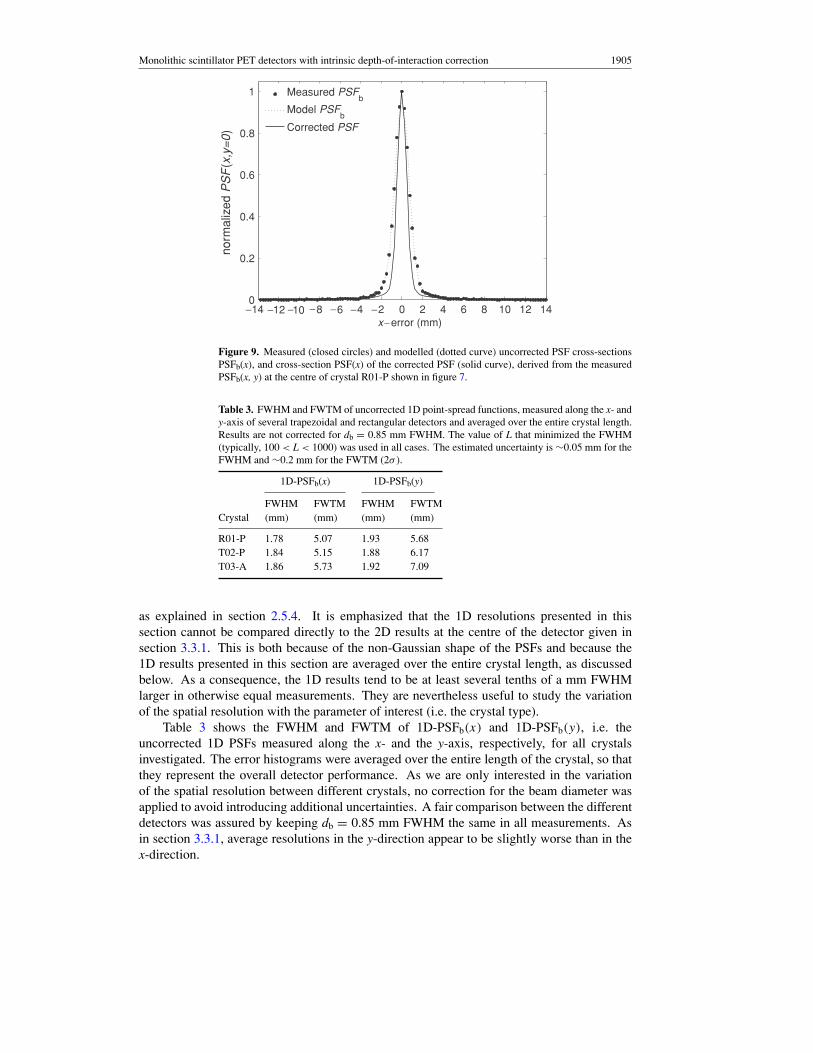
Here we illustrate the procedure for the measured PSFb at the centre of detector R01-Pshown in figure 7. Figure 9 shows the cross-sections PSFb(x) of both the measured PSFb(x, y)
(closed circles) and the model of PSFb(x, y) (dotted curve). Excellent agreement between themodel and the measurements is obtained. The cross-section PSF(x) of the corrected detectorPSF(x, y) is indicated by the solid curve in the same figure.
Table 2 shows the FWHM and FWTM in the x- and y-directions of both the uncorrectedand the corrected PSFs. A corrected spatial resolution of 1.05 mm FWHM is found in thex-direction. Similar to PSFb (see section 3.3.1), the corrected PSF is slightly wider in they-direction.
It is emphasized that these results are obtained at a low energy threshold Eth ' 100 keV.Separate studies have shown that the influence of Eth on the spatial resolution is very small(i.e. no more than a few hundredths of a mm FWHM). This implies that one can select a lowenergy threshold for imaging small subjects (with low intra-subject scattering) to maximizethe system sensitivity without loss of resolution.
3.3.3. Crystal comparison. The spatial resolutions of the rectangular and trapezoidal crystalswere compared in a series of measurements in which the two APD arrays (and other parameters)were kept the same. For efficiency, this was done by means of 1D resolution measurements
Monolithic scintillator PET detectors with intrinsic depth-of-interaction correction 1905
0 22""""""" 44 66 88 1010 12 1412140
0.2
0.4
0.6
0.8
1
x"error (mm)
norm
aliz
edP
SF
(x,y
=0)
Measured PSFb
Model PSFb
Corrected PSF
Figure 9. Measured (closed circles) and modelled (dotted curve) uncorrected PSF cross-sectionsPSFb(x), and cross-section PSF(x) of the corrected PSF (solid curve), derived from the measuredPSFb(x, y) at the centre of crystal R01-P shown in figure 7.
Table 3. FWHM and FWTM of uncorrected 1D point-spread functions, measured along the x- andy-axis of several trapezoidal and rectangular detectors and averaged over the entire crystal length.Results are not corrected for db = 0.85 mm FWHM. The value of L that minimized the FWHM(typically, 100 < L < 1000) was used in all cases. The estimated uncertainty is !0.05 mm for theFWHM and !0.2 mm for the FWTM (2& ).
1D-PSFb(x) 1D-PSFb(y)
FWHM FWTM FWHM FWTMCrystal (mm) (mm) (mm) (mm)
R01-P 1.78 5.07 1.93 5.68T02-P 1.84 5.15 1.88 6.17T03-A 1.86 5.73 1.92 7.09
as explained in section 2.5.4. It is emphasized that the 1D resolutions presented in thissection cannot be compared directly to the 2D results at the centre of the detector given insection 3.3.1. This is both because of the non-Gaussian shape of the PSFs and because the1D results presented in this section are averaged over the entire crystal length, as discussedbelow. As a consequence, the 1D results tend to be at least several tenths of a mm FWHMlarger in otherwise equal measurements. They are nevertheless useful to study the variationof the spatial resolution with the parameter of interest (i.e. the crystal type).
Table 3 shows the FWHM and FWTM of 1D-PSFb(x) and 1D-PSFb(y), i.e. theuncorrected 1D PSFs measured along the x- and the y-axis, respectively, for all crystalsinvestigated. The error histograms were averaged over the entire length of the crystal, so thatthey represent the overall detector performance. As we are only interested in the variationof the spatial resolution between different crystals, no correction for the beam diameter wasapplied to avoid introducing additional uncertainties. A fair comparison between the differentdetectors was assured by keeping db = 0.85 mm FWHM the same in all measurements. Asin section 3.3.1, average resolutions in the y-direction appear to be slightly worse than in thex-direction.
1906 M C Maas et al
0 5 10 15 20 25 301
2
3
4
5
6
7
8
9
10
(degrees)
PS
F w
idth
(mm
)1D 1D
PSFb(x’)
PSFb(x’)
PSFb(y’)
PSFb(y’)
% = 0°
0 5 10 15 20 25 301
2
3
4
5
6
7
8
9
10
(degrees)
PS
F w
idth
(mm
)
PSFb(x’)
PSFb(x’)
PSFb(y’)
PSFb(y’)
(a) (b)
" "
""
"
"
"
"" "
% = 90°
& &
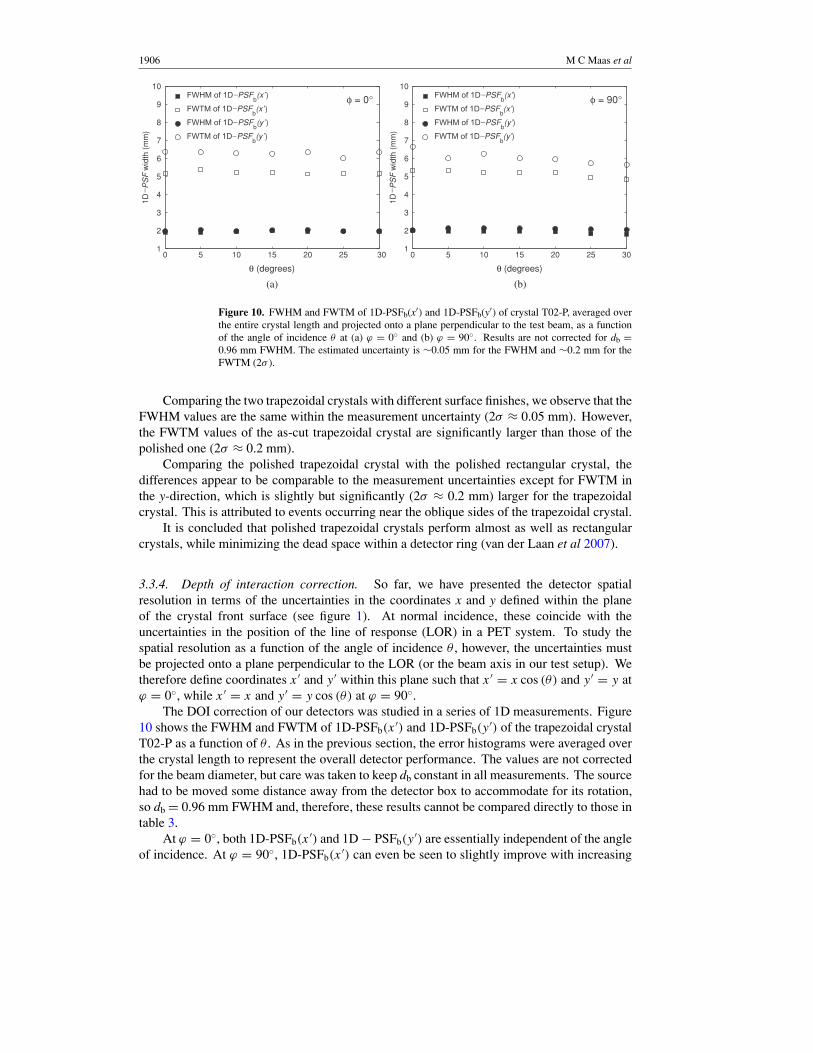
Figure 10. FWHM and FWTM of 1D-PSFb(x)) and 1D-PSFb(y)) of crystal T02-P, averaged overthe entire crystal length and projected onto a plane perpendicular to the test beam, as a functionof the angle of incidence ' at (a) ( = 0" and (b) ( = 90". Results are not corrected for db =0.96 mm FWHM. The estimated uncertainty is !0.05 mm for the FWHM and !0.2 mm for theFWTM (2& ).
Comparing the two trapezoidal crystals with different surface finishes, we observe that theFWHM values are the same within the measurement uncertainty (2& ' 0.05 mm). However,the FWTM values of the as-cut trapezoidal crystal are significantly larger than those of thepolished one (2& ' 0.2 mm).
Comparing the polished trapezoidal crystal with the polished rectangular crystal, thedifferences appear to be comparable to the measurement uncertainties except for FWTM inthe y-direction, which is slightly but significantly (2& ' 0.2 mm) larger for the trapezoidalcrystal. This is attributed to events occurring near the oblique sides of the trapezoidal crystal.
It is concluded that polished trapezoidal crystals perform almost as well as rectangularcrystals, while minimizing the dead space within a detector ring (van der Laan et al 2007).
3.3.4. Depth of interaction correction. So far, we have presented the detector spatialresolution in terms of the uncertainties in the coordinates x and y defined within the planeof the crystal front surface (see figure 1). At normal incidence, these coincide with theuncertainties in the position of the line of response (LOR) in a PET system. To study thespatial resolution as a function of the angle of incidence ' , however, the uncertainties mustbe projected onto a plane perpendicular to the LOR (or the beam axis in our test setup). Wetherefore define coordinates x ) and y ) within this plane such that x ) = x cos (') and y ) = y at( = 0", while x ) = x and y ) = y cos (') at ( = 90".
The DOI correction of our detectors was studied in a series of 1D measurements. Figure10 shows the FWHM and FWTM of 1D-PSFb(x
)) and 1D-PSFb(y)) of the trapezoidal crystal
T02-P as a function of ' . As in the previous section, the error histograms were averaged overthe crystal length to represent the overall detector performance. The values are not correctedfor the beam diameter, but care was taken to keep db constant in all measurements. The sourcehad to be moved some distance away from the detector box to accommodate for its rotation,so db = 0.96 mm FWHM and, therefore, these results cannot be compared directly to those intable 3.
At ( = 0", both 1D-PSFb(x)) and 1D % PSFb(y
)) are essentially independent of the angleof incidence. At ( = 90", 1D-PSFb(x
)) can even be seen to slightly improve with increasing
Monolithic scintillator PET detectors with intrinsic depth-of-interaction correction 1907
' . This is attributed to the fact that in these experiments the beam exits the side surface of thecrystal at large values of ' , reducing the average distance of interaction from the front APDarray. Similar results were found for the rectangular crystals, although the difference betweenthe FWTMs of 1D-PSFb(x
)) and 1D % PSFb(y)) was smaller for these crystals, in accordance
with the results given in the previous section.It is concluded that the excellent intrinsic DOI correction of our detectors enables
essentially parallax-free image reconstruction at angles of incidence of up to at least 30".
4. Conclusions
Monolithic scintillator PET detectors with intrinsic DOI correction were characterizedexperimentally in terms of their spatial, temporal and energy resolutions. The detector designcomprises a rectangular or trapezoidal LYSO:Ce crystal read out by two position-sensitiveAPD arrays in double-sided readout geometry. This involves placement of one of the sensorson the crystal front surface, which is feasible because the APD arrays are essentially transparentto 511 keV photons. With DSR the crystal can be made 20 mm thick for maximum detectionefficiency, while maintaining high spatial resolution.
At the centre of the detector and at normal incidence, the FWHM of the detector PSFobtained with a rectangular crystal is as good as !1.05 mm in the x-direction, after correctionfor the !0.9 mm diameter test beam of annihilation photons. Near the edges of the crystalsome resolution loss occurs, in the direction perpendicular to the edge only.
Trapezoidal crystals perform almost equally well as rectangular ones. Such crystalsminimize the dead space within a detector ring, resulting in the highest and most uniformscanner sensitivity (van der Laan et al 2007).
No loss of spatial resolution is observed for angles of incidence of up to at least 30". Theexcellent DOI correction thus demonstrated will facilitate a high and uniform PET systemresolution.
These promising results were obtained at Eth ' 100 keV, implying that one can use alow energy threshold for imaging small subjects (with low intra-subject scattering), so as tomaximize system sensitivity without loss of resolution.
Energy resolutions of !11% FWHM are measured with !75% of the events in the full-energy peak. The estimated coincidence timing resolution of !2.8 ns FWHM is sufficient foradequate rejection of random coincidences (van der Laan et al 2007).
Whereas some PET detector concepts might offer even higher spatial resolution at thecentre of the FOV, our monolithic detectors offer the advantages of highly accurate DOIcorrection, high detection efficiency, good energy resolution and simplicity of design. Becauseof these advantages they are expected to outperform many other detectors, especially inapplications where larger, or multiple, objects need to be imaged with high and uniformresolution. As an added advantage, the use of APD arrays instead of (multi-channel) PMTsopens up the possibility of integrating these detectors with an MRI device.
References
Abreu M et al 2006 Design and evaluation of the Clear-PEM scanner for positron emission mammography IEEETrans. Nucl. Sci. 53 71–7
Bloomfield P M, Myers R, Hume S P, Spinks T J, Lammertsma A A and Jones T 1997 Three-dimensional performanceof a small-diameter positron emission tomograph Phys. Med. Biol. 42 389–400
Bruyndonckx P, Leonard S M A, Liu J, Tavernier S P K, Szupryczynski P and Fedorov A 2003 Study of spatialresolution and depth of interaction of APD-based PET detector modules using light sharing schemes IEEETrans. Nucl. Sci. 50 1415–9

1908 M C Maas et al
Bruyndonckx P, Leonard S M A, Tavernier S P K, Lemaıtre C, Devroede O, Wu Y and Krieguer M 2004 Neuralnetwork-based position estimators for PET detectors using monolithic LSO blocks IEEE Trans. Nucl. Sci.51 2520–5
Catana C, Wu Y, Judenhofer M S, Qi J, Pichler B J and Cherry S R 2006 Simultaneous acquisition of multislice PETand MR images: initial results with a MR-compatible PET scanner J. Nucl. Med. 47 1968–76
Clement D, Frei R, Loude J and Morel C 1998 Development of a 3D position sensitive scintillation detector usingneural networks 1998 IEEE Nucl. Sci. Symp. Conf. Record pp 1448–52
Correia J A, Burnham C A, Kaufman D and Fischman A J 1999 Development of a small animal PET imaging devicewith resolution approaching 1 mm IEEE Trans. Nucl. Sci. 46 631–5
Cover T M and Hart P E 1967 Nearest neighbor pattern classification IEEE Trans. Inf. Theory 13 21–7De Haas J, Dorenbos P and Van Eijk C W E 2005 Measuring the absolute light yield of scintillators Nucl. Instrum.
Methods Phys. Res. A 537 97–100Del Guerra A, Di Domenico G, Scandola M and Zavatti G 1998 High spatial resolution small animal YAP-PET Nucl.
Instrum. Methods Phys. Res. A 409 537–41Du H, Yang Y and Cherry S R 2008 Comparison of four depth-encoding PET detector modules with wavelength
shifting (WLS) and optical fiber read-out Phys. Med. Biol. 53 1829–42Judenhofer M S et al 2008 Simultaneous PET-MRI: a new approach for functional and morphological imaging Nat.
Med. 14 459–65Lecomte R, Cadorette J, Rodrique S, Lapointe D, Rouleau D, Bentourkia M, Yao R and Msaki P 1996 Initial results
from the Sherbrooke avalanche photodiode positron tomograph IEEE Trans. Nucl. Sci. 43 1952–7Maas M C 2008 Monolithic scintillator detectors for high-resolution positron emission tomography PhD Thesis Delft
University of Technology, Delft, The NetherlandsMaas M C, Schaart D R, Van Der Laan D J, Van Dam H T, Huizenga J, Brouwer J C, Bruyndonckx P, Lemaıtre C and
Van Eijk C W E 2008 Signal to noise ratio of APD-based monolithic scintillator detectors for high resolutionPET IEEE Trans. Nucl. Sci. 55 842–52
Maas M C, Van Der Laan D J, Schaart D R, Huizenga J, Brouwer J C, Bruyndonckx P, Leonard S, Lemaıtre C andVan Eijk C W E 2006 Experimental characterization of monolithic-crystal small animal PET detectors read outby APD arrays IEEE Trans. Nucl. Sci. 53 1071–7
McElroy D P, Pimpl W, Pichler B J, Rafecas M, Schuler T and Ziegler S I 2005 Characterization and readout ofMADPET-II detector modules: validation of a unique design concept for high resolution small animal PETIEEE Trans. Nucl. Sci. 52 199–204
Orita N, Murayama H, Kawai H, Inadama N and Tsuda T 2005 Three-dimensional array of scintillation crystals withproper reflector arrangement for a depth of interaction detector IEEE Trans. Nucl. Sci. 52 8–14
Seidel J, Vaquero J J and Green M V 2003 Resolution uniformity and sensitivity of the NIH ATLAS small animalPET scanner: comparison to simulated LSO scanners without depth-of-interaction capability IEEE Trans. Nucl.Sci. 50 1347–51
Surti S, Karp J S, Perkins A E, Freifelder R and Muhllehner G 2003 Design evaluation of A-PET: a high sensitivityanimal PET camera IEEE Trans. Nucl. Sci. 50 1357–63
Tai Y C, Chatziioannou A F, Yang Y, Silverman R W, Meadors K, Siegel S, Newport D F, Stickel J R and CherryS R 2003 MicroPET II: design, development and initial performance of an improved MicroPET scanner forsmall-animal imaging Phys. Med. Biol. 49 1519–39
Tai Y C, Ruangma A, Rowland D, Siegel S, Newport D F, Chow P L and Laforest R 2005 Performance evaluationof the MicroPET focus: a third generation MicroPET scanner dedicated to animal imaging J. Nucl. Med. 46455–63
Van Der Laan D J, Maas M C, De Jong H W A M, Schaart D R, Bruyndonckx P, Lemaıtre C and Van Eijk C W E2007 Simulated performance of a small-animal PET scanner based on monolithic scintillation detectors Nucl.Instrum. Methods Phys. Res. A 571 227–30
Van Der Laan D J, Maas M C, Schaart D R, Bruyndonckx P, Leonard S and Van Eijk C W E 2006 Using Cramer–Raotheory combined with Monte Carlo simulations for the optimization of monolithic scintillator PET detectorsIEEE Trans. Nucl. Sci. 53 1063–70
Wang G C, Huber J, Moses W, Choong W S and Maltz J 2004 Calibration of a PEM detector with depth of interactionmeasurement IEEE Trans. Nucl. Sci. 51 775–81
Weber S, Bauer A, Herzog H, Kehren F, Muhlensiepen H, Vogelbruch J, Coenen H H, Zilles K and Halling H 1999Recent results of the TierPET scanner 1999 IEEE Nucl. Sci. Symp. Conf. Record pp 1603–7
Woody C et al 2007 Preliminary studies of a simultaneous PET/MRI scanner based on the RatCAP small animaltomograph Nucl. Instrum. Methods Phys. Res. A 571 102–5
Ziemons K et al 2005 The ClearPET (TM) project: development of a 2nd generation high-performance small animalPET scanner Nucl. Instrum. Methods Phys. Res. A 537 307–11
Related Documents


