Monitoring Building Energy Systems Using NASA's Near RealTime Solar and Meteorological Data and RETScreen® Plus So?ware for Decision Support Presenter: Rene Ganoe, SSAI NASA Langley Research Center Hampton, VA CoAuthors: Dr. Paul W. Stackhouse, Jr., Russell DeYoung, Robert Charles, NASA LaRC; Joan Hughes, SAIC; William Chandler, David Westberg, SSAI; and Gregory J. Leng and Urban Zeigler, NRCanCanmetEnergy NATIONAL AERONAUTICS AND SPACE ADMINISTRATION AMS 94 th Annual MeeJng Fi?h Conference on Weather, Climate, and the New Energy Economy

Welcome message from author
This document is posted to help you gain knowledge. Please leave a comment to let me know what you think about it! Share it to your friends and learn new things together.
Transcript

Monitoring Building Energy Systems Using NASA's Near Real-‐Time Solar and
Meteorological Data and RETScreen® Plus So?ware for Decision Support
Presenter: Rene Ganoe, SSAI NASA Langley Research Center
Hampton, VA Co-‐Authors: Dr. Paul W. Stackhouse, Jr., Russell DeYoung, Robert Charles, NASA LaRC; Joan Hughes, SAIC; William Chandler, David Westberg, SSAI; and Gregory J.
Leng and Urban Zeigler, NRCan-‐CanmetEnergy
NATIONAL AERONAUTICS AND SPACE ADMINISTRATION
AMS 94th Annual MeeJng Fi?h Conference on Weather, Climate, and the New Energy Economy

Climate change and energy monitoring in the building sector
• Increasing energy use and carbon emissions are impacts of climate change.
• Building sector is responsible for ~40% of total energy consumed globally.
• Energy and carbon reducSon can be achieved through renewable energy technologies (RETs), and increasing the efficiency of current energy systems.
• This talk presents a comprehensive analysis program that manages building energy usage and performance of energy improvement technologies.
NASA Climate AdaptaJon Science InvesJgator (CASI)
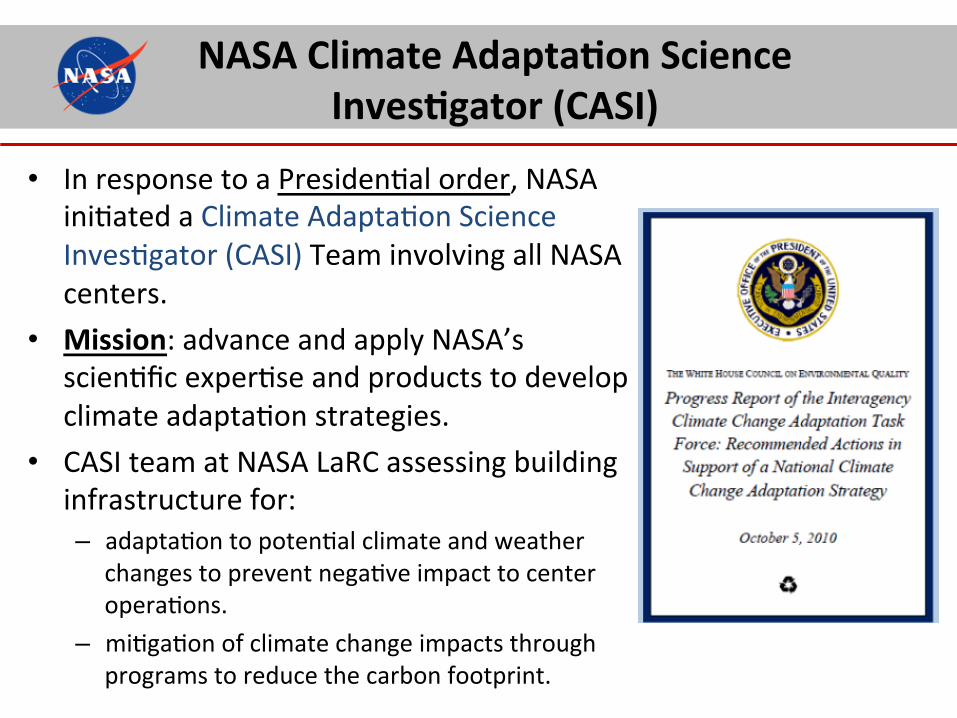
• In response to a PresidenSal order, NASA iniSated a Climate AdaptaSon Science InvesSgator (CASI) Team involving all NASA centers.
• Mission: advance and apply NASA’s scienSfic experSse and products to develop climate adaptaSon strategies.
• CASI team at NASA LaRC assessing building infrastructure for: – adaptaSon to potenSal climate and weather
changes to prevent negaSve impact to center operaSons.
– miSgaSon of climate change impacts through programs to reduce the carbon footprint.

Disease Vectors
NASA Langley climate change impacts
Langley Research Center
ELECTRICITY BROWNOUTS
Temperature Rise (people and infrastructure)
WATER SUPPLY INTERRUPTION
Sea Level Rise
WASTE MANAGEMENT INTERRUPTION
Hurricanes with Sea Level Rise
(Newport News Waterworks)
(Hampton Roads SanitaSon District)
(Dominion Virginia Power)
Changing Ecosystems

RETScreen® InternaJonal (www.retscreen.net)
• RETScreen ® InternaSonal is a
project of Natural Resources Canada’s CanmetEnergy DiversificaSon Research Laboratory (CEDRL) to empower cleaner energy decisions.
• Developed a comprehensive so`ware tool that monitors energy performance and analyzes energy efficiency improvements to provide decision support. – Has over 395,000 users and
available in 35+ languages. – Responsible for ~$8 billion in
user energy savings and ~20 million ton/yr reducSon in greenhouse gas emissions.

RETScreen Plus So?ware
RETScreen Plus, the Windows-‐based Performance Analysis module employs the monitoring, targeSng, and reporSng of current building performance with integraSon of meteorological and solar insolaSon data.
• Maps energy usage over Sme to demonstrate performance changes due to building improvements or alteraSons.
• Provides quanStaSve measure of building efficiency.
• Gauges financial feasibility prior to implementaSon of energy efficiency measures or renewable technology systems.

RETScreen Plus integraJon with NASA Solar and Meteorological Data
RETScreen Plus Monitor and analyze building energy performance, weather-‐normalized
through mulJvariate analysis
Metered building energy
data
CERES-‐FLASHFlux Solar irradiance
Surface meteorology and solar energy data set
Generate custom reports for energy decision support
-‐ Air temperature -‐ Surface temperature -‐ Average humidity
-‐ Atmospheric pressure -‐ HeaJng degree days -‐ Cooling degree days
GMAO GEOS NASA near real-‐Sme data provided by the Surface meteorology and solar energy data set. • Meteorological data
from the NASA GMAO (Global Modeling and AssimilaSon Office) GEOS (Goddard Earth Observing System).
• Solar observaSons from NASA CERES (Clouds and Earth’s Radiance Energy System) and FLASHFlux (Fast Longwave and SHortwave radiaSve Fluxes).

The availability of NASA data sets to RETScreen Plus users has increased spaSal resoluSon of meteorological data to an Earth surface 1° x 1° global grid.
NASA near real-‐Jme solar and meteorological data sets
RETScreen Climate database for site locaSon selecSon

NASA near real-‐Jme data validaJon
• Satellite and model derived parameters validated by surface observaSons from the NaSonal ClimaSc Data Center.
• Near real-‐Sme data sets enable users to maintain ongoing energy monitoring of their faciliSes within a week of real-‐Sme.
Parameter Slope Intercept R2 RMSE Bias
Tmax (°C) 0.97 -‐1.01 0.94 3.5 -‐1.5
Tmin (°C) 0.98 0.43 0.92 3.4 0.3
Tavg (°C) 0.99 -‐0.37 0.96 2.6 -‐0.5
RH (%) 0.74 19.05 0.61 11.5 1.3
HeaJng Degree Days (degree days)
0.95 25.66 0.89 97.59 12.62
Cooling Degree Days (degree days)
0.97 -‐2.75 0.96 40.44 -‐7.47
Atmospheric Pressure (hPa) 1.10 -‐96.84 0.92 17.7 1.3
Solar Irradiance (W m-‐2) 0.94 2.76 0.90 31.8 -‐8.5
NASA Near-‐Real Time Data Accuracies
Linear least squares regression analysis of SSE values versus NCDC daily averaged values for year 2013.

RETScreen Plus ReporSng Pathway
ReporSng has a number of funcSons: • Create moSvaSons for
energy saving acSons. • Report regularly on
performance. • Monitor overall
energy costs. • Measure cost savings
or energy producSon revenue.
www.retscreen.net
Energy-‐metered building/system
Senior decision makers
Measure
RETScreen Plus
AcSo
n
Managers
Facility Operators
Summary informaSon
ExcepSon reports & budget
Control informaSon

NASA Langley Case Studies
DemonstraSon of managing building energy usage and efficiency for select
buildings using NASA data sets

Photo credit: David Bowman, Genex
Year built: 2005 Square footage: 3,473
Power Source: Electric
power with solar panels installed in 2010.
Two solar panel arrays consist of 168
photovoltaic modules. Each year, this 39.5 kW
system will produce 50,000 kWh.
Photo credit: Sean Smith, NASA
Badge and Pass Office

Badge and Pass Office
PV system accrued a net savings of 169 MWh since commissioning.
Solar panels installed
Weather normalized energy usage allow other changes in building energy to be correlated with work orders, occupancy fluctuaSons, etc.

Photo credit: David Bowman, Genex
Year built: 2011
Power source: electric power Leadership in Energy and Environment Design (LEED) green building.
Square footage: 79,000
NASA LaRC Headquarters
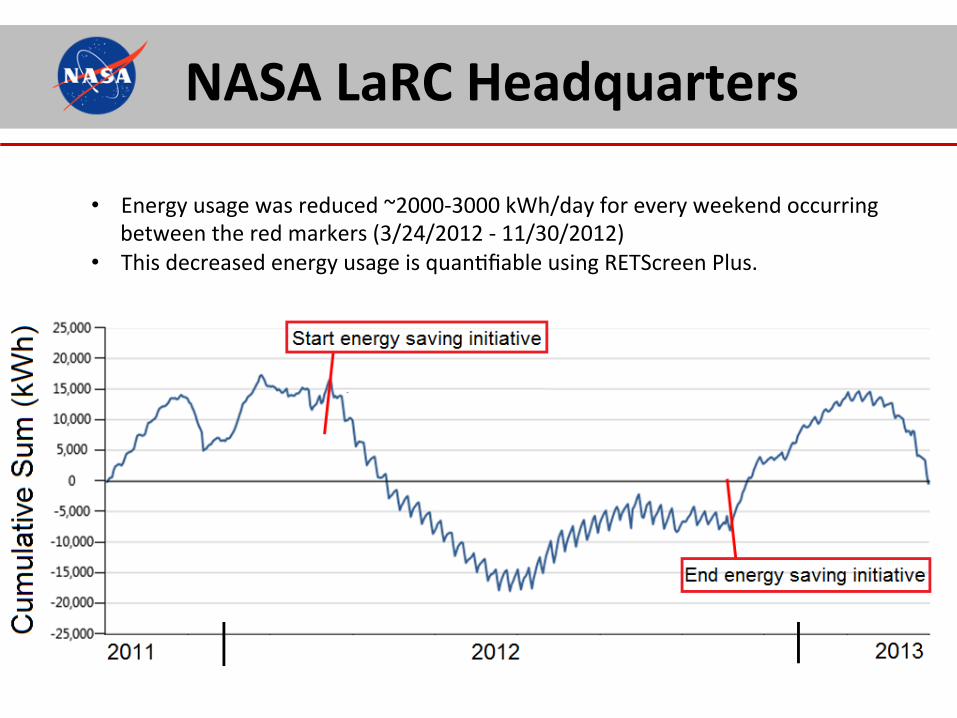
NASA LaRC Headquarters
• Energy usage was reduced ~2000-‐3000 kWh/day for every weekend occurring between the red markers (3/24/2012 -‐ 11/30/2012)
• This decreased energy usage is quanSfiable using RETScreen Plus.

Summary
NASA solar and meteorological
data sets
RETScreen Plus so`ware
MulSvariate analysis
Energy analysis and monitoring normalized by weather parameters
Custom reports and templates to support
energy decision-‐making tailored for:
Facility operators Managers
Senior decision-‐makers
Metered building energy consumpSon and producSon data
Inputs
Output

Conclusions
• RETScreen Plus so`ware has shown to be a valuable instrument in managing ongoing energy usage in commercial buildings as described by the case studies in this report.
• Provides means of idenSfying the validity of new energy efficiency projects.
• The availability of NASA Surface meteorology and Solar Energy data to RETScreen users has increased spaSal resoluSon of meteorological data to a 1°x1° global grid system within days of real-‐Sme.
Supplemental Slides

RETScreen 4
RETScreen Suite comprised of two modules: • RETScreen Plus, as discussed. (Pre-‐feasibility analysis)
• RETScreen 4 (Feasibility analysis) – an Excel-‐based clean energy project analysis so`ware tool – allows users to develop project models and generate a five-‐step analysis including energy usage, cost, emissions, financial benefits, and risk.
– Usually the next step a`er using RETScreen 4 for pre-‐feasibility.
Related Documents


