0RQLWRULQJ :LQGRZV 6\VWHPV ZLWK 3RZHU6KHOO 6FLHQFH/RJLF YHUVLRQ

Welcome message from author
This document is posted to help you gain knowledge. Please leave a comment to let me know what you think about it! Share it to your friends and learn new things together.
Transcript

Monitoring Windows Systems withPowerShellScienceLogic version 8.9.1
Table of Contents
Introduction 4Monitoring Windows Devices in the ScienceLogic Platform 5What is SNMP? 5What is PowerShell? 5PowerPacks 6
Configuring Windows Systems for Monitoring with SNMP 7Configuring SNMP for Windows Server 2016 andWindows Server 2012 8Configuring Ping Responses 8Installing the SNMP Service 9Configuring the SNMP Service 14Configuring the Firewall to Allow SNMP Requests 19Configuring Device Classes for Windows Server 2016 andWindows 10 19Manually Align the Device Class 20Edit the Registry Key 20
Configuring SNMP for Windows Server 2008 21Configuring Ping Responses 21Installing the SNMP Service 22Configuring the SNMP Service 25Configuring the Firewall to Allow SNMP Requests 30
Configuring Windows Servers for Monitoring with PowerShell 31Configuring PowerShell 32Step 1: Configuring the User Account for the ScienceLogic Platform 32Option 1: Creating an Active Directory Account 33Option 2: Creating a Local User Account with Administrator Access 33Option 3: Creating a Non-Administrator Local User Account 34Optional: Configuring the User Account for Remote PowerShell Access to Microsoft Exchange Server 35Optional: Configuring the User Account for Remote PowerShell Access to Hyper-V Servers 36Creating a User Group and Adding a User in Active Directory 36Setting the Session Configuration Parameters and Group Permissions 36Creating a PowerShell Credential 37
Step 2: Configuring a Server Authentication Certificate 37Option 1: Using the Microsoft Management Console to Create a Self-Signed Authentication Certificate 38Option 2: Using the MakeCert Tool to Create a Self-Signed Authentication Certificate 40Option 3: Using PowerShell Commands to Create a Self-Signed Authentication Certificate 40
Step 3: Configuring Windows Remote Management 41Option 1: Using a Script to Configure Windows Remote Management 41Option 2: Manually Configuring Windows Remote Management 47Option 3: Using a Group Policy to Configure Windows Remote Management 49
Step 4: Configuring aWindows Management Proxy 67Step 5: Increasing the Number of PowerShell Dynamic Applications That Can Run Simultaneously 68
SNMP and PowerShell Dynamic Applications for Windows Devices 69SNMP Dynamic Applications for Windows Devices 70PowerShell Dynamic Applications 70Microsoft: Active Directory Server 70Microsoft: DHCP Server 71Microsoft: DNS Server 71Microsoft: Exchange Server 72Microsoft: Exchange Server 2010 72Microsoft: Hyper-V Server 73Microsoft: IIS Server 74
Microsoft: Lync Server 2010 74Microsoft: SharePoint Server 75Microsoft: Skype for Business 75Microsoft: SQL Server 76Microsoft: Windows Server 77Microsoft: Windows Server Services 78Run Book Automations and Actions Associated with PowerShell Dynamic Applications for WindowsServers 78Error Messages for PowerShell Collection 79
Creating SNMP and PowerShell Credentials for Windows Devices 81Creating an SNMP Credential 81Creating a PowerShell Credential 84Testing Windows Credentials 87SNMP Credential Test 87PowerShell Credential Test 87Running aWindows Credential Test 87
Discovering Component Devices on Hyper-V Systems 89Viewing Component Devices 89
Monitoring aWindows Cluster 91Monitoring Windows Clusters in the ScienceLogic Platform 91Discovering Cluster Nodes 92Aligning a Dynamic Application with a Cluster Node 92Disabling Collection of a Dynamic Application on a Device 93
Discovering the Cluster IP Address 94Aligning Dynamic Applications with the Cluster Device 96
Using a Device Template to Configure Dynamic Applications 97Windows Dashboards 99Installing the Microsoft Server Dashboards 99Microsoft: Active Directory Server Performance 101Microsoft: DNS Server Performance 104Microsoft: Exchange Server 2010 Performance 106Microsoft: Exchange Server 2013 Performance 109Microsoft: IIS Server Performance 112Microsoft: Lync Server 2010 Dashboards 114Microsoft: Lync Server 2010 Performance 114Microsoft: Lync Server 2010 Utilization 117
Microsoft: Skype for Business Dashboards 120Microsoft: Lync Server 2013 Performance 120Microsoft: Lync Server 2013 Utilization 123
Microsoft: SQL Server Performance 126Troubleshooting 130Troubleshooting WinRM Error Messages 130Debugging Code 401 Errors 131Debugging Code 500 Errors 132
Troubleshooting PowerShell Error Messages 133
Introduction
Chapter
1Introduction
Overview
This manual describes how to monitor Windows systems in the ScienceLogic platform using SNMP and PowerShellcredentials and Dynamic Applications.
The following sections provide an overview of SNMP and PowerShell, as well as the PowerPacks you can use tomonitor Windows systems in the ScienceLogic platform:
Monitoring Windows Devices in the ScienceLogic Platform 5
What is SNMP? 5
What is PowerShell? 5
PowerPacks 6
NOTE: ScienceLogic provides this documentation for the convenience of ScienceLogic customers. Some ofthe configuration information contained herein pertains to third-party vendor software, which issubject to change without notice to ScienceLogic. ScienceLogic makes every attempt to maintainaccurate technical information and cannot be held responsible for defects or changes in third-partyvendor software. There is no written or implied guarantee that information contained herein will workfor all third-party variants. See the End User License Agreement (EULA) for more information.
4
1
5
Monitoring Windows Devices in the ScienceLogic Platform
The ScienceLogic platform can monitor a Windows device using the following methods:
l Requesting information from the Windows SNMP agent
l Requesting information by executing a remote PowerShell command
l Requesting information from the Windows Management Instrumentation (WMI) agent
l Requesting information using the ScienceLogic agent
NOTE: This manual describes how to monitor Windows with SNMP and PowerShell. For more informationabout using WMI to monitor Windows devices, see theMonitoring Windows with WMI manual.
For more information about using the ScienceLogic agent to monitor Windows devices, see theMonitoringUsing the ScienceLogic Agentmanual.
What is SNMP?
SNMP (Simple Network Management Protocol) is a set of standard protocols for managing diverse computerhardware and software within a TCP/IP network. SNMP is the most common network protocol used by networkmonitoring and management applications to exchange management information between devices. TheScienceLogic platform uses this protocol and other protocols to collect availability and performance information.
SNMP uses a server-client structure. Clients are called agents. Devices and software that run SNMP are agents.The server is called themanagement system. The ScienceLogic platform is the management system.
Most network hardware is configured for SNMP and can be SNMP-enabled. Many enterprise software applicationsare also SNMP-compliant. When SNMP is running on a device, it uses a standard format to collect and store dataabout the device and/or software. For example, SNMP might collect information on each network interface andthe traffic for each interface. The ScienceLogic platform can then query the device to retrieve the stored data.
What is PowerShell?
Windows PowerShell is a command-line shell and scripting language for administration ofWindows systems. TheScienceLogic platform can execute PowerShell requests on target Windows devices via WinRM (Windows RemoteManagement). For an overview ofWindows PowerShell, see https://docs.microsoft.com/en-us/powershell/scripting/powershell-scripting?view=powershell-6.
The ScienceLogic platform supports the following PowerShell versions for monitoring Windows devices:
l PowerShell 3.0
l PowerShell 4.0
l PowerShell 5.1
Introduction
Introduction
PowerPacks
This manual describes content from the following PowerPack versions:
l Microsoft: Active Directory Server, version 100
l Microsoft: DHCP Server, version 1.0
l Microsoft: DNS Server, version 100
l Microsoft: Exchange Server, version 100
l Microsoft: Exchange Server 2010, version 1.2
l Microsoft: Hyper-V Server, version 100
l Microsoft: IIS Server, version 100
l Microsoft: Lync Server 2010, version 1.0
l Microsoft: SharePoint Server, version 1.0
l Microsoft: Skype for Business, version 100
l Microsoft: SQL Server, version 100
l Microsoft: Windows Server, version 106
l Microsoft: Windows Server Services, version 1.1
6
1
Configuring Windows Systems for Monitoring with SNMP
Chapter
2Configuring Windows Systems for Monitoring
with SNMP
Overview
The following sections describe how to configure Windows Server 2016, Windows Server 2012, andWindowsServer 2008 for monitoring by the ScienceLogic platform using SNMP:
Configuring SNMP for Windows Server 2016 and Windows Server 2012 8
Configuring Ping Responses 8
Installing the SNMP Service 9
Configuring the SNMP Service 14
Configuring the Firewall to Allow SNMP Requests 19
Configuring Device Classes for Windows Server 2016 and Windows 10 19
Manually Align the Device Class 20
Edit the Registry Key 20
Configuring SNMP for Windows Server 2008 21
Configuring Ping Responses 21
Installing the SNMP Service 22
Configuring the SNMP Service 25
Configuring the Firewall to Allow SNMP Requests 30
7
2
8
Configuring SNMP for Windows Server 2016 and WindowsServer 2012
To configure SNMP on aWindows 2016 Server or a Windows 2012 Server, you must:
1. Configure "ping" responses.
2. Install the SNMP service.
3. Configure the SNMP service.
4. Configure the firewall to allow SNMP requests.
5. Configure Device Classes. (Windows Server 2016 only)
Configuring Ping Responses
For the ScienceLogic platform to discover a device, including SNMP-enabled devices, the device must meet oneof the following requirements:
l The device must respond to an ICMP "Ping" request.
l One of the ports selected in the Detection Method & Port field for the discovery session must be open onthe device. If the Default Method option for the Detection Method & Port field is selected, the ScienceLogicplatform scans TCP ports 21, 22, 23, 25, and 80.
The default configuration for a Windows Server does not allow ICMP "Ping" requests and does not allowconnections to TCP ports 21, 22, 23, 25, or 80. Therefore, to discover a Windows Server in the ScienceLogicplatform, you must perform one of the following tasks:
l Reconfigure the firewall on the Windows Server to allow ICMP "Ping" requests. This section describes how toperform this task.
l Reconfigure the firewall on the Windows Server to allow connections to port 21, 22, 23, 25, or 80. If youhave already configured your Windows Server to accept SSH, FTP, Telnet, SMTP, or HTTP connections, thistask might have been completed already. You should perform this task only if you were already planning toallow SSH, FTP, Telnet, SMTP, or HTTP connections to your Windows Server.
l When you create the discovery session that will discover the Windows Server, select at least one port in theDetection Method & Port field that is open on the Windows Server. For example, if your Windows Server isconfigured as an MSSQL Server, you could select port 1433 (the default port for MSSQL Server) in theDetection Method & Port field.
To reconfigure the firewall on aWindows Server to allow ICMP "Ping" requests, perform the following steps:
1. In the Start menu search bar, enter "firewall" to open aWindows Firewall with Advanced Securitywindow.
2. In the left pane, select Inbound Rules.
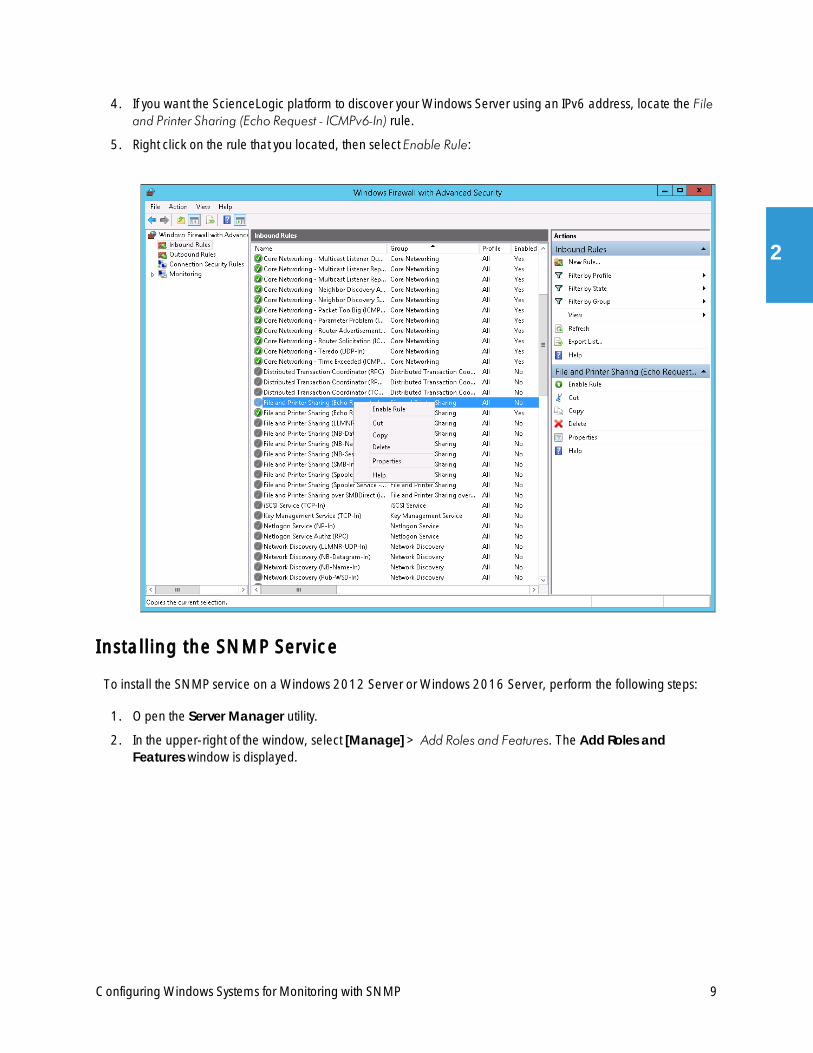
3. If you want the ScienceLogic platform to discover your Windows Server using an IPv4 address, locate the Fileand Printer Sharing (Echo Request - ICMPv4-In) rule.
Configuring Windows Systems for Monitoring with SNMP
Configuring Windows Systems for Monitoring with SNMP
4. If you want the ScienceLogic platform to discover your Windows Server using an IPv6 address, locate the Fileand Printer Sharing (Echo Request - ICMPv6-In) rule.
5. Right click on the rule that you located, then select Enable Rule:
Installing the SNMP Service
To install the SNMP service on aWindows 2012 Server or Windows 2016 Server, perform the following steps:
1. Open the Server Manager utility.
2. In the upper-right of the window, select [Manage]> Add Roles and Features. The Add Roles andFeatures window is displayed.
9
2
10
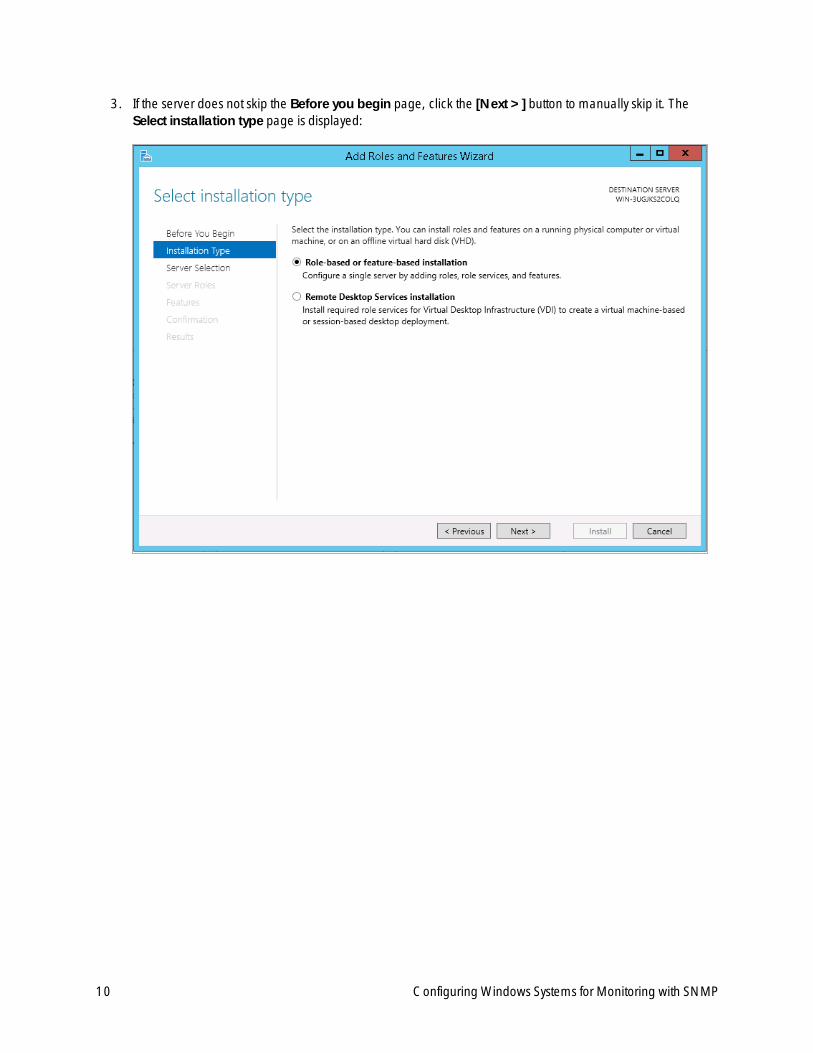
3. If the server does not skip the Before you begin page, click the [Next >] button to manually skip it. TheSelect installation type page is displayed:
Configuring Windows Systems for Monitoring with SNMP
Configuring Windows Systems for Monitoring with SNMP
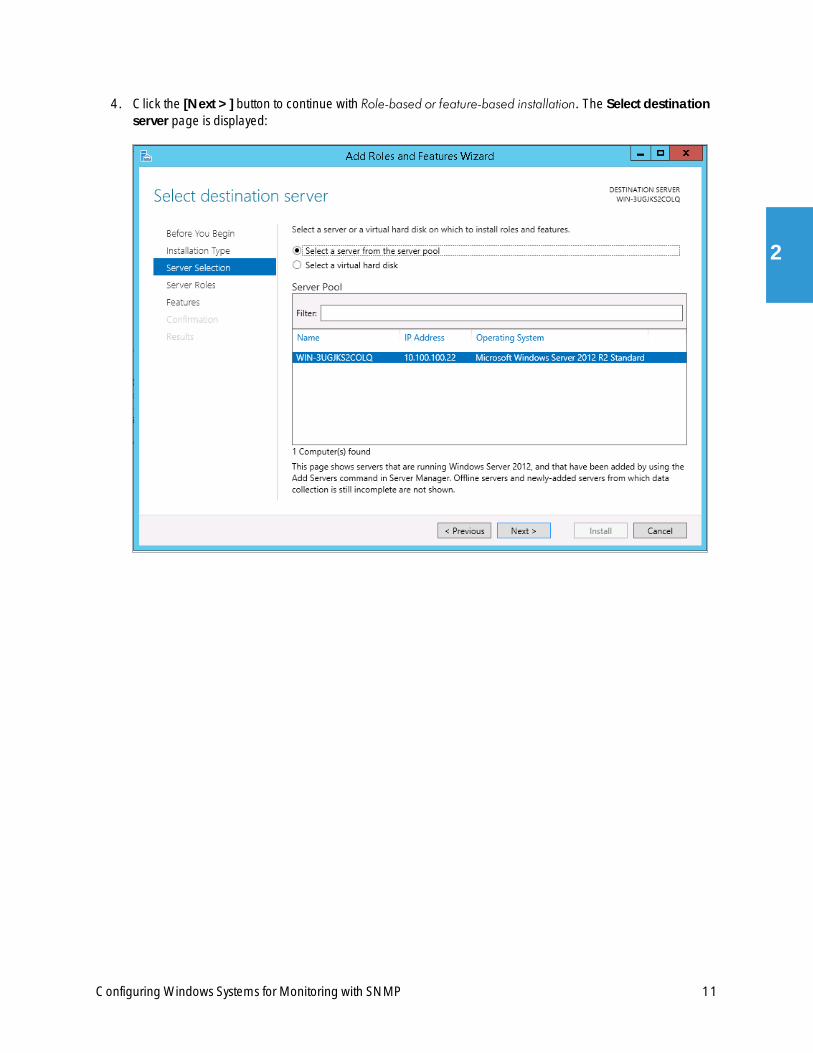
4. Click the [Next >] button to continue with Role-based or feature-based installation. The Select destinationserver page is displayed:
11
2

12
5. Ensure the Windows 2012 server or Windows 2016 Server is selected and then click the [Next >] button.The Select server roles page is displayed.
6. Click the [Next >] button without selecting any additional roles. The Select features page is displayed:
Configuring Windows Systems for Monitoring with SNMP
Configuring Windows Systems for Monitoring with SNMP
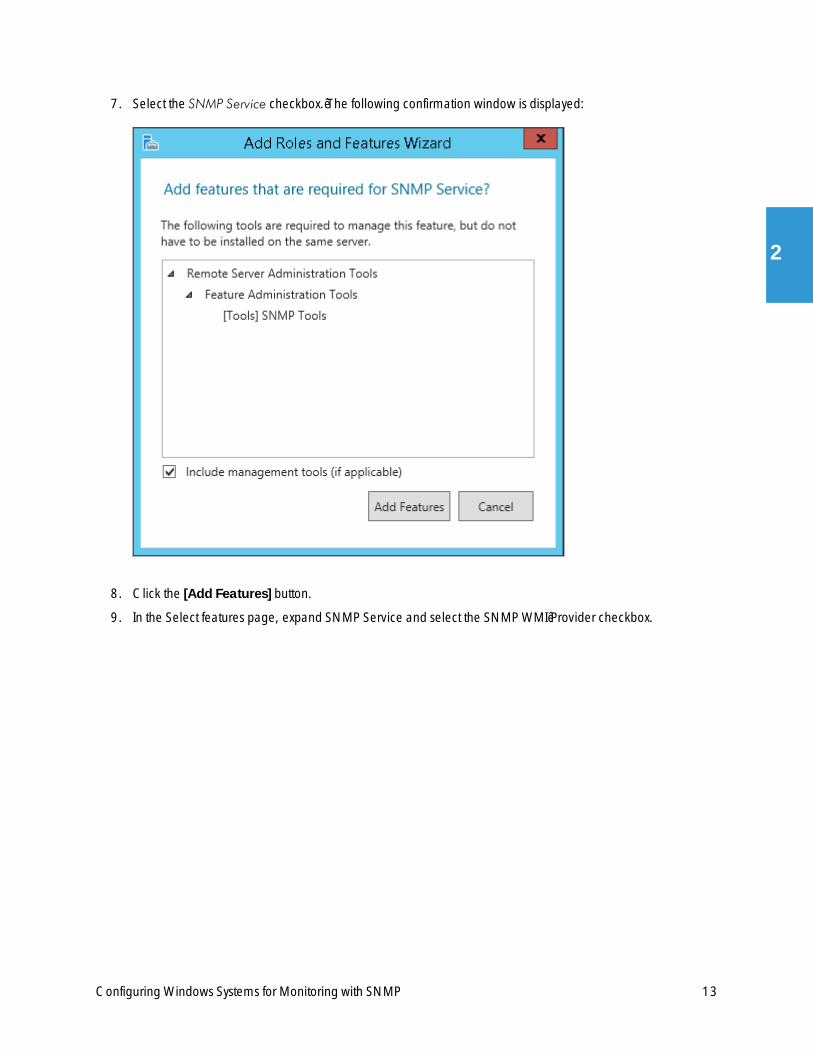
7. Select the SNMP Service checkbox. The following confirmation window is displayed:
8. Click the [Add Features] button.
9. In the Select features page, expand SNMP Service and select the SNMP WMI Provider checkbox.
13
2
14
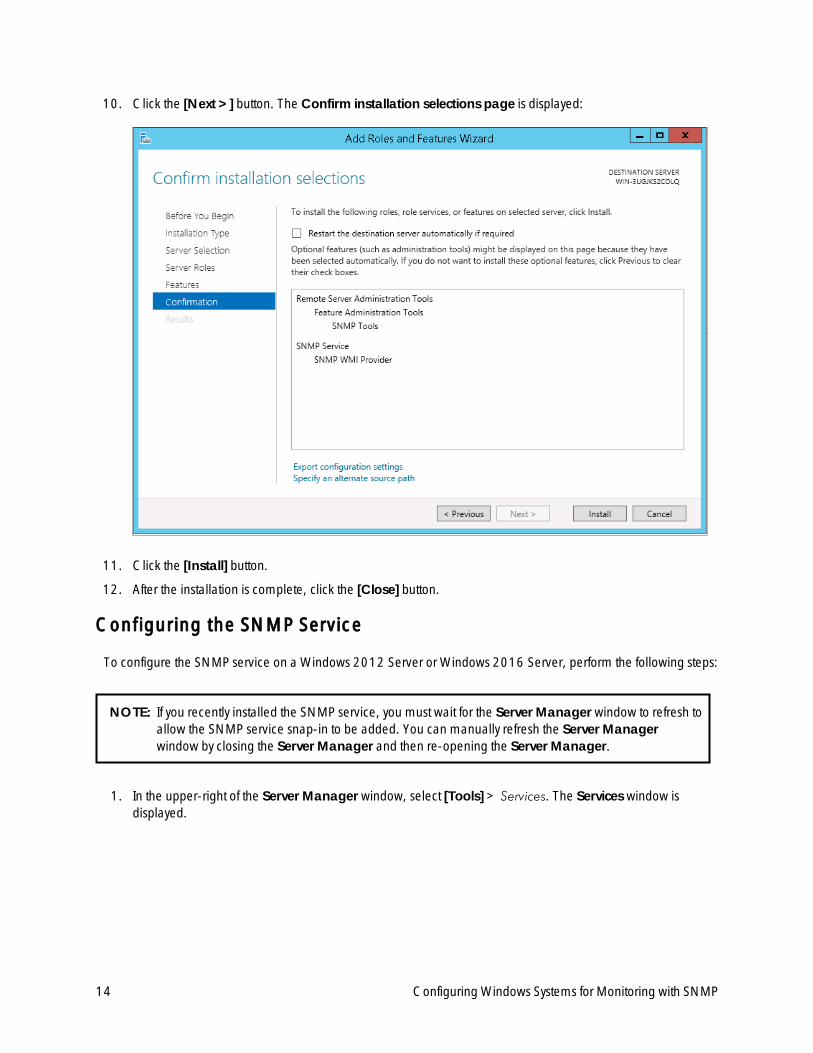
10. Click the [Next >] button. The Confirm installation selections page is displayed:
11. Click the [Install] button.
12. After the installation is complete, click the [Close] button.
Configuring the SNMP Service
To configure the SNMP service on aWindows 2012 Server or Windows 2016 Server, perform the following steps:
NOTE: If you recently installed the SNMP service, you must wait for the Server Manager window to refresh toallow the SNMP service snap-in to be added. You can manually refresh the Server Managerwindow by closing the Server Manager and then re-opening the Server Manager.
1. In the upper-right of the Server Manager window, select [Tools]> Services. The Services window isdisplayed.
Configuring Windows Systems for Monitoring with SNMP

Configuring Windows Systems for Monitoring with SNMP
2. In the Services window, right-click on SNMP Service, and then select Properties. The SNMP ServiceProperties window appears:
3. In the Startup type: field, select Automatic.
15
2
16
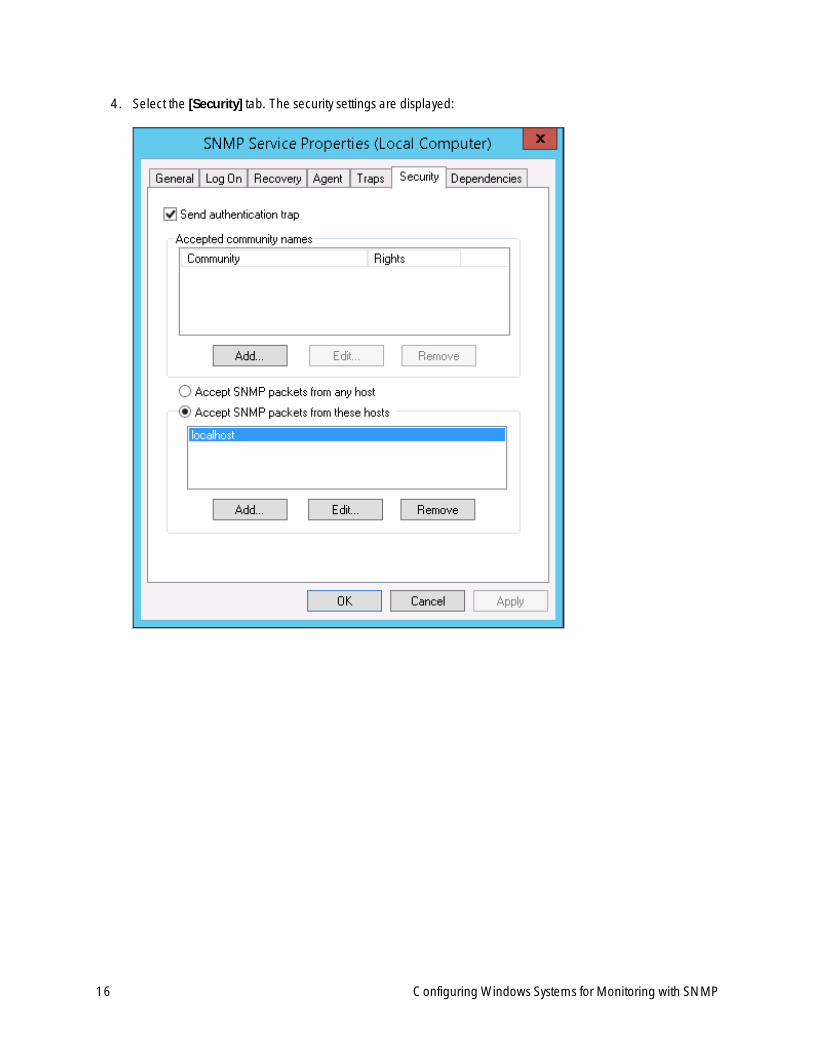
4. Select the [Security] tab. The security settings are displayed:
Configuring Windows Systems for Monitoring with SNMP
Configuring Windows Systems for Monitoring with SNMP
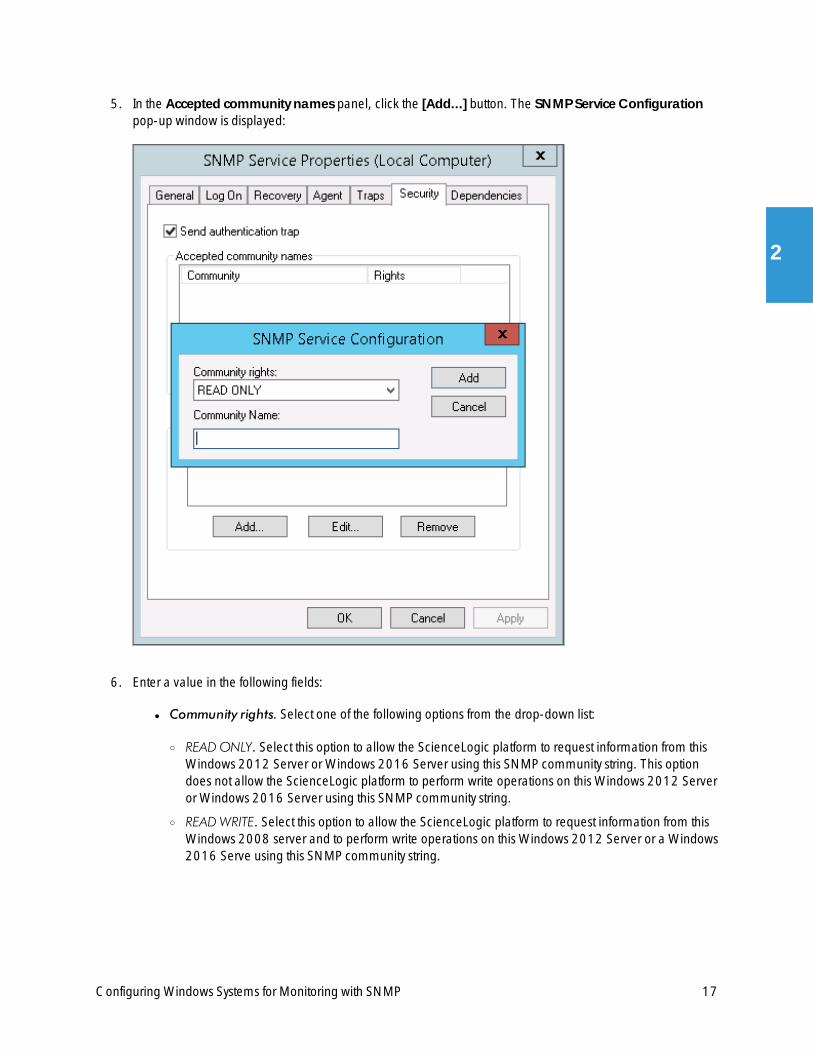
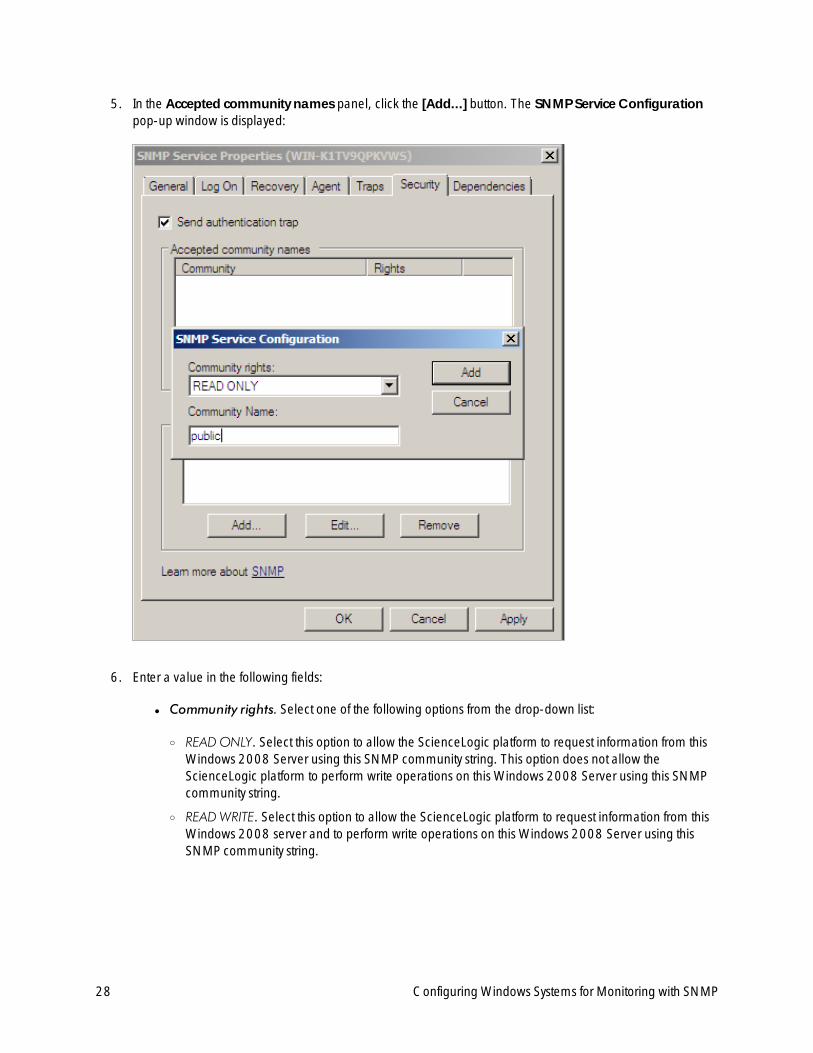
5. In the Accepted community names panel, click the [Add...] button. The SNMP Service Configurationpop-up window is displayed:
6. Enter a value in the following fields:
l Community rights. Select one of the following options from the drop-down list:
o READONLY. Select this option to allow the ScienceLogic platform to request information from thisWindows 2012 Server or Windows 2016 Server using this SNMP community string. This optiondoes not allow the ScienceLogic platform to perform write operations on this Windows 2012 Serveror Windows 2016 Server using this SNMP community string.
o READWRITE. Select this option to allow the ScienceLogic platform to request information from thisWindows 2008 server and to perform write operations on this Windows 2012 Server or a Windows2016 Serve using this SNMP community string.
17
2
18
l Community name. Enter the SNMP community string that the ScienceLogic platform will use whenmaking SNMP requests to this Windows 2012 Server or Windows 2016 Server. When you create acredential for this Windows 2012 Server or Windows 2016 Server in the ScienceLogic platform, youwill enter this community string in one the following fields in the Credential Editormodal page:
o SNMP Community (Read-Only). Enter the SNMP community string in this field if you selected READONLY in the Community rights drop-down list.
o SNMP Community (Read/Write). Enter the SNMP community string in this field if you selectedREADWRITE in the Community rights drop-down list.
7. Click the [Add] button to add the community string to the list of community strings this Windows 2012 Serveror Windows 2016 Server accepts.
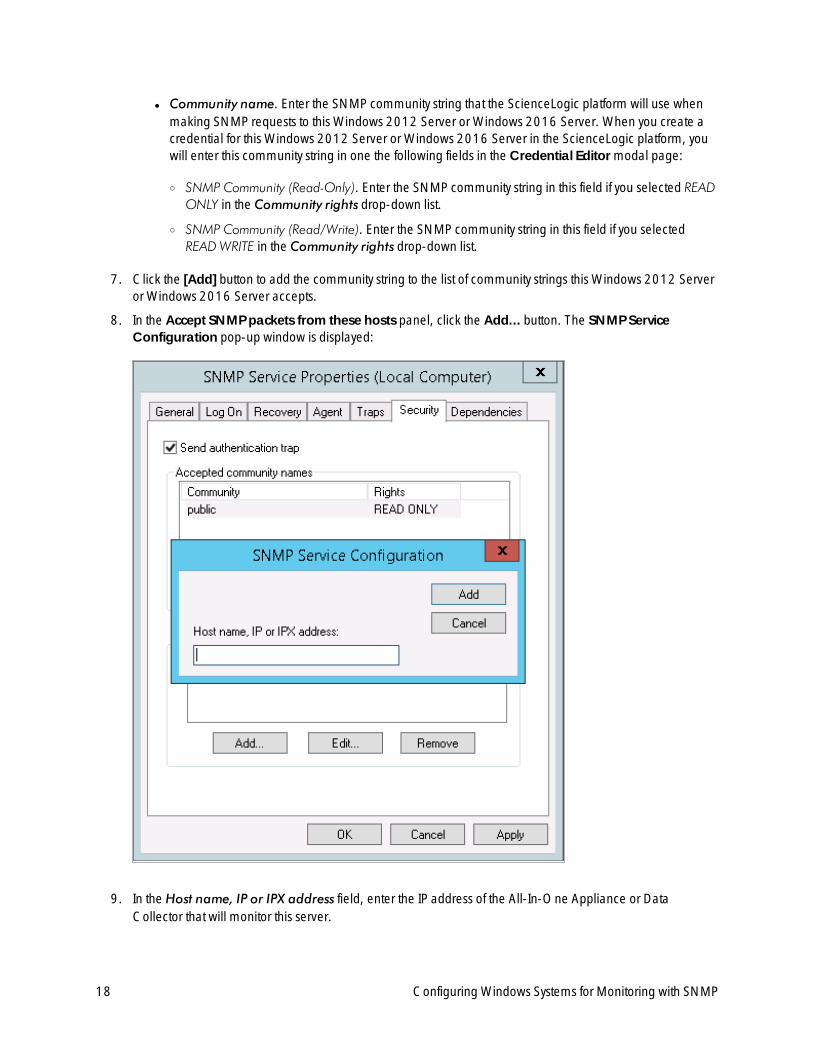
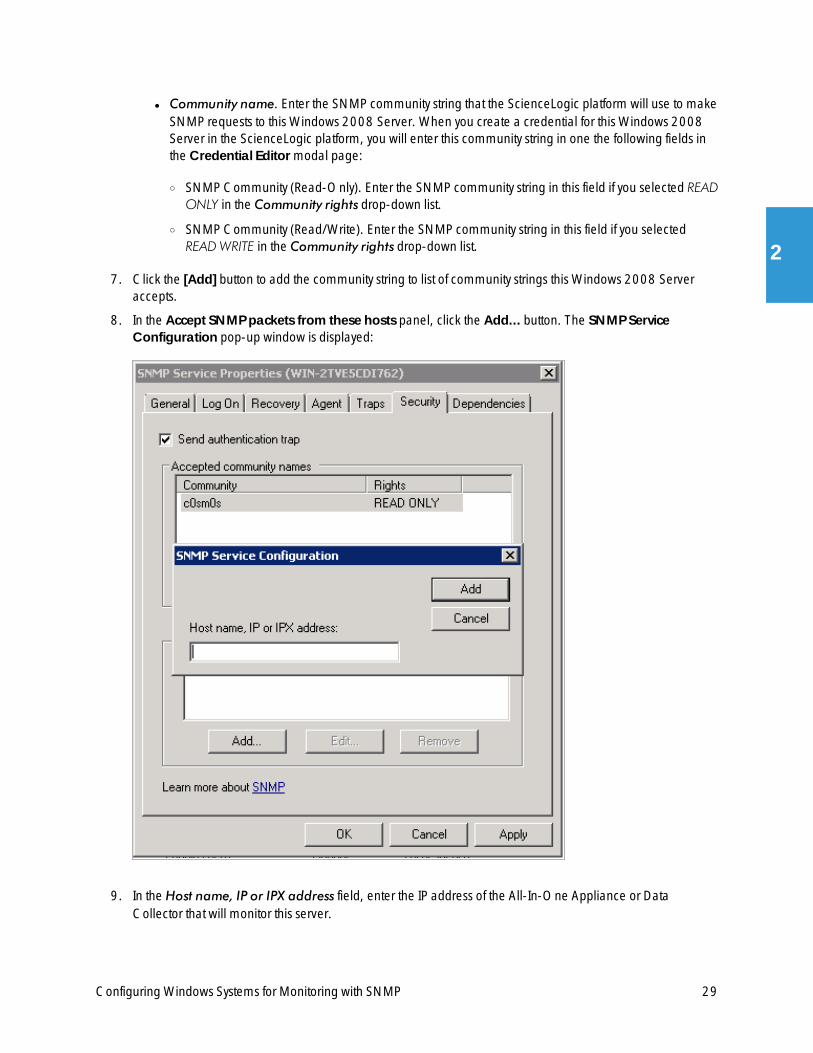
8. In the Accept SNMP packets from these hosts panel, click the Add... button. The SNMP ServiceConfiguration pop-up window is displayed:
9. In the Host name, IP or IPX address field, enter the IP address of the All-In-One Appliance or DataCollector that will monitor this server.
Configuring Windows Systems for Monitoring with SNMP
Configuring Windows Systems for Monitoring with SNMP
10. Click the [Add] button to add the appliance to the list of authorized devices.
11. If you are using the ScienceLogic platform with a distributed architecture, repeat steps 8–10 for each DataCollector in the collector group that will monitor this server.
12. Click the [Apply] button to apply all changes.
Configuring the Firewall to Allow SNMP Requests
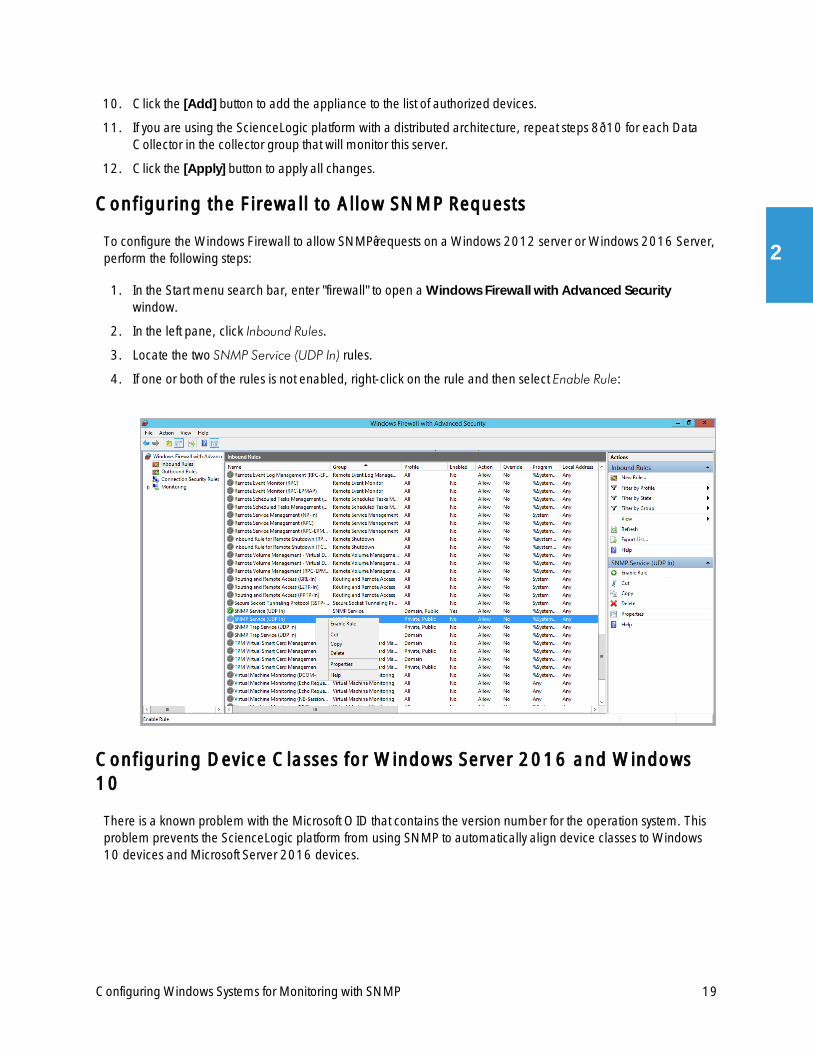
To configure the Windows Firewall to allow SNMP requests on aWindows 2012 server or Windows 2016 Server,perform the following steps:
1. In the Start menu search bar, enter "firewall" to open aWindows Firewall with Advanced Securitywindow.
2. In the left pane, click Inbound Rules.
3. Locate the two SNMP Service (UDP In) rules.
4. If one or both of the rules is not enabled, right-click on the rule and then select Enable Rule:
Configuring Device Classes for Windows Server 2016 and Windows10
There is a known problem with the Microsoft OID that contains the version number for the operation system. Thisproblem prevents the ScienceLogic platform from using SNMP to automatically align device classes toWindows10 devices and Microsoft Server 2016 devices.
19
2
20
Because Microsoft has deprecated support of SNMP on Microsoft Server 2016 andWindows 10, users who wantto use SNMP tomonitor Windows 10 and Microsoft Server 2016 should use one of these workarounds:
l After discovering a Microsoft Server 2016 or Windows 10 device, manually align the device class anddisable nightly auto-discovery
l Edit the registry key
Both workarounds are described in the following sections.
Manual ly A l ign the Device Class
After discovering Microsoft Server 2016 devices andWindows 10 devices, you can manually align a device classwith the discovered devices. To preserve your manual changes, you must disable nightly auto-discovery for thosedevices. You can manually align the discovered devices with one of these device classes:
l Windows Server 2016
l Windows Server 2016 Domain Controller
l Windows 10 Workstation
For details on manually assigning a device class to a device, follow the steps in the section onManually Changingthe Device Class for a Device in the Device Managementmanual chapter onManaging Device Classes andDevice Categories. For details on disabling nightly auto-discovery for a device, see the section onMaintaining theNew Device Class During Auto-Discovery in the Device Managementmanual chapter onManaging DeviceClasses and Device Categories.
Edi t the Registry Key
You can log in to the device that you want to monitor and manually edit the Windows Registry Key "HKEY_LOCAL_MACHINE\Software\Microsoft\Windows NT\CurrentVersion". You can define the value CurrentVersion as either"2016" or "10.0". To do this:
1. Click the Start menu and choose Run.
2. In the Run dialog box, type regedit and then click OK.
3. Navigate to HKEY_LOCAL_MACHINE\Software\Microsoft\Windows NT\CurrentVersion
4. In the right pane, double click on the Default key.
5. Enter the appropriate value:
l For Microsoft Server 2016, change the Value to 2016
l For Windows 10, change the Value to 10.0
Configuring Windows Systems for Monitoring with SNMP
Configuring Windows Systems for Monitoring with SNMP
Configuring SNMP for Windows Server 2008
To configure SNMP on aWindows 2008 Server, you must:
1. Configure "ping" responses.
2. Install the SNMP service.
3. Configure the SNMP service.
4. Configure the firewall to allow SNMP requests.
Configuring Ping Responses
For the ScienceLogic platform to discover a device, including SNMP-enabled devices, the device must meet oneof the following requirements:
l The device must respond to an ICMP "Ping" request.
l One of the ports selected in the Detection Method & Port field for the discovery session must be open onthe device. If the Default Method option for the Detection Method & Port field is selected, the ScienceLogicplatform scans TCP ports 21, 22, 23, 25, and 80.
The default configuration for a Windows Server does not allow ICMP "Ping" requests and does not allowconnections to TCP ports 21, 22, 23, 25, or 80. Therefore, to discover a Windows Server in the ScienceLogicplatform, you must perform one of the following tasks:
l Reconfigure the firewall on the Windows Server to allow ICMP "Ping" requests. This section describes how toperform this task.
l Reconfigure the firewall on the Windows Server to allow connections to port 21, 22, 23, 25, or 80. If youhave already configured your Windows Server to accept SSH, FTP, Telnet, SMTP, or HTTP connections, thistask might have been completed already. You should perform this task only if you were already planning toallow SSH, FTP, Telnet, SMTP, or HTTP connections to your Windows Server.
l When you create the discovery session that will discover the Windows Server, select at least one port in theDetection Method & Port field that is open on the Windows Server. For example, if your Windows Server isconfigured as an MSSQL Server, you could select port 1433 (the default port for MSSQL Server) in theDetection Method & Port field.
To reconfigure the firewall on aWindows Server to allow ICMP "Ping" requests, perform the following steps:
1. In the Start menu search bar, enter "firewall" to open aWindows Firewall with Advanced Securitywindow.
2. In the left pane, select Inbound Rules.
3. If you want the ScienceLogic platform to discover your Windows Server using an IPv4 address, locate the Fileand Printer Sharing (Echo Request - ICMPv4-In) rule.
4. If you want the ScienceLogic platform to discover your Windows Server using an IPv6 address, locate the Fileand Printer Sharing (Echo Request - ICMPv6-In) rule.
21
2
22
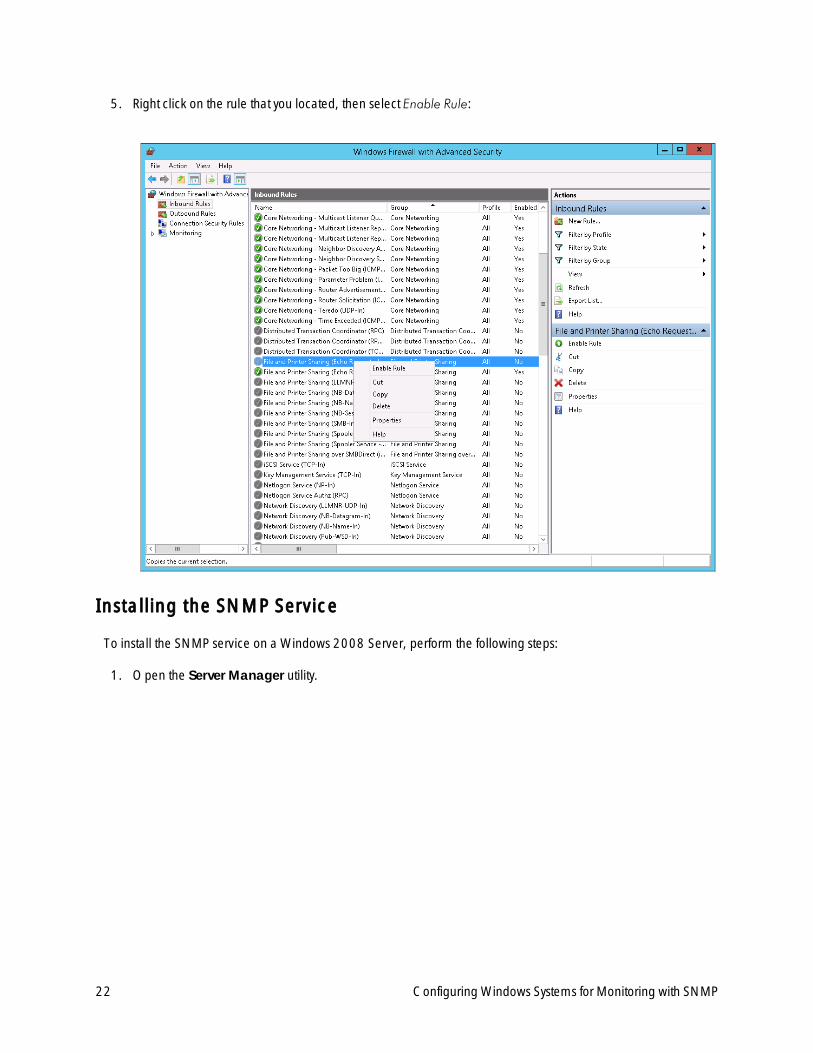
5. Right click on the rule that you located, then select Enable Rule:
Installing the SNMP Service
To install the SNMP service on aWindows 2008 Server, perform the following steps:
1. Open the Server Manager utility.
Configuring Windows Systems for Monitoring with SNMP
Configuring Windows Systems for Monitoring with SNMP
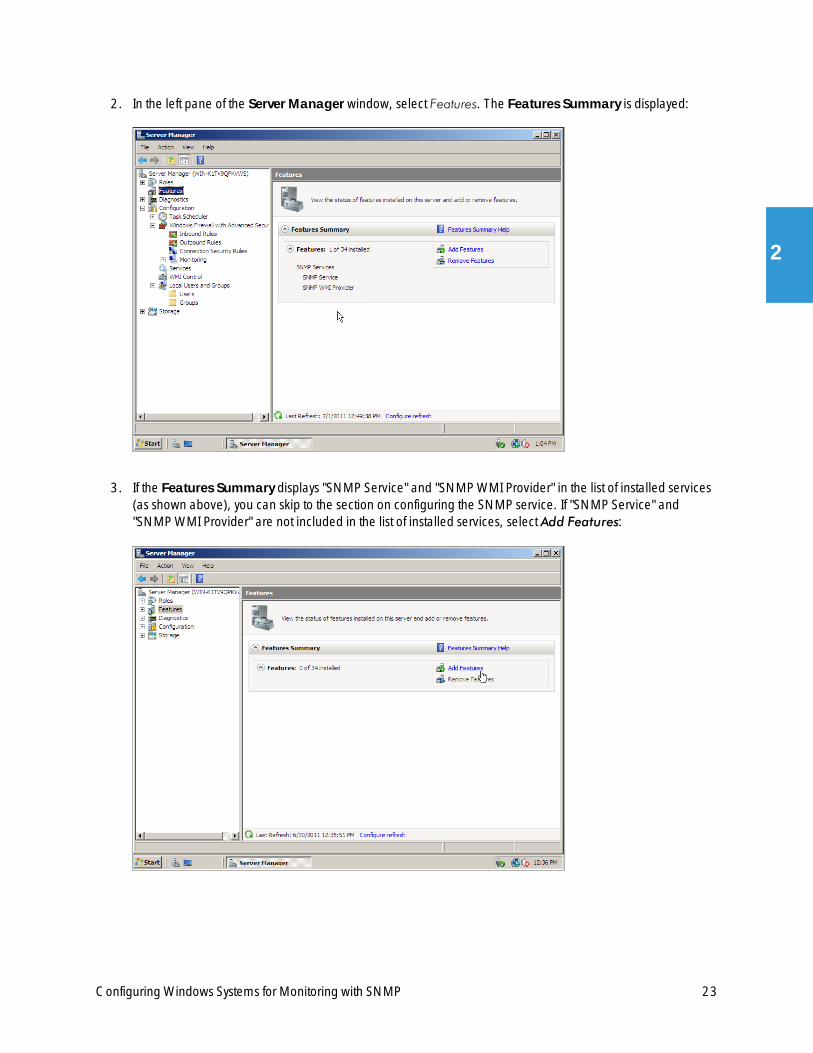
2. In the left pane of the Server Manager window, select Features. The Features Summary is displayed:
3. If the Features Summary displays "SNMP Service" and "SNMP WMI Provider" in the list of installed services(as shown above), you can skip to the section on configuring the SNMP service. If "SNMP Service" and"SNMP WMI Provider" are not included in the list of installed services, select Add Features:
23
2

24
4. In the Select Features window, select SNMP Services:
5. Click the [Next >] button. The Confirm Installed Selections window is displayed with "SNMP Service" and"SNMP WMI Provider" in the list of features that will be installed:
Configuring Windows Systems for Monitoring with SNMP
Configuring Windows Systems for Monitoring with SNMP
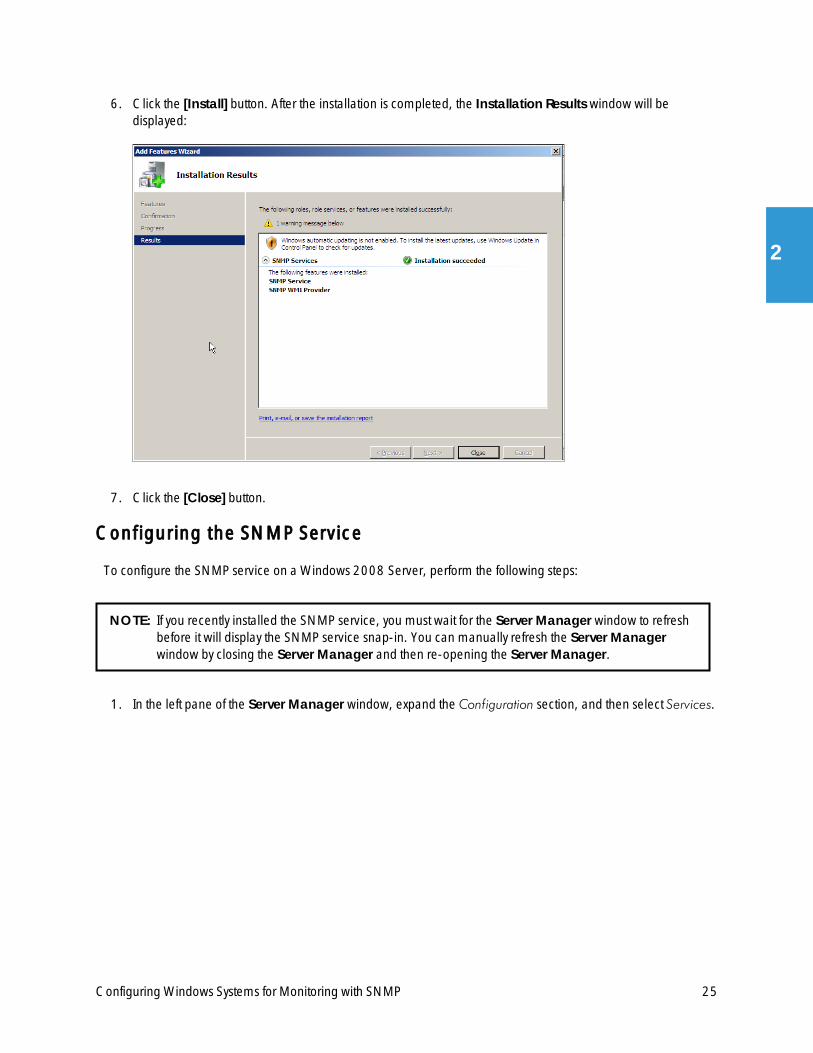
6. Click the [Install] button. After the installation is completed, the Installation Results window will bedisplayed:
7. Click the [Close] button.
Configuring the SNMP Service
To configure the SNMP service on aWindows 2008 Server, perform the following steps:
NOTE: If you recently installed the SNMP service, you must wait for the Server Manager window to refreshbefore it will display the SNMP service snap-in. You can manually refresh the Server Managerwindow by closing the Server Manager and then re-opening the Server Manager.
1. In the left pane of the Server Manager window, expand the Configuration section, and then select Services.
25
2
26
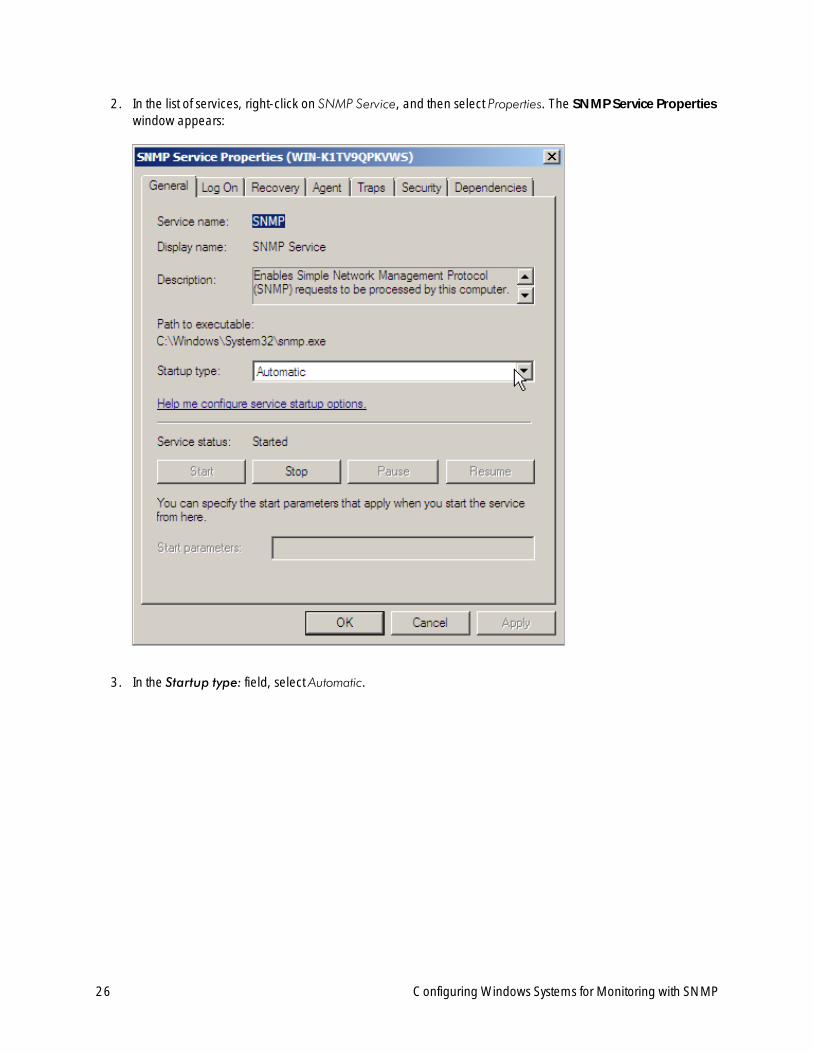
2. In the list of services, right-click on SNMP Service, and then select Properties. The SNMP Service Propertieswindow appears:
3. In the Startup type: field, select Automatic.
Configuring Windows Systems for Monitoring with SNMP
Configuring Windows Systems for Monitoring with SNMP
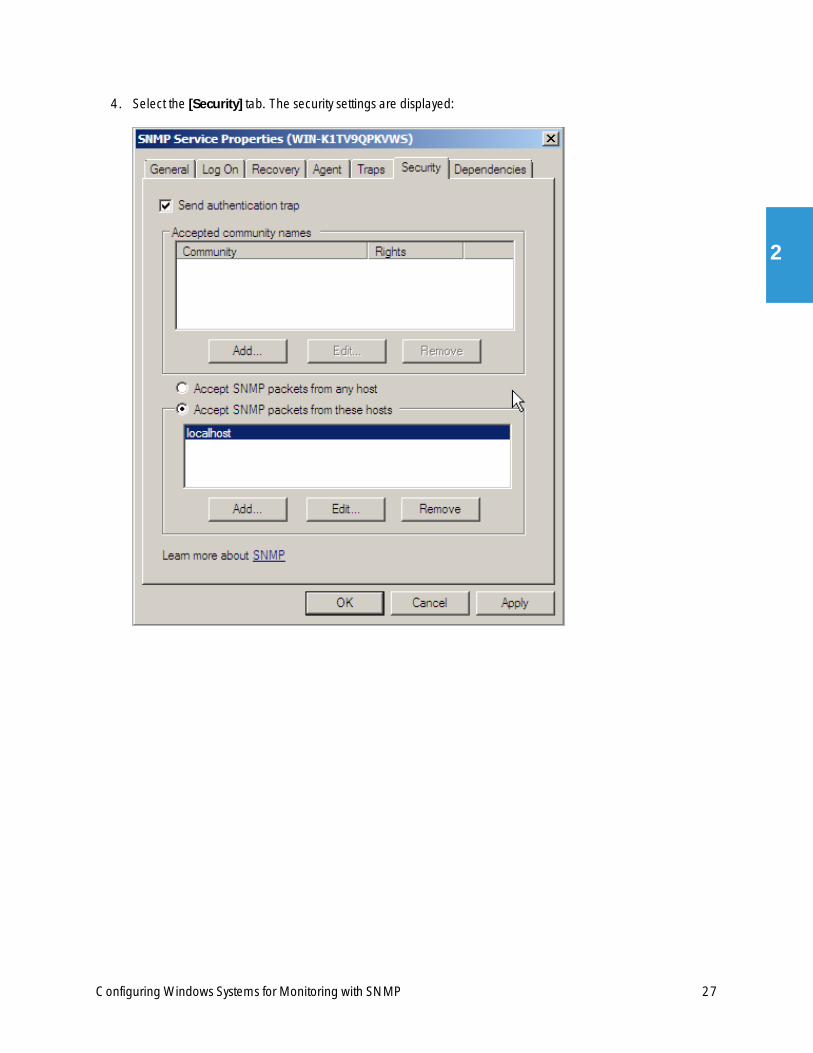
4. Select the [Security] tab. The security settings are displayed:
27
2
28
5. In the Accepted community names panel, click the [Add...] button. The SNMP Service Configurationpop-up window is displayed:
6. Enter a value in the following fields:
l Community rights. Select one of the following options from the drop-down list:
o READONLY. Select this option to allow the ScienceLogic platform to request information from thisWindows 2008 Server using this SNMP community string. This option does not allow theScienceLogic platform to perform write operations on this Windows 2008 Server using this SNMPcommunity string.
o READWRITE. Select this option to allow the ScienceLogic platform to request information from thisWindows 2008 server and to perform write operations on this Windows 2008 Server using thisSNMP community string.
Configuring Windows Systems for Monitoring with SNMP
Configuring Windows Systems for Monitoring with SNMP
l Community name. Enter the SNMP community string that the ScienceLogic platform will use to makeSNMP requests to this Windows 2008 Server. When you create a credential for this Windows 2008Server in the ScienceLogic platform, you will enter this community string in one the following fields inthe Credential Editormodal page:
o SNMP Community (Read-Only). Enter the SNMP community string in this field if you selected READONLY in the Community rights drop-down list.
o SNMP Community (Read/Write). Enter the SNMP community string in this field if you selectedREADWRITE in the Community rights drop-down list.
7. Click the [Add] button to add the community string to list of community strings this Windows 2008 Serveraccepts.
8. In the Accept SNMP packets from these hosts panel, click the Add... button. The SNMP ServiceConfiguration pop-up window is displayed:
9. In the Host name, IP or IPX address field, enter the IP address of the All-In-One Appliance or DataCollector that will monitor this server.
29
2
30
10. Click the [Add] button to add the appliance to the list of authorized devices.
11. If you are using the ScienceLogic platform with a distributed architecture, repeat steps 8–10 for each DataCollector in the collector group that will monitor this server.
12. Click the [Apply] button to apply all changes.
Configuring the Firewall to Allow SNMP Requests
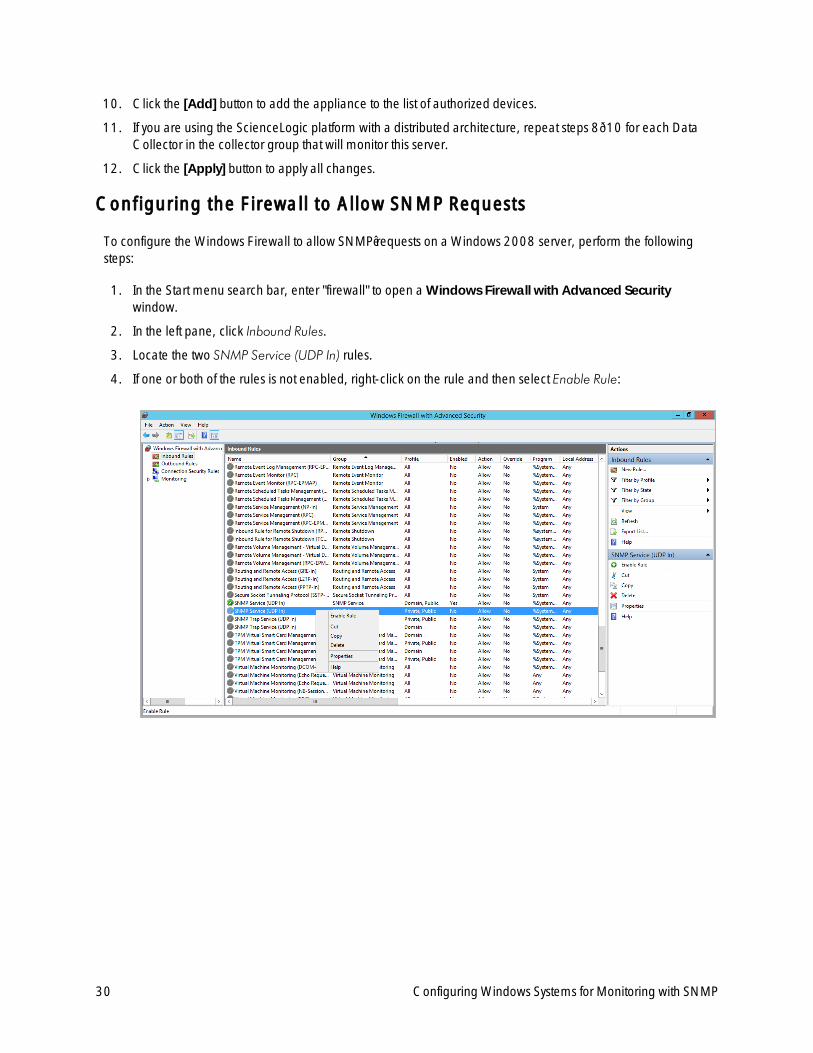
To configure the Windows Firewall to allow SNMP requests on aWindows 2008 server, perform the followingsteps:
1. In the Start menu search bar, enter "firewall" to open aWindows Firewall with Advanced Securitywindow.
2. In the left pane, click Inbound Rules.
3. Locate the two SNMP Service (UDP In) rules.
4. If one or both of the rules is not enabled, right-click on the rule and then select Enable Rule:
Configuring Windows Systems for Monitoring with SNMP
Configuring Windows Servers for Monitoring with PowerShell
Chapter
3Configuring Windows Servers for Monitoring
with PowerShell
Overview
The following sections describe how to configure Windows Server 2016, 2012, 2012 R2, or 2008 R2 formonitoring by the ScienceLogic platform using PowerShell:
Configuring PowerShell 32
Step 1: Configuring the User Account for the ScienceLogic Platform 32
Option 1: Creating an Active Directory Account 33
Option 2: Creating a Local User Account with Administrator Access 33
Option 3: Creating a Non-Administrator Local User Account 34
Optional: Configuring the User Account for Remote PowerShell Access to Microsoft Exchange Server 35
Optional: Configuring the User Account for Remote PowerShell Access to Hyper-V Servers 36
Creating a User Group and Adding a User in Active Directory 36
Setting the Session Configuration Parameters and Group Permissions 36
Creating a PowerShell Credential 37
Step 2: Configuring a Server Authentication Certificate 37
Option 1: Using the Microsoft Management Console to Create a Self-Signed Authentication Certificate 38
Option 2: Using the MakeCert Tool to Create a Self-Signed Authentication Certificate 40
Option 3: Using PowerShell Commands to Create a Self-Signed Authentication Certificate 40
Step 3: Configuring Windows Remote Management 41
Option 1: Using a Script to Configure Windows Remote Management 41
Option 2: Manually Configuring Windows Remote Management 47
31
3
32
Option 3: Using a Group Policy to Configure Windows Remote Management 49
Step 4: Configuring a WindowsManagement Proxy 67
Step 5: Increasing the Number of PowerShell Dynamic Applications That Can Run Simultaneously 68
Configuring PowerShell
Tomonitor a Windows Server using PowerShell Dynamic Applications, you must configure the Windows Server toallow remote access from the ScienceLogic platform. To do so, you must perform the following general steps:
1. Configure a user account that the platform will use to connect to the Windows Server. The user accountcan either be a local account or an Active Directory account.
TIP: For ease-of-configuration, ScienceLogic recommends using an Active Directory account that is a memberof the Local Administrator's group on the Windows Server.
2. Configure a Server Authentication Certificate to encrypt communication between the platform and theWindows Server.
NOTE: If you have created an Active Directory account on the Windows Server, or if your network includes aMicrosoft Certificate server, you can skip this step. You must configure a Server AuthenticationCertificate only if you have created a local account on the Windows Server and your network doesnot include a Microsoft Certificate server.
3. Configure Windows Remote Management.
4. Optionally, configure a Windows server as a WindowsManagement Proxy.
NOTE: If you are configuring multiple Windows servers for monitoring by the ScienceLogic platform, you canapply these settings using a Group Policy.
5. Optionally, you can increase the number of PowerShell Dynamic Applications that can runsimultaneously against a single Windows server.
Step 1: Configuring the User Account for the ScienceLogicPlatform
To enable the ScienceLogic platform to monitor Windows servers, you must first configure a user account on aWindows Server that the platform can use to make PowerShell requests. You will include this user accountinformation when creating the PowerShell credential creating the PowerShell credential that the platform usesto collect data from the Windows Server.
Configuring Windows Servers for Monitoring with PowerShell
Configuring Windows Servers for Monitoring with PowerShell
To configure the Windows Server user account that the ScienceLogic platform can use to make PowerShellrequests, complete one of the following options:
l Option 1:Create an Active Directory Account
l Option 2:Create a local user account with Local Administrator access
l Option 3:Create a non-administrator local user account
TIP: For ease-of-configuration, ScienceLogic recommends creating an Active Directory user account.
After creating your Windows Server user account, depending on your setup and the servers you want to monitor,you might also need to configure the user account for remote PowerShell access to the following server types:
l Microsoft Exchange Server
l Hyper-V Servers
Option 1: Creat ing an Act ive Directory Account
If you have Local Administrator access to the Windows servers that you want to monitor with PowerShell or WinRM,you can create an Active Directory account that is a member of the Local Administrator group on each server youwant to monitor. For instructions, consult Microsoft's documentation.
TIP: For ease-of-configuration, ScienceLogic recommends this method, as it does not require you to configurea Server Authentication Certificate to ensure secure data transfer and authentication.
After creating your Active Directory account:
l If you use the ScienceLogic platform to monitor Microsoft Exchange Servers, you must configure the useraccount for remote PowerShell access to Microsoft Exchange Server.
l If you use the ScienceLogic platform to monitor Hyper-V Servers, you must configure the user account forremote PowerShell access to the Hyper-V Servers.
l Otherwise, you can skip the remainder of this section and proceed to Step 3.
Option 2: Creat ing a Local User Account with Administrator Access
If you have Local Administrator access to the servers you want to monitor and are monitoring Windows Server2016 or Windows Server 2012, you can alternatively create a local user account with Local Administrator accessinstead of an Active Directory account. For instructions, consult Microsoft's documentation.
WARNING: This method does not work for Windows Server 2008.
33
3
34
After creating your local user account with Local Administrator access:
l If you use the ScienceLogic platform to monitor Microsoft Exchange Servers, you must configure the useraccount for remote PowerShell access to Microsoft Exchange Server.
l If you use the ScienceLogic platform to monitor Hyper-V Servers, you must configure the user account forremote PowerShell access to the Hyper-V Servers.
l Otherwise, you can skip the remainder of this section and proceed to Step 2.
Option 3: Creat ing a Non-Administrator Local User Account
If you do not have Local Administrator access to the servers that you want to monitor with PowerShell or WinRM,then you must first create a domain user account or create a non-administrator local user account on the WindowsServer. For instructions, consult Microsoft's documentation.
After creating your local non-administrator user account:
l You must configure the Windows Servers to allow that non-administrator user access. To do so, follow thesteps in this section.
l If you use the ScienceLogic platform to monitor Microsoft Exchange Servers, you must also configure theuser account for remote PowerShell access to Microsoft Exchange Server.
l If you use the ScienceLogic platform to monitor Hyper-V Servers, you must also configure the user accountfor remote PowerShell access to the Hyper-V Servers.
To configure Windows Servers to allow access by your non-administrator user account:
1. Log in toWindows PowerShell as an administrator and execute the following command:
winrm configsddl default
2. On the Permissions window, click the [Add] button, and then add the non-administrator domain user orgroup.
3. Select the Allow checkbox for the Read (Get, Enumerate, Subscribe) and Execute (Invoke) permissions forthe user, and then click [OK].
4. Access the Management console. To do this:
l In Windows Server 2008, click [Start], right-click [Computer], click [Manager], and then expand[Configuration].
l In Windows Server 2016 and 2012, right-click the Windows icon, click [Computer Management],and then expand [Services and Applications].
5. Right-click on [WMI Control] and then select Properties.
6. On theWMI Control Properties window, click the [Security] tab, and then click the [Security] button.
7. Click the [Add] button, and then add the non-administrator domain user or group.
8. Select the Allow checkbox for the Execute Methods, Enable Account, and Remote Enable permissions,and then click [OK].
9. On theWMI Control Properties window, click the [Advanced] tab.
Configuring Windows Servers for Monitoring with PowerShell
Configuring Windows Servers for Monitoring with PowerShell
10. Double-click on the user account (or group).
11. On the Permission Entry window, in the Type field, select Allow.
12. In the Applies to field, select This namespace and subnamespaces.
13. Select the Execute Methods, Enable Account, and Remote Enable permission checkboxes, and then click[OK].
14. Restart the WMI Service from services.msc.
NOTE: To open services.msc, press the Windows + R keys, type "services.msc", and then press Enter.
15. In the Management console, go to System Tools > Local Users and Groups >Groups.
16. Right-click Performance Monitor Users, and then select Properties.
17. On the PerformanceMonitor Users Properties window, click the [Add] button.
18. In the Enter the object names to select field, type the non-administrator domain user or group name, andthen click [Check Names].
19. Select the user or group name from the list and then click [OK].
20. In the PerformanceMonitor Users Properties window, click [OK].
21. Run cmd as an administrator and execute the following command:
sc sdset SCMANAGER D:(A;;CCLCRPRC;;;AU)(A;;CCLCRPWPRC;;;SY)(A;;KA;;;BA)S:(AU;FA;KA;;;WD)(AU;OIIOFA;GA;;;WD)
22. Optionally, you can create a self-signed certificate for WinRM by executing the following command:
$Cert = New-SelfSignedCertificate -CertstoreLocation Cert:\LocalMachine\My -DnsName"myHost"
23. Add an HTTPS listener by executing the following command:
New-Item -Path WSMan:\LocalHost\Listener -Transport HTTPS -Address * -CertificateThumbPrint $Cert.Thumbprint –Force
NOTE: This command should be entered on a single line.
24. Ensure that your local firewall allows inbound TCP connections on port 5986. You may have to create a newrule on Windows Firewall if one does not already exist.
Optional: Configuring the User Account for Remote PowerShell Accessto Microsoft Exchange Server
If you use the ScienceLogic platform to monitor Microsoft Exchange Servers:
35
3
36
1. Follow the steps in the section Configuring the User Account for the ScienceLogic platform.
2. Add the new user account to the “Server Management” Exchange security group in Active Directory.
3. The user account will then be able to connect to the relevant WinRM endpoint to use cmdlets installed withthe Exchange Management Shell. For example, this will give the user account access to the cmdlet “Get-ExchangeServer”.
Optional: Configuring the User Account for Remote PowerShell Accessto Hyper-V Servers
To use PowerShell Dynamic Applications to monitor a Hyper-V server, you must:
l Create a user group in Active Directory
l Add the user account you will use to monitor the Hyper-V server to the group
l Set the session configuration parameters on the Hyper-V Server
l Set the group permissions on the Hyper-V Server
l Create a PowerShell credential using the new user account
Creating a User Group and Adding a User in Active Directory
To create a group in Active Directory and add a user:
1. In Active Directory, in the same DC as the Hyper-V host you want to monitor, in the OU calledUsers, createa group. For example, we called our group PSSession Creators.
2. Add a user that meets the requirements for monitoring aWindows server via PowerShell to the group. This isthe user that you will specify in the PowerShell credential.
NOTE: For details on using Active Directory to perform these tasks, consult Microsoft's documentation.
Sett ing the Session Configuration Parameters and Group Permissions
To set the Session Configuration and the Group Permissions on the Hyper-V Server:
1. Login to the Hyper-V server.
2. Open a PowerShell session. Enter the following command:
Set-PSSessionConfiguration -ShowSecurityDescriptorUI -Name Microsoft.PowerShell
3. When prompted, select A.
Configuring Windows Servers for Monitoring with PowerShell
Configuring Windows Servers for Monitoring with PowerShell
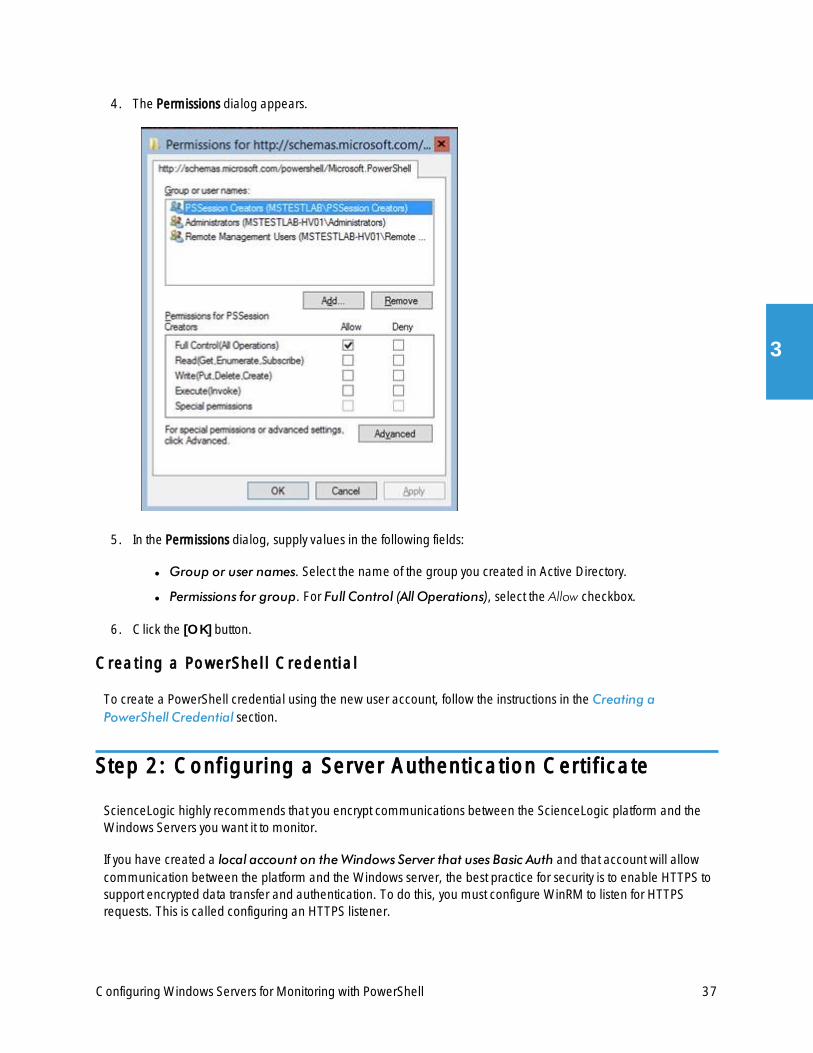
4. The Permissions dialog appears.
5. In the Permissions dialog, supply values in the following fields:
l Group or user names. Select the name of the group you created in Active Directory.
l Permissions for group. For Full Control (All Operations), select the Allow checkbox.
6. Click the [OK] button.
Creating a PowerShel l Credentia l
To create a PowerShell credential using the new user account, follow the instructions in the Creating aPowerShell Credential section.
Step 2: Configuring a Server Authentication Certif icate
ScienceLogic highly recommends that you encrypt communications between the ScienceLogic platform and theWindows Servers you want it to monitor.
If you have created a local account on theWindows Server that uses Basic Auth and that account will allowcommunication between the platform and the Windows server, the best practice for security is to enable HTTPS tosupport encrypted data transfer and authentication. To do this, you must configure WinRM to listen for HTTPSrequests. This is called configuring an HTTPS listener.
37
3
38
NOTE: For details on configuring WinRM on your Windows servers to use HTTPS, seehttps://support.microsoft.com/en-us/help/2019527/how-to-configure-winrm-for-https.
The sections below describe how to configure a Server Authentication Certificate on the Windows Server. This isonly one task included in configuring an HTTPS listener. However, not all users need to configure a ServerAuthentication Certificate.
To support encrypted data transfer and authentication between the ScienceLogic platform and the servers, one ofthe following must be true:
l You have created an Active Directory user account on the Windows Server to allow communicationbetween the platform and the server. In this scenario, Active Directory will use Kerberos and AES-256encryption to ensure secure data transfer and authentication, which means you do not need to configure aself-signed Server Authentication Certificate. You can skip this section and proceed to Step 3.
l You have created a local account on the Windows Server that uses Basic Auth to allow communicationbetween the platform and the server, and your network includes a Microsoft Certificate server. In thisscenario, you should work with your Microsoft administrator to get a certificate for your Windows Serverinstead of configuring a self-signed Server Authentication Certificate. You can skip this section andproceed to Step 3.
l You have created a local account on the Windows Server that uses Basic Auth to allow communicationbetween the platform and the server, and your network does not include a Microsoft Certificate server. Inthis scenario, you must configure a self-signed Server Authentication Certificate on the Windows Server thatyou want to monitor with the platform using one of the following methods:
o Option 1:Use the Microsoft Management Console.
o Option 2: If your Windows Server includes Windows Software Development Kit (SDK), you can usethe makecert tool.
o Option 3: If you are running PowerShell 4.0 or later, you can use the New-SelfSignedCertificateand Export-PfxCertificate commands.
NOTE: Self-signed certificates are appropriate for use on a trusted network, such as a LAN that includes botha ScienceLogic Data Collector and the Windows Server to be monitored.
Option 1: Using the Microsoft Management Console to Create a Self-Signed Authent icat ion Cert if icate
To use theMicrosoft Management Console to create a self-signed certificate:
1. Log in to the Windows Server that you want to monitor with the ScienceLogic platform.
2. In the Start menu search bar, enter "mmc" to open aMicrosoft Management Console window.
Configuring Windows Servers for Monitoring with PowerShell
Configuring Windows Servers for Monitoring with PowerShell
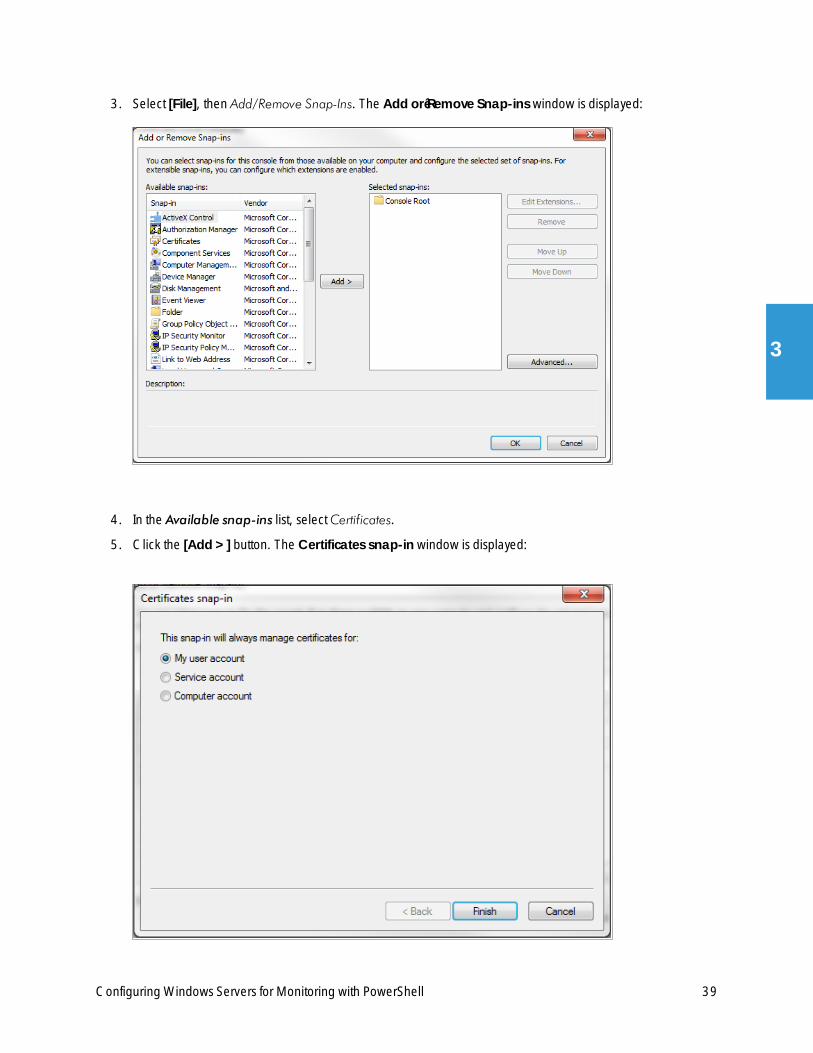
3. Select [File], then Add/Remove Snap-Ins. The Add or Remove Snap-ins window is displayed:
4. In the Available snap-ins list, selectCertificates.
5. Click the [Add >] button. The Certificates snap-in window is displayed:
39
3

40
6. SelectComputer account.
7. Click the [Next >] button.
8. Click the [Finish] button.
9. In the Add or Remove Snap-ins window, click the [OK] button.
10. In the left pane of theMicrosoft Management Console window, navigate to Console Root > Certificates(Local Computer) > Personal.
11. Right-click in the middle pane and select All Tasks> Request New Certificate.... The CertificateEnrollment window is displayed.
12. Click the [Next] button. The Select Certificate Enrollment Policy page is displayed.
13. Select Active Directory Enrollment Policy.
14. Click the [Next] button. The Request Certificates page is displayed.
15. Select the Computer checkbox.
16. Click the [Enroll] button.
17. After the certificate is installed, click the [Finish] button.
Option 2: Using the MakeCert Tool to Create a Self-SignedAuthent icat ion Cert if icate
If your Windows system includes Windows Software Development Kit (SDK), you can use the MakeCert tool that isincluded in the kit to create a self-signed certificate.
l For information on the MakeCert tool, see:
https://msdn.microsoft.com/library/windows/desktop/aa386968.aspx
l For details on creating a self-signed certificate with MakeCert and installing the certificate in the Trusted RootCertification Authorities store, see:
https://msdn.microsoft.com/en-us/library/ms733813%28v=vs.110%29.aspx
Option 3: Using PowerShell Commands to Create a Self-SignedAuthent icat ion Cert if icate
If your Windows system includes PowerShell 4.0 or later, you can use the following PowerShell commands tocreate a self-signed certificate:
l You can use the New-SelfSignCertificate command to create a self-signed certificate. For information onNew-SelfSignCertificate, see:
https://technet.microsoft.com/en-us/library/hh848633%28v=wps.630%29.aspx
l You can use the Export-PfxCertificate command to export the private certificate. For information on theExport-PfxCertificate, see:
https://technet.microsoft.com/en-us/library/hh848635.aspx
Configuring Windows Servers for Monitoring with PowerShell
Configuring Windows Servers for Monitoring with PowerShell
Step 3: Configuring Windows Remote Management
To provide the ScienceLogic platform remote access to the Windows Servers you want to monitor, you mustconfigure Windows Remote Management.
NOTE: This step is required regardless of the user account type that the platform will use to connect to theWindows Server.
There are three ways to configure Windows Remote Management:
l Option 1:Use the script provided by ScienceLogic.
l Option 2:Manually perform the configuration.
l Option 3:Use a group policy.
Option 1: Using a Script to Configure Windows Remote Management
ScienceLogic provides a PowerShell script on the ScienceLogic portal that automates the installation andconfiguration ofWindows Remote Management.
To use the PowerShell script, perform the following steps:
1. Log in to the ScienceLogic portal, go toDownloads >Miscelleanous, and download the PowerShell scriptnamedWinRM Configuration Wizard Script (winrm_configuration_wizard.ps1). The link is :https://portal.sciencelogic.com/portal/miscellaneous/download/3943
2. Unzip the downloaded file.
3. Log in as an administrator to the Windows server you want to monitor with the ScienceLogic platform. Youcan log in directly or use Remote Desktop to log in.
NOTE: During login, use the username and password that you will use later to allow the ScienceLogicplatform to monitor the Windows server.
4. Copy the PowerShell script namedwinrm_configuration_wizard.ps1 to the Windows server that you wantto monitor with the ScienceLogic platform.
5. Right-click on the PowerShell icon and select Run As Administrator.
6. At the PowerShell prompt, navigate to the directory where you copied the PowerShell script namedwinrm_configuration_wizard.ps1.
7. At the PowerShell prompt, enter the following to enable execution of the script:
Set-ExecutionPolicy -ExecutionPolicy Unrestricted -Scope Process -Force
41
3
42
NOTE: The execution policy setting persists only during the current PowerShell session.
8. After the warning text, select Y.
NOTE: If your Windows configuration requires further steps to allow execution of the script, PowerShell willdisplay prompts. Follow the prompts.
9. At the PowerShell prompt, enter the following to execute the script:
.\winrm_configuration_wizard.ps1
NOTE: To execute the script in debug mode, enter the following:.\winrm_configuration_wizard.ps1 -debug
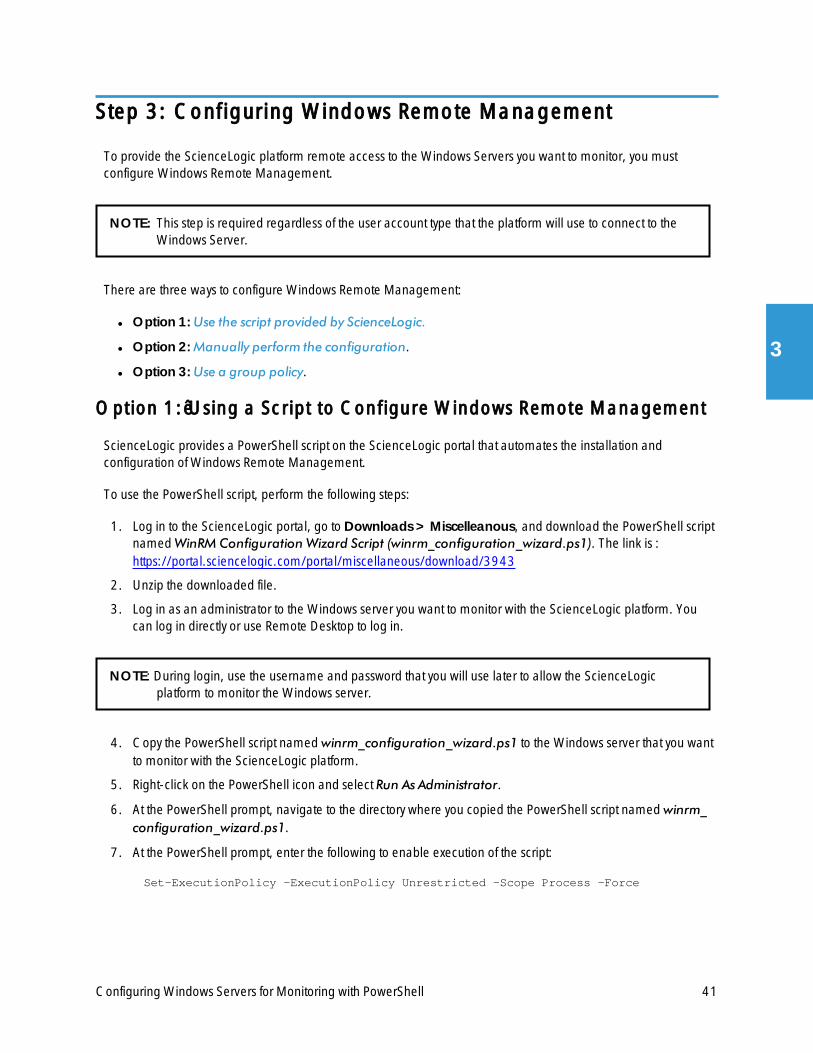
10. TheWinRM Installation Wizard modal page appears. Click [OK].
Configuring Windows Servers for Monitoring with PowerShell
Configuring Windows Servers for Monitoring with PowerShell
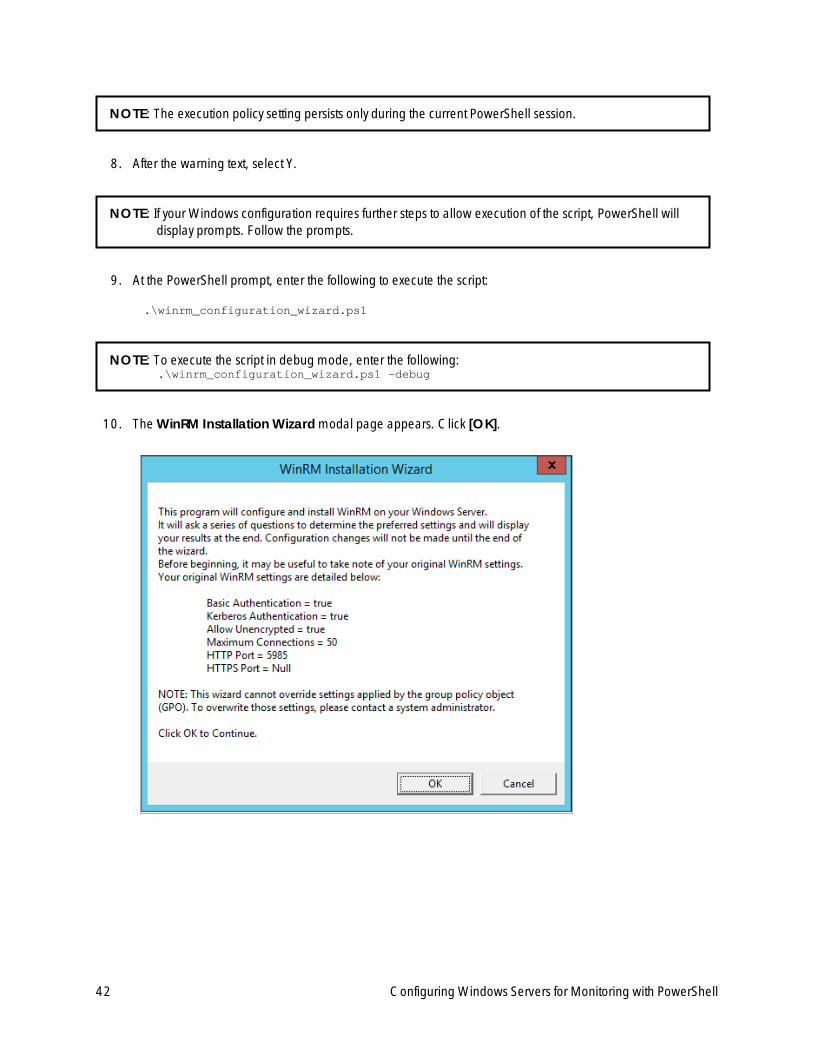
11. The Set Authentication Typemodal page appears. Select the appropriate choice for your environment.
43
3
44
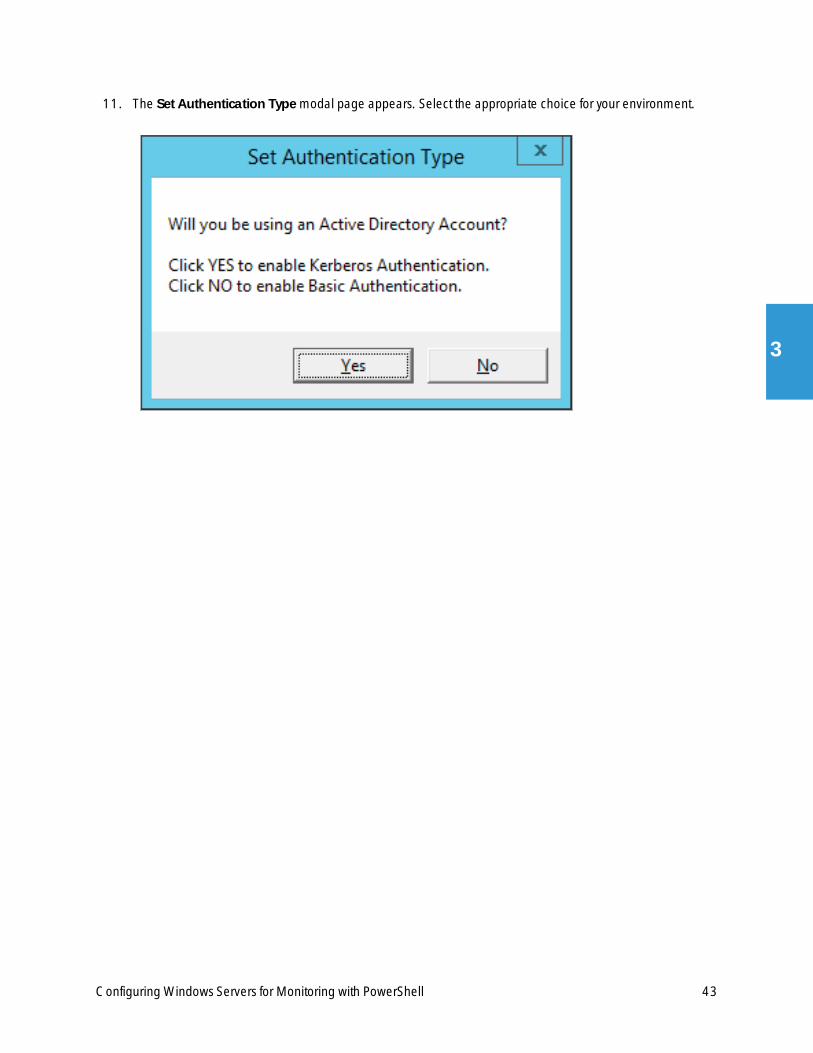
12. The Set Encryption modal page appears. Select the appropriate choice for your environment.
l Click YES to restrict unencrypted data. If when communicating with the Windows server, the ScienceLogicplatform will use a local user account with authentication of type "Basic Auth", select this option. You mustthen use HTTPS and can use a Microsoft Certificate or a self-signed certificate. For information on creating aself-signed certificate, see Configuring a Server Authentication Certificate.
l Click NO to allow unencrypted data. If when communicating with the Windows server, the ScienceLogicplatform will use an AD account, all authentication information is encrypted via Kerberos. Additionalencryption is unnecessary.
13. The Set Maximum Connections modal page appears. Click [Yes].
Configuring Windows Servers for Monitoring with PowerShell

Configuring Windows Servers for Monitoring with PowerShell
14. The Set HTTP/HTTPS Ports modal page appears. Select the appropriate choice for your environment.
15. The Set HTTPS Thumbprintmodal page appears. Enter the information for your certificate thumbprint, thenclick [OK].
NOTE: If the certificate structure for your certificate thumbprint is incomplete or incorrect, an error messageappears indicating that the WinRM client cannot process the request. If you think you made an error,click [OK] and try to correct it. Otherwise, contact a system administrator for help.
45
3
46
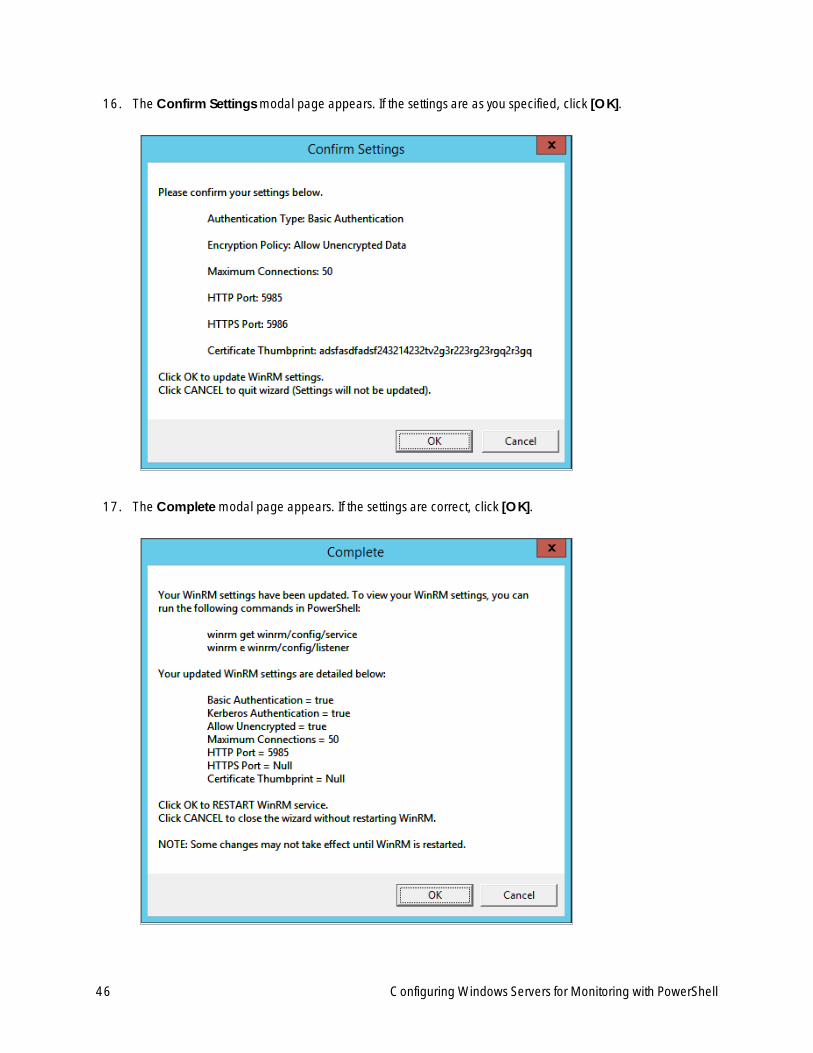
16. The Confirm Settings modal page appears. If the settings are as you specified, click [OK].
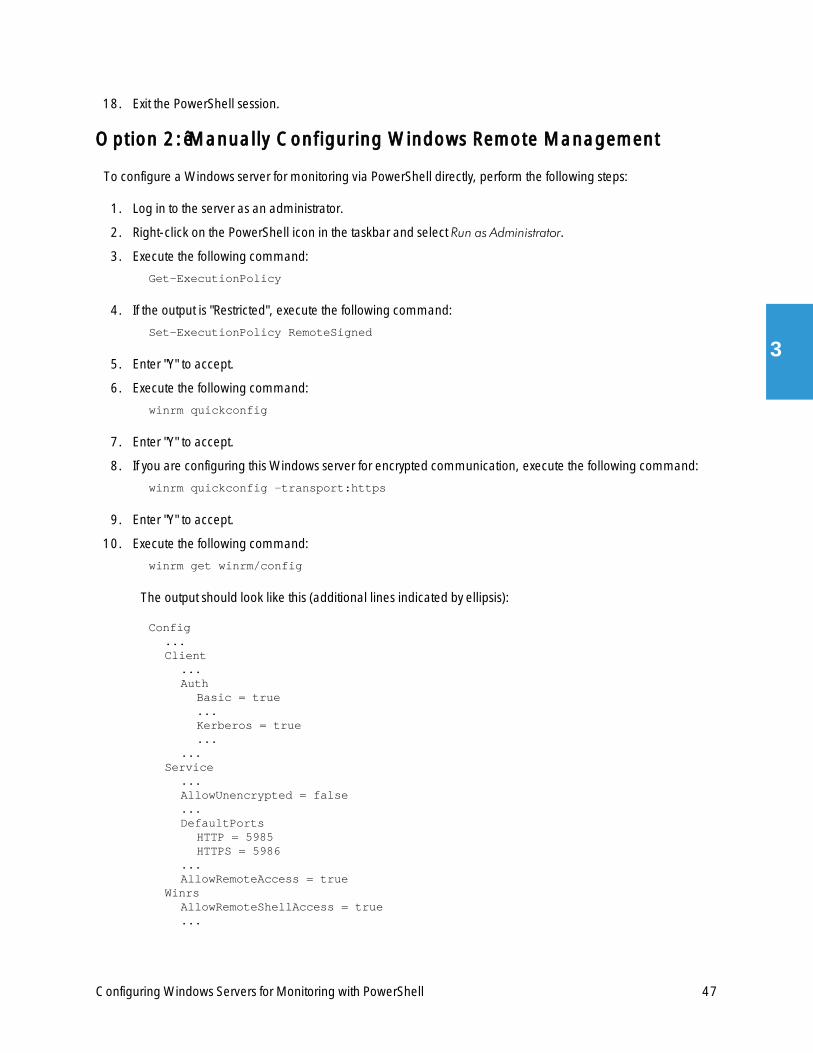
17. The Completemodal page appears. If the settings are correct, click [OK].
Configuring Windows Servers for Monitoring with PowerShell
Configuring Windows Servers for Monitoring with PowerShell
18. Exit the PowerShell session.
Option 2: Manually Configuring Windows Remote Management
To configure a Windows server for monitoring via PowerShell directly, perform the following steps:
1. Log in to the server as an administrator.
2. Right-click on the PowerShell icon in the taskbar and select Run as Administrator.
3. Execute the following command:
Get-ExecutionPolicy
4. If the output is "Restricted", execute the following command:
Set-ExecutionPolicy RemoteSigned
5. Enter "Y" to accept.
6. Execute the following command:
winrm quickconfig
7. Enter "Y" to accept.
8. If you are configuring this Windows server for encrypted communication, execute the following command:
winrm quickconfig -transport:https
9. Enter "Y" to accept.
10. Execute the following command:
winrm get winrm/config
The output should look like this (additional lines indicated by ellipsis):
Config...Client
...Auth
Basic = true...Kerberos = true...
...Service
...AllowUnencrypted = false...DefaultPorts
HTTP = 5985HTTPS = 5986
...AllowRemoteAccess = true
WinrsAllowRemoteShellAccess = true...
47
3
48
11. In the Service section, if the parameter AllowRemoteAccess is set to false, execute the following command:
NOTE: This setting does not appear for all versions of Windows. If this setting does not appear, noaction is required.
Set-Item WSMan:\Localhost\Service\AllowRemoteAccess -value true
12. In the Winrs section, if the parameter AllowRemoteShellAccess is set to false, execute the followingcommand:
Set-Item WSMan:\Localhost\Winrs\AllowRemoteShellAccess -value true
13. If you are configuring this Windows server for unencrypted communication and the parameterAllowUnencrypted (in the Service section) is set to false, execute the following command:
Set-Item WSMan:\Localhost\Service\AllowUnencrypted -value true
14. If you are configuring this Windows server for unencrypted communication, verify that "HTTP = 5985"appears in the DefaultPorts section.
NOTE: ScienceLogic recommends using encrypted communication, particularly if you are also usingan Active Directory account. Using an Active Directory account for encrypted authenticationenables you to use Kerberos ticketing for authentication.
15. If you are configuring this Windows server for encrypted communication, verify that "HTTPS = 5986" appearsin the DefaultPorts section.
16. If you are using an Active Directory account to communicate with this Windows server and in the Auth section,the parameter Kerberos is set to false, execute the following command:
Set-Item WSMan:\Localhost\Service\Auth\Kerberos -value true
NOTE: ScienceLogic recommends using an Active Directory account.
17. If you are using a local account to communicate with this Windows server and in the Auth section, theparameter Basic is set to false, execute the following command:
Set-Item WSMan:\Localhost\Service\Auth\Basic -value true
Configuring Windows Servers for Monitoring with PowerShell
Configuring Windows Servers for Monitoring with PowerShell
Option 3: Using a Group Policy to Configure Windows RemoteManagement
You can use a group policy object (GPO) to configure the following Windows Remote Management settings onWindows Server 2012 or Windows Server 2016:
l A registry key to enable Local Account access toWindows Remote Management
l Firewall rules
l Certificates
l HTTP and HTTPS listeners, including authentication and encryption settings
l Service start and recovery settings
To create the group policy object, perform the following steps:
1. Log in to the server as an administrator.
2. Right-click on the PowerShell icon in the taskbar and select Run as Administrator.
3. At the PowerShell prompt, use the change directory (CD) command to navigate to a folder where you cancreate new files.
49
3

50
4. Save the root Certification Authority certificate to the local directory by executing the following command:
certutil.exe –ca.cert ca_name.cer
TIP: You will import this certificate into the new group policy in step 21.
5. Exit the command prompt.
6. Log in to a domain controller in your Active Directory forest and navigate to the System Manager dashboard.
Configuring Windows Servers for Monitoring with PowerShell
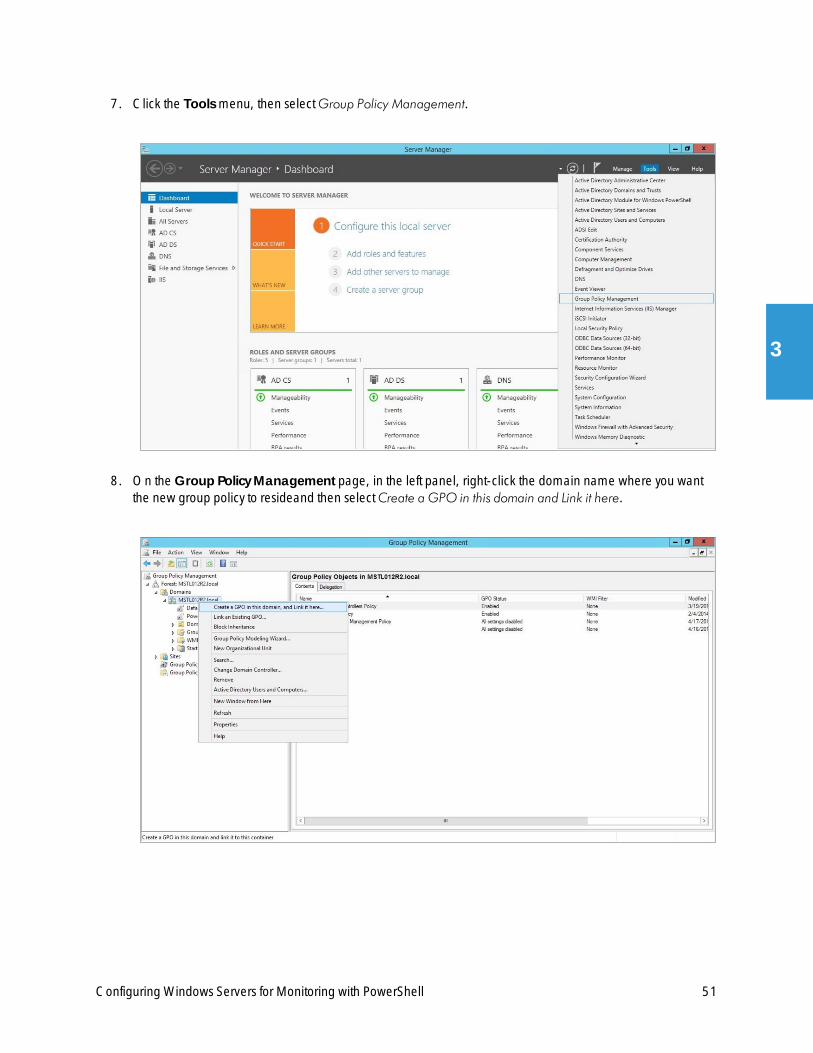
Configuring Windows Servers for Monitoring with PowerShell
7. Click the Tools menu, then selectGroup Policy Management.
8. On the Group Policy Management page, in the left panel, right-click the domain name where you wantthe new group policy to resideand then selectCreate a GPO in this domain and Link it here.
51
3

52
9. In the left panel, right-click the new group policy and select Edit. The Group Policy Management Editorpage for the new Windows Remote Management group policy appears.
10. In the left panel, navigate toComputer Configuration > Policies > Windows Settings > SecuritySettings > System Services. In the right panel, locate theWindows RemoteManagement (WS-Management) service. Right-click the service, then select Properties.
Configuring Windows Servers for Monitoring with PowerShell
Configuring Windows Servers for Monitoring with PowerShell
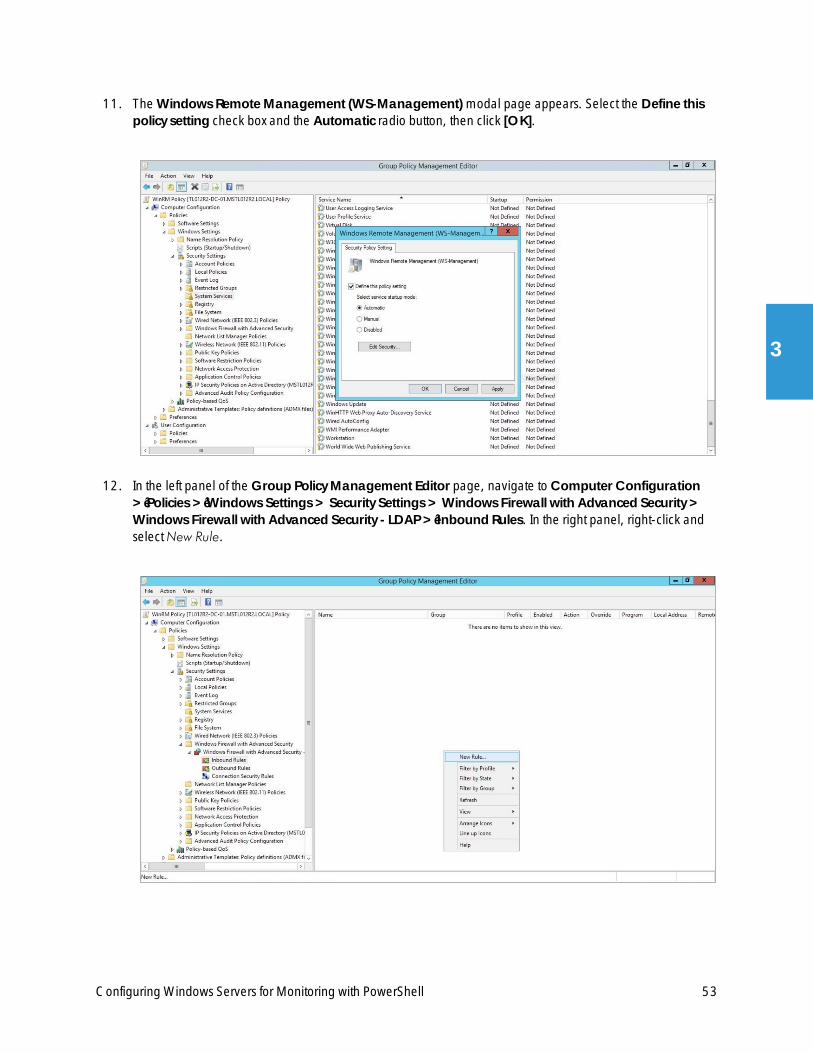
11. TheWindows RemoteManagement (WS-Management)modal page appears. Select the Define thispolicy setting check box and the Automatic radio button, then click [OK].
12. In the left panel of the Group Policy Management Editor page, navigate toComputer Configuration> Policies > Windows Settings > Security Settings >Windows Firewall with Advanced Security >Windows Firewall with Advanced Security - LDAP > Inbound Rules. In the right panel, right-click andselectNew Rule.
53
3
54
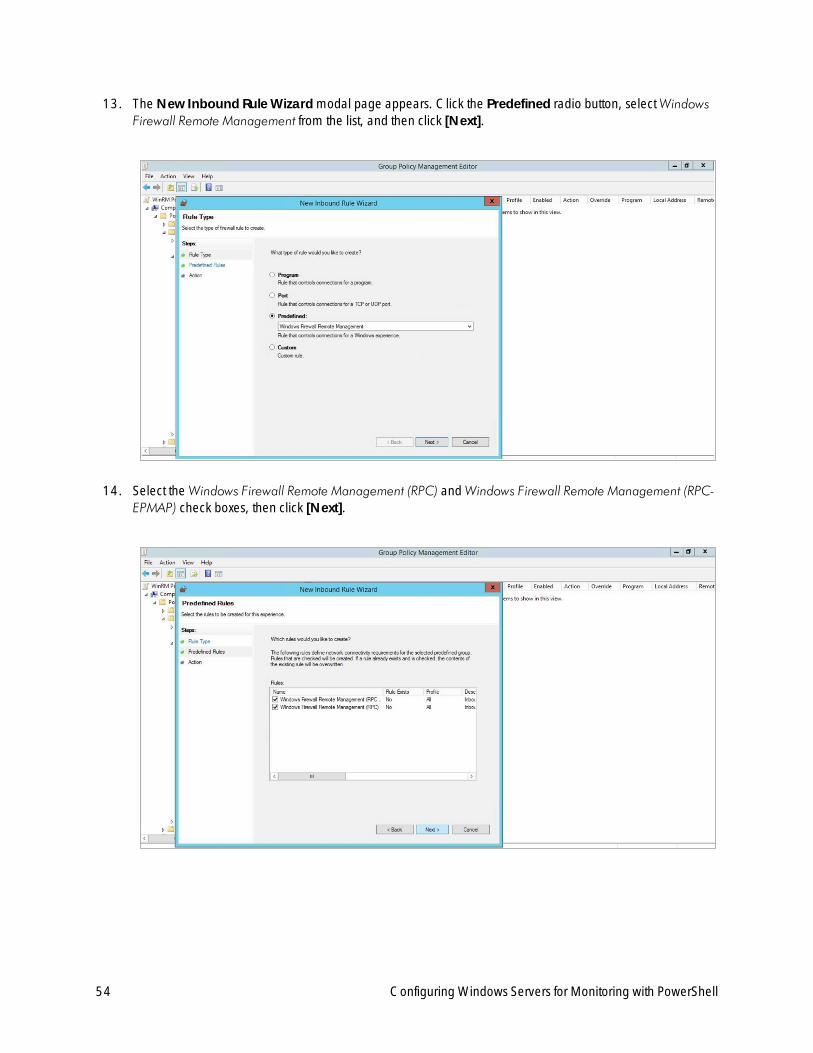
13. The New Inbound RuleWizard modal page appears. Click the Predefined radio button, selectWindowsFirewall Remote Management from the list, and then click [Next].
14. Select theWindows Firewall Remote Management (RPC) andWindows Firewall Remote Management (RPC-EPMAP) check boxes, then click [Next].
Configuring Windows Servers for Monitoring with PowerShell
Configuring Windows Servers for Monitoring with PowerShell
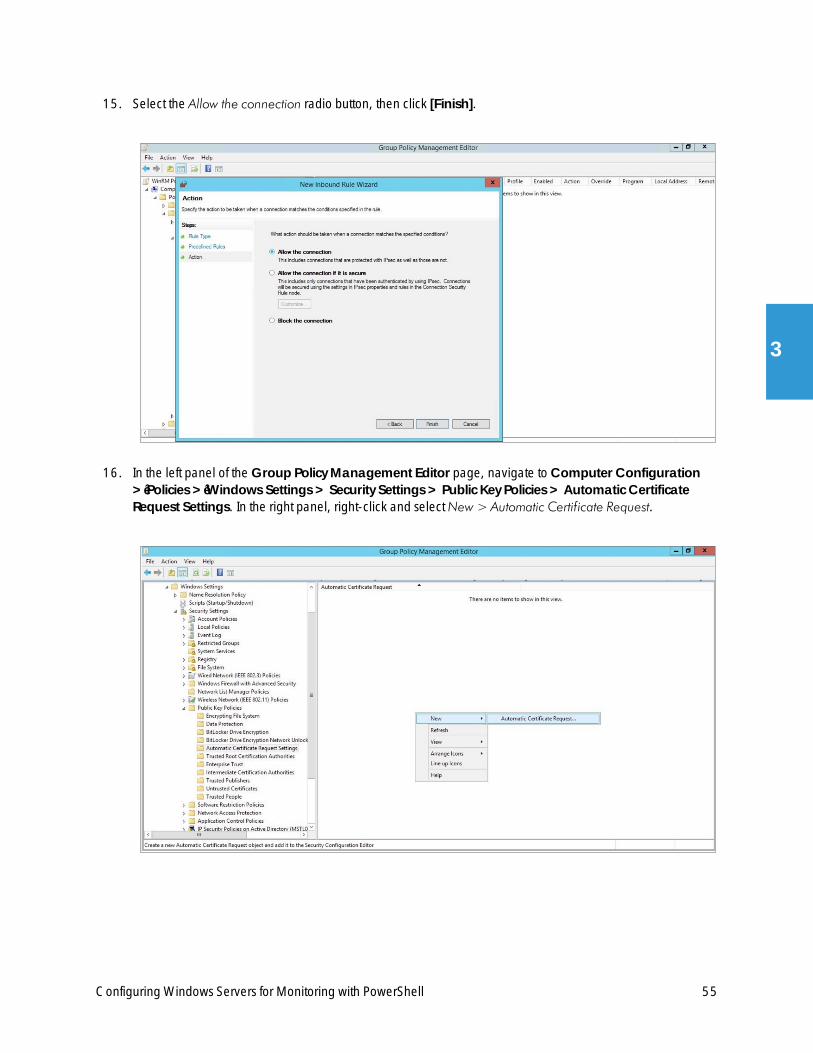
15. Select the Allow the connection radio button, then click [Finish].
16. In the left panel of the Group Policy Management Editor page, navigate toComputer Configuration> Policies > Windows Settings > Security Settings > Public Key Policies > Automatic CertificateRequest Settings. In the right panel, right-click and selectNew > Automatic Certificate Request.
55
3
56
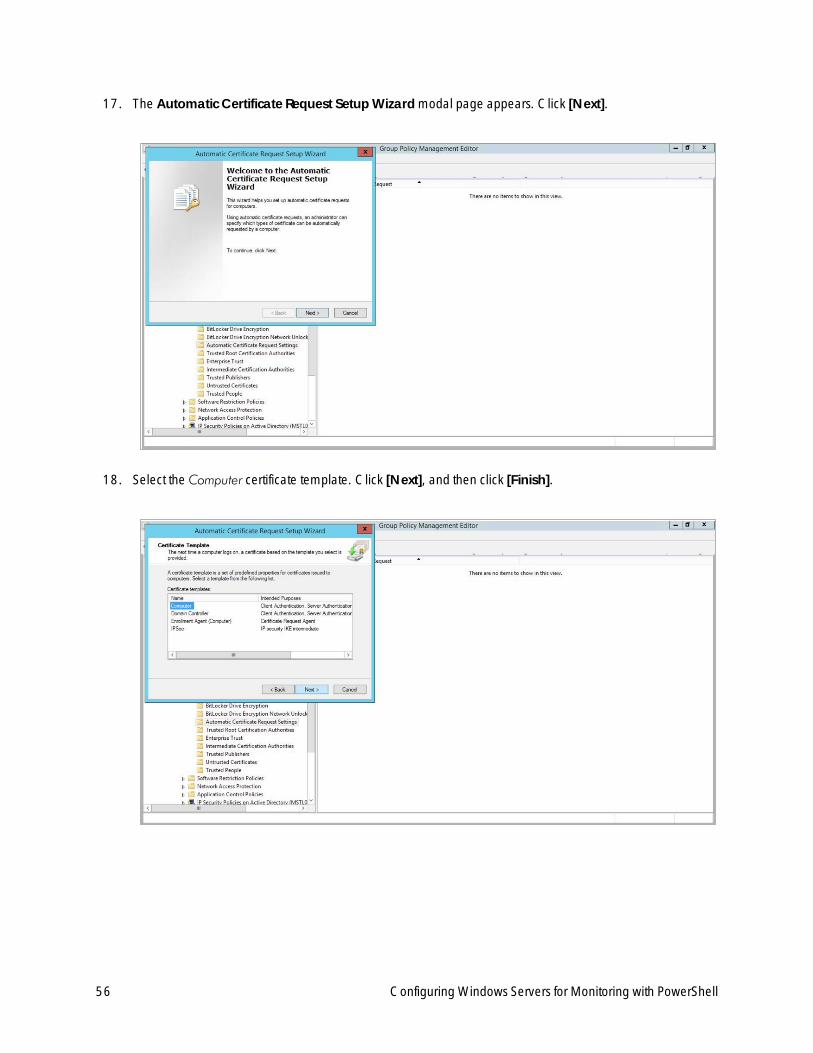
17. The Automatic Certificate Request Setup Wizard modal page appears. Click [Next].
18. Select the Computer certificate template. Click [Next], and then click [Finish].
Configuring Windows Servers for Monitoring with PowerShell
Configuring Windows Servers for Monitoring with PowerShell
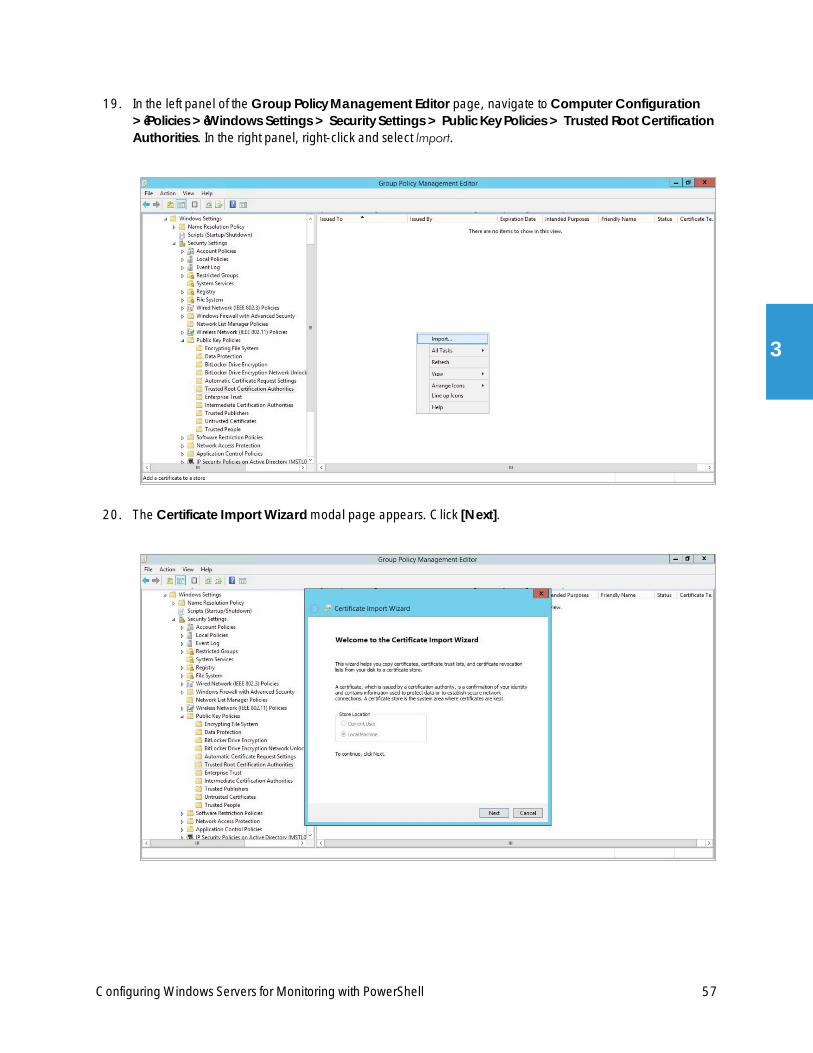
19. In the left panel of the Group Policy Management Editor page, navigate toComputer Configuration> Policies > Windows Settings > Security Settings > Public Key Policies > Trusted Root CertificationAuthorities. In the right panel, right-click and select Import.
20. The Certificate Import Wizard modal page appears. Click [Next].
57
3
58
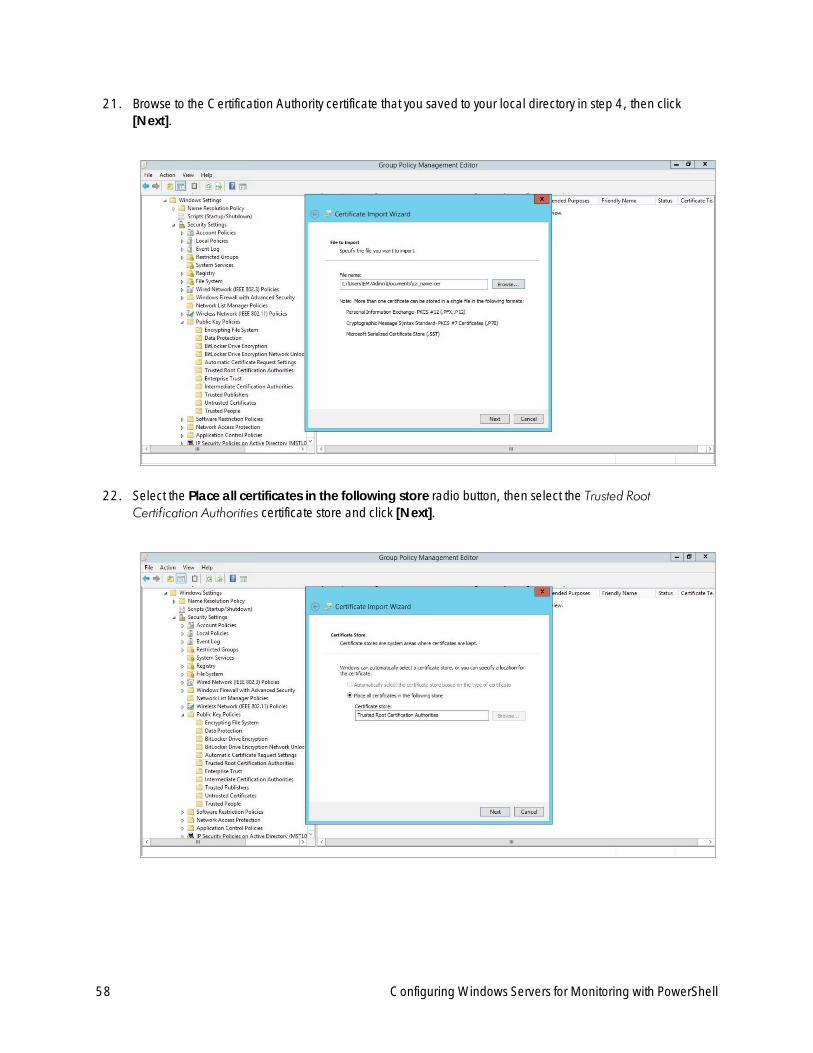
21. Browse to the Certification Authority certificate that you saved to your local directory in step 4, then click[Next].
22. Select the Place all certificates in the following store radio button, then select the Trusted RootCertification Authorities certificate store and click [Next].
Configuring Windows Servers for Monitoring with PowerShell
Configuring Windows Servers for Monitoring with PowerShell
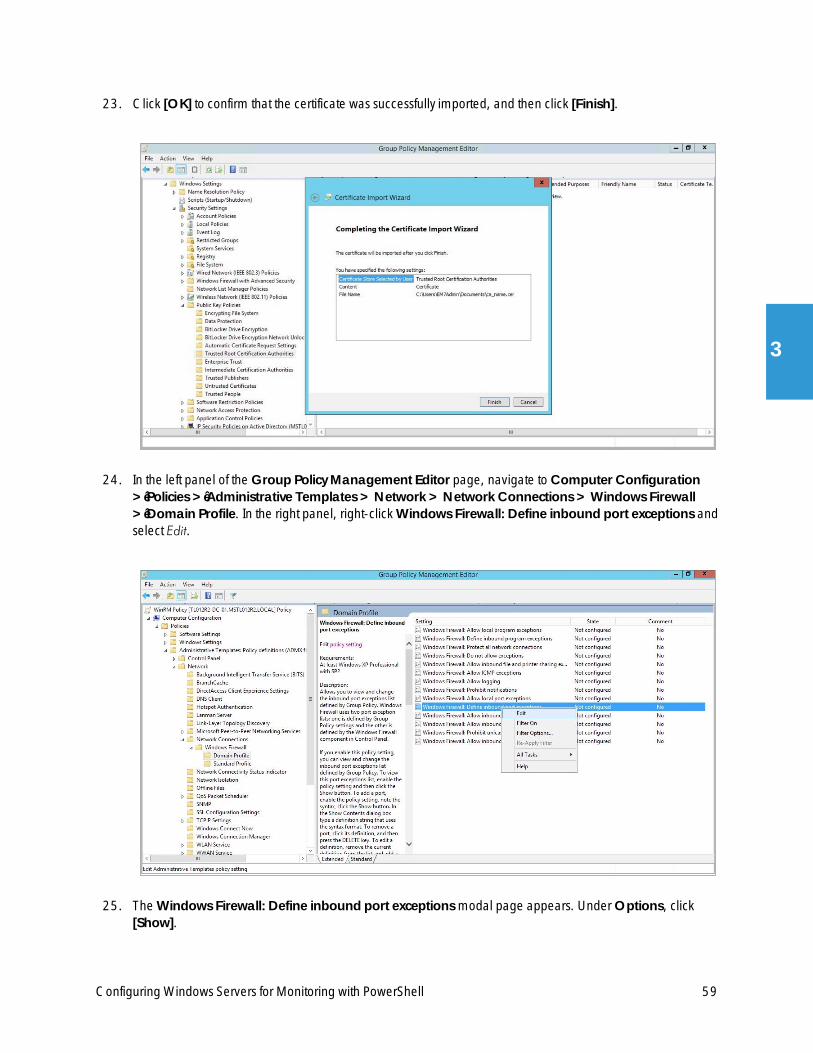
23. Click [OK] to confirm that the certificate was successfully imported, and then click [Finish].
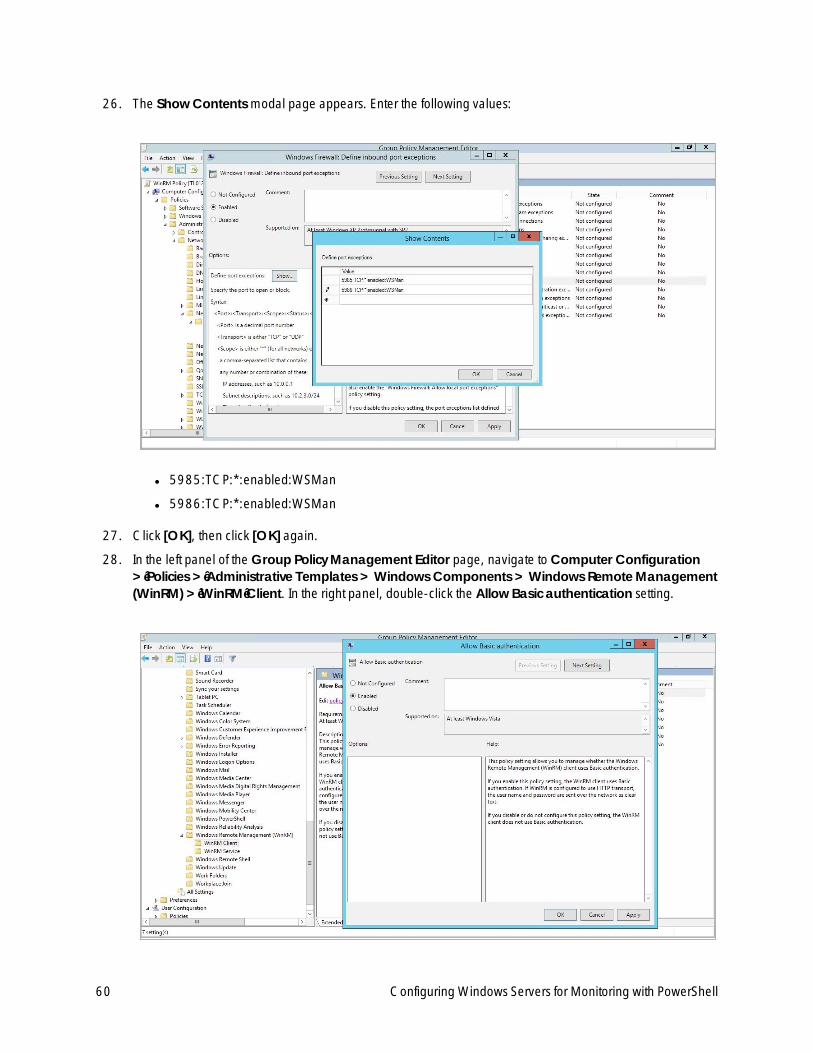
24. In the left panel of the Group Policy Management Editor page, navigate toComputer Configuration> Policies > Administrative Templates > Network >Network Connections >Windows Firewall> Domain Profile. In the right panel, right-clickWindows Firewall: Define inbound port exceptions andselect Edit.
25. TheWindows Firewall: Define inbound port exceptions modal page appears. UnderOptions, click[Show].
59
3
60
26. The Show Contents modal page appears. Enter the following values:
l 5985:TCP:*:enabled:WSMan
l 5986:TCP:*:enabled:WSMan
27. Click [OK], then click [OK] again.
28. In the left panel of the Group Policy Management Editor page, navigate toComputer Configuration> Policies > Administrative Templates >Windows Components >Windows RemoteManagement(WinRM) > WinRM Client. In the right panel, double-click the Allow Basic authentication setting.
Configuring Windows Servers for Monitoring with PowerShell
Configuring Windows Servers for Monitoring with PowerShell
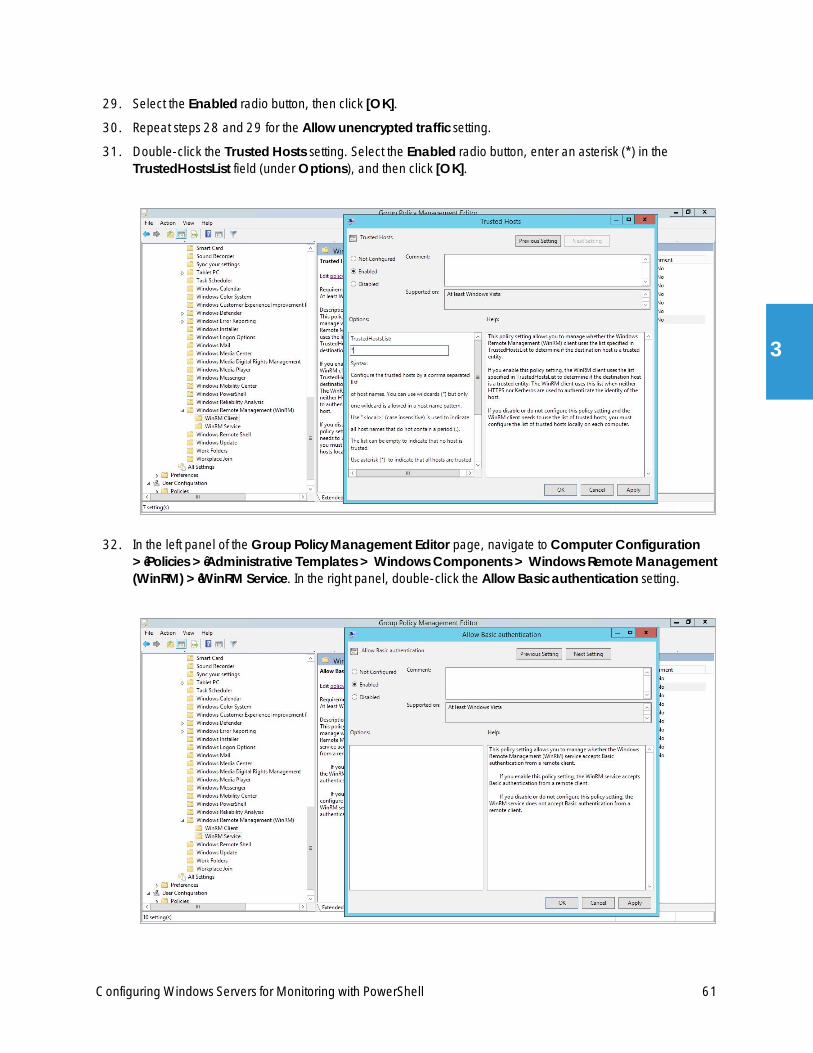
29. Select the Enabled radio button, then click [OK].
30. Repeat steps 28 and 29 for the Allow unencrypted traffic setting.
31. Double-click the Trusted Hosts setting. Select the Enabled radio button, enter an asterisk (*) in theTrustedHostsList field (underOptions), and then click [OK].
32. In the left panel of the Group Policy Management Editor page, navigate toComputer Configuration> Policies > Administrative Templates >Windows Components >Windows RemoteManagement(WinRM) > WinRM Service. In the right panel, double-click the Allow Basic authentication setting.
61
3
62
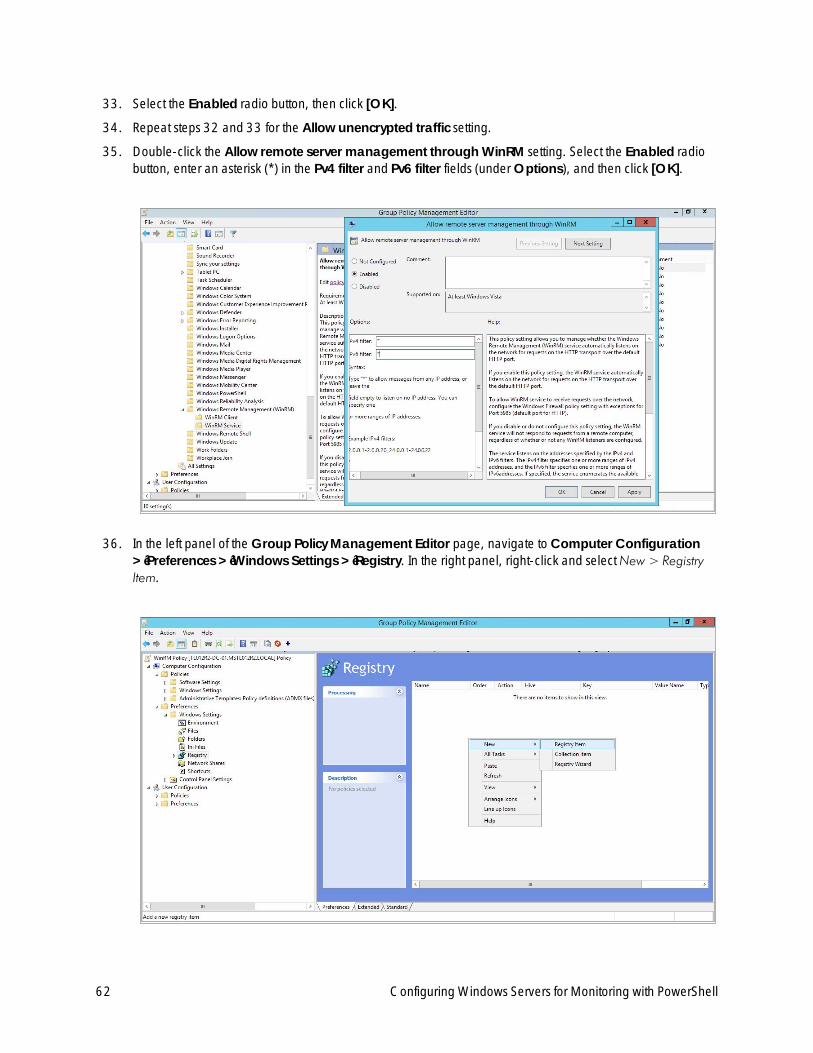
33. Select the Enabled radio button, then click [OK].
34. Repeat steps 32 and 33 for the Allow unencrypted traffic setting.
35. Double-click the Allow remote server management through WinRM setting. Select the Enabled radiobutton, enter an asterisk (*) in the Pv4 filter and Pv6 filter fields (underOptions), and then click [OK].
36. In the left panel of the Group Policy Management Editor page, navigate toComputer Configuration> Preferences > Windows Settings > Registry. In the right panel, right-click and selectNew > RegistryItem.
Configuring Windows Servers for Monitoring with PowerShell
Configuring Windows Servers for Monitoring with PowerShell
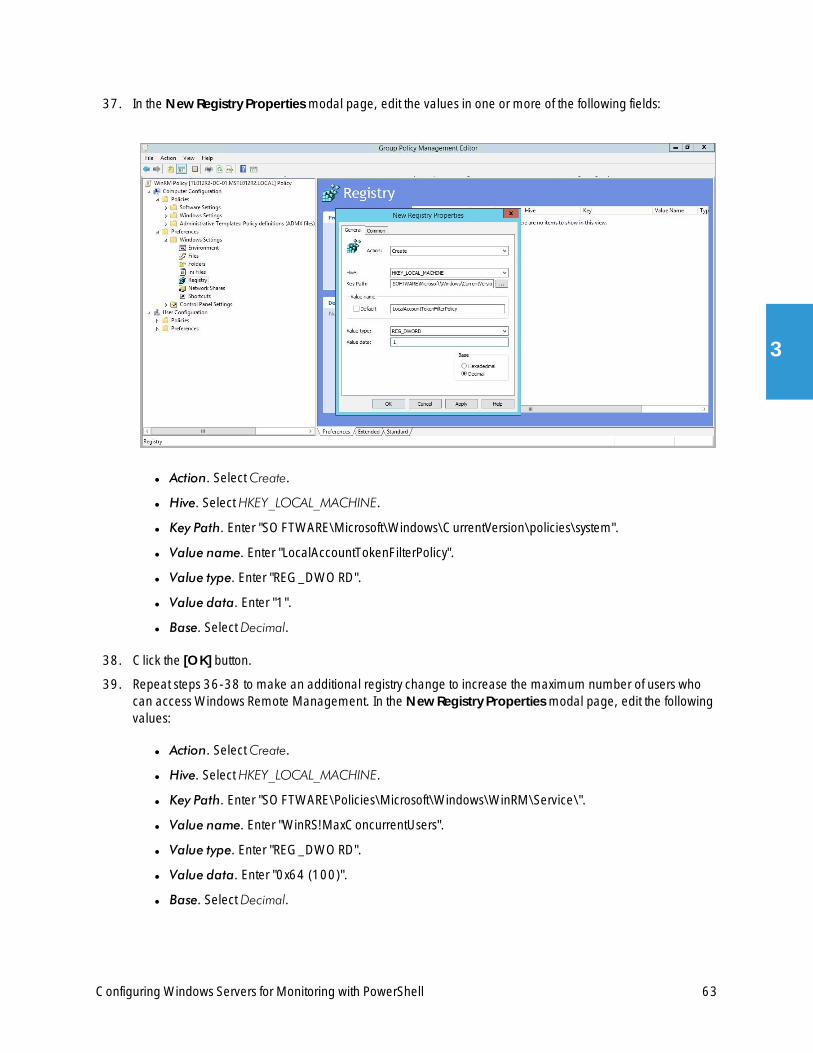
37. In the New Registry Properties modal page, edit the values in one or more of the following fields:
l Action. SelectCreate.
l Hive. SelectHKEY_LOCAL_MACHINE.
l Key Path. Enter "SOFTWARE\Microsoft\Windows\CurrentVersion\policies\system".
l Value name. Enter "LocalAccountTokenFilterPolicy".
l Value type. Enter "REG_DWORD".
l Value data. Enter "1".
l Base. SelectDecimal.
38. Click the [OK] button.
39. Repeat steps 36-38 to make an additional registry change to increase the maximum number of users whocan access Windows Remote Management. In the New Registry Properties modal page, edit the followingvalues:
l Action. SelectCreate.
l Hive. SelectHKEY_LOCAL_MACHINE.
l Key Path. Enter "SOFTWARE\Policies\Microsoft\Windows\WinRM\Service\".
l Value name. Enter "WinRS!MaxConcurrentUsers".
l Value type. Enter "REG_DWORD".
l Value data. Enter "0x64 (100)".
l Base. SelectDecimal.
63
3
64
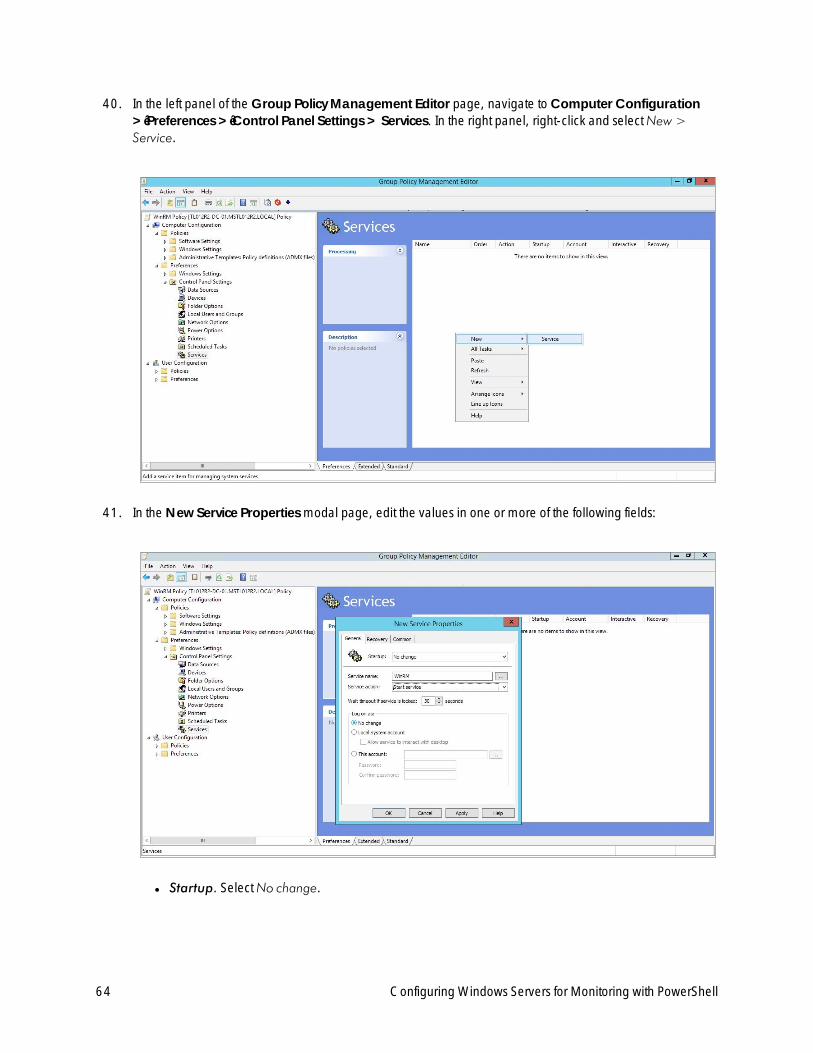
40. In the left panel of the Group Policy Management Editor page, navigate toComputer Configuration> Preferences > Control Panel Settings > Services. In the right panel, right-click and selectNew >Service.
41. In the New Service Properties modal page, edit the values in one or more of the following fields:
l Startup. SelectNo change.
Configuring Windows Servers for Monitoring with PowerShell
Configuring Windows Servers for Monitoring with PowerShell
l Service name. Enter "WinRM".
l Service action. Select Start service.
l Wait timeout if service is locked. Select 30 seconds.
l Log on as. SelectNo change.
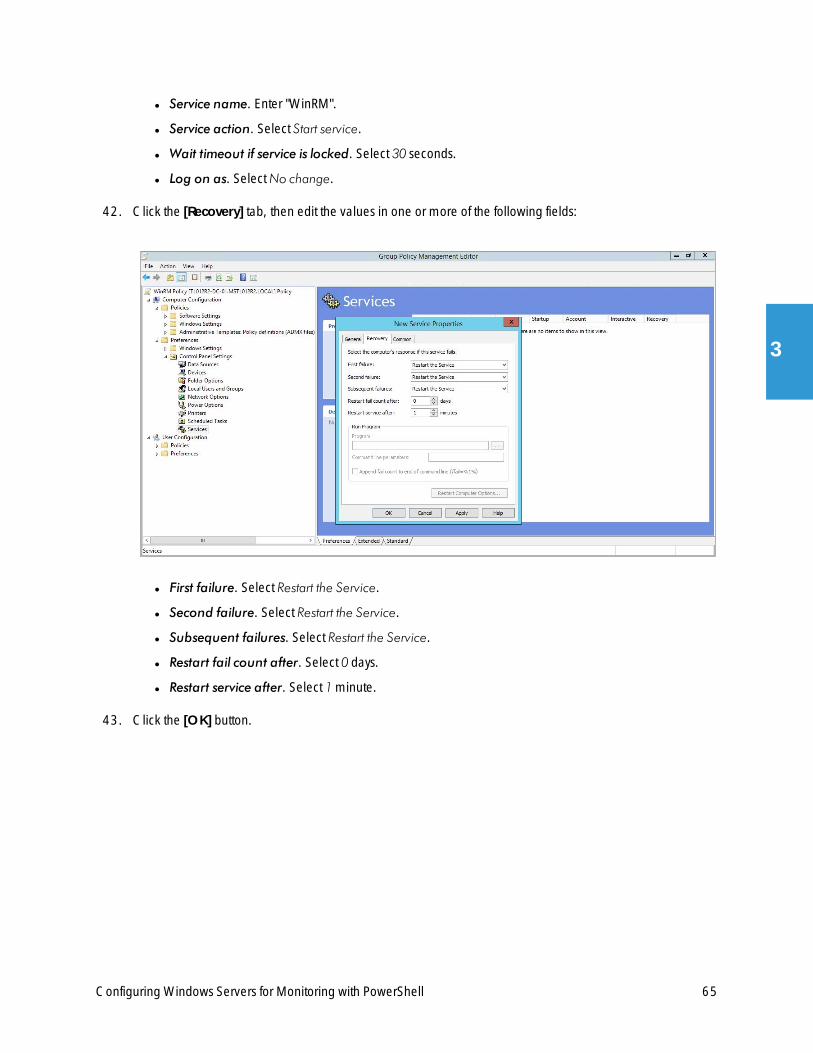
42. Click the [Recovery] tab, then edit the values in one or more of the following fields:
l First failure. Select Restart the Service.
l Second failure. Select Restart the Service.
l Subsequent failures. Select Restart the Service.
l Restart fail count after. Select 0 days.
l Restart service after. Select 1minute.
43. Click the [OK] button.
65
3
66
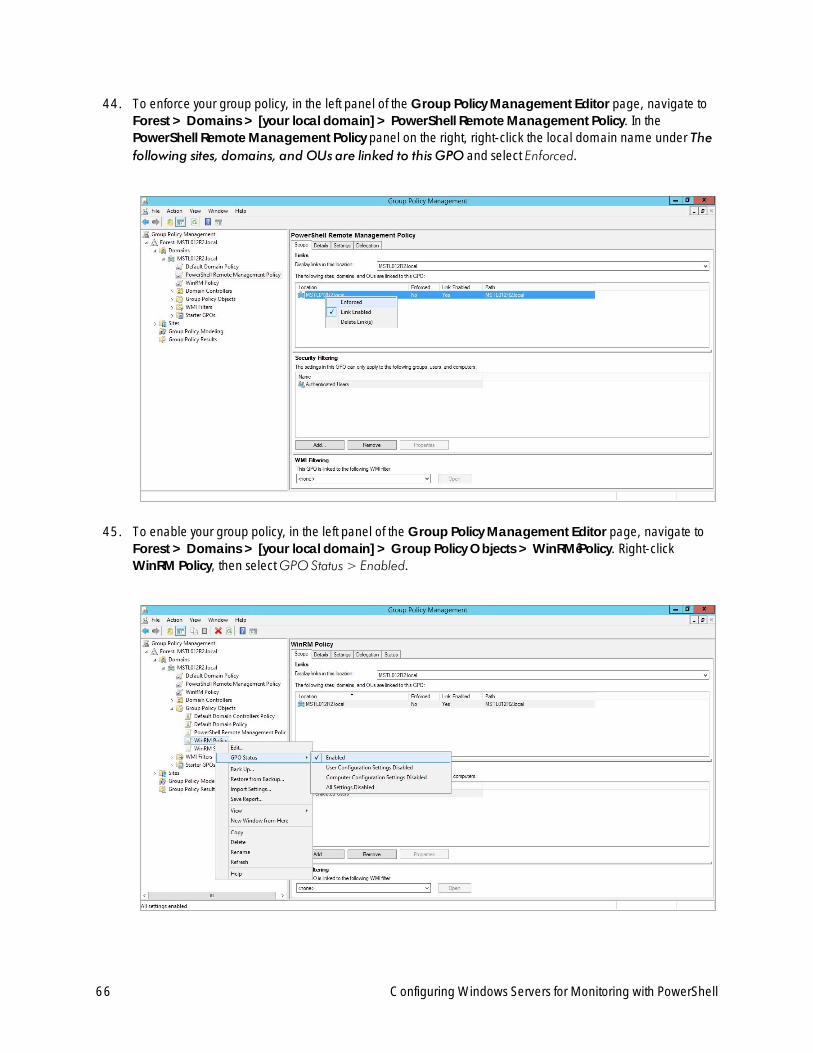
44. To enforce your group policy, in the left panel of the Group Policy Management Editor page, navigate toForest > Domains > [your local domain] > PowerShell RemoteManagement Policy. In thePowerShell RemoteManagement Policy panel on the right, right-click the local domain name under Thefollowing sites, domains, and OUs are linked to this GPO and select Enforced.
45. To enable your group policy, in the left panel of the Group Policy Management Editor page, navigate toForest > Domains > [your local domain] > Group Policy Objects >WinRM Policy. Right-clickWinRM Policy, then selectGPO Status > Enabled.
Configuring Windows Servers for Monitoring with PowerShell
Configuring Windows Servers for Monitoring with PowerShell
Step 4: Configuring a Windows Management Proxy
If the ScienceLogic platform cannot execute PowerShell requests directly on aWindows server, you can optionallyconfigure an additional Windows server to act as a proxy for those PowerShell requests. To use a proxy, you mustconfigure at least twoWindows servers:
l A target server that the platform cannot communicate with directly.
l A proxy server that the platform will communicate with to execute PowerShell requests on the target server.
To configure the target and proxy servers, perform the following steps:
1. Configure a user account that the platform will use to connect to the proxy server and the proxy server will useto connect to the target server. The user account can either be a local account or an Active Directory account;however, the user account must have the same credentials on the target and proxy servers and be in theLocal Administrator's group on both servers.
2. If you have created a local user account on the Windows Server instead of an Active Directory account, youmust configure encrypted communication between the platform and the Windows server. To do this, youmust configure a Server Authentication certificate.
3. Configure Windows Remote Management on the target server and the proxy server.
4. Log in to the proxy server as an administrator.
5. Open the PowerShell command window.
6. Right-click on the PowerShell icon in the taskbar and select Run as Administrator.
7. Execute one of the following commands on the proxy server to allow the proxy server to trust one or moretarget servers:
l To allow the proxy server to trust all servers (not recommended), execute the following command:
Set-Item WSMan:\Localhost\Client\TrustedHosts -value *
l To allow the proxy server to trust only specific target servers, execute the following command, insertinga list that includes the IP address for each target server. Separate the list of IP addresses with commas.
Set-Item WSMan:\Localhost\Client\TrustedHosts -value <comma-delimited-list-of-target-server-IPs>
8. Execute the following command on the proxy server to configure the LocalAccountTokenFilterPolicy:
New-ItemProperty“HKLM:\SOFTWARE\Microsoft\Windows\CurrentVersion\Policies\System” -Name“LocalAccountTokenFilterPolicy” -Value 1 -PropertyType “DWORD"
67
3

68
NOTE: If the proxy server is in a different Windows domain (domain A) than the target servers (domain B), andthe proxy server uses a user account from Active Directory, and Active Directory is in the sameWindows domain as the target servers (domain B), you must perform the following to allow the proxyserver to send PowerShell commands to the target servers:
l On the domain controller for each domain (domain A and domain B), create new forward-lookupzones and reverse-lookup zones that allow name resolution to work between the two domains.
l On the domain controller for each domain (domain A and domain B), create a non-transitive realmtrust between the two domains.
l Login to the proxy server and add the Active Directory account (from domain A) to the LocalAdministrator's group for the proxy server. You should be able to select the account on the proxy serverafter you create the non-transitive realm trust between the two domains.
Step 5: Increasing the Number of PowerShell DynamicApplications That Can Run Simultaneously
You can optionally execute a series of commands that will allow the ScienceLogic platform to increase the defaultmaximum number of PowerShell Dynamic Applications that can run simultaneously.
To do so:
1. Determine the number of Dynamic Applications that will be used to monitor the Windows server. Multiply thisnumber by three.
2. Open a PowerShell command prompt. Log in as an Administrator.
3. At the prompt, execute the following commands:
Set-Item WSMan:\Localhost\Shell\MaxShellsPerUser –value <number youcalculated in step 1>
Set-Item WSMan:\Localhost\Service\MaxConcurrentOperationsPerUser –value<number you calculated in step 1>
Restart-Service WinRM
4. Repeat these steps on each Windows server that will be monitored by the ScienceLogic platform.
Configuring Windows Servers for Monitoring with PowerShell
SNMP and PowerShell Dynamic Applications for Windows Devices
Chapter
4SNMP and PowerShell Dynamic Applications
for Windows Devices
Overview
The following sections describe the SNMP and PowerShell Dynamic Applications that the ScienceLogic platformuses to monitor Windows devices:
SNMPDynamic Applications for Windows Devices 70
PowerShell Dynamic Applications 70
Microsoft: Active Directory Server 70
Microsoft: DHCP Server 71
Microsoft: DNS Server 71
Microsoft: Exchange Server 72
Microsoft: Exchange Server 2010 72
Microsoft: Hyper-V Server 73
Microsoft: IIS Server 74
Microsoft: Lync Server 2010 74
Microsoft: SharePoint Server 75
Microsoft: Skype for Business 75
Microsoft: SQL Server 76
Microsoft: Windows Server 77
Microsoft: Windows Server Services 78
Run Book Automations and Actions Associated with PowerShell Dynamic Applications for Windows Servers 78
Error Messages for PowerShell Collection 79
69
4
70
SNMP Dynamic Applications for Windows Devices
If you configure your Windows system to respond to SNMP requests from the ScienceLogic platform, you candiscover your Windows system as an SNMP device. When the ScienceLogic platform discovers a Windows systemas an SNMP device, the platform will automatically collect the same data from the Windows system that theplatform collects from most network devices. This data includes interface usage, file system usage, CPU usage,memory usage, and hardware configuration information.
In addition to the common SNMP data collection, you can install an optional agent that reports WMI informationthrough SNMP. The following SNMP Dynamic Applications can be used to collect the information reported by theoptional agent:
l MSSQL: General
l MSSQL: Memory
l MSSQL: SQL Stats
PowerShell Dynamic Applications
If you configure your Windows system to respond to PowerShell requests from the ScienceLogic platform, you canuse PowerShell Dynamic Applications to collect information from your Windows system.
All of the PowerShell Dynamic Applications include a discovery object. If you include a credential for PowerShellDynamic Applications in the discovery session that includes your Windows system, the ScienceLogic platform willautomatically align the appropriate PowerShell Dynamic Applications to the Windows system. For moreinformation about creating a discovery session, see the Discovery & Credentialsmanual.
The following PowerPacks include PowerShell Dynamic Applications for Microsoft Servers.
Microsoft: Act ive Directory Server
NOTE: The Dynamic Applications in this PowerPack support Windows Server 2012 R2.
The following PowerShell Dynamic Applications can be used to collect performance data from Active Directoryservers:
l Microsoft: Active Directory Address Book Performance
l Microsoft: Active Directory Async Thread Queue Performance
l Microsoft: Active Directory Database Performance
l Microsoft: Active Directory Directory Services Reads Performance
l Microsoft: Active Directory Directory Services Searches Performance
l Microsoft: Active Directory Directory Services Writes Performance
l Microsoft: Active Directory DRA Performance
SNMP and PowerShell Dynamic Applications for Windows Devices
SNMP and PowerShell Dynamic Applications for Windows Devices
l Microsoft: Active Directory LDAP Performance
l Microsoft: Active Directory Security Account Management Performance
l Microsoft: Active Directory Services General Performance
l Microsoft: Active Directory Web Service Performance
Microsoft: DHCP Server
NOTE: The Dynamic Applications in this PowerPack support Windows Server 2012.
The following PowerShell Dynamic Applications can be used to collect performance data from DHCP servers:
l Microsoft: DHCP IPv4 Performance
l Microsoft: DHCP IPv4 Scope Performance
l Microsoft: DHCP Service Performance
The following PowerShell Dynamic Applications can be used to collect configuration data from DHCP servers:
l Microsoft: DHCP IPv4 Lease Configuration
l Microsoft: DHCP IPv6 Lease Configuration
l Microsoft: DHCP Server Performance
Microsoft: DNS Server
NOTE: The Dynamic Applications in this PowerPack support Windows Server 2008 R2, 2012, and 2012R2.
The following PowerShell Dynamic Applications can be used to collect performance data from DNS servers:
l Microsoft: DNS AXFR Performance
l Microsoft: DNS Dynamic Update Performance
l Microsoft: DNS IXFR Performance
l Microsoft: DNS Memory Performance
l Microsoft: DNS Notification Performance
l Microsoft: DNS Recursion Performance
l Microsoft: DNS Secure Dynamic Update Performance
l Microsoft: DNS TCP Performance
l Microsoft: DNS Total Overall Performance
l Microsoft: DNS UDP Performance
71
4
72
l Microsoft: DNS WINS Performance
l Microsoft: DNS Zone Transfer Performance
Microsoft: Exchange Server
The following PowerShell Dynamic Applications can be used to collect performance data from Exchange 2013and Exchange 2016 servers:
l Microsoft: Exchange CAS ActiveSync Performance
l Microsoft: Exchange CAS Address Book Load Performance
l Microsoft: Exchange CAS Address Book Service Performance
l Microsoft: Exchange CAS Availability Service Performance
l Microsoft: Exchange CAS OWA Performance
l Microsoft: Exchange CAS Performance
l Microsoft: Exchange CAS RPC Client Access Load Performance
l Microsoft: Exchange CAS RPC Client Access Performance
l Microsoft: Exchange MBS Database Performance
l Microsoft: Exchange MBS Info Store RPC Processing Stats
l Microsoft: Exchange MBS Information Store Performance
l Microsoft: Exchange MBS Replay Log I/O Latency Requirements
l Microsoft: Exchange TPS Disk Performance
l Microsoft: Exchange TPS Transport Database Performance
l Microsoft: Exchange TPS Transport Load Assessment Stats
l Microsoft: Exchange UMS General Performance
Microsoft: Exchange Server 2010
The following PowerShell Dynamic Applications can be used to collect performance data from Exchange 2010servers:
l Microsoft: Exchange 2010 CAS Address Book Load Performance
l Microsoft: Exchange 2010 CAS Address Book Service Performance
l Microsoft: Exchange 2010 CAS Availability Service Performance
l Microsoft: Exchange 2010 CAS OWA Performance
l Microsoft: Exchange 2010 CAS Performance
l Microsoft: Exchange 2010 CAS RPC Client Access Load Performance
l Microsoft: Exchange 2010 CAS RPC Client Access Performance
l Microsoft: Exchange 2010 MBS Client-Related Search Performance
l Microsoft: Exchange 2010 MBS Database Performance
SNMP and PowerShell Dynamic Applications for Windows Devices
SNMP and PowerShell Dynamic Applications for Windows Devices
l Microsoft: Exchange 2010 MBS Info Store RPC Processing Stats
l Microsoft: Exchange 2010 MBS Information Store Performance
l Microsoft: Exchange 2010 MBS Message Queuing Performance
l Microsoft: Exchange 2010 MBS Replay Log I/O Latency Requirements
l Microsoft: Exchange 2010 MBS RPC Client Throttling Performance
l Microsoft: Exchange 2010 MBS Store Client Request Performance
l Microsoft: Exchange 2010 TPS Disk Performance
l Microsoft: Exchange 2010 TPS Transport Database Performance
l Microsoft: Exchange 2010 TPS Transport Load Assessment Stats
l Microsoft: Exchange 2010 TPS Transport Queue Length Performance
l Microsoft: Exchange 2010 UMS General Performance
Microsoft: Hyper-V Server
NOTE: The Dynamic Applications in this PowerPack support Hyper-V Server 2008 R2, 2012, and 2012 R2.
The following PowerShell Dynamic Applications can be used to collect performance data from Hyper-V servers:
l Microsoft: Hyper-V Component Count
l Microsoft: Hyper-V Logical Processor Performance
l Microsoft: Hyper-VOverall Guest CPU Performance
l Microsoft: Hyper-V Process Performance
l Microsoft: Hyper-V Root Virtual Processor Performance
l Microsoft: Hyper-V Virtual Processor Performance
l Microsoft: Hyper-V Virtual Storage Device Performance
l Microsoft: Hyper-V Virtual Switch Performance
The following PowerShell Dynamic Applications can be used to collect configuration data from Hyper-V servers:
l Microsoft: Hyper-V Component Count Configuration
l Microsoft: Hyper-V Host Configuration
This PowerPack also includes Snippet Dynamic Applications that discover virtual machines managed by the Hyper-V host. Although the Dynamic Applications are of type "Snippet", the snippets themselves perform PowerShellrequests to collect data and use PowerShell credentials. See the Discovering Component Devices on Hyper-VSystems section for more information.
l Microsoft: Hyper-V Guest Configuration
l Microsoft: Hyper-V Guest Configuration Cache
l Microsoft: Hyper-V Guest Discovery
73
4
74
This PowerPack also includes Snippet Dynamic Applications that retrieve performance data from virtual machinesmanaged by the Hyper-V host. Although the Dynamic Applications are of type "Snippet", the snippets themselvesperform PowerShell requests to collect data and use PowerShell credentials:
l Microsoft: Hyper-V Connected Clients
l Microsoft: Hyper-V Guest CPU Performance
l Microsoft: Hyper-V Guest IDE Controller Performance
l Microsoft: Hyper-V Guest Interface Performance
l Microsoft: Hyper-V Guest Memory Performance
Microsoft: I IS Server
NOTE: The Dynamic Applications in this PowerPack support Internet Information Services (ISS) versions 7.5,8.0, 8.5, and 10.0.
The following PowerShell Dynamic Applications can be used to collect performance data from IIS servers:
l Microsoft: IIS Active Server Pages Performance
l Microsoft: IIS Core Performance
l Microsoft: IIS Web Service Performance
The following PowerShell Dynamic Applications can be used to collect configuration data from IIS servers:
l Microsoft: IIS Server Configuration
Microsoft: Lync Server 2010
The following PowerShell Dynamic Applications can be used to collect performance data from Lync 2010 servers:
l Microsoft: Lync 2010 Announcement Service Performance
l Microsoft: Lync 2010 AS MCU Performance
l Microsoft: Lync 2010 Auto Attendant Performance
l Microsoft: Lync 2010 AVMCU Performance
l Microsoft: Lync 2010 AV SIP/MRAS/QOE Performance
l Microsoft: Lync 2010 Call Park Service Performance
l Microsoft: Lync 2010 Conferencing Compatibility Performance
l Microsoft: Lync 2010 Data Conferencing Performance
l Microsoft: Lync 2010 IMMCU Performance
l Microsoft: Lync 2010 Response Group Performance
l Microsoft: Lync 2010 SIP Load Management Performance
l Microsoft: Lync 2010 SIP Networking Performance
SNMP and PowerShell Dynamic Applications for Windows Devices
SNMP and PowerShell Dynamic Applications for Windows Devices
l Microsoft: Lync 2010 SIP Peers Performance
l Microsoft: Lync 2010 SIP Protocol Performance
l Microsoft: Lync 2010 SIP Response Performance
l Microsoft: Lync 2010 SipEps Incoming Message Performance
l Microsoft: Lync 2010 User Services Performance
l Microsoft: Lync 2010 Web Services Performance
The following PowerShell Dynamic Applications can be used to collect configuration data from Lync 2010 servers:
l Microsoft: Lync 2010 AS MCUConfiguration
l Microsoft: Lync 2010 AVMCUConfiguration
l Microsoft: Lync 2010 Conferencing Compatibility Configuration
l Microsoft: Lync 2010 Data Conferencing Configuration
l Microsoft: Lync 2010 Service Health Configuration
l Microsoft: Lync 2010 User Services Configuration
Microsoft: SharePoint Server
NOTE: The Dynamic Applications in this PowerPack support SharePoint Server 2010 SE.
The following PowerShell Dynamic Applications can be used to collect performance data from SharePoint servers:
l Microsoft: SharePoint Core Performance
l Microsoft: SharePoint Indexer Performance
l Microsoft: SharePoint Query Performance
Microsoft: Skype for Business
NOTE: This PowerPack was previously namedMicrosoft: Lync Server 2013.
The following PowerShell Dynamic Applications can be used to collect performance data from Lync 2013 servers:
l Microsoft: Lync 2013 AS MCU Performance
l Microsoft: Lync 2013 AVMCU Performance
l Microsoft: Lync 2013 AV SIP/MRAS/QOE Performance
l Microsoft: Lync 2013 Bandwidth Services Performance
l Microsoft: Lync 2013 Call Park Service Performance
l Microsoft: Lync 2013 Data Conferencing Performance
75
4
76
l Microsoft: Lync 2013 IMMCU Performance
l Microsoft: Lync 2013 Mediation Server Performance
l Microsoft: Lync 2013 Response Group Performance
l Microsoft: Lync 2013 SIP Load Management Performance
l Microsoft: Lync 2013 SIP Networking Performance
l Microsoft: Lync 2013 SIP Peers Performance
l Microsoft: Lync 2013 SIP Protocol Performance
l Microsoft: Lync 2013 SIP Response Performance
l Microsoft: Lync 2013 SipEps Incoming Message Performance
l Microsoft: Lync 2013 User Services Performance
l Microsoft: Lync 2013 Web Services Performance
The following PowerShell Dynamic Applications can be used to collect configuration data from Lync 2013 servers:
l x Microsoft: Lync 2013 AS MCUConfiguration
l x Microsoft: Lync 2013 AVMCUConfiguration
l x Microsoft: Lync 2013 Data Conferencing Configuration
l x Microsoft: Lync 2013 Service Health Configuration
l x Microsoft: Lync 2013 User Services Configuration
Microsoft: SQL Server
NOTE: The Dynamic Applications in this PowerPack support SQL Server 2008, 2012, 2014, and 2016.
The following PowerShell Dynamic Applications can be used to collect performance data from SQL servers:
l Microsoft: SQL 2008 Buffer Pages Performance
l Microsoft: SQL Buffer Performance
l Microsoft: SQL Database Performance
l Microsoft: SQL Memory Performance
l Microsoft: SQL Plan Cache Performance
l Microsoft: SQL Query Performance
l Microsoft: SQL Session Performance
l Microsoft: SQL Table Lock/Latch Performance
SNMP and PowerShell Dynamic Applications for Windows Devices
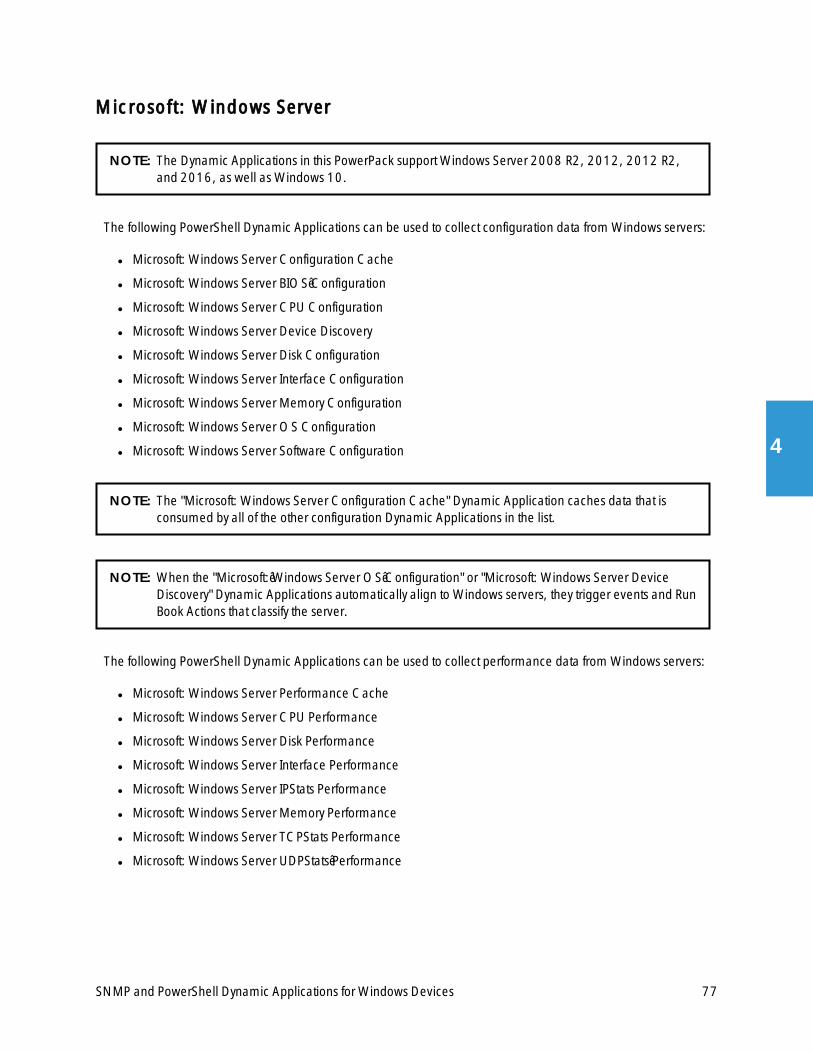
SNMP and PowerShell Dynamic Applications for Windows Devices
Microsoft: Windows Server
NOTE: The Dynamic Applications in this PowerPack support Windows Server 2008 R2, 2012, 2012 R2,and 2016, as well as Windows 10.
The following PowerShell Dynamic Applications can be used to collect configuration data from Windows servers:
l Microsoft: Windows Server Configuration Cache
l Microsoft: Windows Server BIOS Configuration
l Microsoft: Windows Server CPU Configuration
l Microsoft: Windows Server Device Discovery
l Microsoft: Windows Server Disk Configuration
l Microsoft: Windows Server Interface Configuration
l Microsoft: Windows Server Memory Configuration
l Microsoft: Windows Server OS Configuration
l Microsoft: Windows Server Software Configuration
NOTE: The "Microsoft: Windows Server Configuration Cache" Dynamic Application caches data that isconsumed by all of the other configuration Dynamic Applications in the list.
NOTE: When the "Microsoft: Windows Server OS Configuration" or "Microsoft: Windows Server DeviceDiscovery" Dynamic Applications automatically align toWindows servers, they trigger events and RunBook Actions that classify the server.
The following PowerShell Dynamic Applications can be used to collect performance data from Windows servers:
l Microsoft: Windows Server Performance Cache
l Microsoft: Windows Server CPU Performance
l Microsoft: Windows Server Disk Performance
l Microsoft: Windows Server Interface Performance
l Microsoft: Windows Server IPStats Performance
l Microsoft: Windows Server Memory Performance
l Microsoft: Windows Server TCPStats Performance
l Microsoft: Windows Server UDPStats Performance
77
4
78
NOTE: The "Microsoft: Windows Server Performance Cache" Dynamic Application caches data that isconsumed by all of the other performance Dynamic Applications in the list.
The following Snippet Dynamic Application, which uses PowerShell requests to collect data, can be used to collectjournal data from Windows servers:
l Microsoft: Windows Server Process List
The following Dynamic Applications use PowerShell to collect data as a supplement to the ScienceLogic platform'sinternal collection capabilities:
l Microsoft: Windows Server IC Availability
l Microsoft: Windows Server IC Detail
l Microsoft: Windows Server IC Filesystem Inventory
l Microsoft: Windows Server IC Filesystem Performance
l Microsoft: Windows Server IC Interface Inventory
l Microsoft: Windows Server IC Interface Performance
Microsoft: Windows Server Services
NOTE: The Dynamic Applications in this PowerPack support Windows Server 2008 R2, 2012, and 2012R2.
The following PowerShell Dynamic Applications can be used to collect configuration data from aWindows serverabout each Windows Service running on the Windows server:
l Microsoft: Windows Server Service Configuration
Run Book Automations and Act ions Associated with PowerShellDynamic Applicat ions for Windows Servers
You can use the following Run Book Automation Policy and Run Book Action Policy to assign a device class to eachWindows device that does not support SNMP:
l Microsoft: Windows Server Device Class Alignment (Run Book Automation Policy)
l Microsoft: Windows Server Device Class Alignment (Run Book Action Policy)
Devices that do not support SNMP are assigned a device class of type "pingable".
SNMP and PowerShell Dynamic Applications for Windows Devices
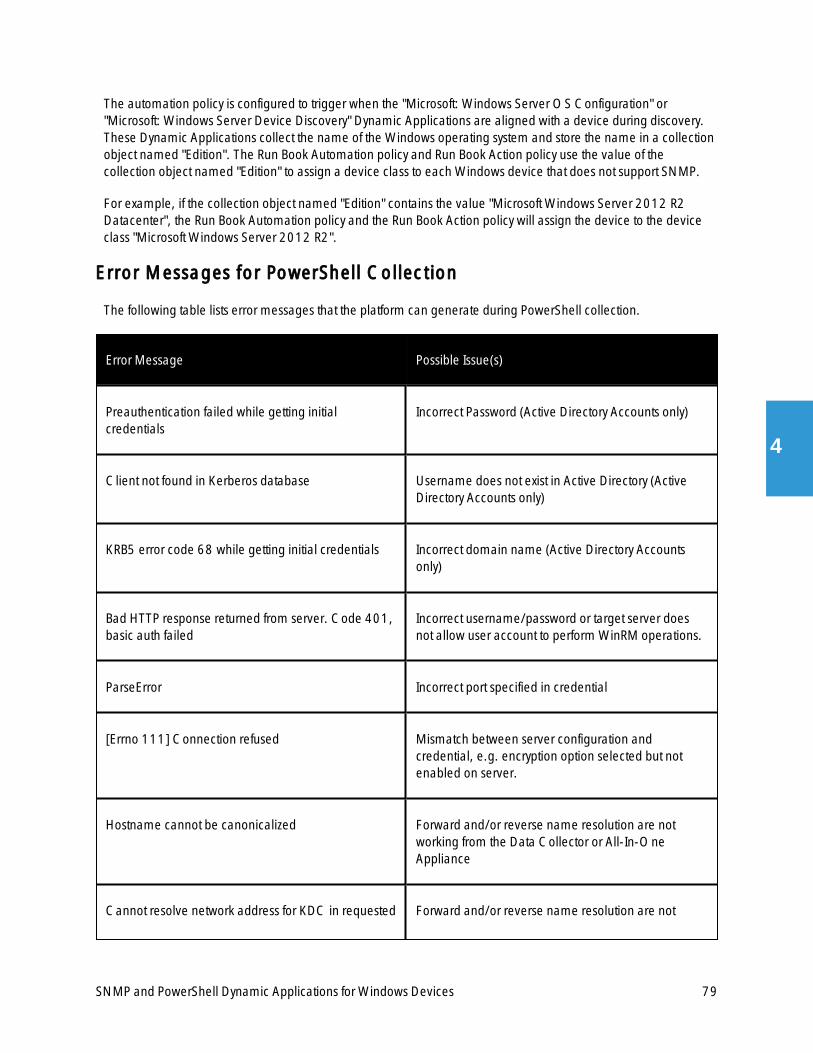
SNMP and PowerShell Dynamic Applications for Windows Devices
The automation policy is configured to trigger when the "Microsoft: Windows Server OS Configuration" or"Microsoft: Windows Server Device Discovery" Dynamic Applications are aligned with a device during discovery.These Dynamic Applications collect the name of the Windows operating system and store the name in a collectionobject named "Edition". The Run Book Automation policy and Run Book Action policy use the value of thecollection object named "Edition" to assign a device class to each Windows device that does not support SNMP.
For example, if the collection object named "Edition" contains the value "Microsoft Windows Server 2012 R2Datacenter", the Run Book Automation policy and the Run Book Action policy will assign the device to the deviceclass "Microsoft Windows Server 2012 R2".
Error Messages for PowerShell Collect ion
The following table lists error messages that the platform can generate during PowerShell collection.
Error Message Possible Issue(s)
Preauthentication failed while getting initialcredentials
Incorrect Password (Active Directory Accounts only)
Client not found in Kerberos database Username does not exist in Active Directory (ActiveDirectory Accounts only)
KRB5 error code 68 while getting initial credentials Incorrect domain name (Active Directory Accountsonly)
Bad HTTP response returned from server. Code 401,basic auth failed
Incorrect username/password or target server doesnot allow user account to perform WinRM operations.
ParseError Incorrect port specified in credential
[Errno 111] Connection refused Mismatch between server configuration andcredential, e.g. encryption option selected but notenabled on server.
Hostname cannot be canonicalized Forward and/or reverse name resolution are notworking from the Data Collector or All-In-OneAppliance
Cannot resolve network address for KDC in requested Forward and/or reverse name resolution are not
79
4
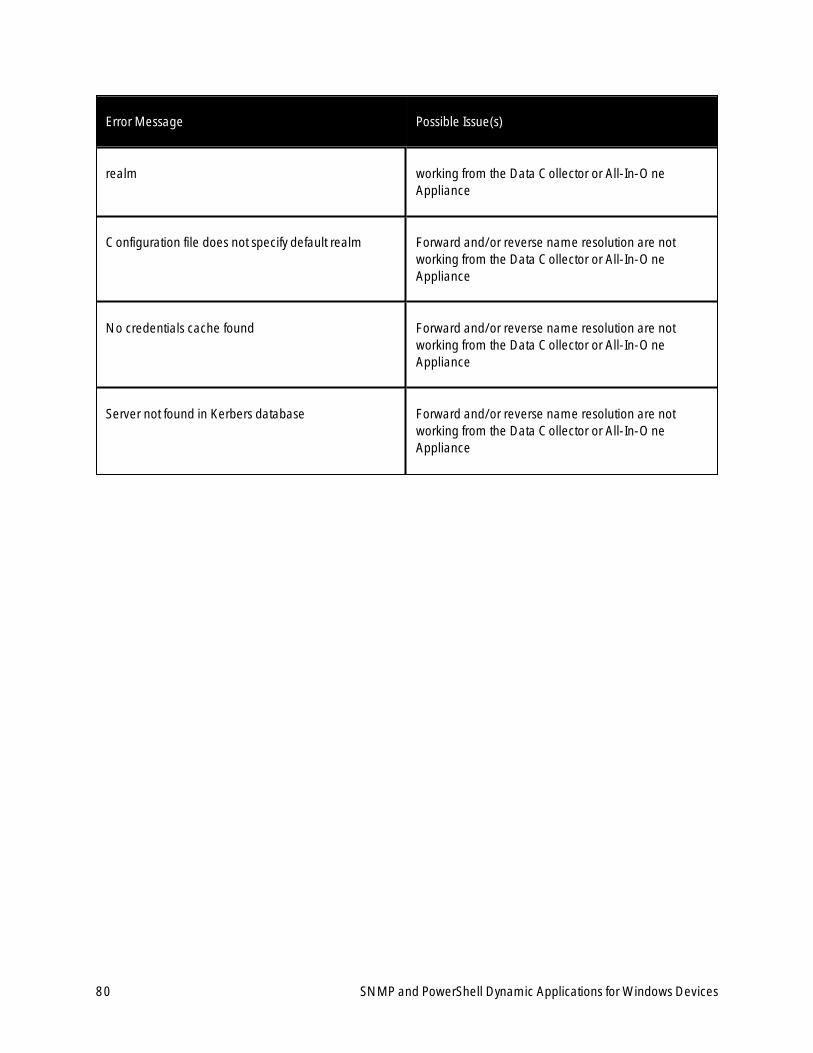
80
Error Message Possible Issue(s)
realm working from the Data Collector or All-In-OneAppliance
Configuration file does not specify default realm Forward and/or reverse name resolution are notworking from the Data Collector or All-In-OneAppliance
No credentials cache found Forward and/or reverse name resolution are notworking from the Data Collector or All-In-OneAppliance
Server not found in Kerbers database Forward and/or reverse name resolution are notworking from the Data Collector or All-In-OneAppliance
SNMP and PowerShell Dynamic Applications for Windows Devices
Creating SNMP and PowerShell Credentials for Windows Devices
Chapter
5Creating SNMP and PowerShell Credentials
for Windows Devices
Overview
The following sections describe how to create SNMP and PowerShell credentials for Windows devices that youwant to monitor with the ScienceLogic platform, as well as how to discover component devices on Hyper-Vsystems:
Creating an SNMP Credential 81
Creating a PowerShell Credential 84
Testing Windows Credentials 87
SNMP Credential Test 87
PowerShell Credential Test 87
Running a Windows Credential Test 87
Discovering Component Devices on Hyper-V Systems 89
Viewing Component Devices 89
Creating an SNMP Credential
SNMP Credentials (called "community strings" in earlier versions of SNMP) allow the ScienceLogic platform toaccess SNMP data on a managed device. The platform uses SNMP credentials to perform discovery, run auto-discovery, and gather information from SNMP Dynamic Applications.
81
5
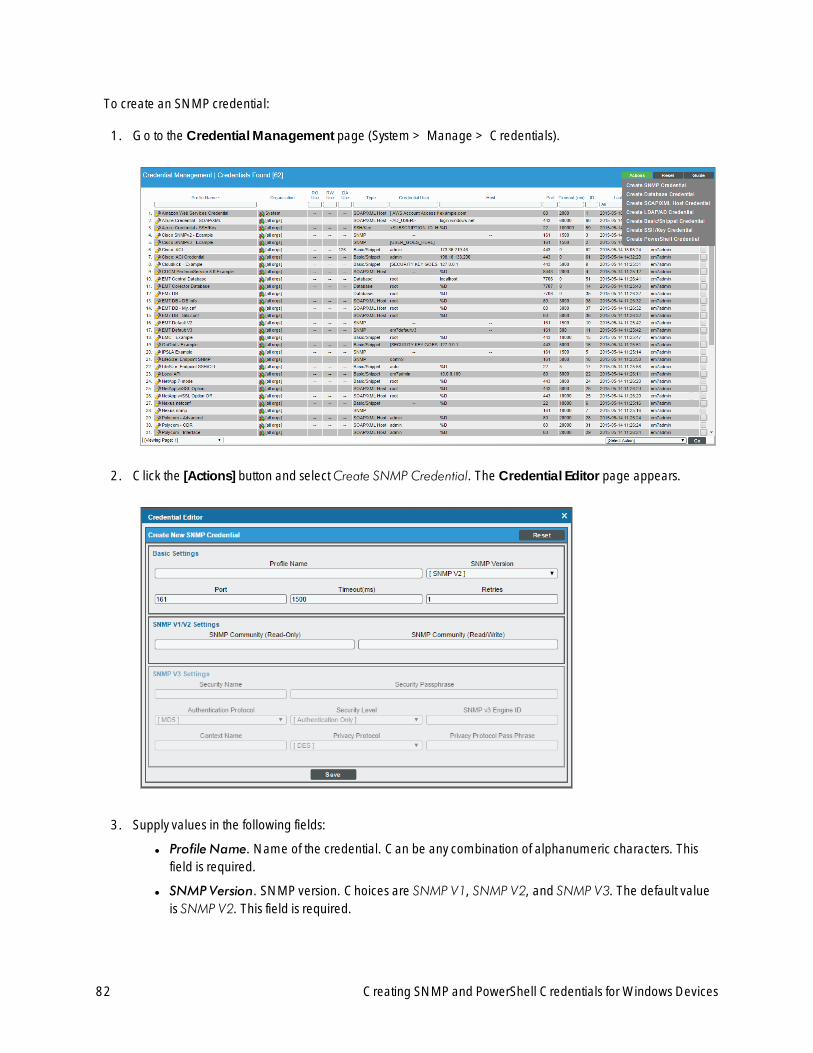
82
To create an SNMP credential:
1. Go to the Credential Management page (System >Manage > Credentials).
2. Click the [Actions] button and selectCreate SNMP Credential. The Credential Editor page appears.
3. Supply values in the following fields:
l Profile Name. Name of the credential. Can be any combination of alphanumeric characters. Thisfield is required.
l SNMP Version. SNMP version. Choices are SNMP V1, SNMP V2, and SNMP V3. The default valueis SNMP V2. This field is required.
Creating SNMP and PowerShell Credentials for Windows Devices
Creating SNMP and PowerShell Credentials for Windows Devices
l Port. The port the platform will use to communicate with the external device or application. Thedefault value is 161. This field is required.
l Timeout (ms). Time, in milliseconds, after which the platform will stop trying to communicate with theSNMP device. The default value is 1500. This field is required.
l Retries. Number of times the platform will try to authenticate and communicate with the externaldevice. The default value is 1. This field is required.
SNMP V1/V2 Settings
These fields appear if you selected SNMP V1 or SNMP V2 in the SNMP Version field. Otherwise, thesefields are grayed out.
l SNMP Community (Read Only). The SNMP community string (password) required for read-onlyaccess of SNMP data on the remote device or application. For SNMP V1 and SNMP V2 credentials,you must supply a community string, either in this field or in the SNMP Community (Read/Write)field.
l SNMP Community (Read/Write). The SNMP community string (password) required for read andwrite access of SNMP data on the remote device or application. For SNMP V1 and SNMP V2credentials, you must supply a community string, either in this field or in the SNMP Community (ReadOnly) field.
SNMP V3 Settings
These fields appear if you selected SNMP V3 in the SNMP Version field. Otherwise, these fields are grayedout.
l Security Name. Name for SNMP authentication. This field is required.
l Security Passphrase. Password to authenticate the credential. This value must contain at least 8characters. This value is required if you use a Security Level that includes authentication.
l Authentication Protocol. Select an authentication algorithm for the credential. Choices are MD5 orSHA. The default value isMD5. This field is required.
l Security Level. Specifies the combination of security features for the credentials. This field is required.Choices are:
o No Authentication / No Encryption.
o Authentication Only. This is the default value.
o Authentication and Encryption.
l SNMP v3 Engine ID. The unique engine ID for the SNMP agent you want to communicate with.(SNMPv3 authentication and encryption keys are generated based on the associated passwords andthe engine ID.) This field is optional.
l Context Name. A context is a mechanism within SNMPv3 (and AgentX) that allows you to useparallel versions of the same MIB objects. For example, one version of a MIB might be associated withSNMP Version 2 and another version of the same MIB might be associated with SNMP Version 3. ForSNMP Version 3, specify the context name in this field. This field is optional.
83
5

84
l Privacy Protocol. The privacy service encryption and decryption algorithm. Choices are DES or AES.The default value is DES. This field is required.
l Privacy Protocol Passphrase. Privacy password for the credential. This field is optional.
4. Click the [Save] button to save the new SNMP credential.
5. Repeat steps 1-4 for each SNMP-enabled device in your network that you want to monitor with theScienceLogic platform.
NOTE: When you define a SNMP Credential, the ScienceLogic platform automatically aligns the credentialwith all organizations of which you are a member.
Creating a PowerShell Credential
If you configure your Windows system to respond to PowerShell requests from the ScienceLogic platform, you canuse PowerShell Dynamic Applications to collect information from your Windows system.
All of the PowerShell Dynamic Applications include a discovery object. If you include a credential for PowerShellDynamic Applications in the discovery session that includes your Windows system, the ScienceLogic platform willautomatically align the appropriate PowerShell Dynamic Applications to the Windows system. For moreinformation about creating a discovery session, see the Discovery & Credentialsmanual.
To define a PowerShell credential in the ScienceLogic platform:
1. Collect the information you need to create the credential:
l The username and password for a user on the Windows device.
l If the user is an Active Directory account, the hostname or IP address of the Active Directory server andthe domain.
l Whether an encrypted connection should be used.
l If you are using aWindows Management Proxy, the hostname or IP address of the proxy server.
2. Go to the Credential Management page (System >Manage > Credentials).
Creating SNMP and PowerShell Credentials for Windows Devices
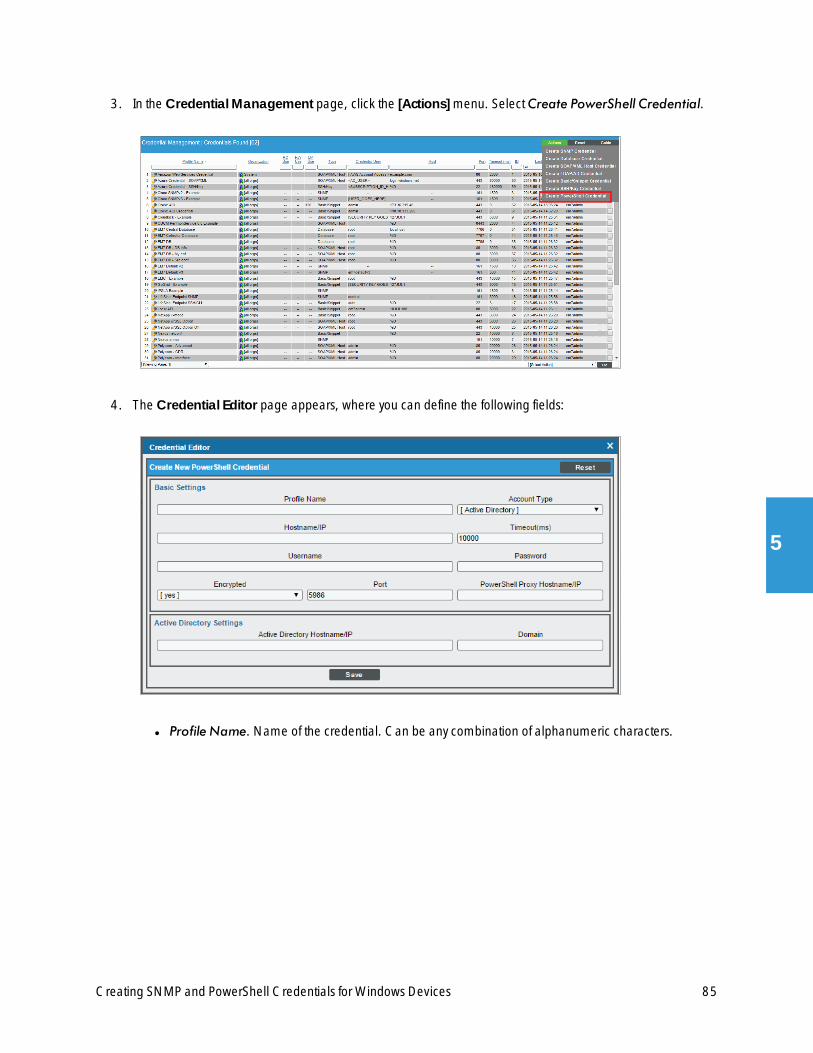
Creating SNMP and PowerShell Credentials for Windows Devices
3. In the Credential Management page, click the [Actions]menu. Select Create PowerShell Credential.
4. The Credential Editor page appears, where you can define the following fields:
l Profile Name. Name of the credential. Can be any combination of alphanumeric characters.
85
5
86
l Hostname/IP. Hostname or IP address of the device from which you want to retrieve data.
o You can include the variable %D in this field. The platform will replace the variable with the IPaddress of the device that is currently using the credential.
o You can include the variable %N in this field. The platform will replace the variable with thehostname of the device that is currently using the credential. If the platform cannot determine thehostname, the platform will replace the variable with the primary, management IP address for thecurrent device.
o You can include the prefixHOST orWSMAN before the variable %D in this field if the device youwant to monitor uses a service principal name (for example, "HOST://%D" or "WSMAN://%D").The platform will use the WinRM service HOST or WSMan instead of HTTP and replace thevariable with the IP address of the device that is currently using the credential.
l Username. Username for an account on the Windows device to be monitored or on the proxy server.
NOTE: The user should not include the domain name prefix in the username for Active Directory accounts.For example, use "em7admin" instead of "MSDOMAIN\em7admin".
l Encrypted. Select whether the platform will communicate with the device using an encryptedconnection. Choices are:
o yes. When communicating with the Windows server, the ScienceLogic platform will use a localuser account with authentication of type "Basic Auth". You must then use HTTPS and can use aMicrosoft Certificate or a self-signed certificate.
o no. When communicating with the Windows server, the ScienceLogic platform will not encrypt theconnection.
l Port. The port number used by the WinRM service on the Windows device. This field is automaticallypopulated with the default port based on the value you selected in the Encrypted field.
l Account Type. Type of authentication for the username and password in this credential. Choices are:
o Active Directory. On the Windows device, Active Directory will authenticate the username andpassword in this credential.
o Local. Local security on the Windows device will authenticate the username and password in thiscredential.
l Timeout (ms). Time, in milliseconds, after which the platform will stop trying to collect data from theauthenticating server. For collection to be successful, the platform must connect to the authenticatingserver, execute the PowerShell command, and receive a response within the amount of time specifiedin this field.
l Password. Password for the account on the Windows device to be monitored or on the proxy server.
l PowerShell Proxy Hostname/IP. If you use a proxy server in front of the Windows devices you want tocommunicate with, enter the fully-qualified domain name or the IP address of the proxy server in thisfield.
Creating SNMP and PowerShell Credentials for Windows Devices
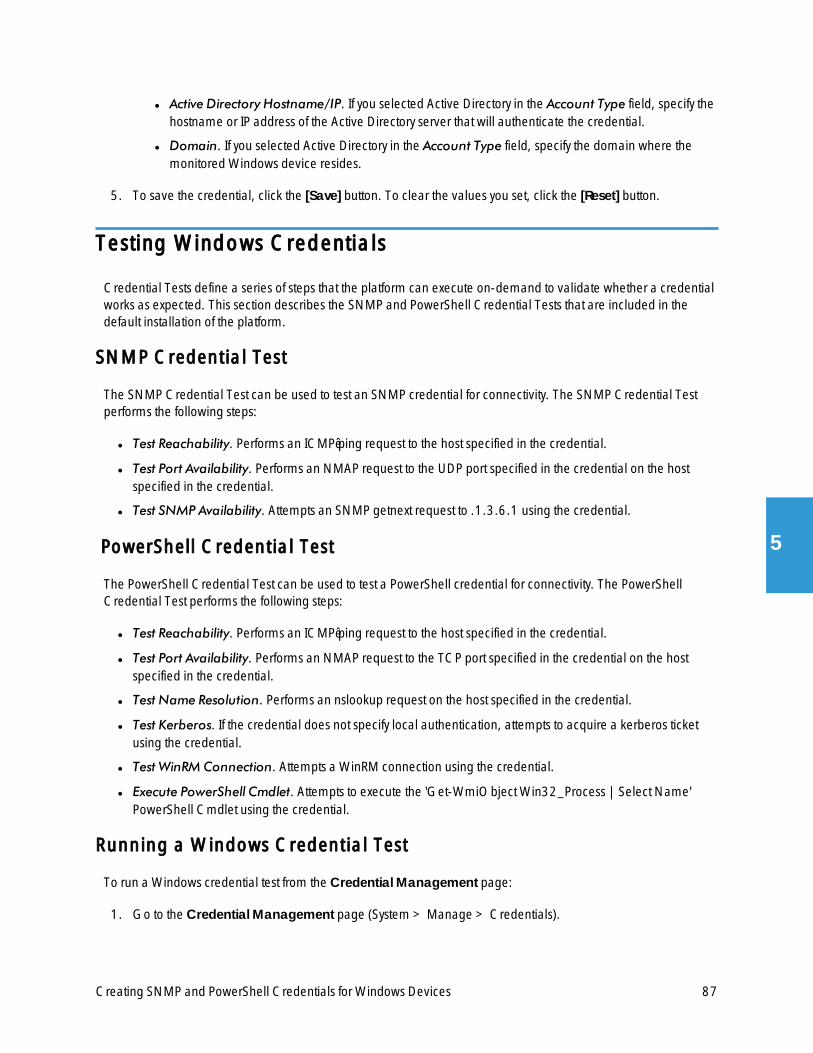
Creating SNMP and PowerShell Credentials for Windows Devices
l Active Directory Hostname/IP. If you selected Active Directory in the Account Type field, specify thehostname or IP address of the Active Directory server that will authenticate the credential.
l Domain. If you selected Active Directory in the Account Type field, specify the domain where themonitored Windows device resides.
5. To save the credential, click the [Save] button. To clear the values you set, click the [Reset] button.
Testing Windows Credentials
Credential Tests define a series of steps that the platform can execute on-demand to validate whether a credentialworks as expected. This section describes the SNMP and PowerShell Credential Tests that are included in thedefault installation of the platform.
SNMP Credential Test
The SNMP Credential Test can be used to test an SNMP credential for connectivity. The SNMP Credential Testperforms the following steps:
l Test Reachability. Performs an ICMP ping request to the host specified in the credential.
l Test Port Availability. Performs an NMAP request to the UDP port specified in the credential on the hostspecified in the credential.
l Test SNMP Availability. Attempts an SNMP getnext request to .1.3.6.1 using the credential.
PowerShell Credent ial Test
The PowerShell Credential Test can be used to test a PowerShell credential for connectivity. The PowerShellCredential Test performs the following steps:
l Test Reachability. Performs an ICMP ping request to the host specified in the credential.
l Test Port Availability. Performs an NMAP request to the TCP port specified in the credential on the hostspecified in the credential.
l Test Name Resolution. Performs an nslookup request on the host specified in the credential.
l Test Kerberos. If the credential does not specify local authentication, attempts to acquire a kerberos ticketusing the credential.
l Test WinRM Connection. Attempts a WinRM connection using the credential.
l Execute PowerShell Cmdlet. Attempts to execute the 'Get-WmiObject Win32_Process | Select Name'PowerShell Cmdlet using the credential.
Running a Windows Credential Test
To run aWindows credential test from the Credential Management page:
1. Go to the Credential Management page (System >Manage > Credentials).
87
5
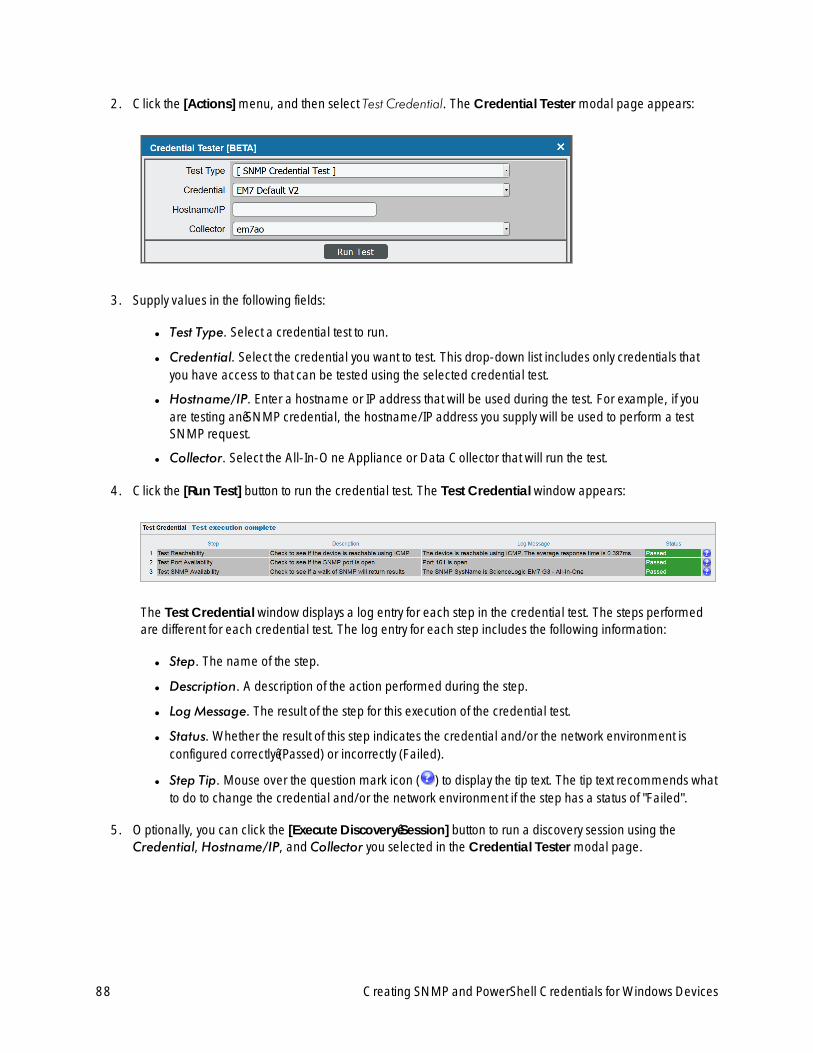
88
2. Click the [Actions]menu, and then select Test Credential. The Credential Testermodal page appears:
3. Supply values in the following fields:
l Test Type. Select a credential test to run.
l Credential. Select the credential you want to test. This drop-down list includes only credentials thatyou have access to that can be tested using the selected credential test.
l Hostname/IP. Enter a hostname or IP address that will be used during the test. For example, if youare testing an SNMP credential, the hostname/IP address you supply will be used to perform a testSNMP request.
l Collector. Select the All-In-One Appliance or Data Collector that will run the test.
4. Click the [Run Test] button to run the credential test. The Test Credentialwindow appears:
The Test Credentialwindow displays a log entry for each step in the credential test. The steps performedare different for each credential test. The log entry for each step includes the following information:
l Step. The name of the step.
l Description. A description of the action performed during the step.
l Log Message. The result of the step for this execution of the credential test.
l Status. Whether the result of this step indicates the credential and/or the network environment isconfigured correctly (Passed) or incorrectly (Failed).
l Step Tip. Mouse over the question mark icon ( ) to display the tip text. The tip text recommends whatto do to change the credential and/or the network environment if the step has a status of "Failed".
5. Optionally, you can click the [Execute Discovery Session] button to run a discovery session using theCredential, Hostname/IP, and Collector you selected in the Credential Testermodal page.
Creating SNMP and PowerShell Credentials for Windows Devices
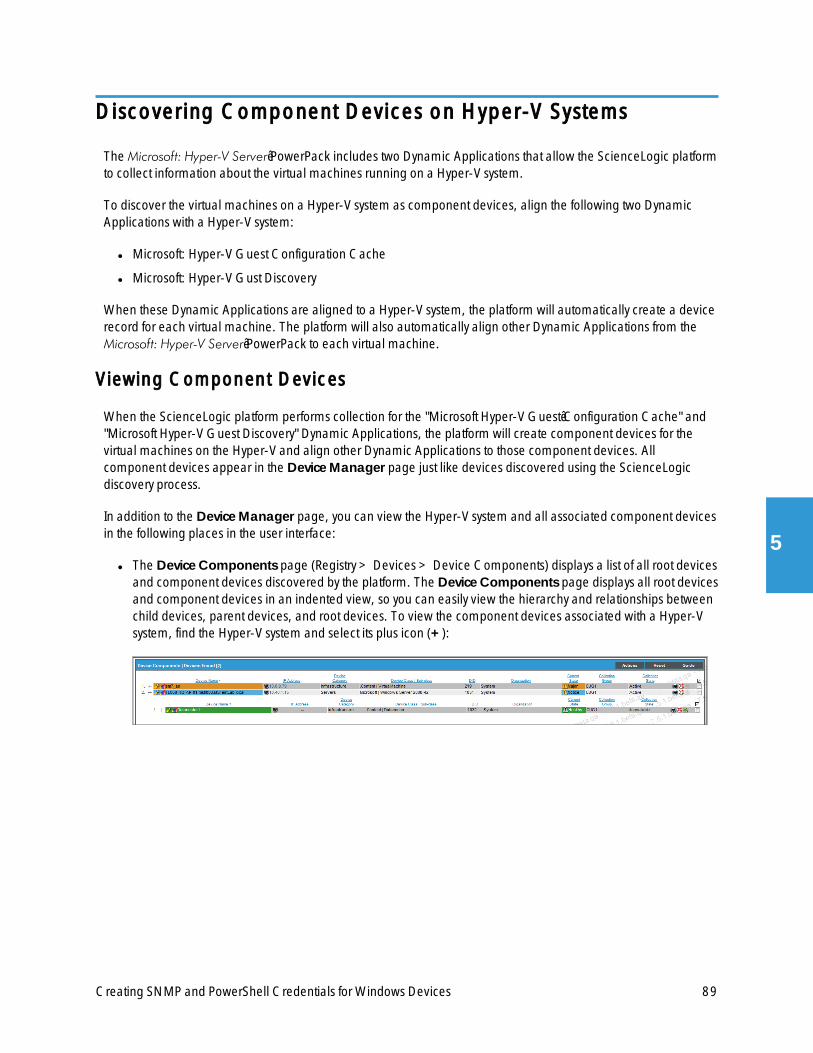
Creating SNMP and PowerShell Credentials for Windows Devices
Discovering Component Devices on Hyper-V Systems
The Microsoft: Hyper-V Server PowerPack includes two Dynamic Applications that allow the ScienceLogic platformto collect information about the virtual machines running on a Hyper-V system.
To discover the virtual machines on a Hyper-V system as component devices, align the following two DynamicApplications with a Hyper-V system:
l Microsoft: Hyper-V Guest Configuration Cache
l Microsoft: Hyper-V Gust Discovery
When these Dynamic Applications are aligned to a Hyper-V system, the platform will automatically create a devicerecord for each virtual machine. The platform will also automatically align other Dynamic Applications from theMicrosoft: Hyper-V Server PowerPack to each virtual machine.
Viewing Component Devices
When the ScienceLogic platform performs collection for the "Microsoft Hyper-V Guest Configuration Cache" and"Microsoft Hyper-V Guest Discovery" Dynamic Applications, the platform will create component devices for thevirtual machines on the Hyper-V and align other Dynamic Applications to those component devices. Allcomponent devices appear in the DeviceManager page just like devices discovered using the ScienceLogicdiscovery process.
In addition to the DeviceManager page, you can view the Hyper-V system and all associated component devicesin the following places in the user interface:
l The Device Components page (Registry > Devices > Device Components) displays a list of all root devicesand component devices discovered by the platform. The Device Components page displays all root devicesand component devices in an indented view, so you can easily view the hierarchy and relationships betweenchild devices, parent devices, and root devices. To view the component devices associated with a Hyper-Vsystem, find the Hyper-V system and select its plus icon (+):
89
5
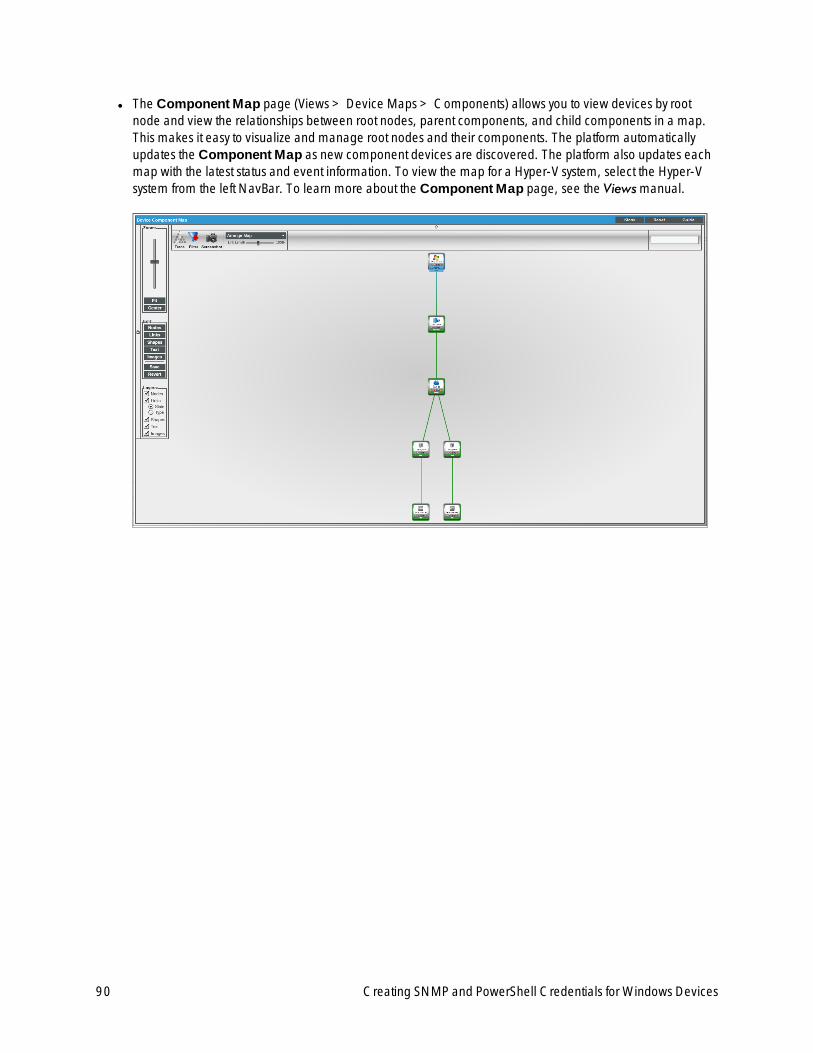
90
l The Component Map page (Views > Device Maps > Components) allows you to view devices by rootnode and view the relationships between root nodes, parent components, and child components in a map.This makes it easy to visualize and manage root nodes and their components. The platform automaticallyupdates the Component Map as new component devices are discovered. The platform also updates eachmap with the latest status and event information. To view the map for a Hyper-V system, select the Hyper-Vsystem from the left NavBar. To learn more about the Component Map page, see the Viewsmanual.
Creating SNMP and PowerShell Credentials for Windows Devices
Monitoring aWindows Cluster
Chapter
6Monitoring a Windows Cluster
Overview
The following sections describe how to monitor a Windows Cluster using the ScienceLogic platform:
Monitoring Windows Clusters in the ScienceLogic Platform 91
Discovering Cluster Nodes 92
Aligning a Dynamic Application with a Cluster Node 92
Disabling Collection of a Dynamic Application on a Device 93
Discovering the Cluster IP Address 94
Aligning Dynamic Applications with the Cluster Device 96
Using a Device Template to Configure Dynamic Applications 97
Monitoring Windows Clusters in the ScienceLogic Platform
The general approach for monitoring aWindows Cluster is to discover each cluster node and then discover theshared IP address as an additional, separate, device:
l For each cluster node, configure the ScienceLogic platform to monitor the non-cluster related aspects of thedevices. For example, the CPU, memory, and interface utilization for each node. When you configuremonitoring for each cluster node, you will ensure that the cluster services are not monitored on each clusternode.
91
6
92
l For the additional device that represents the cluster itself, configure the ScienceLogic platform to monitor theclustered services. For example, you would align the performance Dynamic Applications that collect dataabout a Windows device to this device record. When you configure monitoring for the device record thatrepresents the clustered services, you will ensure that node-specific data, for example, CPU, memory, andinterface utilization, is not monitored through the shared IP.
NOTE: Version 101 of the Microsoft: SQL Server Enhanced PowerPack does not support the ability to monitorSQL Server clusters. The SQL Servers that you monitor must not be using Windows Server FailoverClustering (WSFC) or SQL Server Failover Cluster Instances (FCI) for high-availability.
By monitoring the shared IP address separately, the ScienceLogic platform will always poll the active cluster nodefor information about the clustered service.
Discovering Cluster Nodes
The steps to discover the individual cluster nodes depend on the types of Dynamic Application you will use tomonitor the cluster services, i.e. the Dynamic Applications that will be aligned with the device record for the sharedIP address. When you discover each cluster node, you must configure the ScienceLogic platform to ensure that theDynamic Applications for the clustered service are not aligned automatically.
There are several approaches to preventing the Dynamic Applications for the clustered service from beingautomatically aligned to each cluster node:
l In the discovery session for a cluster node, do not include any credentials that can be used to collect theDynamic Applications for the clustered service. For example, if you will use WMI Dynamic Applications tomonitor the clustered service, do not include a credential that can be used to successfully make WMI requestsin the discovery session. By using this method, you might prevent the automatic alignment of DynamicApplications that you would like to align with the cluster nodes; in this case, you would have to align thoseDynamic Applications manually.
l In some cases, you might need or want to include credentials that can be used to collect DynamicApplications for the clustered service in the discovery session for a cluster node. This typically occurs when theDynamic Applications for the clustered service use the SNMP protocol. If you need to include any credentialthat can be used to collect Dynamic Applications for the clustered service in the discovery session for a clusternode, you can allow the Dynamic Applications for the clustered service to align with the device records for thecluster nodes, then manually disable collection for those Dynamic Applications on those devices. TheScienceLogic platform will not re-enable collection for those Dynamic Applications.
The following sub-sections describe how to manually align a Dynamic Application with a cluster node and how todisable collection of a Dynamic Application on a device. If you are configuring the ScienceLogic platform tomonitor multiple clusters that provide the same service, you can speed up both of these tasks by creating andapplying device templates.
Aligning a Dynamic Applicat ion with a Cluster Node
If you need to manually align a Dynamic Application to a cluster node, perform the following steps:
1. Go to the DeviceManager page (Registry > Devices > Device Manager).
Monitoring aWindows Cluster
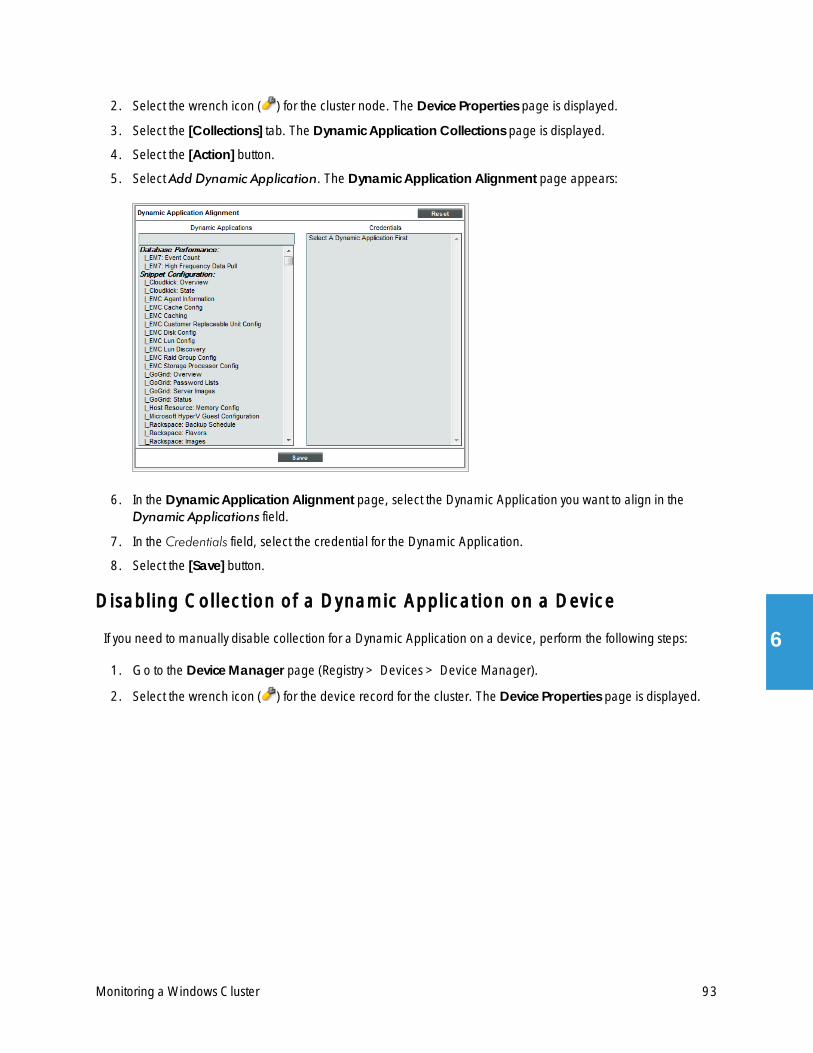
Monitoring aWindows Cluster
2. Select the wrench icon ( ) for the cluster node. The Device Properties page is displayed.
3. Select the [Collections] tab. The Dynamic Application Collections page is displayed.
4. Select the [Action] button.
5. Select Add Dynamic Application. The Dynamic Application Alignment page appears:
6. In the Dynamic Application Alignment page, select the Dynamic Application you want to align in theDynamic Applications field.
7. In the Credentials field, select the credential for the Dynamic Application.
8. Select the [Save] button.
Disabling Collect ion of a Dynamic Applicat ion on a Device
If you need to manually disable collection for a Dynamic Application on a device, perform the following steps:
1. Go to the DeviceManager page (Registry > Devices > Device Manager).
2. Select the wrench icon ( ) for the device record for the cluster. The Device Properties page is displayed.
93
6
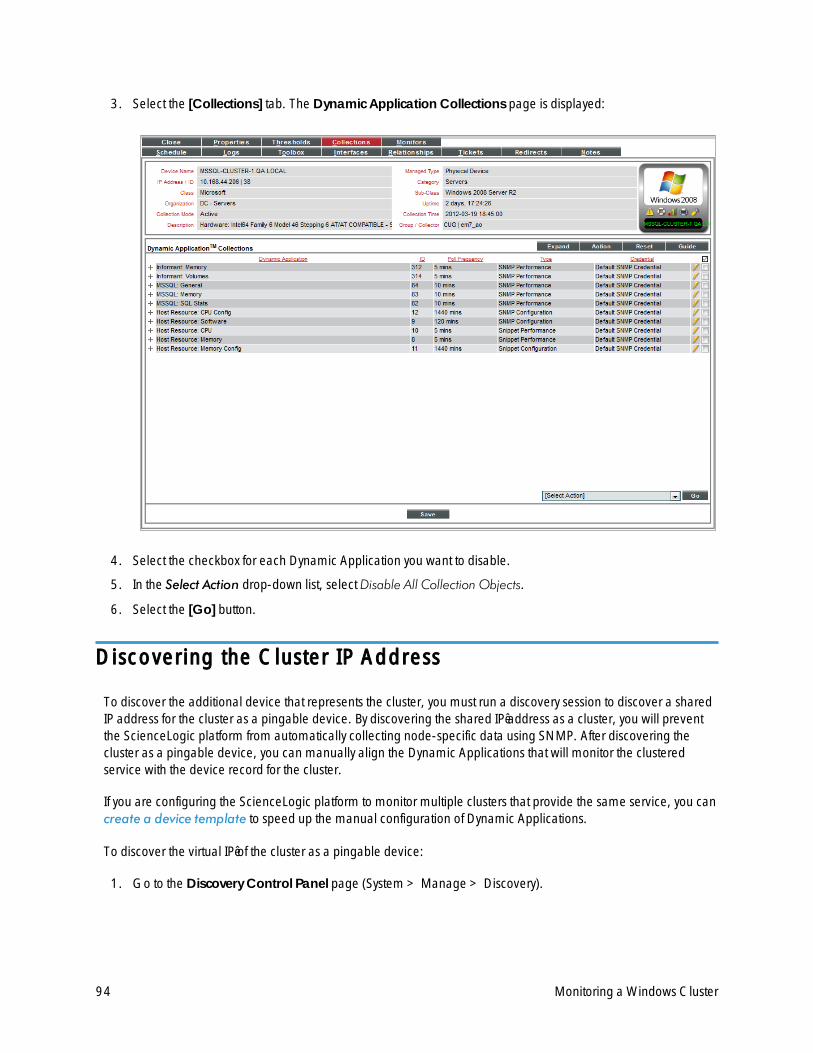
94
3. Select the [Collections] tab. The Dynamic Application Collections page is displayed:
4. Select the checkbox for each Dynamic Application you want to disable.
5. In the Select Action drop-down list, selectDisable All Collection Objects.
6. Select the [Go] button.
Discovering the Cluster IP Address
To discover the additional device that represents the cluster, you must run a discovery session to discover a sharedIP address for the cluster as a pingable device. By discovering the shared IP address as a cluster, you will preventthe ScienceLogic platform from automatically collecting node-specific data using SNMP. After discovering thecluster as a pingable device, you can manually align the Dynamic Applications that will monitor the clusteredservice with the device record for the cluster.
If you are configuring the ScienceLogic platform to monitor multiple clusters that provide the same service, you cancreate a device template to speed up the manual configuration of Dynamic Applications.
To discover the virtual IP of the cluster as a pingable device:
1. Go to the Discovery Control Panel page (System >Manage > Discovery).
Monitoring aWindows Cluster
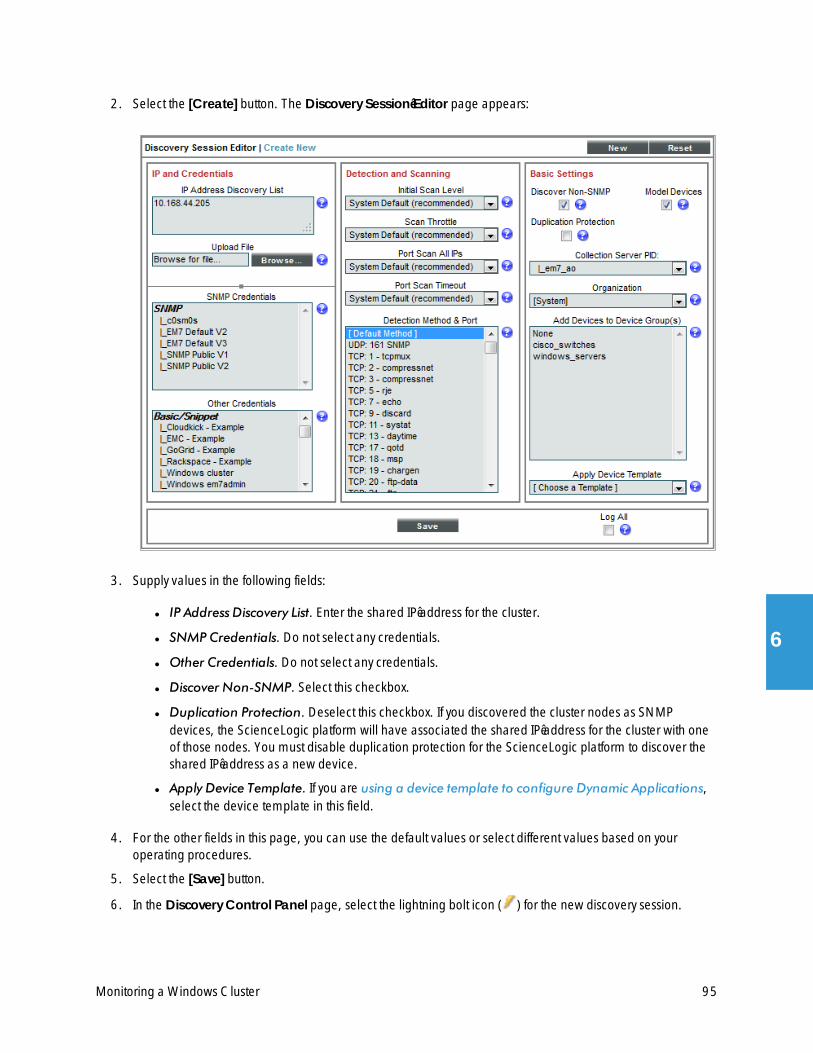
Monitoring aWindows Cluster
2. Select the [Create] button. The Discovery Session Editor page appears:
3. Supply values in the following fields:
l IP Address Discovery List. Enter the shared IP address for the cluster.
l SNMP Credentials. Do not select any credentials.
l Other Credentials. Do not select any credentials.
l Discover Non-SNMP. Select this checkbox.
l Duplication Protection. Deselect this checkbox. If you discovered the cluster nodes as SNMPdevices, the ScienceLogic platform will have associated the shared IP address for the cluster with oneof those nodes. You must disable duplication protection for the ScienceLogic platform to discover theshared IP address as a new device.
l Apply Device Template. If you are using a device template to configure Dynamic Applications,select the device template in this field.
4. For the other fields in this page, you can use the default values or select different values based on youroperating procedures.
5. Select the [Save] button.
6. In the Discovery Control Panel page, select the lightning bolt icon ( ) for the new discovery session.
95
6
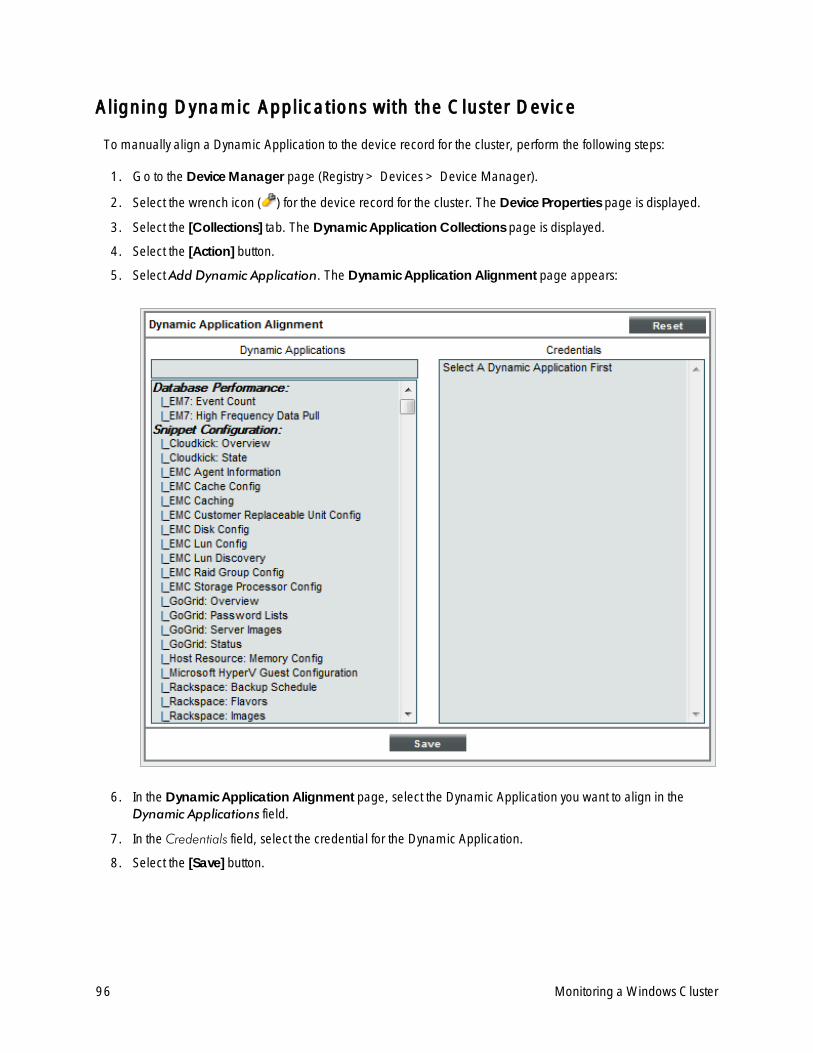
96
Aligning Dynamic Applicat ions with the Cluster Device
Tomanually align a Dynamic Application to the device record for the cluster, perform the following steps:
1. Go to the DeviceManager page (Registry > Devices > Device Manager).
2. Select the wrench icon ( ) for the device record for the cluster. The Device Properties page is displayed.
3. Select the [Collections] tab. The Dynamic Application Collections page is displayed.
4. Select the [Action] button.
5. Select Add Dynamic Application. The Dynamic Application Alignment page appears:
6. In the Dynamic Application Alignment page, select the Dynamic Application you want to align in theDynamic Applications field.
7. In the Credentials field, select the credential for the Dynamic Application.
8. Select the [Save] button.
Monitoring aWindows Cluster
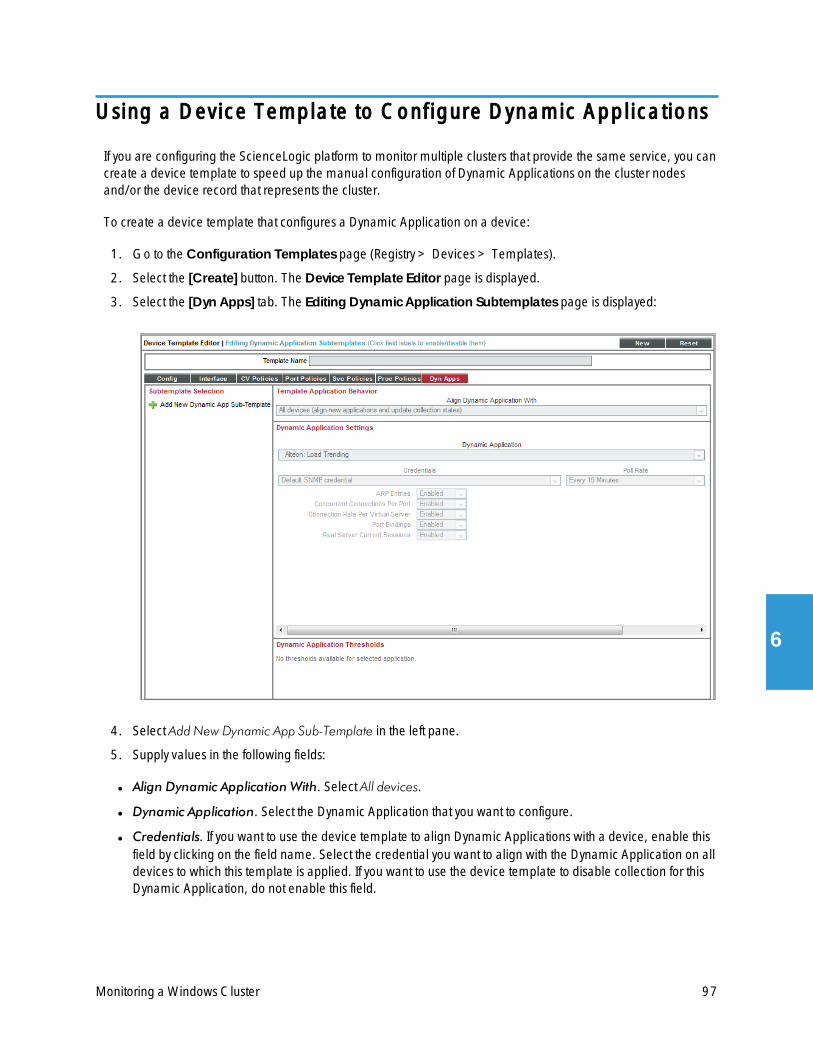
Monitoring aWindows Cluster
Using a Device Template to Configure Dynamic Applications
If you are configuring the ScienceLogic platform to monitor multiple clusters that provide the same service, you cancreate a device template to speed up the manual configuration of Dynamic Applications on the cluster nodesand/or the device record that represents the cluster.
To create a device template that configures a Dynamic Application on a device:
1. Go to the Configuration Templates page (Registry > Devices > Templates).
2. Select the [Create] button. The Device Template Editor page is displayed.
3. Select the [Dyn Apps] tab. The Editing Dynamic Application Subtemplates page is displayed:
4. Select Add New Dynamic App Sub-Template in the left pane.
5. Supply values in the following fields:
l Align Dynamic Application With. Select All devices.
l Dynamic Application. Select the Dynamic Application that you want to configure.
l Credentials. If you want to use the device template to align Dynamic Applications with a device, enable thisfield by clicking on the field name. Select the credential you want to align with the Dynamic Application on alldevices to which this template is applied. If you want to use the device template to disable collection for thisDynamic Application, do not enable this field.
97
6
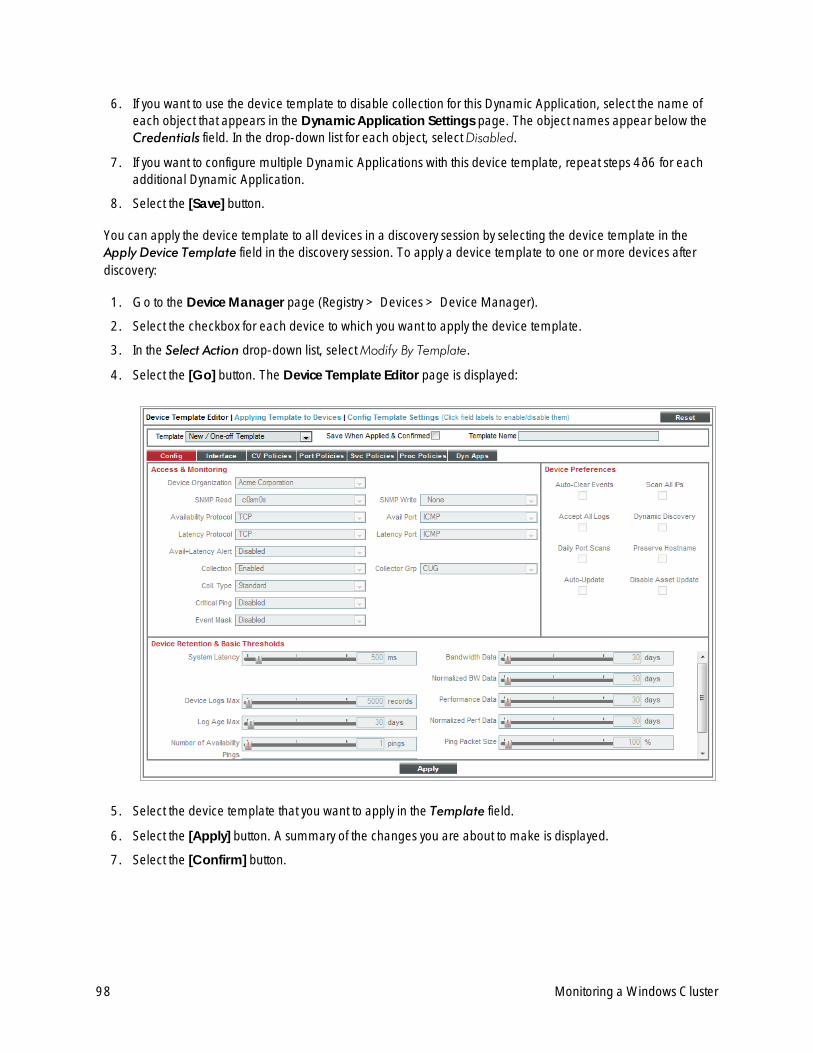
98
6. If you want to use the device template to disable collection for this Dynamic Application, select the name ofeach object that appears in the Dynamic Application Settings page. The object names appear below theCredentials field. In the drop-down list for each object, selectDisabled.
7. If you want to configure multiple Dynamic Applications with this device template, repeat steps 4–6 for eachadditional Dynamic Application.
8. Select the [Save] button.
You can apply the device template to all devices in a discovery session by selecting the device template in theApply Device Template field in the discovery session. To apply a device template to one or more devices afterdiscovery:
1. Go to the DeviceManager page (Registry > Devices > Device Manager).
2. Select the checkbox for each device to which you want to apply the device template.
3. In the Select Action drop-down list, selectModify By Template.
4. Select the [Go] button. The Device Template Editor page is displayed:
5. Select the device template that you want to apply in the Template field.
6. Select the [Apply] button. A summary of the changes you are about to make is displayed.
7. Select the [Confirm] button.
Monitoring aWindows Cluster
Windows Dashboards
Chapter
7Windows Dashboards
Overview
The following sections describe how to install the dashboards included in the ScienceLogic platform for Microsoftservers and a description of each:
Installing the Microsoft Server Dashboards 99
Microsoft: Active Directory Server Performance 101
Microsoft: DNS Server Performance 104
Microsoft: Exchange Server 2010 Performance 106
Microsoft: Exchange Server 2013 Performance 109
Microsoft: IIS Server Performance 112
Microsoft: Lync Server 2010 Dashboards 114
Microsoft: Lync Server 2010 Performance 114
Microsoft: Lync Server 2010 Utilization 117
Microsoft: Skype for Business Dashboards 120
Microsoft: Lync Server 2013 Performance 120
Microsoft: Lync Server 2013 Utilization 123
Microsoft: SQL Server Performance 126
Installing the Microsoft Server Dashboards
The following PowerPacks contain dashboards for Microsoft servers:
l Microsoft: Active Directory Server Dashboards
99
7

100
l Microsoft: DNS Server Dashboards
l Microsoft: Exchange Server 2010 Dashboards
l Microsoft: Exchange Server 2013 Dashboards
l Microsoft: IIS Server Dashboards
l Microsoft: Lync Server 2010 Dashboards
l Microsoft: Skype for Business Dashboards
l Microsoft: SQL Server Dashboards
To view these dashboards in the ScienceLogic platform, you must first install the corresponding PowerPack. To doso:
1. Go to the PowerPack Manager page (System >Manage > PowerPacks).
2. Click the [Actions] button, then select Install PowerPack. The Imported PowerPacks modal page appears.
3. Use the search filter in the PowerPack Name column heading to locate the PowerPack you want to install.To do so, enter text to match, including special characters, and the Imported PowerPacks modal pagedisplays only PowerPacks that have a matching name.
4. Click the lightning-bolt icon ( ) for the PowerPack that you want to install.
Windows Dashboards
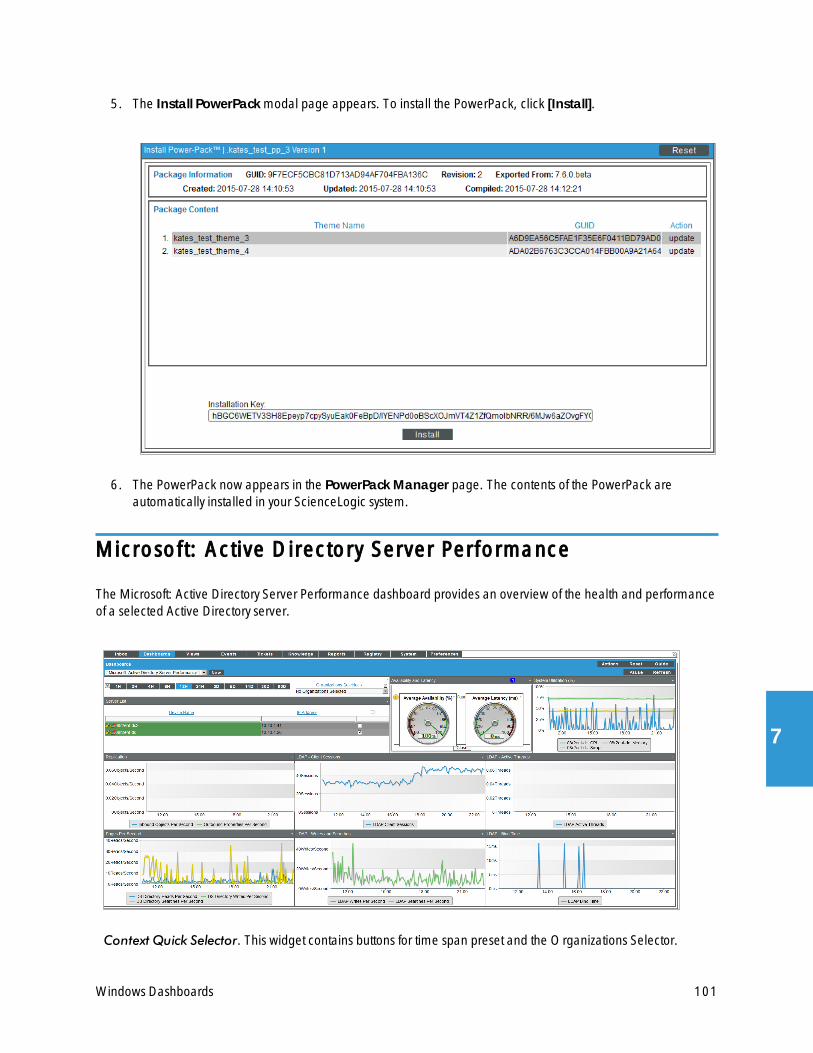
Windows Dashboards
5. The Install PowerPackmodal page appears. To install the PowerPack, click [Install].
6. The PowerPack now appears in the PowerPack Manager page. The contents of the PowerPack areautomatically installed in your ScienceLogic system.
Microsoft: Active Directory Server Performance
The Microsoft: Active Directory Server Performance dashboard provides an overview of the health and performanceof a selected Active Directory server.
Context Quick Selector. This widget contains buttons for time span preset and the Organizations Selector.
101
7

102
l Time span presets. Users select the time span over which they want to view data. Selections range from onehour to 90 days.
l Organizations Selector. This drop-down list allows a user to select specific organizations for which they wantto view data. This field filters the list of Active Directory servers that appear in the Server List widget.
Server List. This widget displays a list of Active Directory servers. Selecting a server drives the context for the otherwidgets in the dashboard.
Availability and Latency. This widget displays two gauges:
l The availability of the selected Active Directory server, in percent.
l The latency of the selected Active Directory server, in milliseconds.
SystemUtilization (%). This widget displays a line graph. The line graph displays memory usage, virtual-memoryusage, and CPU usage for the selected Active Directory server during the selected duration. Each parameter isrepresented by a color-coded line.
l The y axis displays usage, in percent.
l The x axis displays time. The increments vary, depending upon the date range selected in the Context QuickSelectorwidget.
l Mousing over any point in any line displays the average value at that time-point.
l Clicking on a data point displays the Device Performance graph for the selected parameter on the selectedActive Directory server.
Replication. Replication is the process by which the changes that are made on one domain controller aresynchronized with and written to all other domain controllers in the domain or forest. The Replication widgetdisplays a line graph. The line graph displays information about data that is replicated from the current ActiveDirectory server to other Active Directory servers (the Outbound Properties Per Second) and information about datathat is replicated from other Active Directory server to the current Active Directory server (InboundObjects PerSecond).
l The y axis displays objects per second.
l The x axis displays time. The increments vary, depending upon the date ranges selected in theContextQuick Selectorwidget.
l Mousing over any point in any line displays the average value at that time-point.
l Clicking on a data point displays the Device Performance graph for the selected parameter on the selectedActive Directory server.
LDAP - Client Sessions. This widget displays the number of connected LDAP client sessions over time.
l The y axis displays number of sessions .
l The x axis displays time. The increments vary, depending upon the date range selected in the Context QuickSelector widget.
l Mousing over any point in any line displays the average value at that time-point.
Windows Dashboards
Windows Dashboards
l Clicking on a data point displays the Device Performance graph for the selected parameter on the selectedActive Directory server.
LDAP - Active Threads. This widget displays the number of threads in use by the LDAP subsystem of the localdirectory service.
l The y axis displays number of threads.
l The x axis displays time. The increments vary, depending upon the date range selected in the Context QuickSelector widget.
l Mousing over any point in any line displays the average value at that time-point.
l Clicking on a data point displays the Device Performance graph for the selected parameter on the selectedActive Directory server.
Pages Per Second. This widget displays a line graph. The line graph displays DS (domain server) directory readsper second, DS directory writes per second, and DS directory searches per second. Each parameter is representedby a color-coded line.
l The y axis displays usage, in percent.
l The x axis displays time. The increments vary, depending upon the date range selected in the Context QuickSelector widget.
l Mousing over any point in any line displays the average value at that time-point.
l Clicking on a data point displays the Device Performance graph for the selected parameter on the selectedActive Directory server.
LDAP - Writes and Searches. This widget displays a line graph. The line graph displays LDAP writes per secondand LDAP searches per second. Each parameter is represented by a color-coded line.
l The y axis displays writers per second and searches per second.
l The x axis displays time. The increments vary, depending upon the date range selected in the Context QuickSelector widget.
l Mousing over any point in any line displays the average value at that time-point.
l Clicking on a data point displays the Device Performance graph for the selected parameter on the selectedActive Directory server.
LDAP - Bind Time. This widget displays a line graph. The line graph displays the time required for completion ofeach successful LDAP binding.
l The y axis displays duration in milliseconds.
l The x axis displays time. The increments vary, depending upon the date range selected in the Context QuickSelector widget.
l Mousing over any point in any line displays the average value at that time-point.
l Clicking on a data point displays the Device Performance graph for the selected parameter on the selectedActive Directory server.
103
7
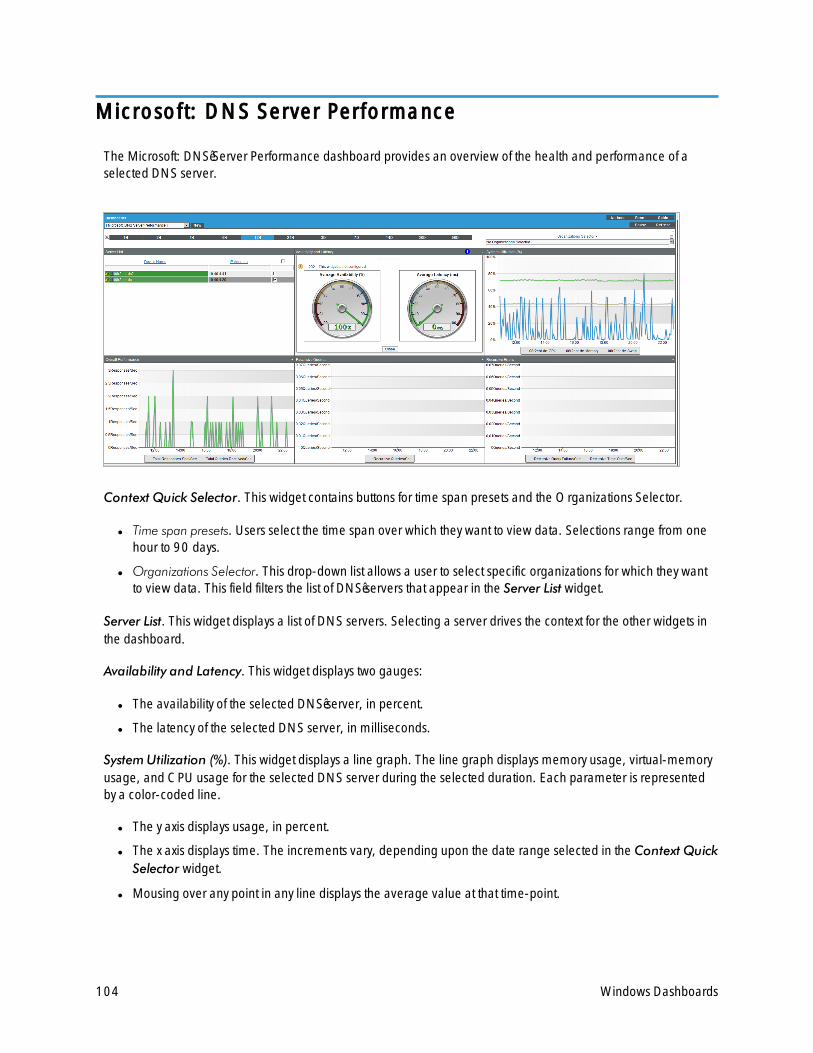
104
Microsoft: DNS Server Performance
The Microsoft: DNS Server Performance dashboard provides an overview of the health and performance of aselected DNS server.
Context Quick Selector. This widget contains buttons for time span presets and the Organizations Selector.
l Time span presets. Users select the time span over which they want to view data. Selections range from onehour to 90 days.
l Organizations Selector. This drop-down list allows a user to select specific organizations for which they wantto view data. This field filters the list of DNS servers that appear in the Server List widget.
Server List. This widget displays a list of DNS servers. Selecting a server drives the context for the other widgets inthe dashboard.
Availability and Latency. This widget displays two gauges:
l The availability of the selected DNS server, in percent.
l The latency of the selected DNS server, in milliseconds.
SystemUtilization (%). This widget displays a line graph. The line graph displays memory usage, virtual-memoryusage, and CPU usage for the selected DNS server during the selected duration. Each parameter is representedby a color-coded line.
l The y axis displays usage, in percent.
l The x axis displays time. The increments vary, depending upon the date range selected in the Context QuickSelector widget.
l Mousing over any point in any line displays the average value at that time-point.
Windows Dashboards
Windows Dashboards
l Clicking on a data point displays the Device Performance graph for the selected parameter on the selectedDNS server.
Overall Performance. This widget displays a line graph. The line graph displays Total Responses Sent per Secondand Total Queries Received per Second. Each parameter is represented by a color-coded line.
l The y axis displays responses per second and queries per second.
l The x axis displays time. The increments vary, depending upon the date range selected in the Context QuickSelector widget.
l Mousing over any point in any line displays the average value at that time-point.
l Clicking on a data point displays the Device Performance graph for the selected parameter on the selectedDNS server.
Recursive Queries. This widget displays a line graph. The line graph displays Recursive Queries per Second.
l The y axis displays number of queries per second.
l The x axis displays time. The increments vary, depending upon the date range selected in the Context QuickSelector widget.
l Mousing over any point in any line displays the average value at that time-point.
l Clicking on a data point displays the Device Performance graph for the selected parameter on the selectedDNS server.
Recursive Errors. This widget displays a line graph. The line graph displays Recursive Query Failures per Secondand Recursive Time-Outs per Second. Each parameter is represented by a color-coded line..
l The y axis displays number of queries per second.
l The x axis displays time. The increments vary, depending upon the date range selected in the Context QuickSelector widget.
l Mousing over any point in any line displays the average value at that time-point.
l Clicking on a data point displays the Device Performance graph for the selected parameter on the selectedDNS server.
105
7
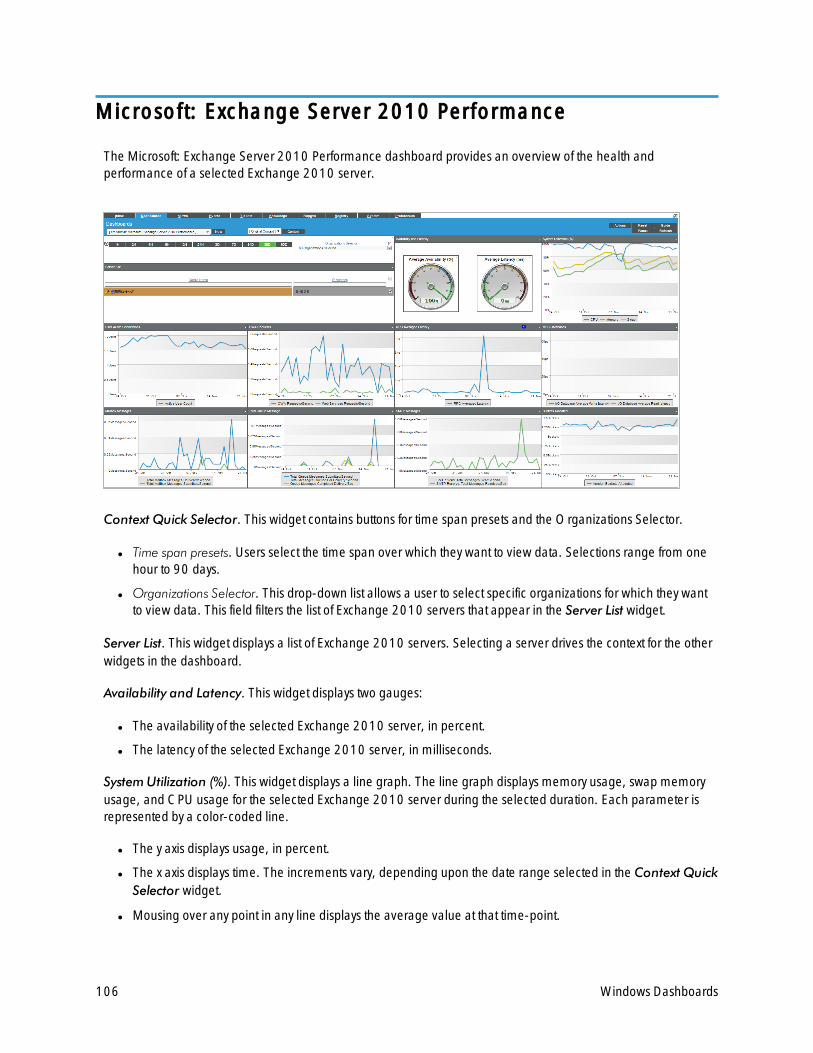
106
Microsoft: Exchange Server 2010 Performance
The Microsoft: Exchange Server 2010 Performance dashboard provides an overview of the health andperformance of a selected Exchange 2010 server.
Context Quick Selector. This widget contains buttons for time span presets and the Organizations Selector.
l Time span presets. Users select the time span over which they want to view data. Selections range from onehour to 90 days.
l Organizations Selector. This drop-down list allows a user to select specific organizations for which they wantto view data. This field filters the list of Exchange 2010 servers that appear in the Server List widget.
Server List. This widget displays a list of Exchange 2010 servers. Selecting a server drives the context for the otherwidgets in the dashboard.
Availability and Latency. This widget displays two gauges:
l The availability of the selected Exchange 2010 server, in percent.
l The latency of the selected Exchange 2010 server, in milliseconds.
SystemUtilization (%). This widget displays a line graph. The line graph displays memory usage, swap memoryusage, and CPU usage for the selected Exchange 2010 server during the selected duration. Each parameter isrepresented by a color-coded line.
l The y axis displays usage, in percent.
l The x axis displays time. The increments vary, depending upon the date range selected in the Context QuickSelector widget.
l Mousing over any point in any line displays the average value at that time-point.
Windows Dashboards
Windows Dashboards
l Clicking on a data point displays the Device Performance graph for the selected parameter on the selectedExchange 2010 server.
User Active Connections. This widget displays a line graph. The line graph displays the number of active userconnections for the selected Exchange 2010 server during the selected duration.
l The y axis displays the number of users.
l The x axis displays time. The increments vary, depending upon the date range selected in the Context QuickSelector widget.
l Mousing over any point in the line displays the average value at that time-point.
l Clicking on a data point displays the Device Performance graph for the selected parameter on the selectedExchange 2010 server.
OWA Requests. This widget displays a line graph. The line graph displays two lines: One for the frequency ofOutlook Web Access requests for the selected Exchange 2010 server during the selected duration and another forthe frequency of Web Services requests for the selected Exchange 2010 server during the selected duration.
l The y axis displays the number of requests per second.
l The x axis displays time. The increments vary, depending upon the date range selected in the Context QuickSelector widget.
l Mousing over any point in any line displays the average value at that time-point.
l Clicking on a data point displays the Device Performance graph for the selected parameter on the selectedExchange 2010 server.
RPC Averaged Latency. This widget displays a line graph. The line graph displays the average latency of remoteprocedure calls (RPCs) for the selected Exchange 2010 server during the selected duration.
l The y axis displays the average RPC latency, in milliseconds.
l The x axis displays time. The increments vary, depending upon the date range selected in the Context QuickSelector widget.
l Mousing over any point in any line displays the average value at that time-point.
l Clicking on a data point displays the Device Performance graph for the selected parameter on the selectedExchange 2010 server.
MBS Databases. This widget displays a line graph. The line graph displays two lines: One for I/O write latency forthe mailbox server database for the selected Exchange 2010 and one for I/O read latency to the mailbox serverfor the selected Exchange 2010 server during the selected duration.
l The y axis displays the write and read latency statistics in milliseconds.
l The x axis displays time. The increments vary, depending upon the date range selected in the Context QuickSelector widget.
l Mousing over any point in any line displays the average value at that time-point.
l Clicking on a data point displays the Device Performance graph for the selected parameter on the selectedExchange 2010 server.
107
7

108
MailboxMessages.This widget displays a line graph. The line graph displays two lines: One for the number ofmailbox messages sent to the selected Exchange 2010 server and one for the number of mailbox message sentfrom the selected Exchange 2010 server during the selected duration.
l The y axis displays the number of messages per second.
l The x axis displays time. The increments vary, depending upon the date range selected in the Context QuickSelector widget.
l Mousing over any point in any line displays the average value at that time-point.
l Clicking on a data point displays the Device Performance graph for the selected parameter on the selectedExchange 2010 server.
Total QueueMessages. This widget displays a line graph. The line graph includes three lines: One for thenumber of messages in the submission queue, one for the number of messages in the delivery queue, and one forthe number of queued message that were delivered for the selected Exchange 2010 server during the selectedduration.
l The y axis displays the number of messages per second.
l The x axis displays time. The increments vary, depending upon the date range selected in the Context QuickSelector widget.
l Mousing over any point in any line displays the average value at that time-point.
l Clicking on a data point displays the Device Performance graph for the selected parameter on the selectedExchange 2010 server.
SMTPMessages. This widget displays a line graph. The line graphs includes two lines: One for the number ofSMTP messages sent from the selected Exchange 2010 server and one for the number of SMTP messagesreceived by the selected Exchange 2010 server during the selected duration.
l The y axis displays the number of messages per second.
l The x axis displays time. The increments vary, depending upon the date range selected in the Context QuickSelector widget.
l Mousing over any point in any line displays the average value at that time-point.
l Clicking on a data point displays the Device Performance graph for the selected parameter on the selectedExchange 2010 server.
Buckets Allocated. This widget displays a line graph. The line graph displays the number of buckets of versionstore memory used by the selected Exchange 2010 server during the selected duration.
l The y axis displays the number of allocated buckets.
l The x axis displays time. The increments vary, depending upon the date range selected in the Context QuickSelector widget.
l Mousing over any point in any line displays the average value at that time-point.
l Clicking on a data point displays the Device Performance graph for the selected parameter on the selectedExchange 2010 server.
Windows Dashboards
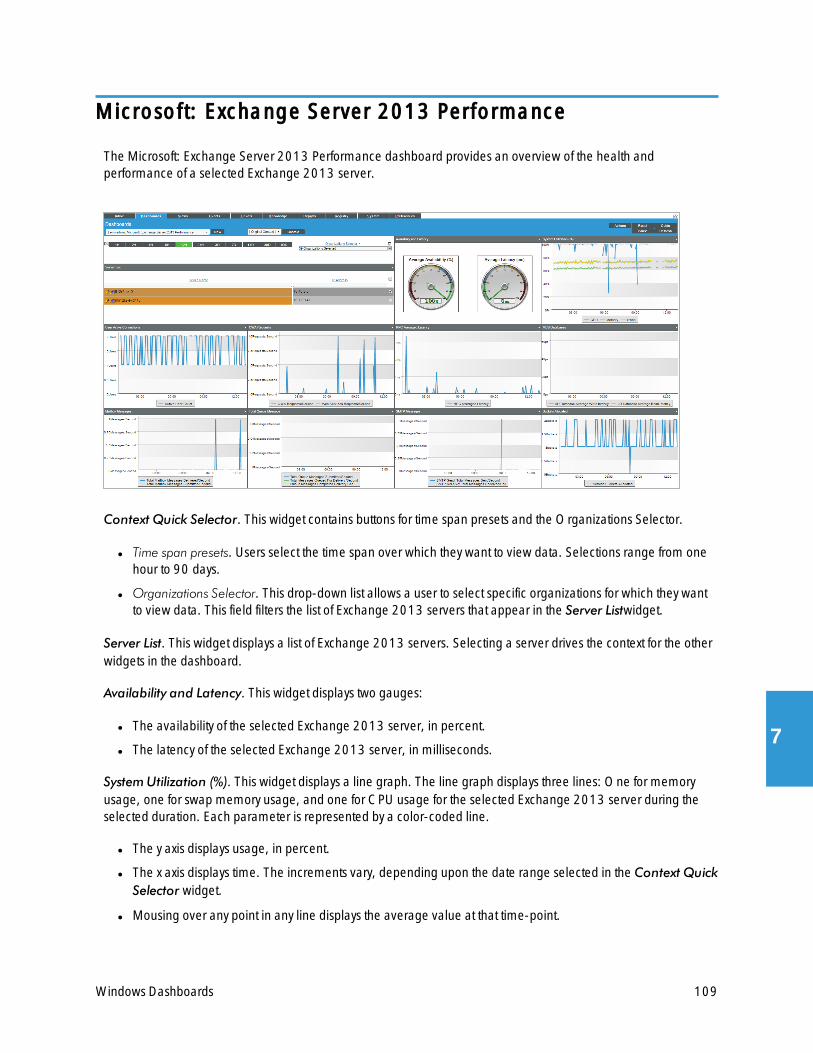
Windows Dashboards
Microsoft: Exchange Server 2013 Performance
The Microsoft: Exchange Server 2013 Performance dashboard provides an overview of the health andperformance of a selected Exchange 2013 server.
Context Quick Selector. This widget contains buttons for time span presets and the Organizations Selector.
l Time span presets. Users select the time span over which they want to view data. Selections range from onehour to 90 days.
l Organizations Selector. This drop-down list allows a user to select specific organizations for which they wantto view data. This field filters the list of Exchange 2013 servers that appear in the Server Listwidget.
Server List. This widget displays a list of Exchange 2013 servers. Selecting a server drives the context for the otherwidgets in the dashboard.
Availability and Latency. This widget displays two gauges:
l The availability of the selected Exchange 2013 server, in percent.
l The latency of the selected Exchange 2013 server, in milliseconds.
SystemUtilization (%). This widget displays a line graph. The line graph displays three lines: One for memoryusage, one for swap memory usage, and one for CPU usage for the selected Exchange 2013 server during theselected duration. Each parameter is represented by a color-coded line.
l The y axis displays usage, in percent.
l The x axis displays time. The increments vary, depending upon the date range selected in the Context QuickSelector widget.
l Mousing over any point in any line displays the average value at that time-point.
109
7

110
l Clicking on a data point displays the Device Performance graph for the selected parameter on the selectedExchange 2013 server.
User Active Connections. This widget displays a line graph. The line graph displays the number of active userconnections for the selected Exchange 2013 server during the selected duration.
l The y axis displays the number of users.
l The x axis displays time. The increments vary, depending upon the date range selected in the Context QuickSelector widget.
l Mousing over any point in the line displays the average value at that time-point.
l Clicking on a data point displays the Device Performance graph for the selected parameter on the selectedExchange 2013 server.
OWA Requests. This widget displays a line graph. The line graph displays two lines: One for the frequency ofOutlook Web Access requests and one for the frequency of Web Services requests for the selected Exchange2013 server during the selected duration.
l The y axis displays the number of requests per second.
l The x axis displays time. The increments vary, depending upon the date range selected in the Context QuickSelector widget.
l Mousing over any point in any line displays the average value at that time-point.
l Clicking on a data point displays the Device Performance graph for the selected parameter on the selectedExchange 2013 server.
RPC Averaged Latency. This widget displays a line graph. The line graph displays the average latency for remoteprocedure calls (RPCs) for the selected Exchange 2013 server during the selected duration.
l The y axis displays the average RPC latency, in milliseconds.
l The x axis displays time. The increments vary, depending upon the date range selected in the Context QuickSelector widget.
l Mousing over any point in any line displays the average value at that time-point.
l Clicking on a data point displays the Device Performance graph for the selected parameter on the selectedExchange 2013 server.
MBS Databases. This widget displays a line graph. The line graph displays two lines: One for I/O write latency tothe mailbox server database and one for I/O read latency to the mailbox server database for the selectedExchange 2013 server during the selected duration.
l The y axis displays the average write and read latency in milliseconds.
l The x axis displays time. The increments vary, depending upon the date range selected in the Context QuickSelector widget.
l Mousing over any point in any line displays the average value at that time-point.
l Clicking on a data point displays the Device Performance graph for the selected parameter on the selectedExchange 2013 server.
Windows Dashboards
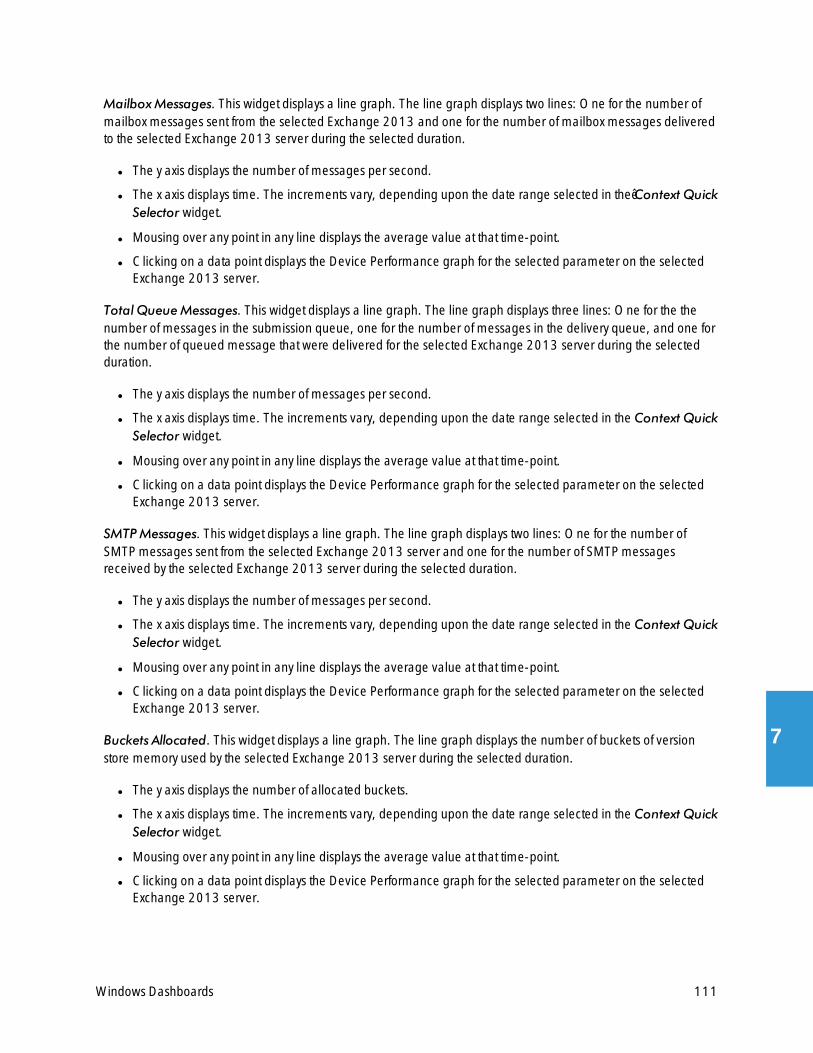
Windows Dashboards
MailboxMessages. This widget displays a line graph. The line graph displays two lines: One for the number ofmailbox messages sent from the selected Exchange 2013 and one for the number of mailbox messages deliveredto the selected Exchange 2013 server during the selected duration.
l The y axis displays the number of messages per second.
l The x axis displays time. The increments vary, depending upon the date range selected in the Context QuickSelector widget.
l Mousing over any point in any line displays the average value at that time-point.
l Clicking on a data point displays the Device Performance graph for the selected parameter on the selectedExchange 2013 server.
Total QueueMessages. This widget displays a line graph. The line graph displays three lines: One for the thenumber of messages in the submission queue, one for the number of messages in the delivery queue, and one forthe number of queued message that were delivered for the selected Exchange 2013 server during the selectedduration.
l The y axis displays the number of messages per second.
l The x axis displays time. The increments vary, depending upon the date range selected in the Context QuickSelector widget.
l Mousing over any point in any line displays the average value at that time-point.
l Clicking on a data point displays the Device Performance graph for the selected parameter on the selectedExchange 2013 server.
SMTPMessages. This widget displays a line graph. The line graph displays two lines: One for the number ofSMTP messages sent from the selected Exchange 2013 server and one for the number of SMTP messagesreceived by the selected Exchange 2013 server during the selected duration.
l The y axis displays the number of messages per second.
l The x axis displays time. The increments vary, depending upon the date range selected in the Context QuickSelector widget.
l Mousing over any point in any line displays the average value at that time-point.
l Clicking on a data point displays the Device Performance graph for the selected parameter on the selectedExchange 2013 server.
Buckets Allocated. This widget displays a line graph. The line graph displays the number of buckets of versionstore memory used by the selected Exchange 2013 server during the selected duration.
l The y axis displays the number of allocated buckets.
l The x axis displays time. The increments vary, depending upon the date range selected in the Context QuickSelector widget.
l Mousing over any point in any line displays the average value at that time-point.
l Clicking on a data point displays the Device Performance graph for the selected parameter on the selectedExchange 2013 server.
111
7
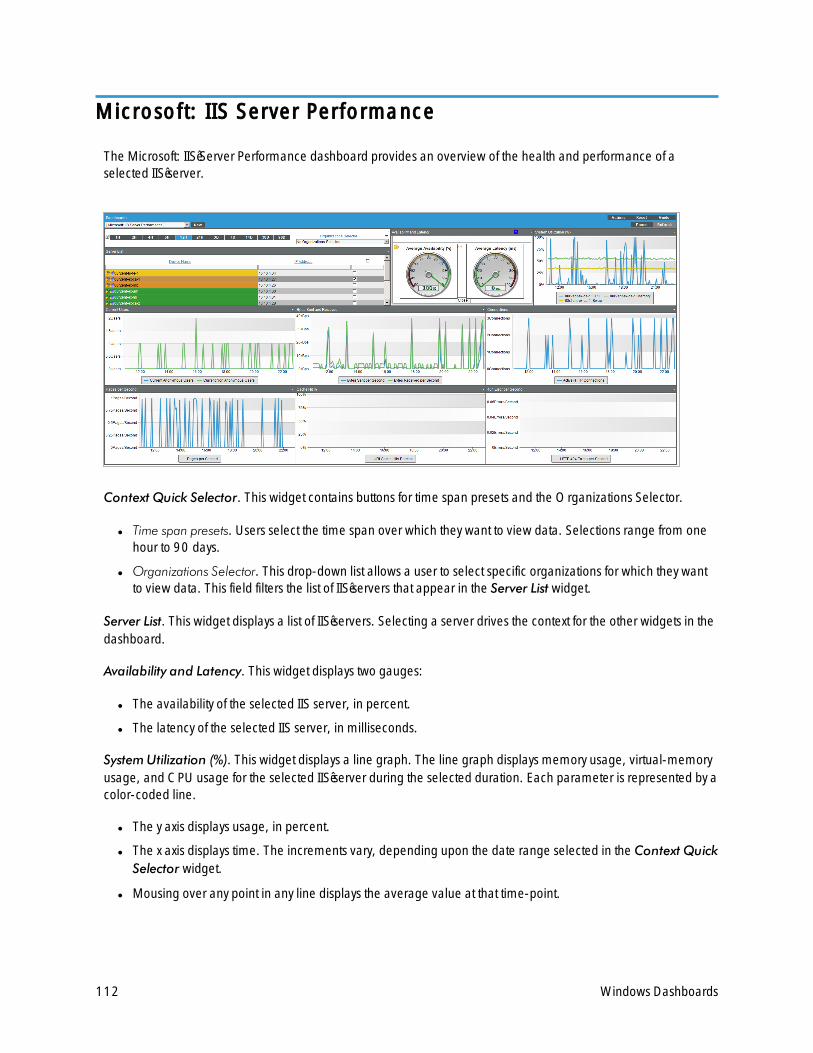
112
Microsoft: IIS Server Performance
The Microsoft: IIS Server Performance dashboard provides an overview of the health and performance of aselected IIS server.
Context Quick Selector. This widget contains buttons for time span presets and the Organizations Selector.
l Time span presets. Users select the time span over which they want to view data. Selections range from onehour to 90 days.
l Organizations Selector. This drop-down list allows a user to select specific organizations for which they wantto view data. This field filters the list of IIS servers that appear in the Server List widget.
Server List. This widget displays a list of IIS servers. Selecting a server drives the context for the other widgets in thedashboard.
Availability and Latency. This widget displays two gauges:
l The availability of the selected IIS server, in percent.
l The latency of the selected IIS server, in milliseconds.
SystemUtilization (%). This widget displays a line graph. The line graph displays memory usage, virtual-memoryusage, and CPU usage for the selected IIS server during the selected duration. Each parameter is represented by acolor-coded line.
l The y axis displays usage, in percent.
l The x axis displays time. The increments vary, depending upon the date range selected in the Context QuickSelector widget.
l Mousing over any point in any line displays the average value at that time-point.
Windows Dashboards

Windows Dashboards
l Clicking on a data point displays the Device Performance graph for the selected parameter on the selectedIIS server.
Current Users. This widget displays a line graph. The line graph displays Current Anonymous Users and CurrentNon Anonymous Users. Each parameter is represented by a color-coded line.
l The y axis displays number of users.
l The x axis displays time. The increments vary, depending upon the date range selected in the Context QuickSelector widget.
l Mousing over any point in any line displays the average value at that time-point.
l Clicking on a data point displays the Device Performance graph for the selected parameter on the selectedIIS server.
Bytes Sent and Received. This widget displays a line graph. The line graph displays Bytes Sent Per Second andBytes Received Per Second. Each parameter is represented by a color-coded line.
l The y axis displays kB of data per second..
l The x axis displays time. The increments vary, depending upon the date range selected in the Context QuickSelector widget.
l Mousing over any point in any line displays the average value at that time-point.
l Clicking on a data point displays the Device Performance graph for the selected parameter on the selectedIIS server.
Connections. This widget displays a line graph. The line graph displays the number of Active HTTP Connections.
l The y axis displays number of connections.
l The x axis displays time. The increments vary, depending upon the date range selected in the Context QuickSelector widget.
l Mousing over any point in any line displays the average value at that time-point.
l Clicking on a data point displays the Device Performance graph for the selected parameter on the selectedIIS server.
Pages Per Second. This widget displays a line graph. The line graph displays the number of Pages (served) PerSecond.
l The y axis displays number of pages per second..
l The x axis displays time. The increments vary, depending upon the date range selected in the Context QuickSelector widget.
l Mousing over any point in any line displays the average value at that time-point.
l Clicking on a data point displays the Device Performance graph for the selected parameter on the selectedIIS server.
Cache Hit %. The IIS server caches (in memory) frequently requested files. This widget displays a line graph. Theline graph displays the ratio of kernel URI cache hits to total cache requests.
l The y axis displays percent of URI cache hits.
113
7
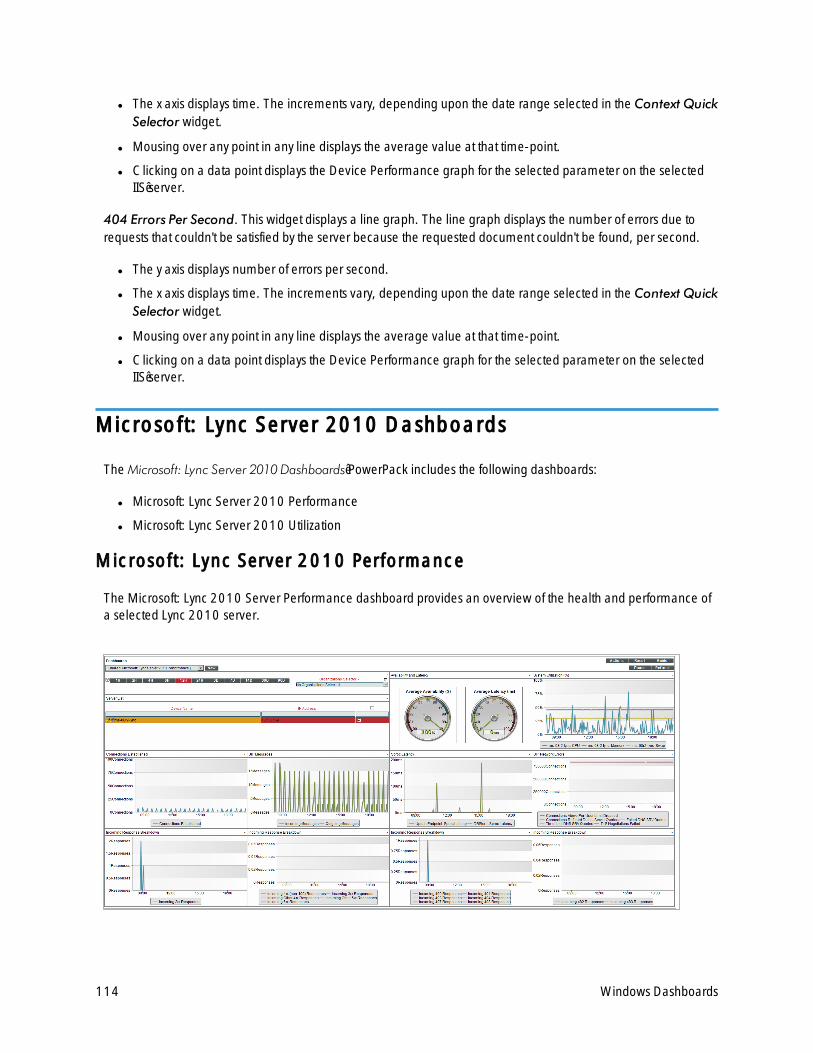
114
l The x axis displays time. The increments vary, depending upon the date range selected in the Context QuickSelector widget.
l Mousing over any point in any line displays the average value at that time-point.
l Clicking on a data point displays the Device Performance graph for the selected parameter on the selectedIIS server.
404 Errors Per Second. This widget displays a line graph. The line graph displays the number of errors due torequests that couldn't be satisfied by the server because the requested document couldn't be found, per second.
l The y axis displays number of errors per second.
l The x axis displays time. The increments vary, depending upon the date range selected in the Context QuickSelector widget.
l Mousing over any point in any line displays the average value at that time-point.
l Clicking on a data point displays the Device Performance graph for the selected parameter on the selectedIIS server.
Microsoft: Lync Server 2010 Dashboards
The Microsoft: Lync Server 2010 Dashboards PowerPack includes the following dashboards:
l Microsoft: Lync Server 2010 Performance
l Microsoft: Lync Server 2010 Utilization
Microsoft: Lync Server 2010 Performance
The Microsoft: Lync 2010 Server Performance dashboard provides an overview of the health and performance ofa selected Lync 2010 server.
Windows Dashboards

Windows Dashboards
Context Quick Selector. This widget contains buttons for time span presets and the Organizations Selector.
l Time span presets. Users select the time span over which they want to view data. Selections range from onehour to 90 days.
l Organizations Selector. This drop-down list allows a user to select specific organizations for which they wantto view data. This field filters the list of Lync 2010 servers that appear in the Server List widget.
Server List. This widget displays a list of Lync 2010 servers. Selecting a server drives the context for the otherwidgets in the dashboard.
Availability and Latency. This widget displays two gauges:
l The availability of the selected Lync 2010 server, in percent.
l The latency of the selected Lync 2010 server, in milliseconds.
SystemUtilization (%). This widget displays a line graph. The line graph displays memory usage, virtual-memoryusage, and CPU usage for the selected Lync 2010 server during the selected duration. Each parameter isrepresented by a color-coded line.
l The y axis displays usage, in percent.
l The x axis displays time. The increments vary, depending upon the date range selected in the Context QuickSelector widget.
l Mousing over any point in any line displays the average value at that time-point.
l Clicking on a data point displays the Device Performance graph for the selected parameter on the selectedLync 2010 server.
Connections Established. This widget displays a line graph. The line graph displays Connections Established.
l The y axis displays number of connections.
l The x axis displays time. The increments vary, depending upon the date range selected in the Context QuickSelector widget.
l Mousing over any point in any line displays the average value at that time-point.
l Clicking on a data point displays the Device Performance graph for the selected parameter on the selectedLync 2010 server.
SIP Message. SIP is a protocol for instant messaging and VOIP. This widget displays a line graph. The line graphdisplays Incoming Message andOutgoing Messages. Each parameter is represented by a color-coded line.
l The y axis displays number of messages.
l The x axis displays time. The increments vary, depending upon the date range selected in the Context QuickSelector widget.
l Mousing over any point in any line displays the average value at that time-point.
l Clicking on a data point displays the Device Performance graph for the selected parameter on the selectedLync 2010 server.
115
7

116
Sproc Latency. Stored Procedure Call (sproc) latency is the time it takes for the Lync database to process thestored procedure call.
l The y axis displays the duration, in milliseconds.
l The x axis displays time. The increments vary, depending upon the date range selected in the Context QuickSelector widget.
l Mousing over any point in any line displays the average value at that time-point.
l Clicking on a data point displays the Device Performance graph for the selected parameter on the selectedLync 2010 server.
SIP Network Errors. This widget displays information about errors during instant messaging or VOIP. This widgetdisplays a line graph. The line graph displays Connections Above Per-User Limit Dropped, Connections RefusedDue to Server Overload, Failed DNS SRVQueries, Time Out DNS SRVQueries, and TLS Negotiations Failed.Each parameter is represented by a color-coded line.
l The y axis displays the number of connections that resulted in errors.
l The x axis displays time. The increments vary, depending upon the date range selected in the Context QuickSelector widget.
l Mousing over any point in any line displays the average value at that time-point.
l Clicking on a data point displays the Device Performance graph for the selected parameter on the selectedLync 2010 server.
Incoming Response Breakdown. This widget displays information about the number of responses generated bythe server. This widget displays a line graph. The line graph displays Incoming 2xx Responses. A 2xx Responsemeans that a connection has been established.
l The y axis displays the number of responses.
l The x axis displays time. The increments vary, depending upon the date range selected in the Context QuickSelector widget.
l Mousing over any point in any line displays the average value at that time-point.
l Clicking on a data point displays the Device Performance graph for the selected parameter on the selectedLync 2010 server.
Incoming Response Breakdown. This widget displays information about the number of responses generated bythe server. This widget displays a line graph. The line graph displays Incoming 1xx (non-100) Responses,Incoming 3xx Responses, Incoming Other 4xx Responses, Incoming Other 5xx Responses, and Incoming 6xxResponses. Each parameter is represented by a color-coded line. For a description of SIP response codes, see theWikipedia page http://en.wikipedia.org/wiki/List_of_SIP_response_codes.
l The y axis displays the number of responses.
l The x axis displays time. The increments vary, depending upon the date range selected in the Context QuickSelector widget.
l Mousing over any point in any line displays the average value at that time-point.
l Clicking on a data point displays the Device Performance graph for the selected parameter on the selectedLync 2010 server.
Windows Dashboards
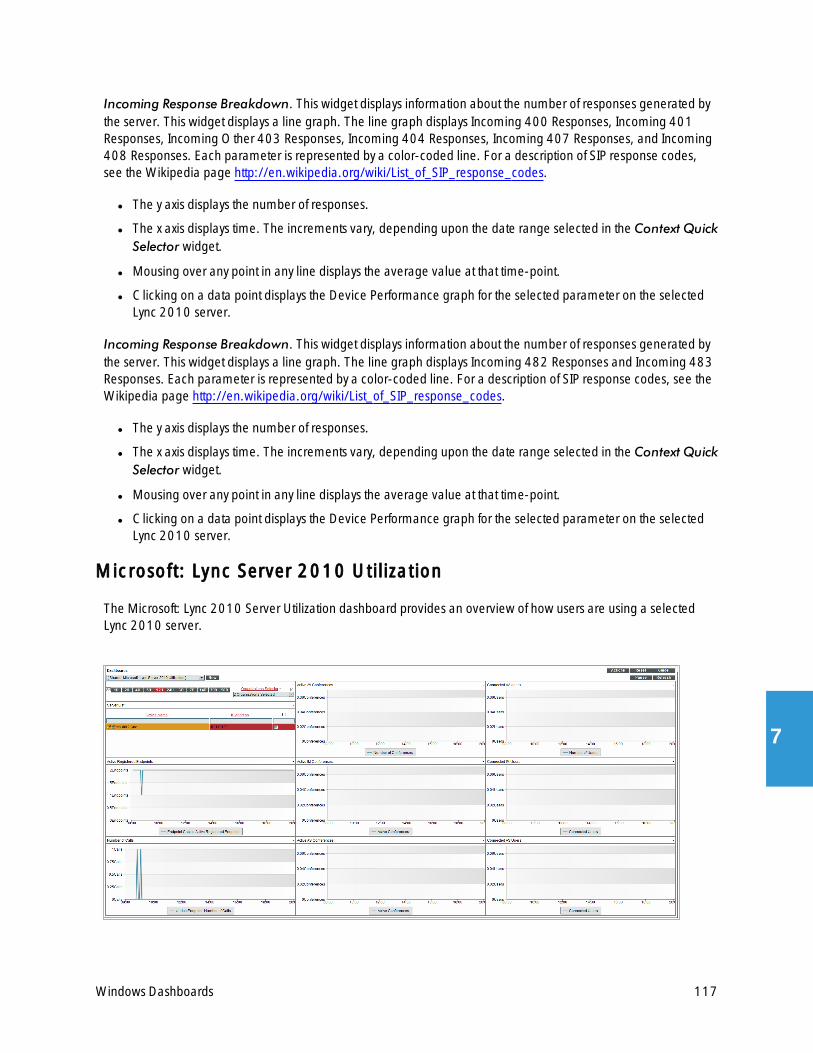
Windows Dashboards
Incoming Response Breakdown. This widget displays information about the number of responses generated bythe server. This widget displays a line graph. The line graph displays Incoming 400 Responses, Incoming 401Responses, Incoming Other 403 Responses, Incoming 404 Responses, Incoming 407 Responses, and Incoming408 Responses. Each parameter is represented by a color-coded line. For a description of SIP response codes,see the Wikipedia page http://en.wikipedia.org/wiki/List_of_SIP_response_codes.
l The y axis displays the number of responses.
l The x axis displays time. The increments vary, depending upon the date range selected in the Context QuickSelector widget.
l Mousing over any point in any line displays the average value at that time-point.
l Clicking on a data point displays the Device Performance graph for the selected parameter on the selectedLync 2010 server.
Incoming Response Breakdown. This widget displays information about the number of responses generated bythe server. This widget displays a line graph. The line graph displays Incoming 482 Responses and Incoming 483Responses. Each parameter is represented by a color-coded line. For a description of SIP response codes, see theWikipedia page http://en.wikipedia.org/wiki/List_of_SIP_response_codes.
l The y axis displays the number of responses.
l The x axis displays time. The increments vary, depending upon the date range selected in the Context QuickSelector widget.
l Mousing over any point in any line displays the average value at that time-point.
l Clicking on a data point displays the Device Performance graph for the selected parameter on the selectedLync 2010 server.
Microsoft: Lync Server 2010 Utilizat ion
The Microsoft: Lync 2010 Server Utilization dashboard provides an overview of how users are using a selectedLync 2010 server.
117
7

118
Context Quick Selector. This widget contains the time span preset buttons andOrganizations Selector.
l Time span presets. Users select the time span over which they want to view data. Selections range from onehour to 90 days.
l Organizations Selector. This drop-down list allows a user to select specific organizations for which they wantto view data. This field filters the list of Lync 2010 servers that appear in the Server List widget.
Server List. This widget displays a list of Lync 2010 servers. Selecting a server drives the context for the otherwidgets in the dashboard.
Availability and Latency. This widget displays two gauges:
l The availability of the selected Lync 2010 server, in percent.
l The latency of the selected Lync 2010 server, in milliseconds.
SystemUtilization (%). This widget displays a line graph. The line graph displays memory usage, virtual-memoryusage, and CPU usage for the selected Lync 2010 server during the selected duration. Each parameter isrepresented by a color-coded line.
l The y axis displays usage, in percent t.
l The x axis displays time. The increments vary, depending upon the date range selected in the Context QuickSelector widget.
l Mousing over any point in any line displays the average value at that time-point.
l Clicking on a data point displays the Device Performance graph for the selected parameter on the selectedLync 2010 server.
Active Registered Endpoints. Endpoints are devices that are connected to the Lync front-end server. This widgetdisplays a line graph. The line graph displays Endpoint Cache: Active Registered Endpoints.
l The y axis displays numbered of registered endpoints.
l The x axis displays time. The increments vary, depending upon the date range selected in the Context QuickSelector widget.
l Mousing over any point in any line displays the average value at that time-point.
l Clicking on a data point displays the Device Performance graph for the selected parameter on the selectedLync 2010 server.
Windows Dashboards

Windows Dashboards
Active IM Conferences. This widget displays the current number of IM conversations on the Lync server.Conferences usually include more than two users. This widget displays a line graph. The line graph displays ActiveConferences.
l The y axis displays numbered of IM conferences.
l The x axis displays time. The increments vary, depending upon the date range selected in the Context QuickSelector widget.
l Mousing over any point in any line displays the average value at that time-point.
l Clicking on a data point displays the Device Performance graph for the selected parameter on the selectedLync 2010 server.
Connected IM Users. This widget displays the current number of connected IM users. This widget displays a linegraph. The line graph displays Connected Users.
l The y axis displays numbered of IM users.
l The x axis displays time. The increments vary, depending upon the date range selected in the Context QuickSelector widget.
l Mousing over any point in any line displays the average value at that time-point.
l Clicking on a data point displays the Device Performance graph for the selected parameter on the selectedLync 2010 server.
Number of Calls. This widget displays the current number of voice calls on the Lync server. This widget displays aline graph. The line graph displays UpdateEndpoint: Number of Calls.
l The y axis displays numbered of calls.
l The x axis displays time. The increments vary, depending upon the date range selected in the Context QuickSelector widget.
l Mousing over any point in any line displays the average value at that time-point.
l Clicking on a data point displays the Device Performance graph for the selected parameter on the selectedLync 2010 server.
Active AS Conferences. This widget displays the number of active conferences using Application Sharing (AS).This widget displays a line graph. The line graph displays Active Conferences.
l The y axis displays numbered of AS conferences.
l The x axis displays time. The increments vary, depending upon the date range selected in the Context QuickSelector widget.
l Mousing over any point in any line displays the average value at that time-point.
l Clicking on a data point displays the Device Performance graph for the selected parameter on the selectedLync 2010 server.
119
7
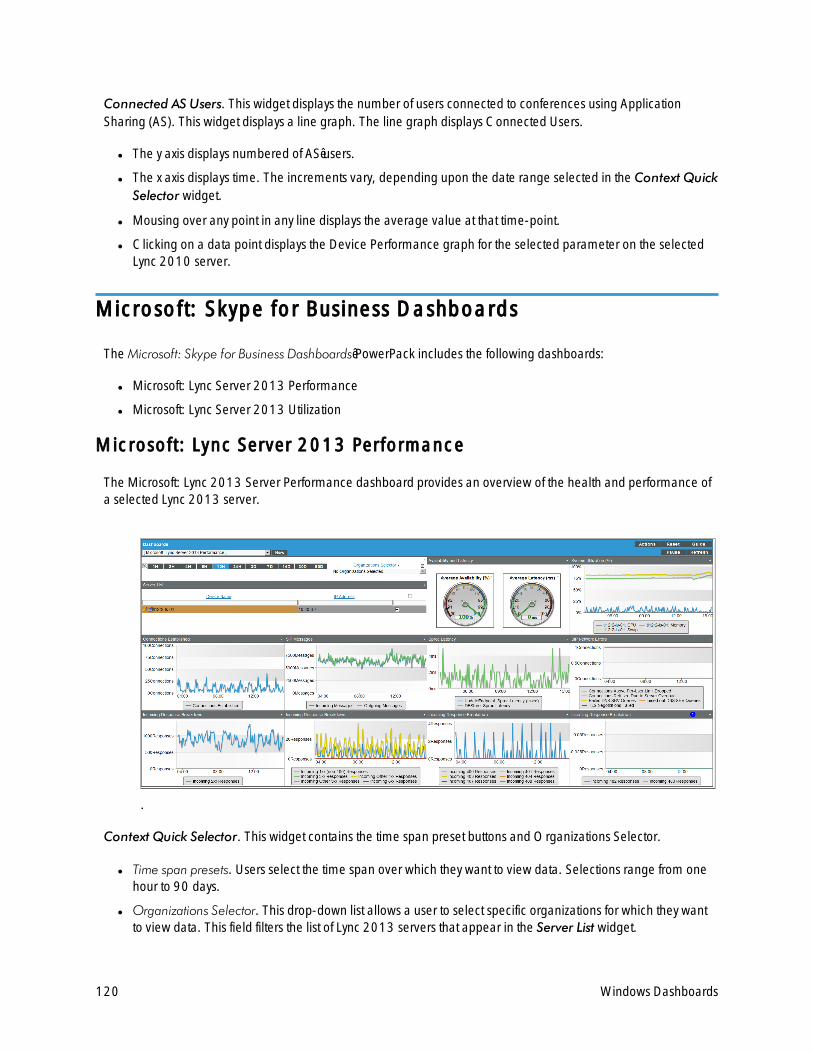
120
Connected AS Users. This widget displays the number of users connected to conferences using ApplicationSharing (AS). This widget displays a line graph. The line graph displays Connected Users.
l The y axis displays numbered of AS users.
l The x axis displays time. The increments vary, depending upon the date range selected in the Context QuickSelector widget.
l Mousing over any point in any line displays the average value at that time-point.
l Clicking on a data point displays the Device Performance graph for the selected parameter on the selectedLync 2010 server.
Microsoft: Skype for Business Dashboards
The Microsoft: Skype for Business Dashboards PowerPack includes the following dashboards:
l Microsoft: Lync Server 2013 Performance
l Microsoft: Lync Server 2013 Utilization
Microsoft: Lync Server 2013 Performance
The Microsoft: Lync 2013 Server Performance dashboard provides an overview of the health and performance ofa selected Lync 2013 server.
.
Context Quick Selector. This widget contains the time span preset buttons andOrganizations Selector.
l Time span presets. Users select the time span over which they want to view data. Selections range from onehour to 90 days.
l Organizations Selector. This drop-down list allows a user to select specific organizations for which they wantto view data. This field filters the list of Lync 2013 servers that appear in the Server List widget.
Windows Dashboards

Windows Dashboards
Server List. This widget displays a list of Lync 2013 servers. Selecting a server drives the context for the otherwidgets in the dashboard.
Availability and Latency. This widget displays two gauges:
l The availability of the selected Lync 2013 server, in percent.
l The latency of the selected Lync 2013 server, in milliseconds.
SystemUtilization (%). This widget displays a line graph. The line graph displays memory usage, virtual-memoryusage, and CPU usage for the selected Lync 2013 server during the selected duration. Each parameter isrepresented by a color-coded line.
l The y axis displays usage, in percent.
l The x axis displays time. The increments vary, depending upon the date range selected in the Context QuickSelector widget.
l Mousing over any point in any line displays the average value at that time-point.
l Clicking on a data point displays the Device Performance graph for the selected parameter on the selectedLync 2013 server.
Connections Established. This widget displays a line graph. The line graph displays Connections Established.
l The y axis displays number of connections.
l The x axis displays time. The increments vary, depending upon the date range selected in the Context QuickSelector widget.
l Mousing over any point in any line displays the average value at that time-point.
l Clicking on a data point displays the Device Performance graph for the selected parameter on the selectedLync 2010 server.
SIP Message. SIP is a protocol for instant messaging and VOIP. This widget displays a line graph. The line graphdisplays Incoming Message andOutgoing Messages. Each parameter is represented by a color-coded line.
l The y axis displays number of messages.
l The x axis displays time. The increments vary, depending upon the date range selected in the Context QuickSelector widget.
l Mousing over any point in any line displays the average value at that time-point.
l Clicking on a data point displays the Device Performance graph for the selected parameter on the selectedLync 2013 server.
Sproc Latency. Stored Procedure Call (sproc) latency is the time it takes for the Lync database to process thestored procedure call.
l The y axis displays the duration, in milliseconds.
l The x axis displays time. The increments vary, depending upon the date range selected in the Context QuickSelector widget.
l Mousing over any point in any line displays the average value at that time-point.
121
7

122
l Clicking on a data point displays the Device Performance graph for the selected parameter on the selectedLync 2013 server.
SIP Network Errors. This widget displays information about errors during instant messaging or VOIP. This widgetdisplays a line graph. The line graph displays Connections Above Per-User Limit Dropped, Connections RefusedDue to Server Overload, Failed DNS SRVQueries, Time Out DNS SRVQueries, and TLS Negotiations Failed.Each parameter is represented by a color-coded line.
l The y axis displays the number of connections that resulted in errors.
l The x axis displays time. The increments vary, depending upon the date range selected in the Context QuickSelector widget.
l Mousing over any point in any line displays the average value at that time-point.
l Clicking on a data point displays the Device Performance graph for the selected parameter on the selectedLync 2013 server.
Incoming Response Breakdown. This widget displays information about the number of responses that are beinggenerated by the server. This widget displays a line graph. The line graph displays Incoming 2xx Responses. A 2xxResponse means that a connection has been established.
l The y axis displays the number of responses.
l The x axis displays time. The increments vary, depending upon the date range selected in the Context QuickSelector widget.
l Mousing over any point in any line displays the average value at that time-point.
l Clicking on a data point displays the Device Performance graph for the selected parameter on the selectedLync 2013 server.
Incoming Respond Breakdown. This widget displays information about the number of responses that are beinggenerated by the server. This widget displays a line graph. The line graph displays Incoming 1xx (non-100)Responses, Incoming 3xx Responses, Incoming Other 4xx Responses, Incoming Other 5xx Responses, andIncoming 6xx Responses. Each parameter is represented by a color-coded line. For a description of all SIPresponse codes, see the Wikipedia page http://en.wikipedia.org/wiki/List_of_SIP_response_codes.
l The y axis displays the number of responses.
l The x axis displays time. The increments vary, depending upon the date range selected in the Context QuickSelector widget.
l Mousing over any point in any line displays the average value at that time-point.
l Clicking on a data point displays the Device Performance graph for the selected parameter on the selectedLync 2013 server.
Windows Dashboards
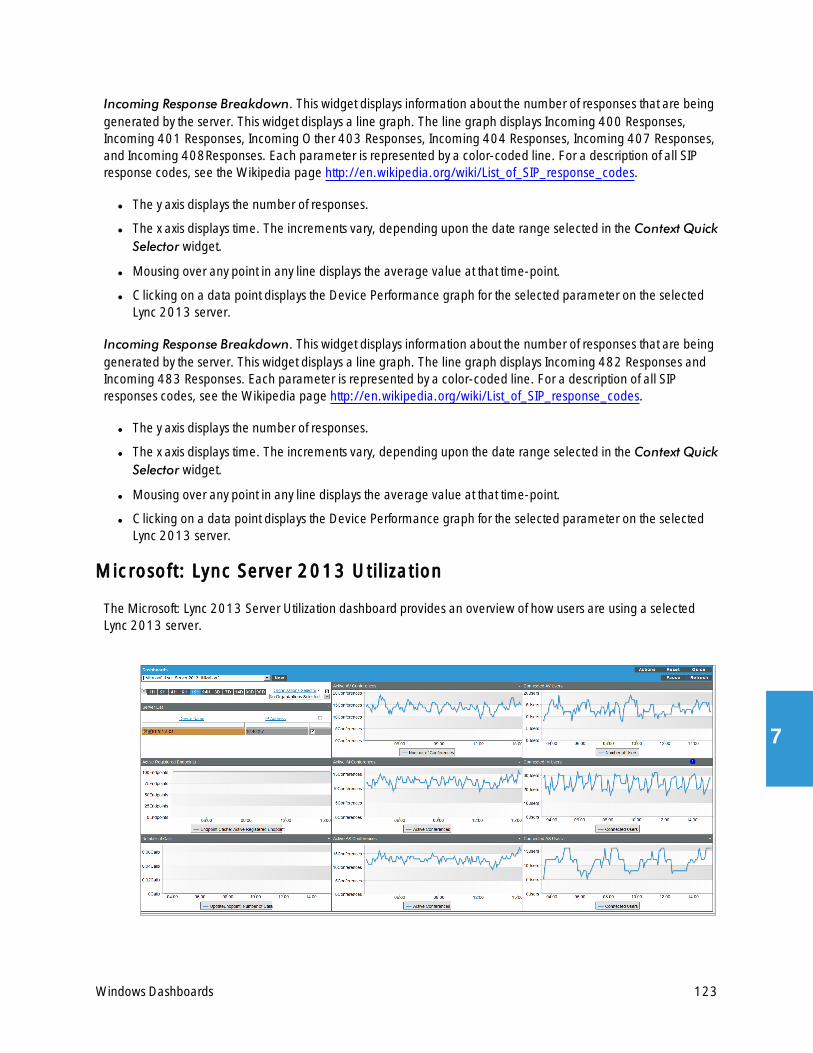
Windows Dashboards
Incoming Response Breakdown. This widget displays information about the number of responses that are beinggenerated by the server. This widget displays a line graph. The line graph displays Incoming 400 Responses,Incoming 401 Responses, Incoming Other 403 Responses, Incoming 404 Responses, Incoming 407 Responses,and Incoming 408Responses. Each parameter is represented by a color-coded line. For a description of all SIPresponse codes, see the Wikipedia page http://en.wikipedia.org/wiki/List_of_SIP_response_codes.
l The y axis displays the number of responses.
l The x axis displays time. The increments vary, depending upon the date range selected in the Context QuickSelector widget.
l Mousing over any point in any line displays the average value at that time-point.
l Clicking on a data point displays the Device Performance graph for the selected parameter on the selectedLync 2013 server.
Incoming Response Breakdown. This widget displays information about the number of responses that are beinggenerated by the server. This widget displays a line graph. The line graph displays Incoming 482 Responses andIncoming 483 Responses. Each parameter is represented by a color-coded line. For a description of all SIPresponses codes, see the Wikipedia page http://en.wikipedia.org/wiki/List_of_SIP_response_codes.
l The y axis displays the number of responses.
l The x axis displays time. The increments vary, depending upon the date range selected in the Context QuickSelector widget.
l Mousing over any point in any line displays the average value at that time-point.
l Clicking on a data point displays the Device Performance graph for the selected parameter on the selectedLync 2013 server.
Microsoft: Lync Server 2013 Utilizat ion
The Microsoft: Lync 2013 Server Utilization dashboard provides an overview of how users are using a selectedLync 2013 server.
123
7

124
Context Quick Selector. This widget contains buttons for time span presets and the Organizations Selector.
l Time span presets. Users select the time span over which they want to view data. Selections range from onehour to 90 days.
l Organizations Selector. This drop-down list allows a user to select specific organizations for which they wantto view data. This field filters the list of Lync 2013 servers that appear in the Server List widget.
Server List. This widget displays a list of Lync 2013 servers. Selecting a server drives the context for the otherwidgets in the dashboard.
Availability and Latency. This widget displays two gauges:
l The availability of the selected Lync 2013 server, in percent.
l The latency of the selected Lync 2013 server, in milliseconds.
SystemUtilization (%). This widget displays a line graph. The line graph displays memory usage, virtual-memoryusage, and CPU usage for the selected Lync 2013 server during the selected duration. Each parameter isrepresented by a color-coded line.
l The y axis displays usage, in percent.
l The x axis displays time. The increments vary, depending upon the date range selected in the Context QuickSelector widget.
l Mousing over any point in any line displays the average value at that time-point.
l Clicking on a data point displays the Device Performance graph for the selected parameter on the selectedLync 2013 server.
Active Registered Endpoints. Endpoints are devices that are connected to the Lync front-end server. This widgetdisplays a line graph. The line graph displays Endpoint Cache: Active Registered Endpoints.
l The y axis displays the number of registered endpoints.
l The x axis displays time. The increments vary, depending upon the date range selected in the Context QuickSelector widget.
l Mousing over any point in any line displays the average value at that time-point.
l Clicking on a data point displays the Device Performance graph for the selected parameter on the selectedLync 2013 server.
Windows Dashboards

Windows Dashboards
Active IM Conferences. This widget displays the number of IM conversations on the Lync server. Conferencesusually include more than two users. This widget displays a line graph. The line graph displays ActiveConferences.
l The y axis displays the number of IM conferences.
l The x axis displays time. The increments vary, depending upon the date range selected in the Context QuickSelector widget.
l Mousing over any point in any line displays the average value at that time-point.
l Clicking on a data point displays the Device Performance graph for the selected parameter on the selectedLync 2013 server.
Connected IM Users. This widget displays the current number of connected IM users. This widget displays a linegraph. The line graph displays Connected Users.
l The y axis displays the number of IM users.
l The x axis displays time. The increments vary, depending upon the date range selected in the Context QuickSelector widget.
l Mousing over any point in any line displays the average value at that time-point.
l Clicking on a data point displays the Device Performance graph for the selected parameter on the selectedLync 2013 server.
Number of Calls. This widget displays the current number of voice calls on the Lync server. This widget displays aline graph. The line graph displays UpdateEndpoint: Number of Calls.
l The y axis displays the number of calls.
l The x axis displays time. The increments vary, depending upon the date range selected in the Context QuickSelector widget.
l Mousing over any point in any line displays the average value at that time-point.
l Clicking on a data point displays the Device Performance graph for the selected parameter on the selectedLync 2013 server.
Active AS Conferences. This widget displays the number of active conferences using Application Sharing (AS).This widget displays a line graph. The line graph displays Active Conferences.
l The y axis displays the number of AS conferences.
l The x axis displays time. The increments vary, depending upon the date range selected in the Context QuickSelector widget.
l Mousing over any point in any line displays the average value at that time-point.
l Clicking on a data point displays the Device Performance graph for the selected parameter on the selectedLync 2013 server.
125
7
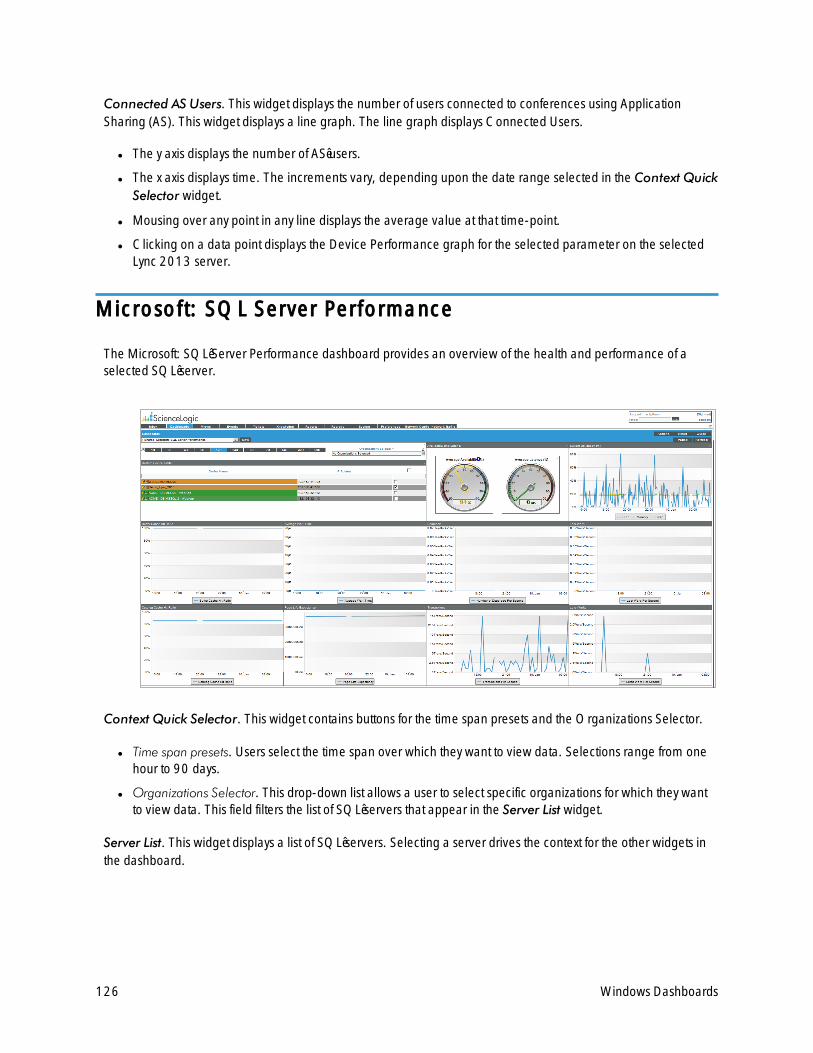
126
Connected AS Users. This widget displays the number of users connected to conferences using ApplicationSharing (AS). This widget displays a line graph. The line graph displays Connected Users.
l The y axis displays the number of AS users.
l The x axis displays time. The increments vary, depending upon the date range selected in the Context QuickSelector widget.
l Mousing over any point in any line displays the average value at that time-point.
l Clicking on a data point displays the Device Performance graph for the selected parameter on the selectedLync 2013 server.
Microsoft: SQL Server Performance
The Microsoft: SQL Server Performance dashboard provides an overview of the health and performance of aselected SQL server.
Context Quick Selector. This widget contains buttons for the time span presets and the Organizations Selector.
l Time span presets. Users select the time span over which they want to view data. Selections range from onehour to 90 days.
l Organizations Selector. This drop-down list allows a user to select specific organizations for which they wantto view data. This field filters the list of SQL servers that appear in the Server List widget.
Server List. This widget displays a list of SQL servers. Selecting a server drives the context for the other widgets inthe dashboard.
Windows Dashboards

Windows Dashboards
Availability and Latency. This widget displays two gauges:
l The availability of the selected SQL server, in percent.
l The latency of the selected SQL server, in milliseconds.
SystemUtilization (%). This widget displays a line graph. The line graph displays memory usage, virtual-memoryusage, and CPU usage for the selected SQL server during the selected duration. Each parameter is representedby a color-coded line.
l The y axis displays usage, in percent.
l The x axis displays time. The increments vary, depending upon the date range selected in the Context QuickSelector widget.
l Mousing over any point in any line displays the average value at that time-point.
l Clicking on a data point displays the Device Performance graph for the selected parameter on the selectedSQL server.
Buffer Cache Hit Ratio. This widget displays information about the percentage of page requests that are satisfiedby data pages from the buffer cache without having to read from disk. The ratio is the total number of pages foundin the buffer divided by the total number of requests. This widget displays a line graph. The line graph displaysBuffer Cache Hit Ratio.
l The y axis displays the ratio, in percent.
l The x axis displays time. The increments vary, depending upon the date range selected in the Context QuickSelector widget.
l Mousing over any point in any line displays the average value at that time-point.
l Clicking on a data point displays the Device Performance graph for the selected parameter on the selectedSQL server.
AverageWait Time. This widget displays information about the average wait time to acquire a lock. This widgetdisplays a line graph. The line graph displays Average Wait Time.
l The y axis displays the wait time, in milliseconds.
l The x axis displays time. The increments vary, depending upon the date range selected in the Context QuickSelector widget.
l Mousing over any point in any line displays the average value at that time-point.
l Clicking on a data point displays the Device Performance graph for the selected parameter on the selectedSQL server.
127
7

128
Deadlocks. This widget displays information about deadlocks. A deadlock occurs when two or more taskspermanently block each other because each task tries to lock a resource which the other tasks are also trying tolock. This widget displays a line graph. The line graph displays Number of Deadlocks Per Second.
l The y axis displays the number of deadlocks per second.
l The x axis displays time. The increments vary, depending upon the date range selected in the Context QuickSelector widget.
l Mousing over any point in any line displays the average value at that time-point.
l Clicking on a data point displays the Device Performance graph for the selected parameter on the selectedSQL server.
Lock Waits. This widget displays information about the number of lock requests per second that require therequester to wait. This widget displays a line graph. The line graph displays Lock Waits Per Second.
l The y axis displays the number of waits per second.
l The x axis displays time. The increments vary, depending upon the date range selected in the Context QuickSelector widget.
l Mousing over any point in any line displays the average value at that time-point.
l Clicking on a data point displays the Device Performance graph for the selected parameter on the selectedSQL server.
Catalog Cache Hit Ratio. This widget displays information about the ratio between catalog metadata cache hitsand lookups. The ratio is the total number of pages found in the catalog metadata cache divided by the totalnumber of lookups. This widget displays a line graph. The line graph displays Catalog Cache Hit Ratio.
l The y axis displays the ratio.
l The x axis displays time. The increments vary, depending upon the date range selected in the Context QuickSelector widget.
l Mousing over any point in any line displays the average value at that time-point.
l Clicking on a data point displays the Device Performance graph for the selected parameter on the selectedSQL server.
Page Life Expectancy. This widget displays information about the number of seconds a page will stay in the bufferpool (memory cache) without references. This widget displays a line graph. The line graph displays Page LifeExpectancy.
l The y axis displays the number of seconds a page will stay in the buffer pool.
l The x axis displays time. The increments vary, depending upon the date range selected in the Context QuickSelector widget.
l Mousing over any point in any line displays the average value at that time-point.
l Clicking on a data point displays the Device Performance graph for the selected parameter on the selectedSQL server.
Windows Dashboards
Windows Dashboards
Transactions. A transaction is a sequence of operations that make up a single logical unit of work, usually achange to the database. This widget displays information about the number of transactions per second to the SQLserver. This widget displays a line graph. The line graph displays Transactions Per Second.
l The y axis displays the number of transactions per second.
l The x axis displays time. The increments vary, depending upon the date range selected in the Context QuickSelector widget.
l Mousing over any point in any line displays the average value at that time-point.
l Clicking on a data point displays the Device Performance graph for the selected parameter on the selectedSQL server.
Latch Waits. A latch is an object that ensures data integrity for objects in the buffer pool (memory cache). Thiswidget displays a line graph. The line graph displays Latch Waits Per Second.
l The y axis displays the number of waits per second.
l The x axis displays time. The increments vary, depending upon the date range selected in the Context QuickSelector widget.
l Mousing over any point in any line displays the average value at that time-point.
l Clicking on a data point displays the Device Performance graph for the selected parameter on the selectedSQL server.
129
7
Troubleshooting
Chapter
8Troubleshooting
Overview
The following sections describe some of the error messages that you might see when configuring the ScienceLogicplatform to monitor Windows devices:
Troubleshooting WinRM Error Messages 130
Debugging Code 401 Errors 131
Debugging Code 500 Errors 132
Troubleshooting PowerShell Error Messages 133
Troubleshooting WinRM Error Messages
The ScienceLogic platform can generate the following error messages when problems occur in Windows RemoteManagement (WinRM). For each error message, the top-most cause listed is the most likely reason for the errormessage.
Error / Message Cause / Resolution
Incorrect username and/or password provided in thePowerShell Credential.
Bad HTTP response returned from server. Basicauthentication failed. Code 401. (For moreinformation, see the section Debugging Code 401Errors.)
Pre-authentication failed while getting initialcredentials.
Client not found in Kerberos database.
130
8
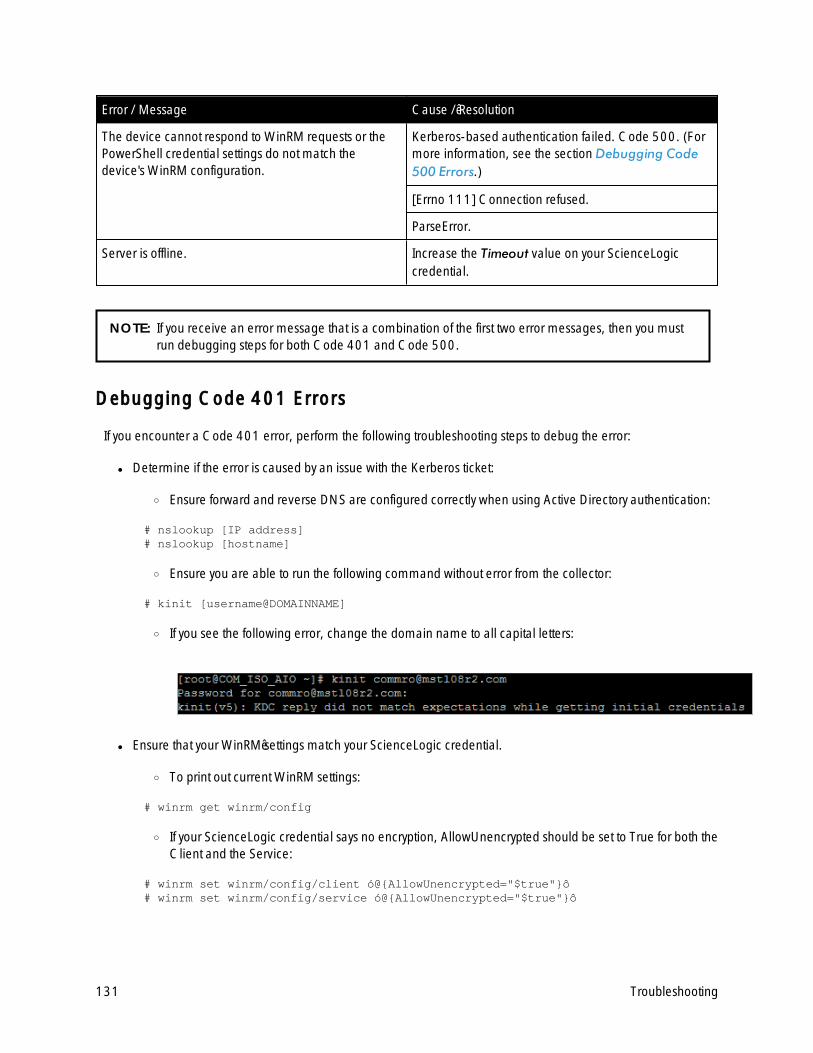
131
Error / Message Cause / Resolution
The device cannot respond toWinRM requests or thePowerShell credential settings do not match thedevice's WinRM configuration.
Kerberos-based authentication failed. Code 500. (Formore information, see the section Debugging Code500 Errors.)
[Errno 111] Connection refused.
ParseError.
Server is offline. Increase the Timeout value on your ScienceLogiccredential.
NOTE: If you receive an error message that is a combination of the first two error messages, then you mustrun debugging steps for both Code 401 and Code 500.
Debugging Code 401 Errors
If you encounter a Code 401 error, perform the following troubleshooting steps to debug the error:
l Determine if the error is caused by an issue with the Kerberos ticket:
o Ensure forward and reverse DNS are configured correctly when using Active Directory authentication:
# nslookup [IP address]# nslookup [hostname]
o Ensure you are able to run the following command without error from the collector:
# kinit [username@DOMAINNAME]
o If you see the following error, change the domain name to all capital letters:
l Ensure that your WinRM settings match your ScienceLogic credential.
o To print out current WinRM settings:
# winrm get winrm/config
o If your ScienceLogic credential says no encryption, AllowUnencrypted should be set to True for both theClient and the Service:
# winrm set winrm/config/client ‘@{AllowUnencrypted="$true"}’# winrm set winrm/config/service ‘@{AllowUnencrypted="$true"}’
Troubleshooting
Troubleshooting
o If you are using local type credentials, basic Authentication should be set to True for both Client andService:
# winrm set winrm/config/client/Auth ‘@{Basic="$true"}’# winrm set winrm/config/service/Auth ‘@{Basic="$true"}’
o If you are using AD type credentials, Kerberos Authentication should be set to True for both Client andService:
# winrm set winrm/config/client/Auth ‘@{Kerberos="$true"}’# winrm set winrm/config/service/Auth ‘@{Kerberos="$true"}’
l In the ScienceLogic credential, ensure the Active DirectoryHostname/IP field contains the FQDN and theLDAP Domain field includes the domain.
l In the ScienceLogic credential, the value in the LDAP Domain field might need to be entered in all capitalletters.
l Ensure your ScienceLogic credentials are correct:
o SSH to your Data Collector and try running the following command:
# wmic -U ‘user%password’ //IP “select * from Win32_ComputerSystem”
NOTE: If you choose to copy and paste the above command from this document into a shell session, youmight have to replace the single and double quotation marks.
l If you are using Windows Servers 2012 and above, make sure that the user you are using belongs to thegroup: WinRMRemoteWMIUsers__
l If you are using Windows Server 2008, 2008r2, or below, ensure that the user you are using is anadministrator. This is a Windows requirement.
l If multiple domains are in use, ensure that they are mapped in the [domain_realm] section of the Kerberoskrb5.conf file.
o The [domain_realm] section provides a translation from a domain name or hostname to a Kerberosrealm name.
l Ensure that the username and password are correct and that you can log on to the system.
l Ensure your credential cache is up-to-date:
o SSH to your Data Collector and cd to the /tmp/ directory.
o Do an ‘ls’ to list all the contents of the /tmp/ directory.
o If you see any files that being with “krb5cc_”, delete those files.
Debugging Code 500 Errors
If you encounter a Code 500 error, perform the following troubleshooting steps to debug the error:
l In the ScienceLogic credential, increase the value in the Timeout field (e.g., 180000 ms.).
132
8
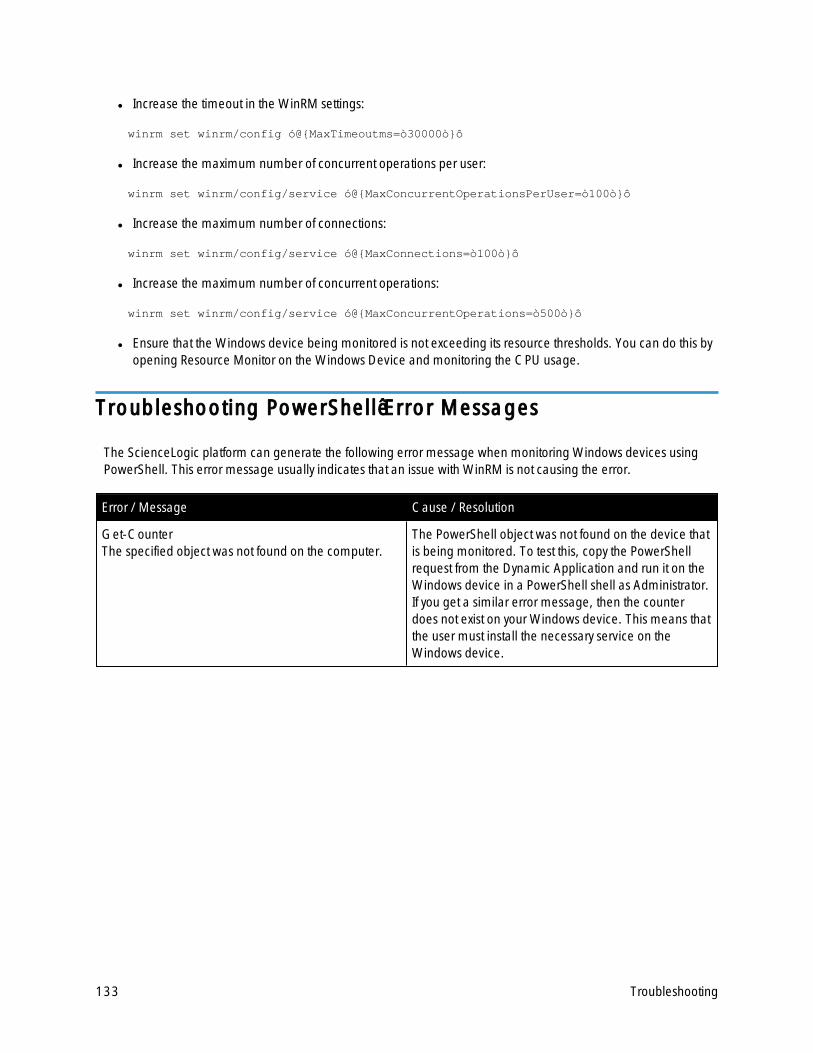
133
l Increase the timeout in the WinRM settings:
winrm set winrm/config ‘@{MaxTimeoutms=”30000”}’
l Increase the maximum number of concurrent operations per user:
winrm set winrm/config/service ‘@{MaxConcurrentOperationsPerUser=”100”}’
l Increase the maximum number of connections:
winrm set winrm/config/service ‘@{MaxConnections=”100”}’
l Increase the maximum number of concurrent operations:
winrm set winrm/config/service ‘@{MaxConcurrentOperations=”500”}’
l Ensure that the Windows device being monitored is not exceeding its resource thresholds. You can do this byopening Resource Monitor on the Windows Device and monitoring the CPU usage.
Troubleshooting PowerShell Error Messages
The ScienceLogic platform can generate the following error message when monitoring Windows devices usingPowerShell. This error message usually indicates that an issue with WinRM is not causing the error.
Error / Message Cause / Resolution
Get-CounterThe specified object was not found on the computer.
The PowerShell object was not found on the device thatis being monitored. To test this, copy the PowerShellrequest from the Dynamic Application and run it on theWindows device in a PowerShell shell as Administrator.If you get a similar error message, then the counterdoes not exist on your Windows device. This means thatthe user must install the necessary service on theWindows device.
Troubleshooting
© 2003 - 2018, ScienceLogic, Inc.
All rights reserved.
LIMITATION OF LIABILITY ANDGENERAL DISCLAIMER
ALL INFORMATION AVAILABLE IN THIS GUIDE IS PROVIDED "AS IS," WITHOUT WARRANTY OF ANYKIND, EITHER EXPRESS OR IMPLIED. SCIENCELOGIC™ AND ITS SUPPLIERS DISCLAIM ALL WARRANTIES,EXPRESS OR IMPLIED, INCLUDING, BUT NOT LIMITED TO, THE IMPLIED WARRANTIES OFMERCHANTABILITY, FITNESS FOR A PARTICULAR PURPOSE OR NON-INFRINGEMENT.
Although ScienceLogic™ has attempted to provide accurate information on this Site, information on this Sitemay contain inadvertent technical inaccuracies or typographical errors, and ScienceLogic™ assumes noresponsibility for the accuracy of the information. Information may be changed or updated without notice.ScienceLogic™ may also make improvements and / or changes in the products or services described in thisSite at any time without notice.
Copyrights and Trademarks
ScienceLogic, the ScienceLogic logo, and EM7 are trademarks of ScienceLogic, Inc. in the United States,other countries, or both.
Below is a list of trademarks and service marks that should be credited to ScienceLogic, Inc. The ® and ™symbols reflect the trademark registration status in the U.S. Patent and Trademark Office and may not beappropriate for materials to be distributed outside the United States.
l ScienceLogic™l EM7™ and em7™l Simplify IT™l Dynamic Application™l Relational Infrastructure Management™
The absence of a product or service name, slogan or logo from this list does not constitute a waiver ofScienceLogic’s trademark or other intellectual property rights concerning that name, slogan, or logo.
Please note that laws concerning use of trademarks or product names vary by country. Always consult alocal attorney for additional guidance.
Other
If any provision of this agreement shall be unlawful, void, or for any reason unenforceable, then thatprovision shall be deemed severable from this agreement and shall not affect the validity and enforceabilityof any remaining provisions. This is the entire agreement between the parties relating to the matterscontained herein.
In the U.S. and other jurisdictions, trademark owners have a duty to police the use of their marks. Therefore,if you become aware of any improper use of ScienceLogic Trademarks, including infringement orcounterfeiting by third parties, report them to Science Logic’s legal department immediately. Report as muchdetail as possible about the misuse, including the name of the party, contact information, and copies orphotographs of the potential misuse to: [email protected]

800-SCI-LOGIC (1-800-724-5644)
International: +1-703-354-1010
Related Documents