Monitoring your Swift cluster health Christian Schwede Principal Software Engineer, Red Hat OpenStack Summit Vancouver, May 2015

Monitoring Swift - OpenStack Summit May 2015, Vancouver
Jul 28, 2015
Welcome message from author
This document is posted to help you gain knowledge. Please leave a comment to let me know what you think about it! Share it to your friends and learn new things together.
Transcript

Monitoring your Swift cluster health
Christian SchwedePrincipal Software Engineer, Red HatOpenStack Summit Vancouver, May 2015

All good things come in threes
Swift Architecture MetricsBasic Monitoring

A short Swift overview

Proxy server PUT http://swift.com/v1/account/container/objectname
disk
Se
rve
r
Re
pl ic
ato
r
Au
di to
r
Up
da
ter
disk
disk disk
disk
Se
rve
r
Re
pl ic
ato
r
Au
di to
r
Up
da
ter
disk
disk disk
disk
Se
rve
r
Re
pl ic
ato
r
Au
di to
r
Up
da
ter
disk
disk disk
disk
Se
rve
r
Re
pl ic
ato
r
Au
di to
r
Up
da
ter
disk
disk disk

Basic Monitoring

Basic monitoring
● Services available?
curl http://server:port/healthcheck → “200 OK”
● Drives OK?
swift-drive-audit
● Checking replication, auditors, updaters, async_pending, ...
swift-recon
● Check data availability
swift-dispersion-report
● Audit a speci-c account/container?
swift-account-audit

Metrics

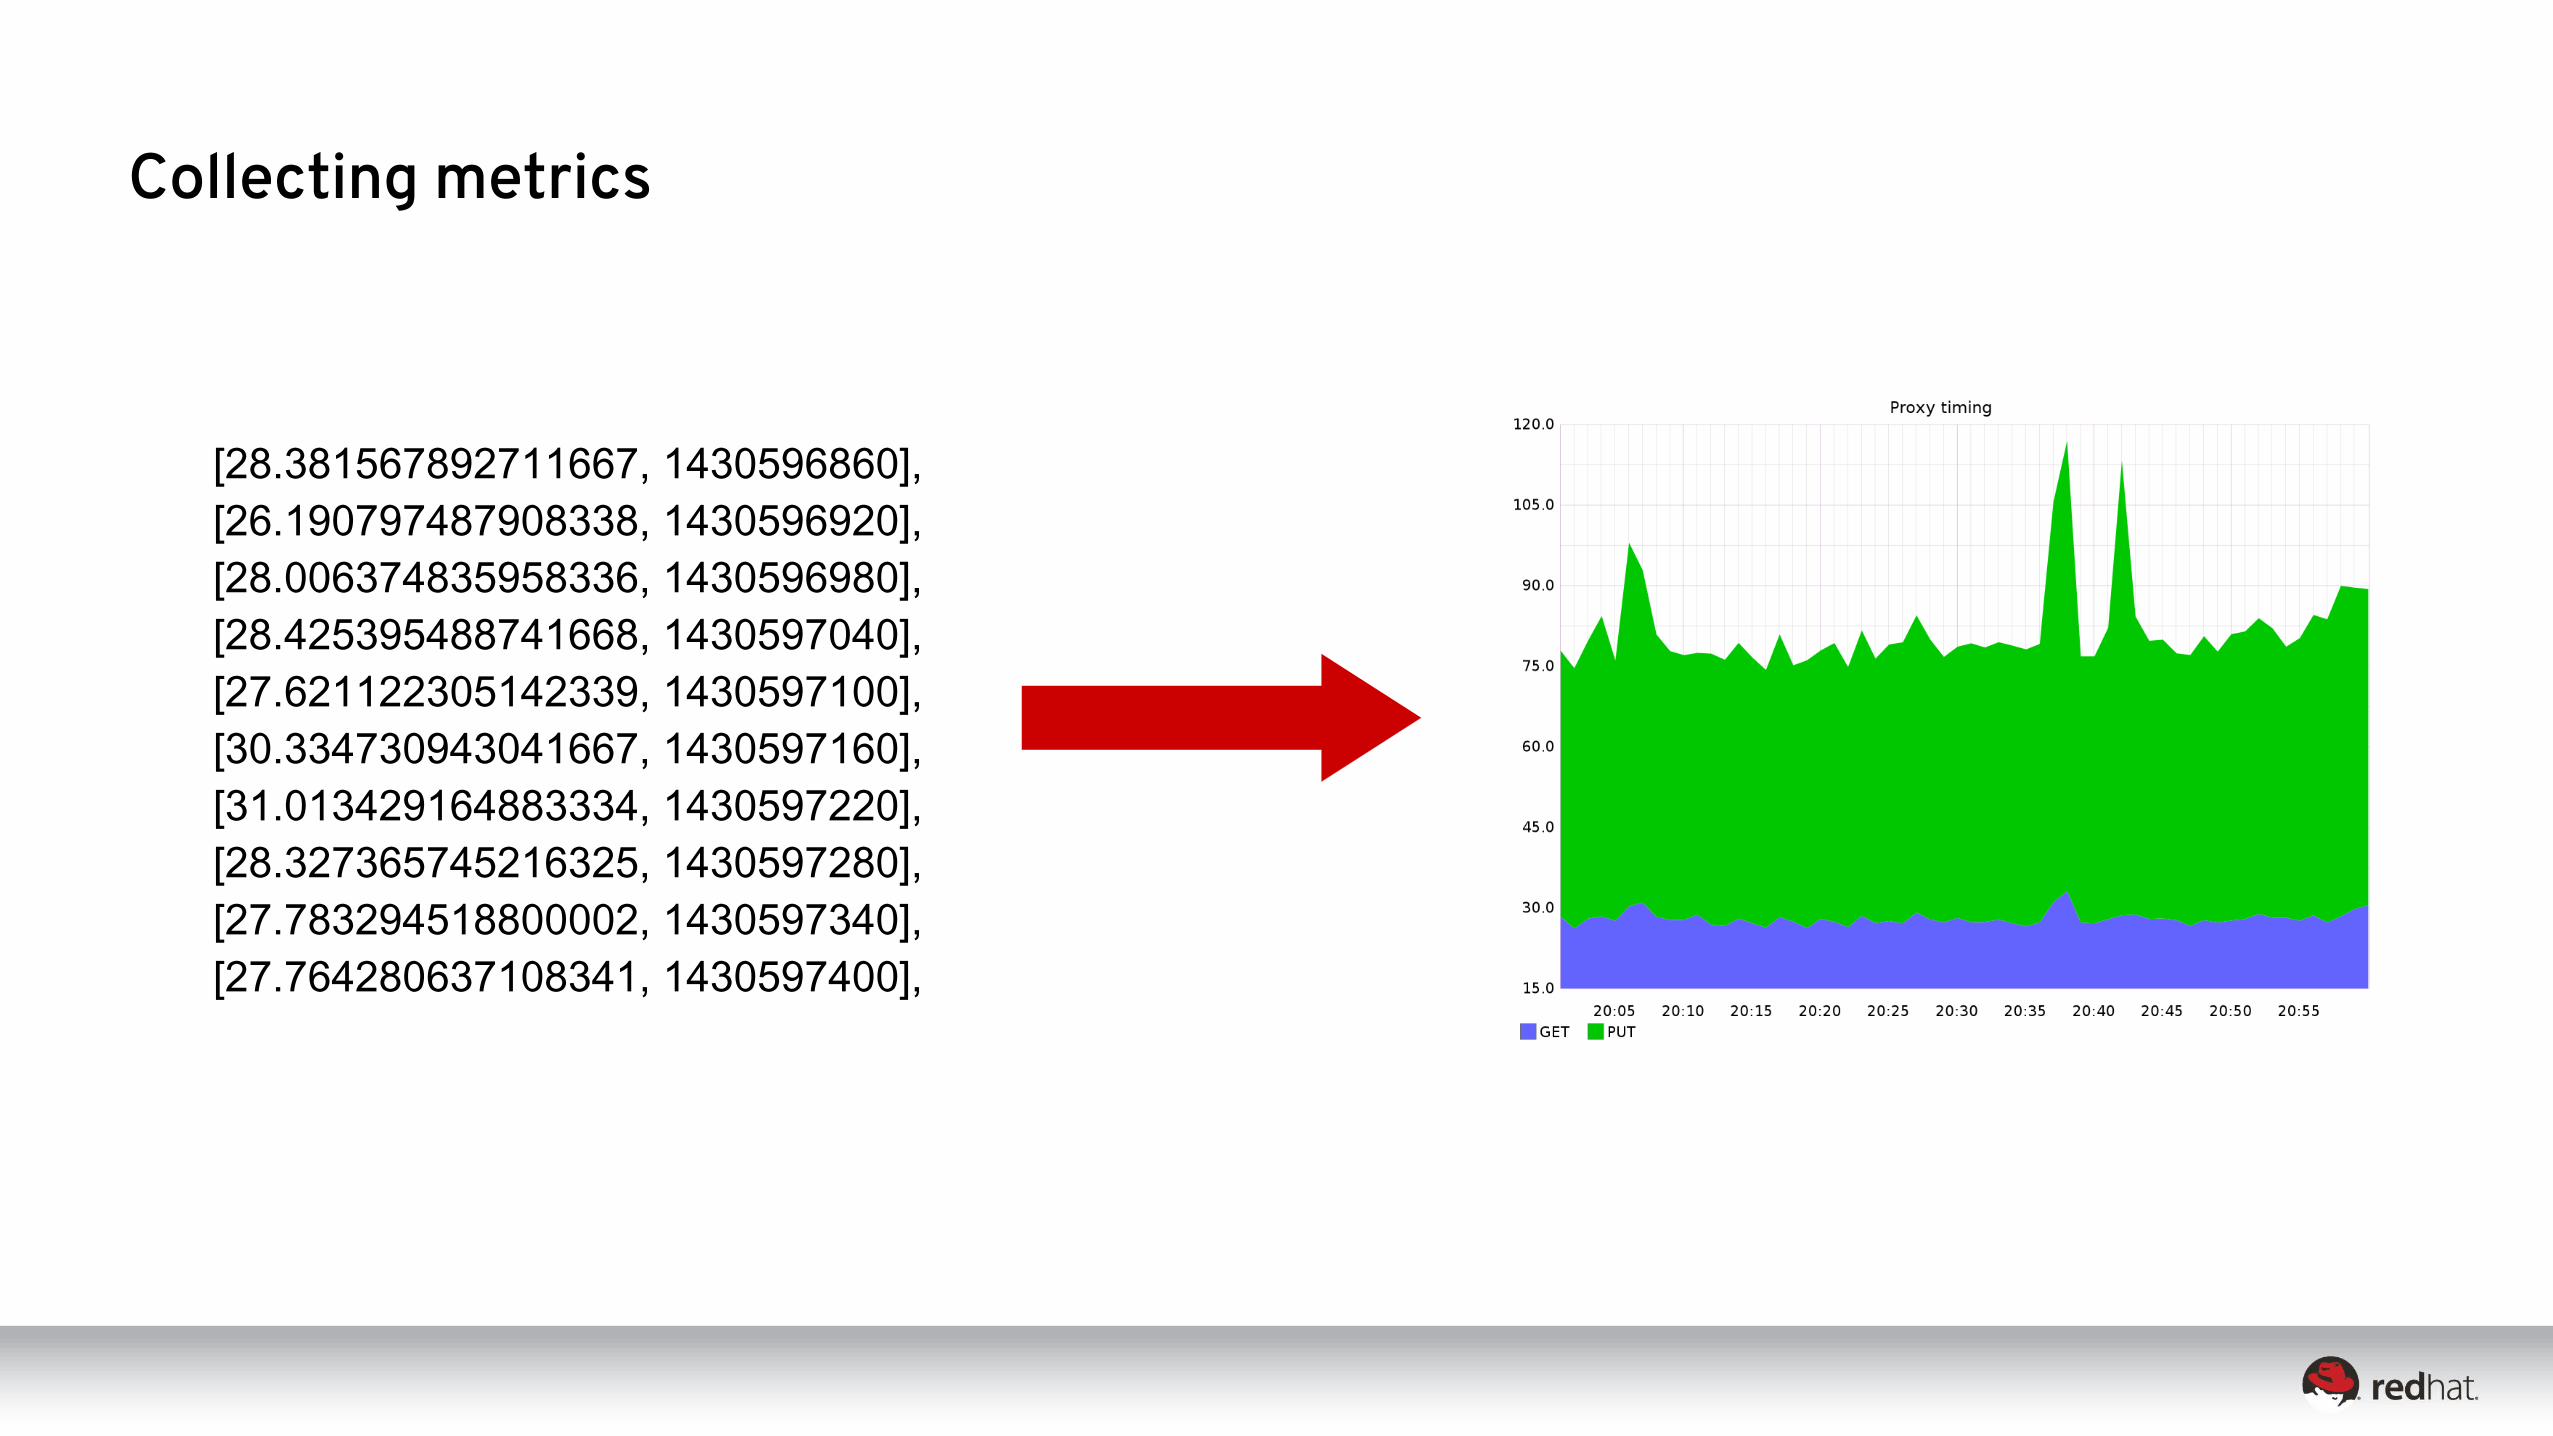
Collecting metrics
[28.381567892711667, 1430596860],
[26.190797487908338, 1430596920],
[28.006374835958336, 1430596980],
[28.425395488741668, 1430597040],
[27.621122305142339, 1430597100],
[30.334730943041667, 1430597160],
[31.013429164883334, 1430597220],
[28.327365745216325, 1430597280],
[27.783294518800002, 1430597340],
[27.764280637108341, 1430597400],
?
Collecting metrics
[28.381567892711667, 1430596860],
[26.190797487908338, 1430596920],
[28.006374835958336, 1430596980],
[28.425395488741668, 1430597040],
[27.621122305142339, 1430597100],
[30.334730943041667, 1430597160],
[31.013429164883334, 1430597220],
[28.327365745216325, 1430597280],
[27.783294518800002, 1430597340],
[27.764280637108341, 1430597400],

Swift, statsd & graphite interaction
object-server object-replicatorcollectd
statsd
carbon-cache
whisperdb
graphite-web

Installation & con-guration

Packages & important con-guration -les
● statsd
● python-carbon
● graphite-web
● graphite-web-selinux
● collectd
/etc/swift/*-server.conf
/etc/collectd.conf
/etc/statsd/con-g.js
/etc/carbon/storage-schemas.conf
/etc/carbon/storage-aggregation.conf

0
2
4
6
8
10
0 1 2 3 4 5 6 7 8 9 10
Sa
mple
valu
e
Time
Retention period & Aggregation method

Working with graphite-web


Selected Metrics


References
● docs.openstack.org/developer/swift/admin_guide.html#cluster-telemetry-and-monitoring
● docs.openstack.org/developer/swift/admin_guide.html#reporting-metrics-to-statsd
● github.com/etsy/statsd/blob/master/docs/graphite.md
● graphite.readthedocs.org/en/latest/
● graphite.readthedocs.org/en/latest/functions.html
● collectd.org/documentation/manpages/collectd.conf.5.shtml#plugin_write_graphite

Used graphite functions
1a groupByNode(stats.counters.*.proxy-server.object.*.2*.xfer.count, 5, "avg")
1b groupByNode(stats.timers.*.proxy-server.object.*.2*.timing.median, 5, "avg")
2a substr(stats.timers.*.proxy-server.object.*.2*.timing.count, 5,6)
2b substr(stats.timers.*.proxy-server.object.*.4*.timing.count, 5,7)
3 substr(avg(*.cpu.*.cpu.wait), 4)
4 substr(lowestCurrent(*.df.*.df_complex.free,5), 0, 1)
5 groupByNode(stats.counters.*.object-replicator.partition.update.count.*.count, 2, "sum")
6 substr(*.counters.*.proxy-server.*.handoff_count.count, 4, 5)
7 groupByNode(*.filecount.*_async_pending.files, 0, "sum")
Related Documents