No 03/1203 Edition: AIRAC 1203 Monitoring Report: AIRAC 1810 13 September 2018 – 10 October 2018

Welcome message from author
This document is posted to help you gain knowledge. Please leave a comment to let me know what you think about it! Share it to your friends and learn new things together.
Transcript

No 03/1203 Edition: AIRAC 1203
Monitoring Report: AIRAC 1810 13 September 2018 – 10 October 2018

European Route Network Improvement Plan
(ERNIP) Implementation Monitoring
Monitoring Report: AIRAC 1810 13 September 2018 – 10 October 2018
NETWORK MANAGER

Left blank intentionally
European Route Network Improvement Plan (ERNIP) - Implementation Monitoring Monitoring Report AIRAC 1810 (13 September 2018 – 10 October 2018)
- 5 -
TABLE OF CONTENT TABLE OF CONTENT .................................................................................................................... 5 1. INTRODUCTION ............................................................................................................... 7
1.1 SUMMARY ........................................................................................................................ 7 1.2 ACHIEVING THE EUROPEAN TARGET .......................................................................... 7 1.3 AIRSPACE DESIGN DEVELOPMENT AND IMPLEMENTATION MONITORING ............. 9 1.4 EXTERNAL DOCUMENT RELEASE................................................................................. 9
2. LIST OF PROPOSALS IMPLEMENTED AIRAC 1810 (13 SEPTEMBER 2018)............. 10 2.1 SUMMARY OF MAJOR PROJECTS IMPLEMENTED ON 13 SEPTEMBER 2018 .......... 10
3. EVOLUTION OF PERFORMANCE INDICATORS .......................................................... 11 3.1 AIRSPACE DESIGN INDICATOR EVOLUTION .............................................................. 11 3.2 FLIGHT PLANNING INDICATOR EVOLUTION .............................................................. 11 3.3 ROUTE AVAILABILITY INDICATOR EVOLUTION.......................................................... 11 3.4 FLIGHT EFFICIENCY EVOLUTION PER AIRAC CYCLE ............................................... 12
3.4.1 EVOLUTION OF RTE-DES AND RTE-FPL INDICATORS ......................................... 13 3.4.2 EVOLUTION OF RTE-RAD INDICATOR ................................................................... 13 3.4.3 BENEFITS AND ASSESSMENT OF RTE-DES AND RTE-FPL EVOLUTIONS ......... 13 3.4.4 BENEFITS AND ASSESSMENT OF RTE-RAD EVOLUTIONS ................................. 18
3.5 FREE ROUTE AIRSPACE/ FRA EVOLUTION ................................................................ 18 3.6 ASM PERFORMANCE ASSESSMENT ........................................................................... 19
ANNEX A: DETAILED LIST OF PROJECTS IMPLEMENTED 13 SEPTEMBER 2018 ................ 25 ANNEX B: ACRONYMS AND TERMINOLOGY ........................................................................... 29

European Route Network Improvement Plan (ERNIP) - Implementation Monitoring Monitoring Report AIRAC 1810 (13 September 2018 – 10 October 2018)
- 6 -
Left blank intentionally
European Route Network Improvement Plan (ERNIP) - Implementation Monitoring Monitoring Report AIRAC 1810 (13 September 2018 – 10 October 2018)
- 7 -
1. INTRODUCTION
1.1 SUMMARY This Report provides an update on the evolution of the environment indicators1 listed in the Network Performance Plan and plots on the progress achieved in improving airspace design and utilisation flight efficiency, in line with the improvement proposals implemented in the relevant AIRAC cycle.
This edition focuses on AIRAC 1810 (13 September 2018 – 10 October 2018). The methodology used for assessing flight efficiency is described in WP/9 of RNDSG/64. This document can be found at: https://extranet.eurocontrol.int/ftp/?t=4df773eea3ffaea31e3d1768150125b3
1.2 ACHIEVING THE EUROPEAN TARGET
The Performance Scheme for air navigation services and network functions includes two important key performance areas and associated indicators, related to the operational performance of the European ATM network for the period 2015 - 2019.
• Environment o average horizontal en-route flight efficiency of the actual trajectory, defined as
follows: - the indicator is the comparison between the length of the en-route part of
the actual trajectory derived from surveillance data and the corresponding portion of the great circle distance, summed over all IFR flights within or traversing the European airspace;
- “en-route” refers to the distance flown outside a circle of 40 NM around the airports;
- where a flight departs from or arrives at a place outside the European airspace, only the part inside the European airspace is considered;
This KPI is applicable at both network and Functional Airspace Block level.
o average horizontal en-route flight efficiency of the last filed flight plan trajectory, defined as follows:
- the difference between the length of the en-route part of the last filed flight plan trajectory and the corresponding portion of the great circle distance, summed over all IFR flights within or traversing the European airspace;
- “en-route” refers to the distance flown outside a circle of 40 NM around the airports;
- where a flight departs from or arrives at a place outside the European airspace, only the part inside the European airspace is considered;
This KPI is only applicable at network level.
• Capacity o minutes of en-route ATFM delay per flight, calculated for the full year and
including all IFR flights within European airspace and all ATFM delay causes, excluding exceptional events.
1 FPL: Flight Plan data provided by NM systems; SAAM analysis carried out by NM. DES/RAD: Traffic demand provided by NM systems; airspace environment data, profile calculations and SAAM analysis provided by NM.
European Route Network Improvement Plan (ERNIP) - Implementation Monitoring Monitoring Report AIRAC 1810 (13 September 2018 – 10 October 2018)
- 8 -
For the second performance Reference Period starting on 1st January 2015 and ending on 31st December 2019, the European Union-wide performance targets will be as follows: • Environment target:
• Actual trajectory (KEA) - an average of 2.6% route extension by 2019, decreasing from 3.17% in 2012 (based on PRB measurements)
• Last filed flight plan trajectory (KEP) - an average of 4.1% route extension by 2019, decreasing from 5.15% in 2012 (based on PRB measurements)
• Capacity target: average en route Air Traffic Flow Management (ATFM) delay of 0.5 minutes
per flight for each year of the second Reference Period. The ERNIP Part 2 - ARN Version 2014 - 2018/19 also responds to the targets included in the Network Performance Plan (NPP) 2015 - 2019 as described below:
o Route extension - airspace design
• Targets: o achieve an improvement of the DES indicator by 0.57
percentage points between the baseline year of 2012 and 2019
o Route extension - last filed flight plan
• Targets: o This is a European-wide indicator in RP2 and the NM
target for RP2 is to achieve 4.1% value for KEP indicator by 2019 for the entire NM area, fully consistent with the EU-wide target, i.e. a reduction by 1.05 pp (percentage points) between the baseline year of 2012 and 2019
o Route extension - actual trajectory
• Targets: o The NM target for RP2 is to achieve 2.6% value for KEA
indicator by 2019 for the SES area, fully consistent with the EU-wide target
o NM direct contributions to flight efficiency savings o The NM objectives is that these FE direct savings will
amount to 5% (2015 - 2016) and 7% (2017 - 2019) of the savings required to achieve the annual 0.15 pp reduction (or alternatively 5% of the actual KEP reduction) each year
o Increase the CDR1/2 usage o NM objective is to increase the CDR availability (CD-RAI)
and CDR usage (CDR-RAU) by 5% between the baseline year 2012 and 2019
European Route Network Improvement Plan (ERNIP) - Implementation Monitoring Monitoring Report AIRAC 1810 (13 September 2018 – 10 October 2018)
- 9 -
1.3 AIRSPACE DESIGN DEVELOPMENT AND IMPLEMENTATION MONITORING The Network Manager coordinates the following activities to achieve the required improvement in flight efficiency: Enhancing European en-route airspace design through annual improvements of European ATS
route network, high priority being given to: • the implementation of a coherent package of annual improvements and shorter routes; • improving efficiency for the most penalised city pairs; • the implementation of additional Conditional Routes for main traffic flows; • supporting initial implementation of free route airspace.
Improving airspace utilisation and route network availability through: • actively supporting and involving aircraft operators and the computer flight plan service
providers in flight plan quality improvements; • gradually applying route availability restrictions only where and when required; • improving the use and availability of civil/military airspace structures.
Efficient Terminal Manoeuvring Area design and utilisation through: • implementing advanced navigation capabilities; • implementing Continuous Descent Operations (CDO), improved arrival/departure routes,
optimised departure profiles, etc. Improving awareness of performance.
1.4 EXTERNAL DOCUMENT RELEASE The latest AIRAC report is available via the EUROCONTROL Airspace design website under the sub section ERNIP ERNIP Implementation Monitoring Latest monitoring report: http://www.eurocontrol.int/articles/airspace-design as well as via the EUROCONTROL Network Operations Monitoring and Reporting website under European Route Network Improvement Plan - Monitoring Report: http://www.eurocontrol.int/articles/network-operations-monitoring-and-reporting The full list of monitoring reports is available on the EUROCONTROL Media & Info Centre website: http://www.eurocontrol.int/publications?title=&field_term_publication_type_tid=205&year[value][yea
r]=
A copy of the AIRAC Report of the European Route Network Improvement Plan is also available via the restricted EUROCONTROL OneSky Online websites for access by other interested members of the RNDSG, ASMSG and NETOPS (see ref sub-sections under main section "LIBRARY"): https://ost.eurocontrol.int/sites/NETOPS/SitePages/Home.aspx https://ost.eurocontrol.int/sites/RNDSG/SitePages/Home.aspx https://ost.eurocontrol.int/sites/ASM-SG/SitePages/Home.aspx
European Route Network Improvement Plan (ERNIP) - Implementation Monitoring Monitoring Report AIRAC 1810 (13 September 2018 – 10 October 2018)
- 10 -
2. LIST OF PROPOSALS IMPLEMENTED AIRAC 1810 (13 SEPTEMBER 2018)
2.1 SUMMARY OF MAJOR PROJECTS IMPLEMENTED ON 13 SEPTEMBER 2018 During the AIRAC cycle 5 (five) airspace improvement packages co-ordinated at network level were implemented. Apart from ECAC States AIP en-route publication issues, ATS route network or RAD improvements the list below provides an overview of the major enhancements implemented on 13 September 2018:
Greece
- Implementation of PBN/ SBAS and Approach procedures Athinai FIR.
Norway
- New Norway ACC Sector 27.
A detailed description of all improvement measures implemented 13 September 2018 is attached in Annex A. The list is an extract of the European Route Network Improvement Plan database accessible via:
https://ext.eurocontrol.int/ernip_database/Index.action
A description of the airspace changes and improvements together with an orientation map due for implementation on the relevant AIRAC cycle is provided in the RNDSG Airspace Improvements Synopsis (RAIS) via the restricted EUROCONTROL OneSky Online website for RNDSG.
The latest situation of the European route network structure is available and updated at each AIRAC cycle through the publication of Regional Electronic Charts that can be found here: http://www.eurocontrol.int/articles/eurocontrol-regional-charts
European Route Network Improvement Plan (ERNIP) - Implementation Monitoring Monitoring Report AIRAC 1810 (13 September 2018 – 10 October 2018)
- 11 -
3. EVOLUTION OF PERFORMANCE INDICATORS
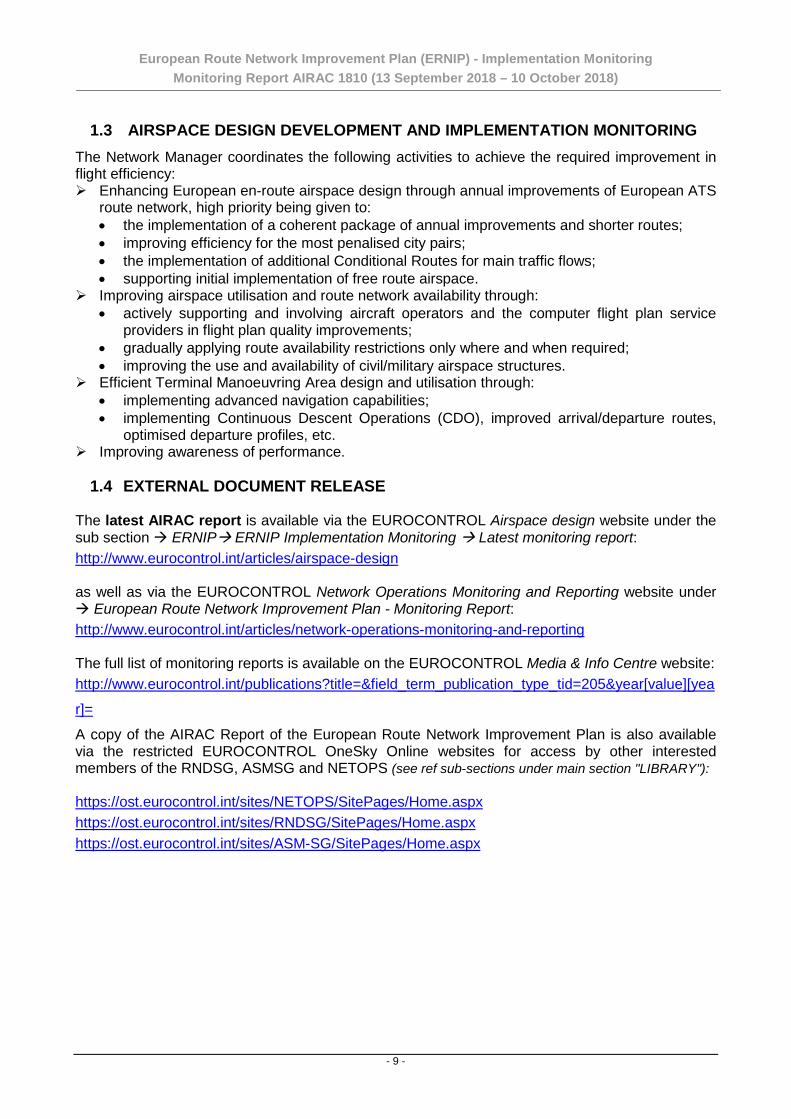
3.1 AIRSPACE DESIGN INDICATOR EVOLUTION The graph below shows the yearly evolution of airspace design flight efficiency (RTE-DES2) over the period 2007 - 2017 and its evolution until 10 October 2018. (Note: inclusion of new measurements will be done as soon as all data will become available)
3,53
%
3,54
%
3,45
%
3,22
%
3,04
%
2,96
%
2,80
%
2,63
%
2,55
%
2,47
%
2,36
%
2,28
%
2%
3%
4%
5%
6%
200720082009201020112012201320142015201620172018
RTE-DES
Figure 1 : Airspace Design indicator evolution
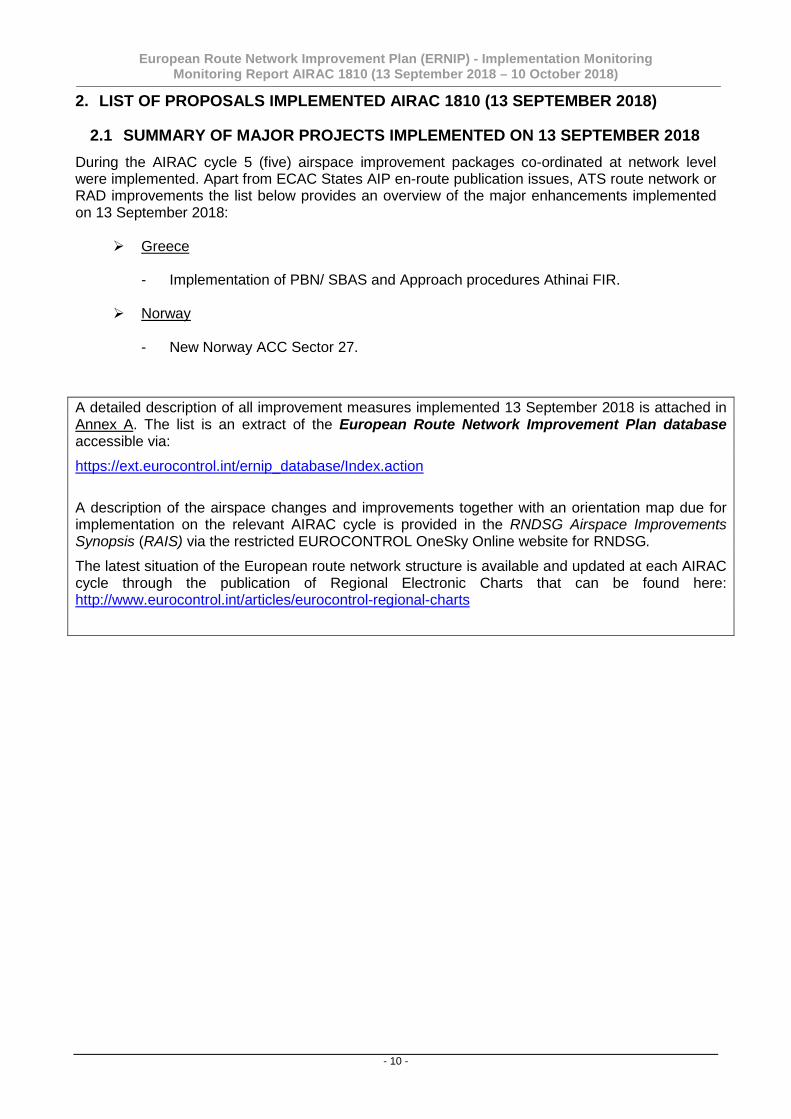
3.2 FLIGHT PLANNING INDICATOR EVOLUTION The graph below shows the yearly evolution of the last filed flight plan indicator (RTE-FPL3) over the period 2007 - 2017 and its evolution until 10 October 2018. (Note: inclusion of new measurements will be done as soon as all data will become available)
4,91
%
5,03
%
4,90
%
4,91
%
4,73
%
4,64
%
4,57
%
4,57
%
4,56
%
4,62
%
4,46
%
4,52
%
2%
3%
4%
5%
6%
200720082009201020112012201320142015201620172018
RTE-FPL
Figure 2 : Airspace Design indicator evolution
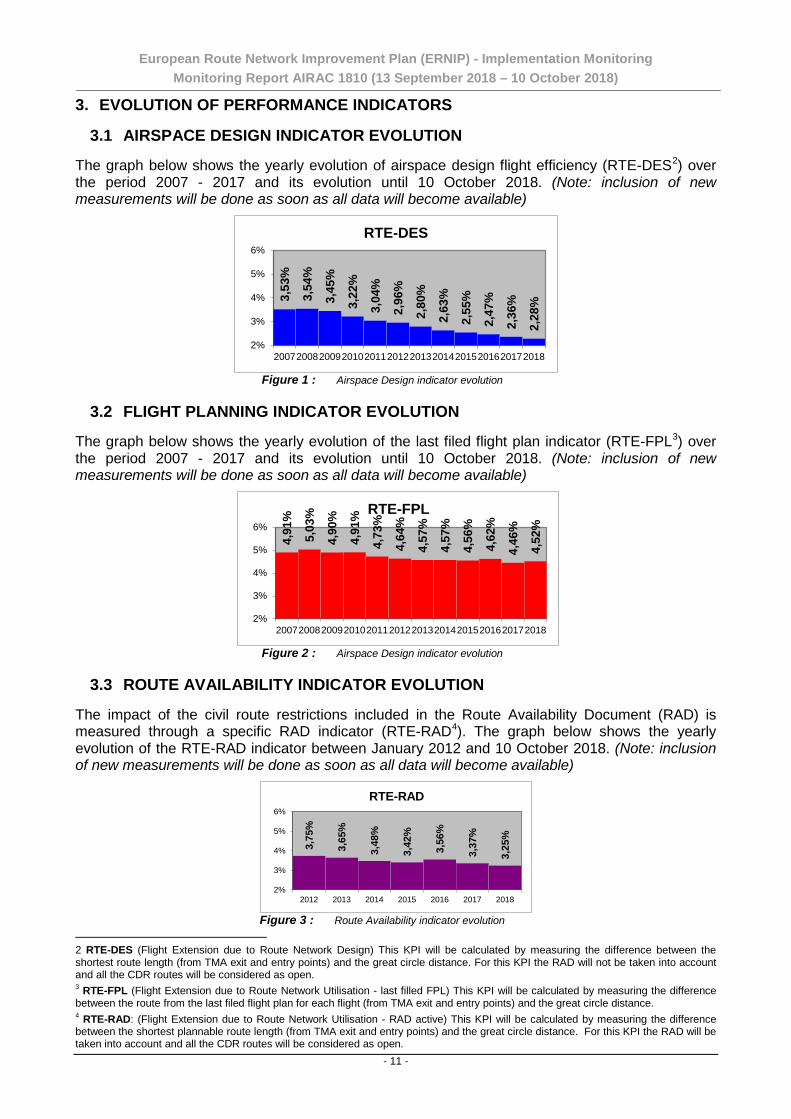
3.3 ROUTE AVAILABILITY INDICATOR EVOLUTION The impact of the civil route restrictions included in the Route Availability Document (RAD) is measured through a specific RAD indicator (RTE-RAD4). The graph below shows the yearly evolution of the RTE-RAD indicator between January 2012 and 10 October 2018. (Note: inclusion of new measurements will be done as soon as all data will become available)
3,75
%
3,65
%
3,48
%
3,42
%
3,56
%
3,37
%
3,25
%
2%
3%
4%
5%
6%
2012 2013 2014 2015 2016 2017 2018
RTE-RAD
Figure 3 : Route Availability indicator evolution
2 RTE-DES (Flight Extension due to Route Network Design) This KPI will be calculated by measuring the difference between the shortest route length (from TMA exit and entry points) and the great circle distance. For this KPI the RAD will not be taken into account and all the CDR routes will be considered as open. 3 RTE-FPL (Flight Extension due to Route Network Utilisation - last filled FPL) This KPI will be calculated by measuring the difference between the route from the last filed flight plan for each flight (from TMA exit and entry points) and the great circle distance. 4 RTE-RAD: (Flight Extension due to Route Network Utilisation - RAD active) This KPI will be calculated by measuring the difference between the shortest plannable route length (from TMA exit and entry points) and the great circle distance. For this KPI the RAD will be taken into account and all the CDR routes will be considered as open.
European Route Network Improvement Plan (ERNIP) - Implementation Monitoring Monitoring Report AIRAC 1810 (13 September 2018 – 10 October 2018)
- 12 -
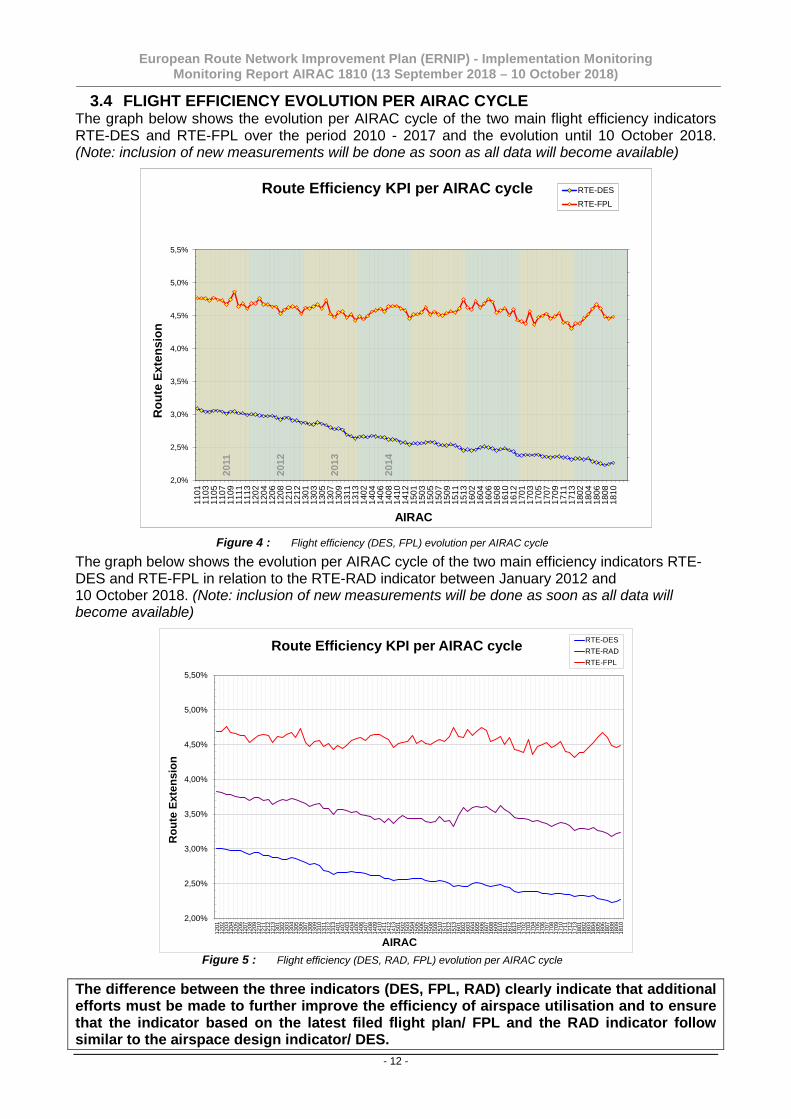
3.4 FLIGHT EFFICIENCY EVOLUTION PER AIRAC CYCLE The graph below shows the evolution per AIRAC cycle of the two main flight efficiency indicators RTE-DES and RTE-FPL over the period 2010 - 2017 and the evolution until 10 October 2018. (Note: inclusion of new measurements will be done as soon as all data will become available)
2011
2013
2012
2014
0
0,1
0,2
0,3
0,4
0,5
0,6
0,7
0,8
0,9
1
2,0%
2,5%
3,0%
3,5%
4,0%
4,5%
5,0%
5,5%
1101
1103
1105
1107
1109
1111
1113
1202
1204
1206
1208
1210
1212
1301
1303
1305
1307
1309
1311
1313
1402
1404
1406
1408
1410
1412
1501
1503
1505
1507
1509
1511
1513
1602
1604
1606
1608
1610
1612
1701
1703
1705
1707
1709
1711
1713
1802
1804
1806
1808
1810
Rou
te E
xten
sion
AIRAC
Route Efficiency KPI per AIRAC cycle RTE-DES
RTE-FPL
Figure 4 : Flight efficiency (DES, FPL) evolution per AIRAC cycle
The graph below shows the evolution per AIRAC cycle of the two main efficiency indicators RTE-DES and RTE-FPL in relation to the RTE-RAD indicator between January 2012 and 10 October 2018. (Note: inclusion of new measurements will be done as soon as all data will become available)
2,00%
2,50%
3,00%
3,50%
4,00%
4,50%
5,00%
5,50%
1201
1202
1203
1204
1205
1206
1207
1208
1209
1210
1211
1212
1213
1301
1302
1303
1304
1305
1306
1307
1308
1309
1310
1311
1312
1313
1401
1402
1403
1404
1405
1406
1407
1408
1409
1410
1411
1412
1413
1501
1502
1503
1504
1505
1506
1507
1508
1509
1510
1511
1512
1513
1601
1602
1603
1604
1605
1606
1607
1608
1609
1610
1611
1612
1613
1701
1702
1703
1704
1705
1706
1707
1708
1709
1710
1711
1712
1713
1801
1802
1803
1804
1805
1806
1807
1808
1809
1810
Rou
te E
xten
sion
AIRAC
Route Efficiency KPI per AIRAC cycle RTE-DESRTE-RADRTE-FPL
Figure 5 : Flight efficiency (DES, RAD, FPL) evolution per AIRAC cycle
The difference between the three indicators (DES, FPL, RAD) clearly indicate that additional efforts must be made to further improve the efficiency of airspace utilisation and to ensure that the indicator based on the latest filed flight plan/ FPL and the RAD indicator follow similar to the airspace design indicator/ DES.
European Route Network Improvement Plan (ERNIP) - Implementation Monitoring Monitoring Report AIRAC 1810 (13 September 2018 – 10 October 2018)
- 13 -
3.4.1 EVOLUTION OF RTE-DES AND RTE-FPL INDICATORS The current data indicates that, the average yearly route extension due to airspace design was reduced between 2009 and 10 October 2018 by 1.17 percentage points (same in AIRAC 1809). The evolution of the airspace design indicator is on the right path and the contributions of the airspace design projects are key for improving flight efficiency. The current data indicates that, the average yearly route extension based on the last filed flight plan was reduced between 2009 and 10 October 2018 by 0.38 percentage points (same in AIRAC 1809). The difference between the airspace design indicator and the last filed flight plan indicator was 1.45 percentage points in 2009 and was 2.24 percentage points in October 2018 (same in AIRAC 1809).
The current data indicates that the route extension due to airspace design went up to 2.27% in October 2018 (2.25% in AIRAC 1809).
The current data show that the route extension based on the last filed flight plan went up to 4.48% in October 2018 (4.46% in AIRAC 1809).
3.4.2 EVOLUTION OF RTE-RAD INDICATOR As shown in Figure 3 above the impact of the RAD decreased by 0,5 percentage points in October 2018 compared with 2012. More actions will be required to further diminish this impact still further and to ensure that the target set in the Network Manager Performance Plan is reached.
3.4.3 BENEFITS AND ASSESSMENT OF RTE-DES AND RTE-FPL EVOLUTIONS Thanks to the airspace enhancements implemented during AIRAC 1810 as well as the airspace design improvements put in place since AIRAC 1710 in connection with changing traffic patterns and structure, the additional, potential savings offered during AIRAC cycle 1810 amount to 144 000 NMs flown less compared with the equivalent AIRAC cycle in 2017. This translates into 864 tons of fuel, or 2 880 tons of CO2, or € 720 000.
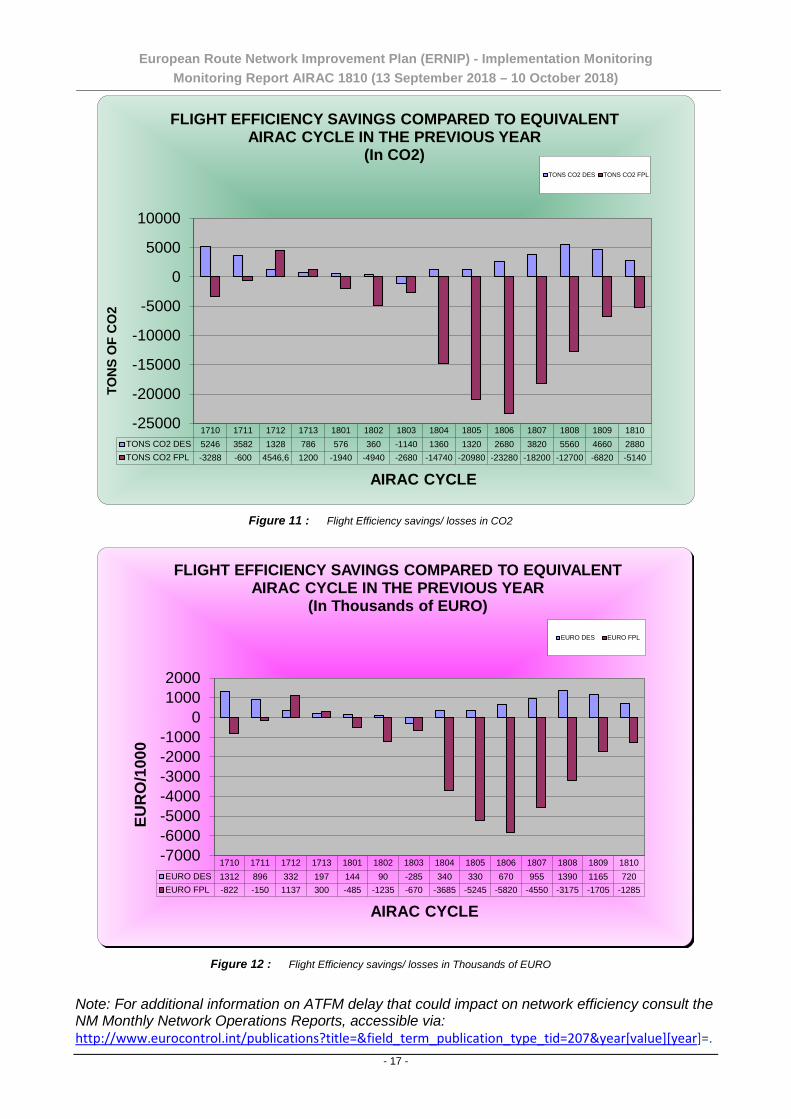
Based on the last filed flight plan indicator and as a result of the airspace design improvements put in place since AIRAC 1710 in connection with changing traffic patterns and the airline choices made, the actual losses calculated during the AIRAC cycle 1810 amount to 257 000 NMs flown more compared to the equivalent AIRAC cycle in 2017. This translates into 1 542 tons of fuel, or 5 140 tons of CO2, or € 1 285 000.
As a result of the FRA implementation (while still impacted by the various crises situation and airspace closed in adjacent airspace) flight efficiency improved but not to the maximum potential and it was seriously impacted by capacity, weather and industrial actions, while airspace design benefits continued to be implemented. The losses recorded on the last filed flight plan data during AIRAC cycle 1810 compared to the equivalent AIRAC cycle in 2017 are mainly because of different flight planning/ airline choices, traffic composition and/or scenarios applied due to capacity problems in the network as well as special events as follows:
• Overall crisis situation in Ukraine that lead a significant number of flights to avoid the entire Ukrainian airspace moving to neighbouring countries (Turkey, Bulgaria, Romania, Poland, Slovakia, etc.); as a result of the Ukrainian crisis adjacent ACCs/ UACs were on-loaded by Far Eastern traffic avoiding the Ukraine airspace leading to increased route extensions.
• Closure of Libyan airspace for over flights due to the security situation required procedures with impact on flight efficiency for traffic between Europe and Africa re-routed via Egypt and Tunisia (while traffic to/from Tunisia remains suppressed since the terrorist attack on 26 June 2016.)
European Route Network Improvement Plan (ERNIP) - Implementation Monitoring Monitoring Report AIRAC 1810 (13 September 2018 – 10 October 2018)
- 14 -
• Avoidance of Syrian due to the security situation with impact on flight efficiency for traffic between Europe and Middle East and Asia re-routed via Iran and Turkey with additional impacts on the flows from the Ukrainian crisis situation. Note: The restriction for the use of Iraqi airspace/ Baghdad FIR was relaxed end of 2017 according to NOTAM by FAA.
• Staffing and capacity issues in Maastricht UAC, Prague ACC and Marseille ACC required regulations, with impact on flight planning route extension.
• Staffing issues in Langen ACC and Nicosia ACC required regulations, with impact on flight planning efficiency.
• Capacity issues in Karlsruhe UAC, Brest ACC, Budapest ACC and Reims ACC required regulations with impact on flight planning route extension.
• Convective activity/ en-route weather affected large areas of Western Central Europe and required regulations with impact on the network performance and flight planning efficiency.
Note: Consistent, strong annual traffic growth for the en-route capacity and staffing regulated locations.
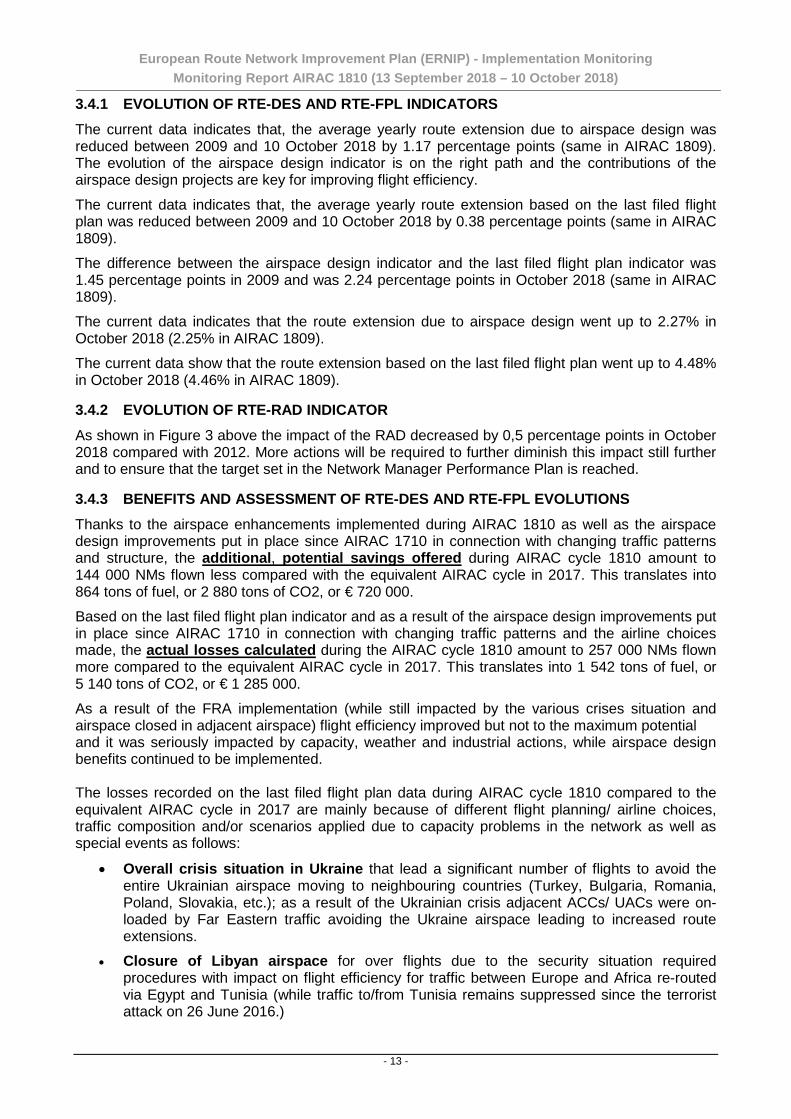
Figure 6 below shows the airspace unavailability and closed areas in October 2018. F
Figure 6 : Airspace unavailability and closed areas in October 2018
European Route Network Improvement Plan (ERNIP) - Implementation Monitoring Monitoring Report AIRAC 1810 (13 September 2018 – 10 October 2018)
- 15 -
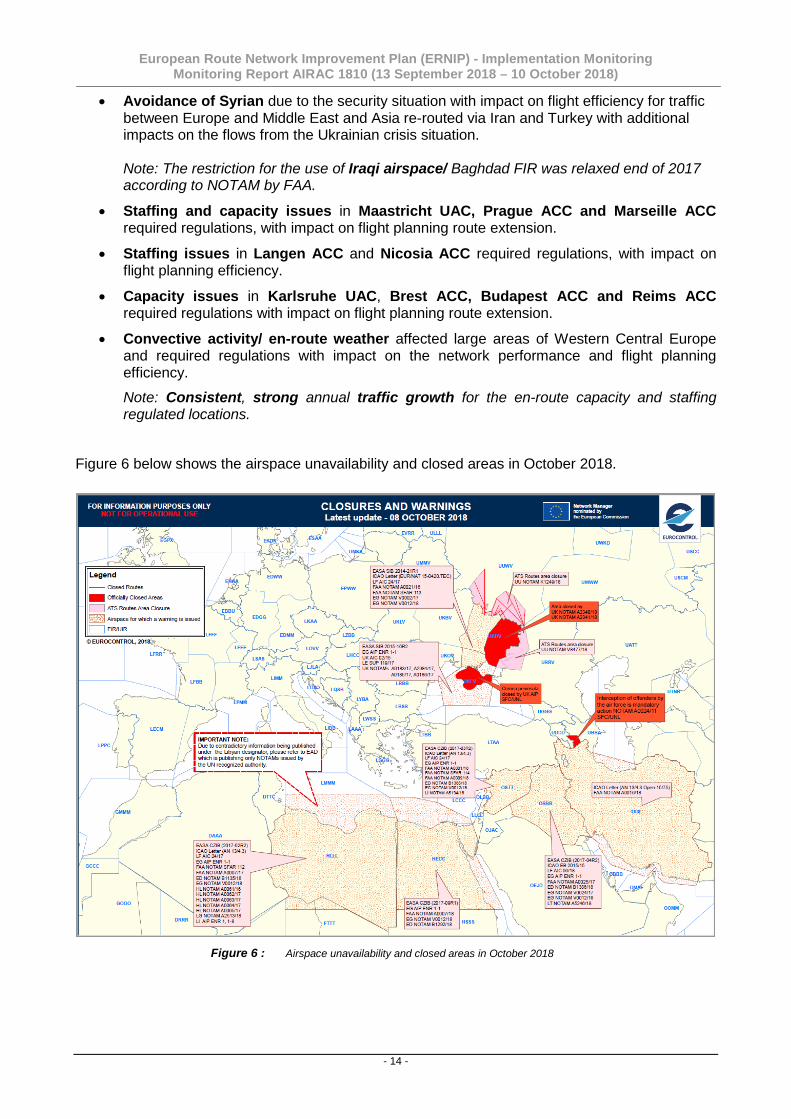
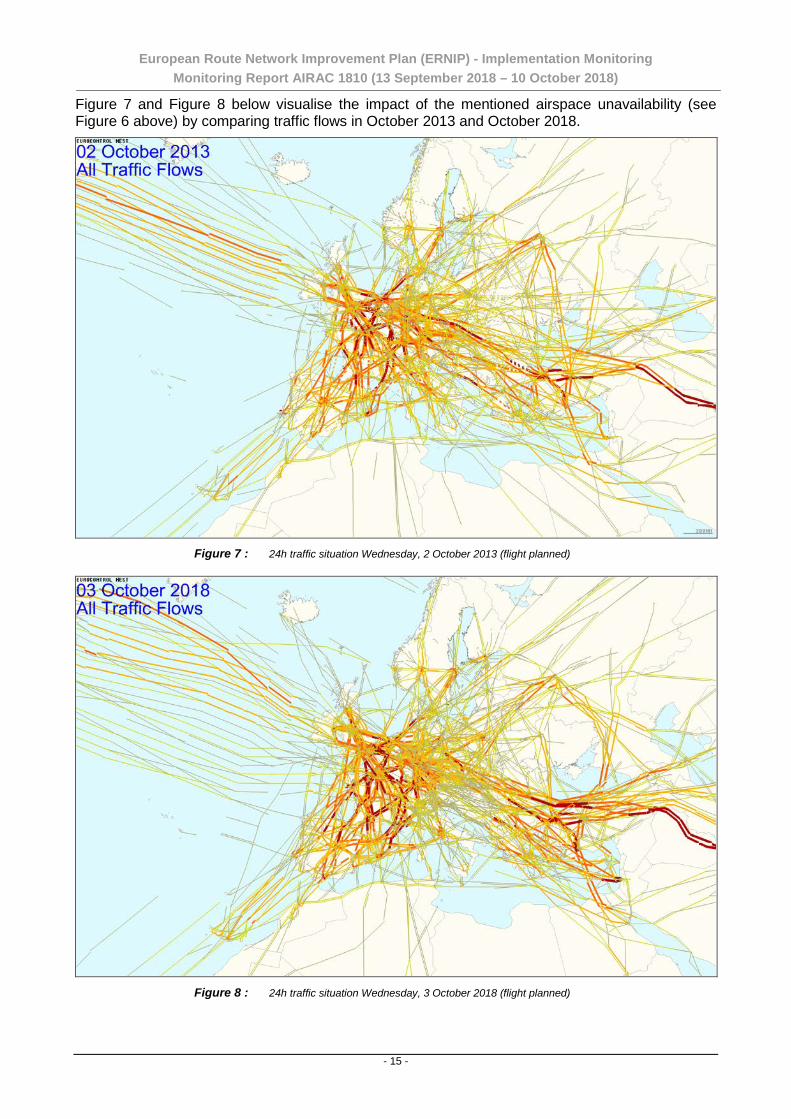
Figure 7 and Figure 8 below visualise the impact of the mentioned airspace unavailability (see Figure 6 above) by comparing traffic flows in October 2013 and October 2018.
Figure 7 : 24h traffic situation Wednesday, 2 October 2013 (flight planned)
Figure 8 : 24h traffic situation Wednesday, 3 October 2018 (flight planned)
European Route Network Improvement Plan (ERNIP) - Implementation Monitoring Monitoring Report AIRAC 1810 (13 September 2018 – 10 October 2018)
- 16 -
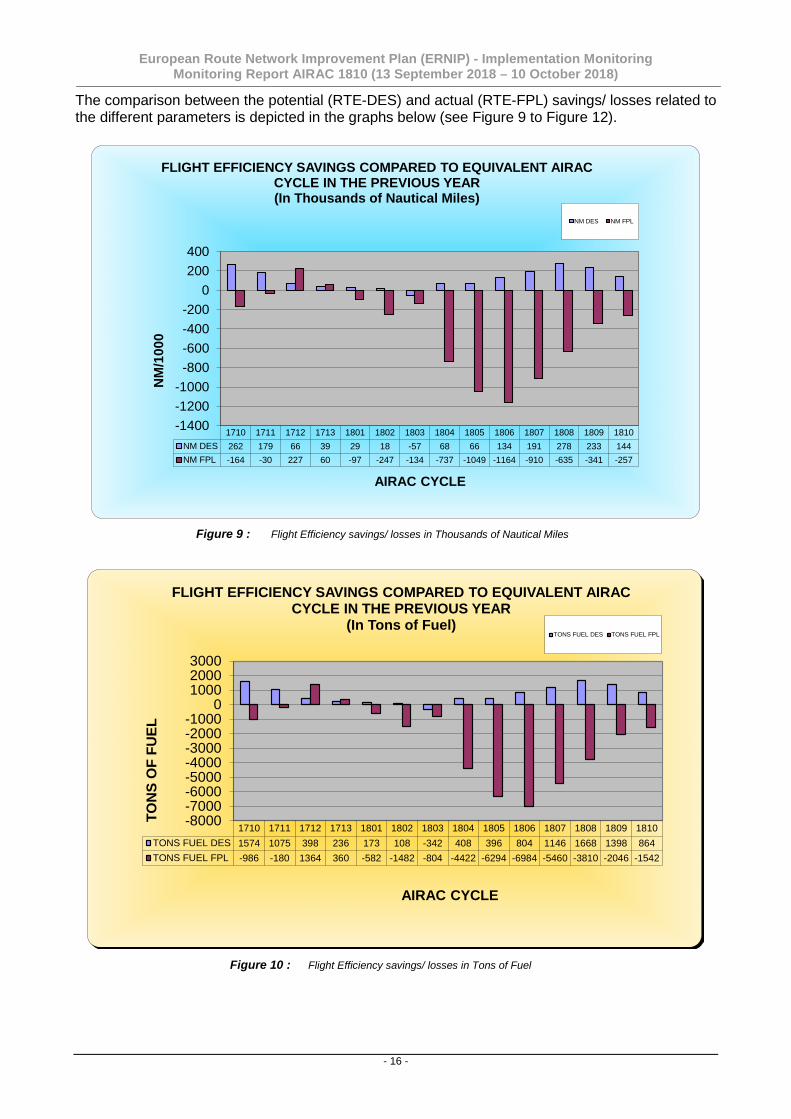
The comparison between the potential (RTE-DES) and actual (RTE-FPL) savings/ losses related to the different parameters is depicted in the graphs below (see Figure 9 to Figure 12).
1710 1711 1712 1713 1801 1802 1803 1804 1805 1806 1807 1808 1809 1810NM DES 262 179 66 39 29 18 -57 68 66 134 191 278 233 144NM FPL -164 -30 227 60 -97 -247 -134 -737 -1049 -1164 -910 -635 -341 -257
-1400-1200-1000-800-600-400-200
0200400
NM
/100
0
AIRAC CYCLE
FLIGHT EFFICIENCY SAVINGS COMPARED TO EQUIVALENT AIRAC CYCLE IN THE PREVIOUS YEAR(In Thousands of Nautical Miles)
NM DES NM FPL
Figure 9 : Flight Efficiency savings/ losses in Thousands of Nautical Miles
1710 1711 1712 1713 1801 1802 1803 1804 1805 1806 1807 1808 1809 1810TONS FUEL DES 1574 1075 398 236 173 108 -342 408 396 804 1146 1668 1398 864TONS FUEL FPL -986 -180 1364 360 -582 -1482 -804 -4422 -6294 -6984 -5460 -3810 -2046 -1542
-8000-7000-6000-5000-4000-3000-2000-1000
0100020003000
TON
S O
F FU
EL
AIRAC CYCLE
FLIGHT EFFICIENCY SAVINGS COMPARED TO EQUIVALENT AIRAC CYCLE IN THE PREVIOUS YEAR
(In Tons of Fuel)TONS FUEL DES TONS FUEL FPL
Figure 10 : Flight Efficiency savings/ losses in Tons of Fuel
European Route Network Improvement Plan (ERNIP) - Implementation Monitoring Monitoring Report AIRAC 1810 (13 September 2018 – 10 October 2018)
- 17 -
1710 1711 1712 1713 1801 1802 1803 1804 1805 1806 1807 1808 1809 1810TONS CO2 DES 5246 3582 1328 786 576 360 -1140 1360 1320 2680 3820 5560 4660 2880TONS CO2 FPL -3288 -600 4546,6 1200 -1940 -4940 -2680 -14740 -20980 -23280 -18200 -12700 -6820 -5140
-25000
-20000
-15000
-10000
-5000
0
5000
10000
TON
S O
F C
O2
AIRAC CYCLE
FLIGHT EFFICIENCY SAVINGS COMPARED TO EQUIVALENT AIRAC CYCLE IN THE PREVIOUS YEAR
(In CO2)TONS CO2 DES TONS CO2 FPL
Figure 11 : Flight Efficiency savings/ losses in CO2
1710 1711 1712 1713 1801 1802 1803 1804 1805 1806 1807 1808 1809 1810EURO DES 1312 896 332 197 144 90 -285 340 330 670 955 1390 1165 720EURO FPL -822 -150 1137 300 -485 -1235 -670 -3685 -5245 -5820 -4550 -3175 -1705 -1285
-7000-6000-5000-4000-3000-2000-1000
010002000
EUR
O/1
000
AIRAC CYCLE
FLIGHT EFFICIENCY SAVINGS COMPARED TO EQUIVALENT AIRAC CYCLE IN THE PREVIOUS YEAR
(In Thousands of EURO)
EURO DES EURO FPL
Figure 12 : Flight Efficiency savings/ losses in Thousands of EURO
Note: For additional information on ATFM delay that could impact on network efficiency consult the NM Monthly Network Operations Reports, accessible via: http://www.eurocontrol.int/publications?title=&field_term_publication_type_tid=207&year[value][year]=.
European Route Network Improvement Plan (ERNIP) - Implementation Monitoring Monitoring Report AIRAC 1810 (13 September 2018 – 10 October 2018)
- 18 -
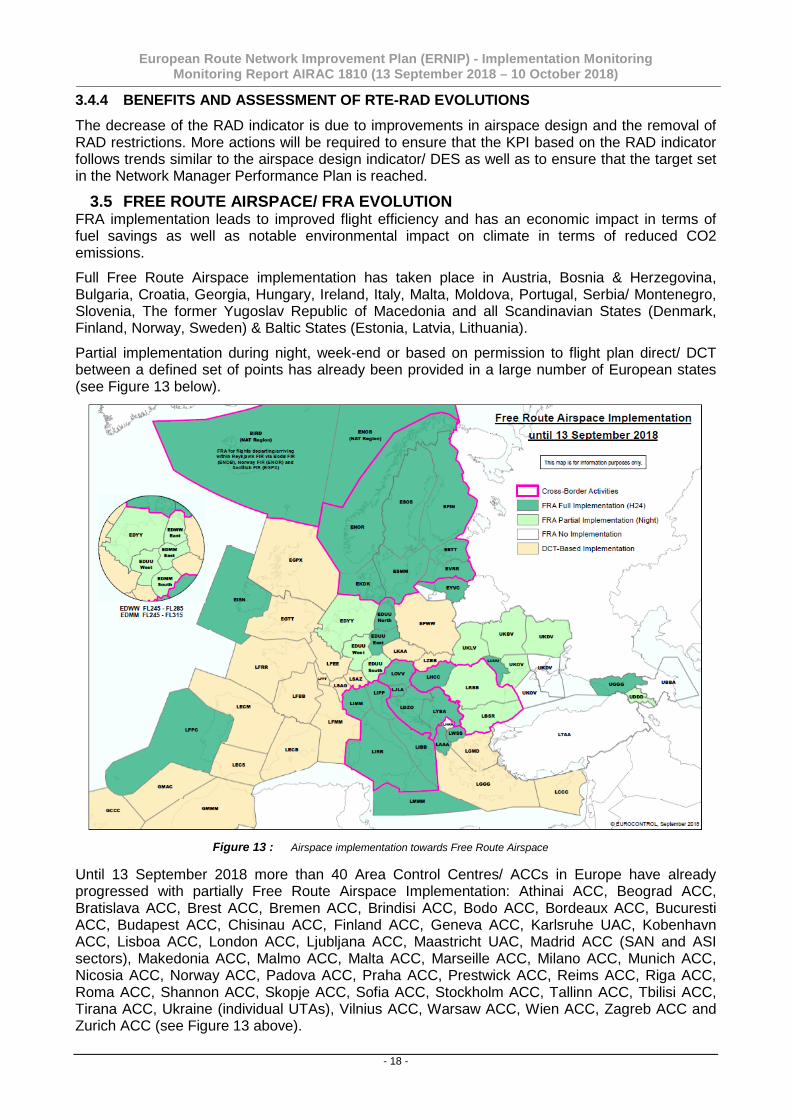
3.4.4 BENEFITS AND ASSESSMENT OF RTE-RAD EVOLUTIONS The decrease of the RAD indicator is due to improvements in airspace design and the removal of RAD restrictions. More actions will be required to ensure that the KPI based on the RAD indicator follows trends similar to the airspace design indicator/ DES as well as to ensure that the target set in the Network Manager Performance Plan is reached.
3.5 FREE ROUTE AIRSPACE/ FRA EVOLUTION FRA implementation leads to improved flight efficiency and has an economic impact in terms of fuel savings as well as notable environmental impact on climate in terms of reduced CO2 emissions.
Full Free Route Airspace implementation has taken place in Austria, Bosnia & Herzegovina, Bulgaria, Croatia, Georgia, Hungary, Ireland, Italy, Malta, Moldova, Portugal, Serbia/ Montenegro, Slovenia, The former Yugoslav Republic of Macedonia and all Scandinavian States (Denmark, Finland, Norway, Sweden) & Baltic States (Estonia, Latvia, Lithuania).
Partial implementation during night, week-end or based on permission to flight plan direct/ DCT between a defined set of points has already been provided in a large number of European states (see Figure 13 below).
Figure 13 : Airspace implementation towards Free Route Airspace
Until 13 September 2018 more than 40 Area Control Centres/ ACCs in Europe have already progressed with partially Free Route Airspace Implementation: Athinai ACC, Beograd ACC, Bratislava ACC, Brest ACC, Bremen ACC, Brindisi ACC, Bodo ACC, Bordeaux ACC, Bucuresti ACC, Budapest ACC, Chisinau ACC, Finland ACC, Geneva ACC, Karlsruhe UAC, Kobenhavn ACC, Lisboa ACC, London ACC, Ljubljana ACC, Maastricht UAC, Madrid ACC (SAN and ASI sectors), Makedonia ACC, Malmo ACC, Malta ACC, Marseille ACC, Milano ACC, Munich ACC, Nicosia ACC, Norway ACC, Padova ACC, Praha ACC, Prestwick ACC, Reims ACC, Riga ACC, Roma ACC, Shannon ACC, Skopje ACC, Sofia ACC, Stockholm ACC, Tallinn ACC, Tbilisi ACC, Tirana ACC, Ukraine (individual UTAs), Vilnius ACC, Warsaw ACC, Wien ACC, Zagreb ACC and Zurich ACC (see Figure 13 above).
European Route Network Improvement Plan (ERNIP) - Implementation Monitoring Monitoring Report AIRAC 1810 (13 September 2018 – 10 October 2018)
- 19 -
3.6 ASM PERFORMANCE ASSESSMENT The FUA indicators are calculated separately for two CDR basic categories: CDR1 and CDR2.
Those CDRs, defined as CDR1/2, CDR1/3 or CDR2/3, are measured over time for each category and their individual contribution is added to either CDR1 or CDR2 type reports. The method allows us to align the calculation of the indicators with the way the CDRs’ availability is presented in AUP/UUP Lists A and B respectively.
The values for each AIRAC cycle were aggregated by measuring the indicators on a daily basis. By doing this, we could differentiate between each CDR1/2, CDR1/3 or CDR2/3 routes, categorising CDR1 and CDR2 routes with the appropriate metrics.
We measure airspace utilisation with the Rate of Aircraft Interested (RAI) and Rate of Aircraft using CDRs (RAU). The first indicator shows which flights could potentially use available CDRs; the second one indicates the actual CDR uptake.
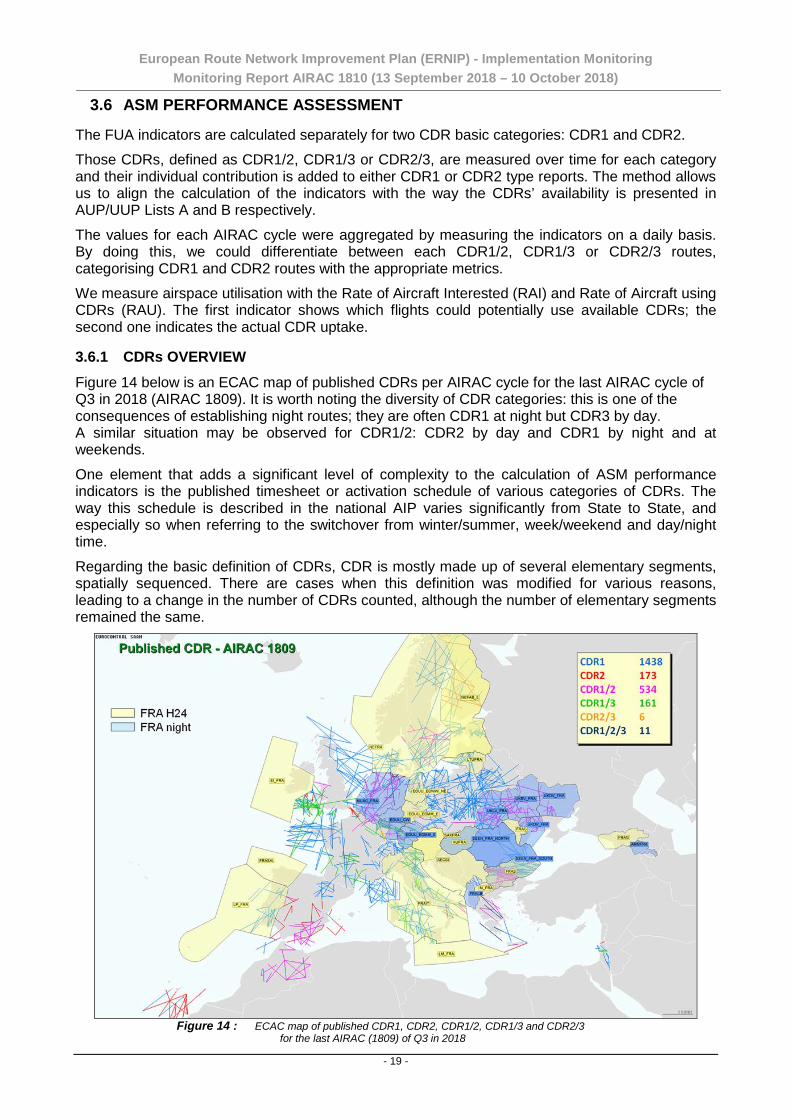
3.6.1 CDRs OVERVIEW Figure 14 below is an ECAC map of published CDRs per AIRAC cycle for the last AIRAC cycle of Q3 in 2018 (AIRAC 1809). It is worth noting the diversity of CDR categories: this is one of the consequences of establishing night routes; they are often CDR1 at night but CDR3 by day. A similar situation may be observed for CDR1/2: CDR2 by day and CDR1 by night and at weekends.
One element that adds a significant level of complexity to the calculation of ASM performance indicators is the published timesheet or activation schedule of various categories of CDRs. The way this schedule is described in the national AIP varies significantly from State to State, and especially so when referring to the switchover from winter/summer, week/weekend and day/night time.
Regarding the basic definition of CDRs, CDR is mostly made up of several elementary segments, spatially sequenced. There are cases when this definition was modified for various reasons, leading to a change in the number of CDRs counted, although the number of elementary segments remained the same.
Figure 14 : ECAC map of published CDR1, CDR2, CDR1/2, CDR1/3 and CDR2/3
for the last AIRAC (1809) of Q3 in 2018
European Route Network Improvement Plan (ERNIP) - Implementation Monitoring Monitoring Report AIRAC 1810 (13 September 2018 – 10 October 2018)
- 20 -
“Flights interested” represents the maximum number of flights that could potentially have made use of an available CDR in their flight plans. The absolute numbers averaged daily for an AIRAC cycle in Q2 and Q3 2017 are:
• 32163 (Q2) and 36167 (Q3) daily average IFPS flights; • 9251 (Q2) and 10954 (Q3) interested flights on CDR1s; • 6773 (Q2) and 8050 (Q3) effectively planning at least one CDR1 segment; • 3068 (Q2) and 3610 (Q3) actually flying on at least one CDR1 segment; • 265 (Q2) and 323 (Q3) interested flights on CDR2s; • 199 (Q2) and 251 (Q3) effectively planning at least one CDR2 segment; • 135 (Q2) and 167 (Q3) actually flying on at least one CDR2 segment.
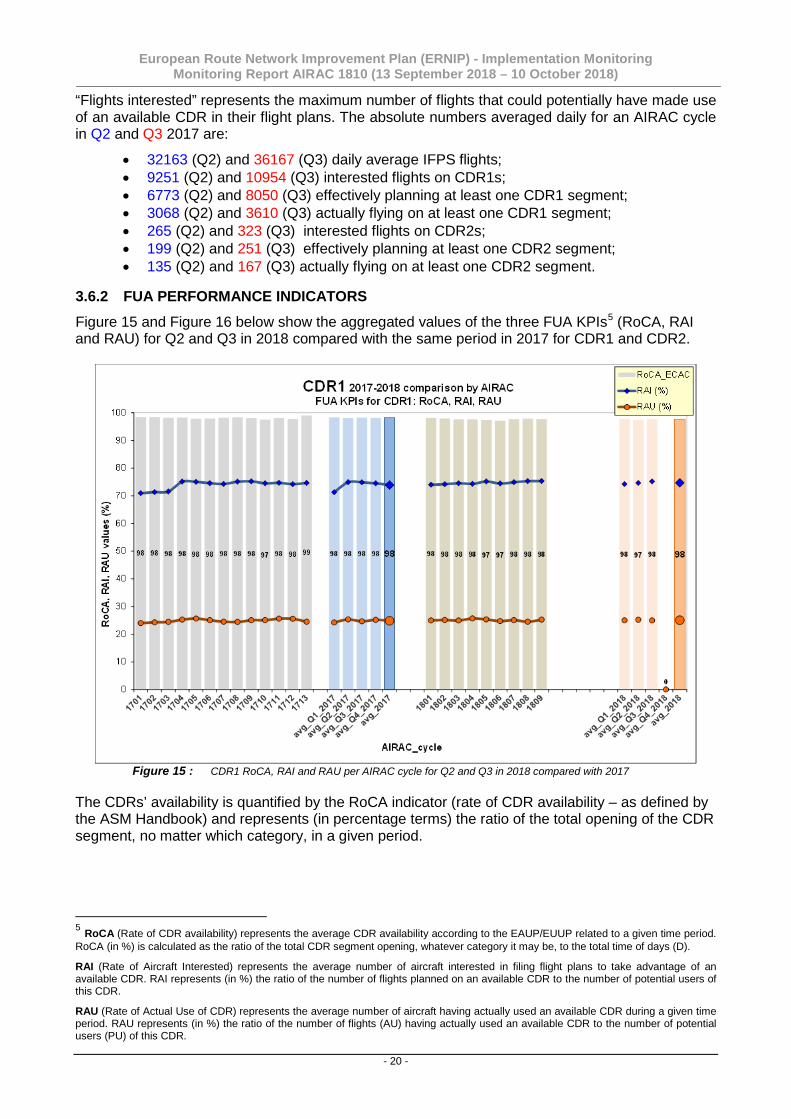
3.6.2 FUA PERFORMANCE INDICATORS Figure 15 and Figure 16 below show the aggregated values of the three FUA KPIs5 (RoCA, RAI and RAU) for Q2 and Q3 in 2018 compared with the same period in 2017 for CDR1 and CDR2.
Figure 15 : CDR1 RoCA, RAI and RAU per AIRAC cycle for Q2 and Q3 in 2018 compared with 2017
The CDRs’ availability is quantified by the RoCA indicator (rate of CDR availability – as defined by the ASM Handbook) and represents (in percentage terms) the ratio of the total opening of the CDR segment, no matter which category, in a given period.
5 RoCA (Rate of CDR availability) represents the average CDR availability according to the EAUP/EUUP related to a given time period. RoCA (in %) is calculated as the ratio of the total CDR segment opening, whatever category it may be, to the total time of days (D).
RAI (Rate of Aircraft Interested) represents the average number of aircraft interested in filing flight plans to take advantage of an available CDR. RAI represents (in %) the ratio of the number of flights planned on an available CDR to the number of potential users of this CDR.
RAU (Rate of Actual Use of CDR) represents the average number of aircraft having actually used an available CDR during a given time period. RAU represents (in %) the ratio of the number of flights (AU) having actually used an available CDR to the number of potential users (PU) of this CDR.
European Route Network Improvement Plan (ERNIP) - Implementation Monitoring Monitoring Report AIRAC 1810 (13 September 2018 – 10 October 2018)
- 21 -
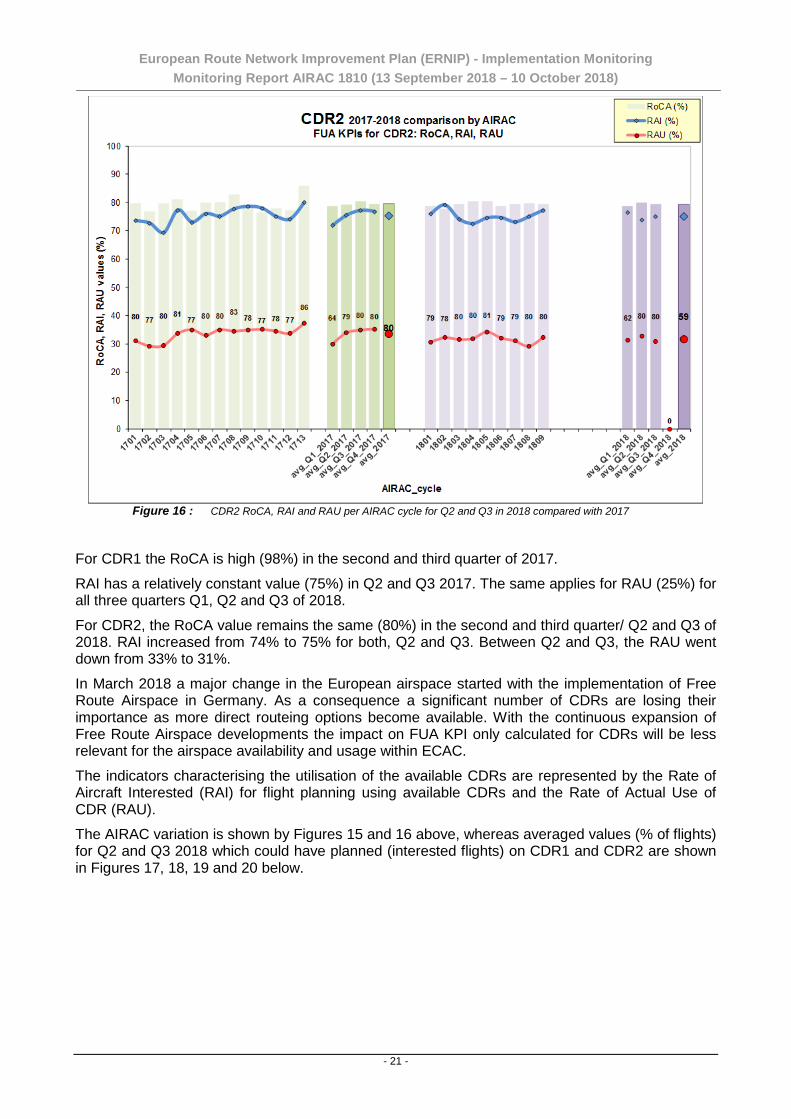
Figure 16 : CDR2 RoCA, RAI and RAU per AIRAC cycle for Q2 and Q3 in 2018 compared with 2017
For CDR1 the RoCA is high (98%) in the second and third quarter of 2017.
RAI has a relatively constant value (75%) in Q2 and Q3 2017. The same applies for RAU (25%) for all three quarters Q1, Q2 and Q3 of 2018.
For CDR2, the RoCA value remains the same (80%) in the second and third quarter/ Q2 and Q3 of 2018. RAI increased from 74% to 75% for both, Q2 and Q3. Between Q2 and Q3, the RAU went down from 33% to 31%.
In March 2018 a major change in the European airspace started with the implementation of Free Route Airspace in Germany. As a consequence a significant number of CDRs are losing their importance as more direct routeing options become available. With the continuous expansion of Free Route Airspace developments the impact on FUA KPI only calculated for CDRs will be less relevant for the airspace availability and usage within ECAC.
The indicators characterising the utilisation of the available CDRs are represented by the Rate of Aircraft Interested (RAI) for flight planning using available CDRs and the Rate of Actual Use of CDR (RAU).
The AIRAC variation is shown by Figures 15 and 16 above, whereas averaged values (% of flights) for Q2 and Q3 2018 which could have planned (interested flights) on CDR1 and CDR2 are shown in Figures 17, 18, 19 and 20 below.
European Route Network Improvement Plan (ERNIP) - Implementation Monitoring Monitoring Report AIRAC 1810 (13 September 2018 – 10 October 2018)
- 22 -
Planning on CDR174.6%
NOT on CDR125.4%
Rate of Aircraft Interested Q2 CDR1
Planning on CDR273.9%
NOT on CDR226.1%
Rate of Aircraft Interested Q2 CDR2
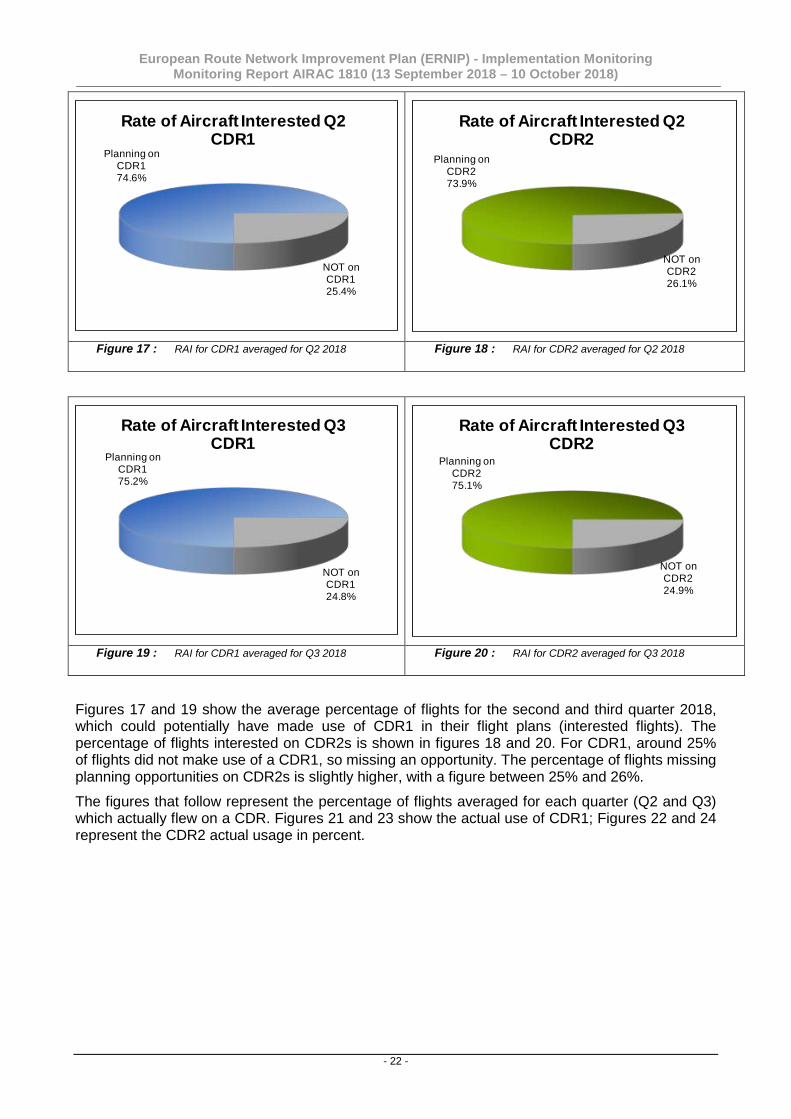
Figure 17 : RAI for CDR1 averaged for Q2 2018 Figure 18 : RAI for CDR2 averaged for Q2 2018
Planning on CDR175.2%
NOT on CDR124.8%
Rate of Aircraft Interested Q3 CDR1
Planning on CDR275.1%
NOT on CDR224.9%
Rate of Aircraft Interested Q3CDR2
Figure 19 : RAI for CDR1 averaged for Q3 2018 Figure 20 : RAI for CDR2 averaged for Q3 2018
Figures 17 and 19 show the average percentage of flights for the second and third quarter 2018, which could potentially have made use of CDR1 in their flight plans (interested flights). The percentage of flights interested on CDR2s is shown in figures 18 and 20. For CDR1, around 25% of flights did not make use of a CDR1, so missing an opportunity. The percentage of flights missing planning opportunities on CDR2s is slightly higher, with a figure between 25% and 26%.
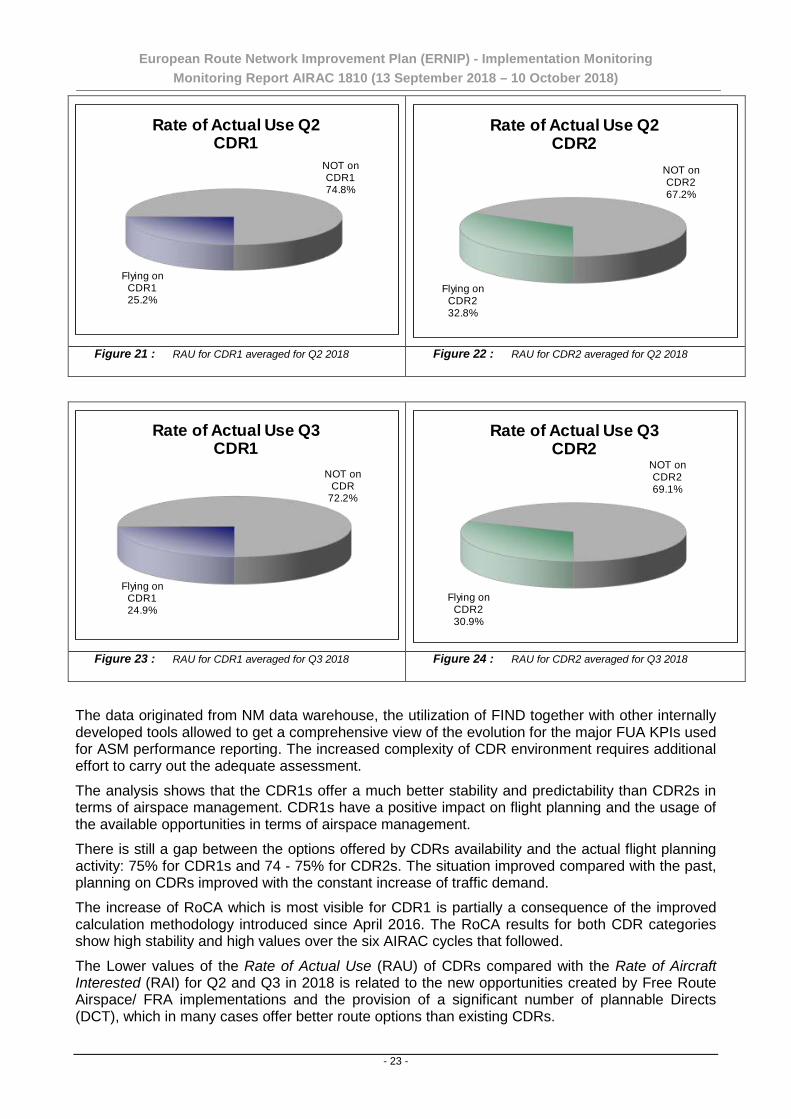
The figures that follow represent the percentage of flights averaged for each quarter (Q2 and Q3) which actually flew on a CDR. Figures 21 and 23 show the actual use of CDR1; Figures 22 and 24 represent the CDR2 actual usage in percent.
European Route Network Improvement Plan (ERNIP) - Implementation Monitoring Monitoring Report AIRAC 1810 (13 September 2018 – 10 October 2018)
- 23 -
Flying on CDR125.2%
NOT on CDR174.8%
Rate of Actual Use Q2 CDR1
Flying on CDR232.8%
NOT on CDR267.2%
Rate of Actual Use Q2 CDR2
Figure 21 : RAU for CDR1 averaged for Q2 2018 Figure 22 : RAU for CDR2 averaged for Q2 2018
Flying on CDR124.9%
NOT on CDR
72.2%
Rate of Actual Use Q3 CDR1
Flying on CDR230.9%
NOT on CDR269.1%
Rate of Actual Use Q3 CDR2
Figure 23 : RAU for CDR1 averaged for Q3 2018 Figure 24 : RAU for CDR2 averaged for Q3 2018
The data originated from NM data warehouse, the utilization of FIND together with other internally developed tools allowed to get a comprehensive view of the evolution for the major FUA KPIs used for ASM performance reporting. The increased complexity of CDR environment requires additional effort to carry out the adequate assessment.
The analysis shows that the CDR1s offer a much better stability and predictability than CDR2s in terms of airspace management. CDR1s have a positive impact on flight planning and the usage of the available opportunities in terms of airspace management.
There is still a gap between the options offered by CDRs availability and the actual flight planning activity: 75% for CDR1s and 74 - 75% for CDR2s. The situation improved compared with the past, planning on CDRs improved with the constant increase of traffic demand.
The increase of RoCA which is most visible for CDR1 is partially a consequence of the improved calculation methodology introduced since April 2016. The RoCA results for both CDR categories show high stability and high values over the six AIRAC cycles that followed.
The Lower values of the Rate of Actual Use (RAU) of CDRs compared with the Rate of Aircraft Interested (RAI) for Q2 and Q3 in 2018 is related to the new opportunities created by Free Route Airspace/ FRA implementations and the provision of a significant number of plannable Directs (DCT), which in many cases offer better route options than existing CDRs.
European Route Network Improvement Plan (ERNIP) - Implementation Monitoring Monitoring Report AIRAC 1810 (13 September 2018 – 10 October 2018)
- 24 -
Note: The ASM Performance Assessment for Q1 2018 is included for AIRAC 1804.
The ASM Performance Assessment for 2018, providing a full picture of the whole year 2018 as well as the performance (behaviour of the aircraft operators and the efficiency of the ANSPs managing the airspace) in the first, second, third and fourth quarter/ Q1 - Q4 2018 (AIRAC 1801 – AIRAC 1813) will be included in the ERNIP Implementation Monitoring Report for AIRAC 1813.
European Route Network Improvement Plan (ERNIP) - Implementation Monitoring Monitoring Report AIRAC 1810 (13 September 2018 – 10 October 2018)
- 25 -
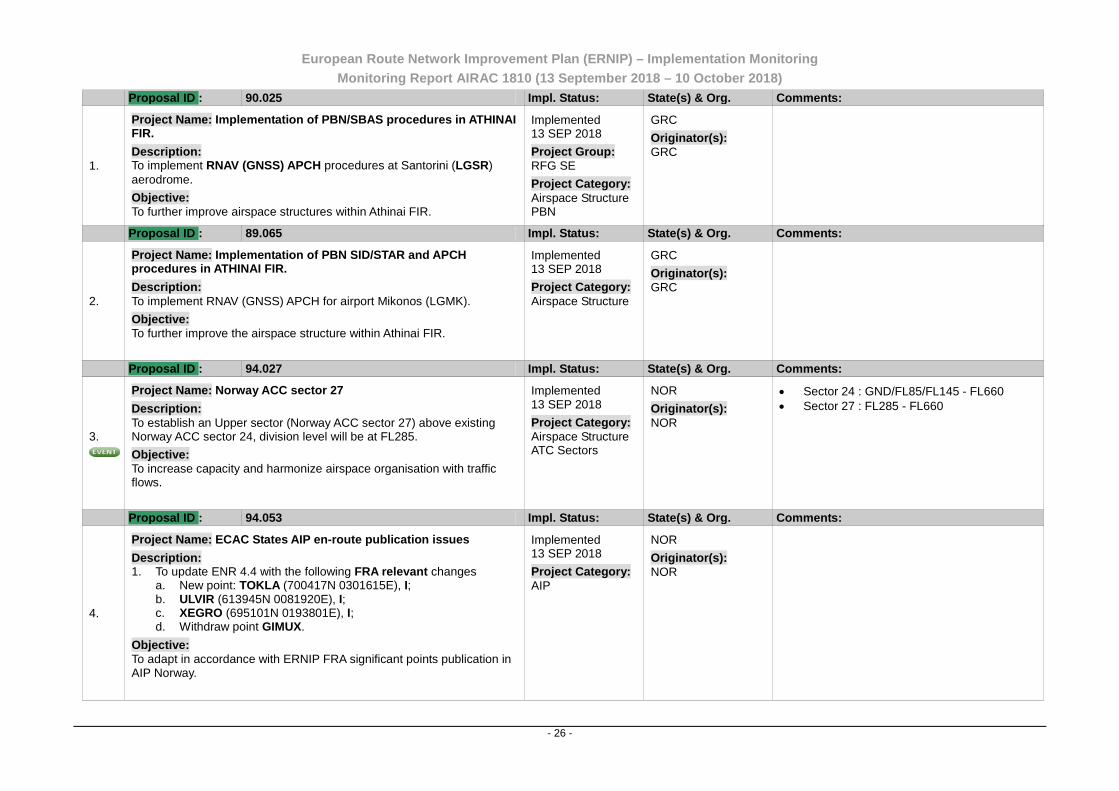
ANNEX A: DETAILED LIST OF PROJECTS IMPLEMENTED 13 SEPTEMBER 2018 The following table presents detailed information about each of the improvement proposals developed within the RNDSG and implemented during the relevant AIRAC cycle. The description of the proposals is based on the information available from different sources (e.g. AOs, ANSPs and EUROCONTROL). The table includes:
Proposal ID number: A reference number to identify each proposal allowing tracing at which RNDSG it was initiated.
Project Name: Dedicated Name and Phase/ Step of the improvement project.
Description: A detailed description of the planned improvement proposal.
Objective: A brief description of the purpose of the enhancement measure.
Implementation Status: The implementation status defined as Proposed, Planned, Confirmed or Implemented.
Project Group: The Functional Airspace Block Group (FAB), Regional Focus Group (RFG), Sub-Group (SG) or any other Project Group(s) involved directly or indirectly by the proposed enhancement measure.
Project Category: The nature of the proposed enhancement measure defined through Project Categories (e.g. Airspace Structure, ATC Sectors, ATS Routes, Free Route Airspace, TMA etc.).
States and Organisations: The States and/or Organisations involved directly or indirectly by the proposed enhancement measure.
Originator(s): The States and/or Organisations who have originated the proposal.
Comments: The conditions and/or pre-requisites which have to be met in order to implement the proposal or any other relevant comment(s).
Note: The list of implemented changes for this AIRAC cycle does not claim to be complete. For the correctness and verification of the relevant aeronautical information consult official State AIP publications. The data from this document should not be used for operational purpose
European Route Network Improvement Plan (ERNIP) – Implementation Monitoring Monitoring Report AIRAC 1810 (13 September 2018 – 10 October 2018)
- 26 -
Proposal ID : 90.025 Impl. Status: State(s) & Org. Comments:
1.
Project Name: Implementation of PBN/SBAS procedures in ATHINAI FIR.
Description: To implement RNAV (GNSS) APCH procedures at Santorini (LGSR) aerodrome.
Objective: To further improve airspace structures within Athinai FIR.
Implemented 13 SEP 2018
Project Group: RFG SE
Project Category: Airspace Structure PBN
GRC
Originator(s): GRC
Proposal ID : 89.065 Impl. Status: State(s) & Org. Comments:
2.
Project Name: Implementation of PBN SID/STAR and APCH procedures in ATHINAI FIR.
Description: To implement RNAV (GNSS) APCH for airport Mikonos (LGMK).
Objective: To further improve the airspace structure within Athinai FIR.
Implemented 13 SEP 2018
Project Category: Airspace Structure
GRC
Originator(s): GRC
Proposal ID : 94.027 Impl. Status: State(s) & Org. Comments:
3.
Project Name: Norway ACC sector 27
Description: To establish an Upper sector (Norway ACC sector 27) above existing Norway ACC sector 24, division level will be at FL285.
Objective: To increase capacity and harmonize airspace organisation with traffic flows.
Implemented 13 SEP 2018
Project Category: Airspace Structure ATC Sectors
NOR
Originator(s): NOR
• Sector 24 : GND/FL85/FL145 - FL660 • Sector 27 : FL285 - FL660
Proposal ID : 94.053 Impl. Status: State(s) & Org. Comments:
4.
Project Name: ECAC States AIP en-route publication issues
Description: 1. To update ENR 4.4 with the following FRA relevant changes
a. New point: TOKLA (700417N 0301615E), I; b. ULVIR (613945N 0081920E), I; c. XEGRO (695101N 0193801E), I; d. Withdraw point GIMUX.
Objective: To adapt in accordance with ERNIP FRA significant points publication in AIP Norway.
Implemented 13 SEP 2018
Project Category: AIP
NOR
Originator(s): NOR
European Route Network Improvement Plan (ERNIP) – Implementation Monitoring Monitoring Report AIRAC 1810 (13 September 2018 – 10 October 2018)
- 27 -
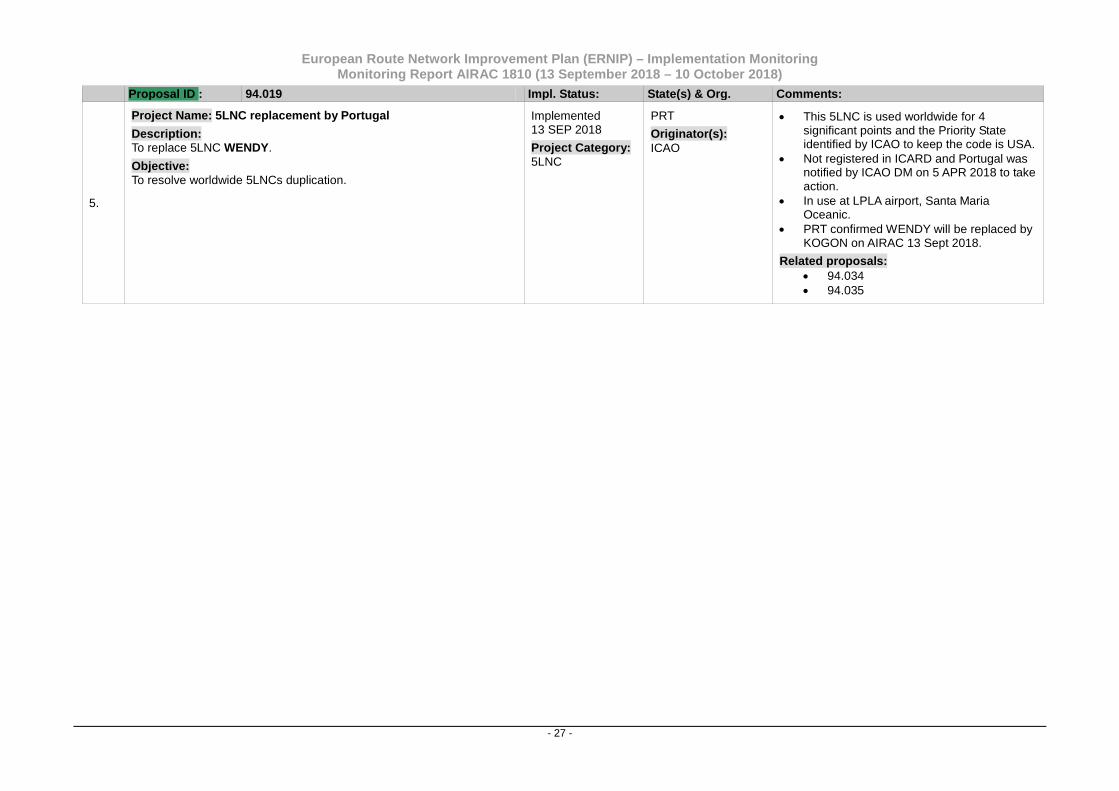
Proposal ID : 94.019 Impl. Status: State(s) & Org. Comments:
5.
Project Name: 5LNC replacement by Portugal
Description: To replace 5LNC WENDY.
Objective: To resolve worldwide 5LNCs duplication.
Implemented 13 SEP 2018
Project Category: 5LNC
PRT
Originator(s): ICAO
• This 5LNC is used worldwide for 4 significant points and the Priority State identified by ICAO to keep the code is USA.
• Not registered in ICARD and Portugal was notified by ICAO DM on 5 APR 2018 to take action.
• In use at LPLA airport, Santa Maria Oceanic.
• PRT confirmed WENDY will be replaced by KOGON on AIRAC 13 Sept 2018.
Related proposals: • 94.034 • 94.035
European Route Network Improvement Plan (ERNIP) – Implementation Monitoring Monitoring Report AIRAC 1810 (13 September 2018 – 10 October 2018)
- 28 -
Left blank intentionally
European Route Network Improvement Plan (ERNIP) – Implementation Monitoring Monitoring Report AIRAC 1810 (13 September 2018 – 10 October 2018)
- 29 -
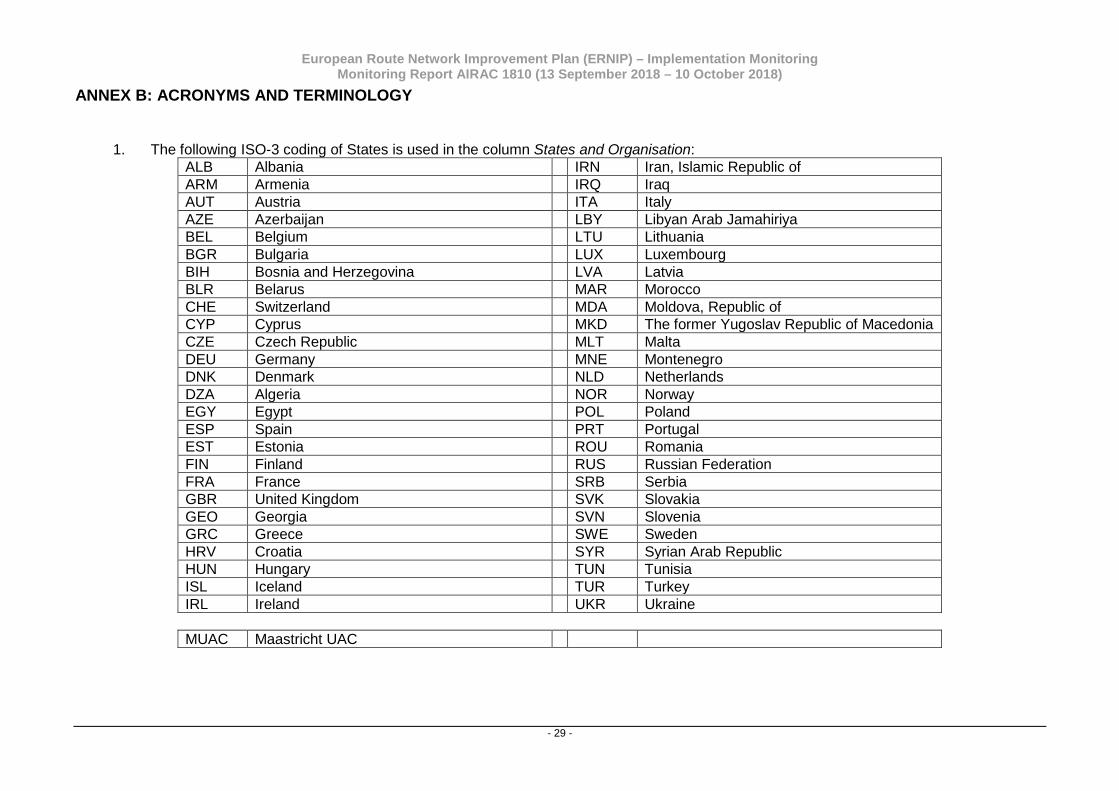
ANNEX B: ACRONYMS AND TERMINOLOGY
1. The following ISO-3 coding of States is used in the column States and Organisation: ALB Albania IRN Iran, Islamic Republic of ARM Armenia IRQ Iraq AUT Austria ITA Italy AZE Azerbaijan LBY Libyan Arab Jamahiriya BEL Belgium LTU Lithuania BGR Bulgaria LUX Luxembourg BIH Bosnia and Herzegovina LVA Latvia BLR Belarus MAR Morocco CHE Switzerland MDA Moldova, Republic of CYP Cyprus MKD The former Yugoslav Republic of Macedonia CZE Czech Republic MLT Malta DEU Germany MNE Montenegro DNK Denmark NLD Netherlands DZA Algeria NOR Norway EGY Egypt POL Poland ESP Spain PRT Portugal EST Estonia ROU Romania FIN Finland RUS Russian Federation FRA France SRB Serbia GBR United Kingdom SVK Slovakia GEO Georgia SVN Slovenia GRC Greece SWE Sweden HRV Croatia SYR Syrian Arab Republic HUN Hungary TUN Tunisia ISL Iceland TUR Turkey IRL Ireland UKR Ukraine
MUAC Maastricht UAC
European Route Network Improvement Plan (ERNIP) – Implementation Monitoring Monitoring Report AIRAC 1810 (13 September 2018 – 10 October 2018)
- 30 -
2. BLUMED FAB, DANUBE FAB and FAB CE proposals referenced in proposal number box are coded with a unique identification number abbreviated as BM or DN or CE, respectively, following by four digits (XXXX) (example BM0001 or DN0001 or CE0001).
3. The content of each proposal is an indication of State’s intention to implement the relevant airspace improvement but don't represent a copy of any official publication. For the correctness and verification of the relevant aeronautical information consult official State AIP publication. The data from this document should not be used for operational purposes.
European Route Network Improvement Plan (ERNIP) – Implementation Monitoring Monitoring Report AIRAC 1810 (13 September 2018 – 10 October 2018)
- 31 -
Left blank intentionally

European Route Network Improvement Plan (ERNIP) – Implementation Monitoring Monitoring Report AIRAC 1810 (13 September 2018 – 10 October 2018)
- 32 -
Related Documents


![AIRAC 09 Feb 2012australianoceanicvirtualairlines.weebly.com/uploads/1/4/...NATS Unclassified AIRAC 09 Feb 2012 5 of 502 Routes Starting From] ADEP/ Entry SID Min Max Route-Segment](https://static.cupdf.com/doc/110x72/5f717f31304430467f1cdca8/airac-09-feb-2012australianoc-nats-unclassified-airac-09-feb-2012-5-of-502-routes.jpg)


