Air Quality Monitoring Program at the Port of Long Beach Annual Summary Report Calendar Year 2020 Prepared For: Port of Long Beach Environmental Planning Division 415 West Ocean Boulevard Long Beach, California 90802 June 2021

Welcome message from author
This document is posted to help you gain knowledge. Please leave a comment to let me know what you think about it! Share it to your friends and learn new things together.
Transcript
Air Quality Monitoring Programat the Port of Long Beach
Annual Summary Report Calendar Year 2020
Prepared For:
Port of Long BeachEnvironmental Planning Division
415 West Ocean BoulevardLong Beach, California 90802
June 2021

This page is intentionally left blank.
Air Quality Monitoring Programat the Port of Long BeachAnnual Summary Report
Calendar Year 2020
Prepared for:
Port of Long BeachEnvironmental Planning Division
415 West Ocean BoulevardLong Beach, California 90802
Prepared by:
Leidos 4161 Campus Point Court
San Diego, California 92121
June 2021

This page is intentionally left blank.
POLB Air Quality Monitoring Program: CY 2020 Summary Report
June 2021 i
Table of Contents LIST OF ACRONYMS ........................................................................................ IV
1 INTRODUCTION ........................................................................................... 5
1.1 Factors Affecting the Monitoring Data ............................................................................................. 6
1.2 Overview of Pollutant Monitoring Data, CY 2020 ........................................................................... 8
2 MONITORING PROGRAM BACKGROUND ............................................... 11
2.1 Objectives of the Study ......................................................................................................................11
2.2 Location of the Monitoring Stations .................................................................................................12
2.3 Implementation of the Monitoring Program ...................................................................................13 2.3.1 The Monitoring Network ............................................................................................................14 2.3.2 Program Start Dates ....................................................................................................................15
2.4 Real-Time Data Presentation ............................................................................................................15
3 DATA ANALYSIS ........................................................................................ 16
3.1 Data Summary, CY 2020 ...................................................................................................................18 3.1.1 CO Data Summary .....................................................................................................................18 3.1.2 NO2 Data Summary ....................................................................................................................19 3.1.3 O3 Data Summary .......................................................................................................................21 3.1.4 SO2 Data Summary ....................................................................................................................23 3.1.5 PM10 Data Summary...................................................................................................................25 3.1.6 PM2.5 Data Summary ..................................................................................................................28 3.1.7 Black Carbon Data Summary .....................................................................................................30
3.2 Meteorological Data ...........................................................................................................................32
3.3 Quality Assurance Procedures ..........................................................................................................34
3.4 Data Recovery ....................................................................................................................................34
3.5 Air Quality Impacts from External Events......................................................................................34 3.5.1 Air Quality Impacts from COVID-19 Shutdown .......................................................................35 3.5.2 Air Quality Impacts from Regional Wildfires ............................................................................37 3.5.3 Vessels at Anchor .......................................................................................................................40
4 TRENDS ANALYSIS ................................................................................... 40
4.1 Trends in Gaseous Criteria Pollutants .............................................................................................42 4.1.1 CO Concentrations .....................................................................................................................42 4.1.2 NO2 Concentrations ....................................................................................................................43 4.1.3 O3 Concentrations .......................................................................................................................45 4.1.4 SO2 Concentrations ....................................................................................................................46
4.2 Trends in PM10 and PM2.5 Data ........................................................................................................47
5 CONCLUSIONS .......................................................................................... 54
6 REFERENCES ............................................................................................ 56
POLB Air Quality Monitoring Program: CY 2020 Summary Report
June 2021 ii
Table of Figures
Figure 1. 2019 NOX Emissions in the SoCAB (mass percent) ..................................... 6 Figure 2. 2019 PM2.5 Emissions in the SoCAB (mass percent).................................... 6 Figure 3. POLB Container Throughput (TEU), 2005 - 2020 ......................................... 7 Figure 4. Average Monthly Ozone Concentrations (ppm) at the Port Stations and
Selected SCAQMD Stations, CY 2020 ......................................................... 9 Figure 5. Average Monthly BAM PM2.5 Concentrations (µg/m3) at the Port Stations and
Selected SCAQMD Stations, CY 2020 ......................................................... 9 Figure 6. Locations of Air Quality Monitoring Stations at Port of Long Beach ............ 12 Figure 7. 2020 Wind Roses for Port of Long Beach Air Quality Monitoring Program . 33 Figure 8. POLB 24-Hour Rolling Average NO2 Concentrations (Jan - Jun 2020) ....... 35 Figure 9. POLB 1-Hour Average O3 Concentrations October 2020 ........................... 36 Figure 10. Wildfire Smoke Influence on SoCAB (September 2020). ............................ 37 Figure 11. 1-Hour Biomass Burning Percentages (September - November 2020). ..... 39 Figure 12. 1-Hour Average PM10 Concentrations at Port Stations (October 2020). ..... 40 Figure 13. Annual Average CO Concentrations Measured at the Port Stations ........... 42 Figure 14. Annual Average NO2 Concentrations Measured at the Port Stations.......... 43 Figure 15. Annual Average O3 Concentrations Measured at the Port Stations ............ 45 Figure 16. Annual Average SO2 Concentrations Measured at the Port Stations .......... 46 Figure 17. Annual Average PM10 Concentrations Measured at the Port Stations by FRM
Monitors. .................................................................................................... 48 Figure 18. Second Highest 24-hour Average PM10 Concentrations Measured at the Port
Stations by FRM Monitors. ......................................................................... 49 Figure 19. Annual Average PM2.5 Concentrations Measured at the Superblock Station
by the FRM Monitor. ................................................................................... 51 Figure 20. 98th Percentile of the 24-hour Average PM2.5 Concentrations Measured at
the Superblock Station by the FRM Monitor................................................ 53
POLB Air Quality Monitoring Program: CY 2020 Summary Report
June 2021 iii
Table of Tables Table 1. California and National Ambient Air Quality Standards ............................... 16 Table 2. NAAQS Comparison - CO Concentrations Measured at the Port Stations
and the Nearest SCAQMD station. ............................................................. 19 Table 3. CAAQS Comparison - CO Concentrations Measured at the Port Stations
and the Nearest SCAQMD Station. ............................................................ 19 Table 4. NAAQS Comparison - NO2 Concentrations Measured at the Port Stations
and the Nearest SCAQMD Station. ............................................................ 20 Table 5. CAAQS Comparison - NO2 Concentrations Measured at the Port Stations
and the Nearest SCAQMD Station. ............................................................ 21 Table 6. NAAQS Comparison - 3-Year Average of Fourth-highest 8-hour Average O3
Concentrations at the Port Stations and the Nearest SCAQMD Station. ..... 22 Table 7. CAAQS Comparison - Maximum 24-Hour O3 Concentrations at the Port
Stations and the Nearest SCAQMD Station. ............................................... 23 Table 8. NAAQS Comparison - Three-Year Average of the 99th Percentile 1-hour
Average, and Second Highest 3-hour Average SO2 Concentrations at the Port Stations and the Nearest SCAQMD Station. ....................................... 24
Table 9. CAAQS Comparison - Highest 24-hour Average and Highest 1-hour Average SO2 Concentrations at the Port Stations and the Nearest SCAQMD Station. ....................................................................................................... 24
Table 10. NAAQS Comparison - Second Highest FRM 24-hour Average PM10 Concentrations at the Port Stations and the Nearest SCAQMD Station. ..... 27
Table 11. CAAQS Comparison - Highest 24-hour and Annual Average FRM PM10 Concentrations at the Port Stations and the Nearest SCAQMD Station. ..... 27
Table 12. NAAQS Comparison -Three Year Average of 98th Percentile 24-hour and Annual Average PM2.5 Concentrations at the Port Station and the Nearest SCAQMD Station ....................................................................................... 29
Table 13. CAAQS Comparison - Annual Average FRM PM2.5 Concentrations at the Port Station and the Nearest SCAQMD Station .......................................... 29
Table 14. Annual Average Black Carbon (BC) Concentrations at Port Stations .......... 31
POLB Air Quality Monitoring Program: CY 2020 Summary Report
June 2021 iv
List of Acronyms AQ Air Quality BAM Beta Attenuation Monitor CAAP Clean Air Action Program CAAQS California Ambient Air Quality Standard CARB California Air Resources Board CFR Code of Federal Regulations CO Carbon Monoxide DAHS Data Acquisition Handling System DPM Diesel Particulate Matter DRI Desert Research Institute EC Elemental Carbon FEM Federal Equivalent Method FRM Federal Reference Method GP Gull Park µg/m3 Microgram per Meter Cubed NAAQS National Ambient Air Quality Standard NLB North Long Beach NO2 Nitrogen Dioxide NOx Oxides of Nitrogen O3 Ozone OC Organic Carbon PCH Pacific Coast Highway PM Particulate Matter PM2.5 Particulate Matter Less than 2.5 microns in aerodynamic diameter PM10 Particulate Matter Less than 10 microns in aerodynamic diameter POLA Port of Los Angeles POLB Port of Long Beach Port Port of Long Beach PPM Parts per million PAH Polycyclic Aromatic Hydrocarbon QA Quality Assurance ROI Region of Influence SB Superblock SC Suspected Carcinogen SoCAB South Coast Air Basin SCAQMD South Coast Air Quality Management District SFS Sequential Filter Samplers SO2 Sulfur Dioxide SOx Sulfur Oxides TEU Twenty-foot Equivalent Unit USEPA United States Environmental Protection Agency
POLB Air Quality Monitoring Program: CY 2020 Summary Report
June 2021 5
Port of Long Beach Air Quality Monitoring Program
Long Beach
2020 Summary Report
1 Introduction This report for the air quality monitoring program at the Port of Long Beach (Port or POLB) summarizes the data collected during calendar year 2020 (CY 2020) and reviews the preliminary trends shown in the air quality data during the fourteen-year period of record (2007 - 2020). There are four gaseous criteria air pollutants measured on a real-time basis under this program: carbon monoxide (CO), nitrogen dioxide (NO2), sulfur dioxide (SO2), and ozone (O3). In addition, particulate matter (PM) is measured at two size thresholds, PM less than 10 micrometers and PM less than 2.5 micrometers (PM10 and PM2.5, respectively). PM measurements are conducted using two methods: (a) traditional filter-based samplers which are the Federal Reference Method (FRM); and (b) on a continuous basis using beta attenuation monitors (BAM). Black Carbon (BC), a surrogate for diesel particulate matter (DPM), has also been measured on a continuous basis since September 2012, using a specialized instrument (Aethalometer). In addition, meteorological parameters are continuously measured. Data from the program are available for public review at the San Pedro Bay Ports Clean Air Action Plan website: http://www.cleanairactionplan.org. The data collected at the Port’s two monitoring stations during CY 2020 were averaged and compared to the National Ambient Air Quality Standards (NAAQS) and California Ambient Air Quality Standards (CAAQS) established for each pollutant over specific averaging periods (e.g., 1 hour, 24 hours, annual). While such comparisons are presented, this report does not make any representations as to compliance with NAAQS or CAAQS. The U.S. Environmental Protection Agency (USEPA) makes NAAQS compliance determinations with input from state and regional air agencies. The California Air Resources Board (CARB) makes CAAQS compliance determinations. For the South Coast Air Basin (SoCAB), which includes the Los Angeles metropolitan region, the South Coast Air Quality Management District (SCAQMD) is responsible for operating the air quality monitoring stations, which are used for those compliance demonstrations. While the Port’s monitoring stations are operated in accordance with the same federal and state regulations and guidelines, the Port’s stations are outside the official monitoring network and are not used in compliance determinations. Data presented in this report from SCAQMD monitoring stations are available publicly on the CARB’s AQMIS2 website (CARB, 2020). These data on the AQMIS2 website may not have undergone full quality assurance (QA) review, and should therefore be used for comparison purposes only. Additionally, there may be small differences between the sums of individual POLB and SCAQMD values in the tables and the totals shown at the bottom of the tables. These differences are a result of rounding of the individual values in the tables.
POLB Air Quality Monitoring Program: CY 2020 Summary Report
June 2021 6
1.1 Factors Affecting the Monitoring Data
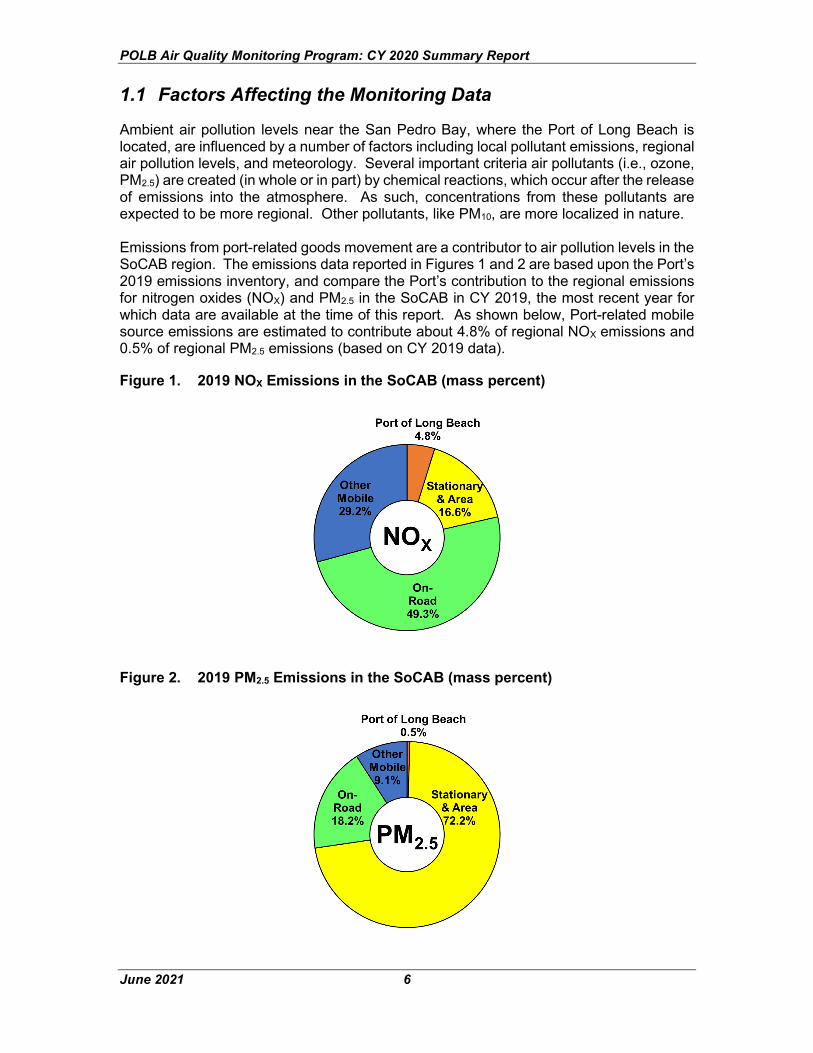
Ambient air pollution levels near the San Pedro Bay, where the Port of Long Beach is located, are influenced by a number of factors including local pollutant emissions, regional air pollution levels, and meteorology. Several important criteria air pollutants (i.e., ozone, PM2.5) are created (in whole or in part) by chemical reactions, which occur after the release of emissions into the atmosphere. As such, concentrations from these pollutants are expected to be more regional. Other pollutants, like PM10, are more localized in nature. Emissions from port-related goods movement are a contributor to air pollution levels in the SoCAB region. The emissions data reported in Figures 1 and 2 are based upon the Port’s 2019 emissions inventory, and compare the Port’s contribution to the regional emissions for nitrogen oxides (NOX) and PM2.5 in the SoCAB in CY 2019, the most recent year for which data are available at the time of this report. As shown below, Port-related mobile source emissions are estimated to contribute about 4.8% of regional NOX emissions and 0.5% of regional PM2.5 emissions (based on CY 2019 data). Figure 1. 2019 NOX Emissions in the SoCAB (mass percent)
Figure 2. 2019 PM2.5 Emissions in the SoCAB (mass percent)
POLB Air Quality Monitoring Program: CY 2020 Summary Report
June 2021 7
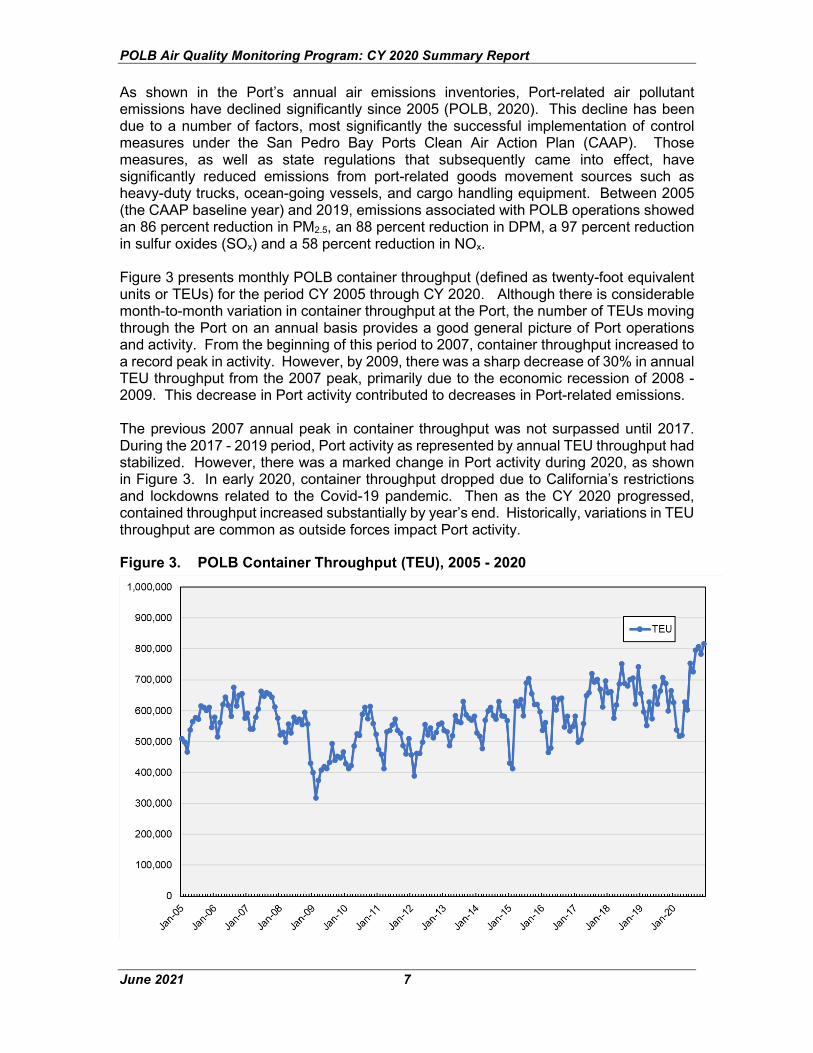
As shown in the Port’s annual air emissions inventories, Port-related air pollutant emissions have declined significantly since 2005 (POLB, 2020). This decline has been due to a number of factors, most significantly the successful implementation of control measures under the San Pedro Bay Ports Clean Air Action Plan (CAAP). Those measures, as well as state regulations that subsequently came into effect, have significantly reduced emissions from port-related goods movement sources such as heavy-duty trucks, ocean-going vessels, and cargo handling equipment. Between 2005 (the CAAP baseline year) and 2019, emissions associated with POLB operations showed an 86 percent reduction in PM2.5, an 88 percent reduction in DPM, a 97 percent reduction in sulfur oxides (SOx) and a 58 percent reduction in NOx. Figure 3 presents monthly POLB container throughput (defined as twenty-foot equivalent units or TEUs) for the period CY 2005 through CY 2020. Although there is considerable month-to-month variation in container throughput at the Port, the number of TEUs moving through the Port on an annual basis provides a good general picture of Port operations and activity. From the beginning of this period to 2007, container throughput increased to a record peak in activity. However, by 2009, there was a sharp decrease of 30% in annual TEU throughput from the 2007 peak, primarily due to the economic recession of 2008 - 2009. This decrease in Port activity contributed to decreases in Port-related emissions. The previous 2007 annual peak in container throughput was not surpassed until 2017. During the 2017 - 2019 period, Port activity as represented by annual TEU throughput had stabilized. However, there was a marked change in Port activity during 2020, as shown in Figure 3. In early 2020, container throughput dropped due to California’s restrictions and lockdowns related to the Covid-19 pandemic. Then as the CY 2020 progressed, contained throughput increased substantially by year’s end. Historically, variations in TEU throughput are common as outside forces impact Port activity.
Figure 3. POLB Container Throughput (TEU), 2005 - 2020

POLB Air Quality Monitoring Program: CY 2020 Summary Report
June 2021 8
Lastly, meteorology and other external events can have a significant influence on regional air pollution levels from year-to-year. For example, record California wildfires in the late summer and fall of 2020 affected air pollution levels during the latter half of 2020. The impact of wildfire emissions on regional air quality are discussed in more detail in Section 3.3, Air Quality Impacts from External Events. So while CAAP measures and state regulations have decreased emissions, it is not known how much of any decrease in ambient air pollutant concentrations measured at the Port’s air monitoring stations can be specifically attributed to goods movement-focused emission control measures under the CAAP versus state law.
1.2 Overview of Pollutant Monitoring Data, CY 2020
The Port maintains two air monitoring stations, one at Gull Park (Outer Harbor) and one at Superblock (Inner Harbor). CO and SO2 concentrations historically have been low throughout the monitoring program and both pollutants’ measurements continued to be very low at both monitoring stations during CY 2020. Historically, NO2 concentrations have demonstrated more year-to-year variability across the monitoring period; however during CY 2020, NO2 levels at both Port monitoring stations remained low and well below their respective NAAQS and CAAQS standards. Other pollutant concentrations, particularly O3 and PM, can show significant variability from year-to-year as they are traditionally more regional in nature and more subject to changes in emissions from external events. This was particularly evident during CY 2020 as the SoCAB was impacted by a variety of external events due to changes in economic and transportation activity from the COVID-19 restrictions, as well as the historic 2020 wildfire season. A short summary overview of O3 and PM measurements, which were impacted by these external events during CY 2020, is provided here; a more detailed analysis on all pollutants measured by the monitoring program are provided in Section 3, Data Analysis. As shown in Figure 4, O3 levels measured at Port stations during 2020 were within the range of concentrations observed at other SCAQMD stations in the SoCAB. The monthly average O3 concentrations presented in Figure 4 illustrate elevated concentrations at all stations during the spring and summer months, typically known as ‘ozone season’. The photochemical reactions required to produce O3 are stronger during the spring/summer months, due to increasing incoming solar irradiance, leading to higher O3 levels across the SoCAB. During the fall months, O3 levels tend to decrease as the sun moves into the southern hemisphere and incoming solar irradiance declines into the winter months.

POLB Air Quality Monitoring Program: CY 2020 Summary Report
June 2021 9
Figure 4. Average Monthly Ozone Concentrations (ppm) at Port Stations and Select SCAQMD Stations, CY 2020
During CY 2020, as observed in Figure 4 above, O3 levels at both Port and SCAQMD monitors remain elevated throughout the fall months as unusually stagnant air and abnormally hot temperatures led to the large number of days with high O3 concentrations (SCAQMD, 2021). Given the similarity of O3 levels measured across the SoCAB during this period, it is likely that the meteorological anomalies (noted above) combined with changes in O3 precursor emissions (primarily VOCs from uncontrolled wildfires) contributed to the elevated O3 levels measured during the latter portion of CY 2020. Even with the anomalous events of 2020, O3 concentrations at both Port monitoring stations remained below the 8-hour NAAQS for the reporting period. During October 2020, outside of the typical ‘ozone season’, the 1-hour and 8-hour O3 CAAQS were both exceeded at the Gull Park station, while the Superblock station exceeded the maximum 1-hour O3 CAAQS. The time period when these O3 exceedances occurred makes it likely that the anomalous events noted above primarily contributed to the elevated O3 levels at the Port’s monitoring stations, rather than changes in localized emission sources. Figure 5 provides a similar comparison for PM2.5 levels measured at Port and SCAQMD stations, using real-time BAM instruments. In contrast to O3 levels, PM2.5 concentrations measured in the SoCAB do not always show a distinct seasonal pattern as PM2.5 levels can demonstrate month-to-month variability. However, in general, PM2.5 concentrations are tend to be lower during the spring/summer months and typically increase into the fall/winter months.
POLB Air Quality Monitoring Program: CY 2020 Summary Report
June 2021 10
Figure 5. Average Monthly BAM PM2.5 Concentrations (µg/m3) at the Port Stations and Selected SCAQMD Stations, CY 2020
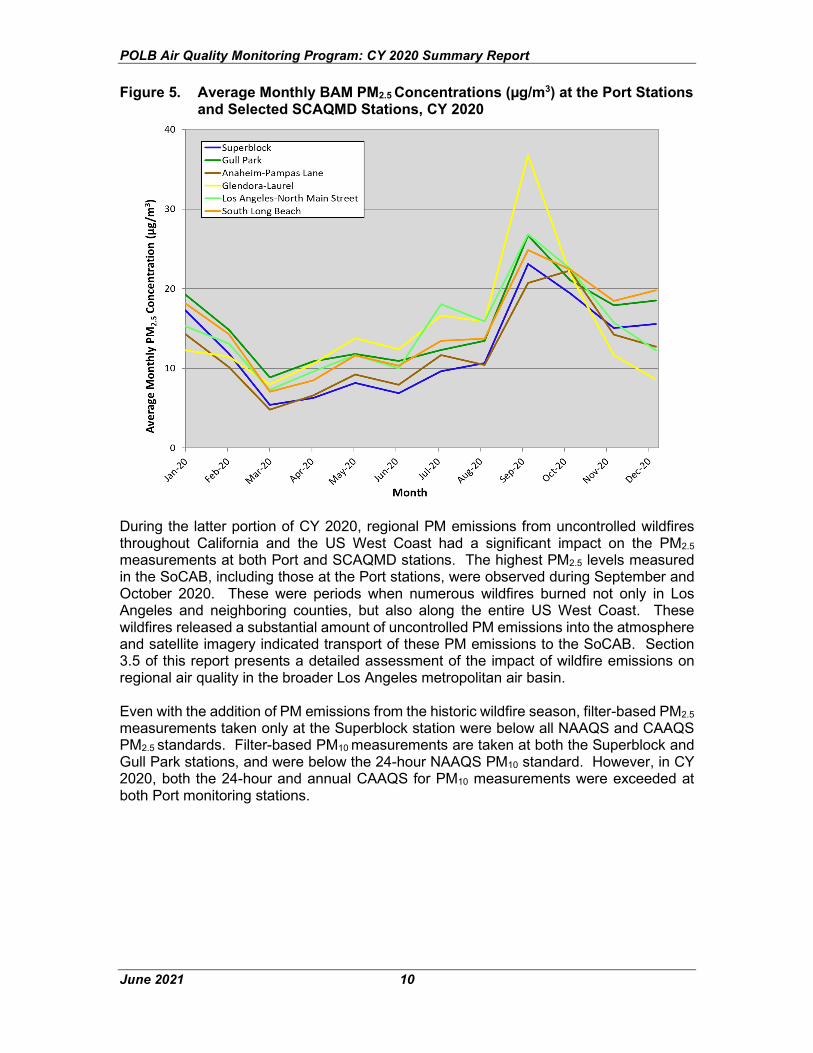
During the latter portion of CY 2020, regional PM emissions from uncontrolled wildfires throughout California and the US West Coast had a significant impact on the PM2.5 measurements at both Port and SCAQMD stations. The highest PM2.5 levels measured in the SoCAB, including those at the Port stations, were observed during September and October 2020. These were periods when numerous wildfires burned not only in Los Angeles and neighboring counties, but also along the entire US West Coast. These wildfires released a substantial amount of uncontrolled PM emissions into the atmosphere and satellite imagery indicated transport of these PM emissions to the SoCAB. Section 3.5 of this report presents a detailed assessment of the impact of wildfire emissions on regional air quality in the broader Los Angeles metropolitan air basin. Even with the addition of PM emissions from the historic wildfire season, filter-based PM2.5 measurements taken only at the Superblock station were below all NAAQS and CAAQS PM2.5 standards. Filter-based PM10 measurements are taken at both the Superblock and Gull Park stations, and were below the 24-hour NAAQS PM10 standard. However, in CY 2020, both the 24-hour and annual CAAQS for PM10 measurements were exceeded at both Port monitoring stations.
POLB Air Quality Monitoring Program: CY 2020 Summary Report
June 2021 11
2 Monitoring Program Background 2.1 Objectives of the Study
The Port of Long Beach developed a plan for an air monitoring program in 2005 to collect representative ambient air quality and meteorological data within the area of the Port’s Harbor District. Monitoring began in late 2006. The Port’s network consists of two monitoring stations, located in the Inner Harbor and the Outer Harbor areas. Data on the following parameters are being collected:
• Real-time measurement of ambient air quality concentrations for nitrogen dioxide (NO2), ozone (O3), carbon monoxide (CO), sulfur dioxide (SO2), particulate matter (PM) less than 10 microns in diameter (PM10), particulate matter less than 2.5 microns in diameter (PM2.5), and black carbon (BC).
• Integrated 24-hour ambient measurement of PM10 and PM2.5 concentrations, using traditional filter-based samplers.
• Real-time measurement of meteorological parameters, including wind direction, wind speed, ambient temperature, humidity, barometric pressure, precipitation, and solar radiation.
This annual report documents the findings of this program for January 1, 2020 through December 31, 2020 and compares the CY 2020 data with the historical data collected during the fourteen-year period of record. The goals of this program are to compare air quality data from the area surrounding the Port with the National and California ambient air quality standards and communicate the air quality information to the communities surrounding the Port. This monitoring program is an integral part of the Port’s commitment to improve the air quality through the CAAP. This annual report marks the fourteenth year (2007 - 2020) of the Port’s ambient air quality monitoring program. The environmental information collected by this program is used to provide a better understanding of the air quality and meteorological conditions in the Port area, as well as to provide feedback on the Port’s air quality improvement efforts. The extended period of data collection for this monitoring program has allowed for identification of various trends in the ambient air quality surrounding the Port.
POLB Air Quality Monitoring Program: CY 2020 Summary Report
June 2021 12
2.2 Location of the Monitoring Stations
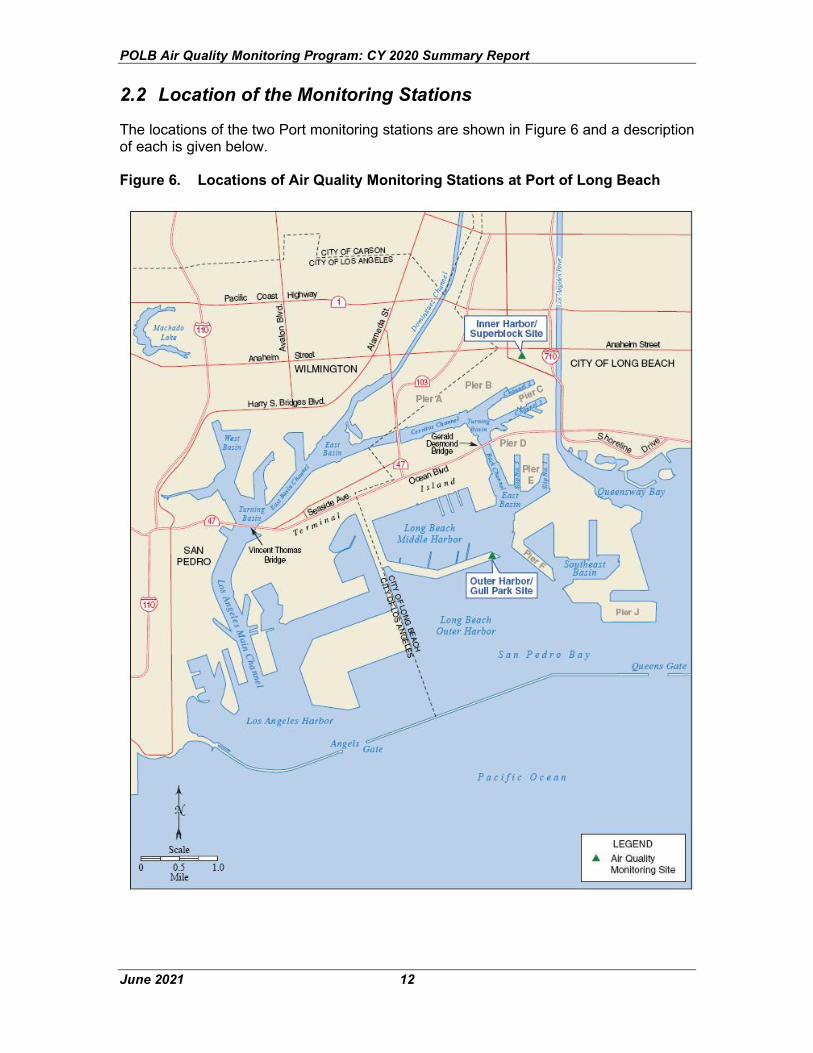
The locations of the two Port monitoring stations are shown in Figure 6 and a description of each is given below. Figure 6. Locations of Air Quality Monitoring Stations at Port of Long Beach
POLB Air Quality Monitoring Program: CY 2020 Summary Report
June 2021 13
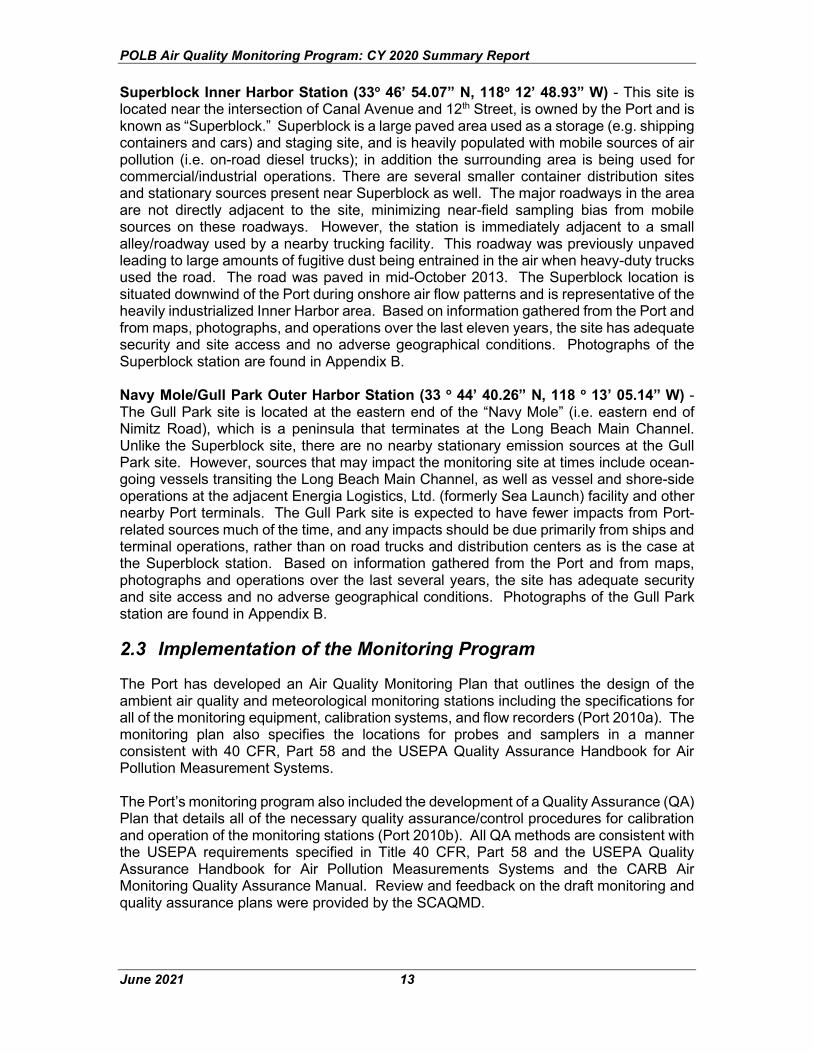
Superblock Inner Harbor Station (33o 46’ 54.07” N, 118o 12’ 48.93” W) - This site is located near the intersection of Canal Avenue and 12th Street, is owned by the Port and is known as “Superblock.” Superblock is a large paved area used as a storage (e.g. shipping containers and cars) and staging site, and is heavily populated with mobile sources of air pollution (i.e. on-road diesel trucks); in addition the surrounding area is being used for commercial/industrial operations. There are several smaller container distribution sites and stationary sources present near Superblock as well. The major roadways in the area are not directly adjacent to the site, minimizing near-field sampling bias from mobile sources on these roadways. However, the station is immediately adjacent to a small alley/roadway used by a nearby trucking facility. This roadway was previously unpaved leading to large amounts of fugitive dust being entrained in the air when heavy-duty trucks used the road. The road was paved in mid-October 2013. The Superblock location is situated downwind of the Port during onshore air flow patterns and is representative of the heavily industrialized Inner Harbor area. Based on information gathered from the Port and from maps, photographs, and operations over the last eleven years, the site has adequate security and site access and no adverse geographical conditions. Photographs of the Superblock station are found in Appendix B.
Navy Mole/Gull Park Outer Harbor Station (33 o 44’ 40.26” N, 118 o 13’ 05.14” W) - The Gull Park site is located at the eastern end of the “Navy Mole” (i.e. eastern end of Nimitz Road), which is a peninsula that terminates at the Long Beach Main Channel. Unlike the Superblock site, there are no nearby stationary emission sources at the Gull Park site. However, sources that may impact the monitoring site at times include ocean-going vessels transiting the Long Beach Main Channel, as well as vessel and shore-side operations at the adjacent Energia Logistics, Ltd. (formerly Sea Launch) facility and other nearby Port terminals. The Gull Park site is expected to have fewer impacts from Port-related sources much of the time, and any impacts should be due primarily from ships and terminal operations, rather than on road trucks and distribution centers as is the case at the Superblock station. Based on information gathered from the Port and from maps, photographs and operations over the last several years, the site has adequate security and site access and no adverse geographical conditions. Photographs of the Gull Park station are found in Appendix B.
2.3 Implementation of the Monitoring Program
The Port has developed an Air Quality Monitoring Plan that outlines the design of the ambient air quality and meteorological monitoring stations including the specifications for all of the monitoring equipment, calibration systems, and flow recorders (Port 2010a). The monitoring plan also specifies the locations for probes and samplers in a manner consistent with 40 CFR, Part 58 and the USEPA Quality Assurance Handbook for Air Pollution Measurement Systems. The Port’s monitoring program also included the development of a Quality Assurance (QA) Plan that details all of the necessary quality assurance/control procedures for calibration and operation of the monitoring stations (Port 2010b). All QA methods are consistent with the USEPA requirements specified in Title 40 CFR, Part 58 and the USEPA Quality Assurance Handbook for Air Pollution Measurements Systems and the CARB Air Monitoring Quality Assurance Manual. Review and feedback on the draft monitoring and quality assurance plans were provided by the SCAQMD.
POLB Air Quality Monitoring Program: CY 2020 Summary Report
June 2021 14
2.3.1 The Monitoring Network
As previously mentioned, the Port’s monitoring program collects three different types of data: (1) air pollutant concentrations measured by real-time analyzers, (2) particulate matter (PM) concentrations measured by integrated filter-based samplers, and (3) meteorological data from real-time measurements. Each of the monitoring stations has the following four components.
2.3.1.1 Integrated 24-hour PM Monitoring
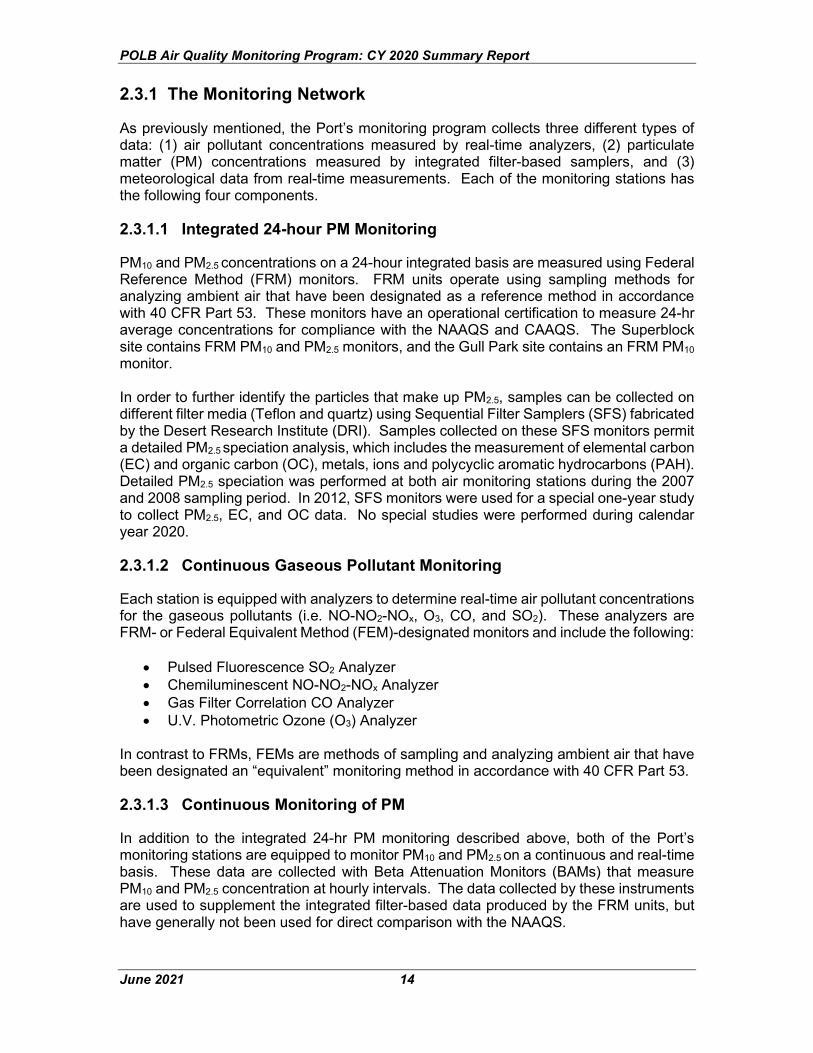
PM10 and PM2.5 concentrations on a 24-hour integrated basis are measured using Federal Reference Method (FRM) monitors. FRM units operate using sampling methods for analyzing ambient air that have been designated as a reference method in accordance with 40 CFR Part 53. These monitors have an operational certification to measure 24-hr average concentrations for compliance with the NAAQS and CAAQS. The Superblock site contains FRM PM10 and PM2.5 monitors, and the Gull Park site contains an FRM PM10 monitor.
In order to further identify the particles that make up PM2.5, samples can be collected on different filter media (Teflon and quartz) using Sequential Filter Samplers (SFS) fabricated by the Desert Research Institute (DRI). Samples collected on these SFS monitors permit a detailed PM2.5 speciation analysis, which includes the measurement of elemental carbon (EC) and organic carbon (OC), metals, ions and polycyclic aromatic hydrocarbons (PAH). Detailed PM2.5 speciation was performed at both air monitoring stations during the 2007 and 2008 sampling period. In 2012, SFS monitors were used for a special one-year study to collect PM2.5, EC, and OC data. No special studies were performed during calendar year 2020.
2.3.1.2 Continuous Gaseous Pollutant Monitoring
Each station is equipped with analyzers to determine real-time air pollutant concentrations for the gaseous pollutants (i.e. NO-NO2-NOx, O3, CO, and SO2). These analyzers are FRM- or Federal Equivalent Method (FEM)-designated monitors and include the following:
• Pulsed Fluorescence SO2 Analyzer • Chemiluminescent NO-NO2-NOx Analyzer • Gas Filter Correlation CO Analyzer • U.V. Photometric Ozone (O3) Analyzer
In contrast to FRMs, FEMs are methods of sampling and analyzing ambient air that have been designated an “equivalent” monitoring method in accordance with 40 CFR Part 53.
2.3.1.3 Continuous Monitoring of PM
In addition to the integrated 24-hr PM monitoring described above, both of the Port’s monitoring stations are equipped to monitor PM10 and PM2.5 on a continuous and real-time basis. These data are collected with Beta Attenuation Monitors (BAMs) that measure PM10 and PM2.5 concentration at hourly intervals. The data collected by these instruments are used to supplement the integrated filter-based data produced by the FRM units, but have generally not been used for direct comparison with the NAAQS.
POLB Air Quality Monitoring Program: CY 2020 Summary Report
June 2021 15
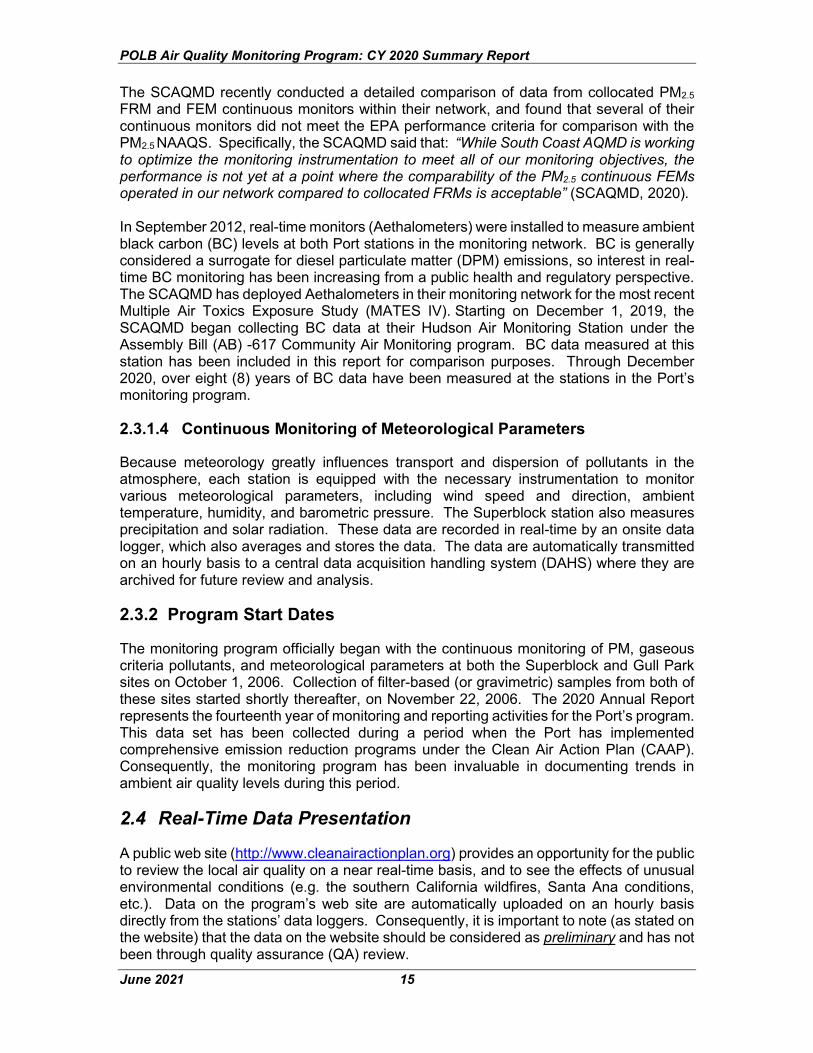
The SCAQMD recently conducted a detailed comparison of data from collocated PM2.5 FRM and FEM continuous monitors within their network, and found that several of their continuous monitors did not meet the EPA performance criteria for comparison with the PM2.5 NAAQS. Specifically, the SCAQMD said that: “While South Coast AQMD is working to optimize the monitoring instrumentation to meet all of our monitoring objectives, the performance is not yet at a point where the comparability of the PM2.5 continuous FEMs operated in our network compared to collocated FRMs is acceptable” (SCAQMD, 2020). In September 2012, real-time monitors (Aethalometers) were installed to measure ambient black carbon (BC) levels at both Port stations in the monitoring network. BC is generally considered a surrogate for diesel particulate matter (DPM) emissions, so interest in real-time BC monitoring has been increasing from a public health and regulatory perspective. The SCAQMD has deployed Aethalometers in their monitoring network for the most recent Multiple Air Toxics Exposure Study (MATES IV). Starting on December 1, 2019, the SCAQMD began collecting BC data at their Hudson Air Monitoring Station under the Assembly Bill (AB) -617 Community Air Monitoring program. BC data measured at this station has been included in this report for comparison purposes. Through December 2020, over eight (8) years of BC data have been measured at the stations in the Port’s monitoring program.
2.3.1.4 Continuous Monitoring of Meteorological Parameters
Because meteorology greatly influences transport and dispersion of pollutants in the atmosphere, each station is equipped with the necessary instrumentation to monitor various meteorological parameters, including wind speed and direction, ambient temperature, humidity, and barometric pressure. The Superblock station also measures precipitation and solar radiation. These data are recorded in real-time by an onsite data logger, which also averages and stores the data. The data are automatically transmitted on an hourly basis to a central data acquisition handling system (DAHS) where they are archived for future review and analysis.
2.3.2 Program Start Dates
The monitoring program officially began with the continuous monitoring of PM, gaseous criteria pollutants, and meteorological parameters at both the Superblock and Gull Park sites on October 1, 2006. Collection of filter-based (or gravimetric) samples from both of these sites started shortly thereafter, on November 22, 2006. The 2020 Annual Report represents the fourteenth year of monitoring and reporting activities for the Port’s program. This data set has been collected during a period when the Port has implemented comprehensive emission reduction programs under the Clean Air Action Plan (CAAP). Consequently, the monitoring program has been invaluable in documenting trends in ambient air quality levels during this period.
2.4 Real-Time Data Presentation
A public web site (http://www.cleanairactionplan.org) provides an opportunity for the public to review the local air quality on a near real-time basis, and to see the effects of unusual environmental conditions (e.g. the southern California wildfires, Santa Ana conditions, etc.). Data on the program’s web site are automatically uploaded on an hourly basis directly from the stations’ data loggers. Consequently, it is important to note (as stated on the website) that the data on the website should be considered as preliminary and has not been through quality assurance (QA) review.
POLB Air Quality Monitoring Program: CY 2020 Summary Report
June 2021 16
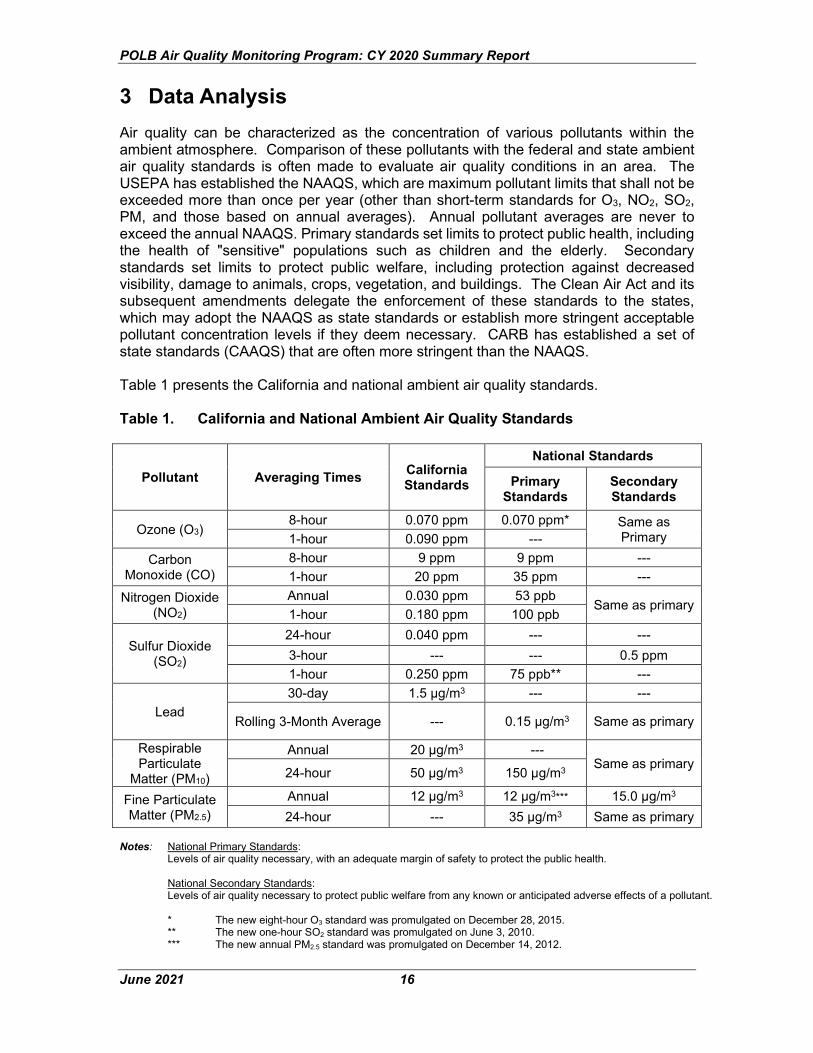
3 Data Analysis Air quality can be characterized as the concentration of various pollutants within the ambient atmosphere. Comparison of these pollutants with the federal and state ambient air quality standards is often made to evaluate air quality conditions in an area. The USEPA has established the NAAQS, which are maximum pollutant limits that shall not be exceeded more than once per year (other than short-term standards for O3, NO2, SO2, PM, and those based on annual averages). Annual pollutant averages are never to exceed the annual NAAQS. Primary standards set limits to protect public health, including the health of "sensitive" populations such as children and the elderly. Secondary standards set limits to protect public welfare, including protection against decreased visibility, damage to animals, crops, vegetation, and buildings. The Clean Air Act and its subsequent amendments delegate the enforcement of these standards to the states, which may adopt the NAAQS as state standards or establish more stringent acceptable pollutant concentration levels if they deem necessary. CARB has established a set of state standards (CAAQS) that are often more stringent than the NAAQS. Table 1 presents the California and national ambient air quality standards. Table 1. California and National Ambient Air Quality Standards
Pollutant Averaging Times California Standards
National Standards
Primary Standards
Secondary Standards
Ozone (O3) 8-hour 0.070 ppm 0.070 ppm* Same as
Primary 1-hour 0.090 ppm --- Carbon
Monoxide (CO) 8-hour 9 ppm 9 ppm --- 1-hour 20 ppm 35 ppm ---
Nitrogen Dioxide (NO2)
Annual 0.030 ppm 53 ppb Same as primary
1-hour 0.180 ppm 100 ppb
Sulfur Dioxide (SO2)
24-hour 0.040 ppm --- --- 3-hour --- --- 0.5 ppm 1-hour 0.250 ppm 75 ppb** ---
Lead 30-day 1.5 µg/m3 --- ---
Rolling 3-Month Average --- 0.15 µg/m3 Same as primary
Respirable Particulate
Matter (PM10)
Annual 20 µg/m3 --- Same as primary
24-hour 50 µg/m3 150 µg/m3
Fine Particulate Matter (PM2.5)
Annual 12 µg/m3 12 µg/m3*** 15.0 µg/m3 24-hour --- 35 µg/m3 Same as primary
Notes: National Primary Standards: Levels of air quality necessary, with an adequate margin of safety to protect the public health. National Secondary Standards: Levels of air quality necessary to protect public welfare from any known or anticipated adverse effects of a pollutant. * The new eight-hour O3 standard was promulgated on December 28, 2015. ** The new one-hour SO2 standard was promulgated on June 3, 2010. *** The new annual PM2.5 standard was promulgated on December 14, 2012.
POLB Air Quality Monitoring Program: CY 2020 Summary Report
June 2021 17
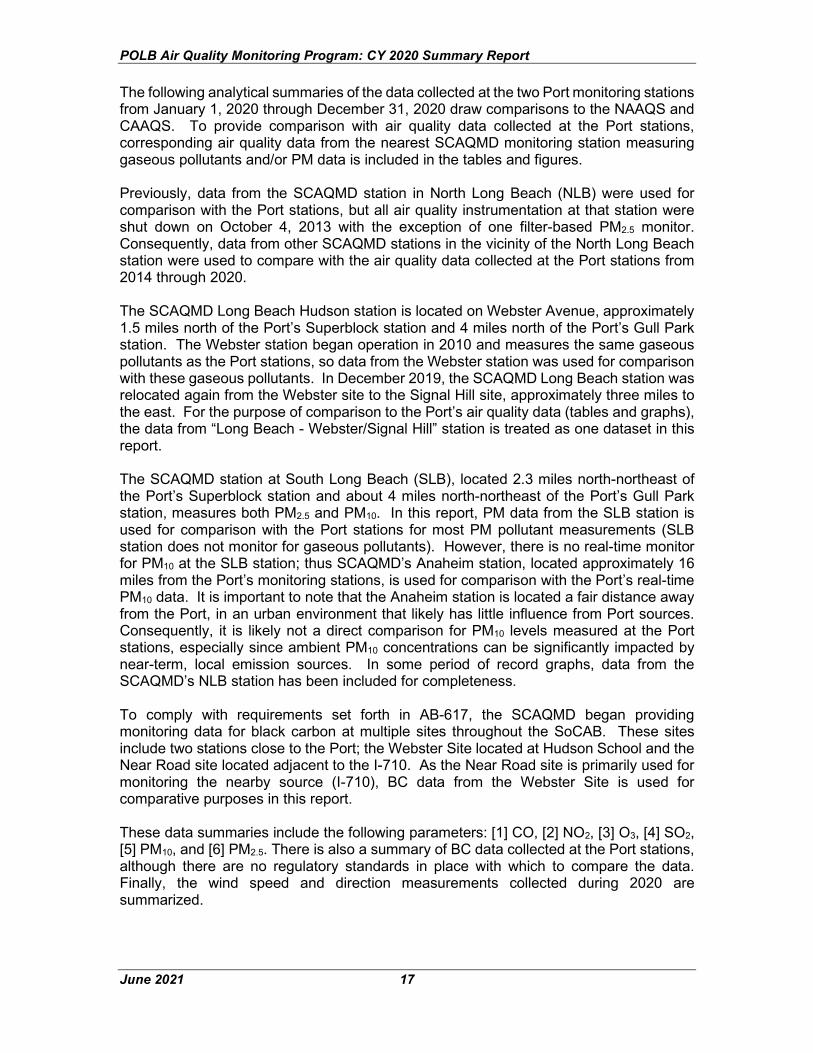
The following analytical summaries of the data collected at the two Port monitoring stations from January 1, 2020 through December 31, 2020 draw comparisons to the NAAQS and CAAQS. To provide comparison with air quality data collected at the Port stations, corresponding air quality data from the nearest SCAQMD monitoring station measuring gaseous pollutants and/or PM data is included in the tables and figures. Previously, data from the SCAQMD station in North Long Beach (NLB) were used for comparison with the Port stations, but all air quality instrumentation at that station were shut down on October 4, 2013 with the exception of one filter-based PM2.5 monitor. Consequently, data from other SCAQMD stations in the vicinity of the North Long Beach station were used to compare with the air quality data collected at the Port stations from 2014 through 2020. The SCAQMD Long Beach Hudson station is located on Webster Avenue, approximately 1.5 miles north of the Port’s Superblock station and 4 miles north of the Port’s Gull Park station. The Webster station began operation in 2010 and measures the same gaseous pollutants as the Port stations, so data from the Webster station was used for comparison with these gaseous pollutants. In December 2019, the SCAQMD Long Beach station was relocated again from the Webster site to the Signal Hill site, approximately three miles to the east. For the purpose of comparison to the Port’s air quality data (tables and graphs), the data from “Long Beach - Webster/Signal Hill” station is treated as one dataset in this report. The SCAQMD station at South Long Beach (SLB), located 2.3 miles north-northeast of the Port’s Superblock station and about 4 miles north-northeast of the Port’s Gull Park station, measures both PM2.5 and PM10. In this report, PM data from the SLB station is used for comparison with the Port stations for most PM pollutant measurements (SLB station does not monitor for gaseous pollutants). However, there is no real-time monitor for PM10 at the SLB station; thus SCAQMD’s Anaheim station, located approximately 16 miles from the Port’s monitoring stations, is used for comparison with the Port’s real-time PM10 data. It is important to note that the Anaheim station is located a fair distance away from the Port, in an urban environment that likely has little influence from Port sources. Consequently, it is likely not a direct comparison for PM10 levels measured at the Port stations, especially since ambient PM10 concentrations can be significantly impacted by near-term, local emission sources. In some period of record graphs, data from the SCAQMD’s NLB station has been included for completeness. To comply with requirements set forth in AB-617, the SCAQMD began providing monitoring data for black carbon at multiple sites throughout the SoCAB. These sites include two stations close to the Port; the Webster Site located at Hudson School and the Near Road site located adjacent to the I-710. As the Near Road site is primarily used for monitoring the nearby source (I-710), BC data from the Webster Site is used for comparative purposes in this report. These data summaries include the following parameters: [1] CO, [2] NO2, [3] O3, [4] SO2, [5] PM10, and [6] PM2.5. There is also a summary of BC data collected at the Port stations, although there are no regulatory standards in place with which to compare the data. Finally, the wind speed and direction measurements collected during 2020 are summarized.

POLB Air Quality Monitoring Program: CY 2020 Summary Report
June 2021 18
In addition to written summaries, the monitoring data are presented in several ways:
1. Presentation of wind roses, which visually depict the distribution of winds at a site showing speed, direction and frequency (Figures A-1 and A-2).
2. Presentation of the air quality data in graphs (Figures A-3 through A-11). 3. Presentation of the air quality data in tables (Tables A-1 through A-29).
Since the tabular and graphic data presentations are quite extensive, most of the figures and many of the graphs are included in Appendix A. The figures and tables that have been included as part of Appendix A are denoted by the letter “A” in front of the number designation; for example, Figure A-1 and Table A-1 can be found in Appendix A. The following sections provide measured pollutant concentrations at the Superblock and Gull Park sites, compared with the relevant standards for each pollutant.
3.1 Data Summary, CY 2020
3.1.1 CO Data Summary
Figure A-3 shows average monthly concentrations from 2007 - 2020. Graphs of average monthly pollutant concentrations have been selected as a convenient scale for illustration of the main features in the data set, rather than as a comparison of regulatory standards. Highlights of this graph are:
• Average CO concentrations are low for this pollutant throughout the period.
• There is a slight increase in CO concentrations during the winter months, presumably due to the light wind conditions and surface-based temperature inversions commonly present during this time of year, which tend to trap pollutants in the lower atmosphere.
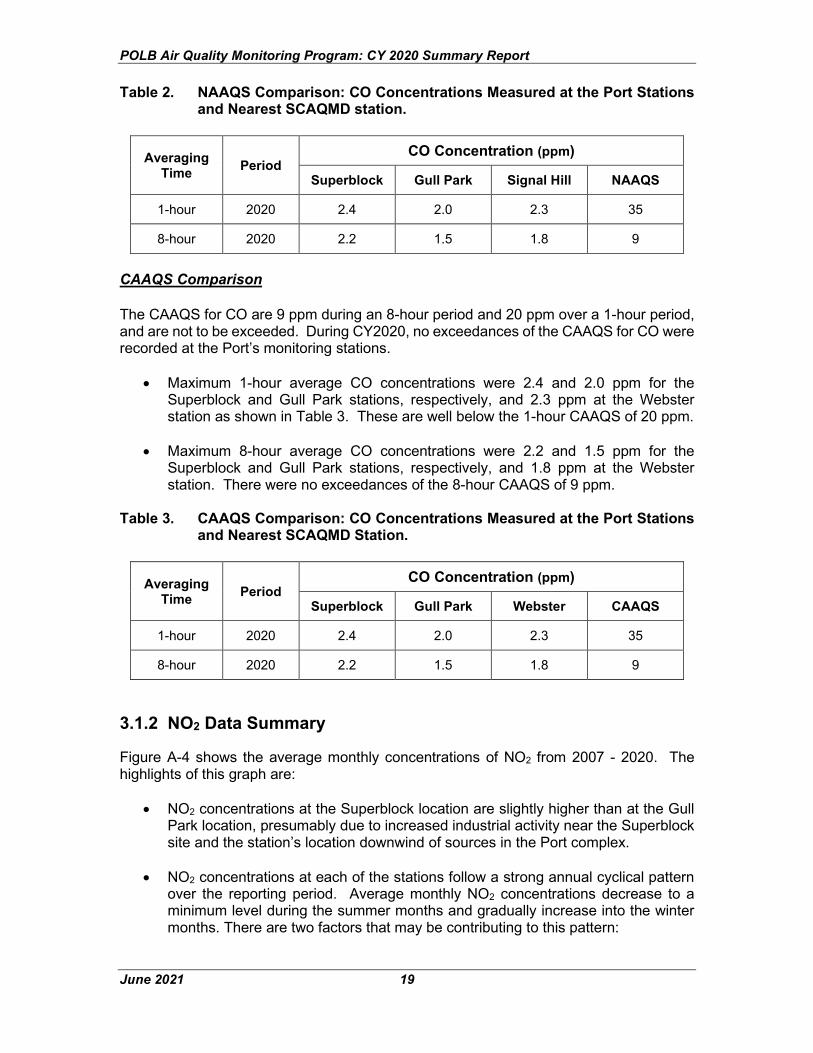
CO averages are presented for the Port’s Superblock and Gull Park stations, and the SCAQMD’s Webster station in Tables A-1 through A-3. NAAQS Comparison The NAAQS for CO are 9 ppm over an 8-hour period and 35 ppm over a 1-hour period, and are not to be exceeded more than once per year. During CY 2020, no exceedances of the NAAQS for CO were recorded at the Port’s monitoring stations.
• Maximum 1-hour average CO concentrations were 2.4 and 2.0 ppm for the
Superblock and Gull Park stations, respectively, and 2.3 ppm at the Webster station as shown in Table 2. These are well below the 1-hour NAAQS of 35 ppm.
• Maximum 8-hour average CO concentrations were 2.2 and 1.5 ppm for the
Superblock and Gull Park stations, respectively, and 1.8 ppm at the Webster station as shown in Table 2. Thus, there were no exceedances of the 8-hour NAAQS of 9 ppm.
POLB Air Quality Monitoring Program: CY 2020 Summary Report
June 2021 19
Table 2. NAAQS Comparison: CO Concentrations Measured at the Port Stations and Nearest SCAQMD station.
Averaging Time Period
CO Concentration (ppm)
Superblock Gull Park Signal Hill NAAQS
1-hour 2020 2.4 2.0 2.3 35
8-hour 2020 2.2 1.5 1.8 9
CAAQS Comparison The CAAQS for CO are 9 ppm during an 8-hour period and 20 ppm over a 1-hour period, and are not to be exceeded. During CY2020, no exceedances of the CAAQS for CO were recorded at the Port’s monitoring stations.
• Maximum 1-hour average CO concentrations were 2.4 and 2.0 ppm for the Superblock and Gull Park stations, respectively, and 2.3 ppm at the Webster station as shown in Table 3. These are well below the 1-hour CAAQS of 20 ppm.
• Maximum 8-hour average CO concentrations were 2.2 and 1.5 ppm for the
Superblock and Gull Park stations, respectively, and 1.8 ppm at the Webster station. There were no exceedances of the 8-hour CAAQS of 9 ppm.
Table 3. CAAQS Comparison: CO Concentrations Measured at the Port Stations
and Nearest SCAQMD Station.
Averaging Time Period
CO Concentration (ppm)
Superblock Gull Park Webster CAAQS
1-hour 2020 2.4 2.0 2.3 35
8-hour 2020 2.2 1.5 1.8 9
3.1.2 NO2 Data Summary
Figure A-4 shows the average monthly concentrations of NO2 from 2007 - 2020. The highlights of this graph are:
• NO2 concentrations at the Superblock location are slightly higher than at the Gull
Park location, presumably due to increased industrial activity near the Superblock site and the station’s location downwind of sources in the Port complex.
• NO2 concentrations at each of the stations follow a strong annual cyclical pattern over the reporting period. Average monthly NO2 concentrations decrease to a minimum level during the summer months and gradually increase into the winter months. There are two factors that may be contributing to this pattern:
POLB Air Quality Monitoring Program: CY 2020 Summary Report
June 2021 20
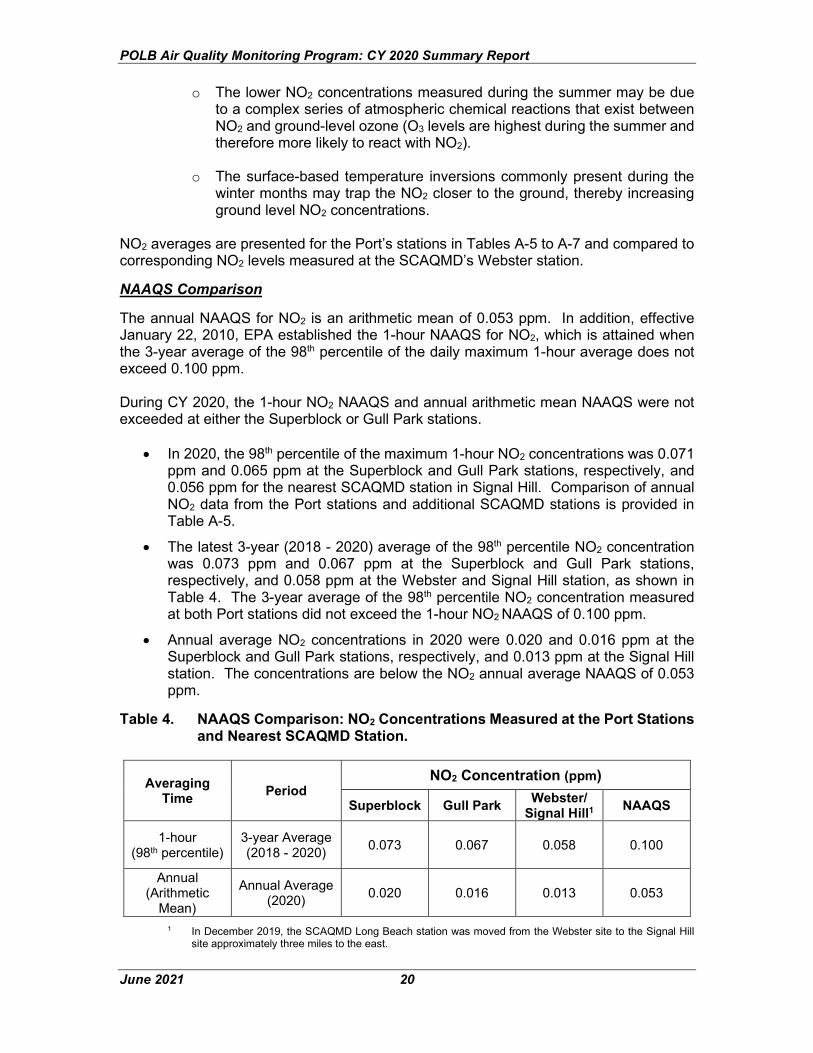
o The lower NO2 concentrations measured during the summer may be due to a complex series of atmospheric chemical reactions that exist between NO2 and ground-level ozone (O3 levels are highest during the summer and therefore more likely to react with NO2).
o The surface-based temperature inversions commonly present during the winter months may trap the NO2 closer to the ground, thereby increasing ground level NO2 concentrations.
NO2 averages are presented for the Port’s stations in Tables A-5 to A-7 and compared to corresponding NO2 levels measured at the SCAQMD’s Webster station.
NAAQS Comparison
The annual NAAQS for NO2 is an arithmetic mean of 0.053 ppm. In addition, effective January 22, 2010, EPA established the 1-hour NAAQS for NO2, which is attained when the 3-year average of the 98th percentile of the daily maximum 1-hour average does not exceed 0.100 ppm. During CY 2020, the 1-hour NO2 NAAQS and annual arithmetic mean NAAQS were not exceeded at either the Superblock or Gull Park stations.
• In 2020, the 98th percentile of the maximum 1-hour NO2 concentrations was 0.071 ppm and 0.065 ppm at the Superblock and Gull Park stations, respectively, and 0.056 ppm for the nearest SCAQMD station in Signal Hill. Comparison of annual NO2 data from the Port stations and additional SCAQMD stations is provided in Table A-5.
• The latest 3-year (2018 - 2020) average of the 98th percentile NO2 concentration was 0.073 ppm and 0.067 ppm at the Superblock and Gull Park stations, respectively, and 0.058 ppm at the Webster and Signal Hill station, as shown in Table 4. The 3-year average of the 98th percentile NO2 concentration measured at both Port stations did not exceed the 1-hour NO2 NAAQS of 0.100 ppm.
• Annual average NO2 concentrations in 2020 were 0.020 and 0.016 ppm at the Superblock and Gull Park stations, respectively, and 0.013 ppm at the Signal Hill station. The concentrations are below the NO2 annual average NAAQS of 0.053 ppm.
Table 4. NAAQS Comparison: NO2 Concentrations Measured at the Port Stations and Nearest SCAQMD Station.
Averaging Time Period
NO2 Concentration (ppm)
Superblock Gull Park Webster/ Signal Hill1 NAAQS
1-hour (98th percentile)
3-year Average (2018 - 2020) 0.073 0.067 0.058 0.100
Annual (Arithmetic
Mean)
Annual Average (2020) 0.020 0.016 0.013 0.053
1 In December 2019, the SCAQMD Long Beach station was moved from the Webster site to the Signal Hill site approximately three miles to the east.
POLB Air Quality Monitoring Program: CY 2020 Summary Report
June 2021 21
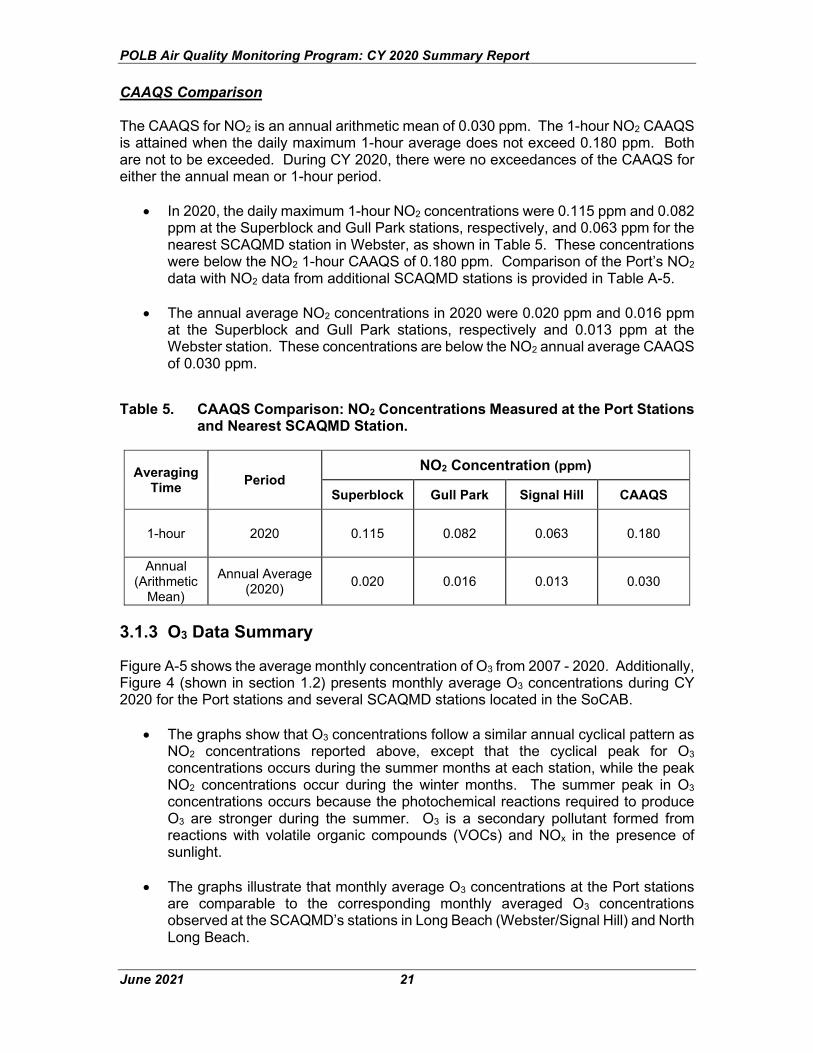
CAAQS Comparison The CAAQS for NO2 is an annual arithmetic mean of 0.030 ppm. The 1-hour NO2 CAAQS is attained when the daily maximum 1-hour average does not exceed 0.180 ppm. Both are not to be exceeded. During CY 2020, there were no exceedances of the CAAQS for either the annual mean or 1-hour period.
• In 2020, the daily maximum 1-hour NO2 concentrations were 0.115 ppm and 0.082
ppm at the Superblock and Gull Park stations, respectively, and 0.063 ppm for the nearest SCAQMD station in Webster, as shown in Table 5. These concentrations were below the NO2 1-hour CAAQS of 0.180 ppm. Comparison of the Port’s NO2 data with NO2 data from additional SCAQMD stations is provided in Table A-5.
• The annual average NO2 concentrations in 2020 were 0.020 ppm and 0.016 ppm at the Superblock and Gull Park stations, respectively and 0.013 ppm at the Webster station. These concentrations are below the NO2 annual average CAAQS of 0.030 ppm.
Table 5. CAAQS Comparison: NO2 Concentrations Measured at the Port Stations and Nearest SCAQMD Station.
Averaging Time Period
NO2 Concentration (ppm)
Superblock Gull Park Signal Hill CAAQS
1-hour 2020 0.115 0.082 0.063 0.180
Annual (Arithmetic
Mean)
Annual Average (2020) 0.020 0.016 0.013 0.030
3.1.3 O3 Data Summary
Figure A-5 shows the average monthly concentration of O3 from 2007 - 2020. Additionally, Figure 4 (shown in section 1.2) presents monthly average O3 concentrations during CY 2020 for the Port stations and several SCAQMD stations located in the SoCAB.
• The graphs show that O3 concentrations follow a similar annual cyclical pattern as NO2 concentrations reported above, except that the cyclical peak for O3 concentrations occurs during the summer months at each station, while the peak NO2 concentrations occur during the winter months. The summer peak in O3 concentrations occurs because the photochemical reactions required to produce O3 are stronger during the summer. O3 is a secondary pollutant formed from reactions with volatile organic compounds (VOCs) and NOx in the presence of sunlight.
• The graphs illustrate that monthly average O3 concentrations at the Port stations are comparable to the corresponding monthly averaged O3 concentrations observed at the SCAQMD’s stations in Long Beach (Webster/Signal Hill) and North Long Beach.

POLB Air Quality Monitoring Program: CY 2020 Summary Report
June 2021 22
Note: o SCAQMD’s Long Beach station was moved from the Webster site to the
Signal Hill site, approximately three miles to the east. o SCAQMD’s North Long Beach station was shut down in October 2013.
• Historically, monthly average O3 concentrations measured at the Superblock station are generally lower than measurements at other nearby stations, including the Gull Park, Webster, and North Long Beach stations, despite the fact that the Superblock station is in a more industrial location with localized emission sources. Both Port stations are exposed to similar regional O3 levels, but it is likely that NOx emissions from sources around the Superblock station slightly deplete O3 levels through localized atmospheric chemical reactions. During CY 2020, concentrations at Superblock and Gull Park stations were very close with annual averages within 4% of each other. Concentrations at Gull Park were generally higher than Superblock during the winter months when there is generally less dispersion.
O3 averages are presented for the Port’s Superblock and Gull Park stations, and the SCAQMD’s Webster/Signal Hill station in Tables A-9 through A-11. NAAQS Comparison The 8-hour average O3 NAAQS is met when the fourth-highest 8-hour concentration in a year, averaged over three years, is equal to or less than 0.070 ppm. During CY 2020, there were no exceedances for the O3 NAAQS. The following maximum O3 concentrations were observed:
• In 2020, the fourth-highest 8-hour average O3 concentrations were 0.062 ppm and
0.061 ppm at the Superblock and Gull Park stations, respectively, and 0.072 ppm at the Signal Hill station.
• The latest 3-year (2018 - 2020) averages of the fourth-highest O3 value were 0.058 ppm and 0.056 ppm at the Superblock and Gull Park stations, respectively, and 0.061 ppm at the Webster/Signal Hill stations, as shown in Table 6. The 3-year average of the O3 value at both POLB stations did not exceed the 8-hour NAAQS.
Table 6. NAAQS Comparison: 3-Year Average of Fourth-highest 8-hour Average O3 Concentrations at the Port Stations and Nearest SCAQMD Station.
Averaging Time Period
O3 Concentration (ppm)
Superblock Gull Park Webster/ Signal Hill1 NAAQS
8-hour (4th highest)
3-year Average (2018 - 2020) 0.058 0.056 0.061 0.070
1 In December 2019, the SCAQMD Long Beach station was moved from the Webster site to the Signal Hill site approximately three miles to the east.

POLB Air Quality Monitoring Program: CY 2020 Summary Report
June 2021 23
CAAQS Comparison The CAAQS for O3 are 0.070 ppm during an 8-hour period and 0.090 ppm over a 1-hour period, and are not to be exceeded. During CY 2020, the 1-hour O3 CAAQS was exceeded at both Superblock and Gull Park stations, as well as at the nearby SCAQMD Signal Hill station. The 8-hour O3 CAAQS was exceeded at both the Gull Park and Signal Hill stations, while the Superblock station did not record an exceedance of the maximum 8-hour average CAAQS. The following maximum O3 concentrations were observed:
• Table 7 shows maximum 1-hour average O3 concentrations of 0.095 ppm and
0.114 ppm at the Superblock and Gull Park stations, respectively. By comparison, the maximum 1-hour average O3 concentration at the Signal Hill SCAQMD monitoring station during CY2020 was 0.105 ppm. The maximum 1-hour O3 concentration at all three stations exceeded the 1-hour CAAQS of 0.090 ppm.
• In 2020, the maximum 8-hour average O3 values were 0.066 and 0.073 ppm at both the Superblock and Gull Park stations, respectively, and 0.083 ppm for the nearest SCAQMD Webster station. Comparison of O3 data with data from additional SCAQMD stations is provided in Table A-9. The maximum 8-hour O3 concentrations at both the Gull Park and Signal Hills stations exceeded the 8-hour CAAQS of 0.070 ppm.
Table 7. CAAQS Comparison: Maximum 1-Hour and 8-Hour O3 Concentrations at
the Port Stations and Nearest SCAQMD Station.
Averaging Time Period
O3 Concentration (ppm)
Superblock Gull Park Signal Hill CAAQS
1-hour 2020 0.095 0.114 0.105 0.090
8-hour 2020 0.066 0.073 0.083 0.070
3.1.4 SO2 Data Summary
Figure A-6 shows average monthly SO2 concentrations from 2007 - 2020. Figure A-6 shows that SO2 concentrations remained relatively constant over the period of record. SO2 averages are provided for the Port’s Superblock and Gull Park stations and SCAQMD’s Webster station in Tables A-13 through A-17. NAAQS Comparison There is a primary 1-hour NAAQS for SO2 which is attained when the 3-year average of the 99th percentile of the daily maximum 1-hour average does not exceed 0.075 ppm. The secondary NAAQS for SO2 is a 3-hour average and is attained if the second highest daily 3-hour maximum does not exceed 0.500 ppm. Primary standards are designed to protect public health, while secondary standards are designed to protect public welfare, including protection against visibility impairment, damage to animals, crops, vegetation and buildings. During CY 2020, no exceedances of the NAAQS for SO2 were recorded at the Port’s monitoring stations.
POLB Air Quality Monitoring Program: CY 2020 Summary Report
June 2021 24
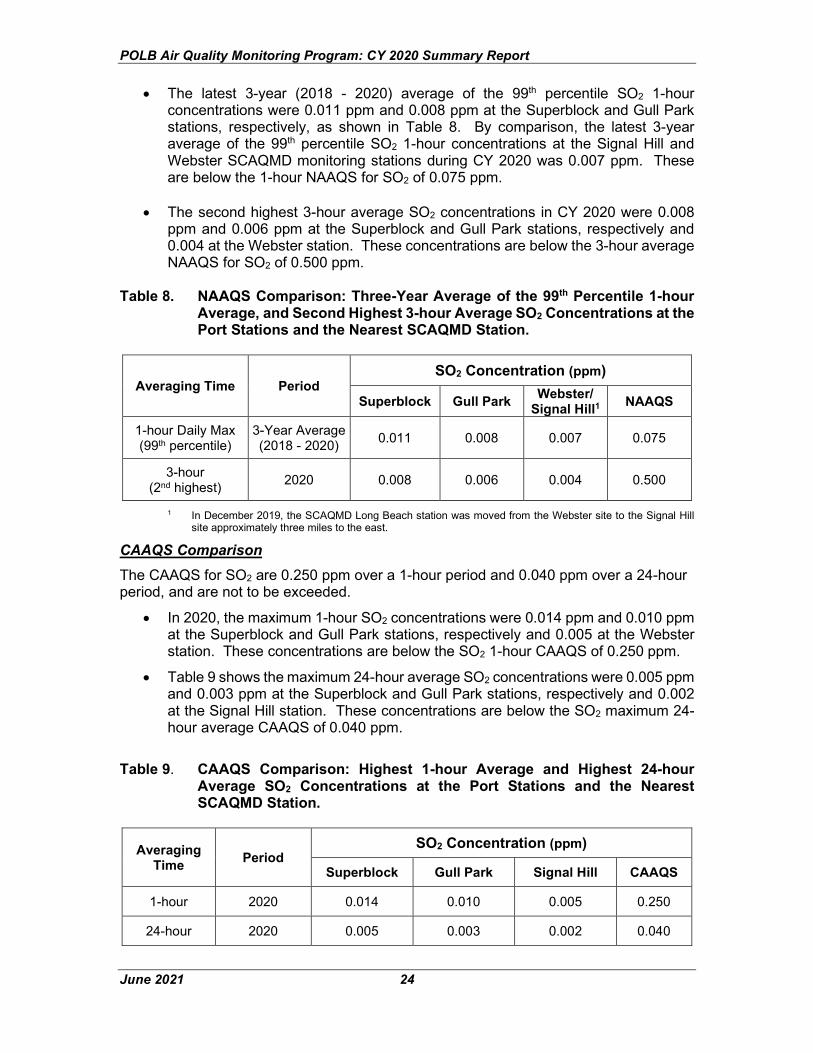
• The latest 3-year (2018 - 2020) average of the 99th percentile SO2 1-hour concentrations were 0.011 ppm and 0.008 ppm at the Superblock and Gull Park stations, respectively, as shown in Table 8. By comparison, the latest 3-year average of the 99th percentile SO2 1-hour concentrations at the Signal Hill and Webster SCAQMD monitoring stations during CY 2020 was 0.007 ppm. These are below the 1-hour NAAQS for SO2 of 0.075 ppm.
• The second highest 3-hour average SO2 concentrations in CY 2020 were 0.008 ppm and 0.006 ppm at the Superblock and Gull Park stations, respectively and 0.004 at the Webster station. These concentrations are below the 3-hour average NAAQS for SO2 of 0.500 ppm.
Table 8. NAAQS Comparison: Three-Year Average of the 99th Percentile 1-hour
Average, and Second Highest 3-hour Average SO2 Concentrations at the Port Stations and the Nearest SCAQMD Station.
Averaging Time Period SO2 Concentration (ppm)
Superblock Gull Park Webster/ Signal Hill1 NAAQS
1-hour Daily Max (99th percentile)
3-Year Average (2018 - 2020) 0.011 0.008 0.007 0.075
3-hour (2nd highest) 2020 0.008 0.006 0.004 0.500
1 In December 2019, the SCAQMD Long Beach station was moved from the Webster site to the Signal Hill site approximately three miles to the east.
CAAQS Comparison The CAAQS for SO2 are 0.250 ppm over a 1-hour period and 0.040 ppm over a 24-hour period, and are not to be exceeded.
• In 2020, the maximum 1-hour SO2 concentrations were 0.014 ppm and 0.010 ppm at the Superblock and Gull Park stations, respectively and 0.005 at the Webster station. These concentrations are below the SO2 1-hour CAAQS of 0.250 ppm.
• Table 9 shows the maximum 24-hour average SO2 concentrations were 0.005 ppm and 0.003 ppm at the Superblock and Gull Park stations, respectively and 0.002 at the Signal Hill station. These concentrations are below the SO2 maximum 24-hour average CAAQS of 0.040 ppm.
Table 9. CAAQS Comparison: Highest 1-hour Average and Highest 24-hour
Average SO2 Concentrations at the Port Stations and the Nearest SCAQMD Station.
Averaging Time Period
SO2 Concentration (ppm)
Superblock Gull Park Signal Hill CAAQS
1-hour 2020 0.014 0.010 0.005 0.250
24-hour 2020 0.005 0.003 0.002 0.040
POLB Air Quality Monitoring Program: CY 2020 Summary Report
June 2021 25
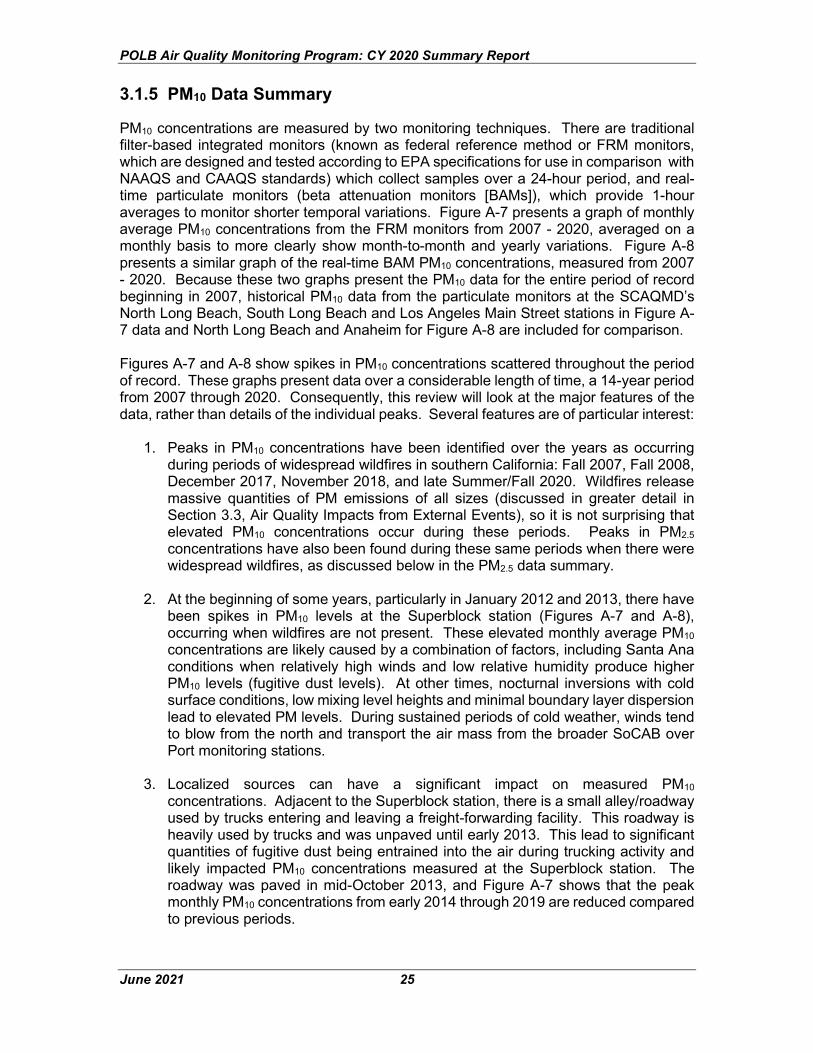
3.1.5 PM10 Data Summary
PM10 concentrations are measured by two monitoring techniques. There are traditional filter-based integrated monitors (known as federal reference method or FRM monitors, which are designed and tested according to EPA specifications for use in comparison with NAAQS and CAAQS standards) which collect samples over a 24-hour period, and real-time particulate monitors (beta attenuation monitors [BAMs]), which provide 1-hour averages to monitor shorter temporal variations. Figure A-7 presents a graph of monthly average PM10 concentrations from the FRM monitors from 2007 - 2020, averaged on a monthly basis to more clearly show month-to-month and yearly variations. Figure A-8 presents a similar graph of the real-time BAM PM10 concentrations, measured from 2007 - 2020. Because these two graphs present the PM10 data for the entire period of record beginning in 2007, historical PM10 data from the particulate monitors at the SCAQMD’s North Long Beach, South Long Beach and Los Angeles Main Street stations in Figure A-7 data and North Long Beach and Anaheim for Figure A-8 are included for comparison. Figures A-7 and A-8 show spikes in PM10 concentrations scattered throughout the period of record. These graphs present data over a considerable length of time, a 14-year period from 2007 through 2020. Consequently, this review will look at the major features of the data, rather than details of the individual peaks. Several features are of particular interest:
1. Peaks in PM10 concentrations have been identified over the years as occurring during periods of widespread wildfires in southern California: Fall 2007, Fall 2008, December 2017, November 2018, and late Summer/Fall 2020. Wildfires release massive quantities of PM emissions of all sizes (discussed in greater detail in Section 3.3, Air Quality Impacts from External Events), so it is not surprising that elevated PM10 concentrations occur during these periods. Peaks in PM2.5 concentrations have also been found during these same periods when there were widespread wildfires, as discussed below in the PM2.5 data summary.
2. At the beginning of some years, particularly in January 2012 and 2013, there have been spikes in PM10 levels at the Superblock station (Figures A-7 and A-8), occurring when wildfires are not present. These elevated monthly average PM10 concentrations are likely caused by a combination of factors, including Santa Ana conditions when relatively high winds and low relative humidity produce higher PM10 levels (fugitive dust levels). At other times, nocturnal inversions with cold surface conditions, low mixing level heights and minimal boundary layer dispersion lead to elevated PM levels. During sustained periods of cold weather, winds tend to blow from the north and transport the air mass from the broader SoCAB over Port monitoring stations.
3. Localized sources can have a significant impact on measured PM10
concentrations. Adjacent to the Superblock station, there is a small alley/roadway used by trucks entering and leaving a freight-forwarding facility. This roadway is heavily used by trucks and was unpaved until early 2013. This lead to significant quantities of fugitive dust being entrained into the air during trucking activity and likely impacted PM10 concentrations measured at the Superblock station. The roadway was paved in mid-October 2013, and Figure A-7 shows that the peak monthly PM10 concentrations from early 2014 through 2019 are reduced compared to previous periods.

POLB Air Quality Monitoring Program: CY 2020 Summary Report
June 2021 26
The combination of these conditions can result in higher measured PM10 levels at the stations, particularly during the fall and early winter of each year. Figures A-7 and A-8 also show that PM10 concentrations at the Superblock station are typically higher than at the Gull Park station. This is primarily a reflection of the surrounding conditions at the two sites:
• The Superblock station is in a highly industrialized location, and as mentioned above, there is an adjacent large container storage area and several smaller container distribution sites, all of which have considerable heavy truck traffic throughout the day, which produce high levels of fugitive dust. A small alley/roadway used by a nearby trucking facility runs adjacent to the Superblock station, and this roadway was paved in mid-October 2013 in an attempt to reduce the impacts to PM10 levels at the site, as discussed above.
• In addition, construction started in September 2013 on the Anaheim Street Improvement Project, located one block north of the Superblock station. This project included repaving the street and other sidewalk, curb, and landscaping improvements on Anaheim Street from the Los Angeles River to 9th Street. This construction project served as a temporary localized source contributing to ambient PM10 concentrations near the station. Construction was completed in October of 2014. With the small alley/roadway being paved in mid-October 2013 and the Anaheim Street Improvement Project ending in late 2014, PM10 levels measured at the Superblock station have decreased somewhat but still remain elevated compared to surrounding stations. Elevated PM10 concentrations measured at Superblock are the result of short-term concentration spikes; likely due to entrainment of fugitive dust from trucking activity on both paved and unpaved roads near the station.
• The Gull Park station, which does not have the large monthly peaks of PM10 concentrations evident at the Superblock station in Figures A-7 and A-8, has no comparable nearby fugitive dust emission sources from truck activity or open paved or unpaved areas. The higher monthly peaks of PM10 concentrations, evident at the Superblock station during the winter season in Figures A-7 and A-8, are much lower at the Gull Park station.
PM10 averages are provided for Superblock and Gull Park sites and for the SCAQMD’s nearest monitoring station at South Long Beach in Tables A-19 through A-22. NAAQS Comparison The 24-hour PM10 NAAQS is attained when the number of days per calendar year with a 24-hour average concentration above 150 µg/m3 is equal to or less than one. Thus, the 24-hour PM10 NAAQS allows for one exceedance of the standard per year. The annual average NAAQS for PM10 was revoked in 2006. The second-highest 24-hour average PM10 concentrations measured by the FRM monitors are shown in Table 10, which also compares these measurements to the 24-hour PM10 NAAQS of 150 µg/m3.
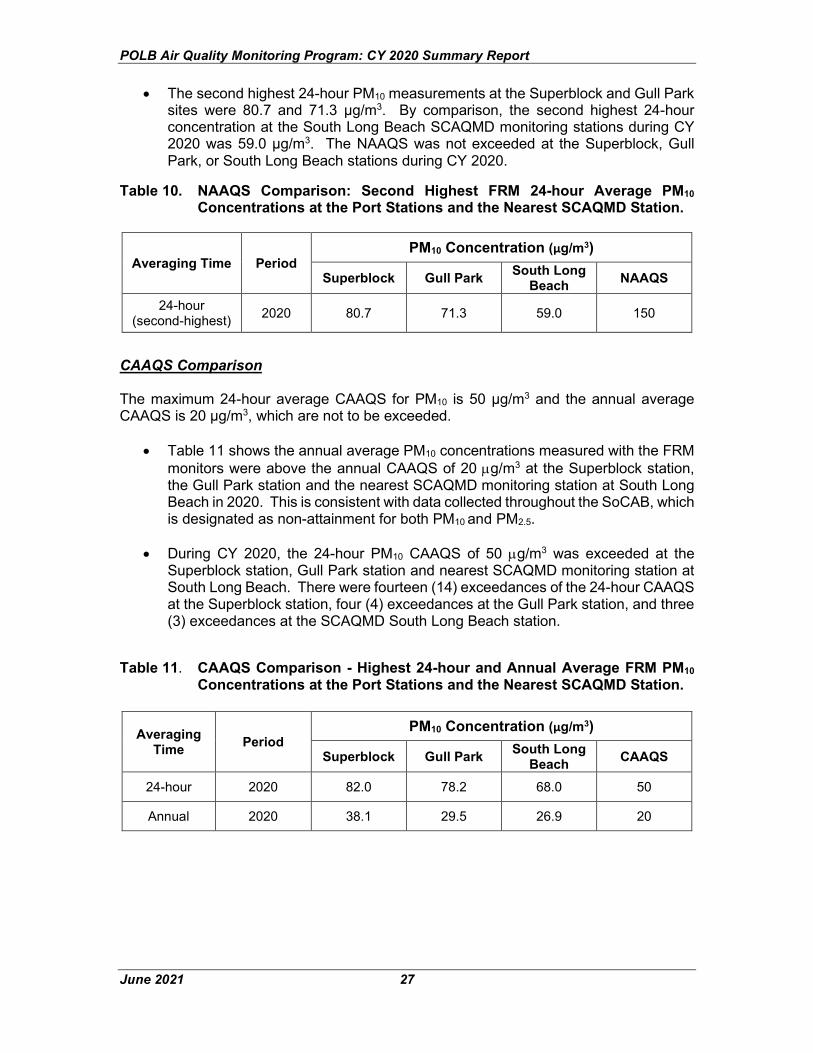
POLB Air Quality Monitoring Program: CY 2020 Summary Report
June 2021 27
• The second highest 24-hour PM10 measurements at the Superblock and Gull Park sites were 80.7 and 71.3 µg/m3. By comparison, the second highest 24-hour concentration at the South Long Beach SCAQMD monitoring stations during CY 2020 was 59.0 µg/m3. The NAAQS was not exceeded at the Superblock, Gull Park, or South Long Beach stations during CY 2020.
Table 10. NAAQS Comparison: Second Highest FRM 24-hour Average PM10 Concentrations at the Port Stations and the Nearest SCAQMD Station.
Averaging Time Period PM10 Concentration (µg/m3)
Superblock Gull Park South Long Beach NAAQS
24-hour (second-highest) 2020 80.7 71.3 59.0 150
CAAQS Comparison The maximum 24-hour average CAAQS for PM10 is 50 µg/m3 and the annual average CAAQS is 20 µg/m3, which are not to be exceeded.
• Table 11 shows the annual average PM10 concentrations measured with the FRM monitors were above the annual CAAQS of 20 µg/m3 at the Superblock station, the Gull Park station and the nearest SCAQMD monitoring station at South Long Beach in 2020. This is consistent with data collected throughout the SoCAB, which is designated as non-attainment for both PM10 and PM2.5.
• During CY 2020, the 24-hour PM10 CAAQS of 50 µg/m3 was exceeded at the Superblock station, Gull Park station and nearest SCAQMD monitoring station at South Long Beach. There were fourteen (14) exceedances of the 24-hour CAAQS at the Superblock station, four (4) exceedances at the Gull Park station, and three (3) exceedances at the SCAQMD South Long Beach station.
Table 11. CAAQS Comparison - Highest 24-hour and Annual Average FRM PM10
Concentrations at the Port Stations and the Nearest SCAQMD Station.
Averaging Time Period
PM10 Concentration (µg/m3)
Superblock Gull Park South Long Beach CAAQS
24-hour 2020 82.0 78.2 68.0 50
Annual 2020 38.1 29.5 26.9 20
POLB Air Quality Monitoring Program: CY 2020 Summary Report
June 2021 28
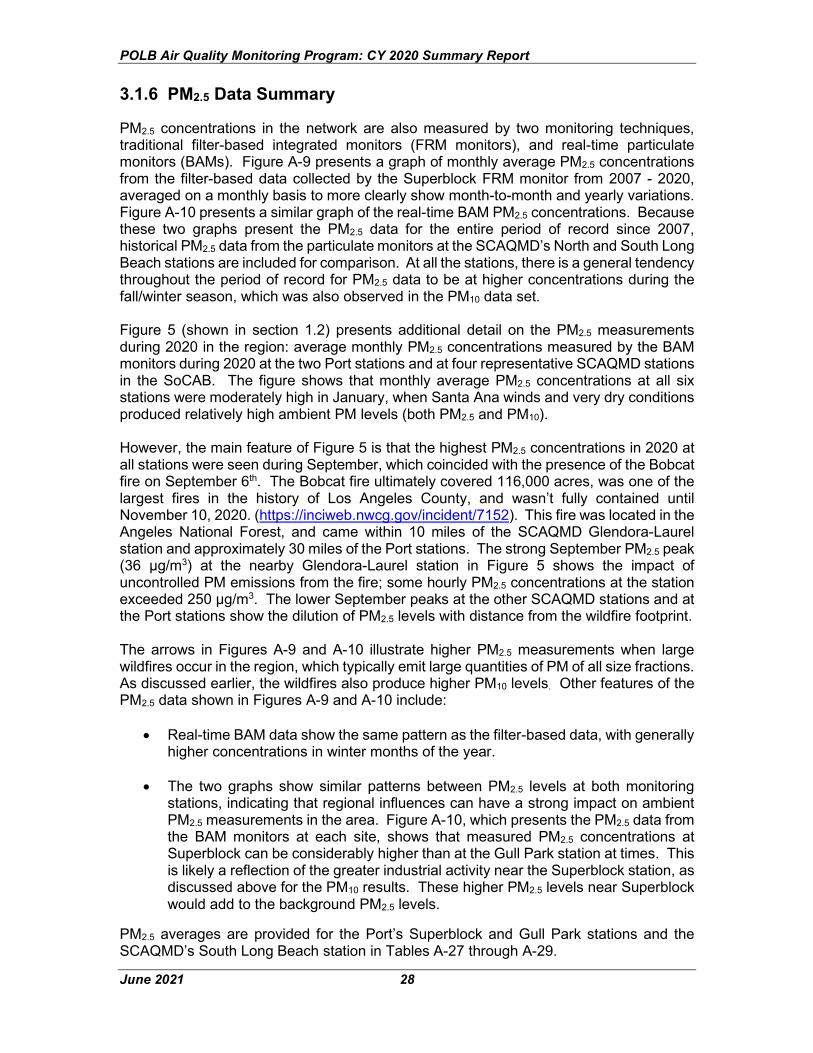
3.1.6 PM2.5 Data Summary
PM2.5 concentrations in the network are also measured by two monitoring techniques, traditional filter-based integrated monitors (FRM monitors), and real-time particulate monitors (BAMs). Figure A-9 presents a graph of monthly average PM2.5 concentrations from the filter-based data collected by the Superblock FRM monitor from 2007 - 2020, averaged on a monthly basis to more clearly show month-to-month and yearly variations. Figure A-10 presents a similar graph of the real-time BAM PM2.5 concentrations. Because these two graphs present the PM2.5 data for the entire period of record since 2007, historical PM2.5 data from the particulate monitors at the SCAQMD’s North and South Long Beach stations are included for comparison. At all the stations, there is a general tendency throughout the period of record for PM2.5 data to be at higher concentrations during the fall/winter season, which was also observed in the PM10 data set. Figure 5 (shown in section 1.2) presents additional detail on the PM2.5 measurements during 2020 in the region: average monthly PM2.5 concentrations measured by the BAM monitors during 2020 at the two Port stations and at four representative SCAQMD stations in the SoCAB. The figure shows that monthly average PM2.5 concentrations at all six stations were moderately high in January, when Santa Ana winds and very dry conditions produced relatively high ambient PM levels (both PM2.5 and PM10). However, the main feature of Figure 5 is that the highest PM2.5 concentrations in 2020 at all stations were seen during September, which coincided with the presence of the Bobcat fire on September 6th. The Bobcat fire ultimately covered 116,000 acres, was one of the largest fires in the history of Los Angeles County, and wasn’t fully contained until November 10, 2020. (https://inciweb.nwcg.gov/incident/7152). This fire was located in the Angeles National Forest, and came within 10 miles of the SCAQMD Glendora-Laurel station and approximately 30 miles of the Port stations. The strong September PM2.5 peak (36 µg/m3) at the nearby Glendora-Laurel station in Figure 5 shows the impact of uncontrolled PM emissions from the fire; some hourly PM2.5 concentrations at the station exceeded 250 µg/m3. The lower September peaks at the other SCAQMD stations and at the Port stations show the dilution of PM2.5 levels with distance from the wildfire footprint. The arrows in Figures A-9 and A-10 illustrate higher PM2.5 measurements when large wildfires occur in the region, which typically emit large quantities of PM of all size fractions. As discussed earlier, the wildfires also produce higher PM10 levels. Other features of the PM2.5 data shown in Figures A-9 and A-10 include:
• Real-time BAM data show the same pattern as the filter-based data, with generally higher concentrations in winter months of the year.
• The two graphs show similar patterns between PM2.5 levels at both monitoring stations, indicating that regional influences can have a strong impact on ambient PM2.5 measurements in the area. Figure A-10, which presents the PM2.5 data from the BAM monitors at each site, shows that measured PM2.5 concentrations at Superblock can be considerably higher than at the Gull Park station at times. This is likely a reflection of the greater industrial activity near the Superblock station, as discussed above for the PM10 results. These higher PM2.5 levels near Superblock would add to the background PM2.5 levels.
PM2.5 averages are provided for the Port’s Superblock and Gull Park stations and the SCAQMD’s South Long Beach station in Tables A-27 through A-29.
POLB Air Quality Monitoring Program: CY 2020 Summary Report
June 2021 29
NAAQS Comparison
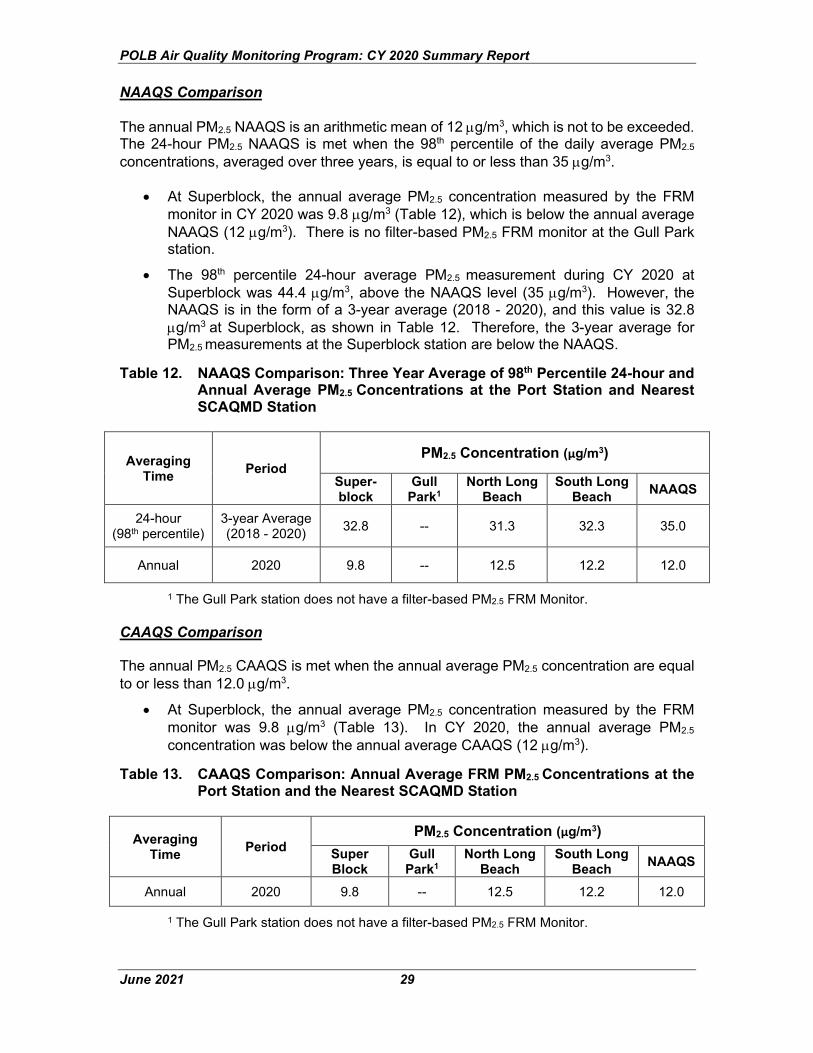
The annual PM2.5 NAAQS is an arithmetic mean of 12 µg/m3, which is not to be exceeded. The 24-hour PM2.5 NAAQS is met when the 98th percentile of the daily average PM2.5 concentrations, averaged over three years, is equal to or less than 35 µg/m3.
• At Superblock, the annual average PM2.5 concentration measured by the FRM monitor in CY 2020 was 9.8 µg/m3 (Table 12), which is below the annual average NAAQS (12 µg/m3). There is no filter-based PM2.5 FRM monitor at the Gull Park station.
• The 98th percentile 24-hour average PM2.5 measurement during CY 2020 at Superblock was 44.4 µg/m3, above the NAAQS level (35 µg/m3). However, the NAAQS is in the form of a 3-year average (2018 - 2020), and this value is 32.8 µg/m3 at Superblock, as shown in Table 12. Therefore, the 3-year average for PM2.5 measurements at the Superblock station are below the NAAQS.
Table 12. NAAQS Comparison: Three Year Average of 98th Percentile 24-hour and Annual Average PM2.5 Concentrations at the Port Station and Nearest SCAQMD Station
Averaging Time Period
PM2.5 Concentration (µg/m3)
Super-block
Gull Park1
North Long Beach
South Long Beach NAAQS
24-hour (98th percentile)
3-year Average (2018 - 2020) 32.8 -- 31.3 32.3 35.0
Annual 2020 9.8 -- 12.5 12.2 12.0
1 The Gull Park station does not have a filter-based PM2.5 FRM Monitor. CAAQS Comparison The annual PM2.5 CAAQS is met when the annual average PM2.5 concentration are equal to or less than 12.0 µg/m3.
• At Superblock, the annual average PM2.5 concentration measured by the FRM monitor was 9.8 µg/m3 (Table 13). In CY 2020, the annual average PM2.5 concentration was below the annual average CAAQS (12 µg/m3).
Table 13. CAAQS Comparison: Annual Average FRM PM2.5 Concentrations at the Port Station and the Nearest SCAQMD Station
Averaging Time Period
PM2.5 Concentration (µg/m3) Super Block
Gull Park1
North Long Beach
South Long Beach NAAQS
Annual 2020 9.8 -- 12.5 12.2 12.0
1 The Gull Park station does not have a filter-based PM2.5 FRM Monitor.
POLB Air Quality Monitoring Program: CY 2020 Summary Report
June 2021 30
3.1.7 Black Carbon Data Summary
Ambient black carbon (BC) concentrations have been measured in the Port’s monitoring network by real-time monitors (API Model 633 Aethalometers) since September 2012. The SCAQMD also uses the Model 633 Aethalometer to collect BC data within their monitoring network. As discussed previously, BC has been considered a surrogate for diesel particulate matter (DPM) by many regulatory agencies including the SCAQMD and CARB. DPM is a very complex mixture of gases and particulates and ambient concentrations of DPM cannot be measured directly. Elemental carbon (EC) is also considered a surrogate for DPM, and EC data was collected previously in the Port’s air monitoring program in CY 2007 and CY 2012. For more details on the EC study, please see the 2012 air monitoring summary report. There are currently no NAAQS or CAAQS for BC, EC, or DPM. Since EC is measured using an integrated 24-hour filter sample on a 3rd day sampling schedule, it is difficult to analyze or assess any potential diurnal influences over the measurement period. Real-time BC measurements allow for analysis of potential source influences (e.g. - regional, urban, local) throughout a sampling day. Hourly BC data may be used, in combination with other pollutant and dispersion data, to preliminarily assess nearby source locations or relative contributions from regional (wood smoke), urban or local (traffic) sources. Real-time BC measurements can be comparable to the integrated, filter-based elemental carbon (EC) data collected previously in the Port’s air monitoring program, using the Desert Research Institute’s (DRI) sequential filter samplers (SFS). While BC and EC data are not considered identical since their concentrations are measured using different monitoring techniques, concurrent measurements of EC and BC taken at 10 sites located within the SoCAB presented in the SCAQMD’s MATES IV study indicates a strong relationship. The measured EC and BC concentrations from this study were analyzed through a linear regression analysis and were found to be highly correlated. Specifically, the coefficient of determination, R2, was calculated, which explains how well changes in one variable (e.g., EC) can be explained by changes in a second variable (e.g., BC). Coefficient of determination values range from zero to one, with R2 values of 1.0 indicating perfect correlation. At the 10 MATES IV monitoring sites, R2 values for concurrent EC and BC measurements ranged from 0.7 to 0.9, which showed very good correlations between the two data sets (SCAQMD, 2015). Table 14 provides annual average BC concentrations at the Superblock and Gull Park stations from 2013 through 2020. Data recovery for the Aethalometer at the Gull Park station was lower than usual (53%) during CY2019 due to instrument issues, so an average was not calculated for that year. The Port of Los Angeles (POLA) also began collecting Black Carbon data in early 2014, which is included in Table 14 for comparison purposes. In late 2019, per requirements set forth in Assembly Bill 617, SCAQMD also began collecting BC data at the nearby Hudson School (Webster) site, which is also included in Table 14. Annual average BC concentrations at the Gull Park station have been consistently lower than at the Superblock station, ranging from 13% to 28% lower depending on the year. Lower BC levels at the Gull Park station are expected due to the lack of localized combustion sources near the station. There has not been a consistent pattern of BC measurements at the POLA Source-Dominated station in comparison with the Superblock station; annual average BC concentrations at the Superblock station were somewhat higher than POLA’s Source-Dominated station during four years, and somewhat lower

POLB Air Quality Monitoring Program: CY 2020 Summary Report
June 2021 31
during three years. In 2020, BC concentration measured at the SCAQMD Webster Site are approximately 20% higher than those measured at the Ports’ stations. The SCAQMD has identified a large local source influence (i.e. - diesel school bus exhaust) impacting BC measurements at Webster and subsequently moved all other monitoring to the Signal Hill site. This is likely the cause of the relatively higher BC concentrations at the Webster site. From 2013 to 2020, annual average BC concentrations measured at both Port stations decreased. The percentage decrease in annual average BC concentrations over this period was 37% and 27% at the Superblock and Gull Park stations, respectively. Annual average BC concentrations measured at POLA’s Source-Dominated station decreased by 19% during its 7-year operational period from 2014 to 2020. Table 14. Annual Average Black Carbon (BC) Concentrations at Port Stations
Averaging Time Period
BC Concentration1 (µg/m3)
Superblock Gull Park POLA – Source
Dominated SCAQMD –
Webster
Annual 2013 1.79 1.34 -- 3 -- 4
Annual 2014 1.50 1.22 1.49 -- 4
Annual 2015 1.41 1.20 1.23 -- 4
Annual 2016 1.39 1.00 1.08 -- 4
Annual 2017 1.38 1.13 1.42 -- 4
Annual 2018 1.27 0.95 1.41 -- 4
Annual 2019 1.10 -- 2 0.95 -- 3
Annual 2020 1.13 0.98 1.21 1.49
1 Currently, there are no NAAQS or CAAQS for black carbon. 2 2019 annual average not calculated for Gull Park as instrument issues resulted in low data recovery. 3 2013 annual average not calculated for POLA Source Dominated; instrument deployed June 2013. 4 SCAQMD Webster BC instrument began reporting data in late 2019.
Figure A-11 presents a graph of monthly average BC concentrations collected at the Superblock and Gull Park stations over the period of record. Monthly average BC concentrations from POLA’s Source-Dominated station (near the center of the Port’s operations) are included in Figure A-11 to provide additional BC data within the San Pedro ports complex. Monthly average BC concentrations measured at all three (3) stations show a consistent trend of decreasing long-term monthly average BC concentrations, with a strong seasonal variation embedded within that trend. Figure A-11 illustrates that BC concentrations consistently peak during the winter season (December - January), and reach a minimum in the late spring-early summer period (May - July). Monthly average PM2.5 data generally show a similar pattern, with maximum concentrations in the winter period and lower concentrations during the summer months. However, with BC, there is a more defined pattern evident in monthly average concentrations, with sharp winter peaks and a distinct period of minimum BC levels during the late spring-early summer. This is likely the result of increased mixing layer heights and convective boundary layer turbulence during the warmer late-spring and summer
POLB Air Quality Monitoring Program: CY 2020 Summary Report
June 2021 32
months, as well as a greater contribution from certain sources of BC (e.g., home heating) during the winter months. The higher BC levels measured at the stations starting in September 2020 are likely due to the contribution of BC emissions from regional wildfires in southern California during that time. The other feature evident in Figure A-11 is that peak winter monthly average BC concentrations have been steadily decreasing over the 2013 - 2019 period of record, with 2017 and 2020 as exceptions. The overall decrease in peak BC concentrations over the 2013 - 2019 period may reflect implementation CAAP control measures on DPM emissions in the area. The increase in peak BC concentrations in 2017 and 2020 were likely due to external regional events (extensive wildfires in southern California), as discussed above. Figure A-11 also shows that monthly average BC concentrations are consistently lower at Gull Park compared to Superblock, with only a few minor exceptions over the period of record. As discussed earlier, this is likely a result of the greater presence of localized sources (industrial facilities and truck activity) near the Superblock station and are similar to the results observed for PM2.5 and PM10 measurements.
3.2 Meteorological Data
The meteorological data collected at both monitoring stations are useful in interpreting the air quality data measured at each of the sites. Additionally, these data sets can be used in air dispersion modeling and other data analyses. Wind roses were created from meteorological data collected at each station for CY 2020 and are shown in Figures A-1 and A-2. Wind roses graphically show the distribution of winds at a site, including speed, direction, and frequency. By convention, winds are shown in the direction from which they came; for example, a west wind blows from the west. The wind roses for each monitoring station were also projected onto the Port base map in Figure 7. These 2020 wind roses are quite similar to the historical record of wind roses at each of the two stations. The predominant wind patterns at the two stations are different, implying that the Port area experiences complex air flow patterns. The wind rose at the Gull Park station shows that the predominant winds are from the southwest through southeast directions, occurring around 50 percent of the time. In contrast, winds at the Superblock station are more varied; they come from the south-southwest through southeast directions approximately 29 percent of the time, and from the west through north-northwest directions 17 percent of the time. Average wind speeds at the Gull Park and Superblock stations are 2.73 m/sec (6.1 mph) and 1.87 m/sec (4.2 mph), respectively.
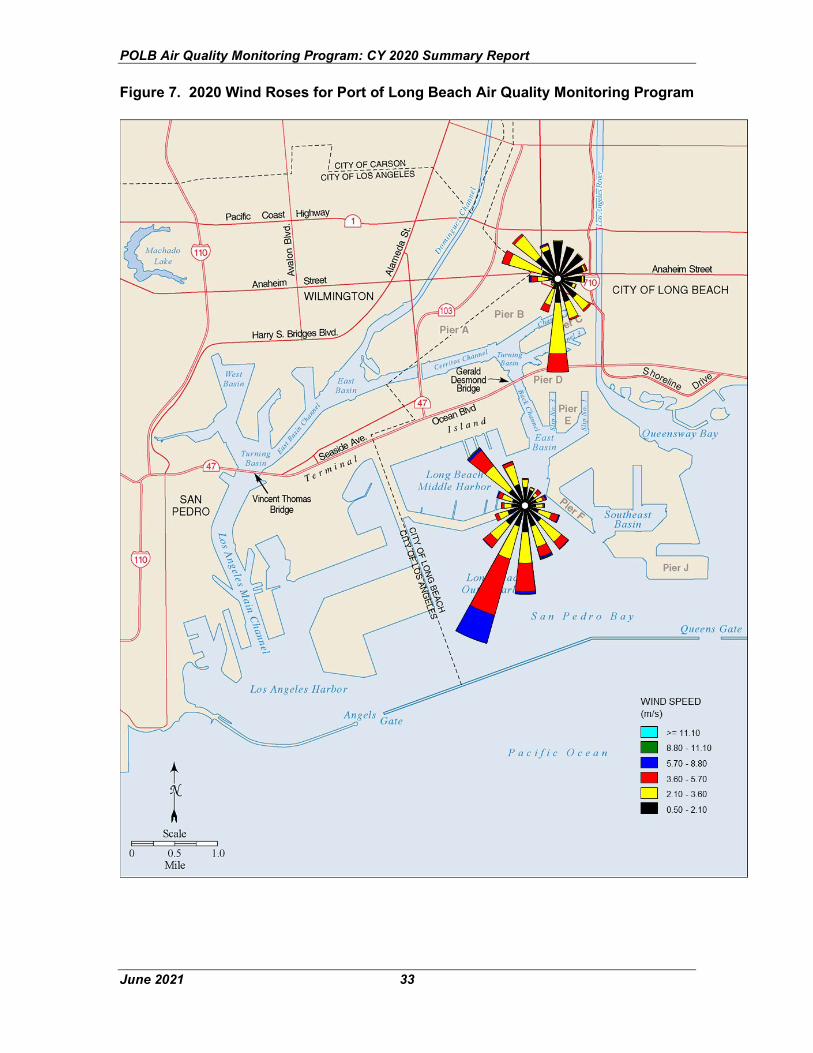
POLB Air Quality Monitoring Program: CY 2020 Summary Report
June 2021 33
Figure 7. 2020 Wind Roses for Port of Long Beach Air Quality Monitoring Program
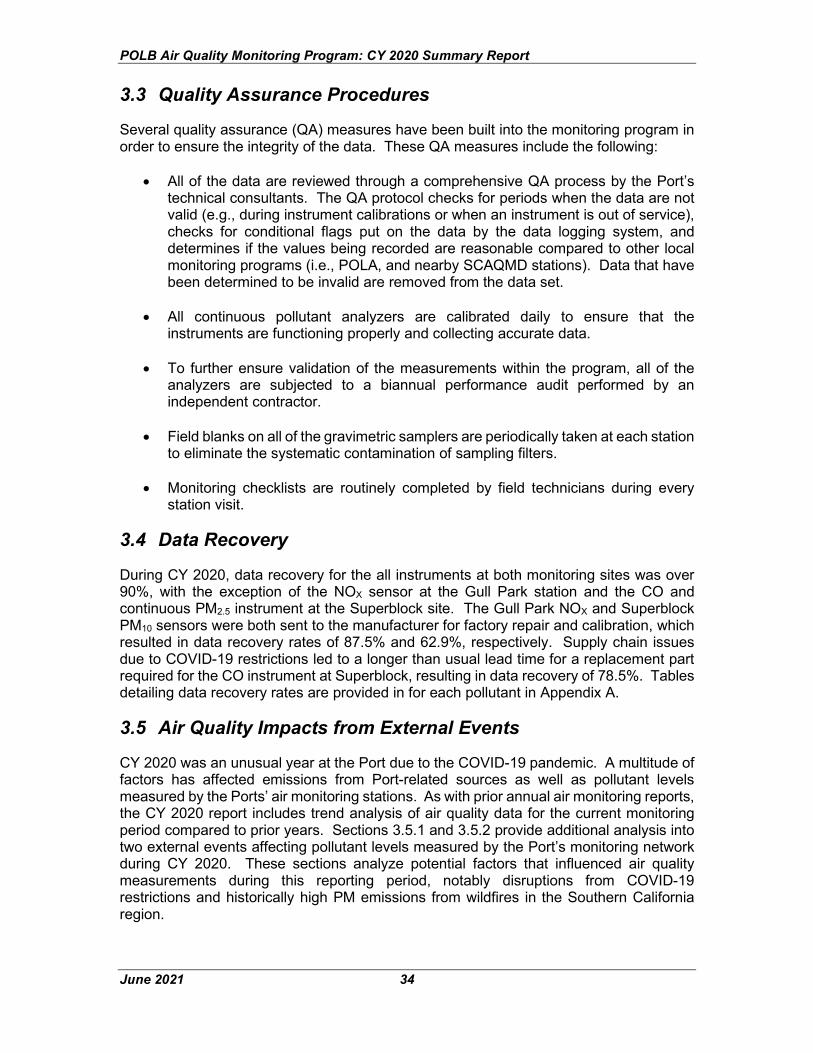
POLB Air Quality Monitoring Program: CY 2020 Summary Report
June 2021 34
3.3 Quality Assurance Procedures
Several quality assurance (QA) measures have been built into the monitoring program in order to ensure the integrity of the data. These QA measures include the following:
• All of the data are reviewed through a comprehensive QA process by the Port’s technical consultants. The QA protocol checks for periods when the data are not valid (e.g., during instrument calibrations or when an instrument is out of service), checks for conditional flags put on the data by the data logging system, and determines if the values being recorded are reasonable compared to other local monitoring programs (i.e., POLA, and nearby SCAQMD stations). Data that have been determined to be invalid are removed from the data set.
• All continuous pollutant analyzers are calibrated daily to ensure that the instruments are functioning properly and collecting accurate data.
• To further ensure validation of the measurements within the program, all of the analyzers are subjected to a biannual performance audit performed by an independent contractor.
• Field blanks on all of the gravimetric samplers are periodically taken at each station
to eliminate the systematic contamination of sampling filters.
• Monitoring checklists are routinely completed by field technicians during every station visit.
3.4 Data Recovery
During CY 2020, data recovery for the all instruments at both monitoring sites was over 90%, with the exception of the NOX sensor at the Gull Park station and the CO and continuous PM2.5 instrument at the Superblock site. The Gull Park NOX and Superblock PM10 sensors were both sent to the manufacturer for factory repair and calibration, which resulted in data recovery rates of 87.5% and 62.9%, respectively. Supply chain issues due to COVID-19 restrictions led to a longer than usual lead time for a replacement part required for the CO instrument at Superblock, resulting in data recovery of 78.5%. Tables detailing data recovery rates are provided in for each pollutant in Appendix A.
3.5 Air Quality Impacts from External Events
CY 2020 was an unusual year at the Port due to the COVID-19 pandemic. A multitude of factors has affected emissions from Port-related sources as well as pollutant levels measured by the Ports’ air monitoring stations. As with prior annual air monitoring reports, the CY 2020 report includes trend analysis of air quality data for the current monitoring period compared to prior years. Sections 3.5.1 and 3.5.2 provide additional analysis into two external events affecting pollutant levels measured by the Port’s monitoring network during CY 2020. These sections analyze potential factors that influenced air quality measurements during this reporting period, notably disruptions from COVID-19 restrictions and historically high PM emissions from wildfires in the Southern California region.
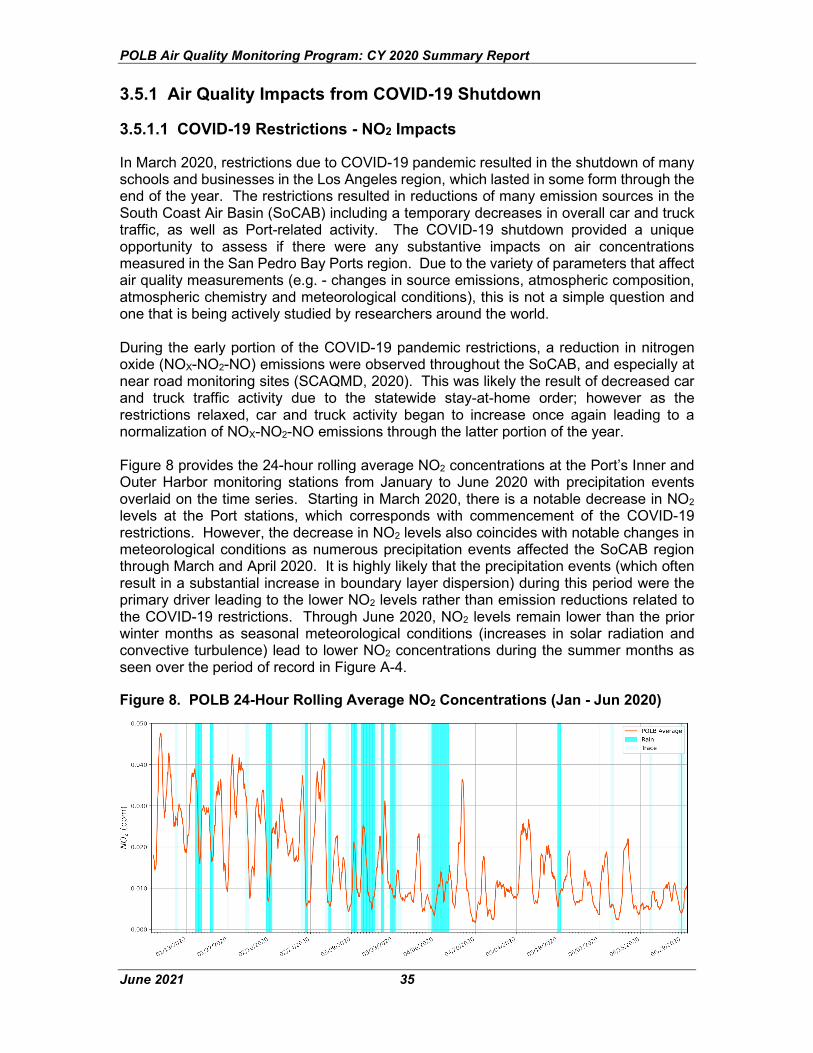
POLB Air Quality Monitoring Program: CY 2020 Summary Report
June 2021 35
3.5.1 Air Quality Impacts from COVID-19 Shutdown
3.5.1.1 COVID-19 Restrictions - NO2 Impacts
In March 2020, restrictions due to COVID-19 pandemic resulted in the shutdown of many schools and businesses in the Los Angeles region, which lasted in some form through the end of the year. The restrictions resulted in reductions of many emission sources in the South Coast Air Basin (SoCAB) including a temporary decreases in overall car and truck traffic, as well as Port-related activity. The COVID-19 shutdown provided a unique opportunity to assess if there were any substantive impacts on air concentrations measured in the San Pedro Bay Ports region. Due to the variety of parameters that affect air quality measurements (e.g. - changes in source emissions, atmospheric composition, atmospheric chemistry and meteorological conditions), this is not a simple question and one that is being actively studied by researchers around the world. During the early portion of the COVID-19 pandemic restrictions, a reduction in nitrogen oxide (NOX-NO2-NO) emissions were observed throughout the SoCAB, and especially at near road monitoring sites (SCAQMD, 2020). This was likely the result of decreased car and truck traffic activity due to the statewide stay-at-home order; however as the restrictions relaxed, car and truck activity began to increase once again leading to a normalization of NOX-NO2-NO emissions through the latter portion of the year. Figure 8 provides the 24-hour rolling average NO2 concentrations at the Port’s Inner and Outer Harbor monitoring stations from January to June 2020 with precipitation events overlaid on the time series. Starting in March 2020, there is a notable decrease in NO2 levels at the Port stations, which corresponds with commencement of the COVID-19 restrictions. However, the decrease in NO2 levels also coincides with notable changes in meteorological conditions as numerous precipitation events affected the SoCAB region through March and April 2020. It is highly likely that the precipitation events (which often result in a substantial increase in boundary layer dispersion) during this period were the primary driver leading to the lower NO2 levels rather than emission reductions related to the COVID-19 restrictions. Through June 2020, NO2 levels remain lower than the prior winter months as seasonal meteorological conditions (increases in solar radiation and convective turbulence) lead to lower NO2 concentrations during the summer months as seen over the period of record in Figure A-4.
Figure 8. POLB 24-Hour Rolling Average NO2 Concentrations (Jan - Jun 2020)
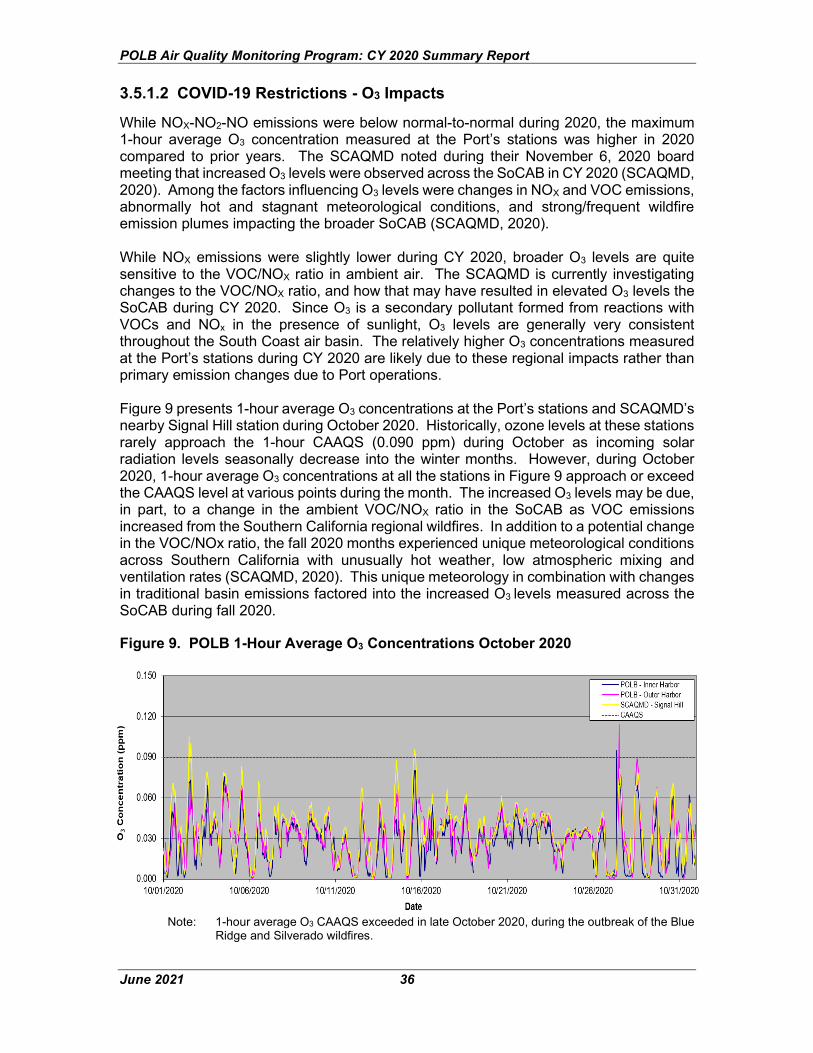
POLB Air Quality Monitoring Program: CY 2020 Summary Report
June 2021 36
3.5.1.2 COVID-19 Restrictions - O3 Impacts
While NOX-NO2-NO emissions were below normal-to-normal during 2020, the maximum 1-hour average O3 concentration measured at the Port’s stations was higher in 2020 compared to prior years. The SCAQMD noted during their November 6, 2020 board meeting that increased O3 levels were observed across the SoCAB in CY 2020 (SCAQMD, 2020). Among the factors influencing O3 levels were changes in NOX and VOC emissions, abnormally hot and stagnant meteorological conditions, and strong/frequent wildfire emission plumes impacting the broader SoCAB (SCAQMD, 2020). While NOX emissions were slightly lower during CY 2020, broader O3 levels are quite sensitive to the VOC/NOX ratio in ambient air. The SCAQMD is currently investigating changes to the VOC/NOX ratio, and how that may have resulted in elevated O3 levels the SoCAB during CY 2020. Since O3 is a secondary pollutant formed from reactions with VOCs and NOx in the presence of sunlight, O3 levels are generally very consistent throughout the South Coast air basin. The relatively higher O3 concentrations measured at the Port’s stations during CY 2020 are likely due to these regional impacts rather than primary emission changes due to Port operations. Figure 9 presents 1-hour average O3 concentrations at the Port’s stations and SCAQMD’s nearby Signal Hill station during October 2020. Historically, ozone levels at these stations rarely approach the 1-hour CAAQS (0.090 ppm) during October as incoming solar radiation levels seasonally decrease into the winter months. However, during October 2020, 1-hour average O3 concentrations at all the stations in Figure 9 approach or exceed the CAAQS level at various points during the month. The increased O3 levels may be due, in part, to a change in the ambient VOC/NOX ratio in the SoCAB as VOC emissions increased from the Southern California regional wildfires. In addition to a potential change in the VOC/NOx ratio, the fall 2020 months experienced unique meteorological conditions across Southern California with unusually hot weather, low atmospheric mixing and ventilation rates (SCAQMD, 2020). This unique meteorology in combination with changes in traditional basin emissions factored into the increased O3 levels measured across the SoCAB during fall 2020.
Figure 9. POLB 1-Hour Average O3 Concentrations October 2020
Note: 1-hour average O3 CAAQS exceeded in late October 2020, during the outbreak of the Blue
Ridge and Silverado wildfires.
POLB Air Quality Monitoring Program: CY 2020 Summary Report
June 2021 37
3.5.2 Air Quality Impacts from Regional Wildfires In addition to the effects of the COVID-19 pandemic in 2020, California endured a record-setting wildfire season that burned over 4,000,000 acres, more than twice the previous record of 2,000,000 acres burned in 2018. Wildfires can have major impacts on atmospheric PM levels (both PM2.5 and PM10), and perhaps influence O3 levels as well. These impacts are discussed individually below.
3.5.2.1 Regional Wildfires - PM2.5 Impacts
The most obvious AQ impact from wildfires is on atmospheric PM levels in an air basin. This can be seen in Figure 10 depicting a satellite image of wildfire smoke in central and southern California on September 13, 2020 (SCAQMD, 2020). Figure 10 illustrates the regional effects of the wildfires, as much of the SoCAB was impacted by smoke of varying densities. Because wildfires emit particulate matter over a wide range of sizes, they have the potential to significantly influence ambient PM2.5 and PM10 levels. During the latter portion of 2020 the Ports monitoring program measured high, short-term PM2.5 levels, and as such, the following analysis will focus on PM2.5. Figure 10. Wildfire Smoke Influence on SoCAB (September 2020).
Note: This image is from SCAQMD Board Meeting Presentation (11/06/20).
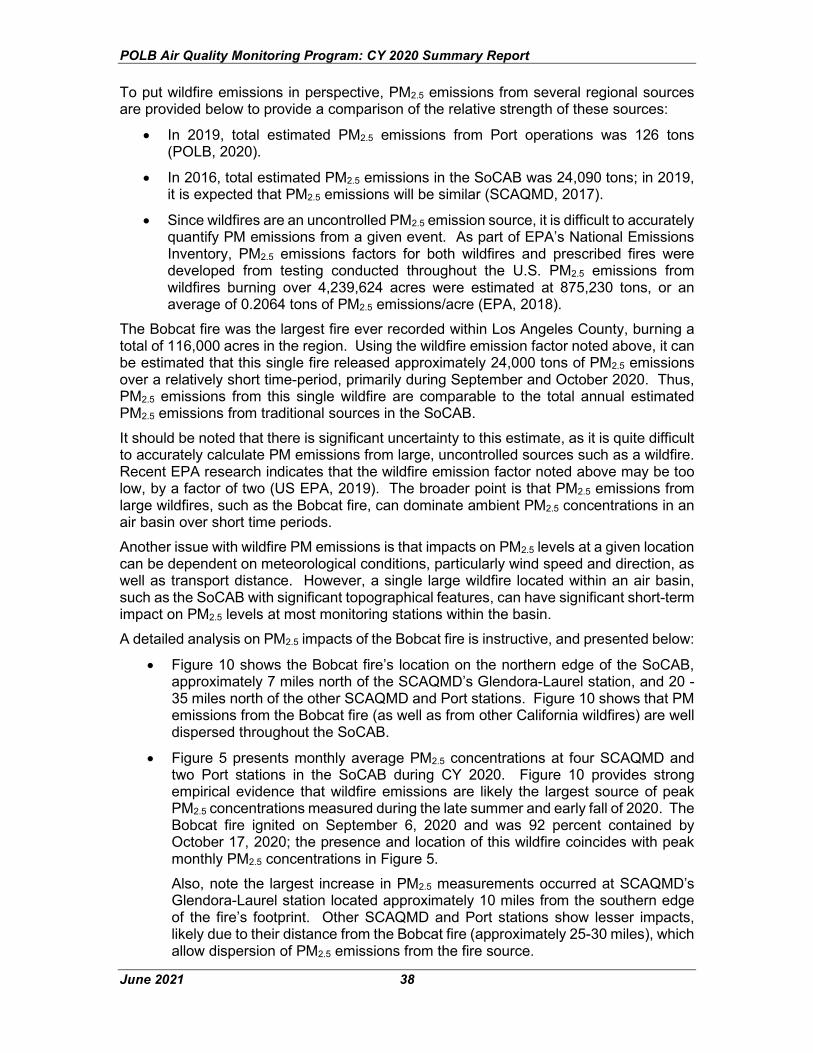
POLB Air Quality Monitoring Program: CY 2020 Summary Report
June 2021 38
To put wildfire emissions in perspective, PM2.5 emissions from several regional sources are provided below to provide a comparison of the relative strength of these sources:
• In 2019, total estimated PM2.5 emissions from Port operations was 126 tons (POLB, 2020).
• In 2016, total estimated PM2.5 emissions in the SoCAB was 24,090 tons; in 2019, it is expected that PM2.5 emissions will be similar (SCAQMD, 2017).
• Since wildfires are an uncontrolled PM2.5 emission source, it is difficult to accurately quantify PM emissions from a given event. As part of EPA’s National Emissions Inventory, PM2.5 emissions factors for both wildfires and prescribed fires were developed from testing conducted throughout the U.S. PM2.5 emissions from wildfires burning over 4,239,624 acres were estimated at 875,230 tons, or an average of 0.2064 tons of PM2.5 emissions/acre (EPA, 2018).
The Bobcat fire was the largest fire ever recorded within Los Angeles County, burning a total of 116,000 acres in the region. Using the wildfire emission factor noted above, it can be estimated that this single fire released approximately 24,000 tons of PM2.5 emissions over a relatively short time-period, primarily during September and October 2020. Thus, PM2.5 emissions from this single wildfire are comparable to the total annual estimated PM2.5 emissions from traditional sources in the SoCAB. It should be noted that there is significant uncertainty to this estimate, as it is quite difficult to accurately calculate PM emissions from large, uncontrolled sources such as a wildfire. Recent EPA research indicates that the wildfire emission factor noted above may be too low, by a factor of two (US EPA, 2019). The broader point is that PM2.5 emissions from large wildfires, such as the Bobcat fire, can dominate ambient PM2.5 concentrations in an air basin over short time periods. Another issue with wildfire PM emissions is that impacts on PM2.5 levels at a given location can be dependent on meteorological conditions, particularly wind speed and direction, as well as transport distance. However, a single large wildfire located within an air basin, such as the SoCAB with significant topographical features, can have significant short-term impact on PM2.5 levels at most monitoring stations within the basin. A detailed analysis on PM2.5 impacts of the Bobcat fire is instructive, and presented below:
• Figure 10 shows the Bobcat fire’s location on the northern edge of the SoCAB, approximately 7 miles north of the SCAQMD’s Glendora-Laurel station, and 20 - 35 miles north of the other SCAQMD and Port stations. Figure 10 shows that PM emissions from the Bobcat fire (as well as from other California wildfires) are well dispersed throughout the SoCAB.
• Figure 5 presents monthly average PM2.5 concentrations at four SCAQMD and two Port stations in the SoCAB during CY 2020. Figure 10 provides strong empirical evidence that wildfire emissions are likely the largest source of peak PM2.5 concentrations measured during the late summer and early fall of 2020. The Bobcat fire ignited on September 6, 2020 and was 92 percent contained by October 17, 2020; the presence and location of this wildfire coincides with peak monthly PM2.5 concentrations in Figure 5. Also, note the largest increase in PM2.5 measurements occurred at SCAQMD’s Glendora-Laurel station located approximately 10 miles from the southern edge of the fire’s footprint. Other SCAQMD and Port stations show lesser impacts, likely due to their distance from the Bobcat fire (approximately 25-30 miles), which allow dispersion of PM2.5 emissions from the fire source.
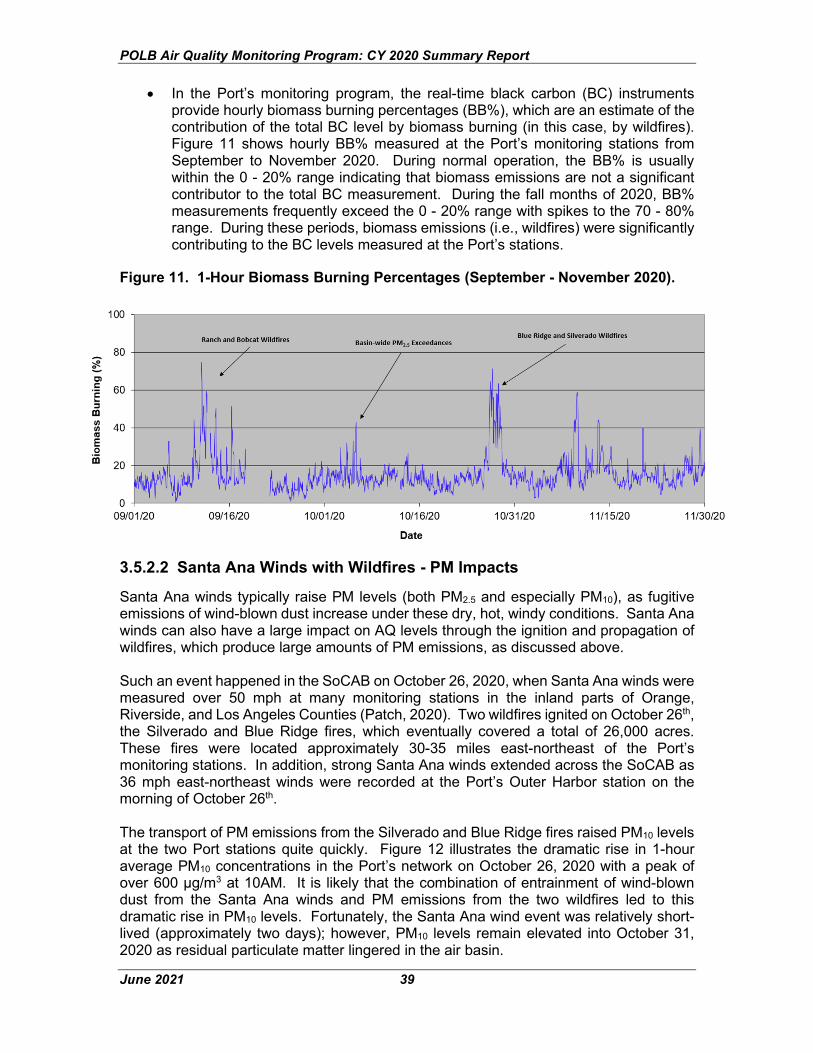
POLB Air Quality Monitoring Program: CY 2020 Summary Report
June 2021 39
• In the Port’s monitoring program, the real-time black carbon (BC) instruments provide hourly biomass burning percentages (BB%), which are an estimate of the contribution of the total BC level by biomass burning (in this case, by wildfires). Figure 11 shows hourly BB% measured at the Port’s monitoring stations from September to November 2020. During normal operation, the BB% is usually within the 0 - 20% range indicating that biomass emissions are not a significant contributor to the total BC measurement. During the fall months of 2020, BB% measurements frequently exceed the 0 - 20% range with spikes to the 70 - 80% range. During these periods, biomass emissions (i.e., wildfires) were significantly contributing to the BC levels measured at the Port’s stations.
Figure 11. 1-Hour Biomass Burning Percentages (September - November 2020).
3.5.2.2 Santa Ana Winds with Wildfires - PM Impacts
Santa Ana winds typically raise PM levels (both PM2.5 and especially PM10), as fugitive emissions of wind-blown dust increase under these dry, hot, windy conditions. Santa Ana winds can also have a large impact on AQ levels through the ignition and propagation of wildfires, which produce large amounts of PM emissions, as discussed above. Such an event happened in the SoCAB on October 26, 2020, when Santa Ana winds were measured over 50 mph at many monitoring stations in the inland parts of Orange, Riverside, and Los Angeles Counties (Patch, 2020). Two wildfires ignited on October 26th, the Silverado and Blue Ridge fires, which eventually covered a total of 26,000 acres. These fires were located approximately 30-35 miles east-northeast of the Port’s monitoring stations. In addition, strong Santa Ana winds extended across the SoCAB as 36 mph east-northeast winds were recorded at the Port’s Outer Harbor station on the morning of October 26th. The transport of PM emissions from the Silverado and Blue Ridge fires raised PM10 levels at the two Port stations quite quickly. Figure 12 illustrates the dramatic rise in 1-hour average PM10 concentrations in the Port’s network on October 26, 2020 with a peak of over 600 µg/m3 at 10AM. It is likely that the combination of entrainment of wind-blown dust from the Santa Ana winds and PM emissions from the two wildfires led to this dramatic rise in PM10 levels. Fortunately, the Santa Ana wind event was relatively short-lived (approximately two days); however, PM10 levels remain elevated into October 31, 2020 as residual particulate matter lingered in the air basin.
POLB Air Quality Monitoring Program: CY 2020 Summary Report
June 2021 40
Figure 12. 1-Hour Average PM10 Concentrations at Port Stations (October 2020).
3.5.3 Vessels at Anchor
Starting in October 2020, the number of ships at anchor and at berth began to increase in the San Pedro Bay Ports Complex, due to changes in operational activity as a result of the COVID-19 pandemic. The activity of ships at both berth and anchor increased into December 2020, when as many as 20 ships per day were recorded at anchor in the San Pedro Bay (American Shipper, 2021). Public and community stakeholders raised concern that these additional ships at anchor produced increased emissions which were transported into the communities surrounding the Port and the broader SoCAB due to operation of vessel auxiliary engines for power while at anchor. However, as the previous section has illustrated, there was a substantial increase in a variety of pollutant emissions from the uncontrolled wildfires burning in California during the same period. As a result, during this reporting period, no increased air quality impacts from the ships at bay was discernable in the ambient pollutant measurements in the Port’s network. A more detailed analysis of the potential impact from vessels at anchor may be possible when evaluating the CY 2021 data as part of the in the CY 2021 Annual Air Monitoring Report and will also be evaluated in the 2020 Emissions Inventory.
4 Trends Analysis With fourteen years of data, an analysis of trends in the data was conducted over the period of record. This analysis uses annual averages to illustrate and evaluate general long-term trends in the data, even if there are no long-term or annual standards for that pollutant. A single trend line for each pollutant was generated based on the combined data from the two Port monitoring stations (Superblock and Gull Park sites). Ambient air pollution levels in the vicinity of the San Pedro Bay Ports are influenced by a number of factors including local pollutant emissions, regional air pollution levels, and meteorology. Several important criteria air pollutants (i.e., ozone, PM2.5) are created (in whole or in part) by chemical reactions occurring after the release of emissions into the atmosphere. As such, concentrations from these pollutants are expected to be more regional in nature. Others pollutants, like PM10, are more localized and directly influenced by nearby emissions sources. As discussed in the introduction, Port-related air pollutant emissions have declined in recent years (POLB, 2020). This decline was likely a result of a number of factors,
POLB Air Quality Monitoring Program: CY 2020 Summary Report
June 2021 41
including the successful implementation of control measures under the San Pedro Bay Ports Clean Air Action Plan (CAAP) and state regulations. Those measures have significantly reduced emissions rates from goods movement sources such as heavy duty trucks, ocean-going vessels, and cargo handling equipment. Between 2005 (the CAAP baseline year) and 2019 (the latest available emissions data), emissions associated with Port of Long Beach operations showed an 86 percent reduction in PM2.5, a 97 percent reduction in sulfur oxides (SOx) and a 58 percent reduction in NOx. Previously, data from the SCAQMD station in North Long Beach were used for comparison with the Port stations, but all of the instruments at that station were shut down in October 2013, with the exception of the filter-based PM2.5 monitor. Consequently, data from the next closest SCAQMD station(s) to the Port region are used for comparison with data from the Port stations. Meteorology can also have a significant influence on regional air pollution levels from one year to the next. So while CAAP measures have improved air emission levels, it is not known how much of any decrease in ambient air pollutant concentrations measured at the Port’s monitoring stations can be directly attributed to the Port’s goods movement emission reduction measures implemented under the CAAP.
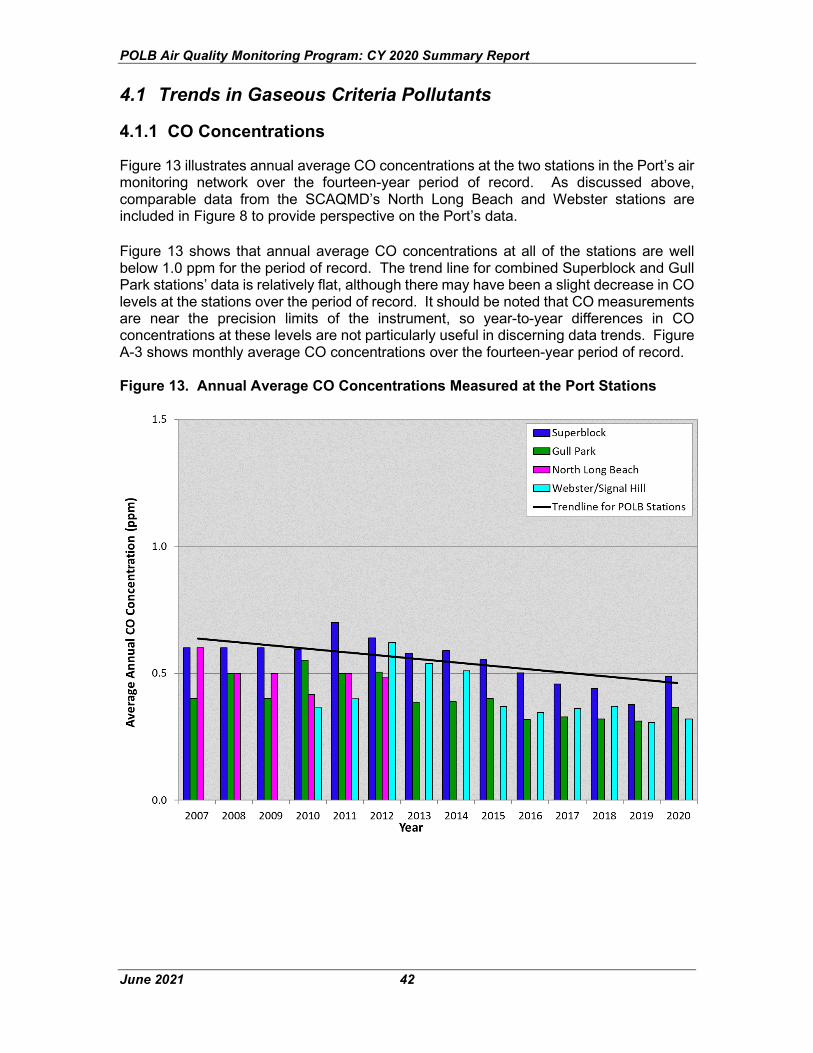
POLB Air Quality Monitoring Program: CY 2020 Summary Report
June 2021 42
4.1 Trends in Gaseous Criteria Pollutants
4.1.1 CO Concentrations
Figure 13 illustrates annual average CO concentrations at the two stations in the Port’s air monitoring network over the fourteen-year period of record. As discussed above, comparable data from the SCAQMD’s North Long Beach and Webster stations are included in Figure 8 to provide perspective on the Port’s data. Figure 13 shows that annual average CO concentrations at all of the stations are well below 1.0 ppm for the period of record. The trend line for combined Superblock and Gull Park stations’ data is relatively flat, although there may have been a slight decrease in CO levels at the stations over the period of record. It should be noted that CO measurements are near the precision limits of the instrument, so year-to-year differences in CO concentrations at these levels are not particularly useful in discerning data trends. Figure A-3 shows monthly average CO concentrations over the fourteen-year period of record. Figure 13. Annual Average CO Concentrations Measured at the Port Stations
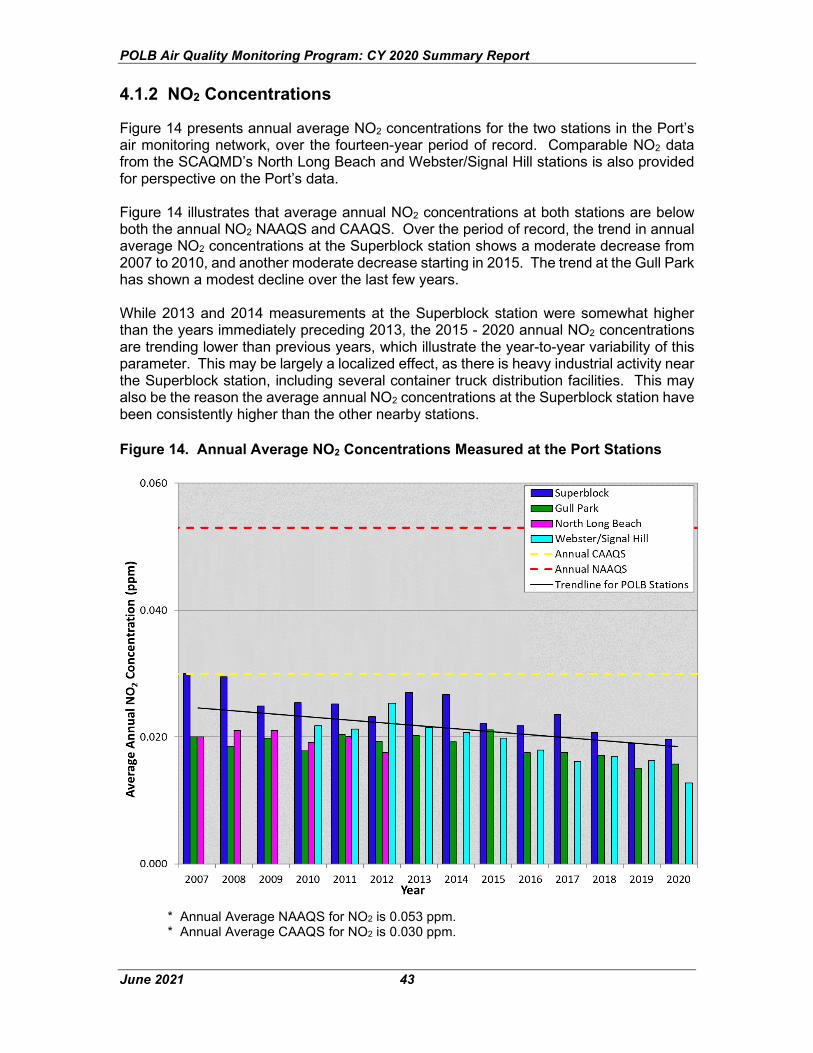
POLB Air Quality Monitoring Program: CY 2020 Summary Report
June 2021 43
4.1.2 NO2 Concentrations
Figure 14 presents annual average NO2 concentrations for the two stations in the Port’s air monitoring network, over the fourteen-year period of record. Comparable NO2 data from the SCAQMD’s North Long Beach and Webster/Signal Hill stations is also provided for perspective on the Port’s data. Figure 14 illustrates that average annual NO2 concentrations at both stations are below both the annual NO2 NAAQS and CAAQS. Over the period of record, the trend in annual average NO2 concentrations at the Superblock station shows a moderate decrease from 2007 to 2010, and another moderate decrease starting in 2015. The trend at the Gull Park has shown a modest decline over the last few years. While 2013 and 2014 measurements at the Superblock station were somewhat higher than the years immediately preceding 2013, the 2015 - 2020 annual NO2 concentrations are trending lower than previous years, which illustrate the year-to-year variability of this parameter. This may be largely a localized effect, as there is heavy industrial activity near the Superblock station, including several container truck distribution facilities. This may also be the reason the average annual NO2 concentrations at the Superblock station have been consistently higher than the other nearby stations. Figure 14. Annual Average NO2 Concentrations Measured at the Port Stations
* Annual Average NAAQS for NO2 is 0.053 ppm. * Annual Average CAAQS for NO2 is 0.030 ppm.
POLB Air Quality Monitoring Program: CY 2020 Summary Report
June 2021 44
Figure A-4 shows monthly average NO2 concentrations over the fourteen-year period of record at the Port stations. The most evident, consistent pattern at each station is the seasonal variation in NO2 measurements, with higher concentrations in the fall/early winter period, and lower concentrations during the summer months. This is likely the result of two factors:
1) Enhanced photochemical production during the summer, in which NOx emissions and volatile hydrocarbons emissions in the presence of sunlight produce O3, thereby reducing ambient NO2 levels during the summer months.
2) Lower dispersion of NOx emissions during the late fall/early winter period,
thereby resulting in higher ambient NO2 levels during the winter period.
Figure A-4 also indicates that the Superblock and Gull Park stations have shown a relatively consistent pattern of moderately decreasing peaks of monthly average NO2 concentrations from 2014 through 2020. This pattern was interrupted in 2017 and may have occurred to a lesser extent in 2020, due to the prolonged impact of regional wildfire emissions in the greater South Coast air basin. Figure A-4 also shows that NO2 data from the SCAQMD’s Webster/Signal Hill station show a similar pattern as the NO2 data from the Port stations.
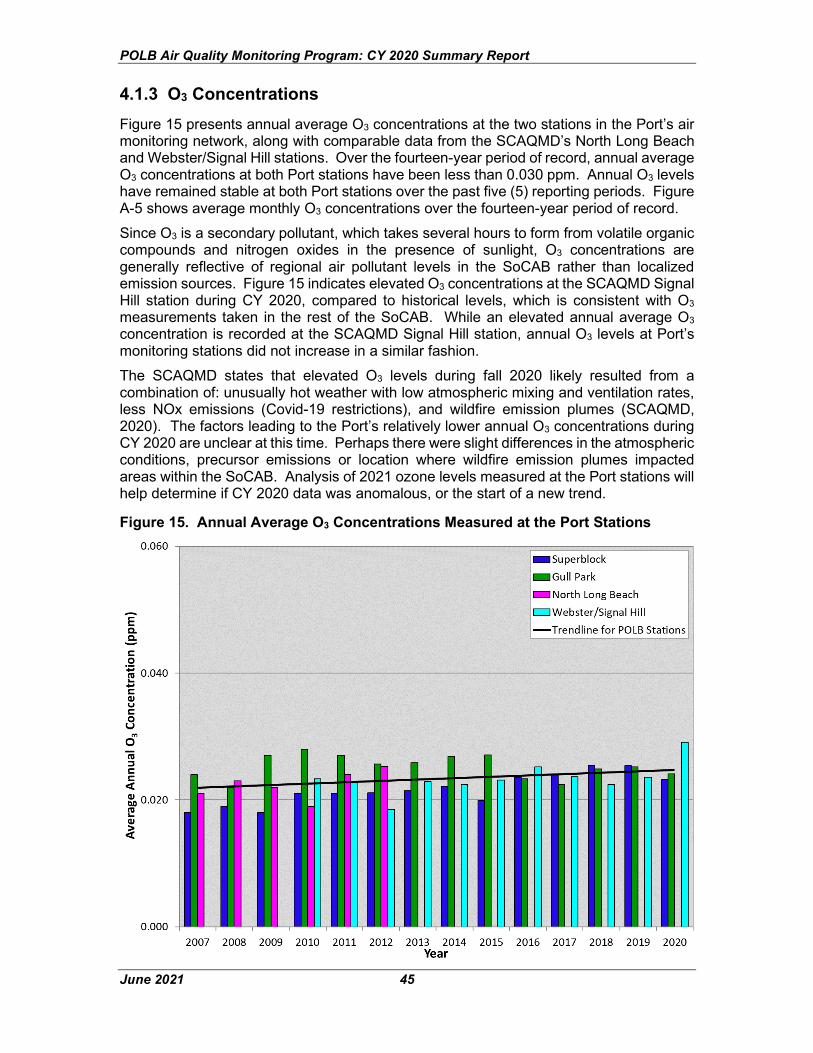
POLB Air Quality Monitoring Program: CY 2020 Summary Report
June 2021 45
4.1.3 O3 Concentrations Figure 15 presents annual average O3 concentrations at the two stations in the Port’s air monitoring network, along with comparable data from the SCAQMD’s North Long Beach and Webster/Signal Hill stations. Over the fourteen-year period of record, annual average O3 concentrations at both Port stations have been less than 0.030 ppm. Annual O3 levels have remained stable at both Port stations over the past five (5) reporting periods. Figure A-5 shows average monthly O3 concentrations over the fourteen-year period of record. Since O3 is a secondary pollutant, which takes several hours to form from volatile organic compounds and nitrogen oxides in the presence of sunlight, O3 concentrations are generally reflective of regional air pollutant levels in the SoCAB rather than localized emission sources. Figure 15 indicates elevated O3 concentrations at the SCAQMD Signal Hill station during CY 2020, compared to historical levels, which is consistent with O3 measurements taken in the rest of the SoCAB. While an elevated annual average O3 concentration is recorded at the SCAQMD Signal Hill station, annual O3 levels at Port’s monitoring stations did not increase in a similar fashion. The SCAQMD states that elevated O3 levels during fall 2020 likely resulted from a combination of: unusually hot weather with low atmospheric mixing and ventilation rates, less NOx emissions (Covid-19 restrictions), and wildfire emission plumes (SCAQMD, 2020). The factors leading to the Port’s relatively lower annual O3 concentrations during CY 2020 are unclear at this time. Perhaps there were slight differences in the atmospheric conditions, precursor emissions or location where wildfire emission plumes impacted areas within the SoCAB. Analysis of 2021 ozone levels measured at the Port stations will help determine if CY 2020 data was anomalous, or the start of a new trend.
Figure 15. Annual Average O3 Concentrations Measured at the Port Stations
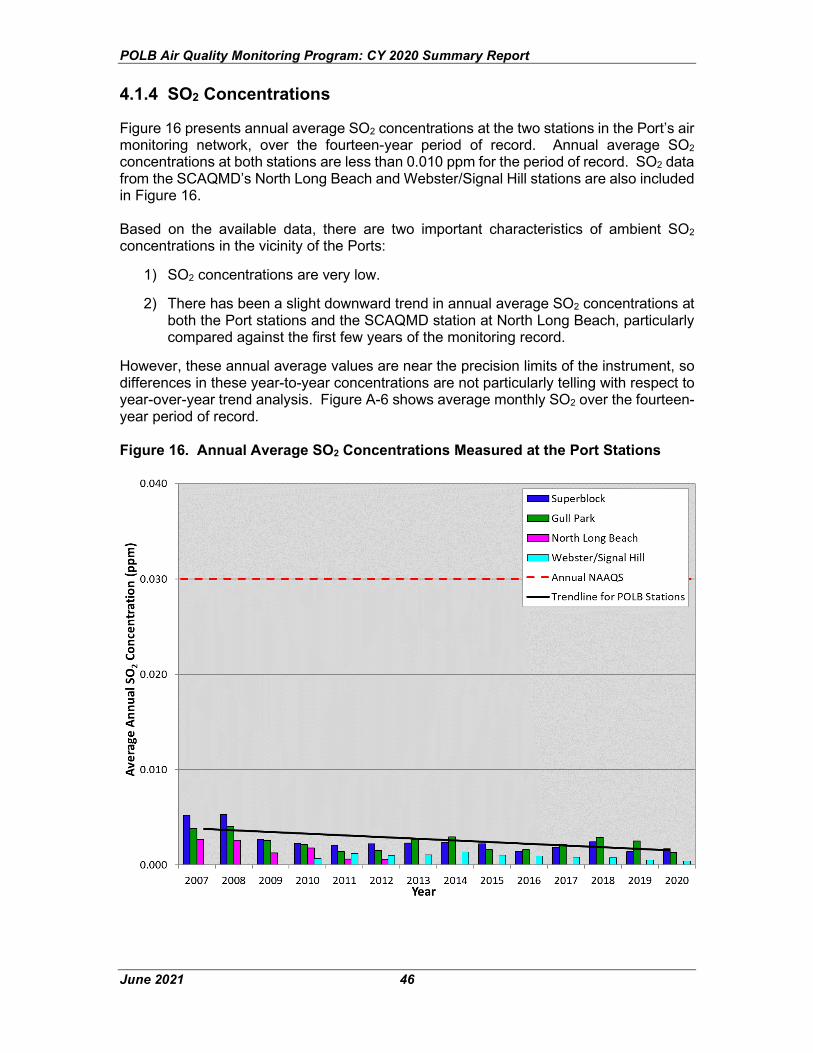
POLB Air Quality Monitoring Program: CY 2020 Summary Report
June 2021 46
4.1.4 SO2 Concentrations
Figure 16 presents annual average SO2 concentrations at the two stations in the Port’s air monitoring network, over the fourteen-year period of record. Annual average SO2 concentrations at both stations are less than 0.010 ppm for the period of record. SO2 data from the SCAQMD’s North Long Beach and Webster/Signal Hill stations are also included in Figure 16. Based on the available data, there are two important characteristics of ambient SO2 concentrations in the vicinity of the Ports:
1) SO2 concentrations are very low.
2) There has been a slight downward trend in annual average SO2 concentrations at both the Port stations and the SCAQMD station at North Long Beach, particularly compared against the first few years of the monitoring record.
However, these annual average values are near the precision limits of the instrument, so differences in these year-to-year concentrations are not particularly telling with respect to year-over-year trend analysis. Figure A-6 shows average monthly SO2 over the fourteen-year period of record. Figure 16. Annual Average SO2 Concentrations Measured at the Port Stations
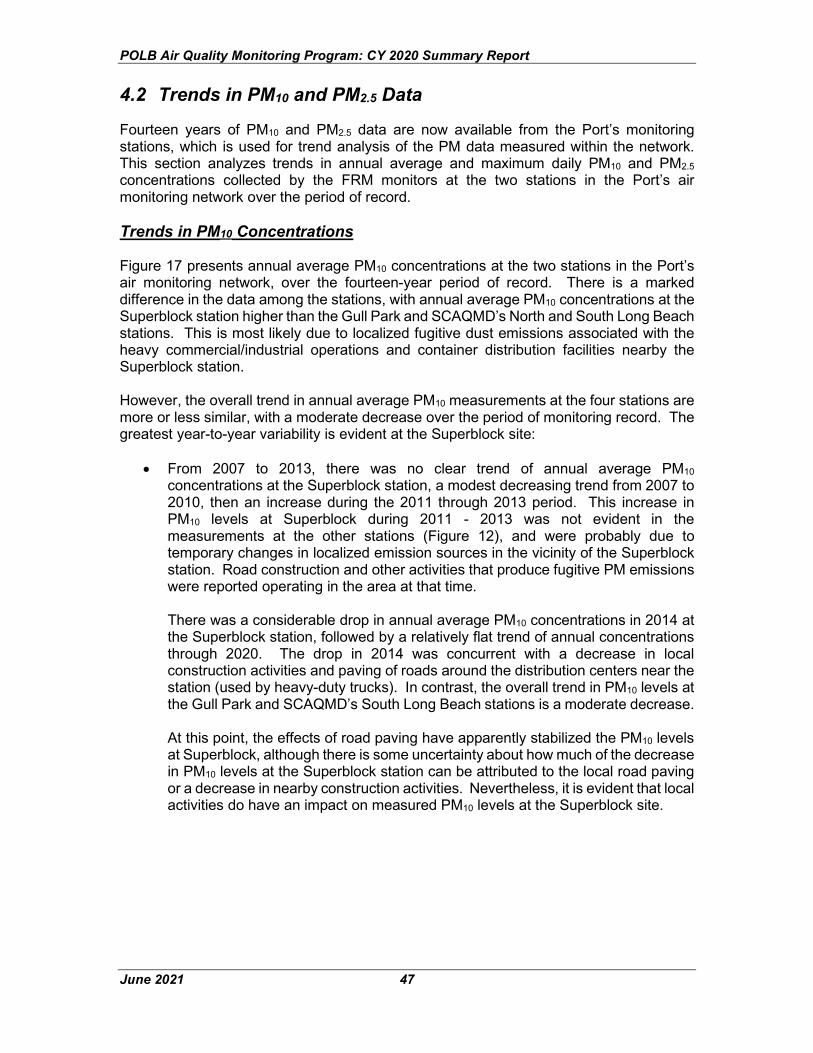
POLB Air Quality Monitoring Program: CY 2020 Summary Report
June 2021 47
4.2 Trends in PM10 and PM2.5 Data
Fourteen years of PM10 and PM2.5 data are now available from the Port’s monitoring stations, which is used for trend analysis of the PM data measured within the network. This section analyzes trends in annual average and maximum daily PM10 and PM2.5 concentrations collected by the FRM monitors at the two stations in the Port’s air monitoring network over the period of record. Trends in PM10 Concentrations
Figure 17 presents annual average PM10 concentrations at the two stations in the Port’s air monitoring network, over the fourteen-year period of record. There is a marked difference in the data among the stations, with annual average PM10 concentrations at the Superblock station higher than the Gull Park and SCAQMD’s North and South Long Beach stations. This is most likely due to localized fugitive dust emissions associated with the heavy commercial/industrial operations and container distribution facilities nearby the Superblock station. However, the overall trend in annual average PM10 measurements at the four stations are more or less similar, with a moderate decrease over the period of monitoring record. The greatest year-to-year variability is evident at the Superblock site:
• From 2007 to 2013, there was no clear trend of annual average PM10 concentrations at the Superblock station, a modest decreasing trend from 2007 to 2010, then an increase during the 2011 through 2013 period. This increase in PM10 levels at Superblock during 2011 - 2013 was not evident in the measurements at the other stations (Figure 12), and were probably due to temporary changes in localized emission sources in the vicinity of the Superblock station. Road construction and other activities that produce fugitive PM emissions were reported operating in the area at that time. There was a considerable drop in annual average PM10 concentrations in 2014 at the Superblock station, followed by a relatively flat trend of annual concentrations through 2020. The drop in 2014 was concurrent with a decrease in local construction activities and paving of roads around the distribution centers near the station (used by heavy-duty trucks). In contrast, the overall trend in PM10 levels at the Gull Park and SCAQMD’s South Long Beach stations is a moderate decrease. At this point, the effects of road paving have apparently stabilized the PM10 levels at Superblock, although there is some uncertainty about how much of the decrease in PM10 levels at the Superblock station can be attributed to the local road paving or a decrease in nearby construction activities. Nevertheless, it is evident that local activities do have an impact on measured PM10 levels at the Superblock site.
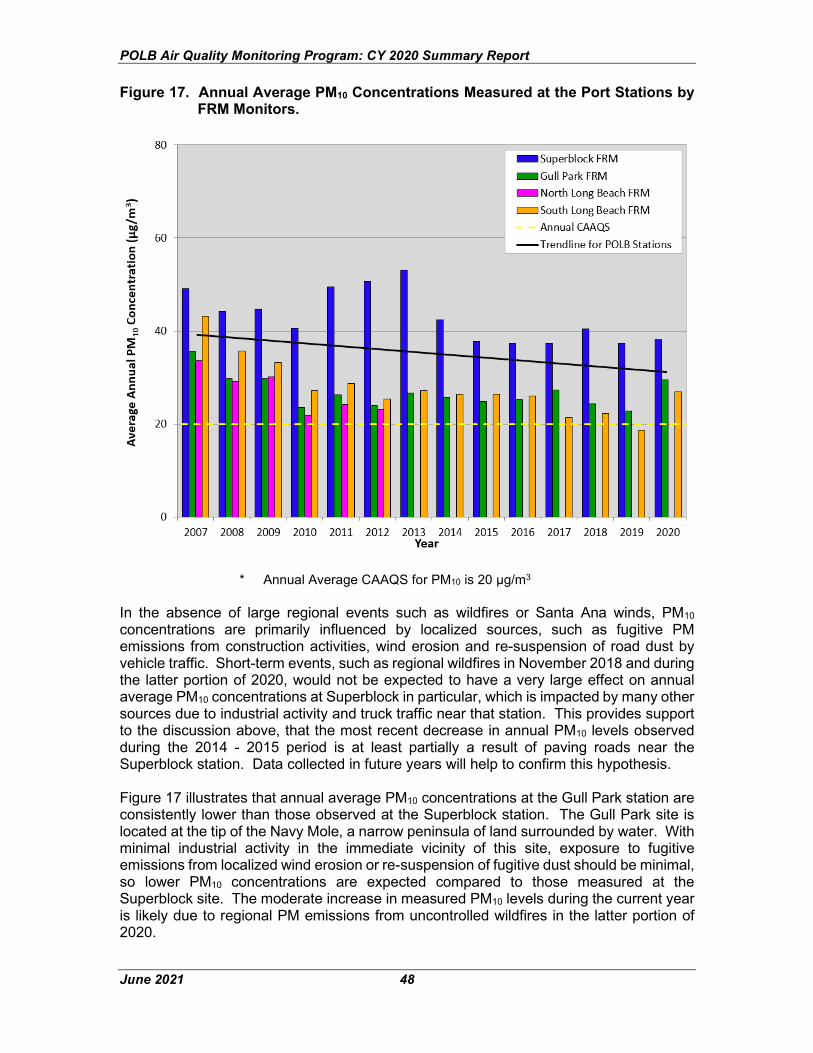
POLB Air Quality Monitoring Program: CY 2020 Summary Report
June 2021 48
Figure 17. Annual Average PM10 Concentrations Measured at the Port Stations by FRM Monitors.
* Annual Average CAAQS for PM10 is 20 µg/m3
In the absence of large regional events such as wildfires or Santa Ana winds, PM10 concentrations are primarily influenced by localized sources, such as fugitive PM emissions from construction activities, wind erosion and re-suspension of road dust by vehicle traffic. Short-term events, such as regional wildfires in November 2018 and during the latter portion of 2020, would not be expected to have a very large effect on annual average PM10 concentrations at Superblock in particular, which is impacted by many other sources due to industrial activity and truck traffic near that station. This provides support to the discussion above, that the most recent decrease in annual PM10 levels observed during the 2014 - 2015 period is at least partially a result of paving roads near the Superblock station. Data collected in future years will help to confirm this hypothesis. Figure 17 illustrates that annual average PM10 concentrations at the Gull Park station are consistently lower than those observed at the Superblock station. The Gull Park site is located at the tip of the Navy Mole, a narrow peninsula of land surrounded by water. With minimal industrial activity in the immediate vicinity of this site, exposure to fugitive emissions from localized wind erosion or re-suspension of fugitive dust should be minimal, so lower PM10 concentrations are expected compared to those measured at the Superblock site. The moderate increase in measured PM10 levels during the current year is likely due to regional PM emissions from uncontrolled wildfires in the latter portion of 2020.
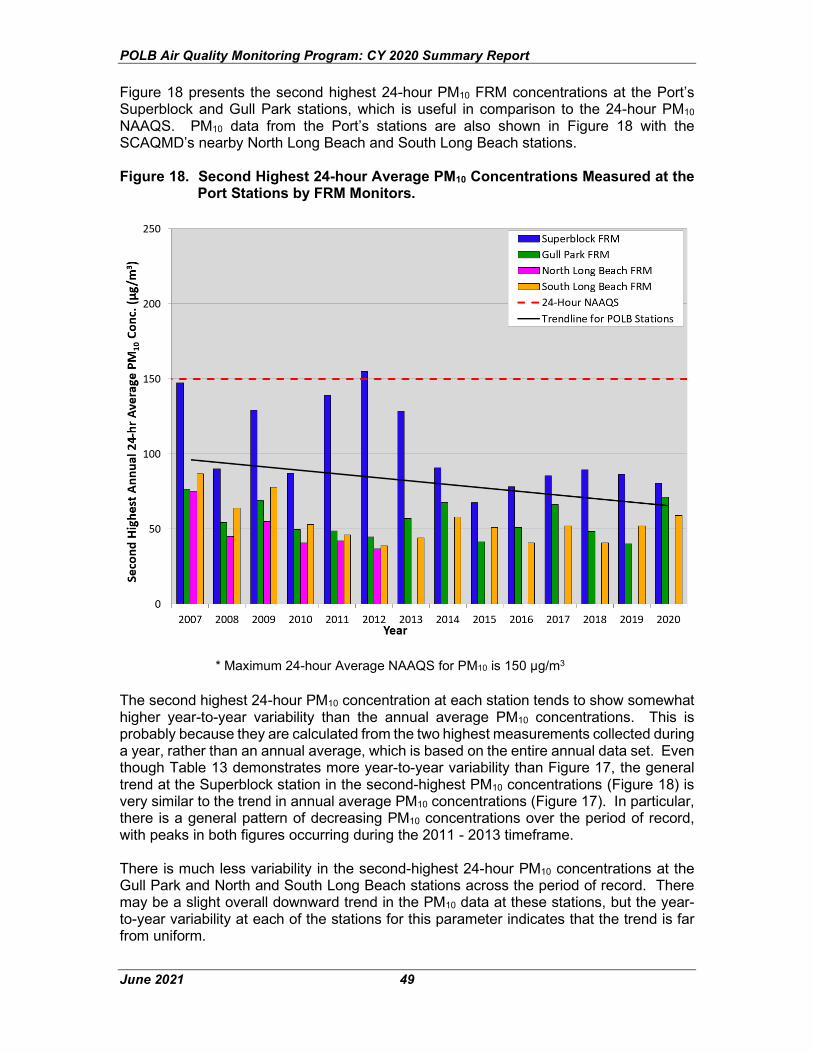
POLB Air Quality Monitoring Program: CY 2020 Summary Report
June 2021 49
Figure 18 presents the second highest 24-hour PM10 FRM concentrations at the Port’s Superblock and Gull Park stations, which is useful in comparison to the 24-hour PM10 NAAQS. PM10 data from the Port’s stations are also shown in Figure 18 with the SCAQMD’s nearby North Long Beach and South Long Beach stations. Figure 18. Second Highest 24-hour Average PM10 Concentrations Measured at the
Port Stations by FRM Monitors.
* Maximum 24-hour Average NAAQS for PM10 is 150 µg/m3 The second highest 24-hour PM10 concentration at each station tends to show somewhat higher year-to-year variability than the annual average PM10 concentrations. This is probably because they are calculated from the two highest measurements collected during a year, rather than an annual average, which is based on the entire annual data set. Even though Table 13 demonstrates more year-to-year variability than Figure 17, the general trend at the Superblock station in the second-highest PM10 concentrations (Figure 18) is very similar to the trend in annual average PM10 concentrations (Figure 17). In particular, there is a general pattern of decreasing PM10 concentrations over the period of record, with peaks in both figures occurring during the 2011 - 2013 timeframe. There is much less variability in the second-highest 24-hour PM10 concentrations at the Gull Park and North and South Long Beach stations across the period of record. There may be a slight overall downward trend in the PM10 data at these stations, but the year-to-year variability at each of the stations for this parameter indicates that the trend is far from uniform.
POLB Air Quality Monitoring Program: CY 2020 Summary Report
June 2021 50
PM10 concentrations can be strongly influenced by fugitive dust, which can be produced by local sources such as construction activity. At the Superblock station in particular, the second-highest 24-hour average PM10 concentrations in CY 2020 were considerably lower than the PM10 concentrations that were measured at the beginning of the monitoring record in 2007. It should become clear in future years whether this trend continues, and if it is a reflection of localized activity or inherent year-to-year variability in this parameter. At the Superblock site in particular, traffic and industrial activity associated with Port operations are the most likely scenario causing occasional elevated PM10 spikes. Because the NAAQS is based on PM10 concentrations measured on the second-highest day of the year, comparisons may vary considerably from year-to-year. Thus, the second-highest 24-hour average PM10 concentrations at Superblock show significant variability. With no localized sources of PM10 emissions at Gull Park, less year-to-year variability is expected, although moderate increases from the trend line were observed in 2017 and 2018, both years in which there were significant numbers of wildfires.
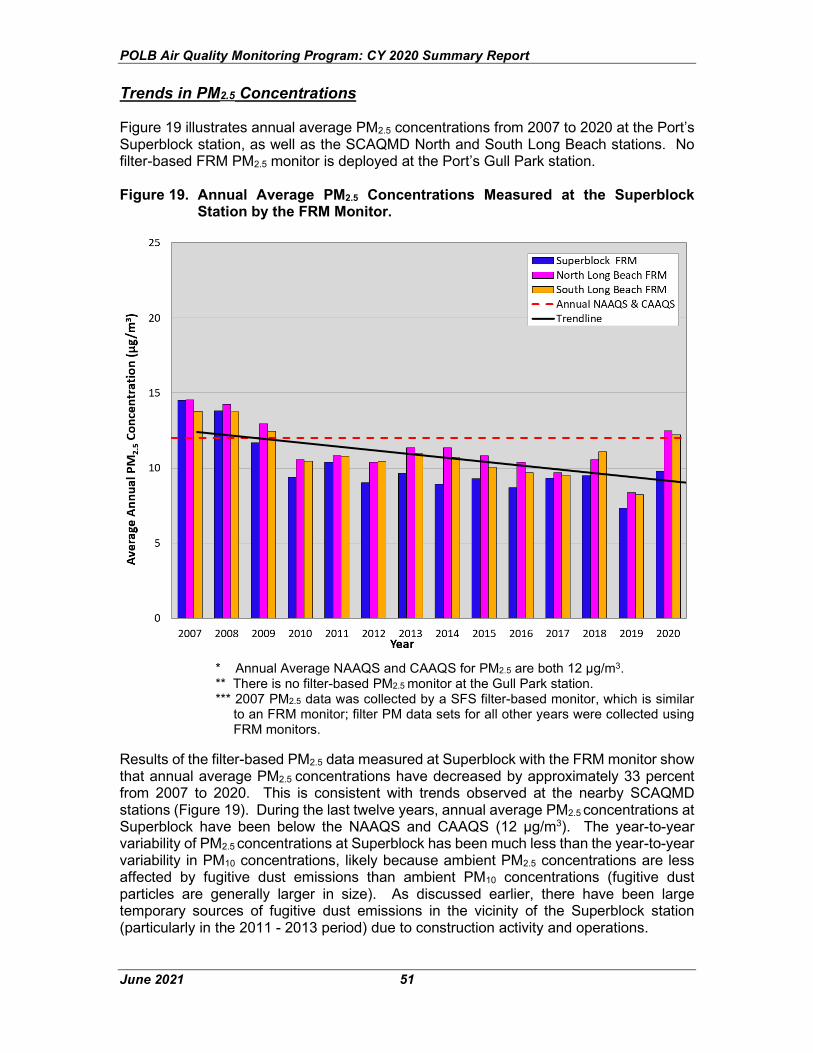
POLB Air Quality Monitoring Program: CY 2020 Summary Report
June 2021 51
Trends in PM2.5 Concentrations Figure 19 illustrates annual average PM2.5 concentrations from 2007 to 2020 at the Port’s Superblock station, as well as the SCAQMD North and South Long Beach stations. No filter-based FRM PM2.5 monitor is deployed at the Port’s Gull Park station. Figure 19. Annual Average PM2.5 Concentrations Measured at the Superblock
Station by the FRM Monitor.
* Annual Average NAAQS and CAAQS for PM2.5 are both 12 µg/m3. ** There is no filter-based PM2.5 monitor at the Gull Park station. *** 2007 PM2.5 data was collected by a SFS filter-based monitor, which is similar
to an FRM monitor; filter PM data sets for all other years were collected using FRM monitors.
Results of the filter-based PM2.5 data measured at Superblock with the FRM monitor show that annual average PM2.5 concentrations have decreased by approximately 33 percent from 2007 to 2020. This is consistent with trends observed at the nearby SCAQMD stations (Figure 19). During the last twelve years, annual average PM2.5 concentrations at Superblock have been below the NAAQS and CAAQS (12 µg/m3). The year-to-year variability of PM2.5 concentrations at Superblock has been much less than the year-to-year variability in PM10 concentrations, likely because ambient PM2.5 concentrations are less affected by fugitive dust emissions than ambient PM10 concentrations (fugitive dust particles are generally larger in size). As discussed earlier, there have been large temporary sources of fugitive dust emissions in the vicinity of the Superblock station (particularly in the 2011 - 2013 period) due to construction activity and operations.
POLB Air Quality Monitoring Program: CY 2020 Summary Report
June 2021 52
Over the period of record, the trend in annual average PM2.5 concentrations at the Superblock station has been an initial decrease followed by relatively constant PM2.5 levels, as shown in Figure 19. However, a moderately large increase in annual average PM2.5 concentrations was observed in CY 2020, likely due to the impact of regional wildfire emissions. A similar increase in annual average PM2.5 levels (and perturbation from the trend line) was measured at the SCCAQMD’s North and South Long Beach stations during CY 2020. The first four years of the monitoring program (2007 - 2010) captured the most notable decrease in PM2.5 levels at the Port’s monitoring stations. The results presented earlier in this document indicate that ambient PM10 concentrations are strongly affected by localized fugitive emission sources; however ambient PM2.5 concentrations are influenced by both local and regional emission sources. Therefore, different source combinations tend to impact measured PM10 and PM2.5 levels somewhat differently:
• Localized PM10 emissions are largely a result of primary fugitive emissions due to wind-blown dust and re-entrained particulate matter on unpaved roadways.
• PM2.5 emissions from mobile sources are generated from three general processes: 1) Direct emissions from cars, trucks and other on-road vehicles, 2) Re-entrained particulate matter found on unpaved roadways, and 3) Secondary formation from precursor emissions such as sulfur dioxide
(SO2), nitrogen oxides (NOx), volatile organic compounds (VOCs) and ammonia (NH3).
The first two items above are generally considered primary PM2.5 emission sources, while PM2.5 formation due to atmospheric chemical reactions are generally considered secondary or regional emission sources. The emission control measures adopted through the Clean Air Action Plan (CAAP) have targeted PM emissions primarily from mobile combustion sources (primary PM2.5 emissions) around the San Pedro Bay ports, rather than from localized fugitive dust sources (PM10). While it is unlikely the CAAP emission control measures are solely responsible for the measured emission reductions, it is reasonable to attribute a portion of the observed reductions to the emission reduction initiatives implemented by the CAAP program. This is evidenced through trend analysis of annual average PM2.5 concentrations measured at the Port stations. After a noticeable reduction in PM2.5 concentrations from 2007 through 2010, the annual average PM2.5 concentrations measured at the Superblock station have remained fairly constant since 2010.

POLB Air Quality Monitoring Program: CY 2020 Summary Report
June 2021 53
Figure 20 presents the 98th percentile of the 24-hour average PM2.5 concentration during the period of record at the Superblock station (the 98th percentile values are presented to be consistent with the NAAQS standard). Figure 20 shows that there was a trend of decreasing (but variable) values of the 98th percentile of the 24-hour average PM2.5 concentrations. In 2018, there was a moderately large increase at the Superblock station and at the SCAQMD North and South Long Beach stations. In 2020, there was a notable increase in this parameter at all three stations. The CY 2020 measurements were the highest values of the 98th percentile of the 24-hour average PM2.5 concentration over the period of record, undoubtedly due to the large number of wildfires in the Southern California region this year. Figure 20. 98th Percentile of the 24-hour Average PM2.5 Concentrations Measured at
the Superblock Station by the FRM Monitor.
* Maximum 24-hour Average NAAQS for PM2.5 is 35 µg/m3.
POLB Air Quality Monitoring Program: CY 2020 Summary Report
June 2021 54
Figures A-7 through A-10 present monthly average PM10 and PM2.5 concentrations over the fourteen-year period of record, illustrating the year-to-year variability in these pollutants. PM2.5 levels at the Superblock and Gull Park stations follow a similar trend throughout the year (measured by BAM monitors at both stations) with concentrations generally lower during the late-spring and summer, followed by increasing concentrations during fall and winter months. As the figures show, wildfires can have a large impact on local PM10 and PM2.5 concentrations, as shown in 2007, 2008, 2017, 2018, and 2020. Emissions from regional wildfires can have even a greater impact on the highest measured PM concentrations during a given year. In general, it appears that wildfires have a greater impact on PM2.5 concentrations than on PM10 concentrations, indicating that either:
1) the 2017 and 2020 wildfires were a greater source of PM2.5 emissions, or 2) the larger and heavier PM10 particulates tend to fall out of the smoke plume faster
than the smaller and lighter PM2.5 emissions. Consequently, the PM10 particulates are not transported as far from the wildfire source, which is typically located at some distance away from the Port monitoring stations.
5 Conclusions This report presents a summary of the data collected in the Port’s air quality monitoring program during CY 2020. This monitoring program has now been in operation for fourteen years (2007 - 2020), and allows a review of trends in the data, as well as comparison with ambient air quality standards during CY 2020. This data record is valuable, because it gives an indication of air quality trends during the implementation of comprehensive emission reduction programs at the Port, as part of the Clean Air Action Plan (CAAP).
1) During CY 2020, no NAAQS were exceeded. 2) During CY 2020, the following CAAQS were exceeded:
a. The 1-hr O3 CAAQS was exceeded at both stations, and the 8-hr CAAQS was exceeded at the Gull Park station.
b. The annual and 24-hr CAAQS for filter-based PM10 measurements were exceeded at both stations.
No other exceedances of the CAAQS were observed during the 2020 reporting period, which is consistent with measurements taken at other SoCAB monitoring stations. Analysis over the fourteen-year period of record indicates the following trends for the gaseous criteria pollutants monitored at both stations:
1) Annual average NO2 and SO2 concentrations have decreased, 2) O3 concentrations have increased slightly, and 3) CO concentrations have demonstrated no discernible trend.
The trend of PM10 measurements in the Port’s monitoring program has been a moderate decrease over the period of record at both stations. However, because fugitive dust produced by local sources has a large effect on PM10 concentrations, there is a considerable year-to-year variability in these values embedded within the overall decreasing trend. This is especially notable at the Superblock station, which is impacted by activity at nearby trucking distribution centers, because their operations produce
POLB Air Quality Monitoring Program: CY 2020 Summary Report
June 2021 55
considerable amounts of fugitive dust emissions. PM10 concentrations at the Gull Park station are consistently lower than at the Superblock station, which is expected since the Gull Park station has no localized sources of fugitive dust (unlike the Superblock station). There was also some increase in average PM10 concentrations in 2020, likely due to the large number of California wildfires and associated PM emissions.
Annual average PM2.5 concentrations have been decreasing at the Superblock station (filter-based PM2.5 measurements are not collected at Gull Park) over the period of record. There has also been a trend of decreasing second-highest 24-hour average PM2.5 concentrations over the period or record, which is a sensitive indicator of the highest year-to-year measurements. This trend was briefly interrupted with increases in this value during 2017 and 2018 due to PM emissions from regional wildfires and with a notable increase in 2020 due to extensive wildfires in California during the second half of the year.
While PM10 concentrations are largely a result of localized fugitive emissions, PM2.5 concentrations are influenced by a combination of local and regional emission sources. Examples of local sources of PM2.5 emissions include diesel and gasoline engines, cooking, fireplaces, wildfires, etc., while regional emission sources are primarily the result of secondary PM2.5 particle formation from gaseous pollutants such as SOx and NOx.
A more detailed analysis of the impacts on air quality during 2020 from the COVID-19 restrictions, regional Southern California wildfires and vessels at anchor in the San Pedro Bay is presented in Section 3.5.
Annual average BC concentrations have been decreasing at both the Superblock and Gull Park station since real-time BC monitoring commenced in 2013. The decrease in annual BC concentrations at Superblock from 2013 to 2020 was 37 percent. The decrease in annual average BC concentrations at Gull Park from 2013 to 2020 was 27 percent.
All data collected in the Port’s ambient air monitoring program are available for review on a real-time basis at the CAAP website: https://monitoring.cleanairactionplan.org.
POLB Air Quality Monitoring Program: CY 2020 Summary Report
June 2021 56
6 References American Shipper. 2021. https://www.freightwaves.com/news/californias-massive-container-ship-traffic-jam-is-still-really-jammed California Air Resources Board. 2020. Air Quality and Meteorological Information System (AQMIS2) [Database Interface]. Retrieved from http://www.arb.ca.gov/aqmis2/aqdselect.php J.H. Kroll, C.L. Heald, C. D. Cappa, D.K. Farmer, J.L. Fry, J.G. Murphy, and A.L. Steiner, 2020. The Complex Chemical Effects of COVID-19 Shutdowns on Air Quality. Nature Chemistry, Vol. 12, pp777-779. Patch, 2020. https://patch.com/california/orange-county/santa-ana-winds-see-10-fastest-wind-speeds-socal-monday Port of Long Beach. 2020. Port of Long Air Emissions Inventory – 2019. (http://www.polb.com) _____. 2010a. Port of Long Beach Air Quality Monitoring Plan. April 2010 Update. _____. 2010b. Port of Long Beach Quality Assurance Plan for the Air Quality Monitoring Program. April 2010 Update _____. 2008. Port of Long Beach Air Quality Monitoring Program Work Plan. South Coast Air Quality Management District. 2020. Air Quality Network Monitoring Plan, July 1, 2020. Appendix C, Continuous Monitor Comparability Assessment and Request for Waiver. http://www.aqmd.gov/docs/default-source/clean-air-plans/air-quality-monitoring-network-plan/aaqmnp-appendix-cA4ED7731453B.pdf?sfvrsn=67 _____. 2020 Air Quality Monitoring Network Plan, Appendix C (PM2.5 Continuous Monitor Comparability Assessment and Request for Waiver). 21865 Copley Drive, Diamond Bar, CA 91765, July, 2020. ______ 2020. 2020 Ozone Season and Wildfire Impact. Presentation to SCAQMD Board, November 6, 2020. http://www.aqmd.gov/docs/default-source/Agendas/Governing-Board/2020/2020-nov6-025.pdf?sfvrsn=2 _____. Final 2016 Air Quality Management Plan (AQMP)-CARB/EPA/SIP Submittal. 21865 Copley Drive, Diamond Bar, CA 91765, March, 2017. _____. Multiple Air Toxics Exposure Study in the South Coast Air Basin, MATES IV. Final Report, Appendix VI. 21865 Copley Drive, Diamond Bar, CA 91765, May, 2015. _____. 2020 Ozone Season and Wildfire Impacts, Advisor Magazine Page 7. 21865 Copley Drive, Diamond Bar, CA 91765, February, 2021. US Forest Service, 2021. Incident overview, El Dorado Fire, on January 21, 2021. https://inciweb.nwcg.gov/incident/7148/
POLB Air Quality Monitoring Program: CY 2020 Summary Report
June 2021 57
US Forest Service, 2020. Incident overview, Bobcat Fire, on October 17, 2020. https://inciweb.nwcg.gov/incident/7152/ US EPA, 2019. Impact of Wildland Fire Combustion Phase on PM and VOC Speciation and EPA’s national Emissions Inventory. International Emission Inventory conference, July 30-August 2, 2019, Dallas TX. US EPA, 2018. 2014 National Emissions Inventory, version 2, Technical Support Document. https://www.epa.gov/sites/production/files/2018-07/documents/nei2014v2_tsd_05jul2018.pdf. U.S. Environmental Protection Agency, 2004. Air Quality Criteria for Particulate Matter, Volume I. EPA/600/P-99/002aF, Office of Research and Development, Research Triangle Park, NC. _____. Instructions and Template for Requesting that Data from PM2.5 Continuous FEMs are not Compared to the NAAQS. 21865 Copley Drive, Diamond Bar, CA 91765, April, 2013.
APPENDIX A
POLB Air Quality Monitoring Program
Annual Report for 2020
Figures and Tables
Appendix A Table of Figures
Figure Page
Figure A-1. Gull Park Wind Rose for the Port of Long Beach Monitoring Program (2020) ............................... A-1 Figure A-2. Superblock Wind Rose for the Port of Long Beach Monitoring Program (2020) ............................ A-2 Figure A-3. Monthly Average CO Concentrations at POLB and Surrounding SCAQMD Stations (January 2007 -
December 2020) ............................................................................................................................. A-2 Figure A-4. Monthly Average NO2 Concentrations at POLB and Surrounding SCAQMD Stations (January 2007 -
December 2020) ............................................................................................................................. A-4 Figure A-5. Monthly Average O3 Concentrations at POLB and Surrounding SCAQMD Stations (January 2007 -
December 2020) ............................................................................................................................. A-5 Figure A-6. Monthly Average SO2 Concentrations at POLB and Surrounding SCAQMD Stations (January 2007 -
December 2020) ............................................................................................................................. A-6 Figure A-7. Monthly Average Filter-Based PM10 Concentrations at POLB and Surrounding SCAQMD Stations
(January 2007 - December 2020) ................................................................................................... A-7 Figure A-8. Monthly Average BAM PM10 Concentrations at POLB and Surrounding SCAQMD Stations (January
2007 - December 2020) .................................................................................................................. A-8 Figure A-9. Monthly Average Filter-Based PM2.5 Concentrations at POLB and Surrounding SCAQMD Stations
(January 2007 - December 2020) ................................................................................................... A-9 Figure A-10. Monthly Average Filter-Based PM2.5 Concentrations at POLB and Surrounding SCAQMD Stations
(January 2007 - December 2020) ................................................................................................... A-10 Figure A-11. Monthly Average Filter-Based Black Carbon Concentrations at POLB and Surrounding SCAQMD
Stations (January 2007 - December 2020) ..................................................................................... A-11

Figure A-1: Gull Park Wind Rose for the Port of Long Beach Monitoring Program (2020)
NORTH
SOUTH
WEST EAST
4%
8%
12%
16%
20%
WIND SPEED
(m/s)
>= 11.10
8.80 - 11.10
5.70 - 8.80
3.60 - 5.70
2.10 - 3.60
0.50 - 2.10
Calms: 2.54%
A-1
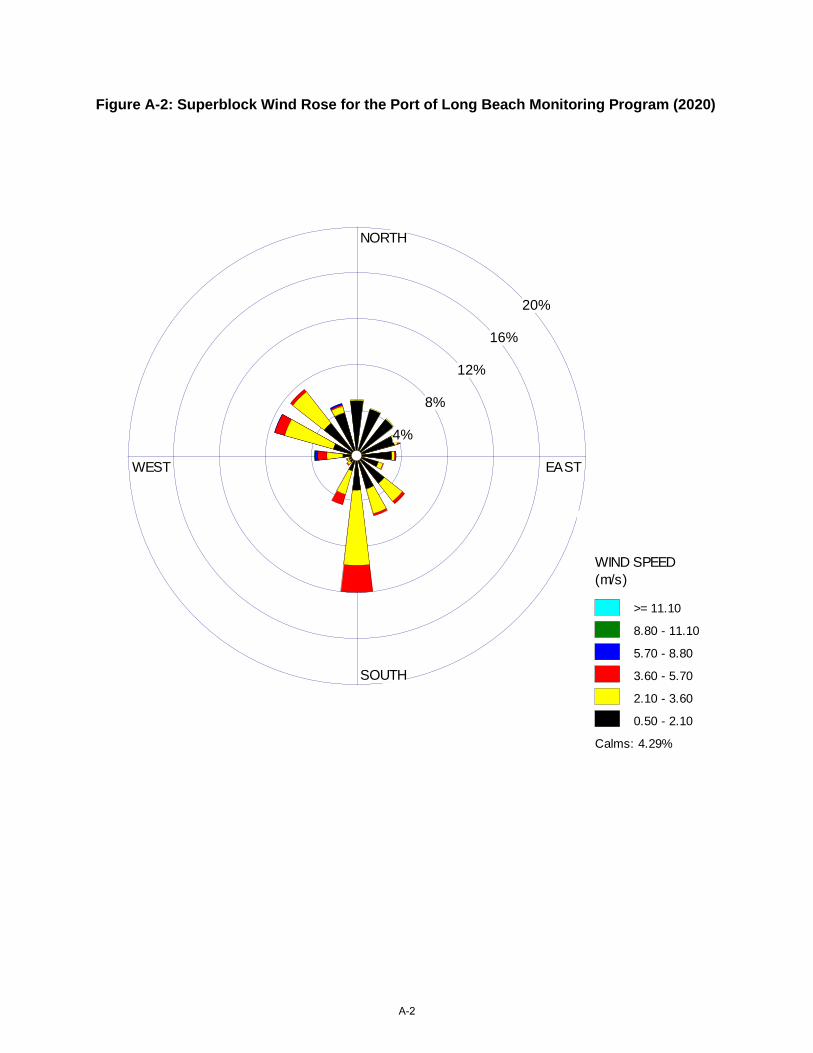
Figure A-2: Superblock Wind Rose for the Port of Long Beach Monitoring Program (2020)
NORTH
SOUTH
WEST EAST
4%
8%
12%
16%
20%
WIND SPEED
(m/s)
>= 11.10
8.80 - 11.10
5.70 - 8.80
3.60 - 5.70
2.10 - 3.60
0.50 - 2.10
Calms: 4.29%
A-2

0
2
4
6
8
10
Ave
rage
Mo
nth
ly C
O C
on
cen
trat
ion
(p
pm
)
Month
Figure A-3: Average Monthly CO Concentrations at the Port of Long Beachand Surrounding SCAQMD Monitoring Stations, January 2007 - December 2020
Super Block
Gull Park
North Long Beach
Long Beach - Webster/Signal Hill*
* In December 2019, the SCAQMD Long Beach station was moved from the Webster site to the Signal Hill site approximately three miles to the east.
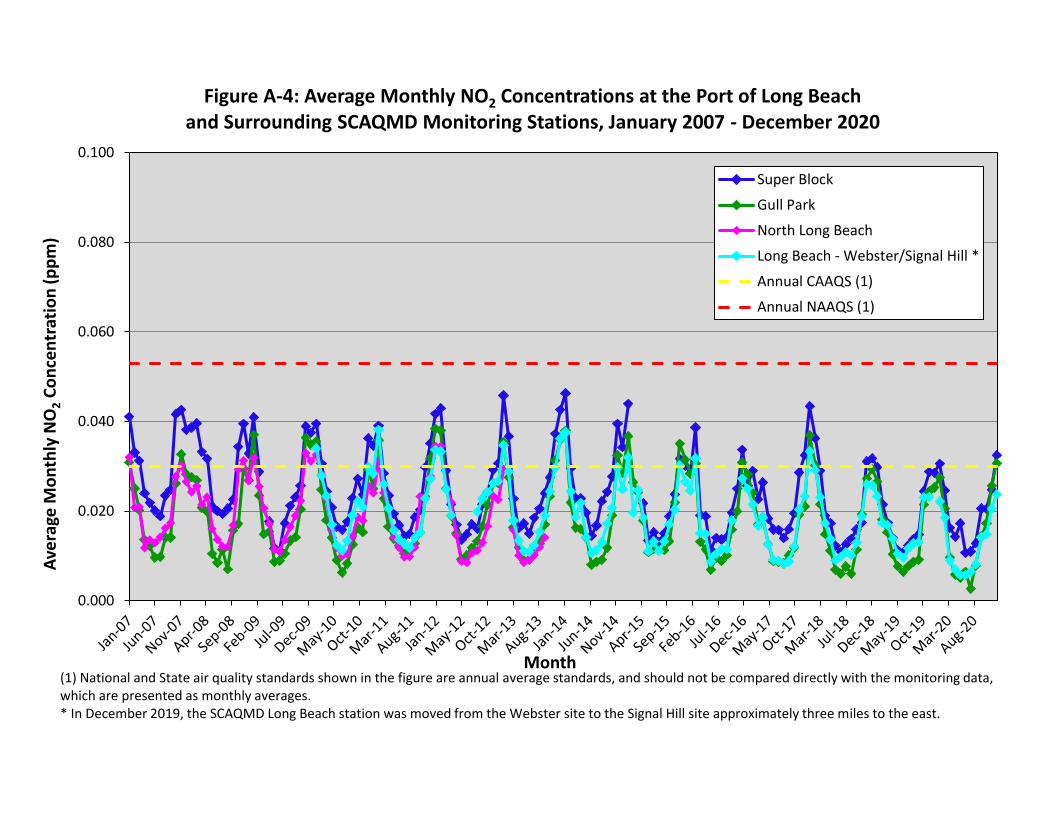
0.000
0.020
0.040
0.060
0.080
0.100
Ave
rage
Mo
nth
ly N
O2
Co
nce
ntr
atio
n (
pp
m)
Month
Figure A-4: Average Monthly NO2 Concentrations at the Port of Long Beachand Surrounding SCAQMD Monitoring Stations, January 2007 - December 2020
Super Block
Gull Park
North Long Beach
Long Beach - Webster/Signal Hill *
Annual CAAQS (1)
Annual NAAQS (1)
(1) National and State air quality standards shown in the figure are annual average standards, and should not be compared directly with the monitoring data, which are presented as monthly averages.* In December 2019, the SCAQMD Long Beach station was moved from the Webster site to the Signal Hill site approximately three miles to the east.
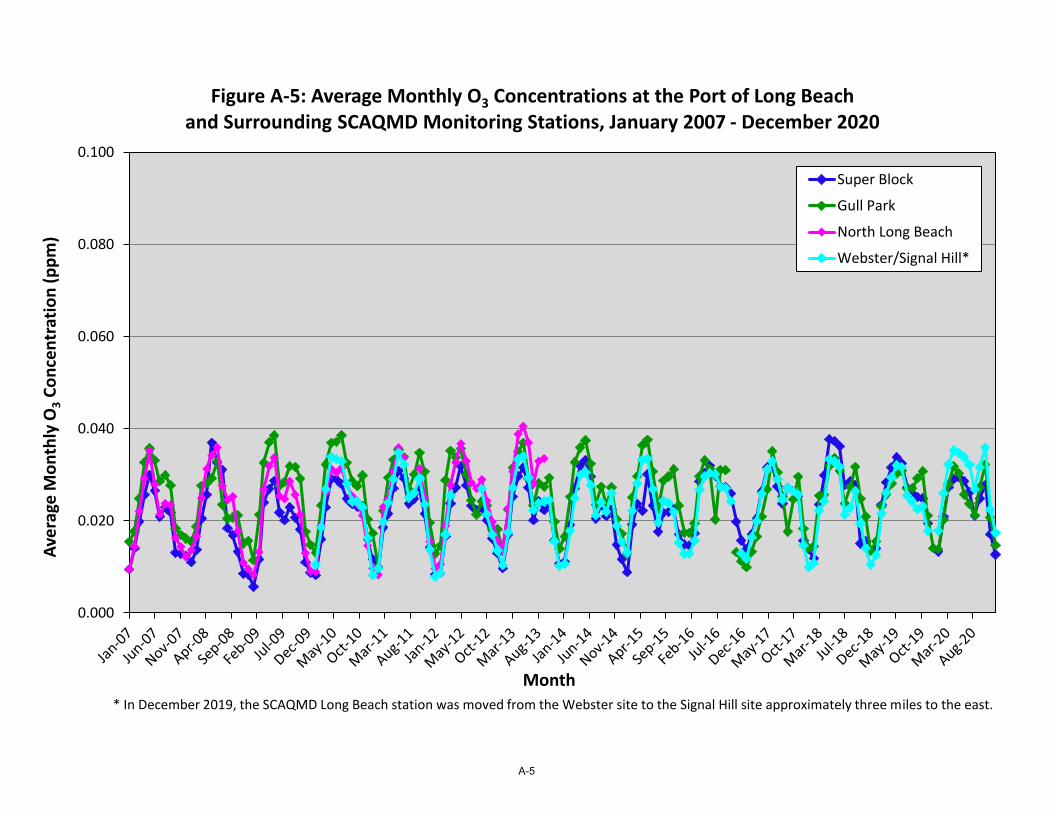
0.000
0.020
0.040
0.060
0.080
0.100
Ave
rage
Mo
nth
ly O
3C
on
cen
trat
ion
(p
pm
)
Month
Figure A-5: Average Monthly O3 Concentrations at the Port of Long Beachand Surrounding SCAQMD Monitoring Stations, January 2007 - December 2020
Super Block
Gull Park
North Long Beach
Webster/Signal Hill*
* In December 2019, the SCAQMD Long Beach station was moved from the Webster site to the Signal Hill site approximately three miles to the east.
A-5
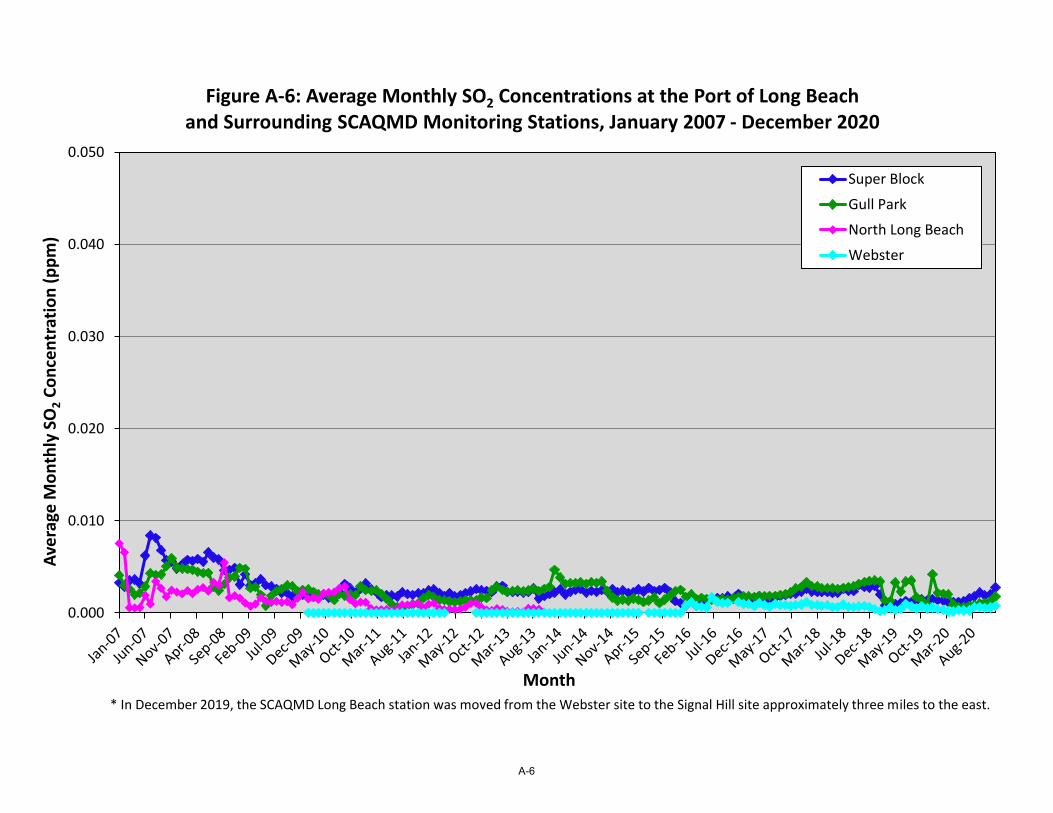
0.000
0.010
0.020
0.030
0.040
0.050
Ave
rage
Mo
nth
ly S
O2
Co
nce
ntr
atio
n (
pp
m)
Month
Figure A-6: Average Monthly SO2 Concentrations at the Port of Long Beachand Surrounding SCAQMD Monitoring Stations, January 2007 - December 2020
Super Block
Gull Park
North Long Beach
Webster
* In December 2019, the SCAQMD Long Beach station was moved from the Webster site to the Signal Hill site approximately three miles to the east.
A-6
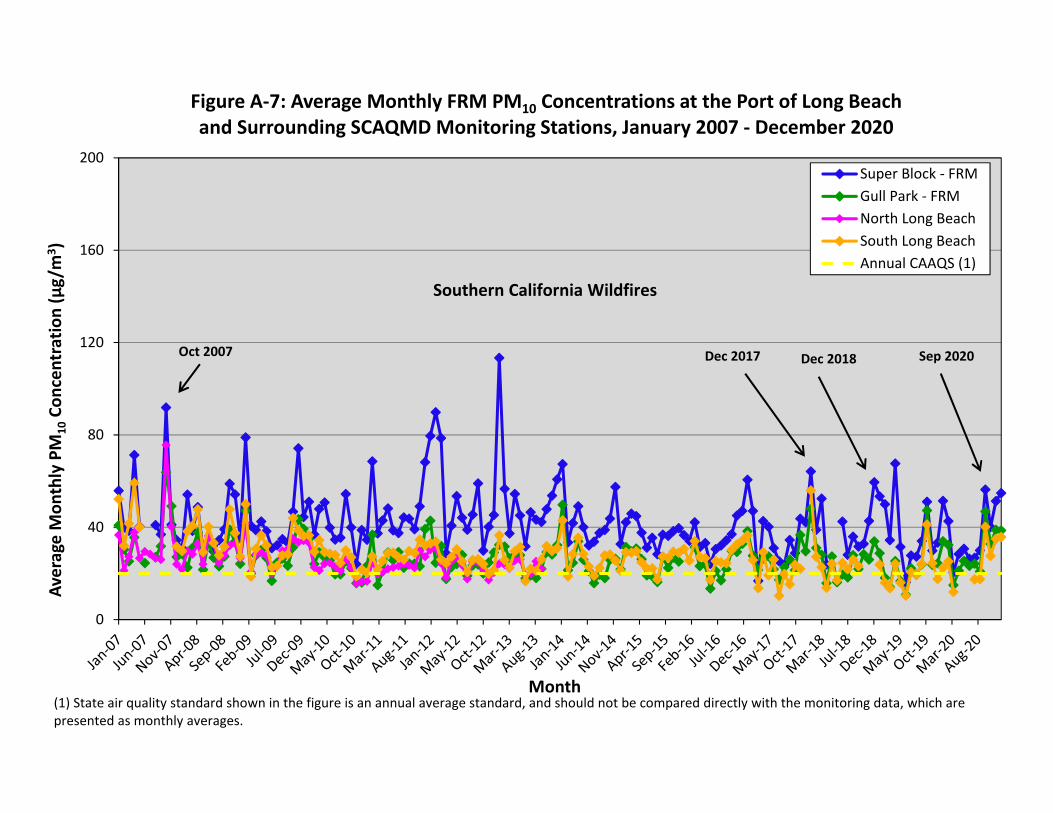
0
40
80
120
160
200
Ave
rage
Mo
nth
ly P
M1
0C
on
cen
trat
ion
(µ
g/m
3)
Month
Figure A-7: Average Monthly FRM PM10 Concentrations at the Port of Long Beachand Surrounding SCAQMD Monitoring Stations, January 2007 - December 2020
Super Block - FRM
Gull Park - FRM
North Long Beach
South Long Beach
Annual CAAQS (1)
(1) State air quality standard shown in the figure is an annual average standard, and should not be compared directly with the monitoring data, which are presented as monthly averages.
Oct 2007
Southern California Wildfires
Dec 2017 Dec 2018 Sep 2020
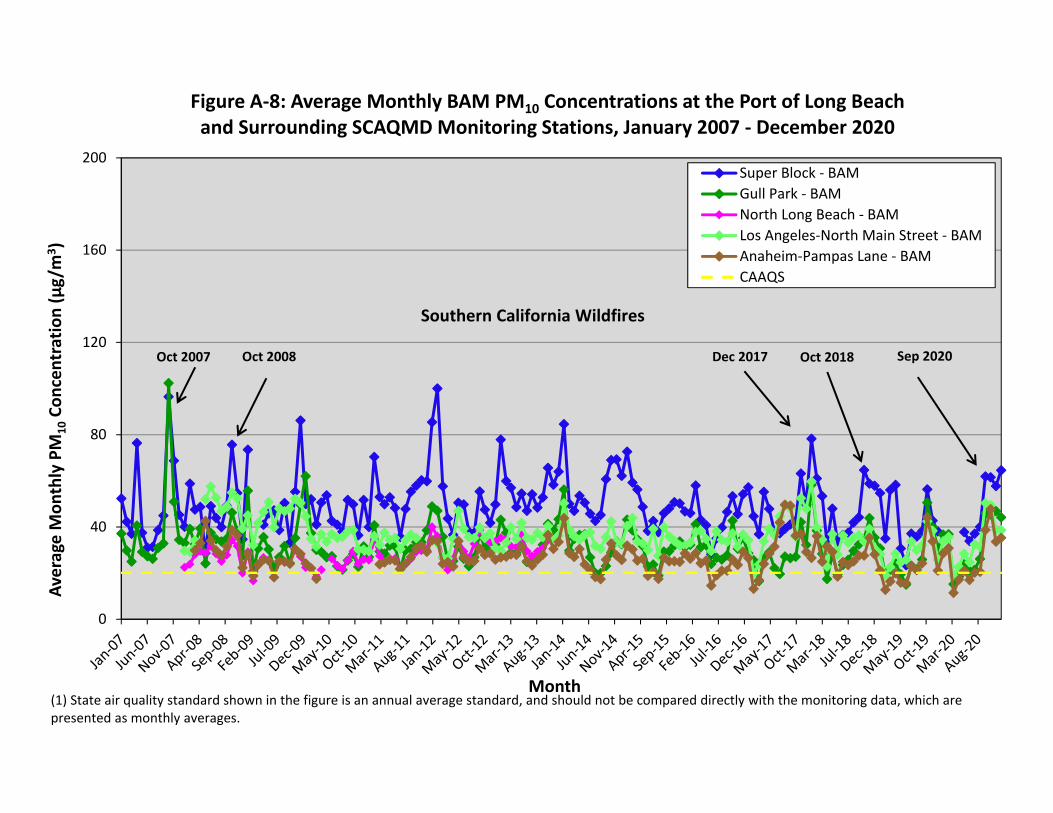
0
40
80
120
160
200
Ave
rage
Mo
nth
ly P
M1
0C
on
cen
trat
ion
(µ
g/m
3)
Month
Figure A-8: Average Monthly BAM PM10 Concentrations at the Port of Long Beachand Surrounding SCAQMD Monitoring Stations, January 2007 - December 2020
Super Block - BAM
Gull Park - BAM
North Long Beach - BAM
Los Angeles-North Main Street - BAM
Anaheim-Pampas Lane - BAM
CAAQS
(1) State air quality standard shown in the figure is an annual average standard, and should not be compared directly with the monitoring data, which are presented as monthly averages.
Oct 2007 Oct 2008
Southern California Wildfires
Dec 2017 Oct 2018 Sep 2020
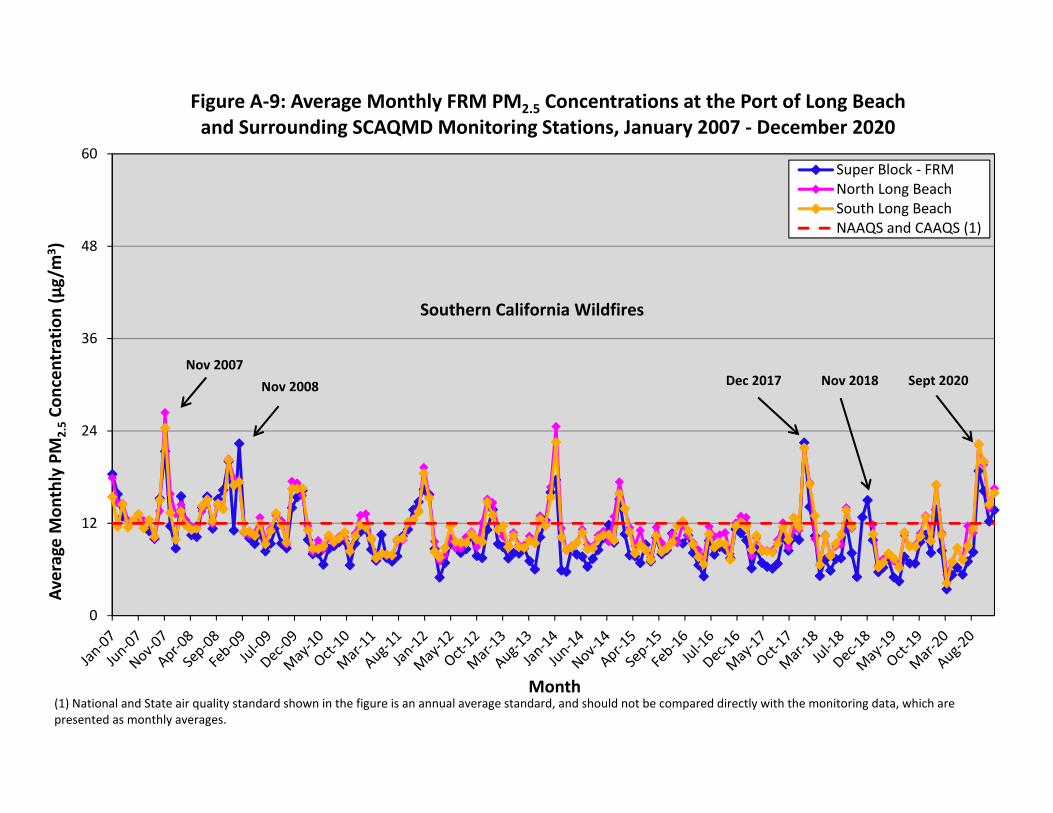
0
12
24
36
48
60
Ave
rage
Mo
nth
ly P
M2
.5C
on
cen
trat
ion
(µ
g/m
3)
Month
Figure A-9: Average Monthly FRM PM2.5 Concentrations at the Port of Long Beachand Surrounding SCAQMD Monitoring Stations, January 2007 - December 2020
Super Block - FRMNorth Long BeachSouth Long BeachNAAQS and CAAQS (1)
(1) National and State air quality standard shown in the figure is an annual average standard, and should not be compared directly with the monitoring data, which are presented as monthly averages.
Nov 2007
Nov 2008 Dec 2017 Nov 2018 Sept 2020
Southern California Wildfires
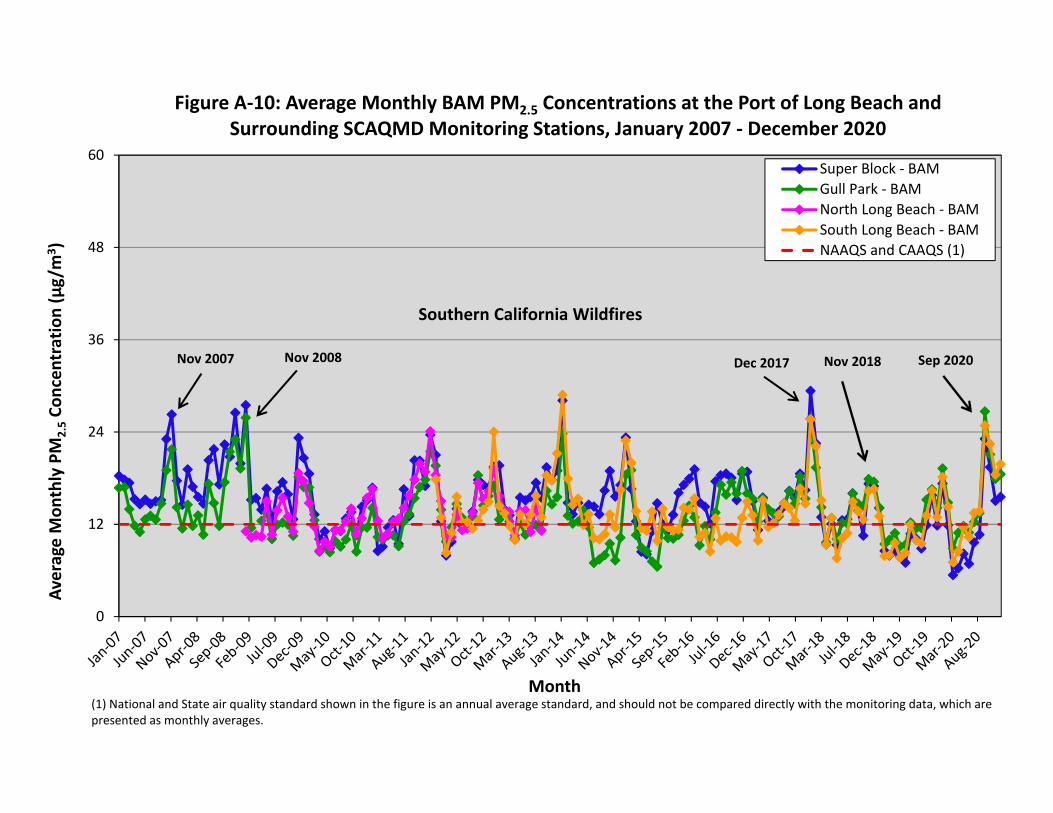
0
12
24
36
48
60
Ave
rage
Mo
nth
ly P
M2
.5C
on
cen
trat
ion
(µ
g/m
3)
Month
Figure A-10: Average Monthly BAM PM2.5 Concentrations at the Port of Long Beach and Surrounding SCAQMD Monitoring Stations, January 2007 - December 2020
Super Block - BAM
Gull Park - BAM
North Long Beach - BAM
South Long Beach - BAM
NAAQS and CAAQS (1)
Nov 2018
(1) National and State air quality standard shown in the figure is an annual average standard, and should not be compared directly with the monitoring data, which are presented as monthly averages.
Sep 2020Nov 2007 Nov 2008
Southern California Wildfires
Dec 2017

0
2
4
6
8
10
Ave
rage
Mo
nth
ly B
C C
on
cen
trat
ion
(µ
g/m
3)
Month
Figure A-11: Average Monthly Black Carbon Concentrations at the Port of Long Beach,September 2012 - December 2020
POLB - Super Block
POLB - Gull Park
POLA - Source Dominated
SCAQMD - Webster
(1) There are currently no State or National Ambient Air Quality Standards for Black Carbon.
Appendix A-2 Table of Tables
Table Page
Table A-1. Maximum 1-Hour CO Concentrations .............................................................................................. A-12
Table A-2. Maximum 8-Hour CO Concentrations .............................................................................................. A-12
Table A-3. Annual Average CO Concentrations (ppm) ..................................................................................... A-13
Table A-4. CO Data Recovery (1-Hr Data Points) ............................................................................................. A-13
Table A-5. Daily Maximum 1-Hr Average NO2 Concentrations (ppm) During 2020 .......................................... A-14
Table A-6. 98th Percentile of the Daily Maximum 1-Hr Average NO2 Concentrations (ppm) ............................. A-14
Table A-7. Annual Average NO2 Concentrations (ppm) ................................................................................... A-15
Table A-8. NO2 Data Recovery (1-Hr Data Points) ........................................................................................... A-15
Table A-9. Daily Maximum 8-Hr Average O3 Concentrations (ppm) During ..................................................... A-16
Table A-10. Fourth Highest 8-Hr O3 Concentrations (ppm) ................................................................................. A-17
Table A-11. Maximum 1-Hr O3 Concentrations (ppm)......................................................................................... A-17
Table A-12. O3 Data Recovery (1-Hr Data Points) .............................................................................................. A-17
Table A-13. Highest Daily Maximum 1-Hr SO2 Concentrations (ppm) During 2020............................................ A-18
Table A-14. 99th Percentile of the Daily Maximum 1-Hr Average SO2 Concentrations (ppm .............................. A-18
Table A-15. Maximum 24-Hr SO2 Concentrations (ppm) .................................................................................... A-18
Table A-16. Annual Average SO2 Concentrations (ppm) .................................................................................... A-19
Table A-17. Maximum 3-Hr Average SO2 concentrations (ppm) ......................................................................... A-19
Table A-18. SO2 Data Recovery (1-Hr Data Points)............................................................................................ A-19
Table A-19. Filter-Based PM10 Concentrations (μg/m3) ....................................................................................... A-20
Table A-20. Continuous BAM PM10 Concentrations (μg/m3) ............................................................................... A-22
Table A-21. Maximum 24-Hr Average PM10 FRM Concentrations (μg/m3) ......................................................... A-24
Table A-22. Maximum 24-Hr Average PM10 BAM Concentrations (μg/m3) ......................................................... A-24
Table A-23. Annual Average PM10 Concentrations (μg/m3) ................................................................................ A-24
Table A-24. PM10 Data Recovery (1-Hr and 24-Hr Data Points) ......................................................................... A-24
Table A-25. Filter-Based PM2.5 Concentrations (μg/m3) ...................................................................................... A-25
Table A-26. Continuous BAM PM2.5 Concentrations (μg/m3) .............................................................................. A-28
Table A-27. Highest 24-Hr Average PM2.5 Concentrations (μg/m3) ..................................................................... A-31
Table A-28. 98th Percentile of the 24-Hr Average PM2.5 Average Concentrations (μg/m3) .................................. A-32
Table A-29. Annual Average PM2.5 Concentrations (μg/m3) ................................................................................ A-32
Table A-30. PM2.5 Data Recovery (1-Hr and 24-Hr Data Points) ........................................................................ A-32
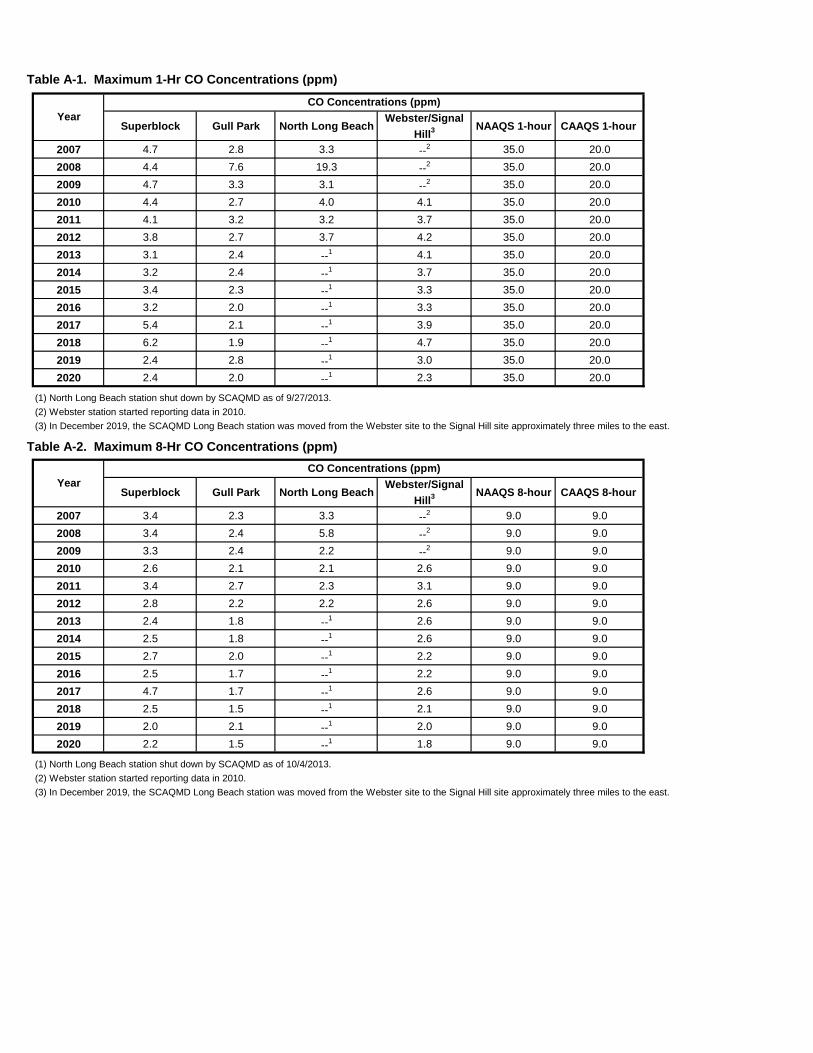
Table A-1. Maximum 1-Hr CO Concentrations (ppm)
Superblock Gull Park North Long BeachWebster/Signal
Hill3 NAAQS 1-hour CAAQS 1-hour
2007 4.7 2.8 3.3 --2 35.0 20.0
2008 4.4 7.6 19.3 --2 35.0 20.0
2009 4.7 3.3 3.1 --2 35.0 20.0
2010 4.4 2.7 4.0 4.1 35.0 20.0
2011 4.1 3.2 3.2 3.7 35.0 20.0
2012 3.8 2.7 3.7 4.2 35.0 20.0
2013 3.1 2.4 --1 4.1 35.0 20.0
2014 3.2 2.4 --1 3.7 35.0 20.0
2015 3.4 2.3 --1 3.3 35.0 20.0
2016 3.2 2.0 --1 3.3 35.0 20.0
2017 5.4 2.1 --1 3.9 35.0 20.0
2018 6.2 1.9 --1 4.7 35.0 20.0
2019 2.4 2.8 --1 3.0 35.0 20.0
2020 2.4 2.0 --1 2.3 35.0 20.0
(1) North Long Beach station shut down by SCAQMD as of 9/27/2013.
(2) Webster station started reporting data in 2010.
(3) In December 2019, the SCAQMD Long Beach station was moved from the Webster site to the Signal Hill site approximately three miles to the east.
Table A-2. Maximum 8-Hr CO Concentrations (ppm)
Superblock Gull Park North Long BeachWebster/Signal
Hill3 NAAQS 8-hour CAAQS 8-hour
2007 3.4 2.3 3.3 --2 9.0 9.0
2008 3.4 2.4 5.8 --2 9.0 9.0
2009 3.3 2.4 2.2 --2 9.0 9.0
2010 2.6 2.1 2.1 2.6 9.0 9.0
2011 3.4 2.7 2.3 3.1 9.0 9.0
2012 2.8 2.2 2.2 2.6 9.0 9.0
2013 2.4 1.8 --1 2.6 9.0 9.0
2014 2.5 1.8 --1 2.6 9.0 9.0
2015 2.7 2.0 --1 2.2 9.0 9.0
2016 2.5 1.7 --1 2.2 9.0 9.0
2017 4.7 1.7 --1 2.6 9.0 9.0
2018 2.5 1.5 --1 2.1 9.0 9.0
2019 2.0 2.1 --1 2.0 9.0 9.0
2020 2.2 1.5 --1 1.8 9.0 9.0
(1) North Long Beach station shut down by SCAQMD as of 10/4/2013.
(2) Webster station started reporting data in 2010.
(3) In December 2019, the SCAQMD Long Beach station was moved from the Webster site to the Signal Hill site approximately three miles to the east.
Year
Year
CO Concentrations (ppm)
CO Concentrations (ppm)
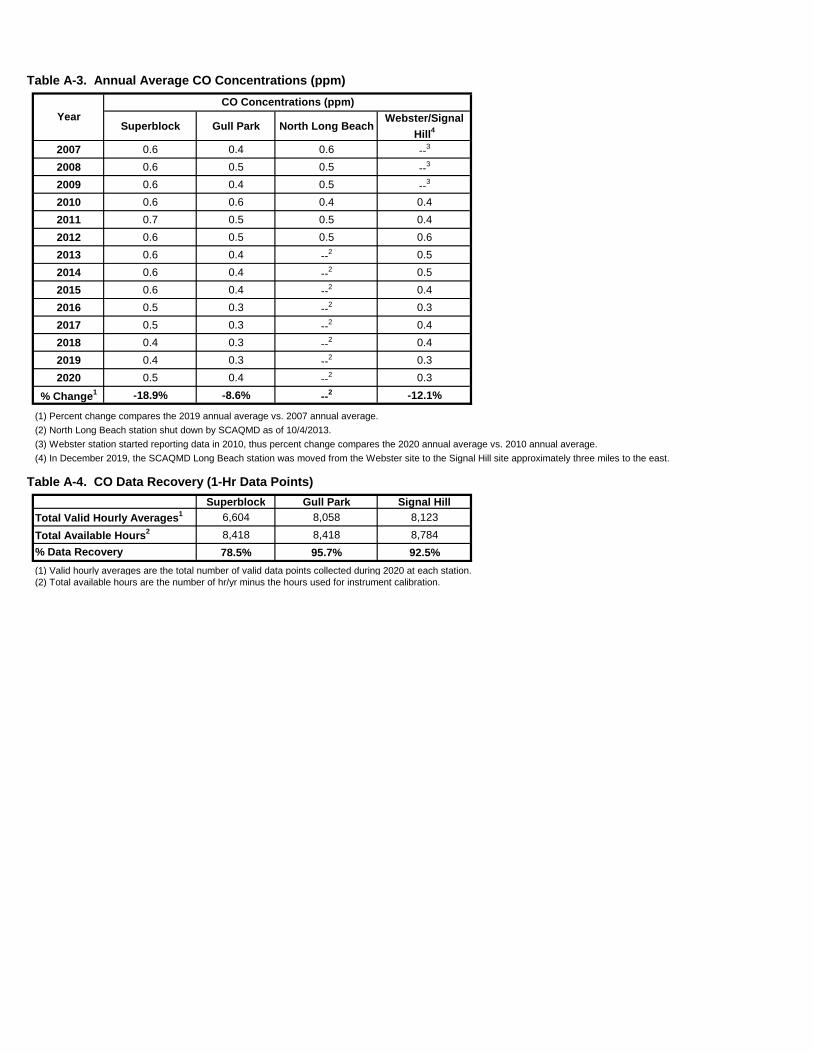
Table A-3. Annual Average CO Concentrations (ppm)
Superblock Gull Park North Long BeachWebster/Signal
Hill4
2007 0.6 0.4 0.6 --3
2008 0.6 0.5 0.5 --3
2009 0.6 0.4 0.5 --3
2010 0.6 0.6 0.4 0.4
2011 0.7 0.5 0.5 0.4
2012 0.6 0.5 0.5 0.6
2013 0.6 0.4 --2 0.5
2014 0.6 0.4 --2 0.5
2015 0.6 0.4 --2 0.4
2016 0.5 0.3 --2 0.3
2017 0.5 0.3 --2 0.4
2018 0.4 0.3 --2 0.4
2019 0.4 0.3 --2 0.3
2020 0.5 0.4 --2 0.3
% Change1 -18.9% -8.6% --
2 -12.1%
(1) Percent change compares the 2019 annual average vs. 2007 annual average.
(2) North Long Beach station shut down by SCAQMD as of 10/4/2013.
(3) Webster station started reporting data in 2010, thus percent change compares the 2020 annual average vs. 2010 annual average.
(4) In December 2019, the SCAQMD Long Beach station was moved from the Webster site to the Signal Hill site approximately three miles to the east.
Table A-4. CO Data Recovery (1-Hr Data Points)
Superblock Gull Park Signal Hill
6,604 8,058 8,123
8,418 8,418 8,784
78.5% 95.7% 92.5%
(1) Valid hourly averages are the total number of valid data points collected during 2020 at each station.(2) Total available hours are the number of hr/yr minus the hours used for instrument calibration.
Total Valid Hourly Averages1
Total Available Hours2
% Data Recovery
Year
CO Concentrations (ppm)
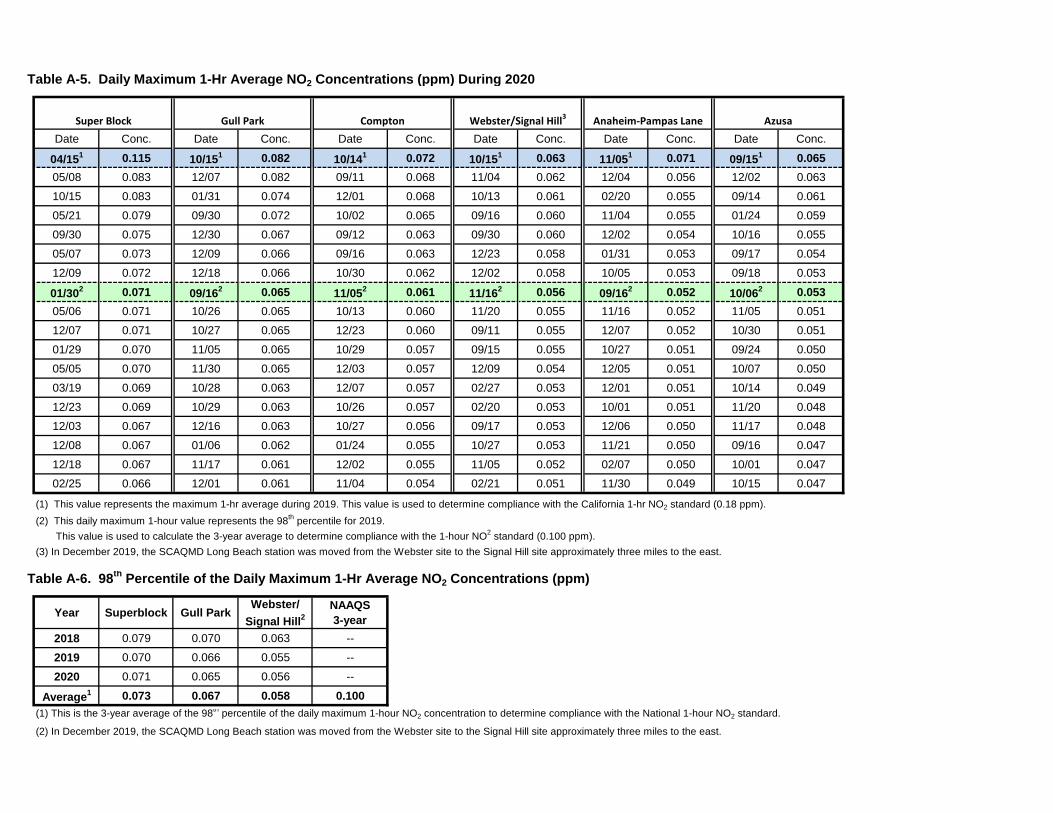
Table A-5. Daily Maximum 1-Hr Average NO2 Concentrations (ppm) During 2020
Date Conc. Date Conc. Date Conc. Date Conc. Date Conc. Date Conc.
04/151 0.115 10/151 0.082 10/141 0.072 10/151 0.063 11/051 0.071 09/151 0.065
05/08 0.083 12/07 0.082 09/11 0.068 11/04 0.062 12/04 0.056 12/02 0.063
10/15 0.083 01/31 0.074 12/01 0.068 10/13 0.061 02/20 0.055 09/14 0.061
05/21 0.079 09/30 0.072 10/02 0.065 09/16 0.060 11/04 0.055 01/24 0.059
09/30 0.075 12/30 0.067 09/12 0.063 09/30 0.060 12/02 0.054 10/16 0.055
05/07 0.073 12/09 0.066 09/16 0.063 12/23 0.058 01/31 0.053 09/17 0.054
12/09 0.072 12/18 0.066 10/30 0.062 12/02 0.058 10/05 0.053 09/18 0.053
01/302 0.071 09/16
2 0.065 11/052 0.061 11/16
2 0.056 09/162 0.052 10/06
2 0.053
05/06 0.071 10/26 0.065 10/13 0.060 11/20 0.055 11/16 0.052 11/05 0.051
12/07 0.071 10/27 0.065 12/23 0.060 09/11 0.055 12/07 0.052 10/30 0.051
01/29 0.070 11/05 0.065 10/29 0.057 09/15 0.055 10/27 0.051 09/24 0.050
05/05 0.070 11/30 0.065 12/03 0.057 12/09 0.054 12/05 0.051 10/07 0.050
03/19 0.069 10/28 0.063 12/07 0.057 02/27 0.053 12/01 0.051 10/14 0.049
12/23 0.069 10/29 0.063 10/26 0.057 02/20 0.053 10/01 0.051 11/20 0.048
12/03 0.067 12/16 0.063 10/27 0.056 09/17 0.053 12/06 0.050 11/17 0.048
12/08 0.067 01/06 0.062 01/24 0.055 10/27 0.053 11/21 0.050 09/16 0.047
12/18 0.067 11/17 0.061 12/02 0.055 11/05 0.052 02/07 0.050 10/01 0.047
02/25 0.066 12/01 0.061 11/04 0.054 02/21 0.051 11/30 0.049 10/15 0.047
(1) This value represents the maximum 1-hr average during 2019. This value is used to determine compliance with the California 1-hr NO2 standard (0.18 ppm).
(2) This daily maximum 1-hour value represents the 98th
percentile for 2019.
This value is used to calculate the 3-year average to determine compliance with the 1-hour NO2 standard (0.100 ppm).
(3) In December 2019, the SCAQMD Long Beach station was moved from the Webster site to the Signal Hill site approximately three miles to the east.
Table A-6. 98th
Percentile of the Daily Maximum 1-Hr Average NO2 Concentrations (ppm)
Year Superblock Gull ParkWebster/
Signal Hill2NAAQS
3-year
2018 0.079 0.070 0.063 --
2019 0.070 0.066 0.055 --
2020 0.071 0.065 0.056 --
Average1 0.073 0.067 0.058 0.100
(1) This is the 3-year average of the 98th
percentile of the daily maximum 1-hour NO2 concentration to determine compliance with the National 1-hour NO2 standard.
(2) In December 2019, the SCAQMD Long Beach station was moved from the Webster site to the Signal Hill site approximately three miles to the east.
AzusaCompton Anaheim-Pampas Lane Super Block Gull Park Webster/Signal Hill3
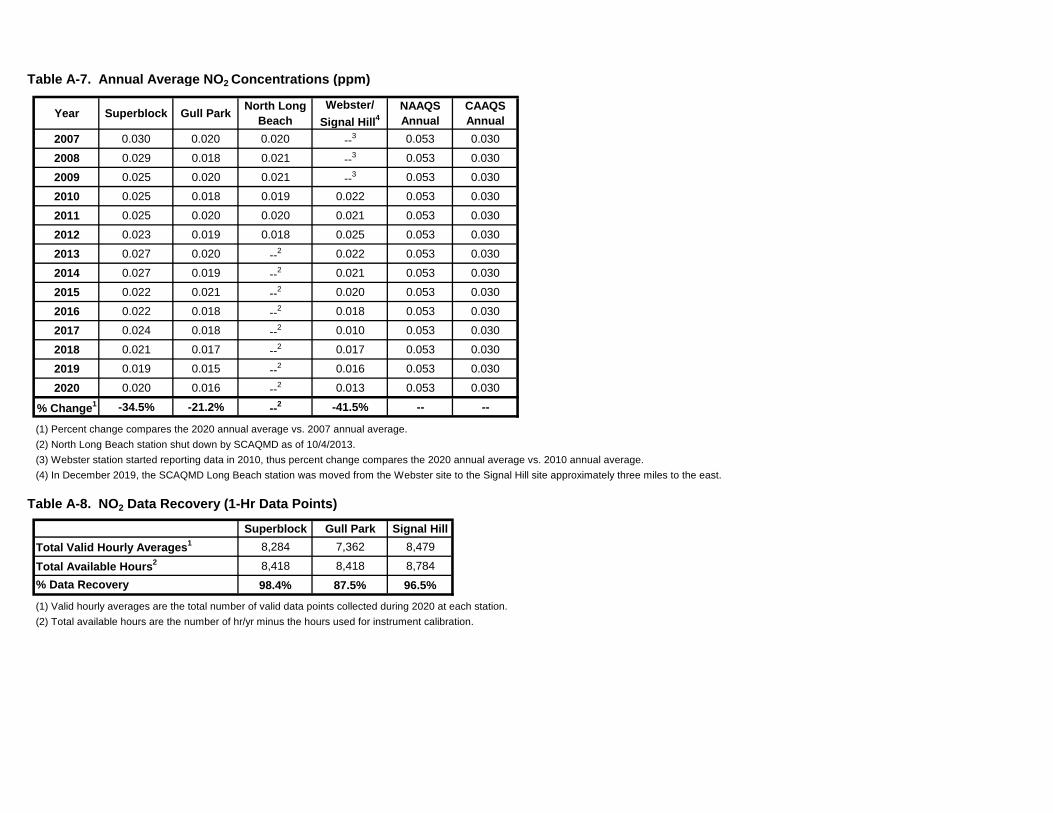
Table A-7. Annual Average NO2 Concentrations (ppm)
Year Superblock Gull ParkNorth Long
Beach
Webster/
Signal Hill4
NAAQS
Annual
CAAQS
Annual
2007 0.030 0.020 0.020 --3 0.053 0.030
2008 0.029 0.018 0.021 --3 0.053 0.030
2009 0.025 0.020 0.021 --3 0.053 0.030
2010 0.025 0.018 0.019 0.022 0.053 0.030
2011 0.025 0.020 0.020 0.021 0.053 0.030
2012 0.023 0.019 0.018 0.025 0.053 0.030
2013 0.027 0.020 --2 0.022 0.053 0.030
2014 0.027 0.019 --2 0.021 0.053 0.030
2015 0.022 0.021 --2 0.020 0.053 0.030
2016 0.022 0.018 --2 0.018 0.053 0.030
2017 0.024 0.018 --2 0.010 0.053 0.030
2018 0.021 0.017 --2 0.017 0.053 0.030
2019 0.019 0.015 --2 0.016 0.053 0.030
2020 0.020 0.016 --2 0.013 0.053 0.030
% Change1 -34.5% -21.2% --2 -41.5% -- --
(1) Percent change compares the 2020 annual average vs. 2007 annual average.
(2) North Long Beach station shut down by SCAQMD as of 10/4/2013.
(3) Webster station started reporting data in 2010, thus percent change compares the 2020 annual average vs. 2010 annual average.
(4) In December 2019, the SCAQMD Long Beach station was moved from the Webster site to the Signal Hill site approximately three miles to the east.
Table A-8. NO2 Data Recovery (1-Hr Data Points)
Superblock Gull Park Signal Hill
8,284 7,362 8,479
8,418 8,418 8,784
98.4% 87.5% 96.5%
(1) Valid hourly averages are the total number of valid data points collected during 2020 at each station.
(2) Total available hours are the number of hr/yr minus the hours used for instrument calibration.
Total Valid Hourly Averages1
Total Available Hours2
% Data Recovery
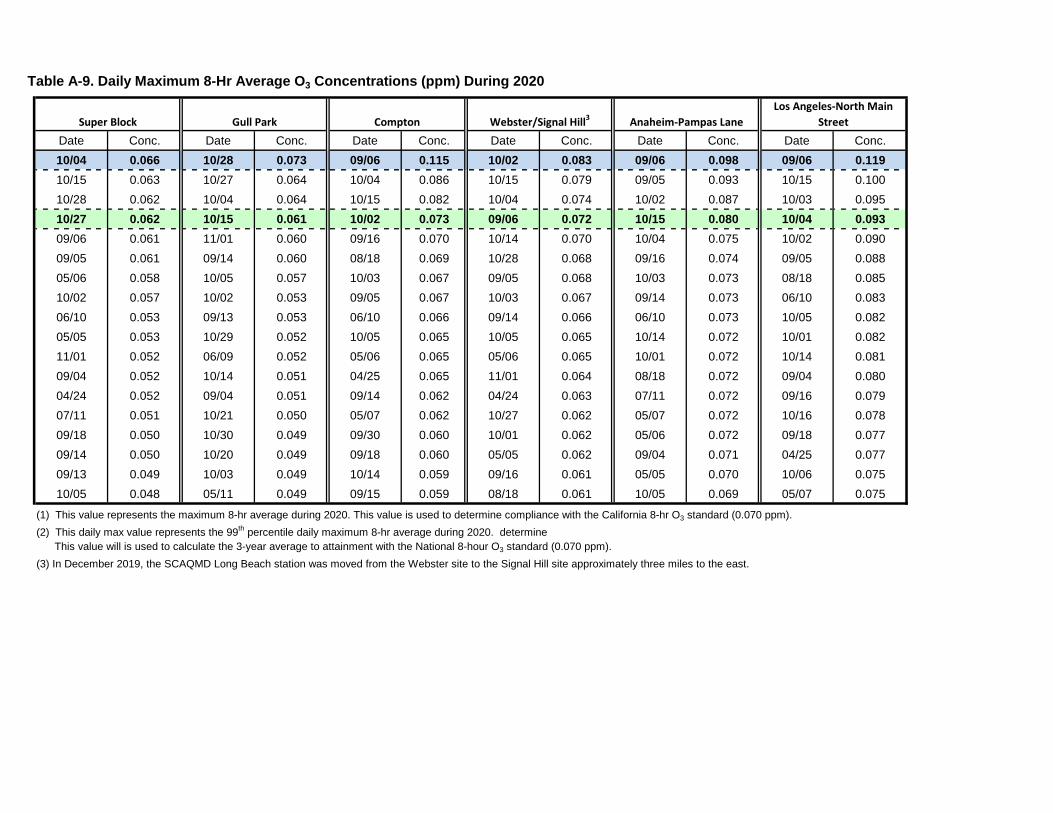
Table A-9. Daily Maximum 8-Hr Average O3 Concentrations (ppm) During 2020
Date Conc. Date Conc. Date Conc. Date Conc. Date Conc. Date Conc.
10/04 0.066 10/28 0.073 09/06 0.115 10/02 0.083 09/06 0.098 09/06 0.119
10/15 0.063 10/27 0.064 10/04 0.086 10/15 0.079 09/05 0.093 10/15 0.100
10/28 0.062 10/04 0.064 10/15 0.082 10/04 0.074 10/02 0.087 10/03 0.095
10/27 0.062 10/15 0.061 10/02 0.073 09/06 0.072 10/15 0.080 10/04 0.093
09/06 0.061 11/01 0.060 09/16 0.070 10/14 0.070 10/04 0.075 10/02 0.090
09/05 0.061 09/14 0.060 08/18 0.069 10/28 0.068 09/16 0.074 09/05 0.088
05/06 0.058 10/05 0.057 10/03 0.067 09/05 0.068 10/03 0.073 08/18 0.085
10/02 0.057 10/02 0.053 09/05 0.067 10/03 0.067 09/14 0.073 06/10 0.083
06/10 0.053 09/13 0.053 06/10 0.066 09/14 0.066 06/10 0.073 10/05 0.082
05/05 0.053 10/29 0.052 10/05 0.065 10/05 0.065 10/14 0.072 10/01 0.082
11/01 0.052 06/09 0.052 05/06 0.065 05/06 0.065 10/01 0.072 10/14 0.081
09/04 0.052 10/14 0.051 04/25 0.065 11/01 0.064 08/18 0.072 09/04 0.080
04/24 0.052 09/04 0.051 09/14 0.062 04/24 0.063 07/11 0.072 09/16 0.079
07/11 0.051 10/21 0.050 05/07 0.062 10/27 0.062 05/07 0.072 10/16 0.078
09/18 0.050 10/30 0.049 09/30 0.060 10/01 0.062 05/06 0.072 09/18 0.077
09/14 0.050 10/20 0.049 09/18 0.060 05/05 0.062 09/04 0.071 04/25 0.077
09/13 0.049 10/03 0.049 10/14 0.059 09/16 0.061 05/05 0.070 10/06 0.075
10/05 0.048 05/11 0.049 09/15 0.059 08/18 0.061 10/05 0.069 05/07 0.075
(1) This value represents the maximum 8-hr average during 2020. This value is used to determine compliance with the California 8-hr O3 standard (0.070 ppm).
(2) This daily max value represents the 99th percentile daily maximum 8-hr average during 2020. determine
This value will is used to calculate the 3-year average to attainment with the National 8-hour O3 standard (0.070 ppm).
(3) In December 2019, the SCAQMD Long Beach station was moved from the Webster site to the Signal Hill site approximately three miles to the east.
Los Angeles-North Main
StreetSuper Block Compton Anaheim-Pampas Lane Gull Park Webster/Signal Hill3

Table A-10. Fourth Highest 8-Hr O3 Concentrations (ppm) Table A-12. O3 Data Recovery (1-Hr Data Points)
Year Superblock Gull ParkWebster/
Signal Hill3NAAQS
8-Hr Superblock Gull Park Signal Hill
2018 0.056 0.051 0.054 -- 8,385 8,196 8,351
2019 0.055 0.056 0.056 -- Total Available Hours2 8,418 8,418 8,784
2020 0.062 0.061 0.072 -- % Data Recovery 99.6% 97.4% 95.1%
Average1 0.058 0.056 0.061 0.0702(1) Valid hourly averages are total number of valid points collected during 2020 at each station.
(1) This is the 3-year average of the 99th percentile daily maximum 8-hour O3 (2) Total available hours are the number of hr/yr minus the hours used for instrument calibration.
concentration to determine compliance with the 8-hour O3 standard.
(2) The 8-Hr O3 NAAQS was revised to 0.070 on Dec 28, 2015.
(3) In December 2019, the SCAQMD Long Beach station was moved from the
Webster site to the Signal Hill site approximately three miles to the east.
Table A-11. Maximum 1-Hr O3 Concentrations (ppm)
Year Superblock Gull ParkNorth Long
Beach
Webster/
Signal Hill3CAAQS
1-Hr
2007 0.093 0.100 0.099 --2 0.090
2008 0.091 0.091 0.093 --2 0.090
2009 0.069 0.072 0.089 --2 0.090
2010 0.089 0.094 0.101 0.099 0.090
2011 0.065 0.081 0.074 0.075 0.090
2012 0.069 0.076 0.084 0.081 0.090
2013 0.081 0.079 --1 0.090 0.090
2014 0.078 0.087 --1 0.088 0.090
2015 0.077 0.078 --1 0.088 0.090
2016 0.077 0.071 --1 0.076 0.090
2017 0.084 0.081 --1 0.085 0.090
2018 0.075 0.075 --1 0.074 0.090
2019 0.080 0.079 --1 0.076 0.090
2020 0.095 0.114 --1 0.105 0.090
(1) North Long Beach station shut down by SCAQMD as of 10/4/2013.
(2) Webster station started reporting data in 2010.
(3) In December 2019, the SCAQMD Long Beach station was moved from the Webster site to the Signal Hill site approximately three miles to the east.
Total Valid Hourly Averages1
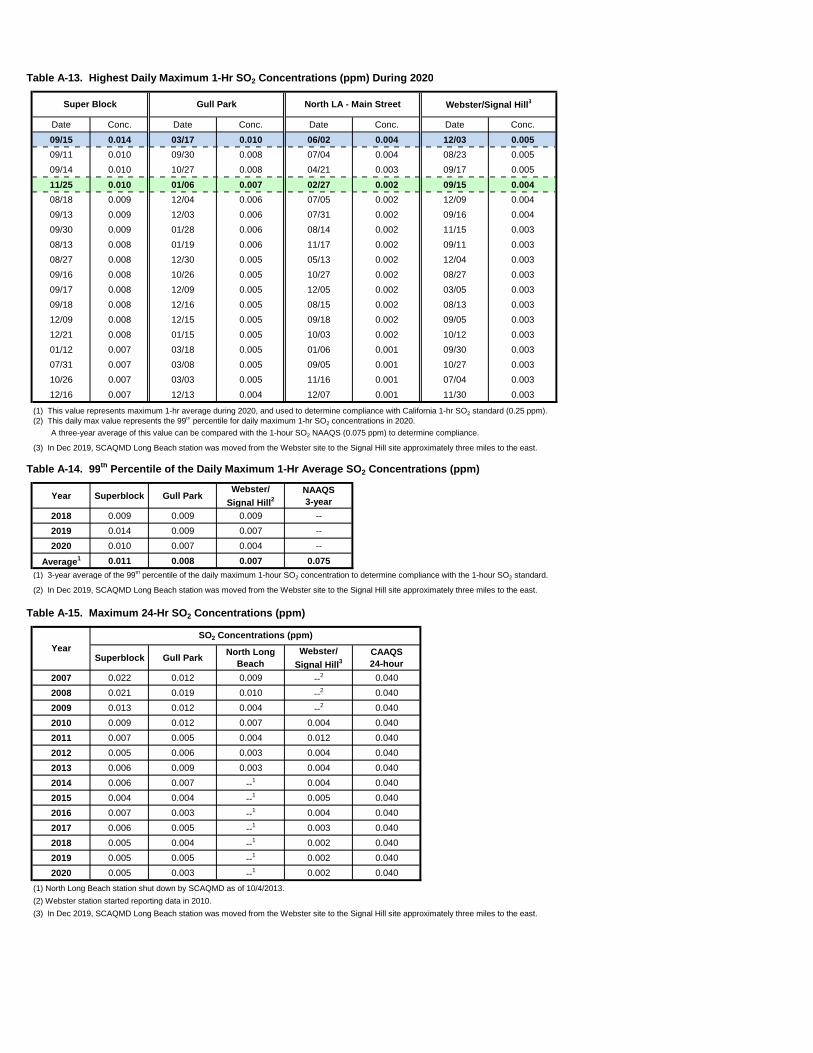
Table A-13. Highest Daily Maximum 1-Hr SO2 Concentrations (ppm) During 2020
Date Conc. Date Conc. Date Conc. Date Conc.
09/15 0.014 03/17 0.010 06/02 0.004 12/03 0.005
09/11 0.010 09/30 0.008 07/04 0.004 08/23 0.005
09/14 0.010 10/27 0.008 04/21 0.003 09/17 0.005
11/25 0.010 01/06 0.007 02/27 0.002 09/15 0.004
08/18 0.009 12/04 0.006 07/05 0.002 12/09 0.004
09/13 0.009 12/03 0.006 07/31 0.002 09/16 0.004
09/30 0.009 01/28 0.006 08/14 0.002 11/15 0.003
08/13 0.008 01/19 0.006 11/17 0.002 09/11 0.003
08/27 0.008 12/30 0.005 05/13 0.002 12/04 0.003
09/16 0.008 10/26 0.005 10/27 0.002 08/27 0.003
09/17 0.008 12/09 0.005 12/05 0.002 03/05 0.003
09/18 0.008 12/16 0.005 08/15 0.002 08/13 0.003
12/09 0.008 12/15 0.005 09/18 0.002 09/05 0.003
12/21 0.008 01/15 0.005 10/03 0.002 10/12 0.003
01/12 0.007 03/18 0.005 01/06 0.001 09/30 0.003
07/31 0.007 03/08 0.005 09/05 0.001 10/27 0.003
10/26 0.007 03/03 0.005 11/16 0.001 07/04 0.003
12/16 0.007 12/13 0.004 12/07 0.001 11/30 0.003
(1) This value represents maximum 1-hr average during 2020, and used to determine compliance with California 1-hr SO2 standard (0.25 ppm).(2) This daily max value represents the 99th percentile for daily maximum 1-hr SO2 concentrations in 2020.
A three-year average of this value can be compared with the 1-hour SO2 NAAQS (0.075 ppm) to determine compliance.
(3) In Dec 2019, SCAQMD Long Beach station was moved from the Webster site to the Signal Hill site approximately three miles to the east.
Table A-14. 99th Percentile of the Daily Maximum 1-Hr Average SO2 Concentrations (ppm)
Year Superblock Gull ParkWebster/
Signal Hill2NAAQS
3-year
2018 0.009 0.009 0.009 --
2019 0.014 0.009 0.007 --
2020 0.010 0.007 0.004 --
Average1 0.011 0.008 0.007 0.075
(1) 3-year average of the 99th percentile of the daily maximum 1-hour SO2 concentration to determine compliance with the 1-hour SO2 standard.
(2) In Dec 2019, SCAQMD Long Beach station was moved from the Webster site to the Signal Hill site approximately three miles to the east.
Table A-15. Maximum 24-Hr SO2 Concentrations (ppm)
Superblock Gull ParkNorth Long
Beach
Webster/
Signal Hill3CAAQS
24-hour
2007 0.022 0.012 0.009 --2 0.040
2008 0.021 0.019 0.010 --2 0.040
2009 0.013 0.012 0.004 --2 0.040
2010 0.009 0.012 0.007 0.004 0.040
2011 0.007 0.005 0.004 0.012 0.040
2012 0.005 0.006 0.003 0.004 0.040
2013 0.006 0.009 0.003 0.004 0.040
2014 0.006 0.007 --1 0.004 0.040
2015 0.004 0.004 --1 0.005 0.040
2016 0.007 0.003 --1 0.004 0.040
2017 0.006 0.005 --1 0.003 0.040
2018 0.005 0.004 --1 0.002 0.040
2019 0.005 0.005 --1 0.002 0.040
2020 0.005 0.003 --1 0.002 0.040
(1) North Long Beach station shut down by SCAQMD as of 10/4/2013.
(2) Webster station started reporting data in 2010.
(3) In Dec 2019, SCAQMD Long Beach station was moved from the Webster site to the Signal Hill site approximately three miles to the east.
Webster/Signal Hill3Super Block
Year
Gull Park North LA - Main Street
SO2 Concentrations (ppm)
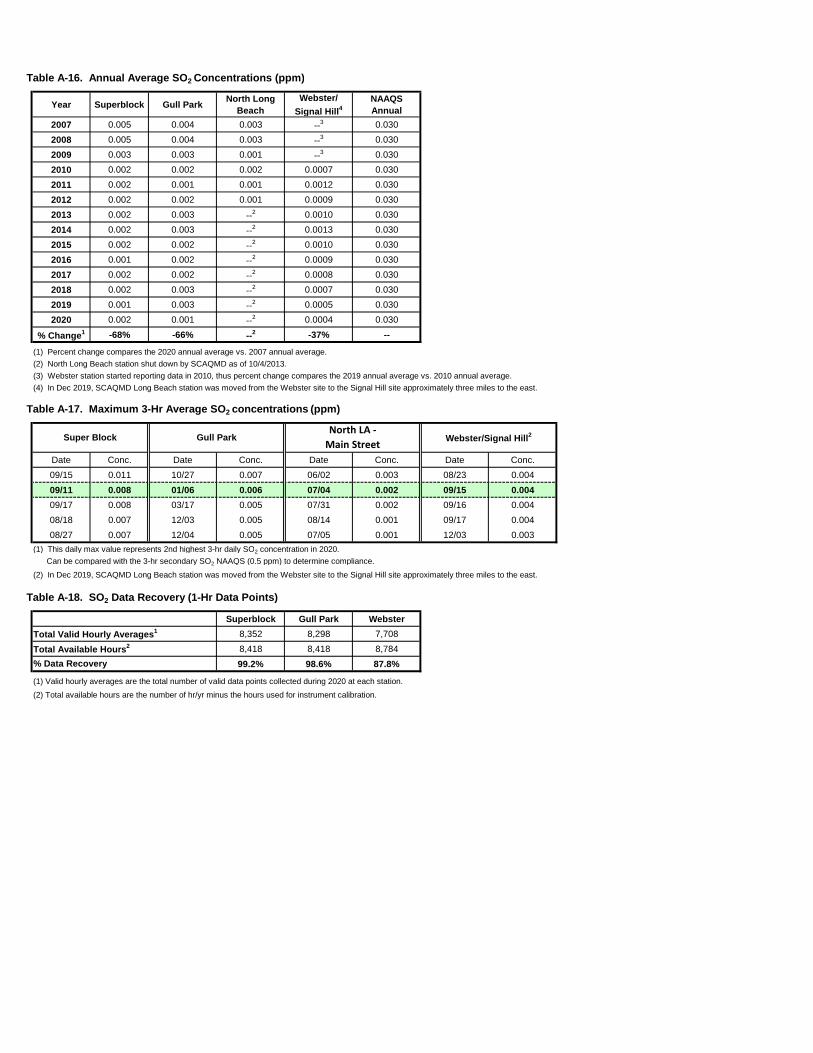
Table A-16. Annual Average SO2 Concentrations (ppm)
Year Superblock Gull ParkNorth Long
Beach
Webster/
Signal Hill4NAAQS
Annual
2007 0.005 0.004 0.003 --3 0.030
2008 0.005 0.004 0.003 --3 0.030
2009 0.003 0.003 0.001 --3 0.030
2010 0.002 0.002 0.002 0.0007 0.030
2011 0.002 0.001 0.001 0.0012 0.030
2012 0.002 0.002 0.001 0.0009 0.030
2013 0.002 0.003 --2 0.0010 0.030
2014 0.002 0.003 --2 0.0013 0.030
2015 0.002 0.002 --2 0.0010 0.030
2016 0.001 0.002 --2 0.0009 0.030
2017 0.002 0.002 --2 0.0008 0.030
2018 0.002 0.003 --2 0.0007 0.030
2019 0.001 0.003 --2 0.0005 0.030
2020 0.002 0.001 --2 0.0004 0.030
% Change1 -68% -66% --2 -37% --
(1) Percent change compares the 2020 annual average vs. 2007 annual average.
(2) North Long Beach station shut down by SCAQMD as of 10/4/2013.
(3) Webster station started reporting data in 2010, thus percent change compares the 2019 annual average vs. 2010 annual average.
(4) In Dec 2019, SCAQMD Long Beach station was moved from the Webster site to the Signal Hill site approximately three miles to the east.
Table A-17. Maximum 3-Hr Average SO2 concentrations (ppm)
Date Conc. Date Conc. Date Conc. Date Conc.
09/15 0.011 10/27 0.007 06/02 0.003 08/23 0.004
09/11 0.008 01/06 0.006 07/04 0.002 09/15 0.004
09/17 0.008 03/17 0.005 07/31 0.002 09/16 0.004
08/18 0.007 12/03 0.005 08/14 0.001 09/17 0.004
08/27 0.007 12/04 0.005 07/05 0.001 12/03 0.003
(1) This daily max value represents 2nd highest 3-hr daily SO2 concentration in 2020.
Can be compared with the 3-hr secondary SO2 NAAQS (0.5 ppm) to determine compliance.
(2) In Dec 2019, SCAQMD Long Beach station was moved from the Webster site to the Signal Hill site approximately three miles to the east.
Table A-18. SO2 Data Recovery (1-Hr Data Points)
Superblock Gull Park Webster
8,352 8,298 7,708
8,418 8,418 8,784
99.2% 98.6% 87.8%
(1) Valid hourly averages are the total number of valid data points collected during 2020 at each station.
(2) Total available hours are the number of hr/yr minus the hours used for instrument calibration.
Total Valid Hourly Averages1
Total Available Hours2
% Data Recovery
Webster/Signal Hill2Super Block Gull ParkNorth LA -
Main Street
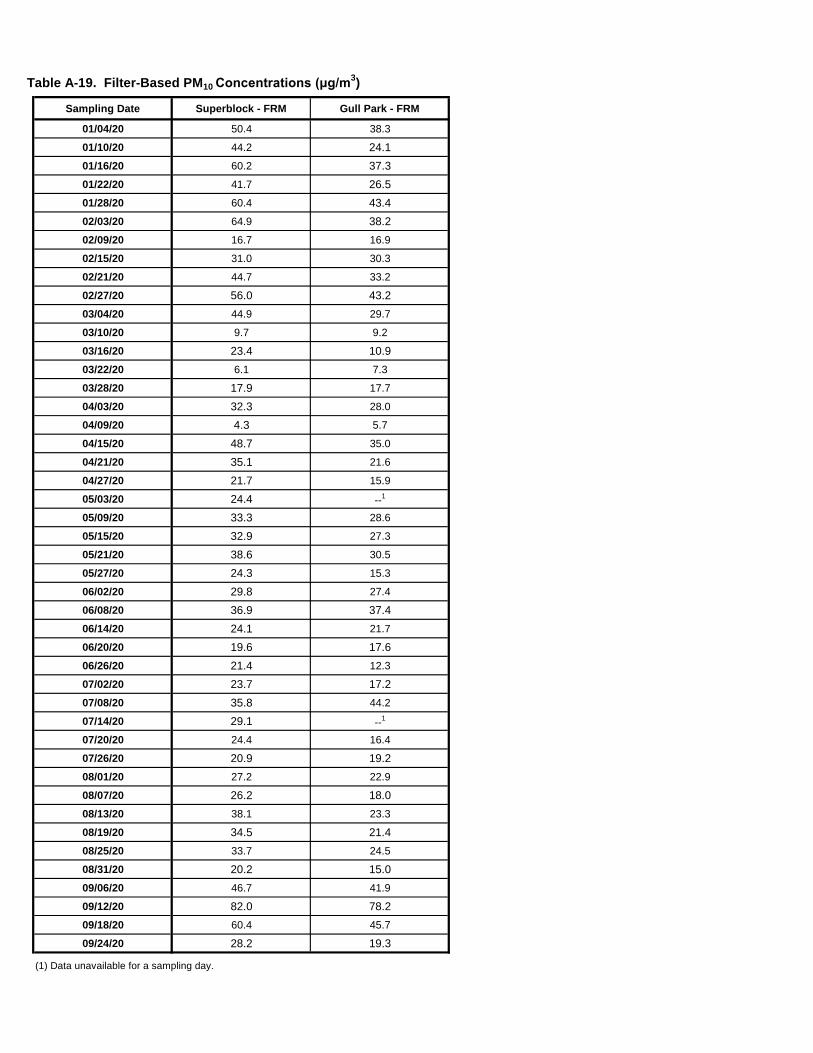
Table A-19. Filter-Based PM10 Concentrations (μg/m3)
Sampling Date Superblock - FRM Gull Park - FRM
01/04/20 50.4 38.3
01/10/20 44.2 24.1
01/16/20 60.2 37.3
01/22/20 41.7 26.5
01/28/20 60.4 43.4
02/03/20 64.9 38.2
02/09/20 16.7 16.9
02/15/20 31.0 30.3
02/21/20 44.7 33.2
02/27/20 56.0 43.2
03/04/20 44.9 29.7
03/10/20 9.7 9.2
03/16/20 23.4 10.9
03/22/20 6.1 7.3
03/28/20 17.9 17.7
04/03/20 32.3 28.0
04/09/20 4.3 5.7
04/15/20 48.7 35.0
04/21/20 35.1 21.6
04/27/20 21.7 15.9
05/03/20 24.4 --1
05/09/20 33.3 28.6
05/15/20 32.9 27.3
05/21/20 38.6 30.5
05/27/20 24.3 15.3
06/02/20 29.8 27.4
06/08/20 36.9 37.4
06/14/20 24.1 21.7
06/20/20 19.6 17.6
06/26/20 21.4 12.3
07/02/20 23.7 17.2
07/08/20 35.8 44.2
07/14/20 29.1 --1
07/20/20 24.4 16.4
07/26/20 20.9 19.2
08/01/20 27.2 22.9
08/07/20 26.2 18.0
08/13/20 38.1 23.3
08/19/20 34.5 21.4
08/25/20 33.7 24.5
08/31/20 20.2 15.0
09/06/20 46.7 41.9
09/12/20 82.0 78.2
09/18/20 60.4 45.7
09/24/20 28.2 19.3
(1) Data unavailable for a sampling day.

Table A-19. Filter-Based PM10 Concentrations (μg/m3)
Sampling Date Superblock - FRM Gull Park - FRM
09/30/20 64.3 49.2
10/06/20 61.3 48.4
10/12/20 44.6 37.0
10/18/20 29.5 27.5
10/24/20 20.5 17.2
10/30/20 44.8 33.7
11/05/20 80.7 71.3
11/11/20 42.8 32.7
11/17/20 60.0 27.8
11/23/20 39.8 26.1
11/29/20 33.5 36.5
12/05/20 63.3 51.5
12/11/20 52.0 37.0
12/17/20 53.6 34.0
12/23/20 75.3 54.0
12/29/20 29.9 16.6
(1) Data unavailable for a sampling day.
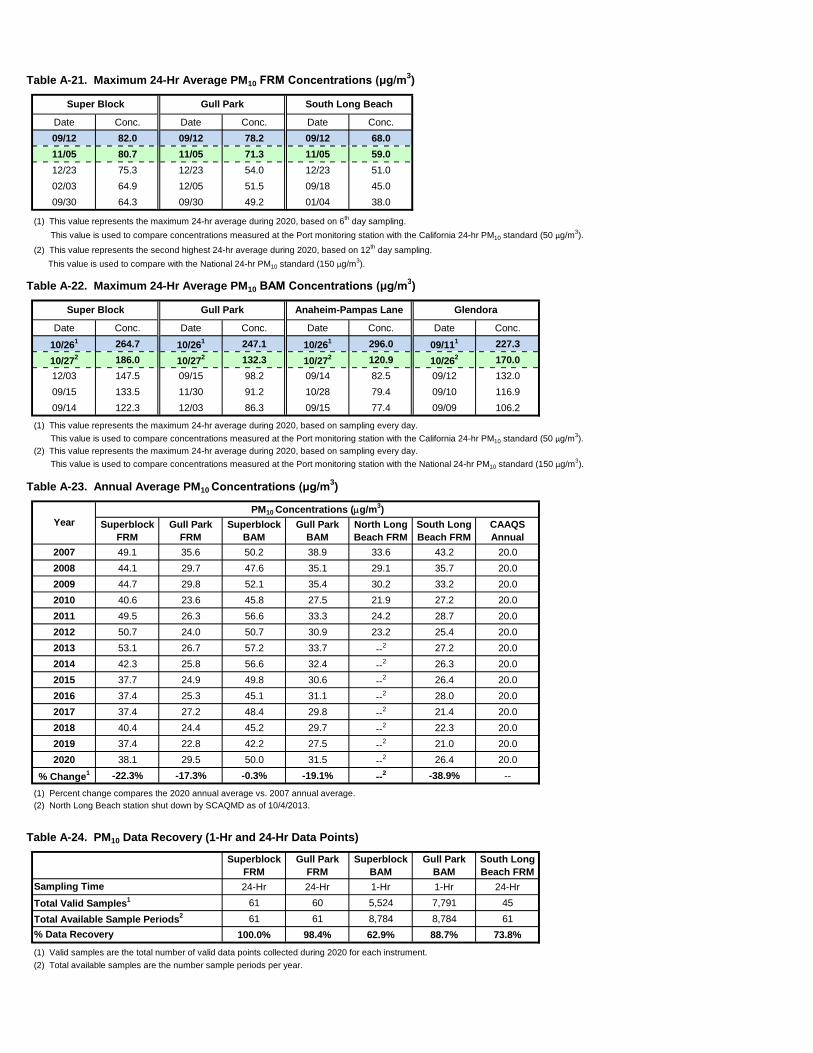
Table A-21. Maximum 24-Hr Average PM10 FRM Concentrations (μg/m3)
Date Conc. Date Conc. Date Conc.
09/12 82.0 09/12 78.2 09/12 68.0
11/05 80.7 11/05 71.3 11/05 59.0
12/23 75.3 12/23 54.0 12/23 51.0
02/03 64.9 12/05 51.5 09/18 45.0
09/30 64.3 09/30 49.2 01/04 38.0
(1) This value represents the maximum 24-hr average during 2020, based on 6th day sampling.
This value is used to compare concentrations measured at the Port monitoring station with the California 24-hr PM10 standard (50 µg/m3).
(2) This value represents the second highest 24-hr average during 2020, based on 12th day sampling.
This value is used to compare with the National 24-hr PM10 standard (150 µg/m3).
Table A-22. Maximum 24-Hr Average PM10 BAM Concentrations (μg/m3)
Date Conc. Date Conc. Date Conc. Date Conc.
10/261 264.7 10/26
1 247.1 10/261 296.0 09/11
1 227.3
10/272 186.0 10/27
2 132.3 10/272 120.9 10/26
2 170.0
12/03 147.5 09/15 98.2 09/14 82.5 09/12 132.0
09/15 133.5 11/30 91.2 10/28 79.4 09/10 116.9
09/14 122.3 12/03 86.3 09/15 77.4 09/09 106.2
(1) This value represents the maximum 24-hr average during 2020, based on sampling every day.
This value is used to compare concentrations measured at the Port monitoring station with the California 24-hr PM10 standard (50 µg/m3).
(2) This value represents the maximum 24-hr average during 2020, based on sampling every day.
This value is used to compare concentrations measured at the Port monitoring station with the National 24-hr PM10 standard (150 µg/m3).
Table A-23. Annual Average PM10 Concentrations (μg/m3)
Superblock
FRM
Gull Park
FRM
Superblock
BAM
Gull Park
BAM
North Long
Beach FRM
South Long
Beach FRM
CAAQS
Annual
2007 49.1 35.6 50.2 38.9 33.6 43.2 20.0
2008 44.1 29.7 47.6 35.1 29.1 35.7 20.0
2009 44.7 29.8 52.1 35.4 30.2 33.2 20.0
2010 40.6 23.6 45.8 27.5 21.9 27.2 20.0
2011 49.5 26.3 56.6 33.3 24.2 28.7 20.0
2012 50.7 24.0 50.7 30.9 23.2 25.4 20.0
2013 53.1 26.7 57.2 33.7 --2 27.2 20.0
2014 42.3 25.8 56.6 32.4 --2 26.3 20.0
2015 37.7 24.9 49.8 30.6 --2 26.4 20.0
2016 37.4 25.3 45.1 31.1 --2 28.0 20.0
2017 37.4 27.2 48.4 29.8 --2 21.4 20.0
2018 40.4 24.4 45.2 29.7 --2 22.3 20.0
2019 37.4 22.8 42.2 27.5 --2 21.0 20.0
2020 38.1 29.5 50.0 31.5 --2 26.4 20.0
% Change1 -22.3% -17.3% -0.3% -19.1% --2 -38.9% --
(1) Percent change compares the 2020 annual average vs. 2007 annual average.
(2) North Long Beach station shut down by SCAQMD as of 10/4/2013.
Table A-24. PM10 Data Recovery (1-Hr and 24-Hr Data Points)
Superblock
FRM
Gull Park
FRM
Superblock
BAM
Gull Park
BAM
South Long
Beach FRM
24-Hr 24-Hr 1-Hr 1-Hr 24-Hr
61 60 5,524 7,791 45
61 61 8,784 8,784 61
100.0% 98.4% 62.9% 88.7% 73.8%
(1) Valid samples are the total number of valid data points collected during 2020 for each instrument.
(2) Total available samples are the number sample periods per year.
Total Available Sample Periods2
% Data Recovery
Glendora
Total Valid Samples1
Sampling Time
Year
PM10 Concentrations (mg/m3)
Super Block Gull Park South Long Beach
Super Block Gull Park Anaheim-Pampas Lane
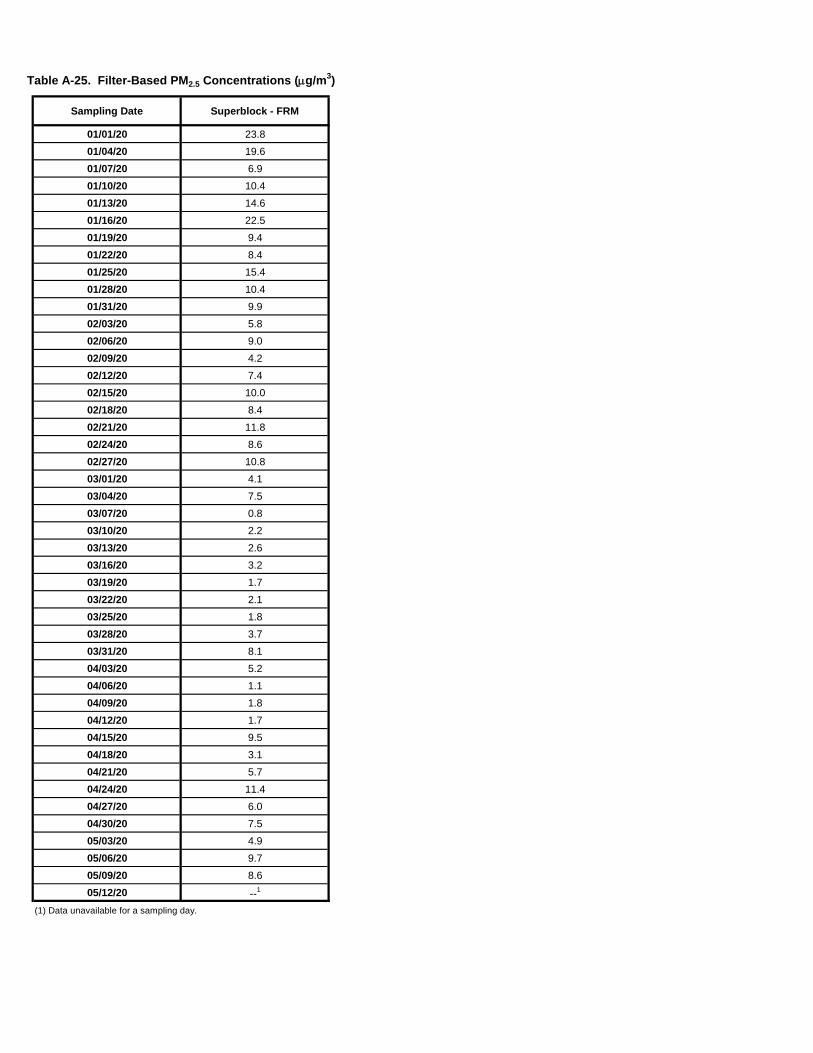
Table A-25. Filter-Based PM2.5 Concentrations (mg/m3)
Sampling Date Superblock - FRM
01/01/20 23.8
01/04/20 19.6
01/07/20 6.9
01/10/20 10.4
01/13/20 14.6
01/16/20 22.5
01/19/20 9.4
01/22/20 8.4
01/25/20 15.4
01/28/20 10.4
01/31/20 9.9
02/03/20 5.8
02/06/20 9.0
02/09/20 4.2
02/12/20 7.4
02/15/20 10.0
02/18/20 8.4
02/21/20 11.8
02/24/20 8.6
02/27/20 10.8
03/01/20 4.1
03/04/20 7.5
03/07/20 0.8
03/10/20 2.2
03/13/20 2.6
03/16/20 3.2
03/19/20 1.7
03/22/20 2.1
03/25/20 1.8
03/28/20 3.7
03/31/20 8.1
04/03/20 5.2
04/06/20 1.1
04/09/20 1.8
04/12/20 1.7
04/15/20 9.5
04/18/20 3.1
04/21/20 5.7
04/24/20 11.4
04/27/20 6.0
04/30/20 7.5
05/03/20 4.9
05/06/20 9.7
05/09/20 8.6
05/12/20 --1
(1) Data unavailable for a sampling day.
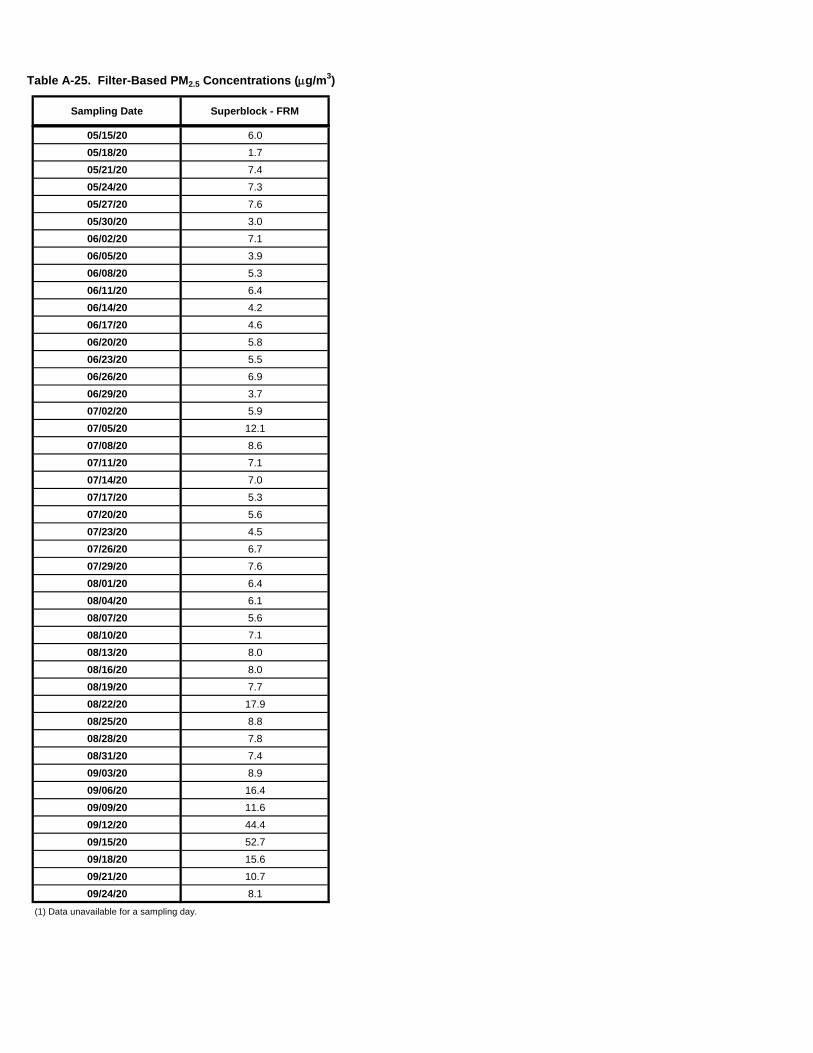
Table A-25. Filter-Based PM2.5 Concentrations (mg/m3)
Sampling Date Superblock - FRM
05/15/20 6.0
05/18/20 1.7
05/21/20 7.4
05/24/20 7.3
05/27/20 7.6
05/30/20 3.0
06/02/20 7.1
06/05/20 3.9
06/08/20 5.3
06/11/20 6.4
06/14/20 4.2
06/17/20 4.6
06/20/20 5.8
06/23/20 5.5
06/26/20 6.9
06/29/20 3.7
07/02/20 5.9
07/05/20 12.1
07/08/20 8.6
07/11/20 7.1
07/14/20 7.0
07/17/20 5.3
07/20/20 5.6
07/23/20 4.5
07/26/20 6.7
07/29/20 7.6
08/01/20 6.4
08/04/20 6.1
08/07/20 5.6
08/10/20 7.1
08/13/20 8.0
08/16/20 8.0
08/19/20 7.7
08/22/20 17.9
08/25/20 8.8
08/28/20 7.8
08/31/20 7.4
09/03/20 8.9
09/06/20 16.4
09/09/20 11.6
09/12/20 44.4
09/15/20 52.7
09/18/20 15.6
09/21/20 10.7
09/24/20 8.1
(1) Data unavailable for a sampling day.
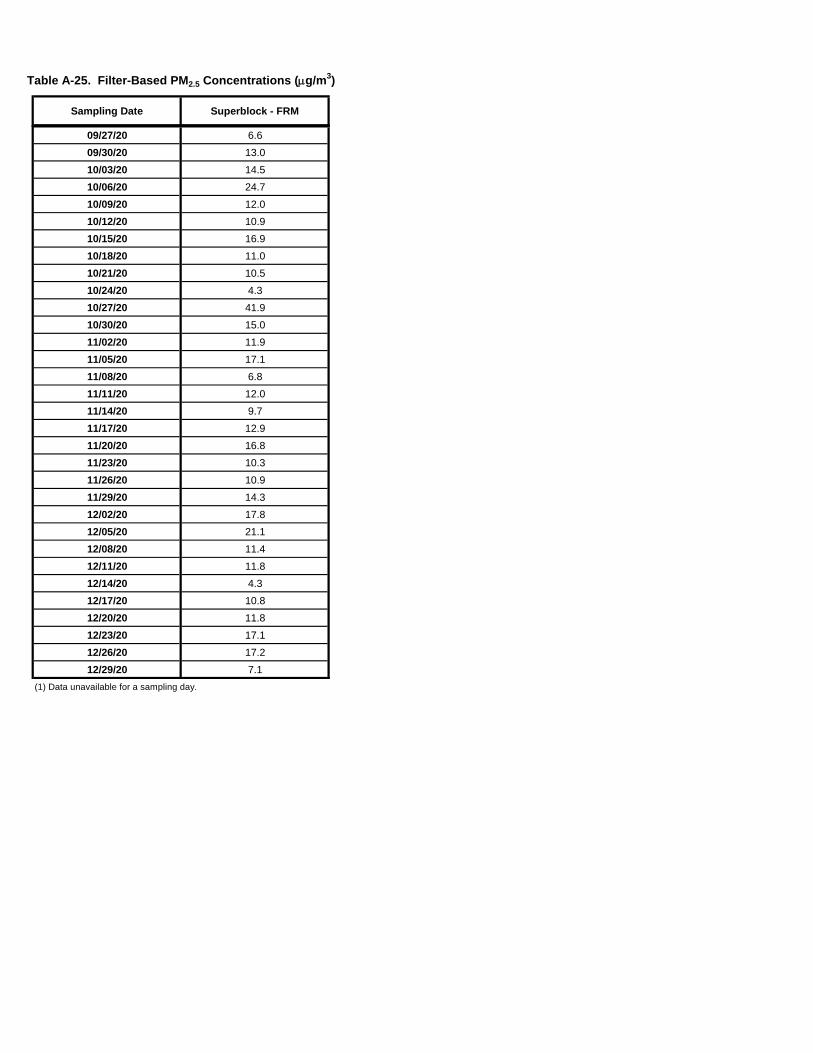
Table A-25. Filter-Based PM2.5 Concentrations (mg/m3)
Sampling Date Superblock - FRM
09/27/20 6.6
09/30/20 13.0
10/03/20 14.5
10/06/20 24.7
10/09/20 12.0
10/12/20 10.9
10/15/20 16.9
10/18/20 11.0
10/21/20 10.5
10/24/20 4.3
10/27/20 41.9
10/30/20 15.0
11/02/20 11.9
11/05/20 17.1
11/08/20 6.8
11/11/20 12.0
11/14/20 9.7
11/17/20 12.9
11/20/20 16.8
11/23/20 10.3
11/26/20 10.9
11/29/20 14.3
12/02/20 17.8
12/05/20 21.1
12/08/20 11.4
12/11/20 11.8
12/14/20 4.3
12/17/20 10.8
12/20/20 11.8
12/23/20 17.1
12/26/20 17.2
12/29/20 7.1
(1) Data unavailable for a sampling day.
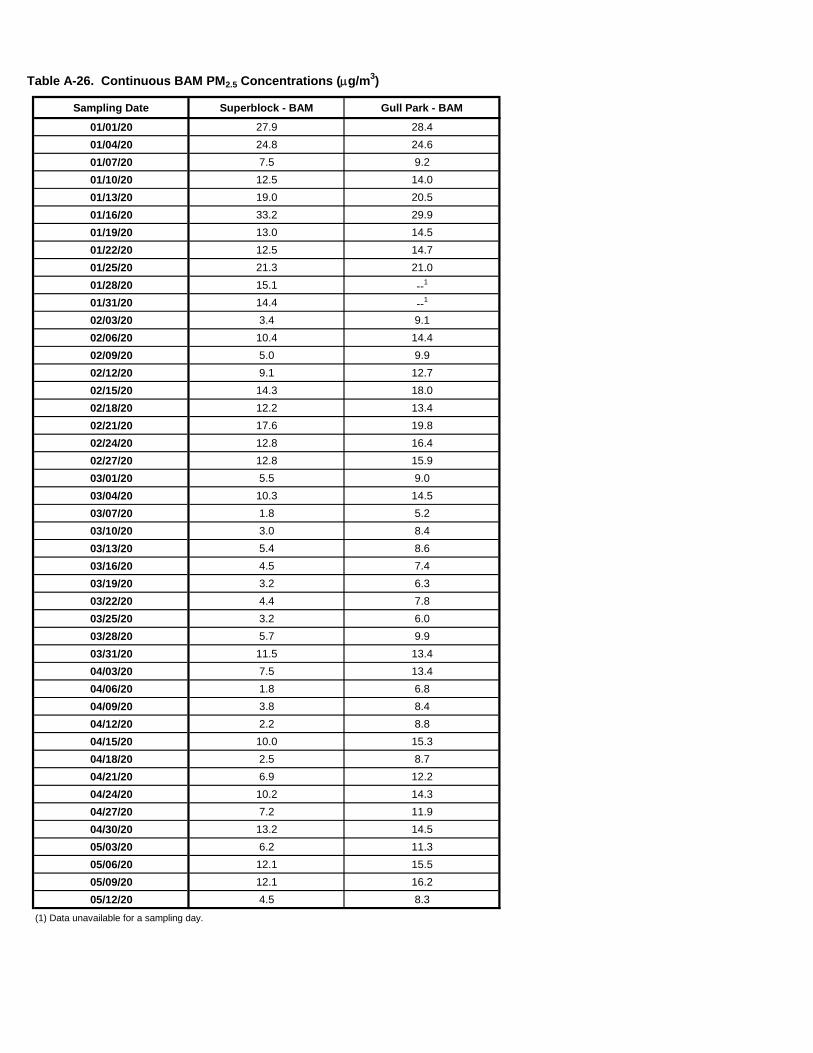
Table A-26. Continuous BAM PM2.5 Concentrations (mg/m3)
Sampling Date Superblock - BAM Gull Park - BAM
01/01/20 27.9 28.4
01/04/20 24.8 24.6
01/07/20 7.5 9.2
01/10/20 12.5 14.0
01/13/20 19.0 20.5
01/16/20 33.2 29.9
01/19/20 13.0 14.5
01/22/20 12.5 14.7
01/25/20 21.3 21.0
01/28/20 15.1 --1
01/31/20 14.4 --1
02/03/20 3.4 9.1
02/06/20 10.4 14.4
02/09/20 5.0 9.9
02/12/20 9.1 12.7
02/15/20 14.3 18.0
02/18/20 12.2 13.4
02/21/20 17.6 19.8
02/24/20 12.8 16.4
02/27/20 12.8 15.9
03/01/20 5.5 9.0
03/04/20 10.3 14.5
03/07/20 1.8 5.2
03/10/20 3.0 8.4
03/13/20 5.4 8.6
03/16/20 4.5 7.4
03/19/20 3.2 6.3
03/22/20 4.4 7.8
03/25/20 3.2 6.0
03/28/20 5.7 9.9
03/31/20 11.5 13.4
04/03/20 7.5 13.4
04/06/20 1.8 6.8
04/09/20 3.8 8.4
04/12/20 2.2 8.8
04/15/20 10.0 15.3
04/18/20 2.5 8.7
04/21/20 6.9 12.2
04/24/20 10.2 14.3
04/27/20 7.2 11.9
04/30/20 13.2 14.5
05/03/20 6.2 11.3
05/06/20 12.1 15.5
05/09/20 12.1 16.2
05/12/20 4.5 8.3
(1) Data unavailable for a sampling day.
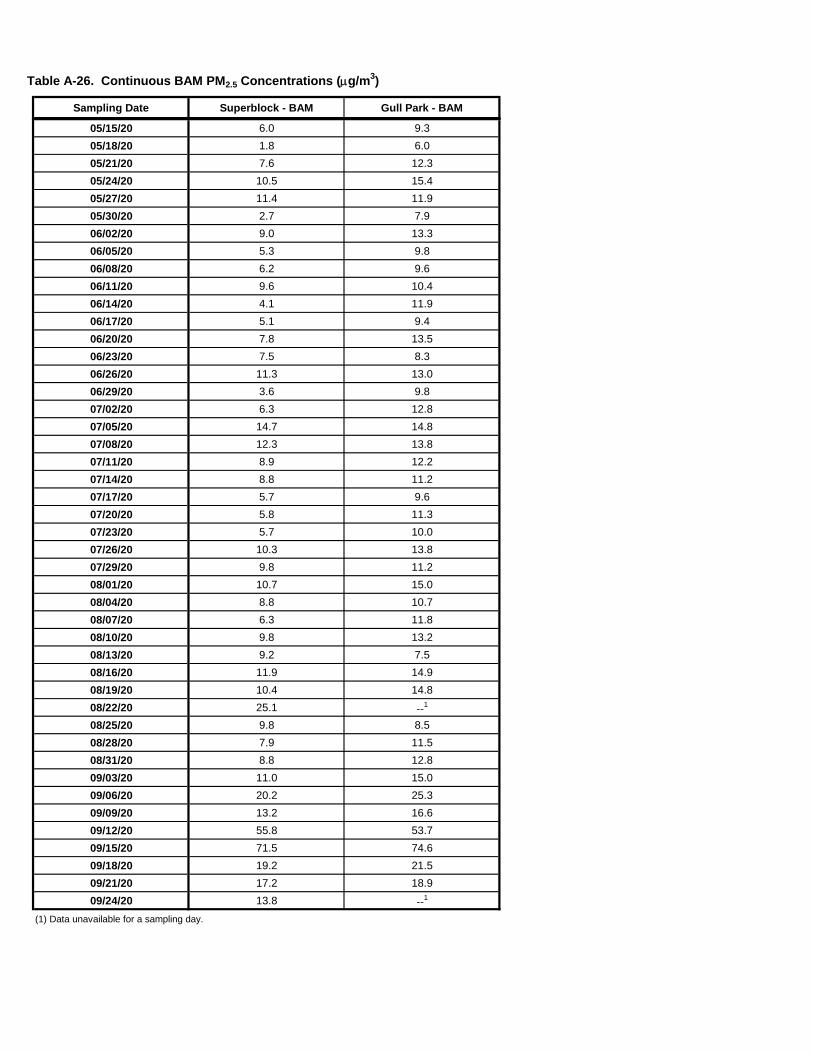
Table A-26. Continuous BAM PM2.5 Concentrations (mg/m3)
Sampling Date Superblock - BAM Gull Park - BAM
05/15/20 6.0 9.3
05/18/20 1.8 6.0
05/21/20 7.6 12.3
05/24/20 10.5 15.4
05/27/20 11.4 11.9
05/30/20 2.7 7.9
06/02/20 9.0 13.3
06/05/20 5.3 9.8
06/08/20 6.2 9.6
06/11/20 9.6 10.4
06/14/20 4.1 11.9
06/17/20 5.1 9.4
06/20/20 7.8 13.5
06/23/20 7.5 8.3
06/26/20 11.3 13.0
06/29/20 3.6 9.8
07/02/20 6.3 12.8
07/05/20 14.7 14.8
07/08/20 12.3 13.8
07/11/20 8.9 12.2
07/14/20 8.8 11.2
07/17/20 5.7 9.6
07/20/20 5.8 11.3
07/23/20 5.7 10.0
07/26/20 10.3 13.8
07/29/20 9.8 11.2
08/01/20 10.7 15.0
08/04/20 8.8 10.7
08/07/20 6.3 11.8
08/10/20 9.8 13.2
08/13/20 9.2 7.5
08/16/20 11.9 14.9
08/19/20 10.4 14.8
08/22/20 25.1 --1
08/25/20 9.8 8.5
08/28/20 7.9 11.5
08/31/20 8.8 12.8
09/03/20 11.0 15.0
09/06/20 20.2 25.3
09/09/20 13.2 16.6
09/12/20 55.8 53.7
09/15/20 71.5 74.6
09/18/20 19.2 21.5
09/21/20 17.2 18.9
09/24/20 13.8 --1
(1) Data unavailable for a sampling day.
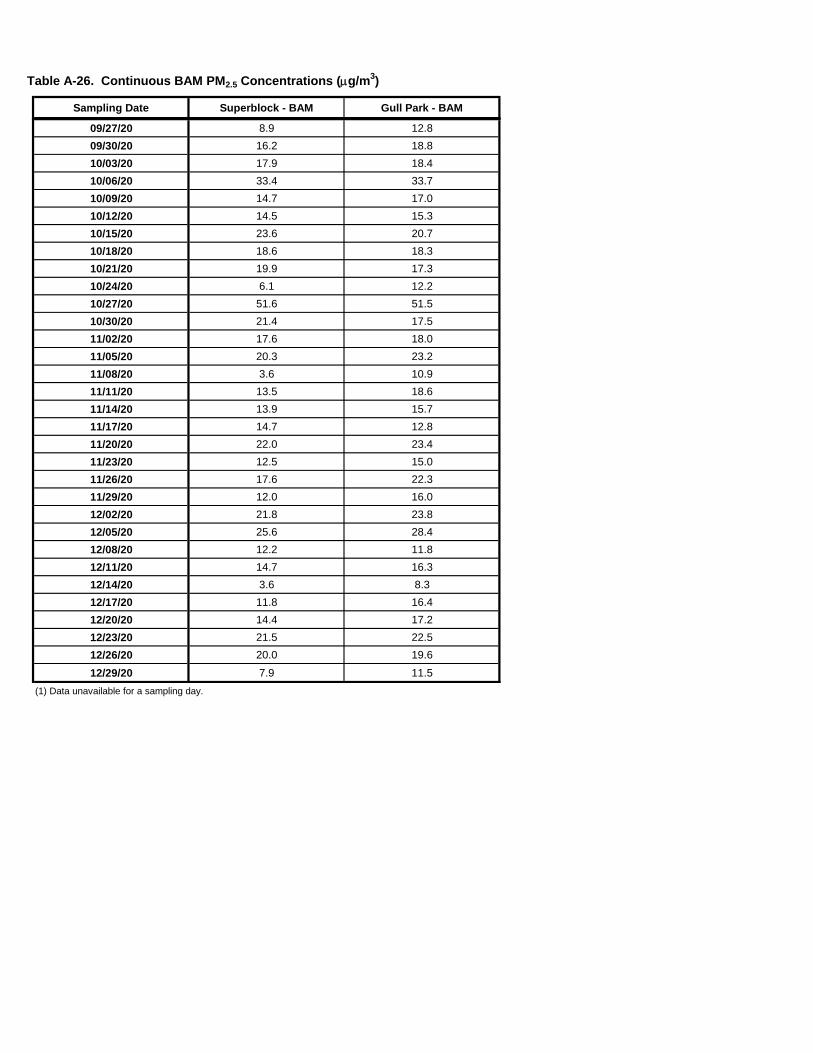
Table A-26. Continuous BAM PM2.5 Concentrations (mg/m3)
Sampling Date Superblock - BAM Gull Park - BAM
09/27/20 8.9 12.8
09/30/20 16.2 18.8
10/03/20 17.9 18.4
10/06/20 33.4 33.7
10/09/20 14.7 17.0
10/12/20 14.5 15.3
10/15/20 23.6 20.7
10/18/20 18.6 18.3
10/21/20 19.9 17.3
10/24/20 6.1 12.2
10/27/20 51.6 51.5
10/30/20 21.4 17.5
11/02/20 17.6 18.0
11/05/20 20.3 23.2
11/08/20 3.6 10.9
11/11/20 13.5 18.6
11/14/20 13.9 15.7
11/17/20 14.7 12.8
11/20/20 22.0 23.4
11/23/20 12.5 15.0
11/26/20 17.6 22.3
11/29/20 12.0 16.0
12/02/20 21.8 23.8
12/05/20 25.6 28.4
12/08/20 12.2 11.8
12/11/20 14.7 16.3
12/14/20 3.6 8.3
12/17/20 11.8 16.4
12/20/20 14.4 17.2
12/23/20 21.5 22.5
12/26/20 20.0 19.6
12/29/20 7.9 11.5
(1) Data unavailable for a sampling day.
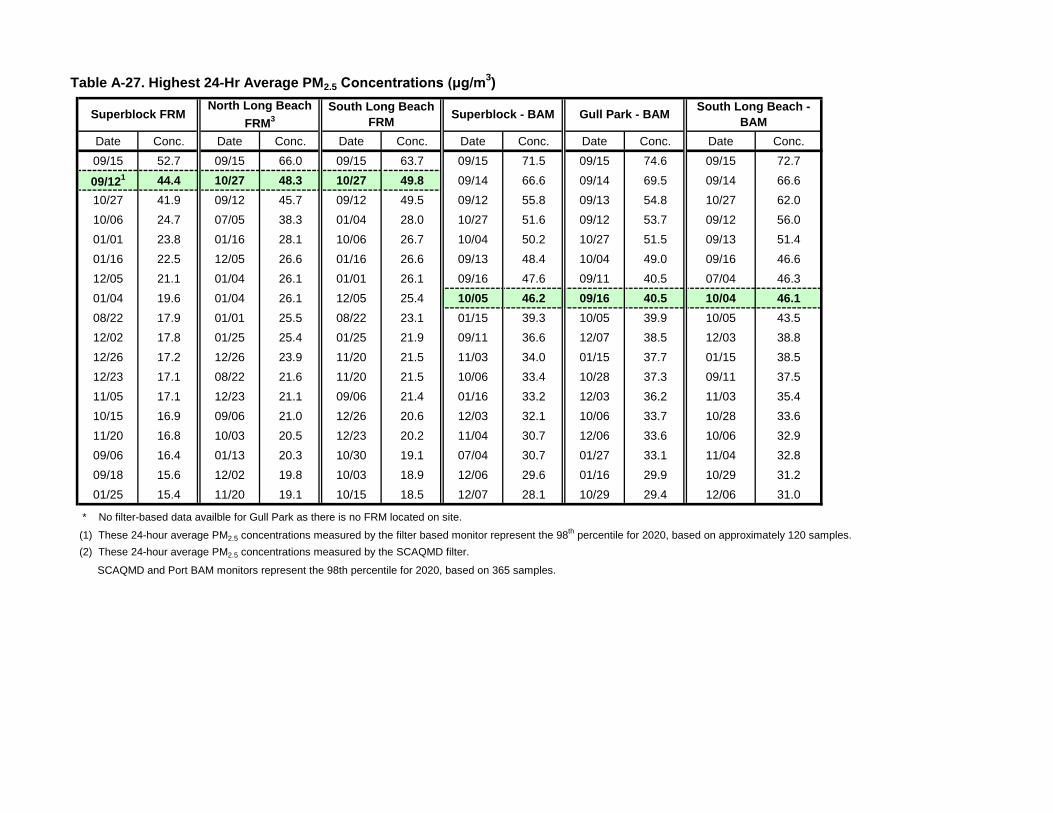
Table A-27. Highest 24-Hr Average PM2.5 Concentrations (μg/m3)
Date Conc. Date Conc. Date Conc. Date Conc. Date Conc. Date Conc.
09/15 52.7 09/15 66.0 09/15 63.7 09/15 71.5 09/15 74.6 09/15 72.7
09/121 44.4 10/27 48.3 10/27 49.8 09/14 66.6 09/14 69.5 09/14 66.6
10/27 41.9 09/12 45.7 09/12 49.5 09/12 55.8 09/13 54.8 10/27 62.0
10/06 24.7 07/05 38.3 01/04 28.0 10/27 51.6 09/12 53.7 09/12 56.0
01/01 23.8 01/16 28.1 10/06 26.7 10/04 50.2 10/27 51.5 09/13 51.4
01/16 22.5 12/05 26.6 01/16 26.6 09/13 48.4 10/04 49.0 09/16 46.6
12/05 21.1 01/04 26.1 01/01 26.1 09/16 47.6 09/11 40.5 07/04 46.3
01/04 19.6 01/04 26.1 12/05 25.4 10/05 46.2 09/16 40.5 10/04 46.1
08/22 17.9 01/01 25.5 08/22 23.1 01/15 39.3 10/05 39.9 10/05 43.5
12/02 17.8 01/25 25.4 01/25 21.9 09/11 36.6 12/07 38.5 12/03 38.8
12/26 17.2 12/26 23.9 11/20 21.5 11/03 34.0 01/15 37.7 01/15 38.5
12/23 17.1 08/22 21.6 11/20 21.5 10/06 33.4 10/28 37.3 09/11 37.5
11/05 17.1 12/23 21.1 09/06 21.4 01/16 33.2 12/03 36.2 11/03 35.4
10/15 16.9 09/06 21.0 12/26 20.6 12/03 32.1 10/06 33.7 10/28 33.6
11/20 16.8 10/03 20.5 12/23 20.2 11/04 30.7 12/06 33.6 10/06 32.9
09/06 16.4 01/13 20.3 10/30 19.1 07/04 30.7 01/27 33.1 11/04 32.8
09/18 15.6 12/02 19.8 10/03 18.9 12/06 29.6 01/16 29.9 10/29 31.2
01/25 15.4 11/20 19.1 10/15 18.5 12/07 28.1 10/29 29.4 12/06 31.0
* No filter-based data availble for Gull Park as there is no FRM located on site.
(1) These 24-hour average PM2.5 concentrations measured by the filter based monitor represent the 98th percentile for 2020, based on approximately 120 samples.
(2) These 24-hour average PM2.5 concentrations measured by the SCAQMD filter.
SCAQMD and Port BAM monitors represent the 98th percentile for 2020, based on 365 samples.
South Long Beach -
BAMSuperblock FRM Superblock - BAM Gull Park - BAM
North Long Beach
FRM3
South Long Beach
FRM
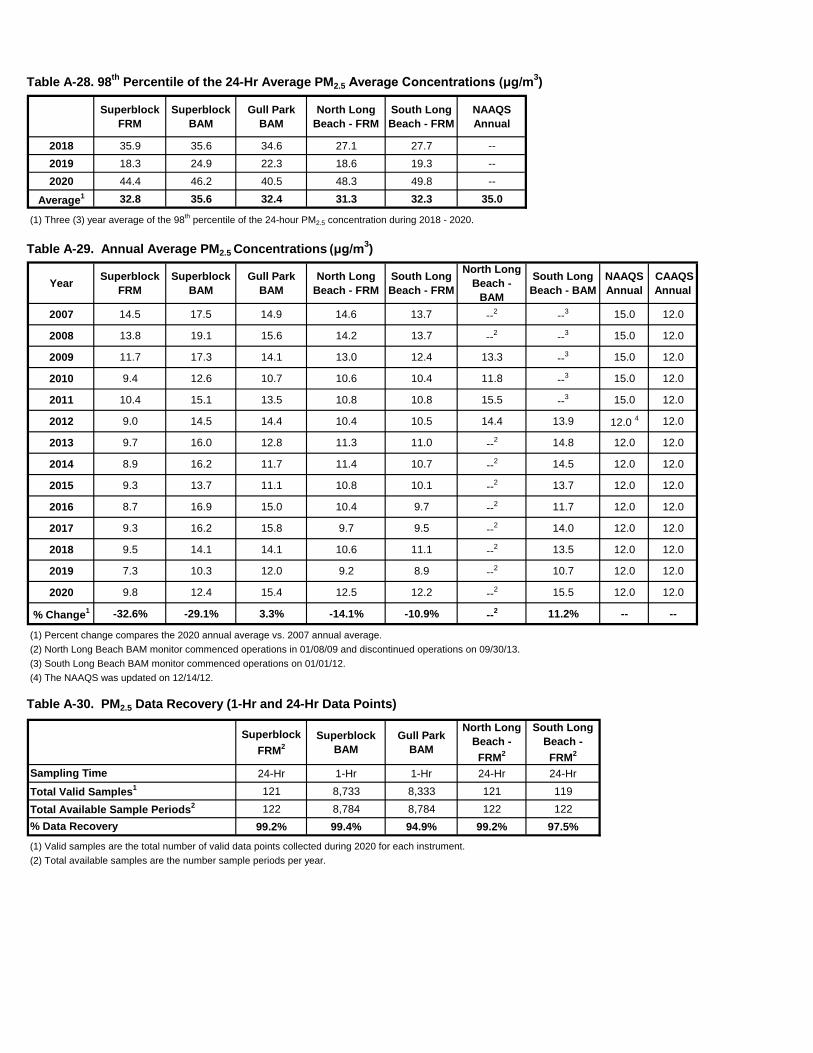
Table A-28. 98th Percentile of the 24-Hr Average PM2.5 Average Concentrations (μg/m3)
Superblock
FRM
Superblock
BAM
Gull Park
BAM
North Long
Beach - FRM
South Long
Beach - FRM
NAAQS
Annual
2018 35.9 35.6 34.6 27.1 27.7 --
2019 18.3 24.9 22.3 18.6 19.3 --
2020 44.4 46.2 40.5 48.3 49.8 --
Average1 32.8 35.6 32.4 31.3 32.3 35.0
(1) Three (3) year average of the 98th percentile of the 24-hour PM2.5 concentration during 2018 - 2020.
Table A-29. Annual Average PM2.5 Concentrations (μg/m3)
YearSuperblock
FRM
Superblock
BAM
Gull Park
BAM
North Long
Beach - FRM
South Long
Beach - FRM
North Long
Beach -
BAM
South Long
Beach - BAM
NAAQS
Annual
CAAQS
Annual
2007 14.5 17.5 14.9 14.6 13.7 --2
--3 15.0 12.0
2008 13.8 19.1 15.6 14.2 13.7 --2 --3 15.0 12.0
2009 11.7 17.3 14.1 13.0 12.4 13.3 --3 15.0 12.0
2010 9.4 12.6 10.7 10.6 10.4 11.8 --3 15.0 12.0
2011 10.4 15.1 13.5 10.8 10.8 15.5 --3 15.0 12.0
2012 9.0 14.5 14.4 10.4 10.5 14.4 13.9 12.0 4 12.0
2013 9.7 16.0 12.8 11.3 11.0 --2 14.8 12.0 12.0
2014 8.9 16.2 11.7 11.4 10.7 --2 14.5 12.0 12.0
2015 9.3 13.7 11.1 10.8 10.1 --2 13.7 12.0 12.0
2016 8.7 16.9 15.0 10.4 9.7 --2 11.7 12.0 12.0
2017 9.3 16.2 15.8 9.7 9.5 --2 14.0 12.0 12.0
2018 9.5 14.1 14.1 10.6 11.1 --2 13.5 12.0 12.0
2019 7.3 10.3 12.0 9.2 8.9 --2 10.7 12.0 12.0
2020 9.8 12.4 15.4 12.5 12.2 --2 15.5 12.0 12.0
% Change1 -32.6% -29.1% 3.3% -14.1% -10.9% --2 11.2% -- --
(1) Percent change compares the 2020 annual average vs. 2007 annual average.
(2) North Long Beach BAM monitor commenced operations in 01/08/09 and discontinued operations on 09/30/13.
(3) South Long Beach BAM monitor commenced operations on 01/01/12.
(4) The NAAQS was updated on 12/14/12.
Table A-30. PM2.5 Data Recovery (1-Hr and 24-Hr Data Points)
Superblock
FRM2
Superblock
BAM
Gull Park
BAM
North Long
Beach -
FRM2
South Long
Beach -
FRM2
24-Hr 1-Hr 1-Hr 24-Hr 24-Hr
121 8,733 8,333 121 119
122 8,784 8,784 122 122
99.2% 99.4% 94.9% 99.2% 97.5%
(1) Valid samples are the total number of valid data points collected during 2020 for each instrument.
(2) Total available samples are the number sample periods per year.
Sampling Time
Total Valid Samples1
Total Available Sample Periods2
% Data Recovery
Related Documents


