17 May 2017, Stop TB Board Meeting, Berlin Monitoring of the Global Plan to End TB: 2016-2020 Stop TB Partnership Secretariat

Welcome message from author
This document is posted to help you gain knowledge. Please leave a comment to let me know what you think about it! Share it to your friends and learn new things together.
Transcript
17 May 2017, Stop TB Board Meeting, Berlin
Monitoring of the
Global Plan to End TB: 2016-2020
Stop TB Partnership Secretariat
www.stoptb.org
• Work done by the secretariat on Board recommendation
• Report on progress against the 90-(90)-90 targets
• Reaching 90% of people with TB
• Reaching 90% of Key Populations
• Achieving 90% treatment success
• Gaps in data
Outline

www.stoptb.orgwww.stoptb.org
• Progress on reaching the 90-(90)-90 targets;
• Adoption of new policies and tools;
• Availability of financial resources for implementation; and
• Availability of financial resources for research and development.
The Board also asked to identify any gaps where the data to track progress of the Global Plan does not exist.
Stop TB Board in Sept-2016 asked the Secretariat to monitor the Global Plan in the following areas:

www.stoptb.orgwww.stoptb.org
Work done by Secretariat so far…1
• Progress report on reaching the 90-(90)-90 targets
• Will be presented to the Board
• After Board inputs the report will be finalized and published
• Case studies on paradigm shift is being compiled separately - will form the second part of the report
• Adoption of new policies and tools – “Out-of-Step” report
• Joint work between Stop TB and MSF
• Data collection completed from 30 countries
• Development of report is underway
• Will be launched in July 2017

www.stoptb.orgwww.stoptb.org
Work done by Secretariat so far…2
• Availability of financial resources for implementation
• Work will start in June 2017
• WHO data available in October 2017
• Financial resources report will be completed by Dec 2017
• Availability of financial resources for research and development
• Joint work of Stop TB and TAG
• Report expected by October 2017

www.stoptb.orgwww.stoptb.org
Modeling done for Global Plan shows that achieving 90% coverage as soon as possible but not later than 2025 will set the world on course to meet the End TB Strategy milestones for 2020 and 2025.
Report on progress against the 90-(90)-90 targets
Source: Global Plan to End TB: The Paradigm Shift
www.stoptb.orgwww.stoptb.org
Methods
• Most data taken from WHO's global tuberculosis database downloaded from http://who.int/tb/country/data/download/en/ in March 2017. Latest data available is from 2015.
• Supplemented by a questionnaire sent to high TB burden countries in early 2017 on National Strategic Plans, Key Population and data availability in countries.
• 27 countries responded
• Other sources of data were NTP documents in public domain for a few countries and TB REACH published results
www.stoptb.orgwww.stoptb.org
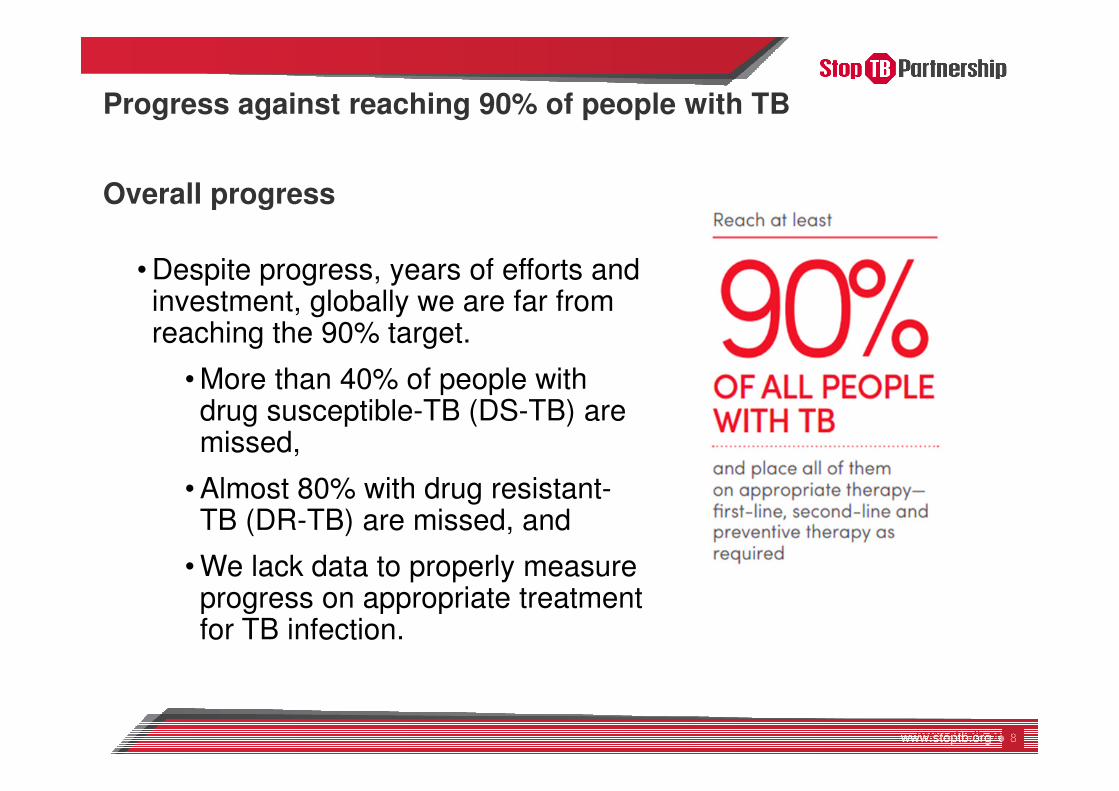
Progress against reaching 90% of people with TB
Overall progress
• Despite progress, years of efforts and investment, globally we are far from reaching the 90% target.
• More than 40% of people with drug susceptible-TB (DS-TB) are missed,
• Almost 80% with drug resistant-TB (DR-TB) are missed, and
• We lack data to properly measure progress on appropriate treatment for TB infection.
www.stoptb.org
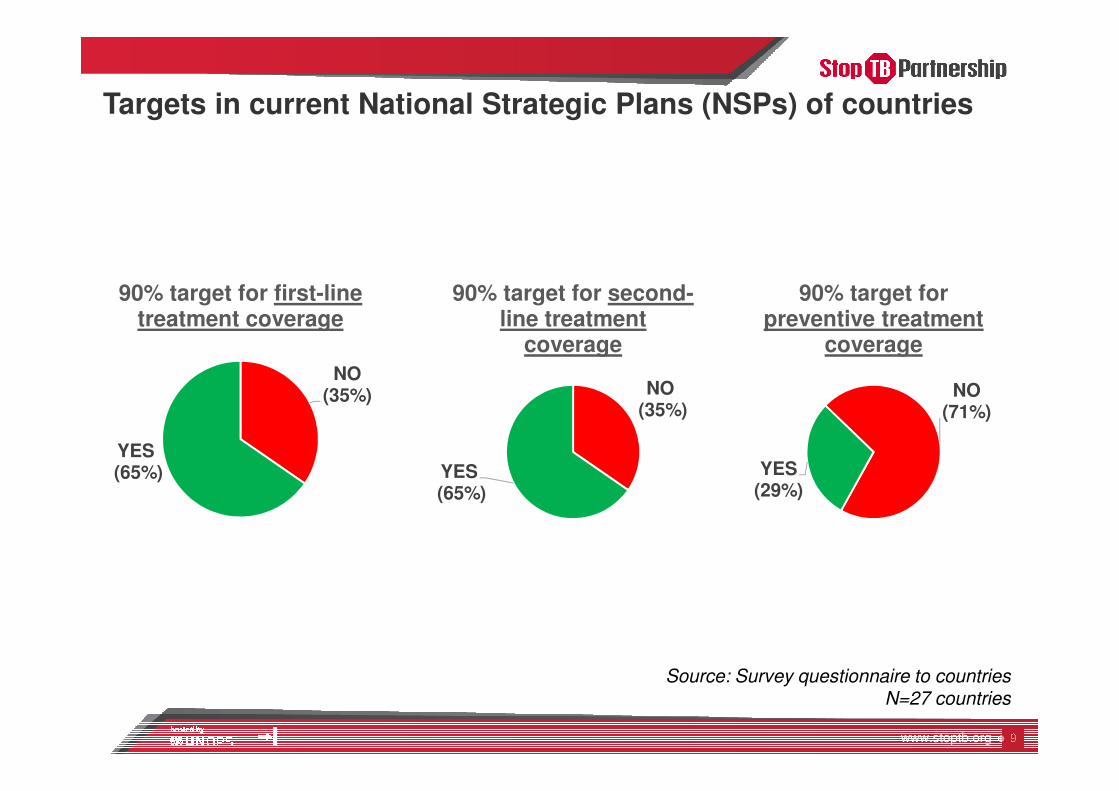
Targets in current National Strategic Plans (NSPs) of countries
NO(35%)
YES(65%)
90% target for first-line treatment coverage
NO(35%)
YES(65%)
90% target for second-line treatment
coverage
NO (71%)
YES (29%)
90% target for preventive treatment
coverage
Source: Survey questionnaire to countriesN=27 countries

www.stoptb.orgwww.stoptb.org
Progress against reaching 90% of people with TB
First line treatment (2005-2015)
• In 2015, an estimated 10.4 million people became ill with TB worldwide.
• Only 6.1 million were reported as receiving treatment
• Leaving behind over 4.3 million people.
• This means on a global scale only 59% of people who developed TB had access to good quality TB diagnosis and treatment.
2005 2010 20150
2
4
6
8
10
12
Nu
mb
er
of
pe
op
le in
Mill
ion
s
People developing TB:
10.4M in 2015
People diagnosed &
put on Treatment:
6.1 M in 2015
MISSING: 4.3 Millions

www.stoptb.org
Progress against reaching 90% of people with TB
First line treatment coverage (2015)
Most high burden countries in Africa and Asia are far from reaching 90% of people with TB.
Source: WHO's global tuberculosis database, March 2016Boundaries used on this map do not imply the expression of any opinion whatsoever on the
part of the Stop TB Partnership concerning the legal status of any country or territory or of
its authorities, or concerning the delimitation of its frontiers or boundaries
No data Not applicable
www.stoptb.orgwww.stoptb.org
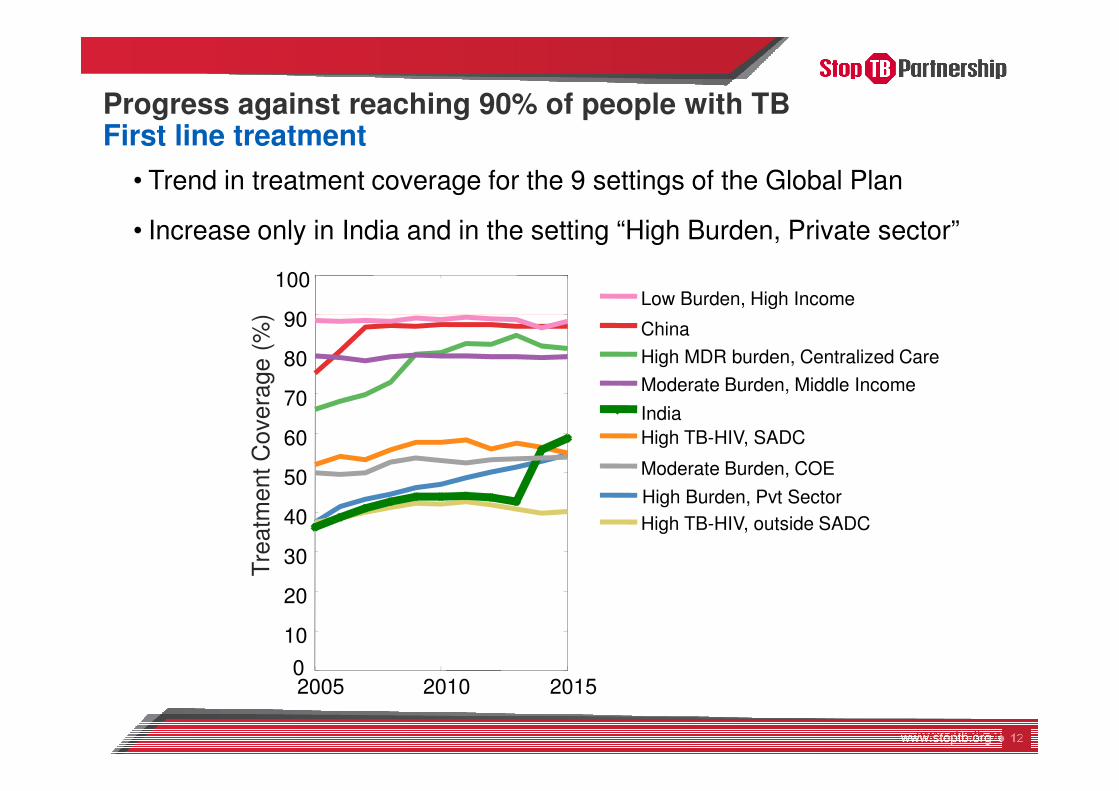
Progress against reaching 90% of people with TB First line treatment
• Trend in treatment coverage for the 9 settings of the Global Plan
• Increase only in India and in the setting “High Burden, Private sector”
2005 2010 20150
10
20
30
40
50
60
70
80
90
100T
reatm
ent C
overa
ge (
%)
China
High Burden, Pvt Sector
High MDR burden, Centralized Care
High TB-HIV, SADC
High TB-HIV, outside SADC
India
Low Burden, High Income
Moderate Burden, COE
Moderate Burden, Middle Income

www.stoptb.orgwww.stoptb.org
Progress against reaching 90% of people with TB First line treatment (2015)
• Treatment coverage in 30 high TB burden countries
• Varies from 15% to 87%
• 4 countries (Russian Federation, China, Brazil and Philippines) are above 80%,
• 19 countries are between 50-80%, and
• 7 countries are below 50% treatment coverage.
0 10 20 30 40 50 60 70 80 90 100
NigeriaIndonesia
UR TanzaniaMozambique
LiberiaLesotho
DR CongoThailand
CARBangladesh
CongoZambia
IndiaCambodia
Sierra LeonePakistan
South AfricaAngola
MyanmarEthiopia
ZimbabweKenya
Viet NamNamibia
PNGDPR KoreaPhilippines
BrazilChina
Russia
Treatment Coverage (%)
Source: WHO's global tuberculosis database, March 2016

www.stoptb.org
2005 2010 20150
200,000
400,000
600,000
800,000
1,000,000
1,200,000
1,400,000
1,600,000
1,800,000
Notified p
eople
with T
B
Philippines (+ 30’000)
China (- ~20’000)
India (+~100’000)
Indonesia (+ ~5000)
Pakistan (+ ~20’000)
South Africa (-~20’000)
Bangladesh (+ 15’000)
Myanmar (==)Ethiopia (+ 10’000)
Democratic Republic of the Congo (+ 4’000)
Democratic People's Republic of Korea (+~10’000)
Central African Republic
Viet Nam
Russian Federation
Nigeria
Kenya
Brazil
Thailand
United Republic of Tanzania
Angola
Mozambique
ZambiaCambodia
Zimbabwe
Papua New Guinea
Sierra LeoneCongo
NamibiaLesotho
Liberia
Source: WHO's global tuberculosis database, March 2016
Progress against reaching 90% of people with TB
First line treatment
Notifications in 30 high TB burden countries – dramatic increase in India, increases in few others and no increase/decline in rest.

www.stoptb.orgwww.stoptb.org
Proportion of children and adults with drug susceptible TB who are receiving first-line TB treatment
Source: WHO's global tuberculosis database, March 2016
Progress against reaching 90% of people with TB
First line treatment (2015)
• Children are left behind –much less likely to access care than adults
• Not much difference in treatment coverage between male and female
46% 48%
61% 63%
Girls Boys Women Men
www.stoptb.orgwww.stoptb.org
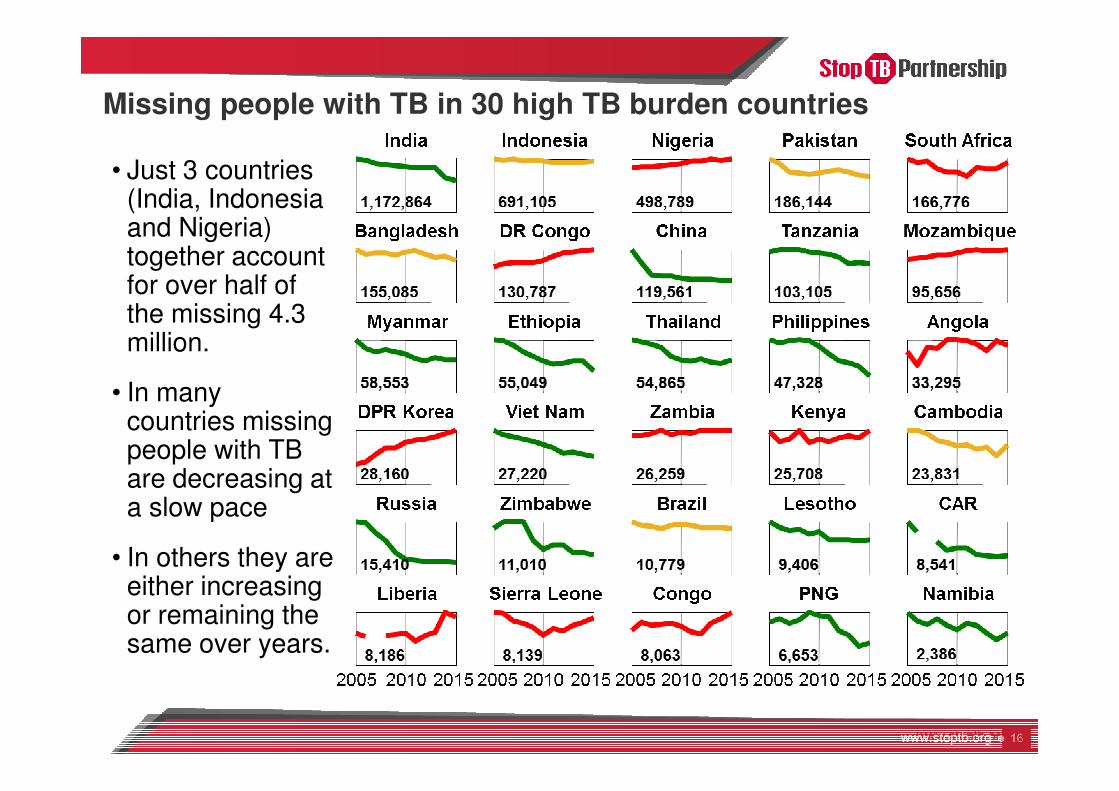
Missing people with TB in 30 high TB burden countries
• Just 3 countries (India, Indonesia and Nigeria) together account for over half of the missing 4.3 million.
• In many countries missing people with TB are decreasing at a slow pace
• In others they are either increasing or remaining the same over years.
www.stoptb.orgwww.stoptb.org
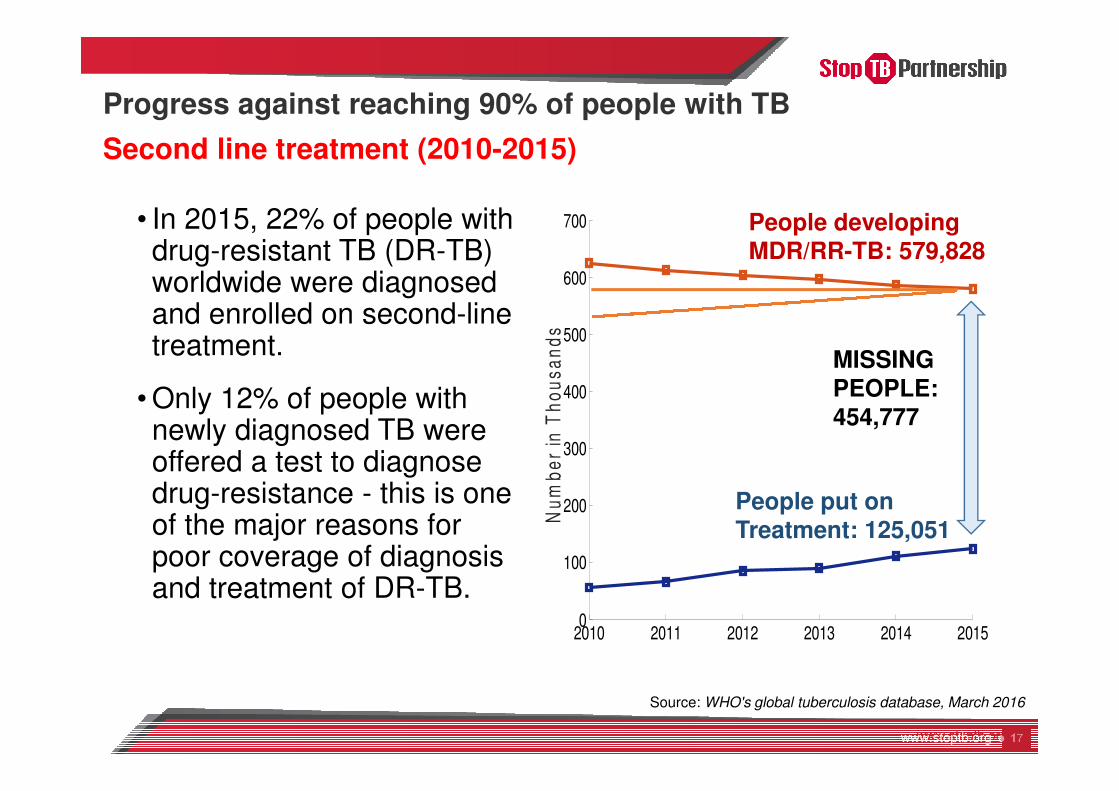
Progress against reaching 90% of people with TB
Second line treatment (2010-2015)
• In 2015, 22% of people with drug-resistant TB (DR-TB) worldwide were diagnosed and enrolled on second-line treatment.
• Only 12% of people with newly diagnosed TB were offered a test to diagnose drug-resistance - this is one of the major reasons for poor coverage of diagnosis and treatment of DR-TB.
2010 2011 2012 2013 2014 20150
100
200
300
400
500
600
700
Nu
mb
er
in T
ho
us
an
ds
People developing MDR/RR-TB: 579,828
People put on Treatment: 125,051
MISSING PEOPLE: 454,777
Source: WHO's global tuberculosis database, March 2016
www.stoptb.org
No data Not applicable
Source: WHO's global tuberculosis database, March 2016
Boundaries used on this map do not imply the expression of any opinion whatsoever on the
part of the Stop TB Partnership concerning the legal status of any country or territory or of
its authorities, or concerning the delimitation of its frontiers or boundaries
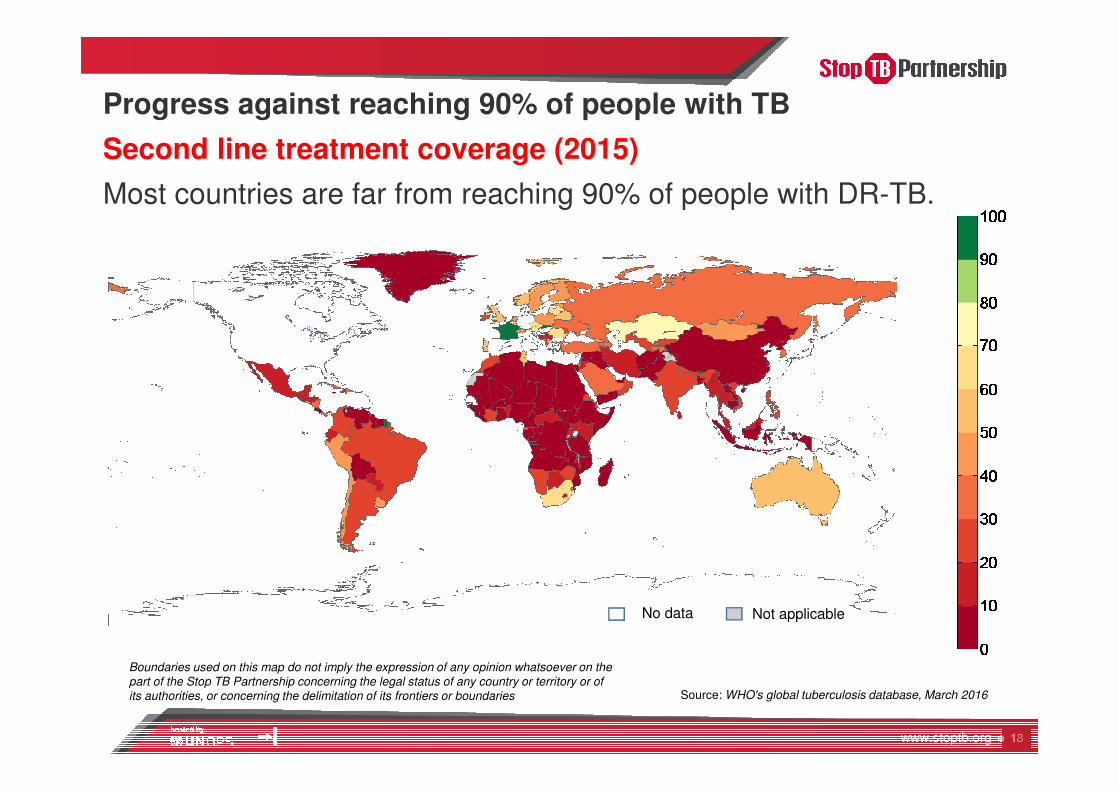
Progress against reaching 90% of people with TB
Second line treatment coverage (2015)
Most countries are far from reaching 90% of people with DR-TB.
www.stoptb.org
Source: WHO's global tuberculosis database, March 2016
2010 2011 2012 2013 2014 2015
0
5,000
10,000
15,000
20,000
25,000
30,000
India
South Africa
Russian Federation
China
Ukraine
Kazakhstan
Philippines
Pakistan
Myanmar
Viet Nam
Uzbekistan
Indonesia
Peru
Belarus
Nigeria
Azerbaijan
Kyrgyzstan
Bangladesh
Tajikistan
Mozambique
Ethiopia
Democratic Republic of the Congo
Zimbabwe
Thailand
Kenya
Papua New Guinea
Angola
Somalia
Democratic Republic of Korea
Moldova
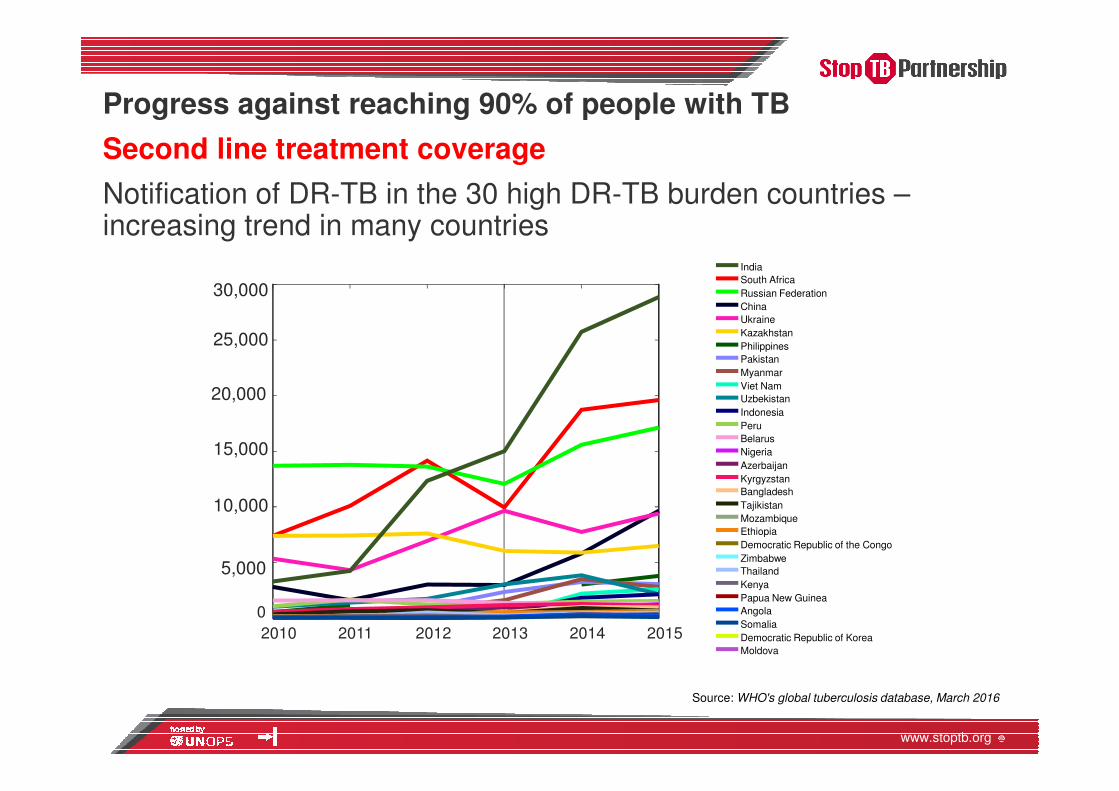
Progress against reaching 90% of people with TB
Second line treatment coverage
Notification of DR-TB in the 30 high DR-TB burden countries –increasing trend in many countries

www.stoptb.org
Source: WHO's global tuberculosis database, March 2016
0 10 20 30 40 50 60 70 80 90 100
DPR KoreaNigeria
SomaliaDR CongoIndonesia
AngolaChina
MozambiqueBangladesh
EthiopiaPakistanThailand
PNGMyanmar
KenyaIndia
UzbekistanKyrgyzstanZimbabwePhilippines
MoldovaViet Nam
AzerbaijanTajikistanUkraineRussia
PeruBelarus
South AfricaKazakhstan
Treatment Coverage (%)
Progress against reaching 90% of people with TB
Second line treatment coverage (2015)
Treatment coverage for drug resistant TB in the 30 high MDR-TB burden countries
• 11 countries less than 10%
• 4 countries (Kazakhstan, South Africa, Belarus and Peru) above 50%
• Globally, 448,000 people with DR-TB were missed.
• 4 countries (India, China, Russia and Indonesia) account for more than half of the missed DR-TB.
www.stoptb.orgwww.stoptb.org
Progress against reaching 90% of people with TB
Preventive treatment (PT)
• Current guidelines for high burden countries is to provide PT to:
• PLHIV and
• Child household contacts
• However, current practice in low burden and higher income countries is to provide PT to many groups

www.stoptb.orgwww.stoptb.org
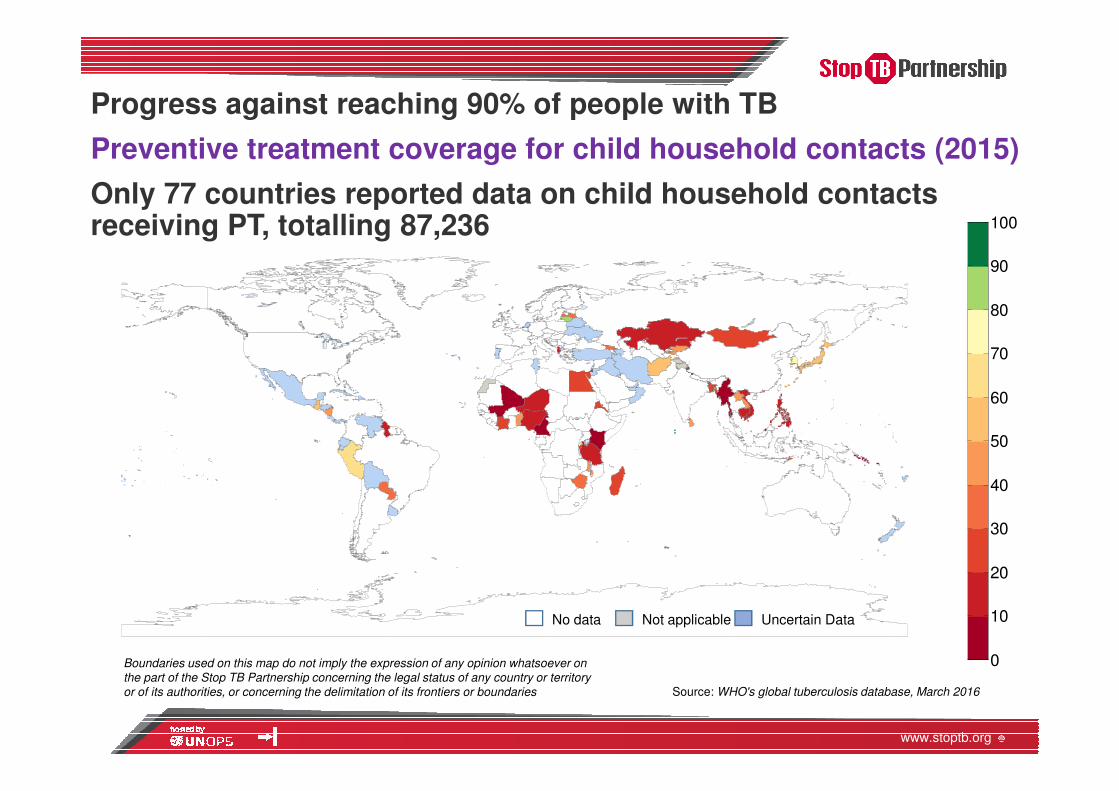
Progress against reaching 90% of people with TB
Preventive treatment coverage for child household contacts (2015)
• Globally, it is estimated that 1.2 million child contacts of people with lab confirmed notified TB are eligible for preventive therapy
• This underestimates the true need as it does not include:
• contacts of people with TB missing from care,
• child contacts of people with notified smear negative TB.
• Only 77 countries reported data on child household contacts receiving preventive TB therapy, totalling 87,236 (only 7% of the 1.2 million estimated to be eligible)
www.stoptb.org
0
10
20
30
40
50
60
70
80
90
100
Source: WHO's global tuberculosis database, March 2016
Boundaries used on this map do not imply the expression of any opinion whatsoever on
the part of the Stop TB Partnership concerning the legal status of any country or territory
or of its authorities, or concerning the delimitation of its frontiers or boundaries
No data Not applicable Uncertain Data
Progress against reaching 90% of people with TB
Preventive treatment coverage for child household contacts (2015)
Only 77 countries reported data on child household contacts receiving PT, totalling 87,236
www.stoptb.orgwww.stoptb.org
Progress against reaching 90% of people with TB
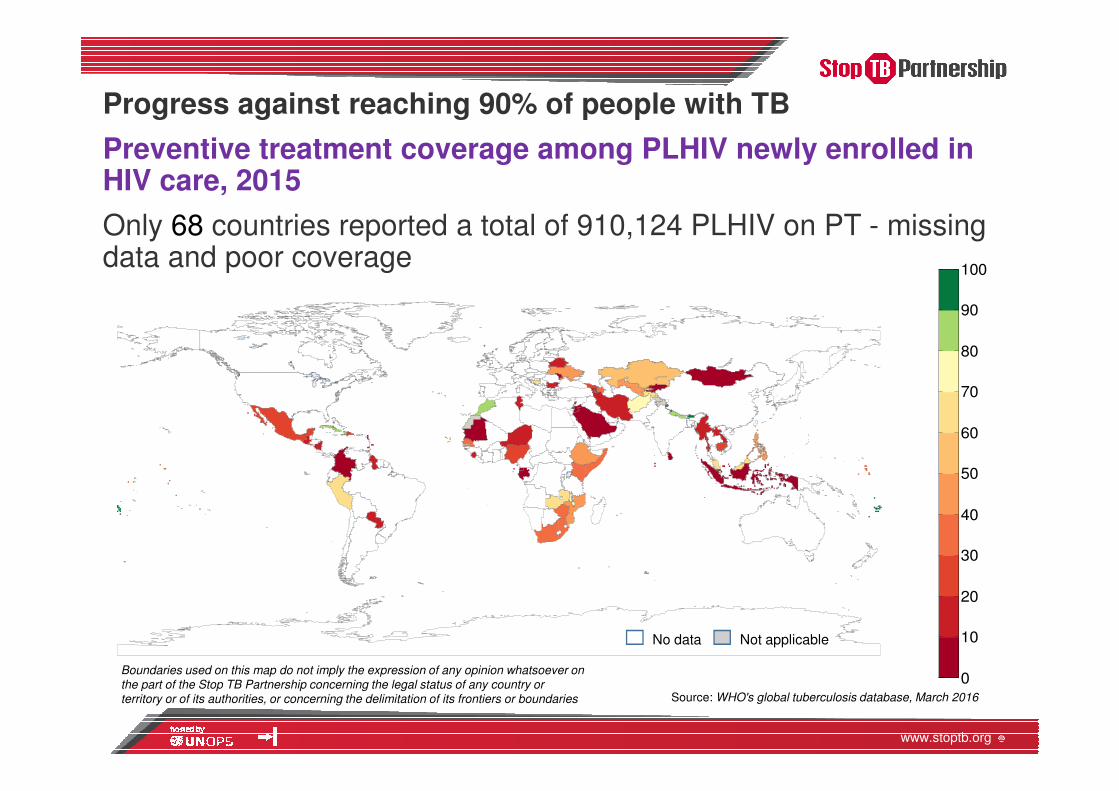
Preventive treatment coverage among People Living with HIV (PLHIV) newly enrolled in HIV care
• Worldwide, there are 37 million PLHIV of whom 2.4 million were newly enrolled in HIV care in 2015
• In 2015, 68 countries reported a total of only 910,124 received preventive TB treatment among PLHIV newly enrolled in HIV care
• Taking 2.4 million as a denominator is an underestimate of true need as it excludes the rest of the PLHIV
www.stoptb.org
0
10
20
30
40
50
60
70
80
90
100
Source: WHO's global tuberculosis database, March 2016
Boundaries used on this map do not imply the expression of any opinion whatsoever on
the part of the Stop TB Partnership concerning the legal status of any country or
territory or of its authorities, or concerning the delimitation of its frontiers or boundaries
No data Not applicable
Progress against reaching 90% of people with TB
Preventive treatment coverage among PLHIV newly enrolled in HIV care, 2015
Only 68 countries reported a total of 910,124 PLHIV on PT - missing data and poor coverage
www.stoptb.org
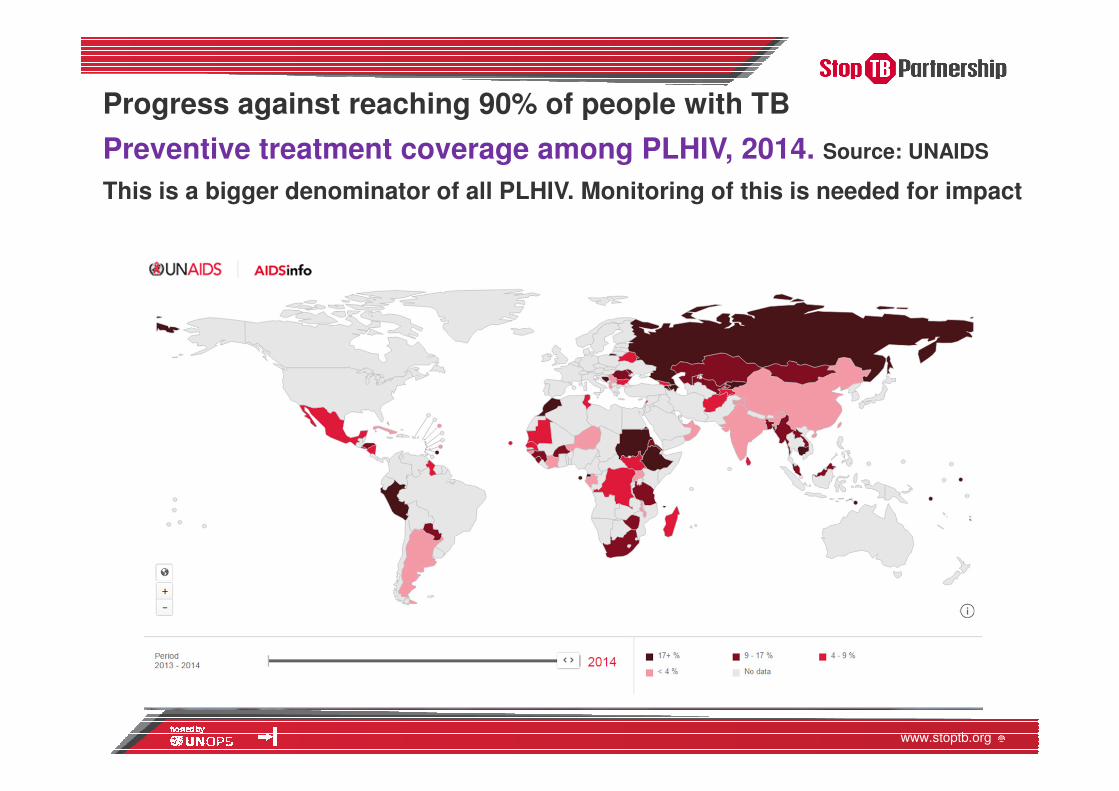
Progress against reaching 90% of people with TB
Preventive treatment coverage among PLHIV, 2014. Source: UNAIDS
This is a bigger denominator of all PLHIV. Monitoring of this is needed for impact

www.stoptb.orgwww.stoptb.org
Progress against reaching 90% of Key Populations
Overall progress
• Data on most key populations:
• virtually non-existent at the global level,
• limited at the regional and national level, and
• a small quantity is generated at the sub-national level in special projects and initiatives.
• There is no standard approach to the data collection, collation, analysis and its programmatic usage.

www.stoptb.orgwww.stoptb.org
Who are Key Populations?
• Defined in Global Plan as people who are vulnerable, under-served or at-risk
Source: Global Plan to End TB: 2016-2020
www.stoptb.orgwww.stoptb.org
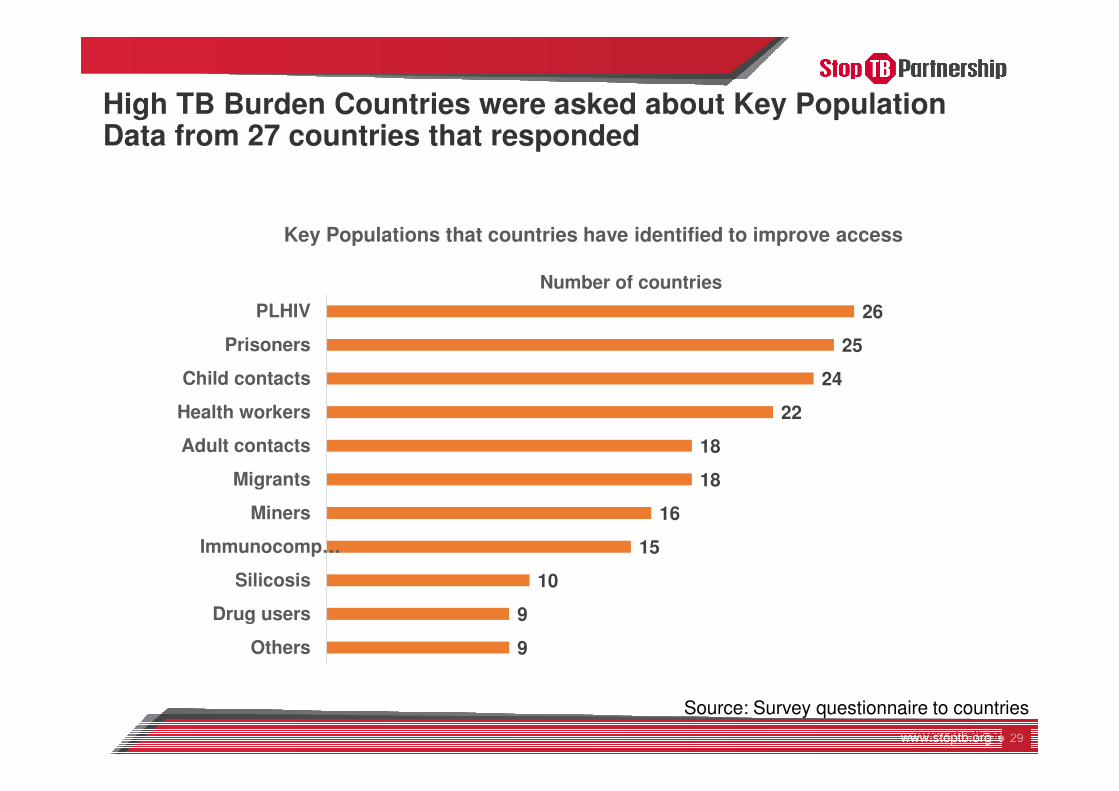
High TB Burden Countries were asked about Key Population Data from 27 countries that responded
26
25
24
22
18
18
16
15
10
9
9
PLHIV
Prisoners
Child contacts
Health workers
Adult contacts
Migrants
Miners
Immunocomp…
Silicosis
Drug users
Others
Number of countries
Key Populations that countries have identified to improve access
Source: Survey questionnaire to countries
www.stoptb.orgwww.stoptb.org
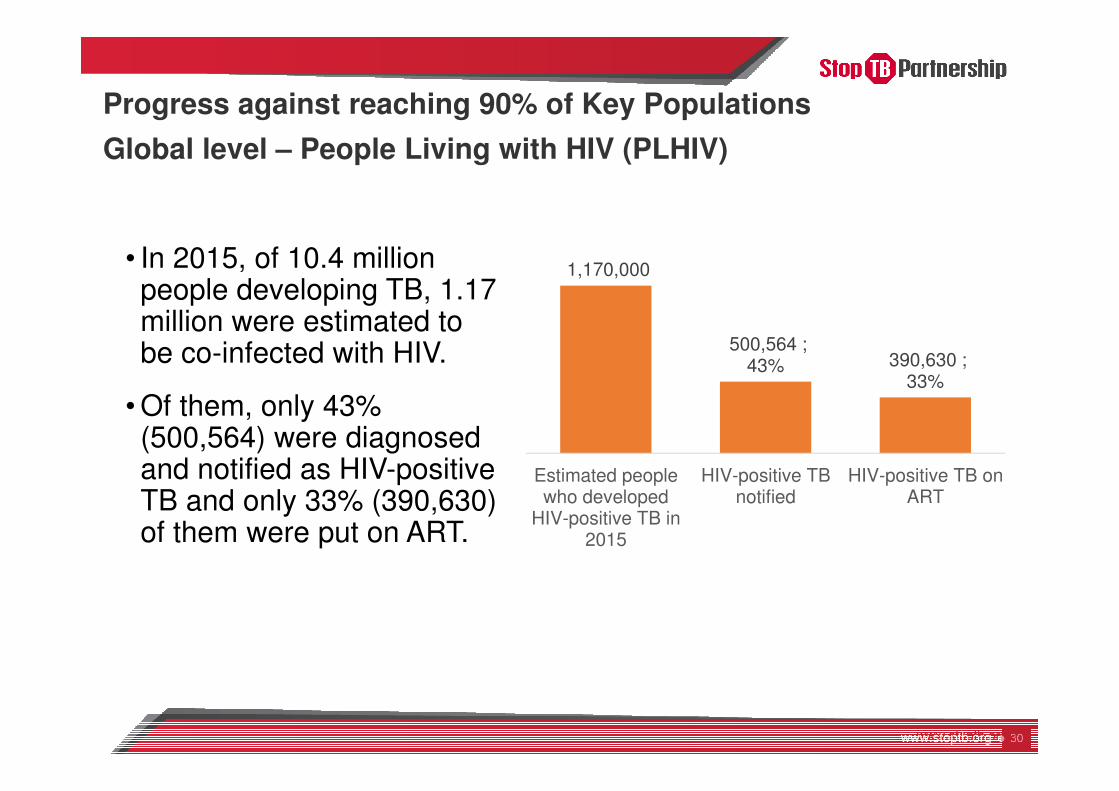
Progress against reaching 90% of Key Populations
Global level – People Living with HIV (PLHIV)
• In 2015, of 10.4 million people developing TB, 1.17 million were estimated to be co-infected with HIV.
• Of them, only 43% (500,564) were diagnosed and notified as HIV-positive TB and only 33% (390,630) of them were put on ART.
1,170,000
500,564 ; 43% 390,630 ;
33%
Estimated peoplewho developed
HIV-positive TB in2015
HIV-positive TBnotified
HIV-positive TB onART
www.stoptb.orgwww.stoptb.org
Progress against reaching 90% of Key Populations
Regional level
At the regional level systematic data collection is currently being undertaken in two regions:
• In Europe and Central Asia by the European Centre for Disease Prevention and Control (ECDC)/WHO EURO on migrants and prisoner.
• In the Southern African Development Community (SADC) region by the regional Global Fund TB & Mining project on miners.
ECDC report: http://ecdc.europa.eu/en/publications/Publications/ecdc-tuberculosis-surveillance-monitoring-Europe-2017.pdf
www.stoptb.orgwww.stoptb.org
Progress against reaching 90% of Key Populations
Europe and Central Asia
Prisoners
• In 2015, among a total of 1.5 million prisoners, 13,845 (almost 1%) were notified as TB.
• This represents 5.9% of all notified TB in the region. Prisoners in the region are less than 0.2% of the population but have a 24 times higher risk of developing TB.
• Treatment success among 16,152 prisoners starting on first-line treatment (2014) was 59.3% versus 76% overall treatment success in the region
Migrants
• In 2015, 19,658 foreign-born people in Europe and Central Asia developed TB, this represents 6.3% of the total TB notified in the region.
www.stoptb.orgwww.stoptb.org
Progress against reaching 90% of Key Populations: SADC Region
Mining
• Among 8 of the SADC countries, the total mining population is 2,182,868 million (1.5% of the total population).
• Out of 366148 people with TB, 12608 (3.4%) are from the mining community.
• Of 20,867 people with DR-TB, 469 (2.2%) are from the mining community.
• SADC regional Global Fund TB & Mining project screened 107,430 people for TB.
• Of which 33,845 (31.5%) are miners/families, 49,057 (45.7%) are ex-miners/families and 24,528 (22.8%) community members.
• 208 people detected with TB (194/100,000) and 159 were put on treatment.
SADC countries: Botswana, Lesotho, Namibia, Malawi, Mozambique, South Africa, Swaziland, Tanzania, Zambia, Zimbabwe.
www.stoptb.orgwww.stoptb.org
Progress against reaching 90% of Key Populations
India – Bold National Plan to end TB by 2025
90% of key populations will be reached by 2018
• 184 districts, plus 4 metropolitan cities and 1 State will conduct active case finding
• In early 2017, an initial 2-week long active case finding campaign in 50 districts with high-risk or underserved population resulted in testing of 26,000 people from which 1800 (7%) with TB were found, otherwise undetected by passive case finding system
• Key population groups identified separately for urban, rural and tribal areas
• Information campaign along with active case finding in a campaign mode will be conducted 3 times a year

www.stoptb.orgwww.stoptb.org
Progress against reaching 90% of Key Populations
Brazil
South Africa
Russia
• In 2015, there were 920,006 prisoners in Brazil, among whom 6,021 were diagnosed with TB, accounting for 8.2% of total notified TB in the country.
• The incidence rate of TB among prisoners was 654 per 100,000, which is 16 times higher compared to the estimated national TB incidence of 41 per 100,000.
• Active case finding approach implemented in prisons and mining affected communities
• 68% of the population was screened in 2015 and about half of the TB detected was through this active screening
www.stoptb.orgwww.stoptb.org
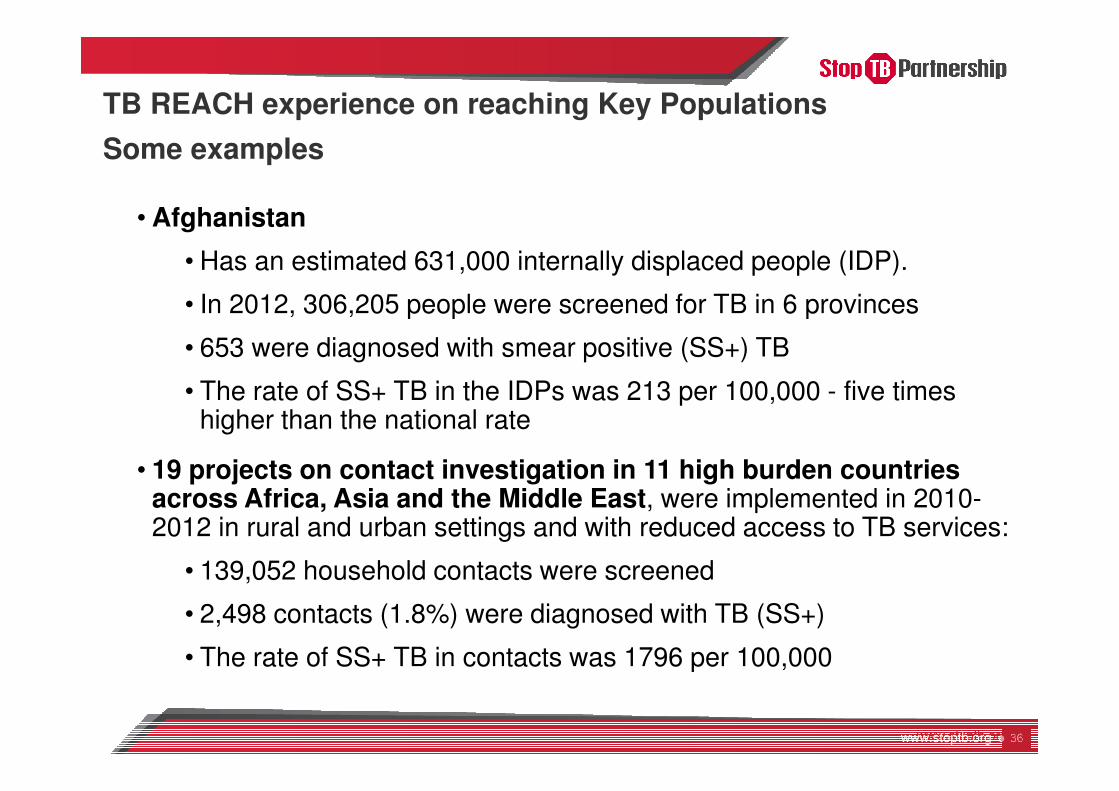
TB REACH experience on reaching Key Populations
Some examples
• Afghanistan
• Has an estimated 631,000 internally displaced people (IDP).
• In 2012, 306,205 people were screened for TB in 6 provinces
• 653 were diagnosed with smear positive (SS+) TB
• The rate of SS+ TB in the IDPs was 213 per 100,000 - five times higher than the national rate
• 19 projects on contact investigation in 11 high burden countries across Africa, Asia and the Middle East, were implemented in 2010-2012 in rural and urban settings and with reduced access to TB services:
• 139,052 household contacts were screened
• 2,498 contacts (1.8%) were diagnosed with TB (SS+)
• The rate of SS+ TB in contacts was 1796 per 100,000

www.stoptb.orgwww.stoptb.org
Progress against achieving 90% treatment success
Overall progress
• Treatment success
• for first-line treatment is at 83%
• for second-line treatment is 51%.
• no routine surveillance data available to assess successful completion of preventive treatment.

www.stoptb.orgwww.stoptb.org
Progress against achieving 90% treatment success
First line treatment success
• The global treatment success rate is 83%
• Has dropped from 86% in 2013 due to an increase in the proportion of people with TB not evaluated
Succeed (86%)
Lost (4%)
Failed (1%)
Died (4%)
Not Evaluated(4%)
Succeed (86%)
Lost (4%)
Failed (1%)
Died (4%)Not Evaluated(4%)
Succeed (83%)
Lost (4%)
Failed (1%)
Died (4%)
Not Evaluated (8%)
2012 2013 2014
Source: WHO's global tuberculosis database, March 2016
www.stoptb.org
No data Not applicable
Source: WHO's global tuberculosis database, March 2016
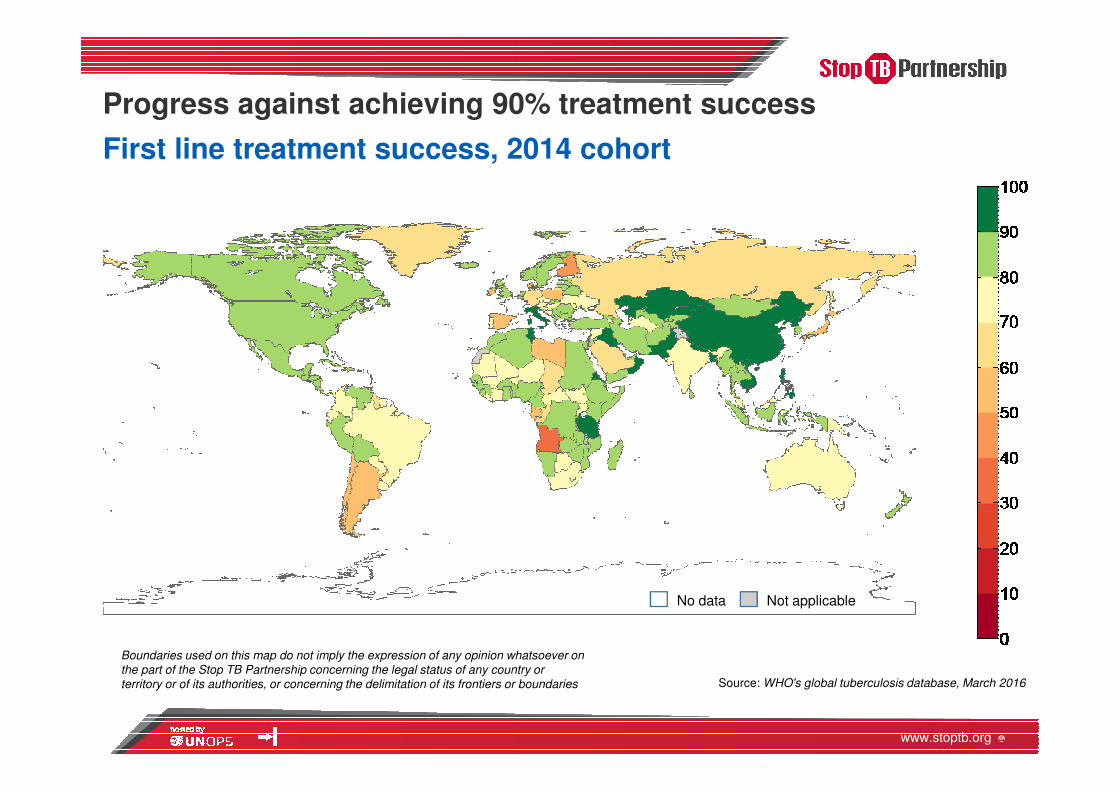
Progress against achieving 90% treatment success
First line treatment success, 2014 cohort
Boundaries used on this map do not imply the expression of any opinion whatsoever on
the part of the Stop TB Partnership concerning the legal status of any country or
territory or of its authorities, or concerning the delimitation of its frontiers or boundaries
www.stoptb.orgwww.stoptb.org
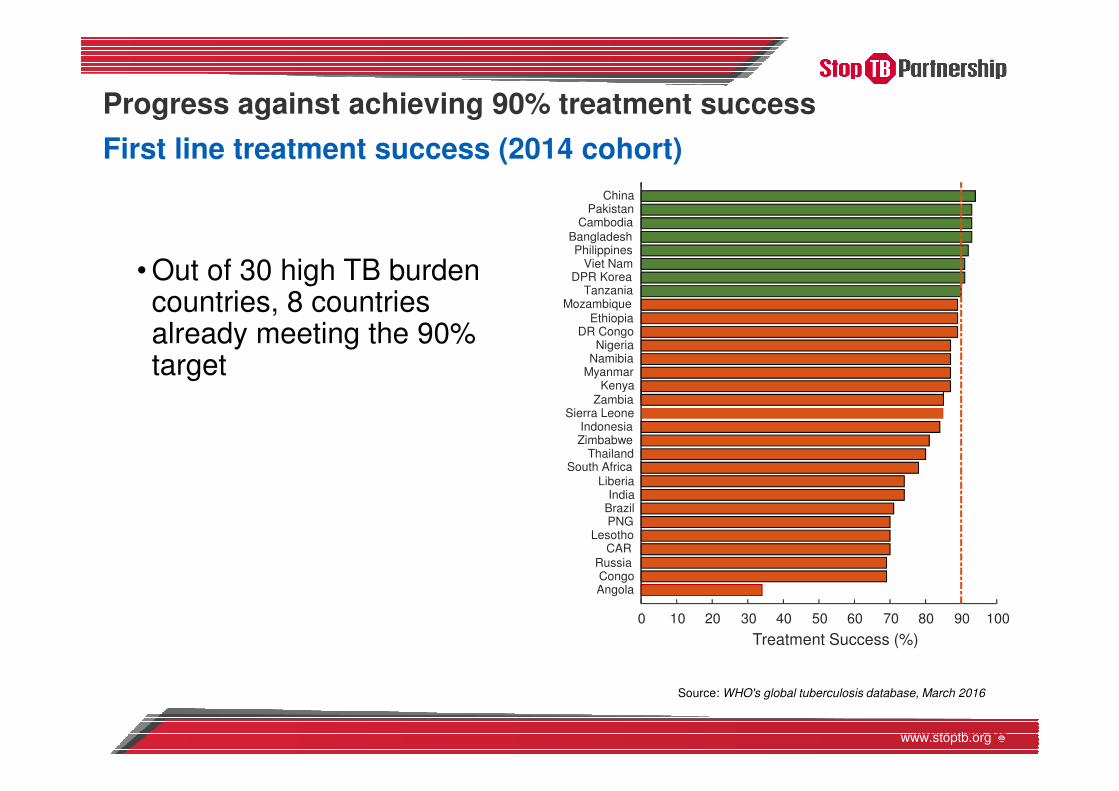
Progress against achieving 90% treatment success
First line treatment success (2014 cohort)
• Out of 30 high TB burden countries, 8 countries already meeting the 90% target
Treatment Success (%)
0 10 20 30 40 50 60 70 80 90 100
AngolaCongo
Russia
CARLesotho
PNGBrazilIndia
Liberia
South AfricaThailand
ZimbabweIndonesia
Sierra LeoneZambia
KenyaMyanmarNamibiaNigeria
DR CongoEthiopia
MozambiqueTanzania
DPR KoreaViet Nam
PhilippinesBangladesh
CambodiaPakistan
China
Source: WHO's global tuberculosis database, March 2016

www.stoptb.orgwww.stoptb.org
Progress against achieving 90% treatment success
First line treatment success (2014 cohort)
Global Plan nine country settings
Source: WHO's global tuberculosis database, March 2016
0 10 20 30 40 50 60 70 80 90 100
India
Low Burden, High Income
High MDR burden, Centralized Care
High TB-HIV, SADC
Moderate Burden, COE
Moderate Burden, Middle Income
High TB-HIV, outside SADC
High Burden, Pvt Sector
China
Treatment Success (%)
SucceedLost
FailedDied
Not Evaluated

www.stoptb.orgwww.stoptb.org
Progress against achieving 90% treatment success
First line treatment success (2014 cohort)
TB treatment success among People Living with HIV (PLHIV)
• Only 112 countries reported on treatment outcome for HIV-positive TB
• The global treatment success for HIV-positive TB on first-line treatment was 75%
• In two WHO Regions (European and Eastern Mediterranean) first line treatment success of HIV-positive TB was below 50%.
www.stoptb.orgwww.stoptb.org
Source: WHO's global tuberculosis database, March 2016
0 10 20 30 40 50 60 70 80 90 100
ThailandUkraine
IndiaSouth Africa
RussiaPhilippines
IndonesiaMozambique
UzbekistanBelarus
PeruPNG
ChinaMoldova
KyrgyzstanZimbabweAzerbaijan
TajikistanDR Congo
EthiopiaViet NamPakistan
KazakhstanAngola
BangladeshSomaliaNigeriaKenya
MyanmarDPR Korea
Treatment Success (%)
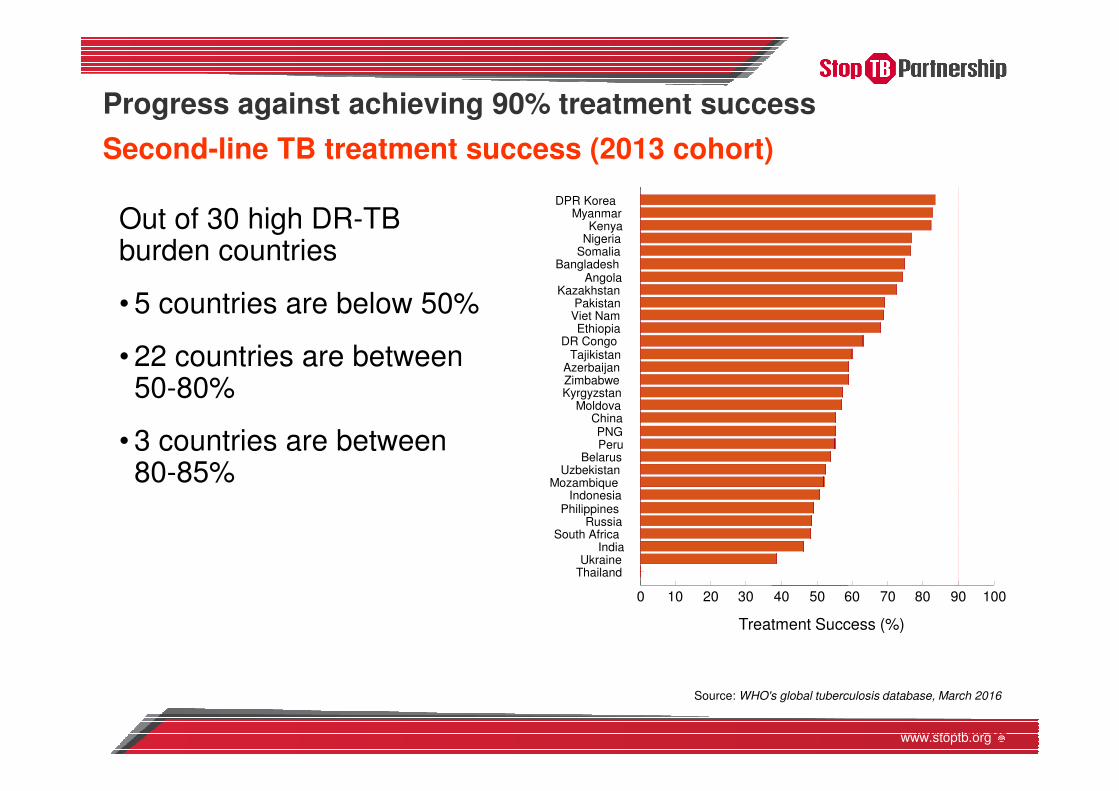
Progress against achieving 90% treatment success
Second-line TB treatment success (2013 cohort)
Out of 30 high DR-TB burden countries
• 5 countries are below 50%
• 22 countries are between 50-80%
• 3 countries are between 80-85%

www.stoptb.orgwww.stoptb.org
Treatment success among people on preventive TB therapy
There is no data reported on treatment completion
among PLHIV or child contacts who have started on preventive TB therapy
www.stoptb.orgwww.stoptb.org
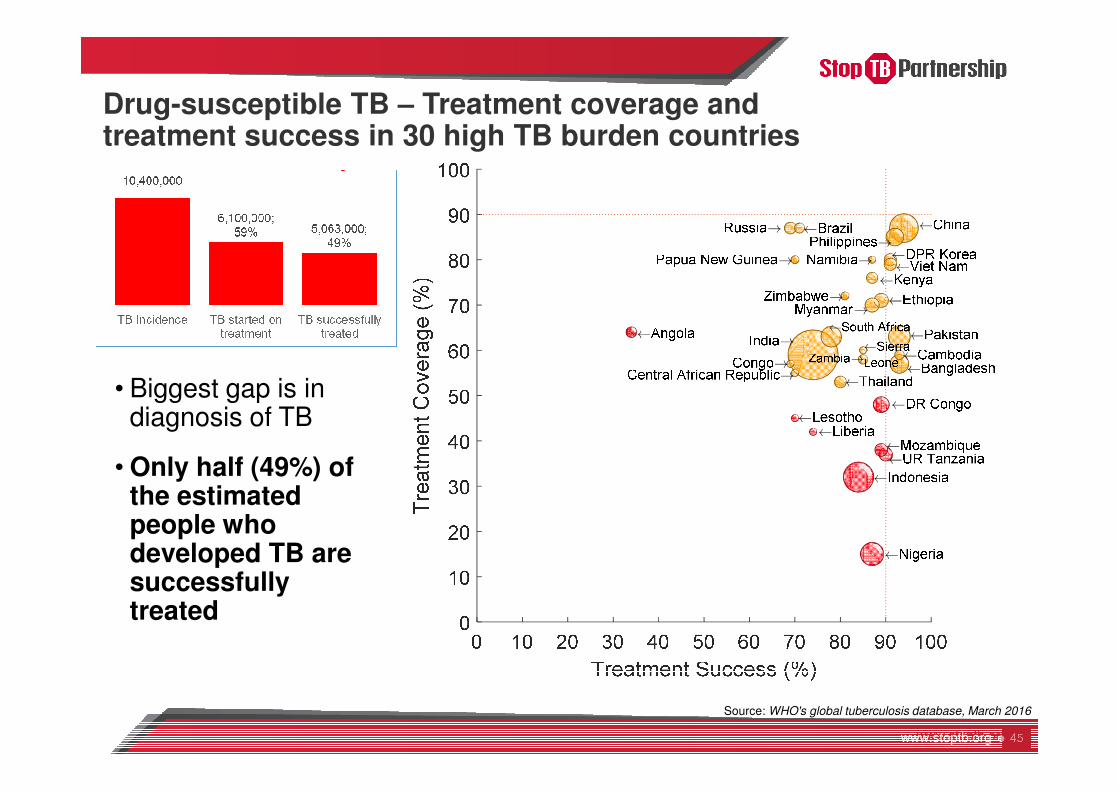
Drug-susceptible TB – Treatment coverage and treatment success in 30 high TB burden countries
• Biggest gap is in diagnosis of TB
• Only half (49%) of the estimated people who developed TB are successfully treated
Source: WHO's global tuberculosis database, March 2016

www.stoptb.orgwww.stoptb.org
Drug-resistant TB – treatment coverage and treatment success in 30 high DR-TB burden countries
• Biggest gap is in diagnosis of DR-TB
• Treatment outcome is poor but some countries achieving 80% treatment success, and new regimen/drugs offer hope
• Only 1 in 10 people estimated to develop DR-TB are successfully treated
Source: WHO's global tuberculosis database, March 2016

www.stoptb.orgwww.stoptb.org
Focus of the monitoring report of 90-(90)-90 targets
Collection, analyzing and reporting on the existing global TB data in this progress report has highlighted:
• Highlights the dramatic and difficult situation – response not at par with the size of the burden
• Points out progress or lack of progress in different areas related to the 90-(90)-90 targets
Now, how can the monitoring improve?
• Data gaps and policy issues related to monitoring is in the next few slides

www.stoptb.orgwww.stoptb.org
Gaps in data and monitoring policy……1
Reaching 90% of all people with TB
Gaps Benefits of addressing the gap
1. Care cascade data on diagnosis is missing
at global level and not prioritized at national
level
• Number of presumptive TB
• Laboratory data on numbers tested and
numbers positive
• Number diagnosed with TB
This data is critical for:
• Monitoring gaps in the care
cascade, such as initial dropouts
during the diagnostic process or
between diagnosis and treatment.
• The change in policy from a
treatment based notification to a
diagnosis based notification as
recommended by the Global Plan
2. Age and sex disaggregation in notification
data is incomplete
• 0-5 year age group is missing in 33
countries for DS-TB notifications
• Age and sex disaggregation is missing for
DR-TB notifications
This data is needed for:
• Monitoring TB treatment coverage in
young children
• Monitoring DR-TB treatment
coverage for men, women and
children.
www.stoptb.orgwww.stoptb.org
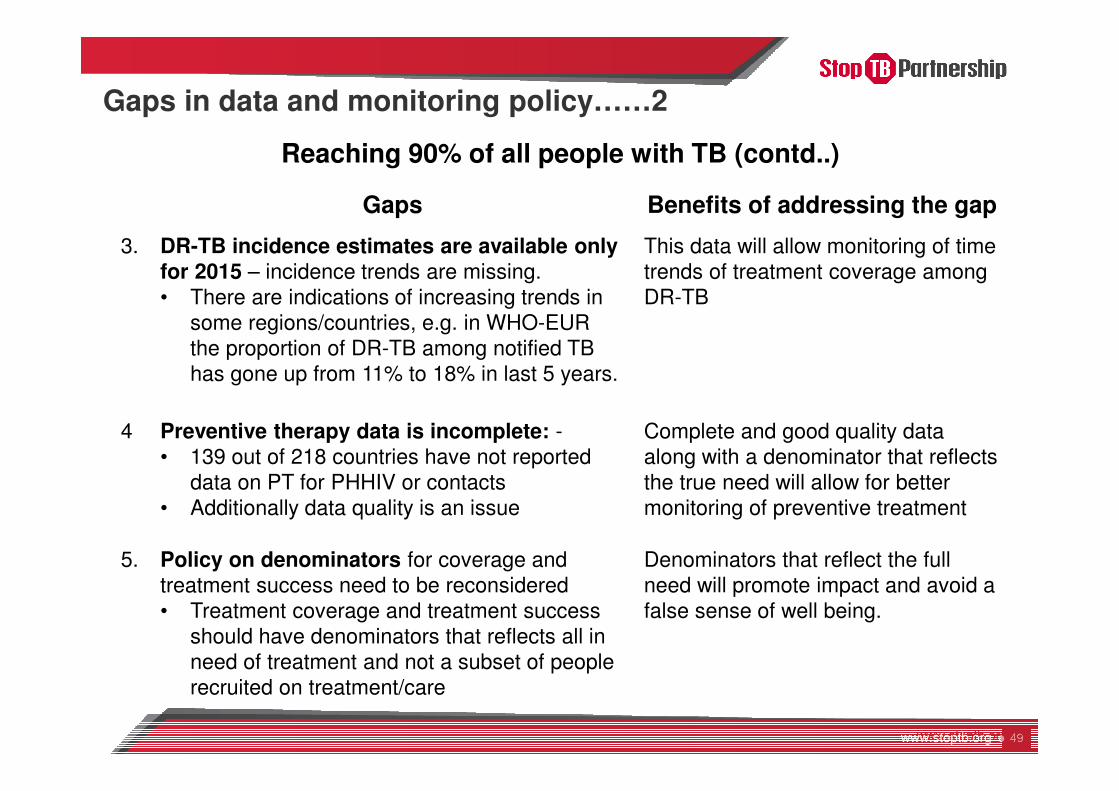
Gaps in data and monitoring policy……2
Reaching 90% of all people with TB (contd..)
Gaps Benefits of addressing the gap
3. DR-TB incidence estimates are available only for 2015 – incidence trends are missing.
• There are indications of increasing trends in
some regions/countries, e.g. in WHO-EUR
the proportion of DR-TB among notified TB
has gone up from 11% to 18% in last 5 years.
This data will allow monitoring of time
trends of treatment coverage among
DR-TB
4 Preventive therapy data is incomplete: -
• 139 out of 218 countries have not reported
data on PT for PHHIV or contacts
• Additionally data quality is an issue
Complete and good quality data
along with a denominator that reflects
the true need will allow for better
monitoring of preventive treatment
5. Policy on denominators for coverage and
treatment success need to be reconsidered
• Treatment coverage and treatment success
should have denominators that reflects all in
need of treatment and not a subset of people
recruited on treatment/care
Denominators that reflect the full
need will promote impact and avoid a
false sense of well being.
www.stoptb.orgwww.stoptb.org
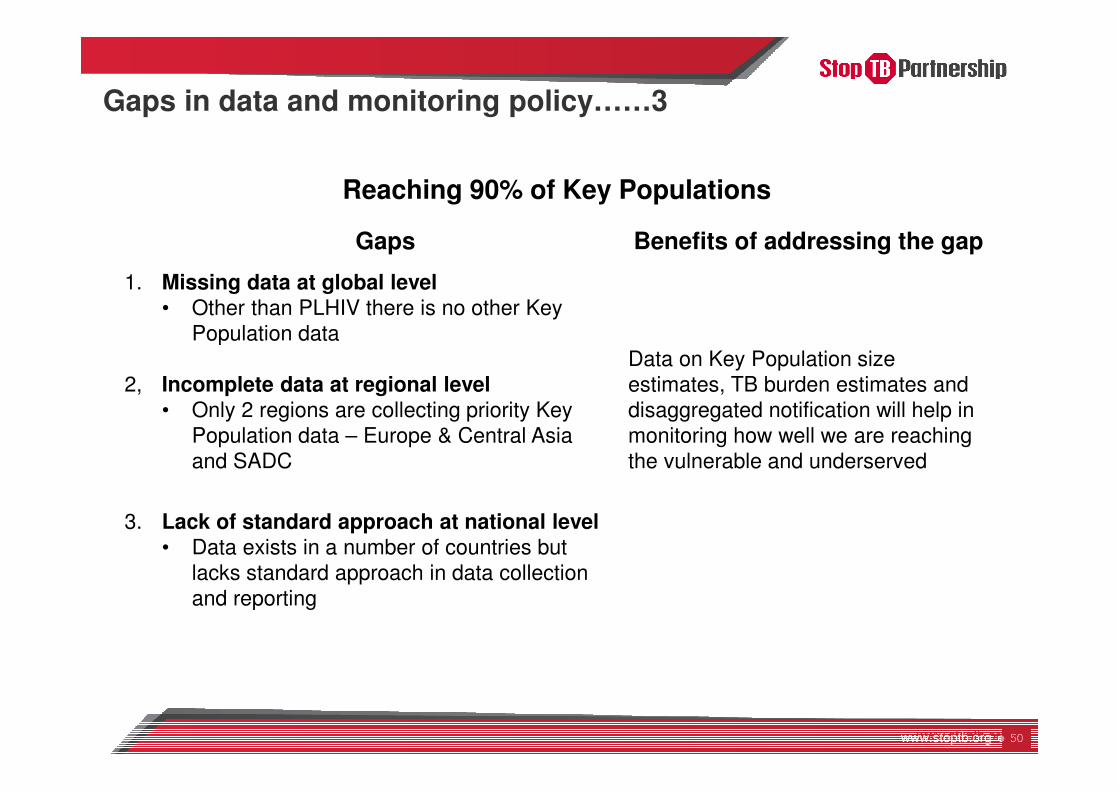
Gaps in data and monitoring policy……3
Reaching 90% of Key Populations
Gaps Benefits of addressing the gap
1. Missing data at global level• Other than PLHIV there is no other Key
Population data
Data on Key Population size
estimates, TB burden estimates and
disaggregated notification will help in
monitoring how well we are reaching
the vulnerable and underserved
2, Incomplete data at regional level • Only 2 regions are collecting priority Key
Population data – Europe & Central Asia
and SADC
3. Lack of standard approach at national level• Data exists in a number of countries but
lacks standard approach in data collection
and reporting
www.stoptb.orgwww.stoptb.org
Gaps in data and monitoring policy……4
Key Population framework
• As recommended in the Global Plan a framework for key, vulnerable and underserved populations is currently under development in an effort to address gaps in their access to quality TB services.
• Tools in the Key Populations Framework will allow countries to
• Identify specific key populations relevant to the setting
• Estimate their population size and disease burden
• Identify barriers to access and relevant programmatic interventions.
www.stoptb.orgwww.stoptb.org
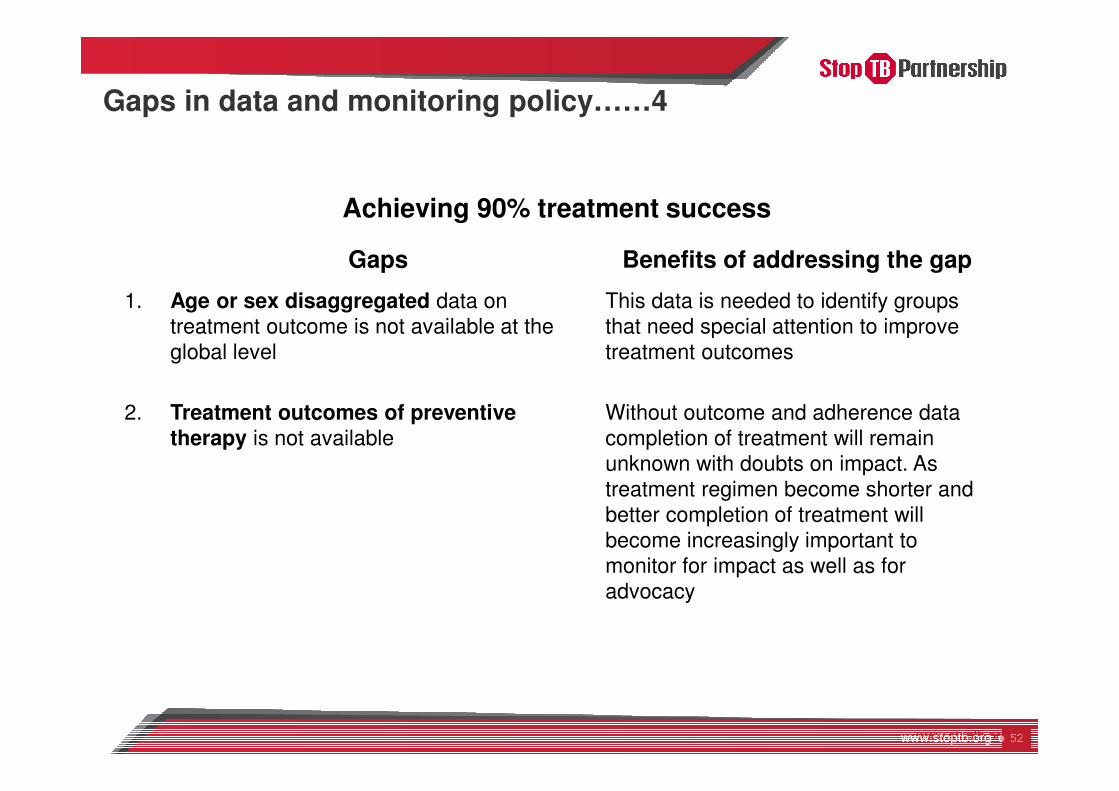
Gaps in data and monitoring policy……4
Achieving 90% treatment success
Gaps Benefits of addressing the gap
1. Age or sex disaggregated data on
treatment outcome is not available at the
global level
This data is needed to identify groups
that need special attention to improve
treatment outcomes
2. Treatment outcomes of preventive therapy is not available
Without outcome and adherence data
completion of treatment will remain
unknown with doubts on impact. As
treatment regimen become shorter and
better completion of treatment will
become increasingly important to
monitor for impact as well as for
advocacy

www.stoptb.org
Huge gap in reaching people with DS-TB and DR-TB still persist
Although a few examples of progress in recent years is encouraging.
Treatment success for DS-TB has fallen in recent years while that of DR-TB remains unacceptably low
A few countries are showing that it is possible to achieve good treatment success even in DR-TB.
Data gaps need to be addressed:� Age/sex� Key Populations� Lab testing and diagnosis data for care cascade� DR-TB incidence trends
Preventive therapy suffers from grossly incomplete reporting and is currently focused on relatively small groups
Choice of ALL PEOPLE IN NEED as the denominator is needed to avoid a false sense of success and keep us focused on impact
Denominators that do not reflect the full need may be easier to measure but not good for impact
Take Home Messages

Thank you
• Suvanand Sahu, Fatima Kazi, Sara Gonzalez, Jacob Creswell, Lucica Ditiu
5
4
Related Documents