MONITORING OF AUTO EXHAUST POLLUTION BY ROADSIDE PLANTS N. SINGH,* M. YUNUS, K. SRIVASTAVA,S.N. SINGH, V. PANDEY, J. MISRA and K.J. AHMAD Environmental Botany Laboratory, National Botanical Research Institute, Lucknow 226 001, India (Received: April 1994; revised: October 1994) Abstract. The changing levels of SO2 and Pb in the air and vegetation, along ten road transections of Lucknow city (having varying traffic densities) have been investigated, with a view to authenticate a possible correlation between SO2 and Pb concentration in air and sulphate and lead accumulation in the foliage of avenue trees. The study showed that the road transection at Alambagh (traffic density 4835 for 2 h) revealed.the highest level of pollutants (SO2, 202 #g m-3; SPM, 1080 #g m-3; and lead, 2.96/zg m -3, 2 h average) in air, as well as in the foliage of plants, whereas the road stretches with less traffic density correspondingly showed lower levels of pollutants. Pb and sulphate in leaves were found to be positively correlated with Pb and SO2 pollution in the air. Results suggest that Dalbergia sissoo and Calotropis procera are the ideal plant species to monitor as indications of Pb and SO2, respectively, in the air. 1. Introduction Motor vehicles account for 60-70% of the pollution found in an urban environment. The major pollutants emitted from automobiles are CO2, CO, oxides of nitrogen, SO2, heavy metals (particularly Pb), unburnt hydrocarbon, carbon particles and water vapours. Lead is added to petrol as organic tetra alkyl lead and ethyl- trimethyl lead. In India this addition amounts to 150-300 mg Pb 1 -t of which 80-90% escapes in car exhausts. Motor cars release approximately 80 mg Pb km -1 (Smith, 1981). Besides Pb, SO2 is another major pollutant emitted in automobile exhaust, especially from diesel vehicles. According to data published by U.P. Department of Environment, India (5 June 1994), 1.50 g SO2 is emitted per 1000 1 gasoline used. Such levels of emission are liable to make the roadside environment a grossly contaminated zone. With the rapid increase in the number of motor vehicles on Indian roads, a considerable quantity of lead and SO2 is now being emitted annually. In the last six years the number of automobiles has increased from 1.82 lakhs to over 3 lakhs (Ghosh, 1994) in Lucknow city alone. Vegetation and soils are important sinks for atmospheric pollutants (Smith, 1984). The vegetative components of the ecosystems are also useful biomonitors of atmospheric pollutant deposition (Burton, 1986; Singh, 1988; Farga~ov~i, 1994). Bryophytes (Grodzinska, 1982; Martin and Coughtrey, 1982; Burton et al., 1986; * To whom correspondence should be addressed. Environmental Monitoring and Assessment 34: 13-25, 1995. (~) 1995 Kluwer Academic Publishers. Printed in the Netherlands.

Welcome message from author
This document is posted to help you gain knowledge. Please leave a comment to let me know what you think about it! Share it to your friends and learn new things together.
Transcript
MONITORING OF AUTO EXHAUST POLLUTION BY ROADSIDE
PLANTS
N. SINGH,* M. YUNUS, K. SRIVASTAVA, S.N. SINGH, V. PANDEY, J. MISRA and K.J. AHMAD
Environmental Botany Laboratory, National Botanical Research Institute, Lucknow 226 001, India
(Received: April 1994; revised: October 1994)
Abstract. The changing levels of SO2 and Pb in the air and vegetation, along ten road transections of Lucknow city (having varying traffic densities) have been investigated, with a view to authenticate a possible correlation between SO2 and Pb concentration in air and sulphate and lead accumulation in the foliage of avenue trees. The study showed that the road transection at Alambagh (traffic density 4835 for 2 h) revealed.the highest level of pollutants (SO2, 202 #g m-3; SPM, 1080 #g m-3; and lead, 2.96/zg m -3, 2 h average) in air, as well as in the foliage of plants, whereas the road stretches with less traffic density correspondingly showed lower levels of pollutants. Pb and sulphate in leaves were found to be positively correlated with Pb and SO2 pollution in the air. Results suggest that Dalbergia sissoo and Calotropis procera are the ideal plant species to monitor as indications of Pb and SO2, respectively, in the air.
1. Introduction
Motor vehicles account for 60-70% of the pollution found in an urban environment. The major pollutants emitted from automobiles are CO2, CO, oxides of nitrogen, SO2, heavy metals (particularly Pb), unburnt hydrocarbon, carbon particles and water vapours. Lead is added to petrol as organic tetra alkyl lead and ethyl- trimethyl lead. In India this addition amounts to 150-300 mg Pb 1 - t of which 80-90% escapes in car exhausts. Motor cars release approximately 80 mg Pb km -1 (Smith, 1981).
Besides Pb, SO2 is another major pollutant emitted in automobile exhaust, especially from diesel vehicles. According to data published by U.P. Department of Environment, India (5 June 1994), 1.50 g SO2 is emitted per 1000 1 gasoline used. Such levels of emission are liable to make the roadside environment a grossly contaminated zone.
With the rapid increase in the number of motor vehicles on Indian roads, a considerable quantity of lead and SO2 is now being emitted annually. In the last six years the number of automobiles has increased from 1.82 lakhs to over 3 lakhs (Ghosh, 1994) in Lucknow city alone.
Vegetation and soils are important sinks for atmospheric pollutants (Smith, 1984). The vegetative components of the ecosystems are also useful biomonitors of atmospheric pollutant deposition (Burton, 1986; Singh, 1988; Farga~ov~i, 1994). Bryophytes (Grodzinska, 1982; Martin and Coughtrey, 1982; Burton et al., 1986;
* To whom correspondence should be addressed.
Environmental Monitoring and Assessment 34: 13-25, 1995. (~) 1995 Kluwer Academic Publishers. Printed in the Netherlands.
14 N. SINGH ET AL.
Kingston et aL, 1988), and lichens (Puckett and Burton, 1981; Brown and Beckett, 1984) have been extensively used for monitoring pollutant deposition.
Trees, by virtue of their perennial habitat, experience the greatest exposure and are influenced greatly by any appreciable change in the environment. As regards environment protection, trees assimilate and accumulate pollutants through the stomas in the leaves and purify the environment. Many studies have been conducted involving analysis Of trees for Pb at roadside locations to examine, e.g. species differences, relationships to distance from the road, traffic volume and seasonal changes in terms of accumulation (Smith, 1976; Peterson, 1978; Martin and Coughtry, 1982; Singh et al., 1993). In contrast to the mainly analytical approach used in the monitoring of metals, gaseous pollutants have been monitored chiefly by their effects on higher plants in terms of growth, visible damage to leaves and biochemical changes. The extensive monitoring programme for a range of gaseous pollutants in the Netherlands has been reviewed by Posthumus (1982). Lorenzini and Panicucci (1994) carried out experiments in order to obtain more information on some aspects of sulphur accumulation in plants under realistic, non-marking SO2 pollution conditions, in connection with biomass production.
Lead remains largely as a superficial deposition or topical aerosol coating on plant surfaces (Schuck and Locke, 1970; Zimdahl, 1976). If Pb is deposited in a soluble form it is rendered soluble after impact, and is probably taken into the plant through stomata and other openings. Only extremely small amounts of Pb can penetrate the cuticle, even after extended exposure (Arvik and Zimdahl, 1974). The deposition of Pb on leaves is dependent upon the characteristics of the leaf surface. Plants with a large leaf area, such as lettuce or spinach, or vegetables with an extensively dissected foliage, such as parsley, may accumulate relatively higher quantities of lead when grown near major roads (Davies and Holmes, 1972). In a study based on the differential accumulation of metals in different plants with relation to Pb content of deposited dust and modified epidermal traits of leaves, Rao and Dubey (1992) listed the species studied in the following order of scavenging potential: Cassia siamea > Zizyphus mauritiana > Calotropis procera > Ipomoea fistula > Mangifera indica.
SO2 is known to be rapidly absorbed by leaves and over a wide range its flux is nearly linear with concentration and duration of the exposure. Absorbed SO2 is rapidly hydrated and forms phytotoxic sulphite and bisulphite (Thomas et al., 1950); possible outcomes of SO2-derived sulphite include: (i) an 'expulsion route', based on a photoreductive detoxification to H2S, which is emitted into the atmo- sphere, and (ii) a 'storage route', based on oxidation to sulphate (Alscher, 1984). According to this second pathway, sulphate content in SO2-exposed plants tend to rise, especially in the cell vacuole. Factors which may affect S-levels in plants include translocation, dilution by new growth, losses through leaching and gaseous emission. Tingey and Olszyk (1985) reviewed factors related to intraspecific vari- ability in response to SO2. As far as S-enrichment is concerned, the picture that emerges is quite puzzling and comparison has not been easy.
MONITORING OF AUTO EXHAUST POLLUTION i
/7~'. ...... ~,~ N
15
~-~S, :'~ " - ~
. ~ m ~ e ¸ . o , . . , ,
~ T ~ l J T & l ~ ~ I Q ~
L22Z-'" , , f 7/
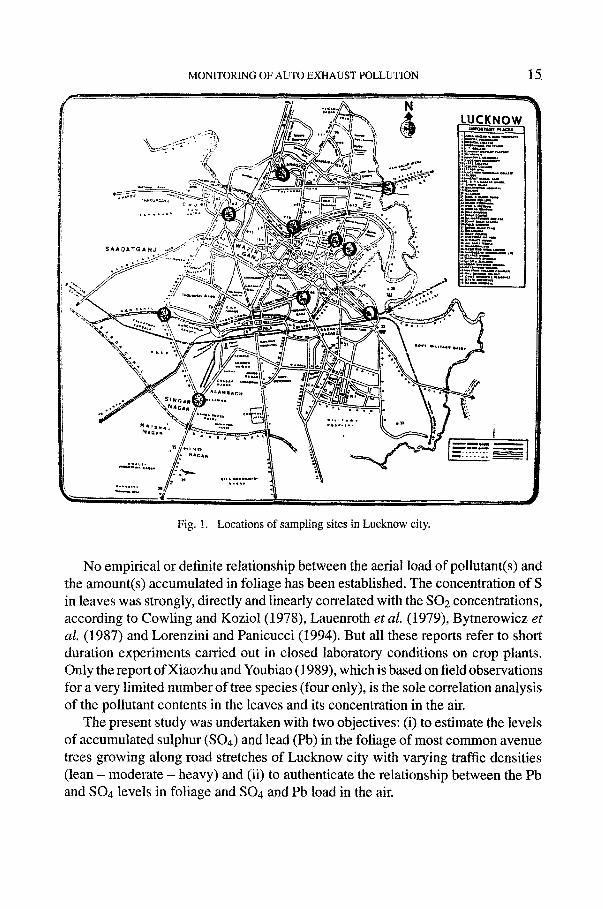
Fig. 1. Locations of sampling sites in Lucknow city.
No empirical or definite relationship between the aerial load of pollutant(s) and the amount(s) accumulated in foliage has been established. The concentration of S in leaves was strongly, directly and linearly correlated with the SO2 concentrations, according to Cowling and Koziol (1978), Lauenroth et al. (1979), Bytnerowicz et
al. (1987) and Lorenzini and Panicucci (1994). But all these reports refer to short duration experiments carried out in closed laboratory conditions on crop plants. Only the report of Xiaozhu and Youbiao (1989), which is based on field observations for a very limited number of tree species (four only), is the sole correlation analysis of the pollutant contents in the leaves and its concentration in the air.
The present study was undertaken with two objectives: (i) to estimate the levels of accumulated sulphur (SO4) and lead (Pb) in the foliage of most common avenue trees growing along road stretches of Lucknow city with varying traffic densities (lean - moderate - heavy) and (ii) to authenticate the relationship between the Pb and SO4 levels in foliage and SO4 and Pb load in the air.
16 N. SINGH ET AL.
TABLE I
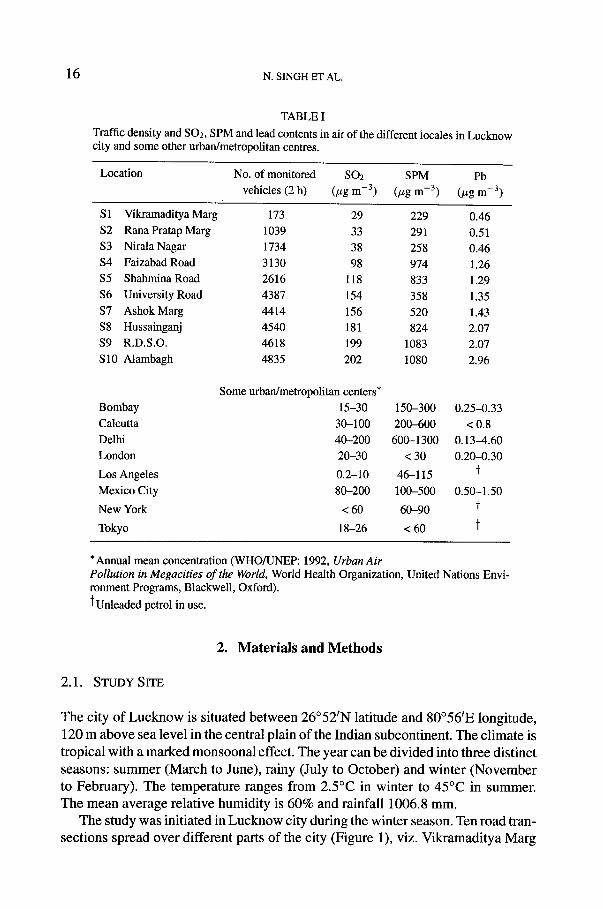
Traffic density and SO2, SPM and lead contents in air of the different locales in Lucknow city and some other urban/metropolitan centres.
Location No. of monitored SO2 SPM Pb vehicles (2 h) (/zg m -3) (/zg m -3) (/zg m -3)
S 1 Vikramaditya Marg 173 29 229 0.46
$2 RanaPratap Marg 1039 33 291 0.51 $3 Nirala Nagar 1734 38 258 0.46
$4 Faizabad Road 3130 98 974 1.26 $5 Shahmina Road 2616 118 833 1.29
$6 University Road 4387 154 358 1.35
$7 Ashok Marg 4414 156 520 1.43 $8 Hussainganj 4540 181 824 2.07 $9 R.D.S.O. 4618 199 1083 2.07 S10 Alambagh 4835 202 1080 2.96
Some urban/metropolitan centers*
Bombay 15-30 150-300 0.25-0.33 Calcutta 30-100 200--600 < 0.8 Delhi 40-200 600-1300 0.13--4.60
London 20-30 < 30 0.20-0.30
Los Angeles 0.2-10 46-115 ~
Mexico City 80-200 100-500 0.50-1.50
New York < 60 60-90 ~"
Tokyo 18-26 < 60 t
* Annual mean concentration (WHO/UNEP: 1992, Urban Air Pollution in Megacities of the World, World Health Organization, United Nations Envi- ronment Programs, Blackwell, Oxford).
t Unleaded petrol in use.
2. Materials and Methods
2.1. STUDY SITE
The city of Lucknow is situated between 26°52~N latitude and 80°56~E longitude, 120 m above sea level in the central plain of the Indian subcontinent. The climate is tropical with a marked monsoonal effect. The year can be divided into three distinct seasons: summer (March to June), rainy (July to October) and winter (November to February). The temperature ranges from 2.5°C in winter to 45°C in summer. The mean average relative humidity is 60% and rainfall 1006.8 mm.
The study was initiated in Lucknow city during the winter season. Ten road tran- sections spread over different parts of the city (Figure 1), viz. Vikramaditya Marg
MONITORING OF AUTO EXHAUST POLLUTION 17
(S1), Rana Pratap Marg ($2), Nirala Nagar ($3), Faizabad Road ($4), Medical College - Shahmina Road ($5), University Road ($6), Ashok Marg ($7), Hussain- ganj ($8), R.D.S.O. ($9) and Kanpur Road, near Alambagh (S10), were selected for this purpose. These road transections were selected to include varying traffic densities, such as lean, less than 1000 h -1 (S1, $2 and $3); moderate, between 1000--2000 h -1 ($4 and $5); and heavy, more than 2000 h -1 ($6, $7, $8, $9 and S 10) (Table I).
2.2. AIR QUALITY MONITORING
Air quality monitoring for sulphur dioxide and suspended particulate matter (SPM) was carried out by employing a Pulsed Fluorescent SO2 Gas Analyser (Model 43 TECO, U.S.A.) and Anderson High Volume Sampler (General Motors, U.S.A.), respectively. Glass fibre papers capable of accumulating SPM were used to estimate the amount of Pb in the air. Monitoring of air quality and counting of traffic density were carried out between 9.00 a.m. to 11.00 a.m., a period of maximum traffic load.
2.3. PLANT ANALYSIS
For this study, the following plant species, commonly present at all the sites, were selected: Azadirachta indica A. Juss., Bougainvillea sp., Callistemon lanceolatum R.Br., Cassia fistula L., Calotropis procera R.Br., Dalbergia sissoo Roxb., Delonix regia Rafim, Eucalyptus sp., Ficus religiosa L., Holoptelea integrifolia Planch., Lantana camara L., Polyalthia longifolia Bent. and Hook., Pongamia glabra Vent., Tabernaemontana coronaria Will& and Thevetia nerifolia Juss. Samples of fully mature and healthy leaves of these plants were collected from all the mentioned sites. Leaves were dried for constant weight, prior to chemical analysis.
2.4. Pb IN AIR
The glass fibre filter paper was cut into small pieces and digested for 30 min in 100 ml HCI over low heat. The solution was removed and the solids were extracted three times for 15 min each with water. The extracts were pooled and evaporated to near dryness, re-dissolved in deionized water and filtered. Volume was made up to 50 ml. A blank filter paper was also run along with the sample to correct for the material extracted from the filter papers. Pb content in the diluted digest was estimated using an air/acetylene flame in a Perkin Elmer 2380 Atomic Absorption Spectrophotometer (AAS) at 283.3 nm using background correction (Beyer, 1969):
Pb (#g m -3) = #g m1-1 in sample solution volume of filtered air in cubic meters
18 N. SINGH ET AL.
TABLE II
Pb content in air and leaves.
Sites
S1 $2 $3 $4 $5 $6 $7 $8 $9 S10
Pb (/~g m -3) in air
Mean
Range
Plant species
0.46 0 . 5 1 0.46 1.26 1.29 1.35 1.43 2.07 2.07 2.96
0.40- 0.45- 0.41- 1.14- 1.22- 1.34- 1.37- 1.42- 1.64- 1.90-
0.54 0.57 0.59 1.37 1.44 1 . 6 0 1 . 7 2 2.14 2.18 3.02
Pb (#g g-1 dry wt.) in leaves
A. indica 20.0 20.4 21.2 31.0 3 2 . 1 3 0 . 5 37.7 31.6 38.5 48.2
Bougainvillea 15.1 15.4 1 6 . 7 32.6 33.9 42.3 43.9 44.0 46.2 48.0
C. lanceolatum 9.9 9.0 9.6 1 0 . 4 10.8 9.9 12.6 1 3 . 4 1 8 . 5 20.0
C.fistula 20.4 1 9 . 4 1 6 . 2 25.5 27.3 30.3 29.8 28.8 36.3 45.4
C. procera 24.0 22.2 2 5 . 1 46.4 44.2 50.2 56.2 51.6 52.4 62.5
D. sissoo 10.2 9.6 9.0 1 6 . 4 17.8 18.0 20.7 26.2 28.4 30.4
D. regia 5.7 4.6 3.9 3.5 3.0 6.6 5.2 5.7 5.7 6.4
Eucalyptus 20.4 19.6 19.5 30.5 34.6 42.4 41.3 40.6 42.4 40.3
E religiosa 22.4 21.0 20.8 3 5 . 3 35.2 42.6 41.6 47.3 42.4 44.5
H. integrifolia 20.6 20.7 23.2 46.5 46.4 44.3 44.1 46.5 48.3 50.0
L. camara 21.4 21.6 22.3 39.6 35.2 47.9 48.3 49.6 50.9 52.3
P. longifolia 21.0 21.4 21.0 40.6 43.2 38.5 41.5 50.4 44.7 46.8
P. glabra 20.9 2 1 . 1 22.3 42.4 43.6 46.4 47.3 47.6 48.9 51.0
T. coronaria 14.3 20.2 1 9 . 4 32.4 33.6 40.4 39.5 43.3 41.9 42.3
T. nerifolia 9.8 9.4 6.5 10.5 1 1 . 4 20.6 19.5 21.0 22.0 22.6
2.5. Pb IN LEAVES
Dry leaves (0.5 g) were digested with mixed acids (conc. HNO3 • conc. H2SO4 " 60% HC104 = 3 : 0.5 • 1) on an aluminium digestion block. Pb content in the diluted digest was estimated as above by AAS.
2.6. SULPHATE IN LEAVES
Sulphate in dry leaves samples was estimated using the turbidity method given by Patterson (1958).
Five replicates of each sample were taken to estimate the average value.
MONITORING OF AUTO EXHAUST POLLUTION 19
TABLEIII
SO2inairandsulphateinleaves.
Sites $1 $2 $3 $4 $5 $6 $7 $8 $9 S10
SO2 (#g m -1) in air Mean 29 32 38 98 118 154 156 181 199 202 Range 26- 30- 36- 80- 107- 144-- 140- 156- 172- 174-
44 48 47 121 130 158 160 197 212 232
Plant species Sulphate (mg g-1 dry wt.) in leaves
A. indica 8.0 9.0 7.5 1t.9 12.3 1 0 . 6 1 3 . 0 1 4 . 6 1 6 . 0 16.5 Bougainvillea 7.8 8.1 7.0 36.0 3 0 . 0 28.9 27.0 46.9 42.0 45.0 C. lanceolatum 24.0 20.0 18.0 48.0 40.0 36.0 45.0 65.0 53.0 55.0 C. fistula 10.2 11.9 10.4 12.0 13.8 1 2 . 0 1 2 . 2 18 .0 20.0 19.8 C. procera 38.0 38.9 35 .6 98.0 100.5 116.0 153.0 196.0 201.0 210.0 D. sissoo 15.6 16.8 17.1 2 8 . 1 27.9 28.0 28.9 38 .3 40.0 42.0 D. regia 10.9 10.0 9.1 9.1 10.1 12.1 11.0 1 5 . 6 1 6 . 0 16.5 Eucalyptus 18.9 18.9 17.6 22.1 23.1 21.0 23.0 27.9 28.0 30.0 E religiosa 4.6 4.8 5.6 4.0 6.8 6.1 7.8 12.0 12.0 15.0 H. integrifolia 15.0 14.9 14.0 17 .0 16.6 20.9 18 .0 3 0 . 3 32.0 32.0 L. camara 38.0 30.0 29.0 48.0 42.2 35.0 36.0 70.0 75.0 80.0 P. longifolia 8.9 10.0 7.8 9.6 10.8 9.3 8.6 10.9 9.3 10.4 P. glabra 65.9 78.1 59.0 107.3 93.6 85.4 8 6 . 9 8 5 . 0 90.0 103.0 T. coronaria 86.4 69.6 78 .7 98.4 8 7 . 6 96.9 105.6 102.0 100.0 110.9 T. nerifolia 25.1 27.1 26.4 45.9 68.4 8 9 . 9 76.6 90.0 84.0 90.0
3. Results and Discussion
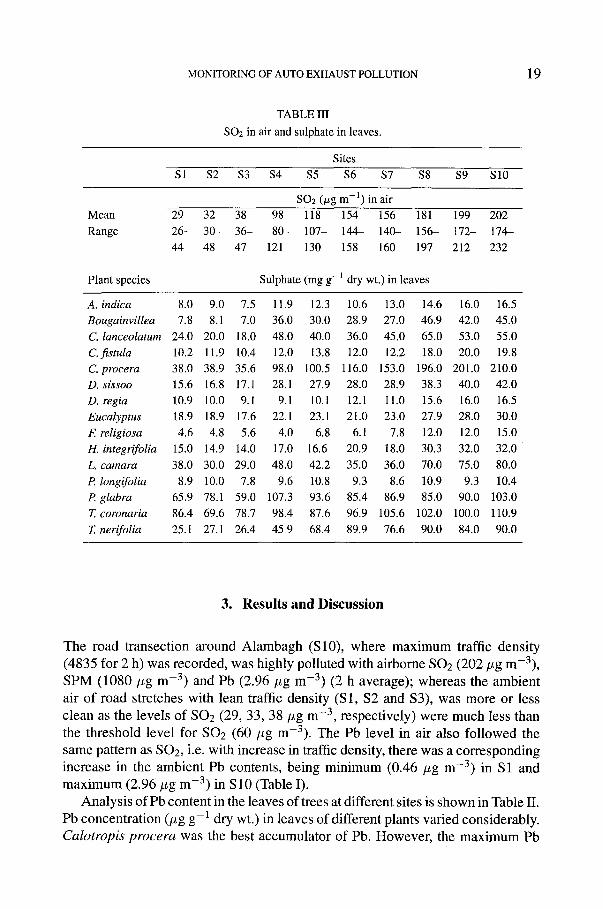
The road transection around Alambagh (S10), where m a x i m u m traffic density (4835 for 2 h) was recorded, was highly polluted with airborne SO2 (202 #g m-3) , SPM (1080 #g m -3) and Pb (2.96 #g m -3) (2 h average); whereas the ambient
air o f road stretches with lean traffic density (S1, $2 and $3), was more or less clean as the levels o f SO2 (29, 33, 38 #g m -3, respectively) were much less than the threshold level for SO2 (60 #g m-3) . The Pb level in air also fol lowed the same pattern as SO2, i.e. with increase in traffic density, there was a corresponding increase in the ambient Pb contents, being min imum (0.46 # g m -3) in $1 and m a x i m u m (2.96 #g m -3) in S10 (Table I).
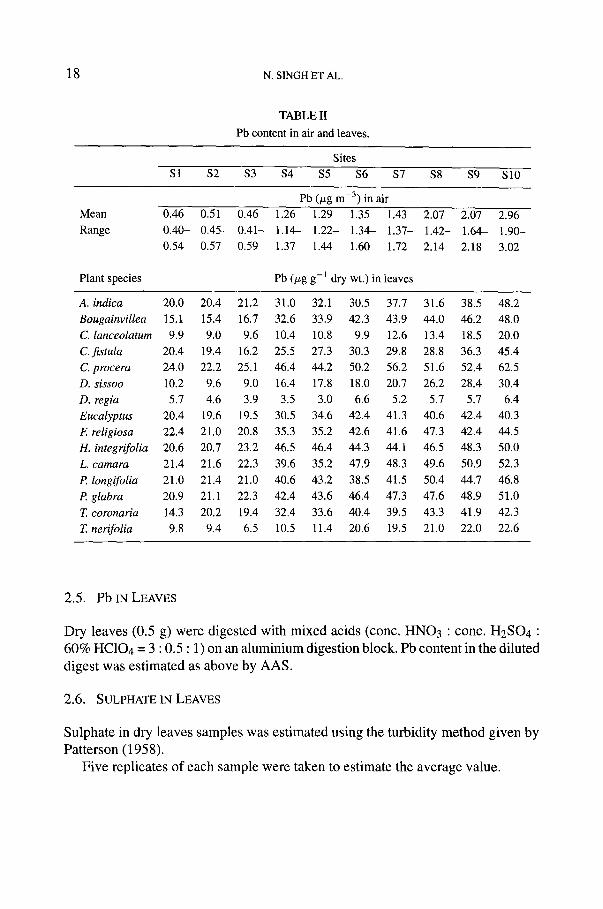
Analysis o f Pb content in the leaves of trees at different sites is shown in Table II. Pb concentrat ion (#g g-1 dry wt.) in leaves of different plants varied considerably. Calo t rop i s p r o c e r a was the best accumulator of Pb. However , the m a x i m u m Pb
2 0 N. SINGH ET AL.
TABLE IV
Correlation analysis (Pb in leaves x Pb in air).
Tree species Regression equation Correlation
]2 = Y + b ( X - ) ( ) coefficient
A. indica ]2 = 1.38 + 0 .08(X - 31.0) 0.9344*
Bougainvillea sp. Y = 1.38 + 0 .05(X - 32.8) 0.8929*
C. lanceolatum ]2 = 1.38 + 0 .18(X - 12.4) 0.8932*
C. fistula ]2 = 1.38 -I- 0 .09(X - 27.9) 0.9524*
C. procera ]2 = 1.38 + 0 .05(X - 43.4) 0.9007*
D. sissoo Y = 1.38 + 0 .10(X - 18.7) 0.9749*
D. regia ]2 = 1.38 + , 0 . 3 1 ( X - 5.0) 0.4688 NS
Eucalyptus sp. )~ = 1.38 q: 0 .07(X - 33.2) 0.8174t
E religiosa Y = 1 . 3 8 + 0 .07(X - 35.3) 0.8712"
H. integrifolia Y = 1.38 + 0 .06(X - 39.0) 0.5651 NS
L camara Y = 1.38 + 0 .06(X - 38.9) 0.8872*
P. longifolia ~" ---- 1.38 + 0 .06(X - 36.9) 0.8700*
P. glabra ~" = 1.38 + 0 .06(X - 39.1) 0.8642*
T. coronaria Y = 1.38 + 0 .06(X - 32.7) 0.8671"
T. nerifolia ~" = 1.38 + 0 .11(X - 15.3) 0.8556 t
*Reliability = 0.001 remarkable, tReliabil i ty = 0.05 remarkable. NS, not significant.
was invariably found in the foliage of plants growing along the road with maximum traffic density (S10). The minimum amounts of Pb were collected in plants of S1 with minimum traffic load.
Sulphate content was also highest in Calotropis procera leaves at site $10 (Table III). The sulphate concentration varied in different plants.
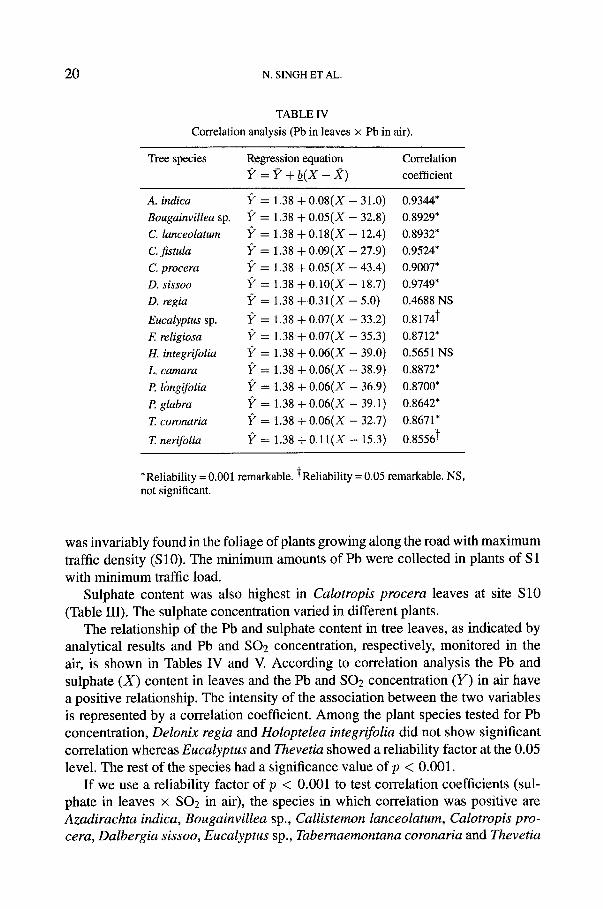
The relationship of the Pb and sulphate content in tree leaves, as indicated by analytical results and Pb and SO2 concentration, respectively, monitored in the air, is shown in Tables IV and V. According to correlation analysis the Pb and sulphate (X) content in leaves and the Pb and SO2 concentration (Y) in air have a positive relationship. The intensity of the association between the two variables is represented by a correlation coefficient. Among the plant species tested for Pb concentration, Delonix regia and Holoptelea integrifolia did not show significant correlation whereas Eucalyptus and Thevetia showed a reliability factor at the 0.05 level. The rest of the species had a significance value o fp < 0.001.
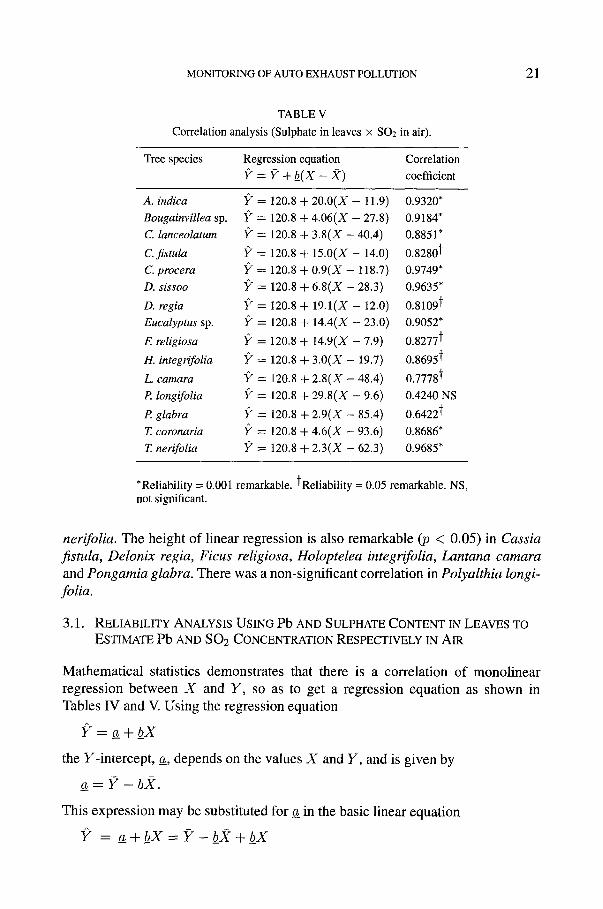
If we use a reliability factor of p < 0.001 to test correlation coefficients (sul- phate in leaves x SO2 in air), the species in which correlation was positive are Azadirachta indica, Bougainvillea sp., Callisternon lanceolatum, Calotropis pro- cera, Dalbergia sissoo, Eucalyptus sp., Tabernaemontana coronaria and Thevetia
MONITORING OF AUTO EXHAUST POLLUTION 21
TABLE V
Correlation analysis (Sulphate in leaves × SO2 in air).
Tree species Regression equation Correlation = Y ÷ _b(X - )() coefficient
A. indica 1~ = 120.8 + 20.0(X - 11.9) 0.9320* Bougainvillea sp. Y = 120.8 + 4.06(X - 27.8) 0.9184" C. lanceolatum Y = 120.8 + 3.8(X - 40.4) 0.885l*
C.fistula Y ---- 120.8 + 15.0(X - 14.0) 0.8280 t C. procera ~ = 120.8 + 0.9(X - 118.7) 0.9749* D. sissoo Y = 120.8 + 6.8(X - 28.3) 0.9635*
D. regia Y = 120.8 + 19.1(X - 12.0) 0.8109 t Eucalyptus sp. 13" = 120.8 + 14.4(X - 23.0) 0.9052*
E religiosa Y = 120.8 + 14.9(X - 7.9) 0.8277 t
H. integrifolia l;" = 120.8 ÷ 3.0(X - 19.7) 0.8695 t
L. camara Y = 120.8 + 2.8(X - 48.4) 0.7778 "~ P. longifolia Y = 120.8 ÷ 29.8(X - 9.6) 0.4240 NS
P. glabra Y = 120.8 ÷ 2.9(X - 85.4) 0.6422 t T. coronaria ~" = 120.8 + 4.6(X - 93.6) 0.8686* T. nerifolia Y = 120,8 + 2.3(X - 62.3) 0.9685*
*Reliability = 0.001 remarkable, tReliability = 0.05 remarkable. NS, not significant.
nerifolia. The height o f l inear regress ion is also remarkable (p < 0.05) in Cassia fistula, Delonix regia, Ficus religiosa, Holoptelea integrifolia, Lantana camara and Pongamia glabra. There was a non-s igni f icant correlat ion in Polyalthia longi-
folia.
3.1. RELIABILITY ANALYSIS USING Pb AND SULPHATE CONTENT IN LEAVES TO ESTIMATE Pb AND SO2 CONCENTRATION RESPECTIVELY IN AIR
Mathema t i ca l statistics demons t ra tes that there is a correlat ion o f m o n o l i n e a r
regress ion be tween X and Y, so as to get a regress ion equat ion as shown in
Tables IV and V. Us ing the regress ion equat ion
?
the Y- in tercept , a_, depends on the values X and Y, and is g iven by
_a= -bX.
This express ion m a y be substi tuted for _a in the basic l inear equat ion
= _a + _ b x = -_b2
22 N. SINGH ET AL.
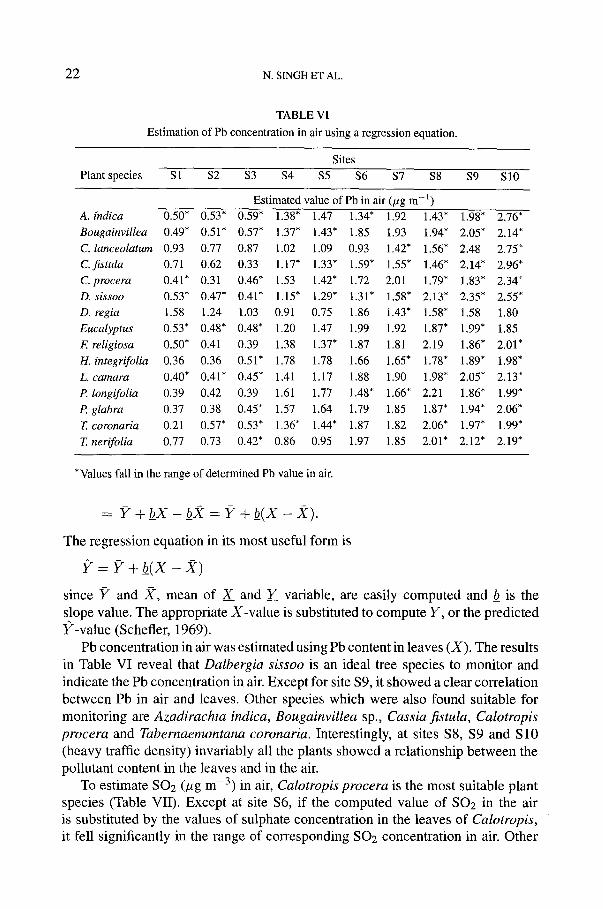
TABLE VI Estimation of Pb concentration in air using a regression equation.
Sites Plant species $1 $2 $3 $4 $5 $6 $7 $8 $9 $10
Estimated value of Pb in air (#gm -1) A. indica 0.50* 0.53* 0.59* 1.38" 1.47 1.34" 1 .92 1.43" 1.98" 2.76* Bougainvillea 0.49* 0.51" 0.57* 1.37" 1.43" 1.85 1 .93 1.94" 2.05* 2.14" C. lanceolatum 0.93 0 .77 0.87 1 .02 1 .09 0 . 9 3 1.42" 1.56" 2 .48 2.75* C. fistula 0.71 0.62 0 .33 1.17" 1.33" 1.59" 1.55" 1.46" 2.14" 2°96* C. procera 0.41" 0.31 0.46* 1.53 1.42" 1.72 2 .01 1.79" 1.83" 2.34* D. sissoo 0.53* 0.47* 0.41" 1.15" 1.29" 1.31" 1.58" 2.13" 2.35* 2.55* D. regia 1.58 1 .24 1 .03 0 .91 0.75 1.86 1.43" 1.58" 1.58 1.80 Eucalyptus 0.53* 0.48* 0.48* 1.20 1.47 1.99 1 .92 1.87" 1,99" 1.85 E religiosa 0.50* 0.41 0.39 1.38 1.37" 1.87 1.81 2 . 1 9 1.86" 2.01" H. integrifolia 0.36 0.36 0.51" 1.78 1.78 1.66 1.65" 1.78" 1.89" 1.98" L. camara 0.40* 0.41" 0.45* 1.41 1.17 1 .88 1 .90 1.98" 2.05* 2.13" P. longifolia 0.39 0.42 0.39 1.61 1.77 1.48" 1.66" 2.21 1.86" 1.99" P. glabra 0.37 0 .38 0.45* 1.57 1 .64 1,79 1.85 1.87" 1.94" 2.06* T. coronaria 0.21 0.57* 0.53* 1.36" 1.44" 1.87 1 .82 2.06* 1.97" 1.99" T. nerifolia 0.77 0 .73 0.42* 0.86 0 . 9 5 1.97 1.85 2.01" 2.12" 2.19"
* Values fall in the range of determined Pb value in air.
= '+hX-bYC=P+h(X-2).
The regression equation in its most useful form is
= + b ( X - 2 )
since Y and ){, mean of X and Y_Y_ variable, are easily computed and _b is the slope value. The appropriate X-value is substituted to compute Y, or the predicted Y-value (Schefler, 1969).
Pb concentration in air was estimated using Pb content in leaves (X). The results in Table VI reveal that Dalbergia sissoo is an ideal tree species to monitor and indicate the Pb concentration in air. Except for site $9, it showed a clear correlation between Pb in air and leaves. Other species which were also found suitable for monitoring are Azadirachta indica, Bougainvillea sp., Cassia fistula, Calotropis procera and Tabernaemontana coronaria. Interestingly, at sites $8, $9 and S10 (heavy traffic density) invariably all the plants showed a relationship between the pollutant content in the leaves and in the air.
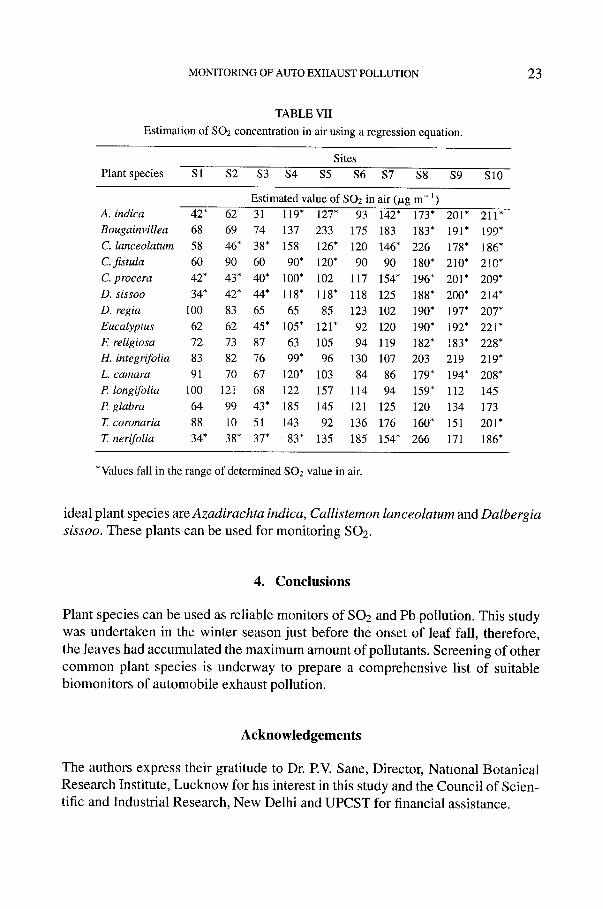
To estimate SO2 (#g m -3) in air, Calotropis procera is the most suitable plant species (Table VII). Except at site $6, if the computed value of SO2 in the air is substituted by the values of sulphate concentration in the leaves of Calotropis, it fell significantly in the range of corresponding SO2 concentration in air. Other
MONITORING OF AUTO EXHAUST POLLUTION 23
TABLE VII
Estimation of SO2 concentration in air using a regression equation.
Sites Plant species S1 $2 $3 $4 $5 $6 $7 $8 $9 $10
Estimated value of SOz in air (#g m -~) A. indica 42* 62 31 119" 127" 93 142" 173" 201" 211" Bougainvillea 68 69 74 137 233 175 183 183" 191" 199" C. lanceolatum 58 46* 38* 158 126" 120 146" 226 178" 186" C.fistula 60 90 60 90* 120" 90 90 180" 210" 210" C. procera 42* 43* 40* 100" 102 117 154" 196" 201" 209* D. sissoo 34* 42* 44* 118" 118" 118 125 188" 200* 214" D. regia 100 83 65 65 85 123 102 190" 197" 207* Eucalyptus 62 62 45* 105" 121" 92 120 190" 192" 221" E religiosa 72 73 87 63 105 94 119 182" 183" 228* H. integrifoIia 83 82 76 99* 96 130 107 203 219 219" L. camara 91 70 67 120" 103 84 86 179" 194" 208* P. longifolia 100 121 68 122 157 114 94 159" 112 145 P. glabra 64 99 43* 185 145 121 125 120 134 173 T. coronaria 88 10 51 143 92 136 176 160" 151 201" T. nerifolia 34* 38* 37* 83* 135 185 154" 266 171 186"
*Values fall in the range of determined SO2 value in air.
ideal plant species are Azad i rach ta indica, Cal l is temon lanceola tum and Dalberg ia
sissoo. These plants can be used for monitoring SO2.
4. Conclusions
Plant species can be used as reliable monitors of SO 2 and Pb pollution. This study
was undertaken in the winter season just before the onset of leaf fall, therefore,
the leaves had accumulated the maximum amount of pollutants. Screening of other
common plant species is underway to prepare a comprehensive list of suitable biomonitors of automobile exhaust pollution.
Acknowledgements
The authors express their gratitude to Dr. RV. Sane, Director, National Botanical
Research Institute, Lucknow for his interest in this study and the Council of Scien-
tific and Industrial Research, New Delhi and UPCST for financial assistance.
24 N. SINGH ET AL.
References
Alscher, R.: 1984, 'Effects of SO2 on light-modulated enzyme reactions', in: Koziol, M.J. and Whatley, F.R. (Eds.), Gaseous Air Pollutants and Plant Metabolism, Butterworth, London, pp. 181-200.
Arvik, W.H. and Zimdahl, R.L.: 1974, 'Effects of lead chloride on chloroplast reactions', Environ. Lett. 6, 175-191.
Beyer, M.: 1969, Atomic Absorption Newsletter 8, 23. Brown, D.H. and Beckett, R.P.: 1984, 'Uptake and effect of cations on lichen metabolism', Lichenol-
ogist 16, 173-188. Burton, K.W., Morgan, E. and Roig, A.: 1986, 'Interactive effects of cadmium, copper and nickel on
the growth of Sitka spruce and studies of metal uptake from nutrient solution', New Phytol. 103, 549-557.
Burton, M.A.S.: 1986, Biological Monitoring of Environmental Contaminants (Plants), Monitoring and Assessment Research Centre, King's College London, University of London, 247 pp.
Bytnerowicz, A., Olszyk, D.M., Kats, G., Dawson, P.J., Wolf, J., and Thompson, C.R.: 1987, 'Effects of SO2 on physiology, elemental content and injury development of winter wheat', Agric. Ecosys. Environ. 20, 37-47.
Cowling, D.W. and Koziol, M.J.: 1987, 'Growth of ryegrass (Lolium perenne L.) exposed to SO2', J. Exp. Bot. 29, 1029-1036.
Davies, B.E. and Holmes, P.L.: 1972, 'Lead contamination of roadside soil and grass in Birmingham, England, in relation to naturally occurring levels', J. Agric. Soc. Camb. 79, 479-484.
Fargagov~i, A.: 1994, 'Effect of Pb, Cd, Hg, As and Cr on germination and root growth of Sinapis alba seeds', Bull Environ. Contam. Toxicol. 52, 452-456.
Ghosh, B.: 1994, 'Lack of departmental co-ordination hindering free flow of traffic', Pioneer (Luc- know) 14 May, 1 and 5.
Grodzinska, K.: 1982, 'Monitoring of air pollutants by mosses and tree bark', in: Steubing, L. and Jager, H.-J. (Eds.), Monitoring of Air Pollutants by Plants, Dr. W. Junk Publishers, The Hague, pp. 33-42.
Kingston, L., Lehame, S., and McPhee, E.: 1988, 'A survey of vehicular lead deposition in a woodland ecosystem', Water, Air, and Soil PoIlut. 38, 239-250.
Lauenroth, W.K., Bicak, C.J., and Dodd, J.L.: 1979, 'Sulphur accumulation in Western wheat grass exposed to three controlled SO2 concentrations', Plant and Soil 53, 131-136.
Lorenzini, G. and Panicucci, A.: 1994, 'Is sulphur accumulation in sulphur dioxide exposed plants related to biomass reduction?', Bull Environ. Contain. Toxicol. 52, 802-809.
Martin, M.H. and Coughtrey, P.J.: 1982, Biological Monitoring of Heavy Metal Pollution, Land and Air, Applied Science Publishers, London, 460 pp.
Patterson Jr., G.D.: 1958, 'Sulphur', in: Boltz, D.E (Ed.), Colorimetric Determination of Nonmetals, Interscience, New York, pp. 261-308.
Peterson, P.J." 1978, 'Lead and vegetation', in: Nriagu, J.O. (Ed.), The Biogeochemistry of Lead in the Environment, Elsevier/North-Holland Biomed. Press, Amsterdam, pp. 355-383.
Posthumus, A.C.: 1982, 'Biological indicators of air pollution', in Unsworth, M.H. and Ormrod, D.P. (Eds.), Effects of Gaseous Air Pollution in Agriculture and Horticulture, Butterworth Scientific, London, pp. 27-42.
Puckett, K.J. and Burton, M.A.S.: 1981, 'The effect of trace elements on lower plants', in: Lepp, N.W. (Ed.), Effect of Heavy Metal Pollution on Plants, Vol. 2, Metals in the Environment, Applied Science Publishers, London, pp. 213-238.
Rao, M.V. and Dubey, P.S.: 1992, 'Occurrence of heavy metals in air and their accumulation by tropical plants growing around an industrial area', The Science of the Total Environment 126, 1-16.
Schefler, W.C.: 1969, Statistics for the Biological Sciences, Addison-Wesley Publishing Company, California.
Schuck, E.A. and Locke, J.K.: 1970, 'Relationships of automotive lead particulates to certain con- sumer crops', Environ. Sci. Technol. 4, 324-330.
MONITORING OF AUTO EXHAUST POLLUTION 25
Singh, N.: 1988, 'Lead pollution and plants', in: Rao, D.N., Ahmad, K.J., Yunus, M., and Singh, S.N. (Eds.), Perspectives in Environmental Botany, Vol. 2, Today and Tomorrow's Printers and Publishers, New Delhi (India), pp. 163-184.
Singh, N., Farooqui, A., Pandey, V., Misra, J., Kulshreshtha, K., Srivastava, K., Singh, S.N., Yunus, M., and Ahmad, K.J,: 1993, 'Heavy metal pollutants and plants', Applied Bot. Abs. 13, 41-56.
Smith, W.H.: 1976i 'Lead contamination of the roadside ecosystem', J. Air Pollut. Control Assoc. 26, 753-766.
Smith, W.H.: 1981, Air Pollution and Forests, Springer-Verlag, New York. Smith, W.H.: 1984, 'Pollutant uptake by plants', in: Treshow, M. (Ed.), Air Pollution and Plant Life,
John Wiley, New York. Thomas, M.D., Hendricks, R.H., and Hill, G.R.: 1950, 'Sulphur metabolism of plants ~, Ind. Eng.
Chem. 42, 2231-2235. Tingey, D.T. and Olszyk, D.M.: 1985, 'Intraspecific variability in metabolic responses to SO2'~
in: Winner, W.E., Mooney, H.A., and Goldstein, R.A. (Eds.), Sulphur Dioxide and Vegetation, Stanford University Press, Stanford, CA, pp. 178-205.
Xiaozhu, L. and Youbiao, Z.: 1989, 'Relationship of sulphur content in tree leaves to SO2 concentra- tion in air', Bull Environ. Contain. Toxicol. 42, 878-883.
Zimdahl, R.L.: 1976, 'Entry and movement in vegetation of lead derived from air and soil sources', J. Air Pollut. Control Assoc. 26, 655-660.
Related Documents