First published 10 February 2020 www.gov.uk/natural-england Natural England Commissioned Report NECR269 Monitoring methods for assessing inshore fish communities

Welcome message from author
This document is posted to help you gain knowledge. Please leave a comment to let me know what you think about it! Share it to your friends and learn new things together.
Transcript
First published 10 February 2020
www.gov.uk/natural-england
Natural England Commissioned Report NECR269
Monitoring methods for assessing
inshore fish communities

Foreword Natural England commission a range of reports from external contractors to provide evidence and advice to assist us in delivering our duties. The views in this report are those of the authors and do not necessarily represent those of Natural England.
Background
As there is limited knowledge of the biodiversity, variability and condition of inshore fish communities around England, there are repercussions for the efficacy of potential management measures, on estimations of Natural Capital values and on their Ecosystem Service value and contribution to societal goods and benefits.
Natural England commissioned a single piece of work with the ultimate aim of producing a detailed and fully costed monitoring plan for the monitoring of inshore fish populations in the SW of England.
This aim has resulted in the production of 3 linked reports;
1. NECR 269 (this report) (Franco, A., Nunn, A., Smyth, K., Hänfling, B. and Mazik, K.(2020a)). A review of methods for the monitoring of inshore fish biodiversity.
2. NECR 270 (Franco, A., Barnard, S. and Smyth, K. (2020b)). An assessment of theviability of fish monitoring techniques for use in a pilot approach in SW England.
3. NECR 271. (Franco, A., Hänfling, B., Young, M. and Elliott, M. (2020c)). Regionalmonitoring plan for inshore fish communities in the Southwest of England.
It is intended that the outputs of these linked report be used to underpin a trial of inshore fish monitoring in English inshore water, with the eventual aims of seeking to integrate inshore fish monitoring into the wider UK marine biodiversity monitoring programme
This report should be cited as: NECR 269. Franco, A., Nunn, A., Smyth, K., Hänfling, B. and Mazik, K. (2020a). A review of methods for the monitoring of inshore fish biodiversity.
This report is published by Natural England under the Open Government Licence - OGLv3.0 for public sector information. You are encouraged to use, and reuse, information subject to certain conditions. For details of the licence visit Copyright. Natural England photographs are only available for non commercial purposes. If any other
information such as maps or data cannot be used commercially this will be made clear within the report.
ISBN 978-1-78354-594-0
© Natural England and other parties 2020
Natural England Project Manager - Mike Young [email protected]
Contractor - Institute of Estuarine & Coastal Studies (IECS). The University of Hull.
Further information This report can be downloaded from the Natural England Access to Evidence Catalogue:http://publications.naturalengland.org.uk/ . For information on Natural England publications contact the
Natural England Enquiry Service on 0300 060 3900 or e-mail [email protected].
Monitoring methods for assessing
inshore fish communities
Report prepared by
A. Franco, A. Nunn, K. Smyth, B. Hänfling, K. Mazik
30 May 2019
IECS Report No. ZBB871/1-F-20192020
Institute of Estuarine & Coastal Studies (IECS)
The University of Hull
Cottingham Road, Hull HU6 7RX UK
Tel: +44 (0)1482 466695 ¦ Fax: +44 (0)1482 466772
E-mail: [email protected]
2
Executive Summary
This report provides a review of the monitoring techniques that can be used to assess inshore
fish communities. This is the first part of a study aimed at developing a regional pilot monitoring
programme for inshore fish communities in the southwest regional sea area (SW) of England.
This study addresses the current knowledge gap existing on the biodiversity, variability and
condition of inshore fish communities around England.
The method review here provides the knowledge basis for the selection of those techniques that
are potentially viable for use in the inshore areas of the SW of England (see Natural England
Commissioned Report: NER270, (Franco et al., 2020b). and for the final design of a holistic,
integrated monitoring pilot programme aimed at characterising the inshore fish communities of
the SW regional sea area (see Natural England Commissioned Report NECR271, (Franco et
al., 2020c).
The review covers methods broadly distinguished into ‘traditional’ sampling (nets and traps),
observation techniques (including visual detection, acoustic detection and others) , and DNA-
based methods. Detailed information is provided for each technique, including information on
the targeted fish (e.g. ecological groups, life stages), operational constraints that may limit the
applicability of the method or its efficiency (e.g. habitat characteristics), logistic requirements or
restrictions, also including licencing aspects. Example of best practice and standardisation of
the approaches are given.
In addition to the commentary in this report, a summary of the key characteristics of each
method and the main data and metrics that can be obtained from them are also provided as an
attached Excel spreadsheet (‘Fish method review table’). Note: this is available on request from
Natural England.
3
Contents
Executive Summary 2
Contents 3
List of Figures 5
List of Plates 6
List of Tables 6
1. Introduction 1
1.1 Monitoring context 1
1.2 Review structure 6
2. ‘Traditional’ sampling (nets and traps) 6
2.1 Trawl nets 7
2.1.1 Beam trawl 8
2.1.2 Otter trawl 11
2.1.3 Pelagic trawl 13
2.1.4 Other trawls 14
2.2 Seine nets 15
2.2.1 Beach seine 15
2.2.2 Other nets 18
2.3 Fixed nets and traps 18
2.3.2 Fixed net/trap (e.g. salmon and eel traps) 21
2.3.3 Stow net 22
2.3.4 Entangling nets (gillnet and trammel net) 24
2.3.5 Drop net and drop traps 27
2.3.6 Popnet and pull-up traps 29
2.3.7 Other fixed nets and traps 30
2.4 Fishing lines 32
2.4.1 Longlines 32
2.4.2 Handline 33
2.5 Plankton samplers 34
2.5.1 Vertical and horizontal plankton nets 34
2.5.2 Bongo net 35
2.5.3 Gulf sampler 36
4
2.6 Power station screens 37
2.7 Hand gathering methods 40
2.7.1 Elver dip net 40
2.7.2 Push net 41
2.7.3 Kick sampling 42
3. Observation techniques 43
3.1 Visual detection 43
3.1.1 Diving 43
3.1.2 Underwater video 46
3.1.2.1 Stationary cameras 47
3.1.2.2 Mobile cameras 49
3.2 Acoustic detection 51
3.2.1 Hydroacoustics 51
3.2.2 Acoustic cameras 53
3.2.3 Acoustic telemetry 56
3.3 Other observation techniques 58
4. DNA-based methods 58
4.1 DNA analysis methods 61
4.1.1 Targeted PCR methods 62
4.1.1.1 Standard PCR (polymerase chain reaction) 62
4.1.1.2 qPCR (quantitative PCR) / RT-PCR (realtime PCR) 63
4.1.1.3 ddPCR (droplet digital PCR) 63
4.1.2 High-throughput sequencing 63
4.1.2.1 DNA metabarcoding 64
4.1.2.2 PCR-free analysis (metagenomics) 65
4.2 Strengths and disadvantages of DNA-based methods 65
4.2.1 Feasibility and costs 65
4.2.2 Does the presence of eDNA equate to the presence of the organism in that
environment? 66
4.2.3 Can eDNA provide quantitative information? 67
4.2.4 DNA techniques for environmental monitoring 68
5. Factors influencing the design of the monitoring programme 71
5.1 Monitoring technique(s) 71
5
5.2 Spatial considerations 74
5.3 Temporal considerations 74
References 76
List of Figures
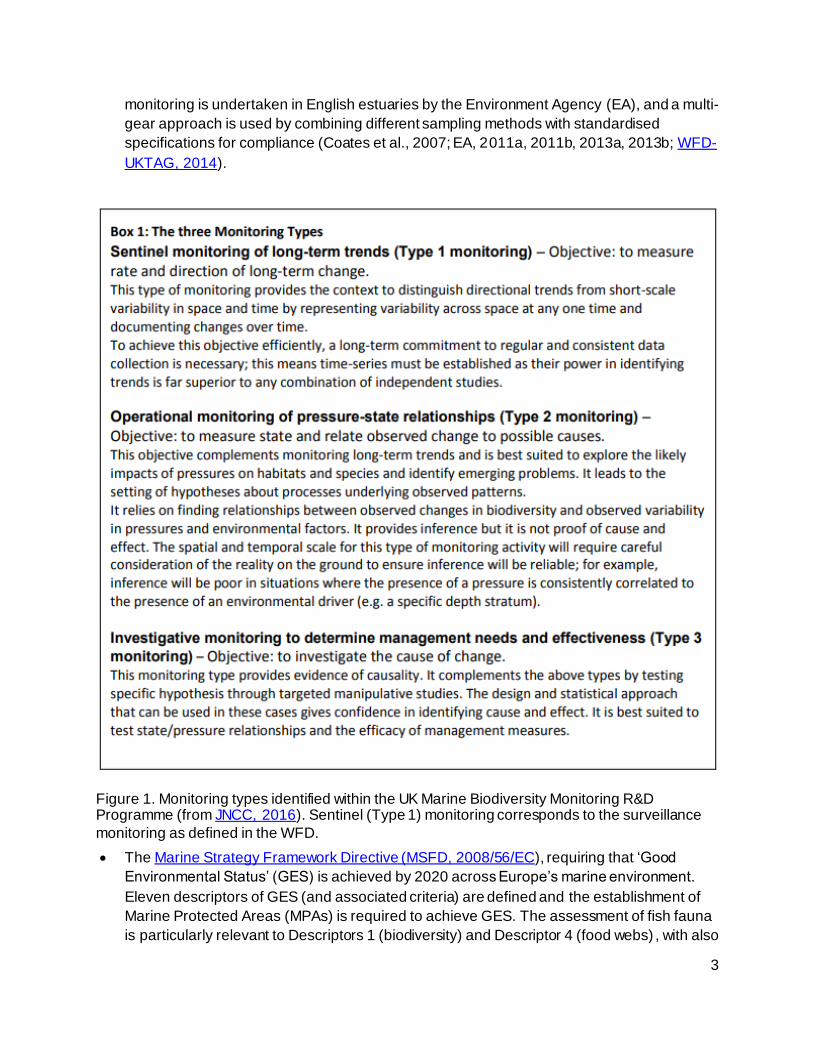
Figure 1. Monitoring types identified within the UK Marine Biodiversity Monitoring R&D
Programme (from JNCC, 2016). Sentinel (Type 1) monitoring corresponds to the surveillance
monitoring as defined in the WFD. ........................................................................................... 3
Figure 2. Beam trawls. Modified from Seafish (2015)................................................................ 8
Figure 3. Otter trawl. Modified from Seafish (2015). ................................................................ 12
Figure 4. Pelagic trawl. Modified from Seafish (2015). ............................................................ 13
Figure 5. Beach seine. Modified from Seafish (2015).............................................................. 16
Figure 6. Fyke net. Modified from Seafish (2015). .................................................................. 19
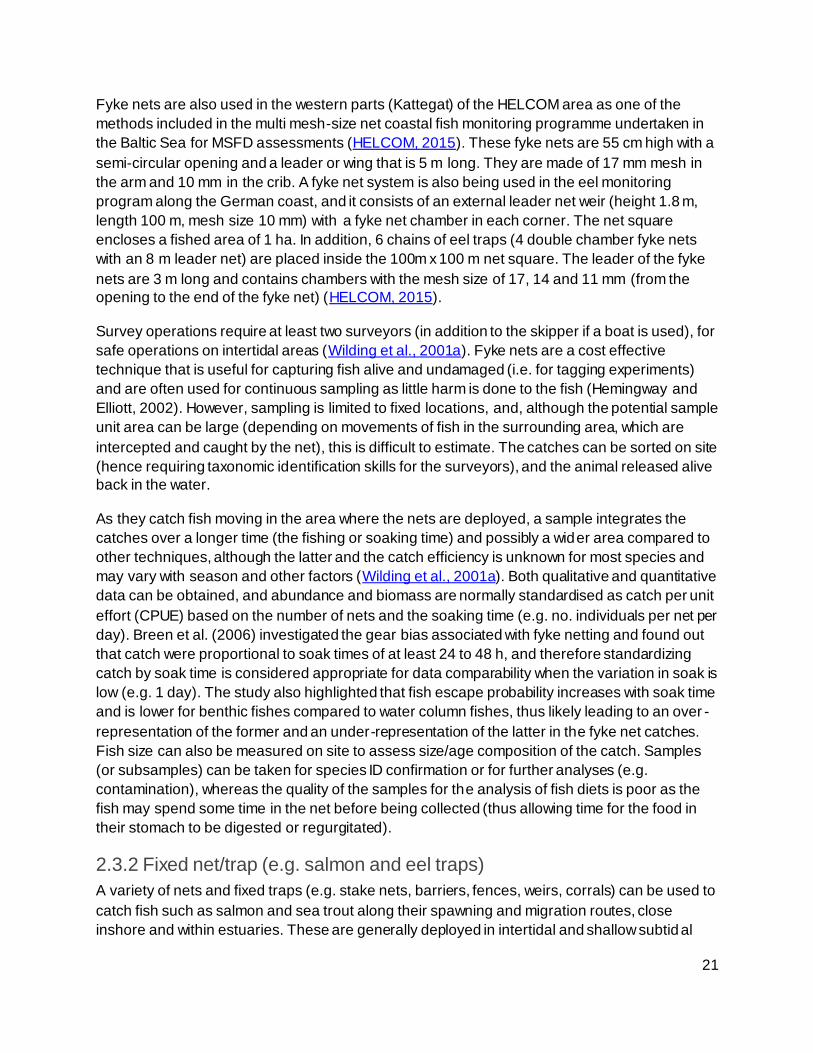
Figure 7. Stake net. Modified from Seafish (2015). ................................................................. 22
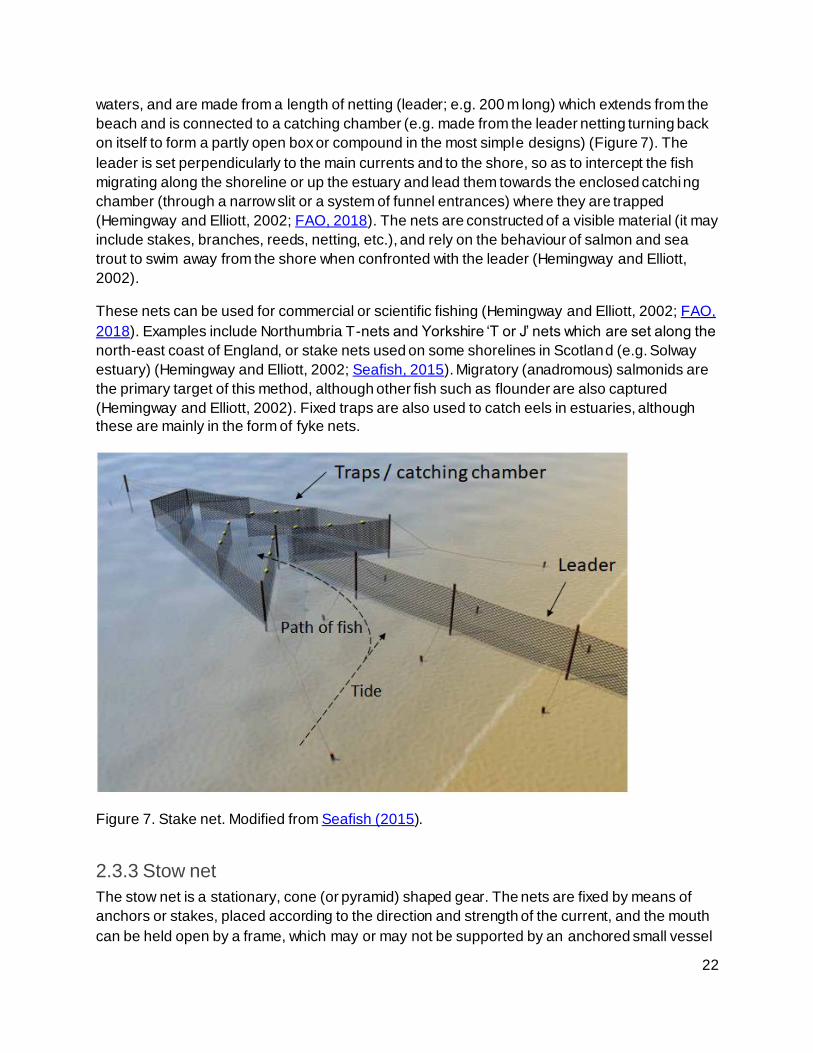
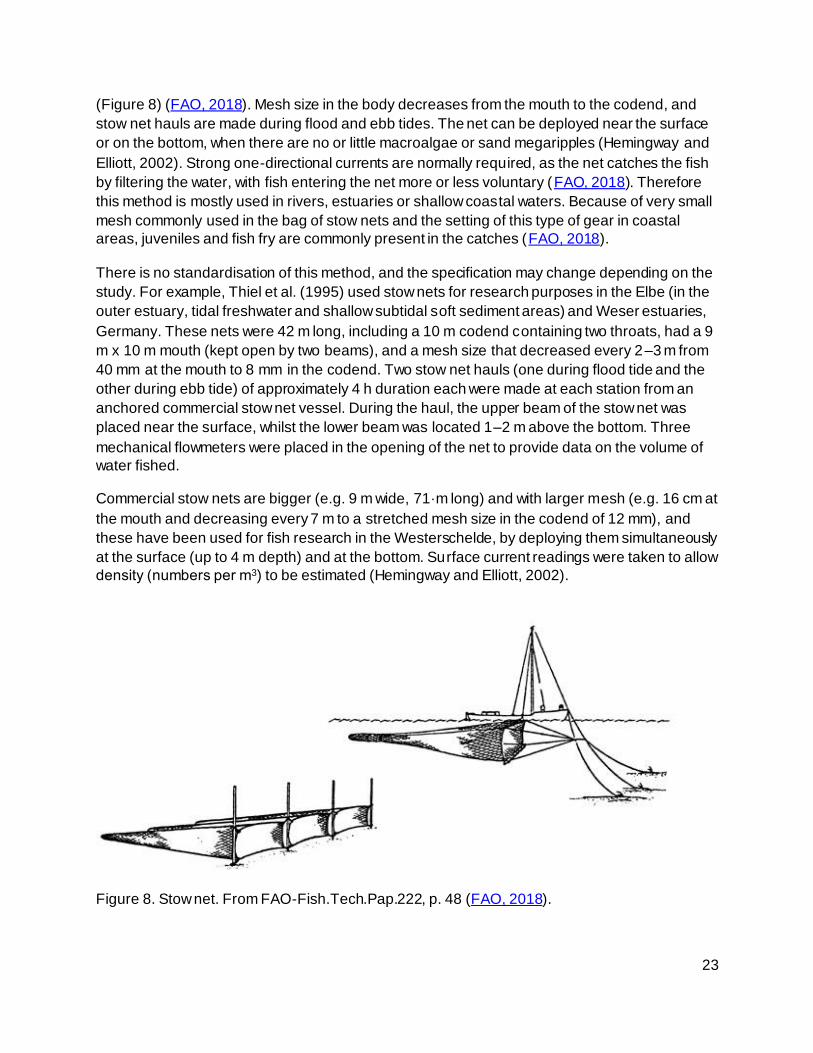
Figure 8. Stow net. From FAO-Fish.Tech.Pap.222, p. 48 (FAO, 2018). ................................... 23
Figure 9. Fleet of gillnets. Modified from Seafish (2015). ........................................................ 25
Figure 10. Drop net (10 m x 10 m x 1.2 m), before and after release. Modified from Aneer et al.
(1992). .................................................................................................................................. 28
Figure 11. Demersal (left) and pelagic (right) lines. Modified from Seafish (2015).................... 32
Figure 12. Schematic of double-oblique tows (modified from http://www.cefas.defra.gov.uk/). . 34
Figure 13. Elver dip nets used in Somerset are 1 m long, 0.8 m wide and 0.45 m deep with a
handle no longer than 4 m (EA, 2017b). ................................................................................. 41
Figure 14. Sampling protocol for PISCO fish surveys in kelp forest. From:
http://www.piscoweb.org/kelp-forest-sampling-protocols ......................................................... 45
Figure 15. Potential sources of eDNA (A) and schematic representation of an eDNA community
(B)......................................................................................................................................... 59
Figure 16. Collection of aquatic eDNA through bottle tipping from the shore (A) and using a
Friedinger sampler at offshore locations (B). DNA capture through vacuum filtration (C) using a
disc filter with a pore size of 0.45 µm (D). ............................................................................... 60
Figure 17. Overview of DNA based approaches to monitoring (from Hänfling et al., 2017)....... 62
Figure 18. Methods for detecting and describing DNA from environmental samples (from
Hänfling et al. 2017). ............................................................................................................. 62
Figure 19. Typical eDNA metabarcoding workflow following DNA capture through filtration or
precipitation........................................................................................................................... 64
6
List of Plates
Plate 1. Seine netting, using a 25 m fry net, in a small artificial lagoon pool in the Humber
estuary (Photo by IECS, 2016)............................................................................................... 17
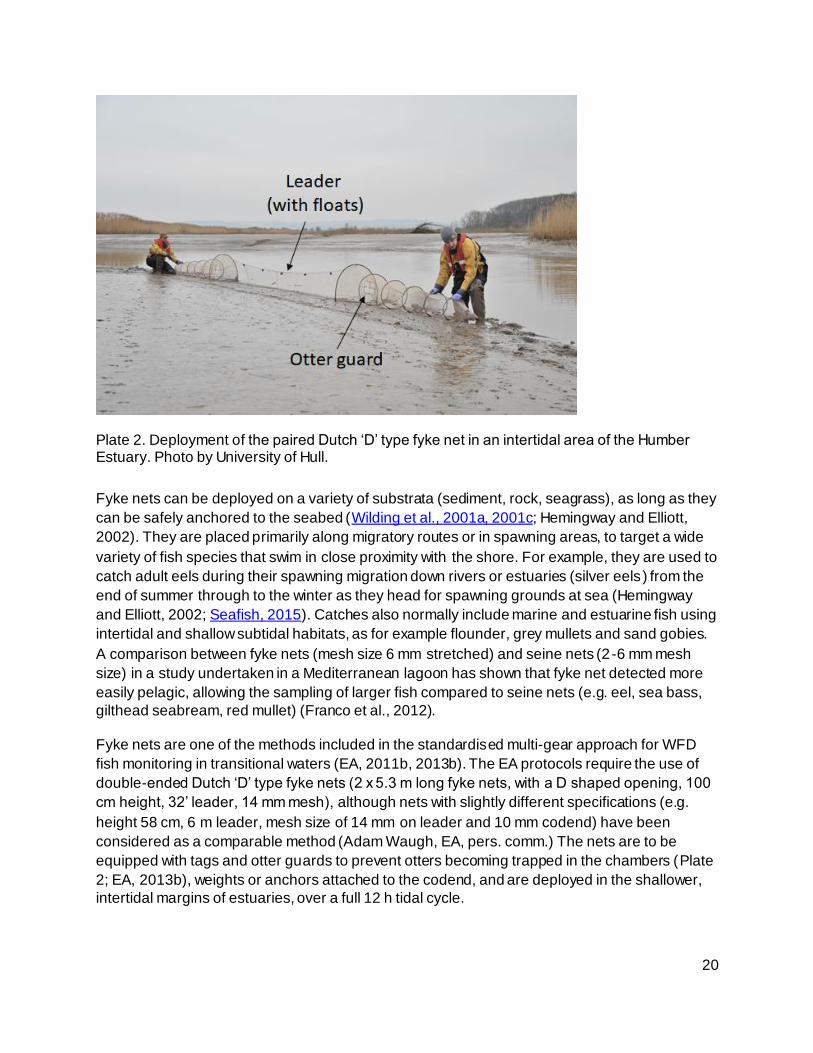
Plate 2. Deployment of the paired Dutch ‘D’ type fyke net in an intertidal area of the Humber
Estuary. Photo by University of Hull. ...................................................................................... 20
List of Tables
Table 1. Metrics computed from the main video techniques. The list of metrics may depend on
the particular implementation of the technique (modified from Mallet and Pelletier, 2014). ....... 46
Table 2. Overview of ROV use in four depth zones. From JNCC (2018; and references therein).
............................................................................................................................................. 50
Table 3. Personnel and material cost-effectiveness, efficiency and impact on fish and migratory
dynamics of the most common acoustic detection methods used to monitor migratory fish
populations in rivers and estuaries. The efficiency of each method is symbolised by gradation
from black (weak efficiency or negative impact) to white (high efficiency or no negative impact)
(redrawn from Martignac et al., 2015)..................................................................................... 55
Table 4. Comparison of the effectiveness, safety, and feasibility of eDNA methods, other non-
invasive methods (such as underwater visual survey line transects), and traditional sampling
methods involving capture of organisms (such as bottom trawls or longlines), based on the
assessment in Pikitch et al. (2018). The colour of the cells reflects current performance
rankings, from least (white), to moderate (light grey), to best (dark grey). Modified from Pikitich
et al. (2018). .......................................................................................................................... 70

1. Introduction
Detailed knowledge of the biodiversity, variability and condition of inshore fish communities
around England is limited. This impacts on the confidence that can be attributed to the efficacy
of potential management measures, on estimations of Natural Capital values and on their
Ecosystem Service and Societal Goods and Benefits values. As a result, Natural England has
commissioned the University of Hull to perform a study that aims at developing a regional pilot
monitoring programme for inshore fish communities in the southwest regional sea area (SW) of
England.
Inshore fish communities are defined here to include fish species that live in estuaries and
marine coastal areas (predominantly within 6 nm of the coast), or that use and depend on these
habitats for part of their life cycle. The latter species include for example fish using estuarine
and shallow coastal waters as nursery grounds or as pathways for spawning migrations
between marine and fresh waters (i.e. marine migrants and diadromous species, respectively;
Franco et al., 2008; Potter et al., 2015).
Pilot studies are used to test specific hypotheses about the design and deployment of sampling
gear towards the development of reliable, robust, and cost-effective monitoring (Andrew and
Mapstone, 1987; Rotherham et al., 2007). Fish assemblages include different taxonomical,
morphological and functional groups, representing different niches and inhabiting different
habitats (e.g. Potter et al., 2015, and references therein). Therefore, the monitoring of fish
communities may require the use of different, though complementary, methods. The screening
and evaluation of the available monitoring techniques is the preliminary step to be undertaken in
this process. The present document reviews the monitoring techniques available to assess
inshore fish communities. The approach used in the review is described in section 1.2.
1.1 Monitoring context
One of the main objectives in marine and coastal management and conservation is to maintain
and where necessary enhance the natural abundance and species composition of the fish
community (HELCOM, 2015). Strategic planning for biodiversity conservation depends largely
on monitoring programmes that provide data on species distributions and trends to assess the
structural and functional characteristics and dynamics of these natural populations, their
response to anthropogenic pressures, or to management measures that are implemented
(Elliott and Hemingway, 2002).
Monitoring programmes on fish populations are often focused on a localised geographic scale,
targeting individual populations, a specific site of interest or a specific area because of a specific
issue. However, conservation planning requires integrative evidence (e.g. multiple species,
communities) at a broader spatial scale (e.g. species range), hence the importance of
establishing monitoring programmes that are coordinated at the regional scale, at least.
2
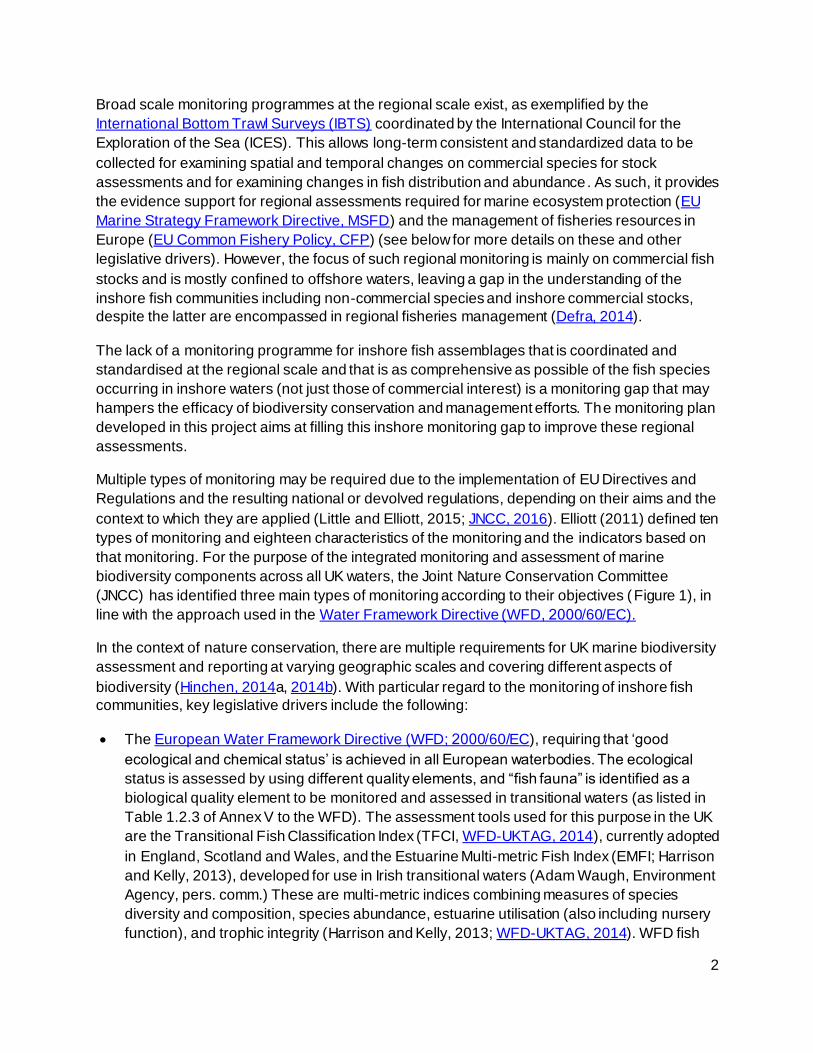
Broad scale monitoring programmes at the regional scale exist, as exemplified by the
International Bottom Trawl Surveys (IBTS) coordinated by the International Council for the
Exploration of the Sea (ICES). This allows long-term consistent and standardized data to be
collected for examining spatial and temporal changes on commercial species for stock
assessments and for examining changes in fish distribution and abundance. As such, it provides
the evidence support for regional assessments required for marine ecosystem protection (EU
Marine Strategy Framework Directive, MSFD) and the management of fisheries resources in
Europe (EU Common Fishery Policy, CFP) (see below for more details on these and other
legislative drivers). However, the focus of such regional monitoring is mainly on commercial fish
stocks and is mostly confined to offshore waters, leaving a gap in the understanding of the
inshore fish communities including non-commercial species and inshore commercial stocks,
despite the latter are encompassed in regional fisheries management (Defra, 2014).
The lack of a monitoring programme for inshore fish assemblages that is coordinated and
standardised at the regional scale and that is as comprehensive as possible of the fish species
occurring in inshore waters (not just those of commercial interest) is a monitoring gap that may
hampers the efficacy of biodiversity conservation and management efforts. The monitoring plan
developed in this project aims at filling this inshore monitoring gap to improve these regional
assessments.
Multiple types of monitoring may be required due to the implementation of EU Directives and
Regulations and the resulting national or devolved regulations, depending on their aims and the
context to which they are applied (Little and Elliott, 2015; JNCC, 2016). Elliott (2011) defined ten
types of monitoring and eighteen characteristics of the monitoring and the indicators based on
that monitoring. For the purpose of the integrated monitoring and assessment of marine
biodiversity components across all UK waters, the Joint Nature Conservation Committee
(JNCC) has identified three main types of monitoring according to their objectives (Figure 1), in
line with the approach used in the Water Framework Directive (WFD, 2000/60/EC).
In the context of nature conservation, there are multiple requirements for UK marine biodiversity
assessment and reporting at varying geographic scales and covering different aspects of
biodiversity (Hinchen, 2014a, 2014b). With particular regard to the monitoring of inshore fish
communities, key legislative drivers include the following:
The European Water Framework Directive (WFD; 2000/60/EC), requiring that ‘good
ecological and chemical status’ is achieved in all European waterbodies. The ecological
status is assessed by using different quality elements, and “fish fauna” is identified as a
biological quality element to be monitored and assessed in transitional waters (as listed in
Table 1.2.3 of Annex V to the WFD). The assessment tools used for this purpose in the UK
are the Transitional Fish Classification Index (TFCI, WFD-UKTAG, 2014), currently adopted
in England, Scotland and Wales, and the Estuarine Multi-metric Fish Index (EMFI; Harrison
and Kelly, 2013), developed for use in Irish transitional waters (Adam Waugh, Environment
Agency, pers. comm.) These are multi-metric indices combining measures of species
diversity and composition, species abundance, estuarine utilisation (also including nursery
function), and trophic integrity (Harrison and Kelly, 2013; WFD-UKTAG, 2014). WFD fish
3
monitoring is undertaken in English estuaries by the Environment Agency (EA), and a multi-
gear approach is used by combining different sampling methods with standardised
specifications for compliance (Coates et al., 2007; EA, 2011a, 2011b, 2013a, 2013b; WFD-
UKTAG, 2014).
Figure 1. Monitoring types identified within the UK Marine Biodiversity Monitoring R&D Programme (from JNCC, 2016). Sentinel (Type 1) monitoring corresponds to the surveillance
monitoring as defined in the WFD.
The Marine Strategy Framework Directive (MSFD, 2008/56/EC), requiring that ‘Good
Environmental Status’ (GES) is achieved by 2020 across Europe’s marine environment.
Eleven descriptors of GES (and associated criteria) are defined and the establishment of
Marine Protected Areas (MPAs) is required to achieve GES. The assessment of fish fauna
is particularly relevant to Descriptors 1 (biodiversity) and Descriptor 4 (food webs) , with also
4
Descriptor 3 addressing the status of exploited fish stocks (also relevant to the
management of fishery resources, see Common Fishery Policy below). To implement the
MSFD nationally, the UK has developed a Marine Strategy setting out the targets and
indicators to measure progress towards achieving GES (Defra, 2012), the marine
monitoring programmes for measuring such progress (Defra, 2014), and the measures that
contribute to the achievement and maintenance of GES in UK seas by 2020 (Defra, 2015).
The understanding of inshore fish diversity, population structure and habitat preference
(throughout different life stages) will aid the UK in adhering to GES criteria therein (e.g.
MSFD criterion D1C1 “The mortality rate per species from incidental by-catch is below
levels which threaten the species, such that its long- term viability is ensured”).
The Common Fisheries Policy (CFP), requiring fisheries management to ensure high long-
term fishing yields for all commercial stocks by 2015 where possible, and at the latest by
2020, while reducing by-catch and wasteful practices. The achievement of healthy stocks and
maximum sustainable yield relies on evidence on the status of exploited stocks (also linked
to MSFD Descriptor 3), which is also provided by fishery-independent monitoring
programmes (such as the IBTS mentioned above). Albeit the CFP Data Collection
Framework (DCF) requirements generally focus on commercial species, the understanding
of the status and distribution of inshore fish populations will contribute evidence towards the
aims of the CFP, by filling the gap of knowledge on inshore fish stocks, and also
considering the dependence of some marine fish stocks on the nursery habitats that occur
in inshore coastal and transitional waters.
The Habitats Directive (HD, 92/43/EC), requiring that natural habitats and wild species (as
listed on the Annexes of the Directive) are maintained or restored at a favourable
conservation status, to promote the maintenance of biodiversity. For this, Special Areas of
Conservation (SACs) are designated according to agreed conservation objectives and
managed, as part of a wider coherent European ecological network of protected sites
(Natura 2000). Fish species (e.g. lampreys, salmonids, shads, clupeids; Annexes II, IV and
V) are included in the list of features that require conservation and may constitute a primary
reason for site selection or a qualifying feature of SACs. As such, fish populations may be
included in the condition monitoring of SAC sites, as undertaken by Natural England in
inshore waters. The Conservation of Habitats and Species Regulations 2017 (‘the Habitats
Regulations’), transpose the European Habitats Directive 1992 and the Wild Birds Directive
2009 (‘the Directives’) into English law. The understanding of inshore fish diversity and
distribution, habitat preference and population structure and variability will provide the
evidence base for competent authorities under the Habitat Regulations (e.g. Natural
England standard) to assess the implications of any new proposed plans or projects that
may be capable of affecting designated interest features of European Sites (possibly
including fish species in some cases).
National legislation such as the Marine and Coastal Access Act 2009 (MCAA), Marine
(Scotland) Act 2010 (MSA) and Marine Act 2013 (Northern Ireland), helping ensuring clean,
healthy, safe, productive and biologically diverse oceans and seas by putting in place a
system for improved management and protection of the marine and coastal environment.
This includes, for example, the designation of Marine Conservation Zones (MPAs in
Scotland), and the protection of fish stocks by introducing a licensing system for fishing

5
activities, and the creation of marine planning and fisheries management authorities (MMO,
Marine Management Organisation, and IFCAs, Inshore Fishery and Conservation Authority,
respectively). A better understanding of inshore fish communities, their dynamics,
distribution and state will help in delivering these objectives by appropriate management
measures. Such planning is encompassed in the Marine Spatial Plans being implemented
in response to the EU Maritime Spatial Planning Directive.
National strategies and plans to improve the environment and the ecosystem services and
societal goods and benefits it delivers, and the approach to fisheries management. These
include for example: the Biodiversity 2020 (Defra, 2011), a strategy for England’ wildlife and
ecosystem services, setting up a strategic direction for biodiversity policy; the Government’s
25 Year Environmental Plan (Defra, 2018a), aiming to deliver cleaner air and water, protect
threatened species and provide richer wildlife habitats; and Defra’s Fisheries White Paper
(Defra, 2018b) and the Fisheries Bill 2017-19 (UK Government, 2019) specifically
addressing future fisheries policy for the managing of fisheries resources within UK waters
while continuing to protect and improve the marine environment in a post EU Exit context.
Fisheries is a key sector, as is marine planning. For example, the sustainable management
and harvest of fish by 2020 is one of the targets of the Biodiversity 2020 strategy (outcome
2 – 2B), and a priority action is established for fisheries, consisting in the implementation of
actions and reforms to ensure fisheries management directly supports the achievement of
wider environmental objectives, including GES under the MSFD. Therefore, understanding
inshore fish community dynamics will enable improved delivery of the above statutory
instruments.
These provide the framework and operational constraints for inshore fish monitoring, including
restrictions, licensing requirements and the identification of methodological criteria for
compliance.
In natural resource management, proxies are commonly used to determine the status of
populations and communities. These include measures assumed to capture the conservation
status of species, as well as measures assumed to provide information on ecosystems’
distribution, structure, functioning and service delivery (Mace et al., 2008; Stephens et al.,
2014). For example, the species richness, taxonomic and functional diversity of biological
communities may be used as indicators of ecosystem function, resilience and resistance to
disturbance (Strong et al., 2015). The number of taxa belonging to specific functional groups are
also used as proxy measures of the functioning of fish assemblages, as in the case for example
of estuarine resident and estuarine-dependent marine taxa, and benthic invertebrate feeding
and piscivorous taxa used to assess the nursery function and the trophic integrity of fish
assemblages in transitional waters in England (WFD-UKTAG, 2014). Abundance proxies for
population size (e.g. standardised indices of abundance, maximum number of individuals
observed during an observation period, frequency of occurrence (e.g. site occupancy), number
of mature individuals) are also used to estimate the status of a population its changes (e.g.
Mace et al., 2008), with additional indices of population structure (e.g. proportion of individuals
above or below a certain age/size; 95th percentile of the fish-length distribution of each
population) also been used for population of commercially exploited fish (see for example
criteria for the assessment of MSFD Descriptor 3; European Commission, 2017). Individual
6
species may also be used as proxies for the whole fish assemblage, particularly where these
represent specific sensitivities to disturbance and/or anthropogenic exploitation (e.g. presence
of indicator species used as a metric in the TFCI for WFD assessment of fish in transitional
waters; WFD-UKTAG, 2014) or a direct measure of human interference that may potentially
threaten native fish populations (e.g. number of introduced species used as a metric in the EMFI
for WFD assessment of fish in transitional waters; Harrison and Kelly, 2013).
1.2 Review structure
The review aims to identify and describe the monitoring techniques that can be used to assess
inshore fish communities, based on best practice and standardised approaches. This will allow
the identification in the next phase of the project of those techniques that are most relevant for
devising a holistic, integrated monitoring pilot programme aimed at characterising the inshore
fish communities of the southwest regional sea area. Therefore, the review presented here is
intended as an operational review, with particular focus on the characteristics of the methods
that will allow making a decision on their suitability for use in the specific regional study area. It
is emphasised that as the methods are usually specific to guild of fishes and types of habitat
then they are relevant for all marine and estuarine areas where those guilds and habitats occur.
The review is delivered in two parts:
● As a matrix (see Excel file ‘Fish method review table’ – available from natural England
on request), summarising key characteristics of each method, and the main data and
metrics that can be obtained from them. The matrix is populated by using tick marks
(“X”) that record the occurrence of one or more of the characteristics identified.
● As a commentary (the present document) that provides information, specifications,
clarifications or comments on the specific methods, with particular attention to the
characteristics identified in the matrix. The report is organised by distinguishing broad
methodological categories, namely ’traditional’ sampling (nets and traps), visual
detection, acoustic detection and DNA-based methods, and providing the detailed
information for each technique within these groups. References to key literature sources
for the different methods are also provided.
The criteria used for the review are largely based on those defined in Hemingway and Elliott
(2002) for field methods in wetlands, estuaries and shallow coastal areas, and in Hering et al.
(2018). These criteria are explained in detail within this Fish method review table.
2. ‘Traditional’ sampling (nets and traps)
Nets and traps are widely used to catch fish in estuarine and coastal marine areas, both in
fishery and scientific monitoring contexts, the variable gear specifications reflecting the different
aims and target organisms. In fact, all fish sampling methods are selective to some degree, with
7
respect to habitat type, and fish size, species, life stage and body morphology (Hemingway and
Elliott, 2002). These are defined in the fisheries literature as ‘fixed’ or ‘moving engines’ in which
respectively the fish swim into the gear or the gear is brought to the fish.
Given that inshore fish communities comprise a diversity of species, life stages, body
morphologies, functional groups and life strategies (e.g. Elliott and Dewailly, 1995; Franco et al.,
2008), there is not one-size-fits-all method that is able to provide a representative picture of the
whole community, and the use of several different complementary methods is required to
capture all components of a fish assemblage. This strategy is used for example in the WFD fish
monitoring programme for UK transitional waters, with a range of standardised fishing
techniques (seine and fyke nets, beam and subtidal otter trawls) being employed for estuarine
fish surveys (Coates et al., 2007; WFD-UKTAG, 2014).
Sampling gears can be active (or mobile; e.g. seines, trawls) or passive (or static; e.g. fyke nets,
gill nets, and traps). The former provide samples that can be related to a specific instant and a
defined area or habitat, while the latter integrate the collection over time and over a wider area,
often unknown and depending on the mobility range of the species being trapped. Therefore,
the type and standardisation of the data that can be obtained may vary with the gear choice ,
influencing the comparability between methods, a factor that also needs to be taken into
account when devising a broad scale, integrative monitoring programme.
The sections below provide information on different types of fish sampling gear, with particular
attention for standardised methods and, where defined, their compliance with existing legislative
requirements. The information is largely based on the review of field methods used for fish in
wetlands, estuaries and shallow coastal areas worldwide (Hemingway and Elliott, 2002). It is
also integrated with standardised fish monitoring guidance, as for example the JNCC Marine
Monitoring Handbook for the monitoring of benthic and demersal fish populations within marine
SACs in UK waters to assess their condition (Wilding et al., 2001a, 2001b, 2001c), the
guidelines of the Baltic Marine Environment Protection Commission (HELCOM) for monitoring
coastal fish for MSFD assessments (HELCOM, 2015), in addition to the WFD fish monitoring
protocols mentioned above. Existing fish monitoring programmes and best practice are a lso
considered, including, for example, UK Marine Monitoring Programmes in place for MSFD
descriptors (Defra, 2014), monitoring and surveillance for non-indigenous species in UK marine
waters (Stebbing et al., 2014), and standardised juvenile fish sampling in coastal nursery
habitats (Barcelo et al., 2016). Where an overlap between sampling methods and commercial
fishing techniques occurs, this is indicated, but techniques that are solely used for commercial
or recreational fishing, with no known application for scientific monitoring, are not included in
this review.
2.1 Trawl nets
Trawl nets are typically funnel-shaped nets which can be towed across the seabed or in the
water column, with the fish being trapped in the ‘cod-end’ (the tail-end of the net). Depending on
how the nets are kept open, different types of trawl nets can be distinguished.
8
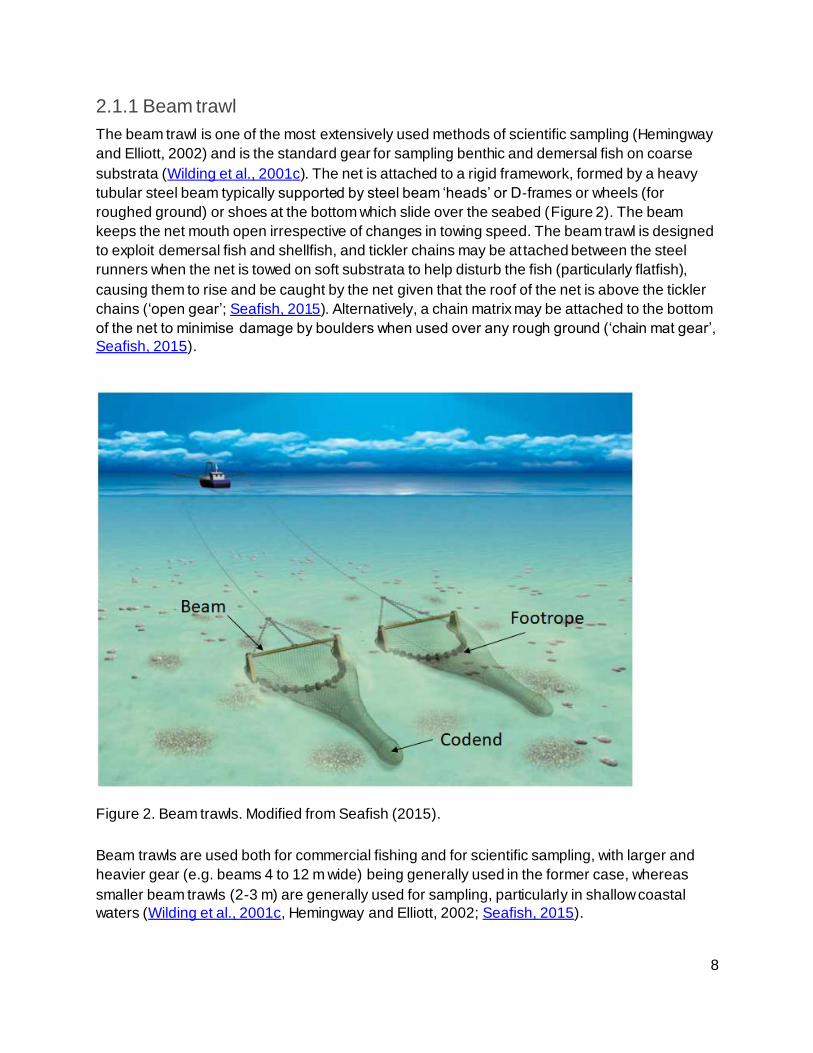
2.1.1 Beam trawl
The beam trawl is one of the most extensively used methods of scientific sampling (Hemingway
and Elliott, 2002) and is the standard gear for sampling benthic and demersal fish on coarse
substrata (Wilding et al., 2001c). The net is attached to a rigid framework, formed by a heavy
tubular steel beam typically supported by steel beam ‘heads’ or D-frames or wheels (for
roughed ground) or shoes at the bottom which slide over the seabed (Figure 2). The beam
keeps the net mouth open irrespective of changes in towing speed. The beam trawl is designed
to exploit demersal fish and shellfish, and tickler chains may be attached between the steel
runners when the net is towed on soft substrata to help disturb the fish (particularly flatfish),
causing them to rise and be caught by the net given that the roof of the net is above the tickler
chains (‘open gear’; Seafish, 2015). Alternatively, a chain matrix may be attached to the bottom
of the net to minimise damage by boulders when used over any rough ground (‘chain mat gear’,
Seafish, 2015).
Figure 2. Beam trawls. Modified from Seafish (2015).
Beam trawls are used both for commercial fishing and for scientific sampling, with larger and
heavier gear (e.g. beams 4 to 12 m wide) being generally used in the former case, whereas
smaller beam trawls (2-3 m) are generally used for sampling, particularly in shallow coastal
waters (Wilding et al., 2001c, Hemingway and Elliott, 2002; Seafish, 2015).
9
In compliance with WFD requirements for surveillance monitoring, a standardised multi -gear
approach is being used by the Environment Agency (EA) for monitoring fish in transitional
waters (Coates et al., 2007; WFD-UKTAG, 2014), and this includes the use of beam trawls of
different size (EA, 2011b, 2013a). In particular, a small beam trawl (beam 1.5 m wide and 0.45
m high; mesh size 20 mm, 5 mm codend) is used in shallower and intertidal habitats. This gear
can be towed manually from a small boat (e.g. a 6 m Rigid Inflatable Boat (RIB)), at low speed
(3 knots), with a required tow length of 200 m, although this may be reduced depending on local
conditions (EA, 2011b). A larger beam trawl is required for sampling in deeper areas, the EA
protocols require a 2 m beam trawl (to be towed for 30 minutes against the flooding tide) for
WFD monitoring (EA, 2011b), or a 2.5 m beam trawl (net 5.5 m long, mesh size 40 mm (knot -to-
knot), and 15 mm on codend; towing speed 3-3.5 knots) for estuarine and coastal surveys (e.g.
Clean Seas Environment Monitoring Programme (CSEMP); EA, 2013a). In both cases, a large
survey vessel (coastal survey vessel, CSV1) that is equipped with a winch for gear deployment
and retrieval is required due to the weight and size of the trawl. It is of note that small beam
trawls of other specifications (e.g. 2 m and 2.4 m beam trawls with 10 mm mesh size on
codend) are also used by the EA for fish surveys in estuarine and coastal areas (Adam Waugh -
EA, pers. comm.; EA, 2017a). WFD protocols require the surveys in shallow waters to be
undertaken annually, twice a year (spring and autumn), whereas the larger beam trawl surveys
(e.g. CSEMP) are to be undertaken once a year (autumn).
A 2 m beam trawl has also been used (in combination with a 1.5 m push net) in the
standardised long term monitoring of young fish along the east and south coast of England
undertaken by Cefas between in late August/early September from 1970 to 2010 (International
Young Fish Survey; Rogers et al., 1998). The trawl had a fine mesh net with a codend liner of 4
mm knotless mesh, a light chain footrope and three tickler chains stretched loosely between the
shoes, and it was deployed from a small commercial inshore vessel in water depths from
approximately 1 m up to a maximum depth of 20 m. Towing speed was approximately 1 knot, or
35 m per minute. These surveys targeted in particular juvenile and young sole and plaice, with
other bottom-dwelling small sized species (mostly <150 mm in total length also being effectively
caught (e.g. small gobies, dragonets) (Rogers et al., 1998).
Beam trawls are also used in internationally coordinated scientific fish surveys undertaken for
the UK by Cefas since 1988 within the ICES offshore beam brawl survey programme
(WGBEAM, 2009; Defra, 2014). These scientific surveys are undertaken in the south and
southwest of England (ICES divisions VIId, e, f, g, a), annually, at a specific time o f the year
(late July in VIId, late September/ early October in VIIe, and September in the other areas).
They aim to provide independent data on commercial species for stock assessments
(particularly sole and plaice) and for examining changes in fish distribution and abundance.
Therefore, a commercially rigged 4 m steel beam trawl is used, fitted with a chain mat, and a 40
mm codend liner. A large vessel (20-70 m long) is needed to tow this gear at a low speed (4
knots) and for the duration of 30 minutes (15 minutes where large numbers o f small fish are
caught or there is a high bycatch of benthic species). It is of note that this type of survey is
1 Coastal survey vessels are normally characterised by a shallow draft and high manoeuvrability that make them ideal for inshore operations. They may also have a low drag profile favouring fuel economy.
10
undertaken mostly offshore, with beam trawling closer to the coast occurring only in some
locations and never in water shallower than 16 m (Defra, 2014).
Beam trawling is preferably undertaken on soft (sedimentary) substrata, or with some
modifications, on more rough ground (see above). The method can be destructive to the
habitats under survey, mainly through abrasion of the seabed, sediment resuspension, and
physical destruction, removal, or scattering of non-target epi- or hyper-benthos (Hemingway and
Elliott, 2002). The penetration depth of a beam trawl ranges from 1 to 8 cm, depending on the
weight of the gear and the towing speed, as well as on the type of substratum (Paschen et al,
2000). Its use on particularly sensitive habitats (e.g. seagrass, maërl beds, biogenic reefs,
substrata with sea-pen and burrowing megafauna) can be therefore restricted. In maërl beds,
for example, bottom fishing with mobile gear (dredges, bottom trawls) affects habitat structure
via extraction of benthic organisms, including maërl itself as bycatch, causing burial,
fragmentation and dispersion as a result of the physical impact of fishing gear. Re-suspension
and settlement of fine sediment over rhodoliths may also cause anoxia and death (Barbera et
al., 2017). Maërl has poor recovery potential (OSPAR, 2010), and therefore the use of bottom-
towed gear on maërl grounds is generally prohibited.
Beam trawling is very effective for sampling flatfish (e.g. plaice, sole, dab, flounder, turbot),
other demersal fish (e.g. red mullet, gobies, smelt, whiting, cod, sea bass, grey gurnard, grey
mullet, small rays) and the epibenthos (e.g. shrimps). The gear efficiency of the beam trawl (i.e.
the proportion of fish caught/assessed in relation to the total available for being caught) has
been widely taken to be 33% (Kuipers, 1975), although this may vary depending on the
conditions in which the gear is used (wind speed, type of seabed, tidal conditions etc.). Beam
trawl surveys are often used to target flatfish nursery grounds (e.g. plaice and sole) and
therefore they are appropriate for sampling flatfish at juvenile and young adult stages, and also
small-medium sized (juvenile or adult) demersal fish. These include marine and estuarine
species, and also freshwater species (e.g. dace, common roach) when beam trawling is
undertaken in the upper reaches of estuaries (EA, 2017a). Diadromous fish (e.g. eel) may also
be caught, but less efficiently compared to the use of traps. Additionally, beam trawls are very
appropriate for collection of live specimens (and subsequent stomach analysis) on condition that
the hauls are short (preferably <15·min) (Hemingway and Elliott, 2002).
Survey operations require two or three surveyors (in addition to vessel crew/skipper), depending
on the trawl size and subsequent sorting required, and can be affected by tide and wind
direction. The catches can be sorted on board (hence requiring taxonomic identification skills for
the surveyors), and where possible the animal released alive back in the water (particularly
when tow duration is short). A minimum number of specimens are retained for difficult
identifications. Both qualitative and quantitative data can be obtained, with abundance and/or
biomass estimates being standardised by sampling effort ( i.e. CPUE, catch per unit effort,
normally as density, over the area towed by the net). Fish size can also be measured on board
using standardised and even electronic measuring boards to assess size/age composition of the
catch. Samples (or subsamples) can be taken for species ID confirmation or for further analyses
(e.g. stomach contents).
11
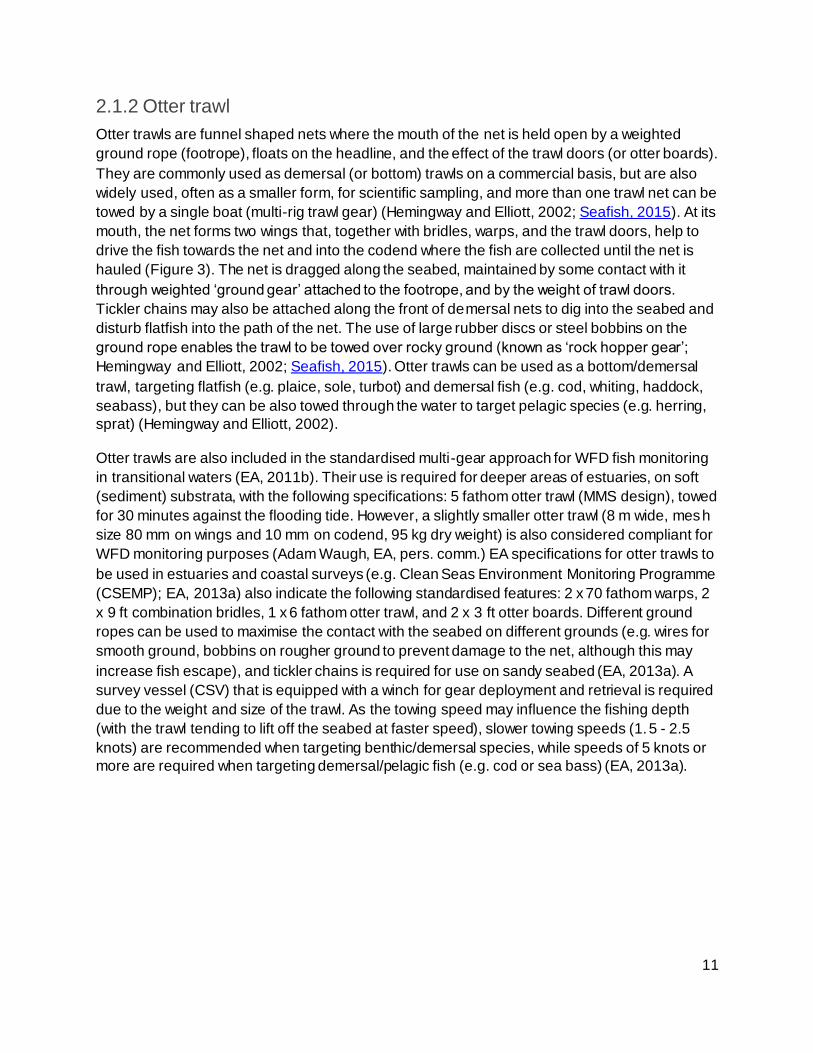
2.1.2 Otter trawl
Otter trawls are funnel shaped nets where the mouth of the net is held open by a weighted
ground rope (footrope), floats on the headline, and the effect of the trawl doors (or otter boards).
They are commonly used as demersal (or bottom) trawls on a commercial basis, but are also
widely used, often as a smaller form, for scientific sampling, and more than one trawl net can be
towed by a single boat (multi-rig trawl gear) (Hemingway and Elliott, 2002; Seafish, 2015). At its
mouth, the net forms two wings that, together with bridles, warps, and the trawl doors, help to
drive the fish towards the net and into the codend where the fish are collected until the net is
hauled (Figure 3). The net is dragged along the seabed, maintained by some contact with it
through weighted ‘ground gear’ attached to the footrope, and by the weight of trawl doors.
Tickler chains may also be attached along the front of demersal nets to dig into the seabed and
disturb flatfish into the path of the net. The use of large rubber discs or steel bobbins on the
ground rope enables the trawl to be towed over rocky ground (known as ‘rock hopper gear’;
Hemingway and Elliott, 2002; Seafish, 2015). Otter trawls can be used as a bottom/demersal
trawl, targeting flatfish (e.g. plaice, sole, turbot) and demersal fish (e.g. cod, whiting, haddock,
seabass), but they can be also towed through the water to target pelagic species (e.g. herring,
sprat) (Hemingway and Elliott, 2002).
Otter trawls are also included in the standardised multi-gear approach for WFD fish monitoring
in transitional waters (EA, 2011b). Their use is required for deeper areas of estuaries, on soft
(sediment) substrata, with the following specifications: 5 fathom otter trawl (MMS design), towed
for 30 minutes against the flooding tide. However, a slightly smaller otter trawl (8 m wide, mesh
size 80 mm on wings and 10 mm on codend, 95 kg dry weight) is also considered compliant for
WFD monitoring purposes (Adam Waugh, EA, pers. comm.) EA specifications for otter trawls to
be used in estuaries and coastal surveys (e.g. Clean Seas Environment Monitoring Programme
(CSEMP); EA, 2013a) also indicate the following standardised features: 2 x 70 fathom warps, 2
x 9 ft combination bridles, 1 x 6 fathom otter trawl, and 2 x 3 ft otter boards. Different ground
ropes can be used to maximise the contact with the seabed on different grounds (e.g. wires for
smooth ground, bobbins on rougher ground to prevent damage to the net, although this may
increase fish escape), and tickler chains is required for use on sandy seabed (EA, 2013a). A
survey vessel (CSV) that is equipped with a winch for gear deployment and retrieval is required
due to the weight and size of the trawl. As the towing speed may influence the fishing depth
(with the trawl tending to lift off the seabed at faster speed), slower towing speeds (1.5 - 2.5
knots) are recommended when targeting benthic/demersal species, while speeds of 5 knots or
more are required when targeting demersal/pelagic fish (e.g. cod or sea bass) (EA, 2013a).
12
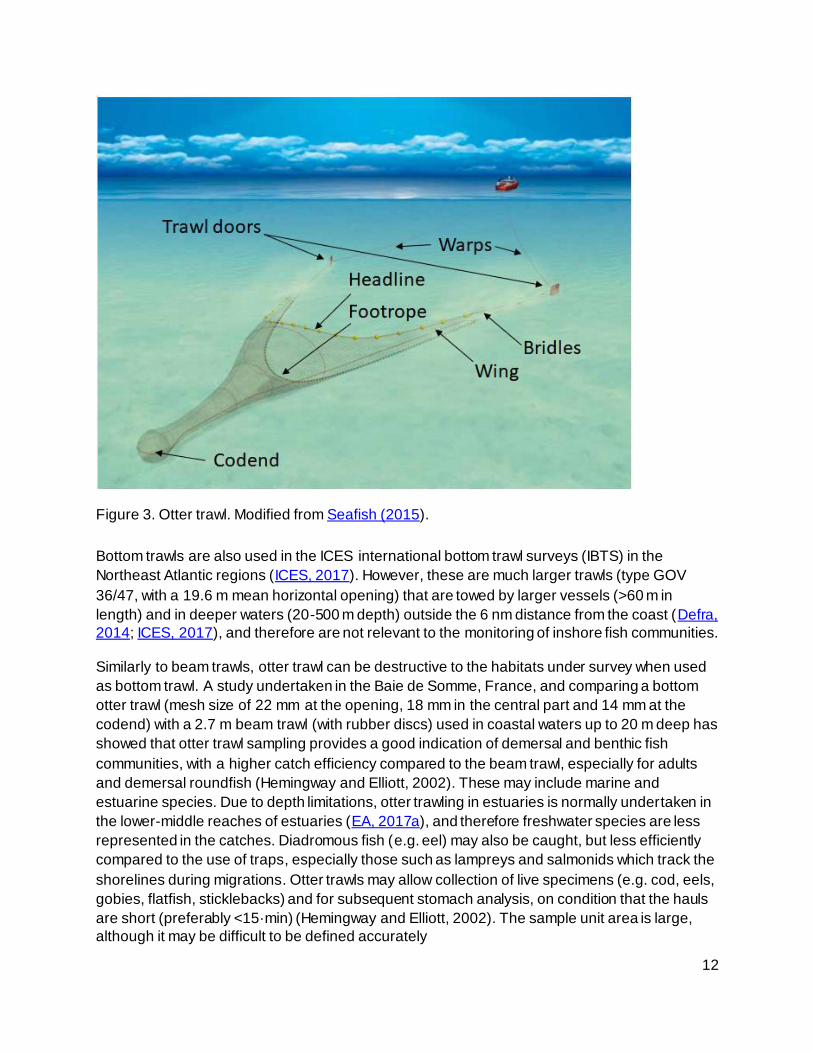
Figure 3. Otter trawl. Modified from Seafish (2015).
Bottom trawls are also used in the ICES international bottom trawl surveys (IBTS) in the
Northeast Atlantic regions (ICES, 2017). However, these are much larger trawls (type GOV
36/47, with a 19.6 m mean horizontal opening) that are towed by larger vessels (>60 m in
length) and in deeper waters (20-500 m depth) outside the 6 nm distance from the coast (Defra,
2014; ICES, 2017), and therefore are not relevant to the monitoring of inshore fish communities.
Similarly to beam trawls, otter trawl can be destructive to the habitats under survey when used
as bottom trawl. A study undertaken in the Baie de Somme, France, and comparing a bottom
otter trawl (mesh size of 22 mm at the opening, 18 mm in the central part and 14 mm at the
codend) with a 2.7 m beam trawl (with rubber discs) used in coastal waters up to 20 m deep has
showed that otter trawl sampling provides a good indication of demersal and benthic fish
communities, with a higher catch efficiency compared to the beam trawl, especially for adults
and demersal roundfish (Hemingway and Elliott, 2002). These may include marine and
estuarine species. Due to depth limitations, otter trawling in estuaries is normally undertaken in
the lower-middle reaches of estuaries (EA, 2017a), and therefore freshwater species are less
represented in the catches. Diadromous fish (e.g. eel) may also be caught, but less efficiently
compared to the use of traps, especially those such as lampreys and salmonids which track the
shorelines during migrations. Otter trawls may allow collection of live specimens (e.g. cod, eels,
gobies, flatfish, sticklebacks) and for subsequent stomach analysis, on condition that the hauls
are short (preferably <15·min) (Hemingway and Elliott, 2002). The sample unit area is large,
although it may be difficult to be defined accurately
13
Survey operations require a minimum of three surveyors (in addition to vessel crew/skipper),
two to handle the trawl, one to operate the winch. The catches can be sorted on board (hence
requiring taxonomic identification skills for the surveyors), and the animals released alive back
in the water (particularly when tow duration is short). Both qualitative and quantitative data can
be obtained, with abundance and/or biomass estimates being standardised by sampling effort
(normally as density, over the area towed by the net). Fish size can also be measured on board
using standardised and even electronic measuring to assess size/age composition of the catch.
Samples (or subsamples) can be taken for species ID confirmation or for further analyses (e.g.
stomach contents).
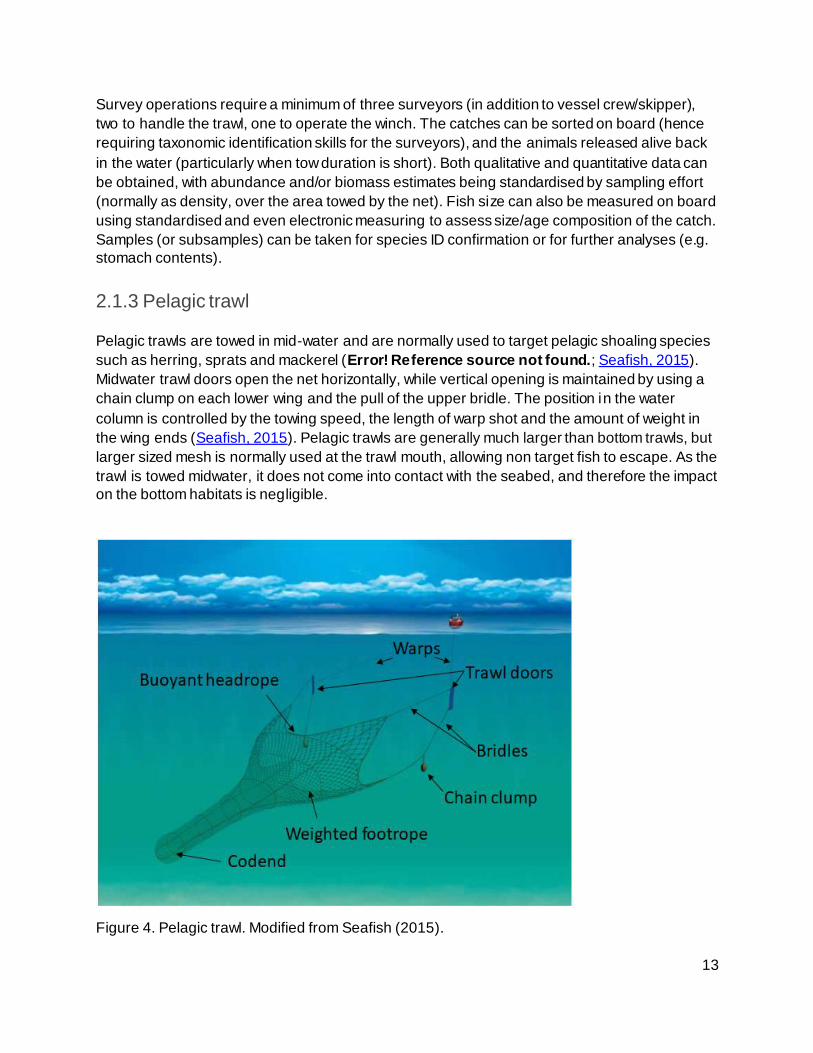
2.1.3 Pelagic trawl
Pelagic trawls are towed in mid-water and are normally used to target pelagic shoaling species
such as herring, sprats and mackerel (Error! Reference source not found.; Seafish, 2015).
Midwater trawl doors open the net horizontally, while vertical opening is maintained by using a
chain clump on each lower wing and the pull of the upper bridle. The position in the water
column is controlled by the towing speed, the length of warp shot and the amount of weight in
the wing ends (Seafish, 2015). Pelagic trawls are generally much larger than bottom trawls, but
larger sized mesh is normally used at the trawl mouth, allowing non target fish to escape. As the
trawl is towed midwater, it does not come into contact with the seabed, and therefore the impact
on the bottom habitats is negligible.
Figure 4. Pelagic trawl. Modified from Seafish (2015).
14
Pelagic trawls are used both commercially and for scientific surveys, although commercial
trawls are normally much larger (some as large as 160 m deep and 240 m wide; Seafish, 2015),
and often unsuitable for use in shallow waters. Smaller pelagic trawls have been designed for
scientific surveys in shallow waters, as for example the Isaacs-Kidd Midwater Trawl (with a front
opening of 10·m2, a codend mesh size of approximately 1.5·mm, towed in horizontal or oblique
hauls at speeds of approximately 3·knots) or the RMT-8 (Rectangular Midwater Trawl, with an
opening of 8·m2, towed at speeds of between 0.5 and 3.5·knots) (Hemingway and Elliott, 2002).
These types of trawls are mainly used for sampling larger larval stages, juveniles and ‘small’ fish
species (Aneer et al., 1992).
There is no wide standardisation of the trawl specifications for monitoring purposes. For
example, the pelagic trawl used for fish monitoring in the lower Seine estuary had a the net
attached to a 4 m wide aluminium frame, with a mesh size decreasing from 9 mm in the
principal section to 1.4 mm at the base, and it was towed in pairs (one trawl at each side of the
boat), against the tidal flow (at approximately 0.1 knots for approximately 15 min). This method
was used to target in particular pelagic juveniles such as twaite shad (Alosa fallax), herring and
sprat (Rochard et al., 1997).
A smaller vessel (e.g. 10 m) equipped with a winch to deploy and haul the net is needed with
smaller pelagic trawls operated for scientific purposes, although their use is limited in shallow
waters. A minimum of three surveyors (in addition to vessel crew/skipper) are required, two to
handle the trawl, one to operate the winch. The catches can be sorted on board (hence
requiring taxonomic identification skills for the surveyors), and the animals released alive back
in the water (particularly when tow duration is short). Both qualitative and quantitative data can
be obtained, and the trawl can be equipped with flowmeters to measure the volume of water
sampled thus allowing standardisation of the catch abundance (or biomass). Fish size can also
be measured on board to assess size/age composition of the catch. Samples (or subsamples)
can be taken for species ID confirmation or for further analyses (e.g. stomach contents).
2.1.4 Other trawls
Trawling gear have been largely adapted for use in specific monitoring programmes. For
example, the Agassiz trawl is a double-sided beam trawl used predominantly for scientific
sampling (Hemingway and Elliott, 2002). The trawl was designed for deep-sea collection (where
it is not possible to control the orientation of the trawl when it lands on the sea bottom), and may
be used for qualitative sampling of both benthic and demersal fauna (particularly invertebrates,
but also fish) as the net is designed to skim over the bed surface. A common size of mouth is 2
m, with a sturdier and heavier frame compared with a beam trawl, ensuring that the gear
remains on the bed even with the use of a larger boat and in stronger currents, and also
allowing its use over semi-rough and mixed ground (Hemingway and Elliott, 2002). The
efficiency of such gear in terms of numbers of animals captured in relation to those in the area
swept by the net is generally low, and it has been assumed to be similar to that of the beam
trawl (Elliott and Taylor, 1989).
15
A 2 m Agassiz trawl (with 13 mm mesh, 15 mm stretched; towed at 2.5-3 knots for
approximately 20 min, over 0.8 km per station) has been used for example in regular fish
sampling in the lower part of the Forth estuary between 1981 and 2001 (with sampling in
January, March-April, June-July, September-October and December at both low and high tide
states in each year; Elliott et al., 1990; Greenwood et al., 2002). Marine/estuarine species such
are whiting, eelpout, pogge, flounder, and plaice were the most abundant species caught by this
gear, with also sand gobies, cod and dab being commonly taken. Pelagic and migratory marine
species (sprat, herring, smelt, Atlantic salmon, sea trout) also occurred in the catches, but they
are not efficiently sampled by this type of net, and their presence in the net was likely due to
their catch during deployment of gear or retrieval (Greenwood et al., 2002).
Other trawls have been tested in inshore coastal and estuarine waters, including for example
the ‘Lowestoft Frame Trawl’ and the Ministry of Agriculture, Fisheries and Food (MAFF) ‘Fast
Bass Trawl’, both trialed in the lower Thames. The former trawl was adapted to allow its
positioning at any level of the water column, whereas the latter operates high in the water
column, making it ideal for use in shallow estuaries, and it was trialed by the EA and in
conjunction with the MAFF particularly to assess the use of the Thames as a bass nursery
(Hemingway and Elliott, 2002).
Demersal and pelagic trawls can also be towed by two boats simultaneously, one towing each
side of the trawl (pair trawl). Using two boats has the advantage of not disturbing the fishing
ground between the boats and of herding the fish from the edges into the central net
(Hemingway and Elliott, 2002). However, in more confined, smaller sites (e.g. inner estuary), the
proportion of the channel being fished is large and may lead to a possibly large by-catch
(Hemingway and Elliott, 2002). There is no standardisation of this method as a monitoring
technique, as this is mostly applied commercially (Hemingway and Elliott, 2002; Seafish, 2015),
and therefore this has not been reviewed further.
2.2 Seine nets
Seine nets are encircling nets that used to surround a concentration of fish either on the seabed
or in the water column. Depending on the net size and the habitat being sampled, the net can
be towed manually or from a vessel, and then hauled back to the vessel or to the shore.
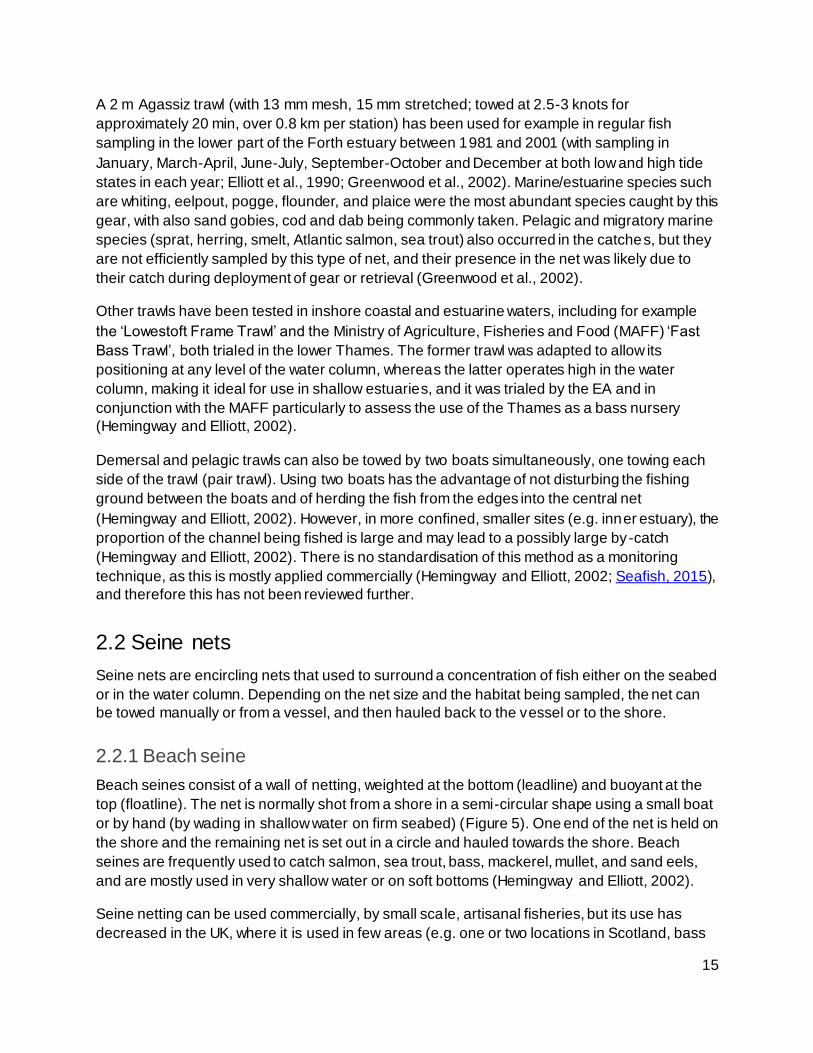
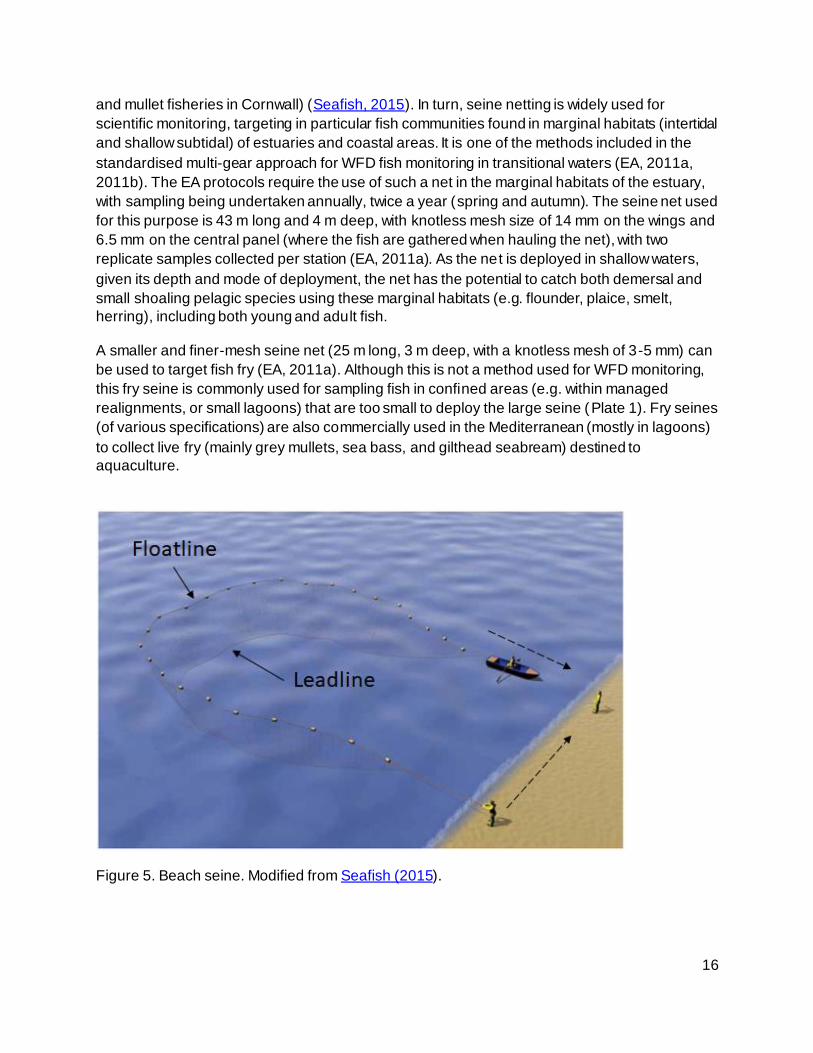
2.2.1 Beach seine
Beach seines consist of a wall of netting, weighted at the bottom (leadline) and buoyant at the
top (floatline). The net is normally shot from a shore in a semi-circular shape using a small boat
or by hand (by wading in shallow water on firm seabed) (Figure 5). One end of the net is held on
the shore and the remaining net is set out in a circle and hauled towards the shore. Beach
seines are frequently used to catch salmon, sea trout, bass, mackerel, mullet, and sand eels,
and are mostly used in very shallow water or on soft bottoms (Hemingway and Elliott, 2002).
Seine netting can be used commercially, by small scale, artisanal fisheries, but its use has
decreased in the UK, where it is used in few areas (e.g. one or two locations in Scotland, bass
16
and mullet fisheries in Cornwall) (Seafish, 2015). In turn, seine netting is widely used for
scientific monitoring, targeting in particular fish communities found in marginal habitats (intertidal
and shallow subtidal) of estuaries and coastal areas. It is one of the methods included in the
standardised multi-gear approach for WFD fish monitoring in transitional waters (EA, 2011a,
2011b). The EA protocols require the use of such a net in the marginal habitats of the estuary,
with sampling being undertaken annually, twice a year (spring and autumn). The seine net used
for this purpose is 43 m long and 4 m deep, with knotless mesh size of 14 mm on the wings and
6.5 mm on the central panel (where the fish are gathered when hauling the net), with two
replicate samples collected per station (EA, 2011a). As the net is deployed in shallow waters,
given its depth and mode of deployment, the net has the potential to catch both demersal and
small shoaling pelagic species using these marginal habitats (e.g. flounder, plaice, smelt,
herring), including both young and adult fish.
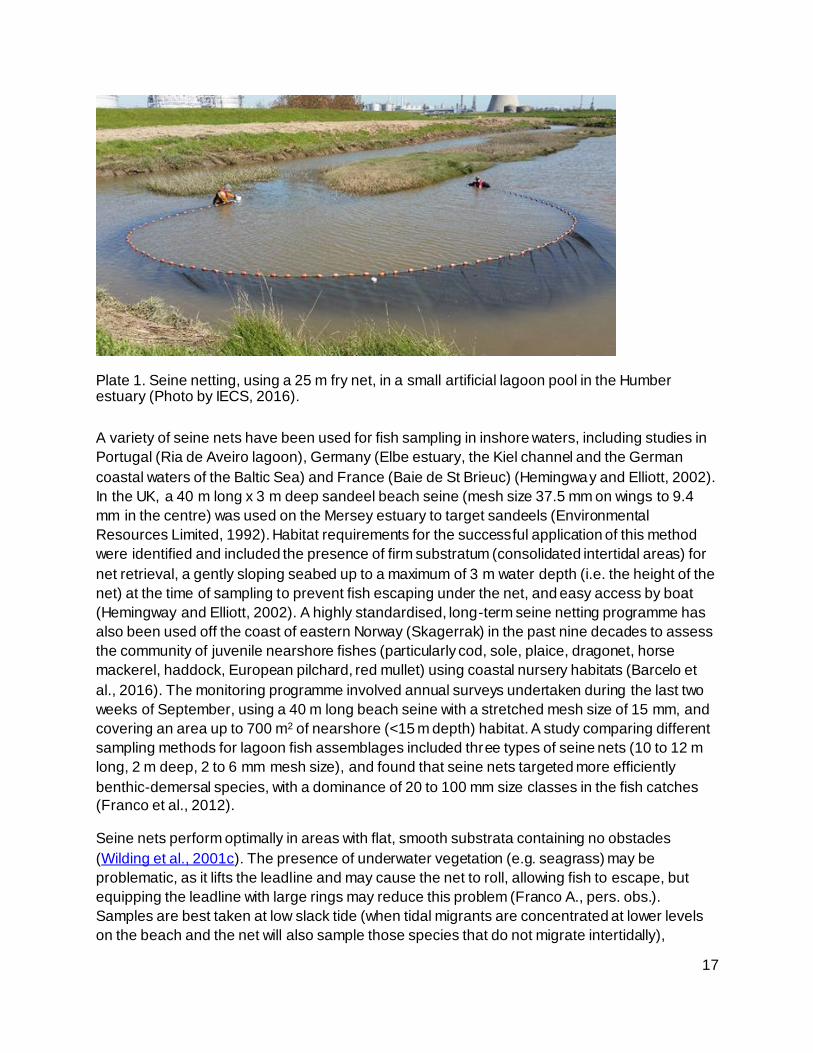
A smaller and finer-mesh seine net (25 m long, 3 m deep, with a knotless mesh of 3-5 mm) can
be used to target fish fry (EA, 2011a). Although this is not a method used for WFD monitoring,
this fry seine is commonly used for sampling fish in confined areas (e.g. within managed
realignments, or small lagoons) that are too small to deploy the large seine (Plate 1). Fry seines
(of various specifications) are also commercially used in the Mediterranean (mostly in lagoons)
to collect live fry (mainly grey mullets, sea bass, and gilthead seabream) destined to
aquaculture.
Figure 5. Beach seine. Modified from Seafish (2015).
17
Plate 1. Seine netting, using a 25 m fry net, in a small artificial lagoon pool in the Humber estuary (Photo by IECS, 2016).
A variety of seine nets have been used for fish sampling in inshore waters, including studies in
Portugal (Ria de Aveiro lagoon), Germany (Elbe estuary, the Kiel channel and the German
coastal waters of the Baltic Sea) and France (Baie de St Brieuc) (Hemingway and Elliott, 2002).
In the UK, a 40 m long x 3 m deep sandeel beach seine (mesh size 37.5 mm on wings to 9.4
mm in the centre) was used on the Mersey estuary to target sandeels (Environmental
Resources Limited, 1992). Habitat requirements for the successful application of this method
were identified and included the presence of firm substratum (consolidated intertidal areas) for
net retrieval, a gently sloping seabed up to a maximum of 3 m water depth (i.e. the height of the
net) at the time of sampling to prevent fish escaping under the net, and easy access by boat
(Hemingway and Elliott, 2002). A highly standardised, long-term seine netting programme has
also been used off the coast of eastern Norway (Skagerrak) in the past nine decades to assess
the community of juvenile nearshore fishes (particularly cod, sole, plaice, dragonet, horse
mackerel, haddock, European pilchard, red mullet) using coastal nursery habitats (Barcelo et
al., 2016). The monitoring programme involved annual surveys undertaken during the last two
weeks of September, using a 40 m long beach seine with a stretched mesh size of 15 mm, and
covering an area up to 700 m2 of nearshore (<15 m depth) habitat. A study comparing different
sampling methods for lagoon fish assemblages included three types of seine nets (10 to 12 m
long, 2 m deep, 2 to 6 mm mesh size), and found that seine nets targeted more efficiently
benthic-demersal species, with a dominance of 20 to 100 mm size classes in the fish catches
(Franco et al., 2012).
Seine nets perform optimally in areas with flat, smooth substrata containing no obstacles
(Wilding et al., 2001c). The presence of underwater vegetation (e.g. seagrass) may be
problematic, as it lifts the leadline and may cause the net to roll, allowing fish to escape, but
equipping the leadline with large rings may reduce this problem (Franco A., pers. obs.).
Samples are best taken at low slack tide (when tidal migrants are concentrated at lower levels
on the beach and the net will also sample those species that do not migrate intertidally),
18
although high slack conditions might be needed at shallow sites upstream in the estuary
(Wilding et al., 2001c; EA, 2011b). It has been estimated that a net of 40 m can deployed and
recovered within 15 minutes (Wilding et al., 2001c). Depending on the net size, this method
allows to sample fish over a large unit area, although it can be difficult to estimate the latter with
accuracy.
Survey operations may require two to four surveyors, depending on the size of the net and
subsequent sorting required (Wilding et al., 2001c; EA, 2011b). The catches can be sorted on
site (hence requiring taxonomic identification skills for the surveyors), and the animals released
alive back in the water (particularly when tow duration is short). Both qualitative and quantitative
data can be obtained, with abundance and/or biomass estimates being standardised by
sampling effort (normally as density, over the area towed by the net), although there may be
some uncertainty in calculating the area swept by the net (EA, 2011a). Fish size can also be
measured on site to assess size/age composition of the catch. Samples (or subsamples) can be
taken for species ID confirmation or for further analyses (e.g. stomach contents).
In terms of impacts on the wider environment, beach seines are mostly deployed over sandy
seabed, and the physical impact is minimal. There are generally no problems with by-catch of
non-target species, and cetacean and seal by-catch is not a problem with this fishery.
2.2.2 Other nets
Demersal seines (e.g. Scottish or fly seine, Danish or anchor seine) can also be deployed from
a vessel to target demersal fish in coastal waters. Lift/dip nets can be used to ca tch flatfish and
other species such as gobies, grey mullets, or brown shrimps in relatively shallow water and soft
bottoms with low hydrodynamic conditions, and they can be deployed manually from a bank or a
boat, or from a fixed structure, depending on the size of the net. However, there are no known
scientific monitoring programmes using these methods and they are mostly used for commercial
fishing, the latter mostly used by artisanal fisheries (larger nets) and anglers (smaller, hand
deployed nets) in Mediterranean coastal lagoons (Hemingway and Elliott, 2002).
2.3 Fixed nets and traps
Fixed nets and traps are stationary devices designed to encourage the entry of animals, which
are then prevented from escaping either by particular aspects of their behaviour or by the
design of the net/trap itself (Hemingway and Elliott, 2002). They exploit the fish movements in
the area where the gear is deployed (e.g. with tides, currents, during migrations) to entrap fish.
After deployment, the gear is left fishing for a variable amount of time (from hours to days),
depending on the conditions and the purpose of the sampling, and the catches are then
collected when the nets/traps are hauled. They exist in many different sizes and forms, and
therefore they may therefore be used in many different environments including on rough
bottoms, and even under ice (Aneer et al., 1992). However, it is emphasised for all traps that the
quality of the catch is influenced by the duration under which the trap is set, i.e. there may be
predation inside the trap or the stomach contents of the catch may be digested or
regurgitated.2.3.1 Fyke net
19
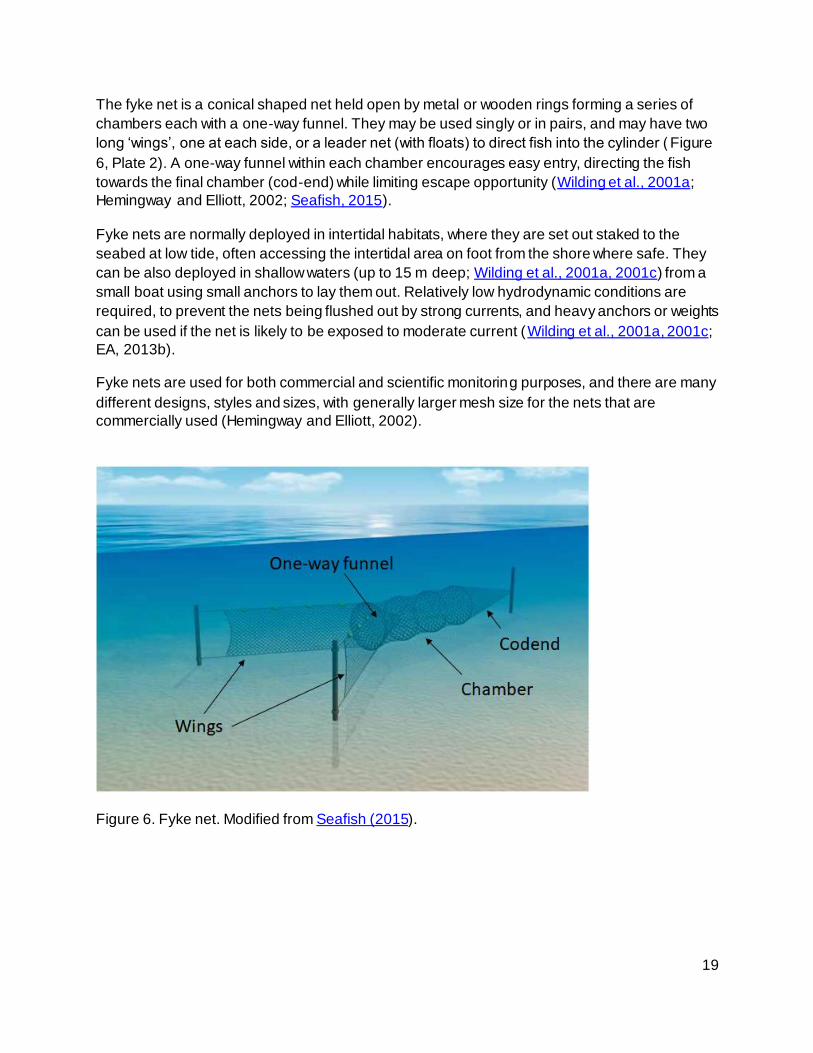
The fyke net is a conical shaped net held open by metal or wooden rings forming a series of
chambers each with a one-way funnel. They may be used singly or in pairs, and may have two
long ‘wings’, one at each side, or a leader net (with floats) to direct fish into the cylinder ( Figure
6, Plate 2). A one-way funnel within each chamber encourages easy entry, directing the fish
towards the final chamber (cod-end) while limiting escape opportunity (Wilding et al., 2001a;
Hemingway and Elliott, 2002; Seafish, 2015).
Fyke nets are normally deployed in intertidal habitats, where they are set out staked to the
seabed at low tide, often accessing the intertidal area on foot from the shore where safe. They
can be also deployed in shallow waters (up to 15 m deep; Wilding et al., 2001a, 2001c) from a
small boat using small anchors to lay them out. Relatively low hydrodynamic conditions are
required, to prevent the nets being flushed out by strong currents, and heavy anchors or weights
can be used if the net is likely to be exposed to moderate current (Wilding et al., 2001a, 2001c;
EA, 2013b).
Fyke nets are used for both commercial and scientific monitoring purposes, and there are many
different designs, styles and sizes, with generally larger mesh size for the nets that are
commercially used (Hemingway and Elliott, 2002).
Figure 6. Fyke net. Modified from Seafish (2015).
20
Plate 2. Deployment of the paired Dutch ‘D’ type fyke net in an intertidal area of the Humber Estuary. Photo by University of Hull.
Fyke nets can be deployed on a variety of substrata (sediment, rock, seagrass), as long as they
can be safely anchored to the seabed (Wilding et al., 2001a, 2001c; Hemingway and Elliott,
2002). They are placed primarily along migratory routes or in spawning areas, to target a wide
variety of fish species that swim in close proximity with the shore. For example, they are used to
catch adult eels during their spawning migration down rivers or estuaries (silver eels) from the
end of summer through to the winter as they head for spawning grounds at sea (Hemingway
and Elliott, 2002; Seafish, 2015). Catches also normally include marine and estuarine fish using
intertidal and shallow subtidal habitats, as for example flounder, grey mullets and sand gobies.
A comparison between fyke nets (mesh size 6 mm stretched) and seine nets (2-6 mm mesh
size) in a study undertaken in a Mediterranean lagoon has shown that fyke net detected more
easily pelagic, allowing the sampling of larger fish compared to seine nets (e.g. eel, sea bass,
gilthead seabream, red mullet) (Franco et al., 2012).
Fyke nets are one of the methods included in the standardised multi-gear approach for WFD
fish monitoring in transitional waters (EA, 2011b, 2013b). The EA protocols require the use of
double-ended Dutch ‘D’ type fyke nets (2 x 5.3 m long fyke nets, with a D shaped opening, 100
cm height, 32’ leader, 14 mm mesh), although nets with slightly different specifications (e.g.
height 58 cm, 6 m leader, mesh size of 14 mm on leader and 10 mm codend) have been
considered as a comparable method (Adam Waugh, EA, pers. comm.) The nets are to be
equipped with tags and otter guards to prevent otters becoming trapped in the chambers (Plate
2; EA, 2013b), weights or anchors attached to the codend, and are deployed in the shallower,
intertidal margins of estuaries, over a full 12 h tidal cycle.
21
Fyke nets are also used in the western parts (Kattegat) of the HELCOM area as one of the
methods included in the multi mesh-size net coastal fish monitoring programme undertaken in
the Baltic Sea for MSFD assessments (HELCOM, 2015). These fyke nets are 55 cm high with a
semi-circular opening and a leader or wing that is 5 m long. They are made of 17 mm mesh in
the arm and 10 mm in the crib. A fyke net system is also being used in the eel monitoring
program along the German coast, and it consists of an external leader net weir (height 1.8 m,
length 100 m, mesh size 10 mm) with a fyke net chamber in each corner. The net square
encloses a fished area of 1 ha. In addition, 6 chains of eel traps (4 double chamber fyke nets
with an 8 m leader net) are placed inside the 100m x 100 m net square. The leader of the fyke
nets are 3 m long and contains chambers with the mesh size of 17, 14 and 11 mm (from the
opening to the end of the fyke net) (HELCOM, 2015).
Survey operations require at least two surveyors (in addition to the skipper if a boat is used), for
safe operations on intertidal areas (Wilding et al., 2001a). Fyke nets are a cost effective
technique that is useful for capturing fish alive and undamaged (i.e. for tagging experiments)
and are often used for continuous sampling as little harm is done to the fish (Hemingway and
Elliott, 2002). However, sampling is limited to fixed locations, and, although the potential sample
unit area can be large (depending on movements of fish in the surrounding area, which are
intercepted and caught by the net), this is difficult to estimate. The catches can be sorted on site
(hence requiring taxonomic identification skills for the surveyors), and the animal released alive
back in the water.
As they catch fish moving in the area where the nets are deployed, a sample integrates the
catches over a longer time (the fishing or soaking time) and possibly a wider area compared to
other techniques, although the latter and the catch efficiency is unknown for most species and
may vary with season and other factors (Wilding et al., 2001a). Both qualitative and quantitative
data can be obtained, and abundance and biomass are normally standardised as catch per unit
effort (CPUE) based on the number of nets and the soaking time (e.g. no. individuals per net per
day). Breen et al. (2006) investigated the gear bias associated with fyke netting and found out
that catch were proportional to soak times of at least 24 to 48 h, and therefore standardizing
catch by soak time is considered appropriate for data comparability when the variation in soak is
low (e.g. 1 day). The study also highlighted that fish escape probability increases with soak time
and is lower for benthic fishes compared to water column fishes, thus likely leading to an over -
representation of the former and an under-representation of the latter in the fyke net catches.
Fish size can also be measured on site to assess size/age composition of the catch. Samples
(or subsamples) can be taken for species ID confirmation or for further analyses (e.g.
contamination), whereas the quality of the samples for the analysis of fish diets is poor as the
fish may spend some time in the net before being collected (thus allowing time for the food in
their stomach to be digested or regurgitated).
2.3.2 Fixed net/trap (e.g. salmon and eel traps)
A variety of nets and fixed traps (e.g. stake nets, barriers, fences, weirs, corrals) can be used to
catch fish such as salmon and sea trout along their spawning and migration routes, close
inshore and within estuaries. These are generally deployed in intertidal and shallow subtidal
22
waters, and are made from a length of netting (leader; e.g. 200 m long) which extends from the
beach and is connected to a catching chamber (e.g. made from the leader netting turning back
on itself to form a partly open box or compound in the most simple designs) (Figure 7). The
leader is set perpendicularly to the main currents and to the shore, so as to intercept the fish
migrating along the shoreline or up the estuary and lead them towards the enclosed catching
chamber (through a narrow slit or a system of funnel entrances) where they are trapped
(Hemingway and Elliott, 2002; FAO, 2018). The nets are constructed of a visible material (it may
include stakes, branches, reeds, netting, etc.), and rely on the behaviour of salmon and sea
trout to swim away from the shore when confronted with the leader (Hemingway and Elliott,
2002).
These nets can be used for commercial or scientific fishing (Hemingway and Elliott, 2002; FAO,
2018). Examples include Northumbria T-nets and Yorkshire ‘T or J’ nets which are set along the
north-east coast of England, or stake nets used on some shorelines in Scotland (e.g. Solway
estuary) (Hemingway and Elliott, 2002; Seafish, 2015). Migratory (anadromous) salmonids are
the primary target of this method, although other fish such as flounder are also captured
(Hemingway and Elliott, 2002). Fixed traps are also used to catch eels in estuaries, although
these are mainly in the form of fyke nets.
Figure 7. Stake net. Modified from Seafish (2015).
2.3.3 Stow net
The stow net is a stationary, cone (or pyramid) shaped gear. The nets are fixed by means of
anchors or stakes, placed according to the direction and strength of the current, and the mouth
can be held open by a frame, which may or may not be supported by an anchored small vessel
23
(Figure 8) (FAO, 2018). Mesh size in the body decreases from the mouth to the codend, and
stow net hauls are made during flood and ebb tides. The net can be deployed near the surface
or on the bottom, when there are no or little macroalgae or sand megaripples (Hemingway and
Elliott, 2002). Strong one-directional currents are normally required, as the net catches the fish
by filtering the water, with fish entering the net more or less voluntary (FAO, 2018). Therefore
this method is mostly used in rivers, estuaries or shallow coastal waters. Because of very small
mesh commonly used in the bag of stow nets and the setting of this type of gear in coastal
areas, juveniles and fish fry are commonly present in the catches (FAO, 2018).
There is no standardisation of this method, and the specification may change depending on the
study. For example, Thiel et al. (1995) used stow nets for research purposes in the Elbe (in the
outer estuary, tidal freshwater and shallow subtidal soft sediment areas) and Weser estuaries,
Germany. These nets were 42 m long, including a 10 m codend containing two throats, had a 9
m x 10 m mouth (kept open by two beams), and a mesh size that decreased every 2–3 m from
40 mm at the mouth to 8 mm in the codend. Two stow net hauls (one during flood tide and the
other during ebb tide) of approximately 4 h duration each were made at each station from an
anchored commercial stow net vessel. During the haul, the upper beam of the stow net was
placed near the surface, whilst the lower beam was located 1–2 m above the bottom. Three
mechanical flowmeters were placed in the opening of the net to provide data on the volume of
water fished.
Commercial stow nets are bigger (e.g. 9 m wide, 71·m long) and with larger mesh (e.g. 16 cm at
the mouth and decreasing every 7 m to a stretched mesh size in the codend of 12 mm), and
these have been used for fish research in the Westerschelde, by deploying them simultaneously
at the surface (up to 4 m depth) and at the bottom. Surface current readings were taken to allow
density (numbers per m3) to be estimated (Hemingway and Elliott, 2002).
Figure 8. Stow net. From FAO-Fish.Tech.Pap.222, p. 48 (FAO, 2018).
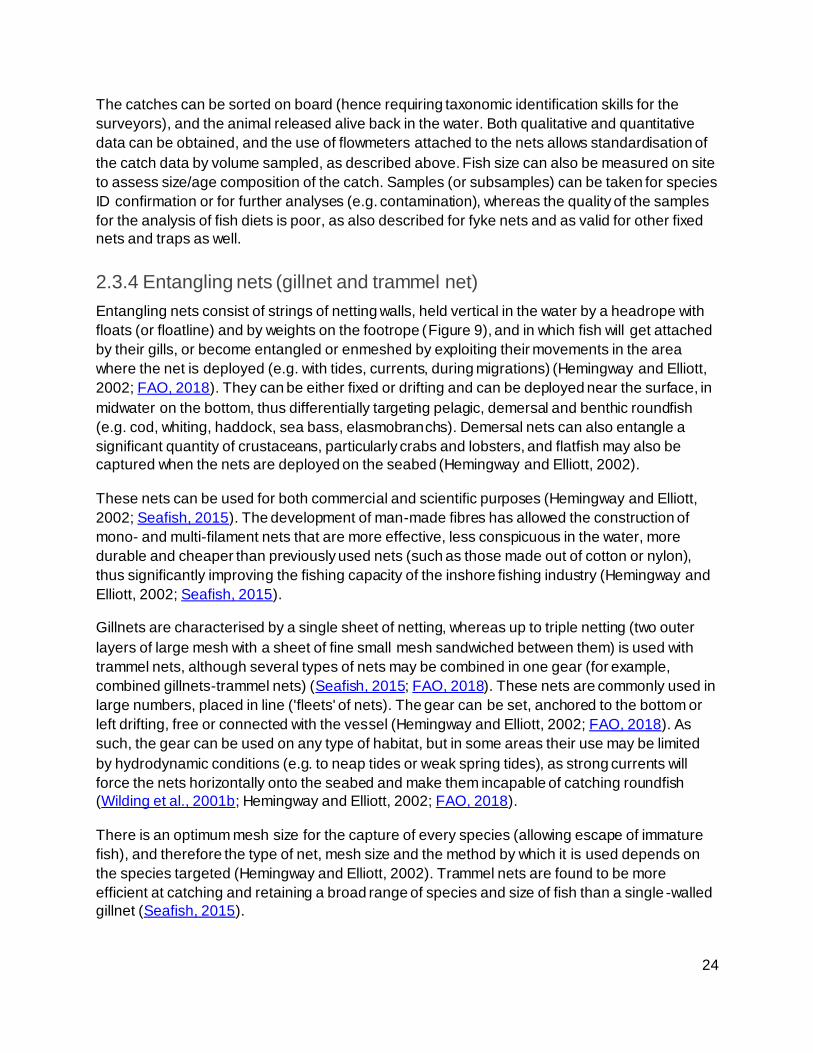
24
The catches can be sorted on board (hence requiring taxonomic identification skills for the
surveyors), and the animal released alive back in the water. Both qualitative and quantitative
data can be obtained, and the use of flowmeters attached to the nets allows standardisation of
the catch data by volume sampled, as described above. Fish size can also be measured on site
to assess size/age composition of the catch. Samples (or subsamples) can be taken for species
ID confirmation or for further analyses (e.g. contamination), whereas the quality of the samples
for the analysis of fish diets is poor, as also described for fyke nets and as valid for other fixed
nets and traps as well.
2.3.4 Entangling nets (gillnet and trammel net)
Entangling nets consist of strings of netting walls, held vertical in the water by a headrope with
floats (or floatline) and by weights on the footrope (Figure 9), and in which fish will get attached
by their gills, or become entangled or enmeshed by exploiting their movements in the area
where the net is deployed (e.g. with tides, currents, during migrations) (Hemingway and Elliott,
2002; FAO, 2018). They can be either fixed or drifting and can be deployed near the surface, in
midwater on the bottom, thus differentially targeting pelagic, demersal and benthic roundfish
(e.g. cod, whiting, haddock, sea bass, elasmobranchs). Demersal nets can also entangle a
significant quantity of crustaceans, particularly crabs and lobsters, and flatfish may also be
captured when the nets are deployed on the seabed (Hemingway and Elliott, 2002).
These nets can be used for both commercial and scientific purposes (Hemingway and Elliott,
2002; Seafish, 2015). The development of man-made fibres has allowed the construction of
mono- and multi-filament nets that are more effective, less conspicuous in the water, more
durable and cheaper than previously used nets (such as those made out of cotton or nylon),
thus significantly improving the fishing capacity of the inshore fishing industry (Hemingway and
Elliott, 2002; Seafish, 2015).
Gillnets are characterised by a single sheet of netting, whereas up to triple netting (two outer
layers of large mesh with a sheet of fine small mesh sandwiched between them) is used with
trammel nets, although several types of nets may be combined in one gear (for example,
combined gillnets-trammel nets) (Seafish, 2015; FAO, 2018). These nets are commonly used in
large numbers, placed in line ('fleets' of nets). The gear can be set, anchored to the bottom or
left drifting, free or connected with the vessel (Hemingway and Elliott, 2002; FAO, 2018). As
such, the gear can be used on any type of habitat, but in some areas their use may be limited
by hydrodynamic conditions (e.g. to neap tides or weak spring tides), as strong currents will
force the nets horizontally onto the seabed and make them incapable of catching roundfish
(Wilding et al., 2001b; Hemingway and Elliott, 2002; FAO, 2018).
There is an optimum mesh size for the capture of every species (allowing escape of immature
fish), and therefore the type of net, mesh size and the method by which it is used depends on
the species targeted (Hemingway and Elliott, 2002). Trammel nets are found to be more
efficient at catching and retaining a broad range of species and size of fish than a single -walled
gillnet (Seafish, 2015).
25
Figure 9. Fleet of gillnets. Modified from Seafish (2015).
Gillnets and trammel nets are extensively used in the multi mesh-size net coastal fish
monitoring programme undertaken in the Baltic Sea by Sweden, Åland, Finland, Germany and
Poland for MSFD assessments (HELCOM, 2015). This programme has been designed to
primarily monitor changes in the fish communities in relation to the impact of eutrophication,
habitat alteration, climate change, toxic substances and fishing. Nets with variable specifications
are used, including for example:
● Coastal survey nets, consisting of 3 m deep bottom gillnets with a length or 35 m (5
panels x 7 m long, with different mesh sizes in the following order: 17, 22, 25, 33 and 50
mm (mesh bar); green monofilament nylon of 0.20 mm diameter in the two largest mesh
sizes and 0.17 mm in the others). These nets have been widely used in the Gulf of
Bothnia, along the Finnish coast of the Gulf of Finland, and along the Swedish coast.
● The Nordic coastal multi-mesh gillnets, consisting of 1.8 m deep bottom gillnets with a
length of 45 m (9 panels x 5 m long, with different mesh sizes in the following order: 30,
15, 38, 10, 48, 12, 24, 60 and 19 mm (mesh bar); transparent monofilament nylon of
0.15 mm diameter in the seven smallest mesh sizes, 0.17 mm in mesh size 48 mm and
0.20 in mesh size 60 mm). These nets are used along the Swedish, Finnish and German
coast, and was used in transitional waters in Poland, and they are the focal gear in the
newly established coastal fish monitoring programme.
● Trammel nets and monofilament gillnets are used in Germany in the artificial reef
program, and consist of a two-panel trammel net (2 m deep x 50 m long, mesh size 60
mm for inner wall, and 350 mm for outer wall) and mono-mesh gillnets (45 m long x 2.4
m high, and either with a mesh size of 60 mm or 55 mm; in the Pärnu Bay area
26
(Estonia), monofilament gill-nets with mesh sizes 16, 22, 25, 30, 38, 45, 48, 50 and 60
mm are used).
These gears have been found to sample representatively only fish above 12-14 cm in size
(dependent on gear), whereas small bodied species, those with eel-like body forms and
sedentary behaviour (as for example pike, Esox lucius) are not sampled representatively by the
gillnets used (HELCOM, 2015).
Trammel nets are also being used for nearshore surveys in the post construction monitoring
programme undertaken along the cable route of the Humber Gateway Offshore Wind Farm as
part of the consenting process (Franco et al., 2018). These surveys target in particular fish living
in the nearshore habitats (e.g. sea bass, flatfish, gadoids) and elasmobranchs present in the
area. The surveys are undertaken in spring and autumn, and use trammel nets that are
comparable to those used by commercial fishers, each net being 100 m long and approximately
3m deep (thirty meshes), and comprising two panels of mesh size 100 mm (inner pane l) and
635 mm (panel). As such, the catches are made up of relatively large sized fish (mostly above
17-20 cm). The nets are deployed on the seabed (depth 3-13 m), with anchors used at either
end, and they are left to fish for a total period of 48 hours each during a survey, divided into 4 x
12 hour replicate deployments (two during daytime and two at night-time) to ensure sampling of
both day‐ active species (e.g. plaice) and night‐ active species (e.g. sole). A small (10.8 m
long) workboat equipped with a net hauler is used for the survey. As mentioned before, the
survey conditions are restricted to periods of calm weather on medium to small neap tides, in
sea states of four or below (Franco et al., 2018).
The catches can be sorted on board (hence requiring taxonomic identification skills for the
surveyors), and the animal released alive back in the water. Qualitative and quantitative data
can be obtained, and catch data can be standardised as catch per unit effort (CPUE), where the
unit effort is the net fleet (or its length unit) per fishing time unit (day or hour). However,
comparability between different studies is difficult due to different net specifications and their
high selectivity towards specific species and sizes, directly depending on the size of the mesh
(FAO, 2018). Fish size can also be measured on site to assess size/age composition of the
catch. Samples (or subsamples) can be taken for species ID confirmation or for further analyses
(e.g. contamination), whereas the quality of the samples for the analysis of fish diets is poor, as
shown for fixed nets and traps.
A scientific study was undertaken in a southeast Australian estuary to develop an optimal,
representative and standardised sampling methodology for future fishery-independent surveys
of estuarine ichthyofauna (Rotherham et al., 2006). Multi-mesh (38, 54 and 89 mm) gill nets
were used, with variable panel length (20, 50, 120 m), soak (1, 3 and 6 h) and setting times
(18:00, 22:00 and 3:00 h) to assess the effect of these factors on the fish catches. Differences
between soak time and panel length treatments were detected for number of species and
number of fish, and standardized CPUE (expressed as numbers of fish caught 20 m-1 of net h-1)
increased with soak time, although fish were often being caught in the same relative
proportions. Based on the results of the study, the authors suggested the use of 20 m panels
soaked for 1 h at any time during the night as optimal for future surveys of estuarine fish
27
populations in New South Wales, Australia, giving the following benefits as reasons for this
choice. Short panels (20 m) allow to double the number of replicate gill nets that can be used on
each sampling occasion compared to larger panels, thus increasing the power of detecting
within and between-site variation, without concomitant increases in cost. Greater replication
may also alleviate concerns relating to short panels (20 m) not catching large and
representative samples of some species. A shorter soak time (1 h) also allows expanding the
scope for increased replication in future studies, and is more likely to reduce fish mortality,
particularly if fish are processed and released as a gill net is retrieved (Rotherham et al., 2006 ).
An advantage of gill/trammel nets over mobile gears (e.g. bottom trawls, seines) is that they can
be used on rocky or hard substrata. Although they are generally considered non-destructive for
the seabed habitat, caution should be applied when used on particularly sensitive substrata, as
for example maërl beds. In fact, although no published study has addressed the impacts of
trammel nets on maërl to date, this method has been reported to potentially affect maërl beds
via perturbation and fragmentation on the short temporal scale, by entangling rhodoliths when
bad weather forces the nets to remain in the water for several days and during net -cleaning)
(Barbera et al., 2017).
Being a passive form of fishing, entangling nets may have a direct effect on non-target animals
such as other fish species, marine mammals and birds which are taken as by-catch. The
incidental catch of endangered species such as turtles, sharks, marine mammals or seabirds, in
certain areas is a matter of growing concern. International Plans of Action have been agreed for
the reduction of the incidental catch of sharks or the entanglement of seabird when operating
gillnets. ’Ghost fishing‘, when lost (or discarded) gillnets (or any piece of netting) continue
fishing while drifting is also a serious concern. The use of different material or mountings can
now ensure that lost nets will not fish for too long or for an unlimited time. For the above
mentioned reasons, the United Nations banned, in 1991, the use of large-scale high seas
driftnets over 2.5 km long. In addition, there are wider environmental benefits given the low
energy consumption of fishing with gillnets (FAO, 2018).
2.3.5 Drop net and drop traps
Drop nets are a quantitative sampling method generally consisting in a net curtain that is
attached to four metal poles and that is dropped remotely so that that the leadline drops to the
seabed while the floatline stays above the water surface (Figure 10). Drop traps work on the
same principle, although they normally consist of square frames of a rigid material (e.g.
aluminium or plastic), which are attached to an upper beam or a rack by which they are
suspended above the water surface. A trigger mechanism leads to free fall of the net/rap into
the water, thereby enclosing a bottom area and the water column above. As a result, fish (and
other organisms) are trapped inside the enclosed area, and they are collected using various
methods (small seine net, hand net, and trawl), depending on the size of the enclosed area
(Wilding et al., 2001a; Hemingway and Elliott, 2002).
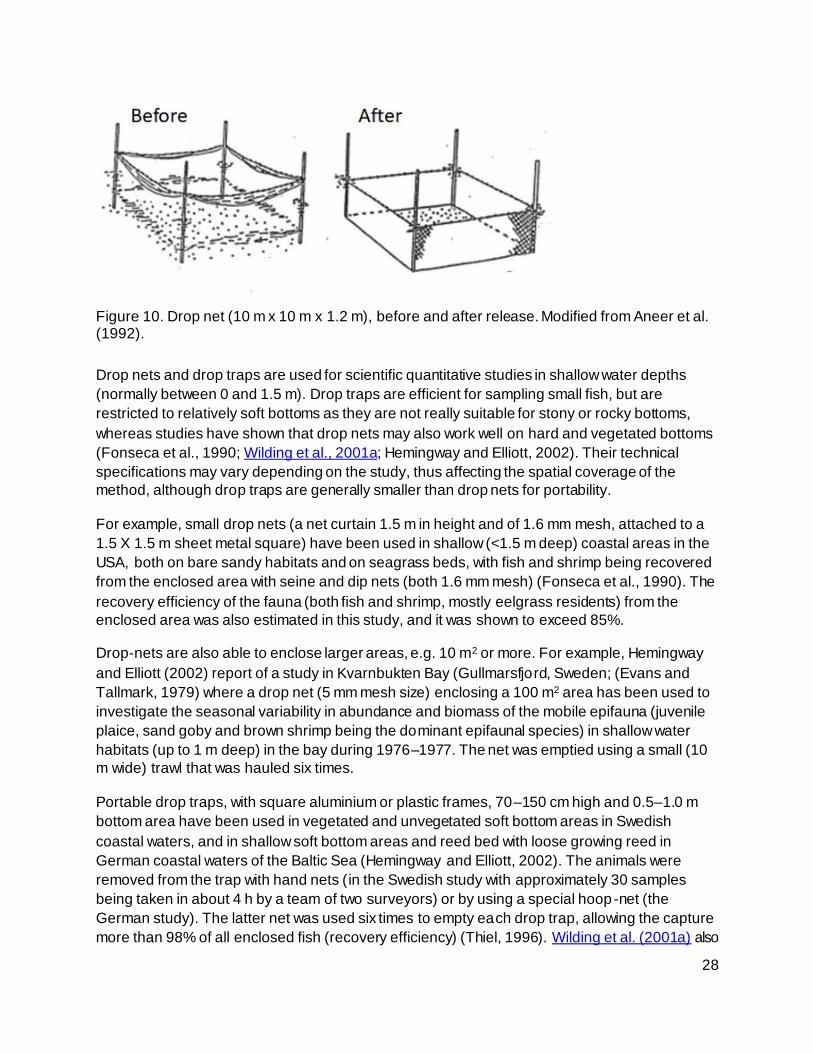
28
Figure 10. Drop net (10 m x 10 m x 1.2 m), before and after release. Modified from Aneer et al. (1992).
Drop nets and drop traps are used for scientific quantitative studies in shallow water depths
(normally between 0 and 1.5 m). Drop traps are efficient for sampling small fish, but are
restricted to relatively soft bottoms as they are not really suitable for stony or rocky bottoms,
whereas studies have shown that drop nets may also work well on hard and vegetated bottoms
(Fonseca et al., 1990; Wilding et al., 2001a; Hemingway and Elliott, 2002). Their technical
specifications may vary depending on the study, thus affecting the spatial coverage of the
method, although drop traps are generally smaller than drop nets for portability.
For example, small drop nets (a net curtain 1.5 m in height and of 1.6 mm mesh, attached to a
1.5 X 1.5 m sheet metal square) have been used in shallow (<1.5 m deep) coastal areas in the
USA, both on bare sandy habitats and on seagrass beds, with fish and shrimp being recovered
from the enclosed area with seine and dip nets (both 1.6 mm mesh) (Fonseca et al., 1990). The
recovery efficiency of the fauna (both fish and shrimp, mostly eelgrass residents) from the
enclosed area was also estimated in this study, and it was shown to exceed 85%.
Drop-nets are also able to enclose larger areas, e.g. 10 m2 or more. For example, Hemingway
and Elliott (2002) report of a study in Kvarnbukten Bay (Gullmarsfjord, Sweden; (Evans and
Tallmark, 1979) where a drop net (5 mm mesh size) enclosing a 100 m2 area has been used to
investigate the seasonal variability in abundance and biomass of the mobile epifauna (juvenile
plaice, sand goby and brown shrimp being the dominant epifaunal species) in shallow water
habitats (up to 1 m deep) in the bay during 1976–1977. The net was emptied using a small (10
m wide) trawl that was hauled six times.
Portable drop traps, with square aluminium or plastic frames, 70–150 cm high and 0.5–1.0 m
bottom area have been used in vegetated and unvegetated soft bottom areas in Swedish
coastal waters, and in shallow soft bottom areas and reed bed with loose growing reed in
German coastal waters of the Baltic Sea (Hemingway and Elliott, 2002). The animals were
removed from the trap with hand nets (in the Swedish study with approximately 30 samples
being taken in about 4 h by a team of two surveyors) or by using a special hoop-net (the
German study). The latter net was used six times to empty each drop trap, allowing the capture
more than 98% of all enclosed fish (recovery efficiency) (Thiel, 1996). Wilding et al. (2001a) also
29
report this method as being unselective and very efficient, although there are limitations in the
small sample area and in the shallow water conditions in which it can be operated.
The catches can be sorted on site (hence requiring taxonomic identification skills for the
surveyors), and the animal released alive back in the water. Both qualitative and quantitative
data can be obtained, with abundance and/or biomass estimates being standardised by
sampling effort (normally as density, over the sampling area or volume enclosed by the net),
although a correction factor accounting for the recovery efficiency of the fauna from inside the
sampling area should be considered. Fish size can also be measured on site to assess size/age
composition of the catch. Samples (or subsamples) can be taken for species ID confirmation or
for further analyses (e.g. stomach contents).
Rozas and Minello (1997) suggested that enclosure samplers are best used for estimating
densities of small nekton in shallow estuarine habitats as these samplers provide the most
reliable quantitative data, and hence the results of studies using these samplers should be
comparable. It is emphasised that enclosure devices have fewer variables influencing catch
efficiency than do towed nets (i.e. trawls and seines), and the catch efficiency of these samplers
does not vary substantially with habitat characteristics typical of shallow estuarine and coastal
areas (e.g. presence of vegetation). The area enclosed is often small, but increasing the sample
number tends to compensate for this limitation (Hemingway and Elliott, 2002).
2.3.6 Popnet and pull-up traps
These are scientific sampling methods, normally used in shallow waters (1-2 m deep), although
the gear specifications (e.g. mesh size, size of the enclosed area) vary depending on the study.
The popnet consists of a buoyant net curtain which, when released, rises from the substratum
trapping fish within a well-defined area. It is used for quantitative sampling of larval, juvenile and
small fish that can be collected from the enclosed sampling area with a small seine or hand net.
It is suitable for use in vegetated areas, and can easily be handled from small boats (Aneer et
al., 1992; Wilding et al., 2001b; Hemingway and Elliott, 2002). A variety of pull-up traps can also
be used, based on a similar sampling system as popnets although they may require more than
one person to handle them and vegetation has to be removed if the traps are to work well
(Aneer et al., 1992; Hemingway and Elliott, 2002).
For example, enclosing popnets with a mesh size of 3 mm and enclosing an area of 100 m2
have been used in German coastal waters of the Baltic Sea within shallow soft bottom areas,
macrophyte beds and reed beds (Thiel, 1996). The nets were fixed on the bottom with a given
strength of attachment, with small buoys fastened on the upper rope, and a mechanism for
releasing the net, allowing the sampling area to be enclosed in less than 1 second. The popnet
was subsequently emptied using a small seine of mesh size 3 mm (Hemingway and Elliott,
2002). Smaller traps (1 mm mesh size, 25 m2 or 9.3 m2 area enclosed) are described in Wilding
et al. (2001b) for recording benthic and demersal fish on vegetation although one of the studies
involved removing the vegetation inside the rising net before seine netting to collect the fish.
At least two staff are required to deploy and trigger the net, and the catches can be sorted on
site (hence requiring taxonomic identification skills for the surveyors), with the animals being
30
released back in the water alive. Wilding et al. (2001b) indicate popnets as a relatively cost-
effective method, which provides qualitative and quantitative data with high accuracy as most
fish are confined by the rising net. Similarly to drop nets, abundance and/or biomass estimates
can be standardised by sampling effort (normally as density, over the sampling area or volume
enclosed by the net). However, a correction factor accounting for the recovery efficiency of the
fauna from inside the sampling area may still be needed. Fish size can also be measured on
site to assess size/age composition of the catch. Samples (or subsamples) can be taken for
species ID confirmation or for further analyses (e.g. stomach contents).
2.3.7 Other fixed nets and traps
Large stationary nets or barrages or traps can be used to intercept and entrap fish moving
through shallow and often confined areas e.g. with tides or during migration phases. They are
designed in such manner that the entrance itself become a one-way device, allowing the fish to
enter the trap but making it impossible to leave the catching chamber. The size of the entrance
and any other openings influences the size selectivity of the gear . Fish may also be guided
physically into the trap by ‘wings’, or may enter in search of cover, out of curiosity, or for feeding
(using baited traps). The traps may be constructed from wood, split bamboo, and netting wire
(Hemingway and Elliott, 2002; Seafish, 2015; FAO, 2018).
In shallow creeks (e.g. in estuaries and salt marsh areas), fish including smaller size classes
and juveniles can be captured using a simple block or stop net (Gardner, 1996; Mathieson et al.,
2000). This is a scientific gear where the bottom line of the net is staked and weighted to the
bottom of the creek, while the top line is tied and one side of the net is staked to the bank of the
creek. The near-bank side of the net is left unattached and weighted in a lowered position to the
creek bottom using weights attached to lengths of rope. At slack high water the net is raised by
lifting the weights and pulling the top rope taut. The near-side of the net can then be secured to
the side of the creek via stakes and weights (Gardner, 1996). This method is most ef fective for
sampling in small semi-enclosed inlets, such as tidal marsh creeks or tidal backwaters,
preferably in areas which are only a few meters wide. This method has been used for example
to sample nekton using saltmarsh creeks in the Humber estuary and in the Forth estuary, UK
(Mathieson et al., 2000). An 8 mm mesh net was used to block saltmarsh creeks of 1.5·m width
with 0.5·m depth in the Humber, and of 3 m width and 1 m maximum depth in the Forth. The
method has also been used in South Africa, where a 3 mm mesh size net was used to block
saltmarsh creeks of the Kariega estuary with widths between 5 and 15 m, and depths of up to 1
m (Paterson and Whitfield, 1996).
Near the outlets of lagoons, permanent barriers are used to concentrate fish that migrate
towards the open sea. This technique is mainly used in Mediterranean lagoons, especially in
Italy and Greece, and the net specifications may vary, being very similar to fyke net traps that
are interconnected in order to form a full-depth barrier at the lagoon outlets in Italy, or forming a
barrier made of wooden poles and canes with either nylon or PVC net and a double -funnel-
shaped trap (1.5–3·m deep, depending on the area) in Greece (Hemingway and Elliott, 2002).
During the main migration season (October to February), these barriers may yield an average of
31
5–10·kg of sea bass, 5–8·kg of gilthead sea bream and 15–20·kg of grey mullet (various
species) per trap on a daily basis (Hemingway and Elliott, 2002).
Minnow or bottle-traps are constructed of inverted funnels inserted into plastic bottles, which are
fastened to the seabed and generally baited. They are effective for sampling small fish in rock
pools and other inshore locations, and allow the fish to enter easily but prevent escape.
Hemingway and Elliott (2002) report that standardised minnow traps are commonly used in
vegetated areas in the eastern USA. These are steel traps that are similar to two small mesh
wired buckets placed with their opening against one another and with the bottoms of the
buckets consist of a meshed funnel inserted into the buckets (diameter approximately 20 cm,
total length approximately 40–50 cm, mesh size 0.5 mm). These traps are very selective, and
catch almost exclusively Fundulus and other poecilid fishes (minnows).
Traps forming semi-permanent structures such as weirs or corrals are designed to exploit the
migration patterns of inshore and estuarine fish (e.g. Bay of Fundy herring fishery) (Potts and
Reay, 1987). Pots, generally comprising of a frame covered in netting to form the trap, a
weighted base to anchor them in the seabed, and deployed in lines of 10 to 50 pots (fleets), are
also used (normally baited), although they mainly target crustacea such as lobsters and crabs
(sometimes prawns) (Hemingway and Elliott, 2002; Seafish, 2015). Fish potting is a rapidly
expanding practice in the Southwest of England; this fishery uses specially designed lightweight
baited pots and targets five species of wrasse for live collection to supply as cleaner fish for the
salmon farming industry (e.g. in Scotland) to control sea lice populations (Devon & Severn
(D&S) IFCA, 2017). The D&S IFCA Live Wrasse Fishing (Limited Permit) Byelaw 2018
regulates the pots characteristics (75 cm length x 45 cm width x 35 cm depth as maximum pot
size, with entrances to the pot fitted with hard or rigid eye of 9 cm maximum size (diameter,
height or width) and at least two unobstructed rigid vertical escape gaps of minimum 7 cm
height and 1 cm width fitted into one or more sides of the pot or trap) as well as other aspects of
the fishery (the wrasse species that may be retained, their size, the fishing periods, etc.) Fishers
in this sector often work single-handed, from small boats, with fish handling and processing time
kept to a minimum (D&S IFCA, 2018; Libby West, D&S IFCA, pers. comm.) Due to the
selectivity of the pots, the by-catch of species is low, with rockling, sea scorpions, and blennies
being most common, and other species including conger, gobies, weever fish, and juvenile
gadoids (D&S IFCA, 2017). A fully documented fishery has been implemented by D&S IFCA (in
2017 and continued in 2018), with data on wrasse landings recorded by the fishers as part of
their permit condition, and more detailed qualitative and quantitative data being collected by on -
board observer surveys undertaken by IFCA Environment Officers. Due to the nature of this
fishery, and the need to avoid disruption of normal fishing behaviour, the data collected in both
ways are limited to wrasse landing (from fishers) and catches (from on-board observers),
whereas by-catch is not recorded (D&S IFCA, 2018; Libby West, D&S IFCA, pers. comm.)
In some fishing practices, pheromone lures have been used to attract target fish to the traps.
For example, there is anecdotal evidence that French fishers used to bait their sea lamprey
traps with mature males to increase their harvest. Pheromones regulating specific migratory and
reproductive behaviors of the sea lamprey have also been tested as potential nontoxic and cost-
effective alternatives to lampricides, where this species constitutes a pest (U.S. and Canada
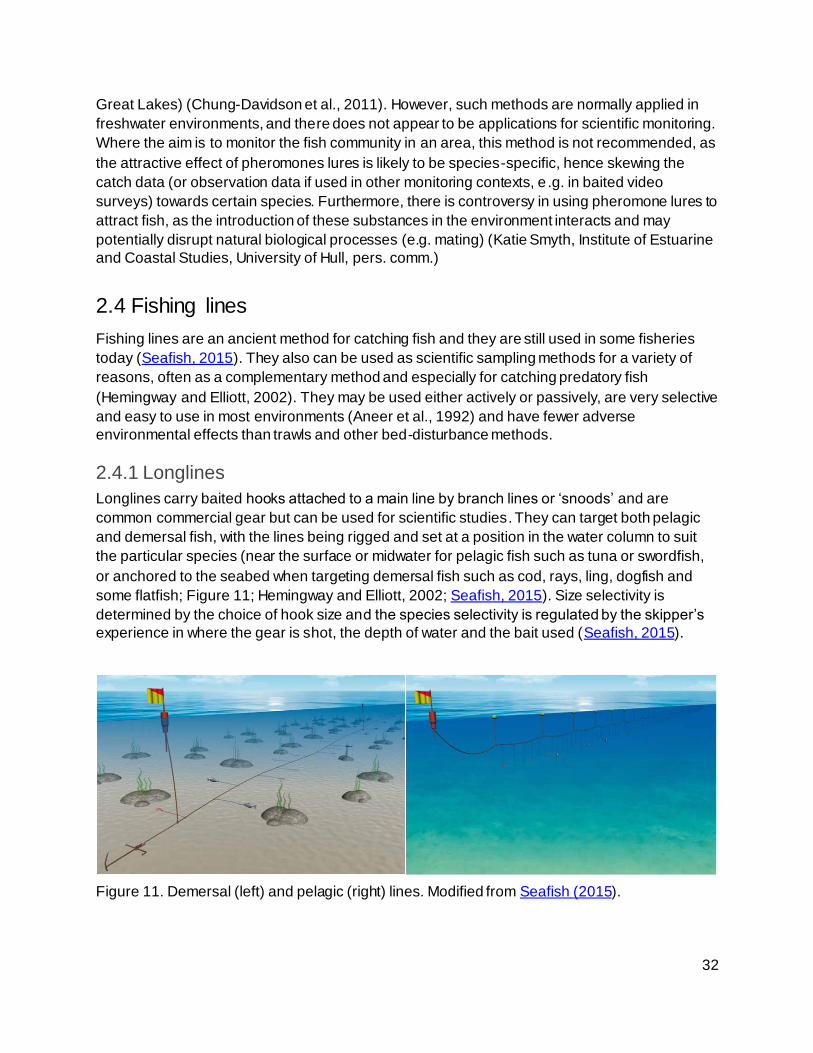
32
Great Lakes) (Chung-Davidson et al., 2011). However, such methods are normally applied in
freshwater environments, and there does not appear to be applications for scientific monitoring.
Where the aim is to monitor the fish community in an area, this method is not recommended, as
the attractive effect of pheromones lures is likely to be species-specific, hence skewing the
catch data (or observation data if used in other monitoring contexts, e .g. in baited video
surveys) towards certain species. Furthermore, there is controversy in using pheromone lures to
attract fish, as the introduction of these substances in the environment interacts and may
potentially disrupt natural biological processes (e.g. mating) (Katie Smyth, Institute of Estuarine
and Coastal Studies, University of Hull, pers. comm.)
2.4 Fishing lines
Fishing lines are an ancient method for catching fish and they are still used in some fisheries
today (Seafish, 2015). They also can be used as scientific sampling methods for a variety of
reasons, often as a complementary method and especially for catching predatory fish
(Hemingway and Elliott, 2002). They may be used either actively or passively, are very selective
and easy to use in most environments (Aneer et al., 1992) and have fewer adverse
environmental effects than trawls and other bed-disturbance methods.
2.4.1 Longlines
Longlines carry baited hooks attached to a main line by branch lines or ‘snoods’ and are
common commercial gear but can be used for scientific studies. They can target both pelagic
and demersal fish, with the lines being rigged and set at a position in the water column to suit
the particular species (near the surface or midwater for pelagic fish such as tuna or swordfish,
or anchored to the seabed when targeting demersal fish such as cod, rays, ling, dogfish and
some flatfish; Figure 11; Hemingway and Elliott, 2002; Seafish, 2015). Size selectivity is
determined by the choice of hook size and the species selectivity is regulated by the skipper’s
experience in where the gear is shot, the depth of water and the bait used (Seafish, 2015).
Figure 11. Demersal (left) and pelagic (right) lines. Modified from Seafish (2015).
33
In the UK, longline fishing is operated on a small scale by only a few inshore vessels in different
parts of the country, whereas pelagic longlining tends to concentrate in tropical regions ( Seafish,
2015). These longlines usually have between 50 and 400 hooks attached per line, with each line
being up to 0.75 km in length (Gray, 1995). They are deployed from small inshore vessels (with
the amount of gear used being dictated by the size of the vessel), are baited by hand, and are
normally allowed to fish over one change of tide or a full 24 hour period (Seafish, 2015).
Lines tend to be used in areas that are inaccessible to trawlers, e.g. where mobile gear is
prohibited or where fixed nets cannot be set due to tidal currents or the nature of substratum
(e.g. rocky or vegetated ground) (Hemingway and Elliott, 2002). For example, they are suitable
for sampling around structures such as offshore windfarms. It is accepted as an environmentally
friendly method of fishing with very little by-catch or discards (Seafish, 2015), although seabird
by-catch may be an issue (Anderson et al., 2011). Line caught fish is regarded as being of the
highest quality (Seafish, 2015), although survey operations can be fairly labour intensive
(Hemingway and Elliott, 2002).
In Greece, this type of fishing gear is used in the Messolonghi-Etolikon lagoon complex and the
areas around the Acheloos and river estuaries, and can be used to sample a variety of species
such as the sea breams, sea bass and eels (Hemingway and Elliott, 2002). The bait is usually
small shrimps (Palaemon spp.), worms and small fish (Atherina boyeri), and live gobies are
often used when fishing for the European sea bass. The longline used within the lagoons is
relatively small (total length 300–500·m with no more than 100 hooks) due to the shallow depths
(down to 1.5·m), whereas in the estuaries lines reaching 1000–1500·m with 500–600 hooks may
be used in shallow depths between 20 and 45 ·m (Hemingway and Elliott, 2002).
2.4.2 Handline
Commercial handlines (rod and line) consist of a single line with a series of baited hooks
attached. Natural bait (e.g. worms, small bait fish) or artificial lures (using movement, vibration,
flash and colour to attract fish) are used to bait fish. Handlines are often used in areas where other
methods are prohibited or where other forms of fishing are difficult, e.g. close inshore or in
turbulent waters, or near underwater obstructions such as wrecks (Hemingway and Elliott,
2002).
One of the simplest techniques to study the behaviour of fish is to record the numbers and
positions of fish captured by recreational or commercial fishers in different seasons. Given the
popularity of recreational angling and the large numbers targeting certain areas, especially
during competitions (e.g. beach fishing), then this has the potential to deliver a large amount of
data as long as these are recorded in a standardised manner. On the assumption that the
population is being adequately sampled, analysis should give reliable (and inexpensive) data on
changing distribution (Bone et al., 1995). However, the catch is heavily dependent on technique,
and type of bait used (Hemingway and Elliott, 2002).
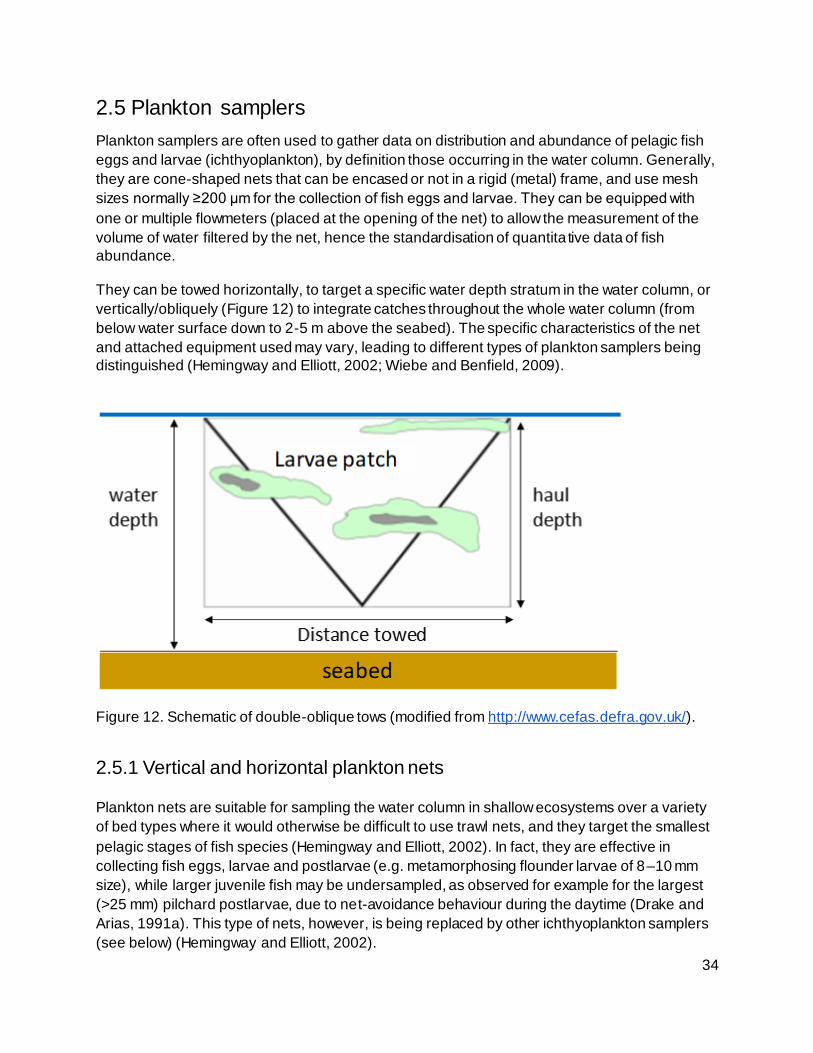
34
2.5 Plankton samplers
Plankton samplers are often used to gather data on distribution and abundance of pelagic fish
eggs and larvae (ichthyoplankton), by definition those occurring in the water column. Generally,
they are cone-shaped nets that can be encased or not in a rigid (metal) frame, and use mesh
sizes normally ≥200 µm for the collection of fish eggs and larvae. They can be equipped with
one or multiple flowmeters (placed at the opening of the net) to allow the measurement of the
volume of water filtered by the net, hence the standardisation of quantita tive data of fish
abundance.
They can be towed horizontally, to target a specific water depth stratum in the water column, or
vertically/obliquely (Figure 12) to integrate catches throughout the whole water column (from
below water surface down to 2-5 m above the seabed). The specific characteristics of the net
and attached equipment used may vary, leading to different types of plankton samplers being
distinguished (Hemingway and Elliott, 2002; Wiebe and Benfield, 2009).
Figure 12. Schematic of double-oblique tows (modified from http://www.cefas.defra.gov.uk/).
2.5.1 Vertical and horizontal plankton nets
Plankton nets are suitable for sampling the water column in shallow ecosystems over a variety
of bed types where it would otherwise be difficult to use trawl nets, and they target the smallest
pelagic stages of fish species (Hemingway and Elliott, 2002). In fact, they are effective in
collecting fish eggs, larvae and postlarvae (e.g. metamorphosing flounder larvae of 8–10 mm
size), while larger juvenile fish may be undersampled, as observed for example for the largest
(>25 mm) pilchard postlarvae, due to net-avoidance behaviour during the daytime (Drake and
Arias, 1991a). This type of nets, however, is being replaced by other ichthyoplankton samplers
(see below) (Hemingway and Elliott, 2002).
35
Plankton nets are cone-shaped nets fastened to a rigid frame (metal rings of 0.5 - 1 m diameter)
that keeps the net mouth open (e.g. Nansen, Hensen nets) (Hemingway and Elliott, 2002).
When used for the collection of fish larvae and eggs, a larger mesh size (≥200 µm) is used than
for plankton sampling (≥90 µm). For examp le, plankton nets used for scientific sampling of fish
eggs and larvae in German estuaries (Elbe and Weser), consisted of different metal frames
(rings of 0.5 and 0.9 m diameter) covered with netting, with mesh sizes of 0.3, 0.5, 1.0 and 2.0
mm (Thiel et al., 1996). The net can be fitted with a sample collecting bag at its end. For
example, the plankton net used for sampling fish eggs and larvae in the saltmarsh area of the
Bay of Cadiz (1 mm stainless steel ring, 4.5 m net length, 0.5 mm mesh size), had a rigid plastic
pipe (10·cm in diameter) fastened to its end and a cylindrical bag (10·cm in diameter, 50·cm
long and 0.3·mm mesh size) used as a sample collecting bag (Drake and Arias, 1991a, b). The
volume of water filtered can be measured using a flowmeter placed in the opening of the net,
thus allowing quantitative data of fish abundance to be estimated.
Plankton nets can be towed horizontally or vertically/obliquely by a vessel at constant low
speed, generally <3 knots (1.5 m s–1; normally 0.5-1 m s–1 for vertical tows or ~2 knots (1 m s–1)
for horizontal tows; Wiebe and Benfield, 2009). Where the current is sufficiently strong, they can
be deployed from an anchored boat or a fixed platform, positioned against the current and used
to passively sample fish larvae and eggs. In the latter case, the net can be positioned at a
chosen depth, thus allowing the investigation of the vertical distribution of the ichthyoplankton
(e.g. Drake and Arias, 1991a). Deployment from a fixed platform or an anchored vessel has
been used in the scientific surveys conducted in the estuarine and coastal areas mentioned
above, allowing the sample collection over a variety of habitats including the outer estuary, tidal
freshwater, intertidal mud and sandflats, shallow subtidal areas (soft and hard), macrophyte
beds and intertidal channels in saltmarsh areas (Drake and Arias, 1991a, b; Thiel et al., 1996).
Drake and Arias (1991a, b) showed that the nets worked efficiently with currents >0.2 m s -1. The
duration of each passive haul was on average about 2·h, although some clogging problems
occurred in the presence of considerable amount of material (e.g. macroalgae) being drifted by
the current. Oblique hauls (3-5 minute duration) were also performed in the Weser and Elbe
estuaries, using an outboard motor boat when the stream velocities were lower than 0.3·m s–1
(Thiel et al., 1996).
2.5.2 Bongo net
The bongo net is one of the most widely used gears for fish larval studies in the open sea and
coastal areas (Aneer et al., 1992). It normally consists of two plankton nets mounted next to
each other, thus possibly allowing for two different mesh size to be used simultaneously if
needed, hence for investigating plankton of different size classes simultaneously. Both nets are
enclosed by a cod-end that is used for collecting plankton.
Bongo nets are often used in the pelagic zone to capture fish larvae, larger zooplankton and, in
some cases, fish juveniles (Hemingway and Elliott, 2002). Mesh sizes of 300 µm or 500 µm are
generally used and the gear may be either towed obliquely (to give integrated samples from the
water column), or horizontally. This gear is easy to use, can cover a large sample unit area,
depending on the tow duration, and gives both qualitative and quantitative data. Aneer et al.
36
(1992) report a good sampling efficiency of this net for smaller fish larvae and fish eggs, and
highlights the need of a relatively strong boat (with good, strong winches) to tow this net.
Bongo nets of various sizes (diameter between 0.2 m and 0.6·m, mesh sizes of usually
0.315 mm, 0.5 mm or 1·mm) have been used in the Elbe estuary and in the German coastal
waters of the Baltic Sea (Thiel, 1996; Thiel et al., 1996). These nets were towed at speeds
between 1.2 and 1.5·m·s–1 for approximately 2–10·min per haul. During sampling, the net was
regularly raised and lowered in the water body between the surface and the bottom, and a depth
depressor was used to keep the net under water. A hydraulic winch was used to control the
height of the net in the water column, and two flowmeters were placed at the two openings of
the bongo net to estimate the quantity of water flowing through the net (Hemingway and Elliott,
2002).
Bongo-nets (61 cm diameter, 500 µm mesh size) have also been used to catch planktonic
stages (eggs and larvae) of bentho-demersal fish in the Bay of Biscay, France between 1985
and 1987 (in March-April each year). One double-oblique tow to within 2·m of the bottom was
undertaken at a towing speed of 2–2.5·knots (1–1.3·m·s–1) was carried out from
(Koutsikopoulos et al., 1989).
2.5.3 Gulf sampler
Gulf samplers are high speed plankton samplers that are used in a similar way to bongo nets,
but can be towed at higher speeds (typically 3-8 knots, i.e. 1.5-4 m·s–1; Wiebe and Benfield,
2009). Higher speed have the advantage of reducing net avoidance by the larger planktonic
forms, while also allowing the use of the net in bad weather (Wiebe and Benfield, 2009). Both
qualitative and quantitative data can be obtained, the gear is easy to handle and can be towed
from a relatively small boat (Hemingway and Elliott, 2002).
There are several versions of Gulf samplers, with different sizes and structure (e.g. where the
net is encased in a metal frame, as in Gulf III, or with an un-encased and scaled-down net, as in
the Gulf V), in addition to several modified versions (e.g. the ‘Nacktai’ (naked shark), a German
modified Gulf V sampler; the Lowestoft sampler, a British modified Gulf III sampler; the
MAFF/Guildline high speed samplers, modified Lowestoft samplers). Some of these can be
used from relatively small boats equipped only with an outboard engine of about 20·hp, as for
example the Gulf ‘Olympia’ used in Finland which allows very finely stratified tows at depths
down to 2·m (Hemingway and Elliott, 2002). Gulf samplers, together with the bongo net, are
considered to be among the best methods for ichthyoplankton sampling (Aneer et al., 1992).
These samplers are normally equipped with flowmeters for calculations of filtered water volume
and to estimate factors affecting the catch efficiency (e.g. net clogging) hence the validity of the
sample collected. They can also have attached CTD sensors and additional probes for
recording physico-chemical water parameters (temperature, conductivity, depth, oxygen, and
pH).
Gulf samplers are largely used in the international fish egg and larval marine surveys
coordinated by ICES for use in stock assessments and fisheries management. For example,
37
Gulf III or VII samplers have been used along with Bongo nets and Continuous Underway Fish
Egg Sampler (CUFES, a system that pumps water from a known depth (5 m under the surface)
onto the vessel, where it is filtered for the collection of eggs) in the North Sea cod and plaice
egg surveys (WGEGGS; ICES, 2018). In these surveys, double oblique hauls were conducted
through the water column till 5 m above the sea floor or a maximum of 200 m depth (the typical
operating range of high speed samplers; Wiebe and Benfield, 2009), and the mesh size of all
sampling equipment was 280 μm (ICES, 2018).
A Gulf-VII high-speed plankton sampler is also used in the ICES programme of International
Herring Larvae Surveys (IHLS) in the North Sea and adjacent areas, in operation since 1967
(see ICES, 2010 for the manual for IHLS). This consists of a 280 μm monofilament nylon mesh
net housed in a steel frame with a depth meter and two flowmeters (one external and one
internal) allowing for calculation of number of herring larvae m-2. A probe or sonde can be
mounted on the sampler to record Conductivity, Temperature and Depth (CTD, e.g. Valeport
Monitor CTD+ 200) measurements if required. A cod-end, made of woven polyester with a
filtering section of 280 μm is attached at the end of the net; this protects the sample during
collection and washing of the net on retrieval of the sampler.
An open bodied ‘Lowestoft’ sampler was used for example for the monitoring of herring larvae at
the Humber Gateway Offshore Wind Farm, located 8 km off the East Yorkshire (Holderness)
coast, UK (Franco, 2014). This consisted of a 280 μm monofilament nylon mesh net with a
detachable cod-end bag, housed in an un-encased aluminium frame (2.13 m long and 0.53 m in
diameter) with a fiberglass conical nose cone of 0.20 cm aperture diameter. The sampler was
equipped with two mechanical impeller flowmeters (General Oceanics 2030R Standard), one
internal and one external, for water volume flow calibration and measurement, and a CTD probe
(Valeport Monitor CTD+ 200) to record haul depth, temperature and salinity during the tow. In
line with IHLS sampling protocols, at each sampling station, one tow (as one or multiple
consecutive double-oblique hauls, depending on the depth) was undertaken at constant towing
speed between 3 and 3.5 knots to allow an even flow to be maintained through the net during
sampling and to reduce damage caused to the larvae samples collected (Kelso et al., 2013). In
fact, towing at speeds >5 knots can cause damage to the larvae samples collected (Harris et al,
2005). Minimum tow duration was 15 minutes to ensure that an adequate volume of water was
filtered. In addition to the sampling tows, a number of ‘free flow’ tows (i.e. without the net) were
conducted survey to calibrate the flowmeters (by towing the sampler horizontal ly for a distance
of 1 nm at a speed similar to that used during sampling) and calculation of the volume of filtered
water. A medium-small sized research vessel (RV The Princess Royal, the Newcastle University
Research Vessel, a 18.9 m long catamaran (MCA category 2) equipped with 2 x 600 hp engines
and 2 ton winches) was used for the surveys.
2.6 Power station screens
Filtration devices in the cooling water intakes of power stations have been widely used as
sampling devices to study fish populations (Hemingway and Elliott, 2002; Henderson, 2017).
Examples have been described for several UK estuarine and coastal locations, including for
38
example the Medway, the Mersey, the Severn, the Thames and the Humber estuaries
(Hemingway and Elliott, 2002 and references therein; Henderson, 2017). The fish data obtained
from available pumping records of the power stations (i.e. cumecs (m3 s−1) of cooling water
processed) can be used to determine relative abundance (semi-quantitative data) in adjacent
waters (Gee, 1983).
Large numbers of fish and other marine species can be entrained in the condenser cooling
water flow which is in the range of 20 to 30 m3 s−1 (cumecs) for a 600 MW unit, with
considerable flows of 91 m3 s−1 of cooling water at full output in larger units (e.g. the now-closed
2400 MW coal fired Longannet Power Station in the Firth of Forth; Greenwood, 2008a;
Henderson, 2017). Once organisms have entered the intake, they either pass through the
cooling water circuit and return to the sea (FRR, Fish Recovery and Return systems), or, if
sufficiently large, they are retained by the 5–9.5 mm mesh fine screens. The screens are in
continual motion so the impinged fish are lifted clear of the water and washed off into troughs
which lead to trash baskets where they are collected for disposal or returned to the sea.
However, while flatfish may be relatively robust and survive impingement, round fish are more
easily damaged and may not survive with an intact swim-bladder.
Sampling volumes of water taken in by modern power plants are similar to those sampled by
trawls, but the former method is less labour intensive than the latter (and also less susceptible
to problems of gear damage, navigation, tidal and weather conditions; Hemingway and Elliott,
2002). Greenwood (2008b) has assessed cooling water intakes as estuarine fish sampling
methods, particularly in comparison with pelagic and demersal trawling, using a large power
station in the lower Forth estuary, UK, as a case study. The study highlighted the utility of a
cooling-water intake as an efficient, low-cost fish sampling device, suggesting it should be
considered as an alternative to trawling as the cost of the latter increases. The intake catch was
typified by pelagic, demersal, and benthic species, although the high abundance of clupeids
(Sprattus sprattus and Clupea harengus) made these catches more similar to those of the
pelagic trawl than the demersal trawl. Intake catches were generally less variable than the
catches made by the two trawls, and monthly trends in relative abundance were reasonably well
correlated with those observed in the trawl samples. Power-plant intakes can be in the seabed,
on the bottom or in mid-water or upper water positions; the position thereby dictates whether the
predominant catch is of benthic, demersal or pelagic species (Elliott, 2012).
Greenwood (2007) also assessed the fish length selectivity, and found that fish collected at the
intake tended to be significantly smaller than those collected by trawling. However, this was
probably attributable to the intake’s smaller mesh size in this specific case study. In fact, an
opposite result was obtained in studies of impingement at Stallingborough, on the Humber
Estuary, England, with larger fish, especially gadoids, being generally taken compared to
sampling by beam trawling in the adjacent estuarine areas (IECS, 2000; Proctor et al., 2000,
2001). Hemingway and Elliott (2002) also report that cooling systems have been used to sample
larvae and the by-catches of flounder and smelt juveniles at the Cordemais Power Station in the
Loire estuary, by using various techniques. Larvae drawn through the cooling system were
sampled using a plankton net 0.6·m in diameter with 0.5·mm mesh in the discharge stream of
the power plant. A flowmeter was fitted to the net, and each sample lasted 5·min, thereby
39
filtering a volume of 68·m3. In order to sample juveniles which were trapped on the drum-screen
and subsequently flushed away by a row of cleaning pumps, a special sampling device was
constructed in the form of a drain by which fish were returned to the estuary, and had a mesh
size of 3·mm. The device was used to sample three times over a 1-min period. Both plankton
net and drum-screen sampling were carried out on the same day every 1.5·h during a tidal cycle
(Hemingway and Elliott, 2002). Intake screen sampling in the Humber has also been used to
monitor fish movements through the estuary, in particular migratory lampreys (IECS 2000;
Leighton 2008).
Henderson (2017) has recently used sampling data from the cooling water filter screens of
power stations to review long term changes (since early 1960s) in temporal and spa tial
composition of the British inshore North Sea fish community, arguing that long-term power
station data give insight into the stability and powers of recovery and resilience of inshore fish
communities. The study showed the notable recovery in fish diversity and abundance in large
industrialised estuaries such as the Thames and the Firth of Forth, likely associated with the
increased water quality after pollution reduction measures were undertaken. Linked to spawning
and nursery habitat gain, smelt, Osmerus eperlanus, and bass, Dicentrarchus labrax, have also
greatly increased in abundance, whereas a decline was observed in the number of
elasmobranchs (except for Raja clavata and Scyliorhinus canicula, which have remained
abundant, and Mustelus asterias, which has increased in abundance). Cumulatively, the
catches from power station intake provided a relatively accurate representation (approximately
90%) of the inshore fish species complement of shallow North Sea British waters (Henderson,
2017).
Power station sampling offers a highly cost-effective and efficient way to sample the fish fauna
and gave the clear advantage over traditional fishing methods that it could be undertaken
throughout the year regardless of the weather (Henderson, 2017). However, although capable
of producing a good database on the state of fish populations, with qualitative and semi-
quantitative data (e.g. relative abundance), there are limitations to using the results from a
single source to provide a representative assessment of the structure of the fish community
within the estuary as a whole (Hemingway and Elliott, 2002). The fixed position can only give an
indication of the fish communities in a small area around the cooling water intake location, which
is often positioned offshore (in coastal waters) or towards the central, deeper part of the
estuarine channel, at sufficient depth (typically < 20 m) to give about 1 m of water above the
intakes at extreme low water spring tide (Henderson, 2017). Therefore, fish occurring
predominantly in other habitats (e.g. shallower and intertidal estuarine margins) may be
underestimated. As is the case for other sampling methods, species also have a variable
vulnerability to capture, with fish species drawn into the power station likely consist ing of the
smaller, weaker fish that are poor swimmers and unable to avoid the suction effect of the intake.
According to Henderson (2017), power station samples show size selectivity at both the lower
and upper size ranges. Typical filter screens with a solid square mesh of 5 to 9.5 mm would
retain all flatfish of standard length (SL) > 25 mm and round fish with a standard length greater
than approximately 60 mm, while smaller fish are retained with reduced efficiency and their rate
of capture might not reflect their abundance. At the same time, very large species such as
40
sharks may escape capture (but they can be still occasionally caught). This selectivity has been
confirmed by qualitative trawls undertaken by the former National Rivers Authority (now EA)
adjacent to West Thurrock during simultaneous surveys of the screens. The results showed that
although in low number, larger fish were present in the estuary than were appearing on the
screens (Hemingway and Elliott, 2002). Further, species that are immobile during the period of
sampling will not be caught, which probably explains the observation by Henderson (1989) that
the only group of inshore fish never recorded in power station samples were clingfishes
(Gobiesocidae). As such, a bias of results may occur and must be taken into account when
interpreting the data.
2.7 Hand gathering methods
Hand gathering methods are normally used in marginal (shallow) areas of estuaries and coasts,
whereby a net is pushed or towed manually to catch fish species using those habitats. As such,
they are easy to use, but access from the shore to the water margin is required, their use is
restricted to wading depths, the sample unit area is generally small compared to other methods
(trawling, seining, etc.), and, given the habitat and the low tow speed, catches are normally
comprised of small fish species or early life stages and that are less able to escape.
2.7.1 Elver dip net
This is a hand-held type of net that is towed to catch elvers (juvenile or glass-eels) migrating
through estuaries in spring from sea spawning grounds (Hemingway and Elliott, 2002). This
gear is similar to a plankton net (and may be equipped with a flowmeter allowing the filtered
water volume to be calculated), and has been used have been used to catch pelagic stages of
benthic species (Pleuronectidae) within the Vilaine estuary, France, and is commonly used by
glass-eel fishers (referred to as ‘tamis’ in French; Marchand and Masson, 1989). Each tow net is
cylindrical and comprised of a 1.2·m-long anterior truncated cone (1.2·m and 0.35·m diameter
at the mouth and cod-end, respectively) with a mesh size of 1.8·mm. This cone leads into the
cylinder which is 0.4·m long and has a mesh size of 1.5·mm. These glass-eel tow nets are
rigged on a 6-meter boom and submerged at two different levels in the water column (1 and 3·m
below the surface). Glass-eels are also caught in the Gironde estuary using the same type of
net (‘tamis’ with a 1·m diameter), together with a second type of gear called ‘pibalour’. This gear
is rectangular in shape and exists in various sizes: 3 to 4.5·m·x·1·m or 5 to 7.5·m·x·1·m (Elie et
al., 1987).
Elver net fishing is also undertaken in the UK, with specific authorisation provided by the
Environment Agency under The Salmon and Freshwater Fisheries Act 1975. The elver fishery
occurs in tidal waters at night, is only allowed during the elver season running from 15 February
– 25 May inclusive, and the use of elver dip nets is restricted to two zones in parts of Wales and
the North West and South West of England (the latter including the Bristol Channel rivers,
draining to the sea between Compass Point in Bude, Cornwall to the south, and Craig y Gwbert
in Cardiganshire). Around 300 individual licensed fishers catch elvers in the Severn and Wye
catchments as they enter freshwater after their journey from the Sargasso Sea using special
elver dip nets (EA, 2018). Elvers are defined as eels not exceeding 120 mm in length, and there

41
are restrictions to gear specifications. The elver dip nets must be constructed in part or in whole
of netting, the depth of the net or bag must not exceed 1 m, the net frame shall be no greater
than 1 m at its widest point and 1.25 m in overall length, excluding the handle (Figure 13).
Fishing from boats is prohibited and no other large nets or traps are allowed. As a further
precaution, all nets must be tagged and fishers must have photographic ID. To protect stocks,
no fishing is permitted within 10 m of any river obstruction, dam, inlet, outlet or fish pass that
hinders the passage of elvers.
Figure 13. Elver dip nets used in Somerset are 1 m long, 0.8 m wide and 0.45 m deep with a handle no longer than 4 m (EA, 2017b).
2.7.2 Push net
Push nets are a commonly used method of scientific sampling and are used on a world -wide
basis. They are normally used for qualitative and quantitative sampling on shallow or intertidal
soft bottoms, especially for juvenile flatfish, gobies, sticklebacks and other small-sized fish and
shrimps (Hemingway and Elliott, 2002). They are useful for collecting live fish (Aneer et al.,
1992), and are relatively cheap and easy to make.
The Riley push-net has been used in detailed studies on the juvenile fish and hyperbenthos
communities in the Mersey estuary, UK and by the EA in the Thames estuary in 1998
(Hemingway and Elliott, 2002). This net may be used in shallow water, either just below low tide
mark, or on the flooded beach, preferably on a flat, firm substratum such as sand or sandy mud,
although it has also been used on consolidated gravel in the inner Thames estuary (Hemingway
and Elliott, 2002). If operated at a standard walking speed and for a fixed time it can produce
comparative data for small active animals such as juvenile flatfish (Eleftheriou and Holme,
1984). The Riley push-net is a small beam trawl designed to catch small fish from shallow
inshore waters to a depth of 60·cm. The beam is pushed from a handle or towed by a person
wearing a harness and is 1.5·m wide with the entrance to the net being 30·cm high; between
the runners on the base of the frame are three tickler chains to increase the catches of young
demersal fish (Hemingway and Elliott, 2002).
42
The push-net is also used as a complementary and quantitative method for juvenile plaice and
brown shrimp in many other areas of France (e.g. Baie de Somme, Seine estuary, Rance
estuary, Baie du Mont St. Michel). In the Baie de Somme, for example, sampling was carried
out at low tide over a distance of 250·m, and depending on the catch either one or several hauls
were are taken. The central bar was 2·m in length and the net was 1.5·m wide with a mesh size
of 8·mm at the mouth and 5·mm in the cod-end (Hemingway and Elliott, 2002).
Push netting also includes a Haaf (or heave) net which consists of a net mounted on a
rectangular frame (6 m long by 1.5 m high), supported by three legs, two lateral and one central,
the latter being extended to allow the fisherman to carry the beam and also tip the beam up to
trap the fish. Multiple Haaf nets are pushed in a line by fishers walking out into the flat, shallow
waters of the estuary facing either the incoming (flood) or outgoing (ebb) tides. The net streams
out in the water and bags, or pokes, form in the net, and, as soon as a fish swims into the net
the legs of the frame are allowed to float to the surface thereby trapping the fish. This is a
traditional and long-established method (dating back to the Vikings) of fishing for salmon and
sea trout on the rivers and estuaries, and is currently permitted only in the Solway estuary (e.g.
only 150 licences are granted each year in Cumbria by the Environment Agency). This method
of fishing has been reported as extremely difficult and dangerous and requires skill and local
knowledge, leading to few fishers still practising Haaf net fishing nowadays. There are no known
applications of this method for scientific surveys, hence this method has not been considered
further.
2.7.3 Kick sampling
This more-commonly used freshwater method consists of a long-handled net with a fine mesh,
which is held vertically in shallow water and the operator standing on the up-tide side kicks the
substratum for a fixed time, moving gradually up-tide as each area underfoot has been
thoroughly stirred. This technique is more suited to benthic epifaunal and infaunal studies,
especially with unconsolidated substrata, and has been used widely in shallow, slow-flowing
channels (Hemingway and Elliott, 2002).
Within the UK, kick-sampling has been undertaken along the shore in the Thames to
complement the EA multi-method surveys and to capture juveniles that might be missed by
other methods (Colclough et al., 2002). In these surveys, timed 1 minute kick sampling was
undertaken with a standard hand net (0.25 x 0.3 m aperture with 1 mm polyester mesh) in the
margins adjacent to sites where seine netting was undertaken to sample early fry and post -
larvae.
Kick sampling has also been used to sample for eggs of Allis shad in the Tamar estuary to
assess the spawning distribution of the species (Cotterell and Hillman, 2015). A long-handled
800 µm mesh kick-sampling net was used, with 10 minute egg surveys (20 x 30 second kick
samples) being undertaken at weekly intervals at known spawning sites. Sampling was
undertaken at a 90° angle to the bank moving across the channel to survey a range of flow
velocities. This ensured that all velocities were sampled as shad eggs can settle in a narrow
band of 1-2 m between marginal slack water and the faster current of the main channel
(Cotterell and Hillman, 2015). The egg surveys commenced when water temperatures
43
approached 15°C (when shad tend to spawn, according to past experience on the Tamar,
normally between mid-May and July), and they targeted high pressure weather periods when
flows were low and the river was not turbid (being able to see the river bed is part of the risk
assessment for undertaking kick samples so turbid water conditions are normally avoided)
(Cotterell and Hillman, 2015).
3. Observation techniques
3.1 Visual detection
Visual methods rely on the in situ (underwater) observation of the fish fauna, and this can be
undertaken directly by divers or remotely by using static or mobile video camera systems
deployed at the monitoring site. These methods are most effective for studying fish behaviour
and activity (habitat use) (Roberts et al., 2016), and may also allow determination of the
distribution, abundance, biomass, species composition, and population characteristics of fish
associated with the seabed or other structures. Visual detection is a most effective method for
sampling fish living on reefs of rock or coral where the alternatives – trapping and angling – are
very selective for certain species and size groups of fish (Hemingway and Elliott, 2002).
As with any method, visual observations have their limitations and can be subject to bias. The
accuracy of the results will depend on both the choice of method, fish species and local
environmental conditions (e.g. sea temperature, time of year, reproductive activity, presence of
predators and food, tidal currents, and reaction to the observer) may also affect the variety and
number of fish observed. Fish that are more active are also more easily detected, whereas
smaller and cryptic fish are more likely to be underestimated (Hemingway and Elliott, 2002).
3.1.1 Diving
Diver-based underwater visual censuses (UVC), together with traditional sampling methods, are
the most common approaches to assessing coastal biodiversity and species (Mallet and
Pelletier, 2014). They have been used to quantify the distribution and abundance of fish on coral
reefs, and has also been used to study fish distribution, biomass, and/or behaviour on rocky
reefs, sedimentary habitats and seagrass beds in the marine environment (Hemingway and
Elliott, 2002, and references therein). However, diving surveys are depth limited (Schobernd et
al., 2013; and Wilding et al. (2001d) recommend a maximum depth of 20 m for transect surveys)
and weather dependent, and may be relatively expensive (require a full, trained dive team;
Wilding et al., 2001d).
Diving surveys may be undertaken from a fixed point, with the diver counting the fish visible
within a field of view for a known length of time, or the diver may move along a transect and
count fish observed within a defined distance from the transect (Wilding et al., 2001d;
Hemingway and Elliott, 2002, and references therein). Fixed point surveys are most appropriate
for fish that swim above but near the seabed, and transect surveys for fish that are sedentary or
territorial. Both methods may be combined within a dive. A transect may be a fixed rope marked
44
at measured intervals and laid over a certain habitat, from shallow to deep water, or at a
constant depth. A fixed rope or other markers (including natural features) are essential if repeat
surveys are to be conducted. Where a constant swimming speed is practiced, it is possible to
estimate the distance covered according to time of survey (Hemingway and Elliott, 2002).
Transects must be at an appropriate scale for the species being studied (e.g. taking into
account the territory range of a species; Costello et al., 1995).
Harmelin-Vivien and Francour (1992) compared diving and trawling for fish on seagrass beds,
and found that diving detected fewer fish species, but greater numbers and biomass. Divers
underestimated cryptic species, whereas trawls failed to catch fast-moving species. In turn, the
diver presence may cause fish to change their behaviour which may also lead to bias in
abundance estimates (Schobernd et al., 2013). For example, some fish may be overestimated
because they are attracted to the observer or to feed on animals that are disturbed from the
seabed during the diving activity, and territorial fish can advance towards a diver in order to
defend their territory (Hemingway and Elliott, 2002).
Factors that may limit the accuracy of data obtained with diving surveys include (Costello et al.,
1995):
● the conspicuousness of the fish, whereby cryptic and inactive fish are likely to be under -
recorded;
● water transparency, affecting visibility, hence the detection range and the ability to see
and identify fish;
● the observer speed, whereby slow speed may attract fish, but faster speed may cause
fish to hide or flee (Boom et al., 2012), while at the same time reducing the diver ability
to notice fish.
In addition, the degree of fish mobility (hence their dispersion) may increase the variability in the
data, thus lowering precision. Costello et al. (1995) recommends that more repeat surveys are
be required to increase the confidence in the mean fish counts. However, variability in recording
also occurs between observers, based on their species identification skills and their field of
vision (or extent of search area) (Wilding et al., 2001d), and this may prevent the reproducibility
of diver observations (Boom et al., 2012).
Diving surveys are used for long-term monitoring of kelp forest ecosystems in shallow (5-20 m
depth) rocky habitats. For example, a long-term scientific program (PISCO2 – Partnership for
Interdisciplinary Studies of Coastal Oceans) was established in 1999 to conduct long-term and
large scale studies on the west coast of the US (led by California and Oregon universities).
Detailed and standardised protocols for kelp forest fish diving surveys have been devised within
this program, with the aim of characterising fish communities associated with this ecosystem,
quantifying their response to establishment of MPAs and to climate change. These protocols
include summer (late July to mid-September) diving surveys, following a depth-stratified
sampling design, where kelp forest locations are surveyed along 30 m-long transects at depths
of 5, 10, 15, 20 m (with three replicate transects at each depth stratum). The survey aims at
2 http://www.piscoweb.org
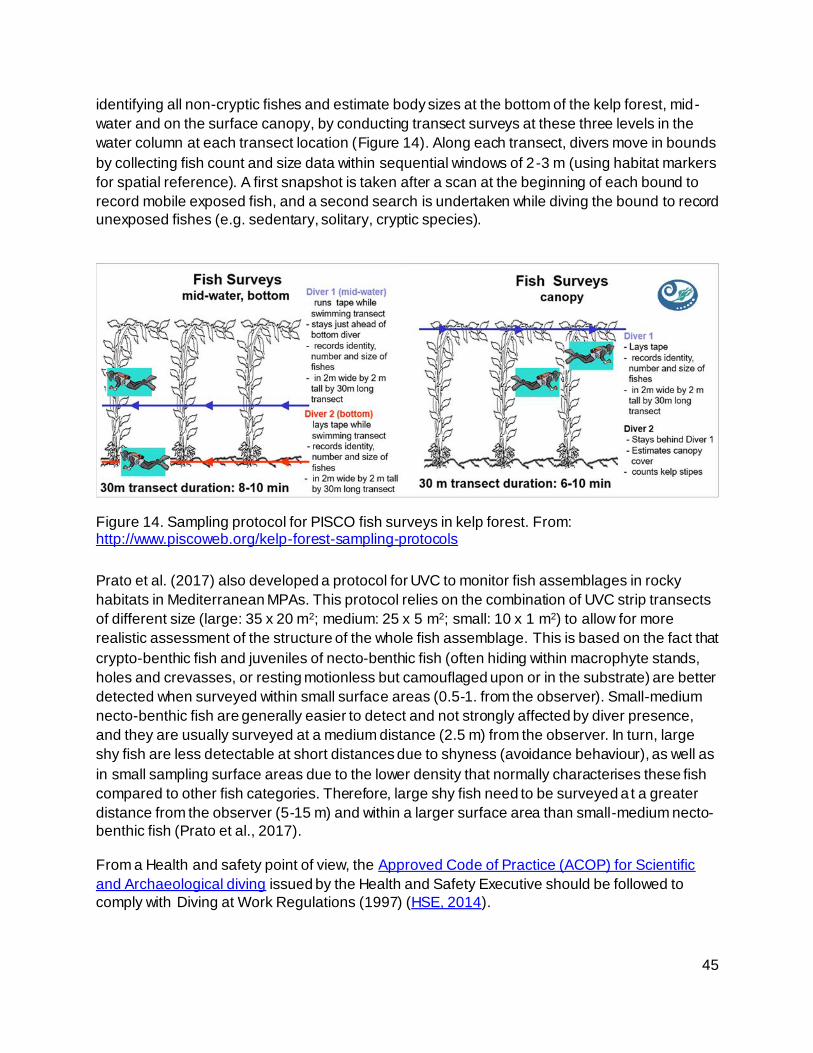
45
identifying all non-cryptic fishes and estimate body sizes at the bottom of the kelp forest, mid-
water and on the surface canopy, by conducting transect surveys at these three levels in the
water column at each transect location (Figure 14). Along each transect, divers move in bounds
by collecting fish count and size data within sequential windows of 2-3 m (using habitat markers
for spatial reference). A first snapshot is taken after a scan at the beginning of each bound to
record mobile exposed fish, and a second search is undertaken while diving the bound to record
unexposed fishes (e.g. sedentary, solitary, cryptic species).
Figure 14. Sampling protocol for PISCO fish surveys in kelp forest. From: http://www.piscoweb.org/kelp-forest-sampling-protocols
Prato et al. (2017) also developed a protocol for UVC to monitor fish assemblages in rocky
habitats in Mediterranean MPAs. This protocol relies on the combination of UVC strip transects
of different size (large: 35 x 20 m2; medium: 25 x 5 m2; small: 10 x 1 m2) to allow for more
realistic assessment of the structure of the whole fish assemblage. This is based on the fact that
crypto-benthic fish and juveniles of necto-benthic fish (often hiding within macrophyte stands,
holes and crevasses, or resting motionless but camouflaged upon or in the substrate) are better
detected when surveyed within small surface areas (0.5-1. from the observer). Small-medium
necto-benthic fish are generally easier to detect and not strongly affected by diver presence,
and they are usually surveyed at a medium distance (2.5 m) from the observer. In turn, large
shy fish are less detectable at short distances due to shyness (avoidance behaviour), as well as
in small sampling surface areas due to the lower density that normally characterises these fish
compared to other fish categories. Therefore, large shy fish need to be surveyed a t a greater
distance from the observer (5-15 m) and within a larger surface area than small-medium necto-
benthic fish (Prato et al., 2017).
From a Health and safety point of view, the Approved Code of Practice (ACOP) for Scientific
and Archaeological diving issued by the Health and Safety Executive should be followed to
comply with Diving at Work Regulations (1997) (HSE, 2014).
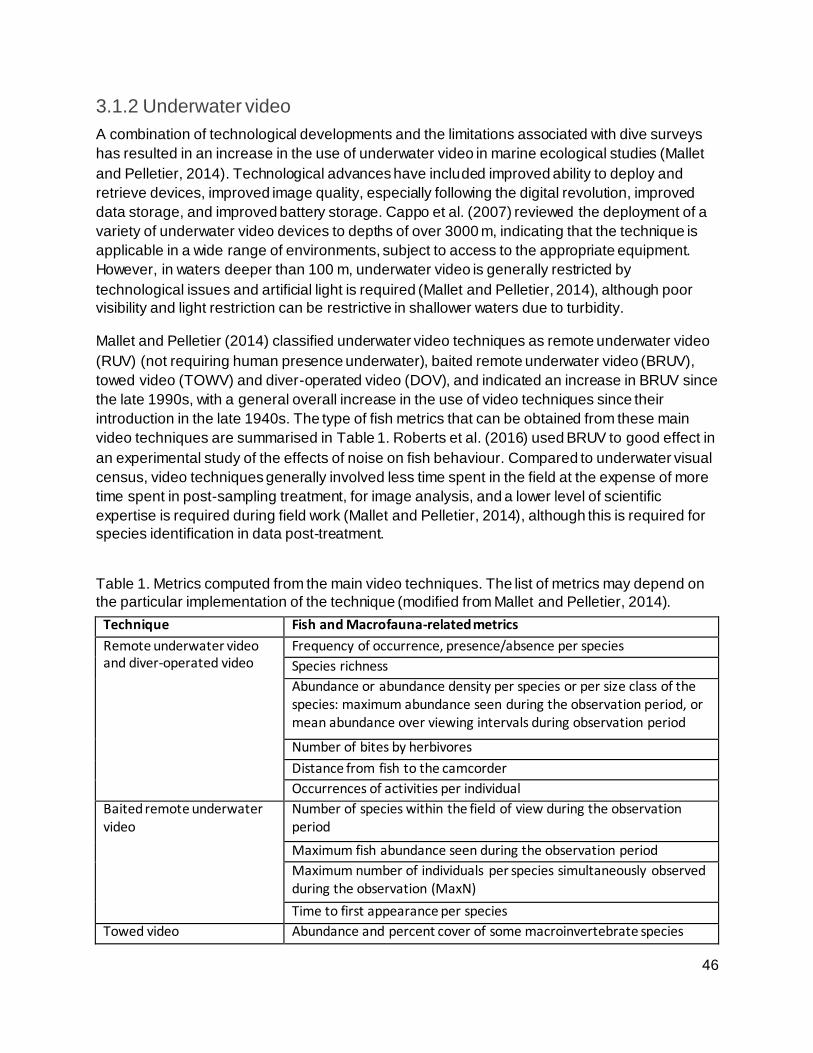
46
3.1.2 Underwater video
A combination of technological developments and the limitations associated with dive surveys
has resulted in an increase in the use of underwater video in marine ecological studies (Mallet
and Pelletier, 2014). Technological advances have included improved ability to deploy and
retrieve devices, improved image quality, especially following the digital revolution, improved
data storage, and improved battery storage. Cappo et al. (2007) reviewed the deployment of a
variety of underwater video devices to depths of over 3000 m, indicating that the technique is
applicable in a wide range of environments, subject to access to the appropriate equipment.
However, in waters deeper than 100 m, underwater video is generally restricted by
technological issues and artificial light is required (Mallet and Pelletier, 2014), although poor
visibility and light restriction can be restrictive in shallower waters due to turbidity.
Mallet and Pelletier (2014) classified underwater video techniques as remote underwater video
(RUV) (not requiring human presence underwater), baited remote underwater video (BRUV),
towed video (TOWV) and diver-operated video (DOV), and indicated an increase in BRUV since
the late 1990s, with a general overall increase in the use of video techniques since their
introduction in the late 1940s. The type of fish metrics that can be obtained from these main
video techniques are summarised in Table 1. Roberts et al. (2016) used BRUV to good effect in
an experimental study of the effects of noise on fish behaviour. Compared to underwater visual
census, video techniques generally involved less time spent in the field at the expense of more
time spent in post-sampling treatment, for image analysis, and a lower level of scientific
expertise is required during field work (Mallet and Pelletier, 2014), although this is required for
species identification in data post-treatment.
Table 1. Metrics computed from the main video techniques. The list of metrics may depend on
the particular implementation of the technique (modified from Mallet and Pelletier, 2014).
Technique Fish and Macrofauna-related metrics
Remote underwater video and diver-operated video
Frequency of occurrence, presence/absence per species
Species richness
Abundance or abundance density per species or per size class of the species: maximum abundance seen during the observation period, or mean abundance over viewing intervals during observation period
Number of bites by herbivores
Distance from fish to the camcorder
Occurrences of activities per individual
Baited remote underwater video
Number of species within the field of view during the observation period
Maximum fish abundance seen during the observation period
Maximum number of individuals per species simultaneously observed during the observation (MaxN)
Time to first appearance per species
Towed video Abundance and percent cover of some macroinvertebrate species
47
3.1.2.1 Stationary cameras
Stationary cameras present a trade-off between the high cost of ROV / underwater vehicle
sampling gears and the disturbance and intensive labour associated with dive surveys
(Schobernd et al., 2013). Boom et al. (2012) report this technique to be less labour intensive
and cheaper than diver surveys, particularly for long-term monitoring, and allows the collection
of reproducible data that can be stored. In contrast to diving, stationary cameras also do not
disturb the fish. Camera orientation can be vertical (looking down on the sea bed) or horizontal
and can be placed at an appropriate depth to sample pelagic or benthic species.
Camera footage can be paused to facilitate species identification. Also the software can be used
for automated species identification, provided that the identification criteria have been defined;
this means that the analysis can be carried out by someone with no biological knowledge,
provided that adequate quality control measures are applied by a competent person. Tracking
and recognition software can be applied to monitor fish movement/ behaviour and also to avoid
double counting of individual fish (Boom et al., 2012).
Baited remote underwater video systems (BRUVs) and their stereo-video counterparts (stereo-
BRUVs) consist in one or two cameras respectively filming the area surrounding a bait used to
attract fish (Roberts et al., 2016). These have been proposed as a novel, standardised, non-
extractive methodology for estimating the relative abundance and diversity of demersal fishes,
with the additional capability of compiling species-specific length data when stereo-video pairs
are used (Dorman et al., 2012; Griffin et al., 2016). Griffin et al. (2016) trialled the use of stereo
BRUVs to assess fish and motile fauna at a local scale around offshore wind farm turbine
structures, collecting data on relative abundance, diversity and size structure for bottom
dwellers, mobile crustaceans and large predatory fish. Roberts et al. (2016) used BRUV to
investigate the behaviour of fishes in response to noise.
BRUV systems (and stereo-BRUVs in particular) may be seen as a viable tool for assessing fish
and other motile fauna at the local scale (e.g. in the vicinity of offshore wind farms; Griffin et al.,
2016). The use of bait (normally pilchard or mackerel) increases the rate at which both the
number of species and the number of individuals are sampled, thus reducing problems
associated with low fish counts per sample (Dorman et al., 2012). Mallet and Pelletier (2014)
state that baited video (BRUV) can be particularly useful in areas where fish are scarce.
However, this technique also carries a level of bias, for example by creating an artefact of
attracting species to a bait station and hence the area of influence of the bait may be difficult to
determine as it relies on olfactory detection by the fishes. Increased abundance and species
richness of generalist carnivores (predatory and scavenging species) has been observed when
bait is used, whereas herbivorous or omnivorous fish appear not to be affected (Harvey et al.,
2007). Harvey et al. (2007) concluded that the use of bait facilitates greater discrimination of fish
assemblages between habitats, but also increases the similarity of samples within a habitat .
This improves the statistical power of detecting changes in individual fish populations within an
assemblage (particularly for large generalist carnivores, macroinvertebrate carnivores and
piscivore species; Harvey et al., 2007). However, it is of note that the variable representation of
different species and trophic groups in the samples is likely to affect the assessment of the
structure and functioning of the fish assemblage as a whole. As a result, Watson et al. (2005)
48
recommend using a combination of survey techniques (e.g. diver-operated, baited and unbaited
stereo-video) for comprehensive fishery-independent studies that aim to sample broad
components of fish assemblages.
According to Cappo et al. (2007), the use of baited video can overcome sampling problems
associated with substratum characteristics, seafloor rugosity, gear selectivity, depth and fish
behaviour (e.g. ability to escape from or gear or gear avoidance). Baited video can attract fish to
a field of view in which they can be identified, counted and measured. Advantages include non-
destructive sampling and there is no size selection (meaning that large species that normally
avoid divers can be recorded). Baited video can be deployed on a variety of seabed types
where other gears cannot be used (e.g. hard substrata with high rugosity), and there is no
disturbance to the seabed or the associated epifauna (Wilding et al., 2001d; Cappo et al., 2007).
Recording can take place over long time periods, avoiding the snapshot sampling associated
with other techniques. Permanent digital records mean that specialist observers are not required
to complete the fieldwork, and that taxonomic analysis can be carried out at any time by
specialists. However, some knowledge of the target species is necessary to assess the potential
effectiveness of this technique and the potential for error (e.g. distance and range of attraction
of vagile fauna by the bait is difficult to test; Mallet and Pelletier, 2014).
Non-destructive methods, such as video or visual census techniques are particularly useful in
no-take zones, such as marine protected areas. Also species and size selectivity as associated
with trawls, traps and hooks is minimised, although a degree of selectivity will be unavoidable
depending on the positioning of the camera (demersal/pelagic). For example, non-baited go pro
cameras have been used to monitor the natural breeding behaviour of black bream in the
nesting areas off the Dorset coast (between Kimmeridge and Poole Bay), allowing to observe
nest building and defence, mate attraction, parental care, egg predation and to gain knowledge
on the spawning timing and behaviour of the species (The Black Bream Project).
The use of stationary cameras is also limited by the water clarity (affecting visibility, hence
detection range), and, even in clear conditions, it allows to assess small areas (likely between a
few cm to a few metres around the camera, depending on visibility). Therefore, this method may
not be very useful in turbid waters where a large field of vision is not possible (e.g. in
SAC/WFD/MSFD monitoring where knowledge of fish populations throughout an estuary or
large coastal area might be required). In addition, given the small unit area assessed by a
stationary camera (microhabitat, <10m), more replicate observations are required to cover wider
study areas compared to mobile techniques, thus involving longer post-processing times.
Video analysis provides information on species composition/richness, abundance and fish
length. The estimation of fish abundance form video footage aims to produce an index of
abundance that is proportional to the true abundance, although with a certain degree of error.
Schobernd et al. (2013) discussed the error in the metrics commonly used to estimate fish
abundance from video footage, the main approaches including:
● Time at which a species first appears - this provides estimates that are characterised by
high variability and that do not correlate well with abundance estimates derived from
direct sampling methods;
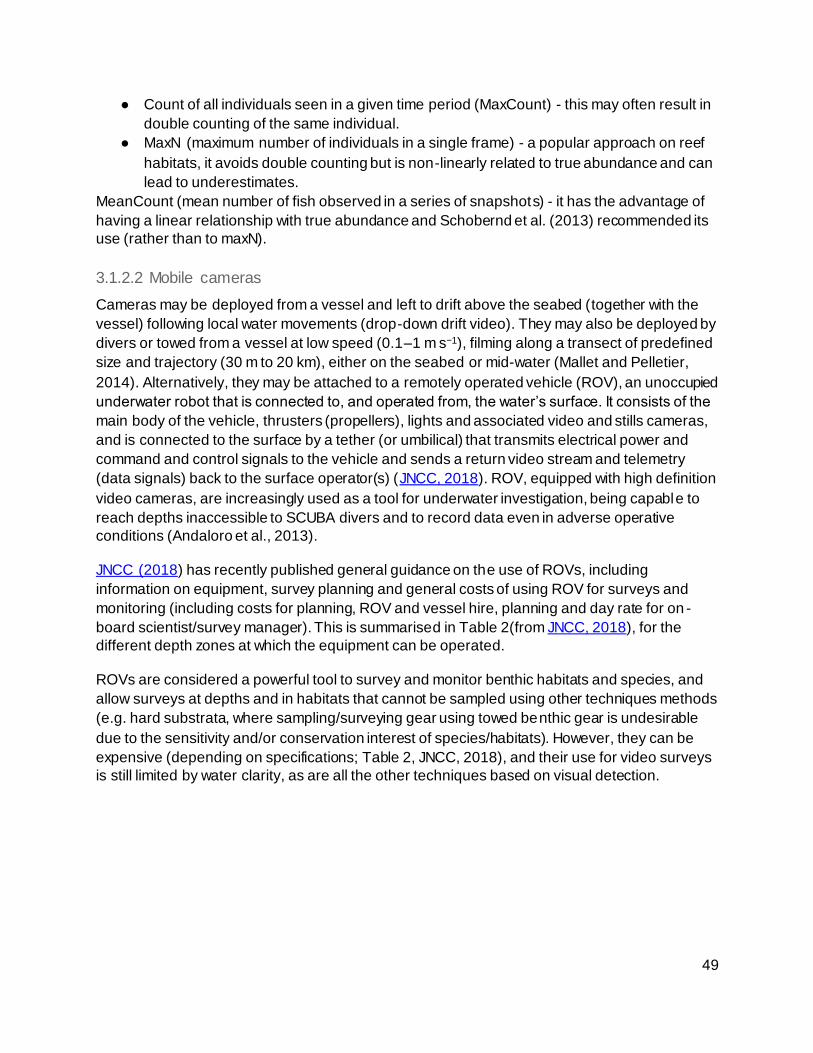
49
● Count of all individuals seen in a given time period (MaxCount) - this may often result in
double counting of the same individual.
● MaxN (maximum number of individuals in a single frame) - a popular approach on reef
habitats, it avoids double counting but is non-linearly related to true abundance and can
lead to underestimates.
MeanCount (mean number of fish observed in a series of snapshots) - it has the advantage of
having a linear relationship with true abundance and Schobernd et al. (2013) recommended its
use (rather than to maxN).
3.1.2.2 Mobile cameras
Cameras may be deployed from a vessel and left to drift above the seabed (together with the
vessel) following local water movements (drop-down drift video). They may also be deployed by
divers or towed from a vessel at low speed (0.1–1 m s−1), filming along a transect of predefined
size and trajectory (30 m to 20 km), either on the seabed or mid-water (Mallet and Pelletier,
2014). Alternatively, they may be attached to a remotely operated vehicle (ROV), an unoccupied
underwater robot that is connected to, and operated from, the water’s surface. It consists of the
main body of the vehicle, thrusters (propellers), lights and associated video and stills cameras,
and is connected to the surface by a tether (or umbilical) that transmits electrical power and
command and control signals to the vehicle and sends a return video stream and telemetry
(data signals) back to the surface operator(s) (JNCC, 2018). ROV, equipped with high definition
video cameras, are increasingly used as a tool for underwater investigation, being capable to
reach depths inaccessible to SCUBA divers and to record data even in adverse operative
conditions (Andaloro et al., 2013).
JNCC (2018) has recently published general guidance on the use of ROVs, including
information on equipment, survey planning and general costs of using ROV for surveys and
monitoring (including costs for planning, ROV and vessel hire, planning and day rate for on -
board scientist/survey manager). This is summarised in Table 2(from JNCC, 2018), for the
different depth zones at which the equipment can be operated.
ROVs are considered a powerful tool to survey and monitor benthic habitats and species, and
allow surveys at depths and in habitats that cannot be sampled using other techniques methods
(e.g. hard substrata, where sampling/surveying gear using towed benthic gear is undesirable
due to the sensitivity and/or conservation interest of species/habitats). However, they can be
expensive (depending on specifications; Table 2, JNCC, 2018), and their use for video surveys
is still limited by water clarity, as are all the other techniques based on visual detection.
50
Table 2. Overview of ROV use in four depth zones. From JNCC (2018; and references therein).
51
Although mobile cameras can be potentially used to monitor fish, their use for this purpose is
less effective, as they can cause behaviour changes in fish, leading to bias in abundance
estimates (Schobernd et al., 2013). Andaloro et al. (2013) compared the use of ROV and
underwater visual census to study marine fish communities at relatively shallow depths (up to
18 m, as dictated by limitations to diving surveys), and found that the ROV surveys failed to give
a truthful representation of the fish communities underestimating the number of species and
their abundances as compared to visual census. This was mainly due to an underestimation of
crypto-benthic species (i.e. benthic fish that are visually and/or behaviorally cryptic) and of
nekto-benthic species (i.e. fish feeding on sessile organisms), whereas the ROV proved to be a
suitable method to census low-mobile and abundant planktivorous species. However, the
authors recognised the value of ROVs to obtain complementary data particularly to survey
deeper areas offshore that are inaccessible to scuba divers (Andaloro et al., 2013).
Given the above, mobile video surveys are usually used to assess the seabed and epifaunal
features rather than for fish monitoring. As such they have not been considered further in this
assessment.
3.2 Acoustic detection
Acoustic methods use sound to detect fish, and are the only way to penetrate the aquatic
environment over great distances (Koslow, 2009; Martignac et al., 2015). Hydroacoustics,
acoustic cameras and acoustic telemetry are the methods most frequently employed to study
fish; the commentary below uses published reviews to summarise their potential efficacy as
monitoring tools for estuarine and coastal fish.
3.2.1 Hydroacoustics
Hydroacoustic methods (also known as sonar and echosounding/counting) use a transducer to
emit sound pulses in water. When a sound pulse hits an object, such as a fish, the reflected
signal is detected and displayed on an echogram (Martignac et al., 2015). Hydroacoustic
methods are widely used to monitor fish because they are remote (fish are not captured) and
can be both quantitative and rapid (Godlewska et al., 2004; Brehmer et al., 2006b, c; Koslow,
2009). Fish abundance and density can be estimated, including in dark or turbid environments,
but care must be taken when estimating body length (and biomass) as echo strength can be
influenced both by fish species and body orientation (aspect-tilt angle) (Misund, 1997; Martignac
et al., 2015).
Hydroacoustic methods can be employed in deep and shallow water, but using contrasting
techniques. Deep water is invariably surveyed vertically, whereas shallow water can usually be
surveyed only horizontally. In vertical surveys, a boat is used to survey an area, often along
predetermined transects. Vertical surveys are of most use for studying pelagic fish species, as
the presence of benthic species can be masked by echoes from the benthos (Lucas and Baras,
2000). Horizontal surveys can be either stationary (fixed location) or mobile, depending upon
the aims of the surveys and the characteristics of the sampling locations. In stationary surveys,
a transducer is deployed to survey across the water column in one location, whereas a boat is
52
used in mobile surveys to monitor the water column along a transect. Stationary surveys can be
particularly useful for monitoring temporal variations in fish movements, whereas mobile surveys
provide greater spatial coverage.
The capabilities of hydroacoustic methods are necessarily dependent upon their specific
features. Single-beam echosounders, for example, can be useful for counting fish, but body-
length estimates are only possible in vertical surveys, and fish orientation and the direction and
speed of movement are unknown (Lucas and Baras, 2000). By contrast, dual-beam
echosounders use fish orientation and distance from the transducer to estimate body length,
and split-beam echosounders can be used to track fish in three dimensions in ‘real-time’ (Lucas
and Baras, 2000; Martignac et al., 2015). More recently, multi-beam echosounders with wide
angles-of-detection have been developed, which may be useful for monitoring fish in shallow
water (Guillard, 1998; Brehmer et al., 2006b).
The most significant limitation of hydroacoustic methods is the difficulty of species identification
(Koslow, 2009; Martignac et al., 2015). Indeed, Horne (2000) concluded that species
identification is impossible using only hydroacoustic methods. Knowledge of species-specific
biology, ecology or behaviour, or of specific geographical areas, may allow indirect identification
of certain fish species, but it may be necessary to combine hydroacoustics with other methods
to differentiate between species of similar sizes and migration periods (Burwen et al., 2003;
Guillard and Colon, 2000; Brehmer et al., 2006a; Martignac et al., 2015). As with other acoustic
methods, a common problem with hydroacoustics is that of underwater noise. For example,
echoes of air bubbles (e.g. in the water column, zooplankton or algae) or debris could be
misinterpreted as fish, or fish echoes could be masked by signals from other objects (Maxwell
and Gove, 2004; Brehmer et al. 2006a). In addition, hydroacoustic methods invariably
underestimate the biomass of fish in shoals (Guillard et al., 2010). These factors may negatively
influence the confidence in the data obtained.
Samedy et al. (2015) found a highly significant correlation between the fish density estimates
obtained using traditional and hydroacoustic methods in the Gironde Estuary, France, and
Martignac et al. (2015) stated that hydroacoustics can provide qualitative (direction, speed,
activity rhythm, length) and quantitative (abundance or density estimates) assessments of most
migratory fish populations without greatly interfering with their behaviour. Thus, notwithstanding
the problems associated with species identification, hydroacoustic methods have the potential to
be used to monitor estuarine and coastal fish.
There appear to be no standardisation of operational procedures for the use of hydroacoustic
techniques in estuaries and coasts in the UK, but there are several for fresh waters (e.g.
Environment Agency, 2016a, b, c). Hydroacoustics can be used for scientific surveys, and is
also used by commercial fisheries to locate fish, which are then captured using nets. Some
studies have attempted to use hydroacoustic data from commercial fishing vessels for scientific
or management purposes (e.g. Brehmer et al., 2006c). The equipment needs to be calibrated to
calculate accuracy and precision (e.g. Foote et al., 2005; Demer et al., 2015), and, currently,
this method allows to obtain data over medium-large areas, whereas the technology is not yet
sufficiently advanced to permit microhabitats to be studied.
53
As mentioned before, hydroacoustics can be used to target demersal and pelagic roundfish, but
is most effective for pelagic roundfish. Fish of different type (marine, freshwater, migratory etc.)
can be assessed with this method, depending on where the monitoring is undertaken, including
juveniles and adults (small and large), while it is difficult to distinguish eggs and larvae from
other targets (e.g. zooplankton). As for observation techniques in general, used on its own, this
technique does not produce data other than fish abundance and density, possibly biomass and
length (e.g. data on diet, health state, contamination).
Hydroacoustics use is not restricted by the habitat, water visibility, or the nature of the
substratum, although it cannot/will struggle to detect fish in/very close to the substratum and
detection may be impaired in rocky areas. It can be undertaken in low or high energy areas,
although air bubbles can interfere with hydroacoustic methods in high-energy environments, or
in rough sea conditions (particularly when surveying in shallow waters). Hydroacoustic surveys
are normally carried out in subtidal environments, and they should be possible in most depths
via vertical surveys in deep water and horizontal surveys in shallow water .
The requirements for survey logistics and staffing are study-specific, but normally a power
supply is required and shore access, a boat, fixed structures and/or divers may also be
required. High skill/expertise/certification is required to skipper boats, with training in
hydroacoustics being required. No other restrictions apply to this method. The method is non -
invasive, although some species, especially clupeids, are sensitive to certain sound frequencies
(Dunning et al., 1992; Nestler et al., 1992; Gregory and Clabburn, 2003).
3.2.2 Acoustic cameras
Acoustic cameras are multibeam, high-frequency sonars designed to create high-resolution
images (Martignac et al., 2015). The main acoustic cameras currently used in fish monitoring
are dual-frequency identification sonar (DIDSON) and, more recently, adaptive-resolution
imaging sonar (ARIS). Both use higher frequencies and more sub-beams than more common
hydroacoustic methods, which improves image resolution and enables fish morphology and
behaviour to be observed, and can be operated in zero-visibility water (Martignac et al., 2015;
Egg et al., 2019). Long-range DIDSON cameras have a detection range of up to 33 m at high
frequency (1.2 MHz) and up to 80 m at low frequency (0.7 MHz) (Lilja and Orell, 2011, in
Martignac et al., 2015).
Acoustic cameras have the advantage over more traditional hydroacoustic methods in allowing
fish to be counted (Table 3; Martignac et al., 2015; Egg et al., 2019). Indeed, abundance
estimates using acoustic cameras can be similar to visual counts (Holmes et al. 2006), although
the former is invariably the most accurate when fish densities and passage rates are low,
especially in turbulent or turbid conditions, and vice-versa at high densities and migration rates
(when acoustic cameras can underestimate abundance due to fish shadows passing close to
the transducer) (Maxwell and Gove, 2004; Baumgartner et al., 2006). The DIDSON appears
unaffected by some of the problems associated with other hydroacoustic methods, such as
changes in aspect-tilt angle, remaining in the acoustic beam for long periods and moving
downstream (Maxwell and Gove, 2004). Acoustic cameras can be particularly useful for
54
counting migrating fish, such as diadromous species passing riverine structures, although it
should be noted that some species (e.g. twaite shad, Alosa fallax) appear to be sensitive to the
signal frequency used by the DIDSON (Gregory and Clabburn, 2003). For example, acoustic
cameras have been used in 2017 (in combination with acoustic tracking and eDNA analyses) to
monitor the migration of twaite shad (in the River Severn as part of the Unlocking the Severn
project research conducted by the Severn Rivers Trust, Environment Agency and Canal and
River Trust. Another advantage of acoustic cameras is that echoes from air bubbles or debris,
for example, can be identified and removed from the echogram, thereby facilitating analysis of
the target echoes. In addition, fish behaviour can be examined in detail and direc t
measurements of fish body length can be obtained (Table 3; Baumgartner et al., 2006;
Martignac et al., 2015). It should be noted, however, that although DIDSON estimates are
usually similar to known fish lengths when in high-frequency mode, larger differences can occur
when in low-frequency mode (Burwen et al., 2007; Lilja et al., 2010, in Martignac et al., 2015).
Most studies using DIDSON have focused on medium- or large-sized fish, but it is possible to
study animals as small as 2 cm (Kimball et al., 2010).
Although acoustic cameras produce ‘video-like’ images, fish species identification can
nonetheless be difficult or, indeed, impossible (Table 3; Guttormsen et al., 2010; Langkau et al.,
2012). This is particularly the case if multiple species of similar body size, morphology and
behaviour co-occur. As with more traditional hydroacoustic methods, knowledge of species-
specific biology, ecology or behaviour, or of specific geographical areas, may allow indirect
identification of certain fish species, but it may be necessary to combine acoustic cameras with
other methods if species identification is required. Even if species identification is possible,
processing acoustic camera footage is very time-intensive. There are options, such as
automated tracking, available in the DIDSON and ARIS software that are intended to minimise
data-processing time, but they are not useful in all situations and verification is required to
ensure that tracked objects are indeed fish and to check for aggregation behaviour; often all
fish, or an appropriate sub-sample, have to be manually counted and measured to ensure that
the data are accurate (Pavlov et al., 2009; Lilja et al., 2010, in Martignac et al., 2015). Another
limitation of acoustic cameras is that they operate in only two dimensions, so it is not possible to
obtain three-dimensional positional data (Martignac et al. 2015), and there are currently too
many potential sources of error to estimate biomass accurately (Hateley and Gregory, 2006).
Acoustic cameras are not currently as efficient as more traditional hydroacoustic methods in
deep water (Guttormsen et al., 2010), but can accurately and cost-effectively assess fish
abundance and behaviour in shallow water (Table 3; Martignac et al., 2015). Indeed, Martignac
et al. (2015) stated that acoustic camera technology appears to be the most efficient monitoring
method in estuaries up to 20 m wide. Thus, notwithstanding the problems associated with
species identification, acoustic cameras have the potential to be used to monitor estuarine and
coastal fish.
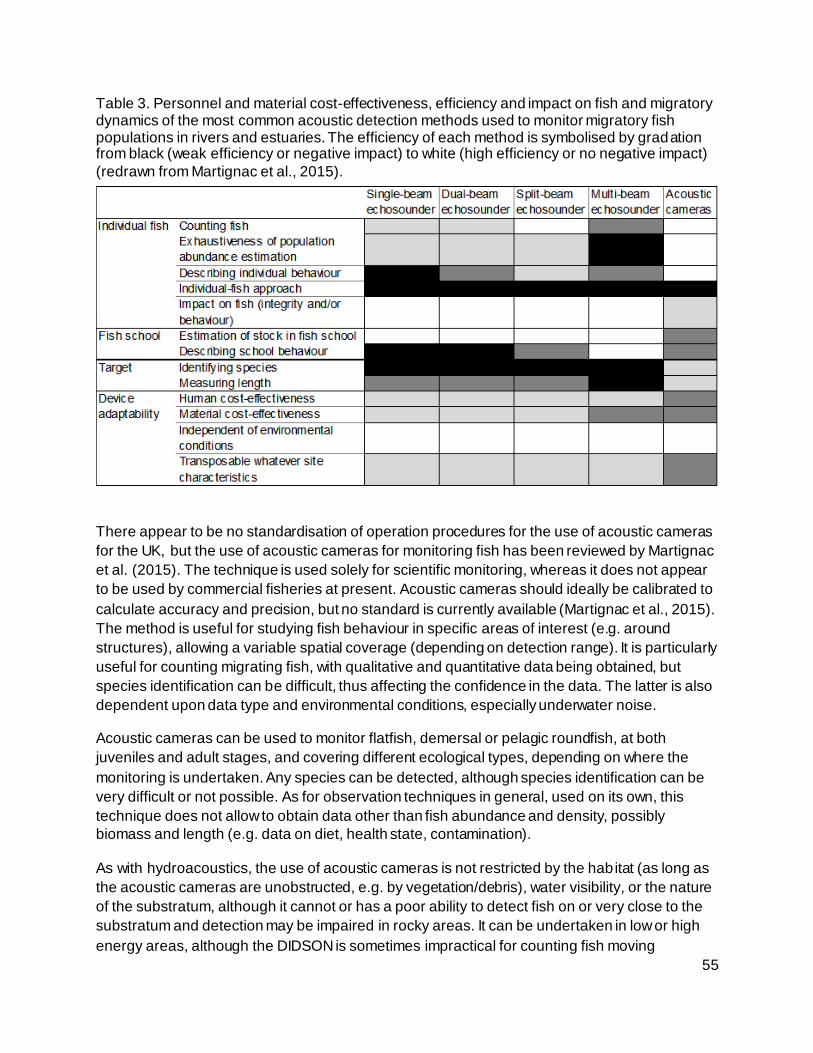
55
Table 3. Personnel and material cost-effectiveness, efficiency and impact on fish and migratory dynamics of the most common acoustic detection methods used to monitor migratory fish populations in rivers and estuaries. The efficiency of each method is symbolised by gradation from black (weak efficiency or negative impact) to white (high efficiency or no negative impact)
(redrawn from Martignac et al., 2015).
There appear to be no standardisation of operation procedures for the use of acoustic cameras
for the UK, but the use of acoustic cameras for monitoring fish has been reviewed by Martignac
et al. (2015). The technique is used solely for scientific monitoring, whereas it does not appear
to be used by commercial fisheries at present. Acoustic cameras should ideally be calibrated to
calculate accuracy and precision, but no standard is currently available (Martignac et al., 2015).
The method is useful for studying fish behaviour in specific areas of interest (e.g. around
structures), allowing a variable spatial coverage (depending on detection range). It is particularly
useful for counting migrating fish, with qualitative and quantitative data being obtained, but
species identification can be difficult, thus affecting the confidence in the data. The latter is also
dependent upon data type and environmental conditions, especially underwater noise.
Acoustic cameras can be used to monitor flatfish, demersal or pelagic roundfish, at both
juveniles and adult stages, and covering different ecological types, depending on where the
monitoring is undertaken. Any species can be detected, although species identification can be
very difficult or not possible. As for observation techniques in general, used on its own, this
technique does not allow to obtain data other than fish abundance and density, possibly
biomass and length (e.g. data on diet, health state, contamination).
As with hydroacoustics, the use of acoustic cameras is not restricted by the habitat (as long as
the acoustic cameras are unobstructed, e.g. by vegetation/debris), water visibility, or the nature
of the substratum, although it cannot or has a poor ability to detect fish on or very close to the
substratum and detection may be impaired in rocky areas. It can be undertaken in low or high
energy areas, although the DIDSON is sometimes impractical for counting fish moving
56
downstream (Hateley and Gregory, 2006). Hydroacoustic surveys are normally carried out in
subtidal environments, and should be possible in most depths, with the survey area being
restricted to by the camera detection range.
The requirements for survey logistics and staffing are study-specific, but normally a power
supply is required and shore access, a boat, fixed structures and/or divers may also be
required. High skill/expertise/certification is required to skipper boats, with training in acoustic
cameras being required. No other restrictions apply to this method. The method is non -invasive,
although some species, especially clupeids, are sensitive to certain sound frequencies,
including those used by the DIDSON (Dunning et al., 1992; Nestler et al., 1992; Gregory and
Clabburn, 2003).
3.2.3 Acoustic telemetry
Acoustic telemetry uses underwater receivers (hydrophones) to detect fish that have been
tagged with sound-emitting transmitters. Individual fish can be recognised by using transmitters
with a unique combination of frequency (usually 30–400 kHz) and pulse rate, or by using coded
signals (Thorstad et al., 2013). Acoustic telemetry is particularly useful for studying fish
distributions, migrations and behaviours, including in marine and estuarine environments, but
necessarily requires fish to be captured so that they can be tagged with a transmitter (Cooke et
al., 2011, 2013; Thorstad et al., 2013).
Tagged fish can be detected automatically (using stationary receivers) or manually (using
mobile receivers), but the receivers must be submerged in water and unobstructed (e.g. by
debris). Stationary receivers can be deployed on the seabed or in the water column at strategic
locations, in a grid or along transects (Heupel et al., 2006), and the data downloaded by cable
or bluetooth transfer at intervals or at the end of the study (Thorstad et al., 2013). The detection
ranges of acoustic transmitters can vary from tens of metres to a few kilometers, and depend
partly upon their signal strength (Pincock and Johnston, 2012). The strength of acoustic signals
is determined by the battery (and hence transmitter) size, with strong signals (and high pulse
rates and long-term studies) requiring large batteries (Thorstad et al., 2013). In addition, large
transmitters produce low-frequency sound, which penetrates greater distances underwater than
do higher frequencies (Pincock and Johnston, 2012). Transmitter size also determines the
minimum size of fish that can be tagged, as large transmitters are heavier and require more
space in the body cavity (for internal implantation) than smaller models (Cooke et al., 2011).
Battery life can range from weeks for small transmitters to several years for some larger models,
but can be modified by adjusting duty cycles and/or interpulse intervals (Thorstad et al., 2013).
As with other acoustic methods, the efficacy of telemetry is determined partly by the frequency
and magnitude of underwater noise. The detection ranges of acoustic receivers are likely to be
compromised by air bubbles in highly turbulent environments, for example, and in areas with
other sources of underwater noise (e.g. from waves, precipitation, sonars and engines)
(Thorstad et al., 2000; Pincock and Johnston, 2012). In addition, although acoustic telemetry
has been successfully used in marine environments, the detection ranges of the transmitters
decline with increasing salinity, and stratification of water with different salinities can reduce
57
detection ranges if transmitters and receivers are in different strata (Thorstad et al., 2013).
Acoustic telemetry cannot currently be used to quantify fish abundance, except as part of mark–
recapture studies, but rapid development of the technology (Cooke et al., 2013; Thorstad et al.,
2013; Donaldson et al., 2014; Crossin et al., 2017) and/or its combination with other methods is
likely to increase the scope for its use to monitor estuarine and coastal fish.
Reviews of fish telemetry methods, including acoustic telemetry, have been conducted by
Cooke et al. (2013), Thorstad et al. (2013), Donaldson et al. (2014) and Crossin et al. (2017).
The technique is used solely for scientific monitoring, but, as it requires the collection of live fish
for the implantation of the transmitter, any method (scientific or commercial) that captures live
fish in good condition is suitable. In the UK, tagging fish with acoustic transmitters is a ‘regulated
procedure’ under the Animals (Scientific Procedures) Act 1986, requiring procedure project
(PPL) and personal individual (PIL) licences from the Home Office. All regulated procedures
need to be approved by the nominated Home Office inspector and the Animal Welfare and
Ethical Review Body (AWERB) of the establishment licence holder. A review of surgical
implantation of electronic tags in fish has been conducted by Cooke et al. (2011).
A large spatial coverage is generally achieved by this monitoring method, and qualitative and
quantitative (e.g. presence of fish within the detection range of an acoustic receiver vs. positions
of individual fish within an array of acoustic receivers) can be obtained, depending on the
characteristics and locations of the acoustic receivers, the type of acoustic transmitter and the
environmental conditions, especially underwater noise. These factors also determine the
confidence in the data obtained.
Acoustic telemetry can be used to monitor flatfish, demersal or pelagic roundfish, covering
different ecological types, depending on where the monitoring is undertaken, and, practically,
any species that is sufficiently large to tag with an acoustic transmitter can be monitored, even
sensitive/fragile species, such as smelt (Moore et al., 2016) and shad (Bolland et al., 2019). The
size of the fish is species-dependent, but potentially includes juveniles and adults (small and
large) can be assessed. The minimum size of fish that can be tagged is determined by
transmitter size/weight. It is possible for fish to avoid detection for various reasons (e.g.
transmitter or receiver failure or loss, underwater noise, mortality).
The use of acoustic telemetry is not restricted by the habitat (as long as the receivers are
unobstructed, e.g. by vegetation/debris), water visibility, or the nature of the substratum,
although acoustic transmitters will not be detected if the signal is blocked by the substratum. It
can be undertaken in low or high energy areas, although underwater noise can reduce the
detection range of acoustic transmitters in high-energy environments. Acoustic telemetry should
work in most depths, as long as the receivers are submerged, although they are inefficient in
very shallow water (Cooke et al., 2013).
The requirements for survey logistics and staffing are study-specific, but shore access, a boat,
fixed structures and/or divers may also be required. Staffing required is partly dependent upon
fish-capture method, and high skill/expertise/certification is required to tag fish with acoustic
transmitters and to skipper boats (if required to capture fish or deploy acoustic receivers).
Licences/permits will be required to capture the fish, and procedure project (PPL) and personal
58
individual (PIL) licences will be required from the UK Home Office to tag the fish. Tagging fish
with acoustic transmitters is necessarily invasive, but it is not destructive to target species, as
only individuals in good condition should generally be tagged. It may be destructive to non -
target species or to habitats, but this depends on the fish-capture method more than on the
tagging itself.
3.3 Other observation techniques
Conventional (non-acoustic) tagging methods have been the most widely used tool for
elucidating fish movements in the last half century. The method of capture, mark and recapture
is well used in restricted water bodies, and it makes identification possible in studies of
migration, life-span and other aspects of autecology in groups of or individual fish and shellfish.
The marking/tagging may be done by fin-clipping, fin and opercular punching, branding with
heated pencils or cold objects, tattooing, subcutaneous injections (e.g. Panjet), vital stains or
internal and external tagging (e.g. using plastic streamer tags, PST) (Elliott and Hemingway,
2002).
Tagging studies (particularly those undertaken on a large scale or longer term) may rely on
fishers for the recapture and subsequent reporting of tagged fish. Such approach has been
used for example in the study of the reproduction migration of grey mullets (Liza ramada) and
flounders in the Loire estuary, France. Fish were anaesthetised and tagged with coloured plastic
T-bar tags fixed in the caudal muscle, and the fish were recaptured by fishermen, either in the
estuary, or in the sea where their spawning grounds are located (Sauriau et al., 1992).
Technological developments have greatly improved the process of fish tagging and reporting
with respect to automating the process of collecting, parsing, and transmitting data without
requiring user supervision. For example, the Olin College Intelligent Vehicles Lab, in partnership
with the Large Pelagics Research Center, Massachusets, have developed a platform called HI
(Hawaii) Tag that incorporates radio frequency identification (RFID) technology with the
widespread popularity of mobile applications. Streamer tags are equipped with a RFID chip,
and, on fish recapture, the tag can be scanned with a compatible RFID reader, with the data
being transmitted to a smartphone application through which the tag ID and additional data (e.g.
photo of the fish, record of the body length, additional notes) are recorded and uploaded
automatically on to the Pacific Islands Fisheries Group database (Bennett et al., 2016).
4. DNA-based methods
This review of DNA techniques and their possibilities for use in environmental monitoring for fish
in coastal and near-shore waters is designed to give a succinct overview of the subject rather
than an in-depth description of the techniques. An advanced technical summary is given by
Hänfling et al. (2017).
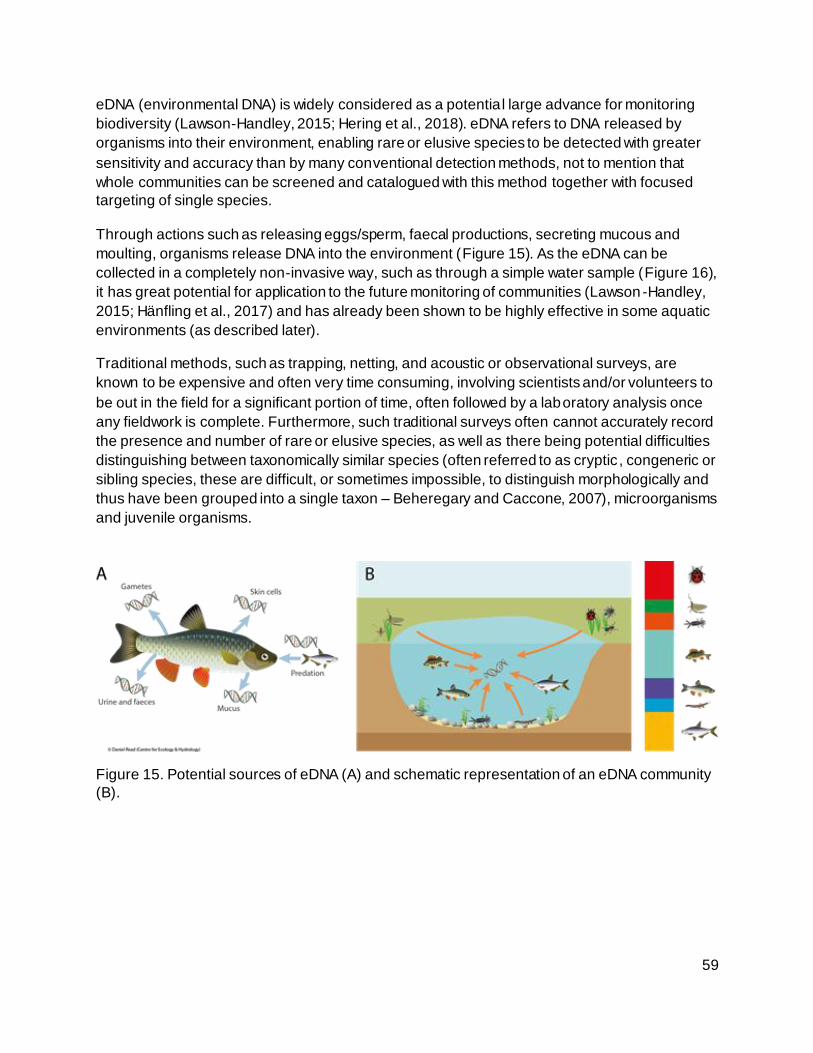
59
eDNA (environmental DNA) is widely considered as a potential large advance for monitoring
biodiversity (Lawson-Handley, 2015; Hering et al., 2018). eDNA refers to DNA released by
organisms into their environment, enabling rare or elusive species to be detected with greater
sensitivity and accuracy than by many conventional detection methods, not to mention that
whole communities can be screened and catalogued with this method together with focused
targeting of single species.
Through actions such as releasing eggs/sperm, faecal productions, secreting mucous and
moulting, organisms release DNA into the environment (Figure 15). As the eDNA can be
collected in a completely non-invasive way, such as through a simple water sample (Figure 16),
it has great potential for application to the future monitoring of communities (Lawson-Handley,
2015; Hänfling et al., 2017) and has already been shown to be highly effective in some aquatic
environments (as described later).
Traditional methods, such as trapping, netting, and acoustic or observational surveys, are
known to be expensive and often very time consuming, involving scientists and/or volunteers to
be out in the field for a significant portion of time, often followed by a laboratory analysis once
any fieldwork is complete. Furthermore, such traditional surveys often cannot accurately record
the presence and number of rare or elusive species, as well as there being potential difficulties
distinguishing between taxonomically similar species (often referred to as cryptic, congeneric or
sibling species, these are difficult, or sometimes impossible, to distinguish morphologically and
thus have been grouped into a single taxon – Beheregary and Caccone, 2007), microorganisms
and juvenile organisms.
Figure 15. Potential sources of eDNA (A) and schematic representation of an eDNA community
(B).
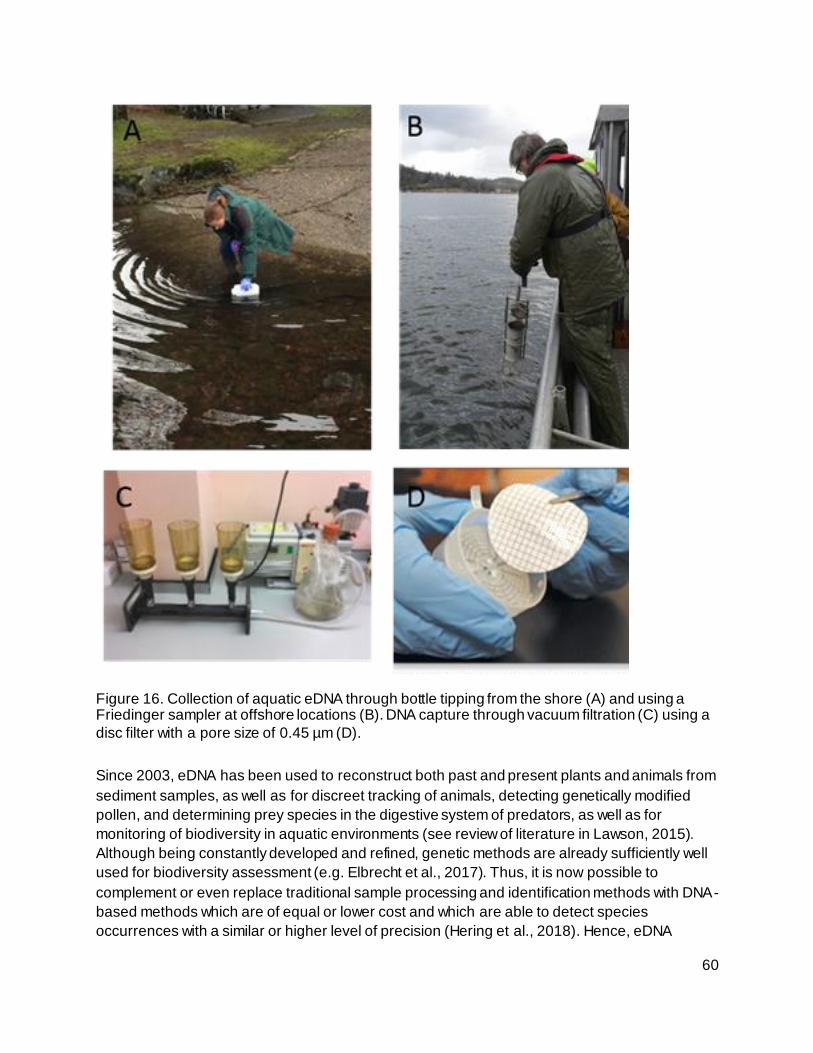
60
Figure 16. Collection of aquatic eDNA through bottle tipping from the shore (A) and using a Friedinger sampler at offshore locations (B). DNA capture through vacuum filtration (C) using a
disc filter with a pore size of 0.45 µm (D).
Since 2003, eDNA has been used to reconstruct both past and present plants and animals from
sediment samples, as well as for discreet tracking of animals, detecting genetically modified
pollen, and determining prey species in the digestive system of predators, as well as for
monitoring of biodiversity in aquatic environments (see review of literature in Lawson, 2015).
Although being constantly developed and refined, genetic methods are already sufficiently well
used for biodiversity assessment (e.g. Elbrecht et al., 2017). Thus, it is now possible to
complement or even replace traditional sample processing and identification methods with DNA-
based methods which are of equal or lower cost and which are able to detect species
occurrences with a similar or higher level of precision (Hering et al., 2018). Hence, eDNA
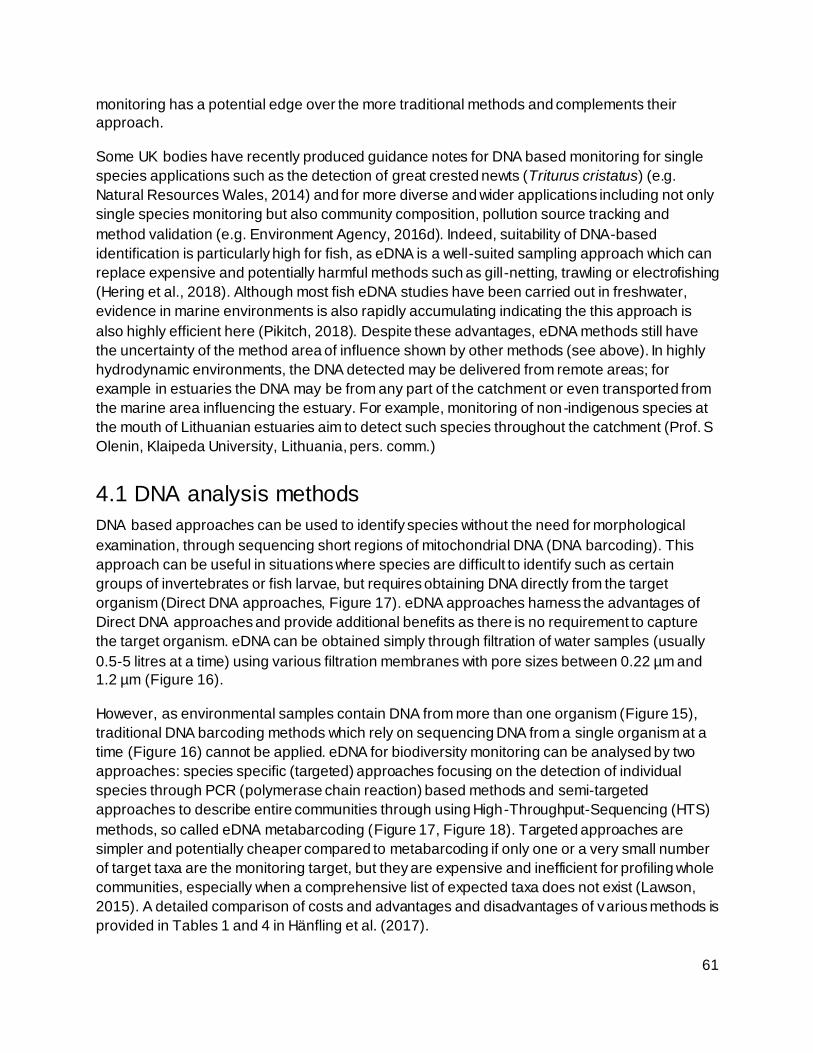
61
monitoring has a potential edge over the more traditional methods and complements their
approach.
Some UK bodies have recently produced guidance notes for DNA based monitoring for single
species applications such as the detection of great crested newts (Triturus cristatus) (e.g.
Natural Resources Wales, 2014) and for more diverse and wider applications including not only
single species monitoring but also community composition, pollution source tracking and
method validation (e.g. Environment Agency, 2016d). Indeed, suitability of DNA-based
identification is particularly high for fish, as eDNA is a well-suited sampling approach which can
replace expensive and potentially harmful methods such as gill-netting, trawling or electrofishing
(Hering et al., 2018). Although most fish eDNA studies have been carried out in freshwater,
evidence in marine environments is also rapidly accumulating indicating the this approach is
also highly efficient here (Pikitch, 2018). Despite these advantages, eDNA methods still have
the uncertainty of the method area of influence shown by other methods (see above). In highly
hydrodynamic environments, the DNA detected may be delivered from remote areas; for
example in estuaries the DNA may be from any part of the catchment or even transported from
the marine area influencing the estuary. For example, monitoring of non-indigenous species at
the mouth of Lithuanian estuaries aim to detect such species throughout the catchment (Prof. S
Olenin, Klaipeda University, Lithuania, pers. comm.)
4.1 DNA analysis methods
DNA based approaches can be used to identify species without the need for morphological
examination, through sequencing short regions of mitochondrial DNA (DNA barcoding). This
approach can be useful in situations where species are difficult to identify such as certain
groups of invertebrates or fish larvae, but requires obtaining DNA directly from the target
organism (Direct DNA approaches, Figure 17). eDNA approaches harness the advantages of
Direct DNA approaches and provide additional benefits as there is no requirement to capture
the target organism. eDNA can be obtained simply through filtration of water samples (usually
0.5-5 litres at a time) using various filtration membranes with pore sizes between 0.22 µm and
1.2 µm (Figure 16).
However, as environmental samples contain DNA from more than one organism (Figure 15),
traditional DNA barcoding methods which rely on sequencing DNA from a single organism at a
time (Figure 16) cannot be applied. eDNA for biodiversity monitoring can be analysed by two
approaches: species specific (targeted) approaches focusing on the detection of individual
species through PCR (polymerase chain reaction) based methods and semi-targeted
approaches to describe entire communities through using High-Throughput-Sequencing (HTS)
methods, so called eDNA metabarcoding (Figure 17, Figure 18). Targeted approaches are
simpler and potentially cheaper compared to metabarcoding if only one or a very small number
of target taxa are the monitoring target, but they are expensive and inefficient for profiling whole
communities, especially when a comprehensive list of expected taxa does not exist (Lawson,
2015). A detailed comparison of costs and advantages and disadvantages of various methods is
provided in Tables 1 and 4 in Hänfling et al. (2017).
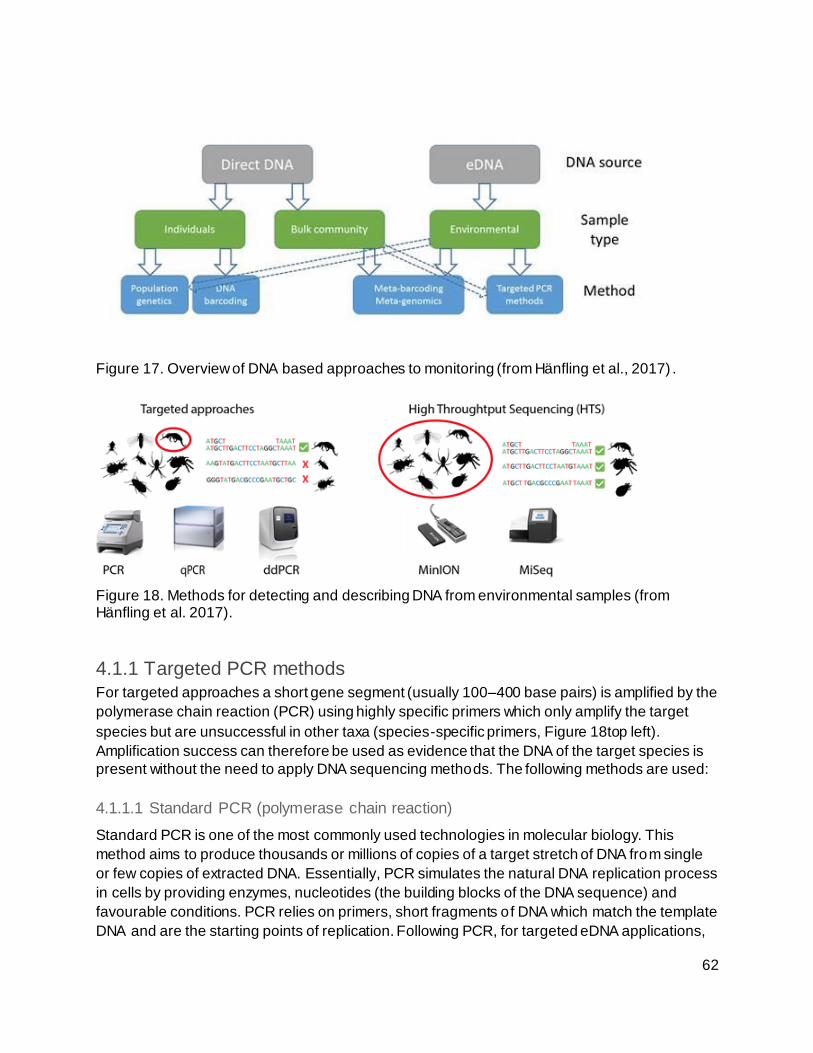
62
Figure 17. Overview of DNA based approaches to monitoring (from Hänfling et al., 2017) .
Figure 18. Methods for detecting and describing DNA from environmental samples (from Hänfling et al. 2017).
4.1.1 Targeted PCR methods For targeted approaches a short gene segment (usually 100–400 base pairs) is amplified by the
polymerase chain reaction (PCR) using highly specific primers which only amplify the target
species but are unsuccessful in other taxa (species-specific primers, Figure 18top left).
Amplification success can therefore be used as evidence that the DNA of the target species is
present without the need to apply DNA sequencing methods. The following methods are used:
4.1.1.1 Standard PCR (polymerase chain reaction)
Standard PCR is one of the most commonly used technologies in molecular biology. This
method aims to produce thousands or millions of copies of a target stretch of DNA from single
or few copies of extracted DNA. Essentially, PCR simulates the natural DNA replication process
in cells by providing enzymes, nucleotides (the building blocks of the DNA sequence) and
favourable conditions. PCR relies on primers, short fragments of DNA which match the template
DNA and are the starting points of replication. Following PCR, for targeted eDNA applications,
63
PCR products are typically visualised via agarose gel electrophoresis and fluorescent staining.
The presence of a correctly-sized band on a gel indicates a positive detection of the target
species. However, the brightness of the band is not a reliable indicator of the initial target
template concentration and therefore standard PCR is not suitable for quantitative estimates. A
further disadvantage is that, although standard PCR itself is sensitive, standard gel
electrophoresis is not. Therefore amplified copies of the target may be present in the PCR
product but not at sufficient concentration to visualise on a gel (Hänfling et al., 2017).
4.1.1.2 qPCR (quantitative PCR) / RT-PCR (realtime PCR)
Quantitative PCR works on the same principle as standard PCR, but additionally monitors the
number of copies of the target region after each cycle of amplification rather than at the end of
the reaction as in standard PCR. qPCR also allows for the detection of target DNA
concentration in a sample, with no need for gel electrophoresis. It is more sensitive than
standard PCR as a DNA signal can be detected from a very low starting copy number. qPCR is
also useful for eDNA studies as it can determine the absolute concentration of DNA in the
sample, and is therefore potentially useful for estimating species abundance (albeit there are
limitations to this; see section 4.3.2). There are two possible approaches for monitoring the
concentration of DNA during qPCR. The first uses non-specific intercalating fluorescent dyes
(e.g SYBR Green, EVA Green etc), which bind to any double stranded DNA present in the
reaction. The second uses fluorescently-labelled oligonucleotide probes that bind to the target
sequence only (e.g TaqMan Minor Groove Binder, MGB) (Hänfling et al., 2017). One of the
main advantages of qPCR is that its greater sensitivity means that very low DNA concentrations
can be detected and, by definition, the number of copies of target DNA that are present can be
quantified. This can then be translated into estimates of relative abundance (Lawson, 2015; see
also section 4.3.2).
4.1.1.3 ddPCR (droplet digital PCR)
Droplet digital PCR (ddPCR) is a relatively new method based on microfluidics, which could
potentially provide a much more cost-effective but equally accurate means of estimating eDNA
concentration. ddPCR involves random partitioning of target DNA into several thousand
individual droplets which are then amplified by PCR. Random sampling means that droplets can
contain target or background DNA or both.
4.1.2 High-throughput sequencing
Whilst species-specific PCR-based assays (as described above) have the advantage of relative
simplicity and sensitivity, they need to use a separate validated assay for each species of
interest. This makes the profiling of the composition of complex communities using this
approach unsustainable, both financially and in terms of labour. Community-based genetic
monitoring approaches are instead based on using high-throughput sequencing (HTS) allowing
the generation of millions of sequence reads in a single sequencing run. This high sequencing
depth allows the parallel sequencing of both many different sequences, representing the
diversity of organisms in a sample, and multiple samples, simultaneously. The resulting large
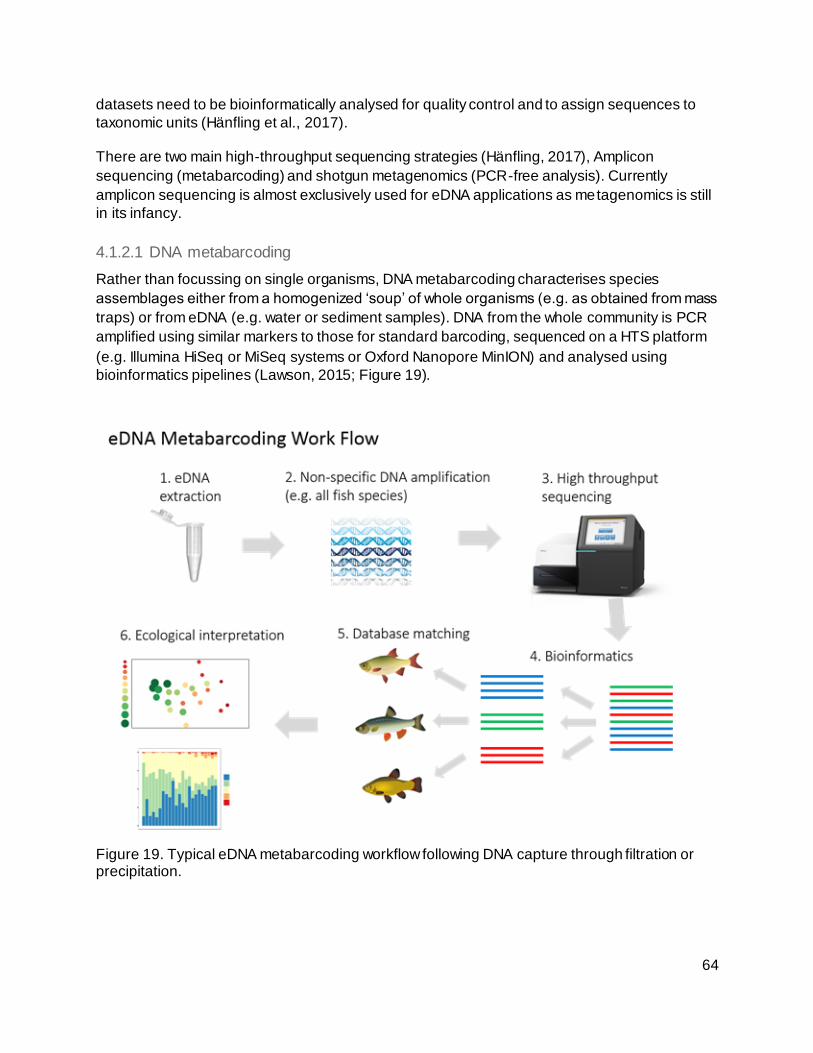
64
datasets need to be bioinformatically analysed for quality control and to assign sequences to
taxonomic units (Hänfling et al., 2017).
There are two main high-throughput sequencing strategies (Hänfling, 2017), Amplicon
sequencing (metabarcoding) and shotgun metagenomics (PCR-free analysis). Currently
amplicon sequencing is almost exclusively used for eDNA applications as metagenomics is still
in its infancy.
4.1.2.1 DNA metabarcoding
Rather than focussing on single organisms, DNA metabarcoding characterises species
assemblages either from a homogenized ‘soup’ of whole organisms (e.g. as obtained from mass
traps) or from eDNA (e.g. water or sediment samples). DNA from the whole community is PCR
amplified using similar markers to those for standard barcoding, sequenced on a HTS platform
(e.g. Illumina HiSeq or MiSeq systems or Oxford Nanopore MinION) and analysed using
bioinformatics pipelines (Lawson, 2015; Figure 19).
Figure 19. Typical eDNA metabarcoding workflow following DNA capture through filtration or precipitation.
65
In such analysis, probably the most critical consideration is choosing the most appropriate
primer (Figure 19, step 2). The primer determines the DNA marker used for identification and its
length. This in turn influences the taxonomic resolution achievable and the extent to which
species level identifications can be made. Primer choice also affects the specificity of the
analysis. Sometimes primers can be designed so that they amplify only a very specific
organismal group (e.g. the 12S primers for fish). In other cases, primers general ly sufficient to
capture the whole group will inevitably amplify non-target taxa as well (e.g. the primers designed
to amplify benthic invertebrates consistently amplify a wide range of non-metazoan taxa when
used on environmental samples) (Hering et al., 2018).
4.1.2.2 PCR-free analysis (metagenomics)
The alternative to metabarcoding where the DNA community is enriched with the target DNA
fragments through PCR amplification is to use so-called metagenomic sequencing. Such an
approach involves that all DNA fragments (not only barcodes) from all organisms including
bacteria and fungi are being sequenced. Theoretically this has the advantage that no a priori
knowledge of the community analysed is necessary and potential biases which can arise
through PCR are avoided. However the volume of data that is required is orders of magnitude
higher resulting in substantially higher costs and significant challenges dur ing the bioinformatics.
Due to these disadvantages, metagenomic analysis is far from becoming a routine method but
is a likely development as technologies and analytical approaches mature (Hänfling et al.,
2017).
4.2 Strengths and disadvantages of DNA-based methods
4.2.1 Feasibility and costs
A clear strong-point of the eDNA approach is the ease of sampling compared to traditional methods. This provides the opportunity for upscaling the sampling effort and to incorporate robust technical and biologically meaningful spatial and temporal replication into monitoring programmes (Hering et al., 2018). This is difficult to achieve with time and cost intensive methods such as netting and trawling surveys. As water collection and even DNA capture through filtration is relatively straightforward it can also be carried out by non-experts such as volunteers, commercial seafarers, etc. For example, an experiment in 2014 using volunteers to collect water samples to look for the presence of great crested newt DNA gave comparable results to labour intensive traditional searching and trapping methods (Briggs et al., 2014). It is even possible to automate eDNA collection so that regular samples could be taken from remote locations using deployable stationary devices or a large geographic area could be covered through samplers attached to marine vessels as has been achieved using the Continuous Plankton Recorder (CPR). A large-volume eDNA sampler has been recently piloted in the SW of England for the monitoring of inshore fish communities NECR287: Mynott S., 2020.This consists of a battery operated, self-contained, and programmable sampler that is deployed on the seabed, thus remotely collecting bottom water (where a higher concentration of eDNA is likely to be present compared to the water column, e.g. due to precipitation) and filtering it in situ. This allows the filtration of large volumes of water over time, thus likely increasing the chances of obtaining more diverse e-DNA in the sample. These operational advantages suggest that eDNA-based assessment of an aquatic vertebrate community is therefore generally cheaper
66
than alternative approaches, despite the often considerable laboratory costs (Hering et al., 2018; Pikitch, 2018).
4.2.2 Does the presence of eDNA equate to the presence of the organism
in that environment?
In the production of taxon lists for monitoring (both from traditional survey and DNA-based
techniques), two types of error can occur: (1) false negatives, where a taxon is recorded as
absent but is present, and (2) false positives, where a taxon is recorded as present but is
absent. It is therefore important to evaluate the sensitivity of new methods regarding these types
of error.
Detectability of eDNA is dependent on the amount of DNA released into the environment, and
there are many factors which can influence this, such as moulting, gamete release, faecal
production, population density, whether an animal resides in that environment or is just passing
through, and so forth (Pilliod et al., 2014), as well as factors such as the rate of DNA
degradation, flushing time of e.g. aquatic systems, water currents and flows, sunlight exposure ,
temperature and salinity (Barnes et al., 2014). In freshwater aquatic systems degradation rates
are variable, but the eDNA is thought to persist at most only for two weeks (Barnes et al., 2014)
and in seawater DNA fragments degrade from being detectable in a much shorter time (0.9 to
6.7 days; Thomsen et al., 2012). Hence, especially in the case of a saline environment the rapid
rate of degradation means that any detections found are likely to represent a real current -time
occurrence of that organism in that environment. Given that the flushing time of estuaries may
be days to weeks, the tidal excursion may cover large distances and the inputs from the
catchment may also be rapid under spate conditions then eDNA detected could be from
considerable distances from the sampling point. However, in soils and other sediments
(including aquatic sediments), DNA can persist over longer timescales and will therefore reflect
both past and present biota. The use of sediment either intentionally or accidentally can
therefore potentially increase the occurrence of false positive records.
As eDNA is an extremely sensitive method, there is the potential that even small amounts of
contamination through DNA from outside the sampling area could be detected and result in a
false positive. For example, Hänfling et al. (2016) detected European smelt (Osmerus
eperlanus) and European flounder (Platichthys flesus) DNA in the lake of Windermere, where
they have not previously been recorded. Both species are marine/estuarine residents and the
result may be due to DNA contamination in the environment caused by the use of these species
as bait for catching predatory pike (Esox lucius) although flounder is known to migrate into
freshwaters (Elliott and Hemingway, 2002). Also, given the clear mobility of avifauna between
water courses, and indeed between entire catchments, and through actions such as the
deposition of their faeces (which contains DNA from their prey items), ‘location fixation’ of an
eDNA signal may be incorrect. Laboratory procedures are also sensitive to cross-contamination
but this can be controlled and monitored through stringent procedures.
Despite the potential for DNA transport away from the source, recent studies have
demonstrated that eDNA provides a good spatial resolution of species distribution even in large
67
water bodies with substantial water movement such as oceans. For example, Port et al. (2016)
found that the results from eDNA surveys in a coastal ecosystem in Monterey Bay, California,
were agreed with visual surveys and were able to distinguish the composition of communities
which were separated by as little as 60 m.
Importantly, direct comparisons between detection rates from eDNA surveys and morpho-
taxonomic methods such as netting or diving surveys have consistently found a higher likelihood
of detection and therefore lower false negative rate for eDNA methods (Darling and Mahon,
2011; Deiner et al., 2017; Hering et al., 2018). In many cases a single eDNA survey was able to
create species lists which were as comprehensive as long-term survey projects. For example an
eDNA study carried out in Windermere in 2015 over two days recovered all 14 teleost species
which had been previously been recorded during 50 years of monitoring. In comparison a
parallel gill netting survey found only the 5 most common large species (Hänfling et al., 2016).
Such high sensitivity has also been achieved in the marine environment where Yamamoto et al.
(2017) detected 40% more fish species in a single day of eDNA sampling than a 14 years of
visual surveys. The pilot study recently carried out in the SW of England to validate an eDNA
sampler for monitoring inshore fish communities has also shown a high ability of the method in
detecting fish species compared to available data, with 74 fish species detected with eDNA
compared to 26 species from landing data (NECR287: Mynott S., 2020). Other examples where
eDNA outperformed traditional methods to detect marine species include the endangered
tidewater goby (Eucyclogobius newberryi) along 400 km of shoreline in California and Oregon,
USA and the detection of the elusive Octopus vulgaris in the Cantabrian sea.
4.2.3 Can eDNA provide quantitative information?
A central question for the application of eDNA methods for biomonitoring is whether the method
accurately represents the true diversity not only qualitatively but also quantitatively, i.e. can
eDNA data be used to estimate abundance or biomass of species? This is a critical factor for
managers wishing to monitor stock size, or rare species and quantitative information is often
required for current statutory monitoring tools. As qPCR can accurately estimate the number of
molecules in a DNA template (i.e. the DNA extracted from the environmental sample), the
method could potentially provide quantitative information if the DNA extracted from the
environmental sample is correlated with the abundance of the organism. A number of studies
have shown that such a positive (but non-linear) relationship between eDNA concentration and
animal biomass can indeed be found under certain circumstances, especially under controlled
experimental conditions (see review in Lawson, 2015). However, as DNA shedding and
degradation rates are to a certain degree environmentally dependent, correlations are often
weak (e.g. Harper et al., 2018). Seasonal variation in activity and behaviour can also affect DNA
release into the water. For example, during mass spawning of e.g. fish, polychaete worms or
corals, the amount of DNA in the environment does not at all reflect the adult population. Hence
the timing of sampling for eDNA must take into account the ecology and life cycles of the target
organisms before quantitative inferences can be made. Obtaining fully quantitative information
from eDNA metabarcoding is more complex and requires the application of rigorous
standardisation procedures throughout the workflow. However, recent studies (see Hering et al.,
2018 for a review) have clearly demonstrated a link between the initial amount of DNA and the
68
number of reads, opening the possibility of estimating relative abundances of target taxa from
high-throughput sequences of eDNA samples. For example, two studies have demonstrated a
clear correlation between biomass and the number of sequence reads/species (Brys et al.,
2017; Li et al., 2018). Furthermore, eDNA abundance has been shown to be a reliable indicator
of relative abundance in lake fish communities (Hänfling et al., 2016; Lawson-Handley, 2018; Li
et al, in press), although this is a closed population, and there are attempts to replace absolute
by relative abundance in metric calculations (Hering et al. 2018).
Using eDNA results in correspondence with statistical modelling techniques may, in the
meantime, be a possible solution in estimating abundance. Calculating ‘site occupancy’ is one
technique suggested. This is the proportion of an area occupied by the species in question.
Although different from a traditional abundance measure, the two measures are positively
correlated and it is often considered as a proxy for abundance (MacKenzie and Nichols, 2004).
Hänfling et al. (2016) used a simple measure of site occupancy (the relative frequency of
occurrence of the sequence reads of a species across the sampling sites) and Pilliod et al.
(2013) acknowledged that eDNA methods can be used for estimating species occupancy,
adjusted for imperfect detection, across a landscape. However the use of site occupancy to
obtain quantitative estimates of species abundance is not an established approach, and full site
occupancy modelling so far has mostly been used to estimate detection probability of eDNA
essays (by relating eDNA-based estimates of species occupancy and abundance with estimates
derived from traditional field sampling methods; e.g. Pilliod et al., 2013; Valentini et al., 2015;
Wilcox et al., 2016).
4.2.4 DNA techniques for environmental monitoring
The low relative cost of DNA analysis methods, albeit relying on high capital equipment costs,
and the easy sample collection give the potential for long-term environmental monitoring,
instead of having to regularly send out teams of field assistants and scientists which could be
cost-prohibitive or lead to a shorter monitoring duration. However, cost-effectiveness is not only
defined by the monetary cost of sample collection and processing but includes factors such as
cost and availability of facilities, staff training and the processing speed, sensitivity and
precision. Hence DNA-based approaches could provide an advantage over traditional survey
methods via low processing costs and rapid sample throughput, potentially enabling increased
sampling frequency, increasing precision of assessments and enabling more responsive and
feedback monitoring of environmental events (Hering et al., 2018).
Implementation of DNA-based identification is being considered as a way of complementing and
even possibly replacing some traditional methods for assessing ecological status under the EU
Water Framework Directive (WFD), including in transitional and coastal waters (Hering et al.,
2018). Under the WFD, the same conceptual framework for assessment applies to all EU
Member States and although the implementation can differ between states, the basic framework
is to sample or survey under EU standard and intercalibrated methods, produce lists of taxa
present and where possible estimates of abundance to compute assessment metrics. However,
as explained earlier, there is limited capability for the determination of species abundance,
which is a prerequisite for many of the five biological quality elements assessed for the WFD,
69
including fish in transitional waters. Therefore new metrics and approaches are currently being
developed and tested by SEPA (Sottish Environmental Protection Agency) and the final
protocols may include the use of eDNA to provide more accurate and meaningful species
distribution list in combination with relative abundance.
It is also of note, for all monitoring purposes, that reference barcodes are not yet available for a
considerable - although decreasing - proportion of species (Hering et al., 2018), which means
monitoring and analysis may miss some species. This is however less a problem for fish where
the database for most regional faunas is almost complete and a number of ongoing projects
focus on closing the remaining gaps. For example, for the recent pilot study carried out in the
SW of England to validate an eDNA sampler for monitoring inshore fish communities
(NECR287: Mynott S., 2020). The fish eDNA database was built using all available 12S and
CytB sequences from Genbank for Actinopterygii and Chondrichthyes. Using both barcode
genes contributed significantly to the total list of fishes that could be identified, which included
protected species as per the UKBAP species list, while also allowing the capacity to detect not
only known UK species but also novel discovery of potential introduced non-native species
(Sebastian Mynott, Applied Genomic, pers. comm.)A potential large disadvantage in monitoring
is that eDNA by definition only contains genetic information, hence it is impossible to determine
the age structure of a population or other ecological functional attributes from eDNA analysis.
The nature of eDNA as pool of DNA from many species and individuals precludes the possibility
to reconstruct full genomes of individuals or even multi-locus genotypes. Therefore the
identification of hybrids or levels of ploidy is beyond the remit of eDNA analysis. However allele
frequencies of individual genes can potentially be estimated which raises the possibility to
obtain population genetic information such as effective population size and estimates of
migration (Sigsgaard et al., 2016). Equally sex ratios could be estimated from eDNA if a sex
linked genetic marker exists although this has not yet been attempted. Other important
ecological information could potentially also been inferred from eDNA. For example Bylemans et
al. (2017) suggested that fish spawning events are characterized by a change in the ratio
between nuclear and mitochondrial eDNA which can be used to monitor spawning activity.
Another factor to be aware of is that in the production of taxon lists (both from traditional survey
and DNA-based techniques), false negatives and false positives may occur, as mentioned
before, and misidentifications comprise both types of error (the correct species is falsely
recorded as absent, whilst the incorrect species is falsely recorded as present; see the above
example for European smelt and European flounder, Hänfling et al., 2016).
An advantage is that compared to visual identification of species which may need to be done
under a microscope (e.g. for some fish larvae) and which may be difficult to determine between
similar species, the processing speed of DNA analysis is a distinct advantage.
Validation of eDNA results is also something that needs to be standardised if the tool is to be
used for biodiversity and environmental monitoring. Standardised quality control and processing
measures need to be adopted on a nationwide (or preferably global) scale. Furthermore it has
been recommended in Lawson (2015) that, for work of a legally sensitive nature, similar
procedures as used for ancient DNA are adopted, involving specialised containment facilities to
prevent contamination as well as strict sterile handling and processing techniques throughout
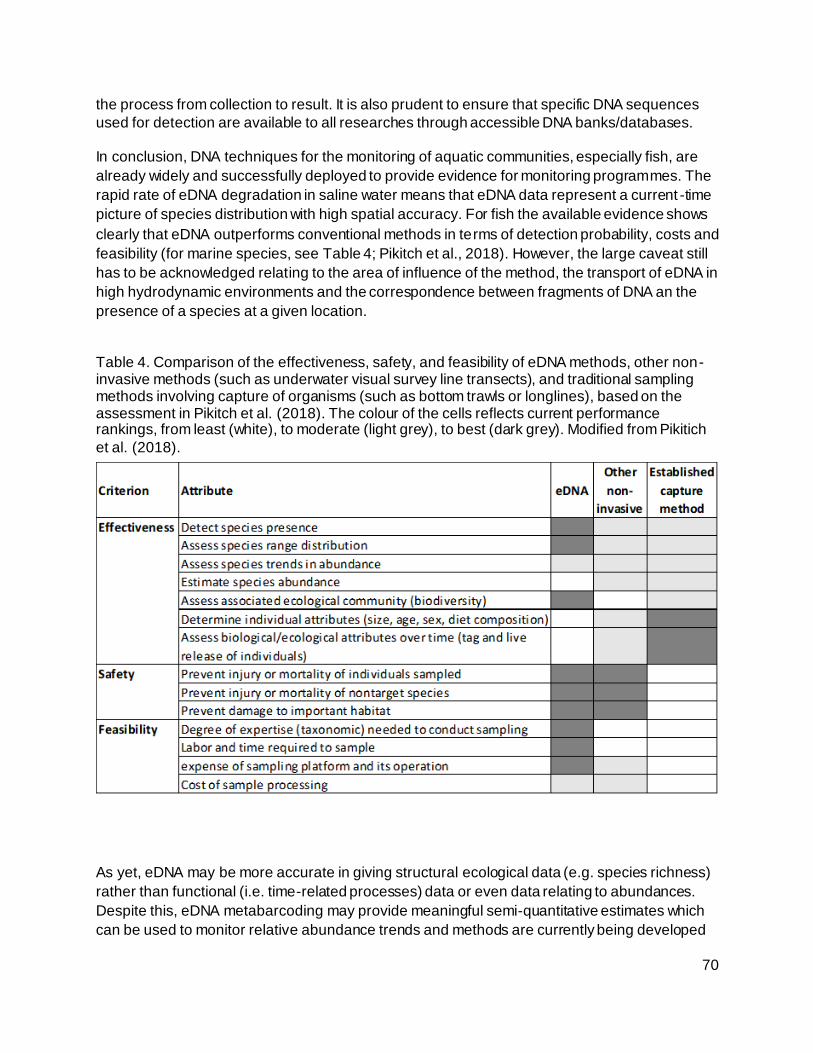
70
the process from collection to result. It is also prudent to ensure that specific DNA sequences
used for detection are available to all researches through accessible DNA banks/databases.
In conclusion, DNA techniques for the monitoring of aquatic communities, especially fish, are
already widely and successfully deployed to provide evidence for monitoring programmes. The
rapid rate of eDNA degradation in saline water means that eDNA data represent a current -time
picture of species distribution with high spatial accuracy. For fish the available evidence shows
clearly that eDNA outperforms conventional methods in terms of detection probability, costs and
feasibility (for marine species, see Table 4; Pikitch et al., 2018). However, the large caveat still
has to be acknowledged relating to the area of influence of the method, the transport of eDNA in
high hydrodynamic environments and the correspondence between fragments of DNA an the
presence of a species at a given location.
Table 4. Comparison of the effectiveness, safety, and feasibility of eDNA methods, other non-invasive methods (such as underwater visual survey line transects), and traditional sampling methods involving capture of organisms (such as bottom trawls or longlines), based on the assessment in Pikitch et al. (2018). The colour of the cells reflects current performance rankings, from least (white), to moderate (light grey), to best (dark grey). Modified from Pikitich
et al. (2018).
As yet, eDNA may be more accurate in giving structural ecological data (e.g. species richness)
rather than functional (i.e. time-related processes) data or even data relating to abundances.
Despite this, eDNA metabarcoding may provide meaningful semi-quantitative estimates which
can be used to monitor relative abundance trends and methods are currently being developed

71
to integrate these measures into WFD compatible monitoring tools. Although the inference of
absolute abundance from eDNA is currently still problematic, this is likely to change in the
future. However, by definition eDNA can only provide genetic information, but ecological
information such as the age-structure of a population, health condition etc. cannot be obtained
through this approach. At present, it is necessary to use eDNA in conjunction with traditional
survey methods in order to provide a more holistic picture of an environment , to ground truth the
techniques and indicate wider features of aquatic quality. However, if a way to reliably measure
absolute abundance/biomass is established in the future using eDNA, this will negate the need
for traditional surveys in many instances, hence enhancing environmental monitoring.
5. Factors influencing the design of the monitoring
programme
The design of a monitoring programme (e.g. type of survey, spatial coverage, repeat frequency
and timing) are dependent on the natural local conditions and the activities that are subject to
monitoring.
5.1 Monitoring technique(s)
The choice of the most appropriate technique(s) to be applied within a monitoring programme
for inshore fish communities is one key element of a monitoring design. The factors affecting the
choice of methods and their application in a monitoring programme can be summarised as
follows (modified and integrated from Rozas and Minello, 1997; Hemingway and Elliott, 2002):
● The choice of the sampling method should be fit-for-purpose. That is, the method
should be appropriate for the target species (or community), the habitats being
surveyed, and the objectives of the study. The chosen method should provide data that
meet these requirements, also considering its efficiency and selectivity and the ability to
provide qualitative vs. quantitative data, as highlighted in the review above. Although for
assessing nekton no method is 100% efficient, the technique utilised for estimating
faunal densities should be as accurate and precise as possible.
● Ease of standardisation is important when choosing (and applying) a particular
sampling technique in order to ensure that catch efficiency does not vary as a result of
changes in gear specification, or how/where a gear is used (e.g. catch efficiency of an
individual technique may change depending on the conditions under which the technique
is operated). Along with consistency in the use of a method (e.g. between similar
habitats or over monitoring programmes), standardisation also allows comparability of
the data in space and time (e.g. with previous monitoring assessments). The ability to
clearly relate the collected data to a given spatial (e.g. area or volume of water sampled)
or temporal scale (e.g. static gears integrating collection over time) also contributes to
the data standardisation and comparability. The dimension of these scales (e.g. sample
unit area covering micro-, meso-, or macrohabitat) may also influence how
representative the data are of a certain habitat, area or period in time (e.g. season).
72
● Environmental implications (e.g. impact on habitats and species) in the use of a
certain method are also important, particularly where sensitive features occur. Inshore
three are often restrictions on the type of gear that can be deployed (e.g. bottom towed
gear fishing prohibitions as regulated by IFCAs byelaws), but in many cases scientific
exceptions can be secured although this may require environmental assessments (e.g.
Habitats Regulations Assessment, HRA). Therefore, local constraints (environmental,
legislative, etc.) are to be considered when assessing the applicability of the method in a
specific study area.
● Cost-effectiveness of the method is also an element to account for, whereby costs for
gear construction, sample collection, and sample processing are considered against the
benefits and limitations of the technique, in respect to the monitoring objectives and data
requirements. Although cost should not be a primary consideration in selecting a
method, the final choice may however result in a compromise, based on additional
factors such as working conditions, personnel availability and skill sets, training,
qualifications, cost, and the availability of suitable techniques. It must be noted that
transport costs (e.g. vessel hire) are often a large proportion of total survey costs, and
therefore maximum use should be made of time spent at the site. Sorting and
processing of a sample or of video or acoustic data may also be time consuming, hence
more costly than collection (using a device which collects a relatively clean sample (i.e.
with a small amount of extraneous material) will reduce the sorting time). New emerging
technologies such as Remote Electronic Monitoring (REM), Artificial Intelligence (AI) like
machine learning and computer vision methods are also being increasingly used in both
scientific sampling and commercial catch monitoring to improve the efficiency and/or
capacity of data collection (e.g. automatic fish identification and length measurements),
thus improving cost-effectiveness. The use of these technologies also allows the
integrated processing and analysis of large quantities of near real‐time, georeferenced
data that can improve management at relevant spatial and temporal scales (Bradley et
al., 2019).
As is evident from the above review of monitoring methods, there are trade-offs between the
characteristics of each technique. For example, methods as eDNA assessment may be highly
cost-effective, easy to apply, non invasive, and may allow detection of species that are rare or
difficult to catch with other methods, but don’t allow (as yet) to obtain reliable quantitative data
on fish abundance or biomass, nor on the age/size structure of a population. In turn, classic
sampling methods may allow to obtain quantitative data (density estimates, body size,
contamination, diet etc.) that can be used to assess the status and variability of the fish
resource in the habitat investigated (although this depends on the selectivity and habitat -specific
efficiency of the method), but they may be more expensive to conduct, more limited by
environmental conditions (weather, tides, etc.), and some may be more impacting on the habitat
(e.g. bottom trawling). Other methods (e.g. those relying on acoustic or visual detection) may be
less invasive and impacting, but may be restricted by other environmental conditions (e.g. water
turbidity affecting visual detection), unable to distinguish different fish species (e.g.
hydroacoustics, when not used in combination with traditional sampling), or may have significant
processing time requirements (hence costs) to obtain the data. The above trade-offs need to be
73
taken into consideration when planning a monitoring programme, and the final choice will reflect
the compromise that best match the monitoring objectives and the associated data
requirements.
Another element to take into account is data comparability. Standardisation of monitoring
protocols for individual methods is important to allow comparability of the data collected with
that method over time and space (and possibly with previous monitoring applying a similar
protocol). However, any individual method has limitations in the component of the fish
assemblage that is being selected in the sample (depending on the species’ body size,
morphological type, distribution in the water column, habitat etc.) and how efficiently it is
assessed. Where the aim is to characterise (and where possible quantify) inshore fish
communities across the range of habitats available in a region, the use of a complementary
range of techniques is therefore required. Such a multi-method approach is used for example by
the EA for monitoring fish in transitional waters, in order to obtain a wider representation of the
structure (e.g. species diversity and composition, species abundance) and functioning (e.g.
nursery function, trophic integrity) of fish assemblages in UK estuaries (Coates et al., 2007;
WFD-UKTAG, 2014). Andersson et al. (2007) also suggest the use of multiple sampling
techniques for estimating fish abundance and composition for the Environmental Impact
Assessment in offshore wind farm construction areas in order to represent the diversity of
receptors (fish species and life stages) that may be impacted and their environment. A
combination of survey techniques is also recommended by Watson et al. (2005) for
comprehensive fishery-independent studies that aim to sample broad components of fish
assemblages. However, combining different methods to sample different parts of the fish
community and different habitats may create issues regarding data comparability between
methods (hence habitats), due to the variable operation and selectivity of the different methods
as mentioned above. These issues would regard both the qualitative representation of the f ish
assemblage (i.e. species sampled, diversity) and the quantitative assessment (e.g. species
abundance or proportion in the sample), so that different methods will all give different estimates
of the fish community composition (Watson et al., 2005; Andersson et al., 2007). Despite work
has been made to assess the catch efficiency and selectivity of different methods and how
these affect abundance estimates, this mostly addresses focuses on fishing gear to address
fishery management and stock assessment issues (e.g. Thompson and Ben-Yami, 1984). In
addition, the results are highly dependent on the gear specifications (gear type, size and setting,
mesh size, etc.) and therefore are unlikely to be valid for other gear (even of similar type) (Godø
and Engås, 1989; Hovgård and Lassen, 2000). The intercalibration of fish sampling methods
undertaken by Franco et al. (2012) in a Mediterranean lagoon clearly illustrates this issue,
showing that different sampling techniques applied in the same habitat at the same time provide
different qualitative and quantitative data on the diversity, abundance and trophic structure of
the fish assemblage, with differences also occurring between similar methods (seine nets with
different specifications). Therefore, although the use of multiple complementary methods
ensures that different components of the fish assemblage are represented in the samples
overall, the direct comparison of the quantitative estimates obtained from different methods is
not recommended. Similarly, as the different methods may be selective towards certain species
or types (e.g. depending on body morphology, habitat association), caution should be taken in
74
combining qualitative data (e.g. species lists) to estimate overall species diversity, as the results
may be influenced by the different proportion of samples collected with different methods and in
different areas. As a result, the qualitative data obtained from different methods, once
combined, can provide an indication of the species present in an area, but caution should be
taken on interpreting the absence of other species (e.g. compared to other areas) as this might
be influenced by the variability in methods and sampling effort.
5.2 Spatial considerations
Spatial factors of anthropogenic and natural variability must be accounted for when designing a
monitoring survey. This is normally done by stratifying the survey design and generating
relevant spatial strata within the study site. These strata may account for areas of distinct
habitats to pressure/impact. The scale at which these strata are defined (e.g. coastal areas and
estuarine ecosystems, and habitats within) also depends on the monitoring target (e.g. known
spatial distribution of a fish community, or mobility of a species of interest). Monitoring stations
are partitioned between strata, with the statistical benefit of improving the precision of the
parameters estimates and the power of the survey design in detecting non-natural changes
(Thompson, 2012).
The appropriate number of samples to be taken is dependent upon a number of factors,
including gear selection. Collecting too many samples wastes time and resources, whereas
taking too few samples may result in a failure to accomplish the study objectives. Sample
replication is therefore usually a compromise between cost and sample precision, although
increasing the number of samples may increase precision and the ability to test hypotheses
(Hemingway and Elliott, 2002). Rozas and Minello (1997) suggest that ideally, the sampling
design should incorporate as few samples as possible, whilst still having enough statistical
power to detect differences among experimental treatments or other factors of interest.
Sampling of fish communities has the additional problem in that the taking of one sample may
greatly influence the nature of any subsequent sample. For example, a beam trawl taken over
an area is likely to scare fish such that a ‘replicate’ taken immediately afterwards will give a
distorted assessment, hence repeated sampling over the same area should be regarded as
‘pseudoreplication’ (Hemingway and Elliott, 2002).
5.3 Temporal considerations
As part of the design of a monitoring programme, temporal parameters such as frequency (the
interval between observations) and timing (when an observation is collected) are important
factors that need to be specified. Correctly fixing these parameters is critical for accurate
detection of temporal patterns in the inshore fish community, both in response to natural
variability and to anthropogenic changes (e.g. to a pressure).
The frequency and timing of the monitoring must match the temporal dynamics of the fish
community of interest, as resulting from variability of environmental conditions and the
seasonality of natural population patterns (depending on the characteristics/behavioural ecology
of the target species such as spawning, recruitment, migrations, mortality, etc.) These may
75
affect the presence and use of an area or habitat by fish species, and the ability to assess them
using a given monitoring technique. If the frequency is too low, the environmental response will
not be documented adequately. If the frequency is too high, the programme will be
unnecessarily expensive.
Sampling intervals should be chosen on the basis of the expected frequency with which
changes occur. This may vary from continuous recording or sampling every 5·min, to several
hours or more. In situations where almost no major changes are expected, sampling once or
twice a year is sufficient (Hemingway and Elliott, 2002). With respect to fish populations, winter
sampling will produce the assessment of the base population size, although weather conditions
in this season may be limiting for undertaking certain surveys (e.g. gill netting, seining). Late -
summer samples will be required to assess recruitment processes (allowing for very high
mortalities of larvae and postlarvae in early summer). Other specific timings may be selected
depending on the ecology of the species targeted or of particular interest (e.g. to target specific
migration periods). Quarterly samples may be sufficient to provide estimates of production by
each species (e.g. Elliott and Taylor, 1989), but more frequent sampling is required for growth
estimates (Hemingway and Elliott, 2002).
For example, the requirements for WFD transitional fish surveillance monitoring (EA, 2011b)
aim to capture the seasonality of fish population patterns by requiring that fish surveys are
undertaken twice a year, during spring (May-June) and autumn (September–October). Sampling
the former period allows to catch adult populations and newly emergent fry, whereas surveys in
the autumn allow to identify the location of fry after summer migrations (Hemingway and Elliott,
2002). The WFD also requires a maximum of 3 years interval for operational monitoring of fish
in transitional waters.
Accurately detecting changes over time depends on comparing two or more datasets collected
under as similar conditions as possible. Therefore, standardised monitoring surveys carried out
at the same time of year are required to facilitate inter-annual comparison. If the same month
cannot be accommodated, then sampling in the same season should at least be ensured. This
increases temporal compatibility between observations and reduces the effects of inter-
seasonal variation in any comparisons made. However, the nature of the temporal variability
needs to be understood to make appropriate decisions. For example, if recruitment is delayed in
one year and sampling only occurs at monthly intervals, then the period for post-recruitment
mortality may be shortened. In surveys designed to provide growth and productivity estimates,
the shorter the sampling interval then the more accurate the estimates (e.g. Elliott and Taylor,
1989).
76
References
Andaloro, F., Ferraro, M., Mostarda, E., Romeo, T., and Consoli, P. (2012). Assessing the
suitability of a remotely operated vehicle (ROV) to study the fish community associated with
offshore gas platforms in the Ionian Sea: a comparative analysis with underwater visual
censuses (UVCs). Helgoland Marine Research, 67(2), 241-250.
Anderson, O. R. J., Small, C. J., Croxall, J. P., Dunn, E. K., Sullivan, B. J., Yates, O., and Black,
A. (2011). Global seabird bycatch in longline fisheries. Endangered Species Research, 14(2),
91-106.
Andersson, M.H., Gullstrom, M., Asplund, M.E. and Ohman, M.C. (2007). Importance of using
multiple sampling methodologies for estimating of fish community composition in offshore wind
power construction areas of the Baltic Sea. Ambio, 36(8), 634–636.
Andrew, N.L. and Mapstone, B.D. (1987). Sampling and the description of spatial pattern in
marine ecology. Oceanography and Marine Biology, 25, 39-90.
Aneer, G., E.A. Blomqvist, H. Hallbäck, J. Mattila, S. Nellbring, K. Skóra and L. Urho (1992).
Methods for Sampling and Observation of Shallow Water Fish. The Baltic Marine Biologists,
Publication No. 13. ISSN 0282–8839.
Barbera, C., Mallol, S., Verges, A., Cabanellas-Reboredo, M., Diaz, D. and Goni, R. (2017).
Maërl beds inside and outside a 25-year-oldno-take area. Marine Ecology Progress Series, 572,
77-90.
Barcelo, C., Ciannelli, L., Olsen, E. M., Johannessen, T., and Knutsen, H. (2016). Eight decades
of sampling reveal a contemporary novel fish assemblage in coastal nursery habitats. Glob.
Chang. Biol., 22(3), 1155-1167.
Barnes MA, Turner CR, Jerde CL, Renshaw MA, Chadderton WL and Lodge DM. (2014).
Environmental conditions influence eDNA persistence in aquatic systems. Environmental
Science & Technology 48: 1819–1827.
Baumgartner, L. J., Reynoldson, N., Cameron, L. and Stanger, J. (2006). Assessment of a dual-
frequency identification sonar (DIDSON) for application in fish migration studies. New South
Wales Department of Primary Industries, Fisheries Final Report Series No. 84, 33 pp.
Beheregaray, L.B. and Caccone, A., 2007. Cryptic biodiversity in a changing world. Journal of
Biology, 6(4), p.9.
Bennett, A., Barrett, D., Vandor, I., Soltan, K., Yoonyoung, C., Lutcavage, M., and Chi Hin, L.
(2016). Fish tagging via RFID and bluetooth: Crowdsourced fish tracking through better
reporting tools. Paper presented at the OCEANS 2016 MTS/IEEE Monterey, 19-23 Sept. 2016.
Biggs J, Ewald N, Valentini A, Gaboriaud C, Dejean T, Griffiths RA, Foster J, Wilkinson JW,
Arnell A, Brotherton P, Williams P, and Dunn F. 2015. Using eDNA to develop a national citizen
77
science-based monitoring programme for the great crested newt (Triturus cristatus). Biological
Conservation 183: 19–28.
Bolland, J. D., Nunn, A. D., Angelopoulos, N. V., Dodd, J. R., Davies, P., Gutmann Roberts, C.,
Britton, J. R. and Cowx, I. G. (2019). Refinement of acoustic-tagging protocol for twaite shad
Alosa fallax (Lacépède), a species sensitive to handling and sedation. Fisheries Research in
press.
Boom, B.J., Huang, P.X., Beyan, C., Spampinato, C., Palazzo, S., He, J., Beauxis-Aussalet, E.,
Lin, S-I, Chou, H-M., Nadarajan, G., Chen-Burger, Y-H., van Ossenbruggen, J., Giordano, D.,
Hardman, L., Lin, F-P. and Fisher, R. (2012). Long-term underwater camera surveillance for
monitoring and analysis of fish populations. VAIB12 Conference Proceedings, 2012. Available
at https://pdfs.semanticscholar.org/195d/e5e16b1b8ebf12ea63fcb521a48e405a7a4b.pdf.
Bradley, D., Merrifield, M., Miller, K. M., Lomonico, S., Wilson, J. R., and Gleason, M. G. (2019).
Opportunities to improve fisheries management through innovative technology and advanced
data systems. Fish and Fisheries, 20(3), 564-583.
https://onlinelibrary.wiley.com/doi/epdf/10.1111/faf.12361
Breen, M. J., and Ruetz, C. R. (2006). Gear Bias in Fyke Netting: Evaluating Soak Time, Fish
Density, and Predators. North American Journal of Fisheries Management, 26(1), 32-41.
Brehmer, P., Chi, T. D. and Mouillot, D. (2006a). Amphidromous fish school migration revealed
by combining fixed sonar monitoring (horizontal beaming) with fishing data. Journal of
Experimental Marine Biology and Ecology 334, 139–150.
Brehmer, P., Guillard, J., Guennégan, Y., Bigot, J. L. and Liorzou, B. (2006b). Evidence of a
variable “unsampled” pelagic fish biomass in shallow water (<20 m): the case of the Gulf of
Lion. ICES Journal of Marine Science 63, 444–451.
Brehmer, P., Lafont, T., Georgakarakos, S., Josse, E., Gerlotto, F. and Collet, C. (2006c).
Omnidirectional multibeam sonar monitoring: applications in fisheries science. Fish and
Fisheries 7, 165–179.
Burwen, D. L., Fleischman, S. J., Miller, J. D. and Jensen, M. E. (2003). Time-based signal
characteristics as predictors of fish size and species for a side-looking hydroacoustic application
in a river. ICES Journal of Marine Science 60, 662–668.
Burwen, D. L., Fleischman, S. J. and Miller, J. D. (2007). Evaluation of a dual-frequency imaging
sonar for detecting and estimating the size of migrating salmon. Alaska Department of Fish and
Game Fishery Data Series No. 07-44, 40 pp.
Bylemans, J., Furlan, E. M., Hardy, C. M., McGuffie, P., Lintermans, M. and Gleeson, D. M. .
(2017). An environmental DNA-based method for monitoring spawning activity: a case study,
using the endangered Macquarie perch (Macquaria australasica). Methods in Ecology and
Evolution, 8: 646-655.
78
Cappo, M., Harvey, E. and Shortis, M. (2006). Counting and measuring fish with baited video
techniques - an overview. In: Furlani, D. and Beumer, J.P. (Eds.), Proceedings of the Australian
Society for Fish Biology Workshop, Hobart, August 2007, pp. 101-114. Available at
https://www.researchgate.net/publication/233531389_Counting_and_measuring_fish_with_baite
d_video_techniques-an_overview
Chung-Davidson, Y.-W., Huertas, M. and Li, W. (2011). A Review of Research in Fish
Pheromones. In Breithaupt, T. and Thiel, M. (Eds.), Chemical Communication in Crustaceans.
Springer, pp. 467-484.
Coates, S. A., Waugh, A., Anwar, A., and Robson, M. (2007). Efficacy of a multi-metric fish
index as an analysis tool for the transitional fish component of the Water Framework Directive.
Marine Pollution Bulletin, 55, 225–240.
Colclough, S. R., Gray, G., Bark, A., and Knights, B. (2002). Fish and fisheries of the tidal
Thames: management of the modern resource, research aims and future pressures. Journal of
Fish Biology, 61 (Supplement A), 64-73.
Cooke, S. J., Woodley, C., Eppard, M. B., Brown, R. S. and Nielsen, J. L. (2011). Advancing the
surgical implantation of electronic tags in fish: a gap analysis and research agenda based on a
review of trends in intracoelomic tagging effects studies. Reviews in Fish Biology and Fisheries
21, 127–151.
Cooke, S. J., Midwood, J. D., Thiem, J. D., Klimley, P., Lucas, M. C., Thorstad, E. B., Eile r, J.,
Holbrook, C. and Ebner, B. C. (2013). Tracking animals in freshwater with electronic tags: past,
present and future. Animal Biotelemetry 1, 5.
Cotterell, S. P, and Hillman, R. J. (2015). Monitoring of allis shad and smelt in Tamar estuaries -
EC18234. Natural England Evidence Project Report RP02463, York.
Crossin, G. T., Heupel, M., Holbrook, C. M., Hussey, N., Lowerre-Barbieri, S., Nguyen, V. M.,
Raby, G. D. and Cooke, S. J. (2017). Acoustic telemetry and fisheries management. Ecological
Applications 27, 1031–1049.
DEFRA (2011). Biodiversity 2020: A strategy for England’s wildlife and ecosystem services.
Available at
https://assets.publishing.service.gov.uk/government/uploads/system/uploads/attachment_data/fi
le/69446/pb13583-biodiversity-strategy-2020-111111.pdf
DEFRA (2012). Marine Strategy Part One: UK Initial Assessment and Good Environmental
Status. London. Available at
https://www.gov.uk/government/uploads/system/uploads/attachment_data/file/69632/pb13860-
marine-strategy-part1-20121220.pdf
DEFRA (2014). Marine Strategy Part Two: UK Marine Monitoring Programmes. London.
Available at
79
https://assets.publishing.service.gov.uk/government/uploads/system/uploads/attachment_data/fi
le/341146/msfd-part-2-final.pdf
DEFRA (2015). Marine Strategy Part Three: UK Programme of Measures. London. Available at
https://www.gov.uk/government/uploads/system/uploads/attachment_data/file/486623/marine-
strategy-part3-programme-of-measures.pdf
DEFRA (2018a). A Green Future: Our 25 Year Plan to Improve the Environment. Available at
https://assets.publishing.service.gov.uk/government/uploads/system/uploads/attachment_data/fi
le/693158/25-year-environment-plan.pdf
DEFRA (2018b). Sustainable fisheries for future generations: consultation document. Available
at https://www.gov.uk/government/consultations/fisheries-white-paper-sustainable-fisheries-for-
future-generations/sustainable-fisheries-for-future-generations-consultation-document#annexes
Demer, D. A., Berger, L., Bernasconi, M., Bethke, E., Boswell, K., Chu, D., Domokos, R.,
Dunford, A., Fässler, S., Gauthier, S., Hufnagle, L. T., Jech, J. M., Bouffant, N., Lebourges-
Dhuassy, A., Lurton, X., Macaulay, G. J., Perrot, Y., Ryan, T., Parker-Stetter, S., Stienesson, S.,
Weber, T. and Williamson, N. (2015). Calibration of acoustic instruments. ICES Cooperative
Research Report No. 326, 133 pp.
Devon and Severn IFCA (2017). Management of the “live” wrasse pot fishery. Revised report for
all DandSIFCA stakeholders. Version 3, August 2017.
https://secure.toolkitfiles.co.uk/clients/15340/sitedata/4F/Byelaw_development_reports/Wrasse/
Final-Wrasse-v-3-new-cover-Aug16th-2017.pdf.
Devon and Severn IFCA (2018). Live Wrasse Fishery in Devon and Severn IFCA District.
Research Report November 2018.
https://www.devonandsevernifca.gov.uk/content/download/2878/21936/version/1/file/Live+Wras
se+Fishery+Data+Analysis+November+2018.pdf.
Donaldson, M. R., Hinch, S. G., Suski, C. D., Fisk, A. T., Heupel, M. R. and Cooke, S. J. (2014).
Making connections in aquatic ecosystems with acoustic telemetry monitoring. Frontiers in
Ecology and the Environment 12, 565–573.
Dorman, S. R., Harvey, E. S. and Newman, S. J. (2012). Bait Effects in Sampling Coral Reef
Fish Assemblages with Stereo-BRUVs. PLoS ONE 7(7), e41538.
Drake, P. and Arias, A.M. (1991a). Ichthyoplankton of a shallow coastal inlet in southwest
Spain: Factors contributing to colonization and retention. Estuarine and Coastal Shelf Science,
32, 347–364.
Drake, P. and Arias, A.M. (1991b). Composition and seasonal fluctuations of the
ichthyoplankton community in a shallow tidal channel of the Cádiz Bay (SW Spain). Journal of
Fish Biology, 39, 245–263.
80
Dunning, D. J., Ross, Q. E., Geoghehan, P., Reichle, J. J., Menezes, J. K. and Watson, J. K.
(1992). Alewives avoid high-frequency sound. North American Journal of Fisheries
Management 12, 407–416.
Egg, L., Pander, J., Mueller, M. and Geist, J. (2019). Comparison of sonar-, camera- and net-
based methods in detecting riverine fish-movement patterns. Marine and Freshwater Research
in press.
Elbrecht, V., Vamos, E.E., Meissner, K., Aroviita, J., and Leese, F., 2017. Assessing strengths
and weaknesses of DNA metabarcoding-based macroinvertebrate identification for routine
stream monitoring. Methods Ecol Evol. https://doi.org/10.1111/2041-210X.12789
Eleftheriou, A. and N.A. Holme (1984) Macrofauna Techniques. In: Holme, N.A. and McIntyre,
A.D. (Eds.), Methods for the Study of Marine Benthos. Second edition, Blackwell Scientific
Publications, Oxford, IBP Handbook 16, pp. 140–216.
Elliott, M. (2011). Marine science and management means tackling exogenic unmanaged
pressures and endogenic managed pressures--a numbered guide. Mar Pollut Bull, 62(4), 651-
655.
Elliott, M. (2012). Preface – Setting the Scene and the Need for Integrated Science for the
Operational and Environmental Consequences of Large Industrial Cooling Water Systems. In:
Rajagopal, S., Jenner, H. A., and Venugopalan, V. P. (Eds). Operational and Environmental
Consequences of Large Industrial Cooling Water Systems. Springer, Heidelberg/New York.
Environment Agency (2011a). Seine netting for monitoring fish. Operational instruction 145_07.
Issued 23/03/2011.
Environment Agency (2011b). Data requirements for WFD transitional fish surveillance
monitoring. Operational instruction 328_07. Issued 22/12/2011.
Environment Agency (2013a). Trawling for fish (otter, beam and oyster dredge). Operational
instruction 011_07. Issued 30/07/2013.
Environment Agency (2013b). Fyke netting for monitoring fish. Operational instruction 25_07.
Issued 06/08/2013.
Environment Agency (2016a). Hydroacoustic fisheries surveys in lakes. Environment Agency
Operational Instruction 24_7, 14 pp.
Environment Agency (2016b). Hydroacoustic fisheries surveys in rivers. Environment Agency
Operational Instruction 146_03, 13 pp.
Environment Agency (2016c). Mobile hydroacoustic fisheries surveys. Environment Agency
Operational Instruction 451_09, 3 pp.
Environment Agency (2016d). Position Statement: Using DNA-based methods for
environmental monitoring and decision-making. Environment Agency, Bristol. 3 pp.

81
Environment Agency (2017a). TraC Fish Counts for all Species for all Estuaries and all years.
Available at https://data.gov.uk/dataset/trac-fish-counts-for-all-species-for-all-estuaries-and-all-
years [last downloaded 27/07/2017].
Environment Agency (2017b). How to fish responsibly during Somerset's elver season. Press
release Published 17 February 2017. https://www.gov.uk/government/news/how-to-fish-
responsibly-during-somersets-elver-season
Environment Agency (2018). Illegal elver fishing and how we tackle it. Blog posted by: Jay Rana
on 3 May 2018 - Categories: Fisheries and biodiversity.
https://environmentagency.blog.gov.uk/2018/05/03/illegal-elver-fishing-and-how-we-tackle-it/
Environmental Resources Limited (1992). Stage IIIa Environmental Studies – E3 Fish studies in
the Mersey. ERM, London. Final report for Mersey Barrage Company.
Elliott, M., O'Reilly, M. G., and Taylor, C. J. L. (1990). The Forth estuary: a nursery and
overwintering area for North Sea fishes. Hydrobiologia, 195, 89-103.
Elliott, M. and Dewailly, F. (1995). The structure and components of European estuarine fish
assemblages. Neth. J. Aquat. Ecol., 29, 397-417.
Elliott, M. and Taylor, C.J.L. (1989). The structure and functioning of an estuarine/marine fish
community in the Forth estuary, Scotland. In: Proceedings of the 21st European Marine Biology
Symposium Gdánsk, 14–19 September 1986. Polish Academy of Sciences, Institute of
Oceanology, Warsaw, pp. 227–240.
European Commission (2017). Commission Decision (EU) 2017/848 of 17 May 2017 laying
down criteria and methodological standards on good environmental status of marine waters and
specifications and standardised methods for monitoring and assessment, and repealing
Decision 2010/477/EU. Official Journal of the European Union, L125, 43-74.
https://publications.europa.eu/en/publication-detail/-/publication/a7523a58-3b91-11e7-a08e-
01aa75ed71a1
FAO (2018). Fisheries and aquaculture technology. Available at:
http://www.fao.org/fishery/geartype/search/en [last accessed 20/12/2018]
Foote, K. G., Chu, D., Hammar, T. R., Baldwin, K. C., Mayer, L. A., Hufnagle, L. C. Jr and Jech,
J. M. (2005). Protocols for calibrating multibeam sonar. Acoustical Society of America 117,
2013–2027.
Franco, A., Elliott, M., Franzoi, P. and Torricelli, P. (2008). Life strategies of fishes in European
estuaries: the functional guild approach. Marine Ecology Progress Series, 354, 219-228.
Franco, A., Pérez-Ruzafa, A., Drouineau, H., Franzoi, P., Koutrakis, E. T., Lepage, M., Verdiell -
Cubedo, D., Bouchoucha, M., Lopez-Capel, A., Riccato, F., Sapounidis, A., Marcos, C., Oliva-
Paterna, F.J., Torralva-Forero, M. and Torricelli, P. (2012). Assessment of fish assemblages in
coastal lagoon habitats: Effect of sampling method. Estuarine, Coastal and Shelf Science, 112,
115-125.
82
Franco A. (2014). Humber Gateway Offshore Wind Farm: Herring Spawning Monitoring 2013. A
report of the Institute of Estuarine and Coastal Studies to RSS Marine for Gardline
Environmental Limited. Report No. ZBB838-F-2014, July 2014.
Franco, A., Barnard, S. and Smyth, K. (2020b). Viability of fish monitoring techniques in inshore
areas of the Southwest of England. Natural England Commissioned Reports, NECR 270. ISBN
978-1-78354-595-7
Franco, A., Hänfling, B., Young, M. and Elliott, M. (2020c). Regional monitoring plan for inshore
fish communities in the Southwest of England. Natural England Commissioned Reports, NECR
271. ISBN 978-1-78354-596-4
Gee, J.M. (1983). Sampling and Analysis of Fish Populations. In: (Morris, A.W., Ed.), Practical
Procedures for Estuarine Studies. Institute of Marine Environmental Research (now Plymouth
Marine Laboratory), Plymouth, pp. 213–238. A handbook prepared by the Estuarine Ecology
Group of the Institute for Marine Environmental Research, Contract No. 480/48.
Godlewska, M., Swierzowski, A. and Winfield, I. J. (2004). Hydroacoustics as a tool for studies
of fish and their habitat. Ecohydrology and Hydrobiology 4, 417–427.
Godø, O. R. and Engås, A. (1989). Swept area variation with depth and its influence on
abundance indices of groundfish from trawl surveys. J. Northw, Atl. Fish, Soc., 9, 133-139.
Gray, M.J. (1995). The coastal fisheries of England and Wales, Part III: A review of their status
1992–1994. MAFF, Lowestoft. Fisheries Research Technical Report No. 100.
Greenwood, M. F. D., Hill, A. S., and McLusky, D. S. (2002). Trends in abundance of benthic
and demersal fish populations of the lower Forth Estuary, East Scotland, from 1982–2001.
Journal of Fish Biology, 61 (Supplement A), 90–-104.
Greenwood, M. F. D. (2008a). Fish mortality by impingement on the cooling-water intake
screens of Britain’s largest direct-cooled power station. Marine Pollution Bulletin, 56, 723–739.
Greenwood, M. F. D. (2008b). Trawls and cooling-water intakes as estuarine fish sampling
tools: Comparisons of catch composition, trends in relative abundance, and length selectivity.
Estuarine Coastal and Shelf Science, 76, 121-130.
Gregory, J. and Clabburn, P. (2003). Avoidance behaviour of Alosa fallax fallax to pulsed
ultrasound and its potential as a technique for monitoring clupeid spawning migration in a
shallow river. Aquatic Living Resources 16, 313–316.
Griffin, R.A., Robinson, G.J., West, A., Gloyne-Phillips, I.T. and Unsworth, R.K.F. (2016).
Assessing Fish and Motile Fauna around Offshore Windfarms Using Stereo Baited Video. PLoS
ONE 11(3): e0149701.
Guillard, J. (1998). Daily migration cycles of fish populations in a tropical estuary (Sine-Saloum,
Senegal) using a horizontal-directed split-beam transducer and multibeam sonar. Fisheries
Research 35, 21–29.

83
Guillard, J. and Colon, M. (2000). First results on migrating shad (Alosa fallax) and mullet (Mugil
cephalus) echocounting in a lock on the Rhône River (France) using a split -beam sounder, and
relationships with environmental data and fish caught. Aquatic Living Resources 13, 327–330.
Guillard, J., Balay, P., Colon, M. and Brehmer, P. (2010). Survey boat effect on YOY fish
schools in a pre-alpine lake: evidence from multibeam sonar and split-beam echosounder data.
Ecology of Freshwater Fish 19, 373– 380.
Guttormsen, M. A., McCarthy, A. and Jones, D. (2010). Results of the February-March 2009
echo integration-trawl surveys of walleye pollock (Theragra chalcogramma) conducted in the
Gulf of Alaska, Cruises DY2009-01 and DY2009-04. Alaska Fisheries Science Center
Processed Report 2010-01, 67 pp.
Harmelin-Vivien, M.L. and Francour, P. (1992). Trawling or visual censuses? Methodological
bias in the assessment of fish populations in seagrass beds. Marine Ecology – Pubblicazioni
della Stazione Zoologica di Napoli I, 13, 41–51.
Harper, L. R., N. P. Griffiths, L. Lawson Handley, C. D. Sayer, D. S. Read, K. J. Harper, R. C.
Blackman, J. Li, and B. Hänfling. 2019. Development and application of environmental DNA
surveillance for the threatened crucian carp (Carassius carassius). Freshwater Biology 64:93-
107.
Harrison, T. D. and Kelly, F. L. (2013). Development of an estuarine multi-metric fish index and
its application to Irish transitional waters. Ecological Indicators, 34, 494-506.
Hateley, J. and Gregory, J. (2006). Evaluation of a multibeam imaging sonar system (DIDSON)
as fisheries monitoring tool: exploiting the acoustic advantage. Environment Agency Technical
Report, 7 pp.
Hänfling, B., Lawson Handley, L., Read, D.S., Hahn, C., Li, J., Nichols, P., Blackman, R.C.,
Oliver, A. and Winfield, I.J. (2016). Environmental DNA metabarcoding of lake fish communities
reflects long term data from established survey methods. Molecular Ecology, 25(13), 3101–
3119. Available at: http://dx.doi.org/10.1111/mec.13660.
Harvey, E.S., Cappo, M., Butler, J.J., Hall, N. and Kendrick, G.A. (2007). Bait attraction affects
the performance of remote underwater video stations in assessment of demersal fish
community structure. Marine Ecology-Progress Series 350: 245–254.
HELCOM (2015). Guidelines for Coastal fish Monitoring Sampling Methods of HELCOM.
Available at http://www.helcom.fi/action-areas/monitoring-and-assessment/monitoring-
manual/fish-fisheries-and-shellfish/coastal-fish
Hemingway, K.L. and Elliott, M. (2002). Field methods. In: Elliott, M. and Hemingway, K.L.
(Eds.), Fishes in Estuaries. Blackwell Science, 410-509.
Henderson, P.A. (1989). On the structure of the inshore fish community of England and Wales.
J. Mar. Biol. Assoc. U. K., 69 (01), 145–163.
84
Henderson, P. A. (2017). Long-term temporal and spatial changes in the richness and relative
abundance of the inshore fish community of the British North Sea Coast. Journal of Sea
Research, 127, 212-226.
Hering, D., Borja, A., Jones, J. I., Pont, D., Boets, P., Bouchez, A. and Kelly, M. (2018).
Implementation options for DNA-based identification into ecological status assessment under
the European Water Framework Directive. Water Res, 138, 192-205.
Heupel, M. R., Semmens, J. M. and Hobday, A. J. (2006). Automated acoustic tracking of
aquatic animals: scales, design and deployment of listening station arrays. Marine and
Freshwater Research 57, 1–13.
Hinchen, H. (2014a). Review of marine biodiversity assessment obligations in the UK. Part I: A
summary of the marine biodiversity assessment obligations stipulated within national and
international legislative and policy instruments. JNCC Report 497, JNCC, Peterborough.
Available at: http://jncc.defra.gov.uk/pdf/JNCC497_web.pdf.
Hinchen, H. (2014b). Review of marine biodiversity assessment obligations in the UK. Part II:
Identifying similarities and differences between marine biodiversity assessment obligations.
JNCC Report 497, JNCC, Peterborough. Available at:
http://jncc.defra.gov.uk/pdf/497_Part%20II_Web.pdf. Holmes, J. A., Cronkite, G. M. W.,
Enzenhofer, H. J. and Mulligan, T. J. (2006). Accuracy and precision of fish-count data from a
‘‘dual-frequency identification sonar’’ (DIDSON) imaging system. ICES Journal of Marine
Science 63, 543–555.
Horne, J. K. (2000). Acoustic approaches to remote species identification: a review. Fisheries
Oceanography 9, 356–371.
Hovgård, H. and Lassen, H. (2000). Manual on estimation of selectivity for gillnet and longline gears in abundance surveys. FAO Fisheries Technical Paper. No. 397. Rome, FAO. 2000. 84p. Available at: http://www.fao.org/3/x7788e/X7788E00.htm#TOC [last accessed 28/03/2019]
ICES (2010). Report of the Working Group for International Pelagic Surveys (WGIPS), 19 ‐ 22
January 2010, Galway, Ireland. ICES CM 2010/SSGESST:03. 242 pp.
http://www.ices.dk/sites/pub/CM%20Doccuments/CM-2010/SSGESST/wgips10.pdf
ICES (2017). Manual of the IBTS North Eastern Atlantic Surveys. Series of ICES Survey
Protocols SISP 15. 92 pp. http://doi.org/10.17895/ices.pub.3519
ICES (2018). Interim Report of the Working Group on North Sea cod and plaice egg surveys in
the North Sea 2 (WGEGGS2), 10-11 October 2017, Boulogne sur Mer, France. ICES CM
2017/EOSG:10. 23 pp.
http://www.ices.dk/sites/pub/Publication%20Reports/Expert%20Group%20Report/SSGIEOM/20
17/WGEGGS2/WGEGGS2%20report%202017.pdf
IECS (2000). Fish impingement assessment at South Humber Bank Power Station year 1.
Institute of Estuarine and Coastal Studies, University of Hull.

85
JNCC (2016). The UK Marine Biodiversity Monitoring Strategy. Version 4.1. Available at
http://jncc.defra.gov.uk/pdf/Marine_Monitoring_Strategy_ver.4.1.pdf
JNCC (2018). Remotely Operated Vehicles for use in marine benthic monitoring. Marine
Monitoring Platform Guidelines No.1. JNCC, Peterborough. ISSN 2517-7605. Available at
http://jncc.defra.gov.uk/pdf/JNCC-MMPG_No1_ROV_WEB.pdf
Kimball, M. E., Rozas, L. P., Boswell, K. M. and Cowan, J. H. Jr. (2010). Evaluating the effect of
slot size and environmental variables on the passage of estuarine nekton through a water
control structure. Journal of Experimental Marine Biology and Ecology 395, 181–190.
Koslow, J. A. (2009). The role of acoustics in ecosystem-based fishery management. ICES
Journal of Marine Science 66, 966–973.
Koutsikopoulos, C., Desaunay, Y., Dorel, D. and Marchand, J. (1989). The role of coastal areas
in the life history of sole (Solea solea, L.) in the Bay of Biscay. Scientia Marina, 53, 567–575.
Kuipers, B.R. (1975). On the efficiency of a two-metre beam trawl for juvenile plaice
(Pleuronectes platessa). Netherlands Journal of Sea Research, 9, 69–85.
Langkau, M. C., Balk, H., Schmidt, M. B. and Borcherding, J. (2012). Can acoustic shadows
identify fish species? A novel application of imaging sonar data. Fisheries Management and
Ecology 19, 313–322.
Lawson-Handley, L. (2015). How will the ‘molecular revolution’ contribute to biological
recording? Biological Journal of the Linnean Society, 115, 750-766.
Lawson Handley LJ, Read D, Winfield I, Kimbell H, Johnson H, Li J, Hahn C, Blackman R,
Wilcox R, Donnelly R, Szitenberg A, Hänfling B (2018) Temporal and spatial variation in
distribution of fish environmental DNA in England's largest lake bioRxiv 376400
Leighton A. (2008). Assessment of lamprey impingement at South Humber Bank Power Station:
November 2003 - February 2006. Institute of Estuarine and Coastal Studies, University of Hull.
Li, J., L.-J. Lawson Handley, D. S. Read and B. Hänfling. 2018. The effect of filtration method on
the efficiency of environmental DNA capture and quantification via metabarcoding. Molecular
Ecology Resources 18:1102-1114.
Little, S., and Elliott, M. (2015). A literature review to inform condition assessment and
monitoring of the Habitats Directive Annex I Estuaries Feature in Scottish waters, Part II.
Scottish Natural Heritage Commissioned Report.
Lucas, M.C. and Baras, E. (2000). Methods for studying spatial behaviour of freshwater fishes in
the natural environment. Fish and Fisheries 1, 283–316.
Mace, G.M., Collar, N.J., Gaston, K.J., Hilton-Taylor, C., Akcakaya, H. R., Leader-Williams, N.,
Milner-Gulland, E.J. And Stuart, S. N. 2008. Quantification of extinction risk: IUCN's system for
classifying threatened species. Conservation Biology, 22(6), 1424-1442
86
MacKenzie, D. I. and Nichols, J. D. (2004). Occupancy as a surrogate for abundance
estimation. Animal Biodiversity and Conservation 27, 461–467.
Mallet, D. and Pelletier, D. (2014). Underwater video techniques for observing coastal marine
biodiversity: A review of sixty years of publications (1952–2012). Fisheries Research, 154, 44-
62.
Martignac, F., Daroux, A., Baglinière, J. L., Ombredane, D. and Guillard, J. (2015). The use of
acoustic cameras in shallow waters: new hydroacoustic tools for monitoring migratory fish
population. A review of DIDSON technology. Fish and Fisheries 16, 486–510.
Maxwell, S. L. and Gove, N. E. (2004). The feasibility of estimating migrating salmon passage
rates in turbid rivers using a dual frequency identification sonar (DIDSON). Alaska Department
of Fish and Game Regional Information Report No. 2A04-05, 88 pp.
Misund, O. A. (1997). Underwater acoustics in marine fisheries and fisheries research. Reviews
in Fish Biology and Fisheries, 7, 1–34.
Moore, A., Ives, M., Davison, P. and Privitera, L. (2016). A preliminary study on the movements
of smelt, Osmerus eperlanus, in two East Anglian rivers. Fisheries Management and Ecology,
23, 169–171.
Mynott S., 2020. Pilot study to validate an environmental DNA sampler for monitoring inshore fish communities. Natural England Commissioned Reports, NECR287. Nathan LM, Simmons M, Wegleitner BJ, Jerde CL, Mahon AR. 2014. Quantifying environmental
DNA signals for aquatic invasive species across multiple detection platforms. Environmental
Science & Technology, 48, 12800–12806.
Natural Resources Wales (2014). The use of environmental DNA test for great crested newt
licensing purposes.
Nestler, J. M., Ploskey, G. R., Pickens, J., Menezes, J. and Schilt, C. (1992). Responses of
blueback herring to high-frequency sound and implications for reducing entrainment at
hydropower dams. North American Journal of Fisheries Management 4, 667–683.
Paschen, M., Richter, U. and Köpnick, W. (2000). Trawl Penetration in the Seabed (TRAPESE).
Final report Contract No. 96–006.
Pavlov, D. S., Borisenko, E. S. and Pashin, V. M. (2009). Investigations of spawning migration
and assessment of abundance of the Kamchatka steelhead (Parasalmo mykiss) from the
Utkholok River by means of DIDSON dual-frequency identification sonar. Journal of Ichthyology
49, 1042–1064.
Pikitch, E. K. 2018. A tool for finding rare marine species. Science 360:1180-1182.
87
Pilliod, D. S., Goldberg, C. S., Arkle, R. S. and Waits, L. P. (2013). Estimating occupancy and
abundance of stream amphibians using environmental DNA from filtered water samples.
Canadian Journal of Fisheries and Aquatic Sciences, 70(8), 1123-1130.
Pilliod, D.S., Goldberg, C.S., Arkle, R.S. and Waits, L.P. (2014). Factors influencing detection of
eDNA from a stream dwelling amphibian. Molecular Ecology Resources, 14, 109–116.
Pincock, D. G. and Johnston, S. V. (2012). Acoustic telemetry overview. In: Telemetry
Techniques: a User’s Guide for Fisheries Research (eds Adams, N. S., Beeman, J. W. and
Eiler, J. H.). American Fisheries Society, Bethesda, Maryland.
Port, J. A., J. L. O'Donnell, O. C. Romero-Maraccini, P. R. Leary, S. Y. Litvin, K. J. Nickols, K.
M. Yamahara, and R. P. Kelly. 2016. Assessing vertebrate biodiversity in a kelp forest
ecosystem using environmental DNA. Molecular Ecology, 25, 527-541.
Potter, I. C., Tweedley, J. R., Elliott, M. and Whitfield, A. K. (2015). The ways in which fish use
estuaries: a refinement and expansion of the guild approach. Fish and Fisheries, 16(2), 230 -
239.
Potts, G.W. and P.J. Reay (1987). Fish. In: Baker, J. and Wolff, W. (Eds.), Biological Surveys of
Coasts and Estuaries. Cambridge University Press, Cambridge, pp. 342–373.
Prato, G., Thiriet, P., Di Franco, A. and Francour, P. (2017). Enhancing fish Underwater Visual
Census to move forward assessment of fish assemblages: An application in three
Mediterranean Marine Protected Areas. PLoS ONE, 12(6), e0178511.
https://doi.org/10.1371/journal.pone.0178511
Proctor, N., M. Elliott and J.H. Allen (2000) Fish Impingement Assessment: South Humber Bank
Power Station, UK 1999–2000. Institute of Estuarine and Coastal Studies, University of Hull,
Hull. Report to Humber Power Limited, South Humber Bank Power Station, Stallingborough,
UK.
Proctor, N., M. Elliott and Allen, J.H. (2001) Fish Impingement Assessment: South Humber
Bank Power Station, UK 2000–2001. Institute of Estuarine and Coastal Studies, University of
Hull, Hull. Report to Humber Power Limited, South Humber Bank Power Station,
Stallingborough, UK.
Roberts, L., Pérez-Domínguez, R. and Elliott, M. (2016). Use of baited remote underwater video
(BRUV) and motion analysis for studying the impacts of underwater noise upon free ranging fish
and implications for marine energy management. Marine Pollution Bulletin, 112, 75-85.
Rochard, E., Boet, P., Castelnaud, G., Gauthiez, F., Bigot, J.F. and Ballion, B. (1997). Premier
inventaire ichtyologique de la partie basse de l’estuaire de Seine. Programme Seine Aval –
thème édifices biologiques, France, pp. 8–31. Rapport 1996/FIN-4.
Rotherham, D., Underwood, A. J., Chapman, M. G. and Gray, C. A. (2007). A strategy for
developing scientific sampling tools for fishery-independent surveys of estuarine fish in New
South Wales, Australia. ICES Journal of Marine Science, 64(8), 1512-1516.
88
Rozas, L.P. and Minello, T.J. (1997). Estimating densities of small fishes and decapod
crustaceans in shallow estuarine habitats: a review of sampling design with focus on gear
selection. Estuaries, 20, 199–213.
Samedy, V., Wach, M., Lobry, J., Selleslagh, J., Pierre, M., Josse, E. and Boët, P. (2015).
Hydroacoustics as a relevant tool to monitor fish dynamics in large Estuaries. Fisheries
Research 172, 225–233.
Sauriau, P. G., Robin, J .P. and Marchand, J. (1992). Effects of excessive organic enrichment of
the Loire estuary on the downstream migratory patterns of the amphihaline grey mullet Liza
ramada (Pisces: Mugilidae). In: Kyer, J., and Olsen, E. (Eds.), Changes in Fluxes in Estuaries –
Implications from Science to Management., Olsen and Olsen, Fredensborg, Denmark, pp. 349–
356.
Schobernd, Z.H., Bacheler, N.B. and Conn, P.B. (2013). Examining the utility of alternative
video monitoring metrics for indexing reef fish abundance. Canadian Journal of Fisheries and
Aquaculture Science, 71, 464-471.
Seafish (2015) Basic fishing methods. A comprehensive guide to commercial fishing methods.
Seafish publication. Available at:
https://www.seafish.org/media/Publications/BFM_August_2015_update.pdf
Sigsgaard, E. E., I. B. Nielsen, S. S. Bach, E. D. Lorenzen, D. P. Robinson, S. W. Knudsen, M.
W. Pedersen, M. A. Jaidah, L. Orlando, E. Willerslev, P. R. Møller and P. F. Thomsen (2016).
Population characteristics of a large whale shark aggregation inferred from seawater
environmental DNA. Nature Ecology and Evolution, 1, 0004.
Stebbing, P., Murray, J., Whomersley, P. and Tidbury, H. (2014). Monitoring and surveillance for
non-indigenous species in UK marine waters. A Cefas report to Defra.
Stephens, P. A., Pettorelli, N., Barlow, J., Whittingham, M. J. and Cadotte, M. W. (2015).
Management by proxy? The use of indices in applied ecology. Journal of Applied Ecology,
52(1), 1-6.
Strong, J.A., Andonegi, E., Bizsel, K.C., Danovaro, R., Elliott, M., Franco, Garces, E., Little, S.,
Mazik, K., Moncheva, S., Papadopoulou, N., Patrício, J., Queirós, A.M., Smith, C., Stefanova, K.
and Solaun, O. (2015). Marine biodiversity and ecosystem function relationships: The potential
for practical monitoring applications. Estuarine, Coastal and Shelf Science, 161, 46-64.
Thiel, R. (1996). The impact of fish predation on the zooplankton community in a southern Baltic
Bay, Germany. Limnologica, 26, 123–137.
Thiel, R., A. Sepulveda, R. Kafemann and W. Nellen (1995). Environmental factors as forces
structuring the fish community of the Elbe estuary. Journal of Fish Biology, 46, 47–69.
Thiel, R., T. Mehner, B. Köpcke and R. Kafemann (1996). Diet niche relationships among early-
life stages of fish in German estuaries. Marine and Freshwater Research, 47, 123–136.
89
Thompson, D.B. and Ben-Yami, M. (1984). Fishing gear selectivity and performance. In: Papers
presented at the Expert Consultation on the regulation of fishing effort (fishing mortality). Rome,
17–26 January 1983. A preparatory meeting for the FAO World Conference on fisheries
management and development. FAO Fish.Rep. (289) Suppl.2: 214 p. Available at:
http://www.fao.org/3/AC749E08.htm#ch8 [last accessed 28/03/2019]
Thompson, S.K. (2012). Sampling. Third edition. Wiles series in probability and statistics. John
Wiley and Sons, Hoboken, NJ, USA.
Thomsen, P.F., Kielgast, J., Iversen, L.L., Møller, P.R., Rasmussen, M. and Willerslev, E.
(2012). Detection of a diverse marine fish fauna using environmental DNA from seawater
samples. PloS ONE 7: e41732.
Thorstad, E. B., Økland, F., Rowsell, D. and McKinley, R. S. (2000). A new system for automatic
recording of fish tagged with coded acoustic transmitters. Fisheries Management and Ecology
7, 281–294.
Thorstad, E. B., Rikardsen, A. H., Alp, A. and Økland, F. (2013). The use of electronic tags in
fish research – an overview of fish telemetry methods. Turkish Journal of Fisheries and Aquatic
Sciences 13, 881–896.
Valentini, A., Taberlet, P., Miaud, C., Civade, R., Herder, J., Thomsen, P. F., Bellemain, E.,
Besnard, A., Coissac, E., Boyer, F., Gaboriaud, C., Jean, P., Poulet, N., Roset, N., Copp, G.H.,
Geniez, P., Pont, D., Argillier, C., Baudoin, J.-M., Peroux, T., Crivelli, A.J., Olivier, A.,
Acqueberge, M., Le Brun, M., Møller, P.R., Willerslev, E. and Dejean, T. (2016). Next-
generation monitoring of aquatic biodiversity using environmental DNA metabarcoding.
Molecular Ecology, 25(4), 929-942.
Watson, D.L., Harvey, E.S., Anderson, M.J. and Kendrick, G.A. (2005). A comparison of
temperate reef fish assemblages recorded by three underwater stereo-video techniques. Marine
Biology, 148(2), 415–25.
Wiebe, P.H. and Benfield, M.C. (2009). Zooplankton sampling with nets and trawls. In: Thorpe,
S.A. (Ed.), Encyclopedia of ocean sciences: measurement techniques, sensors and platforms.
Elsevier, London, pp. 70-88.
Wilding, T. A., Sayer, M. D. J., and Gibson, R. N. (2001a). Procedural Guideline No. 4-1
Sampling benthic and demersal fish populations in subtidal rock habitats. In J. B. Jon Davies
(senior editor), Martin Bradley, David Connor, Janet Khan, Eleanor Murray, William Sanderson,
Caroline Turnbull and Malcolm Vincent (Ed.), Marine Monitoring Handbook March 2001: JNCC.
http://jncc.defra.gov.uk/PDF/MMH-mmh_0601.pdf
Wilding, T. A., Gibson, R. N. and Sayer, M. D. J. (2001b). Procedural Guideline No. 4-2
Recording benthic and demersal fish in dense vegetative cover. In J. B. Jon Davies (senior
editor), Martin Bradley, David Connor, Janet Khan, Eleanor Murray, William Sanderson,
Caroline Turnbull and Malcolm Vincent (Ed.), Marine Monitoring Handbook March 2001: JNCC.
http://jncc.defra.gov.uk/PDF/MMH-mmh_0601.pdf
90
Wilding, T. A., Gibson, R. N. and Sayer, M. D. J. (2001c). Procedural Guideline No. 4-3
Sampling benthic and demersal fish populations on sediments. In J. B. Jon Davies (senior
editor), Martin Bradley, David Connor, Janet Khan, Eleanor Murray, Wil liam Sanderson,
Caroline Turnbull and Malcolm Vincent (Ed.), Marine Monitoring Handbook March 2001: JNCC.
http://jncc.defra.gov.uk/PDF/MMH-mmh_0601.pdf
Wilding, T. A., Sayer, M. D. J. and Gibson, R. N. (2001d). Procedural Guideline No. 4-1
Sampling benthic and demersal fish populations in subtidal rock habitats. In J. B. Jon Davies
(senior editor), Martin Bradley, David Connor, Janet Khan, Eleanor Murray, William Sanderson,
Caroline Turnbull and Malcolm Vincent (Ed.), Marine Monitoring Handbook March 2001: JNCC.
http://jncc.defra.gov.uk/PDF/MMH-mmh_0601.pdf
WFD-UKTAG (2014). UKTAG Transitional Water Assessment Method Fish Fauna. Transit ional
Fish Classification Index. July 2014. ISBN: 978-1-906934-32-3
https://www.wfduk.org/sites/default/files/Media/Characterisation%20of%20the%20water%20envi
ronment/Biological%20Method%20Statements/TW%20Fish%20UKTAG%20Method%20Statem
ent.pdf
Wilcox, T. M., K. S. McKelvey, M. K. Young, A. J. Sepulveda, B. B. Shepard, S. F. Jane, A. R.
Whiteley, W. H. Lowe, and M. K. Schwartz. 2016. Understanding environmental DNA detection
probabilities: A case study using a stream-dwelling char Salvelinus fontinalis. Biological
Conservation 194:209-216
Yamamoto, S., R. Masuda, Y. Sato, T. Sado, H. Araki, M. Kondoh, T. Minamoto, and M. Miya.
2017. Environmental DNA metabarcoding reveals local fish communities in a species-rich
coastal sea. Scientific Reports 7:40368
Zhou X, Li Y, Liu S, Yang Q, Su X, Zhou L, Tang M, Fu R, Li J, Huang Q. 2013. Ultra -deep
sequencing enables high-fidelity recovery of biodiversity for bulk arthropod samples without
PCR amplification. GigaScience 2: 4.
Related Documents