MONITORING & IMPLEMENTATION REPORT VCS Version 3, CCB Standards Third Edition v3.0 1 MONITORING & IMPLEMENTATION REPORT Prepared by: Project Title Amazon Rio REDD+ IFM Reduction of GHG emissions avoided by degradation Version 1.3 Report ID MIR_EBCF_REDD_0116 Date of Issue 06-Junho-2016 Project ID VCS project database ID, if registered Monitoring Period 17 - August - 2012 to 29- March -2016 Prepared By Original Trade Consultoria Especializada Contact Avenida André Araújo, 2936 – Edifício Incubadora do INPA, sala 10, Cep. 69.060-000, Manaus-AM, Brazil. 0055 92 981590997; [email protected]; originaltrade.net

Welcome message from author
This document is posted to help you gain knowledge. Please leave a comment to let me know what you think about it! Share it to your friends and learn new things together.
Transcript

MONITORING amp IMPLEMENTATION REPORT VCS Version 3 CCB Standards Third Edition
v30 1
MONITORING amp
IMPLEMENTATION REPORT
Prepared by
Project Title
Amazon Rio REDD+ IFM
Reduction of GHG emissions avoided by degradation
Version 13
Report ID MIR_EBCF_REDD_0116
Date of Issue 06-Junho-2016
Project ID VCS project database ID if registered
Monitoring Period 17 - August - 2012 to 29- March -2016
Prepared By Original Trade Consultoria Especializada
Contact
Avenida Andreacute Arauacutejo 2936 ndash Edifiacutecio Incubadora do INPA sala 10 Cep
69060-000 Manaus-AM Brazil
0055 92 981590997 tezzanetooriginaltradenet originaltradenet
MONITORING amp IMPLEMENTATION REPORT VCS Version 3 CCB Standards Third Edition
v30 2
Project Name Amazon Rio REDD+ IFM
Reduction of GHG emissions avoided by degradation
Localization
Project Brazil Amazonas State Manicoreacute City
Project Proponent EBCF ndash Empresa Brasileira de Conservaccedilatildeo Florestal
Contato Leonardo Barrionuevo (CEO) Leonardoebcfcombr ndash fone +1 305-
321-4577
Auditor Rainforest Alliance (Klaus Geiger kgeigerraorg Tel +1 (802)923-3766) e
Imaflora (Bruno B Souza brunoimafloraorg Tel +55 (19) 98324 5522
Project start date August 17 2012 crediting period of 37 years 37 years of project time (can be
extended for longer)
Period Covered by
the PIR 17 - August - 2012 to 29- March -2016
Historical status
CCBA No history first proposition (Validation and Initial verification)
Edition CCBA
Standard
CCBA 2013 Climate Community amp Biodiversity Standards Third Edition
CCBA Arlington VA USA December 2013 At wwwclimate-standardsorg
Summary of the
results generated
by the project
As expected there was no logging activity in the project areas as occurred
effective control of deforestation in both areas of the project and in the
surrounding communities With this REDD + project EBCF shows a reduction of
emissions in the order of 43087368 tCO2e to the balance sheet reductions and
emissions between the years 2011 until 2015 The project conducted a sense of
basic social conditions the activities of zoning and implementation of
sustainability matrix This set of instruments will be used for the planning of
future activities as well as measure the different dimensions of local social
progress The benefits to biodiversity present in the drastic reduction of
MONITORING amp IMPLEMENTATION REPORT VCS Version 3 CCB Standards Third Edition
v30 3
deforestation since the project implementation Also if conducted preliminary
studies on the management plan to monitor the practice of hunting in the area It
was also initiated the activities related to health and income generation in
partnership with local communities
Gold Level Criteria On the climate issue is understood that balanced ecosystems have greater
ecological and social resilience and adaptability to climate change whether
through the protection of water bodies and flow regulation of rivers on the peaks
of flood and drought is the regular supply food products and environmental
services From the social point of view the project has a strong presence along
the clearly marginalized populations the social care system of the State and was
strategies interact with the communities to give more visibility to women elderly
and children Exceptional benefits for biodiversity are realized on the fact that
the Amazon River project present several qualifying attributes of High
Conservation Values such as endemic species and or rare and have several
species protected by specific legislation prohibiting cutting such as the Brazil
Nuts tree rubber tree and mahogany
Date of
Completion of this
PIR
10 September 2016
Expected schedule
check Periodic every 5 (five) years
MONITORING amp IMPLEMENTATION REPORT VCS Version 3 CCB Standards Third Edition
v30 4
SUMAacuteRIO
1 GENERAL 10
11 Summary Description of the Project 10
12 Project Objectives 12
13 Project location 13
14 Project Proponent (G4) 16
15 Other Entities Involved in the Project (G4) 16
11 Project Start Date 17
12 Project Crediting Period 17
2 DESIGN 17
21 Sectoral Scope and Project Type 17
22 Project Financing 18
23 Employment Opportunities and Worker Safety 19
24 Stakeholders (G3) 19
25 Respect for Rights and no Involuntary Relocation 25
3 APPLICATION OF METHODOLOGY 27
31 Title and Reference of Methodology 27
32 Methodology Deviations 28
33 Project Boundary 28
34 Baseline Scenario 32
35 Additionality 33
4 MONITORING AND PARAMETERS OF DATA 33
41 Monitoring Plan Description 33
411 Monitoring Impacts to Biodiversity 36
412 Monitoring Social Impacts 37
5 MEASUREMENT OF GHG EMISSIONS REDUCTIONS AND REMOVALS (CLIMATE) 38
51 Emissions Baseline 38
52 Project emissions 38
53 Leakage 38
54 Summary of GHG Emission Reductions And Removals 39
MONITORING amp IMPLEMENTATION REPORT VCS Version 3 CCB Standards Third Edition
v30 5
55 Climate Change Adaptation Benefits (GL1) 39
6 COMMUNITY 40
61 Positive Impacts for Communities (CM1) 40
62 Negative Impacts (CM2) 41
7 BIODIVERSITY 41
71 Positive Impacts for Biodiversity (B1) 41
72 Negative Impacts on Biodiversity (B2) 42
73 Exceptional Benefits for Biodiversity (GL3) 42
8 ADICIONAL INFORMATION 42
REFERENCES 43
TABLES
Table 01 - Project implementation and opperational costs 18
Table 02 - Implementation schedule and next activities 22
Table 03 - Greenhouse gas emissions sources and sinks associated with baseline and project activities 31
Table 04 - Summary of areas managed since 1999 33
Table 05 - 2011-2016 Project Activity Emissions 38
Table 06 - Summary of ex ante estimates 39
FIGURES
Figure 01 - Location of the Municipality of Manicoreacute - AM 13
Figure 02 - Location areas I II III and IV of the Amazon Rio Project 14
Figure 03 - Project Zone and communities of the project 14
Figure 04 - Location of the communities surrounding the Amazon Rio areas I II III and IV 20
Figure 05 - Workshop I Free Prior and Informed Consent for the development of the REDD+ project by
the community leaders of Democracia Aacutegua Azul Satildeo Joseacute do Miriti Vista Alegre Jatuarana Terra
Preta do Ramal Pandegal Santa Maria Santa Eva and Terra Preta do Rio Mancoreacute 26
Figure 06 - Workshop II Free Prior and Informed Consent for the development of the REDD+ project
by the community leaders of Urucury Mocambo Boa Esperanccedila and Satildeo Joatildeo amp Ponta Grossa 26
Figure 07 - Workshop III Free Prior and Informed Consent for the development of the REDD+ project
by the Kamayuaacute indigenous community 27
Figure 08 - Project Boundaries a) Direct Project interference limits b) Total Project Area (G1 Indicator
7) 28
Figure 09 - Project Area forest types 29
Figure 010 - EBCF REDD Project and buffer areas deforestation figures (source HDOM Report) 42
MONITORING amp IMPLEMENTATION REPORT VCS Version 3 CCB Standards Third Edition
v30 6
ANNEXES
ANNEX 1 Operations License Summary (Resumo das LOs)
ANNEX 2 Logging Plan ldquoValdenor IIrdquo (Plano de Manejo Valdenor II)
ANNEX 3 Logging License Registration PAAM (Cadastro para exploraccedilatildeo florestal PAAM)
ANNEX 4 Operations Licenses and Annual Production Units (LOs and UPAs)
ANNEX 5 Vegetation Maps (Mapas de Fitofisionomia)
ANNEX 6 Annual Operation Plan and Forest Logging Authorization (POAs a AUTEX)
ANNEX 7 Forest Inventory 100 UPA 6 (Inventaacuterio Florestal 100 UPA 6 (2007))
ANNEX 8 Expedited Forest Inventory - 2013 (Inventario Florestal Expedito - 2013)
ANNEX 9 Amazon Rio I RPDS Management Plan (Plano de Gestatildeo da RPDS Amazon Rio I
ANNEX 10 Free Prior and Informed Consent (FPIC) (Consentimento Livre Previo e Informado)
ANNEX 11 Land Titles (Escrituras)
ANNEX 12 Support Letters from Government Bodies (Cartas de apoio dos oacutergatildeos do Governo)
ANNEX 13 Sales Declaration from Gethal (Declaraccedilotildees de venda Gethal)
ANNEX 14 Gethal SmartWood Certification (Certificaccedilatildeo SmartWood Gethal)
ANNEX 15 Greenpeace article on timber companies in the Amazon (Relatoacuterio Greenpeace sobre
madeireiras da Amazocircnia)
ANNEX 16 Cash Flow Analysis (Anaacutelise fluxo de caixa)
ANNEX 17 Financial Analysis ndash Baseline and Additionality (Analise financeira ndash linha de base e
adicionalidade)
ANNEX 18 Emissions Calculation Spreadsheet (Planilha de calculos de emissotildees)
ANNEX 19 EBCF Core-business (Core-business da EBCF)
ANNEX 20 EBCFrsquos Undertanding of Project Risks and Barriers (Entendimentos da EBCF sobre
riscos)
MONITORING amp IMPLEMENTATION REPORT VCS Version 3 CCB Standards Third Edition
v30 7
ANNEX 21 EBCFrsquos Energy Use and Transport (EBCF consumo de energia e transporte)
ANNEX 22 Non-Permanence Risk AnalysisBuffer (Analise de risco de nao permanecircnciabuffer)
ANNEX 23 Forest Biomass Inventory - 2016 (Inventaacuterio de Biomassa Florestal - 2016)
ANNEX 24 Deforestation repport_ 2016 (Relatoacuterio Teacutecnico Desmatamento_2016)
ANNEX 25 Consultive Concill (Documento conselho consultivo)
ANNEX 26 Community Sensus (Senso Comunidades 2013)
ABBREVIATIONS
AFOLU Agriculture Forestry and Other Land Use
ANTAQ National Agency for Waterway Services (Agecircncia Nacional de Transportes Aquaviaacuterios)
AP Project Area
APD Avoided Planned Deforestation
APP Areas of Permanent Preservation (Aacutereas de Preservaccedilatildeo Permanente)
ATER Technical Assistance and Rural Development (Assistecircncia Teacutecnica e Extensatildeo Rural)
AUTEX Logging Authorization (Autorizaccedilatildeo de Exploraccedilatildeo Florestal)
CAAD Council of Agro-Extrativist Associations of Democracia (Conselho das Associaccedilotildees
Agroextrativistas de Democracia)
CAAM Council of Agro-Extrativist Associations of Manicoreacute (Conselho das Associacoes
Agroextrativistas de Manicoreacute)
CDM Clean Development Mechanism
CFI Continuous Forest Inventory
CNS National Council of Extractivist Populations (Conselho Nacional das Populaccedilotildees
Extrativistas)
CRA Environmental Reserve Quotas (Cotas de Reserva Ambiental)
DBH Diameter at Breast Height
DETER Real Time Deforestation Detection System
DOF Document of Forest Origin (Documento de Origem Florestal)
EIA Environmental Impact Assessment
FAS Amazonas Sustainable Foundation (Fundaccedilatildeo Amazonas Sustentaacutevel)
FSC Forest Stewardship Council
FUNAI National Indigenous Peoples Foundation (Fundaccedilatildeo Nacional do Iacutendio)
GHG Greenhouse Gases
GIS Geographic Information System
HCV High Conservation Value
IBAMA Brazilian Institute of Environment and Renewable Natural Resources (Instituto Brasileiro
MONITORING amp IMPLEMENTATION REPORT VCS Version 3 CCB Standards Third Edition
v30 8
do Meio Ambiente e dos Recursos Naturais Renovaacuteveis)
ICU Intensive Care Unit
IDAM Institute of Agricultural and Forestry Development of the State of Amazonas (Instituto de
Desenvolvimento Agropecuaacuterio e Florestal do Estado do Amazonas)
IEA International Energy Agency
IEB International Institute of Education of Brazil (Instituto Internacional de Educaccedilatildeo do
Brasil)
IFM-LtPF Improved Forest Management - Logged to Protected Forest
IMAZON Institute of Man and Environment in the Amazon (Instituto do Homem e Meio Ambiente
da Amazocircnia
INPE National Institute for Space Research (Instituto Nacional de Pesquisas Espaciais)
IPAAM Amazon Institute of Environmental Protection (Instituto de Proteccedilatildeo Ambiental do
Amazonas)
IPCC Intergovernmental Panel on Climate Change
LR Legal Reserve (Reserva Legal)
MCT Ministry of Science and Technology (Ministeacuterio da Ciecircncia e Tecnologia)
MMA Ministry of Environment (Ministeacuterio do Meio Ambiente)
MP Monitoring Plan
NTFP Non-Timber Forest Product
PD Project Description
PES Payment for Environmental Services
POA Annual Operational Extraction Plan (Plano Operacional Anual de Extraccedilatildeo)
PPE Personal Protective Equipment
PROARCO Program for the Prevention and Control of Forest Fires in the Arc of Deforestation
(Programa de Prevenccedilatildeo e Controle agraves Queimadas e Incecircndios no Arco do Desflorestamento)
PROBUC Program for Monitoring Biodiversity and Use of Natural Resources in Conserveation Units
(Programa de Monitoramento da Biodiversidade e Uso do Recursos Naturais em UCs)
PRODES Program to Calculate Deforestation in the Amazon (Programa de Caacutelculo do
Desflorestamento da Amazocircnia)
RDS Sustainable Development Reserves (Reservas de Desenvolvimento Sustentaacutevel)
RPDS Private Reserves for Sustainable Development (Reserva Particular de Desenvolvimento
Sustentaacutevel)
RPPN Private Reserve of Natural Heritage (Reserva Particular do Patrimocircnio Natural)
SAD Deforestation Allert System (Sistema de Alerta de Desmatamento)
SDS Secretary of the State for the Environment and Sustainable Development of Amazonas
(Secretaria de Estado do Meio Ambiente e Desenvolvimento Sustentaacutevel do Amazonas)
SEUC State System of Conservation Units (Sistema Estadual de Unidades de Conservaccedilatildeo)
MONITORING amp IMPLEMENTATION REPORT VCS Version 3 CCB Standards Third Edition
v30 9
SFM Sustainable Forest Management
SFMP Sustainable Forest Management Plan
UC Conservation Units (Unidade de Conservaccedilatildeo)
UEA State University of Amazonas (Universidade Estadual do Amazonas)
UFAM Federal University of Amazonas (Universidade Federal do Amazonas)
UNFCCC United Nations Framework Convention on Climate Change
UPA Annual Production Unit (Unidade Produtiva Anual)
VCU Verified Carbon Unit
WBCSD World Business Council for Sustainable Development
WRI World Resources Institute
MONITORING amp IMPLEMENTATION REPORT VCS Version 3 CCB Standards Third Edition
v30 10
1 GENERAL
11 Summary Description of the Project
The Amazon Rio project consists of the conservation of a mosaic of four private areas called
Amazon Rio I II III and IV which add up to 20387 hectares (ha) of primary forest located in the
municipality of Manicoreacute in the state of Amazonas The projects target area is characterized by
being a region of sedimentary Solimotildees Basin dominated by Alluvial Holocene Iccedilaacute Training and
Detritus-lateritic formation The relief is of the flat type with primary vegetation formation consisting
of areas of land floodplain and some formations igapoacute due to the influence of Rio Manicoreacute
The Amazon Rio areas dominated forests of humid tropical rainforest Lowlands emerging Canopy
and Forest Open Rain Lowlands with palm trees (79) the Atlantic rain forest Alluvial emerging
canopy (11) Rain Forest Open Alluvial with palm trees (8) Pioneer formations influenced
fluvial and or lacustrine - herbaceous and shrubby with palm trees (1)
The main focus of the project is (i) the conservation of forest ecosystems and biodiversity (ii) the
sustainable social development of the region including the promotion of ecotourism and scientific
research and (iii) the reduction in carbon dioxide (CO2) emissions through the prevention of
deforestation and forest degradation
In 1998 a logging plan for logging activities was approved by the authorized environmental
agencies on 19800 ha of land over a period of 25 years (the total area does not include
Permanent Preservation Areas (APP) and water bodies Between 1999 and 2010 434769 ha
were degraded due to an authorized logging operation (Annexes 1 2 3 and 4) In February 2011
the area was acquired by the Empresa Brasileira de Conservaccedilatildeo de Florestas (EBCF) which in
order to implement the objectives of the project made two important decisions to suspend the
logging operations underway in the project areas since 1999 and transform them into Private
Reserves for Sustainable Development (Reservas Particulares de Desenvolvimento Sustentaacutevel -
RPDSs) supported by State Law no 53 of June 2007 and Decree no 30108 of June 2010
With this new land use strategy 20387 ha of primary forest will be preserved avoiding the CO2
emissions that would have occurred without the implementation of the project Revenues obtained
from the carbon credits will be used to maintain the primary forest with the implementation of the
activities described in the Reserversquos Management Plan (Annex 9) including social programs and
environmental monitoring
The project intends to maintain financial sustainability through the sale of carbon credits obtained
from the conservation of the area and maintenance of environmental services Another source of
MONITORING amp IMPLEMENTATION REPORT VCS Version 3 CCB Standards Third Edition
v30 11
income planned by the project relates to the national market for legal reserve compensation
(Environmental Reserve Quota (Cotas de Reserva Ambiental (CRA) in Portuguese)1 Using these
two financial mechanisms for conservation the emission of approximately 2 million tons of carbon
dioxide into the atmosphere over a period of 37 years will be avoided
It is important to emphasize that the project area is crucial for conservation especially considering
its characteristics such as (i) high biological diversity and concentration of endemic and
pharmacological species (Section 7) (ii) extensive areas of plains which are important for the
reproduction and survival of many species of plants and animals especially birds and reptiles and
(iii) high potential for ecotourism and environmental education including scientific research
The creation of these private reserves also contributes to the consolidation of a strategy to
establish ecological corridors and mosaics in the region creating a territorial connection between
public and private conservation areas This situation reduces potential conflicts between the state
landowners and residents in the buffer areas and creates opportunities for implementing integrated
actions optimizing human and financial resources for environmental monitoring and control
actions
Another important fact to consider is the surrounding communities who use the project areas for
their own subsistence extracting non-timber forest products (eg nuts fruits oils vines) fishing
and hunting For that reason they have direct interest in the conservation of the forest to obtain
food economic security and maintain their cultural practices
The environmental benefits that the communities receive make them guardians of the forest
contributing significantly to the monitoring and controlling of illegal activities practiced in the region
such as logging fishing and poaching as well as supervision and control of forest fires In this
context the Amazon Rio project plays a role of great environmental importance for the region also
contributing to the improvement of livelihoods of the local population and consequently to the
conservation of the forest
A population of 350 families distributed among 15 communities is estimated to reside around the
area of the Amazon Rio project The environmental benefits provided by the implementation of the
project and Amazon Rio I RPDS Management Plan and posteriorly including Amazon Rio II III
and IV demonstrate a strong social development component and includes several socio-economic
support programs to local communities which promote sustainable development in the region
2 sect 2 Art 15 of the new Brazilian Forest Code (Law 126512012) provides for voluntary forest reserves ie the
excess of forest required by law on rural property According to this law all preserved area that exceeds the minimum required by law may be used for creation of environmental easement or Environmental Reserve Quotas in the same biome and State
MONITORING amp IMPLEMENTATION REPORT VCS Version 3 CCB Standards Third Edition
v30 12
The project will be implemented starting from the introduction of participatory processes ensuring
active involvement of the local communities around the area as in the aforementioned
development programs and in decision-making The community programs that aim to improve
access to health education and income generation will use the ldquoBolsa Florestardquo program as
reference a program of great relevance for payments for environmental services (PES) in the state
of Amazonas In the medium and long terms these programs intend to significantly improve the
living conditions of these communities strengthening their organizational and institutional capacity
including their productive environmental and financial sustainability
12 Project Objectives
General objective
The objectives of this project takes a holistic approach to the region and keep full affinity to the
recent statement of the United Nations in the design of the seventeen goals of Sustainable
Development2 (ODS) In this sense the project objectives have a direct relationship with some of
the ODS and take others as a source of inspiration for the implementation of activities in
partnership with local communities These guidelines will be key elements in the local discussion
process around the project activities
Thus it is assumed as a general objective of the project contribute to the maintenance of global
climate (goal 13) through the implementation of activities to prevent the emission of greenhouse
gases locally by replacing the forest selective logging for a project conservation of forest
biodiversity (goal 15) preserving the traditional culture of the population of surrounding
communities (goal 3) promoting income generation (goal 1 8) and contributing to local social
development (goals 2 5 4 6 7)
Specific objectives
Specifically the project aims to
2 The seventeen Sustainable Development Goals at the United Nations are (1) Ending poverty in all its
form everywhere (2) Ending eat hunger achieve food security improve nutrition (3) To ensure a healthy life and promote well-being for all (4) To ensure inclusive education equitable and quality (5) Achieving gender equality and empower all women (6) Ensure availability and sustainable water management (7) Ensure access energy reliable and sustainable (8) To promote sustained inclusive and sustainable economic growth (9) Building resilient infrastructure promote inclusive industrialization (10) To reduce inequality between and within countries (11) Making cities inclusive human settlements secure resilient (12) To ensure standards of sustainable consumption and production (13) Take urgent action to combat climate change (14) To preserve and promote the sustainable use of the oceans (15) To protect restore and promote the sustainable use of forests (16) To promote peaceful and inclusive societies for sustainable development (17) To strengthen the implementation mechanisms and revitalize the global partnership
MONITORING amp IMPLEMENTATION REPORT VCS Version 3 CCB Standards Third Edition
v30 13
1 Implement economic alternative activities to selective logging to generate revenue for the
project benefiting at least 300 families surrounding the target area
2 Reduce approximately 32 million tons of carbon dioxide as a result of project activities
3 To contribute to the maintenance of regional biodiversity through the preservation and
conservation of the forest
4 Contribute to improve educational processes and attention to regional health
5 Promote the inclusion and womens empowerment in the project area communities
13 Project location
Location
The Amazon Rio Project is located in the southern region of the state of Amazonas in the
municipality of Manicore (Figure 01) The waterway and air constitute arrival means to the city with
approximate distance of 333 km by air and 427 km by river is the starting point for the city of
Manaus the state capital The Project areas are near the Madeira River and between the
Sustainable Development Reserves (RDS) Rio Madeira and Rio Amapaacute (Figure 02)
Figure 01 - Location of the Municipality of Manicoreacute - AM
MONITORING amp IMPLEMENTATION REPORT VCS Version 3 CCB Standards Third Edition
v30 14
Figure 02 - Location areas I II III and IV of the Amazon Rio Project
Figure 03 - Project Zone and communities of the project
MONITORING amp IMPLEMENTATION REPORT VCS Version 3 CCB Standards Third Edition
v30 15
Specifically in the Amazon Rio area the dense Primary Tropical Ombrophylous Lowland Forest and
open Primary Tropical Ombrophylous Lowland Forest with palm trees (79) Dense Primary
Tropical Ombrophylous Alluvial Forest (11) Open Primary Tropical Ambrophylous Alluvial Forest
with palm trees (8) Pioneer Formations with fluvial andor lacustrine influence - herbaceous and
shrubby vegetation with palm trees (1) (Annex 5)
According to IBGEs soil database (2000) the Manicoreacute region is formed mainly of Latosols and
Argisols Also soils such as Gleysols Spodosols Alluvial soils Neosols Planosols Plinthosols and
Nitosols can be found The Brazilian Soil Classification System produced from surveys by the
Brazilian Agricultural Research company (EMBRAPA) between 2001 and 2006 corroborates the
classification information for that region
Alluvial soils are very common in this region These soils are found mainly on the banks of the
Madeira River The fertility levels are dystrophic and located on flat terrain Agricultural and
livestock activities are almost always practiced along the main alluvial stretches of the region The
most fertile soils that occur on the floodplains (vaacuterzea) are widely cultivated for temporary crops
such as beans rice watermelon and cassava
Climate and hydrography
The climate in the region of the Madeira River is humid equatorial (IBGE 2011) with an average
temperature of 27degC relative humidity ranging between 85 and 90 and annual rainfall between
2200 to 2800 mmyear (RADAMBRASIL 1974) Studies from the Amapaacute Rio RDS area indicate
that between the months of January and March rainfall intensity is greater with monthly rainfall
between 300 and 350 mm while the driest months are July and August with monthly averages
around 50 mm
Geographically the Amazon region is defined by watersheds formed by the rivers which flow into
the Amazon Rio and its mouth along the entire East coast of Brazil (RIBEIRO et al 1999) The
city of Manicoreacute is influenced mainly by the Madeira and Manicoreacute rivers which are respectively
white and black water rivers and contribute to the local climatic conditions combined with the
characteristics of the vegetation that includes forests meadows savanna (cerrado) and floodplains
(vaacuterzeas)
Economic context of land use
Southern Amazonas is an important region strategically to prevent advances in deforestation in the
Amazon However in recent years the region has been suffering successive deforestation events
from expanded farming activities contributing to the so-called arc of deforestation toward the
MONITORING amp IMPLEMENTATION REPORT VCS Version 3 CCB Standards Third Edition
v30 16
state of Amazonas Historically the arc of deforestation has advanced with the expansion of
agriculture in the states of Paraacute Mato Grosso Rondocircnia Tocantins and Maranhatildeo In recent
years pressures on forests have increased with the globalization of markets for meat and
soybeans in the Amazon and international development policies for the region (IDESAM 2011)
14 Project Proponent (G4)
Organization Name Empresa Brasileira de Conservaccedilatildeo de Florestas SA (EBCF)
Contact Person Leonardo Barrionuevo
Title President
Address Curitiba-PR Al Dr Carlos de Carvalho 555 Conj 231
Centro Curitiba ndash PR CEP 80430-180 Brazil
Escritoacuterio Manaus Av Djalma Batista 1661 Conj 1409 A Bloco B
Ed Business Tower Millenium Cep 69050-010 Manaus-AM Brazil
Telephone +55 41 3158 9800 | +55 41 9943 8005
Email leonardoebcfcombr
15 Other Entities Involved in the Project (G4)
Organization Name Original Trade Consulting
Role in the Project Update of the Amazon Rio REDD+ IFM Project Description (PD) (V20)
and coordination of certifcation process
Contact Person Joatildeo Batista Tezza Neto
Title Director
Address Avenida Andreacute Arauacutejo 2936 ndash Edifiacutecio Incubadora do INPA sala 10
Cep 69060-000 Manaus-AM Brazil
Telephone +55 92 981590997
Email tezzanetooriginaltradenet
MONITORING amp IMPLEMENTATION REPORT VCS Version 3 CCB Standards Third Edition
v30 17
Organization Name HDOM
Role in the Project Degradation and deforestation report Forest inventory for biomass
calculation purposes in the project area and support the PD review
Contact Person Francisco Higushi
Title Director
Address Av Maacuterio Ypiranga 315 Ed The Office sala 609 Adrianoacutepolis CEP
69057-002
Telephone + 55 92 98128 2561
Email fghiguchihdomcombr
11 Project Start Date
The project began on August 17 2012 when the board and EBCF shareholders formally approved
the companys Business Plan (Annex 27) which set out the objectives of conserving forests
through the REDD + provision of services and sustainable use of forest resources excluded
logging activities
12 Project Crediting Period
The first crediting period of the project is 37 years beginning on August 17 2012 and ending on 17
August 2049 This period is equivalent to the remaining 12 years of the first authorized
management plan (25 years from 1998) added to another 25 years in respect of a new forest
management plan that was intended as the common practice of forestry in Brazil The logging
activities could continue beyond 37 years aiming for a second crediting period
2 DESIGN
21 Sectoral Scope and Project Type
Project Scope Agriculture Forest and other Land Use (AFOLU)
Project Category Reduction Emission from Deforestation and Degradation from Planned
Deforestation (REDD-IFM)
MONITORING amp IMPLEMENTATION REPORT VCS Version 3 CCB Standards Third Edition
v30 18
Type of Activity Improved Forest Management - Logged to Protected Forest (IFM LfPF)
22 Project Financing
The carbon project integrates a broad vision of territorial management as part of the Management
Plan of the Amazon Rio Private Reservation I Accordingly it stipulates that all actions necessary
to implement this Plan should be enabled from resources obtained by payments for environmental
services such as carbon credits and CRAs
The idea is for the plan to serve as a management tool to provide technical and political support
support to negotiations with support institutions to receive investments that can make projects and
programs viable The expected revenues in the short and medium term to implement the
Management Plan will mostly come from payments for environmental services such as negotiated
carbon credits and CRAs in addition to projects that generate long-term income exclusively for the
communities such as ecotourism scientific research and harvest of non-timber forest products
In this context the main difference between a permanent protection private reserve (eg RPPN)
and a private sustainable development reserve (eg RPDS) is that the long-term financial viability
of sustainable reserves usage comes from the marketing of non-timber forest products with high
added value and other sustainable businesses in compensation for environmental services This
flow of resources is expected to occur during and after the implementation period The proposal is
that with external support and through their political representatives local communities will be able
to establish partnerships and contracts with companies cooperatives and industries interested in
supporting social and environmental initiatives in the project areas
These items are briefly listed below with their respective values regarding the implementation and
execution of the project part of which will be initially financed by the contribution of the partners as
mentioned above
Table 01 - Project implementation and opperational costs3
Component Value (R$) Share ()
Pre-Operating expenses R$ 1561904 361
Administrative expenses R$ 24069915 5568
Costs of VCS + CCB certification R$ 456670 106
3 Annex 16
MONITORING amp IMPLEMENTATION REPORT VCS Version 3 CCB Standards Third Edition
v30 19
Monitoring R$ 2820000 652
Social program related expenses R$ 6050000 1399
Carbon trading R$ 1188536 275
Taxes on income R$ 1680219 389
Taxes on profit R$ 5008435 1159
Interest 10 return on investment of shareholders R$ 396300 092
TOTAL R$ 43231980 10000
23 Employment Opportunities and Worker Safety
Despite the considerable local knowledge of the regionrsquos ecosystems and environments
technology is lacking related to the value added to products and environmental conservation
projects Besides these difficulties public service agents frequently indicate the use of techniques
and management practices that require high external inputs and major investments To overcome
these limitations the project intends to promote specific and culturally relevant trainings that include
workshops meetings courses and extended technical assistance to improve the knowledge and
skills of community leaders residents and employees of the project To complement such
trainings we intend to install diversified agroforestry systems to restore and reuse degraded
areas to encourage handicrafts and tourism and to improving the management of non-timber
forest products with emphasis on Brazil nuts andiroba copaiba and Acai As a result
management practices are expected to improve in the long-term as well as and the fostering of
local culture combining technical and scientific knowledge with traditional knowledge
24 Stakeholders (G3)
Consultation prior to the beginning of the project
The populations involved in the carbon project are direct users of forest resources that are present
in the Amazon Rio I II III amp IV areas for the practice of plant and animal extraction Initially they
were indicated by the Council of Agro-Extrativist Associations of Democracia (Conselho das
Associaccedilotildees Agroextrativistas de Democracia - CAAD) which gathers associations of residents
from ten communities located near the Amazon Rio I Reserve Following this indication the EBCF
hired the services of the consulting company CO2X Conservaccedilatildeo de Florestas Ltda to perform a
MONITORING amp IMPLEMENTATION REPORT VCS Version 3 CCB Standards Third Edition
v30 20
series of workshops and meetings to prepare the Amazon Rio I Management Plan (Annex 9) and
to develope the Amazon Rio REDD+ IFM project In these meetings different forms and spaces of
participation of the people and government and non-governmental institutions were discussed to
support the development and implementation of the Management Plan culminating in the creation
of an Advisory Council In these events conservation and fundraising strategies were presented to
the community among them the marketing of avoided emissions resulting from the suspension of
timber management activities The conduct of the Free Prior and Informed Consent (FPIC)
process was done in the communities surrounding the Amazon Rio I II III and IV areas during
three workshops in 2013 which had a very inclusive and participatory nature This document as
well as the minutes of the workshops participatory mapping Sustainability Matrix questionnaires
and presentations in PPT slides are available in Annex 104
Identification of stakeholders
There are 15 communities that will benefiot from the activities of the project and twelve of them
(Urucury Aacutegua Azul Vista Alegre Boa Esperanccedila Santa Eva Santa Maria Pandegal
Democracia Jatuarana Terra Preta do Ramal Kamayuaacute and Satildeo Joseacute do Miriti) are located in the
region surrounding Amazon Rio areas I and III and in the Rio Amapaacute Reserve on the Madeira
River and its tributaries One of the communities is formed by residents that integrate the
Agroextractivist Association Satildeo Joatildeo e Ponta Grossa which is located in the surroundings of the
Amazon Rio IV area Two communities Terra Preta do Rio Manicoreacute and Mocambo are located in
the region surrounding the Amazon Rio II on the bank of the Manicoreacute River(Figure 03)
Figure 04 - Location of the communities surrounding the Amazon Rio areas I II III and IV
4 This topic is thoroughly discussed in Section 37 of this document
MONITORING amp IMPLEMENTATION REPORT VCS Version 3 CCB Standards Third Edition
v30 21
Except for Terra Preta do Rio Manicoreacute Mocambo and Satildeo Joseacute do Miriti all of the communities
utilize the Rio Amapaacute RDS area either on a sporadic or seasonal basis to meet their food needs
(collecting various fruits fishing and hunting) for household and medicinal use (bark leaves and
plant parts considered by medical practices and traditional knowledge) and primarily for the sale of
various non-timber products especially the harvesting of Brazil nut accedilaiacute and copaiacuteba oil However
the trails roads and paths that provide access to the Amapaacute Rio RDS and Amazon Rio areas are
in a poor state of repair which hinders extraction practices especially the production of Brazil nuts
In addition to the 15 communities surrounding the Amazon Rio areas government organizations
directly involved with environmental issues in the region such as SDS the National Indian
Foundation (Fundaccedilatildeo Nacional do Iacutendio - FUNAI) City Hall and the City Council of Manicoreacute the
Secretary of Environment and Sustainable Development of Manicoreacute ICMBio and non-
governmental organizations such as FAS IEB CAAD CNS UFAM UEA were identified and
contacted to participate in the entire process of preparation of the Management Plan
Stakeholder meetings
To present and discuss the project in detail with representatives of 15 communities surrounding
the project area and support institutions three workshops in different locations were conducted
The subjects were presented in straightforward language in a culturally appropriate way so that
community representatives could understand relatively complex and unusual concepts such as
climate change greenhouse effect and payments for environmental services
The importance of forests for the mitigation and adaptation to climate change was emphasized to
convey the main objectives of the project to community representatives and in particular their role
in (i) absorbing carbon dioxide and release oxygen (ii) helping control climate processes on a
regional scale (iii) regulating the flow of rivers and erosion control and (iv) providing shelter and
food for most animals and plants on the planet The fact that 20 of global greenhouse gas
emissions come from the destruction of forests and in Brazil 70 of emissions come from
deforestation was also mentioned
During the workshops participants learned that steps can be taken to reduce the emissions of
greenhouse gases by investing in renewable energy sources such as solar energy wind energy
hydroelectric power plants electric cars and other more efficient ones Another option that
mitigates climate change was also highlighted that relates to the Amazon forest conservation and
the restoration of degraded areas through reforestation management of agricultural land and
establishment of agroforestry systems
MONITORING amp IMPLEMENTATION REPORT VCS Version 3 CCB Standards Third Edition
v30 22
After concepts were discussed it was explained to those present that the proposed project to be
carried out in the RPDS Amazon Rio I recently approved at the time and in the creation process
in the other Reserves has essentially one goal to financially reward those who preserve and
protect a forest threatened with deforestation and degradation the project aims (i) raise funds for
the implementation of the Management Plan programs and (ii) conserve forests and the associated
biodiversity It was also mentioned that the project is part of a new vision of the business strategy
since a logging plan was operational until 2010 associated with the emissions of greenhouse
gases In 2010 the practice was suspended by the owner who began investing in the creation of a
project focused on conservation and payment for environmental services with emphasis on the
voluntary carbon market
Implementation schedule
Table 2 - Implementation schedule and next activities
Ano Atividade
2010
EBCF performs the symbolic protocol creation of the first RPDs during the
seminar results and perspective of the State of Amazonas Conservation
Units held by the SDS
2011 EBCF submits the formal protocol to CEUC
2011 Meeting presentation EBCF for communities near the Amazon River I II III
and IV
2011
EBCF attended the informal invitation made by the management of RDS
Rio Amapaacute and representative CEUC - Silvia Elena the training workshop
and delivery portfolios ENVIRONMENTAL VOLUNTEERS AGENTS held in
the Boa Esperanccedila community
2011
EBCF participated in the event organized by the CAAD which had the
agenda General Assembly accountability of CAAD year 20092010 RDS
Management Plan Amapaacute Rio Bolsa Floresta Municipal Management
IDAM contribution contribution Covema IEBs contribution and delivery of
equipment for processing of acai held on 24032011 in the community of
MONITORING amp IMPLEMENTATION REPORT VCS Version 3 CCB Standards Third Edition
v30 23
Democracy and 25032011 in the Boa esperanccedila Community
2011 Inspection of CEUC on farms for approval on RPDs
2011 The board of EBCF makes his 1st visit the communities and farms
2011
EBCF in partnership with the Municipal Government of Manipur perform
the recovery local road (approximately 20KM) linking Democracia
community Jatuarana communities Terra Preta Community Santa Eva
and Vista Alegre
2012
Visit of the president and directors of EBCF the communities surrounding
the reserves together with the president of PATAC Marcelo Marder and
Andre Albuquerque president for socioeconomic communities report
presentation
2012 Business Plan Project approval and EBCF shareholders agreement
authorizing the start of the REDD project
2013 Workshop I - Diagnosis for the development of areas of the Amazon River
Management Plan I II III amp IV
2013 Visit communities to complement the workshop I for interviews with the
locals
2013 Meeting in CEUC after the second workshop to update the work with the
communities and the progress of the approval of the areas
2013
Technical meeting with the team CO2X Renascer and Human
Development EBCF in Curitiba for the review and evaluation of the first part
of the Management Plan (diagnosis) Definition of programs and
subprograms of the Plan identification of key issues potential threats and
opportunities with the creation of RPDSs definition of vision and action
strategy
MONITORING amp IMPLEMENTATION REPORT VCS Version 3 CCB Standards Third Edition
v30 24
2013
The Secretary of State for the Environment (SDS) officiated at the World
Environment Day the first Private Reserve Sustainable Development
(RPDs) of the Amazon with the signing of the decree no 86
2013 Workshop II - presentation of the carbon project as one of the fundraising
programs for the implementation of the Management Plan
2013 Field work with communities and farms for mapping biodiversity and
hunting and fishing grounds
2013 The EBCF performs a complete socioeconomic census in the surrounding
communities of RPDs
2013 Meeting with CEUC for delivery and presentation of the draft of RPDs
Amazon River Management Plan I
2013
Supplementary Meeting to communities who could not attend the
Workshop II amp III Workshop Creation of the Advisory Council for RPDs
Amazon River I
2013 The EBCF performs social and economic Census in Kamayuaacute community
2015 Realization of field activities for Biomass Inventory Estimation
2016 Vitor Belfort visit and launch of income-generating initiatives
2016 Distribution of medical kits for community health workers and launching the
Health Program in the Amazon
2016 Deforestation Report
2016 PD Review and preparation of the monitoring report
MONITORING amp IMPLEMENTATION REPORT VCS Version 3 CCB Standards Third Edition
v30 25
2016 REDD + Project Certification (VCS and CCV)
2016 Project planning for structuring the supply chain of vegetable oils
certificates
2017 Fundraising from the REDD project
2017 Ecotourism Project Design
2017 Workshop Achievement Participatory Planning Project REDD + activity
EBCF
2017 ProBUC Deployment
2018 Implementation of Voluntary Environmental Agent program
25 Respect for Rights and no Involuntary Relocation
In the three workshops explaining the Carbon project to 15 communities the eight REDD+
principles and the social and environmental safeguards were presented Those safeguards were
previously established in a series of meetings throughout the Amazon between 2009 and 2010
and included several Civil Society Organizations
It was emphasized in the workshops that compliance with these principles and safeguards under
REDD+ projects such as the Amazon Rio carbon project contributes to improving local
governance transparency of information public participation in decision-making coordination of
actions among different actors and respect and recognition of the rights of indigenous peoples and
traditional populations
Free Prior and Informed Consent (FPIC)
During the project workshops the concept of Free Prior and Informed Consent was presented to
the participants as well as the importance of social and environmental safeguards to ensure the
rights of communities in designing and developing the REDD+ project explained in the eight
principles The participants were asked whether they were in agreement and if there were other
MONITORING amp IMPLEMENTATION REPORT VCS Version 3 CCB Standards Third Edition
v30 26
principles or rights that should be included Some community individuals expressed their
agreement to the safeguards All participants at the three workshops raised their hands in support
of REDD+ project The consent was unanimous
A separate document describing the whole process of the Free Prior and Informed Consent has
been prepared and is available in Annex 10
Figure 05 - Workshop I Free Prior and Informed Consent for the development of the REDD+
project by the community leaders of Democracia Aacutegua Azul Satildeo Joseacute do Miriti Vista Alegre
Jatuarana Terra Preta do Ramal Pandegal Santa Maria Santa Eva and Terra Preta do Rio
Mancoreacute
Figure 06 - Workshop II Free Prior and Informed Consent for the development of the REDD+
project by the community leaders of Urucury Mocambo Boa Esperanccedila and Satildeo Joatildeo amp Ponta
Grossa
MONITORING amp IMPLEMENTATION REPORT VCS Version 3 CCB Standards Third Edition
v30 27
Figure 07 - Workshop III Free Prior and Informed Consent for the development of the REDD+
project by the Kamayuaacute indigenous community
3 APPLICATION OF METHODOLOGY
31 Title and Reference of Methodology
VCS VM0011 Methodology for Improved Forest Management ndash Logged to Protected Forest
(LtPF) Calculating the GHG Benefits from Preventing Planned Degradation version 10
MONITORING amp IMPLEMENTATION REPORT VCS Version 3 CCB Standards Third Edition
v30 28
32 Methodology Deviations
Whereas the VM0011 was developed in a context of homogeneous forests of temperate regions
some methodological adjustments were made related to the direct survey biomass in the field
since the project areas are comprised of very heterogeneous areas of rainforest including dryland
and floodplains Any technical documentation related to these methodological adjustments and
their justifications appear in Annex 23 (Forest Inventory 2016) prepared by the consulting firm
HDOM
33 Project Boundary5
The total area of the property is 20387 ha and a buffer zone was established around each of the
four areas in order to include communities that use the resources within their boundaries (Figure
7a) Project activity areas (for purposes of calculating the emissions reductions called the project
area or PA) are only those for which logging is permitted a total of 19800 ha (Figure 7b)
excluding the Permanent Preservation Areas (APPs) and bodies of water A logging plan has been
approved for this area for selective logging (Annexes 1 2 3 4 6 and 7)
Figure 08 - Project Boundaries a) Direct Project interference limits b) Total Project Area (G1
Indicator 7)
5 Ref section 22 of VM0011
MONITORING amp IMPLEMENTATION REPORT VCS Version 3 CCB Standards Third Edition
v30 29
Stratification of the project area
For purposes of inventorying local carbon stocks and project management the project area was
stratified into 3 groups of different forest types as indicated by the VM0011 according to the
vegetation map SIPAMRADAM (DPI 2002) The forest types present in the area are rain forest
types divided into 3 categories as follows
Dense Primary Tropical Ombrophylous Alluvial Forest
Dense Primary Tropical Ombrophylous Lowland Forest
Pioneer Formations
Figure 09 - Project Area forest types
Leakage areas
There is no direct leakage resulting from planned project activities since there will be neither
displacement of management activities to other areas after the cessation of the activities within the
project area nor market leakages The project Management Plan includes the monitoring of
MONITORING amp IMPLEMENTATION REPORT VCS Version 3 CCB Standards Third Edition
v30 30
possible unanticipated leakages around the project area as well as the need to report to the
competent authorities whenever logging activities are identified in these areas For more
information on leakage see chapters 52 and 55 of this document
Temporal boundaries
Crediting period of the project
The first crediting period of the project is 37 years beginning on August 17 2012 and ending on 17
August 2049 This period is equivalent to the remaining 12 years of the first authorized
management plan (25 years from 1998) added to another 25 years in respect of a new forest
management plan that was intended as the common practice of forestry in Brazil The logging
activities could continue beyond 37 years aiming for a second crediting period
Monitoring and Reporting Period
a) Monitoring of Baseline Emissions
The monitoring of Baseline Emissions must demonstrate that the protected forest area is in
accordance with the one specified in the PD The project limit will be monitored before each
verification throughout the crediting period through new inventory information and remote sensing
and GIS as applicable Thus the project will be able to update the baseline calculations based on
the actual remaining forest area (in case of loss of forest cover by disasters for example) and that
would be subject to forest management under a ldquowithout projectrdquo scenario
b) Monitoring of Project Emissions
Project emissions will be monitored annually and compiled in every monitoring report that will detail
in particular the
Monitoring of possible illegal harvesting of timber
Monitoring of areas subject to natural disturbances
Monitoring and quantification of emissions related to air and land travel related to project
activities
c) Monitoring of Leakage
Since there will be no leakages according to the VM0011 and AFOLU Requirements no leakage
monitoring will be necessary However to be conservative the project intends to monitor any
disturbances that might affect the carbon reservoirs Once some disturbance is registered the
project will report the incident to the relevant authorities and make the necessary adjustments to
MONITORING amp IMPLEMENTATION REPORT VCS Version 3 CCB Standards Third Edition
v30 31
the baseline For more details about the monitoring of leakages see chapters 52 and 55 of this
document
Carbon stocks
The biomass reservoirs considered by the project are related to above-ground and underground
biomass
Sources and sinks of GHGs
Table 02 below describes the emission sources and sinks of greenhouse gases associated with
the baseline activities and with the project
Table 03 - Greenhouse gas emissions sources and sinks associated with baseline and project
activities
Source Gas Included JustificationExplanation
Baselin
e
Biomass
CO2 Yes Main source of project emissions through forest
degradation harvested and commercialised
wood products deadwood and forest regrowth
CH4 No Conservatively excluded
N2O No Conservatively excluded
Other No -
Fossil Fuel
consumption
CO2 Yes Main source through fossil fuel use in
machinery and transportation of timber
CH4 Yes Conservatively included
N2O Yes Conservatively included
Other No -
Electricity
consumption
CO2 Yes Main source
CH4 No -
N2O No -
Other No -
Pro
ject
Biomass
CO2 Yes Main source through unexpected natural
disturbances such as forest fires etc
CH4 Yes Included but subject to significance
N2O Yes Included but subject to significance
MONITORING amp IMPLEMENTATION REPORT VCS Version 3 CCB Standards Third Edition
v30 32
Source Gas Included JustificationExplanation
Other No _
Fossil Fuel
consumption
CO2 Yes Main source through flights and ground travel
CH4 Yes Included but subject to significance
N2O Yes Included but subject to significance
Other No _
Electricity
consumption
CO2 Yes Main source
CH4 No _
N2O No _
Other No _
34 Baseline Scenario
The choice between alternative baseline scenarios was taken together with the analysis of
additionality using the latest version of the VCS Tool for the demonstration and assessment of
additionality in Agriculture Forestry and Other Land Use VCS projects in this case VT000167
(VCS 2012a) All possible scenarios as well as the analysis of methodology barriers (steps 211
and 212 of the VM0011) are present in the chapter below In this sense to avoid redundancy of
information refer to additionality analysis to find the steps 211 and 212 of the VM0011
The baseline scenario for the project identified as the most likely to occur was selective logging8
(continuation of Business As Usual - BAU) The reference scenario assumes 37 years of selective
logging according to the 25 year logging plan approved in August 1998 (Annex 6 - document
ValdII T01 POA 1998) that in the absence of project activities would be renewed in 2024 for
another 25 years until 2049
Under this scenario the full implementation of the timber logging plan occurs and which has
already resulted in the degradation of 434769 ha (see table below) The area would be harvested
selectively for timber sold in lumber markets Below is a summary of harvest areas between 1999
and 2010 showing the managed plots and the dates on which the harvests were authorized
6 Tool for the demonstration and assessment of an additional to the VCS project activities in Agriculture Forestry and Other
Uses (AFOLU) (V 30)
7 Adapted from ldquoTool for the Demonstration and Assessment of Additionality in AR CDM project Activitiesrdquo (V02) 8 Additional information about choosing the baseline are presented in section 46 (steps 1 and 2)
MONITORING amp IMPLEMENTATION REPORT VCS Version 3 CCB Standards Third Edition
v30 33
Table 04 - Summary of areas managed since 1999
Date Managed logged area (ha)
1999 58669 (Plot 1)
2000 688 (Plot 2)
2001 ndash 2002 8315 (Plot 3)
2003 ndash 2004 750 (Plots 3 and 4)
2005 ndash 2007 1082 (Plot 5)
2008 ndash 2009 49050 (Plots 5 and 6)
TOTAL 434769
35 Additionality
The additionality analysis of the Amazon Rio project REDD+ IFM was conducted with the latest
version of the VCS Tool for the demonstration and assessment of additionality in Agriculture
Forestry and Other Land Use VCS projects the VT000167
(VCS 2012a)
To generate the reductions in GHG emissions for the project the planned baseline activities
(sustainable forest management) were terminated by the project proponent and supplanted by
environmental conservation activities In this sense the project will be managed by EBCF with
the goal of creating a fund for administrative and accounting management especially to promote
environmental management and monitoring activities of carbon pools within the project area
Alternative activities planned in the project are the provisioning and valuation of environmental
services via carbon credits (VCUs) in conjunction with the sale of Environmental Reserve Quotas
(CRAs)
4 MONITORING AND PARAMETERS OF DATA
41 Monitoring Plan Description
Due to its innovative comprehensive and integrative character the project needs to be monitored
regularly so that its actions activities and impacts can be constantly measured and evaluated To
meet this requirement the monitoring process must meet three main objectives
MONITORING amp IMPLEMENTATION REPORT VCS Version 3 CCB Standards Third Edition
v30 34
i To serve as an internal management project tool
ii To collaborate as an instrument of collective learning from the communities and
social groups directly involved
iii To work as a means of communicating results and impacts to interested institutions
and society in general Furthermore it is important to consider that monitoring if
successful will transcend the managerial aspects of the project and strengthening
the plan
To facilitate the monitoring process instead of having a reference line (to compare interventions
before and after) the first year of monitoring will serve as the starting point whose information will
be regularly and systematically compared throughout the project
Next the initial plans for monitoring benefits to the climate community and biodiversity are
described wherein the community is committed to participatory precept and to the technical and
scientific rigor which is capable of following the possible negative and positive impacts on
environmental and social aspects in the project area and its surroundings
Monitoring of Climate Impacts
The Monitoring Plan (MP) aims to provide security in the periodic estimates of reduction in
emissions especially in monitoring changes in carbon stock Therefore emissions from the
implementation of the project ex post estimates of the activities and emissions from any leakages
and isolated disturbances (eg blowdown fires pests and diseases among others) can be
calculated
The construction of the PM of the climate benefits made in full compliance with the methodological
framework provided by VM0011 ndash IFM LPF (VCS 2011) and CCBA (2008) which consists of four
specific actions to be monitored
i Implementation and execution of the project
ii Dynamics and stock of the forest biomass
iii Deforestation and forest degradation
iv Periodic reviews of ex post emissions
Remote monitoring and surveillance of the project area
Measurement of alterations and biomass loss quantification present in the PA using land use
change detection is critical to make accurate estimates of GHG emissions that account for forest
biomass increases and losses
MONITORING amp IMPLEMENTATION REPORT VCS Version 3 CCB Standards Third Edition
v30 35
Thus the use of remote sensing by satellite images of medium spatial resolution can be applied
readily in the PA and surroundings in order to monitor land use dynamics over time particularly to
identify risks and threats to forested areas In situ verification will complement landscape analysis
in a GIS environment with the aim of quantifying spatializing and identifying conversion of forest
areas into other land uses environmental degradation and other possible changes that may occur
during the term of the project
As a complementary monitoring source the project will rely on the database and information
provided by Monitoring Program of the Brazilian Amazon Forest by Satellite 910
(Prodes Digital)
conducted by the National Institute for Space Research (Instituto Nacional de Pesquisas Espaciais
- INPE) according to the Plan for Prevention and Control of Deforestation in the Amazon
1112(PPCDAm) under the National Policy on Prevention and Control of Deforestation Such
information is available online in13
digital vector files for the public in general
Other tools will provide complementary information to the monitoring such as indicators of forest
degradation and hotspots (fires and wildfires) obtained from DETER 14
SAD 15
and PROARCO16
Information is available online for free in vector format These results will be systematically related
to field data for validating or disproving the occurred event so that the focuses of deforestation and
degradation can be identified remediated reported and consequently avoided as much as
possible
A surveillance system that allows permanent territorial monitoring and inhibits the entry of intruders
through entry points in the PA will also be deployed to control the transport flow In addition one
must investigate and identify risks and threats eg mapping hotspots and areas vulnerable to fire
to illegal logging to hunting and poaching and to invasions by third parties among others
At first we estimate an effective demand for structuring the electronic monitoring system which
includes the hiring of skilled professionals field equipment electronic equipment (digital cameras
GPS desktops and notebooks smartphones printers geoprocessing software and GIS among
others) vehicles andor motorcycles motorized boats for transportation and moving around and
the collection of high resolution satellite images Empowerment and training of all involved staff
9httpwwwobtinpebrprodesdigitalmetodologiahtml
10httpwwwobtinpebrprodesmetodologiapdf 11httpwwwmmagovbrflorestascontrole-e-prevenC3A7C3A3o-do-desmatamento 12httpwwwmmagovbrimagesarquivo80120PPCDAm_FINAL_PPCDAMPDF 13httpwwwobtinpebrprodesindexhtml 14httpwwwobtinpebrdeterdados 15httpwwwimazongeoorgbrdocdownloadsphp 16httpwwwdpiinpebrproarcobdqueimadas
MONITORING amp IMPLEMENTATION REPORT VCS Version 3 CCB Standards Third Edition
v30 36
and the surrounding communities will be necessary to make the system effective17
and a constant
stream of information directed to regional actors and other stakeholders
Strategic monitoring and access points to RPDS roads will also provide support to other MPs
including social and biodiversity conservation aspects especially in the logistic support of planned
field activities
Procedures for determining the permanent sample plots (PSPs) and measurement
The calculation of the stock and increase in forest biomass will be subsidized through the
installation of PSPs in the PA and its temporal monitoring through the Continuous Forest Inventory
(CFI) The methodology proposed by VCS (2011) suggests the use of permanent andor temporary
plots however it confirms the efficiency and accuracy of sample plots
In order to demonstrate the procedural and statistical rigor used all the sampling procedures the
PA forest stratification sampling design calculation of sampling intensity and other parameters
measured in PSPs to monitor biomass balance due to ingressmortality of individuals growth in
DBH and height will be presented in detail in the Annex (Annex 23 - Forest Inventory 2016)
To promote reliable forest biomass estimates standard operating procedures (SOPs) (Section 82)
will be used by the team executing the CFI
Monitoring frequency
The monitoring frequency parameters measured in the PSPs will be no greater than 5 years from
the first measurement Other relevant parameters to monitoring the PSPs like the change in land
use in the PA and surrounding areas such as deforestation forest degradation fire sources and
natural disturbances will be regularly monitored as a project routine operation organized and
archived annually
411 Monitoring Impacts to Biodiversity
Since animal inventories have not been conducted in Amazon Rio project areas (for this project
biological information for the Rio Amapaacute RDS management plan were used) a biodiversity
monitoring system that will follow the RAPELD methodology (Rapid surveys of various taxonomic
groups (RAP) for long-term ecological studies) (MAGNUSSON et al 2005)
The RAPELD method contributes to long-term research using rapid inventory assessments biotic
complementarity and land use planning in the Amazon This method increases adequate sampling
17Linking community monitoring to national Measurement Reporting and Verification for REDD+
MONITORING amp IMPLEMENTATION REPORT VCS Version 3 CCB Standards Third Edition
v30 37
probability of biologically diverse communities which require large areas and at the same time
minimize variation of abiotic factors that affect these communities with smaller areas sampling
Evaluation and selection of indicators will be conducted in accordance with the ProBUC model
however applicably to local reality results will be updated biennially from the first survey
Biodiversity indicators are being designed and planned as suggested in the Social and
Environmental Monitoring System of Protected Areas in the Brazilian Amazon (Sistema de
Monitoramento Socioambiental das Unidades de Conservaccedilatildeo da Amazocircnia Brasileira)1819
and
Methodology for Rapid Assessment and Prioritization of Protected Areas Management20
(Metodologia para Avaliaccedilatildeo Raacutepida e Priorizaccedilatildeo do Manejo de Unidades de Conservaccedilatildeo -
RAPPAM) in line with the experiences gained and disseminated by CEUC and ICMBIO previously
described
The empowerment accountability and shared management of biodiversity conservation is the
main focus of the methodological model adopted These actions create high expectations for
environmental management of the area as the biodiversity monitoring will be conducted by the
community members themselves along with the project proponent promoting a local multiplier
effect It is worth mentioning that strict compliance with these procedures is in within EBCF`s
interest since it considers them to be key to the success of the project
The project begins with the premise that any negative impact on biodiversity in the project area
and its surroundings will not occur In the opposite sense the project aims to generate and provide
greater understanding of the territory subsidizing proposals for the conservation and sustainable
use through adoption of good management practices of natural resources as well as its replication
in other locations
412 Monitoring Social Impacts
The monitoring of social aspects include both the collection of numerical data such as quantity
volume weight (quantitative indicators) as well as information expressing opinions and
experiences (qualitative indicators) remembering that such measures are compatible and
interchangeable Data collection should be systematic and have a pre-established rate and most
likely a single indicator will require several data collection instruments such as plans field records
reports etc
Social information will be monitored through the use of participatory methodologies In this sense
the preparation process of the Amazon Rio I RPDS Management Plan was a first step For the
18Indicator Design 19Social and Environmental Monitoring of Protected Areas System in the Brazilian Amazon (Sistema de Monitoramento
Socioambiental das Unidades de Conservaccedilatildeo da Amazocircnia Brasileira) 20Metodologia para Avaliaccedilatildeo Raacutepida e a Priorizaccedilatildeo do Manejo de Unidades de Conservaccedilatildeo (RAPPAM)
MONITORING amp IMPLEMENTATION REPORT VCS Version 3 CCB Standards Third Edition
v30 38
socioeconomic characteristics of communities several community meetings land use mapping
workshops and interviews with focus groups were held in addition to field visits (Annex 10) The
main activities of the project were presented and discussed in these events emphasizing the
importance and timeliness of local valuation of environmental services as well as strategies for
raising funds to implement other projects and improvements in social well-being of communities
around the PA
5 MEASUREMENT OF GHG EMISSIONS REDUCTIONS AND REMOVALS (CLIMATE)
51 Emissions Baseline
EBCF did not carry out any wood related exploration activity in the areas since the beginning of
the REDD+ project Thus it is confirmed estimated emission reductions for the project as
8678833 t CO2eq t year
52 Project emissions
Project emissions were primarily those related to the running of offices and necessary travels for
studies meetings presentations workshops and other activities Table 10 presents a summary of
emissions based on data from Annex 21 of this report
Table 05 - 2011-2016 Project Activity Emissions
YEAR Energy
(KWh)
Energy
(t CO2eq)
Travels
(Km)
Travels
(t CO2eq)
Total
(t CO2eq)
2010
678 024 024
2011
104010 2360 2360
2012 1149 008 55724 1573 1581
2013 2756 028 236749 5429 5457
2014 2498 025 15789 459 484
2015 2231 023 27340 597 620
2016 1015 010
010
093 440290 10443 10536
53 Leakage
Not applicable according to presentation made on the REDD+ IFM document
MONITORING amp IMPLEMENTATION REPORT VCS Version 3 CCB Standards Third Edition
v30 39
54 Summary of GHG Emission Reductions And Removals
EBCF REDD+ project shows emissions reduction of 34397563 tCO2e as the balance in the
period of 2011-2015 Table 06 shows the overview of the dynamics of reductions and project
emissions up to 2048 By the year 2015 the emissions data is posted as seen in reports and from
2016 data are projects as previous average and should be adjusted as a result of future reports
Table 06 - Summary of ex ante estimates
Year
Estimated
reductions
from
baseline21
(tCO2e)
Project
Estimated
emissions 22
tCO2e)
Unplanned
estimate
Emissions23
(tCO2e)
Net GHG
Estimated
emissions
Reduction
(tCO2e)
2012 8675500 1581 0 8673919
2013 8675500 5457 0 8670043
2014 8675500 484 296296 8378720
2015 8675500 620 0 8674880
2016 8675500 2100 0 8673400
2017 8675500 2100 0 8673400
2018 8675500 2100 0 8673400
2019 8675500 2100 0 8673400
2020 8675500 2100 0 8673400
2030 8675500 2100 0 8673400
2048 8675500 2100 0 8673400
Total 3123180 25203 296296 3119989
55 Climate Change Adaptation Benefits (GL1)
There is a relatively widespread understanding in the scientific community that balanced
ecosystems have greater ecological and social resilience and adaptability to climate change
21
See annex 18 22
See annex 21 23
See annex 24- HDOM (Study on deforestation and heat spots for EBCF REDD+ Project technical report)
MONITORING amp IMPLEMENTATION REPORT VCS Version 3 CCB Standards Third Edition
v30 40
whether through protection of water bodies and regulation of river flows during peak flood and
drought or through the regular supply of environmental services products and services
Thus once the project is designed to conserve an area of native forest which in the absence of
the project scenario would remain subject to the pressure of timber management (baseline) and
consequent degradation resulting from such activities it is understood that the mere protection of
these areas alone would offer communities and the ecosystem itself better adaptability compared
to the baseline scenario
Moreover the project has an Activity Management Plan (Annex 9) which details among other
initiatives the promotion of the sustainable use of ecosystem resources through direct support in
some activities related to income generation and conservation along with community training It is
believed that in addition to ensuring a more balanced (and therefore more resilient) environment
the project will expand the options for generating income among the communities making them
more resilient and preparing them to face the greater and already perceived challenges posed by
climate change
6 COMMUNITY
61 Positive Impacts for Communities (CM1)
EBCFrsquos REDD+ project was first presented to the riverine communities in 2011 By then
communities were informed about the cessation of all timber exploration activities due to the
REDD+ project and discussions were held regarding biodiversity conservation and the sustainable
use of forest products and services as well the social development of the surrounding
communities Briefly the positive impacts along the communities were
1 Project area zoning and its surroundings
2 Contribution to building local capacity
3 Contribution to developing sustainable business in the region
4 Contribution to social and environmental diagnosis
Knowing to manage
To evaluate the progress of these initiatives throughout the development of the project we used
the methodology of the Sustainability Matrix developed by the Secretariat of Environment and
MONITORING amp IMPLEMENTATION REPORT VCS Version 3 CCB Standards Third Edition
v30 41
Sustainable Development of Amazonas State This tool was applied in 15 communities taking into
account local socio-economic aspects that underlie the development of 20 parameters considered
of great importance to community development described by specific indicators As a visual tool
the Sustainability Matrix is quite suitable for traditional populations such as the riverside and
indigenous communities surrounding the Reserve Amazon River I and other areas of the Project
Additionally the Matrix provides interesting spaces for discussion since its construction is done
collectively Through the Sustainability Matrix it was possible to identify along with the
communities projects activities and implementation strategies Budgets and monitoring and
evaluation of these projects will be detailed later through the Annual Operational Plans to be
developed and followed up in the due course Four programs and nine subprograms were defined
for management and community development (Annex 9)
62 Negative Impacts (CM2)
No negative impacts have been recorded or identified as a result of the project with stakeholders
7 BIODIVERSITY
71 Positive Impacts for Biodiversity (B1)
The benefits for biodiversity are in reducing deforestation and degradation (selective logging) in the
project area According to satellite images analysis in the project areas and their surroundings it
was observed that until 2010 300 hectares were deforested After the implementation of the
project community awareness on the importance of preservation and conservation of forests have
encouraged no deforestation degradation and a significant reduction in deforestation was
identified (see graph below) This was due to the good understanding of the projects conservation
objectives and by the involvement and support of the surrounding communities
MONITORING amp IMPLEMENTATION REPORT VCS Version 3 CCB Standards Third Edition
v30 42
Figure 10 - EBCF REDD Project and buffer areas deforestation figures (source HDOM Report)
The consequences of deforestation and degradation on biodiversity are well known Thus the fact
of not being identified changes (natural or anthropogenic) in forest areas shows there was no loss
of biodiversity no reduction in floristic diversity no impact on the dynamics of fauna and flora and
no loss of evolutionary genetic information
72 Negative Impacts on Biodiversity (B2)
There are no negative impacts on biodiversity as a result of the project
73 Exceptional Benefits for Biodiversity (GL3)
The description of exceptional benefits for biodiversity will only be possible after the re-
measurement of permanent plots (FLORA)
8 ADICIONAL INFORMATION
All activities and the consequent reduction in deforestation and degradation in and around the
project areas were maintained and funded without resources of carbon credits We understand that
with the advance of REDD+ project EBCF will have much better conditions to implement positive
actions in partnership with communities
MONITORING amp IMPLEMENTATION REPORT VCS Version 3 CCB Standards Third Edition
v30 43
REFERENCES
ADEODATO S etal Madeira de ponta a ponta o caminho da floresta ateacute o consumo Satildeo Paulo
FGV-RAE 2011
ALBAGLI S Amazocircnia fronteira geopoliacutetica da biodiversidade Revista Parcerias Estrateacutegicas n
12 p6 set2001 Centro de Estudos Estrateacutegicos do Ministeacuterio da Ciecircncia e Tecnologia
AMARAL I C Viabilidade de plantio de cafeacute na zona da mata mineira Revista Poliacutetica Agriacutecola
Ano xx n4 outnovdez 2011 Disponiacutevel em
httpwwwalicecnptiaembrapabrbitstreamdoc9309031Viabilidadedeplantiopdf Acesso
em 17 de set 2013
AMARAL P etal Floresta para Sempre um manual para a produccedilatildeo de madeira na Amazocircnia
Beleacutem IMAZON 1998 130p
AMAZONAS Lei Complementar nordm 532007 de 05062007 REGULAMENTA o inciso V do artigo
230 e o sect 1ordm do artigo 231 da Constituiccedilatildeo Estadual institui o SISTEMA ESTADUAL DE
UNIDADES DE CONSERVACcedilAtildeO - SEUC dispondo sobre infraccedilotildees e penalidades e
estabelecendo outras providecircncias Disponiacutevel em
httpwwwcetesbspgovbruserfilesfilemudancasclimaticasproclimafilelegislacaoestadua
lamazonasleilei_complementar_n_53_2007_amazonaspdf Acessado em Setembro 2013
ANTAQ Anuaacuterio Estatiacutestico 2004 Distacircncia entre os portos Disponiacutevel em
httpwwwantaqgovbrportalanuariosportuario2004TabelasDistanciaEntrePortospdf
Acesso em 23 de out 2013
ANTAQ Panorama Aquaviaacuterio Agecircncia Nacional de Transportes Aquaviaacuterios Volume 3 Brasiacutelia
ndash DF 2009
MONITORING amp IMPLEMENTATION REPORT VCS Version 3 CCB Standards Third Edition
v30 44
AREDES A F PEREIRA M W G Anaacutelise econocircmica da produccedilatildeo de cafeacute araacutebica um estudo
de caso com simulaccedilotildees de Monte Carlo para sistemas de baixa e alta produtividade
Informaccedilotildees Econocircmicas SP v38 n4 abr 2008
ARIMA E UHL C Pecuaacuteria na Amazocircnia Oriental Desempenho Atual e Perspectivas Futuras Seacuterie
Amazocircnia n1 Beleacutem IMAZON 1996 40p
BACCINI A et al Estimated carbon dioxide emissions from tropical deforestation improved by
carbon-density maps Nature Climate Change vol2 march 2012 (LETTERS Published
Online - DOI 101038NCLIMATE1354)
BARROS A C UHL C Padrotildees problemas e potencial da extraccedilatildeo madeireira ao longo do Rio
Amazonas e do seu estuaacuterio Seacuterie Amazocircnia n4 Beleacutem IMAZON 1997 42p
BRASIL Lei 121872009 (Lei Ordinaacuteria) 29122009 Institui a Poliacutetica Nacional sobre Mudanccedila
do Clima - PNMC e daacute outras Providecircncias Presidecircncia da Repuacuteblica Casa Civil Subchefia
para Assuntos Juriacutedicos Disponiacutevel em lthttpswwwplanaltogovbrccivil_03_ato2007-
20102009leil12187htmgt Acesso em 20 de set 2013
CAMPOS E F Emissatildeo de CO2 da madeira serrada da Amazocircnia o caso da exploraccedilatildeo
convencional 2012 172p Dissertaccedilatildeo - Escola Politeacutecnica Universidade de Satildeo Paulo Satildeo
Paulo
CARDOSO RS e FREITAS C E C A pesca de pequena escala no rio Madeira pelos
desembarques ocorridos em Manicoreacute (Estado do Amazonas) Brasil Revista Acta
Amazocircnica vol 38(4) 2008 781 ndash 788
CCBA Climate Community and Biodiversity Alliance-CCBA 2008 Disponiacutevel em
httpwwwclimate-standardsorgccb-standards Acesso em 03 de set 2013
MONITORING amp IMPLEMENTATION REPORT VCS Version 3 CCB Standards Third Edition
v30 45
CEPEA Centro de Estudos Avanccedilados em Economia Aplicada - ESALQUSP Economia da
pecuaacuteria de corte na regiatildeo norte do Brasil Disponiacutevel em httpgooglL2roiA Acesso em
15 de out 2013
CHAMBERS J Q et al Decomposition and carbon cycling of dead trees in tropical forests of the
central Amazon Oecologia vol122 pp380-388 2000 Agricultores se queixam de
burocracia para contratar creacutedito sustentaacutevel do Programa ABC Correio Braziliense Brasiacutelia
26 fev 2012 Disponiacutevel em
lthttpwww2correiobraziliensecombrsersustentavelp=4592gt Acesso em 10 set 2013
CULLEN Jr L VALLADARES-PAacuteDUA C Onccedilas como detetives da paisagem Ciecircncia Hoje
Vol 156 n26 pp54-571999
CPRM - Serviccedilo Geoloacutegico do Brasil Disponiacutevel em httpwwwcprmgovbr Acesso em 13 de
mar 2013
DIAS F M MORAIS S J S REZENDE R C Anaacutelise da viabilidade econocircmica para a
produccedilatildeo de melancia e cenoura com financiamento em Anaacutepolis-GO 2008 Disponiacutevel em
httpwwwprpuegbr06v1conteudopesquisainiccieneventossic2008fronteiraflashsicani
macaoIIIJORNADAarquivosresumosresumo01pdfgt Acesso em 18 de nov2013
Divisatildeo de Precessamento de Imagens (DPI) Ambdata Mapa de Vegetaccedilatildeo SIPAM RADAM
2002 Disponiacutevel em httpwwwdpiinpebrAmbdatamapa_sipamphp Acesso em 21 de
out 2013
DOMINGUES MS BERNMANN C O arco de desflorestamento na Amazocircnia da pecuaacuteria agrave
soja Ambiente amp Sociedade Satildeo Paulo vol15 n2 pp1-22 maioago 2012
MONITORING amp IMPLEMENTATION REPORT VCS Version 3 CCB Standards Third Edition
v30 46
EBCF Criaccedilatildeo da primeira reserva particular de desenvolvimento sustentaacutevel do mundo na
floresta amazocircnica Disponiacutevel emlthttpwwwebcfcombrblog20130624criacao-da-
primeira-reserva-particular-de-desenvolvimento-sustentavel-do-mundo-na-floresta-
amazonicagt Acesso em 21 de set 2013
EMBRAPA Sistema Brasileiro de Classificaccedilatildeo de Solos 2ordf Ed Rio de Janeiro Embrapa Solos
2006 306 p
FELDPAUSCH T R et al When big trees fall Damage and carbon export by reduced impact
logging in southern Amazonia Forest Ecology and Management Vol 219 pp199-215 2005
FEARNSIDE P MDesmatamento na Amazocircnia dinacircmica impactos e controle Acta Amazocircnica
vol 36 n3 pp 395-400 2006
FILGUEIRAS T S et al 1994 Caminhamento Um meacutetodo expedito para levantamentos
floriacutesticos qualitativos Caderno de Geociecircncia IBGE vol12 pp39-43 1994
Forest Management Public Summary for Gethal Amazonas SA Induacutestria de Madeira
Compensada Certification Code SW-FMCOC-119 Date of Certification October 1
2000 Date of Public Summary October 2000 Updated for Annual Audit 2002 Annual Audit
2003 (Gethalpdf)
Globo Rural Linha de financiamento para a agricultura de baixo carbono tem pouca procura
2011 Disponiacutevel em httpwwwrainforest-allianceorgforestrydocumentsgethalpdf
Acesso em 16 de nov 2013
GREENPEACE Face a Face com a Destruiccedilatildeo Relatoacuterio Greenpeace sobre as companhias
multinacionais madeireiras na Amazocircnia Brasileira 1999 Disponiacutevel em
MONITORING amp IMPLEMENTATION REPORT VCS Version 3 CCB Standards Third Edition
v30 47
lthttpwwwgreenpeaceorgbramazoniaface_destruicaopdfgt Acesso em 11 de set
2013
Governo do Estado do Amazonas Plano de Gestao da RDS do Rio Amapaacute 2010 Disponiacutevel em
httpobservatoriowwforgbrsite_mediauploadgestaoplanoManejorio_amapapdf Acesso
em 24 de ago 2013
HDOM Estimates from processing the forest inventories data carried out during the CADAF
Project Final Technical Report 2012 Disponiacutevel em wwwhdomcombr Acesso em 27 de
maio 2013
HIGUCHI N 1986-87 Amostragem sistemaacutetica versus amostragem aleatoacuteria em floresta tropical
uacutemida de terra-firme na regiatildeo de Manaus Acta Amazonica 1617 (uacutenico) 393-400
HIGUCHI N SANTOS J JARDIM FCS Tamanho de parcela amostral para inventaacuterios
florestais Acta Amazocircnica vol12 n1 pp91-103 1982
HIGUCHI F G PINTO A C M ISHIZUKA M KAJIMOTO T LIMA A J N SANTOS J
HIGUCHI N Estoque e dinacircmica de biomassa acima do solo das florestas de terra firme do
estado do Amazonas In Adriano Joseacute Nogueira Lima Flaacutevia Machado Durgante Moacir
Alberto Assis Campos Joaquim dos Santos Moriyoshi Ishizuka Niro Higuchi (Org)
Dinacircmica do carbono das florestas da Amazocircnia resultados do Projeto CADAF
1edManaus INPA 2014 v 1 p 29-34
HOLMES T P etal Custos e benefiacutecios financeiros da exploraccedilatildeo de impacto reduzido em
comparaccedilatildeo agrave exploraccedilatildeo florestal convencional na Amazocircnia oriental 2ordf ed Beleacutem
Fundaccedilatildeo Floresta Tropical 2002 66p
HUSCH B MILLER C I BEERS T W Forest mensuration New York Ronald Press 1971
HUSCH B MILLER C I BEERS T W Forest Mensuration New York John Wiley amp Sons
2nd
ed 1972 402 p
MONITORING amp IMPLEMENTATION REPORT VCS Version 3 CCB Standards Third Edition
v30 48
IBGE Instituto Brasileiro de Geografia e Estatiacutestica Diretoria de GeociecircnciasCoordenaccedilatildeo de
Recursos Naturais e Estudos Ambientais Geologia Solos Hidrografia e Vegetaccedilatildeo 2000
IBGE Instituto Brasileiro de Geografia e Estatiacutestica Manicoreacute 2010 Disponiacutevel
emlthttpwwwsidraibgegovbrgt Acesso em 05 de set 2013
IBGE Instituto Brasileiro de Geografia e Estatiacutestica 2011 Disponiacutevel em httpwwwibgegovbr
Acesso em 19 de mar 2013
IBGE Instituto Brasileiro de Geografia e Estatiacutestica Extraccedilatildeo vegetal e silvicultura para o
municiacutepio de Manicoreacute 2011 Disponiacutevel em
lthttpcidadesibgegovbrxtrastemasphplang=ampcodmun=130270ampidtema=102ampsearch=a
mazonas|manicore|extracao-vegetal-e-silvicultura-2011gt Acesso em 10 de out 2013
IBGE Instituto Brasileiro de Geografia e Estatiacutestica Censo Demograacutefico 2010 Disponiacutevel em
lthttpcidadesibgegovbrxtrastemasphpcodmun=130270ampidtema=116gt Acesso em 18
de out 2013
IBGE Instituto Brasileiro de Geografia e Estatiacutestica Censo Demograacutefico 2010 Disponiacutevel
emlthttpcidadesibgegovbrxtrashomephpgt Acesso em 08 de out 2013
IDESAM Reduccedilotildees de Emissotildees do Desmatamento e Degradaccedilatildeo Florestal (REDD+) estudo de
oportunidades para a regiatildeo sul do Amazonas CENAMO M Cl CARRERO G C
GANDOLFO P (Org) Manaus 2011 Disponiacutevel em
lthttpwwwobservatoriodoreddorgbrsitepdfestudodeoportunidadespdfgt Acesso em 13 de
set 2013
MONITORING amp IMPLEMENTATION REPORT VCS Version 3 CCB Standards Third Edition
v30 49
IDESAM Semeando Sustentabilidade em Apuiacute ndash Resultados e Perspectivas 2011 Manaus
Disponivel em lthttpidesamorgbrsemeando-sustentabilidade-em-apui-resultados-e-
perspectivasUxX8nfldWYI
IEA Instituto de Economia Aplicada CO2 Emissions from fuel combustion 2012 Disponiacutevel em
httpwwwieaorgco2highlightsco2highlightspdf Acesso em 09 de out 2013
IGREJA H L S CATIQUE J Anaacutelise neotectocircnica do lineamento de Itacoatiara centro leste do
Estado do Amazonas In Simpoacutesio Nacional de Estudos Tectocircnicos 6 1997 Pirenoacutepolis
Anais Pirenoacutepolis-GO SBG-Nuacutecleo Brasiacutelia1997
IMAZON Instituto do Homem e do Meio Ambiente da Amazocircnia Fatos Florestais 2010a
Disponiacutevel em httpwwwimazonorgbrpublicacoeslivrosfatos-florestais-da-amazonia-
2010-1 Acesso em 14 de out 2013
IMAZOM Instituto do Homem e do Meio Ambiente da Amazocircnia Mercado e preccedilo da madeira
amazocircnica 2010 Disponiacutevel em httpwwwimazonorgbrpublicacoesprecos-de-madeira-
em-toraboletim-de-precos-de-madeira-em-tora-na-amazonia-julho-2010at_downloadfile
Acesso em 23 de nov 2013
IMAZON Instituto do Homem e do Meio Ambiente da Amazocircnia Portal de Geoinformaccedilatildeo sobre
a Amazocircnia Disponiacutevel em lthttpwwwimazongeoorgbrimazongeophpgt Acesso em 06
de set 2013
IMAZON Instituto do Homem e do Meio Ambiente da Amazocircnia Transparecircncia florestal
Amazocircnia Legal 2012 Disponiacutevel em lthttpwwwimazonorgbrpublicacoestransparencia-
florestaltransparencia-florestal-amazonia-legalcopy_of_SADOutubro2012pdfgt Acesso em
23 de set 2013
IMAZON Instituto do Homem e do Meio Ambiente da Amazocircnia PEREIRA D SANTOS D
VEDOVETO M GIMARAtildeES J VERIacuteSSIMO A (Orgs) Fatos Florestais da Amazocircnia
Beleacutem IMAZON 2010 244p Disponiacutevel em
MONITORING amp IMPLEMENTATION REPORT VCS Version 3 CCB Standards Third Edition
v30 50
lthttpwwwimazonorgbrpublicacoeslivrosfatos-florestais-da-amazonia-2010-1gt Acesso
em 24 de set 2013
IMAZON Instituto do Homem e do Meio Ambiente da Amazocircnia A Expansatildeo madeireira na
Amazocircnia Impactos e perspectivas para o desenvolvimento sustentaacutevel no Paraacute BARROS
AC VERIacuteSSIMO A (Eds) Beleacutem IMAZON 2002
IMAZON Instituto do Homem e do Meio Ambiente da Amazocircnia Custos e Benefiacutecios do Manejo
Florestal Para Produccedilatildeo de Madeira na Amazocircnia Oriental 1998 Disponiacutevel em
lthttpwwwimazonorgbrpublicacoesserie-amazoniacustos-e-beneficios-do-manejo-
florestal-para-producao-de-madeira-na-amazonia-orientalgt Acesso em 20 de set 2013
INPE Instituto de Pesquisas Espaciais Banco de dados PRODES 2012 Disponiacutevel em
lthttpwwwdpiinpebrprodesdigitalprodesphpgt Acesso em 09 de set 2013
INPE Instituto de Pesquisas Espaciais Banco de dados DEGRAD 2009 Disponiacutevel em
lthttpwwwobtinpebrdegradgt Acesso em 09 de set 2013
INPE Instituto de Pesquisas Espaciais Banco de dados DETER 2013 Disponiacutevel em
lthttpwwwobtinpebrdetergt Acesso em 10 de set 2013
INPE Instituto de Pesquisas Espaciais Banco de dados de queimadas e focos de calor
BDQUEIMADAS 2013 Disponiacutevel em lthttpwwwdpiinpebrproarcobdqueimadasgt
Acesso em 10 de set 2013
Instituto Carbono Brasil Soacute 2 da produccedilatildeo de madeira eacute certificada O Estado de SPaulo 2006
Disponiacutevel em lthttpwwwinstitutocarbonobrasilorgbrnoticias6noticia=119796gt Acesso
em 26 de set 2013
MONITORING amp IMPLEMENTATION REPORT VCS Version 3 CCB Standards Third Edition
v30 51
IFT Instituto Floresta Tropical Diagnoacutestico do Setor Florestal de Cotriguaccedilu Estado do Mato
Grosso 2010 Disponiacutevel em lthttpgooglEVx2RZgt Acesso em 16 de dez 2013
IPCC Guidelines for National Greenhouse Gas Inventories In National Greenhouse Gas
Inventories Programme EGGLESTON HS BUENDIA L MIWA K NGARA T TANABE
K (Eds) Japan IGES 2006
ITTO Annual review and assessment of the world timber situation 2011 Disponivel em
httpwwwittointannual_review Acesso em 10 de out 2013
KELLER M et al Coarse woody debris in undisturbed and logged forests in the eastern Brazilian
Amazon Global Change Biology vol10 PP784-795 2004
LENTINI M VERISSIMO A PEREIRA D A expansatildeo madeireira na Amazocircnia O Estado da
Amazocircnia n2 2005 Beleacutem IMAZON Disponiacutevel em
httpwwwimazonorgbruploadea_2ppdf Acesso em 06 de set 2013
LOETSCH F ZOumlHRER F HALLER K E Forest Inventory Munich BLV Verlagsgesellschaft
2nd
edition Vol II 1973 469 p
MAGNUSSON WE et al RAPELD uma modificaccedilatildeo do meacutetodo de Gentry para inventaacuterios de
biodiversidade em siacutetios para pesquisa ecoloacutegica de longa duraccedilatildeo Biota Neotrop JulDez
2005 vol 5 no 2 httpwwwbiotaneotropicaorgbrv5n2ptabstractpoint-of-
view+bn01005022005 ISSN 1676-0603
MARINELLI C E et al O programa de monitoramento da biodiversidade da biodiversidade e do
uso de recursos naturais em unidades de conservaccedilatildeo estaduais do Amazonas Secretaria
de Estado do Meio Ambiente e Desenvolvimento Sustentaacutevel - SDS Manaus SDS 2007
MONITORING amp IMPLEMENTATION REPORT VCS Version 3 CCB Standards Third Edition
v30 52
MARINELLI C E MALTEZ M H Indicadores de Sustentabilidade para Unidades de
Conservaccedilatildeo Documento-Siacutentese Workshop Instituto Socioambiental Brasiacutelia-DF 2010
76p
MAZZEI L et al Above-ground biomass dynamics after reduced-impact logging in the Eastern
Amazon Forest Ecology and Management vol 259 pp367-373 2010
MEIRELLES FILHO O Livro de Ouro da Amazocircnia 5ordf Ediccedilatildeo Rio de Janeiro EDIOURO 2007
422p Meirelles Filho J O Livro de Ouro da Amazocircnia 1ordf ed Editora Ediouro ISBN
8500021616 2007 450p
MENGER Juliana da Silva Fatores determinantes da distribuiccedilatildeo de aves no interfluacutevio Purus-
Madeira Manaus [sn] 2011 35 fl il
MCT Arquivos dos Fatores de Emissatildeo Disponiacutevel em
httpwwwmctgovbrindexphpcontentview321144htmlancora Acesso em 23 de out
2013
MMA Ministeacuterio do Meio Ambiente Avaliaccedilatildeo e identificaccedilatildeo de accedilotildees prioritaacuterias para a
conservaccedilatildeo utilizaccedilatildeo sustentaacutevel e reparticcedilatildeo dos benefiacutecios da biodiversidade na
Amazocircnia brasileira Brasiacutelia MMASBF 2001
MMA Ministeacuterio do Meio Ambiente Secretaria de Biodiversidade e Florestas Aacutereas Prioritaacuterias
para Conservaccedilatildeo Uso Sustentaacutevel e Reparticcedilatildeo de Benefiacutecios da Biodiversidade Brasileira
Atualizaccedilatildeo - Portaria MMA ndeg9 de 23 de janeiro de 2007 Brasiacutelia MMA 2007 (Seacuterie
Biodiversidade 31)
MONITORING amp IMPLEMENTATION REPORT VCS Version 3 CCB Standards Third Edition
v30 53
MMA Livro vermelho da fauna brasileira ameaccedilada de extinccedilatildeo editores Angelo Barbosa
Monteiro Machado Glaacuteucia Moreira Drummond Adriano Pereira Paglia 1ed 2008 Brasiacutelia
DF MMA Belo Horizonte MG Fundaccedilatildeo Biodiversitas (1420 p) il - (Biodiversidade 19)
OLIVEIRA M M HIGUCHI N CELES C H HIGUCHI F G 2014 Tamanho e formas de
parcelas para inventaacuterios florestais de espeacutecies arboacutereas na Amazocircnia Central Ciecircncia
Florestal Santa Maria v 24 n 3 p 645-653
PEARSON TRH WALKER S BROWN SL The Source Book for Land Use Land Use
Change and Forestry Projects BioCarbon Fund and Winrock International 2005 64 pp
PORTAL AMAZOcircNIA Amazocircnia de A a Z Disponiacutevel em
lthttpportalamazoniaglobocomgt Acesso em 13 de set 2013
PEacuteLLICO NETTO S BRENA D A Inventaacuterio florestal Curitiba Editorado pelos autores p
316 1997
PROJETO SIVAM Relatoacuterio metodoloacutegico de trabalho Revisatildeo 3 Diretoria de Geociecircncia Rio de
Janeiro 2002 330 pp
PROJETO SIVAM Atualizaccedilatildeo do RADAMBRASIL Mapa de Vegetacao da Amazonia Legal
Mapa de Fitofisionomias ndash RADAMSIPAM DNPM Ministeacuterio de Minas e Energia 2002
Disponiacutevel em httpwwwdpiinpebramb_dataShapefilesveg_Amz_SIPAMzip Acesso
em 21 de jan 2014
PROJETO FLORESTAL SANTA MARIA (PROJETO FSM-REDD) Plant Inteligecircncia Ambiental ndash
Warwick Manfrinato 2012 Disponiacutevel em
lthttpwwwflorestalsantamariacombrsitedocumentos57FSM_REDD_VCS_PD_ptpdfgt
Acesso em 09 de set 2013
MONITORING amp IMPLEMENTATION REPORT VCS Version 3 CCB Standards Third Edition
v30 54
RADAMBRASIL Programa de Integraccedilatildeo Nacional Levantamentos de Recursos Naturais v 14 ndash
RADAM DNPM Ministeacuterio de Minas e Energia Brasil 1974
RIBEIRO J E L et al Flora da Reserva Ducke guia de identificaccedilatildeo das plantas vasculares de
uma floresta de terra firme na Amazocircnia Central Manaus Editora INPA 1999
ROSAS F C W WALDEMARIN H de MATTOS G E Pteronura rasiliensis (Zimmermann
1780) In MACHADO A B M DRUMMOND G M PAGLIA A P (eds) Livro Vermelho da
Fauna Brasileira Ameaccedilada de Extinccedilatildeo Volume II 1ed Brasiacutelia DF Ministeacuterio do Meio
Ambiente 2008 p 800 - 801
ROSS D GHG Emissions Resulting from Aircraft Travel 2009 Disponiacutevel em
httpwwwcarbonplanetcomdownloadsFlight_Calculator_Information_v92pdf Acesso em
14 de out 2013
SANTOS A J et al Viabilidade econocircmica do sistema agroflorestal greviacutelea x cafeacute na regiatildeo
norte do Paranaacute CERNE vol6 n1 pp89-100 2000
SANTOS R A Custo do manejo florestal madeireiro estudo de caso Floresta Estadual do
Antimary Monografia (Bacharelado em Economia) ndash Departamento de Ciecircncias
Econocircmicas Universidade Federal do Acre 2007109p
SABOGAL C et al Manejo Florestal Empresarial na Amazocircnia Brasileira restriccedilotildees e
oportunidades (Relatoacuterio Siacutentese) Beleacutem CIFORIMAZON 2006 72p
SDSCEUC Secretaria Estadual de Meio Ambiente e Desenvolvimento Sustentaacutevel ndash Centro
Estadual de Unidades de Conservaccedilatildeo Programa de Monitoramento de Biodiversidade e
Uso de Recursos Naturais em Aacutereas Protegidas do Estado Amazonas (ProBUC) 2006
Disponiacutevel em
MONITORING amp IMPLEMENTATION REPORT VCS Version 3 CCB Standards Third Edition
v30 55
httpbrazilwcsorgDesktopModulesBring2mindDMXDownloadaspxEntryId=6168ampPortalI
d=93ampDownloadMethod=attachment Acesso em 11 de ago de 2013
SFBIMAZON Serviccedilo Florestal Brasileiro e Instituto do Homem e Meio Ambiente da Amazocircnia A
atividade madeireira na Amazocircnia brasileira produccedilatildeo receita e mercados 2010 Disponiacutevel
em httpwwwmmagovbrestruturassfb_arquivosmiolo_resexec_polo_03_95_1pdf
Acesso em 23 de out 2013
SILVA R P da Alometria estoque e dinacircmica da biomassa de florestas primaacuterias e
secundaacuterias na regiatildeo de Manaus (AM) 152 p Tese de Doutorado Programa Integrado
de Poacutes-graduaccedilatildeo em Biologia Tropical e Recursos Naturais (INPA) Manaus 2007
SILVA Z A G P G SANTOS R A Custo do manejo florestal madeireiro em floresta puacuteblica
estudo de caso no Acre 2011 Disponiacutevel em
lthttpwwwbasacombrbancoamazonia2Revistaedicao_13n13_custo_do_manejo_flores
pdfgt Acesso em 13 de set 2013
SMIDT M GALLAGHER T Factors Affecting Fuel Consumption and Harvesting Costs Auburn
School of Forestry and Wildlife Sciences Sd Disponiacutevel em
httpweb1cnrevteduforestrycofedocuments2013Smidt_Gallagherpdf Acesso em 21
de out 2013
SOARES-FILHO B et al Role of Brazilian Amazon protected areas in climate change mitigation
2010 Columbia University NY Ruth S DeFries 2010
SPF Serviccedilo Puacuteblico Federal DVPF Documento de venda de produto Florestal (Declaraccedilotildees de
venda Gethalpdf) 14 de julho de 2006
MONITORING amp IMPLEMENTATION REPORT VCS Version 3 CCB Standards Third Edition
v30 56
TIMOFEICZYK JUacuteNIOR R et al Rentabilidade econocircmica do manejo de baixo impacto em
florestas tropicais um estudo de caso Revista Floresta Curitiba v 38 n 4 p 711-725
outdez 2008
VCS Ferramenta para Demonstraccedilatildeo e Avaliaccedilatildeo de Adicionalidade para Atividades de Projetos
VCS em Agricultura Floresta e Outros Usos (AFOLU) 2012a Disponiacutevel em httpwwwv-c-
sorgsitesv-c-sorgfilesVT000120VCS20AFOLU20Additionality20Tool20v30pdf
Acesso em 24 de set 2013
VCS Ferramenta de Risco e Natildeo Permanecircncia (AFOLU) 2012B Disponiacutevel em httpv-c-
sorgsitesv-c-sorgfilesAFOLU20Non-Permanence20Risk20Tool2C20v32pdf
Acesso em 13 de set 2013
VCS Approved VCS Methodology VM0010 Version 10 - Methodology for Improved Forest
Management Conversion to Logged to Protected Forest Calculating GHG Benefits from
Preventing Planned Degradation PHUA S SHARMA S TELFER M CHANDLER H
(Eds) Califoacuternia EUA Carbon Planet Limited 2011149p
VERDEJO M E Diagnoacutestico Rural Participativo um guia praacutetico Brasiacutelia MDA 2006 62p
VIANNA A L M Diagnoacutestico Florestal do Estado do Amazonas 2010 e 2011 Manaus-AM
IDESAM 2013 (Relatoacuterio Final do Projeto Fortalecimento da participaccedilatildeo da sociedade civil
no Amazonas Foacuterum de Mudanccedilas Climaacuteticas Transparecircncia Florestal no Estado do
Amazonas ndash Mapeamento de Instrumentos Legislativos no Brasil)
WBCSDWRI The GHG Protocol for Project Accountin Washington World Business Council for
Sustainable DevelopmentWorld Resources Institute 2005148 p
MONITORING amp IMPLEMENTATION REPORT VCS Version 3 CCB Standards Third Edition
v30 57
WALKER W et al Guia de Campo para Estimativa de Biomassa Florestal e Estoque de Carbono
Woods Hole Center Research Falmouth Massachusetts USA 2011 Disponiacutevel em
httpwwwwhrcorgresourcesfieldguidescarbonpdfWHRC_FieldGuide_PortugueseSMpdf
Acesso em 14 de set 2013
WWF Metodologia para Avaliaccedilatildeo Raacutepida e a Priorizaccedilatildeo do Manejo de Unidades de
Conservaccedilatildeo (RAPPAM) 2010 Disponiacutevel em httpgooglXfDnxs Acesso em 30 de set
2013
WWF-Brasil Efetividade de Gestatildeo das Unidades de Conservaccedilatildeo no Estado do Amazonas
Secretaria de Estado do Meio Ambiente e do Desenvolvimento Sustentaacutevel do Amazonas
Instituto Chico Mendes de Conservaccedilatildeo da Biodiversidade Brasiacutelia WWF-Brasil 2011 72 p
MONITORING amp IMPLEMENTATION REPORT VCS Version 3 CCB Standards Third Edition
v30 3
deforestation since the project implementation Also if conducted preliminary
studies on the management plan to monitor the practice of hunting in the area It
was also initiated the activities related to health and income generation in
partnership with local communities
Gold Level Criteria On the climate issue is understood that balanced ecosystems have greater
ecological and social resilience and adaptability to climate change whether
through the protection of water bodies and flow regulation of rivers on the peaks
of flood and drought is the regular supply food products and environmental
services From the social point of view the project has a strong presence along
the clearly marginalized populations the social care system of the State and was
strategies interact with the communities to give more visibility to women elderly
and children Exceptional benefits for biodiversity are realized on the fact that
the Amazon River project present several qualifying attributes of High
Conservation Values such as endemic species and or rare and have several
species protected by specific legislation prohibiting cutting such as the Brazil
Nuts tree rubber tree and mahogany
Date of
Completion of this
PIR
10 September 2016
Expected schedule
check Periodic every 5 (five) years
MONITORING amp IMPLEMENTATION REPORT VCS Version 3 CCB Standards Third Edition
v30 4
SUMAacuteRIO
1 GENERAL 10
11 Summary Description of the Project 10
12 Project Objectives 12
13 Project location 13
14 Project Proponent (G4) 16
15 Other Entities Involved in the Project (G4) 16
11 Project Start Date 17
12 Project Crediting Period 17
2 DESIGN 17
21 Sectoral Scope and Project Type 17
22 Project Financing 18
23 Employment Opportunities and Worker Safety 19
24 Stakeholders (G3) 19
25 Respect for Rights and no Involuntary Relocation 25
3 APPLICATION OF METHODOLOGY 27
31 Title and Reference of Methodology 27
32 Methodology Deviations 28
33 Project Boundary 28
34 Baseline Scenario 32
35 Additionality 33
4 MONITORING AND PARAMETERS OF DATA 33
41 Monitoring Plan Description 33
411 Monitoring Impacts to Biodiversity 36
412 Monitoring Social Impacts 37
5 MEASUREMENT OF GHG EMISSIONS REDUCTIONS AND REMOVALS (CLIMATE) 38
51 Emissions Baseline 38
52 Project emissions 38
53 Leakage 38
54 Summary of GHG Emission Reductions And Removals 39
MONITORING amp IMPLEMENTATION REPORT VCS Version 3 CCB Standards Third Edition
v30 5
55 Climate Change Adaptation Benefits (GL1) 39
6 COMMUNITY 40
61 Positive Impacts for Communities (CM1) 40
62 Negative Impacts (CM2) 41
7 BIODIVERSITY 41
71 Positive Impacts for Biodiversity (B1) 41
72 Negative Impacts on Biodiversity (B2) 42
73 Exceptional Benefits for Biodiversity (GL3) 42
8 ADICIONAL INFORMATION 42
REFERENCES 43
TABLES
Table 01 - Project implementation and opperational costs 18
Table 02 - Implementation schedule and next activities 22
Table 03 - Greenhouse gas emissions sources and sinks associated with baseline and project activities 31
Table 04 - Summary of areas managed since 1999 33
Table 05 - 2011-2016 Project Activity Emissions 38
Table 06 - Summary of ex ante estimates 39
FIGURES
Figure 01 - Location of the Municipality of Manicoreacute - AM 13
Figure 02 - Location areas I II III and IV of the Amazon Rio Project 14
Figure 03 - Project Zone and communities of the project 14
Figure 04 - Location of the communities surrounding the Amazon Rio areas I II III and IV 20
Figure 05 - Workshop I Free Prior and Informed Consent for the development of the REDD+ project by
the community leaders of Democracia Aacutegua Azul Satildeo Joseacute do Miriti Vista Alegre Jatuarana Terra
Preta do Ramal Pandegal Santa Maria Santa Eva and Terra Preta do Rio Mancoreacute 26
Figure 06 - Workshop II Free Prior and Informed Consent for the development of the REDD+ project
by the community leaders of Urucury Mocambo Boa Esperanccedila and Satildeo Joatildeo amp Ponta Grossa 26
Figure 07 - Workshop III Free Prior and Informed Consent for the development of the REDD+ project
by the Kamayuaacute indigenous community 27
Figure 08 - Project Boundaries a) Direct Project interference limits b) Total Project Area (G1 Indicator
7) 28
Figure 09 - Project Area forest types 29
Figure 010 - EBCF REDD Project and buffer areas deforestation figures (source HDOM Report) 42
MONITORING amp IMPLEMENTATION REPORT VCS Version 3 CCB Standards Third Edition
v30 6
ANNEXES
ANNEX 1 Operations License Summary (Resumo das LOs)
ANNEX 2 Logging Plan ldquoValdenor IIrdquo (Plano de Manejo Valdenor II)
ANNEX 3 Logging License Registration PAAM (Cadastro para exploraccedilatildeo florestal PAAM)
ANNEX 4 Operations Licenses and Annual Production Units (LOs and UPAs)
ANNEX 5 Vegetation Maps (Mapas de Fitofisionomia)
ANNEX 6 Annual Operation Plan and Forest Logging Authorization (POAs a AUTEX)
ANNEX 7 Forest Inventory 100 UPA 6 (Inventaacuterio Florestal 100 UPA 6 (2007))
ANNEX 8 Expedited Forest Inventory - 2013 (Inventario Florestal Expedito - 2013)
ANNEX 9 Amazon Rio I RPDS Management Plan (Plano de Gestatildeo da RPDS Amazon Rio I
ANNEX 10 Free Prior and Informed Consent (FPIC) (Consentimento Livre Previo e Informado)
ANNEX 11 Land Titles (Escrituras)
ANNEX 12 Support Letters from Government Bodies (Cartas de apoio dos oacutergatildeos do Governo)
ANNEX 13 Sales Declaration from Gethal (Declaraccedilotildees de venda Gethal)
ANNEX 14 Gethal SmartWood Certification (Certificaccedilatildeo SmartWood Gethal)
ANNEX 15 Greenpeace article on timber companies in the Amazon (Relatoacuterio Greenpeace sobre
madeireiras da Amazocircnia)
ANNEX 16 Cash Flow Analysis (Anaacutelise fluxo de caixa)
ANNEX 17 Financial Analysis ndash Baseline and Additionality (Analise financeira ndash linha de base e
adicionalidade)
ANNEX 18 Emissions Calculation Spreadsheet (Planilha de calculos de emissotildees)
ANNEX 19 EBCF Core-business (Core-business da EBCF)
ANNEX 20 EBCFrsquos Undertanding of Project Risks and Barriers (Entendimentos da EBCF sobre
riscos)
MONITORING amp IMPLEMENTATION REPORT VCS Version 3 CCB Standards Third Edition
v30 7
ANNEX 21 EBCFrsquos Energy Use and Transport (EBCF consumo de energia e transporte)
ANNEX 22 Non-Permanence Risk AnalysisBuffer (Analise de risco de nao permanecircnciabuffer)
ANNEX 23 Forest Biomass Inventory - 2016 (Inventaacuterio de Biomassa Florestal - 2016)
ANNEX 24 Deforestation repport_ 2016 (Relatoacuterio Teacutecnico Desmatamento_2016)
ANNEX 25 Consultive Concill (Documento conselho consultivo)
ANNEX 26 Community Sensus (Senso Comunidades 2013)
ABBREVIATIONS
AFOLU Agriculture Forestry and Other Land Use
ANTAQ National Agency for Waterway Services (Agecircncia Nacional de Transportes Aquaviaacuterios)
AP Project Area
APD Avoided Planned Deforestation
APP Areas of Permanent Preservation (Aacutereas de Preservaccedilatildeo Permanente)
ATER Technical Assistance and Rural Development (Assistecircncia Teacutecnica e Extensatildeo Rural)
AUTEX Logging Authorization (Autorizaccedilatildeo de Exploraccedilatildeo Florestal)
CAAD Council of Agro-Extrativist Associations of Democracia (Conselho das Associaccedilotildees
Agroextrativistas de Democracia)
CAAM Council of Agro-Extrativist Associations of Manicoreacute (Conselho das Associacoes
Agroextrativistas de Manicoreacute)
CDM Clean Development Mechanism
CFI Continuous Forest Inventory
CNS National Council of Extractivist Populations (Conselho Nacional das Populaccedilotildees
Extrativistas)
CRA Environmental Reserve Quotas (Cotas de Reserva Ambiental)
DBH Diameter at Breast Height
DETER Real Time Deforestation Detection System
DOF Document of Forest Origin (Documento de Origem Florestal)
EIA Environmental Impact Assessment
FAS Amazonas Sustainable Foundation (Fundaccedilatildeo Amazonas Sustentaacutevel)
FSC Forest Stewardship Council
FUNAI National Indigenous Peoples Foundation (Fundaccedilatildeo Nacional do Iacutendio)
GHG Greenhouse Gases
GIS Geographic Information System
HCV High Conservation Value
IBAMA Brazilian Institute of Environment and Renewable Natural Resources (Instituto Brasileiro
MONITORING amp IMPLEMENTATION REPORT VCS Version 3 CCB Standards Third Edition
v30 8
do Meio Ambiente e dos Recursos Naturais Renovaacuteveis)
ICU Intensive Care Unit
IDAM Institute of Agricultural and Forestry Development of the State of Amazonas (Instituto de
Desenvolvimento Agropecuaacuterio e Florestal do Estado do Amazonas)
IEA International Energy Agency
IEB International Institute of Education of Brazil (Instituto Internacional de Educaccedilatildeo do
Brasil)
IFM-LtPF Improved Forest Management - Logged to Protected Forest
IMAZON Institute of Man and Environment in the Amazon (Instituto do Homem e Meio Ambiente
da Amazocircnia
INPE National Institute for Space Research (Instituto Nacional de Pesquisas Espaciais)
IPAAM Amazon Institute of Environmental Protection (Instituto de Proteccedilatildeo Ambiental do
Amazonas)
IPCC Intergovernmental Panel on Climate Change
LR Legal Reserve (Reserva Legal)
MCT Ministry of Science and Technology (Ministeacuterio da Ciecircncia e Tecnologia)
MMA Ministry of Environment (Ministeacuterio do Meio Ambiente)
MP Monitoring Plan
NTFP Non-Timber Forest Product
PD Project Description
PES Payment for Environmental Services
POA Annual Operational Extraction Plan (Plano Operacional Anual de Extraccedilatildeo)
PPE Personal Protective Equipment
PROARCO Program for the Prevention and Control of Forest Fires in the Arc of Deforestation
(Programa de Prevenccedilatildeo e Controle agraves Queimadas e Incecircndios no Arco do Desflorestamento)
PROBUC Program for Monitoring Biodiversity and Use of Natural Resources in Conserveation Units
(Programa de Monitoramento da Biodiversidade e Uso do Recursos Naturais em UCs)
PRODES Program to Calculate Deforestation in the Amazon (Programa de Caacutelculo do
Desflorestamento da Amazocircnia)
RDS Sustainable Development Reserves (Reservas de Desenvolvimento Sustentaacutevel)
RPDS Private Reserves for Sustainable Development (Reserva Particular de Desenvolvimento
Sustentaacutevel)
RPPN Private Reserve of Natural Heritage (Reserva Particular do Patrimocircnio Natural)
SAD Deforestation Allert System (Sistema de Alerta de Desmatamento)
SDS Secretary of the State for the Environment and Sustainable Development of Amazonas
(Secretaria de Estado do Meio Ambiente e Desenvolvimento Sustentaacutevel do Amazonas)
SEUC State System of Conservation Units (Sistema Estadual de Unidades de Conservaccedilatildeo)
MONITORING amp IMPLEMENTATION REPORT VCS Version 3 CCB Standards Third Edition
v30 9
SFM Sustainable Forest Management
SFMP Sustainable Forest Management Plan
UC Conservation Units (Unidade de Conservaccedilatildeo)
UEA State University of Amazonas (Universidade Estadual do Amazonas)
UFAM Federal University of Amazonas (Universidade Federal do Amazonas)
UNFCCC United Nations Framework Convention on Climate Change
UPA Annual Production Unit (Unidade Produtiva Anual)
VCU Verified Carbon Unit
WBCSD World Business Council for Sustainable Development
WRI World Resources Institute
MONITORING amp IMPLEMENTATION REPORT VCS Version 3 CCB Standards Third Edition
v30 10
1 GENERAL
11 Summary Description of the Project
The Amazon Rio project consists of the conservation of a mosaic of four private areas called
Amazon Rio I II III and IV which add up to 20387 hectares (ha) of primary forest located in the
municipality of Manicoreacute in the state of Amazonas The projects target area is characterized by
being a region of sedimentary Solimotildees Basin dominated by Alluvial Holocene Iccedilaacute Training and
Detritus-lateritic formation The relief is of the flat type with primary vegetation formation consisting
of areas of land floodplain and some formations igapoacute due to the influence of Rio Manicoreacute
The Amazon Rio areas dominated forests of humid tropical rainforest Lowlands emerging Canopy
and Forest Open Rain Lowlands with palm trees (79) the Atlantic rain forest Alluvial emerging
canopy (11) Rain Forest Open Alluvial with palm trees (8) Pioneer formations influenced
fluvial and or lacustrine - herbaceous and shrubby with palm trees (1)
The main focus of the project is (i) the conservation of forest ecosystems and biodiversity (ii) the
sustainable social development of the region including the promotion of ecotourism and scientific
research and (iii) the reduction in carbon dioxide (CO2) emissions through the prevention of
deforestation and forest degradation
In 1998 a logging plan for logging activities was approved by the authorized environmental
agencies on 19800 ha of land over a period of 25 years (the total area does not include
Permanent Preservation Areas (APP) and water bodies Between 1999 and 2010 434769 ha
were degraded due to an authorized logging operation (Annexes 1 2 3 and 4) In February 2011
the area was acquired by the Empresa Brasileira de Conservaccedilatildeo de Florestas (EBCF) which in
order to implement the objectives of the project made two important decisions to suspend the
logging operations underway in the project areas since 1999 and transform them into Private
Reserves for Sustainable Development (Reservas Particulares de Desenvolvimento Sustentaacutevel -
RPDSs) supported by State Law no 53 of June 2007 and Decree no 30108 of June 2010
With this new land use strategy 20387 ha of primary forest will be preserved avoiding the CO2
emissions that would have occurred without the implementation of the project Revenues obtained
from the carbon credits will be used to maintain the primary forest with the implementation of the
activities described in the Reserversquos Management Plan (Annex 9) including social programs and
environmental monitoring
The project intends to maintain financial sustainability through the sale of carbon credits obtained
from the conservation of the area and maintenance of environmental services Another source of
MONITORING amp IMPLEMENTATION REPORT VCS Version 3 CCB Standards Third Edition
v30 11
income planned by the project relates to the national market for legal reserve compensation
(Environmental Reserve Quota (Cotas de Reserva Ambiental (CRA) in Portuguese)1 Using these
two financial mechanisms for conservation the emission of approximately 2 million tons of carbon
dioxide into the atmosphere over a period of 37 years will be avoided
It is important to emphasize that the project area is crucial for conservation especially considering
its characteristics such as (i) high biological diversity and concentration of endemic and
pharmacological species (Section 7) (ii) extensive areas of plains which are important for the
reproduction and survival of many species of plants and animals especially birds and reptiles and
(iii) high potential for ecotourism and environmental education including scientific research
The creation of these private reserves also contributes to the consolidation of a strategy to
establish ecological corridors and mosaics in the region creating a territorial connection between
public and private conservation areas This situation reduces potential conflicts between the state
landowners and residents in the buffer areas and creates opportunities for implementing integrated
actions optimizing human and financial resources for environmental monitoring and control
actions
Another important fact to consider is the surrounding communities who use the project areas for
their own subsistence extracting non-timber forest products (eg nuts fruits oils vines) fishing
and hunting For that reason they have direct interest in the conservation of the forest to obtain
food economic security and maintain their cultural practices
The environmental benefits that the communities receive make them guardians of the forest
contributing significantly to the monitoring and controlling of illegal activities practiced in the region
such as logging fishing and poaching as well as supervision and control of forest fires In this
context the Amazon Rio project plays a role of great environmental importance for the region also
contributing to the improvement of livelihoods of the local population and consequently to the
conservation of the forest
A population of 350 families distributed among 15 communities is estimated to reside around the
area of the Amazon Rio project The environmental benefits provided by the implementation of the
project and Amazon Rio I RPDS Management Plan and posteriorly including Amazon Rio II III
and IV demonstrate a strong social development component and includes several socio-economic
support programs to local communities which promote sustainable development in the region
2 sect 2 Art 15 of the new Brazilian Forest Code (Law 126512012) provides for voluntary forest reserves ie the
excess of forest required by law on rural property According to this law all preserved area that exceeds the minimum required by law may be used for creation of environmental easement or Environmental Reserve Quotas in the same biome and State
MONITORING amp IMPLEMENTATION REPORT VCS Version 3 CCB Standards Third Edition
v30 12
The project will be implemented starting from the introduction of participatory processes ensuring
active involvement of the local communities around the area as in the aforementioned
development programs and in decision-making The community programs that aim to improve
access to health education and income generation will use the ldquoBolsa Florestardquo program as
reference a program of great relevance for payments for environmental services (PES) in the state
of Amazonas In the medium and long terms these programs intend to significantly improve the
living conditions of these communities strengthening their organizational and institutional capacity
including their productive environmental and financial sustainability
12 Project Objectives
General objective
The objectives of this project takes a holistic approach to the region and keep full affinity to the
recent statement of the United Nations in the design of the seventeen goals of Sustainable
Development2 (ODS) In this sense the project objectives have a direct relationship with some of
the ODS and take others as a source of inspiration for the implementation of activities in
partnership with local communities These guidelines will be key elements in the local discussion
process around the project activities
Thus it is assumed as a general objective of the project contribute to the maintenance of global
climate (goal 13) through the implementation of activities to prevent the emission of greenhouse
gases locally by replacing the forest selective logging for a project conservation of forest
biodiversity (goal 15) preserving the traditional culture of the population of surrounding
communities (goal 3) promoting income generation (goal 1 8) and contributing to local social
development (goals 2 5 4 6 7)
Specific objectives
Specifically the project aims to
2 The seventeen Sustainable Development Goals at the United Nations are (1) Ending poverty in all its
form everywhere (2) Ending eat hunger achieve food security improve nutrition (3) To ensure a healthy life and promote well-being for all (4) To ensure inclusive education equitable and quality (5) Achieving gender equality and empower all women (6) Ensure availability and sustainable water management (7) Ensure access energy reliable and sustainable (8) To promote sustained inclusive and sustainable economic growth (9) Building resilient infrastructure promote inclusive industrialization (10) To reduce inequality between and within countries (11) Making cities inclusive human settlements secure resilient (12) To ensure standards of sustainable consumption and production (13) Take urgent action to combat climate change (14) To preserve and promote the sustainable use of the oceans (15) To protect restore and promote the sustainable use of forests (16) To promote peaceful and inclusive societies for sustainable development (17) To strengthen the implementation mechanisms and revitalize the global partnership
MONITORING amp IMPLEMENTATION REPORT VCS Version 3 CCB Standards Third Edition
v30 13
1 Implement economic alternative activities to selective logging to generate revenue for the
project benefiting at least 300 families surrounding the target area
2 Reduce approximately 32 million tons of carbon dioxide as a result of project activities
3 To contribute to the maintenance of regional biodiversity through the preservation and
conservation of the forest
4 Contribute to improve educational processes and attention to regional health
5 Promote the inclusion and womens empowerment in the project area communities
13 Project location
Location
The Amazon Rio Project is located in the southern region of the state of Amazonas in the
municipality of Manicore (Figure 01) The waterway and air constitute arrival means to the city with
approximate distance of 333 km by air and 427 km by river is the starting point for the city of
Manaus the state capital The Project areas are near the Madeira River and between the
Sustainable Development Reserves (RDS) Rio Madeira and Rio Amapaacute (Figure 02)
Figure 01 - Location of the Municipality of Manicoreacute - AM
MONITORING amp IMPLEMENTATION REPORT VCS Version 3 CCB Standards Third Edition
v30 14
Figure 02 - Location areas I II III and IV of the Amazon Rio Project
Figure 03 - Project Zone and communities of the project
MONITORING amp IMPLEMENTATION REPORT VCS Version 3 CCB Standards Third Edition
v30 15
Specifically in the Amazon Rio area the dense Primary Tropical Ombrophylous Lowland Forest and
open Primary Tropical Ombrophylous Lowland Forest with palm trees (79) Dense Primary
Tropical Ombrophylous Alluvial Forest (11) Open Primary Tropical Ambrophylous Alluvial Forest
with palm trees (8) Pioneer Formations with fluvial andor lacustrine influence - herbaceous and
shrubby vegetation with palm trees (1) (Annex 5)
According to IBGEs soil database (2000) the Manicoreacute region is formed mainly of Latosols and
Argisols Also soils such as Gleysols Spodosols Alluvial soils Neosols Planosols Plinthosols and
Nitosols can be found The Brazilian Soil Classification System produced from surveys by the
Brazilian Agricultural Research company (EMBRAPA) between 2001 and 2006 corroborates the
classification information for that region
Alluvial soils are very common in this region These soils are found mainly on the banks of the
Madeira River The fertility levels are dystrophic and located on flat terrain Agricultural and
livestock activities are almost always practiced along the main alluvial stretches of the region The
most fertile soils that occur on the floodplains (vaacuterzea) are widely cultivated for temporary crops
such as beans rice watermelon and cassava
Climate and hydrography
The climate in the region of the Madeira River is humid equatorial (IBGE 2011) with an average
temperature of 27degC relative humidity ranging between 85 and 90 and annual rainfall between
2200 to 2800 mmyear (RADAMBRASIL 1974) Studies from the Amapaacute Rio RDS area indicate
that between the months of January and March rainfall intensity is greater with monthly rainfall
between 300 and 350 mm while the driest months are July and August with monthly averages
around 50 mm
Geographically the Amazon region is defined by watersheds formed by the rivers which flow into
the Amazon Rio and its mouth along the entire East coast of Brazil (RIBEIRO et al 1999) The
city of Manicoreacute is influenced mainly by the Madeira and Manicoreacute rivers which are respectively
white and black water rivers and contribute to the local climatic conditions combined with the
characteristics of the vegetation that includes forests meadows savanna (cerrado) and floodplains
(vaacuterzeas)
Economic context of land use
Southern Amazonas is an important region strategically to prevent advances in deforestation in the
Amazon However in recent years the region has been suffering successive deforestation events
from expanded farming activities contributing to the so-called arc of deforestation toward the
MONITORING amp IMPLEMENTATION REPORT VCS Version 3 CCB Standards Third Edition
v30 16
state of Amazonas Historically the arc of deforestation has advanced with the expansion of
agriculture in the states of Paraacute Mato Grosso Rondocircnia Tocantins and Maranhatildeo In recent
years pressures on forests have increased with the globalization of markets for meat and
soybeans in the Amazon and international development policies for the region (IDESAM 2011)
14 Project Proponent (G4)
Organization Name Empresa Brasileira de Conservaccedilatildeo de Florestas SA (EBCF)
Contact Person Leonardo Barrionuevo
Title President
Address Curitiba-PR Al Dr Carlos de Carvalho 555 Conj 231
Centro Curitiba ndash PR CEP 80430-180 Brazil
Escritoacuterio Manaus Av Djalma Batista 1661 Conj 1409 A Bloco B
Ed Business Tower Millenium Cep 69050-010 Manaus-AM Brazil
Telephone +55 41 3158 9800 | +55 41 9943 8005
Email leonardoebcfcombr
15 Other Entities Involved in the Project (G4)
Organization Name Original Trade Consulting
Role in the Project Update of the Amazon Rio REDD+ IFM Project Description (PD) (V20)
and coordination of certifcation process
Contact Person Joatildeo Batista Tezza Neto
Title Director
Address Avenida Andreacute Arauacutejo 2936 ndash Edifiacutecio Incubadora do INPA sala 10
Cep 69060-000 Manaus-AM Brazil
Telephone +55 92 981590997
Email tezzanetooriginaltradenet
MONITORING amp IMPLEMENTATION REPORT VCS Version 3 CCB Standards Third Edition
v30 17
Organization Name HDOM
Role in the Project Degradation and deforestation report Forest inventory for biomass
calculation purposes in the project area and support the PD review
Contact Person Francisco Higushi
Title Director
Address Av Maacuterio Ypiranga 315 Ed The Office sala 609 Adrianoacutepolis CEP
69057-002
Telephone + 55 92 98128 2561
Email fghiguchihdomcombr
11 Project Start Date
The project began on August 17 2012 when the board and EBCF shareholders formally approved
the companys Business Plan (Annex 27) which set out the objectives of conserving forests
through the REDD + provision of services and sustainable use of forest resources excluded
logging activities
12 Project Crediting Period
The first crediting period of the project is 37 years beginning on August 17 2012 and ending on 17
August 2049 This period is equivalent to the remaining 12 years of the first authorized
management plan (25 years from 1998) added to another 25 years in respect of a new forest
management plan that was intended as the common practice of forestry in Brazil The logging
activities could continue beyond 37 years aiming for a second crediting period
2 DESIGN
21 Sectoral Scope and Project Type
Project Scope Agriculture Forest and other Land Use (AFOLU)
Project Category Reduction Emission from Deforestation and Degradation from Planned
Deforestation (REDD-IFM)
MONITORING amp IMPLEMENTATION REPORT VCS Version 3 CCB Standards Third Edition
v30 18
Type of Activity Improved Forest Management - Logged to Protected Forest (IFM LfPF)
22 Project Financing
The carbon project integrates a broad vision of territorial management as part of the Management
Plan of the Amazon Rio Private Reservation I Accordingly it stipulates that all actions necessary
to implement this Plan should be enabled from resources obtained by payments for environmental
services such as carbon credits and CRAs
The idea is for the plan to serve as a management tool to provide technical and political support
support to negotiations with support institutions to receive investments that can make projects and
programs viable The expected revenues in the short and medium term to implement the
Management Plan will mostly come from payments for environmental services such as negotiated
carbon credits and CRAs in addition to projects that generate long-term income exclusively for the
communities such as ecotourism scientific research and harvest of non-timber forest products
In this context the main difference between a permanent protection private reserve (eg RPPN)
and a private sustainable development reserve (eg RPDS) is that the long-term financial viability
of sustainable reserves usage comes from the marketing of non-timber forest products with high
added value and other sustainable businesses in compensation for environmental services This
flow of resources is expected to occur during and after the implementation period The proposal is
that with external support and through their political representatives local communities will be able
to establish partnerships and contracts with companies cooperatives and industries interested in
supporting social and environmental initiatives in the project areas
These items are briefly listed below with their respective values regarding the implementation and
execution of the project part of which will be initially financed by the contribution of the partners as
mentioned above
Table 01 - Project implementation and opperational costs3
Component Value (R$) Share ()
Pre-Operating expenses R$ 1561904 361
Administrative expenses R$ 24069915 5568
Costs of VCS + CCB certification R$ 456670 106
3 Annex 16
MONITORING amp IMPLEMENTATION REPORT VCS Version 3 CCB Standards Third Edition
v30 19
Monitoring R$ 2820000 652
Social program related expenses R$ 6050000 1399
Carbon trading R$ 1188536 275
Taxes on income R$ 1680219 389
Taxes on profit R$ 5008435 1159
Interest 10 return on investment of shareholders R$ 396300 092
TOTAL R$ 43231980 10000
23 Employment Opportunities and Worker Safety
Despite the considerable local knowledge of the regionrsquos ecosystems and environments
technology is lacking related to the value added to products and environmental conservation
projects Besides these difficulties public service agents frequently indicate the use of techniques
and management practices that require high external inputs and major investments To overcome
these limitations the project intends to promote specific and culturally relevant trainings that include
workshops meetings courses and extended technical assistance to improve the knowledge and
skills of community leaders residents and employees of the project To complement such
trainings we intend to install diversified agroforestry systems to restore and reuse degraded
areas to encourage handicrafts and tourism and to improving the management of non-timber
forest products with emphasis on Brazil nuts andiroba copaiba and Acai As a result
management practices are expected to improve in the long-term as well as and the fostering of
local culture combining technical and scientific knowledge with traditional knowledge
24 Stakeholders (G3)
Consultation prior to the beginning of the project
The populations involved in the carbon project are direct users of forest resources that are present
in the Amazon Rio I II III amp IV areas for the practice of plant and animal extraction Initially they
were indicated by the Council of Agro-Extrativist Associations of Democracia (Conselho das
Associaccedilotildees Agroextrativistas de Democracia - CAAD) which gathers associations of residents
from ten communities located near the Amazon Rio I Reserve Following this indication the EBCF
hired the services of the consulting company CO2X Conservaccedilatildeo de Florestas Ltda to perform a
MONITORING amp IMPLEMENTATION REPORT VCS Version 3 CCB Standards Third Edition
v30 20
series of workshops and meetings to prepare the Amazon Rio I Management Plan (Annex 9) and
to develope the Amazon Rio REDD+ IFM project In these meetings different forms and spaces of
participation of the people and government and non-governmental institutions were discussed to
support the development and implementation of the Management Plan culminating in the creation
of an Advisory Council In these events conservation and fundraising strategies were presented to
the community among them the marketing of avoided emissions resulting from the suspension of
timber management activities The conduct of the Free Prior and Informed Consent (FPIC)
process was done in the communities surrounding the Amazon Rio I II III and IV areas during
three workshops in 2013 which had a very inclusive and participatory nature This document as
well as the minutes of the workshops participatory mapping Sustainability Matrix questionnaires
and presentations in PPT slides are available in Annex 104
Identification of stakeholders
There are 15 communities that will benefiot from the activities of the project and twelve of them
(Urucury Aacutegua Azul Vista Alegre Boa Esperanccedila Santa Eva Santa Maria Pandegal
Democracia Jatuarana Terra Preta do Ramal Kamayuaacute and Satildeo Joseacute do Miriti) are located in the
region surrounding Amazon Rio areas I and III and in the Rio Amapaacute Reserve on the Madeira
River and its tributaries One of the communities is formed by residents that integrate the
Agroextractivist Association Satildeo Joatildeo e Ponta Grossa which is located in the surroundings of the
Amazon Rio IV area Two communities Terra Preta do Rio Manicoreacute and Mocambo are located in
the region surrounding the Amazon Rio II on the bank of the Manicoreacute River(Figure 03)
Figure 04 - Location of the communities surrounding the Amazon Rio areas I II III and IV
4 This topic is thoroughly discussed in Section 37 of this document
MONITORING amp IMPLEMENTATION REPORT VCS Version 3 CCB Standards Third Edition
v30 21
Except for Terra Preta do Rio Manicoreacute Mocambo and Satildeo Joseacute do Miriti all of the communities
utilize the Rio Amapaacute RDS area either on a sporadic or seasonal basis to meet their food needs
(collecting various fruits fishing and hunting) for household and medicinal use (bark leaves and
plant parts considered by medical practices and traditional knowledge) and primarily for the sale of
various non-timber products especially the harvesting of Brazil nut accedilaiacute and copaiacuteba oil However
the trails roads and paths that provide access to the Amapaacute Rio RDS and Amazon Rio areas are
in a poor state of repair which hinders extraction practices especially the production of Brazil nuts
In addition to the 15 communities surrounding the Amazon Rio areas government organizations
directly involved with environmental issues in the region such as SDS the National Indian
Foundation (Fundaccedilatildeo Nacional do Iacutendio - FUNAI) City Hall and the City Council of Manicoreacute the
Secretary of Environment and Sustainable Development of Manicoreacute ICMBio and non-
governmental organizations such as FAS IEB CAAD CNS UFAM UEA were identified and
contacted to participate in the entire process of preparation of the Management Plan
Stakeholder meetings
To present and discuss the project in detail with representatives of 15 communities surrounding
the project area and support institutions three workshops in different locations were conducted
The subjects were presented in straightforward language in a culturally appropriate way so that
community representatives could understand relatively complex and unusual concepts such as
climate change greenhouse effect and payments for environmental services
The importance of forests for the mitigation and adaptation to climate change was emphasized to
convey the main objectives of the project to community representatives and in particular their role
in (i) absorbing carbon dioxide and release oxygen (ii) helping control climate processes on a
regional scale (iii) regulating the flow of rivers and erosion control and (iv) providing shelter and
food for most animals and plants on the planet The fact that 20 of global greenhouse gas
emissions come from the destruction of forests and in Brazil 70 of emissions come from
deforestation was also mentioned
During the workshops participants learned that steps can be taken to reduce the emissions of
greenhouse gases by investing in renewable energy sources such as solar energy wind energy
hydroelectric power plants electric cars and other more efficient ones Another option that
mitigates climate change was also highlighted that relates to the Amazon forest conservation and
the restoration of degraded areas through reforestation management of agricultural land and
establishment of agroforestry systems
MONITORING amp IMPLEMENTATION REPORT VCS Version 3 CCB Standards Third Edition
v30 22
After concepts were discussed it was explained to those present that the proposed project to be
carried out in the RPDS Amazon Rio I recently approved at the time and in the creation process
in the other Reserves has essentially one goal to financially reward those who preserve and
protect a forest threatened with deforestation and degradation the project aims (i) raise funds for
the implementation of the Management Plan programs and (ii) conserve forests and the associated
biodiversity It was also mentioned that the project is part of a new vision of the business strategy
since a logging plan was operational until 2010 associated with the emissions of greenhouse
gases In 2010 the practice was suspended by the owner who began investing in the creation of a
project focused on conservation and payment for environmental services with emphasis on the
voluntary carbon market
Implementation schedule
Table 2 - Implementation schedule and next activities
Ano Atividade
2010
EBCF performs the symbolic protocol creation of the first RPDs during the
seminar results and perspective of the State of Amazonas Conservation
Units held by the SDS
2011 EBCF submits the formal protocol to CEUC
2011 Meeting presentation EBCF for communities near the Amazon River I II III
and IV
2011
EBCF attended the informal invitation made by the management of RDS
Rio Amapaacute and representative CEUC - Silvia Elena the training workshop
and delivery portfolios ENVIRONMENTAL VOLUNTEERS AGENTS held in
the Boa Esperanccedila community
2011
EBCF participated in the event organized by the CAAD which had the
agenda General Assembly accountability of CAAD year 20092010 RDS
Management Plan Amapaacute Rio Bolsa Floresta Municipal Management
IDAM contribution contribution Covema IEBs contribution and delivery of
equipment for processing of acai held on 24032011 in the community of
MONITORING amp IMPLEMENTATION REPORT VCS Version 3 CCB Standards Third Edition
v30 23
Democracy and 25032011 in the Boa esperanccedila Community
2011 Inspection of CEUC on farms for approval on RPDs
2011 The board of EBCF makes his 1st visit the communities and farms
2011
EBCF in partnership with the Municipal Government of Manipur perform
the recovery local road (approximately 20KM) linking Democracia
community Jatuarana communities Terra Preta Community Santa Eva
and Vista Alegre
2012
Visit of the president and directors of EBCF the communities surrounding
the reserves together with the president of PATAC Marcelo Marder and
Andre Albuquerque president for socioeconomic communities report
presentation
2012 Business Plan Project approval and EBCF shareholders agreement
authorizing the start of the REDD project
2013 Workshop I - Diagnosis for the development of areas of the Amazon River
Management Plan I II III amp IV
2013 Visit communities to complement the workshop I for interviews with the
locals
2013 Meeting in CEUC after the second workshop to update the work with the
communities and the progress of the approval of the areas
2013
Technical meeting with the team CO2X Renascer and Human
Development EBCF in Curitiba for the review and evaluation of the first part
of the Management Plan (diagnosis) Definition of programs and
subprograms of the Plan identification of key issues potential threats and
opportunities with the creation of RPDSs definition of vision and action
strategy
MONITORING amp IMPLEMENTATION REPORT VCS Version 3 CCB Standards Third Edition
v30 24
2013
The Secretary of State for the Environment (SDS) officiated at the World
Environment Day the first Private Reserve Sustainable Development
(RPDs) of the Amazon with the signing of the decree no 86
2013 Workshop II - presentation of the carbon project as one of the fundraising
programs for the implementation of the Management Plan
2013 Field work with communities and farms for mapping biodiversity and
hunting and fishing grounds
2013 The EBCF performs a complete socioeconomic census in the surrounding
communities of RPDs
2013 Meeting with CEUC for delivery and presentation of the draft of RPDs
Amazon River Management Plan I
2013
Supplementary Meeting to communities who could not attend the
Workshop II amp III Workshop Creation of the Advisory Council for RPDs
Amazon River I
2013 The EBCF performs social and economic Census in Kamayuaacute community
2015 Realization of field activities for Biomass Inventory Estimation
2016 Vitor Belfort visit and launch of income-generating initiatives
2016 Distribution of medical kits for community health workers and launching the
Health Program in the Amazon
2016 Deforestation Report
2016 PD Review and preparation of the monitoring report
MONITORING amp IMPLEMENTATION REPORT VCS Version 3 CCB Standards Third Edition
v30 25
2016 REDD + Project Certification (VCS and CCV)
2016 Project planning for structuring the supply chain of vegetable oils
certificates
2017 Fundraising from the REDD project
2017 Ecotourism Project Design
2017 Workshop Achievement Participatory Planning Project REDD + activity
EBCF
2017 ProBUC Deployment
2018 Implementation of Voluntary Environmental Agent program
25 Respect for Rights and no Involuntary Relocation
In the three workshops explaining the Carbon project to 15 communities the eight REDD+
principles and the social and environmental safeguards were presented Those safeguards were
previously established in a series of meetings throughout the Amazon between 2009 and 2010
and included several Civil Society Organizations
It was emphasized in the workshops that compliance with these principles and safeguards under
REDD+ projects such as the Amazon Rio carbon project contributes to improving local
governance transparency of information public participation in decision-making coordination of
actions among different actors and respect and recognition of the rights of indigenous peoples and
traditional populations
Free Prior and Informed Consent (FPIC)
During the project workshops the concept of Free Prior and Informed Consent was presented to
the participants as well as the importance of social and environmental safeguards to ensure the
rights of communities in designing and developing the REDD+ project explained in the eight
principles The participants were asked whether they were in agreement and if there were other
MONITORING amp IMPLEMENTATION REPORT VCS Version 3 CCB Standards Third Edition
v30 26
principles or rights that should be included Some community individuals expressed their
agreement to the safeguards All participants at the three workshops raised their hands in support
of REDD+ project The consent was unanimous
A separate document describing the whole process of the Free Prior and Informed Consent has
been prepared and is available in Annex 10
Figure 05 - Workshop I Free Prior and Informed Consent for the development of the REDD+
project by the community leaders of Democracia Aacutegua Azul Satildeo Joseacute do Miriti Vista Alegre
Jatuarana Terra Preta do Ramal Pandegal Santa Maria Santa Eva and Terra Preta do Rio
Mancoreacute
Figure 06 - Workshop II Free Prior and Informed Consent for the development of the REDD+
project by the community leaders of Urucury Mocambo Boa Esperanccedila and Satildeo Joatildeo amp Ponta
Grossa
MONITORING amp IMPLEMENTATION REPORT VCS Version 3 CCB Standards Third Edition
v30 27
Figure 07 - Workshop III Free Prior and Informed Consent for the development of the REDD+
project by the Kamayuaacute indigenous community
3 APPLICATION OF METHODOLOGY
31 Title and Reference of Methodology
VCS VM0011 Methodology for Improved Forest Management ndash Logged to Protected Forest
(LtPF) Calculating the GHG Benefits from Preventing Planned Degradation version 10
MONITORING amp IMPLEMENTATION REPORT VCS Version 3 CCB Standards Third Edition
v30 28
32 Methodology Deviations
Whereas the VM0011 was developed in a context of homogeneous forests of temperate regions
some methodological adjustments were made related to the direct survey biomass in the field
since the project areas are comprised of very heterogeneous areas of rainforest including dryland
and floodplains Any technical documentation related to these methodological adjustments and
their justifications appear in Annex 23 (Forest Inventory 2016) prepared by the consulting firm
HDOM
33 Project Boundary5
The total area of the property is 20387 ha and a buffer zone was established around each of the
four areas in order to include communities that use the resources within their boundaries (Figure
7a) Project activity areas (for purposes of calculating the emissions reductions called the project
area or PA) are only those for which logging is permitted a total of 19800 ha (Figure 7b)
excluding the Permanent Preservation Areas (APPs) and bodies of water A logging plan has been
approved for this area for selective logging (Annexes 1 2 3 4 6 and 7)
Figure 08 - Project Boundaries a) Direct Project interference limits b) Total Project Area (G1
Indicator 7)
5 Ref section 22 of VM0011
MONITORING amp IMPLEMENTATION REPORT VCS Version 3 CCB Standards Third Edition
v30 29
Stratification of the project area
For purposes of inventorying local carbon stocks and project management the project area was
stratified into 3 groups of different forest types as indicated by the VM0011 according to the
vegetation map SIPAMRADAM (DPI 2002) The forest types present in the area are rain forest
types divided into 3 categories as follows
Dense Primary Tropical Ombrophylous Alluvial Forest
Dense Primary Tropical Ombrophylous Lowland Forest
Pioneer Formations
Figure 09 - Project Area forest types
Leakage areas
There is no direct leakage resulting from planned project activities since there will be neither
displacement of management activities to other areas after the cessation of the activities within the
project area nor market leakages The project Management Plan includes the monitoring of
MONITORING amp IMPLEMENTATION REPORT VCS Version 3 CCB Standards Third Edition
v30 30
possible unanticipated leakages around the project area as well as the need to report to the
competent authorities whenever logging activities are identified in these areas For more
information on leakage see chapters 52 and 55 of this document
Temporal boundaries
Crediting period of the project
The first crediting period of the project is 37 years beginning on August 17 2012 and ending on 17
August 2049 This period is equivalent to the remaining 12 years of the first authorized
management plan (25 years from 1998) added to another 25 years in respect of a new forest
management plan that was intended as the common practice of forestry in Brazil The logging
activities could continue beyond 37 years aiming for a second crediting period
Monitoring and Reporting Period
a) Monitoring of Baseline Emissions
The monitoring of Baseline Emissions must demonstrate that the protected forest area is in
accordance with the one specified in the PD The project limit will be monitored before each
verification throughout the crediting period through new inventory information and remote sensing
and GIS as applicable Thus the project will be able to update the baseline calculations based on
the actual remaining forest area (in case of loss of forest cover by disasters for example) and that
would be subject to forest management under a ldquowithout projectrdquo scenario
b) Monitoring of Project Emissions
Project emissions will be monitored annually and compiled in every monitoring report that will detail
in particular the
Monitoring of possible illegal harvesting of timber
Monitoring of areas subject to natural disturbances
Monitoring and quantification of emissions related to air and land travel related to project
activities
c) Monitoring of Leakage
Since there will be no leakages according to the VM0011 and AFOLU Requirements no leakage
monitoring will be necessary However to be conservative the project intends to monitor any
disturbances that might affect the carbon reservoirs Once some disturbance is registered the
project will report the incident to the relevant authorities and make the necessary adjustments to
MONITORING amp IMPLEMENTATION REPORT VCS Version 3 CCB Standards Third Edition
v30 31
the baseline For more details about the monitoring of leakages see chapters 52 and 55 of this
document
Carbon stocks
The biomass reservoirs considered by the project are related to above-ground and underground
biomass
Sources and sinks of GHGs
Table 02 below describes the emission sources and sinks of greenhouse gases associated with
the baseline activities and with the project
Table 03 - Greenhouse gas emissions sources and sinks associated with baseline and project
activities
Source Gas Included JustificationExplanation
Baselin
e
Biomass
CO2 Yes Main source of project emissions through forest
degradation harvested and commercialised
wood products deadwood and forest regrowth
CH4 No Conservatively excluded
N2O No Conservatively excluded
Other No -
Fossil Fuel
consumption
CO2 Yes Main source through fossil fuel use in
machinery and transportation of timber
CH4 Yes Conservatively included
N2O Yes Conservatively included
Other No -
Electricity
consumption
CO2 Yes Main source
CH4 No -
N2O No -
Other No -
Pro
ject
Biomass
CO2 Yes Main source through unexpected natural
disturbances such as forest fires etc
CH4 Yes Included but subject to significance
N2O Yes Included but subject to significance
MONITORING amp IMPLEMENTATION REPORT VCS Version 3 CCB Standards Third Edition
v30 32
Source Gas Included JustificationExplanation
Other No _
Fossil Fuel
consumption
CO2 Yes Main source through flights and ground travel
CH4 Yes Included but subject to significance
N2O Yes Included but subject to significance
Other No _
Electricity
consumption
CO2 Yes Main source
CH4 No _
N2O No _
Other No _
34 Baseline Scenario
The choice between alternative baseline scenarios was taken together with the analysis of
additionality using the latest version of the VCS Tool for the demonstration and assessment of
additionality in Agriculture Forestry and Other Land Use VCS projects in this case VT000167
(VCS 2012a) All possible scenarios as well as the analysis of methodology barriers (steps 211
and 212 of the VM0011) are present in the chapter below In this sense to avoid redundancy of
information refer to additionality analysis to find the steps 211 and 212 of the VM0011
The baseline scenario for the project identified as the most likely to occur was selective logging8
(continuation of Business As Usual - BAU) The reference scenario assumes 37 years of selective
logging according to the 25 year logging plan approved in August 1998 (Annex 6 - document
ValdII T01 POA 1998) that in the absence of project activities would be renewed in 2024 for
another 25 years until 2049
Under this scenario the full implementation of the timber logging plan occurs and which has
already resulted in the degradation of 434769 ha (see table below) The area would be harvested
selectively for timber sold in lumber markets Below is a summary of harvest areas between 1999
and 2010 showing the managed plots and the dates on which the harvests were authorized
6 Tool for the demonstration and assessment of an additional to the VCS project activities in Agriculture Forestry and Other
Uses (AFOLU) (V 30)
7 Adapted from ldquoTool for the Demonstration and Assessment of Additionality in AR CDM project Activitiesrdquo (V02) 8 Additional information about choosing the baseline are presented in section 46 (steps 1 and 2)
MONITORING amp IMPLEMENTATION REPORT VCS Version 3 CCB Standards Third Edition
v30 33
Table 04 - Summary of areas managed since 1999
Date Managed logged area (ha)
1999 58669 (Plot 1)
2000 688 (Plot 2)
2001 ndash 2002 8315 (Plot 3)
2003 ndash 2004 750 (Plots 3 and 4)
2005 ndash 2007 1082 (Plot 5)
2008 ndash 2009 49050 (Plots 5 and 6)
TOTAL 434769
35 Additionality
The additionality analysis of the Amazon Rio project REDD+ IFM was conducted with the latest
version of the VCS Tool for the demonstration and assessment of additionality in Agriculture
Forestry and Other Land Use VCS projects the VT000167
(VCS 2012a)
To generate the reductions in GHG emissions for the project the planned baseline activities
(sustainable forest management) were terminated by the project proponent and supplanted by
environmental conservation activities In this sense the project will be managed by EBCF with
the goal of creating a fund for administrative and accounting management especially to promote
environmental management and monitoring activities of carbon pools within the project area
Alternative activities planned in the project are the provisioning and valuation of environmental
services via carbon credits (VCUs) in conjunction with the sale of Environmental Reserve Quotas
(CRAs)
4 MONITORING AND PARAMETERS OF DATA
41 Monitoring Plan Description
Due to its innovative comprehensive and integrative character the project needs to be monitored
regularly so that its actions activities and impacts can be constantly measured and evaluated To
meet this requirement the monitoring process must meet three main objectives
MONITORING amp IMPLEMENTATION REPORT VCS Version 3 CCB Standards Third Edition
v30 34
i To serve as an internal management project tool
ii To collaborate as an instrument of collective learning from the communities and
social groups directly involved
iii To work as a means of communicating results and impacts to interested institutions
and society in general Furthermore it is important to consider that monitoring if
successful will transcend the managerial aspects of the project and strengthening
the plan
To facilitate the monitoring process instead of having a reference line (to compare interventions
before and after) the first year of monitoring will serve as the starting point whose information will
be regularly and systematically compared throughout the project
Next the initial plans for monitoring benefits to the climate community and biodiversity are
described wherein the community is committed to participatory precept and to the technical and
scientific rigor which is capable of following the possible negative and positive impacts on
environmental and social aspects in the project area and its surroundings
Monitoring of Climate Impacts
The Monitoring Plan (MP) aims to provide security in the periodic estimates of reduction in
emissions especially in monitoring changes in carbon stock Therefore emissions from the
implementation of the project ex post estimates of the activities and emissions from any leakages
and isolated disturbances (eg blowdown fires pests and diseases among others) can be
calculated
The construction of the PM of the climate benefits made in full compliance with the methodological
framework provided by VM0011 ndash IFM LPF (VCS 2011) and CCBA (2008) which consists of four
specific actions to be monitored
i Implementation and execution of the project
ii Dynamics and stock of the forest biomass
iii Deforestation and forest degradation
iv Periodic reviews of ex post emissions
Remote monitoring and surveillance of the project area
Measurement of alterations and biomass loss quantification present in the PA using land use
change detection is critical to make accurate estimates of GHG emissions that account for forest
biomass increases and losses
MONITORING amp IMPLEMENTATION REPORT VCS Version 3 CCB Standards Third Edition
v30 35
Thus the use of remote sensing by satellite images of medium spatial resolution can be applied
readily in the PA and surroundings in order to monitor land use dynamics over time particularly to
identify risks and threats to forested areas In situ verification will complement landscape analysis
in a GIS environment with the aim of quantifying spatializing and identifying conversion of forest
areas into other land uses environmental degradation and other possible changes that may occur
during the term of the project
As a complementary monitoring source the project will rely on the database and information
provided by Monitoring Program of the Brazilian Amazon Forest by Satellite 910
(Prodes Digital)
conducted by the National Institute for Space Research (Instituto Nacional de Pesquisas Espaciais
- INPE) according to the Plan for Prevention and Control of Deforestation in the Amazon
1112(PPCDAm) under the National Policy on Prevention and Control of Deforestation Such
information is available online in13
digital vector files for the public in general
Other tools will provide complementary information to the monitoring such as indicators of forest
degradation and hotspots (fires and wildfires) obtained from DETER 14
SAD 15
and PROARCO16
Information is available online for free in vector format These results will be systematically related
to field data for validating or disproving the occurred event so that the focuses of deforestation and
degradation can be identified remediated reported and consequently avoided as much as
possible
A surveillance system that allows permanent territorial monitoring and inhibits the entry of intruders
through entry points in the PA will also be deployed to control the transport flow In addition one
must investigate and identify risks and threats eg mapping hotspots and areas vulnerable to fire
to illegal logging to hunting and poaching and to invasions by third parties among others
At first we estimate an effective demand for structuring the electronic monitoring system which
includes the hiring of skilled professionals field equipment electronic equipment (digital cameras
GPS desktops and notebooks smartphones printers geoprocessing software and GIS among
others) vehicles andor motorcycles motorized boats for transportation and moving around and
the collection of high resolution satellite images Empowerment and training of all involved staff
9httpwwwobtinpebrprodesdigitalmetodologiahtml
10httpwwwobtinpebrprodesmetodologiapdf 11httpwwwmmagovbrflorestascontrole-e-prevenC3A7C3A3o-do-desmatamento 12httpwwwmmagovbrimagesarquivo80120PPCDAm_FINAL_PPCDAMPDF 13httpwwwobtinpebrprodesindexhtml 14httpwwwobtinpebrdeterdados 15httpwwwimazongeoorgbrdocdownloadsphp 16httpwwwdpiinpebrproarcobdqueimadas
MONITORING amp IMPLEMENTATION REPORT VCS Version 3 CCB Standards Third Edition
v30 36
and the surrounding communities will be necessary to make the system effective17
and a constant
stream of information directed to regional actors and other stakeholders
Strategic monitoring and access points to RPDS roads will also provide support to other MPs
including social and biodiversity conservation aspects especially in the logistic support of planned
field activities
Procedures for determining the permanent sample plots (PSPs) and measurement
The calculation of the stock and increase in forest biomass will be subsidized through the
installation of PSPs in the PA and its temporal monitoring through the Continuous Forest Inventory
(CFI) The methodology proposed by VCS (2011) suggests the use of permanent andor temporary
plots however it confirms the efficiency and accuracy of sample plots
In order to demonstrate the procedural and statistical rigor used all the sampling procedures the
PA forest stratification sampling design calculation of sampling intensity and other parameters
measured in PSPs to monitor biomass balance due to ingressmortality of individuals growth in
DBH and height will be presented in detail in the Annex (Annex 23 - Forest Inventory 2016)
To promote reliable forest biomass estimates standard operating procedures (SOPs) (Section 82)
will be used by the team executing the CFI
Monitoring frequency
The monitoring frequency parameters measured in the PSPs will be no greater than 5 years from
the first measurement Other relevant parameters to monitoring the PSPs like the change in land
use in the PA and surrounding areas such as deforestation forest degradation fire sources and
natural disturbances will be regularly monitored as a project routine operation organized and
archived annually
411 Monitoring Impacts to Biodiversity
Since animal inventories have not been conducted in Amazon Rio project areas (for this project
biological information for the Rio Amapaacute RDS management plan were used) a biodiversity
monitoring system that will follow the RAPELD methodology (Rapid surveys of various taxonomic
groups (RAP) for long-term ecological studies) (MAGNUSSON et al 2005)
The RAPELD method contributes to long-term research using rapid inventory assessments biotic
complementarity and land use planning in the Amazon This method increases adequate sampling
17Linking community monitoring to national Measurement Reporting and Verification for REDD+
MONITORING amp IMPLEMENTATION REPORT VCS Version 3 CCB Standards Third Edition
v30 37
probability of biologically diverse communities which require large areas and at the same time
minimize variation of abiotic factors that affect these communities with smaller areas sampling
Evaluation and selection of indicators will be conducted in accordance with the ProBUC model
however applicably to local reality results will be updated biennially from the first survey
Biodiversity indicators are being designed and planned as suggested in the Social and
Environmental Monitoring System of Protected Areas in the Brazilian Amazon (Sistema de
Monitoramento Socioambiental das Unidades de Conservaccedilatildeo da Amazocircnia Brasileira)1819
and
Methodology for Rapid Assessment and Prioritization of Protected Areas Management20
(Metodologia para Avaliaccedilatildeo Raacutepida e Priorizaccedilatildeo do Manejo de Unidades de Conservaccedilatildeo -
RAPPAM) in line with the experiences gained and disseminated by CEUC and ICMBIO previously
described
The empowerment accountability and shared management of biodiversity conservation is the
main focus of the methodological model adopted These actions create high expectations for
environmental management of the area as the biodiversity monitoring will be conducted by the
community members themselves along with the project proponent promoting a local multiplier
effect It is worth mentioning that strict compliance with these procedures is in within EBCF`s
interest since it considers them to be key to the success of the project
The project begins with the premise that any negative impact on biodiversity in the project area
and its surroundings will not occur In the opposite sense the project aims to generate and provide
greater understanding of the territory subsidizing proposals for the conservation and sustainable
use through adoption of good management practices of natural resources as well as its replication
in other locations
412 Monitoring Social Impacts
The monitoring of social aspects include both the collection of numerical data such as quantity
volume weight (quantitative indicators) as well as information expressing opinions and
experiences (qualitative indicators) remembering that such measures are compatible and
interchangeable Data collection should be systematic and have a pre-established rate and most
likely a single indicator will require several data collection instruments such as plans field records
reports etc
Social information will be monitored through the use of participatory methodologies In this sense
the preparation process of the Amazon Rio I RPDS Management Plan was a first step For the
18Indicator Design 19Social and Environmental Monitoring of Protected Areas System in the Brazilian Amazon (Sistema de Monitoramento
Socioambiental das Unidades de Conservaccedilatildeo da Amazocircnia Brasileira) 20Metodologia para Avaliaccedilatildeo Raacutepida e a Priorizaccedilatildeo do Manejo de Unidades de Conservaccedilatildeo (RAPPAM)
MONITORING amp IMPLEMENTATION REPORT VCS Version 3 CCB Standards Third Edition
v30 38
socioeconomic characteristics of communities several community meetings land use mapping
workshops and interviews with focus groups were held in addition to field visits (Annex 10) The
main activities of the project were presented and discussed in these events emphasizing the
importance and timeliness of local valuation of environmental services as well as strategies for
raising funds to implement other projects and improvements in social well-being of communities
around the PA
5 MEASUREMENT OF GHG EMISSIONS REDUCTIONS AND REMOVALS (CLIMATE)
51 Emissions Baseline
EBCF did not carry out any wood related exploration activity in the areas since the beginning of
the REDD+ project Thus it is confirmed estimated emission reductions for the project as
8678833 t CO2eq t year
52 Project emissions
Project emissions were primarily those related to the running of offices and necessary travels for
studies meetings presentations workshops and other activities Table 10 presents a summary of
emissions based on data from Annex 21 of this report
Table 05 - 2011-2016 Project Activity Emissions
YEAR Energy
(KWh)
Energy
(t CO2eq)
Travels
(Km)
Travels
(t CO2eq)
Total
(t CO2eq)
2010
678 024 024
2011
104010 2360 2360
2012 1149 008 55724 1573 1581
2013 2756 028 236749 5429 5457
2014 2498 025 15789 459 484
2015 2231 023 27340 597 620
2016 1015 010
010
093 440290 10443 10536
53 Leakage
Not applicable according to presentation made on the REDD+ IFM document
MONITORING amp IMPLEMENTATION REPORT VCS Version 3 CCB Standards Third Edition
v30 39
54 Summary of GHG Emission Reductions And Removals
EBCF REDD+ project shows emissions reduction of 34397563 tCO2e as the balance in the
period of 2011-2015 Table 06 shows the overview of the dynamics of reductions and project
emissions up to 2048 By the year 2015 the emissions data is posted as seen in reports and from
2016 data are projects as previous average and should be adjusted as a result of future reports
Table 06 - Summary of ex ante estimates
Year
Estimated
reductions
from
baseline21
(tCO2e)
Project
Estimated
emissions 22
tCO2e)
Unplanned
estimate
Emissions23
(tCO2e)
Net GHG
Estimated
emissions
Reduction
(tCO2e)
2012 8675500 1581 0 8673919
2013 8675500 5457 0 8670043
2014 8675500 484 296296 8378720
2015 8675500 620 0 8674880
2016 8675500 2100 0 8673400
2017 8675500 2100 0 8673400
2018 8675500 2100 0 8673400
2019 8675500 2100 0 8673400
2020 8675500 2100 0 8673400
2030 8675500 2100 0 8673400
2048 8675500 2100 0 8673400
Total 3123180 25203 296296 3119989
55 Climate Change Adaptation Benefits (GL1)
There is a relatively widespread understanding in the scientific community that balanced
ecosystems have greater ecological and social resilience and adaptability to climate change
21
See annex 18 22
See annex 21 23
See annex 24- HDOM (Study on deforestation and heat spots for EBCF REDD+ Project technical report)
MONITORING amp IMPLEMENTATION REPORT VCS Version 3 CCB Standards Third Edition
v30 40
whether through protection of water bodies and regulation of river flows during peak flood and
drought or through the regular supply of environmental services products and services
Thus once the project is designed to conserve an area of native forest which in the absence of
the project scenario would remain subject to the pressure of timber management (baseline) and
consequent degradation resulting from such activities it is understood that the mere protection of
these areas alone would offer communities and the ecosystem itself better adaptability compared
to the baseline scenario
Moreover the project has an Activity Management Plan (Annex 9) which details among other
initiatives the promotion of the sustainable use of ecosystem resources through direct support in
some activities related to income generation and conservation along with community training It is
believed that in addition to ensuring a more balanced (and therefore more resilient) environment
the project will expand the options for generating income among the communities making them
more resilient and preparing them to face the greater and already perceived challenges posed by
climate change
6 COMMUNITY
61 Positive Impacts for Communities (CM1)
EBCFrsquos REDD+ project was first presented to the riverine communities in 2011 By then
communities were informed about the cessation of all timber exploration activities due to the
REDD+ project and discussions were held regarding biodiversity conservation and the sustainable
use of forest products and services as well the social development of the surrounding
communities Briefly the positive impacts along the communities were
1 Project area zoning and its surroundings
2 Contribution to building local capacity
3 Contribution to developing sustainable business in the region
4 Contribution to social and environmental diagnosis
Knowing to manage
To evaluate the progress of these initiatives throughout the development of the project we used
the methodology of the Sustainability Matrix developed by the Secretariat of Environment and
MONITORING amp IMPLEMENTATION REPORT VCS Version 3 CCB Standards Third Edition
v30 41
Sustainable Development of Amazonas State This tool was applied in 15 communities taking into
account local socio-economic aspects that underlie the development of 20 parameters considered
of great importance to community development described by specific indicators As a visual tool
the Sustainability Matrix is quite suitable for traditional populations such as the riverside and
indigenous communities surrounding the Reserve Amazon River I and other areas of the Project
Additionally the Matrix provides interesting spaces for discussion since its construction is done
collectively Through the Sustainability Matrix it was possible to identify along with the
communities projects activities and implementation strategies Budgets and monitoring and
evaluation of these projects will be detailed later through the Annual Operational Plans to be
developed and followed up in the due course Four programs and nine subprograms were defined
for management and community development (Annex 9)
62 Negative Impacts (CM2)
No negative impacts have been recorded or identified as a result of the project with stakeholders
7 BIODIVERSITY
71 Positive Impacts for Biodiversity (B1)
The benefits for biodiversity are in reducing deforestation and degradation (selective logging) in the
project area According to satellite images analysis in the project areas and their surroundings it
was observed that until 2010 300 hectares were deforested After the implementation of the
project community awareness on the importance of preservation and conservation of forests have
encouraged no deforestation degradation and a significant reduction in deforestation was
identified (see graph below) This was due to the good understanding of the projects conservation
objectives and by the involvement and support of the surrounding communities
MONITORING amp IMPLEMENTATION REPORT VCS Version 3 CCB Standards Third Edition
v30 42
Figure 10 - EBCF REDD Project and buffer areas deforestation figures (source HDOM Report)
The consequences of deforestation and degradation on biodiversity are well known Thus the fact
of not being identified changes (natural or anthropogenic) in forest areas shows there was no loss
of biodiversity no reduction in floristic diversity no impact on the dynamics of fauna and flora and
no loss of evolutionary genetic information
72 Negative Impacts on Biodiversity (B2)
There are no negative impacts on biodiversity as a result of the project
73 Exceptional Benefits for Biodiversity (GL3)
The description of exceptional benefits for biodiversity will only be possible after the re-
measurement of permanent plots (FLORA)
8 ADICIONAL INFORMATION
All activities and the consequent reduction in deforestation and degradation in and around the
project areas were maintained and funded without resources of carbon credits We understand that
with the advance of REDD+ project EBCF will have much better conditions to implement positive
actions in partnership with communities
MONITORING amp IMPLEMENTATION REPORT VCS Version 3 CCB Standards Third Edition
v30 43
REFERENCES
ADEODATO S etal Madeira de ponta a ponta o caminho da floresta ateacute o consumo Satildeo Paulo
FGV-RAE 2011
ALBAGLI S Amazocircnia fronteira geopoliacutetica da biodiversidade Revista Parcerias Estrateacutegicas n
12 p6 set2001 Centro de Estudos Estrateacutegicos do Ministeacuterio da Ciecircncia e Tecnologia
AMARAL I C Viabilidade de plantio de cafeacute na zona da mata mineira Revista Poliacutetica Agriacutecola
Ano xx n4 outnovdez 2011 Disponiacutevel em
httpwwwalicecnptiaembrapabrbitstreamdoc9309031Viabilidadedeplantiopdf Acesso
em 17 de set 2013
AMARAL P etal Floresta para Sempre um manual para a produccedilatildeo de madeira na Amazocircnia
Beleacutem IMAZON 1998 130p
AMAZONAS Lei Complementar nordm 532007 de 05062007 REGULAMENTA o inciso V do artigo
230 e o sect 1ordm do artigo 231 da Constituiccedilatildeo Estadual institui o SISTEMA ESTADUAL DE
UNIDADES DE CONSERVACcedilAtildeO - SEUC dispondo sobre infraccedilotildees e penalidades e
estabelecendo outras providecircncias Disponiacutevel em
httpwwwcetesbspgovbruserfilesfilemudancasclimaticasproclimafilelegislacaoestadua
lamazonasleilei_complementar_n_53_2007_amazonaspdf Acessado em Setembro 2013
ANTAQ Anuaacuterio Estatiacutestico 2004 Distacircncia entre os portos Disponiacutevel em
httpwwwantaqgovbrportalanuariosportuario2004TabelasDistanciaEntrePortospdf
Acesso em 23 de out 2013
ANTAQ Panorama Aquaviaacuterio Agecircncia Nacional de Transportes Aquaviaacuterios Volume 3 Brasiacutelia
ndash DF 2009
MONITORING amp IMPLEMENTATION REPORT VCS Version 3 CCB Standards Third Edition
v30 44
AREDES A F PEREIRA M W G Anaacutelise econocircmica da produccedilatildeo de cafeacute araacutebica um estudo
de caso com simulaccedilotildees de Monte Carlo para sistemas de baixa e alta produtividade
Informaccedilotildees Econocircmicas SP v38 n4 abr 2008
ARIMA E UHL C Pecuaacuteria na Amazocircnia Oriental Desempenho Atual e Perspectivas Futuras Seacuterie
Amazocircnia n1 Beleacutem IMAZON 1996 40p
BACCINI A et al Estimated carbon dioxide emissions from tropical deforestation improved by
carbon-density maps Nature Climate Change vol2 march 2012 (LETTERS Published
Online - DOI 101038NCLIMATE1354)
BARROS A C UHL C Padrotildees problemas e potencial da extraccedilatildeo madeireira ao longo do Rio
Amazonas e do seu estuaacuterio Seacuterie Amazocircnia n4 Beleacutem IMAZON 1997 42p
BRASIL Lei 121872009 (Lei Ordinaacuteria) 29122009 Institui a Poliacutetica Nacional sobre Mudanccedila
do Clima - PNMC e daacute outras Providecircncias Presidecircncia da Repuacuteblica Casa Civil Subchefia
para Assuntos Juriacutedicos Disponiacutevel em lthttpswwwplanaltogovbrccivil_03_ato2007-
20102009leil12187htmgt Acesso em 20 de set 2013
CAMPOS E F Emissatildeo de CO2 da madeira serrada da Amazocircnia o caso da exploraccedilatildeo
convencional 2012 172p Dissertaccedilatildeo - Escola Politeacutecnica Universidade de Satildeo Paulo Satildeo
Paulo
CARDOSO RS e FREITAS C E C A pesca de pequena escala no rio Madeira pelos
desembarques ocorridos em Manicoreacute (Estado do Amazonas) Brasil Revista Acta
Amazocircnica vol 38(4) 2008 781 ndash 788
CCBA Climate Community and Biodiversity Alliance-CCBA 2008 Disponiacutevel em
httpwwwclimate-standardsorgccb-standards Acesso em 03 de set 2013
MONITORING amp IMPLEMENTATION REPORT VCS Version 3 CCB Standards Third Edition
v30 45
CEPEA Centro de Estudos Avanccedilados em Economia Aplicada - ESALQUSP Economia da
pecuaacuteria de corte na regiatildeo norte do Brasil Disponiacutevel em httpgooglL2roiA Acesso em
15 de out 2013
CHAMBERS J Q et al Decomposition and carbon cycling of dead trees in tropical forests of the
central Amazon Oecologia vol122 pp380-388 2000 Agricultores se queixam de
burocracia para contratar creacutedito sustentaacutevel do Programa ABC Correio Braziliense Brasiacutelia
26 fev 2012 Disponiacutevel em
lthttpwww2correiobraziliensecombrsersustentavelp=4592gt Acesso em 10 set 2013
CULLEN Jr L VALLADARES-PAacuteDUA C Onccedilas como detetives da paisagem Ciecircncia Hoje
Vol 156 n26 pp54-571999
CPRM - Serviccedilo Geoloacutegico do Brasil Disponiacutevel em httpwwwcprmgovbr Acesso em 13 de
mar 2013
DIAS F M MORAIS S J S REZENDE R C Anaacutelise da viabilidade econocircmica para a
produccedilatildeo de melancia e cenoura com financiamento em Anaacutepolis-GO 2008 Disponiacutevel em
httpwwwprpuegbr06v1conteudopesquisainiccieneventossic2008fronteiraflashsicani
macaoIIIJORNADAarquivosresumosresumo01pdfgt Acesso em 18 de nov2013
Divisatildeo de Precessamento de Imagens (DPI) Ambdata Mapa de Vegetaccedilatildeo SIPAM RADAM
2002 Disponiacutevel em httpwwwdpiinpebrAmbdatamapa_sipamphp Acesso em 21 de
out 2013
DOMINGUES MS BERNMANN C O arco de desflorestamento na Amazocircnia da pecuaacuteria agrave
soja Ambiente amp Sociedade Satildeo Paulo vol15 n2 pp1-22 maioago 2012
MONITORING amp IMPLEMENTATION REPORT VCS Version 3 CCB Standards Third Edition
v30 46
EBCF Criaccedilatildeo da primeira reserva particular de desenvolvimento sustentaacutevel do mundo na
floresta amazocircnica Disponiacutevel emlthttpwwwebcfcombrblog20130624criacao-da-
primeira-reserva-particular-de-desenvolvimento-sustentavel-do-mundo-na-floresta-
amazonicagt Acesso em 21 de set 2013
EMBRAPA Sistema Brasileiro de Classificaccedilatildeo de Solos 2ordf Ed Rio de Janeiro Embrapa Solos
2006 306 p
FELDPAUSCH T R et al When big trees fall Damage and carbon export by reduced impact
logging in southern Amazonia Forest Ecology and Management Vol 219 pp199-215 2005
FEARNSIDE P MDesmatamento na Amazocircnia dinacircmica impactos e controle Acta Amazocircnica
vol 36 n3 pp 395-400 2006
FILGUEIRAS T S et al 1994 Caminhamento Um meacutetodo expedito para levantamentos
floriacutesticos qualitativos Caderno de Geociecircncia IBGE vol12 pp39-43 1994
Forest Management Public Summary for Gethal Amazonas SA Induacutestria de Madeira
Compensada Certification Code SW-FMCOC-119 Date of Certification October 1
2000 Date of Public Summary October 2000 Updated for Annual Audit 2002 Annual Audit
2003 (Gethalpdf)
Globo Rural Linha de financiamento para a agricultura de baixo carbono tem pouca procura
2011 Disponiacutevel em httpwwwrainforest-allianceorgforestrydocumentsgethalpdf
Acesso em 16 de nov 2013
GREENPEACE Face a Face com a Destruiccedilatildeo Relatoacuterio Greenpeace sobre as companhias
multinacionais madeireiras na Amazocircnia Brasileira 1999 Disponiacutevel em
MONITORING amp IMPLEMENTATION REPORT VCS Version 3 CCB Standards Third Edition
v30 47
lthttpwwwgreenpeaceorgbramazoniaface_destruicaopdfgt Acesso em 11 de set
2013
Governo do Estado do Amazonas Plano de Gestao da RDS do Rio Amapaacute 2010 Disponiacutevel em
httpobservatoriowwforgbrsite_mediauploadgestaoplanoManejorio_amapapdf Acesso
em 24 de ago 2013
HDOM Estimates from processing the forest inventories data carried out during the CADAF
Project Final Technical Report 2012 Disponiacutevel em wwwhdomcombr Acesso em 27 de
maio 2013
HIGUCHI N 1986-87 Amostragem sistemaacutetica versus amostragem aleatoacuteria em floresta tropical
uacutemida de terra-firme na regiatildeo de Manaus Acta Amazonica 1617 (uacutenico) 393-400
HIGUCHI N SANTOS J JARDIM FCS Tamanho de parcela amostral para inventaacuterios
florestais Acta Amazocircnica vol12 n1 pp91-103 1982
HIGUCHI F G PINTO A C M ISHIZUKA M KAJIMOTO T LIMA A J N SANTOS J
HIGUCHI N Estoque e dinacircmica de biomassa acima do solo das florestas de terra firme do
estado do Amazonas In Adriano Joseacute Nogueira Lima Flaacutevia Machado Durgante Moacir
Alberto Assis Campos Joaquim dos Santos Moriyoshi Ishizuka Niro Higuchi (Org)
Dinacircmica do carbono das florestas da Amazocircnia resultados do Projeto CADAF
1edManaus INPA 2014 v 1 p 29-34
HOLMES T P etal Custos e benefiacutecios financeiros da exploraccedilatildeo de impacto reduzido em
comparaccedilatildeo agrave exploraccedilatildeo florestal convencional na Amazocircnia oriental 2ordf ed Beleacutem
Fundaccedilatildeo Floresta Tropical 2002 66p
HUSCH B MILLER C I BEERS T W Forest mensuration New York Ronald Press 1971
HUSCH B MILLER C I BEERS T W Forest Mensuration New York John Wiley amp Sons
2nd
ed 1972 402 p
MONITORING amp IMPLEMENTATION REPORT VCS Version 3 CCB Standards Third Edition
v30 48
IBGE Instituto Brasileiro de Geografia e Estatiacutestica Diretoria de GeociecircnciasCoordenaccedilatildeo de
Recursos Naturais e Estudos Ambientais Geologia Solos Hidrografia e Vegetaccedilatildeo 2000
IBGE Instituto Brasileiro de Geografia e Estatiacutestica Manicoreacute 2010 Disponiacutevel
emlthttpwwwsidraibgegovbrgt Acesso em 05 de set 2013
IBGE Instituto Brasileiro de Geografia e Estatiacutestica 2011 Disponiacutevel em httpwwwibgegovbr
Acesso em 19 de mar 2013
IBGE Instituto Brasileiro de Geografia e Estatiacutestica Extraccedilatildeo vegetal e silvicultura para o
municiacutepio de Manicoreacute 2011 Disponiacutevel em
lthttpcidadesibgegovbrxtrastemasphplang=ampcodmun=130270ampidtema=102ampsearch=a
mazonas|manicore|extracao-vegetal-e-silvicultura-2011gt Acesso em 10 de out 2013
IBGE Instituto Brasileiro de Geografia e Estatiacutestica Censo Demograacutefico 2010 Disponiacutevel em
lthttpcidadesibgegovbrxtrastemasphpcodmun=130270ampidtema=116gt Acesso em 18
de out 2013
IBGE Instituto Brasileiro de Geografia e Estatiacutestica Censo Demograacutefico 2010 Disponiacutevel
emlthttpcidadesibgegovbrxtrashomephpgt Acesso em 08 de out 2013
IDESAM Reduccedilotildees de Emissotildees do Desmatamento e Degradaccedilatildeo Florestal (REDD+) estudo de
oportunidades para a regiatildeo sul do Amazonas CENAMO M Cl CARRERO G C
GANDOLFO P (Org) Manaus 2011 Disponiacutevel em
lthttpwwwobservatoriodoreddorgbrsitepdfestudodeoportunidadespdfgt Acesso em 13 de
set 2013
MONITORING amp IMPLEMENTATION REPORT VCS Version 3 CCB Standards Third Edition
v30 49
IDESAM Semeando Sustentabilidade em Apuiacute ndash Resultados e Perspectivas 2011 Manaus
Disponivel em lthttpidesamorgbrsemeando-sustentabilidade-em-apui-resultados-e-
perspectivasUxX8nfldWYI
IEA Instituto de Economia Aplicada CO2 Emissions from fuel combustion 2012 Disponiacutevel em
httpwwwieaorgco2highlightsco2highlightspdf Acesso em 09 de out 2013
IGREJA H L S CATIQUE J Anaacutelise neotectocircnica do lineamento de Itacoatiara centro leste do
Estado do Amazonas In Simpoacutesio Nacional de Estudos Tectocircnicos 6 1997 Pirenoacutepolis
Anais Pirenoacutepolis-GO SBG-Nuacutecleo Brasiacutelia1997
IMAZON Instituto do Homem e do Meio Ambiente da Amazocircnia Fatos Florestais 2010a
Disponiacutevel em httpwwwimazonorgbrpublicacoeslivrosfatos-florestais-da-amazonia-
2010-1 Acesso em 14 de out 2013
IMAZOM Instituto do Homem e do Meio Ambiente da Amazocircnia Mercado e preccedilo da madeira
amazocircnica 2010 Disponiacutevel em httpwwwimazonorgbrpublicacoesprecos-de-madeira-
em-toraboletim-de-precos-de-madeira-em-tora-na-amazonia-julho-2010at_downloadfile
Acesso em 23 de nov 2013
IMAZON Instituto do Homem e do Meio Ambiente da Amazocircnia Portal de Geoinformaccedilatildeo sobre
a Amazocircnia Disponiacutevel em lthttpwwwimazongeoorgbrimazongeophpgt Acesso em 06
de set 2013
IMAZON Instituto do Homem e do Meio Ambiente da Amazocircnia Transparecircncia florestal
Amazocircnia Legal 2012 Disponiacutevel em lthttpwwwimazonorgbrpublicacoestransparencia-
florestaltransparencia-florestal-amazonia-legalcopy_of_SADOutubro2012pdfgt Acesso em
23 de set 2013
IMAZON Instituto do Homem e do Meio Ambiente da Amazocircnia PEREIRA D SANTOS D
VEDOVETO M GIMARAtildeES J VERIacuteSSIMO A (Orgs) Fatos Florestais da Amazocircnia
Beleacutem IMAZON 2010 244p Disponiacutevel em
MONITORING amp IMPLEMENTATION REPORT VCS Version 3 CCB Standards Third Edition
v30 50
lthttpwwwimazonorgbrpublicacoeslivrosfatos-florestais-da-amazonia-2010-1gt Acesso
em 24 de set 2013
IMAZON Instituto do Homem e do Meio Ambiente da Amazocircnia A Expansatildeo madeireira na
Amazocircnia Impactos e perspectivas para o desenvolvimento sustentaacutevel no Paraacute BARROS
AC VERIacuteSSIMO A (Eds) Beleacutem IMAZON 2002
IMAZON Instituto do Homem e do Meio Ambiente da Amazocircnia Custos e Benefiacutecios do Manejo
Florestal Para Produccedilatildeo de Madeira na Amazocircnia Oriental 1998 Disponiacutevel em
lthttpwwwimazonorgbrpublicacoesserie-amazoniacustos-e-beneficios-do-manejo-
florestal-para-producao-de-madeira-na-amazonia-orientalgt Acesso em 20 de set 2013
INPE Instituto de Pesquisas Espaciais Banco de dados PRODES 2012 Disponiacutevel em
lthttpwwwdpiinpebrprodesdigitalprodesphpgt Acesso em 09 de set 2013
INPE Instituto de Pesquisas Espaciais Banco de dados DEGRAD 2009 Disponiacutevel em
lthttpwwwobtinpebrdegradgt Acesso em 09 de set 2013
INPE Instituto de Pesquisas Espaciais Banco de dados DETER 2013 Disponiacutevel em
lthttpwwwobtinpebrdetergt Acesso em 10 de set 2013
INPE Instituto de Pesquisas Espaciais Banco de dados de queimadas e focos de calor
BDQUEIMADAS 2013 Disponiacutevel em lthttpwwwdpiinpebrproarcobdqueimadasgt
Acesso em 10 de set 2013
Instituto Carbono Brasil Soacute 2 da produccedilatildeo de madeira eacute certificada O Estado de SPaulo 2006
Disponiacutevel em lthttpwwwinstitutocarbonobrasilorgbrnoticias6noticia=119796gt Acesso
em 26 de set 2013
MONITORING amp IMPLEMENTATION REPORT VCS Version 3 CCB Standards Third Edition
v30 51
IFT Instituto Floresta Tropical Diagnoacutestico do Setor Florestal de Cotriguaccedilu Estado do Mato
Grosso 2010 Disponiacutevel em lthttpgooglEVx2RZgt Acesso em 16 de dez 2013
IPCC Guidelines for National Greenhouse Gas Inventories In National Greenhouse Gas
Inventories Programme EGGLESTON HS BUENDIA L MIWA K NGARA T TANABE
K (Eds) Japan IGES 2006
ITTO Annual review and assessment of the world timber situation 2011 Disponivel em
httpwwwittointannual_review Acesso em 10 de out 2013
KELLER M et al Coarse woody debris in undisturbed and logged forests in the eastern Brazilian
Amazon Global Change Biology vol10 PP784-795 2004
LENTINI M VERISSIMO A PEREIRA D A expansatildeo madeireira na Amazocircnia O Estado da
Amazocircnia n2 2005 Beleacutem IMAZON Disponiacutevel em
httpwwwimazonorgbruploadea_2ppdf Acesso em 06 de set 2013
LOETSCH F ZOumlHRER F HALLER K E Forest Inventory Munich BLV Verlagsgesellschaft
2nd
edition Vol II 1973 469 p
MAGNUSSON WE et al RAPELD uma modificaccedilatildeo do meacutetodo de Gentry para inventaacuterios de
biodiversidade em siacutetios para pesquisa ecoloacutegica de longa duraccedilatildeo Biota Neotrop JulDez
2005 vol 5 no 2 httpwwwbiotaneotropicaorgbrv5n2ptabstractpoint-of-
view+bn01005022005 ISSN 1676-0603
MARINELLI C E et al O programa de monitoramento da biodiversidade da biodiversidade e do
uso de recursos naturais em unidades de conservaccedilatildeo estaduais do Amazonas Secretaria
de Estado do Meio Ambiente e Desenvolvimento Sustentaacutevel - SDS Manaus SDS 2007
MONITORING amp IMPLEMENTATION REPORT VCS Version 3 CCB Standards Third Edition
v30 52
MARINELLI C E MALTEZ M H Indicadores de Sustentabilidade para Unidades de
Conservaccedilatildeo Documento-Siacutentese Workshop Instituto Socioambiental Brasiacutelia-DF 2010
76p
MAZZEI L et al Above-ground biomass dynamics after reduced-impact logging in the Eastern
Amazon Forest Ecology and Management vol 259 pp367-373 2010
MEIRELLES FILHO O Livro de Ouro da Amazocircnia 5ordf Ediccedilatildeo Rio de Janeiro EDIOURO 2007
422p Meirelles Filho J O Livro de Ouro da Amazocircnia 1ordf ed Editora Ediouro ISBN
8500021616 2007 450p
MENGER Juliana da Silva Fatores determinantes da distribuiccedilatildeo de aves no interfluacutevio Purus-
Madeira Manaus [sn] 2011 35 fl il
MCT Arquivos dos Fatores de Emissatildeo Disponiacutevel em
httpwwwmctgovbrindexphpcontentview321144htmlancora Acesso em 23 de out
2013
MMA Ministeacuterio do Meio Ambiente Avaliaccedilatildeo e identificaccedilatildeo de accedilotildees prioritaacuterias para a
conservaccedilatildeo utilizaccedilatildeo sustentaacutevel e reparticcedilatildeo dos benefiacutecios da biodiversidade na
Amazocircnia brasileira Brasiacutelia MMASBF 2001
MMA Ministeacuterio do Meio Ambiente Secretaria de Biodiversidade e Florestas Aacutereas Prioritaacuterias
para Conservaccedilatildeo Uso Sustentaacutevel e Reparticcedilatildeo de Benefiacutecios da Biodiversidade Brasileira
Atualizaccedilatildeo - Portaria MMA ndeg9 de 23 de janeiro de 2007 Brasiacutelia MMA 2007 (Seacuterie
Biodiversidade 31)
MONITORING amp IMPLEMENTATION REPORT VCS Version 3 CCB Standards Third Edition
v30 53
MMA Livro vermelho da fauna brasileira ameaccedilada de extinccedilatildeo editores Angelo Barbosa
Monteiro Machado Glaacuteucia Moreira Drummond Adriano Pereira Paglia 1ed 2008 Brasiacutelia
DF MMA Belo Horizonte MG Fundaccedilatildeo Biodiversitas (1420 p) il - (Biodiversidade 19)
OLIVEIRA M M HIGUCHI N CELES C H HIGUCHI F G 2014 Tamanho e formas de
parcelas para inventaacuterios florestais de espeacutecies arboacutereas na Amazocircnia Central Ciecircncia
Florestal Santa Maria v 24 n 3 p 645-653
PEARSON TRH WALKER S BROWN SL The Source Book for Land Use Land Use
Change and Forestry Projects BioCarbon Fund and Winrock International 2005 64 pp
PORTAL AMAZOcircNIA Amazocircnia de A a Z Disponiacutevel em
lthttpportalamazoniaglobocomgt Acesso em 13 de set 2013
PEacuteLLICO NETTO S BRENA D A Inventaacuterio florestal Curitiba Editorado pelos autores p
316 1997
PROJETO SIVAM Relatoacuterio metodoloacutegico de trabalho Revisatildeo 3 Diretoria de Geociecircncia Rio de
Janeiro 2002 330 pp
PROJETO SIVAM Atualizaccedilatildeo do RADAMBRASIL Mapa de Vegetacao da Amazonia Legal
Mapa de Fitofisionomias ndash RADAMSIPAM DNPM Ministeacuterio de Minas e Energia 2002
Disponiacutevel em httpwwwdpiinpebramb_dataShapefilesveg_Amz_SIPAMzip Acesso
em 21 de jan 2014
PROJETO FLORESTAL SANTA MARIA (PROJETO FSM-REDD) Plant Inteligecircncia Ambiental ndash
Warwick Manfrinato 2012 Disponiacutevel em
lthttpwwwflorestalsantamariacombrsitedocumentos57FSM_REDD_VCS_PD_ptpdfgt
Acesso em 09 de set 2013
MONITORING amp IMPLEMENTATION REPORT VCS Version 3 CCB Standards Third Edition
v30 54
RADAMBRASIL Programa de Integraccedilatildeo Nacional Levantamentos de Recursos Naturais v 14 ndash
RADAM DNPM Ministeacuterio de Minas e Energia Brasil 1974
RIBEIRO J E L et al Flora da Reserva Ducke guia de identificaccedilatildeo das plantas vasculares de
uma floresta de terra firme na Amazocircnia Central Manaus Editora INPA 1999
ROSAS F C W WALDEMARIN H de MATTOS G E Pteronura rasiliensis (Zimmermann
1780) In MACHADO A B M DRUMMOND G M PAGLIA A P (eds) Livro Vermelho da
Fauna Brasileira Ameaccedilada de Extinccedilatildeo Volume II 1ed Brasiacutelia DF Ministeacuterio do Meio
Ambiente 2008 p 800 - 801
ROSS D GHG Emissions Resulting from Aircraft Travel 2009 Disponiacutevel em
httpwwwcarbonplanetcomdownloadsFlight_Calculator_Information_v92pdf Acesso em
14 de out 2013
SANTOS A J et al Viabilidade econocircmica do sistema agroflorestal greviacutelea x cafeacute na regiatildeo
norte do Paranaacute CERNE vol6 n1 pp89-100 2000
SANTOS R A Custo do manejo florestal madeireiro estudo de caso Floresta Estadual do
Antimary Monografia (Bacharelado em Economia) ndash Departamento de Ciecircncias
Econocircmicas Universidade Federal do Acre 2007109p
SABOGAL C et al Manejo Florestal Empresarial na Amazocircnia Brasileira restriccedilotildees e
oportunidades (Relatoacuterio Siacutentese) Beleacutem CIFORIMAZON 2006 72p
SDSCEUC Secretaria Estadual de Meio Ambiente e Desenvolvimento Sustentaacutevel ndash Centro
Estadual de Unidades de Conservaccedilatildeo Programa de Monitoramento de Biodiversidade e
Uso de Recursos Naturais em Aacutereas Protegidas do Estado Amazonas (ProBUC) 2006
Disponiacutevel em
MONITORING amp IMPLEMENTATION REPORT VCS Version 3 CCB Standards Third Edition
v30 55
httpbrazilwcsorgDesktopModulesBring2mindDMXDownloadaspxEntryId=6168ampPortalI
d=93ampDownloadMethod=attachment Acesso em 11 de ago de 2013
SFBIMAZON Serviccedilo Florestal Brasileiro e Instituto do Homem e Meio Ambiente da Amazocircnia A
atividade madeireira na Amazocircnia brasileira produccedilatildeo receita e mercados 2010 Disponiacutevel
em httpwwwmmagovbrestruturassfb_arquivosmiolo_resexec_polo_03_95_1pdf
Acesso em 23 de out 2013
SILVA R P da Alometria estoque e dinacircmica da biomassa de florestas primaacuterias e
secundaacuterias na regiatildeo de Manaus (AM) 152 p Tese de Doutorado Programa Integrado
de Poacutes-graduaccedilatildeo em Biologia Tropical e Recursos Naturais (INPA) Manaus 2007
SILVA Z A G P G SANTOS R A Custo do manejo florestal madeireiro em floresta puacuteblica
estudo de caso no Acre 2011 Disponiacutevel em
lthttpwwwbasacombrbancoamazonia2Revistaedicao_13n13_custo_do_manejo_flores
pdfgt Acesso em 13 de set 2013
SMIDT M GALLAGHER T Factors Affecting Fuel Consumption and Harvesting Costs Auburn
School of Forestry and Wildlife Sciences Sd Disponiacutevel em
httpweb1cnrevteduforestrycofedocuments2013Smidt_Gallagherpdf Acesso em 21
de out 2013
SOARES-FILHO B et al Role of Brazilian Amazon protected areas in climate change mitigation
2010 Columbia University NY Ruth S DeFries 2010
SPF Serviccedilo Puacuteblico Federal DVPF Documento de venda de produto Florestal (Declaraccedilotildees de
venda Gethalpdf) 14 de julho de 2006
MONITORING amp IMPLEMENTATION REPORT VCS Version 3 CCB Standards Third Edition
v30 56
TIMOFEICZYK JUacuteNIOR R et al Rentabilidade econocircmica do manejo de baixo impacto em
florestas tropicais um estudo de caso Revista Floresta Curitiba v 38 n 4 p 711-725
outdez 2008
VCS Ferramenta para Demonstraccedilatildeo e Avaliaccedilatildeo de Adicionalidade para Atividades de Projetos
VCS em Agricultura Floresta e Outros Usos (AFOLU) 2012a Disponiacutevel em httpwwwv-c-
sorgsitesv-c-sorgfilesVT000120VCS20AFOLU20Additionality20Tool20v30pdf
Acesso em 24 de set 2013
VCS Ferramenta de Risco e Natildeo Permanecircncia (AFOLU) 2012B Disponiacutevel em httpv-c-
sorgsitesv-c-sorgfilesAFOLU20Non-Permanence20Risk20Tool2C20v32pdf
Acesso em 13 de set 2013
VCS Approved VCS Methodology VM0010 Version 10 - Methodology for Improved Forest
Management Conversion to Logged to Protected Forest Calculating GHG Benefits from
Preventing Planned Degradation PHUA S SHARMA S TELFER M CHANDLER H
(Eds) Califoacuternia EUA Carbon Planet Limited 2011149p
VERDEJO M E Diagnoacutestico Rural Participativo um guia praacutetico Brasiacutelia MDA 2006 62p
VIANNA A L M Diagnoacutestico Florestal do Estado do Amazonas 2010 e 2011 Manaus-AM
IDESAM 2013 (Relatoacuterio Final do Projeto Fortalecimento da participaccedilatildeo da sociedade civil
no Amazonas Foacuterum de Mudanccedilas Climaacuteticas Transparecircncia Florestal no Estado do
Amazonas ndash Mapeamento de Instrumentos Legislativos no Brasil)
WBCSDWRI The GHG Protocol for Project Accountin Washington World Business Council for
Sustainable DevelopmentWorld Resources Institute 2005148 p
MONITORING amp IMPLEMENTATION REPORT VCS Version 3 CCB Standards Third Edition
v30 57
WALKER W et al Guia de Campo para Estimativa de Biomassa Florestal e Estoque de Carbono
Woods Hole Center Research Falmouth Massachusetts USA 2011 Disponiacutevel em
httpwwwwhrcorgresourcesfieldguidescarbonpdfWHRC_FieldGuide_PortugueseSMpdf
Acesso em 14 de set 2013
WWF Metodologia para Avaliaccedilatildeo Raacutepida e a Priorizaccedilatildeo do Manejo de Unidades de
Conservaccedilatildeo (RAPPAM) 2010 Disponiacutevel em httpgooglXfDnxs Acesso em 30 de set
2013
WWF-Brasil Efetividade de Gestatildeo das Unidades de Conservaccedilatildeo no Estado do Amazonas
Secretaria de Estado do Meio Ambiente e do Desenvolvimento Sustentaacutevel do Amazonas
Instituto Chico Mendes de Conservaccedilatildeo da Biodiversidade Brasiacutelia WWF-Brasil 2011 72 p

MONITORING amp IMPLEMENTATION REPORT VCS Version 3 CCB Standards Third Edition
v30 8
do Meio Ambiente e dos Recursos Naturais Renovaacuteveis)
ICU Intensive Care Unit
IDAM Institute of Agricultural and Forestry Development of the State of Amazonas (Instituto de
Desenvolvimento Agropecuaacuterio e Florestal do Estado do Amazonas)
IEA International Energy Agency
IEB International Institute of Education of Brazil (Instituto Internacional de Educaccedilatildeo do
Brasil)
IFM-LtPF Improved Forest Management - Logged to Protected Forest
IMAZON Institute of Man and Environment in the Amazon (Instituto do Homem e Meio Ambiente
da Amazocircnia
INPE National Institute for Space Research (Instituto Nacional de Pesquisas Espaciais)
IPAAM Amazon Institute of Environmental Protection (Instituto de Proteccedilatildeo Ambiental do
Amazonas)
IPCC Intergovernmental Panel on Climate Change
LR Legal Reserve (Reserva Legal)
MCT Ministry of Science and Technology (Ministeacuterio da Ciecircncia e Tecnologia)
MMA Ministry of Environment (Ministeacuterio do Meio Ambiente)
MP Monitoring Plan
NTFP Non-Timber Forest Product
PD Project Description
PES Payment for Environmental Services
POA Annual Operational Extraction Plan (Plano Operacional Anual de Extraccedilatildeo)
PPE Personal Protective Equipment
PROARCO Program for the Prevention and Control of Forest Fires in the Arc of Deforestation
(Programa de Prevenccedilatildeo e Controle agraves Queimadas e Incecircndios no Arco do Desflorestamento)
PROBUC Program for Monitoring Biodiversity and Use of Natural Resources in Conserveation Units
(Programa de Monitoramento da Biodiversidade e Uso do Recursos Naturais em UCs)
PRODES Program to Calculate Deforestation in the Amazon (Programa de Caacutelculo do
Desflorestamento da Amazocircnia)
RDS Sustainable Development Reserves (Reservas de Desenvolvimento Sustentaacutevel)
RPDS Private Reserves for Sustainable Development (Reserva Particular de Desenvolvimento
Sustentaacutevel)
RPPN Private Reserve of Natural Heritage (Reserva Particular do Patrimocircnio Natural)
SAD Deforestation Allert System (Sistema de Alerta de Desmatamento)
SDS Secretary of the State for the Environment and Sustainable Development of Amazonas
(Secretaria de Estado do Meio Ambiente e Desenvolvimento Sustentaacutevel do Amazonas)
SEUC State System of Conservation Units (Sistema Estadual de Unidades de Conservaccedilatildeo)
MONITORING amp IMPLEMENTATION REPORT VCS Version 3 CCB Standards Third Edition
v30 9
SFM Sustainable Forest Management
SFMP Sustainable Forest Management Plan
UC Conservation Units (Unidade de Conservaccedilatildeo)
UEA State University of Amazonas (Universidade Estadual do Amazonas)
UFAM Federal University of Amazonas (Universidade Federal do Amazonas)
UNFCCC United Nations Framework Convention on Climate Change
UPA Annual Production Unit (Unidade Produtiva Anual)
VCU Verified Carbon Unit
WBCSD World Business Council for Sustainable Development
WRI World Resources Institute
MONITORING amp IMPLEMENTATION REPORT VCS Version 3 CCB Standards Third Edition
v30 10
1 GENERAL
11 Summary Description of the Project
The Amazon Rio project consists of the conservation of a mosaic of four private areas called
Amazon Rio I II III and IV which add up to 20387 hectares (ha) of primary forest located in the
municipality of Manicoreacute in the state of Amazonas The projects target area is characterized by
being a region of sedimentary Solimotildees Basin dominated by Alluvial Holocene Iccedilaacute Training and
Detritus-lateritic formation The relief is of the flat type with primary vegetation formation consisting
of areas of land floodplain and some formations igapoacute due to the influence of Rio Manicoreacute
The Amazon Rio areas dominated forests of humid tropical rainforest Lowlands emerging Canopy
and Forest Open Rain Lowlands with palm trees (79) the Atlantic rain forest Alluvial emerging
canopy (11) Rain Forest Open Alluvial with palm trees (8) Pioneer formations influenced
fluvial and or lacustrine - herbaceous and shrubby with palm trees (1)
The main focus of the project is (i) the conservation of forest ecosystems and biodiversity (ii) the
sustainable social development of the region including the promotion of ecotourism and scientific
research and (iii) the reduction in carbon dioxide (CO2) emissions through the prevention of
deforestation and forest degradation
In 1998 a logging plan for logging activities was approved by the authorized environmental
agencies on 19800 ha of land over a period of 25 years (the total area does not include
Permanent Preservation Areas (APP) and water bodies Between 1999 and 2010 434769 ha
were degraded due to an authorized logging operation (Annexes 1 2 3 and 4) In February 2011
the area was acquired by the Empresa Brasileira de Conservaccedilatildeo de Florestas (EBCF) which in
order to implement the objectives of the project made two important decisions to suspend the
logging operations underway in the project areas since 1999 and transform them into Private
Reserves for Sustainable Development (Reservas Particulares de Desenvolvimento Sustentaacutevel -
RPDSs) supported by State Law no 53 of June 2007 and Decree no 30108 of June 2010
With this new land use strategy 20387 ha of primary forest will be preserved avoiding the CO2
emissions that would have occurred without the implementation of the project Revenues obtained
from the carbon credits will be used to maintain the primary forest with the implementation of the
activities described in the Reserversquos Management Plan (Annex 9) including social programs and
environmental monitoring
The project intends to maintain financial sustainability through the sale of carbon credits obtained
from the conservation of the area and maintenance of environmental services Another source of
MONITORING amp IMPLEMENTATION REPORT VCS Version 3 CCB Standards Third Edition
v30 11
income planned by the project relates to the national market for legal reserve compensation
(Environmental Reserve Quota (Cotas de Reserva Ambiental (CRA) in Portuguese)1 Using these
two financial mechanisms for conservation the emission of approximately 2 million tons of carbon
dioxide into the atmosphere over a period of 37 years will be avoided
It is important to emphasize that the project area is crucial for conservation especially considering
its characteristics such as (i) high biological diversity and concentration of endemic and
pharmacological species (Section 7) (ii) extensive areas of plains which are important for the
reproduction and survival of many species of plants and animals especially birds and reptiles and
(iii) high potential for ecotourism and environmental education including scientific research
The creation of these private reserves also contributes to the consolidation of a strategy to
establish ecological corridors and mosaics in the region creating a territorial connection between
public and private conservation areas This situation reduces potential conflicts between the state
landowners and residents in the buffer areas and creates opportunities for implementing integrated
actions optimizing human and financial resources for environmental monitoring and control
actions
Another important fact to consider is the surrounding communities who use the project areas for
their own subsistence extracting non-timber forest products (eg nuts fruits oils vines) fishing
and hunting For that reason they have direct interest in the conservation of the forest to obtain
food economic security and maintain their cultural practices
The environmental benefits that the communities receive make them guardians of the forest
contributing significantly to the monitoring and controlling of illegal activities practiced in the region
such as logging fishing and poaching as well as supervision and control of forest fires In this
context the Amazon Rio project plays a role of great environmental importance for the region also
contributing to the improvement of livelihoods of the local population and consequently to the
conservation of the forest
A population of 350 families distributed among 15 communities is estimated to reside around the
area of the Amazon Rio project The environmental benefits provided by the implementation of the
project and Amazon Rio I RPDS Management Plan and posteriorly including Amazon Rio II III
and IV demonstrate a strong social development component and includes several socio-economic
support programs to local communities which promote sustainable development in the region
2 sect 2 Art 15 of the new Brazilian Forest Code (Law 126512012) provides for voluntary forest reserves ie the
excess of forest required by law on rural property According to this law all preserved area that exceeds the minimum required by law may be used for creation of environmental easement or Environmental Reserve Quotas in the same biome and State
MONITORING amp IMPLEMENTATION REPORT VCS Version 3 CCB Standards Third Edition
v30 12
The project will be implemented starting from the introduction of participatory processes ensuring
active involvement of the local communities around the area as in the aforementioned
development programs and in decision-making The community programs that aim to improve
access to health education and income generation will use the ldquoBolsa Florestardquo program as
reference a program of great relevance for payments for environmental services (PES) in the state
of Amazonas In the medium and long terms these programs intend to significantly improve the
living conditions of these communities strengthening their organizational and institutional capacity
including their productive environmental and financial sustainability
12 Project Objectives
General objective
The objectives of this project takes a holistic approach to the region and keep full affinity to the
recent statement of the United Nations in the design of the seventeen goals of Sustainable
Development2 (ODS) In this sense the project objectives have a direct relationship with some of
the ODS and take others as a source of inspiration for the implementation of activities in
partnership with local communities These guidelines will be key elements in the local discussion
process around the project activities
Thus it is assumed as a general objective of the project contribute to the maintenance of global
climate (goal 13) through the implementation of activities to prevent the emission of greenhouse
gases locally by replacing the forest selective logging for a project conservation of forest
biodiversity (goal 15) preserving the traditional culture of the population of surrounding
communities (goal 3) promoting income generation (goal 1 8) and contributing to local social
development (goals 2 5 4 6 7)
Specific objectives
Specifically the project aims to
2 The seventeen Sustainable Development Goals at the United Nations are (1) Ending poverty in all its
form everywhere (2) Ending eat hunger achieve food security improve nutrition (3) To ensure a healthy life and promote well-being for all (4) To ensure inclusive education equitable and quality (5) Achieving gender equality and empower all women (6) Ensure availability and sustainable water management (7) Ensure access energy reliable and sustainable (8) To promote sustained inclusive and sustainable economic growth (9) Building resilient infrastructure promote inclusive industrialization (10) To reduce inequality between and within countries (11) Making cities inclusive human settlements secure resilient (12) To ensure standards of sustainable consumption and production (13) Take urgent action to combat climate change (14) To preserve and promote the sustainable use of the oceans (15) To protect restore and promote the sustainable use of forests (16) To promote peaceful and inclusive societies for sustainable development (17) To strengthen the implementation mechanisms and revitalize the global partnership
MONITORING amp IMPLEMENTATION REPORT VCS Version 3 CCB Standards Third Edition
v30 13
1 Implement economic alternative activities to selective logging to generate revenue for the
project benefiting at least 300 families surrounding the target area
2 Reduce approximately 32 million tons of carbon dioxide as a result of project activities
3 To contribute to the maintenance of regional biodiversity through the preservation and
conservation of the forest
4 Contribute to improve educational processes and attention to regional health
5 Promote the inclusion and womens empowerment in the project area communities
13 Project location
Location
The Amazon Rio Project is located in the southern region of the state of Amazonas in the
municipality of Manicore (Figure 01) The waterway and air constitute arrival means to the city with
approximate distance of 333 km by air and 427 km by river is the starting point for the city of
Manaus the state capital The Project areas are near the Madeira River and between the
Sustainable Development Reserves (RDS) Rio Madeira and Rio Amapaacute (Figure 02)
Figure 01 - Location of the Municipality of Manicoreacute - AM
MONITORING amp IMPLEMENTATION REPORT VCS Version 3 CCB Standards Third Edition
v30 14
Figure 02 - Location areas I II III and IV of the Amazon Rio Project
Figure 03 - Project Zone and communities of the project
MONITORING amp IMPLEMENTATION REPORT VCS Version 3 CCB Standards Third Edition
v30 15
Specifically in the Amazon Rio area the dense Primary Tropical Ombrophylous Lowland Forest and
open Primary Tropical Ombrophylous Lowland Forest with palm trees (79) Dense Primary
Tropical Ombrophylous Alluvial Forest (11) Open Primary Tropical Ambrophylous Alluvial Forest
with palm trees (8) Pioneer Formations with fluvial andor lacustrine influence - herbaceous and
shrubby vegetation with palm trees (1) (Annex 5)
According to IBGEs soil database (2000) the Manicoreacute region is formed mainly of Latosols and
Argisols Also soils such as Gleysols Spodosols Alluvial soils Neosols Planosols Plinthosols and
Nitosols can be found The Brazilian Soil Classification System produced from surveys by the
Brazilian Agricultural Research company (EMBRAPA) between 2001 and 2006 corroborates the
classification information for that region
Alluvial soils are very common in this region These soils are found mainly on the banks of the
Madeira River The fertility levels are dystrophic and located on flat terrain Agricultural and
livestock activities are almost always practiced along the main alluvial stretches of the region The
most fertile soils that occur on the floodplains (vaacuterzea) are widely cultivated for temporary crops
such as beans rice watermelon and cassava
Climate and hydrography
The climate in the region of the Madeira River is humid equatorial (IBGE 2011) with an average
temperature of 27degC relative humidity ranging between 85 and 90 and annual rainfall between
2200 to 2800 mmyear (RADAMBRASIL 1974) Studies from the Amapaacute Rio RDS area indicate
that between the months of January and March rainfall intensity is greater with monthly rainfall
between 300 and 350 mm while the driest months are July and August with monthly averages
around 50 mm
Geographically the Amazon region is defined by watersheds formed by the rivers which flow into
the Amazon Rio and its mouth along the entire East coast of Brazil (RIBEIRO et al 1999) The
city of Manicoreacute is influenced mainly by the Madeira and Manicoreacute rivers which are respectively
white and black water rivers and contribute to the local climatic conditions combined with the
characteristics of the vegetation that includes forests meadows savanna (cerrado) and floodplains
(vaacuterzeas)
Economic context of land use
Southern Amazonas is an important region strategically to prevent advances in deforestation in the
Amazon However in recent years the region has been suffering successive deforestation events
from expanded farming activities contributing to the so-called arc of deforestation toward the
MONITORING amp IMPLEMENTATION REPORT VCS Version 3 CCB Standards Third Edition
v30 16
state of Amazonas Historically the arc of deforestation has advanced with the expansion of
agriculture in the states of Paraacute Mato Grosso Rondocircnia Tocantins and Maranhatildeo In recent
years pressures on forests have increased with the globalization of markets for meat and
soybeans in the Amazon and international development policies for the region (IDESAM 2011)
14 Project Proponent (G4)
Organization Name Empresa Brasileira de Conservaccedilatildeo de Florestas SA (EBCF)
Contact Person Leonardo Barrionuevo
Title President
Address Curitiba-PR Al Dr Carlos de Carvalho 555 Conj 231
Centro Curitiba ndash PR CEP 80430-180 Brazil
Escritoacuterio Manaus Av Djalma Batista 1661 Conj 1409 A Bloco B
Ed Business Tower Millenium Cep 69050-010 Manaus-AM Brazil
Telephone +55 41 3158 9800 | +55 41 9943 8005
Email leonardoebcfcombr
15 Other Entities Involved in the Project (G4)
Organization Name Original Trade Consulting
Role in the Project Update of the Amazon Rio REDD+ IFM Project Description (PD) (V20)
and coordination of certifcation process
Contact Person Joatildeo Batista Tezza Neto
Title Director
Address Avenida Andreacute Arauacutejo 2936 ndash Edifiacutecio Incubadora do INPA sala 10
Cep 69060-000 Manaus-AM Brazil
Telephone +55 92 981590997
Email tezzanetooriginaltradenet
MONITORING amp IMPLEMENTATION REPORT VCS Version 3 CCB Standards Third Edition
v30 17
Organization Name HDOM
Role in the Project Degradation and deforestation report Forest inventory for biomass
calculation purposes in the project area and support the PD review
Contact Person Francisco Higushi
Title Director
Address Av Maacuterio Ypiranga 315 Ed The Office sala 609 Adrianoacutepolis CEP
69057-002
Telephone + 55 92 98128 2561
Email fghiguchihdomcombr
11 Project Start Date
The project began on August 17 2012 when the board and EBCF shareholders formally approved
the companys Business Plan (Annex 27) which set out the objectives of conserving forests
through the REDD + provision of services and sustainable use of forest resources excluded
logging activities
12 Project Crediting Period
The first crediting period of the project is 37 years beginning on August 17 2012 and ending on 17
August 2049 This period is equivalent to the remaining 12 years of the first authorized
management plan (25 years from 1998) added to another 25 years in respect of a new forest
management plan that was intended as the common practice of forestry in Brazil The logging
activities could continue beyond 37 years aiming for a second crediting period
2 DESIGN
21 Sectoral Scope and Project Type
Project Scope Agriculture Forest and other Land Use (AFOLU)
Project Category Reduction Emission from Deforestation and Degradation from Planned
Deforestation (REDD-IFM)
MONITORING amp IMPLEMENTATION REPORT VCS Version 3 CCB Standards Third Edition
v30 18
Type of Activity Improved Forest Management - Logged to Protected Forest (IFM LfPF)
22 Project Financing
The carbon project integrates a broad vision of territorial management as part of the Management
Plan of the Amazon Rio Private Reservation I Accordingly it stipulates that all actions necessary
to implement this Plan should be enabled from resources obtained by payments for environmental
services such as carbon credits and CRAs
The idea is for the plan to serve as a management tool to provide technical and political support
support to negotiations with support institutions to receive investments that can make projects and
programs viable The expected revenues in the short and medium term to implement the
Management Plan will mostly come from payments for environmental services such as negotiated
carbon credits and CRAs in addition to projects that generate long-term income exclusively for the
communities such as ecotourism scientific research and harvest of non-timber forest products
In this context the main difference between a permanent protection private reserve (eg RPPN)
and a private sustainable development reserve (eg RPDS) is that the long-term financial viability
of sustainable reserves usage comes from the marketing of non-timber forest products with high
added value and other sustainable businesses in compensation for environmental services This
flow of resources is expected to occur during and after the implementation period The proposal is
that with external support and through their political representatives local communities will be able
to establish partnerships and contracts with companies cooperatives and industries interested in
supporting social and environmental initiatives in the project areas
These items are briefly listed below with their respective values regarding the implementation and
execution of the project part of which will be initially financed by the contribution of the partners as
mentioned above
Table 01 - Project implementation and opperational costs3
Component Value (R$) Share ()
Pre-Operating expenses R$ 1561904 361
Administrative expenses R$ 24069915 5568
Costs of VCS + CCB certification R$ 456670 106
3 Annex 16
MONITORING amp IMPLEMENTATION REPORT VCS Version 3 CCB Standards Third Edition
v30 19
Monitoring R$ 2820000 652
Social program related expenses R$ 6050000 1399
Carbon trading R$ 1188536 275
Taxes on income R$ 1680219 389
Taxes on profit R$ 5008435 1159
Interest 10 return on investment of shareholders R$ 396300 092
TOTAL R$ 43231980 10000
23 Employment Opportunities and Worker Safety
Despite the considerable local knowledge of the regionrsquos ecosystems and environments
technology is lacking related to the value added to products and environmental conservation
projects Besides these difficulties public service agents frequently indicate the use of techniques
and management practices that require high external inputs and major investments To overcome
these limitations the project intends to promote specific and culturally relevant trainings that include
workshops meetings courses and extended technical assistance to improve the knowledge and
skills of community leaders residents and employees of the project To complement such
trainings we intend to install diversified agroforestry systems to restore and reuse degraded
areas to encourage handicrafts and tourism and to improving the management of non-timber
forest products with emphasis on Brazil nuts andiroba copaiba and Acai As a result
management practices are expected to improve in the long-term as well as and the fostering of
local culture combining technical and scientific knowledge with traditional knowledge
24 Stakeholders (G3)
Consultation prior to the beginning of the project
The populations involved in the carbon project are direct users of forest resources that are present
in the Amazon Rio I II III amp IV areas for the practice of plant and animal extraction Initially they
were indicated by the Council of Agro-Extrativist Associations of Democracia (Conselho das
Associaccedilotildees Agroextrativistas de Democracia - CAAD) which gathers associations of residents
from ten communities located near the Amazon Rio I Reserve Following this indication the EBCF
hired the services of the consulting company CO2X Conservaccedilatildeo de Florestas Ltda to perform a
MONITORING amp IMPLEMENTATION REPORT VCS Version 3 CCB Standards Third Edition
v30 20
series of workshops and meetings to prepare the Amazon Rio I Management Plan (Annex 9) and
to develope the Amazon Rio REDD+ IFM project In these meetings different forms and spaces of
participation of the people and government and non-governmental institutions were discussed to
support the development and implementation of the Management Plan culminating in the creation
of an Advisory Council In these events conservation and fundraising strategies were presented to
the community among them the marketing of avoided emissions resulting from the suspension of
timber management activities The conduct of the Free Prior and Informed Consent (FPIC)
process was done in the communities surrounding the Amazon Rio I II III and IV areas during
three workshops in 2013 which had a very inclusive and participatory nature This document as
well as the minutes of the workshops participatory mapping Sustainability Matrix questionnaires
and presentations in PPT slides are available in Annex 104
Identification of stakeholders
There are 15 communities that will benefiot from the activities of the project and twelve of them
(Urucury Aacutegua Azul Vista Alegre Boa Esperanccedila Santa Eva Santa Maria Pandegal
Democracia Jatuarana Terra Preta do Ramal Kamayuaacute and Satildeo Joseacute do Miriti) are located in the
region surrounding Amazon Rio areas I and III and in the Rio Amapaacute Reserve on the Madeira
River and its tributaries One of the communities is formed by residents that integrate the
Agroextractivist Association Satildeo Joatildeo e Ponta Grossa which is located in the surroundings of the
Amazon Rio IV area Two communities Terra Preta do Rio Manicoreacute and Mocambo are located in
the region surrounding the Amazon Rio II on the bank of the Manicoreacute River(Figure 03)
Figure 04 - Location of the communities surrounding the Amazon Rio areas I II III and IV
4 This topic is thoroughly discussed in Section 37 of this document
MONITORING amp IMPLEMENTATION REPORT VCS Version 3 CCB Standards Third Edition
v30 21
Except for Terra Preta do Rio Manicoreacute Mocambo and Satildeo Joseacute do Miriti all of the communities
utilize the Rio Amapaacute RDS area either on a sporadic or seasonal basis to meet their food needs
(collecting various fruits fishing and hunting) for household and medicinal use (bark leaves and
plant parts considered by medical practices and traditional knowledge) and primarily for the sale of
various non-timber products especially the harvesting of Brazil nut accedilaiacute and copaiacuteba oil However
the trails roads and paths that provide access to the Amapaacute Rio RDS and Amazon Rio areas are
in a poor state of repair which hinders extraction practices especially the production of Brazil nuts
In addition to the 15 communities surrounding the Amazon Rio areas government organizations
directly involved with environmental issues in the region such as SDS the National Indian
Foundation (Fundaccedilatildeo Nacional do Iacutendio - FUNAI) City Hall and the City Council of Manicoreacute the
Secretary of Environment and Sustainable Development of Manicoreacute ICMBio and non-
governmental organizations such as FAS IEB CAAD CNS UFAM UEA were identified and
contacted to participate in the entire process of preparation of the Management Plan
Stakeholder meetings
To present and discuss the project in detail with representatives of 15 communities surrounding
the project area and support institutions three workshops in different locations were conducted
The subjects were presented in straightforward language in a culturally appropriate way so that
community representatives could understand relatively complex and unusual concepts such as
climate change greenhouse effect and payments for environmental services
The importance of forests for the mitigation and adaptation to climate change was emphasized to
convey the main objectives of the project to community representatives and in particular their role
in (i) absorbing carbon dioxide and release oxygen (ii) helping control climate processes on a
regional scale (iii) regulating the flow of rivers and erosion control and (iv) providing shelter and
food for most animals and plants on the planet The fact that 20 of global greenhouse gas
emissions come from the destruction of forests and in Brazil 70 of emissions come from
deforestation was also mentioned
During the workshops participants learned that steps can be taken to reduce the emissions of
greenhouse gases by investing in renewable energy sources such as solar energy wind energy
hydroelectric power plants electric cars and other more efficient ones Another option that
mitigates climate change was also highlighted that relates to the Amazon forest conservation and
the restoration of degraded areas through reforestation management of agricultural land and
establishment of agroforestry systems
MONITORING amp IMPLEMENTATION REPORT VCS Version 3 CCB Standards Third Edition
v30 22
After concepts were discussed it was explained to those present that the proposed project to be
carried out in the RPDS Amazon Rio I recently approved at the time and in the creation process
in the other Reserves has essentially one goal to financially reward those who preserve and
protect a forest threatened with deforestation and degradation the project aims (i) raise funds for
the implementation of the Management Plan programs and (ii) conserve forests and the associated
biodiversity It was also mentioned that the project is part of a new vision of the business strategy
since a logging plan was operational until 2010 associated with the emissions of greenhouse
gases In 2010 the practice was suspended by the owner who began investing in the creation of a
project focused on conservation and payment for environmental services with emphasis on the
voluntary carbon market
Implementation schedule
Table 2 - Implementation schedule and next activities
Ano Atividade
2010
EBCF performs the symbolic protocol creation of the first RPDs during the
seminar results and perspective of the State of Amazonas Conservation
Units held by the SDS
2011 EBCF submits the formal protocol to CEUC
2011 Meeting presentation EBCF for communities near the Amazon River I II III
and IV
2011
EBCF attended the informal invitation made by the management of RDS
Rio Amapaacute and representative CEUC - Silvia Elena the training workshop
and delivery portfolios ENVIRONMENTAL VOLUNTEERS AGENTS held in
the Boa Esperanccedila community
2011
EBCF participated in the event organized by the CAAD which had the
agenda General Assembly accountability of CAAD year 20092010 RDS
Management Plan Amapaacute Rio Bolsa Floresta Municipal Management
IDAM contribution contribution Covema IEBs contribution and delivery of
equipment for processing of acai held on 24032011 in the community of
MONITORING amp IMPLEMENTATION REPORT VCS Version 3 CCB Standards Third Edition
v30 23
Democracy and 25032011 in the Boa esperanccedila Community
2011 Inspection of CEUC on farms for approval on RPDs
2011 The board of EBCF makes his 1st visit the communities and farms
2011
EBCF in partnership with the Municipal Government of Manipur perform
the recovery local road (approximately 20KM) linking Democracia
community Jatuarana communities Terra Preta Community Santa Eva
and Vista Alegre
2012
Visit of the president and directors of EBCF the communities surrounding
the reserves together with the president of PATAC Marcelo Marder and
Andre Albuquerque president for socioeconomic communities report
presentation
2012 Business Plan Project approval and EBCF shareholders agreement
authorizing the start of the REDD project
2013 Workshop I - Diagnosis for the development of areas of the Amazon River
Management Plan I II III amp IV
2013 Visit communities to complement the workshop I for interviews with the
locals
2013 Meeting in CEUC after the second workshop to update the work with the
communities and the progress of the approval of the areas
2013
Technical meeting with the team CO2X Renascer and Human
Development EBCF in Curitiba for the review and evaluation of the first part
of the Management Plan (diagnosis) Definition of programs and
subprograms of the Plan identification of key issues potential threats and
opportunities with the creation of RPDSs definition of vision and action
strategy
MONITORING amp IMPLEMENTATION REPORT VCS Version 3 CCB Standards Third Edition
v30 24
2013
The Secretary of State for the Environment (SDS) officiated at the World
Environment Day the first Private Reserve Sustainable Development
(RPDs) of the Amazon with the signing of the decree no 86
2013 Workshop II - presentation of the carbon project as one of the fundraising
programs for the implementation of the Management Plan
2013 Field work with communities and farms for mapping biodiversity and
hunting and fishing grounds
2013 The EBCF performs a complete socioeconomic census in the surrounding
communities of RPDs
2013 Meeting with CEUC for delivery and presentation of the draft of RPDs
Amazon River Management Plan I
2013
Supplementary Meeting to communities who could not attend the
Workshop II amp III Workshop Creation of the Advisory Council for RPDs
Amazon River I
2013 The EBCF performs social and economic Census in Kamayuaacute community
2015 Realization of field activities for Biomass Inventory Estimation
2016 Vitor Belfort visit and launch of income-generating initiatives
2016 Distribution of medical kits for community health workers and launching the
Health Program in the Amazon
2016 Deforestation Report
2016 PD Review and preparation of the monitoring report
MONITORING amp IMPLEMENTATION REPORT VCS Version 3 CCB Standards Third Edition
v30 25
2016 REDD + Project Certification (VCS and CCV)
2016 Project planning for structuring the supply chain of vegetable oils
certificates
2017 Fundraising from the REDD project
2017 Ecotourism Project Design
2017 Workshop Achievement Participatory Planning Project REDD + activity
EBCF
2017 ProBUC Deployment
2018 Implementation of Voluntary Environmental Agent program
25 Respect for Rights and no Involuntary Relocation
In the three workshops explaining the Carbon project to 15 communities the eight REDD+
principles and the social and environmental safeguards were presented Those safeguards were
previously established in a series of meetings throughout the Amazon between 2009 and 2010
and included several Civil Society Organizations
It was emphasized in the workshops that compliance with these principles and safeguards under
REDD+ projects such as the Amazon Rio carbon project contributes to improving local
governance transparency of information public participation in decision-making coordination of
actions among different actors and respect and recognition of the rights of indigenous peoples and
traditional populations
Free Prior and Informed Consent (FPIC)
During the project workshops the concept of Free Prior and Informed Consent was presented to
the participants as well as the importance of social and environmental safeguards to ensure the
rights of communities in designing and developing the REDD+ project explained in the eight
principles The participants were asked whether they were in agreement and if there were other
MONITORING amp IMPLEMENTATION REPORT VCS Version 3 CCB Standards Third Edition
v30 26
principles or rights that should be included Some community individuals expressed their
agreement to the safeguards All participants at the three workshops raised their hands in support
of REDD+ project The consent was unanimous
A separate document describing the whole process of the Free Prior and Informed Consent has
been prepared and is available in Annex 10
Figure 05 - Workshop I Free Prior and Informed Consent for the development of the REDD+
project by the community leaders of Democracia Aacutegua Azul Satildeo Joseacute do Miriti Vista Alegre
Jatuarana Terra Preta do Ramal Pandegal Santa Maria Santa Eva and Terra Preta do Rio
Mancoreacute
Figure 06 - Workshop II Free Prior and Informed Consent for the development of the REDD+
project by the community leaders of Urucury Mocambo Boa Esperanccedila and Satildeo Joatildeo amp Ponta
Grossa
MONITORING amp IMPLEMENTATION REPORT VCS Version 3 CCB Standards Third Edition
v30 27
Figure 07 - Workshop III Free Prior and Informed Consent for the development of the REDD+
project by the Kamayuaacute indigenous community
3 APPLICATION OF METHODOLOGY
31 Title and Reference of Methodology
VCS VM0011 Methodology for Improved Forest Management ndash Logged to Protected Forest
(LtPF) Calculating the GHG Benefits from Preventing Planned Degradation version 10
MONITORING amp IMPLEMENTATION REPORT VCS Version 3 CCB Standards Third Edition
v30 28
32 Methodology Deviations
Whereas the VM0011 was developed in a context of homogeneous forests of temperate regions
some methodological adjustments were made related to the direct survey biomass in the field
since the project areas are comprised of very heterogeneous areas of rainforest including dryland
and floodplains Any technical documentation related to these methodological adjustments and
their justifications appear in Annex 23 (Forest Inventory 2016) prepared by the consulting firm
HDOM
33 Project Boundary5
The total area of the property is 20387 ha and a buffer zone was established around each of the
four areas in order to include communities that use the resources within their boundaries (Figure
7a) Project activity areas (for purposes of calculating the emissions reductions called the project
area or PA) are only those for which logging is permitted a total of 19800 ha (Figure 7b)
excluding the Permanent Preservation Areas (APPs) and bodies of water A logging plan has been
approved for this area for selective logging (Annexes 1 2 3 4 6 and 7)
Figure 08 - Project Boundaries a) Direct Project interference limits b) Total Project Area (G1
Indicator 7)
5 Ref section 22 of VM0011
MONITORING amp IMPLEMENTATION REPORT VCS Version 3 CCB Standards Third Edition
v30 29
Stratification of the project area
For purposes of inventorying local carbon stocks and project management the project area was
stratified into 3 groups of different forest types as indicated by the VM0011 according to the
vegetation map SIPAMRADAM (DPI 2002) The forest types present in the area are rain forest
types divided into 3 categories as follows
Dense Primary Tropical Ombrophylous Alluvial Forest
Dense Primary Tropical Ombrophylous Lowland Forest
Pioneer Formations
Figure 09 - Project Area forest types
Leakage areas
There is no direct leakage resulting from planned project activities since there will be neither
displacement of management activities to other areas after the cessation of the activities within the
project area nor market leakages The project Management Plan includes the monitoring of
MONITORING amp IMPLEMENTATION REPORT VCS Version 3 CCB Standards Third Edition
v30 30
possible unanticipated leakages around the project area as well as the need to report to the
competent authorities whenever logging activities are identified in these areas For more
information on leakage see chapters 52 and 55 of this document
Temporal boundaries
Crediting period of the project
The first crediting period of the project is 37 years beginning on August 17 2012 and ending on 17
August 2049 This period is equivalent to the remaining 12 years of the first authorized
management plan (25 years from 1998) added to another 25 years in respect of a new forest
management plan that was intended as the common practice of forestry in Brazil The logging
activities could continue beyond 37 years aiming for a second crediting period
Monitoring and Reporting Period
a) Monitoring of Baseline Emissions
The monitoring of Baseline Emissions must demonstrate that the protected forest area is in
accordance with the one specified in the PD The project limit will be monitored before each
verification throughout the crediting period through new inventory information and remote sensing
and GIS as applicable Thus the project will be able to update the baseline calculations based on
the actual remaining forest area (in case of loss of forest cover by disasters for example) and that
would be subject to forest management under a ldquowithout projectrdquo scenario
b) Monitoring of Project Emissions
Project emissions will be monitored annually and compiled in every monitoring report that will detail
in particular the
Monitoring of possible illegal harvesting of timber
Monitoring of areas subject to natural disturbances
Monitoring and quantification of emissions related to air and land travel related to project
activities
c) Monitoring of Leakage
Since there will be no leakages according to the VM0011 and AFOLU Requirements no leakage
monitoring will be necessary However to be conservative the project intends to monitor any
disturbances that might affect the carbon reservoirs Once some disturbance is registered the
project will report the incident to the relevant authorities and make the necessary adjustments to
MONITORING amp IMPLEMENTATION REPORT VCS Version 3 CCB Standards Third Edition
v30 31
the baseline For more details about the monitoring of leakages see chapters 52 and 55 of this
document
Carbon stocks
The biomass reservoirs considered by the project are related to above-ground and underground
biomass
Sources and sinks of GHGs
Table 02 below describes the emission sources and sinks of greenhouse gases associated with
the baseline activities and with the project
Table 03 - Greenhouse gas emissions sources and sinks associated with baseline and project
activities
Source Gas Included JustificationExplanation
Baselin
e
Biomass
CO2 Yes Main source of project emissions through forest
degradation harvested and commercialised
wood products deadwood and forest regrowth
CH4 No Conservatively excluded
N2O No Conservatively excluded
Other No -
Fossil Fuel
consumption
CO2 Yes Main source through fossil fuel use in
machinery and transportation of timber
CH4 Yes Conservatively included
N2O Yes Conservatively included
Other No -
Electricity
consumption
CO2 Yes Main source
CH4 No -
N2O No -
Other No -
Pro
ject
Biomass
CO2 Yes Main source through unexpected natural
disturbances such as forest fires etc
CH4 Yes Included but subject to significance
N2O Yes Included but subject to significance
MONITORING amp IMPLEMENTATION REPORT VCS Version 3 CCB Standards Third Edition
v30 32
Source Gas Included JustificationExplanation
Other No _
Fossil Fuel
consumption
CO2 Yes Main source through flights and ground travel
CH4 Yes Included but subject to significance
N2O Yes Included but subject to significance
Other No _
Electricity
consumption
CO2 Yes Main source
CH4 No _
N2O No _
Other No _
34 Baseline Scenario
The choice between alternative baseline scenarios was taken together with the analysis of
additionality using the latest version of the VCS Tool for the demonstration and assessment of
additionality in Agriculture Forestry and Other Land Use VCS projects in this case VT000167
(VCS 2012a) All possible scenarios as well as the analysis of methodology barriers (steps 211
and 212 of the VM0011) are present in the chapter below In this sense to avoid redundancy of
information refer to additionality analysis to find the steps 211 and 212 of the VM0011
The baseline scenario for the project identified as the most likely to occur was selective logging8
(continuation of Business As Usual - BAU) The reference scenario assumes 37 years of selective
logging according to the 25 year logging plan approved in August 1998 (Annex 6 - document
ValdII T01 POA 1998) that in the absence of project activities would be renewed in 2024 for
another 25 years until 2049
Under this scenario the full implementation of the timber logging plan occurs and which has
already resulted in the degradation of 434769 ha (see table below) The area would be harvested
selectively for timber sold in lumber markets Below is a summary of harvest areas between 1999
and 2010 showing the managed plots and the dates on which the harvests were authorized
6 Tool for the demonstration and assessment of an additional to the VCS project activities in Agriculture Forestry and Other
Uses (AFOLU) (V 30)
7 Adapted from ldquoTool for the Demonstration and Assessment of Additionality in AR CDM project Activitiesrdquo (V02) 8 Additional information about choosing the baseline are presented in section 46 (steps 1 and 2)
MONITORING amp IMPLEMENTATION REPORT VCS Version 3 CCB Standards Third Edition
v30 33
Table 04 - Summary of areas managed since 1999
Date Managed logged area (ha)
1999 58669 (Plot 1)
2000 688 (Plot 2)
2001 ndash 2002 8315 (Plot 3)
2003 ndash 2004 750 (Plots 3 and 4)
2005 ndash 2007 1082 (Plot 5)
2008 ndash 2009 49050 (Plots 5 and 6)
TOTAL 434769
35 Additionality
The additionality analysis of the Amazon Rio project REDD+ IFM was conducted with the latest
version of the VCS Tool for the demonstration and assessment of additionality in Agriculture
Forestry and Other Land Use VCS projects the VT000167
(VCS 2012a)
To generate the reductions in GHG emissions for the project the planned baseline activities
(sustainable forest management) were terminated by the project proponent and supplanted by
environmental conservation activities In this sense the project will be managed by EBCF with
the goal of creating a fund for administrative and accounting management especially to promote
environmental management and monitoring activities of carbon pools within the project area
Alternative activities planned in the project are the provisioning and valuation of environmental
services via carbon credits (VCUs) in conjunction with the sale of Environmental Reserve Quotas
(CRAs)
4 MONITORING AND PARAMETERS OF DATA
41 Monitoring Plan Description
Due to its innovative comprehensive and integrative character the project needs to be monitored
regularly so that its actions activities and impacts can be constantly measured and evaluated To
meet this requirement the monitoring process must meet three main objectives
MONITORING amp IMPLEMENTATION REPORT VCS Version 3 CCB Standards Third Edition
v30 34
i To serve as an internal management project tool
ii To collaborate as an instrument of collective learning from the communities and
social groups directly involved
iii To work as a means of communicating results and impacts to interested institutions
and society in general Furthermore it is important to consider that monitoring if
successful will transcend the managerial aspects of the project and strengthening
the plan
To facilitate the monitoring process instead of having a reference line (to compare interventions
before and after) the first year of monitoring will serve as the starting point whose information will
be regularly and systematically compared throughout the project
Next the initial plans for monitoring benefits to the climate community and biodiversity are
described wherein the community is committed to participatory precept and to the technical and
scientific rigor which is capable of following the possible negative and positive impacts on
environmental and social aspects in the project area and its surroundings
Monitoring of Climate Impacts
The Monitoring Plan (MP) aims to provide security in the periodic estimates of reduction in
emissions especially in monitoring changes in carbon stock Therefore emissions from the
implementation of the project ex post estimates of the activities and emissions from any leakages
and isolated disturbances (eg blowdown fires pests and diseases among others) can be
calculated
The construction of the PM of the climate benefits made in full compliance with the methodological
framework provided by VM0011 ndash IFM LPF (VCS 2011) and CCBA (2008) which consists of four
specific actions to be monitored
i Implementation and execution of the project
ii Dynamics and stock of the forest biomass
iii Deforestation and forest degradation
iv Periodic reviews of ex post emissions
Remote monitoring and surveillance of the project area
Measurement of alterations and biomass loss quantification present in the PA using land use
change detection is critical to make accurate estimates of GHG emissions that account for forest
biomass increases and losses
MONITORING amp IMPLEMENTATION REPORT VCS Version 3 CCB Standards Third Edition
v30 35
Thus the use of remote sensing by satellite images of medium spatial resolution can be applied
readily in the PA and surroundings in order to monitor land use dynamics over time particularly to
identify risks and threats to forested areas In situ verification will complement landscape analysis
in a GIS environment with the aim of quantifying spatializing and identifying conversion of forest
areas into other land uses environmental degradation and other possible changes that may occur
during the term of the project
As a complementary monitoring source the project will rely on the database and information
provided by Monitoring Program of the Brazilian Amazon Forest by Satellite 910
(Prodes Digital)
conducted by the National Institute for Space Research (Instituto Nacional de Pesquisas Espaciais
- INPE) according to the Plan for Prevention and Control of Deforestation in the Amazon
1112(PPCDAm) under the National Policy on Prevention and Control of Deforestation Such
information is available online in13
digital vector files for the public in general
Other tools will provide complementary information to the monitoring such as indicators of forest
degradation and hotspots (fires and wildfires) obtained from DETER 14
SAD 15
and PROARCO16
Information is available online for free in vector format These results will be systematically related
to field data for validating or disproving the occurred event so that the focuses of deforestation and
degradation can be identified remediated reported and consequently avoided as much as
possible
A surveillance system that allows permanent territorial monitoring and inhibits the entry of intruders
through entry points in the PA will also be deployed to control the transport flow In addition one
must investigate and identify risks and threats eg mapping hotspots and areas vulnerable to fire
to illegal logging to hunting and poaching and to invasions by third parties among others
At first we estimate an effective demand for structuring the electronic monitoring system which
includes the hiring of skilled professionals field equipment electronic equipment (digital cameras
GPS desktops and notebooks smartphones printers geoprocessing software and GIS among
others) vehicles andor motorcycles motorized boats for transportation and moving around and
the collection of high resolution satellite images Empowerment and training of all involved staff
9httpwwwobtinpebrprodesdigitalmetodologiahtml
10httpwwwobtinpebrprodesmetodologiapdf 11httpwwwmmagovbrflorestascontrole-e-prevenC3A7C3A3o-do-desmatamento 12httpwwwmmagovbrimagesarquivo80120PPCDAm_FINAL_PPCDAMPDF 13httpwwwobtinpebrprodesindexhtml 14httpwwwobtinpebrdeterdados 15httpwwwimazongeoorgbrdocdownloadsphp 16httpwwwdpiinpebrproarcobdqueimadas
MONITORING amp IMPLEMENTATION REPORT VCS Version 3 CCB Standards Third Edition
v30 36
and the surrounding communities will be necessary to make the system effective17
and a constant
stream of information directed to regional actors and other stakeholders
Strategic monitoring and access points to RPDS roads will also provide support to other MPs
including social and biodiversity conservation aspects especially in the logistic support of planned
field activities
Procedures for determining the permanent sample plots (PSPs) and measurement
The calculation of the stock and increase in forest biomass will be subsidized through the
installation of PSPs in the PA and its temporal monitoring through the Continuous Forest Inventory
(CFI) The methodology proposed by VCS (2011) suggests the use of permanent andor temporary
plots however it confirms the efficiency and accuracy of sample plots
In order to demonstrate the procedural and statistical rigor used all the sampling procedures the
PA forest stratification sampling design calculation of sampling intensity and other parameters
measured in PSPs to monitor biomass balance due to ingressmortality of individuals growth in
DBH and height will be presented in detail in the Annex (Annex 23 - Forest Inventory 2016)
To promote reliable forest biomass estimates standard operating procedures (SOPs) (Section 82)
will be used by the team executing the CFI
Monitoring frequency
The monitoring frequency parameters measured in the PSPs will be no greater than 5 years from
the first measurement Other relevant parameters to monitoring the PSPs like the change in land
use in the PA and surrounding areas such as deforestation forest degradation fire sources and
natural disturbances will be regularly monitored as a project routine operation organized and
archived annually
411 Monitoring Impacts to Biodiversity
Since animal inventories have not been conducted in Amazon Rio project areas (for this project
biological information for the Rio Amapaacute RDS management plan were used) a biodiversity
monitoring system that will follow the RAPELD methodology (Rapid surveys of various taxonomic
groups (RAP) for long-term ecological studies) (MAGNUSSON et al 2005)
The RAPELD method contributes to long-term research using rapid inventory assessments biotic
complementarity and land use planning in the Amazon This method increases adequate sampling
17Linking community monitoring to national Measurement Reporting and Verification for REDD+
MONITORING amp IMPLEMENTATION REPORT VCS Version 3 CCB Standards Third Edition
v30 37
probability of biologically diverse communities which require large areas and at the same time
minimize variation of abiotic factors that affect these communities with smaller areas sampling
Evaluation and selection of indicators will be conducted in accordance with the ProBUC model
however applicably to local reality results will be updated biennially from the first survey
Biodiversity indicators are being designed and planned as suggested in the Social and
Environmental Monitoring System of Protected Areas in the Brazilian Amazon (Sistema de
Monitoramento Socioambiental das Unidades de Conservaccedilatildeo da Amazocircnia Brasileira)1819
and
Methodology for Rapid Assessment and Prioritization of Protected Areas Management20
(Metodologia para Avaliaccedilatildeo Raacutepida e Priorizaccedilatildeo do Manejo de Unidades de Conservaccedilatildeo -
RAPPAM) in line with the experiences gained and disseminated by CEUC and ICMBIO previously
described
The empowerment accountability and shared management of biodiversity conservation is the
main focus of the methodological model adopted These actions create high expectations for
environmental management of the area as the biodiversity monitoring will be conducted by the
community members themselves along with the project proponent promoting a local multiplier
effect It is worth mentioning that strict compliance with these procedures is in within EBCF`s
interest since it considers them to be key to the success of the project
The project begins with the premise that any negative impact on biodiversity in the project area
and its surroundings will not occur In the opposite sense the project aims to generate and provide
greater understanding of the territory subsidizing proposals for the conservation and sustainable
use through adoption of good management practices of natural resources as well as its replication
in other locations
412 Monitoring Social Impacts
The monitoring of social aspects include both the collection of numerical data such as quantity
volume weight (quantitative indicators) as well as information expressing opinions and
experiences (qualitative indicators) remembering that such measures are compatible and
interchangeable Data collection should be systematic and have a pre-established rate and most
likely a single indicator will require several data collection instruments such as plans field records
reports etc
Social information will be monitored through the use of participatory methodologies In this sense
the preparation process of the Amazon Rio I RPDS Management Plan was a first step For the
18Indicator Design 19Social and Environmental Monitoring of Protected Areas System in the Brazilian Amazon (Sistema de Monitoramento
Socioambiental das Unidades de Conservaccedilatildeo da Amazocircnia Brasileira) 20Metodologia para Avaliaccedilatildeo Raacutepida e a Priorizaccedilatildeo do Manejo de Unidades de Conservaccedilatildeo (RAPPAM)
MONITORING amp IMPLEMENTATION REPORT VCS Version 3 CCB Standards Third Edition
v30 38
socioeconomic characteristics of communities several community meetings land use mapping
workshops and interviews with focus groups were held in addition to field visits (Annex 10) The
main activities of the project were presented and discussed in these events emphasizing the
importance and timeliness of local valuation of environmental services as well as strategies for
raising funds to implement other projects and improvements in social well-being of communities
around the PA
5 MEASUREMENT OF GHG EMISSIONS REDUCTIONS AND REMOVALS (CLIMATE)
51 Emissions Baseline
EBCF did not carry out any wood related exploration activity in the areas since the beginning of
the REDD+ project Thus it is confirmed estimated emission reductions for the project as
8678833 t CO2eq t year
52 Project emissions
Project emissions were primarily those related to the running of offices and necessary travels for
studies meetings presentations workshops and other activities Table 10 presents a summary of
emissions based on data from Annex 21 of this report
Table 05 - 2011-2016 Project Activity Emissions
YEAR Energy
(KWh)
Energy
(t CO2eq)
Travels
(Km)
Travels
(t CO2eq)
Total
(t CO2eq)
2010
678 024 024
2011
104010 2360 2360
2012 1149 008 55724 1573 1581
2013 2756 028 236749 5429 5457
2014 2498 025 15789 459 484
2015 2231 023 27340 597 620
2016 1015 010
010
093 440290 10443 10536
53 Leakage
Not applicable according to presentation made on the REDD+ IFM document
MONITORING amp IMPLEMENTATION REPORT VCS Version 3 CCB Standards Third Edition
v30 39
54 Summary of GHG Emission Reductions And Removals
EBCF REDD+ project shows emissions reduction of 34397563 tCO2e as the balance in the
period of 2011-2015 Table 06 shows the overview of the dynamics of reductions and project
emissions up to 2048 By the year 2015 the emissions data is posted as seen in reports and from
2016 data are projects as previous average and should be adjusted as a result of future reports
Table 06 - Summary of ex ante estimates
Year
Estimated
reductions
from
baseline21
(tCO2e)
Project
Estimated
emissions 22
tCO2e)
Unplanned
estimate
Emissions23
(tCO2e)
Net GHG
Estimated
emissions
Reduction
(tCO2e)
2012 8675500 1581 0 8673919
2013 8675500 5457 0 8670043
2014 8675500 484 296296 8378720
2015 8675500 620 0 8674880
2016 8675500 2100 0 8673400
2017 8675500 2100 0 8673400
2018 8675500 2100 0 8673400
2019 8675500 2100 0 8673400
2020 8675500 2100 0 8673400
2030 8675500 2100 0 8673400
2048 8675500 2100 0 8673400
Total 3123180 25203 296296 3119989
55 Climate Change Adaptation Benefits (GL1)
There is a relatively widespread understanding in the scientific community that balanced
ecosystems have greater ecological and social resilience and adaptability to climate change
21
See annex 18 22
See annex 21 23
See annex 24- HDOM (Study on deforestation and heat spots for EBCF REDD+ Project technical report)
MONITORING amp IMPLEMENTATION REPORT VCS Version 3 CCB Standards Third Edition
v30 40
whether through protection of water bodies and regulation of river flows during peak flood and
drought or through the regular supply of environmental services products and services
Thus once the project is designed to conserve an area of native forest which in the absence of
the project scenario would remain subject to the pressure of timber management (baseline) and
consequent degradation resulting from such activities it is understood that the mere protection of
these areas alone would offer communities and the ecosystem itself better adaptability compared
to the baseline scenario
Moreover the project has an Activity Management Plan (Annex 9) which details among other
initiatives the promotion of the sustainable use of ecosystem resources through direct support in
some activities related to income generation and conservation along with community training It is
believed that in addition to ensuring a more balanced (and therefore more resilient) environment
the project will expand the options for generating income among the communities making them
more resilient and preparing them to face the greater and already perceived challenges posed by
climate change
6 COMMUNITY
61 Positive Impacts for Communities (CM1)
EBCFrsquos REDD+ project was first presented to the riverine communities in 2011 By then
communities were informed about the cessation of all timber exploration activities due to the
REDD+ project and discussions were held regarding biodiversity conservation and the sustainable
use of forest products and services as well the social development of the surrounding
communities Briefly the positive impacts along the communities were
1 Project area zoning and its surroundings
2 Contribution to building local capacity
3 Contribution to developing sustainable business in the region
4 Contribution to social and environmental diagnosis
Knowing to manage
To evaluate the progress of these initiatives throughout the development of the project we used
the methodology of the Sustainability Matrix developed by the Secretariat of Environment and
MONITORING amp IMPLEMENTATION REPORT VCS Version 3 CCB Standards Third Edition
v30 41
Sustainable Development of Amazonas State This tool was applied in 15 communities taking into
account local socio-economic aspects that underlie the development of 20 parameters considered
of great importance to community development described by specific indicators As a visual tool
the Sustainability Matrix is quite suitable for traditional populations such as the riverside and
indigenous communities surrounding the Reserve Amazon River I and other areas of the Project
Additionally the Matrix provides interesting spaces for discussion since its construction is done
collectively Through the Sustainability Matrix it was possible to identify along with the
communities projects activities and implementation strategies Budgets and monitoring and
evaluation of these projects will be detailed later through the Annual Operational Plans to be
developed and followed up in the due course Four programs and nine subprograms were defined
for management and community development (Annex 9)
62 Negative Impacts (CM2)
No negative impacts have been recorded or identified as a result of the project with stakeholders
7 BIODIVERSITY
71 Positive Impacts for Biodiversity (B1)
The benefits for biodiversity are in reducing deforestation and degradation (selective logging) in the
project area According to satellite images analysis in the project areas and their surroundings it
was observed that until 2010 300 hectares were deforested After the implementation of the
project community awareness on the importance of preservation and conservation of forests have
encouraged no deforestation degradation and a significant reduction in deforestation was
identified (see graph below) This was due to the good understanding of the projects conservation
objectives and by the involvement and support of the surrounding communities
MONITORING amp IMPLEMENTATION REPORT VCS Version 3 CCB Standards Third Edition
v30 42
Figure 10 - EBCF REDD Project and buffer areas deforestation figures (source HDOM Report)
The consequences of deforestation and degradation on biodiversity are well known Thus the fact
of not being identified changes (natural or anthropogenic) in forest areas shows there was no loss
of biodiversity no reduction in floristic diversity no impact on the dynamics of fauna and flora and
no loss of evolutionary genetic information
72 Negative Impacts on Biodiversity (B2)
There are no negative impacts on biodiversity as a result of the project
73 Exceptional Benefits for Biodiversity (GL3)
The description of exceptional benefits for biodiversity will only be possible after the re-
measurement of permanent plots (FLORA)
8 ADICIONAL INFORMATION
All activities and the consequent reduction in deforestation and degradation in and around the
project areas were maintained and funded without resources of carbon credits We understand that
with the advance of REDD+ project EBCF will have much better conditions to implement positive
actions in partnership with communities
MONITORING amp IMPLEMENTATION REPORT VCS Version 3 CCB Standards Third Edition
v30 43
REFERENCES
ADEODATO S etal Madeira de ponta a ponta o caminho da floresta ateacute o consumo Satildeo Paulo
FGV-RAE 2011
ALBAGLI S Amazocircnia fronteira geopoliacutetica da biodiversidade Revista Parcerias Estrateacutegicas n
12 p6 set2001 Centro de Estudos Estrateacutegicos do Ministeacuterio da Ciecircncia e Tecnologia
AMARAL I C Viabilidade de plantio de cafeacute na zona da mata mineira Revista Poliacutetica Agriacutecola
Ano xx n4 outnovdez 2011 Disponiacutevel em
httpwwwalicecnptiaembrapabrbitstreamdoc9309031Viabilidadedeplantiopdf Acesso
em 17 de set 2013
AMARAL P etal Floresta para Sempre um manual para a produccedilatildeo de madeira na Amazocircnia
Beleacutem IMAZON 1998 130p
AMAZONAS Lei Complementar nordm 532007 de 05062007 REGULAMENTA o inciso V do artigo
230 e o sect 1ordm do artigo 231 da Constituiccedilatildeo Estadual institui o SISTEMA ESTADUAL DE
UNIDADES DE CONSERVACcedilAtildeO - SEUC dispondo sobre infraccedilotildees e penalidades e
estabelecendo outras providecircncias Disponiacutevel em
httpwwwcetesbspgovbruserfilesfilemudancasclimaticasproclimafilelegislacaoestadua
lamazonasleilei_complementar_n_53_2007_amazonaspdf Acessado em Setembro 2013
ANTAQ Anuaacuterio Estatiacutestico 2004 Distacircncia entre os portos Disponiacutevel em
httpwwwantaqgovbrportalanuariosportuario2004TabelasDistanciaEntrePortospdf
Acesso em 23 de out 2013
ANTAQ Panorama Aquaviaacuterio Agecircncia Nacional de Transportes Aquaviaacuterios Volume 3 Brasiacutelia
ndash DF 2009
MONITORING amp IMPLEMENTATION REPORT VCS Version 3 CCB Standards Third Edition
v30 44
AREDES A F PEREIRA M W G Anaacutelise econocircmica da produccedilatildeo de cafeacute araacutebica um estudo
de caso com simulaccedilotildees de Monte Carlo para sistemas de baixa e alta produtividade
Informaccedilotildees Econocircmicas SP v38 n4 abr 2008
ARIMA E UHL C Pecuaacuteria na Amazocircnia Oriental Desempenho Atual e Perspectivas Futuras Seacuterie
Amazocircnia n1 Beleacutem IMAZON 1996 40p
BACCINI A et al Estimated carbon dioxide emissions from tropical deforestation improved by
carbon-density maps Nature Climate Change vol2 march 2012 (LETTERS Published
Online - DOI 101038NCLIMATE1354)
BARROS A C UHL C Padrotildees problemas e potencial da extraccedilatildeo madeireira ao longo do Rio
Amazonas e do seu estuaacuterio Seacuterie Amazocircnia n4 Beleacutem IMAZON 1997 42p
BRASIL Lei 121872009 (Lei Ordinaacuteria) 29122009 Institui a Poliacutetica Nacional sobre Mudanccedila
do Clima - PNMC e daacute outras Providecircncias Presidecircncia da Repuacuteblica Casa Civil Subchefia
para Assuntos Juriacutedicos Disponiacutevel em lthttpswwwplanaltogovbrccivil_03_ato2007-
20102009leil12187htmgt Acesso em 20 de set 2013
CAMPOS E F Emissatildeo de CO2 da madeira serrada da Amazocircnia o caso da exploraccedilatildeo
convencional 2012 172p Dissertaccedilatildeo - Escola Politeacutecnica Universidade de Satildeo Paulo Satildeo
Paulo
CARDOSO RS e FREITAS C E C A pesca de pequena escala no rio Madeira pelos
desembarques ocorridos em Manicoreacute (Estado do Amazonas) Brasil Revista Acta
Amazocircnica vol 38(4) 2008 781 ndash 788
CCBA Climate Community and Biodiversity Alliance-CCBA 2008 Disponiacutevel em
httpwwwclimate-standardsorgccb-standards Acesso em 03 de set 2013
MONITORING amp IMPLEMENTATION REPORT VCS Version 3 CCB Standards Third Edition
v30 45
CEPEA Centro de Estudos Avanccedilados em Economia Aplicada - ESALQUSP Economia da
pecuaacuteria de corte na regiatildeo norte do Brasil Disponiacutevel em httpgooglL2roiA Acesso em
15 de out 2013
CHAMBERS J Q et al Decomposition and carbon cycling of dead trees in tropical forests of the
central Amazon Oecologia vol122 pp380-388 2000 Agricultores se queixam de
burocracia para contratar creacutedito sustentaacutevel do Programa ABC Correio Braziliense Brasiacutelia
26 fev 2012 Disponiacutevel em
lthttpwww2correiobraziliensecombrsersustentavelp=4592gt Acesso em 10 set 2013
CULLEN Jr L VALLADARES-PAacuteDUA C Onccedilas como detetives da paisagem Ciecircncia Hoje
Vol 156 n26 pp54-571999
CPRM - Serviccedilo Geoloacutegico do Brasil Disponiacutevel em httpwwwcprmgovbr Acesso em 13 de
mar 2013
DIAS F M MORAIS S J S REZENDE R C Anaacutelise da viabilidade econocircmica para a
produccedilatildeo de melancia e cenoura com financiamento em Anaacutepolis-GO 2008 Disponiacutevel em
httpwwwprpuegbr06v1conteudopesquisainiccieneventossic2008fronteiraflashsicani
macaoIIIJORNADAarquivosresumosresumo01pdfgt Acesso em 18 de nov2013
Divisatildeo de Precessamento de Imagens (DPI) Ambdata Mapa de Vegetaccedilatildeo SIPAM RADAM
2002 Disponiacutevel em httpwwwdpiinpebrAmbdatamapa_sipamphp Acesso em 21 de
out 2013
DOMINGUES MS BERNMANN C O arco de desflorestamento na Amazocircnia da pecuaacuteria agrave
soja Ambiente amp Sociedade Satildeo Paulo vol15 n2 pp1-22 maioago 2012
MONITORING amp IMPLEMENTATION REPORT VCS Version 3 CCB Standards Third Edition
v30 46
EBCF Criaccedilatildeo da primeira reserva particular de desenvolvimento sustentaacutevel do mundo na
floresta amazocircnica Disponiacutevel emlthttpwwwebcfcombrblog20130624criacao-da-
primeira-reserva-particular-de-desenvolvimento-sustentavel-do-mundo-na-floresta-
amazonicagt Acesso em 21 de set 2013
EMBRAPA Sistema Brasileiro de Classificaccedilatildeo de Solos 2ordf Ed Rio de Janeiro Embrapa Solos
2006 306 p
FELDPAUSCH T R et al When big trees fall Damage and carbon export by reduced impact
logging in southern Amazonia Forest Ecology and Management Vol 219 pp199-215 2005
FEARNSIDE P MDesmatamento na Amazocircnia dinacircmica impactos e controle Acta Amazocircnica
vol 36 n3 pp 395-400 2006
FILGUEIRAS T S et al 1994 Caminhamento Um meacutetodo expedito para levantamentos
floriacutesticos qualitativos Caderno de Geociecircncia IBGE vol12 pp39-43 1994
Forest Management Public Summary for Gethal Amazonas SA Induacutestria de Madeira
Compensada Certification Code SW-FMCOC-119 Date of Certification October 1
2000 Date of Public Summary October 2000 Updated for Annual Audit 2002 Annual Audit
2003 (Gethalpdf)
Globo Rural Linha de financiamento para a agricultura de baixo carbono tem pouca procura
2011 Disponiacutevel em httpwwwrainforest-allianceorgforestrydocumentsgethalpdf
Acesso em 16 de nov 2013
GREENPEACE Face a Face com a Destruiccedilatildeo Relatoacuterio Greenpeace sobre as companhias
multinacionais madeireiras na Amazocircnia Brasileira 1999 Disponiacutevel em
MONITORING amp IMPLEMENTATION REPORT VCS Version 3 CCB Standards Third Edition
v30 47
lthttpwwwgreenpeaceorgbramazoniaface_destruicaopdfgt Acesso em 11 de set
2013
Governo do Estado do Amazonas Plano de Gestao da RDS do Rio Amapaacute 2010 Disponiacutevel em
httpobservatoriowwforgbrsite_mediauploadgestaoplanoManejorio_amapapdf Acesso
em 24 de ago 2013
HDOM Estimates from processing the forest inventories data carried out during the CADAF
Project Final Technical Report 2012 Disponiacutevel em wwwhdomcombr Acesso em 27 de
maio 2013
HIGUCHI N 1986-87 Amostragem sistemaacutetica versus amostragem aleatoacuteria em floresta tropical
uacutemida de terra-firme na regiatildeo de Manaus Acta Amazonica 1617 (uacutenico) 393-400
HIGUCHI N SANTOS J JARDIM FCS Tamanho de parcela amostral para inventaacuterios
florestais Acta Amazocircnica vol12 n1 pp91-103 1982
HIGUCHI F G PINTO A C M ISHIZUKA M KAJIMOTO T LIMA A J N SANTOS J
HIGUCHI N Estoque e dinacircmica de biomassa acima do solo das florestas de terra firme do
estado do Amazonas In Adriano Joseacute Nogueira Lima Flaacutevia Machado Durgante Moacir
Alberto Assis Campos Joaquim dos Santos Moriyoshi Ishizuka Niro Higuchi (Org)
Dinacircmica do carbono das florestas da Amazocircnia resultados do Projeto CADAF
1edManaus INPA 2014 v 1 p 29-34
HOLMES T P etal Custos e benefiacutecios financeiros da exploraccedilatildeo de impacto reduzido em
comparaccedilatildeo agrave exploraccedilatildeo florestal convencional na Amazocircnia oriental 2ordf ed Beleacutem
Fundaccedilatildeo Floresta Tropical 2002 66p
HUSCH B MILLER C I BEERS T W Forest mensuration New York Ronald Press 1971
HUSCH B MILLER C I BEERS T W Forest Mensuration New York John Wiley amp Sons
2nd
ed 1972 402 p
MONITORING amp IMPLEMENTATION REPORT VCS Version 3 CCB Standards Third Edition
v30 48
IBGE Instituto Brasileiro de Geografia e Estatiacutestica Diretoria de GeociecircnciasCoordenaccedilatildeo de
Recursos Naturais e Estudos Ambientais Geologia Solos Hidrografia e Vegetaccedilatildeo 2000
IBGE Instituto Brasileiro de Geografia e Estatiacutestica Manicoreacute 2010 Disponiacutevel
emlthttpwwwsidraibgegovbrgt Acesso em 05 de set 2013
IBGE Instituto Brasileiro de Geografia e Estatiacutestica 2011 Disponiacutevel em httpwwwibgegovbr
Acesso em 19 de mar 2013
IBGE Instituto Brasileiro de Geografia e Estatiacutestica Extraccedilatildeo vegetal e silvicultura para o
municiacutepio de Manicoreacute 2011 Disponiacutevel em
lthttpcidadesibgegovbrxtrastemasphplang=ampcodmun=130270ampidtema=102ampsearch=a
mazonas|manicore|extracao-vegetal-e-silvicultura-2011gt Acesso em 10 de out 2013
IBGE Instituto Brasileiro de Geografia e Estatiacutestica Censo Demograacutefico 2010 Disponiacutevel em
lthttpcidadesibgegovbrxtrastemasphpcodmun=130270ampidtema=116gt Acesso em 18
de out 2013
IBGE Instituto Brasileiro de Geografia e Estatiacutestica Censo Demograacutefico 2010 Disponiacutevel
emlthttpcidadesibgegovbrxtrashomephpgt Acesso em 08 de out 2013
IDESAM Reduccedilotildees de Emissotildees do Desmatamento e Degradaccedilatildeo Florestal (REDD+) estudo de
oportunidades para a regiatildeo sul do Amazonas CENAMO M Cl CARRERO G C
GANDOLFO P (Org) Manaus 2011 Disponiacutevel em
lthttpwwwobservatoriodoreddorgbrsitepdfestudodeoportunidadespdfgt Acesso em 13 de
set 2013
MONITORING amp IMPLEMENTATION REPORT VCS Version 3 CCB Standards Third Edition
v30 49
IDESAM Semeando Sustentabilidade em Apuiacute ndash Resultados e Perspectivas 2011 Manaus
Disponivel em lthttpidesamorgbrsemeando-sustentabilidade-em-apui-resultados-e-
perspectivasUxX8nfldWYI
IEA Instituto de Economia Aplicada CO2 Emissions from fuel combustion 2012 Disponiacutevel em
httpwwwieaorgco2highlightsco2highlightspdf Acesso em 09 de out 2013
IGREJA H L S CATIQUE J Anaacutelise neotectocircnica do lineamento de Itacoatiara centro leste do
Estado do Amazonas In Simpoacutesio Nacional de Estudos Tectocircnicos 6 1997 Pirenoacutepolis
Anais Pirenoacutepolis-GO SBG-Nuacutecleo Brasiacutelia1997
IMAZON Instituto do Homem e do Meio Ambiente da Amazocircnia Fatos Florestais 2010a
Disponiacutevel em httpwwwimazonorgbrpublicacoeslivrosfatos-florestais-da-amazonia-
2010-1 Acesso em 14 de out 2013
IMAZOM Instituto do Homem e do Meio Ambiente da Amazocircnia Mercado e preccedilo da madeira
amazocircnica 2010 Disponiacutevel em httpwwwimazonorgbrpublicacoesprecos-de-madeira-
em-toraboletim-de-precos-de-madeira-em-tora-na-amazonia-julho-2010at_downloadfile
Acesso em 23 de nov 2013
IMAZON Instituto do Homem e do Meio Ambiente da Amazocircnia Portal de Geoinformaccedilatildeo sobre
a Amazocircnia Disponiacutevel em lthttpwwwimazongeoorgbrimazongeophpgt Acesso em 06
de set 2013
IMAZON Instituto do Homem e do Meio Ambiente da Amazocircnia Transparecircncia florestal
Amazocircnia Legal 2012 Disponiacutevel em lthttpwwwimazonorgbrpublicacoestransparencia-
florestaltransparencia-florestal-amazonia-legalcopy_of_SADOutubro2012pdfgt Acesso em
23 de set 2013
IMAZON Instituto do Homem e do Meio Ambiente da Amazocircnia PEREIRA D SANTOS D
VEDOVETO M GIMARAtildeES J VERIacuteSSIMO A (Orgs) Fatos Florestais da Amazocircnia
Beleacutem IMAZON 2010 244p Disponiacutevel em
MONITORING amp IMPLEMENTATION REPORT VCS Version 3 CCB Standards Third Edition
v30 50
lthttpwwwimazonorgbrpublicacoeslivrosfatos-florestais-da-amazonia-2010-1gt Acesso
em 24 de set 2013
IMAZON Instituto do Homem e do Meio Ambiente da Amazocircnia A Expansatildeo madeireira na
Amazocircnia Impactos e perspectivas para o desenvolvimento sustentaacutevel no Paraacute BARROS
AC VERIacuteSSIMO A (Eds) Beleacutem IMAZON 2002
IMAZON Instituto do Homem e do Meio Ambiente da Amazocircnia Custos e Benefiacutecios do Manejo
Florestal Para Produccedilatildeo de Madeira na Amazocircnia Oriental 1998 Disponiacutevel em
lthttpwwwimazonorgbrpublicacoesserie-amazoniacustos-e-beneficios-do-manejo-
florestal-para-producao-de-madeira-na-amazonia-orientalgt Acesso em 20 de set 2013
INPE Instituto de Pesquisas Espaciais Banco de dados PRODES 2012 Disponiacutevel em
lthttpwwwdpiinpebrprodesdigitalprodesphpgt Acesso em 09 de set 2013
INPE Instituto de Pesquisas Espaciais Banco de dados DEGRAD 2009 Disponiacutevel em
lthttpwwwobtinpebrdegradgt Acesso em 09 de set 2013
INPE Instituto de Pesquisas Espaciais Banco de dados DETER 2013 Disponiacutevel em
lthttpwwwobtinpebrdetergt Acesso em 10 de set 2013
INPE Instituto de Pesquisas Espaciais Banco de dados de queimadas e focos de calor
BDQUEIMADAS 2013 Disponiacutevel em lthttpwwwdpiinpebrproarcobdqueimadasgt
Acesso em 10 de set 2013
Instituto Carbono Brasil Soacute 2 da produccedilatildeo de madeira eacute certificada O Estado de SPaulo 2006
Disponiacutevel em lthttpwwwinstitutocarbonobrasilorgbrnoticias6noticia=119796gt Acesso
em 26 de set 2013
MONITORING amp IMPLEMENTATION REPORT VCS Version 3 CCB Standards Third Edition
v30 51
IFT Instituto Floresta Tropical Diagnoacutestico do Setor Florestal de Cotriguaccedilu Estado do Mato
Grosso 2010 Disponiacutevel em lthttpgooglEVx2RZgt Acesso em 16 de dez 2013
IPCC Guidelines for National Greenhouse Gas Inventories In National Greenhouse Gas
Inventories Programme EGGLESTON HS BUENDIA L MIWA K NGARA T TANABE
K (Eds) Japan IGES 2006
ITTO Annual review and assessment of the world timber situation 2011 Disponivel em
httpwwwittointannual_review Acesso em 10 de out 2013
KELLER M et al Coarse woody debris in undisturbed and logged forests in the eastern Brazilian
Amazon Global Change Biology vol10 PP784-795 2004
LENTINI M VERISSIMO A PEREIRA D A expansatildeo madeireira na Amazocircnia O Estado da
Amazocircnia n2 2005 Beleacutem IMAZON Disponiacutevel em
httpwwwimazonorgbruploadea_2ppdf Acesso em 06 de set 2013
LOETSCH F ZOumlHRER F HALLER K E Forest Inventory Munich BLV Verlagsgesellschaft
2nd
edition Vol II 1973 469 p
MAGNUSSON WE et al RAPELD uma modificaccedilatildeo do meacutetodo de Gentry para inventaacuterios de
biodiversidade em siacutetios para pesquisa ecoloacutegica de longa duraccedilatildeo Biota Neotrop JulDez
2005 vol 5 no 2 httpwwwbiotaneotropicaorgbrv5n2ptabstractpoint-of-
view+bn01005022005 ISSN 1676-0603
MARINELLI C E et al O programa de monitoramento da biodiversidade da biodiversidade e do
uso de recursos naturais em unidades de conservaccedilatildeo estaduais do Amazonas Secretaria
de Estado do Meio Ambiente e Desenvolvimento Sustentaacutevel - SDS Manaus SDS 2007
MONITORING amp IMPLEMENTATION REPORT VCS Version 3 CCB Standards Third Edition
v30 52
MARINELLI C E MALTEZ M H Indicadores de Sustentabilidade para Unidades de
Conservaccedilatildeo Documento-Siacutentese Workshop Instituto Socioambiental Brasiacutelia-DF 2010
76p
MAZZEI L et al Above-ground biomass dynamics after reduced-impact logging in the Eastern
Amazon Forest Ecology and Management vol 259 pp367-373 2010
MEIRELLES FILHO O Livro de Ouro da Amazocircnia 5ordf Ediccedilatildeo Rio de Janeiro EDIOURO 2007
422p Meirelles Filho J O Livro de Ouro da Amazocircnia 1ordf ed Editora Ediouro ISBN
8500021616 2007 450p
MENGER Juliana da Silva Fatores determinantes da distribuiccedilatildeo de aves no interfluacutevio Purus-
Madeira Manaus [sn] 2011 35 fl il
MCT Arquivos dos Fatores de Emissatildeo Disponiacutevel em
httpwwwmctgovbrindexphpcontentview321144htmlancora Acesso em 23 de out
2013
MMA Ministeacuterio do Meio Ambiente Avaliaccedilatildeo e identificaccedilatildeo de accedilotildees prioritaacuterias para a
conservaccedilatildeo utilizaccedilatildeo sustentaacutevel e reparticcedilatildeo dos benefiacutecios da biodiversidade na
Amazocircnia brasileira Brasiacutelia MMASBF 2001
MMA Ministeacuterio do Meio Ambiente Secretaria de Biodiversidade e Florestas Aacutereas Prioritaacuterias
para Conservaccedilatildeo Uso Sustentaacutevel e Reparticcedilatildeo de Benefiacutecios da Biodiversidade Brasileira
Atualizaccedilatildeo - Portaria MMA ndeg9 de 23 de janeiro de 2007 Brasiacutelia MMA 2007 (Seacuterie
Biodiversidade 31)
MONITORING amp IMPLEMENTATION REPORT VCS Version 3 CCB Standards Third Edition
v30 53
MMA Livro vermelho da fauna brasileira ameaccedilada de extinccedilatildeo editores Angelo Barbosa
Monteiro Machado Glaacuteucia Moreira Drummond Adriano Pereira Paglia 1ed 2008 Brasiacutelia
DF MMA Belo Horizonte MG Fundaccedilatildeo Biodiversitas (1420 p) il - (Biodiversidade 19)
OLIVEIRA M M HIGUCHI N CELES C H HIGUCHI F G 2014 Tamanho e formas de
parcelas para inventaacuterios florestais de espeacutecies arboacutereas na Amazocircnia Central Ciecircncia
Florestal Santa Maria v 24 n 3 p 645-653
PEARSON TRH WALKER S BROWN SL The Source Book for Land Use Land Use
Change and Forestry Projects BioCarbon Fund and Winrock International 2005 64 pp
PORTAL AMAZOcircNIA Amazocircnia de A a Z Disponiacutevel em
lthttpportalamazoniaglobocomgt Acesso em 13 de set 2013
PEacuteLLICO NETTO S BRENA D A Inventaacuterio florestal Curitiba Editorado pelos autores p
316 1997
PROJETO SIVAM Relatoacuterio metodoloacutegico de trabalho Revisatildeo 3 Diretoria de Geociecircncia Rio de
Janeiro 2002 330 pp
PROJETO SIVAM Atualizaccedilatildeo do RADAMBRASIL Mapa de Vegetacao da Amazonia Legal
Mapa de Fitofisionomias ndash RADAMSIPAM DNPM Ministeacuterio de Minas e Energia 2002
Disponiacutevel em httpwwwdpiinpebramb_dataShapefilesveg_Amz_SIPAMzip Acesso
em 21 de jan 2014
PROJETO FLORESTAL SANTA MARIA (PROJETO FSM-REDD) Plant Inteligecircncia Ambiental ndash
Warwick Manfrinato 2012 Disponiacutevel em
lthttpwwwflorestalsantamariacombrsitedocumentos57FSM_REDD_VCS_PD_ptpdfgt
Acesso em 09 de set 2013
MONITORING amp IMPLEMENTATION REPORT VCS Version 3 CCB Standards Third Edition
v30 54
RADAMBRASIL Programa de Integraccedilatildeo Nacional Levantamentos de Recursos Naturais v 14 ndash
RADAM DNPM Ministeacuterio de Minas e Energia Brasil 1974
RIBEIRO J E L et al Flora da Reserva Ducke guia de identificaccedilatildeo das plantas vasculares de
uma floresta de terra firme na Amazocircnia Central Manaus Editora INPA 1999
ROSAS F C W WALDEMARIN H de MATTOS G E Pteronura rasiliensis (Zimmermann
1780) In MACHADO A B M DRUMMOND G M PAGLIA A P (eds) Livro Vermelho da
Fauna Brasileira Ameaccedilada de Extinccedilatildeo Volume II 1ed Brasiacutelia DF Ministeacuterio do Meio
Ambiente 2008 p 800 - 801
ROSS D GHG Emissions Resulting from Aircraft Travel 2009 Disponiacutevel em
httpwwwcarbonplanetcomdownloadsFlight_Calculator_Information_v92pdf Acesso em
14 de out 2013
SANTOS A J et al Viabilidade econocircmica do sistema agroflorestal greviacutelea x cafeacute na regiatildeo
norte do Paranaacute CERNE vol6 n1 pp89-100 2000
SANTOS R A Custo do manejo florestal madeireiro estudo de caso Floresta Estadual do
Antimary Monografia (Bacharelado em Economia) ndash Departamento de Ciecircncias
Econocircmicas Universidade Federal do Acre 2007109p
SABOGAL C et al Manejo Florestal Empresarial na Amazocircnia Brasileira restriccedilotildees e
oportunidades (Relatoacuterio Siacutentese) Beleacutem CIFORIMAZON 2006 72p
SDSCEUC Secretaria Estadual de Meio Ambiente e Desenvolvimento Sustentaacutevel ndash Centro
Estadual de Unidades de Conservaccedilatildeo Programa de Monitoramento de Biodiversidade e
Uso de Recursos Naturais em Aacutereas Protegidas do Estado Amazonas (ProBUC) 2006
Disponiacutevel em
MONITORING amp IMPLEMENTATION REPORT VCS Version 3 CCB Standards Third Edition
v30 55
httpbrazilwcsorgDesktopModulesBring2mindDMXDownloadaspxEntryId=6168ampPortalI
d=93ampDownloadMethod=attachment Acesso em 11 de ago de 2013
SFBIMAZON Serviccedilo Florestal Brasileiro e Instituto do Homem e Meio Ambiente da Amazocircnia A
atividade madeireira na Amazocircnia brasileira produccedilatildeo receita e mercados 2010 Disponiacutevel
em httpwwwmmagovbrestruturassfb_arquivosmiolo_resexec_polo_03_95_1pdf
Acesso em 23 de out 2013
SILVA R P da Alometria estoque e dinacircmica da biomassa de florestas primaacuterias e
secundaacuterias na regiatildeo de Manaus (AM) 152 p Tese de Doutorado Programa Integrado
de Poacutes-graduaccedilatildeo em Biologia Tropical e Recursos Naturais (INPA) Manaus 2007
SILVA Z A G P G SANTOS R A Custo do manejo florestal madeireiro em floresta puacuteblica
estudo de caso no Acre 2011 Disponiacutevel em
lthttpwwwbasacombrbancoamazonia2Revistaedicao_13n13_custo_do_manejo_flores
pdfgt Acesso em 13 de set 2013
SMIDT M GALLAGHER T Factors Affecting Fuel Consumption and Harvesting Costs Auburn
School of Forestry and Wildlife Sciences Sd Disponiacutevel em
httpweb1cnrevteduforestrycofedocuments2013Smidt_Gallagherpdf Acesso em 21
de out 2013
SOARES-FILHO B et al Role of Brazilian Amazon protected areas in climate change mitigation
2010 Columbia University NY Ruth S DeFries 2010
SPF Serviccedilo Puacuteblico Federal DVPF Documento de venda de produto Florestal (Declaraccedilotildees de
venda Gethalpdf) 14 de julho de 2006
MONITORING amp IMPLEMENTATION REPORT VCS Version 3 CCB Standards Third Edition
v30 56
TIMOFEICZYK JUacuteNIOR R et al Rentabilidade econocircmica do manejo de baixo impacto em
florestas tropicais um estudo de caso Revista Floresta Curitiba v 38 n 4 p 711-725
outdez 2008
VCS Ferramenta para Demonstraccedilatildeo e Avaliaccedilatildeo de Adicionalidade para Atividades de Projetos
VCS em Agricultura Floresta e Outros Usos (AFOLU) 2012a Disponiacutevel em httpwwwv-c-
sorgsitesv-c-sorgfilesVT000120VCS20AFOLU20Additionality20Tool20v30pdf
Acesso em 24 de set 2013
VCS Ferramenta de Risco e Natildeo Permanecircncia (AFOLU) 2012B Disponiacutevel em httpv-c-
sorgsitesv-c-sorgfilesAFOLU20Non-Permanence20Risk20Tool2C20v32pdf
Acesso em 13 de set 2013
VCS Approved VCS Methodology VM0010 Version 10 - Methodology for Improved Forest
Management Conversion to Logged to Protected Forest Calculating GHG Benefits from
Preventing Planned Degradation PHUA S SHARMA S TELFER M CHANDLER H
(Eds) Califoacuternia EUA Carbon Planet Limited 2011149p
VERDEJO M E Diagnoacutestico Rural Participativo um guia praacutetico Brasiacutelia MDA 2006 62p
VIANNA A L M Diagnoacutestico Florestal do Estado do Amazonas 2010 e 2011 Manaus-AM
IDESAM 2013 (Relatoacuterio Final do Projeto Fortalecimento da participaccedilatildeo da sociedade civil
no Amazonas Foacuterum de Mudanccedilas Climaacuteticas Transparecircncia Florestal no Estado do
Amazonas ndash Mapeamento de Instrumentos Legislativos no Brasil)
WBCSDWRI The GHG Protocol for Project Accountin Washington World Business Council for
Sustainable DevelopmentWorld Resources Institute 2005148 p
MONITORING amp IMPLEMENTATION REPORT VCS Version 3 CCB Standards Third Edition
v30 57
WALKER W et al Guia de Campo para Estimativa de Biomassa Florestal e Estoque de Carbono
Woods Hole Center Research Falmouth Massachusetts USA 2011 Disponiacutevel em
httpwwwwhrcorgresourcesfieldguidescarbonpdfWHRC_FieldGuide_PortugueseSMpdf
Acesso em 14 de set 2013
WWF Metodologia para Avaliaccedilatildeo Raacutepida e a Priorizaccedilatildeo do Manejo de Unidades de
Conservaccedilatildeo (RAPPAM) 2010 Disponiacutevel em httpgooglXfDnxs Acesso em 30 de set
2013
WWF-Brasil Efetividade de Gestatildeo das Unidades de Conservaccedilatildeo no Estado do Amazonas
Secretaria de Estado do Meio Ambiente e do Desenvolvimento Sustentaacutevel do Amazonas
Instituto Chico Mendes de Conservaccedilatildeo da Biodiversidade Brasiacutelia WWF-Brasil 2011 72 p
MONITORING amp IMPLEMENTATION REPORT VCS Version 3 CCB Standards Third Edition
v30 9
SFM Sustainable Forest Management
SFMP Sustainable Forest Management Plan
UC Conservation Units (Unidade de Conservaccedilatildeo)
UEA State University of Amazonas (Universidade Estadual do Amazonas)
UFAM Federal University of Amazonas (Universidade Federal do Amazonas)
UNFCCC United Nations Framework Convention on Climate Change
UPA Annual Production Unit (Unidade Produtiva Anual)
VCU Verified Carbon Unit
WBCSD World Business Council for Sustainable Development
WRI World Resources Institute
MONITORING amp IMPLEMENTATION REPORT VCS Version 3 CCB Standards Third Edition
v30 10
1 GENERAL
11 Summary Description of the Project
The Amazon Rio project consists of the conservation of a mosaic of four private areas called
Amazon Rio I II III and IV which add up to 20387 hectares (ha) of primary forest located in the
municipality of Manicoreacute in the state of Amazonas The projects target area is characterized by
being a region of sedimentary Solimotildees Basin dominated by Alluvial Holocene Iccedilaacute Training and
Detritus-lateritic formation The relief is of the flat type with primary vegetation formation consisting
of areas of land floodplain and some formations igapoacute due to the influence of Rio Manicoreacute
The Amazon Rio areas dominated forests of humid tropical rainforest Lowlands emerging Canopy
and Forest Open Rain Lowlands with palm trees (79) the Atlantic rain forest Alluvial emerging
canopy (11) Rain Forest Open Alluvial with palm trees (8) Pioneer formations influenced
fluvial and or lacustrine - herbaceous and shrubby with palm trees (1)
The main focus of the project is (i) the conservation of forest ecosystems and biodiversity (ii) the
sustainable social development of the region including the promotion of ecotourism and scientific
research and (iii) the reduction in carbon dioxide (CO2) emissions through the prevention of
deforestation and forest degradation
In 1998 a logging plan for logging activities was approved by the authorized environmental
agencies on 19800 ha of land over a period of 25 years (the total area does not include
Permanent Preservation Areas (APP) and water bodies Between 1999 and 2010 434769 ha
were degraded due to an authorized logging operation (Annexes 1 2 3 and 4) In February 2011
the area was acquired by the Empresa Brasileira de Conservaccedilatildeo de Florestas (EBCF) which in
order to implement the objectives of the project made two important decisions to suspend the
logging operations underway in the project areas since 1999 and transform them into Private
Reserves for Sustainable Development (Reservas Particulares de Desenvolvimento Sustentaacutevel -
RPDSs) supported by State Law no 53 of June 2007 and Decree no 30108 of June 2010
With this new land use strategy 20387 ha of primary forest will be preserved avoiding the CO2
emissions that would have occurred without the implementation of the project Revenues obtained
from the carbon credits will be used to maintain the primary forest with the implementation of the
activities described in the Reserversquos Management Plan (Annex 9) including social programs and
environmental monitoring
The project intends to maintain financial sustainability through the sale of carbon credits obtained
from the conservation of the area and maintenance of environmental services Another source of
MONITORING amp IMPLEMENTATION REPORT VCS Version 3 CCB Standards Third Edition
v30 11
income planned by the project relates to the national market for legal reserve compensation
(Environmental Reserve Quota (Cotas de Reserva Ambiental (CRA) in Portuguese)1 Using these
two financial mechanisms for conservation the emission of approximately 2 million tons of carbon
dioxide into the atmosphere over a period of 37 years will be avoided
It is important to emphasize that the project area is crucial for conservation especially considering
its characteristics such as (i) high biological diversity and concentration of endemic and
pharmacological species (Section 7) (ii) extensive areas of plains which are important for the
reproduction and survival of many species of plants and animals especially birds and reptiles and
(iii) high potential for ecotourism and environmental education including scientific research
The creation of these private reserves also contributes to the consolidation of a strategy to
establish ecological corridors and mosaics in the region creating a territorial connection between
public and private conservation areas This situation reduces potential conflicts between the state
landowners and residents in the buffer areas and creates opportunities for implementing integrated
actions optimizing human and financial resources for environmental monitoring and control
actions
Another important fact to consider is the surrounding communities who use the project areas for
their own subsistence extracting non-timber forest products (eg nuts fruits oils vines) fishing
and hunting For that reason they have direct interest in the conservation of the forest to obtain
food economic security and maintain their cultural practices
The environmental benefits that the communities receive make them guardians of the forest
contributing significantly to the monitoring and controlling of illegal activities practiced in the region
such as logging fishing and poaching as well as supervision and control of forest fires In this
context the Amazon Rio project plays a role of great environmental importance for the region also
contributing to the improvement of livelihoods of the local population and consequently to the
conservation of the forest
A population of 350 families distributed among 15 communities is estimated to reside around the
area of the Amazon Rio project The environmental benefits provided by the implementation of the
project and Amazon Rio I RPDS Management Plan and posteriorly including Amazon Rio II III
and IV demonstrate a strong social development component and includes several socio-economic
support programs to local communities which promote sustainable development in the region
2 sect 2 Art 15 of the new Brazilian Forest Code (Law 126512012) provides for voluntary forest reserves ie the
excess of forest required by law on rural property According to this law all preserved area that exceeds the minimum required by law may be used for creation of environmental easement or Environmental Reserve Quotas in the same biome and State
MONITORING amp IMPLEMENTATION REPORT VCS Version 3 CCB Standards Third Edition
v30 12
The project will be implemented starting from the introduction of participatory processes ensuring
active involvement of the local communities around the area as in the aforementioned
development programs and in decision-making The community programs that aim to improve
access to health education and income generation will use the ldquoBolsa Florestardquo program as
reference a program of great relevance for payments for environmental services (PES) in the state
of Amazonas In the medium and long terms these programs intend to significantly improve the
living conditions of these communities strengthening their organizational and institutional capacity
including their productive environmental and financial sustainability
12 Project Objectives
General objective
The objectives of this project takes a holistic approach to the region and keep full affinity to the
recent statement of the United Nations in the design of the seventeen goals of Sustainable
Development2 (ODS) In this sense the project objectives have a direct relationship with some of
the ODS and take others as a source of inspiration for the implementation of activities in
partnership with local communities These guidelines will be key elements in the local discussion
process around the project activities
Thus it is assumed as a general objective of the project contribute to the maintenance of global
climate (goal 13) through the implementation of activities to prevent the emission of greenhouse
gases locally by replacing the forest selective logging for a project conservation of forest
biodiversity (goal 15) preserving the traditional culture of the population of surrounding
communities (goal 3) promoting income generation (goal 1 8) and contributing to local social
development (goals 2 5 4 6 7)
Specific objectives
Specifically the project aims to
2 The seventeen Sustainable Development Goals at the United Nations are (1) Ending poverty in all its
form everywhere (2) Ending eat hunger achieve food security improve nutrition (3) To ensure a healthy life and promote well-being for all (4) To ensure inclusive education equitable and quality (5) Achieving gender equality and empower all women (6) Ensure availability and sustainable water management (7) Ensure access energy reliable and sustainable (8) To promote sustained inclusive and sustainable economic growth (9) Building resilient infrastructure promote inclusive industrialization (10) To reduce inequality between and within countries (11) Making cities inclusive human settlements secure resilient (12) To ensure standards of sustainable consumption and production (13) Take urgent action to combat climate change (14) To preserve and promote the sustainable use of the oceans (15) To protect restore and promote the sustainable use of forests (16) To promote peaceful and inclusive societies for sustainable development (17) To strengthen the implementation mechanisms and revitalize the global partnership
MONITORING amp IMPLEMENTATION REPORT VCS Version 3 CCB Standards Third Edition
v30 13
1 Implement economic alternative activities to selective logging to generate revenue for the
project benefiting at least 300 families surrounding the target area
2 Reduce approximately 32 million tons of carbon dioxide as a result of project activities
3 To contribute to the maintenance of regional biodiversity through the preservation and
conservation of the forest
4 Contribute to improve educational processes and attention to regional health
5 Promote the inclusion and womens empowerment in the project area communities
13 Project location
Location
The Amazon Rio Project is located in the southern region of the state of Amazonas in the
municipality of Manicore (Figure 01) The waterway and air constitute arrival means to the city with
approximate distance of 333 km by air and 427 km by river is the starting point for the city of
Manaus the state capital The Project areas are near the Madeira River and between the
Sustainable Development Reserves (RDS) Rio Madeira and Rio Amapaacute (Figure 02)
Figure 01 - Location of the Municipality of Manicoreacute - AM
MONITORING amp IMPLEMENTATION REPORT VCS Version 3 CCB Standards Third Edition
v30 14
Figure 02 - Location areas I II III and IV of the Amazon Rio Project
Figure 03 - Project Zone and communities of the project
MONITORING amp IMPLEMENTATION REPORT VCS Version 3 CCB Standards Third Edition
v30 15
Specifically in the Amazon Rio area the dense Primary Tropical Ombrophylous Lowland Forest and
open Primary Tropical Ombrophylous Lowland Forest with palm trees (79) Dense Primary
Tropical Ombrophylous Alluvial Forest (11) Open Primary Tropical Ambrophylous Alluvial Forest
with palm trees (8) Pioneer Formations with fluvial andor lacustrine influence - herbaceous and
shrubby vegetation with palm trees (1) (Annex 5)
According to IBGEs soil database (2000) the Manicoreacute region is formed mainly of Latosols and
Argisols Also soils such as Gleysols Spodosols Alluvial soils Neosols Planosols Plinthosols and
Nitosols can be found The Brazilian Soil Classification System produced from surveys by the
Brazilian Agricultural Research company (EMBRAPA) between 2001 and 2006 corroborates the
classification information for that region
Alluvial soils are very common in this region These soils are found mainly on the banks of the
Madeira River The fertility levels are dystrophic and located on flat terrain Agricultural and
livestock activities are almost always practiced along the main alluvial stretches of the region The
most fertile soils that occur on the floodplains (vaacuterzea) are widely cultivated for temporary crops
such as beans rice watermelon and cassava
Climate and hydrography
The climate in the region of the Madeira River is humid equatorial (IBGE 2011) with an average
temperature of 27degC relative humidity ranging between 85 and 90 and annual rainfall between
2200 to 2800 mmyear (RADAMBRASIL 1974) Studies from the Amapaacute Rio RDS area indicate
that between the months of January and March rainfall intensity is greater with monthly rainfall
between 300 and 350 mm while the driest months are July and August with monthly averages
around 50 mm
Geographically the Amazon region is defined by watersheds formed by the rivers which flow into
the Amazon Rio and its mouth along the entire East coast of Brazil (RIBEIRO et al 1999) The
city of Manicoreacute is influenced mainly by the Madeira and Manicoreacute rivers which are respectively
white and black water rivers and contribute to the local climatic conditions combined with the
characteristics of the vegetation that includes forests meadows savanna (cerrado) and floodplains
(vaacuterzeas)
Economic context of land use
Southern Amazonas is an important region strategically to prevent advances in deforestation in the
Amazon However in recent years the region has been suffering successive deforestation events
from expanded farming activities contributing to the so-called arc of deforestation toward the
MONITORING amp IMPLEMENTATION REPORT VCS Version 3 CCB Standards Third Edition
v30 16
state of Amazonas Historically the arc of deforestation has advanced with the expansion of
agriculture in the states of Paraacute Mato Grosso Rondocircnia Tocantins and Maranhatildeo In recent
years pressures on forests have increased with the globalization of markets for meat and
soybeans in the Amazon and international development policies for the region (IDESAM 2011)
14 Project Proponent (G4)
Organization Name Empresa Brasileira de Conservaccedilatildeo de Florestas SA (EBCF)
Contact Person Leonardo Barrionuevo
Title President
Address Curitiba-PR Al Dr Carlos de Carvalho 555 Conj 231
Centro Curitiba ndash PR CEP 80430-180 Brazil
Escritoacuterio Manaus Av Djalma Batista 1661 Conj 1409 A Bloco B
Ed Business Tower Millenium Cep 69050-010 Manaus-AM Brazil
Telephone +55 41 3158 9800 | +55 41 9943 8005
Email leonardoebcfcombr
15 Other Entities Involved in the Project (G4)
Organization Name Original Trade Consulting
Role in the Project Update of the Amazon Rio REDD+ IFM Project Description (PD) (V20)
and coordination of certifcation process
Contact Person Joatildeo Batista Tezza Neto
Title Director
Address Avenida Andreacute Arauacutejo 2936 ndash Edifiacutecio Incubadora do INPA sala 10
Cep 69060-000 Manaus-AM Brazil
Telephone +55 92 981590997
Email tezzanetooriginaltradenet
MONITORING amp IMPLEMENTATION REPORT VCS Version 3 CCB Standards Third Edition
v30 17
Organization Name HDOM
Role in the Project Degradation and deforestation report Forest inventory for biomass
calculation purposes in the project area and support the PD review
Contact Person Francisco Higushi
Title Director
Address Av Maacuterio Ypiranga 315 Ed The Office sala 609 Adrianoacutepolis CEP
69057-002
Telephone + 55 92 98128 2561
Email fghiguchihdomcombr
11 Project Start Date
The project began on August 17 2012 when the board and EBCF shareholders formally approved
the companys Business Plan (Annex 27) which set out the objectives of conserving forests
through the REDD + provision of services and sustainable use of forest resources excluded
logging activities
12 Project Crediting Period
The first crediting period of the project is 37 years beginning on August 17 2012 and ending on 17
August 2049 This period is equivalent to the remaining 12 years of the first authorized
management plan (25 years from 1998) added to another 25 years in respect of a new forest
management plan that was intended as the common practice of forestry in Brazil The logging
activities could continue beyond 37 years aiming for a second crediting period
2 DESIGN
21 Sectoral Scope and Project Type
Project Scope Agriculture Forest and other Land Use (AFOLU)
Project Category Reduction Emission from Deforestation and Degradation from Planned
Deforestation (REDD-IFM)
MONITORING amp IMPLEMENTATION REPORT VCS Version 3 CCB Standards Third Edition
v30 18
Type of Activity Improved Forest Management - Logged to Protected Forest (IFM LfPF)
22 Project Financing
The carbon project integrates a broad vision of territorial management as part of the Management
Plan of the Amazon Rio Private Reservation I Accordingly it stipulates that all actions necessary
to implement this Plan should be enabled from resources obtained by payments for environmental
services such as carbon credits and CRAs
The idea is for the plan to serve as a management tool to provide technical and political support
support to negotiations with support institutions to receive investments that can make projects and
programs viable The expected revenues in the short and medium term to implement the
Management Plan will mostly come from payments for environmental services such as negotiated
carbon credits and CRAs in addition to projects that generate long-term income exclusively for the
communities such as ecotourism scientific research and harvest of non-timber forest products
In this context the main difference between a permanent protection private reserve (eg RPPN)
and a private sustainable development reserve (eg RPDS) is that the long-term financial viability
of sustainable reserves usage comes from the marketing of non-timber forest products with high
added value and other sustainable businesses in compensation for environmental services This
flow of resources is expected to occur during and after the implementation period The proposal is
that with external support and through their political representatives local communities will be able
to establish partnerships and contracts with companies cooperatives and industries interested in
supporting social and environmental initiatives in the project areas
These items are briefly listed below with their respective values regarding the implementation and
execution of the project part of which will be initially financed by the contribution of the partners as
mentioned above
Table 01 - Project implementation and opperational costs3
Component Value (R$) Share ()
Pre-Operating expenses R$ 1561904 361
Administrative expenses R$ 24069915 5568
Costs of VCS + CCB certification R$ 456670 106
3 Annex 16
MONITORING amp IMPLEMENTATION REPORT VCS Version 3 CCB Standards Third Edition
v30 19
Monitoring R$ 2820000 652
Social program related expenses R$ 6050000 1399
Carbon trading R$ 1188536 275
Taxes on income R$ 1680219 389
Taxes on profit R$ 5008435 1159
Interest 10 return on investment of shareholders R$ 396300 092
TOTAL R$ 43231980 10000
23 Employment Opportunities and Worker Safety
Despite the considerable local knowledge of the regionrsquos ecosystems and environments
technology is lacking related to the value added to products and environmental conservation
projects Besides these difficulties public service agents frequently indicate the use of techniques
and management practices that require high external inputs and major investments To overcome
these limitations the project intends to promote specific and culturally relevant trainings that include
workshops meetings courses and extended technical assistance to improve the knowledge and
skills of community leaders residents and employees of the project To complement such
trainings we intend to install diversified agroforestry systems to restore and reuse degraded
areas to encourage handicrafts and tourism and to improving the management of non-timber
forest products with emphasis on Brazil nuts andiroba copaiba and Acai As a result
management practices are expected to improve in the long-term as well as and the fostering of
local culture combining technical and scientific knowledge with traditional knowledge
24 Stakeholders (G3)
Consultation prior to the beginning of the project
The populations involved in the carbon project are direct users of forest resources that are present
in the Amazon Rio I II III amp IV areas for the practice of plant and animal extraction Initially they
were indicated by the Council of Agro-Extrativist Associations of Democracia (Conselho das
Associaccedilotildees Agroextrativistas de Democracia - CAAD) which gathers associations of residents
from ten communities located near the Amazon Rio I Reserve Following this indication the EBCF
hired the services of the consulting company CO2X Conservaccedilatildeo de Florestas Ltda to perform a
MONITORING amp IMPLEMENTATION REPORT VCS Version 3 CCB Standards Third Edition
v30 20
series of workshops and meetings to prepare the Amazon Rio I Management Plan (Annex 9) and
to develope the Amazon Rio REDD+ IFM project In these meetings different forms and spaces of
participation of the people and government and non-governmental institutions were discussed to
support the development and implementation of the Management Plan culminating in the creation
of an Advisory Council In these events conservation and fundraising strategies were presented to
the community among them the marketing of avoided emissions resulting from the suspension of
timber management activities The conduct of the Free Prior and Informed Consent (FPIC)
process was done in the communities surrounding the Amazon Rio I II III and IV areas during
three workshops in 2013 which had a very inclusive and participatory nature This document as
well as the minutes of the workshops participatory mapping Sustainability Matrix questionnaires
and presentations in PPT slides are available in Annex 104
Identification of stakeholders
There are 15 communities that will benefiot from the activities of the project and twelve of them
(Urucury Aacutegua Azul Vista Alegre Boa Esperanccedila Santa Eva Santa Maria Pandegal
Democracia Jatuarana Terra Preta do Ramal Kamayuaacute and Satildeo Joseacute do Miriti) are located in the
region surrounding Amazon Rio areas I and III and in the Rio Amapaacute Reserve on the Madeira
River and its tributaries One of the communities is formed by residents that integrate the
Agroextractivist Association Satildeo Joatildeo e Ponta Grossa which is located in the surroundings of the
Amazon Rio IV area Two communities Terra Preta do Rio Manicoreacute and Mocambo are located in
the region surrounding the Amazon Rio II on the bank of the Manicoreacute River(Figure 03)
Figure 04 - Location of the communities surrounding the Amazon Rio areas I II III and IV
4 This topic is thoroughly discussed in Section 37 of this document
MONITORING amp IMPLEMENTATION REPORT VCS Version 3 CCB Standards Third Edition
v30 21
Except for Terra Preta do Rio Manicoreacute Mocambo and Satildeo Joseacute do Miriti all of the communities
utilize the Rio Amapaacute RDS area either on a sporadic or seasonal basis to meet their food needs
(collecting various fruits fishing and hunting) for household and medicinal use (bark leaves and
plant parts considered by medical practices and traditional knowledge) and primarily for the sale of
various non-timber products especially the harvesting of Brazil nut accedilaiacute and copaiacuteba oil However
the trails roads and paths that provide access to the Amapaacute Rio RDS and Amazon Rio areas are
in a poor state of repair which hinders extraction practices especially the production of Brazil nuts
In addition to the 15 communities surrounding the Amazon Rio areas government organizations
directly involved with environmental issues in the region such as SDS the National Indian
Foundation (Fundaccedilatildeo Nacional do Iacutendio - FUNAI) City Hall and the City Council of Manicoreacute the
Secretary of Environment and Sustainable Development of Manicoreacute ICMBio and non-
governmental organizations such as FAS IEB CAAD CNS UFAM UEA were identified and
contacted to participate in the entire process of preparation of the Management Plan
Stakeholder meetings
To present and discuss the project in detail with representatives of 15 communities surrounding
the project area and support institutions three workshops in different locations were conducted
The subjects were presented in straightforward language in a culturally appropriate way so that
community representatives could understand relatively complex and unusual concepts such as
climate change greenhouse effect and payments for environmental services
The importance of forests for the mitigation and adaptation to climate change was emphasized to
convey the main objectives of the project to community representatives and in particular their role
in (i) absorbing carbon dioxide and release oxygen (ii) helping control climate processes on a
regional scale (iii) regulating the flow of rivers and erosion control and (iv) providing shelter and
food for most animals and plants on the planet The fact that 20 of global greenhouse gas
emissions come from the destruction of forests and in Brazil 70 of emissions come from
deforestation was also mentioned
During the workshops participants learned that steps can be taken to reduce the emissions of
greenhouse gases by investing in renewable energy sources such as solar energy wind energy
hydroelectric power plants electric cars and other more efficient ones Another option that
mitigates climate change was also highlighted that relates to the Amazon forest conservation and
the restoration of degraded areas through reforestation management of agricultural land and
establishment of agroforestry systems
MONITORING amp IMPLEMENTATION REPORT VCS Version 3 CCB Standards Third Edition
v30 22
After concepts were discussed it was explained to those present that the proposed project to be
carried out in the RPDS Amazon Rio I recently approved at the time and in the creation process
in the other Reserves has essentially one goal to financially reward those who preserve and
protect a forest threatened with deforestation and degradation the project aims (i) raise funds for
the implementation of the Management Plan programs and (ii) conserve forests and the associated
biodiversity It was also mentioned that the project is part of a new vision of the business strategy
since a logging plan was operational until 2010 associated with the emissions of greenhouse
gases In 2010 the practice was suspended by the owner who began investing in the creation of a
project focused on conservation and payment for environmental services with emphasis on the
voluntary carbon market
Implementation schedule
Table 2 - Implementation schedule and next activities
Ano Atividade
2010
EBCF performs the symbolic protocol creation of the first RPDs during the
seminar results and perspective of the State of Amazonas Conservation
Units held by the SDS
2011 EBCF submits the formal protocol to CEUC
2011 Meeting presentation EBCF for communities near the Amazon River I II III
and IV
2011
EBCF attended the informal invitation made by the management of RDS
Rio Amapaacute and representative CEUC - Silvia Elena the training workshop
and delivery portfolios ENVIRONMENTAL VOLUNTEERS AGENTS held in
the Boa Esperanccedila community
2011
EBCF participated in the event organized by the CAAD which had the
agenda General Assembly accountability of CAAD year 20092010 RDS
Management Plan Amapaacute Rio Bolsa Floresta Municipal Management
IDAM contribution contribution Covema IEBs contribution and delivery of
equipment for processing of acai held on 24032011 in the community of
MONITORING amp IMPLEMENTATION REPORT VCS Version 3 CCB Standards Third Edition
v30 23
Democracy and 25032011 in the Boa esperanccedila Community
2011 Inspection of CEUC on farms for approval on RPDs
2011 The board of EBCF makes his 1st visit the communities and farms
2011
EBCF in partnership with the Municipal Government of Manipur perform
the recovery local road (approximately 20KM) linking Democracia
community Jatuarana communities Terra Preta Community Santa Eva
and Vista Alegre
2012
Visit of the president and directors of EBCF the communities surrounding
the reserves together with the president of PATAC Marcelo Marder and
Andre Albuquerque president for socioeconomic communities report
presentation
2012 Business Plan Project approval and EBCF shareholders agreement
authorizing the start of the REDD project
2013 Workshop I - Diagnosis for the development of areas of the Amazon River
Management Plan I II III amp IV
2013 Visit communities to complement the workshop I for interviews with the
locals
2013 Meeting in CEUC after the second workshop to update the work with the
communities and the progress of the approval of the areas
2013
Technical meeting with the team CO2X Renascer and Human
Development EBCF in Curitiba for the review and evaluation of the first part
of the Management Plan (diagnosis) Definition of programs and
subprograms of the Plan identification of key issues potential threats and
opportunities with the creation of RPDSs definition of vision and action
strategy
MONITORING amp IMPLEMENTATION REPORT VCS Version 3 CCB Standards Third Edition
v30 24
2013
The Secretary of State for the Environment (SDS) officiated at the World
Environment Day the first Private Reserve Sustainable Development
(RPDs) of the Amazon with the signing of the decree no 86
2013 Workshop II - presentation of the carbon project as one of the fundraising
programs for the implementation of the Management Plan
2013 Field work with communities and farms for mapping biodiversity and
hunting and fishing grounds
2013 The EBCF performs a complete socioeconomic census in the surrounding
communities of RPDs
2013 Meeting with CEUC for delivery and presentation of the draft of RPDs
Amazon River Management Plan I
2013
Supplementary Meeting to communities who could not attend the
Workshop II amp III Workshop Creation of the Advisory Council for RPDs
Amazon River I
2013 The EBCF performs social and economic Census in Kamayuaacute community
2015 Realization of field activities for Biomass Inventory Estimation
2016 Vitor Belfort visit and launch of income-generating initiatives
2016 Distribution of medical kits for community health workers and launching the
Health Program in the Amazon
2016 Deforestation Report
2016 PD Review and preparation of the monitoring report
MONITORING amp IMPLEMENTATION REPORT VCS Version 3 CCB Standards Third Edition
v30 25
2016 REDD + Project Certification (VCS and CCV)
2016 Project planning for structuring the supply chain of vegetable oils
certificates
2017 Fundraising from the REDD project
2017 Ecotourism Project Design
2017 Workshop Achievement Participatory Planning Project REDD + activity
EBCF
2017 ProBUC Deployment
2018 Implementation of Voluntary Environmental Agent program
25 Respect for Rights and no Involuntary Relocation
In the three workshops explaining the Carbon project to 15 communities the eight REDD+
principles and the social and environmental safeguards were presented Those safeguards were
previously established in a series of meetings throughout the Amazon between 2009 and 2010
and included several Civil Society Organizations
It was emphasized in the workshops that compliance with these principles and safeguards under
REDD+ projects such as the Amazon Rio carbon project contributes to improving local
governance transparency of information public participation in decision-making coordination of
actions among different actors and respect and recognition of the rights of indigenous peoples and
traditional populations
Free Prior and Informed Consent (FPIC)
During the project workshops the concept of Free Prior and Informed Consent was presented to
the participants as well as the importance of social and environmental safeguards to ensure the
rights of communities in designing and developing the REDD+ project explained in the eight
principles The participants were asked whether they were in agreement and if there were other
MONITORING amp IMPLEMENTATION REPORT VCS Version 3 CCB Standards Third Edition
v30 26
principles or rights that should be included Some community individuals expressed their
agreement to the safeguards All participants at the three workshops raised their hands in support
of REDD+ project The consent was unanimous
A separate document describing the whole process of the Free Prior and Informed Consent has
been prepared and is available in Annex 10
Figure 05 - Workshop I Free Prior and Informed Consent for the development of the REDD+
project by the community leaders of Democracia Aacutegua Azul Satildeo Joseacute do Miriti Vista Alegre
Jatuarana Terra Preta do Ramal Pandegal Santa Maria Santa Eva and Terra Preta do Rio
Mancoreacute
Figure 06 - Workshop II Free Prior and Informed Consent for the development of the REDD+
project by the community leaders of Urucury Mocambo Boa Esperanccedila and Satildeo Joatildeo amp Ponta
Grossa
MONITORING amp IMPLEMENTATION REPORT VCS Version 3 CCB Standards Third Edition
v30 27
Figure 07 - Workshop III Free Prior and Informed Consent for the development of the REDD+
project by the Kamayuaacute indigenous community
3 APPLICATION OF METHODOLOGY
31 Title and Reference of Methodology
VCS VM0011 Methodology for Improved Forest Management ndash Logged to Protected Forest
(LtPF) Calculating the GHG Benefits from Preventing Planned Degradation version 10
MONITORING amp IMPLEMENTATION REPORT VCS Version 3 CCB Standards Third Edition
v30 28
32 Methodology Deviations
Whereas the VM0011 was developed in a context of homogeneous forests of temperate regions
some methodological adjustments were made related to the direct survey biomass in the field
since the project areas are comprised of very heterogeneous areas of rainforest including dryland
and floodplains Any technical documentation related to these methodological adjustments and
their justifications appear in Annex 23 (Forest Inventory 2016) prepared by the consulting firm
HDOM
33 Project Boundary5
The total area of the property is 20387 ha and a buffer zone was established around each of the
four areas in order to include communities that use the resources within their boundaries (Figure
7a) Project activity areas (for purposes of calculating the emissions reductions called the project
area or PA) are only those for which logging is permitted a total of 19800 ha (Figure 7b)
excluding the Permanent Preservation Areas (APPs) and bodies of water A logging plan has been
approved for this area for selective logging (Annexes 1 2 3 4 6 and 7)
Figure 08 - Project Boundaries a) Direct Project interference limits b) Total Project Area (G1
Indicator 7)
5 Ref section 22 of VM0011
MONITORING amp IMPLEMENTATION REPORT VCS Version 3 CCB Standards Third Edition
v30 29
Stratification of the project area
For purposes of inventorying local carbon stocks and project management the project area was
stratified into 3 groups of different forest types as indicated by the VM0011 according to the
vegetation map SIPAMRADAM (DPI 2002) The forest types present in the area are rain forest
types divided into 3 categories as follows
Dense Primary Tropical Ombrophylous Alluvial Forest
Dense Primary Tropical Ombrophylous Lowland Forest
Pioneer Formations
Figure 09 - Project Area forest types
Leakage areas
There is no direct leakage resulting from planned project activities since there will be neither
displacement of management activities to other areas after the cessation of the activities within the
project area nor market leakages The project Management Plan includes the monitoring of
MONITORING amp IMPLEMENTATION REPORT VCS Version 3 CCB Standards Third Edition
v30 30
possible unanticipated leakages around the project area as well as the need to report to the
competent authorities whenever logging activities are identified in these areas For more
information on leakage see chapters 52 and 55 of this document
Temporal boundaries
Crediting period of the project
The first crediting period of the project is 37 years beginning on August 17 2012 and ending on 17
August 2049 This period is equivalent to the remaining 12 years of the first authorized
management plan (25 years from 1998) added to another 25 years in respect of a new forest
management plan that was intended as the common practice of forestry in Brazil The logging
activities could continue beyond 37 years aiming for a second crediting period
Monitoring and Reporting Period
a) Monitoring of Baseline Emissions
The monitoring of Baseline Emissions must demonstrate that the protected forest area is in
accordance with the one specified in the PD The project limit will be monitored before each
verification throughout the crediting period through new inventory information and remote sensing
and GIS as applicable Thus the project will be able to update the baseline calculations based on
the actual remaining forest area (in case of loss of forest cover by disasters for example) and that
would be subject to forest management under a ldquowithout projectrdquo scenario
b) Monitoring of Project Emissions
Project emissions will be monitored annually and compiled in every monitoring report that will detail
in particular the
Monitoring of possible illegal harvesting of timber
Monitoring of areas subject to natural disturbances
Monitoring and quantification of emissions related to air and land travel related to project
activities
c) Monitoring of Leakage
Since there will be no leakages according to the VM0011 and AFOLU Requirements no leakage
monitoring will be necessary However to be conservative the project intends to monitor any
disturbances that might affect the carbon reservoirs Once some disturbance is registered the
project will report the incident to the relevant authorities and make the necessary adjustments to
MONITORING amp IMPLEMENTATION REPORT VCS Version 3 CCB Standards Third Edition
v30 31
the baseline For more details about the monitoring of leakages see chapters 52 and 55 of this
document
Carbon stocks
The biomass reservoirs considered by the project are related to above-ground and underground
biomass
Sources and sinks of GHGs
Table 02 below describes the emission sources and sinks of greenhouse gases associated with
the baseline activities and with the project
Table 03 - Greenhouse gas emissions sources and sinks associated with baseline and project
activities
Source Gas Included JustificationExplanation
Baselin
e
Biomass
CO2 Yes Main source of project emissions through forest
degradation harvested and commercialised
wood products deadwood and forest regrowth
CH4 No Conservatively excluded
N2O No Conservatively excluded
Other No -
Fossil Fuel
consumption
CO2 Yes Main source through fossil fuel use in
machinery and transportation of timber
CH4 Yes Conservatively included
N2O Yes Conservatively included
Other No -
Electricity
consumption
CO2 Yes Main source
CH4 No -
N2O No -
Other No -
Pro
ject
Biomass
CO2 Yes Main source through unexpected natural
disturbances such as forest fires etc
CH4 Yes Included but subject to significance
N2O Yes Included but subject to significance
MONITORING amp IMPLEMENTATION REPORT VCS Version 3 CCB Standards Third Edition
v30 32
Source Gas Included JustificationExplanation
Other No _
Fossil Fuel
consumption
CO2 Yes Main source through flights and ground travel
CH4 Yes Included but subject to significance
N2O Yes Included but subject to significance
Other No _
Electricity
consumption
CO2 Yes Main source
CH4 No _
N2O No _
Other No _
34 Baseline Scenario
The choice between alternative baseline scenarios was taken together with the analysis of
additionality using the latest version of the VCS Tool for the demonstration and assessment of
additionality in Agriculture Forestry and Other Land Use VCS projects in this case VT000167
(VCS 2012a) All possible scenarios as well as the analysis of methodology barriers (steps 211
and 212 of the VM0011) are present in the chapter below In this sense to avoid redundancy of
information refer to additionality analysis to find the steps 211 and 212 of the VM0011
The baseline scenario for the project identified as the most likely to occur was selective logging8
(continuation of Business As Usual - BAU) The reference scenario assumes 37 years of selective
logging according to the 25 year logging plan approved in August 1998 (Annex 6 - document
ValdII T01 POA 1998) that in the absence of project activities would be renewed in 2024 for
another 25 years until 2049
Under this scenario the full implementation of the timber logging plan occurs and which has
already resulted in the degradation of 434769 ha (see table below) The area would be harvested
selectively for timber sold in lumber markets Below is a summary of harvest areas between 1999
and 2010 showing the managed plots and the dates on which the harvests were authorized
6 Tool for the demonstration and assessment of an additional to the VCS project activities in Agriculture Forestry and Other
Uses (AFOLU) (V 30)
7 Adapted from ldquoTool for the Demonstration and Assessment of Additionality in AR CDM project Activitiesrdquo (V02) 8 Additional information about choosing the baseline are presented in section 46 (steps 1 and 2)
MONITORING amp IMPLEMENTATION REPORT VCS Version 3 CCB Standards Third Edition
v30 33
Table 04 - Summary of areas managed since 1999
Date Managed logged area (ha)
1999 58669 (Plot 1)
2000 688 (Plot 2)
2001 ndash 2002 8315 (Plot 3)
2003 ndash 2004 750 (Plots 3 and 4)
2005 ndash 2007 1082 (Plot 5)
2008 ndash 2009 49050 (Plots 5 and 6)
TOTAL 434769
35 Additionality
The additionality analysis of the Amazon Rio project REDD+ IFM was conducted with the latest
version of the VCS Tool for the demonstration and assessment of additionality in Agriculture
Forestry and Other Land Use VCS projects the VT000167
(VCS 2012a)
To generate the reductions in GHG emissions for the project the planned baseline activities
(sustainable forest management) were terminated by the project proponent and supplanted by
environmental conservation activities In this sense the project will be managed by EBCF with
the goal of creating a fund for administrative and accounting management especially to promote
environmental management and monitoring activities of carbon pools within the project area
Alternative activities planned in the project are the provisioning and valuation of environmental
services via carbon credits (VCUs) in conjunction with the sale of Environmental Reserve Quotas
(CRAs)
4 MONITORING AND PARAMETERS OF DATA
41 Monitoring Plan Description
Due to its innovative comprehensive and integrative character the project needs to be monitored
regularly so that its actions activities and impacts can be constantly measured and evaluated To
meet this requirement the monitoring process must meet three main objectives
MONITORING amp IMPLEMENTATION REPORT VCS Version 3 CCB Standards Third Edition
v30 34
i To serve as an internal management project tool
ii To collaborate as an instrument of collective learning from the communities and
social groups directly involved
iii To work as a means of communicating results and impacts to interested institutions
and society in general Furthermore it is important to consider that monitoring if
successful will transcend the managerial aspects of the project and strengthening
the plan
To facilitate the monitoring process instead of having a reference line (to compare interventions
before and after) the first year of monitoring will serve as the starting point whose information will
be regularly and systematically compared throughout the project
Next the initial plans for monitoring benefits to the climate community and biodiversity are
described wherein the community is committed to participatory precept and to the technical and
scientific rigor which is capable of following the possible negative and positive impacts on
environmental and social aspects in the project area and its surroundings
Monitoring of Climate Impacts
The Monitoring Plan (MP) aims to provide security in the periodic estimates of reduction in
emissions especially in monitoring changes in carbon stock Therefore emissions from the
implementation of the project ex post estimates of the activities and emissions from any leakages
and isolated disturbances (eg blowdown fires pests and diseases among others) can be
calculated
The construction of the PM of the climate benefits made in full compliance with the methodological
framework provided by VM0011 ndash IFM LPF (VCS 2011) and CCBA (2008) which consists of four
specific actions to be monitored
i Implementation and execution of the project
ii Dynamics and stock of the forest biomass
iii Deforestation and forest degradation
iv Periodic reviews of ex post emissions
Remote monitoring and surveillance of the project area
Measurement of alterations and biomass loss quantification present in the PA using land use
change detection is critical to make accurate estimates of GHG emissions that account for forest
biomass increases and losses
MONITORING amp IMPLEMENTATION REPORT VCS Version 3 CCB Standards Third Edition
v30 35
Thus the use of remote sensing by satellite images of medium spatial resolution can be applied
readily in the PA and surroundings in order to monitor land use dynamics over time particularly to
identify risks and threats to forested areas In situ verification will complement landscape analysis
in a GIS environment with the aim of quantifying spatializing and identifying conversion of forest
areas into other land uses environmental degradation and other possible changes that may occur
during the term of the project
As a complementary monitoring source the project will rely on the database and information
provided by Monitoring Program of the Brazilian Amazon Forest by Satellite 910
(Prodes Digital)
conducted by the National Institute for Space Research (Instituto Nacional de Pesquisas Espaciais
- INPE) according to the Plan for Prevention and Control of Deforestation in the Amazon
1112(PPCDAm) under the National Policy on Prevention and Control of Deforestation Such
information is available online in13
digital vector files for the public in general
Other tools will provide complementary information to the monitoring such as indicators of forest
degradation and hotspots (fires and wildfires) obtained from DETER 14
SAD 15
and PROARCO16
Information is available online for free in vector format These results will be systematically related
to field data for validating or disproving the occurred event so that the focuses of deforestation and
degradation can be identified remediated reported and consequently avoided as much as
possible
A surveillance system that allows permanent territorial monitoring and inhibits the entry of intruders
through entry points in the PA will also be deployed to control the transport flow In addition one
must investigate and identify risks and threats eg mapping hotspots and areas vulnerable to fire
to illegal logging to hunting and poaching and to invasions by third parties among others
At first we estimate an effective demand for structuring the electronic monitoring system which
includes the hiring of skilled professionals field equipment electronic equipment (digital cameras
GPS desktops and notebooks smartphones printers geoprocessing software and GIS among
others) vehicles andor motorcycles motorized boats for transportation and moving around and
the collection of high resolution satellite images Empowerment and training of all involved staff
9httpwwwobtinpebrprodesdigitalmetodologiahtml
10httpwwwobtinpebrprodesmetodologiapdf 11httpwwwmmagovbrflorestascontrole-e-prevenC3A7C3A3o-do-desmatamento 12httpwwwmmagovbrimagesarquivo80120PPCDAm_FINAL_PPCDAMPDF 13httpwwwobtinpebrprodesindexhtml 14httpwwwobtinpebrdeterdados 15httpwwwimazongeoorgbrdocdownloadsphp 16httpwwwdpiinpebrproarcobdqueimadas
MONITORING amp IMPLEMENTATION REPORT VCS Version 3 CCB Standards Third Edition
v30 36
and the surrounding communities will be necessary to make the system effective17
and a constant
stream of information directed to regional actors and other stakeholders
Strategic monitoring and access points to RPDS roads will also provide support to other MPs
including social and biodiversity conservation aspects especially in the logistic support of planned
field activities
Procedures for determining the permanent sample plots (PSPs) and measurement
The calculation of the stock and increase in forest biomass will be subsidized through the
installation of PSPs in the PA and its temporal monitoring through the Continuous Forest Inventory
(CFI) The methodology proposed by VCS (2011) suggests the use of permanent andor temporary
plots however it confirms the efficiency and accuracy of sample plots
In order to demonstrate the procedural and statistical rigor used all the sampling procedures the
PA forest stratification sampling design calculation of sampling intensity and other parameters
measured in PSPs to monitor biomass balance due to ingressmortality of individuals growth in
DBH and height will be presented in detail in the Annex (Annex 23 - Forest Inventory 2016)
To promote reliable forest biomass estimates standard operating procedures (SOPs) (Section 82)
will be used by the team executing the CFI
Monitoring frequency
The monitoring frequency parameters measured in the PSPs will be no greater than 5 years from
the first measurement Other relevant parameters to monitoring the PSPs like the change in land
use in the PA and surrounding areas such as deforestation forest degradation fire sources and
natural disturbances will be regularly monitored as a project routine operation organized and
archived annually
411 Monitoring Impacts to Biodiversity
Since animal inventories have not been conducted in Amazon Rio project areas (for this project
biological information for the Rio Amapaacute RDS management plan were used) a biodiversity
monitoring system that will follow the RAPELD methodology (Rapid surveys of various taxonomic
groups (RAP) for long-term ecological studies) (MAGNUSSON et al 2005)
The RAPELD method contributes to long-term research using rapid inventory assessments biotic
complementarity and land use planning in the Amazon This method increases adequate sampling
17Linking community monitoring to national Measurement Reporting and Verification for REDD+
MONITORING amp IMPLEMENTATION REPORT VCS Version 3 CCB Standards Third Edition
v30 37
probability of biologically diverse communities which require large areas and at the same time
minimize variation of abiotic factors that affect these communities with smaller areas sampling
Evaluation and selection of indicators will be conducted in accordance with the ProBUC model
however applicably to local reality results will be updated biennially from the first survey
Biodiversity indicators are being designed and planned as suggested in the Social and
Environmental Monitoring System of Protected Areas in the Brazilian Amazon (Sistema de
Monitoramento Socioambiental das Unidades de Conservaccedilatildeo da Amazocircnia Brasileira)1819
and
Methodology for Rapid Assessment and Prioritization of Protected Areas Management20
(Metodologia para Avaliaccedilatildeo Raacutepida e Priorizaccedilatildeo do Manejo de Unidades de Conservaccedilatildeo -
RAPPAM) in line with the experiences gained and disseminated by CEUC and ICMBIO previously
described
The empowerment accountability and shared management of biodiversity conservation is the
main focus of the methodological model adopted These actions create high expectations for
environmental management of the area as the biodiversity monitoring will be conducted by the
community members themselves along with the project proponent promoting a local multiplier
effect It is worth mentioning that strict compliance with these procedures is in within EBCF`s
interest since it considers them to be key to the success of the project
The project begins with the premise that any negative impact on biodiversity in the project area
and its surroundings will not occur In the opposite sense the project aims to generate and provide
greater understanding of the territory subsidizing proposals for the conservation and sustainable
use through adoption of good management practices of natural resources as well as its replication
in other locations
412 Monitoring Social Impacts
The monitoring of social aspects include both the collection of numerical data such as quantity
volume weight (quantitative indicators) as well as information expressing opinions and
experiences (qualitative indicators) remembering that such measures are compatible and
interchangeable Data collection should be systematic and have a pre-established rate and most
likely a single indicator will require several data collection instruments such as plans field records
reports etc
Social information will be monitored through the use of participatory methodologies In this sense
the preparation process of the Amazon Rio I RPDS Management Plan was a first step For the
18Indicator Design 19Social and Environmental Monitoring of Protected Areas System in the Brazilian Amazon (Sistema de Monitoramento
Socioambiental das Unidades de Conservaccedilatildeo da Amazocircnia Brasileira) 20Metodologia para Avaliaccedilatildeo Raacutepida e a Priorizaccedilatildeo do Manejo de Unidades de Conservaccedilatildeo (RAPPAM)
MONITORING amp IMPLEMENTATION REPORT VCS Version 3 CCB Standards Third Edition
v30 38
socioeconomic characteristics of communities several community meetings land use mapping
workshops and interviews with focus groups were held in addition to field visits (Annex 10) The
main activities of the project were presented and discussed in these events emphasizing the
importance and timeliness of local valuation of environmental services as well as strategies for
raising funds to implement other projects and improvements in social well-being of communities
around the PA
5 MEASUREMENT OF GHG EMISSIONS REDUCTIONS AND REMOVALS (CLIMATE)
51 Emissions Baseline
EBCF did not carry out any wood related exploration activity in the areas since the beginning of
the REDD+ project Thus it is confirmed estimated emission reductions for the project as
8678833 t CO2eq t year
52 Project emissions
Project emissions were primarily those related to the running of offices and necessary travels for
studies meetings presentations workshops and other activities Table 10 presents a summary of
emissions based on data from Annex 21 of this report
Table 05 - 2011-2016 Project Activity Emissions
YEAR Energy
(KWh)
Energy
(t CO2eq)
Travels
(Km)
Travels
(t CO2eq)
Total
(t CO2eq)
2010
678 024 024
2011
104010 2360 2360
2012 1149 008 55724 1573 1581
2013 2756 028 236749 5429 5457
2014 2498 025 15789 459 484
2015 2231 023 27340 597 620
2016 1015 010
010
093 440290 10443 10536
53 Leakage
Not applicable according to presentation made on the REDD+ IFM document
MONITORING amp IMPLEMENTATION REPORT VCS Version 3 CCB Standards Third Edition
v30 39
54 Summary of GHG Emission Reductions And Removals
EBCF REDD+ project shows emissions reduction of 34397563 tCO2e as the balance in the
period of 2011-2015 Table 06 shows the overview of the dynamics of reductions and project
emissions up to 2048 By the year 2015 the emissions data is posted as seen in reports and from
2016 data are projects as previous average and should be adjusted as a result of future reports
Table 06 - Summary of ex ante estimates
Year
Estimated
reductions
from
baseline21
(tCO2e)
Project
Estimated
emissions 22
tCO2e)
Unplanned
estimate
Emissions23
(tCO2e)
Net GHG
Estimated
emissions
Reduction
(tCO2e)
2012 8675500 1581 0 8673919
2013 8675500 5457 0 8670043
2014 8675500 484 296296 8378720
2015 8675500 620 0 8674880
2016 8675500 2100 0 8673400
2017 8675500 2100 0 8673400
2018 8675500 2100 0 8673400
2019 8675500 2100 0 8673400
2020 8675500 2100 0 8673400
2030 8675500 2100 0 8673400
2048 8675500 2100 0 8673400
Total 3123180 25203 296296 3119989
55 Climate Change Adaptation Benefits (GL1)
There is a relatively widespread understanding in the scientific community that balanced
ecosystems have greater ecological and social resilience and adaptability to climate change
21
See annex 18 22
See annex 21 23
See annex 24- HDOM (Study on deforestation and heat spots for EBCF REDD+ Project technical report)
MONITORING amp IMPLEMENTATION REPORT VCS Version 3 CCB Standards Third Edition
v30 40
whether through protection of water bodies and regulation of river flows during peak flood and
drought or through the regular supply of environmental services products and services
Thus once the project is designed to conserve an area of native forest which in the absence of
the project scenario would remain subject to the pressure of timber management (baseline) and
consequent degradation resulting from such activities it is understood that the mere protection of
these areas alone would offer communities and the ecosystem itself better adaptability compared
to the baseline scenario
Moreover the project has an Activity Management Plan (Annex 9) which details among other
initiatives the promotion of the sustainable use of ecosystem resources through direct support in
some activities related to income generation and conservation along with community training It is
believed that in addition to ensuring a more balanced (and therefore more resilient) environment
the project will expand the options for generating income among the communities making them
more resilient and preparing them to face the greater and already perceived challenges posed by
climate change
6 COMMUNITY
61 Positive Impacts for Communities (CM1)
EBCFrsquos REDD+ project was first presented to the riverine communities in 2011 By then
communities were informed about the cessation of all timber exploration activities due to the
REDD+ project and discussions were held regarding biodiversity conservation and the sustainable
use of forest products and services as well the social development of the surrounding
communities Briefly the positive impacts along the communities were
1 Project area zoning and its surroundings
2 Contribution to building local capacity
3 Contribution to developing sustainable business in the region
4 Contribution to social and environmental diagnosis
Knowing to manage
To evaluate the progress of these initiatives throughout the development of the project we used
the methodology of the Sustainability Matrix developed by the Secretariat of Environment and
MONITORING amp IMPLEMENTATION REPORT VCS Version 3 CCB Standards Third Edition
v30 41
Sustainable Development of Amazonas State This tool was applied in 15 communities taking into
account local socio-economic aspects that underlie the development of 20 parameters considered
of great importance to community development described by specific indicators As a visual tool
the Sustainability Matrix is quite suitable for traditional populations such as the riverside and
indigenous communities surrounding the Reserve Amazon River I and other areas of the Project
Additionally the Matrix provides interesting spaces for discussion since its construction is done
collectively Through the Sustainability Matrix it was possible to identify along with the
communities projects activities and implementation strategies Budgets and monitoring and
evaluation of these projects will be detailed later through the Annual Operational Plans to be
developed and followed up in the due course Four programs and nine subprograms were defined
for management and community development (Annex 9)
62 Negative Impacts (CM2)
No negative impacts have been recorded or identified as a result of the project with stakeholders
7 BIODIVERSITY
71 Positive Impacts for Biodiversity (B1)
The benefits for biodiversity are in reducing deforestation and degradation (selective logging) in the
project area According to satellite images analysis in the project areas and their surroundings it
was observed that until 2010 300 hectares were deforested After the implementation of the
project community awareness on the importance of preservation and conservation of forests have
encouraged no deforestation degradation and a significant reduction in deforestation was
identified (see graph below) This was due to the good understanding of the projects conservation
objectives and by the involvement and support of the surrounding communities
MONITORING amp IMPLEMENTATION REPORT VCS Version 3 CCB Standards Third Edition
v30 42
Figure 10 - EBCF REDD Project and buffer areas deforestation figures (source HDOM Report)
The consequences of deforestation and degradation on biodiversity are well known Thus the fact
of not being identified changes (natural or anthropogenic) in forest areas shows there was no loss
of biodiversity no reduction in floristic diversity no impact on the dynamics of fauna and flora and
no loss of evolutionary genetic information
72 Negative Impacts on Biodiversity (B2)
There are no negative impacts on biodiversity as a result of the project
73 Exceptional Benefits for Biodiversity (GL3)
The description of exceptional benefits for biodiversity will only be possible after the re-
measurement of permanent plots (FLORA)
8 ADICIONAL INFORMATION
All activities and the consequent reduction in deforestation and degradation in and around the
project areas were maintained and funded without resources of carbon credits We understand that
with the advance of REDD+ project EBCF will have much better conditions to implement positive
actions in partnership with communities
MONITORING amp IMPLEMENTATION REPORT VCS Version 3 CCB Standards Third Edition
v30 43
REFERENCES
ADEODATO S etal Madeira de ponta a ponta o caminho da floresta ateacute o consumo Satildeo Paulo
FGV-RAE 2011
ALBAGLI S Amazocircnia fronteira geopoliacutetica da biodiversidade Revista Parcerias Estrateacutegicas n
12 p6 set2001 Centro de Estudos Estrateacutegicos do Ministeacuterio da Ciecircncia e Tecnologia
AMARAL I C Viabilidade de plantio de cafeacute na zona da mata mineira Revista Poliacutetica Agriacutecola
Ano xx n4 outnovdez 2011 Disponiacutevel em
httpwwwalicecnptiaembrapabrbitstreamdoc9309031Viabilidadedeplantiopdf Acesso
em 17 de set 2013
AMARAL P etal Floresta para Sempre um manual para a produccedilatildeo de madeira na Amazocircnia
Beleacutem IMAZON 1998 130p
AMAZONAS Lei Complementar nordm 532007 de 05062007 REGULAMENTA o inciso V do artigo
230 e o sect 1ordm do artigo 231 da Constituiccedilatildeo Estadual institui o SISTEMA ESTADUAL DE
UNIDADES DE CONSERVACcedilAtildeO - SEUC dispondo sobre infraccedilotildees e penalidades e
estabelecendo outras providecircncias Disponiacutevel em
httpwwwcetesbspgovbruserfilesfilemudancasclimaticasproclimafilelegislacaoestadua
lamazonasleilei_complementar_n_53_2007_amazonaspdf Acessado em Setembro 2013
ANTAQ Anuaacuterio Estatiacutestico 2004 Distacircncia entre os portos Disponiacutevel em
httpwwwantaqgovbrportalanuariosportuario2004TabelasDistanciaEntrePortospdf
Acesso em 23 de out 2013
ANTAQ Panorama Aquaviaacuterio Agecircncia Nacional de Transportes Aquaviaacuterios Volume 3 Brasiacutelia
ndash DF 2009
MONITORING amp IMPLEMENTATION REPORT VCS Version 3 CCB Standards Third Edition
v30 44
AREDES A F PEREIRA M W G Anaacutelise econocircmica da produccedilatildeo de cafeacute araacutebica um estudo
de caso com simulaccedilotildees de Monte Carlo para sistemas de baixa e alta produtividade
Informaccedilotildees Econocircmicas SP v38 n4 abr 2008
ARIMA E UHL C Pecuaacuteria na Amazocircnia Oriental Desempenho Atual e Perspectivas Futuras Seacuterie
Amazocircnia n1 Beleacutem IMAZON 1996 40p
BACCINI A et al Estimated carbon dioxide emissions from tropical deforestation improved by
carbon-density maps Nature Climate Change vol2 march 2012 (LETTERS Published
Online - DOI 101038NCLIMATE1354)
BARROS A C UHL C Padrotildees problemas e potencial da extraccedilatildeo madeireira ao longo do Rio
Amazonas e do seu estuaacuterio Seacuterie Amazocircnia n4 Beleacutem IMAZON 1997 42p
BRASIL Lei 121872009 (Lei Ordinaacuteria) 29122009 Institui a Poliacutetica Nacional sobre Mudanccedila
do Clima - PNMC e daacute outras Providecircncias Presidecircncia da Repuacuteblica Casa Civil Subchefia
para Assuntos Juriacutedicos Disponiacutevel em lthttpswwwplanaltogovbrccivil_03_ato2007-
20102009leil12187htmgt Acesso em 20 de set 2013
CAMPOS E F Emissatildeo de CO2 da madeira serrada da Amazocircnia o caso da exploraccedilatildeo
convencional 2012 172p Dissertaccedilatildeo - Escola Politeacutecnica Universidade de Satildeo Paulo Satildeo
Paulo
CARDOSO RS e FREITAS C E C A pesca de pequena escala no rio Madeira pelos
desembarques ocorridos em Manicoreacute (Estado do Amazonas) Brasil Revista Acta
Amazocircnica vol 38(4) 2008 781 ndash 788
CCBA Climate Community and Biodiversity Alliance-CCBA 2008 Disponiacutevel em
httpwwwclimate-standardsorgccb-standards Acesso em 03 de set 2013
MONITORING amp IMPLEMENTATION REPORT VCS Version 3 CCB Standards Third Edition
v30 45
CEPEA Centro de Estudos Avanccedilados em Economia Aplicada - ESALQUSP Economia da
pecuaacuteria de corte na regiatildeo norte do Brasil Disponiacutevel em httpgooglL2roiA Acesso em
15 de out 2013
CHAMBERS J Q et al Decomposition and carbon cycling of dead trees in tropical forests of the
central Amazon Oecologia vol122 pp380-388 2000 Agricultores se queixam de
burocracia para contratar creacutedito sustentaacutevel do Programa ABC Correio Braziliense Brasiacutelia
26 fev 2012 Disponiacutevel em
lthttpwww2correiobraziliensecombrsersustentavelp=4592gt Acesso em 10 set 2013
CULLEN Jr L VALLADARES-PAacuteDUA C Onccedilas como detetives da paisagem Ciecircncia Hoje
Vol 156 n26 pp54-571999
CPRM - Serviccedilo Geoloacutegico do Brasil Disponiacutevel em httpwwwcprmgovbr Acesso em 13 de
mar 2013
DIAS F M MORAIS S J S REZENDE R C Anaacutelise da viabilidade econocircmica para a
produccedilatildeo de melancia e cenoura com financiamento em Anaacutepolis-GO 2008 Disponiacutevel em
httpwwwprpuegbr06v1conteudopesquisainiccieneventossic2008fronteiraflashsicani
macaoIIIJORNADAarquivosresumosresumo01pdfgt Acesso em 18 de nov2013
Divisatildeo de Precessamento de Imagens (DPI) Ambdata Mapa de Vegetaccedilatildeo SIPAM RADAM
2002 Disponiacutevel em httpwwwdpiinpebrAmbdatamapa_sipamphp Acesso em 21 de
out 2013
DOMINGUES MS BERNMANN C O arco de desflorestamento na Amazocircnia da pecuaacuteria agrave
soja Ambiente amp Sociedade Satildeo Paulo vol15 n2 pp1-22 maioago 2012
MONITORING amp IMPLEMENTATION REPORT VCS Version 3 CCB Standards Third Edition
v30 46
EBCF Criaccedilatildeo da primeira reserva particular de desenvolvimento sustentaacutevel do mundo na
floresta amazocircnica Disponiacutevel emlthttpwwwebcfcombrblog20130624criacao-da-
primeira-reserva-particular-de-desenvolvimento-sustentavel-do-mundo-na-floresta-
amazonicagt Acesso em 21 de set 2013
EMBRAPA Sistema Brasileiro de Classificaccedilatildeo de Solos 2ordf Ed Rio de Janeiro Embrapa Solos
2006 306 p
FELDPAUSCH T R et al When big trees fall Damage and carbon export by reduced impact
logging in southern Amazonia Forest Ecology and Management Vol 219 pp199-215 2005
FEARNSIDE P MDesmatamento na Amazocircnia dinacircmica impactos e controle Acta Amazocircnica
vol 36 n3 pp 395-400 2006
FILGUEIRAS T S et al 1994 Caminhamento Um meacutetodo expedito para levantamentos
floriacutesticos qualitativos Caderno de Geociecircncia IBGE vol12 pp39-43 1994
Forest Management Public Summary for Gethal Amazonas SA Induacutestria de Madeira
Compensada Certification Code SW-FMCOC-119 Date of Certification October 1
2000 Date of Public Summary October 2000 Updated for Annual Audit 2002 Annual Audit
2003 (Gethalpdf)
Globo Rural Linha de financiamento para a agricultura de baixo carbono tem pouca procura
2011 Disponiacutevel em httpwwwrainforest-allianceorgforestrydocumentsgethalpdf
Acesso em 16 de nov 2013
GREENPEACE Face a Face com a Destruiccedilatildeo Relatoacuterio Greenpeace sobre as companhias
multinacionais madeireiras na Amazocircnia Brasileira 1999 Disponiacutevel em
MONITORING amp IMPLEMENTATION REPORT VCS Version 3 CCB Standards Third Edition
v30 47
lthttpwwwgreenpeaceorgbramazoniaface_destruicaopdfgt Acesso em 11 de set
2013
Governo do Estado do Amazonas Plano de Gestao da RDS do Rio Amapaacute 2010 Disponiacutevel em
httpobservatoriowwforgbrsite_mediauploadgestaoplanoManejorio_amapapdf Acesso
em 24 de ago 2013
HDOM Estimates from processing the forest inventories data carried out during the CADAF
Project Final Technical Report 2012 Disponiacutevel em wwwhdomcombr Acesso em 27 de
maio 2013
HIGUCHI N 1986-87 Amostragem sistemaacutetica versus amostragem aleatoacuteria em floresta tropical
uacutemida de terra-firme na regiatildeo de Manaus Acta Amazonica 1617 (uacutenico) 393-400
HIGUCHI N SANTOS J JARDIM FCS Tamanho de parcela amostral para inventaacuterios
florestais Acta Amazocircnica vol12 n1 pp91-103 1982
HIGUCHI F G PINTO A C M ISHIZUKA M KAJIMOTO T LIMA A J N SANTOS J
HIGUCHI N Estoque e dinacircmica de biomassa acima do solo das florestas de terra firme do
estado do Amazonas In Adriano Joseacute Nogueira Lima Flaacutevia Machado Durgante Moacir
Alberto Assis Campos Joaquim dos Santos Moriyoshi Ishizuka Niro Higuchi (Org)
Dinacircmica do carbono das florestas da Amazocircnia resultados do Projeto CADAF
1edManaus INPA 2014 v 1 p 29-34
HOLMES T P etal Custos e benefiacutecios financeiros da exploraccedilatildeo de impacto reduzido em
comparaccedilatildeo agrave exploraccedilatildeo florestal convencional na Amazocircnia oriental 2ordf ed Beleacutem
Fundaccedilatildeo Floresta Tropical 2002 66p
HUSCH B MILLER C I BEERS T W Forest mensuration New York Ronald Press 1971
HUSCH B MILLER C I BEERS T W Forest Mensuration New York John Wiley amp Sons
2nd
ed 1972 402 p
MONITORING amp IMPLEMENTATION REPORT VCS Version 3 CCB Standards Third Edition
v30 48
IBGE Instituto Brasileiro de Geografia e Estatiacutestica Diretoria de GeociecircnciasCoordenaccedilatildeo de
Recursos Naturais e Estudos Ambientais Geologia Solos Hidrografia e Vegetaccedilatildeo 2000
IBGE Instituto Brasileiro de Geografia e Estatiacutestica Manicoreacute 2010 Disponiacutevel
emlthttpwwwsidraibgegovbrgt Acesso em 05 de set 2013
IBGE Instituto Brasileiro de Geografia e Estatiacutestica 2011 Disponiacutevel em httpwwwibgegovbr
Acesso em 19 de mar 2013
IBGE Instituto Brasileiro de Geografia e Estatiacutestica Extraccedilatildeo vegetal e silvicultura para o
municiacutepio de Manicoreacute 2011 Disponiacutevel em
lthttpcidadesibgegovbrxtrastemasphplang=ampcodmun=130270ampidtema=102ampsearch=a
mazonas|manicore|extracao-vegetal-e-silvicultura-2011gt Acesso em 10 de out 2013
IBGE Instituto Brasileiro de Geografia e Estatiacutestica Censo Demograacutefico 2010 Disponiacutevel em
lthttpcidadesibgegovbrxtrastemasphpcodmun=130270ampidtema=116gt Acesso em 18
de out 2013
IBGE Instituto Brasileiro de Geografia e Estatiacutestica Censo Demograacutefico 2010 Disponiacutevel
emlthttpcidadesibgegovbrxtrashomephpgt Acesso em 08 de out 2013
IDESAM Reduccedilotildees de Emissotildees do Desmatamento e Degradaccedilatildeo Florestal (REDD+) estudo de
oportunidades para a regiatildeo sul do Amazonas CENAMO M Cl CARRERO G C
GANDOLFO P (Org) Manaus 2011 Disponiacutevel em
lthttpwwwobservatoriodoreddorgbrsitepdfestudodeoportunidadespdfgt Acesso em 13 de
set 2013
MONITORING amp IMPLEMENTATION REPORT VCS Version 3 CCB Standards Third Edition
v30 49
IDESAM Semeando Sustentabilidade em Apuiacute ndash Resultados e Perspectivas 2011 Manaus
Disponivel em lthttpidesamorgbrsemeando-sustentabilidade-em-apui-resultados-e-
perspectivasUxX8nfldWYI
IEA Instituto de Economia Aplicada CO2 Emissions from fuel combustion 2012 Disponiacutevel em
httpwwwieaorgco2highlightsco2highlightspdf Acesso em 09 de out 2013
IGREJA H L S CATIQUE J Anaacutelise neotectocircnica do lineamento de Itacoatiara centro leste do
Estado do Amazonas In Simpoacutesio Nacional de Estudos Tectocircnicos 6 1997 Pirenoacutepolis
Anais Pirenoacutepolis-GO SBG-Nuacutecleo Brasiacutelia1997
IMAZON Instituto do Homem e do Meio Ambiente da Amazocircnia Fatos Florestais 2010a
Disponiacutevel em httpwwwimazonorgbrpublicacoeslivrosfatos-florestais-da-amazonia-
2010-1 Acesso em 14 de out 2013
IMAZOM Instituto do Homem e do Meio Ambiente da Amazocircnia Mercado e preccedilo da madeira
amazocircnica 2010 Disponiacutevel em httpwwwimazonorgbrpublicacoesprecos-de-madeira-
em-toraboletim-de-precos-de-madeira-em-tora-na-amazonia-julho-2010at_downloadfile
Acesso em 23 de nov 2013
IMAZON Instituto do Homem e do Meio Ambiente da Amazocircnia Portal de Geoinformaccedilatildeo sobre
a Amazocircnia Disponiacutevel em lthttpwwwimazongeoorgbrimazongeophpgt Acesso em 06
de set 2013
IMAZON Instituto do Homem e do Meio Ambiente da Amazocircnia Transparecircncia florestal
Amazocircnia Legal 2012 Disponiacutevel em lthttpwwwimazonorgbrpublicacoestransparencia-
florestaltransparencia-florestal-amazonia-legalcopy_of_SADOutubro2012pdfgt Acesso em
23 de set 2013
IMAZON Instituto do Homem e do Meio Ambiente da Amazocircnia PEREIRA D SANTOS D
VEDOVETO M GIMARAtildeES J VERIacuteSSIMO A (Orgs) Fatos Florestais da Amazocircnia
Beleacutem IMAZON 2010 244p Disponiacutevel em
MONITORING amp IMPLEMENTATION REPORT VCS Version 3 CCB Standards Third Edition
v30 50
lthttpwwwimazonorgbrpublicacoeslivrosfatos-florestais-da-amazonia-2010-1gt Acesso
em 24 de set 2013
IMAZON Instituto do Homem e do Meio Ambiente da Amazocircnia A Expansatildeo madeireira na
Amazocircnia Impactos e perspectivas para o desenvolvimento sustentaacutevel no Paraacute BARROS
AC VERIacuteSSIMO A (Eds) Beleacutem IMAZON 2002
IMAZON Instituto do Homem e do Meio Ambiente da Amazocircnia Custos e Benefiacutecios do Manejo
Florestal Para Produccedilatildeo de Madeira na Amazocircnia Oriental 1998 Disponiacutevel em
lthttpwwwimazonorgbrpublicacoesserie-amazoniacustos-e-beneficios-do-manejo-
florestal-para-producao-de-madeira-na-amazonia-orientalgt Acesso em 20 de set 2013
INPE Instituto de Pesquisas Espaciais Banco de dados PRODES 2012 Disponiacutevel em
lthttpwwwdpiinpebrprodesdigitalprodesphpgt Acesso em 09 de set 2013
INPE Instituto de Pesquisas Espaciais Banco de dados DEGRAD 2009 Disponiacutevel em
lthttpwwwobtinpebrdegradgt Acesso em 09 de set 2013
INPE Instituto de Pesquisas Espaciais Banco de dados DETER 2013 Disponiacutevel em
lthttpwwwobtinpebrdetergt Acesso em 10 de set 2013
INPE Instituto de Pesquisas Espaciais Banco de dados de queimadas e focos de calor
BDQUEIMADAS 2013 Disponiacutevel em lthttpwwwdpiinpebrproarcobdqueimadasgt
Acesso em 10 de set 2013
Instituto Carbono Brasil Soacute 2 da produccedilatildeo de madeira eacute certificada O Estado de SPaulo 2006
Disponiacutevel em lthttpwwwinstitutocarbonobrasilorgbrnoticias6noticia=119796gt Acesso
em 26 de set 2013
MONITORING amp IMPLEMENTATION REPORT VCS Version 3 CCB Standards Third Edition
v30 51
IFT Instituto Floresta Tropical Diagnoacutestico do Setor Florestal de Cotriguaccedilu Estado do Mato
Grosso 2010 Disponiacutevel em lthttpgooglEVx2RZgt Acesso em 16 de dez 2013
IPCC Guidelines for National Greenhouse Gas Inventories In National Greenhouse Gas
Inventories Programme EGGLESTON HS BUENDIA L MIWA K NGARA T TANABE
K (Eds) Japan IGES 2006
ITTO Annual review and assessment of the world timber situation 2011 Disponivel em
httpwwwittointannual_review Acesso em 10 de out 2013
KELLER M et al Coarse woody debris in undisturbed and logged forests in the eastern Brazilian
Amazon Global Change Biology vol10 PP784-795 2004
LENTINI M VERISSIMO A PEREIRA D A expansatildeo madeireira na Amazocircnia O Estado da
Amazocircnia n2 2005 Beleacutem IMAZON Disponiacutevel em
httpwwwimazonorgbruploadea_2ppdf Acesso em 06 de set 2013
LOETSCH F ZOumlHRER F HALLER K E Forest Inventory Munich BLV Verlagsgesellschaft
2nd
edition Vol II 1973 469 p
MAGNUSSON WE et al RAPELD uma modificaccedilatildeo do meacutetodo de Gentry para inventaacuterios de
biodiversidade em siacutetios para pesquisa ecoloacutegica de longa duraccedilatildeo Biota Neotrop JulDez
2005 vol 5 no 2 httpwwwbiotaneotropicaorgbrv5n2ptabstractpoint-of-
view+bn01005022005 ISSN 1676-0603
MARINELLI C E et al O programa de monitoramento da biodiversidade da biodiversidade e do
uso de recursos naturais em unidades de conservaccedilatildeo estaduais do Amazonas Secretaria
de Estado do Meio Ambiente e Desenvolvimento Sustentaacutevel - SDS Manaus SDS 2007
MONITORING amp IMPLEMENTATION REPORT VCS Version 3 CCB Standards Third Edition
v30 52
MARINELLI C E MALTEZ M H Indicadores de Sustentabilidade para Unidades de
Conservaccedilatildeo Documento-Siacutentese Workshop Instituto Socioambiental Brasiacutelia-DF 2010
76p
MAZZEI L et al Above-ground biomass dynamics after reduced-impact logging in the Eastern
Amazon Forest Ecology and Management vol 259 pp367-373 2010
MEIRELLES FILHO O Livro de Ouro da Amazocircnia 5ordf Ediccedilatildeo Rio de Janeiro EDIOURO 2007
422p Meirelles Filho J O Livro de Ouro da Amazocircnia 1ordf ed Editora Ediouro ISBN
8500021616 2007 450p
MENGER Juliana da Silva Fatores determinantes da distribuiccedilatildeo de aves no interfluacutevio Purus-
Madeira Manaus [sn] 2011 35 fl il
MCT Arquivos dos Fatores de Emissatildeo Disponiacutevel em
httpwwwmctgovbrindexphpcontentview321144htmlancora Acesso em 23 de out
2013
MMA Ministeacuterio do Meio Ambiente Avaliaccedilatildeo e identificaccedilatildeo de accedilotildees prioritaacuterias para a
conservaccedilatildeo utilizaccedilatildeo sustentaacutevel e reparticcedilatildeo dos benefiacutecios da biodiversidade na
Amazocircnia brasileira Brasiacutelia MMASBF 2001
MMA Ministeacuterio do Meio Ambiente Secretaria de Biodiversidade e Florestas Aacutereas Prioritaacuterias
para Conservaccedilatildeo Uso Sustentaacutevel e Reparticcedilatildeo de Benefiacutecios da Biodiversidade Brasileira
Atualizaccedilatildeo - Portaria MMA ndeg9 de 23 de janeiro de 2007 Brasiacutelia MMA 2007 (Seacuterie
Biodiversidade 31)
MONITORING amp IMPLEMENTATION REPORT VCS Version 3 CCB Standards Third Edition
v30 53
MMA Livro vermelho da fauna brasileira ameaccedilada de extinccedilatildeo editores Angelo Barbosa
Monteiro Machado Glaacuteucia Moreira Drummond Adriano Pereira Paglia 1ed 2008 Brasiacutelia
DF MMA Belo Horizonte MG Fundaccedilatildeo Biodiversitas (1420 p) il - (Biodiversidade 19)
OLIVEIRA M M HIGUCHI N CELES C H HIGUCHI F G 2014 Tamanho e formas de
parcelas para inventaacuterios florestais de espeacutecies arboacutereas na Amazocircnia Central Ciecircncia
Florestal Santa Maria v 24 n 3 p 645-653
PEARSON TRH WALKER S BROWN SL The Source Book for Land Use Land Use
Change and Forestry Projects BioCarbon Fund and Winrock International 2005 64 pp
PORTAL AMAZOcircNIA Amazocircnia de A a Z Disponiacutevel em
lthttpportalamazoniaglobocomgt Acesso em 13 de set 2013
PEacuteLLICO NETTO S BRENA D A Inventaacuterio florestal Curitiba Editorado pelos autores p
316 1997
PROJETO SIVAM Relatoacuterio metodoloacutegico de trabalho Revisatildeo 3 Diretoria de Geociecircncia Rio de
Janeiro 2002 330 pp
PROJETO SIVAM Atualizaccedilatildeo do RADAMBRASIL Mapa de Vegetacao da Amazonia Legal
Mapa de Fitofisionomias ndash RADAMSIPAM DNPM Ministeacuterio de Minas e Energia 2002
Disponiacutevel em httpwwwdpiinpebramb_dataShapefilesveg_Amz_SIPAMzip Acesso
em 21 de jan 2014
PROJETO FLORESTAL SANTA MARIA (PROJETO FSM-REDD) Plant Inteligecircncia Ambiental ndash
Warwick Manfrinato 2012 Disponiacutevel em
lthttpwwwflorestalsantamariacombrsitedocumentos57FSM_REDD_VCS_PD_ptpdfgt
Acesso em 09 de set 2013
MONITORING amp IMPLEMENTATION REPORT VCS Version 3 CCB Standards Third Edition
v30 54
RADAMBRASIL Programa de Integraccedilatildeo Nacional Levantamentos de Recursos Naturais v 14 ndash
RADAM DNPM Ministeacuterio de Minas e Energia Brasil 1974
RIBEIRO J E L et al Flora da Reserva Ducke guia de identificaccedilatildeo das plantas vasculares de
uma floresta de terra firme na Amazocircnia Central Manaus Editora INPA 1999
ROSAS F C W WALDEMARIN H de MATTOS G E Pteronura rasiliensis (Zimmermann
1780) In MACHADO A B M DRUMMOND G M PAGLIA A P (eds) Livro Vermelho da
Fauna Brasileira Ameaccedilada de Extinccedilatildeo Volume II 1ed Brasiacutelia DF Ministeacuterio do Meio
Ambiente 2008 p 800 - 801
ROSS D GHG Emissions Resulting from Aircraft Travel 2009 Disponiacutevel em
httpwwwcarbonplanetcomdownloadsFlight_Calculator_Information_v92pdf Acesso em
14 de out 2013
SANTOS A J et al Viabilidade econocircmica do sistema agroflorestal greviacutelea x cafeacute na regiatildeo
norte do Paranaacute CERNE vol6 n1 pp89-100 2000
SANTOS R A Custo do manejo florestal madeireiro estudo de caso Floresta Estadual do
Antimary Monografia (Bacharelado em Economia) ndash Departamento de Ciecircncias
Econocircmicas Universidade Federal do Acre 2007109p
SABOGAL C et al Manejo Florestal Empresarial na Amazocircnia Brasileira restriccedilotildees e
oportunidades (Relatoacuterio Siacutentese) Beleacutem CIFORIMAZON 2006 72p
SDSCEUC Secretaria Estadual de Meio Ambiente e Desenvolvimento Sustentaacutevel ndash Centro
Estadual de Unidades de Conservaccedilatildeo Programa de Monitoramento de Biodiversidade e
Uso de Recursos Naturais em Aacutereas Protegidas do Estado Amazonas (ProBUC) 2006
Disponiacutevel em
MONITORING amp IMPLEMENTATION REPORT VCS Version 3 CCB Standards Third Edition
v30 55
httpbrazilwcsorgDesktopModulesBring2mindDMXDownloadaspxEntryId=6168ampPortalI
d=93ampDownloadMethod=attachment Acesso em 11 de ago de 2013
SFBIMAZON Serviccedilo Florestal Brasileiro e Instituto do Homem e Meio Ambiente da Amazocircnia A
atividade madeireira na Amazocircnia brasileira produccedilatildeo receita e mercados 2010 Disponiacutevel
em httpwwwmmagovbrestruturassfb_arquivosmiolo_resexec_polo_03_95_1pdf
Acesso em 23 de out 2013
SILVA R P da Alometria estoque e dinacircmica da biomassa de florestas primaacuterias e
secundaacuterias na regiatildeo de Manaus (AM) 152 p Tese de Doutorado Programa Integrado
de Poacutes-graduaccedilatildeo em Biologia Tropical e Recursos Naturais (INPA) Manaus 2007
SILVA Z A G P G SANTOS R A Custo do manejo florestal madeireiro em floresta puacuteblica
estudo de caso no Acre 2011 Disponiacutevel em
lthttpwwwbasacombrbancoamazonia2Revistaedicao_13n13_custo_do_manejo_flores
pdfgt Acesso em 13 de set 2013
SMIDT M GALLAGHER T Factors Affecting Fuel Consumption and Harvesting Costs Auburn
School of Forestry and Wildlife Sciences Sd Disponiacutevel em
httpweb1cnrevteduforestrycofedocuments2013Smidt_Gallagherpdf Acesso em 21
de out 2013
SOARES-FILHO B et al Role of Brazilian Amazon protected areas in climate change mitigation
2010 Columbia University NY Ruth S DeFries 2010
SPF Serviccedilo Puacuteblico Federal DVPF Documento de venda de produto Florestal (Declaraccedilotildees de
venda Gethalpdf) 14 de julho de 2006
MONITORING amp IMPLEMENTATION REPORT VCS Version 3 CCB Standards Third Edition
v30 56
TIMOFEICZYK JUacuteNIOR R et al Rentabilidade econocircmica do manejo de baixo impacto em
florestas tropicais um estudo de caso Revista Floresta Curitiba v 38 n 4 p 711-725
outdez 2008
VCS Ferramenta para Demonstraccedilatildeo e Avaliaccedilatildeo de Adicionalidade para Atividades de Projetos
VCS em Agricultura Floresta e Outros Usos (AFOLU) 2012a Disponiacutevel em httpwwwv-c-
sorgsitesv-c-sorgfilesVT000120VCS20AFOLU20Additionality20Tool20v30pdf
Acesso em 24 de set 2013
VCS Ferramenta de Risco e Natildeo Permanecircncia (AFOLU) 2012B Disponiacutevel em httpv-c-
sorgsitesv-c-sorgfilesAFOLU20Non-Permanence20Risk20Tool2C20v32pdf
Acesso em 13 de set 2013
VCS Approved VCS Methodology VM0010 Version 10 - Methodology for Improved Forest
Management Conversion to Logged to Protected Forest Calculating GHG Benefits from
Preventing Planned Degradation PHUA S SHARMA S TELFER M CHANDLER H
(Eds) Califoacuternia EUA Carbon Planet Limited 2011149p
VERDEJO M E Diagnoacutestico Rural Participativo um guia praacutetico Brasiacutelia MDA 2006 62p
VIANNA A L M Diagnoacutestico Florestal do Estado do Amazonas 2010 e 2011 Manaus-AM
IDESAM 2013 (Relatoacuterio Final do Projeto Fortalecimento da participaccedilatildeo da sociedade civil
no Amazonas Foacuterum de Mudanccedilas Climaacuteticas Transparecircncia Florestal no Estado do
Amazonas ndash Mapeamento de Instrumentos Legislativos no Brasil)
WBCSDWRI The GHG Protocol for Project Accountin Washington World Business Council for
Sustainable DevelopmentWorld Resources Institute 2005148 p
MONITORING amp IMPLEMENTATION REPORT VCS Version 3 CCB Standards Third Edition
v30 57
WALKER W et al Guia de Campo para Estimativa de Biomassa Florestal e Estoque de Carbono
Woods Hole Center Research Falmouth Massachusetts USA 2011 Disponiacutevel em
httpwwwwhrcorgresourcesfieldguidescarbonpdfWHRC_FieldGuide_PortugueseSMpdf
Acesso em 14 de set 2013
WWF Metodologia para Avaliaccedilatildeo Raacutepida e a Priorizaccedilatildeo do Manejo de Unidades de
Conservaccedilatildeo (RAPPAM) 2010 Disponiacutevel em httpgooglXfDnxs Acesso em 30 de set
2013
WWF-Brasil Efetividade de Gestatildeo das Unidades de Conservaccedilatildeo no Estado do Amazonas
Secretaria de Estado do Meio Ambiente e do Desenvolvimento Sustentaacutevel do Amazonas
Instituto Chico Mendes de Conservaccedilatildeo da Biodiversidade Brasiacutelia WWF-Brasil 2011 72 p

MONITORING amp IMPLEMENTATION REPORT VCS Version 3 CCB Standards Third Edition
v30 10
1 GENERAL
11 Summary Description of the Project
The Amazon Rio project consists of the conservation of a mosaic of four private areas called
Amazon Rio I II III and IV which add up to 20387 hectares (ha) of primary forest located in the
municipality of Manicoreacute in the state of Amazonas The projects target area is characterized by
being a region of sedimentary Solimotildees Basin dominated by Alluvial Holocene Iccedilaacute Training and
Detritus-lateritic formation The relief is of the flat type with primary vegetation formation consisting
of areas of land floodplain and some formations igapoacute due to the influence of Rio Manicoreacute
The Amazon Rio areas dominated forests of humid tropical rainforest Lowlands emerging Canopy
and Forest Open Rain Lowlands with palm trees (79) the Atlantic rain forest Alluvial emerging
canopy (11) Rain Forest Open Alluvial with palm trees (8) Pioneer formations influenced
fluvial and or lacustrine - herbaceous and shrubby with palm trees (1)
The main focus of the project is (i) the conservation of forest ecosystems and biodiversity (ii) the
sustainable social development of the region including the promotion of ecotourism and scientific
research and (iii) the reduction in carbon dioxide (CO2) emissions through the prevention of
deforestation and forest degradation
In 1998 a logging plan for logging activities was approved by the authorized environmental
agencies on 19800 ha of land over a period of 25 years (the total area does not include
Permanent Preservation Areas (APP) and water bodies Between 1999 and 2010 434769 ha
were degraded due to an authorized logging operation (Annexes 1 2 3 and 4) In February 2011
the area was acquired by the Empresa Brasileira de Conservaccedilatildeo de Florestas (EBCF) which in
order to implement the objectives of the project made two important decisions to suspend the
logging operations underway in the project areas since 1999 and transform them into Private
Reserves for Sustainable Development (Reservas Particulares de Desenvolvimento Sustentaacutevel -
RPDSs) supported by State Law no 53 of June 2007 and Decree no 30108 of June 2010
With this new land use strategy 20387 ha of primary forest will be preserved avoiding the CO2
emissions that would have occurred without the implementation of the project Revenues obtained
from the carbon credits will be used to maintain the primary forest with the implementation of the
activities described in the Reserversquos Management Plan (Annex 9) including social programs and
environmental monitoring
The project intends to maintain financial sustainability through the sale of carbon credits obtained
from the conservation of the area and maintenance of environmental services Another source of
MONITORING amp IMPLEMENTATION REPORT VCS Version 3 CCB Standards Third Edition
v30 11
income planned by the project relates to the national market for legal reserve compensation
(Environmental Reserve Quota (Cotas de Reserva Ambiental (CRA) in Portuguese)1 Using these
two financial mechanisms for conservation the emission of approximately 2 million tons of carbon
dioxide into the atmosphere over a period of 37 years will be avoided
It is important to emphasize that the project area is crucial for conservation especially considering
its characteristics such as (i) high biological diversity and concentration of endemic and
pharmacological species (Section 7) (ii) extensive areas of plains which are important for the
reproduction and survival of many species of plants and animals especially birds and reptiles and
(iii) high potential for ecotourism and environmental education including scientific research
The creation of these private reserves also contributes to the consolidation of a strategy to
establish ecological corridors and mosaics in the region creating a territorial connection between
public and private conservation areas This situation reduces potential conflicts between the state
landowners and residents in the buffer areas and creates opportunities for implementing integrated
actions optimizing human and financial resources for environmental monitoring and control
actions
Another important fact to consider is the surrounding communities who use the project areas for
their own subsistence extracting non-timber forest products (eg nuts fruits oils vines) fishing
and hunting For that reason they have direct interest in the conservation of the forest to obtain
food economic security and maintain their cultural practices
The environmental benefits that the communities receive make them guardians of the forest
contributing significantly to the monitoring and controlling of illegal activities practiced in the region
such as logging fishing and poaching as well as supervision and control of forest fires In this
context the Amazon Rio project plays a role of great environmental importance for the region also
contributing to the improvement of livelihoods of the local population and consequently to the
conservation of the forest
A population of 350 families distributed among 15 communities is estimated to reside around the
area of the Amazon Rio project The environmental benefits provided by the implementation of the
project and Amazon Rio I RPDS Management Plan and posteriorly including Amazon Rio II III
and IV demonstrate a strong social development component and includes several socio-economic
support programs to local communities which promote sustainable development in the region
2 sect 2 Art 15 of the new Brazilian Forest Code (Law 126512012) provides for voluntary forest reserves ie the
excess of forest required by law on rural property According to this law all preserved area that exceeds the minimum required by law may be used for creation of environmental easement or Environmental Reserve Quotas in the same biome and State
MONITORING amp IMPLEMENTATION REPORT VCS Version 3 CCB Standards Third Edition
v30 12
The project will be implemented starting from the introduction of participatory processes ensuring
active involvement of the local communities around the area as in the aforementioned
development programs and in decision-making The community programs that aim to improve
access to health education and income generation will use the ldquoBolsa Florestardquo program as
reference a program of great relevance for payments for environmental services (PES) in the state
of Amazonas In the medium and long terms these programs intend to significantly improve the
living conditions of these communities strengthening their organizational and institutional capacity
including their productive environmental and financial sustainability
12 Project Objectives
General objective
The objectives of this project takes a holistic approach to the region and keep full affinity to the
recent statement of the United Nations in the design of the seventeen goals of Sustainable
Development2 (ODS) In this sense the project objectives have a direct relationship with some of
the ODS and take others as a source of inspiration for the implementation of activities in
partnership with local communities These guidelines will be key elements in the local discussion
process around the project activities
Thus it is assumed as a general objective of the project contribute to the maintenance of global
climate (goal 13) through the implementation of activities to prevent the emission of greenhouse
gases locally by replacing the forest selective logging for a project conservation of forest
biodiversity (goal 15) preserving the traditional culture of the population of surrounding
communities (goal 3) promoting income generation (goal 1 8) and contributing to local social
development (goals 2 5 4 6 7)
Specific objectives
Specifically the project aims to
2 The seventeen Sustainable Development Goals at the United Nations are (1) Ending poverty in all its
form everywhere (2) Ending eat hunger achieve food security improve nutrition (3) To ensure a healthy life and promote well-being for all (4) To ensure inclusive education equitable and quality (5) Achieving gender equality and empower all women (6) Ensure availability and sustainable water management (7) Ensure access energy reliable and sustainable (8) To promote sustained inclusive and sustainable economic growth (9) Building resilient infrastructure promote inclusive industrialization (10) To reduce inequality between and within countries (11) Making cities inclusive human settlements secure resilient (12) To ensure standards of sustainable consumption and production (13) Take urgent action to combat climate change (14) To preserve and promote the sustainable use of the oceans (15) To protect restore and promote the sustainable use of forests (16) To promote peaceful and inclusive societies for sustainable development (17) To strengthen the implementation mechanisms and revitalize the global partnership
MONITORING amp IMPLEMENTATION REPORT VCS Version 3 CCB Standards Third Edition
v30 13
1 Implement economic alternative activities to selective logging to generate revenue for the
project benefiting at least 300 families surrounding the target area
2 Reduce approximately 32 million tons of carbon dioxide as a result of project activities
3 To contribute to the maintenance of regional biodiversity through the preservation and
conservation of the forest
4 Contribute to improve educational processes and attention to regional health
5 Promote the inclusion and womens empowerment in the project area communities
13 Project location
Location
The Amazon Rio Project is located in the southern region of the state of Amazonas in the
municipality of Manicore (Figure 01) The waterway and air constitute arrival means to the city with
approximate distance of 333 km by air and 427 km by river is the starting point for the city of
Manaus the state capital The Project areas are near the Madeira River and between the
Sustainable Development Reserves (RDS) Rio Madeira and Rio Amapaacute (Figure 02)
Figure 01 - Location of the Municipality of Manicoreacute - AM
MONITORING amp IMPLEMENTATION REPORT VCS Version 3 CCB Standards Third Edition
v30 14
Figure 02 - Location areas I II III and IV of the Amazon Rio Project
Figure 03 - Project Zone and communities of the project
MONITORING amp IMPLEMENTATION REPORT VCS Version 3 CCB Standards Third Edition
v30 15
Specifically in the Amazon Rio area the dense Primary Tropical Ombrophylous Lowland Forest and
open Primary Tropical Ombrophylous Lowland Forest with palm trees (79) Dense Primary
Tropical Ombrophylous Alluvial Forest (11) Open Primary Tropical Ambrophylous Alluvial Forest
with palm trees (8) Pioneer Formations with fluvial andor lacustrine influence - herbaceous and
shrubby vegetation with palm trees (1) (Annex 5)
According to IBGEs soil database (2000) the Manicoreacute region is formed mainly of Latosols and
Argisols Also soils such as Gleysols Spodosols Alluvial soils Neosols Planosols Plinthosols and
Nitosols can be found The Brazilian Soil Classification System produced from surveys by the
Brazilian Agricultural Research company (EMBRAPA) between 2001 and 2006 corroborates the
classification information for that region
Alluvial soils are very common in this region These soils are found mainly on the banks of the
Madeira River The fertility levels are dystrophic and located on flat terrain Agricultural and
livestock activities are almost always practiced along the main alluvial stretches of the region The
most fertile soils that occur on the floodplains (vaacuterzea) are widely cultivated for temporary crops
such as beans rice watermelon and cassava
Climate and hydrography
The climate in the region of the Madeira River is humid equatorial (IBGE 2011) with an average
temperature of 27degC relative humidity ranging between 85 and 90 and annual rainfall between
2200 to 2800 mmyear (RADAMBRASIL 1974) Studies from the Amapaacute Rio RDS area indicate
that between the months of January and March rainfall intensity is greater with monthly rainfall
between 300 and 350 mm while the driest months are July and August with monthly averages
around 50 mm
Geographically the Amazon region is defined by watersheds formed by the rivers which flow into
the Amazon Rio and its mouth along the entire East coast of Brazil (RIBEIRO et al 1999) The
city of Manicoreacute is influenced mainly by the Madeira and Manicoreacute rivers which are respectively
white and black water rivers and contribute to the local climatic conditions combined with the
characteristics of the vegetation that includes forests meadows savanna (cerrado) and floodplains
(vaacuterzeas)
Economic context of land use
Southern Amazonas is an important region strategically to prevent advances in deforestation in the
Amazon However in recent years the region has been suffering successive deforestation events
from expanded farming activities contributing to the so-called arc of deforestation toward the
MONITORING amp IMPLEMENTATION REPORT VCS Version 3 CCB Standards Third Edition
v30 16
state of Amazonas Historically the arc of deforestation has advanced with the expansion of
agriculture in the states of Paraacute Mato Grosso Rondocircnia Tocantins and Maranhatildeo In recent
years pressures on forests have increased with the globalization of markets for meat and
soybeans in the Amazon and international development policies for the region (IDESAM 2011)
14 Project Proponent (G4)
Organization Name Empresa Brasileira de Conservaccedilatildeo de Florestas SA (EBCF)
Contact Person Leonardo Barrionuevo
Title President
Address Curitiba-PR Al Dr Carlos de Carvalho 555 Conj 231
Centro Curitiba ndash PR CEP 80430-180 Brazil
Escritoacuterio Manaus Av Djalma Batista 1661 Conj 1409 A Bloco B
Ed Business Tower Millenium Cep 69050-010 Manaus-AM Brazil
Telephone +55 41 3158 9800 | +55 41 9943 8005
Email leonardoebcfcombr
15 Other Entities Involved in the Project (G4)
Organization Name Original Trade Consulting
Role in the Project Update of the Amazon Rio REDD+ IFM Project Description (PD) (V20)
and coordination of certifcation process
Contact Person Joatildeo Batista Tezza Neto
Title Director
Address Avenida Andreacute Arauacutejo 2936 ndash Edifiacutecio Incubadora do INPA sala 10
Cep 69060-000 Manaus-AM Brazil
Telephone +55 92 981590997
Email tezzanetooriginaltradenet
MONITORING amp IMPLEMENTATION REPORT VCS Version 3 CCB Standards Third Edition
v30 17
Organization Name HDOM
Role in the Project Degradation and deforestation report Forest inventory for biomass
calculation purposes in the project area and support the PD review
Contact Person Francisco Higushi
Title Director
Address Av Maacuterio Ypiranga 315 Ed The Office sala 609 Adrianoacutepolis CEP
69057-002
Telephone + 55 92 98128 2561
Email fghiguchihdomcombr
11 Project Start Date
The project began on August 17 2012 when the board and EBCF shareholders formally approved
the companys Business Plan (Annex 27) which set out the objectives of conserving forests
through the REDD + provision of services and sustainable use of forest resources excluded
logging activities
12 Project Crediting Period
The first crediting period of the project is 37 years beginning on August 17 2012 and ending on 17
August 2049 This period is equivalent to the remaining 12 years of the first authorized
management plan (25 years from 1998) added to another 25 years in respect of a new forest
management plan that was intended as the common practice of forestry in Brazil The logging
activities could continue beyond 37 years aiming for a second crediting period
2 DESIGN
21 Sectoral Scope and Project Type
Project Scope Agriculture Forest and other Land Use (AFOLU)
Project Category Reduction Emission from Deforestation and Degradation from Planned
Deforestation (REDD-IFM)
MONITORING amp IMPLEMENTATION REPORT VCS Version 3 CCB Standards Third Edition
v30 18
Type of Activity Improved Forest Management - Logged to Protected Forest (IFM LfPF)
22 Project Financing
The carbon project integrates a broad vision of territorial management as part of the Management
Plan of the Amazon Rio Private Reservation I Accordingly it stipulates that all actions necessary
to implement this Plan should be enabled from resources obtained by payments for environmental
services such as carbon credits and CRAs
The idea is for the plan to serve as a management tool to provide technical and political support
support to negotiations with support institutions to receive investments that can make projects and
programs viable The expected revenues in the short and medium term to implement the
Management Plan will mostly come from payments for environmental services such as negotiated
carbon credits and CRAs in addition to projects that generate long-term income exclusively for the
communities such as ecotourism scientific research and harvest of non-timber forest products
In this context the main difference between a permanent protection private reserve (eg RPPN)
and a private sustainable development reserve (eg RPDS) is that the long-term financial viability
of sustainable reserves usage comes from the marketing of non-timber forest products with high
added value and other sustainable businesses in compensation for environmental services This
flow of resources is expected to occur during and after the implementation period The proposal is
that with external support and through their political representatives local communities will be able
to establish partnerships and contracts with companies cooperatives and industries interested in
supporting social and environmental initiatives in the project areas
These items are briefly listed below with their respective values regarding the implementation and
execution of the project part of which will be initially financed by the contribution of the partners as
mentioned above
Table 01 - Project implementation and opperational costs3
Component Value (R$) Share ()
Pre-Operating expenses R$ 1561904 361
Administrative expenses R$ 24069915 5568
Costs of VCS + CCB certification R$ 456670 106
3 Annex 16
MONITORING amp IMPLEMENTATION REPORT VCS Version 3 CCB Standards Third Edition
v30 19
Monitoring R$ 2820000 652
Social program related expenses R$ 6050000 1399
Carbon trading R$ 1188536 275
Taxes on income R$ 1680219 389
Taxes on profit R$ 5008435 1159
Interest 10 return on investment of shareholders R$ 396300 092
TOTAL R$ 43231980 10000
23 Employment Opportunities and Worker Safety
Despite the considerable local knowledge of the regionrsquos ecosystems and environments
technology is lacking related to the value added to products and environmental conservation
projects Besides these difficulties public service agents frequently indicate the use of techniques
and management practices that require high external inputs and major investments To overcome
these limitations the project intends to promote specific and culturally relevant trainings that include
workshops meetings courses and extended technical assistance to improve the knowledge and
skills of community leaders residents and employees of the project To complement such
trainings we intend to install diversified agroforestry systems to restore and reuse degraded
areas to encourage handicrafts and tourism and to improving the management of non-timber
forest products with emphasis on Brazil nuts andiroba copaiba and Acai As a result
management practices are expected to improve in the long-term as well as and the fostering of
local culture combining technical and scientific knowledge with traditional knowledge
24 Stakeholders (G3)
Consultation prior to the beginning of the project
The populations involved in the carbon project are direct users of forest resources that are present
in the Amazon Rio I II III amp IV areas for the practice of plant and animal extraction Initially they
were indicated by the Council of Agro-Extrativist Associations of Democracia (Conselho das
Associaccedilotildees Agroextrativistas de Democracia - CAAD) which gathers associations of residents
from ten communities located near the Amazon Rio I Reserve Following this indication the EBCF
hired the services of the consulting company CO2X Conservaccedilatildeo de Florestas Ltda to perform a
MONITORING amp IMPLEMENTATION REPORT VCS Version 3 CCB Standards Third Edition
v30 20
series of workshops and meetings to prepare the Amazon Rio I Management Plan (Annex 9) and
to develope the Amazon Rio REDD+ IFM project In these meetings different forms and spaces of
participation of the people and government and non-governmental institutions were discussed to
support the development and implementation of the Management Plan culminating in the creation
of an Advisory Council In these events conservation and fundraising strategies were presented to
the community among them the marketing of avoided emissions resulting from the suspension of
timber management activities The conduct of the Free Prior and Informed Consent (FPIC)
process was done in the communities surrounding the Amazon Rio I II III and IV areas during
three workshops in 2013 which had a very inclusive and participatory nature This document as
well as the minutes of the workshops participatory mapping Sustainability Matrix questionnaires
and presentations in PPT slides are available in Annex 104
Identification of stakeholders
There are 15 communities that will benefiot from the activities of the project and twelve of them
(Urucury Aacutegua Azul Vista Alegre Boa Esperanccedila Santa Eva Santa Maria Pandegal
Democracia Jatuarana Terra Preta do Ramal Kamayuaacute and Satildeo Joseacute do Miriti) are located in the
region surrounding Amazon Rio areas I and III and in the Rio Amapaacute Reserve on the Madeira
River and its tributaries One of the communities is formed by residents that integrate the
Agroextractivist Association Satildeo Joatildeo e Ponta Grossa which is located in the surroundings of the
Amazon Rio IV area Two communities Terra Preta do Rio Manicoreacute and Mocambo are located in
the region surrounding the Amazon Rio II on the bank of the Manicoreacute River(Figure 03)
Figure 04 - Location of the communities surrounding the Amazon Rio areas I II III and IV
4 This topic is thoroughly discussed in Section 37 of this document
MONITORING amp IMPLEMENTATION REPORT VCS Version 3 CCB Standards Third Edition
v30 21
Except for Terra Preta do Rio Manicoreacute Mocambo and Satildeo Joseacute do Miriti all of the communities
utilize the Rio Amapaacute RDS area either on a sporadic or seasonal basis to meet their food needs
(collecting various fruits fishing and hunting) for household and medicinal use (bark leaves and
plant parts considered by medical practices and traditional knowledge) and primarily for the sale of
various non-timber products especially the harvesting of Brazil nut accedilaiacute and copaiacuteba oil However
the trails roads and paths that provide access to the Amapaacute Rio RDS and Amazon Rio areas are
in a poor state of repair which hinders extraction practices especially the production of Brazil nuts
In addition to the 15 communities surrounding the Amazon Rio areas government organizations
directly involved with environmental issues in the region such as SDS the National Indian
Foundation (Fundaccedilatildeo Nacional do Iacutendio - FUNAI) City Hall and the City Council of Manicoreacute the
Secretary of Environment and Sustainable Development of Manicoreacute ICMBio and non-
governmental organizations such as FAS IEB CAAD CNS UFAM UEA were identified and
contacted to participate in the entire process of preparation of the Management Plan
Stakeholder meetings
To present and discuss the project in detail with representatives of 15 communities surrounding
the project area and support institutions three workshops in different locations were conducted
The subjects were presented in straightforward language in a culturally appropriate way so that
community representatives could understand relatively complex and unusual concepts such as
climate change greenhouse effect and payments for environmental services
The importance of forests for the mitigation and adaptation to climate change was emphasized to
convey the main objectives of the project to community representatives and in particular their role
in (i) absorbing carbon dioxide and release oxygen (ii) helping control climate processes on a
regional scale (iii) regulating the flow of rivers and erosion control and (iv) providing shelter and
food for most animals and plants on the planet The fact that 20 of global greenhouse gas
emissions come from the destruction of forests and in Brazil 70 of emissions come from
deforestation was also mentioned
During the workshops participants learned that steps can be taken to reduce the emissions of
greenhouse gases by investing in renewable energy sources such as solar energy wind energy
hydroelectric power plants electric cars and other more efficient ones Another option that
mitigates climate change was also highlighted that relates to the Amazon forest conservation and
the restoration of degraded areas through reforestation management of agricultural land and
establishment of agroforestry systems
MONITORING amp IMPLEMENTATION REPORT VCS Version 3 CCB Standards Third Edition
v30 22
After concepts were discussed it was explained to those present that the proposed project to be
carried out in the RPDS Amazon Rio I recently approved at the time and in the creation process
in the other Reserves has essentially one goal to financially reward those who preserve and
protect a forest threatened with deforestation and degradation the project aims (i) raise funds for
the implementation of the Management Plan programs and (ii) conserve forests and the associated
biodiversity It was also mentioned that the project is part of a new vision of the business strategy
since a logging plan was operational until 2010 associated with the emissions of greenhouse
gases In 2010 the practice was suspended by the owner who began investing in the creation of a
project focused on conservation and payment for environmental services with emphasis on the
voluntary carbon market
Implementation schedule
Table 2 - Implementation schedule and next activities
Ano Atividade
2010
EBCF performs the symbolic protocol creation of the first RPDs during the
seminar results and perspective of the State of Amazonas Conservation
Units held by the SDS
2011 EBCF submits the formal protocol to CEUC
2011 Meeting presentation EBCF for communities near the Amazon River I II III
and IV
2011
EBCF attended the informal invitation made by the management of RDS
Rio Amapaacute and representative CEUC - Silvia Elena the training workshop
and delivery portfolios ENVIRONMENTAL VOLUNTEERS AGENTS held in
the Boa Esperanccedila community
2011
EBCF participated in the event organized by the CAAD which had the
agenda General Assembly accountability of CAAD year 20092010 RDS
Management Plan Amapaacute Rio Bolsa Floresta Municipal Management
IDAM contribution contribution Covema IEBs contribution and delivery of
equipment for processing of acai held on 24032011 in the community of
MONITORING amp IMPLEMENTATION REPORT VCS Version 3 CCB Standards Third Edition
v30 23
Democracy and 25032011 in the Boa esperanccedila Community
2011 Inspection of CEUC on farms for approval on RPDs
2011 The board of EBCF makes his 1st visit the communities and farms
2011
EBCF in partnership with the Municipal Government of Manipur perform
the recovery local road (approximately 20KM) linking Democracia
community Jatuarana communities Terra Preta Community Santa Eva
and Vista Alegre
2012
Visit of the president and directors of EBCF the communities surrounding
the reserves together with the president of PATAC Marcelo Marder and
Andre Albuquerque president for socioeconomic communities report
presentation
2012 Business Plan Project approval and EBCF shareholders agreement
authorizing the start of the REDD project
2013 Workshop I - Diagnosis for the development of areas of the Amazon River
Management Plan I II III amp IV
2013 Visit communities to complement the workshop I for interviews with the
locals
2013 Meeting in CEUC after the second workshop to update the work with the
communities and the progress of the approval of the areas
2013
Technical meeting with the team CO2X Renascer and Human
Development EBCF in Curitiba for the review and evaluation of the first part
of the Management Plan (diagnosis) Definition of programs and
subprograms of the Plan identification of key issues potential threats and
opportunities with the creation of RPDSs definition of vision and action
strategy
MONITORING amp IMPLEMENTATION REPORT VCS Version 3 CCB Standards Third Edition
v30 24
2013
The Secretary of State for the Environment (SDS) officiated at the World
Environment Day the first Private Reserve Sustainable Development
(RPDs) of the Amazon with the signing of the decree no 86
2013 Workshop II - presentation of the carbon project as one of the fundraising
programs for the implementation of the Management Plan
2013 Field work with communities and farms for mapping biodiversity and
hunting and fishing grounds
2013 The EBCF performs a complete socioeconomic census in the surrounding
communities of RPDs
2013 Meeting with CEUC for delivery and presentation of the draft of RPDs
Amazon River Management Plan I
2013
Supplementary Meeting to communities who could not attend the
Workshop II amp III Workshop Creation of the Advisory Council for RPDs
Amazon River I
2013 The EBCF performs social and economic Census in Kamayuaacute community
2015 Realization of field activities for Biomass Inventory Estimation
2016 Vitor Belfort visit and launch of income-generating initiatives
2016 Distribution of medical kits for community health workers and launching the
Health Program in the Amazon
2016 Deforestation Report
2016 PD Review and preparation of the monitoring report
MONITORING amp IMPLEMENTATION REPORT VCS Version 3 CCB Standards Third Edition
v30 25
2016 REDD + Project Certification (VCS and CCV)
2016 Project planning for structuring the supply chain of vegetable oils
certificates
2017 Fundraising from the REDD project
2017 Ecotourism Project Design
2017 Workshop Achievement Participatory Planning Project REDD + activity
EBCF
2017 ProBUC Deployment
2018 Implementation of Voluntary Environmental Agent program
25 Respect for Rights and no Involuntary Relocation
In the three workshops explaining the Carbon project to 15 communities the eight REDD+
principles and the social and environmental safeguards were presented Those safeguards were
previously established in a series of meetings throughout the Amazon between 2009 and 2010
and included several Civil Society Organizations
It was emphasized in the workshops that compliance with these principles and safeguards under
REDD+ projects such as the Amazon Rio carbon project contributes to improving local
governance transparency of information public participation in decision-making coordination of
actions among different actors and respect and recognition of the rights of indigenous peoples and
traditional populations
Free Prior and Informed Consent (FPIC)
During the project workshops the concept of Free Prior and Informed Consent was presented to
the participants as well as the importance of social and environmental safeguards to ensure the
rights of communities in designing and developing the REDD+ project explained in the eight
principles The participants were asked whether they were in agreement and if there were other
MONITORING amp IMPLEMENTATION REPORT VCS Version 3 CCB Standards Third Edition
v30 26
principles or rights that should be included Some community individuals expressed their
agreement to the safeguards All participants at the three workshops raised their hands in support
of REDD+ project The consent was unanimous
A separate document describing the whole process of the Free Prior and Informed Consent has
been prepared and is available in Annex 10
Figure 05 - Workshop I Free Prior and Informed Consent for the development of the REDD+
project by the community leaders of Democracia Aacutegua Azul Satildeo Joseacute do Miriti Vista Alegre
Jatuarana Terra Preta do Ramal Pandegal Santa Maria Santa Eva and Terra Preta do Rio
Mancoreacute
Figure 06 - Workshop II Free Prior and Informed Consent for the development of the REDD+
project by the community leaders of Urucury Mocambo Boa Esperanccedila and Satildeo Joatildeo amp Ponta
Grossa
MONITORING amp IMPLEMENTATION REPORT VCS Version 3 CCB Standards Third Edition
v30 27
Figure 07 - Workshop III Free Prior and Informed Consent for the development of the REDD+
project by the Kamayuaacute indigenous community
3 APPLICATION OF METHODOLOGY
31 Title and Reference of Methodology
VCS VM0011 Methodology for Improved Forest Management ndash Logged to Protected Forest
(LtPF) Calculating the GHG Benefits from Preventing Planned Degradation version 10
MONITORING amp IMPLEMENTATION REPORT VCS Version 3 CCB Standards Third Edition
v30 28
32 Methodology Deviations
Whereas the VM0011 was developed in a context of homogeneous forests of temperate regions
some methodological adjustments were made related to the direct survey biomass in the field
since the project areas are comprised of very heterogeneous areas of rainforest including dryland
and floodplains Any technical documentation related to these methodological adjustments and
their justifications appear in Annex 23 (Forest Inventory 2016) prepared by the consulting firm
HDOM
33 Project Boundary5
The total area of the property is 20387 ha and a buffer zone was established around each of the
four areas in order to include communities that use the resources within their boundaries (Figure
7a) Project activity areas (for purposes of calculating the emissions reductions called the project
area or PA) are only those for which logging is permitted a total of 19800 ha (Figure 7b)
excluding the Permanent Preservation Areas (APPs) and bodies of water A logging plan has been
approved for this area for selective logging (Annexes 1 2 3 4 6 and 7)
Figure 08 - Project Boundaries a) Direct Project interference limits b) Total Project Area (G1
Indicator 7)
5 Ref section 22 of VM0011
MONITORING amp IMPLEMENTATION REPORT VCS Version 3 CCB Standards Third Edition
v30 29
Stratification of the project area
For purposes of inventorying local carbon stocks and project management the project area was
stratified into 3 groups of different forest types as indicated by the VM0011 according to the
vegetation map SIPAMRADAM (DPI 2002) The forest types present in the area are rain forest
types divided into 3 categories as follows
Dense Primary Tropical Ombrophylous Alluvial Forest
Dense Primary Tropical Ombrophylous Lowland Forest
Pioneer Formations
Figure 09 - Project Area forest types
Leakage areas
There is no direct leakage resulting from planned project activities since there will be neither
displacement of management activities to other areas after the cessation of the activities within the
project area nor market leakages The project Management Plan includes the monitoring of
MONITORING amp IMPLEMENTATION REPORT VCS Version 3 CCB Standards Third Edition
v30 30
possible unanticipated leakages around the project area as well as the need to report to the
competent authorities whenever logging activities are identified in these areas For more
information on leakage see chapters 52 and 55 of this document
Temporal boundaries
Crediting period of the project
The first crediting period of the project is 37 years beginning on August 17 2012 and ending on 17
August 2049 This period is equivalent to the remaining 12 years of the first authorized
management plan (25 years from 1998) added to another 25 years in respect of a new forest
management plan that was intended as the common practice of forestry in Brazil The logging
activities could continue beyond 37 years aiming for a second crediting period
Monitoring and Reporting Period
a) Monitoring of Baseline Emissions
The monitoring of Baseline Emissions must demonstrate that the protected forest area is in
accordance with the one specified in the PD The project limit will be monitored before each
verification throughout the crediting period through new inventory information and remote sensing
and GIS as applicable Thus the project will be able to update the baseline calculations based on
the actual remaining forest area (in case of loss of forest cover by disasters for example) and that
would be subject to forest management under a ldquowithout projectrdquo scenario
b) Monitoring of Project Emissions
Project emissions will be monitored annually and compiled in every monitoring report that will detail
in particular the
Monitoring of possible illegal harvesting of timber
Monitoring of areas subject to natural disturbances
Monitoring and quantification of emissions related to air and land travel related to project
activities
c) Monitoring of Leakage
Since there will be no leakages according to the VM0011 and AFOLU Requirements no leakage
monitoring will be necessary However to be conservative the project intends to monitor any
disturbances that might affect the carbon reservoirs Once some disturbance is registered the
project will report the incident to the relevant authorities and make the necessary adjustments to
MONITORING amp IMPLEMENTATION REPORT VCS Version 3 CCB Standards Third Edition
v30 31
the baseline For more details about the monitoring of leakages see chapters 52 and 55 of this
document
Carbon stocks
The biomass reservoirs considered by the project are related to above-ground and underground
biomass
Sources and sinks of GHGs
Table 02 below describes the emission sources and sinks of greenhouse gases associated with
the baseline activities and with the project
Table 03 - Greenhouse gas emissions sources and sinks associated with baseline and project
activities
Source Gas Included JustificationExplanation
Baselin
e
Biomass
CO2 Yes Main source of project emissions through forest
degradation harvested and commercialised
wood products deadwood and forest regrowth
CH4 No Conservatively excluded
N2O No Conservatively excluded
Other No -
Fossil Fuel
consumption
CO2 Yes Main source through fossil fuel use in
machinery and transportation of timber
CH4 Yes Conservatively included
N2O Yes Conservatively included
Other No -
Electricity
consumption
CO2 Yes Main source
CH4 No -
N2O No -
Other No -
Pro
ject
Biomass
CO2 Yes Main source through unexpected natural
disturbances such as forest fires etc
CH4 Yes Included but subject to significance
N2O Yes Included but subject to significance
MONITORING amp IMPLEMENTATION REPORT VCS Version 3 CCB Standards Third Edition
v30 32
Source Gas Included JustificationExplanation
Other No _
Fossil Fuel
consumption
CO2 Yes Main source through flights and ground travel
CH4 Yes Included but subject to significance
N2O Yes Included but subject to significance
Other No _
Electricity
consumption
CO2 Yes Main source
CH4 No _
N2O No _
Other No _
34 Baseline Scenario
The choice between alternative baseline scenarios was taken together with the analysis of
additionality using the latest version of the VCS Tool for the demonstration and assessment of
additionality in Agriculture Forestry and Other Land Use VCS projects in this case VT000167
(VCS 2012a) All possible scenarios as well as the analysis of methodology barriers (steps 211
and 212 of the VM0011) are present in the chapter below In this sense to avoid redundancy of
information refer to additionality analysis to find the steps 211 and 212 of the VM0011
The baseline scenario for the project identified as the most likely to occur was selective logging8
(continuation of Business As Usual - BAU) The reference scenario assumes 37 years of selective
logging according to the 25 year logging plan approved in August 1998 (Annex 6 - document
ValdII T01 POA 1998) that in the absence of project activities would be renewed in 2024 for
another 25 years until 2049
Under this scenario the full implementation of the timber logging plan occurs and which has
already resulted in the degradation of 434769 ha (see table below) The area would be harvested
selectively for timber sold in lumber markets Below is a summary of harvest areas between 1999
and 2010 showing the managed plots and the dates on which the harvests were authorized
6 Tool for the demonstration and assessment of an additional to the VCS project activities in Agriculture Forestry and Other
Uses (AFOLU) (V 30)
7 Adapted from ldquoTool for the Demonstration and Assessment of Additionality in AR CDM project Activitiesrdquo (V02) 8 Additional information about choosing the baseline are presented in section 46 (steps 1 and 2)
MONITORING amp IMPLEMENTATION REPORT VCS Version 3 CCB Standards Third Edition
v30 33
Table 04 - Summary of areas managed since 1999
Date Managed logged area (ha)
1999 58669 (Plot 1)
2000 688 (Plot 2)
2001 ndash 2002 8315 (Plot 3)
2003 ndash 2004 750 (Plots 3 and 4)
2005 ndash 2007 1082 (Plot 5)
2008 ndash 2009 49050 (Plots 5 and 6)
TOTAL 434769
35 Additionality
The additionality analysis of the Amazon Rio project REDD+ IFM was conducted with the latest
version of the VCS Tool for the demonstration and assessment of additionality in Agriculture
Forestry and Other Land Use VCS projects the VT000167
(VCS 2012a)
To generate the reductions in GHG emissions for the project the planned baseline activities
(sustainable forest management) were terminated by the project proponent and supplanted by
environmental conservation activities In this sense the project will be managed by EBCF with
the goal of creating a fund for administrative and accounting management especially to promote
environmental management and monitoring activities of carbon pools within the project area
Alternative activities planned in the project are the provisioning and valuation of environmental
services via carbon credits (VCUs) in conjunction with the sale of Environmental Reserve Quotas
(CRAs)
4 MONITORING AND PARAMETERS OF DATA
41 Monitoring Plan Description
Due to its innovative comprehensive and integrative character the project needs to be monitored
regularly so that its actions activities and impacts can be constantly measured and evaluated To
meet this requirement the monitoring process must meet three main objectives
MONITORING amp IMPLEMENTATION REPORT VCS Version 3 CCB Standards Third Edition
v30 34
i To serve as an internal management project tool
ii To collaborate as an instrument of collective learning from the communities and
social groups directly involved
iii To work as a means of communicating results and impacts to interested institutions
and society in general Furthermore it is important to consider that monitoring if
successful will transcend the managerial aspects of the project and strengthening
the plan
To facilitate the monitoring process instead of having a reference line (to compare interventions
before and after) the first year of monitoring will serve as the starting point whose information will
be regularly and systematically compared throughout the project
Next the initial plans for monitoring benefits to the climate community and biodiversity are
described wherein the community is committed to participatory precept and to the technical and
scientific rigor which is capable of following the possible negative and positive impacts on
environmental and social aspects in the project area and its surroundings
Monitoring of Climate Impacts
The Monitoring Plan (MP) aims to provide security in the periodic estimates of reduction in
emissions especially in monitoring changes in carbon stock Therefore emissions from the
implementation of the project ex post estimates of the activities and emissions from any leakages
and isolated disturbances (eg blowdown fires pests and diseases among others) can be
calculated
The construction of the PM of the climate benefits made in full compliance with the methodological
framework provided by VM0011 ndash IFM LPF (VCS 2011) and CCBA (2008) which consists of four
specific actions to be monitored
i Implementation and execution of the project
ii Dynamics and stock of the forest biomass
iii Deforestation and forest degradation
iv Periodic reviews of ex post emissions
Remote monitoring and surveillance of the project area
Measurement of alterations and biomass loss quantification present in the PA using land use
change detection is critical to make accurate estimates of GHG emissions that account for forest
biomass increases and losses
MONITORING amp IMPLEMENTATION REPORT VCS Version 3 CCB Standards Third Edition
v30 35
Thus the use of remote sensing by satellite images of medium spatial resolution can be applied
readily in the PA and surroundings in order to monitor land use dynamics over time particularly to
identify risks and threats to forested areas In situ verification will complement landscape analysis
in a GIS environment with the aim of quantifying spatializing and identifying conversion of forest
areas into other land uses environmental degradation and other possible changes that may occur
during the term of the project
As a complementary monitoring source the project will rely on the database and information
provided by Monitoring Program of the Brazilian Amazon Forest by Satellite 910
(Prodes Digital)
conducted by the National Institute for Space Research (Instituto Nacional de Pesquisas Espaciais
- INPE) according to the Plan for Prevention and Control of Deforestation in the Amazon
1112(PPCDAm) under the National Policy on Prevention and Control of Deforestation Such
information is available online in13
digital vector files for the public in general
Other tools will provide complementary information to the monitoring such as indicators of forest
degradation and hotspots (fires and wildfires) obtained from DETER 14
SAD 15
and PROARCO16
Information is available online for free in vector format These results will be systematically related
to field data for validating or disproving the occurred event so that the focuses of deforestation and
degradation can be identified remediated reported and consequently avoided as much as
possible
A surveillance system that allows permanent territorial monitoring and inhibits the entry of intruders
through entry points in the PA will also be deployed to control the transport flow In addition one
must investigate and identify risks and threats eg mapping hotspots and areas vulnerable to fire
to illegal logging to hunting and poaching and to invasions by third parties among others
At first we estimate an effective demand for structuring the electronic monitoring system which
includes the hiring of skilled professionals field equipment electronic equipment (digital cameras
GPS desktops and notebooks smartphones printers geoprocessing software and GIS among
others) vehicles andor motorcycles motorized boats for transportation and moving around and
the collection of high resolution satellite images Empowerment and training of all involved staff
9httpwwwobtinpebrprodesdigitalmetodologiahtml
10httpwwwobtinpebrprodesmetodologiapdf 11httpwwwmmagovbrflorestascontrole-e-prevenC3A7C3A3o-do-desmatamento 12httpwwwmmagovbrimagesarquivo80120PPCDAm_FINAL_PPCDAMPDF 13httpwwwobtinpebrprodesindexhtml 14httpwwwobtinpebrdeterdados 15httpwwwimazongeoorgbrdocdownloadsphp 16httpwwwdpiinpebrproarcobdqueimadas
MONITORING amp IMPLEMENTATION REPORT VCS Version 3 CCB Standards Third Edition
v30 36
and the surrounding communities will be necessary to make the system effective17
and a constant
stream of information directed to regional actors and other stakeholders
Strategic monitoring and access points to RPDS roads will also provide support to other MPs
including social and biodiversity conservation aspects especially in the logistic support of planned
field activities
Procedures for determining the permanent sample plots (PSPs) and measurement
The calculation of the stock and increase in forest biomass will be subsidized through the
installation of PSPs in the PA and its temporal monitoring through the Continuous Forest Inventory
(CFI) The methodology proposed by VCS (2011) suggests the use of permanent andor temporary
plots however it confirms the efficiency and accuracy of sample plots
In order to demonstrate the procedural and statistical rigor used all the sampling procedures the
PA forest stratification sampling design calculation of sampling intensity and other parameters
measured in PSPs to monitor biomass balance due to ingressmortality of individuals growth in
DBH and height will be presented in detail in the Annex (Annex 23 - Forest Inventory 2016)
To promote reliable forest biomass estimates standard operating procedures (SOPs) (Section 82)
will be used by the team executing the CFI
Monitoring frequency
The monitoring frequency parameters measured in the PSPs will be no greater than 5 years from
the first measurement Other relevant parameters to monitoring the PSPs like the change in land
use in the PA and surrounding areas such as deforestation forest degradation fire sources and
natural disturbances will be regularly monitored as a project routine operation organized and
archived annually
411 Monitoring Impacts to Biodiversity
Since animal inventories have not been conducted in Amazon Rio project areas (for this project
biological information for the Rio Amapaacute RDS management plan were used) a biodiversity
monitoring system that will follow the RAPELD methodology (Rapid surveys of various taxonomic
groups (RAP) for long-term ecological studies) (MAGNUSSON et al 2005)
The RAPELD method contributes to long-term research using rapid inventory assessments biotic
complementarity and land use planning in the Amazon This method increases adequate sampling
17Linking community monitoring to national Measurement Reporting and Verification for REDD+
MONITORING amp IMPLEMENTATION REPORT VCS Version 3 CCB Standards Third Edition
v30 37
probability of biologically diverse communities which require large areas and at the same time
minimize variation of abiotic factors that affect these communities with smaller areas sampling
Evaluation and selection of indicators will be conducted in accordance with the ProBUC model
however applicably to local reality results will be updated biennially from the first survey
Biodiversity indicators are being designed and planned as suggested in the Social and
Environmental Monitoring System of Protected Areas in the Brazilian Amazon (Sistema de
Monitoramento Socioambiental das Unidades de Conservaccedilatildeo da Amazocircnia Brasileira)1819
and
Methodology for Rapid Assessment and Prioritization of Protected Areas Management20
(Metodologia para Avaliaccedilatildeo Raacutepida e Priorizaccedilatildeo do Manejo de Unidades de Conservaccedilatildeo -
RAPPAM) in line with the experiences gained and disseminated by CEUC and ICMBIO previously
described
The empowerment accountability and shared management of biodiversity conservation is the
main focus of the methodological model adopted These actions create high expectations for
environmental management of the area as the biodiversity monitoring will be conducted by the
community members themselves along with the project proponent promoting a local multiplier
effect It is worth mentioning that strict compliance with these procedures is in within EBCF`s
interest since it considers them to be key to the success of the project
The project begins with the premise that any negative impact on biodiversity in the project area
and its surroundings will not occur In the opposite sense the project aims to generate and provide
greater understanding of the territory subsidizing proposals for the conservation and sustainable
use through adoption of good management practices of natural resources as well as its replication
in other locations
412 Monitoring Social Impacts
The monitoring of social aspects include both the collection of numerical data such as quantity
volume weight (quantitative indicators) as well as information expressing opinions and
experiences (qualitative indicators) remembering that such measures are compatible and
interchangeable Data collection should be systematic and have a pre-established rate and most
likely a single indicator will require several data collection instruments such as plans field records
reports etc
Social information will be monitored through the use of participatory methodologies In this sense
the preparation process of the Amazon Rio I RPDS Management Plan was a first step For the
18Indicator Design 19Social and Environmental Monitoring of Protected Areas System in the Brazilian Amazon (Sistema de Monitoramento
Socioambiental das Unidades de Conservaccedilatildeo da Amazocircnia Brasileira) 20Metodologia para Avaliaccedilatildeo Raacutepida e a Priorizaccedilatildeo do Manejo de Unidades de Conservaccedilatildeo (RAPPAM)
MONITORING amp IMPLEMENTATION REPORT VCS Version 3 CCB Standards Third Edition
v30 38
socioeconomic characteristics of communities several community meetings land use mapping
workshops and interviews with focus groups were held in addition to field visits (Annex 10) The
main activities of the project were presented and discussed in these events emphasizing the
importance and timeliness of local valuation of environmental services as well as strategies for
raising funds to implement other projects and improvements in social well-being of communities
around the PA
5 MEASUREMENT OF GHG EMISSIONS REDUCTIONS AND REMOVALS (CLIMATE)
51 Emissions Baseline
EBCF did not carry out any wood related exploration activity in the areas since the beginning of
the REDD+ project Thus it is confirmed estimated emission reductions for the project as
8678833 t CO2eq t year
52 Project emissions
Project emissions were primarily those related to the running of offices and necessary travels for
studies meetings presentations workshops and other activities Table 10 presents a summary of
emissions based on data from Annex 21 of this report
Table 05 - 2011-2016 Project Activity Emissions
YEAR Energy
(KWh)
Energy
(t CO2eq)
Travels
(Km)
Travels
(t CO2eq)
Total
(t CO2eq)
2010
678 024 024
2011
104010 2360 2360
2012 1149 008 55724 1573 1581
2013 2756 028 236749 5429 5457
2014 2498 025 15789 459 484
2015 2231 023 27340 597 620
2016 1015 010
010
093 440290 10443 10536
53 Leakage
Not applicable according to presentation made on the REDD+ IFM document
MONITORING amp IMPLEMENTATION REPORT VCS Version 3 CCB Standards Third Edition
v30 39
54 Summary of GHG Emission Reductions And Removals
EBCF REDD+ project shows emissions reduction of 34397563 tCO2e as the balance in the
period of 2011-2015 Table 06 shows the overview of the dynamics of reductions and project
emissions up to 2048 By the year 2015 the emissions data is posted as seen in reports and from
2016 data are projects as previous average and should be adjusted as a result of future reports
Table 06 - Summary of ex ante estimates
Year
Estimated
reductions
from
baseline21
(tCO2e)
Project
Estimated
emissions 22
tCO2e)
Unplanned
estimate
Emissions23
(tCO2e)
Net GHG
Estimated
emissions
Reduction
(tCO2e)
2012 8675500 1581 0 8673919
2013 8675500 5457 0 8670043
2014 8675500 484 296296 8378720
2015 8675500 620 0 8674880
2016 8675500 2100 0 8673400
2017 8675500 2100 0 8673400
2018 8675500 2100 0 8673400
2019 8675500 2100 0 8673400
2020 8675500 2100 0 8673400
2030 8675500 2100 0 8673400
2048 8675500 2100 0 8673400
Total 3123180 25203 296296 3119989
55 Climate Change Adaptation Benefits (GL1)
There is a relatively widespread understanding in the scientific community that balanced
ecosystems have greater ecological and social resilience and adaptability to climate change
21
See annex 18 22
See annex 21 23
See annex 24- HDOM (Study on deforestation and heat spots for EBCF REDD+ Project technical report)
MONITORING amp IMPLEMENTATION REPORT VCS Version 3 CCB Standards Third Edition
v30 40
whether through protection of water bodies and regulation of river flows during peak flood and
drought or through the regular supply of environmental services products and services
Thus once the project is designed to conserve an area of native forest which in the absence of
the project scenario would remain subject to the pressure of timber management (baseline) and
consequent degradation resulting from such activities it is understood that the mere protection of
these areas alone would offer communities and the ecosystem itself better adaptability compared
to the baseline scenario
Moreover the project has an Activity Management Plan (Annex 9) which details among other
initiatives the promotion of the sustainable use of ecosystem resources through direct support in
some activities related to income generation and conservation along with community training It is
believed that in addition to ensuring a more balanced (and therefore more resilient) environment
the project will expand the options for generating income among the communities making them
more resilient and preparing them to face the greater and already perceived challenges posed by
climate change
6 COMMUNITY
61 Positive Impacts for Communities (CM1)
EBCFrsquos REDD+ project was first presented to the riverine communities in 2011 By then
communities were informed about the cessation of all timber exploration activities due to the
REDD+ project and discussions were held regarding biodiversity conservation and the sustainable
use of forest products and services as well the social development of the surrounding
communities Briefly the positive impacts along the communities were
1 Project area zoning and its surroundings
2 Contribution to building local capacity
3 Contribution to developing sustainable business in the region
4 Contribution to social and environmental diagnosis
Knowing to manage
To evaluate the progress of these initiatives throughout the development of the project we used
the methodology of the Sustainability Matrix developed by the Secretariat of Environment and
MONITORING amp IMPLEMENTATION REPORT VCS Version 3 CCB Standards Third Edition
v30 41
Sustainable Development of Amazonas State This tool was applied in 15 communities taking into
account local socio-economic aspects that underlie the development of 20 parameters considered
of great importance to community development described by specific indicators As a visual tool
the Sustainability Matrix is quite suitable for traditional populations such as the riverside and
indigenous communities surrounding the Reserve Amazon River I and other areas of the Project
Additionally the Matrix provides interesting spaces for discussion since its construction is done
collectively Through the Sustainability Matrix it was possible to identify along with the
communities projects activities and implementation strategies Budgets and monitoring and
evaluation of these projects will be detailed later through the Annual Operational Plans to be
developed and followed up in the due course Four programs and nine subprograms were defined
for management and community development (Annex 9)
62 Negative Impacts (CM2)
No negative impacts have been recorded or identified as a result of the project with stakeholders
7 BIODIVERSITY
71 Positive Impacts for Biodiversity (B1)
The benefits for biodiversity are in reducing deforestation and degradation (selective logging) in the
project area According to satellite images analysis in the project areas and their surroundings it
was observed that until 2010 300 hectares were deforested After the implementation of the
project community awareness on the importance of preservation and conservation of forests have
encouraged no deforestation degradation and a significant reduction in deforestation was
identified (see graph below) This was due to the good understanding of the projects conservation
objectives and by the involvement and support of the surrounding communities
MONITORING amp IMPLEMENTATION REPORT VCS Version 3 CCB Standards Third Edition
v30 42
Figure 10 - EBCF REDD Project and buffer areas deforestation figures (source HDOM Report)
The consequences of deforestation and degradation on biodiversity are well known Thus the fact
of not being identified changes (natural or anthropogenic) in forest areas shows there was no loss
of biodiversity no reduction in floristic diversity no impact on the dynamics of fauna and flora and
no loss of evolutionary genetic information
72 Negative Impacts on Biodiversity (B2)
There are no negative impacts on biodiversity as a result of the project
73 Exceptional Benefits for Biodiversity (GL3)
The description of exceptional benefits for biodiversity will only be possible after the re-
measurement of permanent plots (FLORA)
8 ADICIONAL INFORMATION
All activities and the consequent reduction in deforestation and degradation in and around the
project areas were maintained and funded without resources of carbon credits We understand that
with the advance of REDD+ project EBCF will have much better conditions to implement positive
actions in partnership with communities
MONITORING amp IMPLEMENTATION REPORT VCS Version 3 CCB Standards Third Edition
v30 43
REFERENCES
ADEODATO S etal Madeira de ponta a ponta o caminho da floresta ateacute o consumo Satildeo Paulo
FGV-RAE 2011
ALBAGLI S Amazocircnia fronteira geopoliacutetica da biodiversidade Revista Parcerias Estrateacutegicas n
12 p6 set2001 Centro de Estudos Estrateacutegicos do Ministeacuterio da Ciecircncia e Tecnologia
AMARAL I C Viabilidade de plantio de cafeacute na zona da mata mineira Revista Poliacutetica Agriacutecola
Ano xx n4 outnovdez 2011 Disponiacutevel em
httpwwwalicecnptiaembrapabrbitstreamdoc9309031Viabilidadedeplantiopdf Acesso
em 17 de set 2013
AMARAL P etal Floresta para Sempre um manual para a produccedilatildeo de madeira na Amazocircnia
Beleacutem IMAZON 1998 130p
AMAZONAS Lei Complementar nordm 532007 de 05062007 REGULAMENTA o inciso V do artigo
230 e o sect 1ordm do artigo 231 da Constituiccedilatildeo Estadual institui o SISTEMA ESTADUAL DE
UNIDADES DE CONSERVACcedilAtildeO - SEUC dispondo sobre infraccedilotildees e penalidades e
estabelecendo outras providecircncias Disponiacutevel em
httpwwwcetesbspgovbruserfilesfilemudancasclimaticasproclimafilelegislacaoestadua
lamazonasleilei_complementar_n_53_2007_amazonaspdf Acessado em Setembro 2013
ANTAQ Anuaacuterio Estatiacutestico 2004 Distacircncia entre os portos Disponiacutevel em
httpwwwantaqgovbrportalanuariosportuario2004TabelasDistanciaEntrePortospdf
Acesso em 23 de out 2013
ANTAQ Panorama Aquaviaacuterio Agecircncia Nacional de Transportes Aquaviaacuterios Volume 3 Brasiacutelia
ndash DF 2009
MONITORING amp IMPLEMENTATION REPORT VCS Version 3 CCB Standards Third Edition
v30 44
AREDES A F PEREIRA M W G Anaacutelise econocircmica da produccedilatildeo de cafeacute araacutebica um estudo
de caso com simulaccedilotildees de Monte Carlo para sistemas de baixa e alta produtividade
Informaccedilotildees Econocircmicas SP v38 n4 abr 2008
ARIMA E UHL C Pecuaacuteria na Amazocircnia Oriental Desempenho Atual e Perspectivas Futuras Seacuterie
Amazocircnia n1 Beleacutem IMAZON 1996 40p
BACCINI A et al Estimated carbon dioxide emissions from tropical deforestation improved by
carbon-density maps Nature Climate Change vol2 march 2012 (LETTERS Published
Online - DOI 101038NCLIMATE1354)
BARROS A C UHL C Padrotildees problemas e potencial da extraccedilatildeo madeireira ao longo do Rio
Amazonas e do seu estuaacuterio Seacuterie Amazocircnia n4 Beleacutem IMAZON 1997 42p
BRASIL Lei 121872009 (Lei Ordinaacuteria) 29122009 Institui a Poliacutetica Nacional sobre Mudanccedila
do Clima - PNMC e daacute outras Providecircncias Presidecircncia da Repuacuteblica Casa Civil Subchefia
para Assuntos Juriacutedicos Disponiacutevel em lthttpswwwplanaltogovbrccivil_03_ato2007-
20102009leil12187htmgt Acesso em 20 de set 2013
CAMPOS E F Emissatildeo de CO2 da madeira serrada da Amazocircnia o caso da exploraccedilatildeo
convencional 2012 172p Dissertaccedilatildeo - Escola Politeacutecnica Universidade de Satildeo Paulo Satildeo
Paulo
CARDOSO RS e FREITAS C E C A pesca de pequena escala no rio Madeira pelos
desembarques ocorridos em Manicoreacute (Estado do Amazonas) Brasil Revista Acta
Amazocircnica vol 38(4) 2008 781 ndash 788
CCBA Climate Community and Biodiversity Alliance-CCBA 2008 Disponiacutevel em
httpwwwclimate-standardsorgccb-standards Acesso em 03 de set 2013
MONITORING amp IMPLEMENTATION REPORT VCS Version 3 CCB Standards Third Edition
v30 45
CEPEA Centro de Estudos Avanccedilados em Economia Aplicada - ESALQUSP Economia da
pecuaacuteria de corte na regiatildeo norte do Brasil Disponiacutevel em httpgooglL2roiA Acesso em
15 de out 2013
CHAMBERS J Q et al Decomposition and carbon cycling of dead trees in tropical forests of the
central Amazon Oecologia vol122 pp380-388 2000 Agricultores se queixam de
burocracia para contratar creacutedito sustentaacutevel do Programa ABC Correio Braziliense Brasiacutelia
26 fev 2012 Disponiacutevel em
lthttpwww2correiobraziliensecombrsersustentavelp=4592gt Acesso em 10 set 2013
CULLEN Jr L VALLADARES-PAacuteDUA C Onccedilas como detetives da paisagem Ciecircncia Hoje
Vol 156 n26 pp54-571999
CPRM - Serviccedilo Geoloacutegico do Brasil Disponiacutevel em httpwwwcprmgovbr Acesso em 13 de
mar 2013
DIAS F M MORAIS S J S REZENDE R C Anaacutelise da viabilidade econocircmica para a
produccedilatildeo de melancia e cenoura com financiamento em Anaacutepolis-GO 2008 Disponiacutevel em
httpwwwprpuegbr06v1conteudopesquisainiccieneventossic2008fronteiraflashsicani
macaoIIIJORNADAarquivosresumosresumo01pdfgt Acesso em 18 de nov2013
Divisatildeo de Precessamento de Imagens (DPI) Ambdata Mapa de Vegetaccedilatildeo SIPAM RADAM
2002 Disponiacutevel em httpwwwdpiinpebrAmbdatamapa_sipamphp Acesso em 21 de
out 2013
DOMINGUES MS BERNMANN C O arco de desflorestamento na Amazocircnia da pecuaacuteria agrave
soja Ambiente amp Sociedade Satildeo Paulo vol15 n2 pp1-22 maioago 2012
MONITORING amp IMPLEMENTATION REPORT VCS Version 3 CCB Standards Third Edition
v30 46
EBCF Criaccedilatildeo da primeira reserva particular de desenvolvimento sustentaacutevel do mundo na
floresta amazocircnica Disponiacutevel emlthttpwwwebcfcombrblog20130624criacao-da-
primeira-reserva-particular-de-desenvolvimento-sustentavel-do-mundo-na-floresta-
amazonicagt Acesso em 21 de set 2013
EMBRAPA Sistema Brasileiro de Classificaccedilatildeo de Solos 2ordf Ed Rio de Janeiro Embrapa Solos
2006 306 p
FELDPAUSCH T R et al When big trees fall Damage and carbon export by reduced impact
logging in southern Amazonia Forest Ecology and Management Vol 219 pp199-215 2005
FEARNSIDE P MDesmatamento na Amazocircnia dinacircmica impactos e controle Acta Amazocircnica
vol 36 n3 pp 395-400 2006
FILGUEIRAS T S et al 1994 Caminhamento Um meacutetodo expedito para levantamentos
floriacutesticos qualitativos Caderno de Geociecircncia IBGE vol12 pp39-43 1994
Forest Management Public Summary for Gethal Amazonas SA Induacutestria de Madeira
Compensada Certification Code SW-FMCOC-119 Date of Certification October 1
2000 Date of Public Summary October 2000 Updated for Annual Audit 2002 Annual Audit
2003 (Gethalpdf)
Globo Rural Linha de financiamento para a agricultura de baixo carbono tem pouca procura
2011 Disponiacutevel em httpwwwrainforest-allianceorgforestrydocumentsgethalpdf
Acesso em 16 de nov 2013
GREENPEACE Face a Face com a Destruiccedilatildeo Relatoacuterio Greenpeace sobre as companhias
multinacionais madeireiras na Amazocircnia Brasileira 1999 Disponiacutevel em
MONITORING amp IMPLEMENTATION REPORT VCS Version 3 CCB Standards Third Edition
v30 47
lthttpwwwgreenpeaceorgbramazoniaface_destruicaopdfgt Acesso em 11 de set
2013
Governo do Estado do Amazonas Plano de Gestao da RDS do Rio Amapaacute 2010 Disponiacutevel em
httpobservatoriowwforgbrsite_mediauploadgestaoplanoManejorio_amapapdf Acesso
em 24 de ago 2013
HDOM Estimates from processing the forest inventories data carried out during the CADAF
Project Final Technical Report 2012 Disponiacutevel em wwwhdomcombr Acesso em 27 de
maio 2013
HIGUCHI N 1986-87 Amostragem sistemaacutetica versus amostragem aleatoacuteria em floresta tropical
uacutemida de terra-firme na regiatildeo de Manaus Acta Amazonica 1617 (uacutenico) 393-400
HIGUCHI N SANTOS J JARDIM FCS Tamanho de parcela amostral para inventaacuterios
florestais Acta Amazocircnica vol12 n1 pp91-103 1982
HIGUCHI F G PINTO A C M ISHIZUKA M KAJIMOTO T LIMA A J N SANTOS J
HIGUCHI N Estoque e dinacircmica de biomassa acima do solo das florestas de terra firme do
estado do Amazonas In Adriano Joseacute Nogueira Lima Flaacutevia Machado Durgante Moacir
Alberto Assis Campos Joaquim dos Santos Moriyoshi Ishizuka Niro Higuchi (Org)
Dinacircmica do carbono das florestas da Amazocircnia resultados do Projeto CADAF
1edManaus INPA 2014 v 1 p 29-34
HOLMES T P etal Custos e benefiacutecios financeiros da exploraccedilatildeo de impacto reduzido em
comparaccedilatildeo agrave exploraccedilatildeo florestal convencional na Amazocircnia oriental 2ordf ed Beleacutem
Fundaccedilatildeo Floresta Tropical 2002 66p
HUSCH B MILLER C I BEERS T W Forest mensuration New York Ronald Press 1971
HUSCH B MILLER C I BEERS T W Forest Mensuration New York John Wiley amp Sons
2nd
ed 1972 402 p
MONITORING amp IMPLEMENTATION REPORT VCS Version 3 CCB Standards Third Edition
v30 48
IBGE Instituto Brasileiro de Geografia e Estatiacutestica Diretoria de GeociecircnciasCoordenaccedilatildeo de
Recursos Naturais e Estudos Ambientais Geologia Solos Hidrografia e Vegetaccedilatildeo 2000
IBGE Instituto Brasileiro de Geografia e Estatiacutestica Manicoreacute 2010 Disponiacutevel
emlthttpwwwsidraibgegovbrgt Acesso em 05 de set 2013
IBGE Instituto Brasileiro de Geografia e Estatiacutestica 2011 Disponiacutevel em httpwwwibgegovbr
Acesso em 19 de mar 2013
IBGE Instituto Brasileiro de Geografia e Estatiacutestica Extraccedilatildeo vegetal e silvicultura para o
municiacutepio de Manicoreacute 2011 Disponiacutevel em
lthttpcidadesibgegovbrxtrastemasphplang=ampcodmun=130270ampidtema=102ampsearch=a
mazonas|manicore|extracao-vegetal-e-silvicultura-2011gt Acesso em 10 de out 2013
IBGE Instituto Brasileiro de Geografia e Estatiacutestica Censo Demograacutefico 2010 Disponiacutevel em
lthttpcidadesibgegovbrxtrastemasphpcodmun=130270ampidtema=116gt Acesso em 18
de out 2013
IBGE Instituto Brasileiro de Geografia e Estatiacutestica Censo Demograacutefico 2010 Disponiacutevel
emlthttpcidadesibgegovbrxtrashomephpgt Acesso em 08 de out 2013
IDESAM Reduccedilotildees de Emissotildees do Desmatamento e Degradaccedilatildeo Florestal (REDD+) estudo de
oportunidades para a regiatildeo sul do Amazonas CENAMO M Cl CARRERO G C
GANDOLFO P (Org) Manaus 2011 Disponiacutevel em
lthttpwwwobservatoriodoreddorgbrsitepdfestudodeoportunidadespdfgt Acesso em 13 de
set 2013
MONITORING amp IMPLEMENTATION REPORT VCS Version 3 CCB Standards Third Edition
v30 49
IDESAM Semeando Sustentabilidade em Apuiacute ndash Resultados e Perspectivas 2011 Manaus
Disponivel em lthttpidesamorgbrsemeando-sustentabilidade-em-apui-resultados-e-
perspectivasUxX8nfldWYI
IEA Instituto de Economia Aplicada CO2 Emissions from fuel combustion 2012 Disponiacutevel em
httpwwwieaorgco2highlightsco2highlightspdf Acesso em 09 de out 2013
IGREJA H L S CATIQUE J Anaacutelise neotectocircnica do lineamento de Itacoatiara centro leste do
Estado do Amazonas In Simpoacutesio Nacional de Estudos Tectocircnicos 6 1997 Pirenoacutepolis
Anais Pirenoacutepolis-GO SBG-Nuacutecleo Brasiacutelia1997
IMAZON Instituto do Homem e do Meio Ambiente da Amazocircnia Fatos Florestais 2010a
Disponiacutevel em httpwwwimazonorgbrpublicacoeslivrosfatos-florestais-da-amazonia-
2010-1 Acesso em 14 de out 2013
IMAZOM Instituto do Homem e do Meio Ambiente da Amazocircnia Mercado e preccedilo da madeira
amazocircnica 2010 Disponiacutevel em httpwwwimazonorgbrpublicacoesprecos-de-madeira-
em-toraboletim-de-precos-de-madeira-em-tora-na-amazonia-julho-2010at_downloadfile
Acesso em 23 de nov 2013
IMAZON Instituto do Homem e do Meio Ambiente da Amazocircnia Portal de Geoinformaccedilatildeo sobre
a Amazocircnia Disponiacutevel em lthttpwwwimazongeoorgbrimazongeophpgt Acesso em 06
de set 2013
IMAZON Instituto do Homem e do Meio Ambiente da Amazocircnia Transparecircncia florestal
Amazocircnia Legal 2012 Disponiacutevel em lthttpwwwimazonorgbrpublicacoestransparencia-
florestaltransparencia-florestal-amazonia-legalcopy_of_SADOutubro2012pdfgt Acesso em
23 de set 2013
IMAZON Instituto do Homem e do Meio Ambiente da Amazocircnia PEREIRA D SANTOS D
VEDOVETO M GIMARAtildeES J VERIacuteSSIMO A (Orgs) Fatos Florestais da Amazocircnia
Beleacutem IMAZON 2010 244p Disponiacutevel em
MONITORING amp IMPLEMENTATION REPORT VCS Version 3 CCB Standards Third Edition
v30 50
lthttpwwwimazonorgbrpublicacoeslivrosfatos-florestais-da-amazonia-2010-1gt Acesso
em 24 de set 2013
IMAZON Instituto do Homem e do Meio Ambiente da Amazocircnia A Expansatildeo madeireira na
Amazocircnia Impactos e perspectivas para o desenvolvimento sustentaacutevel no Paraacute BARROS
AC VERIacuteSSIMO A (Eds) Beleacutem IMAZON 2002
IMAZON Instituto do Homem e do Meio Ambiente da Amazocircnia Custos e Benefiacutecios do Manejo
Florestal Para Produccedilatildeo de Madeira na Amazocircnia Oriental 1998 Disponiacutevel em
lthttpwwwimazonorgbrpublicacoesserie-amazoniacustos-e-beneficios-do-manejo-
florestal-para-producao-de-madeira-na-amazonia-orientalgt Acesso em 20 de set 2013
INPE Instituto de Pesquisas Espaciais Banco de dados PRODES 2012 Disponiacutevel em
lthttpwwwdpiinpebrprodesdigitalprodesphpgt Acesso em 09 de set 2013
INPE Instituto de Pesquisas Espaciais Banco de dados DEGRAD 2009 Disponiacutevel em
lthttpwwwobtinpebrdegradgt Acesso em 09 de set 2013
INPE Instituto de Pesquisas Espaciais Banco de dados DETER 2013 Disponiacutevel em
lthttpwwwobtinpebrdetergt Acesso em 10 de set 2013
INPE Instituto de Pesquisas Espaciais Banco de dados de queimadas e focos de calor
BDQUEIMADAS 2013 Disponiacutevel em lthttpwwwdpiinpebrproarcobdqueimadasgt
Acesso em 10 de set 2013
Instituto Carbono Brasil Soacute 2 da produccedilatildeo de madeira eacute certificada O Estado de SPaulo 2006
Disponiacutevel em lthttpwwwinstitutocarbonobrasilorgbrnoticias6noticia=119796gt Acesso
em 26 de set 2013
MONITORING amp IMPLEMENTATION REPORT VCS Version 3 CCB Standards Third Edition
v30 51
IFT Instituto Floresta Tropical Diagnoacutestico do Setor Florestal de Cotriguaccedilu Estado do Mato
Grosso 2010 Disponiacutevel em lthttpgooglEVx2RZgt Acesso em 16 de dez 2013
IPCC Guidelines for National Greenhouse Gas Inventories In National Greenhouse Gas
Inventories Programme EGGLESTON HS BUENDIA L MIWA K NGARA T TANABE
K (Eds) Japan IGES 2006
ITTO Annual review and assessment of the world timber situation 2011 Disponivel em
httpwwwittointannual_review Acesso em 10 de out 2013
KELLER M et al Coarse woody debris in undisturbed and logged forests in the eastern Brazilian
Amazon Global Change Biology vol10 PP784-795 2004
LENTINI M VERISSIMO A PEREIRA D A expansatildeo madeireira na Amazocircnia O Estado da
Amazocircnia n2 2005 Beleacutem IMAZON Disponiacutevel em
httpwwwimazonorgbruploadea_2ppdf Acesso em 06 de set 2013
LOETSCH F ZOumlHRER F HALLER K E Forest Inventory Munich BLV Verlagsgesellschaft
2nd
edition Vol II 1973 469 p
MAGNUSSON WE et al RAPELD uma modificaccedilatildeo do meacutetodo de Gentry para inventaacuterios de
biodiversidade em siacutetios para pesquisa ecoloacutegica de longa duraccedilatildeo Biota Neotrop JulDez
2005 vol 5 no 2 httpwwwbiotaneotropicaorgbrv5n2ptabstractpoint-of-
view+bn01005022005 ISSN 1676-0603
MARINELLI C E et al O programa de monitoramento da biodiversidade da biodiversidade e do
uso de recursos naturais em unidades de conservaccedilatildeo estaduais do Amazonas Secretaria
de Estado do Meio Ambiente e Desenvolvimento Sustentaacutevel - SDS Manaus SDS 2007
MONITORING amp IMPLEMENTATION REPORT VCS Version 3 CCB Standards Third Edition
v30 52
MARINELLI C E MALTEZ M H Indicadores de Sustentabilidade para Unidades de
Conservaccedilatildeo Documento-Siacutentese Workshop Instituto Socioambiental Brasiacutelia-DF 2010
76p
MAZZEI L et al Above-ground biomass dynamics after reduced-impact logging in the Eastern
Amazon Forest Ecology and Management vol 259 pp367-373 2010
MEIRELLES FILHO O Livro de Ouro da Amazocircnia 5ordf Ediccedilatildeo Rio de Janeiro EDIOURO 2007
422p Meirelles Filho J O Livro de Ouro da Amazocircnia 1ordf ed Editora Ediouro ISBN
8500021616 2007 450p
MENGER Juliana da Silva Fatores determinantes da distribuiccedilatildeo de aves no interfluacutevio Purus-
Madeira Manaus [sn] 2011 35 fl il
MCT Arquivos dos Fatores de Emissatildeo Disponiacutevel em
httpwwwmctgovbrindexphpcontentview321144htmlancora Acesso em 23 de out
2013
MMA Ministeacuterio do Meio Ambiente Avaliaccedilatildeo e identificaccedilatildeo de accedilotildees prioritaacuterias para a
conservaccedilatildeo utilizaccedilatildeo sustentaacutevel e reparticcedilatildeo dos benefiacutecios da biodiversidade na
Amazocircnia brasileira Brasiacutelia MMASBF 2001
MMA Ministeacuterio do Meio Ambiente Secretaria de Biodiversidade e Florestas Aacutereas Prioritaacuterias
para Conservaccedilatildeo Uso Sustentaacutevel e Reparticcedilatildeo de Benefiacutecios da Biodiversidade Brasileira
Atualizaccedilatildeo - Portaria MMA ndeg9 de 23 de janeiro de 2007 Brasiacutelia MMA 2007 (Seacuterie
Biodiversidade 31)
MONITORING amp IMPLEMENTATION REPORT VCS Version 3 CCB Standards Third Edition
v30 53
MMA Livro vermelho da fauna brasileira ameaccedilada de extinccedilatildeo editores Angelo Barbosa
Monteiro Machado Glaacuteucia Moreira Drummond Adriano Pereira Paglia 1ed 2008 Brasiacutelia
DF MMA Belo Horizonte MG Fundaccedilatildeo Biodiversitas (1420 p) il - (Biodiversidade 19)
OLIVEIRA M M HIGUCHI N CELES C H HIGUCHI F G 2014 Tamanho e formas de
parcelas para inventaacuterios florestais de espeacutecies arboacutereas na Amazocircnia Central Ciecircncia
Florestal Santa Maria v 24 n 3 p 645-653
PEARSON TRH WALKER S BROWN SL The Source Book for Land Use Land Use
Change and Forestry Projects BioCarbon Fund and Winrock International 2005 64 pp
PORTAL AMAZOcircNIA Amazocircnia de A a Z Disponiacutevel em
lthttpportalamazoniaglobocomgt Acesso em 13 de set 2013
PEacuteLLICO NETTO S BRENA D A Inventaacuterio florestal Curitiba Editorado pelos autores p
316 1997
PROJETO SIVAM Relatoacuterio metodoloacutegico de trabalho Revisatildeo 3 Diretoria de Geociecircncia Rio de
Janeiro 2002 330 pp
PROJETO SIVAM Atualizaccedilatildeo do RADAMBRASIL Mapa de Vegetacao da Amazonia Legal
Mapa de Fitofisionomias ndash RADAMSIPAM DNPM Ministeacuterio de Minas e Energia 2002
Disponiacutevel em httpwwwdpiinpebramb_dataShapefilesveg_Amz_SIPAMzip Acesso
em 21 de jan 2014
PROJETO FLORESTAL SANTA MARIA (PROJETO FSM-REDD) Plant Inteligecircncia Ambiental ndash
Warwick Manfrinato 2012 Disponiacutevel em
lthttpwwwflorestalsantamariacombrsitedocumentos57FSM_REDD_VCS_PD_ptpdfgt
Acesso em 09 de set 2013
MONITORING amp IMPLEMENTATION REPORT VCS Version 3 CCB Standards Third Edition
v30 54
RADAMBRASIL Programa de Integraccedilatildeo Nacional Levantamentos de Recursos Naturais v 14 ndash
RADAM DNPM Ministeacuterio de Minas e Energia Brasil 1974
RIBEIRO J E L et al Flora da Reserva Ducke guia de identificaccedilatildeo das plantas vasculares de
uma floresta de terra firme na Amazocircnia Central Manaus Editora INPA 1999
ROSAS F C W WALDEMARIN H de MATTOS G E Pteronura rasiliensis (Zimmermann
1780) In MACHADO A B M DRUMMOND G M PAGLIA A P (eds) Livro Vermelho da
Fauna Brasileira Ameaccedilada de Extinccedilatildeo Volume II 1ed Brasiacutelia DF Ministeacuterio do Meio
Ambiente 2008 p 800 - 801
ROSS D GHG Emissions Resulting from Aircraft Travel 2009 Disponiacutevel em
httpwwwcarbonplanetcomdownloadsFlight_Calculator_Information_v92pdf Acesso em
14 de out 2013
SANTOS A J et al Viabilidade econocircmica do sistema agroflorestal greviacutelea x cafeacute na regiatildeo
norte do Paranaacute CERNE vol6 n1 pp89-100 2000
SANTOS R A Custo do manejo florestal madeireiro estudo de caso Floresta Estadual do
Antimary Monografia (Bacharelado em Economia) ndash Departamento de Ciecircncias
Econocircmicas Universidade Federal do Acre 2007109p
SABOGAL C et al Manejo Florestal Empresarial na Amazocircnia Brasileira restriccedilotildees e
oportunidades (Relatoacuterio Siacutentese) Beleacutem CIFORIMAZON 2006 72p
SDSCEUC Secretaria Estadual de Meio Ambiente e Desenvolvimento Sustentaacutevel ndash Centro
Estadual de Unidades de Conservaccedilatildeo Programa de Monitoramento de Biodiversidade e
Uso de Recursos Naturais em Aacutereas Protegidas do Estado Amazonas (ProBUC) 2006
Disponiacutevel em
MONITORING amp IMPLEMENTATION REPORT VCS Version 3 CCB Standards Third Edition
v30 55
httpbrazilwcsorgDesktopModulesBring2mindDMXDownloadaspxEntryId=6168ampPortalI
d=93ampDownloadMethod=attachment Acesso em 11 de ago de 2013
SFBIMAZON Serviccedilo Florestal Brasileiro e Instituto do Homem e Meio Ambiente da Amazocircnia A
atividade madeireira na Amazocircnia brasileira produccedilatildeo receita e mercados 2010 Disponiacutevel
em httpwwwmmagovbrestruturassfb_arquivosmiolo_resexec_polo_03_95_1pdf
Acesso em 23 de out 2013
SILVA R P da Alometria estoque e dinacircmica da biomassa de florestas primaacuterias e
secundaacuterias na regiatildeo de Manaus (AM) 152 p Tese de Doutorado Programa Integrado
de Poacutes-graduaccedilatildeo em Biologia Tropical e Recursos Naturais (INPA) Manaus 2007
SILVA Z A G P G SANTOS R A Custo do manejo florestal madeireiro em floresta puacuteblica
estudo de caso no Acre 2011 Disponiacutevel em
lthttpwwwbasacombrbancoamazonia2Revistaedicao_13n13_custo_do_manejo_flores
pdfgt Acesso em 13 de set 2013
SMIDT M GALLAGHER T Factors Affecting Fuel Consumption and Harvesting Costs Auburn
School of Forestry and Wildlife Sciences Sd Disponiacutevel em
httpweb1cnrevteduforestrycofedocuments2013Smidt_Gallagherpdf Acesso em 21
de out 2013
SOARES-FILHO B et al Role of Brazilian Amazon protected areas in climate change mitigation
2010 Columbia University NY Ruth S DeFries 2010
SPF Serviccedilo Puacuteblico Federal DVPF Documento de venda de produto Florestal (Declaraccedilotildees de
venda Gethalpdf) 14 de julho de 2006
MONITORING amp IMPLEMENTATION REPORT VCS Version 3 CCB Standards Third Edition
v30 56
TIMOFEICZYK JUacuteNIOR R et al Rentabilidade econocircmica do manejo de baixo impacto em
florestas tropicais um estudo de caso Revista Floresta Curitiba v 38 n 4 p 711-725
outdez 2008
VCS Ferramenta para Demonstraccedilatildeo e Avaliaccedilatildeo de Adicionalidade para Atividades de Projetos
VCS em Agricultura Floresta e Outros Usos (AFOLU) 2012a Disponiacutevel em httpwwwv-c-
sorgsitesv-c-sorgfilesVT000120VCS20AFOLU20Additionality20Tool20v30pdf
Acesso em 24 de set 2013
VCS Ferramenta de Risco e Natildeo Permanecircncia (AFOLU) 2012B Disponiacutevel em httpv-c-
sorgsitesv-c-sorgfilesAFOLU20Non-Permanence20Risk20Tool2C20v32pdf
Acesso em 13 de set 2013
VCS Approved VCS Methodology VM0010 Version 10 - Methodology for Improved Forest
Management Conversion to Logged to Protected Forest Calculating GHG Benefits from
Preventing Planned Degradation PHUA S SHARMA S TELFER M CHANDLER H
(Eds) Califoacuternia EUA Carbon Planet Limited 2011149p
VERDEJO M E Diagnoacutestico Rural Participativo um guia praacutetico Brasiacutelia MDA 2006 62p
VIANNA A L M Diagnoacutestico Florestal do Estado do Amazonas 2010 e 2011 Manaus-AM
IDESAM 2013 (Relatoacuterio Final do Projeto Fortalecimento da participaccedilatildeo da sociedade civil
no Amazonas Foacuterum de Mudanccedilas Climaacuteticas Transparecircncia Florestal no Estado do
Amazonas ndash Mapeamento de Instrumentos Legislativos no Brasil)
WBCSDWRI The GHG Protocol for Project Accountin Washington World Business Council for
Sustainable DevelopmentWorld Resources Institute 2005148 p
MONITORING amp IMPLEMENTATION REPORT VCS Version 3 CCB Standards Third Edition
v30 57
WALKER W et al Guia de Campo para Estimativa de Biomassa Florestal e Estoque de Carbono
Woods Hole Center Research Falmouth Massachusetts USA 2011 Disponiacutevel em
httpwwwwhrcorgresourcesfieldguidescarbonpdfWHRC_FieldGuide_PortugueseSMpdf
Acesso em 14 de set 2013
WWF Metodologia para Avaliaccedilatildeo Raacutepida e a Priorizaccedilatildeo do Manejo de Unidades de
Conservaccedilatildeo (RAPPAM) 2010 Disponiacutevel em httpgooglXfDnxs Acesso em 30 de set
2013
WWF-Brasil Efetividade de Gestatildeo das Unidades de Conservaccedilatildeo no Estado do Amazonas
Secretaria de Estado do Meio Ambiente e do Desenvolvimento Sustentaacutevel do Amazonas
Instituto Chico Mendes de Conservaccedilatildeo da Biodiversidade Brasiacutelia WWF-Brasil 2011 72 p
MONITORING amp IMPLEMENTATION REPORT VCS Version 3 CCB Standards Third Edition
v30 12
The project will be implemented starting from the introduction of participatory processes ensuring
active involvement of the local communities around the area as in the aforementioned
development programs and in decision-making The community programs that aim to improve
access to health education and income generation will use the ldquoBolsa Florestardquo program as
reference a program of great relevance for payments for environmental services (PES) in the state
of Amazonas In the medium and long terms these programs intend to significantly improve the
living conditions of these communities strengthening their organizational and institutional capacity
including their productive environmental and financial sustainability
12 Project Objectives
General objective
The objectives of this project takes a holistic approach to the region and keep full affinity to the
recent statement of the United Nations in the design of the seventeen goals of Sustainable
Development2 (ODS) In this sense the project objectives have a direct relationship with some of
the ODS and take others as a source of inspiration for the implementation of activities in
partnership with local communities These guidelines will be key elements in the local discussion
process around the project activities
Thus it is assumed as a general objective of the project contribute to the maintenance of global
climate (goal 13) through the implementation of activities to prevent the emission of greenhouse
gases locally by replacing the forest selective logging for a project conservation of forest
biodiversity (goal 15) preserving the traditional culture of the population of surrounding
communities (goal 3) promoting income generation (goal 1 8) and contributing to local social
development (goals 2 5 4 6 7)
Specific objectives
Specifically the project aims to
2 The seventeen Sustainable Development Goals at the United Nations are (1) Ending poverty in all its
form everywhere (2) Ending eat hunger achieve food security improve nutrition (3) To ensure a healthy life and promote well-being for all (4) To ensure inclusive education equitable and quality (5) Achieving gender equality and empower all women (6) Ensure availability and sustainable water management (7) Ensure access energy reliable and sustainable (8) To promote sustained inclusive and sustainable economic growth (9) Building resilient infrastructure promote inclusive industrialization (10) To reduce inequality between and within countries (11) Making cities inclusive human settlements secure resilient (12) To ensure standards of sustainable consumption and production (13) Take urgent action to combat climate change (14) To preserve and promote the sustainable use of the oceans (15) To protect restore and promote the sustainable use of forests (16) To promote peaceful and inclusive societies for sustainable development (17) To strengthen the implementation mechanisms and revitalize the global partnership
MONITORING amp IMPLEMENTATION REPORT VCS Version 3 CCB Standards Third Edition
v30 13
1 Implement economic alternative activities to selective logging to generate revenue for the
project benefiting at least 300 families surrounding the target area
2 Reduce approximately 32 million tons of carbon dioxide as a result of project activities
3 To contribute to the maintenance of regional biodiversity through the preservation and
conservation of the forest
4 Contribute to improve educational processes and attention to regional health
5 Promote the inclusion and womens empowerment in the project area communities
13 Project location
Location
The Amazon Rio Project is located in the southern region of the state of Amazonas in the
municipality of Manicore (Figure 01) The waterway and air constitute arrival means to the city with
approximate distance of 333 km by air and 427 km by river is the starting point for the city of
Manaus the state capital The Project areas are near the Madeira River and between the
Sustainable Development Reserves (RDS) Rio Madeira and Rio Amapaacute (Figure 02)
Figure 01 - Location of the Municipality of Manicoreacute - AM
MONITORING amp IMPLEMENTATION REPORT VCS Version 3 CCB Standards Third Edition
v30 14
Figure 02 - Location areas I II III and IV of the Amazon Rio Project
Figure 03 - Project Zone and communities of the project
MONITORING amp IMPLEMENTATION REPORT VCS Version 3 CCB Standards Third Edition
v30 15
Specifically in the Amazon Rio area the dense Primary Tropical Ombrophylous Lowland Forest and
open Primary Tropical Ombrophylous Lowland Forest with palm trees (79) Dense Primary
Tropical Ombrophylous Alluvial Forest (11) Open Primary Tropical Ambrophylous Alluvial Forest
with palm trees (8) Pioneer Formations with fluvial andor lacustrine influence - herbaceous and
shrubby vegetation with palm trees (1) (Annex 5)
According to IBGEs soil database (2000) the Manicoreacute region is formed mainly of Latosols and
Argisols Also soils such as Gleysols Spodosols Alluvial soils Neosols Planosols Plinthosols and
Nitosols can be found The Brazilian Soil Classification System produced from surveys by the
Brazilian Agricultural Research company (EMBRAPA) between 2001 and 2006 corroborates the
classification information for that region
Alluvial soils are very common in this region These soils are found mainly on the banks of the
Madeira River The fertility levels are dystrophic and located on flat terrain Agricultural and
livestock activities are almost always practiced along the main alluvial stretches of the region The
most fertile soils that occur on the floodplains (vaacuterzea) are widely cultivated for temporary crops
such as beans rice watermelon and cassava
Climate and hydrography
The climate in the region of the Madeira River is humid equatorial (IBGE 2011) with an average
temperature of 27degC relative humidity ranging between 85 and 90 and annual rainfall between
2200 to 2800 mmyear (RADAMBRASIL 1974) Studies from the Amapaacute Rio RDS area indicate
that between the months of January and March rainfall intensity is greater with monthly rainfall
between 300 and 350 mm while the driest months are July and August with monthly averages
around 50 mm
Geographically the Amazon region is defined by watersheds formed by the rivers which flow into
the Amazon Rio and its mouth along the entire East coast of Brazil (RIBEIRO et al 1999) The
city of Manicoreacute is influenced mainly by the Madeira and Manicoreacute rivers which are respectively
white and black water rivers and contribute to the local climatic conditions combined with the
characteristics of the vegetation that includes forests meadows savanna (cerrado) and floodplains
(vaacuterzeas)
Economic context of land use
Southern Amazonas is an important region strategically to prevent advances in deforestation in the
Amazon However in recent years the region has been suffering successive deforestation events
from expanded farming activities contributing to the so-called arc of deforestation toward the
MONITORING amp IMPLEMENTATION REPORT VCS Version 3 CCB Standards Third Edition
v30 16
state of Amazonas Historically the arc of deforestation has advanced with the expansion of
agriculture in the states of Paraacute Mato Grosso Rondocircnia Tocantins and Maranhatildeo In recent
years pressures on forests have increased with the globalization of markets for meat and
soybeans in the Amazon and international development policies for the region (IDESAM 2011)
14 Project Proponent (G4)
Organization Name Empresa Brasileira de Conservaccedilatildeo de Florestas SA (EBCF)
Contact Person Leonardo Barrionuevo
Title President
Address Curitiba-PR Al Dr Carlos de Carvalho 555 Conj 231
Centro Curitiba ndash PR CEP 80430-180 Brazil
Escritoacuterio Manaus Av Djalma Batista 1661 Conj 1409 A Bloco B
Ed Business Tower Millenium Cep 69050-010 Manaus-AM Brazil
Telephone +55 41 3158 9800 | +55 41 9943 8005
Email leonardoebcfcombr
15 Other Entities Involved in the Project (G4)
Organization Name Original Trade Consulting
Role in the Project Update of the Amazon Rio REDD+ IFM Project Description (PD) (V20)
and coordination of certifcation process
Contact Person Joatildeo Batista Tezza Neto
Title Director
Address Avenida Andreacute Arauacutejo 2936 ndash Edifiacutecio Incubadora do INPA sala 10
Cep 69060-000 Manaus-AM Brazil
Telephone +55 92 981590997
Email tezzanetooriginaltradenet
MONITORING amp IMPLEMENTATION REPORT VCS Version 3 CCB Standards Third Edition
v30 17
Organization Name HDOM
Role in the Project Degradation and deforestation report Forest inventory for biomass
calculation purposes in the project area and support the PD review
Contact Person Francisco Higushi
Title Director
Address Av Maacuterio Ypiranga 315 Ed The Office sala 609 Adrianoacutepolis CEP
69057-002
Telephone + 55 92 98128 2561
Email fghiguchihdomcombr
11 Project Start Date
The project began on August 17 2012 when the board and EBCF shareholders formally approved
the companys Business Plan (Annex 27) which set out the objectives of conserving forests
through the REDD + provision of services and sustainable use of forest resources excluded
logging activities
12 Project Crediting Period
The first crediting period of the project is 37 years beginning on August 17 2012 and ending on 17
August 2049 This period is equivalent to the remaining 12 years of the first authorized
management plan (25 years from 1998) added to another 25 years in respect of a new forest
management plan that was intended as the common practice of forestry in Brazil The logging
activities could continue beyond 37 years aiming for a second crediting period
2 DESIGN
21 Sectoral Scope and Project Type
Project Scope Agriculture Forest and other Land Use (AFOLU)
Project Category Reduction Emission from Deforestation and Degradation from Planned
Deforestation (REDD-IFM)
MONITORING amp IMPLEMENTATION REPORT VCS Version 3 CCB Standards Third Edition
v30 18
Type of Activity Improved Forest Management - Logged to Protected Forest (IFM LfPF)
22 Project Financing
The carbon project integrates a broad vision of territorial management as part of the Management
Plan of the Amazon Rio Private Reservation I Accordingly it stipulates that all actions necessary
to implement this Plan should be enabled from resources obtained by payments for environmental
services such as carbon credits and CRAs
The idea is for the plan to serve as a management tool to provide technical and political support
support to negotiations with support institutions to receive investments that can make projects and
programs viable The expected revenues in the short and medium term to implement the
Management Plan will mostly come from payments for environmental services such as negotiated
carbon credits and CRAs in addition to projects that generate long-term income exclusively for the
communities such as ecotourism scientific research and harvest of non-timber forest products
In this context the main difference between a permanent protection private reserve (eg RPPN)
and a private sustainable development reserve (eg RPDS) is that the long-term financial viability
of sustainable reserves usage comes from the marketing of non-timber forest products with high
added value and other sustainable businesses in compensation for environmental services This
flow of resources is expected to occur during and after the implementation period The proposal is
that with external support and through their political representatives local communities will be able
to establish partnerships and contracts with companies cooperatives and industries interested in
supporting social and environmental initiatives in the project areas
These items are briefly listed below with their respective values regarding the implementation and
execution of the project part of which will be initially financed by the contribution of the partners as
mentioned above
Table 01 - Project implementation and opperational costs3
Component Value (R$) Share ()
Pre-Operating expenses R$ 1561904 361
Administrative expenses R$ 24069915 5568
Costs of VCS + CCB certification R$ 456670 106
3 Annex 16
MONITORING amp IMPLEMENTATION REPORT VCS Version 3 CCB Standards Third Edition
v30 19
Monitoring R$ 2820000 652
Social program related expenses R$ 6050000 1399
Carbon trading R$ 1188536 275
Taxes on income R$ 1680219 389
Taxes on profit R$ 5008435 1159
Interest 10 return on investment of shareholders R$ 396300 092
TOTAL R$ 43231980 10000
23 Employment Opportunities and Worker Safety
Despite the considerable local knowledge of the regionrsquos ecosystems and environments
technology is lacking related to the value added to products and environmental conservation
projects Besides these difficulties public service agents frequently indicate the use of techniques
and management practices that require high external inputs and major investments To overcome
these limitations the project intends to promote specific and culturally relevant trainings that include
workshops meetings courses and extended technical assistance to improve the knowledge and
skills of community leaders residents and employees of the project To complement such
trainings we intend to install diversified agroforestry systems to restore and reuse degraded
areas to encourage handicrafts and tourism and to improving the management of non-timber
forest products with emphasis on Brazil nuts andiroba copaiba and Acai As a result
management practices are expected to improve in the long-term as well as and the fostering of
local culture combining technical and scientific knowledge with traditional knowledge
24 Stakeholders (G3)
Consultation prior to the beginning of the project
The populations involved in the carbon project are direct users of forest resources that are present
in the Amazon Rio I II III amp IV areas for the practice of plant and animal extraction Initially they
were indicated by the Council of Agro-Extrativist Associations of Democracia (Conselho das
Associaccedilotildees Agroextrativistas de Democracia - CAAD) which gathers associations of residents
from ten communities located near the Amazon Rio I Reserve Following this indication the EBCF
hired the services of the consulting company CO2X Conservaccedilatildeo de Florestas Ltda to perform a
MONITORING amp IMPLEMENTATION REPORT VCS Version 3 CCB Standards Third Edition
v30 20
series of workshops and meetings to prepare the Amazon Rio I Management Plan (Annex 9) and
to develope the Amazon Rio REDD+ IFM project In these meetings different forms and spaces of
participation of the people and government and non-governmental institutions were discussed to
support the development and implementation of the Management Plan culminating in the creation
of an Advisory Council In these events conservation and fundraising strategies were presented to
the community among them the marketing of avoided emissions resulting from the suspension of
timber management activities The conduct of the Free Prior and Informed Consent (FPIC)
process was done in the communities surrounding the Amazon Rio I II III and IV areas during
three workshops in 2013 which had a very inclusive and participatory nature This document as
well as the minutes of the workshops participatory mapping Sustainability Matrix questionnaires
and presentations in PPT slides are available in Annex 104
Identification of stakeholders
There are 15 communities that will benefiot from the activities of the project and twelve of them
(Urucury Aacutegua Azul Vista Alegre Boa Esperanccedila Santa Eva Santa Maria Pandegal
Democracia Jatuarana Terra Preta do Ramal Kamayuaacute and Satildeo Joseacute do Miriti) are located in the
region surrounding Amazon Rio areas I and III and in the Rio Amapaacute Reserve on the Madeira
River and its tributaries One of the communities is formed by residents that integrate the
Agroextractivist Association Satildeo Joatildeo e Ponta Grossa which is located in the surroundings of the
Amazon Rio IV area Two communities Terra Preta do Rio Manicoreacute and Mocambo are located in
the region surrounding the Amazon Rio II on the bank of the Manicoreacute River(Figure 03)
Figure 04 - Location of the communities surrounding the Amazon Rio areas I II III and IV
4 This topic is thoroughly discussed in Section 37 of this document
MONITORING amp IMPLEMENTATION REPORT VCS Version 3 CCB Standards Third Edition
v30 21
Except for Terra Preta do Rio Manicoreacute Mocambo and Satildeo Joseacute do Miriti all of the communities
utilize the Rio Amapaacute RDS area either on a sporadic or seasonal basis to meet their food needs
(collecting various fruits fishing and hunting) for household and medicinal use (bark leaves and
plant parts considered by medical practices and traditional knowledge) and primarily for the sale of
various non-timber products especially the harvesting of Brazil nut accedilaiacute and copaiacuteba oil However
the trails roads and paths that provide access to the Amapaacute Rio RDS and Amazon Rio areas are
in a poor state of repair which hinders extraction practices especially the production of Brazil nuts
In addition to the 15 communities surrounding the Amazon Rio areas government organizations
directly involved with environmental issues in the region such as SDS the National Indian
Foundation (Fundaccedilatildeo Nacional do Iacutendio - FUNAI) City Hall and the City Council of Manicoreacute the
Secretary of Environment and Sustainable Development of Manicoreacute ICMBio and non-
governmental organizations such as FAS IEB CAAD CNS UFAM UEA were identified and
contacted to participate in the entire process of preparation of the Management Plan
Stakeholder meetings
To present and discuss the project in detail with representatives of 15 communities surrounding
the project area and support institutions three workshops in different locations were conducted
The subjects were presented in straightforward language in a culturally appropriate way so that
community representatives could understand relatively complex and unusual concepts such as
climate change greenhouse effect and payments for environmental services
The importance of forests for the mitigation and adaptation to climate change was emphasized to
convey the main objectives of the project to community representatives and in particular their role
in (i) absorbing carbon dioxide and release oxygen (ii) helping control climate processes on a
regional scale (iii) regulating the flow of rivers and erosion control and (iv) providing shelter and
food for most animals and plants on the planet The fact that 20 of global greenhouse gas
emissions come from the destruction of forests and in Brazil 70 of emissions come from
deforestation was also mentioned
During the workshops participants learned that steps can be taken to reduce the emissions of
greenhouse gases by investing in renewable energy sources such as solar energy wind energy
hydroelectric power plants electric cars and other more efficient ones Another option that
mitigates climate change was also highlighted that relates to the Amazon forest conservation and
the restoration of degraded areas through reforestation management of agricultural land and
establishment of agroforestry systems
MONITORING amp IMPLEMENTATION REPORT VCS Version 3 CCB Standards Third Edition
v30 22
After concepts were discussed it was explained to those present that the proposed project to be
carried out in the RPDS Amazon Rio I recently approved at the time and in the creation process
in the other Reserves has essentially one goal to financially reward those who preserve and
protect a forest threatened with deforestation and degradation the project aims (i) raise funds for
the implementation of the Management Plan programs and (ii) conserve forests and the associated
biodiversity It was also mentioned that the project is part of a new vision of the business strategy
since a logging plan was operational until 2010 associated with the emissions of greenhouse
gases In 2010 the practice was suspended by the owner who began investing in the creation of a
project focused on conservation and payment for environmental services with emphasis on the
voluntary carbon market
Implementation schedule
Table 2 - Implementation schedule and next activities
Ano Atividade
2010
EBCF performs the symbolic protocol creation of the first RPDs during the
seminar results and perspective of the State of Amazonas Conservation
Units held by the SDS
2011 EBCF submits the formal protocol to CEUC
2011 Meeting presentation EBCF for communities near the Amazon River I II III
and IV
2011
EBCF attended the informal invitation made by the management of RDS
Rio Amapaacute and representative CEUC - Silvia Elena the training workshop
and delivery portfolios ENVIRONMENTAL VOLUNTEERS AGENTS held in
the Boa Esperanccedila community
2011
EBCF participated in the event organized by the CAAD which had the
agenda General Assembly accountability of CAAD year 20092010 RDS
Management Plan Amapaacute Rio Bolsa Floresta Municipal Management
IDAM contribution contribution Covema IEBs contribution and delivery of
equipment for processing of acai held on 24032011 in the community of
MONITORING amp IMPLEMENTATION REPORT VCS Version 3 CCB Standards Third Edition
v30 23
Democracy and 25032011 in the Boa esperanccedila Community
2011 Inspection of CEUC on farms for approval on RPDs
2011 The board of EBCF makes his 1st visit the communities and farms
2011
EBCF in partnership with the Municipal Government of Manipur perform
the recovery local road (approximately 20KM) linking Democracia
community Jatuarana communities Terra Preta Community Santa Eva
and Vista Alegre
2012
Visit of the president and directors of EBCF the communities surrounding
the reserves together with the president of PATAC Marcelo Marder and
Andre Albuquerque president for socioeconomic communities report
presentation
2012 Business Plan Project approval and EBCF shareholders agreement
authorizing the start of the REDD project
2013 Workshop I - Diagnosis for the development of areas of the Amazon River
Management Plan I II III amp IV
2013 Visit communities to complement the workshop I for interviews with the
locals
2013 Meeting in CEUC after the second workshop to update the work with the
communities and the progress of the approval of the areas
2013
Technical meeting with the team CO2X Renascer and Human
Development EBCF in Curitiba for the review and evaluation of the first part
of the Management Plan (diagnosis) Definition of programs and
subprograms of the Plan identification of key issues potential threats and
opportunities with the creation of RPDSs definition of vision and action
strategy
MONITORING amp IMPLEMENTATION REPORT VCS Version 3 CCB Standards Third Edition
v30 24
2013
The Secretary of State for the Environment (SDS) officiated at the World
Environment Day the first Private Reserve Sustainable Development
(RPDs) of the Amazon with the signing of the decree no 86
2013 Workshop II - presentation of the carbon project as one of the fundraising
programs for the implementation of the Management Plan
2013 Field work with communities and farms for mapping biodiversity and
hunting and fishing grounds
2013 The EBCF performs a complete socioeconomic census in the surrounding
communities of RPDs
2013 Meeting with CEUC for delivery and presentation of the draft of RPDs
Amazon River Management Plan I
2013
Supplementary Meeting to communities who could not attend the
Workshop II amp III Workshop Creation of the Advisory Council for RPDs
Amazon River I
2013 The EBCF performs social and economic Census in Kamayuaacute community
2015 Realization of field activities for Biomass Inventory Estimation
2016 Vitor Belfort visit and launch of income-generating initiatives
2016 Distribution of medical kits for community health workers and launching the
Health Program in the Amazon
2016 Deforestation Report
2016 PD Review and preparation of the monitoring report
MONITORING amp IMPLEMENTATION REPORT VCS Version 3 CCB Standards Third Edition
v30 25
2016 REDD + Project Certification (VCS and CCV)
2016 Project planning for structuring the supply chain of vegetable oils
certificates
2017 Fundraising from the REDD project
2017 Ecotourism Project Design
2017 Workshop Achievement Participatory Planning Project REDD + activity
EBCF
2017 ProBUC Deployment
2018 Implementation of Voluntary Environmental Agent program
25 Respect for Rights and no Involuntary Relocation
In the three workshops explaining the Carbon project to 15 communities the eight REDD+
principles and the social and environmental safeguards were presented Those safeguards were
previously established in a series of meetings throughout the Amazon between 2009 and 2010
and included several Civil Society Organizations
It was emphasized in the workshops that compliance with these principles and safeguards under
REDD+ projects such as the Amazon Rio carbon project contributes to improving local
governance transparency of information public participation in decision-making coordination of
actions among different actors and respect and recognition of the rights of indigenous peoples and
traditional populations
Free Prior and Informed Consent (FPIC)
During the project workshops the concept of Free Prior and Informed Consent was presented to
the participants as well as the importance of social and environmental safeguards to ensure the
rights of communities in designing and developing the REDD+ project explained in the eight
principles The participants were asked whether they were in agreement and if there were other
MONITORING amp IMPLEMENTATION REPORT VCS Version 3 CCB Standards Third Edition
v30 26
principles or rights that should be included Some community individuals expressed their
agreement to the safeguards All participants at the three workshops raised their hands in support
of REDD+ project The consent was unanimous
A separate document describing the whole process of the Free Prior and Informed Consent has
been prepared and is available in Annex 10
Figure 05 - Workshop I Free Prior and Informed Consent for the development of the REDD+
project by the community leaders of Democracia Aacutegua Azul Satildeo Joseacute do Miriti Vista Alegre
Jatuarana Terra Preta do Ramal Pandegal Santa Maria Santa Eva and Terra Preta do Rio
Mancoreacute
Figure 06 - Workshop II Free Prior and Informed Consent for the development of the REDD+
project by the community leaders of Urucury Mocambo Boa Esperanccedila and Satildeo Joatildeo amp Ponta
Grossa
MONITORING amp IMPLEMENTATION REPORT VCS Version 3 CCB Standards Third Edition
v30 27
Figure 07 - Workshop III Free Prior and Informed Consent for the development of the REDD+
project by the Kamayuaacute indigenous community
3 APPLICATION OF METHODOLOGY
31 Title and Reference of Methodology
VCS VM0011 Methodology for Improved Forest Management ndash Logged to Protected Forest
(LtPF) Calculating the GHG Benefits from Preventing Planned Degradation version 10
MONITORING amp IMPLEMENTATION REPORT VCS Version 3 CCB Standards Third Edition
v30 28
32 Methodology Deviations
Whereas the VM0011 was developed in a context of homogeneous forests of temperate regions
some methodological adjustments were made related to the direct survey biomass in the field
since the project areas are comprised of very heterogeneous areas of rainforest including dryland
and floodplains Any technical documentation related to these methodological adjustments and
their justifications appear in Annex 23 (Forest Inventory 2016) prepared by the consulting firm
HDOM
33 Project Boundary5
The total area of the property is 20387 ha and a buffer zone was established around each of the
four areas in order to include communities that use the resources within their boundaries (Figure
7a) Project activity areas (for purposes of calculating the emissions reductions called the project
area or PA) are only those for which logging is permitted a total of 19800 ha (Figure 7b)
excluding the Permanent Preservation Areas (APPs) and bodies of water A logging plan has been
approved for this area for selective logging (Annexes 1 2 3 4 6 and 7)
Figure 08 - Project Boundaries a) Direct Project interference limits b) Total Project Area (G1
Indicator 7)
5 Ref section 22 of VM0011
MONITORING amp IMPLEMENTATION REPORT VCS Version 3 CCB Standards Third Edition
v30 29
Stratification of the project area
For purposes of inventorying local carbon stocks and project management the project area was
stratified into 3 groups of different forest types as indicated by the VM0011 according to the
vegetation map SIPAMRADAM (DPI 2002) The forest types present in the area are rain forest
types divided into 3 categories as follows
Dense Primary Tropical Ombrophylous Alluvial Forest
Dense Primary Tropical Ombrophylous Lowland Forest
Pioneer Formations
Figure 09 - Project Area forest types
Leakage areas
There is no direct leakage resulting from planned project activities since there will be neither
displacement of management activities to other areas after the cessation of the activities within the
project area nor market leakages The project Management Plan includes the monitoring of
MONITORING amp IMPLEMENTATION REPORT VCS Version 3 CCB Standards Third Edition
v30 30
possible unanticipated leakages around the project area as well as the need to report to the
competent authorities whenever logging activities are identified in these areas For more
information on leakage see chapters 52 and 55 of this document
Temporal boundaries
Crediting period of the project
The first crediting period of the project is 37 years beginning on August 17 2012 and ending on 17
August 2049 This period is equivalent to the remaining 12 years of the first authorized
management plan (25 years from 1998) added to another 25 years in respect of a new forest
management plan that was intended as the common practice of forestry in Brazil The logging
activities could continue beyond 37 years aiming for a second crediting period
Monitoring and Reporting Period
a) Monitoring of Baseline Emissions
The monitoring of Baseline Emissions must demonstrate that the protected forest area is in
accordance with the one specified in the PD The project limit will be monitored before each
verification throughout the crediting period through new inventory information and remote sensing
and GIS as applicable Thus the project will be able to update the baseline calculations based on
the actual remaining forest area (in case of loss of forest cover by disasters for example) and that
would be subject to forest management under a ldquowithout projectrdquo scenario
b) Monitoring of Project Emissions
Project emissions will be monitored annually and compiled in every monitoring report that will detail
in particular the
Monitoring of possible illegal harvesting of timber
Monitoring of areas subject to natural disturbances
Monitoring and quantification of emissions related to air and land travel related to project
activities
c) Monitoring of Leakage
Since there will be no leakages according to the VM0011 and AFOLU Requirements no leakage
monitoring will be necessary However to be conservative the project intends to monitor any
disturbances that might affect the carbon reservoirs Once some disturbance is registered the
project will report the incident to the relevant authorities and make the necessary adjustments to
MONITORING amp IMPLEMENTATION REPORT VCS Version 3 CCB Standards Third Edition
v30 31
the baseline For more details about the monitoring of leakages see chapters 52 and 55 of this
document
Carbon stocks
The biomass reservoirs considered by the project are related to above-ground and underground
biomass
Sources and sinks of GHGs
Table 02 below describes the emission sources and sinks of greenhouse gases associated with
the baseline activities and with the project
Table 03 - Greenhouse gas emissions sources and sinks associated with baseline and project
activities
Source Gas Included JustificationExplanation
Baselin
e
Biomass
CO2 Yes Main source of project emissions through forest
degradation harvested and commercialised
wood products deadwood and forest regrowth
CH4 No Conservatively excluded
N2O No Conservatively excluded
Other No -
Fossil Fuel
consumption
CO2 Yes Main source through fossil fuel use in
machinery and transportation of timber
CH4 Yes Conservatively included
N2O Yes Conservatively included
Other No -
Electricity
consumption
CO2 Yes Main source
CH4 No -
N2O No -
Other No -
Pro
ject
Biomass
CO2 Yes Main source through unexpected natural
disturbances such as forest fires etc
CH4 Yes Included but subject to significance
N2O Yes Included but subject to significance
MONITORING amp IMPLEMENTATION REPORT VCS Version 3 CCB Standards Third Edition
v30 32
Source Gas Included JustificationExplanation
Other No _
Fossil Fuel
consumption
CO2 Yes Main source through flights and ground travel
CH4 Yes Included but subject to significance
N2O Yes Included but subject to significance
Other No _
Electricity
consumption
CO2 Yes Main source
CH4 No _
N2O No _
Other No _
34 Baseline Scenario
The choice between alternative baseline scenarios was taken together with the analysis of
additionality using the latest version of the VCS Tool for the demonstration and assessment of
additionality in Agriculture Forestry and Other Land Use VCS projects in this case VT000167
(VCS 2012a) All possible scenarios as well as the analysis of methodology barriers (steps 211
and 212 of the VM0011) are present in the chapter below In this sense to avoid redundancy of
information refer to additionality analysis to find the steps 211 and 212 of the VM0011
The baseline scenario for the project identified as the most likely to occur was selective logging8
(continuation of Business As Usual - BAU) The reference scenario assumes 37 years of selective
logging according to the 25 year logging plan approved in August 1998 (Annex 6 - document
ValdII T01 POA 1998) that in the absence of project activities would be renewed in 2024 for
another 25 years until 2049
Under this scenario the full implementation of the timber logging plan occurs and which has
already resulted in the degradation of 434769 ha (see table below) The area would be harvested
selectively for timber sold in lumber markets Below is a summary of harvest areas between 1999
and 2010 showing the managed plots and the dates on which the harvests were authorized
6 Tool for the demonstration and assessment of an additional to the VCS project activities in Agriculture Forestry and Other
Uses (AFOLU) (V 30)
7 Adapted from ldquoTool for the Demonstration and Assessment of Additionality in AR CDM project Activitiesrdquo (V02) 8 Additional information about choosing the baseline are presented in section 46 (steps 1 and 2)
MONITORING amp IMPLEMENTATION REPORT VCS Version 3 CCB Standards Third Edition
v30 33
Table 04 - Summary of areas managed since 1999
Date Managed logged area (ha)
1999 58669 (Plot 1)
2000 688 (Plot 2)
2001 ndash 2002 8315 (Plot 3)
2003 ndash 2004 750 (Plots 3 and 4)
2005 ndash 2007 1082 (Plot 5)
2008 ndash 2009 49050 (Plots 5 and 6)
TOTAL 434769
35 Additionality
The additionality analysis of the Amazon Rio project REDD+ IFM was conducted with the latest
version of the VCS Tool for the demonstration and assessment of additionality in Agriculture
Forestry and Other Land Use VCS projects the VT000167
(VCS 2012a)
To generate the reductions in GHG emissions for the project the planned baseline activities
(sustainable forest management) were terminated by the project proponent and supplanted by
environmental conservation activities In this sense the project will be managed by EBCF with
the goal of creating a fund for administrative and accounting management especially to promote
environmental management and monitoring activities of carbon pools within the project area
Alternative activities planned in the project are the provisioning and valuation of environmental
services via carbon credits (VCUs) in conjunction with the sale of Environmental Reserve Quotas
(CRAs)
4 MONITORING AND PARAMETERS OF DATA
41 Monitoring Plan Description
Due to its innovative comprehensive and integrative character the project needs to be monitored
regularly so that its actions activities and impacts can be constantly measured and evaluated To
meet this requirement the monitoring process must meet three main objectives
MONITORING amp IMPLEMENTATION REPORT VCS Version 3 CCB Standards Third Edition
v30 34
i To serve as an internal management project tool
ii To collaborate as an instrument of collective learning from the communities and
social groups directly involved
iii To work as a means of communicating results and impacts to interested institutions
and society in general Furthermore it is important to consider that monitoring if
successful will transcend the managerial aspects of the project and strengthening
the plan
To facilitate the monitoring process instead of having a reference line (to compare interventions
before and after) the first year of monitoring will serve as the starting point whose information will
be regularly and systematically compared throughout the project
Next the initial plans for monitoring benefits to the climate community and biodiversity are
described wherein the community is committed to participatory precept and to the technical and
scientific rigor which is capable of following the possible negative and positive impacts on
environmental and social aspects in the project area and its surroundings
Monitoring of Climate Impacts
The Monitoring Plan (MP) aims to provide security in the periodic estimates of reduction in
emissions especially in monitoring changes in carbon stock Therefore emissions from the
implementation of the project ex post estimates of the activities and emissions from any leakages
and isolated disturbances (eg blowdown fires pests and diseases among others) can be
calculated
The construction of the PM of the climate benefits made in full compliance with the methodological
framework provided by VM0011 ndash IFM LPF (VCS 2011) and CCBA (2008) which consists of four
specific actions to be monitored
i Implementation and execution of the project
ii Dynamics and stock of the forest biomass
iii Deforestation and forest degradation
iv Periodic reviews of ex post emissions
Remote monitoring and surveillance of the project area
Measurement of alterations and biomass loss quantification present in the PA using land use
change detection is critical to make accurate estimates of GHG emissions that account for forest
biomass increases and losses
MONITORING amp IMPLEMENTATION REPORT VCS Version 3 CCB Standards Third Edition
v30 35
Thus the use of remote sensing by satellite images of medium spatial resolution can be applied
readily in the PA and surroundings in order to monitor land use dynamics over time particularly to
identify risks and threats to forested areas In situ verification will complement landscape analysis
in a GIS environment with the aim of quantifying spatializing and identifying conversion of forest
areas into other land uses environmental degradation and other possible changes that may occur
during the term of the project
As a complementary monitoring source the project will rely on the database and information
provided by Monitoring Program of the Brazilian Amazon Forest by Satellite 910
(Prodes Digital)
conducted by the National Institute for Space Research (Instituto Nacional de Pesquisas Espaciais
- INPE) according to the Plan for Prevention and Control of Deforestation in the Amazon
1112(PPCDAm) under the National Policy on Prevention and Control of Deforestation Such
information is available online in13
digital vector files for the public in general
Other tools will provide complementary information to the monitoring such as indicators of forest
degradation and hotspots (fires and wildfires) obtained from DETER 14
SAD 15
and PROARCO16
Information is available online for free in vector format These results will be systematically related
to field data for validating or disproving the occurred event so that the focuses of deforestation and
degradation can be identified remediated reported and consequently avoided as much as
possible
A surveillance system that allows permanent territorial monitoring and inhibits the entry of intruders
through entry points in the PA will also be deployed to control the transport flow In addition one
must investigate and identify risks and threats eg mapping hotspots and areas vulnerable to fire
to illegal logging to hunting and poaching and to invasions by third parties among others
At first we estimate an effective demand for structuring the electronic monitoring system which
includes the hiring of skilled professionals field equipment electronic equipment (digital cameras
GPS desktops and notebooks smartphones printers geoprocessing software and GIS among
others) vehicles andor motorcycles motorized boats for transportation and moving around and
the collection of high resolution satellite images Empowerment and training of all involved staff
9httpwwwobtinpebrprodesdigitalmetodologiahtml
10httpwwwobtinpebrprodesmetodologiapdf 11httpwwwmmagovbrflorestascontrole-e-prevenC3A7C3A3o-do-desmatamento 12httpwwwmmagovbrimagesarquivo80120PPCDAm_FINAL_PPCDAMPDF 13httpwwwobtinpebrprodesindexhtml 14httpwwwobtinpebrdeterdados 15httpwwwimazongeoorgbrdocdownloadsphp 16httpwwwdpiinpebrproarcobdqueimadas
MONITORING amp IMPLEMENTATION REPORT VCS Version 3 CCB Standards Third Edition
v30 36
and the surrounding communities will be necessary to make the system effective17
and a constant
stream of information directed to regional actors and other stakeholders
Strategic monitoring and access points to RPDS roads will also provide support to other MPs
including social and biodiversity conservation aspects especially in the logistic support of planned
field activities
Procedures for determining the permanent sample plots (PSPs) and measurement
The calculation of the stock and increase in forest biomass will be subsidized through the
installation of PSPs in the PA and its temporal monitoring through the Continuous Forest Inventory
(CFI) The methodology proposed by VCS (2011) suggests the use of permanent andor temporary
plots however it confirms the efficiency and accuracy of sample plots
In order to demonstrate the procedural and statistical rigor used all the sampling procedures the
PA forest stratification sampling design calculation of sampling intensity and other parameters
measured in PSPs to monitor biomass balance due to ingressmortality of individuals growth in
DBH and height will be presented in detail in the Annex (Annex 23 - Forest Inventory 2016)
To promote reliable forest biomass estimates standard operating procedures (SOPs) (Section 82)
will be used by the team executing the CFI
Monitoring frequency
The monitoring frequency parameters measured in the PSPs will be no greater than 5 years from
the first measurement Other relevant parameters to monitoring the PSPs like the change in land
use in the PA and surrounding areas such as deforestation forest degradation fire sources and
natural disturbances will be regularly monitored as a project routine operation organized and
archived annually
411 Monitoring Impacts to Biodiversity
Since animal inventories have not been conducted in Amazon Rio project areas (for this project
biological information for the Rio Amapaacute RDS management plan were used) a biodiversity
monitoring system that will follow the RAPELD methodology (Rapid surveys of various taxonomic
groups (RAP) for long-term ecological studies) (MAGNUSSON et al 2005)
The RAPELD method contributes to long-term research using rapid inventory assessments biotic
complementarity and land use planning in the Amazon This method increases adequate sampling
17Linking community monitoring to national Measurement Reporting and Verification for REDD+
MONITORING amp IMPLEMENTATION REPORT VCS Version 3 CCB Standards Third Edition
v30 37
probability of biologically diverse communities which require large areas and at the same time
minimize variation of abiotic factors that affect these communities with smaller areas sampling
Evaluation and selection of indicators will be conducted in accordance with the ProBUC model
however applicably to local reality results will be updated biennially from the first survey
Biodiversity indicators are being designed and planned as suggested in the Social and
Environmental Monitoring System of Protected Areas in the Brazilian Amazon (Sistema de
Monitoramento Socioambiental das Unidades de Conservaccedilatildeo da Amazocircnia Brasileira)1819
and
Methodology for Rapid Assessment and Prioritization of Protected Areas Management20
(Metodologia para Avaliaccedilatildeo Raacutepida e Priorizaccedilatildeo do Manejo de Unidades de Conservaccedilatildeo -
RAPPAM) in line with the experiences gained and disseminated by CEUC and ICMBIO previously
described
The empowerment accountability and shared management of biodiversity conservation is the
main focus of the methodological model adopted These actions create high expectations for
environmental management of the area as the biodiversity monitoring will be conducted by the
community members themselves along with the project proponent promoting a local multiplier
effect It is worth mentioning that strict compliance with these procedures is in within EBCF`s
interest since it considers them to be key to the success of the project
The project begins with the premise that any negative impact on biodiversity in the project area
and its surroundings will not occur In the opposite sense the project aims to generate and provide
greater understanding of the territory subsidizing proposals for the conservation and sustainable
use through adoption of good management practices of natural resources as well as its replication
in other locations
412 Monitoring Social Impacts
The monitoring of social aspects include both the collection of numerical data such as quantity
volume weight (quantitative indicators) as well as information expressing opinions and
experiences (qualitative indicators) remembering that such measures are compatible and
interchangeable Data collection should be systematic and have a pre-established rate and most
likely a single indicator will require several data collection instruments such as plans field records
reports etc
Social information will be monitored through the use of participatory methodologies In this sense
the preparation process of the Amazon Rio I RPDS Management Plan was a first step For the
18Indicator Design 19Social and Environmental Monitoring of Protected Areas System in the Brazilian Amazon (Sistema de Monitoramento
Socioambiental das Unidades de Conservaccedilatildeo da Amazocircnia Brasileira) 20Metodologia para Avaliaccedilatildeo Raacutepida e a Priorizaccedilatildeo do Manejo de Unidades de Conservaccedilatildeo (RAPPAM)
MONITORING amp IMPLEMENTATION REPORT VCS Version 3 CCB Standards Third Edition
v30 38
socioeconomic characteristics of communities several community meetings land use mapping
workshops and interviews with focus groups were held in addition to field visits (Annex 10) The
main activities of the project were presented and discussed in these events emphasizing the
importance and timeliness of local valuation of environmental services as well as strategies for
raising funds to implement other projects and improvements in social well-being of communities
around the PA
5 MEASUREMENT OF GHG EMISSIONS REDUCTIONS AND REMOVALS (CLIMATE)
51 Emissions Baseline
EBCF did not carry out any wood related exploration activity in the areas since the beginning of
the REDD+ project Thus it is confirmed estimated emission reductions for the project as
8678833 t CO2eq t year
52 Project emissions
Project emissions were primarily those related to the running of offices and necessary travels for
studies meetings presentations workshops and other activities Table 10 presents a summary of
emissions based on data from Annex 21 of this report
Table 05 - 2011-2016 Project Activity Emissions
YEAR Energy
(KWh)
Energy
(t CO2eq)
Travels
(Km)
Travels
(t CO2eq)
Total
(t CO2eq)
2010
678 024 024
2011
104010 2360 2360
2012 1149 008 55724 1573 1581
2013 2756 028 236749 5429 5457
2014 2498 025 15789 459 484
2015 2231 023 27340 597 620
2016 1015 010
010
093 440290 10443 10536
53 Leakage
Not applicable according to presentation made on the REDD+ IFM document
MONITORING amp IMPLEMENTATION REPORT VCS Version 3 CCB Standards Third Edition
v30 39
54 Summary of GHG Emission Reductions And Removals
EBCF REDD+ project shows emissions reduction of 34397563 tCO2e as the balance in the
period of 2011-2015 Table 06 shows the overview of the dynamics of reductions and project
emissions up to 2048 By the year 2015 the emissions data is posted as seen in reports and from
2016 data are projects as previous average and should be adjusted as a result of future reports
Table 06 - Summary of ex ante estimates
Year
Estimated
reductions
from
baseline21
(tCO2e)
Project
Estimated
emissions 22
tCO2e)
Unplanned
estimate
Emissions23
(tCO2e)
Net GHG
Estimated
emissions
Reduction
(tCO2e)
2012 8675500 1581 0 8673919
2013 8675500 5457 0 8670043
2014 8675500 484 296296 8378720
2015 8675500 620 0 8674880
2016 8675500 2100 0 8673400
2017 8675500 2100 0 8673400
2018 8675500 2100 0 8673400
2019 8675500 2100 0 8673400
2020 8675500 2100 0 8673400
2030 8675500 2100 0 8673400
2048 8675500 2100 0 8673400
Total 3123180 25203 296296 3119989
55 Climate Change Adaptation Benefits (GL1)
There is a relatively widespread understanding in the scientific community that balanced
ecosystems have greater ecological and social resilience and adaptability to climate change
21
See annex 18 22
See annex 21 23
See annex 24- HDOM (Study on deforestation and heat spots for EBCF REDD+ Project technical report)
MONITORING amp IMPLEMENTATION REPORT VCS Version 3 CCB Standards Third Edition
v30 40
whether through protection of water bodies and regulation of river flows during peak flood and
drought or through the regular supply of environmental services products and services
Thus once the project is designed to conserve an area of native forest which in the absence of
the project scenario would remain subject to the pressure of timber management (baseline) and
consequent degradation resulting from such activities it is understood that the mere protection of
these areas alone would offer communities and the ecosystem itself better adaptability compared
to the baseline scenario
Moreover the project has an Activity Management Plan (Annex 9) which details among other
initiatives the promotion of the sustainable use of ecosystem resources through direct support in
some activities related to income generation and conservation along with community training It is
believed that in addition to ensuring a more balanced (and therefore more resilient) environment
the project will expand the options for generating income among the communities making them
more resilient and preparing them to face the greater and already perceived challenges posed by
climate change
6 COMMUNITY
61 Positive Impacts for Communities (CM1)
EBCFrsquos REDD+ project was first presented to the riverine communities in 2011 By then
communities were informed about the cessation of all timber exploration activities due to the
REDD+ project and discussions were held regarding biodiversity conservation and the sustainable
use of forest products and services as well the social development of the surrounding
communities Briefly the positive impacts along the communities were
1 Project area zoning and its surroundings
2 Contribution to building local capacity
3 Contribution to developing sustainable business in the region
4 Contribution to social and environmental diagnosis
Knowing to manage
To evaluate the progress of these initiatives throughout the development of the project we used
the methodology of the Sustainability Matrix developed by the Secretariat of Environment and
MONITORING amp IMPLEMENTATION REPORT VCS Version 3 CCB Standards Third Edition
v30 41
Sustainable Development of Amazonas State This tool was applied in 15 communities taking into
account local socio-economic aspects that underlie the development of 20 parameters considered
of great importance to community development described by specific indicators As a visual tool
the Sustainability Matrix is quite suitable for traditional populations such as the riverside and
indigenous communities surrounding the Reserve Amazon River I and other areas of the Project
Additionally the Matrix provides interesting spaces for discussion since its construction is done
collectively Through the Sustainability Matrix it was possible to identify along with the
communities projects activities and implementation strategies Budgets and monitoring and
evaluation of these projects will be detailed later through the Annual Operational Plans to be
developed and followed up in the due course Four programs and nine subprograms were defined
for management and community development (Annex 9)
62 Negative Impacts (CM2)
No negative impacts have been recorded or identified as a result of the project with stakeholders
7 BIODIVERSITY
71 Positive Impacts for Biodiversity (B1)
The benefits for biodiversity are in reducing deforestation and degradation (selective logging) in the
project area According to satellite images analysis in the project areas and their surroundings it
was observed that until 2010 300 hectares were deforested After the implementation of the
project community awareness on the importance of preservation and conservation of forests have
encouraged no deforestation degradation and a significant reduction in deforestation was
identified (see graph below) This was due to the good understanding of the projects conservation
objectives and by the involvement and support of the surrounding communities
MONITORING amp IMPLEMENTATION REPORT VCS Version 3 CCB Standards Third Edition
v30 42
Figure 10 - EBCF REDD Project and buffer areas deforestation figures (source HDOM Report)
The consequences of deforestation and degradation on biodiversity are well known Thus the fact
of not being identified changes (natural or anthropogenic) in forest areas shows there was no loss
of biodiversity no reduction in floristic diversity no impact on the dynamics of fauna and flora and
no loss of evolutionary genetic information
72 Negative Impacts on Biodiversity (B2)
There are no negative impacts on biodiversity as a result of the project
73 Exceptional Benefits for Biodiversity (GL3)
The description of exceptional benefits for biodiversity will only be possible after the re-
measurement of permanent plots (FLORA)
8 ADICIONAL INFORMATION
All activities and the consequent reduction in deforestation and degradation in and around the
project areas were maintained and funded without resources of carbon credits We understand that
with the advance of REDD+ project EBCF will have much better conditions to implement positive
actions in partnership with communities
MONITORING amp IMPLEMENTATION REPORT VCS Version 3 CCB Standards Third Edition
v30 43
REFERENCES
ADEODATO S etal Madeira de ponta a ponta o caminho da floresta ateacute o consumo Satildeo Paulo
FGV-RAE 2011
ALBAGLI S Amazocircnia fronteira geopoliacutetica da biodiversidade Revista Parcerias Estrateacutegicas n
12 p6 set2001 Centro de Estudos Estrateacutegicos do Ministeacuterio da Ciecircncia e Tecnologia
AMARAL I C Viabilidade de plantio de cafeacute na zona da mata mineira Revista Poliacutetica Agriacutecola
Ano xx n4 outnovdez 2011 Disponiacutevel em
httpwwwalicecnptiaembrapabrbitstreamdoc9309031Viabilidadedeplantiopdf Acesso
em 17 de set 2013
AMARAL P etal Floresta para Sempre um manual para a produccedilatildeo de madeira na Amazocircnia
Beleacutem IMAZON 1998 130p
AMAZONAS Lei Complementar nordm 532007 de 05062007 REGULAMENTA o inciso V do artigo
230 e o sect 1ordm do artigo 231 da Constituiccedilatildeo Estadual institui o SISTEMA ESTADUAL DE
UNIDADES DE CONSERVACcedilAtildeO - SEUC dispondo sobre infraccedilotildees e penalidades e
estabelecendo outras providecircncias Disponiacutevel em
httpwwwcetesbspgovbruserfilesfilemudancasclimaticasproclimafilelegislacaoestadua
lamazonasleilei_complementar_n_53_2007_amazonaspdf Acessado em Setembro 2013
ANTAQ Anuaacuterio Estatiacutestico 2004 Distacircncia entre os portos Disponiacutevel em
httpwwwantaqgovbrportalanuariosportuario2004TabelasDistanciaEntrePortospdf
Acesso em 23 de out 2013
ANTAQ Panorama Aquaviaacuterio Agecircncia Nacional de Transportes Aquaviaacuterios Volume 3 Brasiacutelia
ndash DF 2009
MONITORING amp IMPLEMENTATION REPORT VCS Version 3 CCB Standards Third Edition
v30 44
AREDES A F PEREIRA M W G Anaacutelise econocircmica da produccedilatildeo de cafeacute araacutebica um estudo
de caso com simulaccedilotildees de Monte Carlo para sistemas de baixa e alta produtividade
Informaccedilotildees Econocircmicas SP v38 n4 abr 2008
ARIMA E UHL C Pecuaacuteria na Amazocircnia Oriental Desempenho Atual e Perspectivas Futuras Seacuterie
Amazocircnia n1 Beleacutem IMAZON 1996 40p
BACCINI A et al Estimated carbon dioxide emissions from tropical deforestation improved by
carbon-density maps Nature Climate Change vol2 march 2012 (LETTERS Published
Online - DOI 101038NCLIMATE1354)
BARROS A C UHL C Padrotildees problemas e potencial da extraccedilatildeo madeireira ao longo do Rio
Amazonas e do seu estuaacuterio Seacuterie Amazocircnia n4 Beleacutem IMAZON 1997 42p
BRASIL Lei 121872009 (Lei Ordinaacuteria) 29122009 Institui a Poliacutetica Nacional sobre Mudanccedila
do Clima - PNMC e daacute outras Providecircncias Presidecircncia da Repuacuteblica Casa Civil Subchefia
para Assuntos Juriacutedicos Disponiacutevel em lthttpswwwplanaltogovbrccivil_03_ato2007-
20102009leil12187htmgt Acesso em 20 de set 2013
CAMPOS E F Emissatildeo de CO2 da madeira serrada da Amazocircnia o caso da exploraccedilatildeo
convencional 2012 172p Dissertaccedilatildeo - Escola Politeacutecnica Universidade de Satildeo Paulo Satildeo
Paulo
CARDOSO RS e FREITAS C E C A pesca de pequena escala no rio Madeira pelos
desembarques ocorridos em Manicoreacute (Estado do Amazonas) Brasil Revista Acta
Amazocircnica vol 38(4) 2008 781 ndash 788
CCBA Climate Community and Biodiversity Alliance-CCBA 2008 Disponiacutevel em
httpwwwclimate-standardsorgccb-standards Acesso em 03 de set 2013
MONITORING amp IMPLEMENTATION REPORT VCS Version 3 CCB Standards Third Edition
v30 45
CEPEA Centro de Estudos Avanccedilados em Economia Aplicada - ESALQUSP Economia da
pecuaacuteria de corte na regiatildeo norte do Brasil Disponiacutevel em httpgooglL2roiA Acesso em
15 de out 2013
CHAMBERS J Q et al Decomposition and carbon cycling of dead trees in tropical forests of the
central Amazon Oecologia vol122 pp380-388 2000 Agricultores se queixam de
burocracia para contratar creacutedito sustentaacutevel do Programa ABC Correio Braziliense Brasiacutelia
26 fev 2012 Disponiacutevel em
lthttpwww2correiobraziliensecombrsersustentavelp=4592gt Acesso em 10 set 2013
CULLEN Jr L VALLADARES-PAacuteDUA C Onccedilas como detetives da paisagem Ciecircncia Hoje
Vol 156 n26 pp54-571999
CPRM - Serviccedilo Geoloacutegico do Brasil Disponiacutevel em httpwwwcprmgovbr Acesso em 13 de
mar 2013
DIAS F M MORAIS S J S REZENDE R C Anaacutelise da viabilidade econocircmica para a
produccedilatildeo de melancia e cenoura com financiamento em Anaacutepolis-GO 2008 Disponiacutevel em
httpwwwprpuegbr06v1conteudopesquisainiccieneventossic2008fronteiraflashsicani
macaoIIIJORNADAarquivosresumosresumo01pdfgt Acesso em 18 de nov2013
Divisatildeo de Precessamento de Imagens (DPI) Ambdata Mapa de Vegetaccedilatildeo SIPAM RADAM
2002 Disponiacutevel em httpwwwdpiinpebrAmbdatamapa_sipamphp Acesso em 21 de
out 2013
DOMINGUES MS BERNMANN C O arco de desflorestamento na Amazocircnia da pecuaacuteria agrave
soja Ambiente amp Sociedade Satildeo Paulo vol15 n2 pp1-22 maioago 2012
MONITORING amp IMPLEMENTATION REPORT VCS Version 3 CCB Standards Third Edition
v30 46
EBCF Criaccedilatildeo da primeira reserva particular de desenvolvimento sustentaacutevel do mundo na
floresta amazocircnica Disponiacutevel emlthttpwwwebcfcombrblog20130624criacao-da-
primeira-reserva-particular-de-desenvolvimento-sustentavel-do-mundo-na-floresta-
amazonicagt Acesso em 21 de set 2013
EMBRAPA Sistema Brasileiro de Classificaccedilatildeo de Solos 2ordf Ed Rio de Janeiro Embrapa Solos
2006 306 p
FELDPAUSCH T R et al When big trees fall Damage and carbon export by reduced impact
logging in southern Amazonia Forest Ecology and Management Vol 219 pp199-215 2005
FEARNSIDE P MDesmatamento na Amazocircnia dinacircmica impactos e controle Acta Amazocircnica
vol 36 n3 pp 395-400 2006
FILGUEIRAS T S et al 1994 Caminhamento Um meacutetodo expedito para levantamentos
floriacutesticos qualitativos Caderno de Geociecircncia IBGE vol12 pp39-43 1994
Forest Management Public Summary for Gethal Amazonas SA Induacutestria de Madeira
Compensada Certification Code SW-FMCOC-119 Date of Certification October 1
2000 Date of Public Summary October 2000 Updated for Annual Audit 2002 Annual Audit
2003 (Gethalpdf)
Globo Rural Linha de financiamento para a agricultura de baixo carbono tem pouca procura
2011 Disponiacutevel em httpwwwrainforest-allianceorgforestrydocumentsgethalpdf
Acesso em 16 de nov 2013
GREENPEACE Face a Face com a Destruiccedilatildeo Relatoacuterio Greenpeace sobre as companhias
multinacionais madeireiras na Amazocircnia Brasileira 1999 Disponiacutevel em
MONITORING amp IMPLEMENTATION REPORT VCS Version 3 CCB Standards Third Edition
v30 47
lthttpwwwgreenpeaceorgbramazoniaface_destruicaopdfgt Acesso em 11 de set
2013
Governo do Estado do Amazonas Plano de Gestao da RDS do Rio Amapaacute 2010 Disponiacutevel em
httpobservatoriowwforgbrsite_mediauploadgestaoplanoManejorio_amapapdf Acesso
em 24 de ago 2013
HDOM Estimates from processing the forest inventories data carried out during the CADAF
Project Final Technical Report 2012 Disponiacutevel em wwwhdomcombr Acesso em 27 de
maio 2013
HIGUCHI N 1986-87 Amostragem sistemaacutetica versus amostragem aleatoacuteria em floresta tropical
uacutemida de terra-firme na regiatildeo de Manaus Acta Amazonica 1617 (uacutenico) 393-400
HIGUCHI N SANTOS J JARDIM FCS Tamanho de parcela amostral para inventaacuterios
florestais Acta Amazocircnica vol12 n1 pp91-103 1982
HIGUCHI F G PINTO A C M ISHIZUKA M KAJIMOTO T LIMA A J N SANTOS J
HIGUCHI N Estoque e dinacircmica de biomassa acima do solo das florestas de terra firme do
estado do Amazonas In Adriano Joseacute Nogueira Lima Flaacutevia Machado Durgante Moacir
Alberto Assis Campos Joaquim dos Santos Moriyoshi Ishizuka Niro Higuchi (Org)
Dinacircmica do carbono das florestas da Amazocircnia resultados do Projeto CADAF
1edManaus INPA 2014 v 1 p 29-34
HOLMES T P etal Custos e benefiacutecios financeiros da exploraccedilatildeo de impacto reduzido em
comparaccedilatildeo agrave exploraccedilatildeo florestal convencional na Amazocircnia oriental 2ordf ed Beleacutem
Fundaccedilatildeo Floresta Tropical 2002 66p
HUSCH B MILLER C I BEERS T W Forest mensuration New York Ronald Press 1971
HUSCH B MILLER C I BEERS T W Forest Mensuration New York John Wiley amp Sons
2nd
ed 1972 402 p
MONITORING amp IMPLEMENTATION REPORT VCS Version 3 CCB Standards Third Edition
v30 48
IBGE Instituto Brasileiro de Geografia e Estatiacutestica Diretoria de GeociecircnciasCoordenaccedilatildeo de
Recursos Naturais e Estudos Ambientais Geologia Solos Hidrografia e Vegetaccedilatildeo 2000
IBGE Instituto Brasileiro de Geografia e Estatiacutestica Manicoreacute 2010 Disponiacutevel
emlthttpwwwsidraibgegovbrgt Acesso em 05 de set 2013
IBGE Instituto Brasileiro de Geografia e Estatiacutestica 2011 Disponiacutevel em httpwwwibgegovbr
Acesso em 19 de mar 2013
IBGE Instituto Brasileiro de Geografia e Estatiacutestica Extraccedilatildeo vegetal e silvicultura para o
municiacutepio de Manicoreacute 2011 Disponiacutevel em
lthttpcidadesibgegovbrxtrastemasphplang=ampcodmun=130270ampidtema=102ampsearch=a
mazonas|manicore|extracao-vegetal-e-silvicultura-2011gt Acesso em 10 de out 2013
IBGE Instituto Brasileiro de Geografia e Estatiacutestica Censo Demograacutefico 2010 Disponiacutevel em
lthttpcidadesibgegovbrxtrastemasphpcodmun=130270ampidtema=116gt Acesso em 18
de out 2013
IBGE Instituto Brasileiro de Geografia e Estatiacutestica Censo Demograacutefico 2010 Disponiacutevel
emlthttpcidadesibgegovbrxtrashomephpgt Acesso em 08 de out 2013
IDESAM Reduccedilotildees de Emissotildees do Desmatamento e Degradaccedilatildeo Florestal (REDD+) estudo de
oportunidades para a regiatildeo sul do Amazonas CENAMO M Cl CARRERO G C
GANDOLFO P (Org) Manaus 2011 Disponiacutevel em
lthttpwwwobservatoriodoreddorgbrsitepdfestudodeoportunidadespdfgt Acesso em 13 de
set 2013
MONITORING amp IMPLEMENTATION REPORT VCS Version 3 CCB Standards Third Edition
v30 49
IDESAM Semeando Sustentabilidade em Apuiacute ndash Resultados e Perspectivas 2011 Manaus
Disponivel em lthttpidesamorgbrsemeando-sustentabilidade-em-apui-resultados-e-
perspectivasUxX8nfldWYI
IEA Instituto de Economia Aplicada CO2 Emissions from fuel combustion 2012 Disponiacutevel em
httpwwwieaorgco2highlightsco2highlightspdf Acesso em 09 de out 2013
IGREJA H L S CATIQUE J Anaacutelise neotectocircnica do lineamento de Itacoatiara centro leste do
Estado do Amazonas In Simpoacutesio Nacional de Estudos Tectocircnicos 6 1997 Pirenoacutepolis
Anais Pirenoacutepolis-GO SBG-Nuacutecleo Brasiacutelia1997
IMAZON Instituto do Homem e do Meio Ambiente da Amazocircnia Fatos Florestais 2010a
Disponiacutevel em httpwwwimazonorgbrpublicacoeslivrosfatos-florestais-da-amazonia-
2010-1 Acesso em 14 de out 2013
IMAZOM Instituto do Homem e do Meio Ambiente da Amazocircnia Mercado e preccedilo da madeira
amazocircnica 2010 Disponiacutevel em httpwwwimazonorgbrpublicacoesprecos-de-madeira-
em-toraboletim-de-precos-de-madeira-em-tora-na-amazonia-julho-2010at_downloadfile
Acesso em 23 de nov 2013
IMAZON Instituto do Homem e do Meio Ambiente da Amazocircnia Portal de Geoinformaccedilatildeo sobre
a Amazocircnia Disponiacutevel em lthttpwwwimazongeoorgbrimazongeophpgt Acesso em 06
de set 2013
IMAZON Instituto do Homem e do Meio Ambiente da Amazocircnia Transparecircncia florestal
Amazocircnia Legal 2012 Disponiacutevel em lthttpwwwimazonorgbrpublicacoestransparencia-
florestaltransparencia-florestal-amazonia-legalcopy_of_SADOutubro2012pdfgt Acesso em
23 de set 2013
IMAZON Instituto do Homem e do Meio Ambiente da Amazocircnia PEREIRA D SANTOS D
VEDOVETO M GIMARAtildeES J VERIacuteSSIMO A (Orgs) Fatos Florestais da Amazocircnia
Beleacutem IMAZON 2010 244p Disponiacutevel em
MONITORING amp IMPLEMENTATION REPORT VCS Version 3 CCB Standards Third Edition
v30 50
lthttpwwwimazonorgbrpublicacoeslivrosfatos-florestais-da-amazonia-2010-1gt Acesso
em 24 de set 2013
IMAZON Instituto do Homem e do Meio Ambiente da Amazocircnia A Expansatildeo madeireira na
Amazocircnia Impactos e perspectivas para o desenvolvimento sustentaacutevel no Paraacute BARROS
AC VERIacuteSSIMO A (Eds) Beleacutem IMAZON 2002
IMAZON Instituto do Homem e do Meio Ambiente da Amazocircnia Custos e Benefiacutecios do Manejo
Florestal Para Produccedilatildeo de Madeira na Amazocircnia Oriental 1998 Disponiacutevel em
lthttpwwwimazonorgbrpublicacoesserie-amazoniacustos-e-beneficios-do-manejo-
florestal-para-producao-de-madeira-na-amazonia-orientalgt Acesso em 20 de set 2013
INPE Instituto de Pesquisas Espaciais Banco de dados PRODES 2012 Disponiacutevel em
lthttpwwwdpiinpebrprodesdigitalprodesphpgt Acesso em 09 de set 2013
INPE Instituto de Pesquisas Espaciais Banco de dados DEGRAD 2009 Disponiacutevel em
lthttpwwwobtinpebrdegradgt Acesso em 09 de set 2013
INPE Instituto de Pesquisas Espaciais Banco de dados DETER 2013 Disponiacutevel em
lthttpwwwobtinpebrdetergt Acesso em 10 de set 2013
INPE Instituto de Pesquisas Espaciais Banco de dados de queimadas e focos de calor
BDQUEIMADAS 2013 Disponiacutevel em lthttpwwwdpiinpebrproarcobdqueimadasgt
Acesso em 10 de set 2013
Instituto Carbono Brasil Soacute 2 da produccedilatildeo de madeira eacute certificada O Estado de SPaulo 2006
Disponiacutevel em lthttpwwwinstitutocarbonobrasilorgbrnoticias6noticia=119796gt Acesso
em 26 de set 2013
MONITORING amp IMPLEMENTATION REPORT VCS Version 3 CCB Standards Third Edition
v30 51
IFT Instituto Floresta Tropical Diagnoacutestico do Setor Florestal de Cotriguaccedilu Estado do Mato
Grosso 2010 Disponiacutevel em lthttpgooglEVx2RZgt Acesso em 16 de dez 2013
IPCC Guidelines for National Greenhouse Gas Inventories In National Greenhouse Gas
Inventories Programme EGGLESTON HS BUENDIA L MIWA K NGARA T TANABE
K (Eds) Japan IGES 2006
ITTO Annual review and assessment of the world timber situation 2011 Disponivel em
httpwwwittointannual_review Acesso em 10 de out 2013
KELLER M et al Coarse woody debris in undisturbed and logged forests in the eastern Brazilian
Amazon Global Change Biology vol10 PP784-795 2004
LENTINI M VERISSIMO A PEREIRA D A expansatildeo madeireira na Amazocircnia O Estado da
Amazocircnia n2 2005 Beleacutem IMAZON Disponiacutevel em
httpwwwimazonorgbruploadea_2ppdf Acesso em 06 de set 2013
LOETSCH F ZOumlHRER F HALLER K E Forest Inventory Munich BLV Verlagsgesellschaft
2nd
edition Vol II 1973 469 p
MAGNUSSON WE et al RAPELD uma modificaccedilatildeo do meacutetodo de Gentry para inventaacuterios de
biodiversidade em siacutetios para pesquisa ecoloacutegica de longa duraccedilatildeo Biota Neotrop JulDez
2005 vol 5 no 2 httpwwwbiotaneotropicaorgbrv5n2ptabstractpoint-of-
view+bn01005022005 ISSN 1676-0603
MARINELLI C E et al O programa de monitoramento da biodiversidade da biodiversidade e do
uso de recursos naturais em unidades de conservaccedilatildeo estaduais do Amazonas Secretaria
de Estado do Meio Ambiente e Desenvolvimento Sustentaacutevel - SDS Manaus SDS 2007
MONITORING amp IMPLEMENTATION REPORT VCS Version 3 CCB Standards Third Edition
v30 52
MARINELLI C E MALTEZ M H Indicadores de Sustentabilidade para Unidades de
Conservaccedilatildeo Documento-Siacutentese Workshop Instituto Socioambiental Brasiacutelia-DF 2010
76p
MAZZEI L et al Above-ground biomass dynamics after reduced-impact logging in the Eastern
Amazon Forest Ecology and Management vol 259 pp367-373 2010
MEIRELLES FILHO O Livro de Ouro da Amazocircnia 5ordf Ediccedilatildeo Rio de Janeiro EDIOURO 2007
422p Meirelles Filho J O Livro de Ouro da Amazocircnia 1ordf ed Editora Ediouro ISBN
8500021616 2007 450p
MENGER Juliana da Silva Fatores determinantes da distribuiccedilatildeo de aves no interfluacutevio Purus-
Madeira Manaus [sn] 2011 35 fl il
MCT Arquivos dos Fatores de Emissatildeo Disponiacutevel em
httpwwwmctgovbrindexphpcontentview321144htmlancora Acesso em 23 de out
2013
MMA Ministeacuterio do Meio Ambiente Avaliaccedilatildeo e identificaccedilatildeo de accedilotildees prioritaacuterias para a
conservaccedilatildeo utilizaccedilatildeo sustentaacutevel e reparticcedilatildeo dos benefiacutecios da biodiversidade na
Amazocircnia brasileira Brasiacutelia MMASBF 2001
MMA Ministeacuterio do Meio Ambiente Secretaria de Biodiversidade e Florestas Aacutereas Prioritaacuterias
para Conservaccedilatildeo Uso Sustentaacutevel e Reparticcedilatildeo de Benefiacutecios da Biodiversidade Brasileira
Atualizaccedilatildeo - Portaria MMA ndeg9 de 23 de janeiro de 2007 Brasiacutelia MMA 2007 (Seacuterie
Biodiversidade 31)
MONITORING amp IMPLEMENTATION REPORT VCS Version 3 CCB Standards Third Edition
v30 53
MMA Livro vermelho da fauna brasileira ameaccedilada de extinccedilatildeo editores Angelo Barbosa
Monteiro Machado Glaacuteucia Moreira Drummond Adriano Pereira Paglia 1ed 2008 Brasiacutelia
DF MMA Belo Horizonte MG Fundaccedilatildeo Biodiversitas (1420 p) il - (Biodiversidade 19)
OLIVEIRA M M HIGUCHI N CELES C H HIGUCHI F G 2014 Tamanho e formas de
parcelas para inventaacuterios florestais de espeacutecies arboacutereas na Amazocircnia Central Ciecircncia
Florestal Santa Maria v 24 n 3 p 645-653
PEARSON TRH WALKER S BROWN SL The Source Book for Land Use Land Use
Change and Forestry Projects BioCarbon Fund and Winrock International 2005 64 pp
PORTAL AMAZOcircNIA Amazocircnia de A a Z Disponiacutevel em
lthttpportalamazoniaglobocomgt Acesso em 13 de set 2013
PEacuteLLICO NETTO S BRENA D A Inventaacuterio florestal Curitiba Editorado pelos autores p
316 1997
PROJETO SIVAM Relatoacuterio metodoloacutegico de trabalho Revisatildeo 3 Diretoria de Geociecircncia Rio de
Janeiro 2002 330 pp
PROJETO SIVAM Atualizaccedilatildeo do RADAMBRASIL Mapa de Vegetacao da Amazonia Legal
Mapa de Fitofisionomias ndash RADAMSIPAM DNPM Ministeacuterio de Minas e Energia 2002
Disponiacutevel em httpwwwdpiinpebramb_dataShapefilesveg_Amz_SIPAMzip Acesso
em 21 de jan 2014
PROJETO FLORESTAL SANTA MARIA (PROJETO FSM-REDD) Plant Inteligecircncia Ambiental ndash
Warwick Manfrinato 2012 Disponiacutevel em
lthttpwwwflorestalsantamariacombrsitedocumentos57FSM_REDD_VCS_PD_ptpdfgt
Acesso em 09 de set 2013
MONITORING amp IMPLEMENTATION REPORT VCS Version 3 CCB Standards Third Edition
v30 54
RADAMBRASIL Programa de Integraccedilatildeo Nacional Levantamentos de Recursos Naturais v 14 ndash
RADAM DNPM Ministeacuterio de Minas e Energia Brasil 1974
RIBEIRO J E L et al Flora da Reserva Ducke guia de identificaccedilatildeo das plantas vasculares de
uma floresta de terra firme na Amazocircnia Central Manaus Editora INPA 1999
ROSAS F C W WALDEMARIN H de MATTOS G E Pteronura rasiliensis (Zimmermann
1780) In MACHADO A B M DRUMMOND G M PAGLIA A P (eds) Livro Vermelho da
Fauna Brasileira Ameaccedilada de Extinccedilatildeo Volume II 1ed Brasiacutelia DF Ministeacuterio do Meio
Ambiente 2008 p 800 - 801
ROSS D GHG Emissions Resulting from Aircraft Travel 2009 Disponiacutevel em
httpwwwcarbonplanetcomdownloadsFlight_Calculator_Information_v92pdf Acesso em
14 de out 2013
SANTOS A J et al Viabilidade econocircmica do sistema agroflorestal greviacutelea x cafeacute na regiatildeo
norte do Paranaacute CERNE vol6 n1 pp89-100 2000
SANTOS R A Custo do manejo florestal madeireiro estudo de caso Floresta Estadual do
Antimary Monografia (Bacharelado em Economia) ndash Departamento de Ciecircncias
Econocircmicas Universidade Federal do Acre 2007109p
SABOGAL C et al Manejo Florestal Empresarial na Amazocircnia Brasileira restriccedilotildees e
oportunidades (Relatoacuterio Siacutentese) Beleacutem CIFORIMAZON 2006 72p
SDSCEUC Secretaria Estadual de Meio Ambiente e Desenvolvimento Sustentaacutevel ndash Centro
Estadual de Unidades de Conservaccedilatildeo Programa de Monitoramento de Biodiversidade e
Uso de Recursos Naturais em Aacutereas Protegidas do Estado Amazonas (ProBUC) 2006
Disponiacutevel em
MONITORING amp IMPLEMENTATION REPORT VCS Version 3 CCB Standards Third Edition
v30 55
httpbrazilwcsorgDesktopModulesBring2mindDMXDownloadaspxEntryId=6168ampPortalI
d=93ampDownloadMethod=attachment Acesso em 11 de ago de 2013
SFBIMAZON Serviccedilo Florestal Brasileiro e Instituto do Homem e Meio Ambiente da Amazocircnia A
atividade madeireira na Amazocircnia brasileira produccedilatildeo receita e mercados 2010 Disponiacutevel
em httpwwwmmagovbrestruturassfb_arquivosmiolo_resexec_polo_03_95_1pdf
Acesso em 23 de out 2013
SILVA R P da Alometria estoque e dinacircmica da biomassa de florestas primaacuterias e
secundaacuterias na regiatildeo de Manaus (AM) 152 p Tese de Doutorado Programa Integrado
de Poacutes-graduaccedilatildeo em Biologia Tropical e Recursos Naturais (INPA) Manaus 2007
SILVA Z A G P G SANTOS R A Custo do manejo florestal madeireiro em floresta puacuteblica
estudo de caso no Acre 2011 Disponiacutevel em
lthttpwwwbasacombrbancoamazonia2Revistaedicao_13n13_custo_do_manejo_flores
pdfgt Acesso em 13 de set 2013
SMIDT M GALLAGHER T Factors Affecting Fuel Consumption and Harvesting Costs Auburn
School of Forestry and Wildlife Sciences Sd Disponiacutevel em
httpweb1cnrevteduforestrycofedocuments2013Smidt_Gallagherpdf Acesso em 21
de out 2013
SOARES-FILHO B et al Role of Brazilian Amazon protected areas in climate change mitigation
2010 Columbia University NY Ruth S DeFries 2010
SPF Serviccedilo Puacuteblico Federal DVPF Documento de venda de produto Florestal (Declaraccedilotildees de
venda Gethalpdf) 14 de julho de 2006
MONITORING amp IMPLEMENTATION REPORT VCS Version 3 CCB Standards Third Edition
v30 56
TIMOFEICZYK JUacuteNIOR R et al Rentabilidade econocircmica do manejo de baixo impacto em
florestas tropicais um estudo de caso Revista Floresta Curitiba v 38 n 4 p 711-725
outdez 2008
VCS Ferramenta para Demonstraccedilatildeo e Avaliaccedilatildeo de Adicionalidade para Atividades de Projetos
VCS em Agricultura Floresta e Outros Usos (AFOLU) 2012a Disponiacutevel em httpwwwv-c-
sorgsitesv-c-sorgfilesVT000120VCS20AFOLU20Additionality20Tool20v30pdf
Acesso em 24 de set 2013
VCS Ferramenta de Risco e Natildeo Permanecircncia (AFOLU) 2012B Disponiacutevel em httpv-c-
sorgsitesv-c-sorgfilesAFOLU20Non-Permanence20Risk20Tool2C20v32pdf
Acesso em 13 de set 2013
VCS Approved VCS Methodology VM0010 Version 10 - Methodology for Improved Forest
Management Conversion to Logged to Protected Forest Calculating GHG Benefits from
Preventing Planned Degradation PHUA S SHARMA S TELFER M CHANDLER H
(Eds) Califoacuternia EUA Carbon Planet Limited 2011149p
VERDEJO M E Diagnoacutestico Rural Participativo um guia praacutetico Brasiacutelia MDA 2006 62p
VIANNA A L M Diagnoacutestico Florestal do Estado do Amazonas 2010 e 2011 Manaus-AM
IDESAM 2013 (Relatoacuterio Final do Projeto Fortalecimento da participaccedilatildeo da sociedade civil
no Amazonas Foacuterum de Mudanccedilas Climaacuteticas Transparecircncia Florestal no Estado do
Amazonas ndash Mapeamento de Instrumentos Legislativos no Brasil)
WBCSDWRI The GHG Protocol for Project Accountin Washington World Business Council for
Sustainable DevelopmentWorld Resources Institute 2005148 p
MONITORING amp IMPLEMENTATION REPORT VCS Version 3 CCB Standards Third Edition
v30 57
WALKER W et al Guia de Campo para Estimativa de Biomassa Florestal e Estoque de Carbono
Woods Hole Center Research Falmouth Massachusetts USA 2011 Disponiacutevel em
httpwwwwhrcorgresourcesfieldguidescarbonpdfWHRC_FieldGuide_PortugueseSMpdf
Acesso em 14 de set 2013
WWF Metodologia para Avaliaccedilatildeo Raacutepida e a Priorizaccedilatildeo do Manejo de Unidades de
Conservaccedilatildeo (RAPPAM) 2010 Disponiacutevel em httpgooglXfDnxs Acesso em 30 de set
2013
WWF-Brasil Efetividade de Gestatildeo das Unidades de Conservaccedilatildeo no Estado do Amazonas
Secretaria de Estado do Meio Ambiente e do Desenvolvimento Sustentaacutevel do Amazonas
Instituto Chico Mendes de Conservaccedilatildeo da Biodiversidade Brasiacutelia WWF-Brasil 2011 72 p

MONITORING amp IMPLEMENTATION REPORT VCS Version 3 CCB Standards Third Edition
v30 21
Except for Terra Preta do Rio Manicoreacute Mocambo and Satildeo Joseacute do Miriti all of the communities
utilize the Rio Amapaacute RDS area either on a sporadic or seasonal basis to meet their food needs
(collecting various fruits fishing and hunting) for household and medicinal use (bark leaves and
plant parts considered by medical practices and traditional knowledge) and primarily for the sale of
various non-timber products especially the harvesting of Brazil nut accedilaiacute and copaiacuteba oil However
the trails roads and paths that provide access to the Amapaacute Rio RDS and Amazon Rio areas are
in a poor state of repair which hinders extraction practices especially the production of Brazil nuts
In addition to the 15 communities surrounding the Amazon Rio areas government organizations
directly involved with environmental issues in the region such as SDS the National Indian
Foundation (Fundaccedilatildeo Nacional do Iacutendio - FUNAI) City Hall and the City Council of Manicoreacute the
Secretary of Environment and Sustainable Development of Manicoreacute ICMBio and non-
governmental organizations such as FAS IEB CAAD CNS UFAM UEA were identified and
contacted to participate in the entire process of preparation of the Management Plan
Stakeholder meetings
To present and discuss the project in detail with representatives of 15 communities surrounding
the project area and support institutions three workshops in different locations were conducted
The subjects were presented in straightforward language in a culturally appropriate way so that
community representatives could understand relatively complex and unusual concepts such as
climate change greenhouse effect and payments for environmental services
The importance of forests for the mitigation and adaptation to climate change was emphasized to
convey the main objectives of the project to community representatives and in particular their role
in (i) absorbing carbon dioxide and release oxygen (ii) helping control climate processes on a
regional scale (iii) regulating the flow of rivers and erosion control and (iv) providing shelter and
food for most animals and plants on the planet The fact that 20 of global greenhouse gas
emissions come from the destruction of forests and in Brazil 70 of emissions come from
deforestation was also mentioned
During the workshops participants learned that steps can be taken to reduce the emissions of
greenhouse gases by investing in renewable energy sources such as solar energy wind energy
hydroelectric power plants electric cars and other more efficient ones Another option that
mitigates climate change was also highlighted that relates to the Amazon forest conservation and
the restoration of degraded areas through reforestation management of agricultural land and
establishment of agroforestry systems
MONITORING amp IMPLEMENTATION REPORT VCS Version 3 CCB Standards Third Edition
v30 22
After concepts were discussed it was explained to those present that the proposed project to be
carried out in the RPDS Amazon Rio I recently approved at the time and in the creation process
in the other Reserves has essentially one goal to financially reward those who preserve and
protect a forest threatened with deforestation and degradation the project aims (i) raise funds for
the implementation of the Management Plan programs and (ii) conserve forests and the associated
biodiversity It was also mentioned that the project is part of a new vision of the business strategy
since a logging plan was operational until 2010 associated with the emissions of greenhouse
gases In 2010 the practice was suspended by the owner who began investing in the creation of a
project focused on conservation and payment for environmental services with emphasis on the
voluntary carbon market
Implementation schedule
Table 2 - Implementation schedule and next activities
Ano Atividade
2010
EBCF performs the symbolic protocol creation of the first RPDs during the
seminar results and perspective of the State of Amazonas Conservation
Units held by the SDS
2011 EBCF submits the formal protocol to CEUC
2011 Meeting presentation EBCF for communities near the Amazon River I II III
and IV
2011
EBCF attended the informal invitation made by the management of RDS
Rio Amapaacute and representative CEUC - Silvia Elena the training workshop
and delivery portfolios ENVIRONMENTAL VOLUNTEERS AGENTS held in
the Boa Esperanccedila community
2011
EBCF participated in the event organized by the CAAD which had the
agenda General Assembly accountability of CAAD year 20092010 RDS
Management Plan Amapaacute Rio Bolsa Floresta Municipal Management
IDAM contribution contribution Covema IEBs contribution and delivery of
equipment for processing of acai held on 24032011 in the community of
MONITORING amp IMPLEMENTATION REPORT VCS Version 3 CCB Standards Third Edition
v30 23
Democracy and 25032011 in the Boa esperanccedila Community
2011 Inspection of CEUC on farms for approval on RPDs
2011 The board of EBCF makes his 1st visit the communities and farms
2011
EBCF in partnership with the Municipal Government of Manipur perform
the recovery local road (approximately 20KM) linking Democracia
community Jatuarana communities Terra Preta Community Santa Eva
and Vista Alegre
2012
Visit of the president and directors of EBCF the communities surrounding
the reserves together with the president of PATAC Marcelo Marder and
Andre Albuquerque president for socioeconomic communities report
presentation
2012 Business Plan Project approval and EBCF shareholders agreement
authorizing the start of the REDD project
2013 Workshop I - Diagnosis for the development of areas of the Amazon River
Management Plan I II III amp IV
2013 Visit communities to complement the workshop I for interviews with the
locals
2013 Meeting in CEUC after the second workshop to update the work with the
communities and the progress of the approval of the areas
2013
Technical meeting with the team CO2X Renascer and Human
Development EBCF in Curitiba for the review and evaluation of the first part
of the Management Plan (diagnosis) Definition of programs and
subprograms of the Plan identification of key issues potential threats and
opportunities with the creation of RPDSs definition of vision and action
strategy
MONITORING amp IMPLEMENTATION REPORT VCS Version 3 CCB Standards Third Edition
v30 24
2013
The Secretary of State for the Environment (SDS) officiated at the World
Environment Day the first Private Reserve Sustainable Development
(RPDs) of the Amazon with the signing of the decree no 86
2013 Workshop II - presentation of the carbon project as one of the fundraising
programs for the implementation of the Management Plan
2013 Field work with communities and farms for mapping biodiversity and
hunting and fishing grounds
2013 The EBCF performs a complete socioeconomic census in the surrounding
communities of RPDs
2013 Meeting with CEUC for delivery and presentation of the draft of RPDs
Amazon River Management Plan I
2013
Supplementary Meeting to communities who could not attend the
Workshop II amp III Workshop Creation of the Advisory Council for RPDs
Amazon River I
2013 The EBCF performs social and economic Census in Kamayuaacute community
2015 Realization of field activities for Biomass Inventory Estimation
2016 Vitor Belfort visit and launch of income-generating initiatives
2016 Distribution of medical kits for community health workers and launching the
Health Program in the Amazon
2016 Deforestation Report
2016 PD Review and preparation of the monitoring report
MONITORING amp IMPLEMENTATION REPORT VCS Version 3 CCB Standards Third Edition
v30 25
2016 REDD + Project Certification (VCS and CCV)
2016 Project planning for structuring the supply chain of vegetable oils
certificates
2017 Fundraising from the REDD project
2017 Ecotourism Project Design
2017 Workshop Achievement Participatory Planning Project REDD + activity
EBCF
2017 ProBUC Deployment
2018 Implementation of Voluntary Environmental Agent program
25 Respect for Rights and no Involuntary Relocation
In the three workshops explaining the Carbon project to 15 communities the eight REDD+
principles and the social and environmental safeguards were presented Those safeguards were
previously established in a series of meetings throughout the Amazon between 2009 and 2010
and included several Civil Society Organizations
It was emphasized in the workshops that compliance with these principles and safeguards under
REDD+ projects such as the Amazon Rio carbon project contributes to improving local
governance transparency of information public participation in decision-making coordination of
actions among different actors and respect and recognition of the rights of indigenous peoples and
traditional populations
Free Prior and Informed Consent (FPIC)
During the project workshops the concept of Free Prior and Informed Consent was presented to
the participants as well as the importance of social and environmental safeguards to ensure the
rights of communities in designing and developing the REDD+ project explained in the eight
principles The participants were asked whether they were in agreement and if there were other
MONITORING amp IMPLEMENTATION REPORT VCS Version 3 CCB Standards Third Edition
v30 26
principles or rights that should be included Some community individuals expressed their
agreement to the safeguards All participants at the three workshops raised their hands in support
of REDD+ project The consent was unanimous
A separate document describing the whole process of the Free Prior and Informed Consent has
been prepared and is available in Annex 10
Figure 05 - Workshop I Free Prior and Informed Consent for the development of the REDD+
project by the community leaders of Democracia Aacutegua Azul Satildeo Joseacute do Miriti Vista Alegre
Jatuarana Terra Preta do Ramal Pandegal Santa Maria Santa Eva and Terra Preta do Rio
Mancoreacute
Figure 06 - Workshop II Free Prior and Informed Consent for the development of the REDD+
project by the community leaders of Urucury Mocambo Boa Esperanccedila and Satildeo Joatildeo amp Ponta
Grossa
MONITORING amp IMPLEMENTATION REPORT VCS Version 3 CCB Standards Third Edition
v30 27
Figure 07 - Workshop III Free Prior and Informed Consent for the development of the REDD+
project by the Kamayuaacute indigenous community
3 APPLICATION OF METHODOLOGY
31 Title and Reference of Methodology
VCS VM0011 Methodology for Improved Forest Management ndash Logged to Protected Forest
(LtPF) Calculating the GHG Benefits from Preventing Planned Degradation version 10
MONITORING amp IMPLEMENTATION REPORT VCS Version 3 CCB Standards Third Edition
v30 28
32 Methodology Deviations
Whereas the VM0011 was developed in a context of homogeneous forests of temperate regions
some methodological adjustments were made related to the direct survey biomass in the field
since the project areas are comprised of very heterogeneous areas of rainforest including dryland
and floodplains Any technical documentation related to these methodological adjustments and
their justifications appear in Annex 23 (Forest Inventory 2016) prepared by the consulting firm
HDOM
33 Project Boundary5
The total area of the property is 20387 ha and a buffer zone was established around each of the
four areas in order to include communities that use the resources within their boundaries (Figure
7a) Project activity areas (for purposes of calculating the emissions reductions called the project
area or PA) are only those for which logging is permitted a total of 19800 ha (Figure 7b)
excluding the Permanent Preservation Areas (APPs) and bodies of water A logging plan has been
approved for this area for selective logging (Annexes 1 2 3 4 6 and 7)
Figure 08 - Project Boundaries a) Direct Project interference limits b) Total Project Area (G1
Indicator 7)
5 Ref section 22 of VM0011
MONITORING amp IMPLEMENTATION REPORT VCS Version 3 CCB Standards Third Edition
v30 29
Stratification of the project area
For purposes of inventorying local carbon stocks and project management the project area was
stratified into 3 groups of different forest types as indicated by the VM0011 according to the
vegetation map SIPAMRADAM (DPI 2002) The forest types present in the area are rain forest
types divided into 3 categories as follows
Dense Primary Tropical Ombrophylous Alluvial Forest
Dense Primary Tropical Ombrophylous Lowland Forest
Pioneer Formations
Figure 09 - Project Area forest types
Leakage areas
There is no direct leakage resulting from planned project activities since there will be neither
displacement of management activities to other areas after the cessation of the activities within the
project area nor market leakages The project Management Plan includes the monitoring of
MONITORING amp IMPLEMENTATION REPORT VCS Version 3 CCB Standards Third Edition
v30 30
possible unanticipated leakages around the project area as well as the need to report to the
competent authorities whenever logging activities are identified in these areas For more
information on leakage see chapters 52 and 55 of this document
Temporal boundaries
Crediting period of the project
The first crediting period of the project is 37 years beginning on August 17 2012 and ending on 17
August 2049 This period is equivalent to the remaining 12 years of the first authorized
management plan (25 years from 1998) added to another 25 years in respect of a new forest
management plan that was intended as the common practice of forestry in Brazil The logging
activities could continue beyond 37 years aiming for a second crediting period
Monitoring and Reporting Period
a) Monitoring of Baseline Emissions
The monitoring of Baseline Emissions must demonstrate that the protected forest area is in
accordance with the one specified in the PD The project limit will be monitored before each
verification throughout the crediting period through new inventory information and remote sensing
and GIS as applicable Thus the project will be able to update the baseline calculations based on
the actual remaining forest area (in case of loss of forest cover by disasters for example) and that
would be subject to forest management under a ldquowithout projectrdquo scenario
b) Monitoring of Project Emissions
Project emissions will be monitored annually and compiled in every monitoring report that will detail
in particular the
Monitoring of possible illegal harvesting of timber
Monitoring of areas subject to natural disturbances
Monitoring and quantification of emissions related to air and land travel related to project
activities
c) Monitoring of Leakage
Since there will be no leakages according to the VM0011 and AFOLU Requirements no leakage
monitoring will be necessary However to be conservative the project intends to monitor any
disturbances that might affect the carbon reservoirs Once some disturbance is registered the
project will report the incident to the relevant authorities and make the necessary adjustments to
MONITORING amp IMPLEMENTATION REPORT VCS Version 3 CCB Standards Third Edition
v30 31
the baseline For more details about the monitoring of leakages see chapters 52 and 55 of this
document
Carbon stocks
The biomass reservoirs considered by the project are related to above-ground and underground
biomass
Sources and sinks of GHGs
Table 02 below describes the emission sources and sinks of greenhouse gases associated with
the baseline activities and with the project
Table 03 - Greenhouse gas emissions sources and sinks associated with baseline and project
activities
Source Gas Included JustificationExplanation
Baselin
e
Biomass
CO2 Yes Main source of project emissions through forest
degradation harvested and commercialised
wood products deadwood and forest regrowth
CH4 No Conservatively excluded
N2O No Conservatively excluded
Other No -
Fossil Fuel
consumption
CO2 Yes Main source through fossil fuel use in
machinery and transportation of timber
CH4 Yes Conservatively included
N2O Yes Conservatively included
Other No -
Electricity
consumption
CO2 Yes Main source
CH4 No -
N2O No -
Other No -
Pro
ject
Biomass
CO2 Yes Main source through unexpected natural
disturbances such as forest fires etc
CH4 Yes Included but subject to significance
N2O Yes Included but subject to significance
MONITORING amp IMPLEMENTATION REPORT VCS Version 3 CCB Standards Third Edition
v30 32
Source Gas Included JustificationExplanation
Other No _
Fossil Fuel
consumption
CO2 Yes Main source through flights and ground travel
CH4 Yes Included but subject to significance
N2O Yes Included but subject to significance
Other No _
Electricity
consumption
CO2 Yes Main source
CH4 No _
N2O No _
Other No _
34 Baseline Scenario
The choice between alternative baseline scenarios was taken together with the analysis of
additionality using the latest version of the VCS Tool for the demonstration and assessment of
additionality in Agriculture Forestry and Other Land Use VCS projects in this case VT000167
(VCS 2012a) All possible scenarios as well as the analysis of methodology barriers (steps 211
and 212 of the VM0011) are present in the chapter below In this sense to avoid redundancy of
information refer to additionality analysis to find the steps 211 and 212 of the VM0011
The baseline scenario for the project identified as the most likely to occur was selective logging8
(continuation of Business As Usual - BAU) The reference scenario assumes 37 years of selective
logging according to the 25 year logging plan approved in August 1998 (Annex 6 - document
ValdII T01 POA 1998) that in the absence of project activities would be renewed in 2024 for
another 25 years until 2049
Under this scenario the full implementation of the timber logging plan occurs and which has
already resulted in the degradation of 434769 ha (see table below) The area would be harvested
selectively for timber sold in lumber markets Below is a summary of harvest areas between 1999
and 2010 showing the managed plots and the dates on which the harvests were authorized
6 Tool for the demonstration and assessment of an additional to the VCS project activities in Agriculture Forestry and Other
Uses (AFOLU) (V 30)
7 Adapted from ldquoTool for the Demonstration and Assessment of Additionality in AR CDM project Activitiesrdquo (V02) 8 Additional information about choosing the baseline are presented in section 46 (steps 1 and 2)
MONITORING amp IMPLEMENTATION REPORT VCS Version 3 CCB Standards Third Edition
v30 33
Table 04 - Summary of areas managed since 1999
Date Managed logged area (ha)
1999 58669 (Plot 1)
2000 688 (Plot 2)
2001 ndash 2002 8315 (Plot 3)
2003 ndash 2004 750 (Plots 3 and 4)
2005 ndash 2007 1082 (Plot 5)
2008 ndash 2009 49050 (Plots 5 and 6)
TOTAL 434769
35 Additionality
The additionality analysis of the Amazon Rio project REDD+ IFM was conducted with the latest
version of the VCS Tool for the demonstration and assessment of additionality in Agriculture
Forestry and Other Land Use VCS projects the VT000167
(VCS 2012a)
To generate the reductions in GHG emissions for the project the planned baseline activities
(sustainable forest management) were terminated by the project proponent and supplanted by
environmental conservation activities In this sense the project will be managed by EBCF with
the goal of creating a fund for administrative and accounting management especially to promote
environmental management and monitoring activities of carbon pools within the project area
Alternative activities planned in the project are the provisioning and valuation of environmental
services via carbon credits (VCUs) in conjunction with the sale of Environmental Reserve Quotas
(CRAs)
4 MONITORING AND PARAMETERS OF DATA
41 Monitoring Plan Description
Due to its innovative comprehensive and integrative character the project needs to be monitored
regularly so that its actions activities and impacts can be constantly measured and evaluated To
meet this requirement the monitoring process must meet three main objectives
MONITORING amp IMPLEMENTATION REPORT VCS Version 3 CCB Standards Third Edition
v30 34
i To serve as an internal management project tool
ii To collaborate as an instrument of collective learning from the communities and
social groups directly involved
iii To work as a means of communicating results and impacts to interested institutions
and society in general Furthermore it is important to consider that monitoring if
successful will transcend the managerial aspects of the project and strengthening
the plan
To facilitate the monitoring process instead of having a reference line (to compare interventions
before and after) the first year of monitoring will serve as the starting point whose information will
be regularly and systematically compared throughout the project
Next the initial plans for monitoring benefits to the climate community and biodiversity are
described wherein the community is committed to participatory precept and to the technical and
scientific rigor which is capable of following the possible negative and positive impacts on
environmental and social aspects in the project area and its surroundings
Monitoring of Climate Impacts
The Monitoring Plan (MP) aims to provide security in the periodic estimates of reduction in
emissions especially in monitoring changes in carbon stock Therefore emissions from the
implementation of the project ex post estimates of the activities and emissions from any leakages
and isolated disturbances (eg blowdown fires pests and diseases among others) can be
calculated
The construction of the PM of the climate benefits made in full compliance with the methodological
framework provided by VM0011 ndash IFM LPF (VCS 2011) and CCBA (2008) which consists of four
specific actions to be monitored
i Implementation and execution of the project
ii Dynamics and stock of the forest biomass
iii Deforestation and forest degradation
iv Periodic reviews of ex post emissions
Remote monitoring and surveillance of the project area
Measurement of alterations and biomass loss quantification present in the PA using land use
change detection is critical to make accurate estimates of GHG emissions that account for forest
biomass increases and losses
MONITORING amp IMPLEMENTATION REPORT VCS Version 3 CCB Standards Third Edition
v30 35
Thus the use of remote sensing by satellite images of medium spatial resolution can be applied
readily in the PA and surroundings in order to monitor land use dynamics over time particularly to
identify risks and threats to forested areas In situ verification will complement landscape analysis
in a GIS environment with the aim of quantifying spatializing and identifying conversion of forest
areas into other land uses environmental degradation and other possible changes that may occur
during the term of the project
As a complementary monitoring source the project will rely on the database and information
provided by Monitoring Program of the Brazilian Amazon Forest by Satellite 910
(Prodes Digital)
conducted by the National Institute for Space Research (Instituto Nacional de Pesquisas Espaciais
- INPE) according to the Plan for Prevention and Control of Deforestation in the Amazon
1112(PPCDAm) under the National Policy on Prevention and Control of Deforestation Such
information is available online in13
digital vector files for the public in general
Other tools will provide complementary information to the monitoring such as indicators of forest
degradation and hotspots (fires and wildfires) obtained from DETER 14
SAD 15
and PROARCO16
Information is available online for free in vector format These results will be systematically related
to field data for validating or disproving the occurred event so that the focuses of deforestation and
degradation can be identified remediated reported and consequently avoided as much as
possible
A surveillance system that allows permanent territorial monitoring and inhibits the entry of intruders
through entry points in the PA will also be deployed to control the transport flow In addition one
must investigate and identify risks and threats eg mapping hotspots and areas vulnerable to fire
to illegal logging to hunting and poaching and to invasions by third parties among others
At first we estimate an effective demand for structuring the electronic monitoring system which
includes the hiring of skilled professionals field equipment electronic equipment (digital cameras
GPS desktops and notebooks smartphones printers geoprocessing software and GIS among
others) vehicles andor motorcycles motorized boats for transportation and moving around and
the collection of high resolution satellite images Empowerment and training of all involved staff
9httpwwwobtinpebrprodesdigitalmetodologiahtml
10httpwwwobtinpebrprodesmetodologiapdf 11httpwwwmmagovbrflorestascontrole-e-prevenC3A7C3A3o-do-desmatamento 12httpwwwmmagovbrimagesarquivo80120PPCDAm_FINAL_PPCDAMPDF 13httpwwwobtinpebrprodesindexhtml 14httpwwwobtinpebrdeterdados 15httpwwwimazongeoorgbrdocdownloadsphp 16httpwwwdpiinpebrproarcobdqueimadas
MONITORING amp IMPLEMENTATION REPORT VCS Version 3 CCB Standards Third Edition
v30 36
and the surrounding communities will be necessary to make the system effective17
and a constant
stream of information directed to regional actors and other stakeholders
Strategic monitoring and access points to RPDS roads will also provide support to other MPs
including social and biodiversity conservation aspects especially in the logistic support of planned
field activities
Procedures for determining the permanent sample plots (PSPs) and measurement
The calculation of the stock and increase in forest biomass will be subsidized through the
installation of PSPs in the PA and its temporal monitoring through the Continuous Forest Inventory
(CFI) The methodology proposed by VCS (2011) suggests the use of permanent andor temporary
plots however it confirms the efficiency and accuracy of sample plots
In order to demonstrate the procedural and statistical rigor used all the sampling procedures the
PA forest stratification sampling design calculation of sampling intensity and other parameters
measured in PSPs to monitor biomass balance due to ingressmortality of individuals growth in
DBH and height will be presented in detail in the Annex (Annex 23 - Forest Inventory 2016)
To promote reliable forest biomass estimates standard operating procedures (SOPs) (Section 82)
will be used by the team executing the CFI
Monitoring frequency
The monitoring frequency parameters measured in the PSPs will be no greater than 5 years from
the first measurement Other relevant parameters to monitoring the PSPs like the change in land
use in the PA and surrounding areas such as deforestation forest degradation fire sources and
natural disturbances will be regularly monitored as a project routine operation organized and
archived annually
411 Monitoring Impacts to Biodiversity
Since animal inventories have not been conducted in Amazon Rio project areas (for this project
biological information for the Rio Amapaacute RDS management plan were used) a biodiversity
monitoring system that will follow the RAPELD methodology (Rapid surveys of various taxonomic
groups (RAP) for long-term ecological studies) (MAGNUSSON et al 2005)
The RAPELD method contributes to long-term research using rapid inventory assessments biotic
complementarity and land use planning in the Amazon This method increases adequate sampling
17Linking community monitoring to national Measurement Reporting and Verification for REDD+
MONITORING amp IMPLEMENTATION REPORT VCS Version 3 CCB Standards Third Edition
v30 37
probability of biologically diverse communities which require large areas and at the same time
minimize variation of abiotic factors that affect these communities with smaller areas sampling
Evaluation and selection of indicators will be conducted in accordance with the ProBUC model
however applicably to local reality results will be updated biennially from the first survey
Biodiversity indicators are being designed and planned as suggested in the Social and
Environmental Monitoring System of Protected Areas in the Brazilian Amazon (Sistema de
Monitoramento Socioambiental das Unidades de Conservaccedilatildeo da Amazocircnia Brasileira)1819
and
Methodology for Rapid Assessment and Prioritization of Protected Areas Management20
(Metodologia para Avaliaccedilatildeo Raacutepida e Priorizaccedilatildeo do Manejo de Unidades de Conservaccedilatildeo -
RAPPAM) in line with the experiences gained and disseminated by CEUC and ICMBIO previously
described
The empowerment accountability and shared management of biodiversity conservation is the
main focus of the methodological model adopted These actions create high expectations for
environmental management of the area as the biodiversity monitoring will be conducted by the
community members themselves along with the project proponent promoting a local multiplier
effect It is worth mentioning that strict compliance with these procedures is in within EBCF`s
interest since it considers them to be key to the success of the project
The project begins with the premise that any negative impact on biodiversity in the project area
and its surroundings will not occur In the opposite sense the project aims to generate and provide
greater understanding of the territory subsidizing proposals for the conservation and sustainable
use through adoption of good management practices of natural resources as well as its replication
in other locations
412 Monitoring Social Impacts
The monitoring of social aspects include both the collection of numerical data such as quantity
volume weight (quantitative indicators) as well as information expressing opinions and
experiences (qualitative indicators) remembering that such measures are compatible and
interchangeable Data collection should be systematic and have a pre-established rate and most
likely a single indicator will require several data collection instruments such as plans field records
reports etc
Social information will be monitored through the use of participatory methodologies In this sense
the preparation process of the Amazon Rio I RPDS Management Plan was a first step For the
18Indicator Design 19Social and Environmental Monitoring of Protected Areas System in the Brazilian Amazon (Sistema de Monitoramento
Socioambiental das Unidades de Conservaccedilatildeo da Amazocircnia Brasileira) 20Metodologia para Avaliaccedilatildeo Raacutepida e a Priorizaccedilatildeo do Manejo de Unidades de Conservaccedilatildeo (RAPPAM)
MONITORING amp IMPLEMENTATION REPORT VCS Version 3 CCB Standards Third Edition
v30 38
socioeconomic characteristics of communities several community meetings land use mapping
workshops and interviews with focus groups were held in addition to field visits (Annex 10) The
main activities of the project were presented and discussed in these events emphasizing the
importance and timeliness of local valuation of environmental services as well as strategies for
raising funds to implement other projects and improvements in social well-being of communities
around the PA
5 MEASUREMENT OF GHG EMISSIONS REDUCTIONS AND REMOVALS (CLIMATE)
51 Emissions Baseline
EBCF did not carry out any wood related exploration activity in the areas since the beginning of
the REDD+ project Thus it is confirmed estimated emission reductions for the project as
8678833 t CO2eq t year
52 Project emissions
Project emissions were primarily those related to the running of offices and necessary travels for
studies meetings presentations workshops and other activities Table 10 presents a summary of
emissions based on data from Annex 21 of this report
Table 05 - 2011-2016 Project Activity Emissions
YEAR Energy
(KWh)
Energy
(t CO2eq)
Travels
(Km)
Travels
(t CO2eq)
Total
(t CO2eq)
2010
678 024 024
2011
104010 2360 2360
2012 1149 008 55724 1573 1581
2013 2756 028 236749 5429 5457
2014 2498 025 15789 459 484
2015 2231 023 27340 597 620
2016 1015 010
010
093 440290 10443 10536
53 Leakage
Not applicable according to presentation made on the REDD+ IFM document
MONITORING amp IMPLEMENTATION REPORT VCS Version 3 CCB Standards Third Edition
v30 39
54 Summary of GHG Emission Reductions And Removals
EBCF REDD+ project shows emissions reduction of 34397563 tCO2e as the balance in the
period of 2011-2015 Table 06 shows the overview of the dynamics of reductions and project
emissions up to 2048 By the year 2015 the emissions data is posted as seen in reports and from
2016 data are projects as previous average and should be adjusted as a result of future reports
Table 06 - Summary of ex ante estimates
Year
Estimated
reductions
from
baseline21
(tCO2e)
Project
Estimated
emissions 22
tCO2e)
Unplanned
estimate
Emissions23
(tCO2e)
Net GHG
Estimated
emissions
Reduction
(tCO2e)
2012 8675500 1581 0 8673919
2013 8675500 5457 0 8670043
2014 8675500 484 296296 8378720
2015 8675500 620 0 8674880
2016 8675500 2100 0 8673400
2017 8675500 2100 0 8673400
2018 8675500 2100 0 8673400
2019 8675500 2100 0 8673400
2020 8675500 2100 0 8673400
2030 8675500 2100 0 8673400
2048 8675500 2100 0 8673400
Total 3123180 25203 296296 3119989
55 Climate Change Adaptation Benefits (GL1)
There is a relatively widespread understanding in the scientific community that balanced
ecosystems have greater ecological and social resilience and adaptability to climate change
21
See annex 18 22
See annex 21 23
See annex 24- HDOM (Study on deforestation and heat spots for EBCF REDD+ Project technical report)
MONITORING amp IMPLEMENTATION REPORT VCS Version 3 CCB Standards Third Edition
v30 40
whether through protection of water bodies and regulation of river flows during peak flood and
drought or through the regular supply of environmental services products and services
Thus once the project is designed to conserve an area of native forest which in the absence of
the project scenario would remain subject to the pressure of timber management (baseline) and
consequent degradation resulting from such activities it is understood that the mere protection of
these areas alone would offer communities and the ecosystem itself better adaptability compared
to the baseline scenario
Moreover the project has an Activity Management Plan (Annex 9) which details among other
initiatives the promotion of the sustainable use of ecosystem resources through direct support in
some activities related to income generation and conservation along with community training It is
believed that in addition to ensuring a more balanced (and therefore more resilient) environment
the project will expand the options for generating income among the communities making them
more resilient and preparing them to face the greater and already perceived challenges posed by
climate change
6 COMMUNITY
61 Positive Impacts for Communities (CM1)
EBCFrsquos REDD+ project was first presented to the riverine communities in 2011 By then
communities were informed about the cessation of all timber exploration activities due to the
REDD+ project and discussions were held regarding biodiversity conservation and the sustainable
use of forest products and services as well the social development of the surrounding
communities Briefly the positive impacts along the communities were
1 Project area zoning and its surroundings
2 Contribution to building local capacity
3 Contribution to developing sustainable business in the region
4 Contribution to social and environmental diagnosis
Knowing to manage
To evaluate the progress of these initiatives throughout the development of the project we used
the methodology of the Sustainability Matrix developed by the Secretariat of Environment and
MONITORING amp IMPLEMENTATION REPORT VCS Version 3 CCB Standards Third Edition
v30 41
Sustainable Development of Amazonas State This tool was applied in 15 communities taking into
account local socio-economic aspects that underlie the development of 20 parameters considered
of great importance to community development described by specific indicators As a visual tool
the Sustainability Matrix is quite suitable for traditional populations such as the riverside and
indigenous communities surrounding the Reserve Amazon River I and other areas of the Project
Additionally the Matrix provides interesting spaces for discussion since its construction is done
collectively Through the Sustainability Matrix it was possible to identify along with the
communities projects activities and implementation strategies Budgets and monitoring and
evaluation of these projects will be detailed later through the Annual Operational Plans to be
developed and followed up in the due course Four programs and nine subprograms were defined
for management and community development (Annex 9)
62 Negative Impacts (CM2)
No negative impacts have been recorded or identified as a result of the project with stakeholders
7 BIODIVERSITY
71 Positive Impacts for Biodiversity (B1)
The benefits for biodiversity are in reducing deforestation and degradation (selective logging) in the
project area According to satellite images analysis in the project areas and their surroundings it
was observed that until 2010 300 hectares were deforested After the implementation of the
project community awareness on the importance of preservation and conservation of forests have
encouraged no deforestation degradation and a significant reduction in deforestation was
identified (see graph below) This was due to the good understanding of the projects conservation
objectives and by the involvement and support of the surrounding communities
MONITORING amp IMPLEMENTATION REPORT VCS Version 3 CCB Standards Third Edition
v30 42
Figure 10 - EBCF REDD Project and buffer areas deforestation figures (source HDOM Report)
The consequences of deforestation and degradation on biodiversity are well known Thus the fact
of not being identified changes (natural or anthropogenic) in forest areas shows there was no loss
of biodiversity no reduction in floristic diversity no impact on the dynamics of fauna and flora and
no loss of evolutionary genetic information
72 Negative Impacts on Biodiversity (B2)
There are no negative impacts on biodiversity as a result of the project
73 Exceptional Benefits for Biodiversity (GL3)
The description of exceptional benefits for biodiversity will only be possible after the re-
measurement of permanent plots (FLORA)
8 ADICIONAL INFORMATION
All activities and the consequent reduction in deforestation and degradation in and around the
project areas were maintained and funded without resources of carbon credits We understand that
with the advance of REDD+ project EBCF will have much better conditions to implement positive
actions in partnership with communities
MONITORING amp IMPLEMENTATION REPORT VCS Version 3 CCB Standards Third Edition
v30 43
REFERENCES
ADEODATO S etal Madeira de ponta a ponta o caminho da floresta ateacute o consumo Satildeo Paulo
FGV-RAE 2011
ALBAGLI S Amazocircnia fronteira geopoliacutetica da biodiversidade Revista Parcerias Estrateacutegicas n
12 p6 set2001 Centro de Estudos Estrateacutegicos do Ministeacuterio da Ciecircncia e Tecnologia
AMARAL I C Viabilidade de plantio de cafeacute na zona da mata mineira Revista Poliacutetica Agriacutecola
Ano xx n4 outnovdez 2011 Disponiacutevel em
httpwwwalicecnptiaembrapabrbitstreamdoc9309031Viabilidadedeplantiopdf Acesso
em 17 de set 2013
AMARAL P etal Floresta para Sempre um manual para a produccedilatildeo de madeira na Amazocircnia
Beleacutem IMAZON 1998 130p
AMAZONAS Lei Complementar nordm 532007 de 05062007 REGULAMENTA o inciso V do artigo
230 e o sect 1ordm do artigo 231 da Constituiccedilatildeo Estadual institui o SISTEMA ESTADUAL DE
UNIDADES DE CONSERVACcedilAtildeO - SEUC dispondo sobre infraccedilotildees e penalidades e
estabelecendo outras providecircncias Disponiacutevel em
httpwwwcetesbspgovbruserfilesfilemudancasclimaticasproclimafilelegislacaoestadua
lamazonasleilei_complementar_n_53_2007_amazonaspdf Acessado em Setembro 2013
ANTAQ Anuaacuterio Estatiacutestico 2004 Distacircncia entre os portos Disponiacutevel em
httpwwwantaqgovbrportalanuariosportuario2004TabelasDistanciaEntrePortospdf
Acesso em 23 de out 2013
ANTAQ Panorama Aquaviaacuterio Agecircncia Nacional de Transportes Aquaviaacuterios Volume 3 Brasiacutelia
ndash DF 2009
MONITORING amp IMPLEMENTATION REPORT VCS Version 3 CCB Standards Third Edition
v30 44
AREDES A F PEREIRA M W G Anaacutelise econocircmica da produccedilatildeo de cafeacute araacutebica um estudo
de caso com simulaccedilotildees de Monte Carlo para sistemas de baixa e alta produtividade
Informaccedilotildees Econocircmicas SP v38 n4 abr 2008
ARIMA E UHL C Pecuaacuteria na Amazocircnia Oriental Desempenho Atual e Perspectivas Futuras Seacuterie
Amazocircnia n1 Beleacutem IMAZON 1996 40p
BACCINI A et al Estimated carbon dioxide emissions from tropical deforestation improved by
carbon-density maps Nature Climate Change vol2 march 2012 (LETTERS Published
Online - DOI 101038NCLIMATE1354)
BARROS A C UHL C Padrotildees problemas e potencial da extraccedilatildeo madeireira ao longo do Rio
Amazonas e do seu estuaacuterio Seacuterie Amazocircnia n4 Beleacutem IMAZON 1997 42p
BRASIL Lei 121872009 (Lei Ordinaacuteria) 29122009 Institui a Poliacutetica Nacional sobre Mudanccedila
do Clima - PNMC e daacute outras Providecircncias Presidecircncia da Repuacuteblica Casa Civil Subchefia
para Assuntos Juriacutedicos Disponiacutevel em lthttpswwwplanaltogovbrccivil_03_ato2007-
20102009leil12187htmgt Acesso em 20 de set 2013
CAMPOS E F Emissatildeo de CO2 da madeira serrada da Amazocircnia o caso da exploraccedilatildeo
convencional 2012 172p Dissertaccedilatildeo - Escola Politeacutecnica Universidade de Satildeo Paulo Satildeo
Paulo
CARDOSO RS e FREITAS C E C A pesca de pequena escala no rio Madeira pelos
desembarques ocorridos em Manicoreacute (Estado do Amazonas) Brasil Revista Acta
Amazocircnica vol 38(4) 2008 781 ndash 788
CCBA Climate Community and Biodiversity Alliance-CCBA 2008 Disponiacutevel em
httpwwwclimate-standardsorgccb-standards Acesso em 03 de set 2013
MONITORING amp IMPLEMENTATION REPORT VCS Version 3 CCB Standards Third Edition
v30 45
CEPEA Centro de Estudos Avanccedilados em Economia Aplicada - ESALQUSP Economia da
pecuaacuteria de corte na regiatildeo norte do Brasil Disponiacutevel em httpgooglL2roiA Acesso em
15 de out 2013
CHAMBERS J Q et al Decomposition and carbon cycling of dead trees in tropical forests of the
central Amazon Oecologia vol122 pp380-388 2000 Agricultores se queixam de
burocracia para contratar creacutedito sustentaacutevel do Programa ABC Correio Braziliense Brasiacutelia
26 fev 2012 Disponiacutevel em
lthttpwww2correiobraziliensecombrsersustentavelp=4592gt Acesso em 10 set 2013
CULLEN Jr L VALLADARES-PAacuteDUA C Onccedilas como detetives da paisagem Ciecircncia Hoje
Vol 156 n26 pp54-571999
CPRM - Serviccedilo Geoloacutegico do Brasil Disponiacutevel em httpwwwcprmgovbr Acesso em 13 de
mar 2013
DIAS F M MORAIS S J S REZENDE R C Anaacutelise da viabilidade econocircmica para a
produccedilatildeo de melancia e cenoura com financiamento em Anaacutepolis-GO 2008 Disponiacutevel em
httpwwwprpuegbr06v1conteudopesquisainiccieneventossic2008fronteiraflashsicani
macaoIIIJORNADAarquivosresumosresumo01pdfgt Acesso em 18 de nov2013
Divisatildeo de Precessamento de Imagens (DPI) Ambdata Mapa de Vegetaccedilatildeo SIPAM RADAM
2002 Disponiacutevel em httpwwwdpiinpebrAmbdatamapa_sipamphp Acesso em 21 de
out 2013
DOMINGUES MS BERNMANN C O arco de desflorestamento na Amazocircnia da pecuaacuteria agrave
soja Ambiente amp Sociedade Satildeo Paulo vol15 n2 pp1-22 maioago 2012
MONITORING amp IMPLEMENTATION REPORT VCS Version 3 CCB Standards Third Edition
v30 46
EBCF Criaccedilatildeo da primeira reserva particular de desenvolvimento sustentaacutevel do mundo na
floresta amazocircnica Disponiacutevel emlthttpwwwebcfcombrblog20130624criacao-da-
primeira-reserva-particular-de-desenvolvimento-sustentavel-do-mundo-na-floresta-
amazonicagt Acesso em 21 de set 2013
EMBRAPA Sistema Brasileiro de Classificaccedilatildeo de Solos 2ordf Ed Rio de Janeiro Embrapa Solos
2006 306 p
FELDPAUSCH T R et al When big trees fall Damage and carbon export by reduced impact
logging in southern Amazonia Forest Ecology and Management Vol 219 pp199-215 2005
FEARNSIDE P MDesmatamento na Amazocircnia dinacircmica impactos e controle Acta Amazocircnica
vol 36 n3 pp 395-400 2006
FILGUEIRAS T S et al 1994 Caminhamento Um meacutetodo expedito para levantamentos
floriacutesticos qualitativos Caderno de Geociecircncia IBGE vol12 pp39-43 1994
Forest Management Public Summary for Gethal Amazonas SA Induacutestria de Madeira
Compensada Certification Code SW-FMCOC-119 Date of Certification October 1
2000 Date of Public Summary October 2000 Updated for Annual Audit 2002 Annual Audit
2003 (Gethalpdf)
Globo Rural Linha de financiamento para a agricultura de baixo carbono tem pouca procura
2011 Disponiacutevel em httpwwwrainforest-allianceorgforestrydocumentsgethalpdf
Acesso em 16 de nov 2013
GREENPEACE Face a Face com a Destruiccedilatildeo Relatoacuterio Greenpeace sobre as companhias
multinacionais madeireiras na Amazocircnia Brasileira 1999 Disponiacutevel em
MONITORING amp IMPLEMENTATION REPORT VCS Version 3 CCB Standards Third Edition
v30 47
lthttpwwwgreenpeaceorgbramazoniaface_destruicaopdfgt Acesso em 11 de set
2013
Governo do Estado do Amazonas Plano de Gestao da RDS do Rio Amapaacute 2010 Disponiacutevel em
httpobservatoriowwforgbrsite_mediauploadgestaoplanoManejorio_amapapdf Acesso
em 24 de ago 2013
HDOM Estimates from processing the forest inventories data carried out during the CADAF
Project Final Technical Report 2012 Disponiacutevel em wwwhdomcombr Acesso em 27 de
maio 2013
HIGUCHI N 1986-87 Amostragem sistemaacutetica versus amostragem aleatoacuteria em floresta tropical
uacutemida de terra-firme na regiatildeo de Manaus Acta Amazonica 1617 (uacutenico) 393-400
HIGUCHI N SANTOS J JARDIM FCS Tamanho de parcela amostral para inventaacuterios
florestais Acta Amazocircnica vol12 n1 pp91-103 1982
HIGUCHI F G PINTO A C M ISHIZUKA M KAJIMOTO T LIMA A J N SANTOS J
HIGUCHI N Estoque e dinacircmica de biomassa acima do solo das florestas de terra firme do
estado do Amazonas In Adriano Joseacute Nogueira Lima Flaacutevia Machado Durgante Moacir
Alberto Assis Campos Joaquim dos Santos Moriyoshi Ishizuka Niro Higuchi (Org)
Dinacircmica do carbono das florestas da Amazocircnia resultados do Projeto CADAF
1edManaus INPA 2014 v 1 p 29-34
HOLMES T P etal Custos e benefiacutecios financeiros da exploraccedilatildeo de impacto reduzido em
comparaccedilatildeo agrave exploraccedilatildeo florestal convencional na Amazocircnia oriental 2ordf ed Beleacutem
Fundaccedilatildeo Floresta Tropical 2002 66p
HUSCH B MILLER C I BEERS T W Forest mensuration New York Ronald Press 1971
HUSCH B MILLER C I BEERS T W Forest Mensuration New York John Wiley amp Sons
2nd
ed 1972 402 p
MONITORING amp IMPLEMENTATION REPORT VCS Version 3 CCB Standards Third Edition
v30 48
IBGE Instituto Brasileiro de Geografia e Estatiacutestica Diretoria de GeociecircnciasCoordenaccedilatildeo de
Recursos Naturais e Estudos Ambientais Geologia Solos Hidrografia e Vegetaccedilatildeo 2000
IBGE Instituto Brasileiro de Geografia e Estatiacutestica Manicoreacute 2010 Disponiacutevel
emlthttpwwwsidraibgegovbrgt Acesso em 05 de set 2013
IBGE Instituto Brasileiro de Geografia e Estatiacutestica 2011 Disponiacutevel em httpwwwibgegovbr
Acesso em 19 de mar 2013
IBGE Instituto Brasileiro de Geografia e Estatiacutestica Extraccedilatildeo vegetal e silvicultura para o
municiacutepio de Manicoreacute 2011 Disponiacutevel em
lthttpcidadesibgegovbrxtrastemasphplang=ampcodmun=130270ampidtema=102ampsearch=a
mazonas|manicore|extracao-vegetal-e-silvicultura-2011gt Acesso em 10 de out 2013
IBGE Instituto Brasileiro de Geografia e Estatiacutestica Censo Demograacutefico 2010 Disponiacutevel em
lthttpcidadesibgegovbrxtrastemasphpcodmun=130270ampidtema=116gt Acesso em 18
de out 2013
IBGE Instituto Brasileiro de Geografia e Estatiacutestica Censo Demograacutefico 2010 Disponiacutevel
emlthttpcidadesibgegovbrxtrashomephpgt Acesso em 08 de out 2013
IDESAM Reduccedilotildees de Emissotildees do Desmatamento e Degradaccedilatildeo Florestal (REDD+) estudo de
oportunidades para a regiatildeo sul do Amazonas CENAMO M Cl CARRERO G C
GANDOLFO P (Org) Manaus 2011 Disponiacutevel em
lthttpwwwobservatoriodoreddorgbrsitepdfestudodeoportunidadespdfgt Acesso em 13 de
set 2013
MONITORING amp IMPLEMENTATION REPORT VCS Version 3 CCB Standards Third Edition
v30 49
IDESAM Semeando Sustentabilidade em Apuiacute ndash Resultados e Perspectivas 2011 Manaus
Disponivel em lthttpidesamorgbrsemeando-sustentabilidade-em-apui-resultados-e-
perspectivasUxX8nfldWYI
IEA Instituto de Economia Aplicada CO2 Emissions from fuel combustion 2012 Disponiacutevel em
httpwwwieaorgco2highlightsco2highlightspdf Acesso em 09 de out 2013
IGREJA H L S CATIQUE J Anaacutelise neotectocircnica do lineamento de Itacoatiara centro leste do
Estado do Amazonas In Simpoacutesio Nacional de Estudos Tectocircnicos 6 1997 Pirenoacutepolis
Anais Pirenoacutepolis-GO SBG-Nuacutecleo Brasiacutelia1997
IMAZON Instituto do Homem e do Meio Ambiente da Amazocircnia Fatos Florestais 2010a
Disponiacutevel em httpwwwimazonorgbrpublicacoeslivrosfatos-florestais-da-amazonia-
2010-1 Acesso em 14 de out 2013
IMAZOM Instituto do Homem e do Meio Ambiente da Amazocircnia Mercado e preccedilo da madeira
amazocircnica 2010 Disponiacutevel em httpwwwimazonorgbrpublicacoesprecos-de-madeira-
em-toraboletim-de-precos-de-madeira-em-tora-na-amazonia-julho-2010at_downloadfile
Acesso em 23 de nov 2013
IMAZON Instituto do Homem e do Meio Ambiente da Amazocircnia Portal de Geoinformaccedilatildeo sobre
a Amazocircnia Disponiacutevel em lthttpwwwimazongeoorgbrimazongeophpgt Acesso em 06
de set 2013
IMAZON Instituto do Homem e do Meio Ambiente da Amazocircnia Transparecircncia florestal
Amazocircnia Legal 2012 Disponiacutevel em lthttpwwwimazonorgbrpublicacoestransparencia-
florestaltransparencia-florestal-amazonia-legalcopy_of_SADOutubro2012pdfgt Acesso em
23 de set 2013
IMAZON Instituto do Homem e do Meio Ambiente da Amazocircnia PEREIRA D SANTOS D
VEDOVETO M GIMARAtildeES J VERIacuteSSIMO A (Orgs) Fatos Florestais da Amazocircnia
Beleacutem IMAZON 2010 244p Disponiacutevel em
MONITORING amp IMPLEMENTATION REPORT VCS Version 3 CCB Standards Third Edition
v30 50
lthttpwwwimazonorgbrpublicacoeslivrosfatos-florestais-da-amazonia-2010-1gt Acesso
em 24 de set 2013
IMAZON Instituto do Homem e do Meio Ambiente da Amazocircnia A Expansatildeo madeireira na
Amazocircnia Impactos e perspectivas para o desenvolvimento sustentaacutevel no Paraacute BARROS
AC VERIacuteSSIMO A (Eds) Beleacutem IMAZON 2002
IMAZON Instituto do Homem e do Meio Ambiente da Amazocircnia Custos e Benefiacutecios do Manejo
Florestal Para Produccedilatildeo de Madeira na Amazocircnia Oriental 1998 Disponiacutevel em
lthttpwwwimazonorgbrpublicacoesserie-amazoniacustos-e-beneficios-do-manejo-
florestal-para-producao-de-madeira-na-amazonia-orientalgt Acesso em 20 de set 2013
INPE Instituto de Pesquisas Espaciais Banco de dados PRODES 2012 Disponiacutevel em
lthttpwwwdpiinpebrprodesdigitalprodesphpgt Acesso em 09 de set 2013
INPE Instituto de Pesquisas Espaciais Banco de dados DEGRAD 2009 Disponiacutevel em
lthttpwwwobtinpebrdegradgt Acesso em 09 de set 2013
INPE Instituto de Pesquisas Espaciais Banco de dados DETER 2013 Disponiacutevel em
lthttpwwwobtinpebrdetergt Acesso em 10 de set 2013
INPE Instituto de Pesquisas Espaciais Banco de dados de queimadas e focos de calor
BDQUEIMADAS 2013 Disponiacutevel em lthttpwwwdpiinpebrproarcobdqueimadasgt
Acesso em 10 de set 2013
Instituto Carbono Brasil Soacute 2 da produccedilatildeo de madeira eacute certificada O Estado de SPaulo 2006
Disponiacutevel em lthttpwwwinstitutocarbonobrasilorgbrnoticias6noticia=119796gt Acesso
em 26 de set 2013
MONITORING amp IMPLEMENTATION REPORT VCS Version 3 CCB Standards Third Edition
v30 51
IFT Instituto Floresta Tropical Diagnoacutestico do Setor Florestal de Cotriguaccedilu Estado do Mato
Grosso 2010 Disponiacutevel em lthttpgooglEVx2RZgt Acesso em 16 de dez 2013
IPCC Guidelines for National Greenhouse Gas Inventories In National Greenhouse Gas
Inventories Programme EGGLESTON HS BUENDIA L MIWA K NGARA T TANABE
K (Eds) Japan IGES 2006
ITTO Annual review and assessment of the world timber situation 2011 Disponivel em
httpwwwittointannual_review Acesso em 10 de out 2013
KELLER M et al Coarse woody debris in undisturbed and logged forests in the eastern Brazilian
Amazon Global Change Biology vol10 PP784-795 2004
LENTINI M VERISSIMO A PEREIRA D A expansatildeo madeireira na Amazocircnia O Estado da
Amazocircnia n2 2005 Beleacutem IMAZON Disponiacutevel em
httpwwwimazonorgbruploadea_2ppdf Acesso em 06 de set 2013
LOETSCH F ZOumlHRER F HALLER K E Forest Inventory Munich BLV Verlagsgesellschaft
2nd
edition Vol II 1973 469 p
MAGNUSSON WE et al RAPELD uma modificaccedilatildeo do meacutetodo de Gentry para inventaacuterios de
biodiversidade em siacutetios para pesquisa ecoloacutegica de longa duraccedilatildeo Biota Neotrop JulDez
2005 vol 5 no 2 httpwwwbiotaneotropicaorgbrv5n2ptabstractpoint-of-
view+bn01005022005 ISSN 1676-0603
MARINELLI C E et al O programa de monitoramento da biodiversidade da biodiversidade e do
uso de recursos naturais em unidades de conservaccedilatildeo estaduais do Amazonas Secretaria
de Estado do Meio Ambiente e Desenvolvimento Sustentaacutevel - SDS Manaus SDS 2007
MONITORING amp IMPLEMENTATION REPORT VCS Version 3 CCB Standards Third Edition
v30 52
MARINELLI C E MALTEZ M H Indicadores de Sustentabilidade para Unidades de
Conservaccedilatildeo Documento-Siacutentese Workshop Instituto Socioambiental Brasiacutelia-DF 2010
76p
MAZZEI L et al Above-ground biomass dynamics after reduced-impact logging in the Eastern
Amazon Forest Ecology and Management vol 259 pp367-373 2010
MEIRELLES FILHO O Livro de Ouro da Amazocircnia 5ordf Ediccedilatildeo Rio de Janeiro EDIOURO 2007
422p Meirelles Filho J O Livro de Ouro da Amazocircnia 1ordf ed Editora Ediouro ISBN
8500021616 2007 450p
MENGER Juliana da Silva Fatores determinantes da distribuiccedilatildeo de aves no interfluacutevio Purus-
Madeira Manaus [sn] 2011 35 fl il
MCT Arquivos dos Fatores de Emissatildeo Disponiacutevel em
httpwwwmctgovbrindexphpcontentview321144htmlancora Acesso em 23 de out
2013
MMA Ministeacuterio do Meio Ambiente Avaliaccedilatildeo e identificaccedilatildeo de accedilotildees prioritaacuterias para a
conservaccedilatildeo utilizaccedilatildeo sustentaacutevel e reparticcedilatildeo dos benefiacutecios da biodiversidade na
Amazocircnia brasileira Brasiacutelia MMASBF 2001
MMA Ministeacuterio do Meio Ambiente Secretaria de Biodiversidade e Florestas Aacutereas Prioritaacuterias
para Conservaccedilatildeo Uso Sustentaacutevel e Reparticcedilatildeo de Benefiacutecios da Biodiversidade Brasileira
Atualizaccedilatildeo - Portaria MMA ndeg9 de 23 de janeiro de 2007 Brasiacutelia MMA 2007 (Seacuterie
Biodiversidade 31)
MONITORING amp IMPLEMENTATION REPORT VCS Version 3 CCB Standards Third Edition
v30 53
MMA Livro vermelho da fauna brasileira ameaccedilada de extinccedilatildeo editores Angelo Barbosa
Monteiro Machado Glaacuteucia Moreira Drummond Adriano Pereira Paglia 1ed 2008 Brasiacutelia
DF MMA Belo Horizonte MG Fundaccedilatildeo Biodiversitas (1420 p) il - (Biodiversidade 19)
OLIVEIRA M M HIGUCHI N CELES C H HIGUCHI F G 2014 Tamanho e formas de
parcelas para inventaacuterios florestais de espeacutecies arboacutereas na Amazocircnia Central Ciecircncia
Florestal Santa Maria v 24 n 3 p 645-653
PEARSON TRH WALKER S BROWN SL The Source Book for Land Use Land Use
Change and Forestry Projects BioCarbon Fund and Winrock International 2005 64 pp
PORTAL AMAZOcircNIA Amazocircnia de A a Z Disponiacutevel em
lthttpportalamazoniaglobocomgt Acesso em 13 de set 2013
PEacuteLLICO NETTO S BRENA D A Inventaacuterio florestal Curitiba Editorado pelos autores p
316 1997
PROJETO SIVAM Relatoacuterio metodoloacutegico de trabalho Revisatildeo 3 Diretoria de Geociecircncia Rio de
Janeiro 2002 330 pp
PROJETO SIVAM Atualizaccedilatildeo do RADAMBRASIL Mapa de Vegetacao da Amazonia Legal
Mapa de Fitofisionomias ndash RADAMSIPAM DNPM Ministeacuterio de Minas e Energia 2002
Disponiacutevel em httpwwwdpiinpebramb_dataShapefilesveg_Amz_SIPAMzip Acesso
em 21 de jan 2014
PROJETO FLORESTAL SANTA MARIA (PROJETO FSM-REDD) Plant Inteligecircncia Ambiental ndash
Warwick Manfrinato 2012 Disponiacutevel em
lthttpwwwflorestalsantamariacombrsitedocumentos57FSM_REDD_VCS_PD_ptpdfgt
Acesso em 09 de set 2013
MONITORING amp IMPLEMENTATION REPORT VCS Version 3 CCB Standards Third Edition
v30 54
RADAMBRASIL Programa de Integraccedilatildeo Nacional Levantamentos de Recursos Naturais v 14 ndash
RADAM DNPM Ministeacuterio de Minas e Energia Brasil 1974
RIBEIRO J E L et al Flora da Reserva Ducke guia de identificaccedilatildeo das plantas vasculares de
uma floresta de terra firme na Amazocircnia Central Manaus Editora INPA 1999
ROSAS F C W WALDEMARIN H de MATTOS G E Pteronura rasiliensis (Zimmermann
1780) In MACHADO A B M DRUMMOND G M PAGLIA A P (eds) Livro Vermelho da
Fauna Brasileira Ameaccedilada de Extinccedilatildeo Volume II 1ed Brasiacutelia DF Ministeacuterio do Meio
Ambiente 2008 p 800 - 801
ROSS D GHG Emissions Resulting from Aircraft Travel 2009 Disponiacutevel em
httpwwwcarbonplanetcomdownloadsFlight_Calculator_Information_v92pdf Acesso em
14 de out 2013
SANTOS A J et al Viabilidade econocircmica do sistema agroflorestal greviacutelea x cafeacute na regiatildeo
norte do Paranaacute CERNE vol6 n1 pp89-100 2000
SANTOS R A Custo do manejo florestal madeireiro estudo de caso Floresta Estadual do
Antimary Monografia (Bacharelado em Economia) ndash Departamento de Ciecircncias
Econocircmicas Universidade Federal do Acre 2007109p
SABOGAL C et al Manejo Florestal Empresarial na Amazocircnia Brasileira restriccedilotildees e
oportunidades (Relatoacuterio Siacutentese) Beleacutem CIFORIMAZON 2006 72p
SDSCEUC Secretaria Estadual de Meio Ambiente e Desenvolvimento Sustentaacutevel ndash Centro
Estadual de Unidades de Conservaccedilatildeo Programa de Monitoramento de Biodiversidade e
Uso de Recursos Naturais em Aacutereas Protegidas do Estado Amazonas (ProBUC) 2006
Disponiacutevel em
MONITORING amp IMPLEMENTATION REPORT VCS Version 3 CCB Standards Third Edition
v30 55
httpbrazilwcsorgDesktopModulesBring2mindDMXDownloadaspxEntryId=6168ampPortalI
d=93ampDownloadMethod=attachment Acesso em 11 de ago de 2013
SFBIMAZON Serviccedilo Florestal Brasileiro e Instituto do Homem e Meio Ambiente da Amazocircnia A
atividade madeireira na Amazocircnia brasileira produccedilatildeo receita e mercados 2010 Disponiacutevel
em httpwwwmmagovbrestruturassfb_arquivosmiolo_resexec_polo_03_95_1pdf
Acesso em 23 de out 2013
SILVA R P da Alometria estoque e dinacircmica da biomassa de florestas primaacuterias e
secundaacuterias na regiatildeo de Manaus (AM) 152 p Tese de Doutorado Programa Integrado
de Poacutes-graduaccedilatildeo em Biologia Tropical e Recursos Naturais (INPA) Manaus 2007
SILVA Z A G P G SANTOS R A Custo do manejo florestal madeireiro em floresta puacuteblica
estudo de caso no Acre 2011 Disponiacutevel em
lthttpwwwbasacombrbancoamazonia2Revistaedicao_13n13_custo_do_manejo_flores
pdfgt Acesso em 13 de set 2013
SMIDT M GALLAGHER T Factors Affecting Fuel Consumption and Harvesting Costs Auburn
School of Forestry and Wildlife Sciences Sd Disponiacutevel em
httpweb1cnrevteduforestrycofedocuments2013Smidt_Gallagherpdf Acesso em 21
de out 2013
SOARES-FILHO B et al Role of Brazilian Amazon protected areas in climate change mitigation
2010 Columbia University NY Ruth S DeFries 2010
SPF Serviccedilo Puacuteblico Federal DVPF Documento de venda de produto Florestal (Declaraccedilotildees de
venda Gethalpdf) 14 de julho de 2006
MONITORING amp IMPLEMENTATION REPORT VCS Version 3 CCB Standards Third Edition
v30 56
TIMOFEICZYK JUacuteNIOR R et al Rentabilidade econocircmica do manejo de baixo impacto em
florestas tropicais um estudo de caso Revista Floresta Curitiba v 38 n 4 p 711-725
outdez 2008
VCS Ferramenta para Demonstraccedilatildeo e Avaliaccedilatildeo de Adicionalidade para Atividades de Projetos
VCS em Agricultura Floresta e Outros Usos (AFOLU) 2012a Disponiacutevel em httpwwwv-c-
sorgsitesv-c-sorgfilesVT000120VCS20AFOLU20Additionality20Tool20v30pdf
Acesso em 24 de set 2013
VCS Ferramenta de Risco e Natildeo Permanecircncia (AFOLU) 2012B Disponiacutevel em httpv-c-
sorgsitesv-c-sorgfilesAFOLU20Non-Permanence20Risk20Tool2C20v32pdf
Acesso em 13 de set 2013
VCS Approved VCS Methodology VM0010 Version 10 - Methodology for Improved Forest
Management Conversion to Logged to Protected Forest Calculating GHG Benefits from
Preventing Planned Degradation PHUA S SHARMA S TELFER M CHANDLER H
(Eds) Califoacuternia EUA Carbon Planet Limited 2011149p
VERDEJO M E Diagnoacutestico Rural Participativo um guia praacutetico Brasiacutelia MDA 2006 62p
VIANNA A L M Diagnoacutestico Florestal do Estado do Amazonas 2010 e 2011 Manaus-AM
IDESAM 2013 (Relatoacuterio Final do Projeto Fortalecimento da participaccedilatildeo da sociedade civil
no Amazonas Foacuterum de Mudanccedilas Climaacuteticas Transparecircncia Florestal no Estado do
Amazonas ndash Mapeamento de Instrumentos Legislativos no Brasil)
WBCSDWRI The GHG Protocol for Project Accountin Washington World Business Council for
Sustainable DevelopmentWorld Resources Institute 2005148 p
MONITORING amp IMPLEMENTATION REPORT VCS Version 3 CCB Standards Third Edition
v30 57
WALKER W et al Guia de Campo para Estimativa de Biomassa Florestal e Estoque de Carbono
Woods Hole Center Research Falmouth Massachusetts USA 2011 Disponiacutevel em
httpwwwwhrcorgresourcesfieldguidescarbonpdfWHRC_FieldGuide_PortugueseSMpdf
Acesso em 14 de set 2013
WWF Metodologia para Avaliaccedilatildeo Raacutepida e a Priorizaccedilatildeo do Manejo de Unidades de
Conservaccedilatildeo (RAPPAM) 2010 Disponiacutevel em httpgooglXfDnxs Acesso em 30 de set
2013
WWF-Brasil Efetividade de Gestatildeo das Unidades de Conservaccedilatildeo no Estado do Amazonas
Secretaria de Estado do Meio Ambiente e do Desenvolvimento Sustentaacutevel do Amazonas
Instituto Chico Mendes de Conservaccedilatildeo da Biodiversidade Brasiacutelia WWF-Brasil 2011 72 p
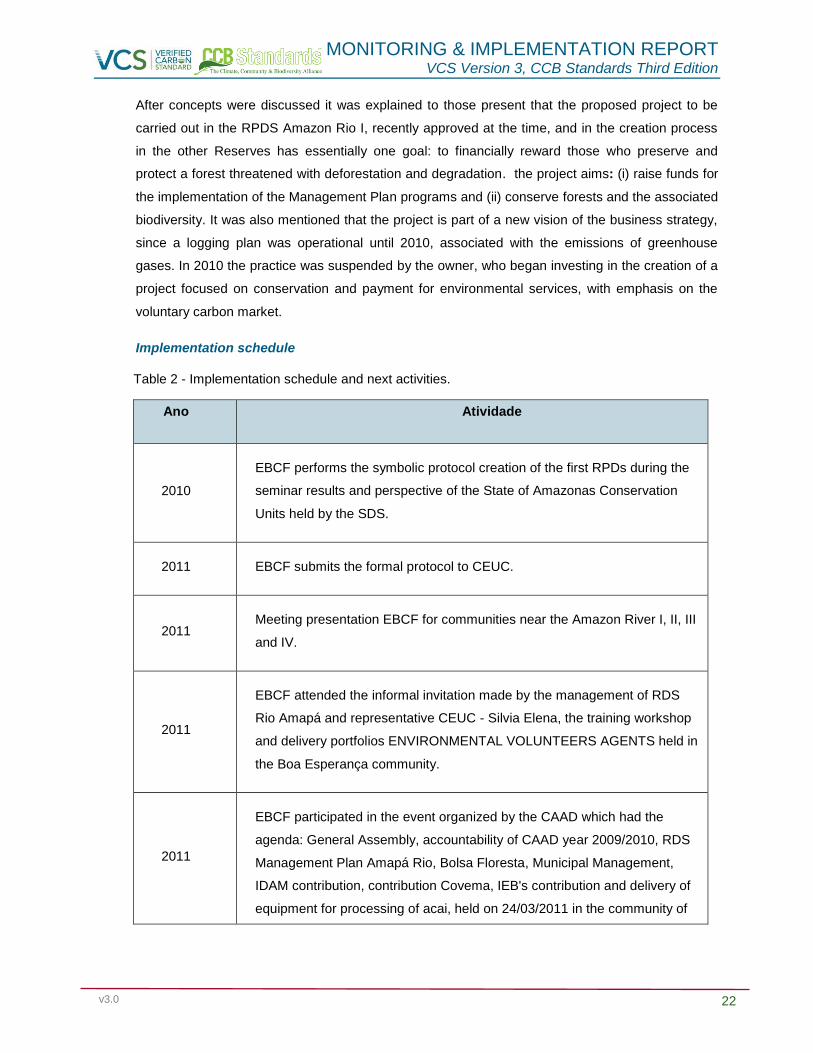
MONITORING amp IMPLEMENTATION REPORT VCS Version 3 CCB Standards Third Edition
v30 22
After concepts were discussed it was explained to those present that the proposed project to be
carried out in the RPDS Amazon Rio I recently approved at the time and in the creation process
in the other Reserves has essentially one goal to financially reward those who preserve and
protect a forest threatened with deforestation and degradation the project aims (i) raise funds for
the implementation of the Management Plan programs and (ii) conserve forests and the associated
biodiversity It was also mentioned that the project is part of a new vision of the business strategy
since a logging plan was operational until 2010 associated with the emissions of greenhouse
gases In 2010 the practice was suspended by the owner who began investing in the creation of a
project focused on conservation and payment for environmental services with emphasis on the
voluntary carbon market
Implementation schedule
Table 2 - Implementation schedule and next activities
Ano Atividade
2010
EBCF performs the symbolic protocol creation of the first RPDs during the
seminar results and perspective of the State of Amazonas Conservation
Units held by the SDS
2011 EBCF submits the formal protocol to CEUC
2011 Meeting presentation EBCF for communities near the Amazon River I II III
and IV
2011
EBCF attended the informal invitation made by the management of RDS
Rio Amapaacute and representative CEUC - Silvia Elena the training workshop
and delivery portfolios ENVIRONMENTAL VOLUNTEERS AGENTS held in
the Boa Esperanccedila community
2011
EBCF participated in the event organized by the CAAD which had the
agenda General Assembly accountability of CAAD year 20092010 RDS
Management Plan Amapaacute Rio Bolsa Floresta Municipal Management
IDAM contribution contribution Covema IEBs contribution and delivery of
equipment for processing of acai held on 24032011 in the community of
MONITORING amp IMPLEMENTATION REPORT VCS Version 3 CCB Standards Third Edition
v30 23
Democracy and 25032011 in the Boa esperanccedila Community
2011 Inspection of CEUC on farms for approval on RPDs
2011 The board of EBCF makes his 1st visit the communities and farms
2011
EBCF in partnership with the Municipal Government of Manipur perform
the recovery local road (approximately 20KM) linking Democracia
community Jatuarana communities Terra Preta Community Santa Eva
and Vista Alegre
2012
Visit of the president and directors of EBCF the communities surrounding
the reserves together with the president of PATAC Marcelo Marder and
Andre Albuquerque president for socioeconomic communities report
presentation
2012 Business Plan Project approval and EBCF shareholders agreement
authorizing the start of the REDD project
2013 Workshop I - Diagnosis for the development of areas of the Amazon River
Management Plan I II III amp IV
2013 Visit communities to complement the workshop I for interviews with the
locals
2013 Meeting in CEUC after the second workshop to update the work with the
communities and the progress of the approval of the areas
2013
Technical meeting with the team CO2X Renascer and Human
Development EBCF in Curitiba for the review and evaluation of the first part
of the Management Plan (diagnosis) Definition of programs and
subprograms of the Plan identification of key issues potential threats and
opportunities with the creation of RPDSs definition of vision and action
strategy
MONITORING amp IMPLEMENTATION REPORT VCS Version 3 CCB Standards Third Edition
v30 24
2013
The Secretary of State for the Environment (SDS) officiated at the World
Environment Day the first Private Reserve Sustainable Development
(RPDs) of the Amazon with the signing of the decree no 86
2013 Workshop II - presentation of the carbon project as one of the fundraising
programs for the implementation of the Management Plan
2013 Field work with communities and farms for mapping biodiversity and
hunting and fishing grounds
2013 The EBCF performs a complete socioeconomic census in the surrounding
communities of RPDs
2013 Meeting with CEUC for delivery and presentation of the draft of RPDs
Amazon River Management Plan I
2013
Supplementary Meeting to communities who could not attend the
Workshop II amp III Workshop Creation of the Advisory Council for RPDs
Amazon River I
2013 The EBCF performs social and economic Census in Kamayuaacute community
2015 Realization of field activities for Biomass Inventory Estimation
2016 Vitor Belfort visit and launch of income-generating initiatives
2016 Distribution of medical kits for community health workers and launching the
Health Program in the Amazon
2016 Deforestation Report
2016 PD Review and preparation of the monitoring report
MONITORING amp IMPLEMENTATION REPORT VCS Version 3 CCB Standards Third Edition
v30 25
2016 REDD + Project Certification (VCS and CCV)
2016 Project planning for structuring the supply chain of vegetable oils
certificates
2017 Fundraising from the REDD project
2017 Ecotourism Project Design
2017 Workshop Achievement Participatory Planning Project REDD + activity
EBCF
2017 ProBUC Deployment
2018 Implementation of Voluntary Environmental Agent program
25 Respect for Rights and no Involuntary Relocation
In the three workshops explaining the Carbon project to 15 communities the eight REDD+
principles and the social and environmental safeguards were presented Those safeguards were
previously established in a series of meetings throughout the Amazon between 2009 and 2010
and included several Civil Society Organizations
It was emphasized in the workshops that compliance with these principles and safeguards under
REDD+ projects such as the Amazon Rio carbon project contributes to improving local
governance transparency of information public participation in decision-making coordination of
actions among different actors and respect and recognition of the rights of indigenous peoples and
traditional populations
Free Prior and Informed Consent (FPIC)
During the project workshops the concept of Free Prior and Informed Consent was presented to
the participants as well as the importance of social and environmental safeguards to ensure the
rights of communities in designing and developing the REDD+ project explained in the eight
principles The participants were asked whether they were in agreement and if there were other
MONITORING amp IMPLEMENTATION REPORT VCS Version 3 CCB Standards Third Edition
v30 26
principles or rights that should be included Some community individuals expressed their
agreement to the safeguards All participants at the three workshops raised their hands in support
of REDD+ project The consent was unanimous
A separate document describing the whole process of the Free Prior and Informed Consent has
been prepared and is available in Annex 10
Figure 05 - Workshop I Free Prior and Informed Consent for the development of the REDD+
project by the community leaders of Democracia Aacutegua Azul Satildeo Joseacute do Miriti Vista Alegre
Jatuarana Terra Preta do Ramal Pandegal Santa Maria Santa Eva and Terra Preta do Rio
Mancoreacute
Figure 06 - Workshop II Free Prior and Informed Consent for the development of the REDD+
project by the community leaders of Urucury Mocambo Boa Esperanccedila and Satildeo Joatildeo amp Ponta
Grossa
MONITORING amp IMPLEMENTATION REPORT VCS Version 3 CCB Standards Third Edition
v30 27
Figure 07 - Workshop III Free Prior and Informed Consent for the development of the REDD+
project by the Kamayuaacute indigenous community
3 APPLICATION OF METHODOLOGY
31 Title and Reference of Methodology
VCS VM0011 Methodology for Improved Forest Management ndash Logged to Protected Forest
(LtPF) Calculating the GHG Benefits from Preventing Planned Degradation version 10
MONITORING amp IMPLEMENTATION REPORT VCS Version 3 CCB Standards Third Edition
v30 28
32 Methodology Deviations
Whereas the VM0011 was developed in a context of homogeneous forests of temperate regions
some methodological adjustments were made related to the direct survey biomass in the field
since the project areas are comprised of very heterogeneous areas of rainforest including dryland
and floodplains Any technical documentation related to these methodological adjustments and
their justifications appear in Annex 23 (Forest Inventory 2016) prepared by the consulting firm
HDOM
33 Project Boundary5
The total area of the property is 20387 ha and a buffer zone was established around each of the
four areas in order to include communities that use the resources within their boundaries (Figure
7a) Project activity areas (for purposes of calculating the emissions reductions called the project
area or PA) are only those for which logging is permitted a total of 19800 ha (Figure 7b)
excluding the Permanent Preservation Areas (APPs) and bodies of water A logging plan has been
approved for this area for selective logging (Annexes 1 2 3 4 6 and 7)
Figure 08 - Project Boundaries a) Direct Project interference limits b) Total Project Area (G1
Indicator 7)
5 Ref section 22 of VM0011
MONITORING amp IMPLEMENTATION REPORT VCS Version 3 CCB Standards Third Edition
v30 29
Stratification of the project area
For purposes of inventorying local carbon stocks and project management the project area was
stratified into 3 groups of different forest types as indicated by the VM0011 according to the
vegetation map SIPAMRADAM (DPI 2002) The forest types present in the area are rain forest
types divided into 3 categories as follows
Dense Primary Tropical Ombrophylous Alluvial Forest
Dense Primary Tropical Ombrophylous Lowland Forest
Pioneer Formations
Figure 09 - Project Area forest types
Leakage areas
There is no direct leakage resulting from planned project activities since there will be neither
displacement of management activities to other areas after the cessation of the activities within the
project area nor market leakages The project Management Plan includes the monitoring of
MONITORING amp IMPLEMENTATION REPORT VCS Version 3 CCB Standards Third Edition
v30 30
possible unanticipated leakages around the project area as well as the need to report to the
competent authorities whenever logging activities are identified in these areas For more
information on leakage see chapters 52 and 55 of this document
Temporal boundaries
Crediting period of the project
The first crediting period of the project is 37 years beginning on August 17 2012 and ending on 17
August 2049 This period is equivalent to the remaining 12 years of the first authorized
management plan (25 years from 1998) added to another 25 years in respect of a new forest
management plan that was intended as the common practice of forestry in Brazil The logging
activities could continue beyond 37 years aiming for a second crediting period
Monitoring and Reporting Period
a) Monitoring of Baseline Emissions
The monitoring of Baseline Emissions must demonstrate that the protected forest area is in
accordance with the one specified in the PD The project limit will be monitored before each
verification throughout the crediting period through new inventory information and remote sensing
and GIS as applicable Thus the project will be able to update the baseline calculations based on
the actual remaining forest area (in case of loss of forest cover by disasters for example) and that
would be subject to forest management under a ldquowithout projectrdquo scenario
b) Monitoring of Project Emissions
Project emissions will be monitored annually and compiled in every monitoring report that will detail
in particular the
Monitoring of possible illegal harvesting of timber
Monitoring of areas subject to natural disturbances
Monitoring and quantification of emissions related to air and land travel related to project
activities
c) Monitoring of Leakage
Since there will be no leakages according to the VM0011 and AFOLU Requirements no leakage
monitoring will be necessary However to be conservative the project intends to monitor any
disturbances that might affect the carbon reservoirs Once some disturbance is registered the
project will report the incident to the relevant authorities and make the necessary adjustments to
MONITORING amp IMPLEMENTATION REPORT VCS Version 3 CCB Standards Third Edition
v30 31
the baseline For more details about the monitoring of leakages see chapters 52 and 55 of this
document
Carbon stocks
The biomass reservoirs considered by the project are related to above-ground and underground
biomass
Sources and sinks of GHGs
Table 02 below describes the emission sources and sinks of greenhouse gases associated with
the baseline activities and with the project
Table 03 - Greenhouse gas emissions sources and sinks associated with baseline and project
activities
Source Gas Included JustificationExplanation
Baselin
e
Biomass
CO2 Yes Main source of project emissions through forest
degradation harvested and commercialised
wood products deadwood and forest regrowth
CH4 No Conservatively excluded
N2O No Conservatively excluded
Other No -
Fossil Fuel
consumption
CO2 Yes Main source through fossil fuel use in
machinery and transportation of timber
CH4 Yes Conservatively included
N2O Yes Conservatively included
Other No -
Electricity
consumption
CO2 Yes Main source
CH4 No -
N2O No -
Other No -
Pro
ject
Biomass
CO2 Yes Main source through unexpected natural
disturbances such as forest fires etc
CH4 Yes Included but subject to significance
N2O Yes Included but subject to significance
MONITORING amp IMPLEMENTATION REPORT VCS Version 3 CCB Standards Third Edition
v30 32
Source Gas Included JustificationExplanation
Other No _
Fossil Fuel
consumption
CO2 Yes Main source through flights and ground travel
CH4 Yes Included but subject to significance
N2O Yes Included but subject to significance
Other No _
Electricity
consumption
CO2 Yes Main source
CH4 No _
N2O No _
Other No _
34 Baseline Scenario
The choice between alternative baseline scenarios was taken together with the analysis of
additionality using the latest version of the VCS Tool for the demonstration and assessment of
additionality in Agriculture Forestry and Other Land Use VCS projects in this case VT000167
(VCS 2012a) All possible scenarios as well as the analysis of methodology barriers (steps 211
and 212 of the VM0011) are present in the chapter below In this sense to avoid redundancy of
information refer to additionality analysis to find the steps 211 and 212 of the VM0011
The baseline scenario for the project identified as the most likely to occur was selective logging8
(continuation of Business As Usual - BAU) The reference scenario assumes 37 years of selective
logging according to the 25 year logging plan approved in August 1998 (Annex 6 - document
ValdII T01 POA 1998) that in the absence of project activities would be renewed in 2024 for
another 25 years until 2049
Under this scenario the full implementation of the timber logging plan occurs and which has
already resulted in the degradation of 434769 ha (see table below) The area would be harvested
selectively for timber sold in lumber markets Below is a summary of harvest areas between 1999
and 2010 showing the managed plots and the dates on which the harvests were authorized
6 Tool for the demonstration and assessment of an additional to the VCS project activities in Agriculture Forestry and Other
Uses (AFOLU) (V 30)
7 Adapted from ldquoTool for the Demonstration and Assessment of Additionality in AR CDM project Activitiesrdquo (V02) 8 Additional information about choosing the baseline are presented in section 46 (steps 1 and 2)
MONITORING amp IMPLEMENTATION REPORT VCS Version 3 CCB Standards Third Edition
v30 33
Table 04 - Summary of areas managed since 1999
Date Managed logged area (ha)
1999 58669 (Plot 1)
2000 688 (Plot 2)
2001 ndash 2002 8315 (Plot 3)
2003 ndash 2004 750 (Plots 3 and 4)
2005 ndash 2007 1082 (Plot 5)
2008 ndash 2009 49050 (Plots 5 and 6)
TOTAL 434769
35 Additionality
The additionality analysis of the Amazon Rio project REDD+ IFM was conducted with the latest
version of the VCS Tool for the demonstration and assessment of additionality in Agriculture
Forestry and Other Land Use VCS projects the VT000167
(VCS 2012a)
To generate the reductions in GHG emissions for the project the planned baseline activities
(sustainable forest management) were terminated by the project proponent and supplanted by
environmental conservation activities In this sense the project will be managed by EBCF with
the goal of creating a fund for administrative and accounting management especially to promote
environmental management and monitoring activities of carbon pools within the project area
Alternative activities planned in the project are the provisioning and valuation of environmental
services via carbon credits (VCUs) in conjunction with the sale of Environmental Reserve Quotas
(CRAs)
4 MONITORING AND PARAMETERS OF DATA
41 Monitoring Plan Description
Due to its innovative comprehensive and integrative character the project needs to be monitored
regularly so that its actions activities and impacts can be constantly measured and evaluated To
meet this requirement the monitoring process must meet three main objectives
MONITORING amp IMPLEMENTATION REPORT VCS Version 3 CCB Standards Third Edition
v30 34
i To serve as an internal management project tool
ii To collaborate as an instrument of collective learning from the communities and
social groups directly involved
iii To work as a means of communicating results and impacts to interested institutions
and society in general Furthermore it is important to consider that monitoring if
successful will transcend the managerial aspects of the project and strengthening
the plan
To facilitate the monitoring process instead of having a reference line (to compare interventions
before and after) the first year of monitoring will serve as the starting point whose information will
be regularly and systematically compared throughout the project
Next the initial plans for monitoring benefits to the climate community and biodiversity are
described wherein the community is committed to participatory precept and to the technical and
scientific rigor which is capable of following the possible negative and positive impacts on
environmental and social aspects in the project area and its surroundings
Monitoring of Climate Impacts
The Monitoring Plan (MP) aims to provide security in the periodic estimates of reduction in
emissions especially in monitoring changes in carbon stock Therefore emissions from the
implementation of the project ex post estimates of the activities and emissions from any leakages
and isolated disturbances (eg blowdown fires pests and diseases among others) can be
calculated
The construction of the PM of the climate benefits made in full compliance with the methodological
framework provided by VM0011 ndash IFM LPF (VCS 2011) and CCBA (2008) which consists of four
specific actions to be monitored
i Implementation and execution of the project
ii Dynamics and stock of the forest biomass
iii Deforestation and forest degradation
iv Periodic reviews of ex post emissions
Remote monitoring and surveillance of the project area
Measurement of alterations and biomass loss quantification present in the PA using land use
change detection is critical to make accurate estimates of GHG emissions that account for forest
biomass increases and losses
MONITORING amp IMPLEMENTATION REPORT VCS Version 3 CCB Standards Third Edition
v30 35
Thus the use of remote sensing by satellite images of medium spatial resolution can be applied
readily in the PA and surroundings in order to monitor land use dynamics over time particularly to
identify risks and threats to forested areas In situ verification will complement landscape analysis
in a GIS environment with the aim of quantifying spatializing and identifying conversion of forest
areas into other land uses environmental degradation and other possible changes that may occur
during the term of the project
As a complementary monitoring source the project will rely on the database and information
provided by Monitoring Program of the Brazilian Amazon Forest by Satellite 910
(Prodes Digital)
conducted by the National Institute for Space Research (Instituto Nacional de Pesquisas Espaciais
- INPE) according to the Plan for Prevention and Control of Deforestation in the Amazon
1112(PPCDAm) under the National Policy on Prevention and Control of Deforestation Such
information is available online in13
digital vector files for the public in general
Other tools will provide complementary information to the monitoring such as indicators of forest
degradation and hotspots (fires and wildfires) obtained from DETER 14
SAD 15
and PROARCO16
Information is available online for free in vector format These results will be systematically related
to field data for validating or disproving the occurred event so that the focuses of deforestation and
degradation can be identified remediated reported and consequently avoided as much as
possible
A surveillance system that allows permanent territorial monitoring and inhibits the entry of intruders
through entry points in the PA will also be deployed to control the transport flow In addition one
must investigate and identify risks and threats eg mapping hotspots and areas vulnerable to fire
to illegal logging to hunting and poaching and to invasions by third parties among others
At first we estimate an effective demand for structuring the electronic monitoring system which
includes the hiring of skilled professionals field equipment electronic equipment (digital cameras
GPS desktops and notebooks smartphones printers geoprocessing software and GIS among
others) vehicles andor motorcycles motorized boats for transportation and moving around and
the collection of high resolution satellite images Empowerment and training of all involved staff
9httpwwwobtinpebrprodesdigitalmetodologiahtml
10httpwwwobtinpebrprodesmetodologiapdf 11httpwwwmmagovbrflorestascontrole-e-prevenC3A7C3A3o-do-desmatamento 12httpwwwmmagovbrimagesarquivo80120PPCDAm_FINAL_PPCDAMPDF 13httpwwwobtinpebrprodesindexhtml 14httpwwwobtinpebrdeterdados 15httpwwwimazongeoorgbrdocdownloadsphp 16httpwwwdpiinpebrproarcobdqueimadas
MONITORING amp IMPLEMENTATION REPORT VCS Version 3 CCB Standards Third Edition
v30 36
and the surrounding communities will be necessary to make the system effective17
and a constant
stream of information directed to regional actors and other stakeholders
Strategic monitoring and access points to RPDS roads will also provide support to other MPs
including social and biodiversity conservation aspects especially in the logistic support of planned
field activities
Procedures for determining the permanent sample plots (PSPs) and measurement
The calculation of the stock and increase in forest biomass will be subsidized through the
installation of PSPs in the PA and its temporal monitoring through the Continuous Forest Inventory
(CFI) The methodology proposed by VCS (2011) suggests the use of permanent andor temporary
plots however it confirms the efficiency and accuracy of sample plots
In order to demonstrate the procedural and statistical rigor used all the sampling procedures the
PA forest stratification sampling design calculation of sampling intensity and other parameters
measured in PSPs to monitor biomass balance due to ingressmortality of individuals growth in
DBH and height will be presented in detail in the Annex (Annex 23 - Forest Inventory 2016)
To promote reliable forest biomass estimates standard operating procedures (SOPs) (Section 82)
will be used by the team executing the CFI
Monitoring frequency
The monitoring frequency parameters measured in the PSPs will be no greater than 5 years from
the first measurement Other relevant parameters to monitoring the PSPs like the change in land
use in the PA and surrounding areas such as deforestation forest degradation fire sources and
natural disturbances will be regularly monitored as a project routine operation organized and
archived annually
411 Monitoring Impacts to Biodiversity
Since animal inventories have not been conducted in Amazon Rio project areas (for this project
biological information for the Rio Amapaacute RDS management plan were used) a biodiversity
monitoring system that will follow the RAPELD methodology (Rapid surveys of various taxonomic
groups (RAP) for long-term ecological studies) (MAGNUSSON et al 2005)
The RAPELD method contributes to long-term research using rapid inventory assessments biotic
complementarity and land use planning in the Amazon This method increases adequate sampling
17Linking community monitoring to national Measurement Reporting and Verification for REDD+
MONITORING amp IMPLEMENTATION REPORT VCS Version 3 CCB Standards Third Edition
v30 37
probability of biologically diverse communities which require large areas and at the same time
minimize variation of abiotic factors that affect these communities with smaller areas sampling
Evaluation and selection of indicators will be conducted in accordance with the ProBUC model
however applicably to local reality results will be updated biennially from the first survey
Biodiversity indicators are being designed and planned as suggested in the Social and
Environmental Monitoring System of Protected Areas in the Brazilian Amazon (Sistema de
Monitoramento Socioambiental das Unidades de Conservaccedilatildeo da Amazocircnia Brasileira)1819
and
Methodology for Rapid Assessment and Prioritization of Protected Areas Management20
(Metodologia para Avaliaccedilatildeo Raacutepida e Priorizaccedilatildeo do Manejo de Unidades de Conservaccedilatildeo -
RAPPAM) in line with the experiences gained and disseminated by CEUC and ICMBIO previously
described
The empowerment accountability and shared management of biodiversity conservation is the
main focus of the methodological model adopted These actions create high expectations for
environmental management of the area as the biodiversity monitoring will be conducted by the
community members themselves along with the project proponent promoting a local multiplier
effect It is worth mentioning that strict compliance with these procedures is in within EBCF`s
interest since it considers them to be key to the success of the project
The project begins with the premise that any negative impact on biodiversity in the project area
and its surroundings will not occur In the opposite sense the project aims to generate and provide
greater understanding of the territory subsidizing proposals for the conservation and sustainable
use through adoption of good management practices of natural resources as well as its replication
in other locations
412 Monitoring Social Impacts
The monitoring of social aspects include both the collection of numerical data such as quantity
volume weight (quantitative indicators) as well as information expressing opinions and
experiences (qualitative indicators) remembering that such measures are compatible and
interchangeable Data collection should be systematic and have a pre-established rate and most
likely a single indicator will require several data collection instruments such as plans field records
reports etc
Social information will be monitored through the use of participatory methodologies In this sense
the preparation process of the Amazon Rio I RPDS Management Plan was a first step For the
18Indicator Design 19Social and Environmental Monitoring of Protected Areas System in the Brazilian Amazon (Sistema de Monitoramento
Socioambiental das Unidades de Conservaccedilatildeo da Amazocircnia Brasileira) 20Metodologia para Avaliaccedilatildeo Raacutepida e a Priorizaccedilatildeo do Manejo de Unidades de Conservaccedilatildeo (RAPPAM)
MONITORING amp IMPLEMENTATION REPORT VCS Version 3 CCB Standards Third Edition
v30 38
socioeconomic characteristics of communities several community meetings land use mapping
workshops and interviews with focus groups were held in addition to field visits (Annex 10) The
main activities of the project were presented and discussed in these events emphasizing the
importance and timeliness of local valuation of environmental services as well as strategies for
raising funds to implement other projects and improvements in social well-being of communities
around the PA
5 MEASUREMENT OF GHG EMISSIONS REDUCTIONS AND REMOVALS (CLIMATE)
51 Emissions Baseline
EBCF did not carry out any wood related exploration activity in the areas since the beginning of
the REDD+ project Thus it is confirmed estimated emission reductions for the project as
8678833 t CO2eq t year
52 Project emissions
Project emissions were primarily those related to the running of offices and necessary travels for
studies meetings presentations workshops and other activities Table 10 presents a summary of
emissions based on data from Annex 21 of this report
Table 05 - 2011-2016 Project Activity Emissions
YEAR Energy
(KWh)
Energy
(t CO2eq)
Travels
(Km)
Travels
(t CO2eq)
Total
(t CO2eq)
2010
678 024 024
2011
104010 2360 2360
2012 1149 008 55724 1573 1581
2013 2756 028 236749 5429 5457
2014 2498 025 15789 459 484
2015 2231 023 27340 597 620
2016 1015 010
010
093 440290 10443 10536
53 Leakage
Not applicable according to presentation made on the REDD+ IFM document
MONITORING amp IMPLEMENTATION REPORT VCS Version 3 CCB Standards Third Edition
v30 39
54 Summary of GHG Emission Reductions And Removals
EBCF REDD+ project shows emissions reduction of 34397563 tCO2e as the balance in the
period of 2011-2015 Table 06 shows the overview of the dynamics of reductions and project
emissions up to 2048 By the year 2015 the emissions data is posted as seen in reports and from
2016 data are projects as previous average and should be adjusted as a result of future reports
Table 06 - Summary of ex ante estimates
Year
Estimated
reductions
from
baseline21
(tCO2e)
Project
Estimated
emissions 22
tCO2e)
Unplanned
estimate
Emissions23
(tCO2e)
Net GHG
Estimated
emissions
Reduction
(tCO2e)
2012 8675500 1581 0 8673919
2013 8675500 5457 0 8670043
2014 8675500 484 296296 8378720
2015 8675500 620 0 8674880
2016 8675500 2100 0 8673400
2017 8675500 2100 0 8673400
2018 8675500 2100 0 8673400
2019 8675500 2100 0 8673400
2020 8675500 2100 0 8673400
2030 8675500 2100 0 8673400
2048 8675500 2100 0 8673400
Total 3123180 25203 296296 3119989
55 Climate Change Adaptation Benefits (GL1)
There is a relatively widespread understanding in the scientific community that balanced
ecosystems have greater ecological and social resilience and adaptability to climate change
21
See annex 18 22
See annex 21 23
See annex 24- HDOM (Study on deforestation and heat spots for EBCF REDD+ Project technical report)
MONITORING amp IMPLEMENTATION REPORT VCS Version 3 CCB Standards Third Edition
v30 40
whether through protection of water bodies and regulation of river flows during peak flood and
drought or through the regular supply of environmental services products and services
Thus once the project is designed to conserve an area of native forest which in the absence of
the project scenario would remain subject to the pressure of timber management (baseline) and
consequent degradation resulting from such activities it is understood that the mere protection of
these areas alone would offer communities and the ecosystem itself better adaptability compared
to the baseline scenario
Moreover the project has an Activity Management Plan (Annex 9) which details among other
initiatives the promotion of the sustainable use of ecosystem resources through direct support in
some activities related to income generation and conservation along with community training It is
believed that in addition to ensuring a more balanced (and therefore more resilient) environment
the project will expand the options for generating income among the communities making them
more resilient and preparing them to face the greater and already perceived challenges posed by
climate change
6 COMMUNITY
61 Positive Impacts for Communities (CM1)
EBCFrsquos REDD+ project was first presented to the riverine communities in 2011 By then
communities were informed about the cessation of all timber exploration activities due to the
REDD+ project and discussions were held regarding biodiversity conservation and the sustainable
use of forest products and services as well the social development of the surrounding
communities Briefly the positive impacts along the communities were
1 Project area zoning and its surroundings
2 Contribution to building local capacity
3 Contribution to developing sustainable business in the region
4 Contribution to social and environmental diagnosis
Knowing to manage
To evaluate the progress of these initiatives throughout the development of the project we used
the methodology of the Sustainability Matrix developed by the Secretariat of Environment and
MONITORING amp IMPLEMENTATION REPORT VCS Version 3 CCB Standards Third Edition
v30 41
Sustainable Development of Amazonas State This tool was applied in 15 communities taking into
account local socio-economic aspects that underlie the development of 20 parameters considered
of great importance to community development described by specific indicators As a visual tool
the Sustainability Matrix is quite suitable for traditional populations such as the riverside and
indigenous communities surrounding the Reserve Amazon River I and other areas of the Project
Additionally the Matrix provides interesting spaces for discussion since its construction is done
collectively Through the Sustainability Matrix it was possible to identify along with the
communities projects activities and implementation strategies Budgets and monitoring and
evaluation of these projects will be detailed later through the Annual Operational Plans to be
developed and followed up in the due course Four programs and nine subprograms were defined
for management and community development (Annex 9)
62 Negative Impacts (CM2)
No negative impacts have been recorded or identified as a result of the project with stakeholders
7 BIODIVERSITY
71 Positive Impacts for Biodiversity (B1)
The benefits for biodiversity are in reducing deforestation and degradation (selective logging) in the
project area According to satellite images analysis in the project areas and their surroundings it
was observed that until 2010 300 hectares were deforested After the implementation of the
project community awareness on the importance of preservation and conservation of forests have
encouraged no deforestation degradation and a significant reduction in deforestation was
identified (see graph below) This was due to the good understanding of the projects conservation
objectives and by the involvement and support of the surrounding communities
MONITORING amp IMPLEMENTATION REPORT VCS Version 3 CCB Standards Third Edition
v30 42
Figure 10 - EBCF REDD Project and buffer areas deforestation figures (source HDOM Report)
The consequences of deforestation and degradation on biodiversity are well known Thus the fact
of not being identified changes (natural or anthropogenic) in forest areas shows there was no loss
of biodiversity no reduction in floristic diversity no impact on the dynamics of fauna and flora and
no loss of evolutionary genetic information
72 Negative Impacts on Biodiversity (B2)
There are no negative impacts on biodiversity as a result of the project
73 Exceptional Benefits for Biodiversity (GL3)
The description of exceptional benefits for biodiversity will only be possible after the re-
measurement of permanent plots (FLORA)
8 ADICIONAL INFORMATION
All activities and the consequent reduction in deforestation and degradation in and around the
project areas were maintained and funded without resources of carbon credits We understand that
with the advance of REDD+ project EBCF will have much better conditions to implement positive
actions in partnership with communities
MONITORING amp IMPLEMENTATION REPORT VCS Version 3 CCB Standards Third Edition
v30 43
REFERENCES
ADEODATO S etal Madeira de ponta a ponta o caminho da floresta ateacute o consumo Satildeo Paulo
FGV-RAE 2011
ALBAGLI S Amazocircnia fronteira geopoliacutetica da biodiversidade Revista Parcerias Estrateacutegicas n
12 p6 set2001 Centro de Estudos Estrateacutegicos do Ministeacuterio da Ciecircncia e Tecnologia
AMARAL I C Viabilidade de plantio de cafeacute na zona da mata mineira Revista Poliacutetica Agriacutecola
Ano xx n4 outnovdez 2011 Disponiacutevel em
httpwwwalicecnptiaembrapabrbitstreamdoc9309031Viabilidadedeplantiopdf Acesso
em 17 de set 2013
AMARAL P etal Floresta para Sempre um manual para a produccedilatildeo de madeira na Amazocircnia
Beleacutem IMAZON 1998 130p
AMAZONAS Lei Complementar nordm 532007 de 05062007 REGULAMENTA o inciso V do artigo
230 e o sect 1ordm do artigo 231 da Constituiccedilatildeo Estadual institui o SISTEMA ESTADUAL DE
UNIDADES DE CONSERVACcedilAtildeO - SEUC dispondo sobre infraccedilotildees e penalidades e
estabelecendo outras providecircncias Disponiacutevel em
httpwwwcetesbspgovbruserfilesfilemudancasclimaticasproclimafilelegislacaoestadua
lamazonasleilei_complementar_n_53_2007_amazonaspdf Acessado em Setembro 2013
ANTAQ Anuaacuterio Estatiacutestico 2004 Distacircncia entre os portos Disponiacutevel em
httpwwwantaqgovbrportalanuariosportuario2004TabelasDistanciaEntrePortospdf
Acesso em 23 de out 2013
ANTAQ Panorama Aquaviaacuterio Agecircncia Nacional de Transportes Aquaviaacuterios Volume 3 Brasiacutelia
ndash DF 2009
MONITORING amp IMPLEMENTATION REPORT VCS Version 3 CCB Standards Third Edition
v30 44
AREDES A F PEREIRA M W G Anaacutelise econocircmica da produccedilatildeo de cafeacute araacutebica um estudo
de caso com simulaccedilotildees de Monte Carlo para sistemas de baixa e alta produtividade
Informaccedilotildees Econocircmicas SP v38 n4 abr 2008
ARIMA E UHL C Pecuaacuteria na Amazocircnia Oriental Desempenho Atual e Perspectivas Futuras Seacuterie
Amazocircnia n1 Beleacutem IMAZON 1996 40p
BACCINI A et al Estimated carbon dioxide emissions from tropical deforestation improved by
carbon-density maps Nature Climate Change vol2 march 2012 (LETTERS Published
Online - DOI 101038NCLIMATE1354)
BARROS A C UHL C Padrotildees problemas e potencial da extraccedilatildeo madeireira ao longo do Rio
Amazonas e do seu estuaacuterio Seacuterie Amazocircnia n4 Beleacutem IMAZON 1997 42p
BRASIL Lei 121872009 (Lei Ordinaacuteria) 29122009 Institui a Poliacutetica Nacional sobre Mudanccedila
do Clima - PNMC e daacute outras Providecircncias Presidecircncia da Repuacuteblica Casa Civil Subchefia
para Assuntos Juriacutedicos Disponiacutevel em lthttpswwwplanaltogovbrccivil_03_ato2007-
20102009leil12187htmgt Acesso em 20 de set 2013
CAMPOS E F Emissatildeo de CO2 da madeira serrada da Amazocircnia o caso da exploraccedilatildeo
convencional 2012 172p Dissertaccedilatildeo - Escola Politeacutecnica Universidade de Satildeo Paulo Satildeo
Paulo
CARDOSO RS e FREITAS C E C A pesca de pequena escala no rio Madeira pelos
desembarques ocorridos em Manicoreacute (Estado do Amazonas) Brasil Revista Acta
Amazocircnica vol 38(4) 2008 781 ndash 788
CCBA Climate Community and Biodiversity Alliance-CCBA 2008 Disponiacutevel em
httpwwwclimate-standardsorgccb-standards Acesso em 03 de set 2013
MONITORING amp IMPLEMENTATION REPORT VCS Version 3 CCB Standards Third Edition
v30 45
CEPEA Centro de Estudos Avanccedilados em Economia Aplicada - ESALQUSP Economia da
pecuaacuteria de corte na regiatildeo norte do Brasil Disponiacutevel em httpgooglL2roiA Acesso em
15 de out 2013
CHAMBERS J Q et al Decomposition and carbon cycling of dead trees in tropical forests of the
central Amazon Oecologia vol122 pp380-388 2000 Agricultores se queixam de
burocracia para contratar creacutedito sustentaacutevel do Programa ABC Correio Braziliense Brasiacutelia
26 fev 2012 Disponiacutevel em
lthttpwww2correiobraziliensecombrsersustentavelp=4592gt Acesso em 10 set 2013
CULLEN Jr L VALLADARES-PAacuteDUA C Onccedilas como detetives da paisagem Ciecircncia Hoje
Vol 156 n26 pp54-571999
CPRM - Serviccedilo Geoloacutegico do Brasil Disponiacutevel em httpwwwcprmgovbr Acesso em 13 de
mar 2013
DIAS F M MORAIS S J S REZENDE R C Anaacutelise da viabilidade econocircmica para a
produccedilatildeo de melancia e cenoura com financiamento em Anaacutepolis-GO 2008 Disponiacutevel em
httpwwwprpuegbr06v1conteudopesquisainiccieneventossic2008fronteiraflashsicani
macaoIIIJORNADAarquivosresumosresumo01pdfgt Acesso em 18 de nov2013
Divisatildeo de Precessamento de Imagens (DPI) Ambdata Mapa de Vegetaccedilatildeo SIPAM RADAM
2002 Disponiacutevel em httpwwwdpiinpebrAmbdatamapa_sipamphp Acesso em 21 de
out 2013
DOMINGUES MS BERNMANN C O arco de desflorestamento na Amazocircnia da pecuaacuteria agrave
soja Ambiente amp Sociedade Satildeo Paulo vol15 n2 pp1-22 maioago 2012
MONITORING amp IMPLEMENTATION REPORT VCS Version 3 CCB Standards Third Edition
v30 46
EBCF Criaccedilatildeo da primeira reserva particular de desenvolvimento sustentaacutevel do mundo na
floresta amazocircnica Disponiacutevel emlthttpwwwebcfcombrblog20130624criacao-da-
primeira-reserva-particular-de-desenvolvimento-sustentavel-do-mundo-na-floresta-
amazonicagt Acesso em 21 de set 2013
EMBRAPA Sistema Brasileiro de Classificaccedilatildeo de Solos 2ordf Ed Rio de Janeiro Embrapa Solos
2006 306 p
FELDPAUSCH T R et al When big trees fall Damage and carbon export by reduced impact
logging in southern Amazonia Forest Ecology and Management Vol 219 pp199-215 2005
FEARNSIDE P MDesmatamento na Amazocircnia dinacircmica impactos e controle Acta Amazocircnica
vol 36 n3 pp 395-400 2006
FILGUEIRAS T S et al 1994 Caminhamento Um meacutetodo expedito para levantamentos
floriacutesticos qualitativos Caderno de Geociecircncia IBGE vol12 pp39-43 1994
Forest Management Public Summary for Gethal Amazonas SA Induacutestria de Madeira
Compensada Certification Code SW-FMCOC-119 Date of Certification October 1
2000 Date of Public Summary October 2000 Updated for Annual Audit 2002 Annual Audit
2003 (Gethalpdf)
Globo Rural Linha de financiamento para a agricultura de baixo carbono tem pouca procura
2011 Disponiacutevel em httpwwwrainforest-allianceorgforestrydocumentsgethalpdf
Acesso em 16 de nov 2013
GREENPEACE Face a Face com a Destruiccedilatildeo Relatoacuterio Greenpeace sobre as companhias
multinacionais madeireiras na Amazocircnia Brasileira 1999 Disponiacutevel em
MONITORING amp IMPLEMENTATION REPORT VCS Version 3 CCB Standards Third Edition
v30 47
lthttpwwwgreenpeaceorgbramazoniaface_destruicaopdfgt Acesso em 11 de set
2013
Governo do Estado do Amazonas Plano de Gestao da RDS do Rio Amapaacute 2010 Disponiacutevel em
httpobservatoriowwforgbrsite_mediauploadgestaoplanoManejorio_amapapdf Acesso
em 24 de ago 2013
HDOM Estimates from processing the forest inventories data carried out during the CADAF
Project Final Technical Report 2012 Disponiacutevel em wwwhdomcombr Acesso em 27 de
maio 2013
HIGUCHI N 1986-87 Amostragem sistemaacutetica versus amostragem aleatoacuteria em floresta tropical
uacutemida de terra-firme na regiatildeo de Manaus Acta Amazonica 1617 (uacutenico) 393-400
HIGUCHI N SANTOS J JARDIM FCS Tamanho de parcela amostral para inventaacuterios
florestais Acta Amazocircnica vol12 n1 pp91-103 1982
HIGUCHI F G PINTO A C M ISHIZUKA M KAJIMOTO T LIMA A J N SANTOS J
HIGUCHI N Estoque e dinacircmica de biomassa acima do solo das florestas de terra firme do
estado do Amazonas In Adriano Joseacute Nogueira Lima Flaacutevia Machado Durgante Moacir
Alberto Assis Campos Joaquim dos Santos Moriyoshi Ishizuka Niro Higuchi (Org)
Dinacircmica do carbono das florestas da Amazocircnia resultados do Projeto CADAF
1edManaus INPA 2014 v 1 p 29-34
HOLMES T P etal Custos e benefiacutecios financeiros da exploraccedilatildeo de impacto reduzido em
comparaccedilatildeo agrave exploraccedilatildeo florestal convencional na Amazocircnia oriental 2ordf ed Beleacutem
Fundaccedilatildeo Floresta Tropical 2002 66p
HUSCH B MILLER C I BEERS T W Forest mensuration New York Ronald Press 1971
HUSCH B MILLER C I BEERS T W Forest Mensuration New York John Wiley amp Sons
2nd
ed 1972 402 p
MONITORING amp IMPLEMENTATION REPORT VCS Version 3 CCB Standards Third Edition
v30 48
IBGE Instituto Brasileiro de Geografia e Estatiacutestica Diretoria de GeociecircnciasCoordenaccedilatildeo de
Recursos Naturais e Estudos Ambientais Geologia Solos Hidrografia e Vegetaccedilatildeo 2000
IBGE Instituto Brasileiro de Geografia e Estatiacutestica Manicoreacute 2010 Disponiacutevel
emlthttpwwwsidraibgegovbrgt Acesso em 05 de set 2013
IBGE Instituto Brasileiro de Geografia e Estatiacutestica 2011 Disponiacutevel em httpwwwibgegovbr
Acesso em 19 de mar 2013
IBGE Instituto Brasileiro de Geografia e Estatiacutestica Extraccedilatildeo vegetal e silvicultura para o
municiacutepio de Manicoreacute 2011 Disponiacutevel em
lthttpcidadesibgegovbrxtrastemasphplang=ampcodmun=130270ampidtema=102ampsearch=a
mazonas|manicore|extracao-vegetal-e-silvicultura-2011gt Acesso em 10 de out 2013
IBGE Instituto Brasileiro de Geografia e Estatiacutestica Censo Demograacutefico 2010 Disponiacutevel em
lthttpcidadesibgegovbrxtrastemasphpcodmun=130270ampidtema=116gt Acesso em 18
de out 2013
IBGE Instituto Brasileiro de Geografia e Estatiacutestica Censo Demograacutefico 2010 Disponiacutevel
emlthttpcidadesibgegovbrxtrashomephpgt Acesso em 08 de out 2013
IDESAM Reduccedilotildees de Emissotildees do Desmatamento e Degradaccedilatildeo Florestal (REDD+) estudo de
oportunidades para a regiatildeo sul do Amazonas CENAMO M Cl CARRERO G C
GANDOLFO P (Org) Manaus 2011 Disponiacutevel em
lthttpwwwobservatoriodoreddorgbrsitepdfestudodeoportunidadespdfgt Acesso em 13 de
set 2013
MONITORING amp IMPLEMENTATION REPORT VCS Version 3 CCB Standards Third Edition
v30 49
IDESAM Semeando Sustentabilidade em Apuiacute ndash Resultados e Perspectivas 2011 Manaus
Disponivel em lthttpidesamorgbrsemeando-sustentabilidade-em-apui-resultados-e-
perspectivasUxX8nfldWYI
IEA Instituto de Economia Aplicada CO2 Emissions from fuel combustion 2012 Disponiacutevel em
httpwwwieaorgco2highlightsco2highlightspdf Acesso em 09 de out 2013
IGREJA H L S CATIQUE J Anaacutelise neotectocircnica do lineamento de Itacoatiara centro leste do
Estado do Amazonas In Simpoacutesio Nacional de Estudos Tectocircnicos 6 1997 Pirenoacutepolis
Anais Pirenoacutepolis-GO SBG-Nuacutecleo Brasiacutelia1997
IMAZON Instituto do Homem e do Meio Ambiente da Amazocircnia Fatos Florestais 2010a
Disponiacutevel em httpwwwimazonorgbrpublicacoeslivrosfatos-florestais-da-amazonia-
2010-1 Acesso em 14 de out 2013
IMAZOM Instituto do Homem e do Meio Ambiente da Amazocircnia Mercado e preccedilo da madeira
amazocircnica 2010 Disponiacutevel em httpwwwimazonorgbrpublicacoesprecos-de-madeira-
em-toraboletim-de-precos-de-madeira-em-tora-na-amazonia-julho-2010at_downloadfile
Acesso em 23 de nov 2013
IMAZON Instituto do Homem e do Meio Ambiente da Amazocircnia Portal de Geoinformaccedilatildeo sobre
a Amazocircnia Disponiacutevel em lthttpwwwimazongeoorgbrimazongeophpgt Acesso em 06
de set 2013
IMAZON Instituto do Homem e do Meio Ambiente da Amazocircnia Transparecircncia florestal
Amazocircnia Legal 2012 Disponiacutevel em lthttpwwwimazonorgbrpublicacoestransparencia-
florestaltransparencia-florestal-amazonia-legalcopy_of_SADOutubro2012pdfgt Acesso em
23 de set 2013
IMAZON Instituto do Homem e do Meio Ambiente da Amazocircnia PEREIRA D SANTOS D
VEDOVETO M GIMARAtildeES J VERIacuteSSIMO A (Orgs) Fatos Florestais da Amazocircnia
Beleacutem IMAZON 2010 244p Disponiacutevel em
MONITORING amp IMPLEMENTATION REPORT VCS Version 3 CCB Standards Third Edition
v30 50
lthttpwwwimazonorgbrpublicacoeslivrosfatos-florestais-da-amazonia-2010-1gt Acesso
em 24 de set 2013
IMAZON Instituto do Homem e do Meio Ambiente da Amazocircnia A Expansatildeo madeireira na
Amazocircnia Impactos e perspectivas para o desenvolvimento sustentaacutevel no Paraacute BARROS
AC VERIacuteSSIMO A (Eds) Beleacutem IMAZON 2002
IMAZON Instituto do Homem e do Meio Ambiente da Amazocircnia Custos e Benefiacutecios do Manejo
Florestal Para Produccedilatildeo de Madeira na Amazocircnia Oriental 1998 Disponiacutevel em
lthttpwwwimazonorgbrpublicacoesserie-amazoniacustos-e-beneficios-do-manejo-
florestal-para-producao-de-madeira-na-amazonia-orientalgt Acesso em 20 de set 2013
INPE Instituto de Pesquisas Espaciais Banco de dados PRODES 2012 Disponiacutevel em
lthttpwwwdpiinpebrprodesdigitalprodesphpgt Acesso em 09 de set 2013
INPE Instituto de Pesquisas Espaciais Banco de dados DEGRAD 2009 Disponiacutevel em
lthttpwwwobtinpebrdegradgt Acesso em 09 de set 2013
INPE Instituto de Pesquisas Espaciais Banco de dados DETER 2013 Disponiacutevel em
lthttpwwwobtinpebrdetergt Acesso em 10 de set 2013
INPE Instituto de Pesquisas Espaciais Banco de dados de queimadas e focos de calor
BDQUEIMADAS 2013 Disponiacutevel em lthttpwwwdpiinpebrproarcobdqueimadasgt
Acesso em 10 de set 2013
Instituto Carbono Brasil Soacute 2 da produccedilatildeo de madeira eacute certificada O Estado de SPaulo 2006
Disponiacutevel em lthttpwwwinstitutocarbonobrasilorgbrnoticias6noticia=119796gt Acesso
em 26 de set 2013
MONITORING amp IMPLEMENTATION REPORT VCS Version 3 CCB Standards Third Edition
v30 51
IFT Instituto Floresta Tropical Diagnoacutestico do Setor Florestal de Cotriguaccedilu Estado do Mato
Grosso 2010 Disponiacutevel em lthttpgooglEVx2RZgt Acesso em 16 de dez 2013
IPCC Guidelines for National Greenhouse Gas Inventories In National Greenhouse Gas
Inventories Programme EGGLESTON HS BUENDIA L MIWA K NGARA T TANABE
K (Eds) Japan IGES 2006
ITTO Annual review and assessment of the world timber situation 2011 Disponivel em
httpwwwittointannual_review Acesso em 10 de out 2013
KELLER M et al Coarse woody debris in undisturbed and logged forests in the eastern Brazilian
Amazon Global Change Biology vol10 PP784-795 2004
LENTINI M VERISSIMO A PEREIRA D A expansatildeo madeireira na Amazocircnia O Estado da
Amazocircnia n2 2005 Beleacutem IMAZON Disponiacutevel em
httpwwwimazonorgbruploadea_2ppdf Acesso em 06 de set 2013
LOETSCH F ZOumlHRER F HALLER K E Forest Inventory Munich BLV Verlagsgesellschaft
2nd
edition Vol II 1973 469 p
MAGNUSSON WE et al RAPELD uma modificaccedilatildeo do meacutetodo de Gentry para inventaacuterios de
biodiversidade em siacutetios para pesquisa ecoloacutegica de longa duraccedilatildeo Biota Neotrop JulDez
2005 vol 5 no 2 httpwwwbiotaneotropicaorgbrv5n2ptabstractpoint-of-
view+bn01005022005 ISSN 1676-0603
MARINELLI C E et al O programa de monitoramento da biodiversidade da biodiversidade e do
uso de recursos naturais em unidades de conservaccedilatildeo estaduais do Amazonas Secretaria
de Estado do Meio Ambiente e Desenvolvimento Sustentaacutevel - SDS Manaus SDS 2007
MONITORING amp IMPLEMENTATION REPORT VCS Version 3 CCB Standards Third Edition
v30 52
MARINELLI C E MALTEZ M H Indicadores de Sustentabilidade para Unidades de
Conservaccedilatildeo Documento-Siacutentese Workshop Instituto Socioambiental Brasiacutelia-DF 2010
76p
MAZZEI L et al Above-ground biomass dynamics after reduced-impact logging in the Eastern
Amazon Forest Ecology and Management vol 259 pp367-373 2010
MEIRELLES FILHO O Livro de Ouro da Amazocircnia 5ordf Ediccedilatildeo Rio de Janeiro EDIOURO 2007
422p Meirelles Filho J O Livro de Ouro da Amazocircnia 1ordf ed Editora Ediouro ISBN
8500021616 2007 450p
MENGER Juliana da Silva Fatores determinantes da distribuiccedilatildeo de aves no interfluacutevio Purus-
Madeira Manaus [sn] 2011 35 fl il
MCT Arquivos dos Fatores de Emissatildeo Disponiacutevel em
httpwwwmctgovbrindexphpcontentview321144htmlancora Acesso em 23 de out
2013
MMA Ministeacuterio do Meio Ambiente Avaliaccedilatildeo e identificaccedilatildeo de accedilotildees prioritaacuterias para a
conservaccedilatildeo utilizaccedilatildeo sustentaacutevel e reparticcedilatildeo dos benefiacutecios da biodiversidade na
Amazocircnia brasileira Brasiacutelia MMASBF 2001
MMA Ministeacuterio do Meio Ambiente Secretaria de Biodiversidade e Florestas Aacutereas Prioritaacuterias
para Conservaccedilatildeo Uso Sustentaacutevel e Reparticcedilatildeo de Benefiacutecios da Biodiversidade Brasileira
Atualizaccedilatildeo - Portaria MMA ndeg9 de 23 de janeiro de 2007 Brasiacutelia MMA 2007 (Seacuterie
Biodiversidade 31)
MONITORING amp IMPLEMENTATION REPORT VCS Version 3 CCB Standards Third Edition
v30 53
MMA Livro vermelho da fauna brasileira ameaccedilada de extinccedilatildeo editores Angelo Barbosa
Monteiro Machado Glaacuteucia Moreira Drummond Adriano Pereira Paglia 1ed 2008 Brasiacutelia
DF MMA Belo Horizonte MG Fundaccedilatildeo Biodiversitas (1420 p) il - (Biodiversidade 19)
OLIVEIRA M M HIGUCHI N CELES C H HIGUCHI F G 2014 Tamanho e formas de
parcelas para inventaacuterios florestais de espeacutecies arboacutereas na Amazocircnia Central Ciecircncia
Florestal Santa Maria v 24 n 3 p 645-653
PEARSON TRH WALKER S BROWN SL The Source Book for Land Use Land Use
Change and Forestry Projects BioCarbon Fund and Winrock International 2005 64 pp
PORTAL AMAZOcircNIA Amazocircnia de A a Z Disponiacutevel em
lthttpportalamazoniaglobocomgt Acesso em 13 de set 2013
PEacuteLLICO NETTO S BRENA D A Inventaacuterio florestal Curitiba Editorado pelos autores p
316 1997
PROJETO SIVAM Relatoacuterio metodoloacutegico de trabalho Revisatildeo 3 Diretoria de Geociecircncia Rio de
Janeiro 2002 330 pp
PROJETO SIVAM Atualizaccedilatildeo do RADAMBRASIL Mapa de Vegetacao da Amazonia Legal
Mapa de Fitofisionomias ndash RADAMSIPAM DNPM Ministeacuterio de Minas e Energia 2002
Disponiacutevel em httpwwwdpiinpebramb_dataShapefilesveg_Amz_SIPAMzip Acesso
em 21 de jan 2014
PROJETO FLORESTAL SANTA MARIA (PROJETO FSM-REDD) Plant Inteligecircncia Ambiental ndash
Warwick Manfrinato 2012 Disponiacutevel em
lthttpwwwflorestalsantamariacombrsitedocumentos57FSM_REDD_VCS_PD_ptpdfgt
Acesso em 09 de set 2013
MONITORING amp IMPLEMENTATION REPORT VCS Version 3 CCB Standards Third Edition
v30 54
RADAMBRASIL Programa de Integraccedilatildeo Nacional Levantamentos de Recursos Naturais v 14 ndash
RADAM DNPM Ministeacuterio de Minas e Energia Brasil 1974
RIBEIRO J E L et al Flora da Reserva Ducke guia de identificaccedilatildeo das plantas vasculares de
uma floresta de terra firme na Amazocircnia Central Manaus Editora INPA 1999
ROSAS F C W WALDEMARIN H de MATTOS G E Pteronura rasiliensis (Zimmermann
1780) In MACHADO A B M DRUMMOND G M PAGLIA A P (eds) Livro Vermelho da
Fauna Brasileira Ameaccedilada de Extinccedilatildeo Volume II 1ed Brasiacutelia DF Ministeacuterio do Meio
Ambiente 2008 p 800 - 801
ROSS D GHG Emissions Resulting from Aircraft Travel 2009 Disponiacutevel em
httpwwwcarbonplanetcomdownloadsFlight_Calculator_Information_v92pdf Acesso em
14 de out 2013
SANTOS A J et al Viabilidade econocircmica do sistema agroflorestal greviacutelea x cafeacute na regiatildeo
norte do Paranaacute CERNE vol6 n1 pp89-100 2000
SANTOS R A Custo do manejo florestal madeireiro estudo de caso Floresta Estadual do
Antimary Monografia (Bacharelado em Economia) ndash Departamento de Ciecircncias
Econocircmicas Universidade Federal do Acre 2007109p
SABOGAL C et al Manejo Florestal Empresarial na Amazocircnia Brasileira restriccedilotildees e
oportunidades (Relatoacuterio Siacutentese) Beleacutem CIFORIMAZON 2006 72p
SDSCEUC Secretaria Estadual de Meio Ambiente e Desenvolvimento Sustentaacutevel ndash Centro
Estadual de Unidades de Conservaccedilatildeo Programa de Monitoramento de Biodiversidade e
Uso de Recursos Naturais em Aacutereas Protegidas do Estado Amazonas (ProBUC) 2006
Disponiacutevel em
MONITORING amp IMPLEMENTATION REPORT VCS Version 3 CCB Standards Third Edition
v30 55
httpbrazilwcsorgDesktopModulesBring2mindDMXDownloadaspxEntryId=6168ampPortalI
d=93ampDownloadMethod=attachment Acesso em 11 de ago de 2013
SFBIMAZON Serviccedilo Florestal Brasileiro e Instituto do Homem e Meio Ambiente da Amazocircnia A
atividade madeireira na Amazocircnia brasileira produccedilatildeo receita e mercados 2010 Disponiacutevel
em httpwwwmmagovbrestruturassfb_arquivosmiolo_resexec_polo_03_95_1pdf
Acesso em 23 de out 2013
SILVA R P da Alometria estoque e dinacircmica da biomassa de florestas primaacuterias e
secundaacuterias na regiatildeo de Manaus (AM) 152 p Tese de Doutorado Programa Integrado
de Poacutes-graduaccedilatildeo em Biologia Tropical e Recursos Naturais (INPA) Manaus 2007
SILVA Z A G P G SANTOS R A Custo do manejo florestal madeireiro em floresta puacuteblica
estudo de caso no Acre 2011 Disponiacutevel em
lthttpwwwbasacombrbancoamazonia2Revistaedicao_13n13_custo_do_manejo_flores
pdfgt Acesso em 13 de set 2013
SMIDT M GALLAGHER T Factors Affecting Fuel Consumption and Harvesting Costs Auburn
School of Forestry and Wildlife Sciences Sd Disponiacutevel em
httpweb1cnrevteduforestrycofedocuments2013Smidt_Gallagherpdf Acesso em 21
de out 2013
SOARES-FILHO B et al Role of Brazilian Amazon protected areas in climate change mitigation
2010 Columbia University NY Ruth S DeFries 2010
SPF Serviccedilo Puacuteblico Federal DVPF Documento de venda de produto Florestal (Declaraccedilotildees de
venda Gethalpdf) 14 de julho de 2006
MONITORING amp IMPLEMENTATION REPORT VCS Version 3 CCB Standards Third Edition
v30 56
TIMOFEICZYK JUacuteNIOR R et al Rentabilidade econocircmica do manejo de baixo impacto em
florestas tropicais um estudo de caso Revista Floresta Curitiba v 38 n 4 p 711-725
outdez 2008
VCS Ferramenta para Demonstraccedilatildeo e Avaliaccedilatildeo de Adicionalidade para Atividades de Projetos
VCS em Agricultura Floresta e Outros Usos (AFOLU) 2012a Disponiacutevel em httpwwwv-c-
sorgsitesv-c-sorgfilesVT000120VCS20AFOLU20Additionality20Tool20v30pdf
Acesso em 24 de set 2013
VCS Ferramenta de Risco e Natildeo Permanecircncia (AFOLU) 2012B Disponiacutevel em httpv-c-
sorgsitesv-c-sorgfilesAFOLU20Non-Permanence20Risk20Tool2C20v32pdf
Acesso em 13 de set 2013
VCS Approved VCS Methodology VM0010 Version 10 - Methodology for Improved Forest
Management Conversion to Logged to Protected Forest Calculating GHG Benefits from
Preventing Planned Degradation PHUA S SHARMA S TELFER M CHANDLER H
(Eds) Califoacuternia EUA Carbon Planet Limited 2011149p
VERDEJO M E Diagnoacutestico Rural Participativo um guia praacutetico Brasiacutelia MDA 2006 62p
VIANNA A L M Diagnoacutestico Florestal do Estado do Amazonas 2010 e 2011 Manaus-AM
IDESAM 2013 (Relatoacuterio Final do Projeto Fortalecimento da participaccedilatildeo da sociedade civil
no Amazonas Foacuterum de Mudanccedilas Climaacuteticas Transparecircncia Florestal no Estado do
Amazonas ndash Mapeamento de Instrumentos Legislativos no Brasil)
WBCSDWRI The GHG Protocol for Project Accountin Washington World Business Council for
Sustainable DevelopmentWorld Resources Institute 2005148 p
MONITORING amp IMPLEMENTATION REPORT VCS Version 3 CCB Standards Third Edition
v30 57
WALKER W et al Guia de Campo para Estimativa de Biomassa Florestal e Estoque de Carbono
Woods Hole Center Research Falmouth Massachusetts USA 2011 Disponiacutevel em
httpwwwwhrcorgresourcesfieldguidescarbonpdfWHRC_FieldGuide_PortugueseSMpdf
Acesso em 14 de set 2013
WWF Metodologia para Avaliaccedilatildeo Raacutepida e a Priorizaccedilatildeo do Manejo de Unidades de
Conservaccedilatildeo (RAPPAM) 2010 Disponiacutevel em httpgooglXfDnxs Acesso em 30 de set
2013
WWF-Brasil Efetividade de Gestatildeo das Unidades de Conservaccedilatildeo no Estado do Amazonas
Secretaria de Estado do Meio Ambiente e do Desenvolvimento Sustentaacutevel do Amazonas
Instituto Chico Mendes de Conservaccedilatildeo da Biodiversidade Brasiacutelia WWF-Brasil 2011 72 p
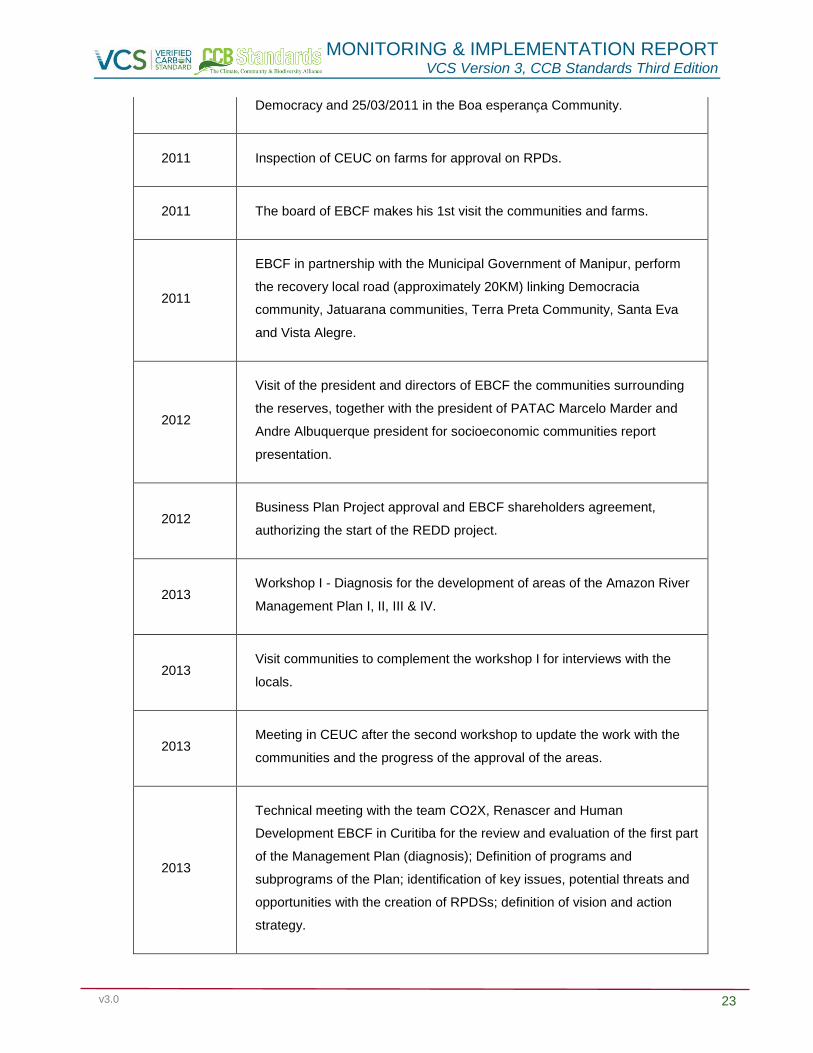
MONITORING amp IMPLEMENTATION REPORT VCS Version 3 CCB Standards Third Edition
v30 25
2016 REDD + Project Certification (VCS and CCV)
2016 Project planning for structuring the supply chain of vegetable oils
certificates
2017 Fundraising from the REDD project
2017 Ecotourism Project Design
2017 Workshop Achievement Participatory Planning Project REDD + activity
EBCF
2017 ProBUC Deployment
2018 Implementation of Voluntary Environmental Agent program
25 Respect for Rights and no Involuntary Relocation
In the three workshops explaining the Carbon project to 15 communities the eight REDD+
principles and the social and environmental safeguards were presented Those safeguards were
previously established in a series of meetings throughout the Amazon between 2009 and 2010
and included several Civil Society Organizations
It was emphasized in the workshops that compliance with these principles and safeguards under
REDD+ projects such as the Amazon Rio carbon project contributes to improving local
governance transparency of information public participation in decision-making coordination of
actions among different actors and respect and recognition of the rights of indigenous peoples and
traditional populations
Free Prior and Informed Consent (FPIC)
During the project workshops the concept of Free Prior and Informed Consent was presented to
the participants as well as the importance of social and environmental safeguards to ensure the
rights of communities in designing and developing the REDD+ project explained in the eight
principles The participants were asked whether they were in agreement and if there were other
MONITORING amp IMPLEMENTATION REPORT VCS Version 3 CCB Standards Third Edition
v30 26
principles or rights that should be included Some community individuals expressed their
agreement to the safeguards All participants at the three workshops raised their hands in support
of REDD+ project The consent was unanimous
A separate document describing the whole process of the Free Prior and Informed Consent has
been prepared and is available in Annex 10
Figure 05 - Workshop I Free Prior and Informed Consent for the development of the REDD+
project by the community leaders of Democracia Aacutegua Azul Satildeo Joseacute do Miriti Vista Alegre
Jatuarana Terra Preta do Ramal Pandegal Santa Maria Santa Eva and Terra Preta do Rio
Mancoreacute
Figure 06 - Workshop II Free Prior and Informed Consent for the development of the REDD+
project by the community leaders of Urucury Mocambo Boa Esperanccedila and Satildeo Joatildeo amp Ponta
Grossa
MONITORING amp IMPLEMENTATION REPORT VCS Version 3 CCB Standards Third Edition
v30 27
Figure 07 - Workshop III Free Prior and Informed Consent for the development of the REDD+
project by the Kamayuaacute indigenous community
3 APPLICATION OF METHODOLOGY
31 Title and Reference of Methodology
VCS VM0011 Methodology for Improved Forest Management ndash Logged to Protected Forest
(LtPF) Calculating the GHG Benefits from Preventing Planned Degradation version 10
MONITORING amp IMPLEMENTATION REPORT VCS Version 3 CCB Standards Third Edition
v30 28
32 Methodology Deviations
Whereas the VM0011 was developed in a context of homogeneous forests of temperate regions
some methodological adjustments were made related to the direct survey biomass in the field
since the project areas are comprised of very heterogeneous areas of rainforest including dryland
and floodplains Any technical documentation related to these methodological adjustments and
their justifications appear in Annex 23 (Forest Inventory 2016) prepared by the consulting firm
HDOM
33 Project Boundary5
The total area of the property is 20387 ha and a buffer zone was established around each of the
four areas in order to include communities that use the resources within their boundaries (Figure
7a) Project activity areas (for purposes of calculating the emissions reductions called the project
area or PA) are only those for which logging is permitted a total of 19800 ha (Figure 7b)
excluding the Permanent Preservation Areas (APPs) and bodies of water A logging plan has been
approved for this area for selective logging (Annexes 1 2 3 4 6 and 7)
Figure 08 - Project Boundaries a) Direct Project interference limits b) Total Project Area (G1
Indicator 7)
5 Ref section 22 of VM0011
MONITORING amp IMPLEMENTATION REPORT VCS Version 3 CCB Standards Third Edition
v30 29
Stratification of the project area
For purposes of inventorying local carbon stocks and project management the project area was
stratified into 3 groups of different forest types as indicated by the VM0011 according to the
vegetation map SIPAMRADAM (DPI 2002) The forest types present in the area are rain forest
types divided into 3 categories as follows
Dense Primary Tropical Ombrophylous Alluvial Forest
Dense Primary Tropical Ombrophylous Lowland Forest
Pioneer Formations
Figure 09 - Project Area forest types
Leakage areas
There is no direct leakage resulting from planned project activities since there will be neither
displacement of management activities to other areas after the cessation of the activities within the
project area nor market leakages The project Management Plan includes the monitoring of
MONITORING amp IMPLEMENTATION REPORT VCS Version 3 CCB Standards Third Edition
v30 30
possible unanticipated leakages around the project area as well as the need to report to the
competent authorities whenever logging activities are identified in these areas For more
information on leakage see chapters 52 and 55 of this document
Temporal boundaries
Crediting period of the project
The first crediting period of the project is 37 years beginning on August 17 2012 and ending on 17
August 2049 This period is equivalent to the remaining 12 years of the first authorized
management plan (25 years from 1998) added to another 25 years in respect of a new forest
management plan that was intended as the common practice of forestry in Brazil The logging
activities could continue beyond 37 years aiming for a second crediting period
Monitoring and Reporting Period
a) Monitoring of Baseline Emissions
The monitoring of Baseline Emissions must demonstrate that the protected forest area is in
accordance with the one specified in the PD The project limit will be monitored before each
verification throughout the crediting period through new inventory information and remote sensing
and GIS as applicable Thus the project will be able to update the baseline calculations based on
the actual remaining forest area (in case of loss of forest cover by disasters for example) and that
would be subject to forest management under a ldquowithout projectrdquo scenario
b) Monitoring of Project Emissions
Project emissions will be monitored annually and compiled in every monitoring report that will detail
in particular the
Monitoring of possible illegal harvesting of timber
Monitoring of areas subject to natural disturbances
Monitoring and quantification of emissions related to air and land travel related to project
activities
c) Monitoring of Leakage
Since there will be no leakages according to the VM0011 and AFOLU Requirements no leakage
monitoring will be necessary However to be conservative the project intends to monitor any
disturbances that might affect the carbon reservoirs Once some disturbance is registered the
project will report the incident to the relevant authorities and make the necessary adjustments to
MONITORING amp IMPLEMENTATION REPORT VCS Version 3 CCB Standards Third Edition
v30 31
the baseline For more details about the monitoring of leakages see chapters 52 and 55 of this
document
Carbon stocks
The biomass reservoirs considered by the project are related to above-ground and underground
biomass
Sources and sinks of GHGs
Table 02 below describes the emission sources and sinks of greenhouse gases associated with
the baseline activities and with the project
Table 03 - Greenhouse gas emissions sources and sinks associated with baseline and project
activities
Source Gas Included JustificationExplanation
Baselin
e
Biomass
CO2 Yes Main source of project emissions through forest
degradation harvested and commercialised
wood products deadwood and forest regrowth
CH4 No Conservatively excluded
N2O No Conservatively excluded
Other No -
Fossil Fuel
consumption
CO2 Yes Main source through fossil fuel use in
machinery and transportation of timber
CH4 Yes Conservatively included
N2O Yes Conservatively included
Other No -
Electricity
consumption
CO2 Yes Main source
CH4 No -
N2O No -
Other No -
Pro
ject
Biomass
CO2 Yes Main source through unexpected natural
disturbances such as forest fires etc
CH4 Yes Included but subject to significance
N2O Yes Included but subject to significance
MONITORING amp IMPLEMENTATION REPORT VCS Version 3 CCB Standards Third Edition
v30 32
Source Gas Included JustificationExplanation
Other No _
Fossil Fuel
consumption
CO2 Yes Main source through flights and ground travel
CH4 Yes Included but subject to significance
N2O Yes Included but subject to significance
Other No _
Electricity
consumption
CO2 Yes Main source
CH4 No _
N2O No _
Other No _
34 Baseline Scenario
The choice between alternative baseline scenarios was taken together with the analysis of
additionality using the latest version of the VCS Tool for the demonstration and assessment of
additionality in Agriculture Forestry and Other Land Use VCS projects in this case VT000167
(VCS 2012a) All possible scenarios as well as the analysis of methodology barriers (steps 211
and 212 of the VM0011) are present in the chapter below In this sense to avoid redundancy of
information refer to additionality analysis to find the steps 211 and 212 of the VM0011
The baseline scenario for the project identified as the most likely to occur was selective logging8
(continuation of Business As Usual - BAU) The reference scenario assumes 37 years of selective
logging according to the 25 year logging plan approved in August 1998 (Annex 6 - document
ValdII T01 POA 1998) that in the absence of project activities would be renewed in 2024 for
another 25 years until 2049
Under this scenario the full implementation of the timber logging plan occurs and which has
already resulted in the degradation of 434769 ha (see table below) The area would be harvested
selectively for timber sold in lumber markets Below is a summary of harvest areas between 1999
and 2010 showing the managed plots and the dates on which the harvests were authorized
6 Tool for the demonstration and assessment of an additional to the VCS project activities in Agriculture Forestry and Other
Uses (AFOLU) (V 30)
7 Adapted from ldquoTool for the Demonstration and Assessment of Additionality in AR CDM project Activitiesrdquo (V02) 8 Additional information about choosing the baseline are presented in section 46 (steps 1 and 2)
MONITORING amp IMPLEMENTATION REPORT VCS Version 3 CCB Standards Third Edition
v30 33
Table 04 - Summary of areas managed since 1999
Date Managed logged area (ha)
1999 58669 (Plot 1)
2000 688 (Plot 2)
2001 ndash 2002 8315 (Plot 3)
2003 ndash 2004 750 (Plots 3 and 4)
2005 ndash 2007 1082 (Plot 5)
2008 ndash 2009 49050 (Plots 5 and 6)
TOTAL 434769
35 Additionality
The additionality analysis of the Amazon Rio project REDD+ IFM was conducted with the latest
version of the VCS Tool for the demonstration and assessment of additionality in Agriculture
Forestry and Other Land Use VCS projects the VT000167
(VCS 2012a)
To generate the reductions in GHG emissions for the project the planned baseline activities
(sustainable forest management) were terminated by the project proponent and supplanted by
environmental conservation activities In this sense the project will be managed by EBCF with
the goal of creating a fund for administrative and accounting management especially to promote
environmental management and monitoring activities of carbon pools within the project area
Alternative activities planned in the project are the provisioning and valuation of environmental
services via carbon credits (VCUs) in conjunction with the sale of Environmental Reserve Quotas
(CRAs)
4 MONITORING AND PARAMETERS OF DATA
41 Monitoring Plan Description
Due to its innovative comprehensive and integrative character the project needs to be monitored
regularly so that its actions activities and impacts can be constantly measured and evaluated To
meet this requirement the monitoring process must meet three main objectives
MONITORING amp IMPLEMENTATION REPORT VCS Version 3 CCB Standards Third Edition
v30 34
i To serve as an internal management project tool
ii To collaborate as an instrument of collective learning from the communities and
social groups directly involved
iii To work as a means of communicating results and impacts to interested institutions
and society in general Furthermore it is important to consider that monitoring if
successful will transcend the managerial aspects of the project and strengthening
the plan
To facilitate the monitoring process instead of having a reference line (to compare interventions
before and after) the first year of monitoring will serve as the starting point whose information will
be regularly and systematically compared throughout the project
Next the initial plans for monitoring benefits to the climate community and biodiversity are
described wherein the community is committed to participatory precept and to the technical and
scientific rigor which is capable of following the possible negative and positive impacts on
environmental and social aspects in the project area and its surroundings
Monitoring of Climate Impacts
The Monitoring Plan (MP) aims to provide security in the periodic estimates of reduction in
emissions especially in monitoring changes in carbon stock Therefore emissions from the
implementation of the project ex post estimates of the activities and emissions from any leakages
and isolated disturbances (eg blowdown fires pests and diseases among others) can be
calculated
The construction of the PM of the climate benefits made in full compliance with the methodological
framework provided by VM0011 ndash IFM LPF (VCS 2011) and CCBA (2008) which consists of four
specific actions to be monitored
i Implementation and execution of the project
ii Dynamics and stock of the forest biomass
iii Deforestation and forest degradation
iv Periodic reviews of ex post emissions
Remote monitoring and surveillance of the project area
Measurement of alterations and biomass loss quantification present in the PA using land use
change detection is critical to make accurate estimates of GHG emissions that account for forest
biomass increases and losses
MONITORING amp IMPLEMENTATION REPORT VCS Version 3 CCB Standards Third Edition
v30 35
Thus the use of remote sensing by satellite images of medium spatial resolution can be applied
readily in the PA and surroundings in order to monitor land use dynamics over time particularly to
identify risks and threats to forested areas In situ verification will complement landscape analysis
in a GIS environment with the aim of quantifying spatializing and identifying conversion of forest
areas into other land uses environmental degradation and other possible changes that may occur
during the term of the project
As a complementary monitoring source the project will rely on the database and information
provided by Monitoring Program of the Brazilian Amazon Forest by Satellite 910
(Prodes Digital)
conducted by the National Institute for Space Research (Instituto Nacional de Pesquisas Espaciais
- INPE) according to the Plan for Prevention and Control of Deforestation in the Amazon
1112(PPCDAm) under the National Policy on Prevention and Control of Deforestation Such
information is available online in13
digital vector files for the public in general
Other tools will provide complementary information to the monitoring such as indicators of forest
degradation and hotspots (fires and wildfires) obtained from DETER 14
SAD 15
and PROARCO16
Information is available online for free in vector format These results will be systematically related
to field data for validating or disproving the occurred event so that the focuses of deforestation and
degradation can be identified remediated reported and consequently avoided as much as
possible
A surveillance system that allows permanent territorial monitoring and inhibits the entry of intruders
through entry points in the PA will also be deployed to control the transport flow In addition one
must investigate and identify risks and threats eg mapping hotspots and areas vulnerable to fire
to illegal logging to hunting and poaching and to invasions by third parties among others
At first we estimate an effective demand for structuring the electronic monitoring system which
includes the hiring of skilled professionals field equipment electronic equipment (digital cameras
GPS desktops and notebooks smartphones printers geoprocessing software and GIS among
others) vehicles andor motorcycles motorized boats for transportation and moving around and
the collection of high resolution satellite images Empowerment and training of all involved staff
9httpwwwobtinpebrprodesdigitalmetodologiahtml
10httpwwwobtinpebrprodesmetodologiapdf 11httpwwwmmagovbrflorestascontrole-e-prevenC3A7C3A3o-do-desmatamento 12httpwwwmmagovbrimagesarquivo80120PPCDAm_FINAL_PPCDAMPDF 13httpwwwobtinpebrprodesindexhtml 14httpwwwobtinpebrdeterdados 15httpwwwimazongeoorgbrdocdownloadsphp 16httpwwwdpiinpebrproarcobdqueimadas
MONITORING amp IMPLEMENTATION REPORT VCS Version 3 CCB Standards Third Edition
v30 36
and the surrounding communities will be necessary to make the system effective17
and a constant
stream of information directed to regional actors and other stakeholders
Strategic monitoring and access points to RPDS roads will also provide support to other MPs
including social and biodiversity conservation aspects especially in the logistic support of planned
field activities
Procedures for determining the permanent sample plots (PSPs) and measurement
The calculation of the stock and increase in forest biomass will be subsidized through the
installation of PSPs in the PA and its temporal monitoring through the Continuous Forest Inventory
(CFI) The methodology proposed by VCS (2011) suggests the use of permanent andor temporary
plots however it confirms the efficiency and accuracy of sample plots
In order to demonstrate the procedural and statistical rigor used all the sampling procedures the
PA forest stratification sampling design calculation of sampling intensity and other parameters
measured in PSPs to monitor biomass balance due to ingressmortality of individuals growth in
DBH and height will be presented in detail in the Annex (Annex 23 - Forest Inventory 2016)
To promote reliable forest biomass estimates standard operating procedures (SOPs) (Section 82)
will be used by the team executing the CFI
Monitoring frequency
The monitoring frequency parameters measured in the PSPs will be no greater than 5 years from
the first measurement Other relevant parameters to monitoring the PSPs like the change in land
use in the PA and surrounding areas such as deforestation forest degradation fire sources and
natural disturbances will be regularly monitored as a project routine operation organized and
archived annually
411 Monitoring Impacts to Biodiversity
Since animal inventories have not been conducted in Amazon Rio project areas (for this project
biological information for the Rio Amapaacute RDS management plan were used) a biodiversity
monitoring system that will follow the RAPELD methodology (Rapid surveys of various taxonomic
groups (RAP) for long-term ecological studies) (MAGNUSSON et al 2005)
The RAPELD method contributes to long-term research using rapid inventory assessments biotic
complementarity and land use planning in the Amazon This method increases adequate sampling
17Linking community monitoring to national Measurement Reporting and Verification for REDD+
MONITORING amp IMPLEMENTATION REPORT VCS Version 3 CCB Standards Third Edition
v30 37
probability of biologically diverse communities which require large areas and at the same time
minimize variation of abiotic factors that affect these communities with smaller areas sampling
Evaluation and selection of indicators will be conducted in accordance with the ProBUC model
however applicably to local reality results will be updated biennially from the first survey
Biodiversity indicators are being designed and planned as suggested in the Social and
Environmental Monitoring System of Protected Areas in the Brazilian Amazon (Sistema de
Monitoramento Socioambiental das Unidades de Conservaccedilatildeo da Amazocircnia Brasileira)1819
and
Methodology for Rapid Assessment and Prioritization of Protected Areas Management20
(Metodologia para Avaliaccedilatildeo Raacutepida e Priorizaccedilatildeo do Manejo de Unidades de Conservaccedilatildeo -
RAPPAM) in line with the experiences gained and disseminated by CEUC and ICMBIO previously
described
The empowerment accountability and shared management of biodiversity conservation is the
main focus of the methodological model adopted These actions create high expectations for
environmental management of the area as the biodiversity monitoring will be conducted by the
community members themselves along with the project proponent promoting a local multiplier
effect It is worth mentioning that strict compliance with these procedures is in within EBCF`s
interest since it considers them to be key to the success of the project
The project begins with the premise that any negative impact on biodiversity in the project area
and its surroundings will not occur In the opposite sense the project aims to generate and provide
greater understanding of the territory subsidizing proposals for the conservation and sustainable
use through adoption of good management practices of natural resources as well as its replication
in other locations
412 Monitoring Social Impacts
The monitoring of social aspects include both the collection of numerical data such as quantity
volume weight (quantitative indicators) as well as information expressing opinions and
experiences (qualitative indicators) remembering that such measures are compatible and
interchangeable Data collection should be systematic and have a pre-established rate and most
likely a single indicator will require several data collection instruments such as plans field records
reports etc
Social information will be monitored through the use of participatory methodologies In this sense
the preparation process of the Amazon Rio I RPDS Management Plan was a first step For the
18Indicator Design 19Social and Environmental Monitoring of Protected Areas System in the Brazilian Amazon (Sistema de Monitoramento
Socioambiental das Unidades de Conservaccedilatildeo da Amazocircnia Brasileira) 20Metodologia para Avaliaccedilatildeo Raacutepida e a Priorizaccedilatildeo do Manejo de Unidades de Conservaccedilatildeo (RAPPAM)
MONITORING amp IMPLEMENTATION REPORT VCS Version 3 CCB Standards Third Edition
v30 38
socioeconomic characteristics of communities several community meetings land use mapping
workshops and interviews with focus groups were held in addition to field visits (Annex 10) The
main activities of the project were presented and discussed in these events emphasizing the
importance and timeliness of local valuation of environmental services as well as strategies for
raising funds to implement other projects and improvements in social well-being of communities
around the PA
5 MEASUREMENT OF GHG EMISSIONS REDUCTIONS AND REMOVALS (CLIMATE)
51 Emissions Baseline
EBCF did not carry out any wood related exploration activity in the areas since the beginning of
the REDD+ project Thus it is confirmed estimated emission reductions for the project as
8678833 t CO2eq t year
52 Project emissions
Project emissions were primarily those related to the running of offices and necessary travels for
studies meetings presentations workshops and other activities Table 10 presents a summary of
emissions based on data from Annex 21 of this report
Table 05 - 2011-2016 Project Activity Emissions
YEAR Energy
(KWh)
Energy
(t CO2eq)
Travels
(Km)
Travels
(t CO2eq)
Total
(t CO2eq)
2010
678 024 024
2011
104010 2360 2360
2012 1149 008 55724 1573 1581
2013 2756 028 236749 5429 5457
2014 2498 025 15789 459 484
2015 2231 023 27340 597 620
2016 1015 010
010
093 440290 10443 10536
53 Leakage
Not applicable according to presentation made on the REDD+ IFM document
MONITORING amp IMPLEMENTATION REPORT VCS Version 3 CCB Standards Third Edition
v30 39
54 Summary of GHG Emission Reductions And Removals
EBCF REDD+ project shows emissions reduction of 34397563 tCO2e as the balance in the
period of 2011-2015 Table 06 shows the overview of the dynamics of reductions and project
emissions up to 2048 By the year 2015 the emissions data is posted as seen in reports and from
2016 data are projects as previous average and should be adjusted as a result of future reports
Table 06 - Summary of ex ante estimates
Year
Estimated
reductions
from
baseline21
(tCO2e)
Project
Estimated
emissions 22
tCO2e)
Unplanned
estimate
Emissions23
(tCO2e)
Net GHG
Estimated
emissions
Reduction
(tCO2e)
2012 8675500 1581 0 8673919
2013 8675500 5457 0 8670043
2014 8675500 484 296296 8378720
2015 8675500 620 0 8674880
2016 8675500 2100 0 8673400
2017 8675500 2100 0 8673400
2018 8675500 2100 0 8673400
2019 8675500 2100 0 8673400
2020 8675500 2100 0 8673400
2030 8675500 2100 0 8673400
2048 8675500 2100 0 8673400
Total 3123180 25203 296296 3119989
55 Climate Change Adaptation Benefits (GL1)
There is a relatively widespread understanding in the scientific community that balanced
ecosystems have greater ecological and social resilience and adaptability to climate change
21
See annex 18 22
See annex 21 23
See annex 24- HDOM (Study on deforestation and heat spots for EBCF REDD+ Project technical report)
MONITORING amp IMPLEMENTATION REPORT VCS Version 3 CCB Standards Third Edition
v30 40
whether through protection of water bodies and regulation of river flows during peak flood and
drought or through the regular supply of environmental services products and services
Thus once the project is designed to conserve an area of native forest which in the absence of
the project scenario would remain subject to the pressure of timber management (baseline) and
consequent degradation resulting from such activities it is understood that the mere protection of
these areas alone would offer communities and the ecosystem itself better adaptability compared
to the baseline scenario
Moreover the project has an Activity Management Plan (Annex 9) which details among other
initiatives the promotion of the sustainable use of ecosystem resources through direct support in
some activities related to income generation and conservation along with community training It is
believed that in addition to ensuring a more balanced (and therefore more resilient) environment
the project will expand the options for generating income among the communities making them
more resilient and preparing them to face the greater and already perceived challenges posed by
climate change
6 COMMUNITY
61 Positive Impacts for Communities (CM1)
EBCFrsquos REDD+ project was first presented to the riverine communities in 2011 By then
communities were informed about the cessation of all timber exploration activities due to the
REDD+ project and discussions were held regarding biodiversity conservation and the sustainable
use of forest products and services as well the social development of the surrounding
communities Briefly the positive impacts along the communities were
1 Project area zoning and its surroundings
2 Contribution to building local capacity
3 Contribution to developing sustainable business in the region
4 Contribution to social and environmental diagnosis
Knowing to manage
To evaluate the progress of these initiatives throughout the development of the project we used
the methodology of the Sustainability Matrix developed by the Secretariat of Environment and
MONITORING amp IMPLEMENTATION REPORT VCS Version 3 CCB Standards Third Edition
v30 41
Sustainable Development of Amazonas State This tool was applied in 15 communities taking into
account local socio-economic aspects that underlie the development of 20 parameters considered
of great importance to community development described by specific indicators As a visual tool
the Sustainability Matrix is quite suitable for traditional populations such as the riverside and
indigenous communities surrounding the Reserve Amazon River I and other areas of the Project
Additionally the Matrix provides interesting spaces for discussion since its construction is done
collectively Through the Sustainability Matrix it was possible to identify along with the
communities projects activities and implementation strategies Budgets and monitoring and
evaluation of these projects will be detailed later through the Annual Operational Plans to be
developed and followed up in the due course Four programs and nine subprograms were defined
for management and community development (Annex 9)
62 Negative Impacts (CM2)
No negative impacts have been recorded or identified as a result of the project with stakeholders
7 BIODIVERSITY
71 Positive Impacts for Biodiversity (B1)
The benefits for biodiversity are in reducing deforestation and degradation (selective logging) in the
project area According to satellite images analysis in the project areas and their surroundings it
was observed that until 2010 300 hectares were deforested After the implementation of the
project community awareness on the importance of preservation and conservation of forests have
encouraged no deforestation degradation and a significant reduction in deforestation was
identified (see graph below) This was due to the good understanding of the projects conservation
objectives and by the involvement and support of the surrounding communities
MONITORING amp IMPLEMENTATION REPORT VCS Version 3 CCB Standards Third Edition
v30 42
Figure 10 - EBCF REDD Project and buffer areas deforestation figures (source HDOM Report)
The consequences of deforestation and degradation on biodiversity are well known Thus the fact
of not being identified changes (natural or anthropogenic) in forest areas shows there was no loss
of biodiversity no reduction in floristic diversity no impact on the dynamics of fauna and flora and
no loss of evolutionary genetic information
72 Negative Impacts on Biodiversity (B2)
There are no negative impacts on biodiversity as a result of the project
73 Exceptional Benefits for Biodiversity (GL3)
The description of exceptional benefits for biodiversity will only be possible after the re-
measurement of permanent plots (FLORA)
8 ADICIONAL INFORMATION
All activities and the consequent reduction in deforestation and degradation in and around the
project areas were maintained and funded without resources of carbon credits We understand that
with the advance of REDD+ project EBCF will have much better conditions to implement positive
actions in partnership with communities
MONITORING amp IMPLEMENTATION REPORT VCS Version 3 CCB Standards Third Edition
v30 43
REFERENCES
ADEODATO S etal Madeira de ponta a ponta o caminho da floresta ateacute o consumo Satildeo Paulo
FGV-RAE 2011
ALBAGLI S Amazocircnia fronteira geopoliacutetica da biodiversidade Revista Parcerias Estrateacutegicas n
12 p6 set2001 Centro de Estudos Estrateacutegicos do Ministeacuterio da Ciecircncia e Tecnologia
AMARAL I C Viabilidade de plantio de cafeacute na zona da mata mineira Revista Poliacutetica Agriacutecola
Ano xx n4 outnovdez 2011 Disponiacutevel em
httpwwwalicecnptiaembrapabrbitstreamdoc9309031Viabilidadedeplantiopdf Acesso
em 17 de set 2013
AMARAL P etal Floresta para Sempre um manual para a produccedilatildeo de madeira na Amazocircnia
Beleacutem IMAZON 1998 130p
AMAZONAS Lei Complementar nordm 532007 de 05062007 REGULAMENTA o inciso V do artigo
230 e o sect 1ordm do artigo 231 da Constituiccedilatildeo Estadual institui o SISTEMA ESTADUAL DE
UNIDADES DE CONSERVACcedilAtildeO - SEUC dispondo sobre infraccedilotildees e penalidades e
estabelecendo outras providecircncias Disponiacutevel em
httpwwwcetesbspgovbruserfilesfilemudancasclimaticasproclimafilelegislacaoestadua
lamazonasleilei_complementar_n_53_2007_amazonaspdf Acessado em Setembro 2013
ANTAQ Anuaacuterio Estatiacutestico 2004 Distacircncia entre os portos Disponiacutevel em
httpwwwantaqgovbrportalanuariosportuario2004TabelasDistanciaEntrePortospdf
Acesso em 23 de out 2013
ANTAQ Panorama Aquaviaacuterio Agecircncia Nacional de Transportes Aquaviaacuterios Volume 3 Brasiacutelia
ndash DF 2009
MONITORING amp IMPLEMENTATION REPORT VCS Version 3 CCB Standards Third Edition
v30 44
AREDES A F PEREIRA M W G Anaacutelise econocircmica da produccedilatildeo de cafeacute araacutebica um estudo
de caso com simulaccedilotildees de Monte Carlo para sistemas de baixa e alta produtividade
Informaccedilotildees Econocircmicas SP v38 n4 abr 2008
ARIMA E UHL C Pecuaacuteria na Amazocircnia Oriental Desempenho Atual e Perspectivas Futuras Seacuterie
Amazocircnia n1 Beleacutem IMAZON 1996 40p
BACCINI A et al Estimated carbon dioxide emissions from tropical deforestation improved by
carbon-density maps Nature Climate Change vol2 march 2012 (LETTERS Published
Online - DOI 101038NCLIMATE1354)
BARROS A C UHL C Padrotildees problemas e potencial da extraccedilatildeo madeireira ao longo do Rio
Amazonas e do seu estuaacuterio Seacuterie Amazocircnia n4 Beleacutem IMAZON 1997 42p
BRASIL Lei 121872009 (Lei Ordinaacuteria) 29122009 Institui a Poliacutetica Nacional sobre Mudanccedila
do Clima - PNMC e daacute outras Providecircncias Presidecircncia da Repuacuteblica Casa Civil Subchefia
para Assuntos Juriacutedicos Disponiacutevel em lthttpswwwplanaltogovbrccivil_03_ato2007-
20102009leil12187htmgt Acesso em 20 de set 2013
CAMPOS E F Emissatildeo de CO2 da madeira serrada da Amazocircnia o caso da exploraccedilatildeo
convencional 2012 172p Dissertaccedilatildeo - Escola Politeacutecnica Universidade de Satildeo Paulo Satildeo
Paulo
CARDOSO RS e FREITAS C E C A pesca de pequena escala no rio Madeira pelos
desembarques ocorridos em Manicoreacute (Estado do Amazonas) Brasil Revista Acta
Amazocircnica vol 38(4) 2008 781 ndash 788
CCBA Climate Community and Biodiversity Alliance-CCBA 2008 Disponiacutevel em
httpwwwclimate-standardsorgccb-standards Acesso em 03 de set 2013
MONITORING amp IMPLEMENTATION REPORT VCS Version 3 CCB Standards Third Edition
v30 45
CEPEA Centro de Estudos Avanccedilados em Economia Aplicada - ESALQUSP Economia da
pecuaacuteria de corte na regiatildeo norte do Brasil Disponiacutevel em httpgooglL2roiA Acesso em
15 de out 2013
CHAMBERS J Q et al Decomposition and carbon cycling of dead trees in tropical forests of the
central Amazon Oecologia vol122 pp380-388 2000 Agricultores se queixam de
burocracia para contratar creacutedito sustentaacutevel do Programa ABC Correio Braziliense Brasiacutelia
26 fev 2012 Disponiacutevel em
lthttpwww2correiobraziliensecombrsersustentavelp=4592gt Acesso em 10 set 2013
CULLEN Jr L VALLADARES-PAacuteDUA C Onccedilas como detetives da paisagem Ciecircncia Hoje
Vol 156 n26 pp54-571999
CPRM - Serviccedilo Geoloacutegico do Brasil Disponiacutevel em httpwwwcprmgovbr Acesso em 13 de
mar 2013
DIAS F M MORAIS S J S REZENDE R C Anaacutelise da viabilidade econocircmica para a
produccedilatildeo de melancia e cenoura com financiamento em Anaacutepolis-GO 2008 Disponiacutevel em
httpwwwprpuegbr06v1conteudopesquisainiccieneventossic2008fronteiraflashsicani
macaoIIIJORNADAarquivosresumosresumo01pdfgt Acesso em 18 de nov2013
Divisatildeo de Precessamento de Imagens (DPI) Ambdata Mapa de Vegetaccedilatildeo SIPAM RADAM
2002 Disponiacutevel em httpwwwdpiinpebrAmbdatamapa_sipamphp Acesso em 21 de
out 2013
DOMINGUES MS BERNMANN C O arco de desflorestamento na Amazocircnia da pecuaacuteria agrave
soja Ambiente amp Sociedade Satildeo Paulo vol15 n2 pp1-22 maioago 2012
MONITORING amp IMPLEMENTATION REPORT VCS Version 3 CCB Standards Third Edition
v30 46
EBCF Criaccedilatildeo da primeira reserva particular de desenvolvimento sustentaacutevel do mundo na
floresta amazocircnica Disponiacutevel emlthttpwwwebcfcombrblog20130624criacao-da-
primeira-reserva-particular-de-desenvolvimento-sustentavel-do-mundo-na-floresta-
amazonicagt Acesso em 21 de set 2013
EMBRAPA Sistema Brasileiro de Classificaccedilatildeo de Solos 2ordf Ed Rio de Janeiro Embrapa Solos
2006 306 p
FELDPAUSCH T R et al When big trees fall Damage and carbon export by reduced impact
logging in southern Amazonia Forest Ecology and Management Vol 219 pp199-215 2005
FEARNSIDE P MDesmatamento na Amazocircnia dinacircmica impactos e controle Acta Amazocircnica
vol 36 n3 pp 395-400 2006
FILGUEIRAS T S et al 1994 Caminhamento Um meacutetodo expedito para levantamentos
floriacutesticos qualitativos Caderno de Geociecircncia IBGE vol12 pp39-43 1994
Forest Management Public Summary for Gethal Amazonas SA Induacutestria de Madeira
Compensada Certification Code SW-FMCOC-119 Date of Certification October 1
2000 Date of Public Summary October 2000 Updated for Annual Audit 2002 Annual Audit
2003 (Gethalpdf)
Globo Rural Linha de financiamento para a agricultura de baixo carbono tem pouca procura
2011 Disponiacutevel em httpwwwrainforest-allianceorgforestrydocumentsgethalpdf
Acesso em 16 de nov 2013
GREENPEACE Face a Face com a Destruiccedilatildeo Relatoacuterio Greenpeace sobre as companhias
multinacionais madeireiras na Amazocircnia Brasileira 1999 Disponiacutevel em
MONITORING amp IMPLEMENTATION REPORT VCS Version 3 CCB Standards Third Edition
v30 47
lthttpwwwgreenpeaceorgbramazoniaface_destruicaopdfgt Acesso em 11 de set
2013
Governo do Estado do Amazonas Plano de Gestao da RDS do Rio Amapaacute 2010 Disponiacutevel em
httpobservatoriowwforgbrsite_mediauploadgestaoplanoManejorio_amapapdf Acesso
em 24 de ago 2013
HDOM Estimates from processing the forest inventories data carried out during the CADAF
Project Final Technical Report 2012 Disponiacutevel em wwwhdomcombr Acesso em 27 de
maio 2013
HIGUCHI N 1986-87 Amostragem sistemaacutetica versus amostragem aleatoacuteria em floresta tropical
uacutemida de terra-firme na regiatildeo de Manaus Acta Amazonica 1617 (uacutenico) 393-400
HIGUCHI N SANTOS J JARDIM FCS Tamanho de parcela amostral para inventaacuterios
florestais Acta Amazocircnica vol12 n1 pp91-103 1982
HIGUCHI F G PINTO A C M ISHIZUKA M KAJIMOTO T LIMA A J N SANTOS J
HIGUCHI N Estoque e dinacircmica de biomassa acima do solo das florestas de terra firme do
estado do Amazonas In Adriano Joseacute Nogueira Lima Flaacutevia Machado Durgante Moacir
Alberto Assis Campos Joaquim dos Santos Moriyoshi Ishizuka Niro Higuchi (Org)
Dinacircmica do carbono das florestas da Amazocircnia resultados do Projeto CADAF
1edManaus INPA 2014 v 1 p 29-34
HOLMES T P etal Custos e benefiacutecios financeiros da exploraccedilatildeo de impacto reduzido em
comparaccedilatildeo agrave exploraccedilatildeo florestal convencional na Amazocircnia oriental 2ordf ed Beleacutem
Fundaccedilatildeo Floresta Tropical 2002 66p
HUSCH B MILLER C I BEERS T W Forest mensuration New York Ronald Press 1971
HUSCH B MILLER C I BEERS T W Forest Mensuration New York John Wiley amp Sons
2nd
ed 1972 402 p
MONITORING amp IMPLEMENTATION REPORT VCS Version 3 CCB Standards Third Edition
v30 48
IBGE Instituto Brasileiro de Geografia e Estatiacutestica Diretoria de GeociecircnciasCoordenaccedilatildeo de
Recursos Naturais e Estudos Ambientais Geologia Solos Hidrografia e Vegetaccedilatildeo 2000
IBGE Instituto Brasileiro de Geografia e Estatiacutestica Manicoreacute 2010 Disponiacutevel
emlthttpwwwsidraibgegovbrgt Acesso em 05 de set 2013
IBGE Instituto Brasileiro de Geografia e Estatiacutestica 2011 Disponiacutevel em httpwwwibgegovbr
Acesso em 19 de mar 2013
IBGE Instituto Brasileiro de Geografia e Estatiacutestica Extraccedilatildeo vegetal e silvicultura para o
municiacutepio de Manicoreacute 2011 Disponiacutevel em
lthttpcidadesibgegovbrxtrastemasphplang=ampcodmun=130270ampidtema=102ampsearch=a
mazonas|manicore|extracao-vegetal-e-silvicultura-2011gt Acesso em 10 de out 2013
IBGE Instituto Brasileiro de Geografia e Estatiacutestica Censo Demograacutefico 2010 Disponiacutevel em
lthttpcidadesibgegovbrxtrastemasphpcodmun=130270ampidtema=116gt Acesso em 18
de out 2013
IBGE Instituto Brasileiro de Geografia e Estatiacutestica Censo Demograacutefico 2010 Disponiacutevel
emlthttpcidadesibgegovbrxtrashomephpgt Acesso em 08 de out 2013
IDESAM Reduccedilotildees de Emissotildees do Desmatamento e Degradaccedilatildeo Florestal (REDD+) estudo de
oportunidades para a regiatildeo sul do Amazonas CENAMO M Cl CARRERO G C
GANDOLFO P (Org) Manaus 2011 Disponiacutevel em
lthttpwwwobservatoriodoreddorgbrsitepdfestudodeoportunidadespdfgt Acesso em 13 de
set 2013
MONITORING amp IMPLEMENTATION REPORT VCS Version 3 CCB Standards Third Edition
v30 49
IDESAM Semeando Sustentabilidade em Apuiacute ndash Resultados e Perspectivas 2011 Manaus
Disponivel em lthttpidesamorgbrsemeando-sustentabilidade-em-apui-resultados-e-
perspectivasUxX8nfldWYI
IEA Instituto de Economia Aplicada CO2 Emissions from fuel combustion 2012 Disponiacutevel em
httpwwwieaorgco2highlightsco2highlightspdf Acesso em 09 de out 2013
IGREJA H L S CATIQUE J Anaacutelise neotectocircnica do lineamento de Itacoatiara centro leste do
Estado do Amazonas In Simpoacutesio Nacional de Estudos Tectocircnicos 6 1997 Pirenoacutepolis
Anais Pirenoacutepolis-GO SBG-Nuacutecleo Brasiacutelia1997
IMAZON Instituto do Homem e do Meio Ambiente da Amazocircnia Fatos Florestais 2010a
Disponiacutevel em httpwwwimazonorgbrpublicacoeslivrosfatos-florestais-da-amazonia-
2010-1 Acesso em 14 de out 2013
IMAZOM Instituto do Homem e do Meio Ambiente da Amazocircnia Mercado e preccedilo da madeira
amazocircnica 2010 Disponiacutevel em httpwwwimazonorgbrpublicacoesprecos-de-madeira-
em-toraboletim-de-precos-de-madeira-em-tora-na-amazonia-julho-2010at_downloadfile
Acesso em 23 de nov 2013
IMAZON Instituto do Homem e do Meio Ambiente da Amazocircnia Portal de Geoinformaccedilatildeo sobre
a Amazocircnia Disponiacutevel em lthttpwwwimazongeoorgbrimazongeophpgt Acesso em 06
de set 2013
IMAZON Instituto do Homem e do Meio Ambiente da Amazocircnia Transparecircncia florestal
Amazocircnia Legal 2012 Disponiacutevel em lthttpwwwimazonorgbrpublicacoestransparencia-
florestaltransparencia-florestal-amazonia-legalcopy_of_SADOutubro2012pdfgt Acesso em
23 de set 2013
IMAZON Instituto do Homem e do Meio Ambiente da Amazocircnia PEREIRA D SANTOS D
VEDOVETO M GIMARAtildeES J VERIacuteSSIMO A (Orgs) Fatos Florestais da Amazocircnia
Beleacutem IMAZON 2010 244p Disponiacutevel em
MONITORING amp IMPLEMENTATION REPORT VCS Version 3 CCB Standards Third Edition
v30 50
lthttpwwwimazonorgbrpublicacoeslivrosfatos-florestais-da-amazonia-2010-1gt Acesso
em 24 de set 2013
IMAZON Instituto do Homem e do Meio Ambiente da Amazocircnia A Expansatildeo madeireira na
Amazocircnia Impactos e perspectivas para o desenvolvimento sustentaacutevel no Paraacute BARROS
AC VERIacuteSSIMO A (Eds) Beleacutem IMAZON 2002
IMAZON Instituto do Homem e do Meio Ambiente da Amazocircnia Custos e Benefiacutecios do Manejo
Florestal Para Produccedilatildeo de Madeira na Amazocircnia Oriental 1998 Disponiacutevel em
lthttpwwwimazonorgbrpublicacoesserie-amazoniacustos-e-beneficios-do-manejo-
florestal-para-producao-de-madeira-na-amazonia-orientalgt Acesso em 20 de set 2013
INPE Instituto de Pesquisas Espaciais Banco de dados PRODES 2012 Disponiacutevel em
lthttpwwwdpiinpebrprodesdigitalprodesphpgt Acesso em 09 de set 2013
INPE Instituto de Pesquisas Espaciais Banco de dados DEGRAD 2009 Disponiacutevel em
lthttpwwwobtinpebrdegradgt Acesso em 09 de set 2013
INPE Instituto de Pesquisas Espaciais Banco de dados DETER 2013 Disponiacutevel em
lthttpwwwobtinpebrdetergt Acesso em 10 de set 2013
INPE Instituto de Pesquisas Espaciais Banco de dados de queimadas e focos de calor
BDQUEIMADAS 2013 Disponiacutevel em lthttpwwwdpiinpebrproarcobdqueimadasgt
Acesso em 10 de set 2013
Instituto Carbono Brasil Soacute 2 da produccedilatildeo de madeira eacute certificada O Estado de SPaulo 2006
Disponiacutevel em lthttpwwwinstitutocarbonobrasilorgbrnoticias6noticia=119796gt Acesso
em 26 de set 2013
MONITORING amp IMPLEMENTATION REPORT VCS Version 3 CCB Standards Third Edition
v30 51
IFT Instituto Floresta Tropical Diagnoacutestico do Setor Florestal de Cotriguaccedilu Estado do Mato
Grosso 2010 Disponiacutevel em lthttpgooglEVx2RZgt Acesso em 16 de dez 2013
IPCC Guidelines for National Greenhouse Gas Inventories In National Greenhouse Gas
Inventories Programme EGGLESTON HS BUENDIA L MIWA K NGARA T TANABE
K (Eds) Japan IGES 2006
ITTO Annual review and assessment of the world timber situation 2011 Disponivel em
httpwwwittointannual_review Acesso em 10 de out 2013
KELLER M et al Coarse woody debris in undisturbed and logged forests in the eastern Brazilian
Amazon Global Change Biology vol10 PP784-795 2004
LENTINI M VERISSIMO A PEREIRA D A expansatildeo madeireira na Amazocircnia O Estado da
Amazocircnia n2 2005 Beleacutem IMAZON Disponiacutevel em
httpwwwimazonorgbruploadea_2ppdf Acesso em 06 de set 2013
LOETSCH F ZOumlHRER F HALLER K E Forest Inventory Munich BLV Verlagsgesellschaft
2nd
edition Vol II 1973 469 p
MAGNUSSON WE et al RAPELD uma modificaccedilatildeo do meacutetodo de Gentry para inventaacuterios de
biodiversidade em siacutetios para pesquisa ecoloacutegica de longa duraccedilatildeo Biota Neotrop JulDez
2005 vol 5 no 2 httpwwwbiotaneotropicaorgbrv5n2ptabstractpoint-of-
view+bn01005022005 ISSN 1676-0603
MARINELLI C E et al O programa de monitoramento da biodiversidade da biodiversidade e do
uso de recursos naturais em unidades de conservaccedilatildeo estaduais do Amazonas Secretaria
de Estado do Meio Ambiente e Desenvolvimento Sustentaacutevel - SDS Manaus SDS 2007
MONITORING amp IMPLEMENTATION REPORT VCS Version 3 CCB Standards Third Edition
v30 52
MARINELLI C E MALTEZ M H Indicadores de Sustentabilidade para Unidades de
Conservaccedilatildeo Documento-Siacutentese Workshop Instituto Socioambiental Brasiacutelia-DF 2010
76p
MAZZEI L et al Above-ground biomass dynamics after reduced-impact logging in the Eastern
Amazon Forest Ecology and Management vol 259 pp367-373 2010
MEIRELLES FILHO O Livro de Ouro da Amazocircnia 5ordf Ediccedilatildeo Rio de Janeiro EDIOURO 2007
422p Meirelles Filho J O Livro de Ouro da Amazocircnia 1ordf ed Editora Ediouro ISBN
8500021616 2007 450p
MENGER Juliana da Silva Fatores determinantes da distribuiccedilatildeo de aves no interfluacutevio Purus-
Madeira Manaus [sn] 2011 35 fl il
MCT Arquivos dos Fatores de Emissatildeo Disponiacutevel em
httpwwwmctgovbrindexphpcontentview321144htmlancora Acesso em 23 de out
2013
MMA Ministeacuterio do Meio Ambiente Avaliaccedilatildeo e identificaccedilatildeo de accedilotildees prioritaacuterias para a
conservaccedilatildeo utilizaccedilatildeo sustentaacutevel e reparticcedilatildeo dos benefiacutecios da biodiversidade na
Amazocircnia brasileira Brasiacutelia MMASBF 2001
MMA Ministeacuterio do Meio Ambiente Secretaria de Biodiversidade e Florestas Aacutereas Prioritaacuterias
para Conservaccedilatildeo Uso Sustentaacutevel e Reparticcedilatildeo de Benefiacutecios da Biodiversidade Brasileira
Atualizaccedilatildeo - Portaria MMA ndeg9 de 23 de janeiro de 2007 Brasiacutelia MMA 2007 (Seacuterie
Biodiversidade 31)
MONITORING amp IMPLEMENTATION REPORT VCS Version 3 CCB Standards Third Edition
v30 53
MMA Livro vermelho da fauna brasileira ameaccedilada de extinccedilatildeo editores Angelo Barbosa
Monteiro Machado Glaacuteucia Moreira Drummond Adriano Pereira Paglia 1ed 2008 Brasiacutelia
DF MMA Belo Horizonte MG Fundaccedilatildeo Biodiversitas (1420 p) il - (Biodiversidade 19)
OLIVEIRA M M HIGUCHI N CELES C H HIGUCHI F G 2014 Tamanho e formas de
parcelas para inventaacuterios florestais de espeacutecies arboacutereas na Amazocircnia Central Ciecircncia
Florestal Santa Maria v 24 n 3 p 645-653
PEARSON TRH WALKER S BROWN SL The Source Book for Land Use Land Use
Change and Forestry Projects BioCarbon Fund and Winrock International 2005 64 pp
PORTAL AMAZOcircNIA Amazocircnia de A a Z Disponiacutevel em
lthttpportalamazoniaglobocomgt Acesso em 13 de set 2013
PEacuteLLICO NETTO S BRENA D A Inventaacuterio florestal Curitiba Editorado pelos autores p
316 1997
PROJETO SIVAM Relatoacuterio metodoloacutegico de trabalho Revisatildeo 3 Diretoria de Geociecircncia Rio de
Janeiro 2002 330 pp
PROJETO SIVAM Atualizaccedilatildeo do RADAMBRASIL Mapa de Vegetacao da Amazonia Legal
Mapa de Fitofisionomias ndash RADAMSIPAM DNPM Ministeacuterio de Minas e Energia 2002
Disponiacutevel em httpwwwdpiinpebramb_dataShapefilesveg_Amz_SIPAMzip Acesso
em 21 de jan 2014
PROJETO FLORESTAL SANTA MARIA (PROJETO FSM-REDD) Plant Inteligecircncia Ambiental ndash
Warwick Manfrinato 2012 Disponiacutevel em
lthttpwwwflorestalsantamariacombrsitedocumentos57FSM_REDD_VCS_PD_ptpdfgt
Acesso em 09 de set 2013
MONITORING amp IMPLEMENTATION REPORT VCS Version 3 CCB Standards Third Edition
v30 54
RADAMBRASIL Programa de Integraccedilatildeo Nacional Levantamentos de Recursos Naturais v 14 ndash
RADAM DNPM Ministeacuterio de Minas e Energia Brasil 1974
RIBEIRO J E L et al Flora da Reserva Ducke guia de identificaccedilatildeo das plantas vasculares de
uma floresta de terra firme na Amazocircnia Central Manaus Editora INPA 1999
ROSAS F C W WALDEMARIN H de MATTOS G E Pteronura rasiliensis (Zimmermann
1780) In MACHADO A B M DRUMMOND G M PAGLIA A P (eds) Livro Vermelho da
Fauna Brasileira Ameaccedilada de Extinccedilatildeo Volume II 1ed Brasiacutelia DF Ministeacuterio do Meio
Ambiente 2008 p 800 - 801
ROSS D GHG Emissions Resulting from Aircraft Travel 2009 Disponiacutevel em
httpwwwcarbonplanetcomdownloadsFlight_Calculator_Information_v92pdf Acesso em
14 de out 2013
SANTOS A J et al Viabilidade econocircmica do sistema agroflorestal greviacutelea x cafeacute na regiatildeo
norte do Paranaacute CERNE vol6 n1 pp89-100 2000
SANTOS R A Custo do manejo florestal madeireiro estudo de caso Floresta Estadual do
Antimary Monografia (Bacharelado em Economia) ndash Departamento de Ciecircncias
Econocircmicas Universidade Federal do Acre 2007109p
SABOGAL C et al Manejo Florestal Empresarial na Amazocircnia Brasileira restriccedilotildees e
oportunidades (Relatoacuterio Siacutentese) Beleacutem CIFORIMAZON 2006 72p
SDSCEUC Secretaria Estadual de Meio Ambiente e Desenvolvimento Sustentaacutevel ndash Centro
Estadual de Unidades de Conservaccedilatildeo Programa de Monitoramento de Biodiversidade e
Uso de Recursos Naturais em Aacutereas Protegidas do Estado Amazonas (ProBUC) 2006
Disponiacutevel em
MONITORING amp IMPLEMENTATION REPORT VCS Version 3 CCB Standards Third Edition
v30 55
httpbrazilwcsorgDesktopModulesBring2mindDMXDownloadaspxEntryId=6168ampPortalI
d=93ampDownloadMethod=attachment Acesso em 11 de ago de 2013
SFBIMAZON Serviccedilo Florestal Brasileiro e Instituto do Homem e Meio Ambiente da Amazocircnia A
atividade madeireira na Amazocircnia brasileira produccedilatildeo receita e mercados 2010 Disponiacutevel
em httpwwwmmagovbrestruturassfb_arquivosmiolo_resexec_polo_03_95_1pdf
Acesso em 23 de out 2013
SILVA R P da Alometria estoque e dinacircmica da biomassa de florestas primaacuterias e
secundaacuterias na regiatildeo de Manaus (AM) 152 p Tese de Doutorado Programa Integrado
de Poacutes-graduaccedilatildeo em Biologia Tropical e Recursos Naturais (INPA) Manaus 2007
SILVA Z A G P G SANTOS R A Custo do manejo florestal madeireiro em floresta puacuteblica
estudo de caso no Acre 2011 Disponiacutevel em
lthttpwwwbasacombrbancoamazonia2Revistaedicao_13n13_custo_do_manejo_flores
pdfgt Acesso em 13 de set 2013
SMIDT M GALLAGHER T Factors Affecting Fuel Consumption and Harvesting Costs Auburn
School of Forestry and Wildlife Sciences Sd Disponiacutevel em
httpweb1cnrevteduforestrycofedocuments2013Smidt_Gallagherpdf Acesso em 21
de out 2013
SOARES-FILHO B et al Role of Brazilian Amazon protected areas in climate change mitigation
2010 Columbia University NY Ruth S DeFries 2010
SPF Serviccedilo Puacuteblico Federal DVPF Documento de venda de produto Florestal (Declaraccedilotildees de
venda Gethalpdf) 14 de julho de 2006
MONITORING amp IMPLEMENTATION REPORT VCS Version 3 CCB Standards Third Edition
v30 56
TIMOFEICZYK JUacuteNIOR R et al Rentabilidade econocircmica do manejo de baixo impacto em
florestas tropicais um estudo de caso Revista Floresta Curitiba v 38 n 4 p 711-725
outdez 2008
VCS Ferramenta para Demonstraccedilatildeo e Avaliaccedilatildeo de Adicionalidade para Atividades de Projetos
VCS em Agricultura Floresta e Outros Usos (AFOLU) 2012a Disponiacutevel em httpwwwv-c-
sorgsitesv-c-sorgfilesVT000120VCS20AFOLU20Additionality20Tool20v30pdf
Acesso em 24 de set 2013
VCS Ferramenta de Risco e Natildeo Permanecircncia (AFOLU) 2012B Disponiacutevel em httpv-c-
sorgsitesv-c-sorgfilesAFOLU20Non-Permanence20Risk20Tool2C20v32pdf
Acesso em 13 de set 2013
VCS Approved VCS Methodology VM0010 Version 10 - Methodology for Improved Forest
Management Conversion to Logged to Protected Forest Calculating GHG Benefits from
Preventing Planned Degradation PHUA S SHARMA S TELFER M CHANDLER H
(Eds) Califoacuternia EUA Carbon Planet Limited 2011149p
VERDEJO M E Diagnoacutestico Rural Participativo um guia praacutetico Brasiacutelia MDA 2006 62p
VIANNA A L M Diagnoacutestico Florestal do Estado do Amazonas 2010 e 2011 Manaus-AM
IDESAM 2013 (Relatoacuterio Final do Projeto Fortalecimento da participaccedilatildeo da sociedade civil
no Amazonas Foacuterum de Mudanccedilas Climaacuteticas Transparecircncia Florestal no Estado do
Amazonas ndash Mapeamento de Instrumentos Legislativos no Brasil)
WBCSDWRI The GHG Protocol for Project Accountin Washington World Business Council for
Sustainable DevelopmentWorld Resources Institute 2005148 p
MONITORING amp IMPLEMENTATION REPORT VCS Version 3 CCB Standards Third Edition
v30 57
WALKER W et al Guia de Campo para Estimativa de Biomassa Florestal e Estoque de Carbono
Woods Hole Center Research Falmouth Massachusetts USA 2011 Disponiacutevel em
httpwwwwhrcorgresourcesfieldguidescarbonpdfWHRC_FieldGuide_PortugueseSMpdf
Acesso em 14 de set 2013
WWF Metodologia para Avaliaccedilatildeo Raacutepida e a Priorizaccedilatildeo do Manejo de Unidades de
Conservaccedilatildeo (RAPPAM) 2010 Disponiacutevel em httpgooglXfDnxs Acesso em 30 de set
2013
WWF-Brasil Efetividade de Gestatildeo das Unidades de Conservaccedilatildeo no Estado do Amazonas
Secretaria de Estado do Meio Ambiente e do Desenvolvimento Sustentaacutevel do Amazonas
Instituto Chico Mendes de Conservaccedilatildeo da Biodiversidade Brasiacutelia WWF-Brasil 2011 72 p
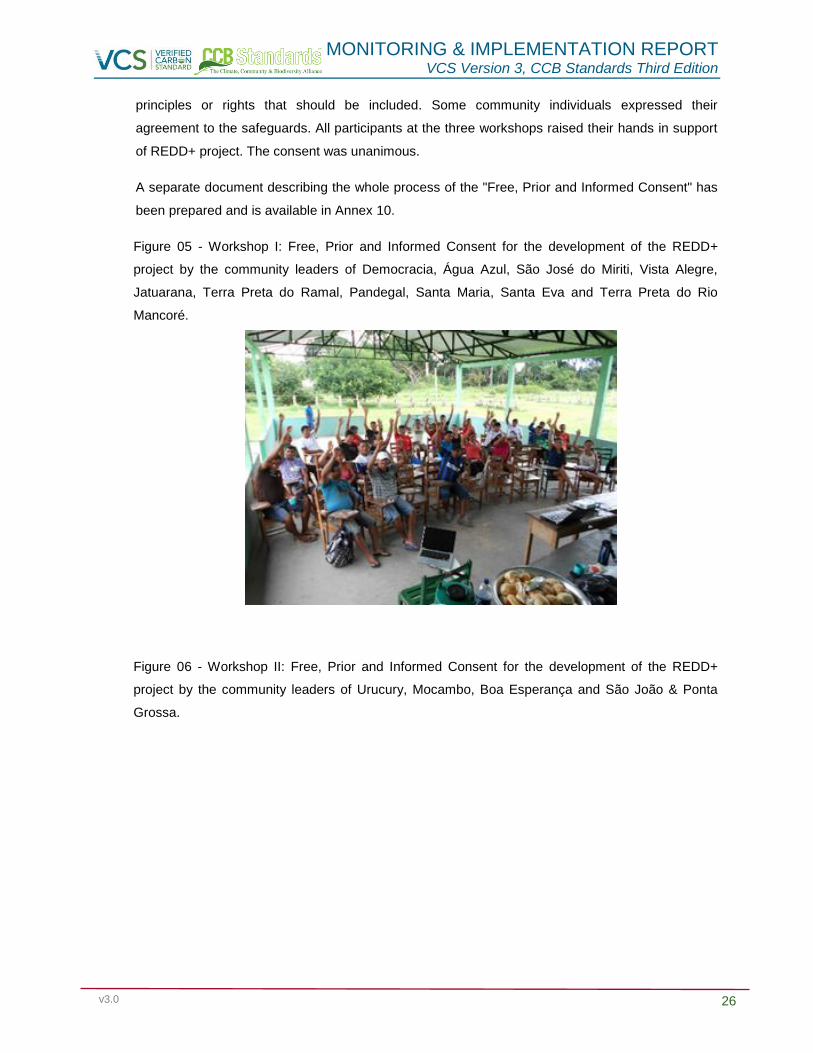
MONITORING amp IMPLEMENTATION REPORT VCS Version 3 CCB Standards Third Edition
v30 26
principles or rights that should be included Some community individuals expressed their
agreement to the safeguards All participants at the three workshops raised their hands in support
of REDD+ project The consent was unanimous
A separate document describing the whole process of the Free Prior and Informed Consent has
been prepared and is available in Annex 10
Figure 05 - Workshop I Free Prior and Informed Consent for the development of the REDD+
project by the community leaders of Democracia Aacutegua Azul Satildeo Joseacute do Miriti Vista Alegre
Jatuarana Terra Preta do Ramal Pandegal Santa Maria Santa Eva and Terra Preta do Rio
Mancoreacute
Figure 06 - Workshop II Free Prior and Informed Consent for the development of the REDD+
project by the community leaders of Urucury Mocambo Boa Esperanccedila and Satildeo Joatildeo amp Ponta
Grossa
MONITORING amp IMPLEMENTATION REPORT VCS Version 3 CCB Standards Third Edition
v30 27
Figure 07 - Workshop III Free Prior and Informed Consent for the development of the REDD+
project by the Kamayuaacute indigenous community
3 APPLICATION OF METHODOLOGY
31 Title and Reference of Methodology
VCS VM0011 Methodology for Improved Forest Management ndash Logged to Protected Forest
(LtPF) Calculating the GHG Benefits from Preventing Planned Degradation version 10
MONITORING amp IMPLEMENTATION REPORT VCS Version 3 CCB Standards Third Edition
v30 28
32 Methodology Deviations
Whereas the VM0011 was developed in a context of homogeneous forests of temperate regions
some methodological adjustments were made related to the direct survey biomass in the field
since the project areas are comprised of very heterogeneous areas of rainforest including dryland
and floodplains Any technical documentation related to these methodological adjustments and
their justifications appear in Annex 23 (Forest Inventory 2016) prepared by the consulting firm
HDOM
33 Project Boundary5
The total area of the property is 20387 ha and a buffer zone was established around each of the
four areas in order to include communities that use the resources within their boundaries (Figure
7a) Project activity areas (for purposes of calculating the emissions reductions called the project
area or PA) are only those for which logging is permitted a total of 19800 ha (Figure 7b)
excluding the Permanent Preservation Areas (APPs) and bodies of water A logging plan has been
approved for this area for selective logging (Annexes 1 2 3 4 6 and 7)
Figure 08 - Project Boundaries a) Direct Project interference limits b) Total Project Area (G1
Indicator 7)
5 Ref section 22 of VM0011
MONITORING amp IMPLEMENTATION REPORT VCS Version 3 CCB Standards Third Edition
v30 29
Stratification of the project area
For purposes of inventorying local carbon stocks and project management the project area was
stratified into 3 groups of different forest types as indicated by the VM0011 according to the
vegetation map SIPAMRADAM (DPI 2002) The forest types present in the area are rain forest
types divided into 3 categories as follows
Dense Primary Tropical Ombrophylous Alluvial Forest
Dense Primary Tropical Ombrophylous Lowland Forest
Pioneer Formations
Figure 09 - Project Area forest types
Leakage areas
There is no direct leakage resulting from planned project activities since there will be neither
displacement of management activities to other areas after the cessation of the activities within the
project area nor market leakages The project Management Plan includes the monitoring of
MONITORING amp IMPLEMENTATION REPORT VCS Version 3 CCB Standards Third Edition
v30 30
possible unanticipated leakages around the project area as well as the need to report to the
competent authorities whenever logging activities are identified in these areas For more
information on leakage see chapters 52 and 55 of this document
Temporal boundaries
Crediting period of the project
The first crediting period of the project is 37 years beginning on August 17 2012 and ending on 17
August 2049 This period is equivalent to the remaining 12 years of the first authorized
management plan (25 years from 1998) added to another 25 years in respect of a new forest
management plan that was intended as the common practice of forestry in Brazil The logging
activities could continue beyond 37 years aiming for a second crediting period
Monitoring and Reporting Period
a) Monitoring of Baseline Emissions
The monitoring of Baseline Emissions must demonstrate that the protected forest area is in
accordance with the one specified in the PD The project limit will be monitored before each
verification throughout the crediting period through new inventory information and remote sensing
and GIS as applicable Thus the project will be able to update the baseline calculations based on
the actual remaining forest area (in case of loss of forest cover by disasters for example) and that
would be subject to forest management under a ldquowithout projectrdquo scenario
b) Monitoring of Project Emissions
Project emissions will be monitored annually and compiled in every monitoring report that will detail
in particular the
Monitoring of possible illegal harvesting of timber
Monitoring of areas subject to natural disturbances
Monitoring and quantification of emissions related to air and land travel related to project
activities
c) Monitoring of Leakage
Since there will be no leakages according to the VM0011 and AFOLU Requirements no leakage
monitoring will be necessary However to be conservative the project intends to monitor any
disturbances that might affect the carbon reservoirs Once some disturbance is registered the
project will report the incident to the relevant authorities and make the necessary adjustments to
MONITORING amp IMPLEMENTATION REPORT VCS Version 3 CCB Standards Third Edition
v30 31
the baseline For more details about the monitoring of leakages see chapters 52 and 55 of this
document
Carbon stocks
The biomass reservoirs considered by the project are related to above-ground and underground
biomass
Sources and sinks of GHGs
Table 02 below describes the emission sources and sinks of greenhouse gases associated with
the baseline activities and with the project
Table 03 - Greenhouse gas emissions sources and sinks associated with baseline and project
activities
Source Gas Included JustificationExplanation
Baselin
e
Biomass
CO2 Yes Main source of project emissions through forest
degradation harvested and commercialised
wood products deadwood and forest regrowth
CH4 No Conservatively excluded
N2O No Conservatively excluded
Other No -
Fossil Fuel
consumption
CO2 Yes Main source through fossil fuel use in
machinery and transportation of timber
CH4 Yes Conservatively included
N2O Yes Conservatively included
Other No -
Electricity
consumption
CO2 Yes Main source
CH4 No -
N2O No -
Other No -
Pro
ject
Biomass
CO2 Yes Main source through unexpected natural
disturbances such as forest fires etc
CH4 Yes Included but subject to significance
N2O Yes Included but subject to significance
MONITORING amp IMPLEMENTATION REPORT VCS Version 3 CCB Standards Third Edition
v30 32
Source Gas Included JustificationExplanation
Other No _
Fossil Fuel
consumption
CO2 Yes Main source through flights and ground travel
CH4 Yes Included but subject to significance
N2O Yes Included but subject to significance
Other No _
Electricity
consumption
CO2 Yes Main source
CH4 No _
N2O No _
Other No _
34 Baseline Scenario
The choice between alternative baseline scenarios was taken together with the analysis of
additionality using the latest version of the VCS Tool for the demonstration and assessment of
additionality in Agriculture Forestry and Other Land Use VCS projects in this case VT000167
(VCS 2012a) All possible scenarios as well as the analysis of methodology barriers (steps 211
and 212 of the VM0011) are present in the chapter below In this sense to avoid redundancy of
information refer to additionality analysis to find the steps 211 and 212 of the VM0011
The baseline scenario for the project identified as the most likely to occur was selective logging8
(continuation of Business As Usual - BAU) The reference scenario assumes 37 years of selective
logging according to the 25 year logging plan approved in August 1998 (Annex 6 - document
ValdII T01 POA 1998) that in the absence of project activities would be renewed in 2024 for
another 25 years until 2049
Under this scenario the full implementation of the timber logging plan occurs and which has
already resulted in the degradation of 434769 ha (see table below) The area would be harvested
selectively for timber sold in lumber markets Below is a summary of harvest areas between 1999
and 2010 showing the managed plots and the dates on which the harvests were authorized
6 Tool for the demonstration and assessment of an additional to the VCS project activities in Agriculture Forestry and Other
Uses (AFOLU) (V 30)
7 Adapted from ldquoTool for the Demonstration and Assessment of Additionality in AR CDM project Activitiesrdquo (V02) 8 Additional information about choosing the baseline are presented in section 46 (steps 1 and 2)
MONITORING amp IMPLEMENTATION REPORT VCS Version 3 CCB Standards Third Edition
v30 33
Table 04 - Summary of areas managed since 1999
Date Managed logged area (ha)
1999 58669 (Plot 1)
2000 688 (Plot 2)
2001 ndash 2002 8315 (Plot 3)
2003 ndash 2004 750 (Plots 3 and 4)
2005 ndash 2007 1082 (Plot 5)
2008 ndash 2009 49050 (Plots 5 and 6)
TOTAL 434769
35 Additionality
The additionality analysis of the Amazon Rio project REDD+ IFM was conducted with the latest
version of the VCS Tool for the demonstration and assessment of additionality in Agriculture
Forestry and Other Land Use VCS projects the VT000167
(VCS 2012a)
To generate the reductions in GHG emissions for the project the planned baseline activities
(sustainable forest management) were terminated by the project proponent and supplanted by
environmental conservation activities In this sense the project will be managed by EBCF with
the goal of creating a fund for administrative and accounting management especially to promote
environmental management and monitoring activities of carbon pools within the project area
Alternative activities planned in the project are the provisioning and valuation of environmental
services via carbon credits (VCUs) in conjunction with the sale of Environmental Reserve Quotas
(CRAs)
4 MONITORING AND PARAMETERS OF DATA
41 Monitoring Plan Description
Due to its innovative comprehensive and integrative character the project needs to be monitored
regularly so that its actions activities and impacts can be constantly measured and evaluated To
meet this requirement the monitoring process must meet three main objectives
MONITORING amp IMPLEMENTATION REPORT VCS Version 3 CCB Standards Third Edition
v30 34
i To serve as an internal management project tool
ii To collaborate as an instrument of collective learning from the communities and
social groups directly involved
iii To work as a means of communicating results and impacts to interested institutions
and society in general Furthermore it is important to consider that monitoring if
successful will transcend the managerial aspects of the project and strengthening
the plan
To facilitate the monitoring process instead of having a reference line (to compare interventions
before and after) the first year of monitoring will serve as the starting point whose information will
be regularly and systematically compared throughout the project
Next the initial plans for monitoring benefits to the climate community and biodiversity are
described wherein the community is committed to participatory precept and to the technical and
scientific rigor which is capable of following the possible negative and positive impacts on
environmental and social aspects in the project area and its surroundings
Monitoring of Climate Impacts
The Monitoring Plan (MP) aims to provide security in the periodic estimates of reduction in
emissions especially in monitoring changes in carbon stock Therefore emissions from the
implementation of the project ex post estimates of the activities and emissions from any leakages
and isolated disturbances (eg blowdown fires pests and diseases among others) can be
calculated
The construction of the PM of the climate benefits made in full compliance with the methodological
framework provided by VM0011 ndash IFM LPF (VCS 2011) and CCBA (2008) which consists of four
specific actions to be monitored
i Implementation and execution of the project
ii Dynamics and stock of the forest biomass
iii Deforestation and forest degradation
iv Periodic reviews of ex post emissions
Remote monitoring and surveillance of the project area
Measurement of alterations and biomass loss quantification present in the PA using land use
change detection is critical to make accurate estimates of GHG emissions that account for forest
biomass increases and losses
MONITORING amp IMPLEMENTATION REPORT VCS Version 3 CCB Standards Third Edition
v30 35
Thus the use of remote sensing by satellite images of medium spatial resolution can be applied
readily in the PA and surroundings in order to monitor land use dynamics over time particularly to
identify risks and threats to forested areas In situ verification will complement landscape analysis
in a GIS environment with the aim of quantifying spatializing and identifying conversion of forest
areas into other land uses environmental degradation and other possible changes that may occur
during the term of the project
As a complementary monitoring source the project will rely on the database and information
provided by Monitoring Program of the Brazilian Amazon Forest by Satellite 910
(Prodes Digital)
conducted by the National Institute for Space Research (Instituto Nacional de Pesquisas Espaciais
- INPE) according to the Plan for Prevention and Control of Deforestation in the Amazon
1112(PPCDAm) under the National Policy on Prevention and Control of Deforestation Such
information is available online in13
digital vector files for the public in general
Other tools will provide complementary information to the monitoring such as indicators of forest
degradation and hotspots (fires and wildfires) obtained from DETER 14
SAD 15
and PROARCO16
Information is available online for free in vector format These results will be systematically related
to field data for validating or disproving the occurred event so that the focuses of deforestation and
degradation can be identified remediated reported and consequently avoided as much as
possible
A surveillance system that allows permanent territorial monitoring and inhibits the entry of intruders
through entry points in the PA will also be deployed to control the transport flow In addition one
must investigate and identify risks and threats eg mapping hotspots and areas vulnerable to fire
to illegal logging to hunting and poaching and to invasions by third parties among others
At first we estimate an effective demand for structuring the electronic monitoring system which
includes the hiring of skilled professionals field equipment electronic equipment (digital cameras
GPS desktops and notebooks smartphones printers geoprocessing software and GIS among
others) vehicles andor motorcycles motorized boats for transportation and moving around and
the collection of high resolution satellite images Empowerment and training of all involved staff
9httpwwwobtinpebrprodesdigitalmetodologiahtml
10httpwwwobtinpebrprodesmetodologiapdf 11httpwwwmmagovbrflorestascontrole-e-prevenC3A7C3A3o-do-desmatamento 12httpwwwmmagovbrimagesarquivo80120PPCDAm_FINAL_PPCDAMPDF 13httpwwwobtinpebrprodesindexhtml 14httpwwwobtinpebrdeterdados 15httpwwwimazongeoorgbrdocdownloadsphp 16httpwwwdpiinpebrproarcobdqueimadas
MONITORING amp IMPLEMENTATION REPORT VCS Version 3 CCB Standards Third Edition
v30 36
and the surrounding communities will be necessary to make the system effective17
and a constant
stream of information directed to regional actors and other stakeholders
Strategic monitoring and access points to RPDS roads will also provide support to other MPs
including social and biodiversity conservation aspects especially in the logistic support of planned
field activities
Procedures for determining the permanent sample plots (PSPs) and measurement
The calculation of the stock and increase in forest biomass will be subsidized through the
installation of PSPs in the PA and its temporal monitoring through the Continuous Forest Inventory
(CFI) The methodology proposed by VCS (2011) suggests the use of permanent andor temporary
plots however it confirms the efficiency and accuracy of sample plots
In order to demonstrate the procedural and statistical rigor used all the sampling procedures the
PA forest stratification sampling design calculation of sampling intensity and other parameters
measured in PSPs to monitor biomass balance due to ingressmortality of individuals growth in
DBH and height will be presented in detail in the Annex (Annex 23 - Forest Inventory 2016)
To promote reliable forest biomass estimates standard operating procedures (SOPs) (Section 82)
will be used by the team executing the CFI
Monitoring frequency
The monitoring frequency parameters measured in the PSPs will be no greater than 5 years from
the first measurement Other relevant parameters to monitoring the PSPs like the change in land
use in the PA and surrounding areas such as deforestation forest degradation fire sources and
natural disturbances will be regularly monitored as a project routine operation organized and
archived annually
411 Monitoring Impacts to Biodiversity
Since animal inventories have not been conducted in Amazon Rio project areas (for this project
biological information for the Rio Amapaacute RDS management plan were used) a biodiversity
monitoring system that will follow the RAPELD methodology (Rapid surveys of various taxonomic
groups (RAP) for long-term ecological studies) (MAGNUSSON et al 2005)
The RAPELD method contributes to long-term research using rapid inventory assessments biotic
complementarity and land use planning in the Amazon This method increases adequate sampling
17Linking community monitoring to national Measurement Reporting and Verification for REDD+
MONITORING amp IMPLEMENTATION REPORT VCS Version 3 CCB Standards Third Edition
v30 37
probability of biologically diverse communities which require large areas and at the same time
minimize variation of abiotic factors that affect these communities with smaller areas sampling
Evaluation and selection of indicators will be conducted in accordance with the ProBUC model
however applicably to local reality results will be updated biennially from the first survey
Biodiversity indicators are being designed and planned as suggested in the Social and
Environmental Monitoring System of Protected Areas in the Brazilian Amazon (Sistema de
Monitoramento Socioambiental das Unidades de Conservaccedilatildeo da Amazocircnia Brasileira)1819
and
Methodology for Rapid Assessment and Prioritization of Protected Areas Management20
(Metodologia para Avaliaccedilatildeo Raacutepida e Priorizaccedilatildeo do Manejo de Unidades de Conservaccedilatildeo -
RAPPAM) in line with the experiences gained and disseminated by CEUC and ICMBIO previously
described
The empowerment accountability and shared management of biodiversity conservation is the
main focus of the methodological model adopted These actions create high expectations for
environmental management of the area as the biodiversity monitoring will be conducted by the
community members themselves along with the project proponent promoting a local multiplier
effect It is worth mentioning that strict compliance with these procedures is in within EBCF`s
interest since it considers them to be key to the success of the project
The project begins with the premise that any negative impact on biodiversity in the project area
and its surroundings will not occur In the opposite sense the project aims to generate and provide
greater understanding of the territory subsidizing proposals for the conservation and sustainable
use through adoption of good management practices of natural resources as well as its replication
in other locations
412 Monitoring Social Impacts
The monitoring of social aspects include both the collection of numerical data such as quantity
volume weight (quantitative indicators) as well as information expressing opinions and
experiences (qualitative indicators) remembering that such measures are compatible and
interchangeable Data collection should be systematic and have a pre-established rate and most
likely a single indicator will require several data collection instruments such as plans field records
reports etc
Social information will be monitored through the use of participatory methodologies In this sense
the preparation process of the Amazon Rio I RPDS Management Plan was a first step For the
18Indicator Design 19Social and Environmental Monitoring of Protected Areas System in the Brazilian Amazon (Sistema de Monitoramento
Socioambiental das Unidades de Conservaccedilatildeo da Amazocircnia Brasileira) 20Metodologia para Avaliaccedilatildeo Raacutepida e a Priorizaccedilatildeo do Manejo de Unidades de Conservaccedilatildeo (RAPPAM)
MONITORING amp IMPLEMENTATION REPORT VCS Version 3 CCB Standards Third Edition
v30 38
socioeconomic characteristics of communities several community meetings land use mapping
workshops and interviews with focus groups were held in addition to field visits (Annex 10) The
main activities of the project were presented and discussed in these events emphasizing the
importance and timeliness of local valuation of environmental services as well as strategies for
raising funds to implement other projects and improvements in social well-being of communities
around the PA
5 MEASUREMENT OF GHG EMISSIONS REDUCTIONS AND REMOVALS (CLIMATE)
51 Emissions Baseline
EBCF did not carry out any wood related exploration activity in the areas since the beginning of
the REDD+ project Thus it is confirmed estimated emission reductions for the project as
8678833 t CO2eq t year
52 Project emissions
Project emissions were primarily those related to the running of offices and necessary travels for
studies meetings presentations workshops and other activities Table 10 presents a summary of
emissions based on data from Annex 21 of this report
Table 05 - 2011-2016 Project Activity Emissions
YEAR Energy
(KWh)
Energy
(t CO2eq)
Travels
(Km)
Travels
(t CO2eq)
Total
(t CO2eq)
2010
678 024 024
2011
104010 2360 2360
2012 1149 008 55724 1573 1581
2013 2756 028 236749 5429 5457
2014 2498 025 15789 459 484
2015 2231 023 27340 597 620
2016 1015 010
010
093 440290 10443 10536
53 Leakage
Not applicable according to presentation made on the REDD+ IFM document
MONITORING amp IMPLEMENTATION REPORT VCS Version 3 CCB Standards Third Edition
v30 39
54 Summary of GHG Emission Reductions And Removals
EBCF REDD+ project shows emissions reduction of 34397563 tCO2e as the balance in the
period of 2011-2015 Table 06 shows the overview of the dynamics of reductions and project
emissions up to 2048 By the year 2015 the emissions data is posted as seen in reports and from
2016 data are projects as previous average and should be adjusted as a result of future reports
Table 06 - Summary of ex ante estimates
Year
Estimated
reductions
from
baseline21
(tCO2e)
Project
Estimated
emissions 22
tCO2e)
Unplanned
estimate
Emissions23
(tCO2e)
Net GHG
Estimated
emissions
Reduction
(tCO2e)
2012 8675500 1581 0 8673919
2013 8675500 5457 0 8670043
2014 8675500 484 296296 8378720
2015 8675500 620 0 8674880
2016 8675500 2100 0 8673400
2017 8675500 2100 0 8673400
2018 8675500 2100 0 8673400
2019 8675500 2100 0 8673400
2020 8675500 2100 0 8673400
2030 8675500 2100 0 8673400
2048 8675500 2100 0 8673400
Total 3123180 25203 296296 3119989
55 Climate Change Adaptation Benefits (GL1)
There is a relatively widespread understanding in the scientific community that balanced
ecosystems have greater ecological and social resilience and adaptability to climate change
21
See annex 18 22
See annex 21 23
See annex 24- HDOM (Study on deforestation and heat spots for EBCF REDD+ Project technical report)
MONITORING amp IMPLEMENTATION REPORT VCS Version 3 CCB Standards Third Edition
v30 40
whether through protection of water bodies and regulation of river flows during peak flood and
drought or through the regular supply of environmental services products and services
Thus once the project is designed to conserve an area of native forest which in the absence of
the project scenario would remain subject to the pressure of timber management (baseline) and
consequent degradation resulting from such activities it is understood that the mere protection of
these areas alone would offer communities and the ecosystem itself better adaptability compared
to the baseline scenario
Moreover the project has an Activity Management Plan (Annex 9) which details among other
initiatives the promotion of the sustainable use of ecosystem resources through direct support in
some activities related to income generation and conservation along with community training It is
believed that in addition to ensuring a more balanced (and therefore more resilient) environment
the project will expand the options for generating income among the communities making them
more resilient and preparing them to face the greater and already perceived challenges posed by
climate change
6 COMMUNITY
61 Positive Impacts for Communities (CM1)
EBCFrsquos REDD+ project was first presented to the riverine communities in 2011 By then
communities were informed about the cessation of all timber exploration activities due to the
REDD+ project and discussions were held regarding biodiversity conservation and the sustainable
use of forest products and services as well the social development of the surrounding
communities Briefly the positive impacts along the communities were
1 Project area zoning and its surroundings
2 Contribution to building local capacity
3 Contribution to developing sustainable business in the region
4 Contribution to social and environmental diagnosis
Knowing to manage
To evaluate the progress of these initiatives throughout the development of the project we used
the methodology of the Sustainability Matrix developed by the Secretariat of Environment and
MONITORING amp IMPLEMENTATION REPORT VCS Version 3 CCB Standards Third Edition
v30 41
Sustainable Development of Amazonas State This tool was applied in 15 communities taking into
account local socio-economic aspects that underlie the development of 20 parameters considered
of great importance to community development described by specific indicators As a visual tool
the Sustainability Matrix is quite suitable for traditional populations such as the riverside and
indigenous communities surrounding the Reserve Amazon River I and other areas of the Project
Additionally the Matrix provides interesting spaces for discussion since its construction is done
collectively Through the Sustainability Matrix it was possible to identify along with the
communities projects activities and implementation strategies Budgets and monitoring and
evaluation of these projects will be detailed later through the Annual Operational Plans to be
developed and followed up in the due course Four programs and nine subprograms were defined
for management and community development (Annex 9)
62 Negative Impacts (CM2)
No negative impacts have been recorded or identified as a result of the project with stakeholders
7 BIODIVERSITY
71 Positive Impacts for Biodiversity (B1)
The benefits for biodiversity are in reducing deforestation and degradation (selective logging) in the
project area According to satellite images analysis in the project areas and their surroundings it
was observed that until 2010 300 hectares were deforested After the implementation of the
project community awareness on the importance of preservation and conservation of forests have
encouraged no deforestation degradation and a significant reduction in deforestation was
identified (see graph below) This was due to the good understanding of the projects conservation
objectives and by the involvement and support of the surrounding communities
MONITORING amp IMPLEMENTATION REPORT VCS Version 3 CCB Standards Third Edition
v30 42
Figure 10 - EBCF REDD Project and buffer areas deforestation figures (source HDOM Report)
The consequences of deforestation and degradation on biodiversity are well known Thus the fact
of not being identified changes (natural or anthropogenic) in forest areas shows there was no loss
of biodiversity no reduction in floristic diversity no impact on the dynamics of fauna and flora and
no loss of evolutionary genetic information
72 Negative Impacts on Biodiversity (B2)
There are no negative impacts on biodiversity as a result of the project
73 Exceptional Benefits for Biodiversity (GL3)
The description of exceptional benefits for biodiversity will only be possible after the re-
measurement of permanent plots (FLORA)
8 ADICIONAL INFORMATION
All activities and the consequent reduction in deforestation and degradation in and around the
project areas were maintained and funded without resources of carbon credits We understand that
with the advance of REDD+ project EBCF will have much better conditions to implement positive
actions in partnership with communities
MONITORING amp IMPLEMENTATION REPORT VCS Version 3 CCB Standards Third Edition
v30 43
REFERENCES
ADEODATO S etal Madeira de ponta a ponta o caminho da floresta ateacute o consumo Satildeo Paulo
FGV-RAE 2011
ALBAGLI S Amazocircnia fronteira geopoliacutetica da biodiversidade Revista Parcerias Estrateacutegicas n
12 p6 set2001 Centro de Estudos Estrateacutegicos do Ministeacuterio da Ciecircncia e Tecnologia
AMARAL I C Viabilidade de plantio de cafeacute na zona da mata mineira Revista Poliacutetica Agriacutecola
Ano xx n4 outnovdez 2011 Disponiacutevel em
httpwwwalicecnptiaembrapabrbitstreamdoc9309031Viabilidadedeplantiopdf Acesso
em 17 de set 2013
AMARAL P etal Floresta para Sempre um manual para a produccedilatildeo de madeira na Amazocircnia
Beleacutem IMAZON 1998 130p
AMAZONAS Lei Complementar nordm 532007 de 05062007 REGULAMENTA o inciso V do artigo
230 e o sect 1ordm do artigo 231 da Constituiccedilatildeo Estadual institui o SISTEMA ESTADUAL DE
UNIDADES DE CONSERVACcedilAtildeO - SEUC dispondo sobre infraccedilotildees e penalidades e
estabelecendo outras providecircncias Disponiacutevel em
httpwwwcetesbspgovbruserfilesfilemudancasclimaticasproclimafilelegislacaoestadua
lamazonasleilei_complementar_n_53_2007_amazonaspdf Acessado em Setembro 2013
ANTAQ Anuaacuterio Estatiacutestico 2004 Distacircncia entre os portos Disponiacutevel em
httpwwwantaqgovbrportalanuariosportuario2004TabelasDistanciaEntrePortospdf
Acesso em 23 de out 2013
ANTAQ Panorama Aquaviaacuterio Agecircncia Nacional de Transportes Aquaviaacuterios Volume 3 Brasiacutelia
ndash DF 2009
MONITORING amp IMPLEMENTATION REPORT VCS Version 3 CCB Standards Third Edition
v30 44
AREDES A F PEREIRA M W G Anaacutelise econocircmica da produccedilatildeo de cafeacute araacutebica um estudo
de caso com simulaccedilotildees de Monte Carlo para sistemas de baixa e alta produtividade
Informaccedilotildees Econocircmicas SP v38 n4 abr 2008
ARIMA E UHL C Pecuaacuteria na Amazocircnia Oriental Desempenho Atual e Perspectivas Futuras Seacuterie
Amazocircnia n1 Beleacutem IMAZON 1996 40p
BACCINI A et al Estimated carbon dioxide emissions from tropical deforestation improved by
carbon-density maps Nature Climate Change vol2 march 2012 (LETTERS Published
Online - DOI 101038NCLIMATE1354)
BARROS A C UHL C Padrotildees problemas e potencial da extraccedilatildeo madeireira ao longo do Rio
Amazonas e do seu estuaacuterio Seacuterie Amazocircnia n4 Beleacutem IMAZON 1997 42p
BRASIL Lei 121872009 (Lei Ordinaacuteria) 29122009 Institui a Poliacutetica Nacional sobre Mudanccedila
do Clima - PNMC e daacute outras Providecircncias Presidecircncia da Repuacuteblica Casa Civil Subchefia
para Assuntos Juriacutedicos Disponiacutevel em lthttpswwwplanaltogovbrccivil_03_ato2007-
20102009leil12187htmgt Acesso em 20 de set 2013
CAMPOS E F Emissatildeo de CO2 da madeira serrada da Amazocircnia o caso da exploraccedilatildeo
convencional 2012 172p Dissertaccedilatildeo - Escola Politeacutecnica Universidade de Satildeo Paulo Satildeo
Paulo
CARDOSO RS e FREITAS C E C A pesca de pequena escala no rio Madeira pelos
desembarques ocorridos em Manicoreacute (Estado do Amazonas) Brasil Revista Acta
Amazocircnica vol 38(4) 2008 781 ndash 788
CCBA Climate Community and Biodiversity Alliance-CCBA 2008 Disponiacutevel em
httpwwwclimate-standardsorgccb-standards Acesso em 03 de set 2013
MONITORING amp IMPLEMENTATION REPORT VCS Version 3 CCB Standards Third Edition
v30 45
CEPEA Centro de Estudos Avanccedilados em Economia Aplicada - ESALQUSP Economia da
pecuaacuteria de corte na regiatildeo norte do Brasil Disponiacutevel em httpgooglL2roiA Acesso em
15 de out 2013
CHAMBERS J Q et al Decomposition and carbon cycling of dead trees in tropical forests of the
central Amazon Oecologia vol122 pp380-388 2000 Agricultores se queixam de
burocracia para contratar creacutedito sustentaacutevel do Programa ABC Correio Braziliense Brasiacutelia
26 fev 2012 Disponiacutevel em
lthttpwww2correiobraziliensecombrsersustentavelp=4592gt Acesso em 10 set 2013
CULLEN Jr L VALLADARES-PAacuteDUA C Onccedilas como detetives da paisagem Ciecircncia Hoje
Vol 156 n26 pp54-571999
CPRM - Serviccedilo Geoloacutegico do Brasil Disponiacutevel em httpwwwcprmgovbr Acesso em 13 de
mar 2013
DIAS F M MORAIS S J S REZENDE R C Anaacutelise da viabilidade econocircmica para a
produccedilatildeo de melancia e cenoura com financiamento em Anaacutepolis-GO 2008 Disponiacutevel em
httpwwwprpuegbr06v1conteudopesquisainiccieneventossic2008fronteiraflashsicani
macaoIIIJORNADAarquivosresumosresumo01pdfgt Acesso em 18 de nov2013
Divisatildeo de Precessamento de Imagens (DPI) Ambdata Mapa de Vegetaccedilatildeo SIPAM RADAM
2002 Disponiacutevel em httpwwwdpiinpebrAmbdatamapa_sipamphp Acesso em 21 de
out 2013
DOMINGUES MS BERNMANN C O arco de desflorestamento na Amazocircnia da pecuaacuteria agrave
soja Ambiente amp Sociedade Satildeo Paulo vol15 n2 pp1-22 maioago 2012
MONITORING amp IMPLEMENTATION REPORT VCS Version 3 CCB Standards Third Edition
v30 46
EBCF Criaccedilatildeo da primeira reserva particular de desenvolvimento sustentaacutevel do mundo na
floresta amazocircnica Disponiacutevel emlthttpwwwebcfcombrblog20130624criacao-da-
primeira-reserva-particular-de-desenvolvimento-sustentavel-do-mundo-na-floresta-
amazonicagt Acesso em 21 de set 2013
EMBRAPA Sistema Brasileiro de Classificaccedilatildeo de Solos 2ordf Ed Rio de Janeiro Embrapa Solos
2006 306 p
FELDPAUSCH T R et al When big trees fall Damage and carbon export by reduced impact
logging in southern Amazonia Forest Ecology and Management Vol 219 pp199-215 2005
FEARNSIDE P MDesmatamento na Amazocircnia dinacircmica impactos e controle Acta Amazocircnica
vol 36 n3 pp 395-400 2006
FILGUEIRAS T S et al 1994 Caminhamento Um meacutetodo expedito para levantamentos
floriacutesticos qualitativos Caderno de Geociecircncia IBGE vol12 pp39-43 1994
Forest Management Public Summary for Gethal Amazonas SA Induacutestria de Madeira
Compensada Certification Code SW-FMCOC-119 Date of Certification October 1
2000 Date of Public Summary October 2000 Updated for Annual Audit 2002 Annual Audit
2003 (Gethalpdf)
Globo Rural Linha de financiamento para a agricultura de baixo carbono tem pouca procura
2011 Disponiacutevel em httpwwwrainforest-allianceorgforestrydocumentsgethalpdf
Acesso em 16 de nov 2013
GREENPEACE Face a Face com a Destruiccedilatildeo Relatoacuterio Greenpeace sobre as companhias
multinacionais madeireiras na Amazocircnia Brasileira 1999 Disponiacutevel em
MONITORING amp IMPLEMENTATION REPORT VCS Version 3 CCB Standards Third Edition
v30 47
lthttpwwwgreenpeaceorgbramazoniaface_destruicaopdfgt Acesso em 11 de set
2013
Governo do Estado do Amazonas Plano de Gestao da RDS do Rio Amapaacute 2010 Disponiacutevel em
httpobservatoriowwforgbrsite_mediauploadgestaoplanoManejorio_amapapdf Acesso
em 24 de ago 2013
HDOM Estimates from processing the forest inventories data carried out during the CADAF
Project Final Technical Report 2012 Disponiacutevel em wwwhdomcombr Acesso em 27 de
maio 2013
HIGUCHI N 1986-87 Amostragem sistemaacutetica versus amostragem aleatoacuteria em floresta tropical
uacutemida de terra-firme na regiatildeo de Manaus Acta Amazonica 1617 (uacutenico) 393-400
HIGUCHI N SANTOS J JARDIM FCS Tamanho de parcela amostral para inventaacuterios
florestais Acta Amazocircnica vol12 n1 pp91-103 1982
HIGUCHI F G PINTO A C M ISHIZUKA M KAJIMOTO T LIMA A J N SANTOS J
HIGUCHI N Estoque e dinacircmica de biomassa acima do solo das florestas de terra firme do
estado do Amazonas In Adriano Joseacute Nogueira Lima Flaacutevia Machado Durgante Moacir
Alberto Assis Campos Joaquim dos Santos Moriyoshi Ishizuka Niro Higuchi (Org)
Dinacircmica do carbono das florestas da Amazocircnia resultados do Projeto CADAF
1edManaus INPA 2014 v 1 p 29-34
HOLMES T P etal Custos e benefiacutecios financeiros da exploraccedilatildeo de impacto reduzido em
comparaccedilatildeo agrave exploraccedilatildeo florestal convencional na Amazocircnia oriental 2ordf ed Beleacutem
Fundaccedilatildeo Floresta Tropical 2002 66p
HUSCH B MILLER C I BEERS T W Forest mensuration New York Ronald Press 1971
HUSCH B MILLER C I BEERS T W Forest Mensuration New York John Wiley amp Sons
2nd
ed 1972 402 p
MONITORING amp IMPLEMENTATION REPORT VCS Version 3 CCB Standards Third Edition
v30 48
IBGE Instituto Brasileiro de Geografia e Estatiacutestica Diretoria de GeociecircnciasCoordenaccedilatildeo de
Recursos Naturais e Estudos Ambientais Geologia Solos Hidrografia e Vegetaccedilatildeo 2000
IBGE Instituto Brasileiro de Geografia e Estatiacutestica Manicoreacute 2010 Disponiacutevel
emlthttpwwwsidraibgegovbrgt Acesso em 05 de set 2013
IBGE Instituto Brasileiro de Geografia e Estatiacutestica 2011 Disponiacutevel em httpwwwibgegovbr
Acesso em 19 de mar 2013
IBGE Instituto Brasileiro de Geografia e Estatiacutestica Extraccedilatildeo vegetal e silvicultura para o
municiacutepio de Manicoreacute 2011 Disponiacutevel em
lthttpcidadesibgegovbrxtrastemasphplang=ampcodmun=130270ampidtema=102ampsearch=a
mazonas|manicore|extracao-vegetal-e-silvicultura-2011gt Acesso em 10 de out 2013
IBGE Instituto Brasileiro de Geografia e Estatiacutestica Censo Demograacutefico 2010 Disponiacutevel em
lthttpcidadesibgegovbrxtrastemasphpcodmun=130270ampidtema=116gt Acesso em 18
de out 2013
IBGE Instituto Brasileiro de Geografia e Estatiacutestica Censo Demograacutefico 2010 Disponiacutevel
emlthttpcidadesibgegovbrxtrashomephpgt Acesso em 08 de out 2013
IDESAM Reduccedilotildees de Emissotildees do Desmatamento e Degradaccedilatildeo Florestal (REDD+) estudo de
oportunidades para a regiatildeo sul do Amazonas CENAMO M Cl CARRERO G C
GANDOLFO P (Org) Manaus 2011 Disponiacutevel em
lthttpwwwobservatoriodoreddorgbrsitepdfestudodeoportunidadespdfgt Acesso em 13 de
set 2013
MONITORING amp IMPLEMENTATION REPORT VCS Version 3 CCB Standards Third Edition
v30 49
IDESAM Semeando Sustentabilidade em Apuiacute ndash Resultados e Perspectivas 2011 Manaus
Disponivel em lthttpidesamorgbrsemeando-sustentabilidade-em-apui-resultados-e-
perspectivasUxX8nfldWYI
IEA Instituto de Economia Aplicada CO2 Emissions from fuel combustion 2012 Disponiacutevel em
httpwwwieaorgco2highlightsco2highlightspdf Acesso em 09 de out 2013
IGREJA H L S CATIQUE J Anaacutelise neotectocircnica do lineamento de Itacoatiara centro leste do
Estado do Amazonas In Simpoacutesio Nacional de Estudos Tectocircnicos 6 1997 Pirenoacutepolis
Anais Pirenoacutepolis-GO SBG-Nuacutecleo Brasiacutelia1997
IMAZON Instituto do Homem e do Meio Ambiente da Amazocircnia Fatos Florestais 2010a
Disponiacutevel em httpwwwimazonorgbrpublicacoeslivrosfatos-florestais-da-amazonia-
2010-1 Acesso em 14 de out 2013
IMAZOM Instituto do Homem e do Meio Ambiente da Amazocircnia Mercado e preccedilo da madeira
amazocircnica 2010 Disponiacutevel em httpwwwimazonorgbrpublicacoesprecos-de-madeira-
em-toraboletim-de-precos-de-madeira-em-tora-na-amazonia-julho-2010at_downloadfile
Acesso em 23 de nov 2013
IMAZON Instituto do Homem e do Meio Ambiente da Amazocircnia Portal de Geoinformaccedilatildeo sobre
a Amazocircnia Disponiacutevel em lthttpwwwimazongeoorgbrimazongeophpgt Acesso em 06
de set 2013
IMAZON Instituto do Homem e do Meio Ambiente da Amazocircnia Transparecircncia florestal
Amazocircnia Legal 2012 Disponiacutevel em lthttpwwwimazonorgbrpublicacoestransparencia-
florestaltransparencia-florestal-amazonia-legalcopy_of_SADOutubro2012pdfgt Acesso em
23 de set 2013
IMAZON Instituto do Homem e do Meio Ambiente da Amazocircnia PEREIRA D SANTOS D
VEDOVETO M GIMARAtildeES J VERIacuteSSIMO A (Orgs) Fatos Florestais da Amazocircnia
Beleacutem IMAZON 2010 244p Disponiacutevel em
MONITORING amp IMPLEMENTATION REPORT VCS Version 3 CCB Standards Third Edition
v30 50
lthttpwwwimazonorgbrpublicacoeslivrosfatos-florestais-da-amazonia-2010-1gt Acesso
em 24 de set 2013
IMAZON Instituto do Homem e do Meio Ambiente da Amazocircnia A Expansatildeo madeireira na
Amazocircnia Impactos e perspectivas para o desenvolvimento sustentaacutevel no Paraacute BARROS
AC VERIacuteSSIMO A (Eds) Beleacutem IMAZON 2002
IMAZON Instituto do Homem e do Meio Ambiente da Amazocircnia Custos e Benefiacutecios do Manejo
Florestal Para Produccedilatildeo de Madeira na Amazocircnia Oriental 1998 Disponiacutevel em
lthttpwwwimazonorgbrpublicacoesserie-amazoniacustos-e-beneficios-do-manejo-
florestal-para-producao-de-madeira-na-amazonia-orientalgt Acesso em 20 de set 2013
INPE Instituto de Pesquisas Espaciais Banco de dados PRODES 2012 Disponiacutevel em
lthttpwwwdpiinpebrprodesdigitalprodesphpgt Acesso em 09 de set 2013
INPE Instituto de Pesquisas Espaciais Banco de dados DEGRAD 2009 Disponiacutevel em
lthttpwwwobtinpebrdegradgt Acesso em 09 de set 2013
INPE Instituto de Pesquisas Espaciais Banco de dados DETER 2013 Disponiacutevel em
lthttpwwwobtinpebrdetergt Acesso em 10 de set 2013
INPE Instituto de Pesquisas Espaciais Banco de dados de queimadas e focos de calor
BDQUEIMADAS 2013 Disponiacutevel em lthttpwwwdpiinpebrproarcobdqueimadasgt
Acesso em 10 de set 2013
Instituto Carbono Brasil Soacute 2 da produccedilatildeo de madeira eacute certificada O Estado de SPaulo 2006
Disponiacutevel em lthttpwwwinstitutocarbonobrasilorgbrnoticias6noticia=119796gt Acesso
em 26 de set 2013
MONITORING amp IMPLEMENTATION REPORT VCS Version 3 CCB Standards Third Edition
v30 51
IFT Instituto Floresta Tropical Diagnoacutestico do Setor Florestal de Cotriguaccedilu Estado do Mato
Grosso 2010 Disponiacutevel em lthttpgooglEVx2RZgt Acesso em 16 de dez 2013
IPCC Guidelines for National Greenhouse Gas Inventories In National Greenhouse Gas
Inventories Programme EGGLESTON HS BUENDIA L MIWA K NGARA T TANABE
K (Eds) Japan IGES 2006
ITTO Annual review and assessment of the world timber situation 2011 Disponivel em
httpwwwittointannual_review Acesso em 10 de out 2013
KELLER M et al Coarse woody debris in undisturbed and logged forests in the eastern Brazilian
Amazon Global Change Biology vol10 PP784-795 2004
LENTINI M VERISSIMO A PEREIRA D A expansatildeo madeireira na Amazocircnia O Estado da
Amazocircnia n2 2005 Beleacutem IMAZON Disponiacutevel em
httpwwwimazonorgbruploadea_2ppdf Acesso em 06 de set 2013
LOETSCH F ZOumlHRER F HALLER K E Forest Inventory Munich BLV Verlagsgesellschaft
2nd
edition Vol II 1973 469 p
MAGNUSSON WE et al RAPELD uma modificaccedilatildeo do meacutetodo de Gentry para inventaacuterios de
biodiversidade em siacutetios para pesquisa ecoloacutegica de longa duraccedilatildeo Biota Neotrop JulDez
2005 vol 5 no 2 httpwwwbiotaneotropicaorgbrv5n2ptabstractpoint-of-
view+bn01005022005 ISSN 1676-0603
MARINELLI C E et al O programa de monitoramento da biodiversidade da biodiversidade e do
uso de recursos naturais em unidades de conservaccedilatildeo estaduais do Amazonas Secretaria
de Estado do Meio Ambiente e Desenvolvimento Sustentaacutevel - SDS Manaus SDS 2007
MONITORING amp IMPLEMENTATION REPORT VCS Version 3 CCB Standards Third Edition
v30 52
MARINELLI C E MALTEZ M H Indicadores de Sustentabilidade para Unidades de
Conservaccedilatildeo Documento-Siacutentese Workshop Instituto Socioambiental Brasiacutelia-DF 2010
76p
MAZZEI L et al Above-ground biomass dynamics after reduced-impact logging in the Eastern
Amazon Forest Ecology and Management vol 259 pp367-373 2010
MEIRELLES FILHO O Livro de Ouro da Amazocircnia 5ordf Ediccedilatildeo Rio de Janeiro EDIOURO 2007
422p Meirelles Filho J O Livro de Ouro da Amazocircnia 1ordf ed Editora Ediouro ISBN
8500021616 2007 450p
MENGER Juliana da Silva Fatores determinantes da distribuiccedilatildeo de aves no interfluacutevio Purus-
Madeira Manaus [sn] 2011 35 fl il
MCT Arquivos dos Fatores de Emissatildeo Disponiacutevel em
httpwwwmctgovbrindexphpcontentview321144htmlancora Acesso em 23 de out
2013
MMA Ministeacuterio do Meio Ambiente Avaliaccedilatildeo e identificaccedilatildeo de accedilotildees prioritaacuterias para a
conservaccedilatildeo utilizaccedilatildeo sustentaacutevel e reparticcedilatildeo dos benefiacutecios da biodiversidade na
Amazocircnia brasileira Brasiacutelia MMASBF 2001
MMA Ministeacuterio do Meio Ambiente Secretaria de Biodiversidade e Florestas Aacutereas Prioritaacuterias
para Conservaccedilatildeo Uso Sustentaacutevel e Reparticcedilatildeo de Benefiacutecios da Biodiversidade Brasileira
Atualizaccedilatildeo - Portaria MMA ndeg9 de 23 de janeiro de 2007 Brasiacutelia MMA 2007 (Seacuterie
Biodiversidade 31)
MONITORING amp IMPLEMENTATION REPORT VCS Version 3 CCB Standards Third Edition
v30 53
MMA Livro vermelho da fauna brasileira ameaccedilada de extinccedilatildeo editores Angelo Barbosa
Monteiro Machado Glaacuteucia Moreira Drummond Adriano Pereira Paglia 1ed 2008 Brasiacutelia
DF MMA Belo Horizonte MG Fundaccedilatildeo Biodiversitas (1420 p) il - (Biodiversidade 19)
OLIVEIRA M M HIGUCHI N CELES C H HIGUCHI F G 2014 Tamanho e formas de
parcelas para inventaacuterios florestais de espeacutecies arboacutereas na Amazocircnia Central Ciecircncia
Florestal Santa Maria v 24 n 3 p 645-653
PEARSON TRH WALKER S BROWN SL The Source Book for Land Use Land Use
Change and Forestry Projects BioCarbon Fund and Winrock International 2005 64 pp
PORTAL AMAZOcircNIA Amazocircnia de A a Z Disponiacutevel em
lthttpportalamazoniaglobocomgt Acesso em 13 de set 2013
PEacuteLLICO NETTO S BRENA D A Inventaacuterio florestal Curitiba Editorado pelos autores p
316 1997
PROJETO SIVAM Relatoacuterio metodoloacutegico de trabalho Revisatildeo 3 Diretoria de Geociecircncia Rio de
Janeiro 2002 330 pp
PROJETO SIVAM Atualizaccedilatildeo do RADAMBRASIL Mapa de Vegetacao da Amazonia Legal
Mapa de Fitofisionomias ndash RADAMSIPAM DNPM Ministeacuterio de Minas e Energia 2002
Disponiacutevel em httpwwwdpiinpebramb_dataShapefilesveg_Amz_SIPAMzip Acesso
em 21 de jan 2014
PROJETO FLORESTAL SANTA MARIA (PROJETO FSM-REDD) Plant Inteligecircncia Ambiental ndash
Warwick Manfrinato 2012 Disponiacutevel em
lthttpwwwflorestalsantamariacombrsitedocumentos57FSM_REDD_VCS_PD_ptpdfgt
Acesso em 09 de set 2013
MONITORING amp IMPLEMENTATION REPORT VCS Version 3 CCB Standards Third Edition
v30 54
RADAMBRASIL Programa de Integraccedilatildeo Nacional Levantamentos de Recursos Naturais v 14 ndash
RADAM DNPM Ministeacuterio de Minas e Energia Brasil 1974
RIBEIRO J E L et al Flora da Reserva Ducke guia de identificaccedilatildeo das plantas vasculares de
uma floresta de terra firme na Amazocircnia Central Manaus Editora INPA 1999
ROSAS F C W WALDEMARIN H de MATTOS G E Pteronura rasiliensis (Zimmermann
1780) In MACHADO A B M DRUMMOND G M PAGLIA A P (eds) Livro Vermelho da
Fauna Brasileira Ameaccedilada de Extinccedilatildeo Volume II 1ed Brasiacutelia DF Ministeacuterio do Meio
Ambiente 2008 p 800 - 801
ROSS D GHG Emissions Resulting from Aircraft Travel 2009 Disponiacutevel em
httpwwwcarbonplanetcomdownloadsFlight_Calculator_Information_v92pdf Acesso em
14 de out 2013
SANTOS A J et al Viabilidade econocircmica do sistema agroflorestal greviacutelea x cafeacute na regiatildeo
norte do Paranaacute CERNE vol6 n1 pp89-100 2000
SANTOS R A Custo do manejo florestal madeireiro estudo de caso Floresta Estadual do
Antimary Monografia (Bacharelado em Economia) ndash Departamento de Ciecircncias
Econocircmicas Universidade Federal do Acre 2007109p
SABOGAL C et al Manejo Florestal Empresarial na Amazocircnia Brasileira restriccedilotildees e
oportunidades (Relatoacuterio Siacutentese) Beleacutem CIFORIMAZON 2006 72p
SDSCEUC Secretaria Estadual de Meio Ambiente e Desenvolvimento Sustentaacutevel ndash Centro
Estadual de Unidades de Conservaccedilatildeo Programa de Monitoramento de Biodiversidade e
Uso de Recursos Naturais em Aacutereas Protegidas do Estado Amazonas (ProBUC) 2006
Disponiacutevel em
MONITORING amp IMPLEMENTATION REPORT VCS Version 3 CCB Standards Third Edition
v30 55
httpbrazilwcsorgDesktopModulesBring2mindDMXDownloadaspxEntryId=6168ampPortalI
d=93ampDownloadMethod=attachment Acesso em 11 de ago de 2013
SFBIMAZON Serviccedilo Florestal Brasileiro e Instituto do Homem e Meio Ambiente da Amazocircnia A
atividade madeireira na Amazocircnia brasileira produccedilatildeo receita e mercados 2010 Disponiacutevel
em httpwwwmmagovbrestruturassfb_arquivosmiolo_resexec_polo_03_95_1pdf
Acesso em 23 de out 2013
SILVA R P da Alometria estoque e dinacircmica da biomassa de florestas primaacuterias e
secundaacuterias na regiatildeo de Manaus (AM) 152 p Tese de Doutorado Programa Integrado
de Poacutes-graduaccedilatildeo em Biologia Tropical e Recursos Naturais (INPA) Manaus 2007
SILVA Z A G P G SANTOS R A Custo do manejo florestal madeireiro em floresta puacuteblica
estudo de caso no Acre 2011 Disponiacutevel em
lthttpwwwbasacombrbancoamazonia2Revistaedicao_13n13_custo_do_manejo_flores
pdfgt Acesso em 13 de set 2013
SMIDT M GALLAGHER T Factors Affecting Fuel Consumption and Harvesting Costs Auburn
School of Forestry and Wildlife Sciences Sd Disponiacutevel em
httpweb1cnrevteduforestrycofedocuments2013Smidt_Gallagherpdf Acesso em 21
de out 2013
SOARES-FILHO B et al Role of Brazilian Amazon protected areas in climate change mitigation
2010 Columbia University NY Ruth S DeFries 2010
SPF Serviccedilo Puacuteblico Federal DVPF Documento de venda de produto Florestal (Declaraccedilotildees de
venda Gethalpdf) 14 de julho de 2006
MONITORING amp IMPLEMENTATION REPORT VCS Version 3 CCB Standards Third Edition
v30 56
TIMOFEICZYK JUacuteNIOR R et al Rentabilidade econocircmica do manejo de baixo impacto em
florestas tropicais um estudo de caso Revista Floresta Curitiba v 38 n 4 p 711-725
outdez 2008
VCS Ferramenta para Demonstraccedilatildeo e Avaliaccedilatildeo de Adicionalidade para Atividades de Projetos
VCS em Agricultura Floresta e Outros Usos (AFOLU) 2012a Disponiacutevel em httpwwwv-c-
sorgsitesv-c-sorgfilesVT000120VCS20AFOLU20Additionality20Tool20v30pdf
Acesso em 24 de set 2013
VCS Ferramenta de Risco e Natildeo Permanecircncia (AFOLU) 2012B Disponiacutevel em httpv-c-
sorgsitesv-c-sorgfilesAFOLU20Non-Permanence20Risk20Tool2C20v32pdf
Acesso em 13 de set 2013
VCS Approved VCS Methodology VM0010 Version 10 - Methodology for Improved Forest
Management Conversion to Logged to Protected Forest Calculating GHG Benefits from
Preventing Planned Degradation PHUA S SHARMA S TELFER M CHANDLER H
(Eds) Califoacuternia EUA Carbon Planet Limited 2011149p
VERDEJO M E Diagnoacutestico Rural Participativo um guia praacutetico Brasiacutelia MDA 2006 62p
VIANNA A L M Diagnoacutestico Florestal do Estado do Amazonas 2010 e 2011 Manaus-AM
IDESAM 2013 (Relatoacuterio Final do Projeto Fortalecimento da participaccedilatildeo da sociedade civil
no Amazonas Foacuterum de Mudanccedilas Climaacuteticas Transparecircncia Florestal no Estado do
Amazonas ndash Mapeamento de Instrumentos Legislativos no Brasil)
WBCSDWRI The GHG Protocol for Project Accountin Washington World Business Council for
Sustainable DevelopmentWorld Resources Institute 2005148 p
MONITORING amp IMPLEMENTATION REPORT VCS Version 3 CCB Standards Third Edition
v30 57
WALKER W et al Guia de Campo para Estimativa de Biomassa Florestal e Estoque de Carbono
Woods Hole Center Research Falmouth Massachusetts USA 2011 Disponiacutevel em
httpwwwwhrcorgresourcesfieldguidescarbonpdfWHRC_FieldGuide_PortugueseSMpdf
Acesso em 14 de set 2013
WWF Metodologia para Avaliaccedilatildeo Raacutepida e a Priorizaccedilatildeo do Manejo de Unidades de
Conservaccedilatildeo (RAPPAM) 2010 Disponiacutevel em httpgooglXfDnxs Acesso em 30 de set
2013
WWF-Brasil Efetividade de Gestatildeo das Unidades de Conservaccedilatildeo no Estado do Amazonas
Secretaria de Estado do Meio Ambiente e do Desenvolvimento Sustentaacutevel do Amazonas
Instituto Chico Mendes de Conservaccedilatildeo da Biodiversidade Brasiacutelia WWF-Brasil 2011 72 p
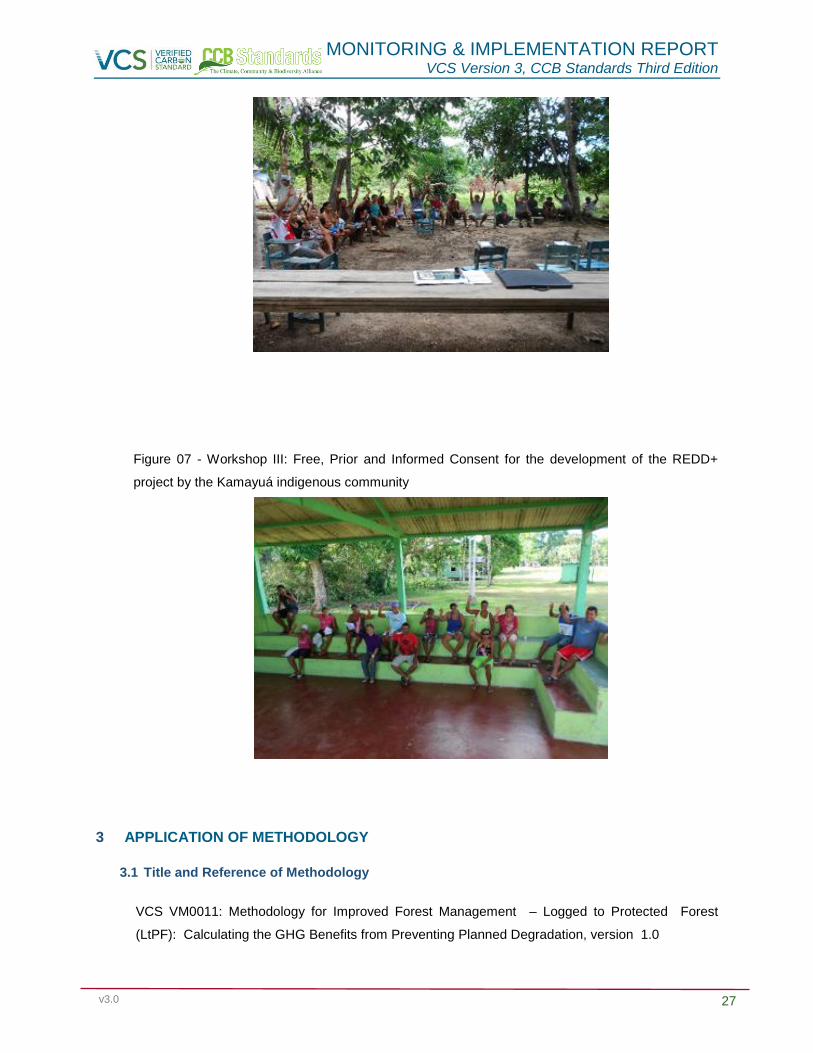
MONITORING amp IMPLEMENTATION REPORT VCS Version 3 CCB Standards Third Edition
v30 27
Figure 07 - Workshop III Free Prior and Informed Consent for the development of the REDD+
project by the Kamayuaacute indigenous community
3 APPLICATION OF METHODOLOGY
31 Title and Reference of Methodology
VCS VM0011 Methodology for Improved Forest Management ndash Logged to Protected Forest
(LtPF) Calculating the GHG Benefits from Preventing Planned Degradation version 10
MONITORING amp IMPLEMENTATION REPORT VCS Version 3 CCB Standards Third Edition
v30 28
32 Methodology Deviations
Whereas the VM0011 was developed in a context of homogeneous forests of temperate regions
some methodological adjustments were made related to the direct survey biomass in the field
since the project areas are comprised of very heterogeneous areas of rainforest including dryland
and floodplains Any technical documentation related to these methodological adjustments and
their justifications appear in Annex 23 (Forest Inventory 2016) prepared by the consulting firm
HDOM
33 Project Boundary5
The total area of the property is 20387 ha and a buffer zone was established around each of the
four areas in order to include communities that use the resources within their boundaries (Figure
7a) Project activity areas (for purposes of calculating the emissions reductions called the project
area or PA) are only those for which logging is permitted a total of 19800 ha (Figure 7b)
excluding the Permanent Preservation Areas (APPs) and bodies of water A logging plan has been
approved for this area for selective logging (Annexes 1 2 3 4 6 and 7)
Figure 08 - Project Boundaries a) Direct Project interference limits b) Total Project Area (G1
Indicator 7)
5 Ref section 22 of VM0011
MONITORING amp IMPLEMENTATION REPORT VCS Version 3 CCB Standards Third Edition
v30 29
Stratification of the project area
For purposes of inventorying local carbon stocks and project management the project area was
stratified into 3 groups of different forest types as indicated by the VM0011 according to the
vegetation map SIPAMRADAM (DPI 2002) The forest types present in the area are rain forest
types divided into 3 categories as follows
Dense Primary Tropical Ombrophylous Alluvial Forest
Dense Primary Tropical Ombrophylous Lowland Forest
Pioneer Formations
Figure 09 - Project Area forest types
Leakage areas
There is no direct leakage resulting from planned project activities since there will be neither
displacement of management activities to other areas after the cessation of the activities within the
project area nor market leakages The project Management Plan includes the monitoring of
MONITORING amp IMPLEMENTATION REPORT VCS Version 3 CCB Standards Third Edition
v30 30
possible unanticipated leakages around the project area as well as the need to report to the
competent authorities whenever logging activities are identified in these areas For more
information on leakage see chapters 52 and 55 of this document
Temporal boundaries
Crediting period of the project
The first crediting period of the project is 37 years beginning on August 17 2012 and ending on 17
August 2049 This period is equivalent to the remaining 12 years of the first authorized
management plan (25 years from 1998) added to another 25 years in respect of a new forest
management plan that was intended as the common practice of forestry in Brazil The logging
activities could continue beyond 37 years aiming for a second crediting period
Monitoring and Reporting Period
a) Monitoring of Baseline Emissions
The monitoring of Baseline Emissions must demonstrate that the protected forest area is in
accordance with the one specified in the PD The project limit will be monitored before each
verification throughout the crediting period through new inventory information and remote sensing
and GIS as applicable Thus the project will be able to update the baseline calculations based on
the actual remaining forest area (in case of loss of forest cover by disasters for example) and that
would be subject to forest management under a ldquowithout projectrdquo scenario
b) Monitoring of Project Emissions
Project emissions will be monitored annually and compiled in every monitoring report that will detail
in particular the
Monitoring of possible illegal harvesting of timber
Monitoring of areas subject to natural disturbances
Monitoring and quantification of emissions related to air and land travel related to project
activities
c) Monitoring of Leakage
Since there will be no leakages according to the VM0011 and AFOLU Requirements no leakage
monitoring will be necessary However to be conservative the project intends to monitor any
disturbances that might affect the carbon reservoirs Once some disturbance is registered the
project will report the incident to the relevant authorities and make the necessary adjustments to
MONITORING amp IMPLEMENTATION REPORT VCS Version 3 CCB Standards Third Edition
v30 31
the baseline For more details about the monitoring of leakages see chapters 52 and 55 of this
document
Carbon stocks
The biomass reservoirs considered by the project are related to above-ground and underground
biomass
Sources and sinks of GHGs
Table 02 below describes the emission sources and sinks of greenhouse gases associated with
the baseline activities and with the project
Table 03 - Greenhouse gas emissions sources and sinks associated with baseline and project
activities
Source Gas Included JustificationExplanation
Baselin
e
Biomass
CO2 Yes Main source of project emissions through forest
degradation harvested and commercialised
wood products deadwood and forest regrowth
CH4 No Conservatively excluded
N2O No Conservatively excluded
Other No -
Fossil Fuel
consumption
CO2 Yes Main source through fossil fuel use in
machinery and transportation of timber
CH4 Yes Conservatively included
N2O Yes Conservatively included
Other No -
Electricity
consumption
CO2 Yes Main source
CH4 No -
N2O No -
Other No -
Pro
ject
Biomass
CO2 Yes Main source through unexpected natural
disturbances such as forest fires etc
CH4 Yes Included but subject to significance
N2O Yes Included but subject to significance
MONITORING amp IMPLEMENTATION REPORT VCS Version 3 CCB Standards Third Edition
v30 32
Source Gas Included JustificationExplanation
Other No _
Fossil Fuel
consumption
CO2 Yes Main source through flights and ground travel
CH4 Yes Included but subject to significance
N2O Yes Included but subject to significance
Other No _
Electricity
consumption
CO2 Yes Main source
CH4 No _
N2O No _
Other No _
34 Baseline Scenario
The choice between alternative baseline scenarios was taken together with the analysis of
additionality using the latest version of the VCS Tool for the demonstration and assessment of
additionality in Agriculture Forestry and Other Land Use VCS projects in this case VT000167
(VCS 2012a) All possible scenarios as well as the analysis of methodology barriers (steps 211
and 212 of the VM0011) are present in the chapter below In this sense to avoid redundancy of
information refer to additionality analysis to find the steps 211 and 212 of the VM0011
The baseline scenario for the project identified as the most likely to occur was selective logging8
(continuation of Business As Usual - BAU) The reference scenario assumes 37 years of selective
logging according to the 25 year logging plan approved in August 1998 (Annex 6 - document
ValdII T01 POA 1998) that in the absence of project activities would be renewed in 2024 for
another 25 years until 2049
Under this scenario the full implementation of the timber logging plan occurs and which has
already resulted in the degradation of 434769 ha (see table below) The area would be harvested
selectively for timber sold in lumber markets Below is a summary of harvest areas between 1999
and 2010 showing the managed plots and the dates on which the harvests were authorized
6 Tool for the demonstration and assessment of an additional to the VCS project activities in Agriculture Forestry and Other
Uses (AFOLU) (V 30)
7 Adapted from ldquoTool for the Demonstration and Assessment of Additionality in AR CDM project Activitiesrdquo (V02) 8 Additional information about choosing the baseline are presented in section 46 (steps 1 and 2)
MONITORING amp IMPLEMENTATION REPORT VCS Version 3 CCB Standards Third Edition
v30 33
Table 04 - Summary of areas managed since 1999
Date Managed logged area (ha)
1999 58669 (Plot 1)
2000 688 (Plot 2)
2001 ndash 2002 8315 (Plot 3)
2003 ndash 2004 750 (Plots 3 and 4)
2005 ndash 2007 1082 (Plot 5)
2008 ndash 2009 49050 (Plots 5 and 6)
TOTAL 434769
35 Additionality
The additionality analysis of the Amazon Rio project REDD+ IFM was conducted with the latest
version of the VCS Tool for the demonstration and assessment of additionality in Agriculture
Forestry and Other Land Use VCS projects the VT000167
(VCS 2012a)
To generate the reductions in GHG emissions for the project the planned baseline activities
(sustainable forest management) were terminated by the project proponent and supplanted by
environmental conservation activities In this sense the project will be managed by EBCF with
the goal of creating a fund for administrative and accounting management especially to promote
environmental management and monitoring activities of carbon pools within the project area
Alternative activities planned in the project are the provisioning and valuation of environmental
services via carbon credits (VCUs) in conjunction with the sale of Environmental Reserve Quotas
(CRAs)
4 MONITORING AND PARAMETERS OF DATA
41 Monitoring Plan Description
Due to its innovative comprehensive and integrative character the project needs to be monitored
regularly so that its actions activities and impacts can be constantly measured and evaluated To
meet this requirement the monitoring process must meet three main objectives
MONITORING amp IMPLEMENTATION REPORT VCS Version 3 CCB Standards Third Edition
v30 34
i To serve as an internal management project tool
ii To collaborate as an instrument of collective learning from the communities and
social groups directly involved
iii To work as a means of communicating results and impacts to interested institutions
and society in general Furthermore it is important to consider that monitoring if
successful will transcend the managerial aspects of the project and strengthening
the plan
To facilitate the monitoring process instead of having a reference line (to compare interventions
before and after) the first year of monitoring will serve as the starting point whose information will
be regularly and systematically compared throughout the project
Next the initial plans for monitoring benefits to the climate community and biodiversity are
described wherein the community is committed to participatory precept and to the technical and
scientific rigor which is capable of following the possible negative and positive impacts on
environmental and social aspects in the project area and its surroundings
Monitoring of Climate Impacts
The Monitoring Plan (MP) aims to provide security in the periodic estimates of reduction in
emissions especially in monitoring changes in carbon stock Therefore emissions from the
implementation of the project ex post estimates of the activities and emissions from any leakages
and isolated disturbances (eg blowdown fires pests and diseases among others) can be
calculated
The construction of the PM of the climate benefits made in full compliance with the methodological
framework provided by VM0011 ndash IFM LPF (VCS 2011) and CCBA (2008) which consists of four
specific actions to be monitored
i Implementation and execution of the project
ii Dynamics and stock of the forest biomass
iii Deforestation and forest degradation
iv Periodic reviews of ex post emissions
Remote monitoring and surveillance of the project area
Measurement of alterations and biomass loss quantification present in the PA using land use
change detection is critical to make accurate estimates of GHG emissions that account for forest
biomass increases and losses
MONITORING amp IMPLEMENTATION REPORT VCS Version 3 CCB Standards Third Edition
v30 35
Thus the use of remote sensing by satellite images of medium spatial resolution can be applied
readily in the PA and surroundings in order to monitor land use dynamics over time particularly to
identify risks and threats to forested areas In situ verification will complement landscape analysis
in a GIS environment with the aim of quantifying spatializing and identifying conversion of forest
areas into other land uses environmental degradation and other possible changes that may occur
during the term of the project
As a complementary monitoring source the project will rely on the database and information
provided by Monitoring Program of the Brazilian Amazon Forest by Satellite 910
(Prodes Digital)
conducted by the National Institute for Space Research (Instituto Nacional de Pesquisas Espaciais
- INPE) according to the Plan for Prevention and Control of Deforestation in the Amazon
1112(PPCDAm) under the National Policy on Prevention and Control of Deforestation Such
information is available online in13
digital vector files for the public in general
Other tools will provide complementary information to the monitoring such as indicators of forest
degradation and hotspots (fires and wildfires) obtained from DETER 14
SAD 15
and PROARCO16
Information is available online for free in vector format These results will be systematically related
to field data for validating or disproving the occurred event so that the focuses of deforestation and
degradation can be identified remediated reported and consequently avoided as much as
possible
A surveillance system that allows permanent territorial monitoring and inhibits the entry of intruders
through entry points in the PA will also be deployed to control the transport flow In addition one
must investigate and identify risks and threats eg mapping hotspots and areas vulnerable to fire
to illegal logging to hunting and poaching and to invasions by third parties among others
At first we estimate an effective demand for structuring the electronic monitoring system which
includes the hiring of skilled professionals field equipment electronic equipment (digital cameras
GPS desktops and notebooks smartphones printers geoprocessing software and GIS among
others) vehicles andor motorcycles motorized boats for transportation and moving around and
the collection of high resolution satellite images Empowerment and training of all involved staff
9httpwwwobtinpebrprodesdigitalmetodologiahtml
10httpwwwobtinpebrprodesmetodologiapdf 11httpwwwmmagovbrflorestascontrole-e-prevenC3A7C3A3o-do-desmatamento 12httpwwwmmagovbrimagesarquivo80120PPCDAm_FINAL_PPCDAMPDF 13httpwwwobtinpebrprodesindexhtml 14httpwwwobtinpebrdeterdados 15httpwwwimazongeoorgbrdocdownloadsphp 16httpwwwdpiinpebrproarcobdqueimadas
MONITORING amp IMPLEMENTATION REPORT VCS Version 3 CCB Standards Third Edition
v30 36
and the surrounding communities will be necessary to make the system effective17
and a constant
stream of information directed to regional actors and other stakeholders
Strategic monitoring and access points to RPDS roads will also provide support to other MPs
including social and biodiversity conservation aspects especially in the logistic support of planned
field activities
Procedures for determining the permanent sample plots (PSPs) and measurement
The calculation of the stock and increase in forest biomass will be subsidized through the
installation of PSPs in the PA and its temporal monitoring through the Continuous Forest Inventory
(CFI) The methodology proposed by VCS (2011) suggests the use of permanent andor temporary
plots however it confirms the efficiency and accuracy of sample plots
In order to demonstrate the procedural and statistical rigor used all the sampling procedures the
PA forest stratification sampling design calculation of sampling intensity and other parameters
measured in PSPs to monitor biomass balance due to ingressmortality of individuals growth in
DBH and height will be presented in detail in the Annex (Annex 23 - Forest Inventory 2016)
To promote reliable forest biomass estimates standard operating procedures (SOPs) (Section 82)
will be used by the team executing the CFI
Monitoring frequency
The monitoring frequency parameters measured in the PSPs will be no greater than 5 years from
the first measurement Other relevant parameters to monitoring the PSPs like the change in land
use in the PA and surrounding areas such as deforestation forest degradation fire sources and
natural disturbances will be regularly monitored as a project routine operation organized and
archived annually
411 Monitoring Impacts to Biodiversity
Since animal inventories have not been conducted in Amazon Rio project areas (for this project
biological information for the Rio Amapaacute RDS management plan were used) a biodiversity
monitoring system that will follow the RAPELD methodology (Rapid surveys of various taxonomic
groups (RAP) for long-term ecological studies) (MAGNUSSON et al 2005)
The RAPELD method contributes to long-term research using rapid inventory assessments biotic
complementarity and land use planning in the Amazon This method increases adequate sampling
17Linking community monitoring to national Measurement Reporting and Verification for REDD+
MONITORING amp IMPLEMENTATION REPORT VCS Version 3 CCB Standards Third Edition
v30 37
probability of biologically diverse communities which require large areas and at the same time
minimize variation of abiotic factors that affect these communities with smaller areas sampling
Evaluation and selection of indicators will be conducted in accordance with the ProBUC model
however applicably to local reality results will be updated biennially from the first survey
Biodiversity indicators are being designed and planned as suggested in the Social and
Environmental Monitoring System of Protected Areas in the Brazilian Amazon (Sistema de
Monitoramento Socioambiental das Unidades de Conservaccedilatildeo da Amazocircnia Brasileira)1819
and
Methodology for Rapid Assessment and Prioritization of Protected Areas Management20
(Metodologia para Avaliaccedilatildeo Raacutepida e Priorizaccedilatildeo do Manejo de Unidades de Conservaccedilatildeo -
RAPPAM) in line with the experiences gained and disseminated by CEUC and ICMBIO previously
described
The empowerment accountability and shared management of biodiversity conservation is the
main focus of the methodological model adopted These actions create high expectations for
environmental management of the area as the biodiversity monitoring will be conducted by the
community members themselves along with the project proponent promoting a local multiplier
effect It is worth mentioning that strict compliance with these procedures is in within EBCF`s
interest since it considers them to be key to the success of the project
The project begins with the premise that any negative impact on biodiversity in the project area
and its surroundings will not occur In the opposite sense the project aims to generate and provide
greater understanding of the territory subsidizing proposals for the conservation and sustainable
use through adoption of good management practices of natural resources as well as its replication
in other locations
412 Monitoring Social Impacts
The monitoring of social aspects include both the collection of numerical data such as quantity
volume weight (quantitative indicators) as well as information expressing opinions and
experiences (qualitative indicators) remembering that such measures are compatible and
interchangeable Data collection should be systematic and have a pre-established rate and most
likely a single indicator will require several data collection instruments such as plans field records
reports etc
Social information will be monitored through the use of participatory methodologies In this sense
the preparation process of the Amazon Rio I RPDS Management Plan was a first step For the
18Indicator Design 19Social and Environmental Monitoring of Protected Areas System in the Brazilian Amazon (Sistema de Monitoramento
Socioambiental das Unidades de Conservaccedilatildeo da Amazocircnia Brasileira) 20Metodologia para Avaliaccedilatildeo Raacutepida e a Priorizaccedilatildeo do Manejo de Unidades de Conservaccedilatildeo (RAPPAM)
MONITORING amp IMPLEMENTATION REPORT VCS Version 3 CCB Standards Third Edition
v30 38
socioeconomic characteristics of communities several community meetings land use mapping
workshops and interviews with focus groups were held in addition to field visits (Annex 10) The
main activities of the project were presented and discussed in these events emphasizing the
importance and timeliness of local valuation of environmental services as well as strategies for
raising funds to implement other projects and improvements in social well-being of communities
around the PA
5 MEASUREMENT OF GHG EMISSIONS REDUCTIONS AND REMOVALS (CLIMATE)
51 Emissions Baseline
EBCF did not carry out any wood related exploration activity in the areas since the beginning of
the REDD+ project Thus it is confirmed estimated emission reductions for the project as
8678833 t CO2eq t year
52 Project emissions
Project emissions were primarily those related to the running of offices and necessary travels for
studies meetings presentations workshops and other activities Table 10 presents a summary of
emissions based on data from Annex 21 of this report
Table 05 - 2011-2016 Project Activity Emissions
YEAR Energy
(KWh)
Energy
(t CO2eq)
Travels
(Km)
Travels
(t CO2eq)
Total
(t CO2eq)
2010
678 024 024
2011
104010 2360 2360
2012 1149 008 55724 1573 1581
2013 2756 028 236749 5429 5457
2014 2498 025 15789 459 484
2015 2231 023 27340 597 620
2016 1015 010
010
093 440290 10443 10536
53 Leakage
Not applicable according to presentation made on the REDD+ IFM document
MONITORING amp IMPLEMENTATION REPORT VCS Version 3 CCB Standards Third Edition
v30 39
54 Summary of GHG Emission Reductions And Removals
EBCF REDD+ project shows emissions reduction of 34397563 tCO2e as the balance in the
period of 2011-2015 Table 06 shows the overview of the dynamics of reductions and project
emissions up to 2048 By the year 2015 the emissions data is posted as seen in reports and from
2016 data are projects as previous average and should be adjusted as a result of future reports
Table 06 - Summary of ex ante estimates
Year
Estimated
reductions
from
baseline21
(tCO2e)
Project
Estimated
emissions 22
tCO2e)
Unplanned
estimate
Emissions23
(tCO2e)
Net GHG
Estimated
emissions
Reduction
(tCO2e)
2012 8675500 1581 0 8673919
2013 8675500 5457 0 8670043
2014 8675500 484 296296 8378720
2015 8675500 620 0 8674880
2016 8675500 2100 0 8673400
2017 8675500 2100 0 8673400
2018 8675500 2100 0 8673400
2019 8675500 2100 0 8673400
2020 8675500 2100 0 8673400
2030 8675500 2100 0 8673400
2048 8675500 2100 0 8673400
Total 3123180 25203 296296 3119989
55 Climate Change Adaptation Benefits (GL1)
There is a relatively widespread understanding in the scientific community that balanced
ecosystems have greater ecological and social resilience and adaptability to climate change
21
See annex 18 22
See annex 21 23
See annex 24- HDOM (Study on deforestation and heat spots for EBCF REDD+ Project technical report)
MONITORING amp IMPLEMENTATION REPORT VCS Version 3 CCB Standards Third Edition
v30 40
whether through protection of water bodies and regulation of river flows during peak flood and
drought or through the regular supply of environmental services products and services
Thus once the project is designed to conserve an area of native forest which in the absence of
the project scenario would remain subject to the pressure of timber management (baseline) and
consequent degradation resulting from such activities it is understood that the mere protection of
these areas alone would offer communities and the ecosystem itself better adaptability compared
to the baseline scenario
Moreover the project has an Activity Management Plan (Annex 9) which details among other
initiatives the promotion of the sustainable use of ecosystem resources through direct support in
some activities related to income generation and conservation along with community training It is
believed that in addition to ensuring a more balanced (and therefore more resilient) environment
the project will expand the options for generating income among the communities making them
more resilient and preparing them to face the greater and already perceived challenges posed by
climate change
6 COMMUNITY
61 Positive Impacts for Communities (CM1)
EBCFrsquos REDD+ project was first presented to the riverine communities in 2011 By then
communities were informed about the cessation of all timber exploration activities due to the
REDD+ project and discussions were held regarding biodiversity conservation and the sustainable
use of forest products and services as well the social development of the surrounding
communities Briefly the positive impacts along the communities were
1 Project area zoning and its surroundings
2 Contribution to building local capacity
3 Contribution to developing sustainable business in the region
4 Contribution to social and environmental diagnosis
Knowing to manage
To evaluate the progress of these initiatives throughout the development of the project we used
the methodology of the Sustainability Matrix developed by the Secretariat of Environment and
MONITORING amp IMPLEMENTATION REPORT VCS Version 3 CCB Standards Third Edition
v30 41
Sustainable Development of Amazonas State This tool was applied in 15 communities taking into
account local socio-economic aspects that underlie the development of 20 parameters considered
of great importance to community development described by specific indicators As a visual tool
the Sustainability Matrix is quite suitable for traditional populations such as the riverside and
indigenous communities surrounding the Reserve Amazon River I and other areas of the Project
Additionally the Matrix provides interesting spaces for discussion since its construction is done
collectively Through the Sustainability Matrix it was possible to identify along with the
communities projects activities and implementation strategies Budgets and monitoring and
evaluation of these projects will be detailed later through the Annual Operational Plans to be
developed and followed up in the due course Four programs and nine subprograms were defined
for management and community development (Annex 9)
62 Negative Impacts (CM2)
No negative impacts have been recorded or identified as a result of the project with stakeholders
7 BIODIVERSITY
71 Positive Impacts for Biodiversity (B1)
The benefits for biodiversity are in reducing deforestation and degradation (selective logging) in the
project area According to satellite images analysis in the project areas and their surroundings it
was observed that until 2010 300 hectares were deforested After the implementation of the
project community awareness on the importance of preservation and conservation of forests have
encouraged no deforestation degradation and a significant reduction in deforestation was
identified (see graph below) This was due to the good understanding of the projects conservation
objectives and by the involvement and support of the surrounding communities
MONITORING amp IMPLEMENTATION REPORT VCS Version 3 CCB Standards Third Edition
v30 42
Figure 10 - EBCF REDD Project and buffer areas deforestation figures (source HDOM Report)
The consequences of deforestation and degradation on biodiversity are well known Thus the fact
of not being identified changes (natural or anthropogenic) in forest areas shows there was no loss
of biodiversity no reduction in floristic diversity no impact on the dynamics of fauna and flora and
no loss of evolutionary genetic information
72 Negative Impacts on Biodiversity (B2)
There are no negative impacts on biodiversity as a result of the project
73 Exceptional Benefits for Biodiversity (GL3)
The description of exceptional benefits for biodiversity will only be possible after the re-
measurement of permanent plots (FLORA)
8 ADICIONAL INFORMATION
All activities and the consequent reduction in deforestation and degradation in and around the
project areas were maintained and funded without resources of carbon credits We understand that
with the advance of REDD+ project EBCF will have much better conditions to implement positive
actions in partnership with communities
MONITORING amp IMPLEMENTATION REPORT VCS Version 3 CCB Standards Third Edition
v30 43
REFERENCES
ADEODATO S etal Madeira de ponta a ponta o caminho da floresta ateacute o consumo Satildeo Paulo
FGV-RAE 2011
ALBAGLI S Amazocircnia fronteira geopoliacutetica da biodiversidade Revista Parcerias Estrateacutegicas n
12 p6 set2001 Centro de Estudos Estrateacutegicos do Ministeacuterio da Ciecircncia e Tecnologia
AMARAL I C Viabilidade de plantio de cafeacute na zona da mata mineira Revista Poliacutetica Agriacutecola
Ano xx n4 outnovdez 2011 Disponiacutevel em
httpwwwalicecnptiaembrapabrbitstreamdoc9309031Viabilidadedeplantiopdf Acesso
em 17 de set 2013
AMARAL P etal Floresta para Sempre um manual para a produccedilatildeo de madeira na Amazocircnia
Beleacutem IMAZON 1998 130p
AMAZONAS Lei Complementar nordm 532007 de 05062007 REGULAMENTA o inciso V do artigo
230 e o sect 1ordm do artigo 231 da Constituiccedilatildeo Estadual institui o SISTEMA ESTADUAL DE
UNIDADES DE CONSERVACcedilAtildeO - SEUC dispondo sobre infraccedilotildees e penalidades e
estabelecendo outras providecircncias Disponiacutevel em
httpwwwcetesbspgovbruserfilesfilemudancasclimaticasproclimafilelegislacaoestadua
lamazonasleilei_complementar_n_53_2007_amazonaspdf Acessado em Setembro 2013
ANTAQ Anuaacuterio Estatiacutestico 2004 Distacircncia entre os portos Disponiacutevel em
httpwwwantaqgovbrportalanuariosportuario2004TabelasDistanciaEntrePortospdf
Acesso em 23 de out 2013
ANTAQ Panorama Aquaviaacuterio Agecircncia Nacional de Transportes Aquaviaacuterios Volume 3 Brasiacutelia
ndash DF 2009
MONITORING amp IMPLEMENTATION REPORT VCS Version 3 CCB Standards Third Edition
v30 44
AREDES A F PEREIRA M W G Anaacutelise econocircmica da produccedilatildeo de cafeacute araacutebica um estudo
de caso com simulaccedilotildees de Monte Carlo para sistemas de baixa e alta produtividade
Informaccedilotildees Econocircmicas SP v38 n4 abr 2008
ARIMA E UHL C Pecuaacuteria na Amazocircnia Oriental Desempenho Atual e Perspectivas Futuras Seacuterie
Amazocircnia n1 Beleacutem IMAZON 1996 40p
BACCINI A et al Estimated carbon dioxide emissions from tropical deforestation improved by
carbon-density maps Nature Climate Change vol2 march 2012 (LETTERS Published
Online - DOI 101038NCLIMATE1354)
BARROS A C UHL C Padrotildees problemas e potencial da extraccedilatildeo madeireira ao longo do Rio
Amazonas e do seu estuaacuterio Seacuterie Amazocircnia n4 Beleacutem IMAZON 1997 42p
BRASIL Lei 121872009 (Lei Ordinaacuteria) 29122009 Institui a Poliacutetica Nacional sobre Mudanccedila
do Clima - PNMC e daacute outras Providecircncias Presidecircncia da Repuacuteblica Casa Civil Subchefia
para Assuntos Juriacutedicos Disponiacutevel em lthttpswwwplanaltogovbrccivil_03_ato2007-
20102009leil12187htmgt Acesso em 20 de set 2013
CAMPOS E F Emissatildeo de CO2 da madeira serrada da Amazocircnia o caso da exploraccedilatildeo
convencional 2012 172p Dissertaccedilatildeo - Escola Politeacutecnica Universidade de Satildeo Paulo Satildeo
Paulo
CARDOSO RS e FREITAS C E C A pesca de pequena escala no rio Madeira pelos
desembarques ocorridos em Manicoreacute (Estado do Amazonas) Brasil Revista Acta
Amazocircnica vol 38(4) 2008 781 ndash 788
CCBA Climate Community and Biodiversity Alliance-CCBA 2008 Disponiacutevel em
httpwwwclimate-standardsorgccb-standards Acesso em 03 de set 2013
MONITORING amp IMPLEMENTATION REPORT VCS Version 3 CCB Standards Third Edition
v30 45
CEPEA Centro de Estudos Avanccedilados em Economia Aplicada - ESALQUSP Economia da
pecuaacuteria de corte na regiatildeo norte do Brasil Disponiacutevel em httpgooglL2roiA Acesso em
15 de out 2013
CHAMBERS J Q et al Decomposition and carbon cycling of dead trees in tropical forests of the
central Amazon Oecologia vol122 pp380-388 2000 Agricultores se queixam de
burocracia para contratar creacutedito sustentaacutevel do Programa ABC Correio Braziliense Brasiacutelia
26 fev 2012 Disponiacutevel em
lthttpwww2correiobraziliensecombrsersustentavelp=4592gt Acesso em 10 set 2013
CULLEN Jr L VALLADARES-PAacuteDUA C Onccedilas como detetives da paisagem Ciecircncia Hoje
Vol 156 n26 pp54-571999
CPRM - Serviccedilo Geoloacutegico do Brasil Disponiacutevel em httpwwwcprmgovbr Acesso em 13 de
mar 2013
DIAS F M MORAIS S J S REZENDE R C Anaacutelise da viabilidade econocircmica para a
produccedilatildeo de melancia e cenoura com financiamento em Anaacutepolis-GO 2008 Disponiacutevel em
httpwwwprpuegbr06v1conteudopesquisainiccieneventossic2008fronteiraflashsicani
macaoIIIJORNADAarquivosresumosresumo01pdfgt Acesso em 18 de nov2013
Divisatildeo de Precessamento de Imagens (DPI) Ambdata Mapa de Vegetaccedilatildeo SIPAM RADAM
2002 Disponiacutevel em httpwwwdpiinpebrAmbdatamapa_sipamphp Acesso em 21 de
out 2013
DOMINGUES MS BERNMANN C O arco de desflorestamento na Amazocircnia da pecuaacuteria agrave
soja Ambiente amp Sociedade Satildeo Paulo vol15 n2 pp1-22 maioago 2012
MONITORING amp IMPLEMENTATION REPORT VCS Version 3 CCB Standards Third Edition
v30 46
EBCF Criaccedilatildeo da primeira reserva particular de desenvolvimento sustentaacutevel do mundo na
floresta amazocircnica Disponiacutevel emlthttpwwwebcfcombrblog20130624criacao-da-
primeira-reserva-particular-de-desenvolvimento-sustentavel-do-mundo-na-floresta-
amazonicagt Acesso em 21 de set 2013
EMBRAPA Sistema Brasileiro de Classificaccedilatildeo de Solos 2ordf Ed Rio de Janeiro Embrapa Solos
2006 306 p
FELDPAUSCH T R et al When big trees fall Damage and carbon export by reduced impact
logging in southern Amazonia Forest Ecology and Management Vol 219 pp199-215 2005
FEARNSIDE P MDesmatamento na Amazocircnia dinacircmica impactos e controle Acta Amazocircnica
vol 36 n3 pp 395-400 2006
FILGUEIRAS T S et al 1994 Caminhamento Um meacutetodo expedito para levantamentos
floriacutesticos qualitativos Caderno de Geociecircncia IBGE vol12 pp39-43 1994
Forest Management Public Summary for Gethal Amazonas SA Induacutestria de Madeira
Compensada Certification Code SW-FMCOC-119 Date of Certification October 1
2000 Date of Public Summary October 2000 Updated for Annual Audit 2002 Annual Audit
2003 (Gethalpdf)
Globo Rural Linha de financiamento para a agricultura de baixo carbono tem pouca procura
2011 Disponiacutevel em httpwwwrainforest-allianceorgforestrydocumentsgethalpdf
Acesso em 16 de nov 2013
GREENPEACE Face a Face com a Destruiccedilatildeo Relatoacuterio Greenpeace sobre as companhias
multinacionais madeireiras na Amazocircnia Brasileira 1999 Disponiacutevel em
MONITORING amp IMPLEMENTATION REPORT VCS Version 3 CCB Standards Third Edition
v30 47
lthttpwwwgreenpeaceorgbramazoniaface_destruicaopdfgt Acesso em 11 de set
2013
Governo do Estado do Amazonas Plano de Gestao da RDS do Rio Amapaacute 2010 Disponiacutevel em
httpobservatoriowwforgbrsite_mediauploadgestaoplanoManejorio_amapapdf Acesso
em 24 de ago 2013
HDOM Estimates from processing the forest inventories data carried out during the CADAF
Project Final Technical Report 2012 Disponiacutevel em wwwhdomcombr Acesso em 27 de
maio 2013
HIGUCHI N 1986-87 Amostragem sistemaacutetica versus amostragem aleatoacuteria em floresta tropical
uacutemida de terra-firme na regiatildeo de Manaus Acta Amazonica 1617 (uacutenico) 393-400
HIGUCHI N SANTOS J JARDIM FCS Tamanho de parcela amostral para inventaacuterios
florestais Acta Amazocircnica vol12 n1 pp91-103 1982
HIGUCHI F G PINTO A C M ISHIZUKA M KAJIMOTO T LIMA A J N SANTOS J
HIGUCHI N Estoque e dinacircmica de biomassa acima do solo das florestas de terra firme do
estado do Amazonas In Adriano Joseacute Nogueira Lima Flaacutevia Machado Durgante Moacir
Alberto Assis Campos Joaquim dos Santos Moriyoshi Ishizuka Niro Higuchi (Org)
Dinacircmica do carbono das florestas da Amazocircnia resultados do Projeto CADAF
1edManaus INPA 2014 v 1 p 29-34
HOLMES T P etal Custos e benefiacutecios financeiros da exploraccedilatildeo de impacto reduzido em
comparaccedilatildeo agrave exploraccedilatildeo florestal convencional na Amazocircnia oriental 2ordf ed Beleacutem
Fundaccedilatildeo Floresta Tropical 2002 66p
HUSCH B MILLER C I BEERS T W Forest mensuration New York Ronald Press 1971
HUSCH B MILLER C I BEERS T W Forest Mensuration New York John Wiley amp Sons
2nd
ed 1972 402 p
MONITORING amp IMPLEMENTATION REPORT VCS Version 3 CCB Standards Third Edition
v30 48
IBGE Instituto Brasileiro de Geografia e Estatiacutestica Diretoria de GeociecircnciasCoordenaccedilatildeo de
Recursos Naturais e Estudos Ambientais Geologia Solos Hidrografia e Vegetaccedilatildeo 2000
IBGE Instituto Brasileiro de Geografia e Estatiacutestica Manicoreacute 2010 Disponiacutevel
emlthttpwwwsidraibgegovbrgt Acesso em 05 de set 2013
IBGE Instituto Brasileiro de Geografia e Estatiacutestica 2011 Disponiacutevel em httpwwwibgegovbr
Acesso em 19 de mar 2013
IBGE Instituto Brasileiro de Geografia e Estatiacutestica Extraccedilatildeo vegetal e silvicultura para o
municiacutepio de Manicoreacute 2011 Disponiacutevel em
lthttpcidadesibgegovbrxtrastemasphplang=ampcodmun=130270ampidtema=102ampsearch=a
mazonas|manicore|extracao-vegetal-e-silvicultura-2011gt Acesso em 10 de out 2013
IBGE Instituto Brasileiro de Geografia e Estatiacutestica Censo Demograacutefico 2010 Disponiacutevel em
lthttpcidadesibgegovbrxtrastemasphpcodmun=130270ampidtema=116gt Acesso em 18
de out 2013
IBGE Instituto Brasileiro de Geografia e Estatiacutestica Censo Demograacutefico 2010 Disponiacutevel
emlthttpcidadesibgegovbrxtrashomephpgt Acesso em 08 de out 2013
IDESAM Reduccedilotildees de Emissotildees do Desmatamento e Degradaccedilatildeo Florestal (REDD+) estudo de
oportunidades para a regiatildeo sul do Amazonas CENAMO M Cl CARRERO G C
GANDOLFO P (Org) Manaus 2011 Disponiacutevel em
lthttpwwwobservatoriodoreddorgbrsitepdfestudodeoportunidadespdfgt Acesso em 13 de
set 2013
MONITORING amp IMPLEMENTATION REPORT VCS Version 3 CCB Standards Third Edition
v30 49
IDESAM Semeando Sustentabilidade em Apuiacute ndash Resultados e Perspectivas 2011 Manaus
Disponivel em lthttpidesamorgbrsemeando-sustentabilidade-em-apui-resultados-e-
perspectivasUxX8nfldWYI
IEA Instituto de Economia Aplicada CO2 Emissions from fuel combustion 2012 Disponiacutevel em
httpwwwieaorgco2highlightsco2highlightspdf Acesso em 09 de out 2013
IGREJA H L S CATIQUE J Anaacutelise neotectocircnica do lineamento de Itacoatiara centro leste do
Estado do Amazonas In Simpoacutesio Nacional de Estudos Tectocircnicos 6 1997 Pirenoacutepolis
Anais Pirenoacutepolis-GO SBG-Nuacutecleo Brasiacutelia1997
IMAZON Instituto do Homem e do Meio Ambiente da Amazocircnia Fatos Florestais 2010a
Disponiacutevel em httpwwwimazonorgbrpublicacoeslivrosfatos-florestais-da-amazonia-
2010-1 Acesso em 14 de out 2013
IMAZOM Instituto do Homem e do Meio Ambiente da Amazocircnia Mercado e preccedilo da madeira
amazocircnica 2010 Disponiacutevel em httpwwwimazonorgbrpublicacoesprecos-de-madeira-
em-toraboletim-de-precos-de-madeira-em-tora-na-amazonia-julho-2010at_downloadfile
Acesso em 23 de nov 2013
IMAZON Instituto do Homem e do Meio Ambiente da Amazocircnia Portal de Geoinformaccedilatildeo sobre
a Amazocircnia Disponiacutevel em lthttpwwwimazongeoorgbrimazongeophpgt Acesso em 06
de set 2013
IMAZON Instituto do Homem e do Meio Ambiente da Amazocircnia Transparecircncia florestal
Amazocircnia Legal 2012 Disponiacutevel em lthttpwwwimazonorgbrpublicacoestransparencia-
florestaltransparencia-florestal-amazonia-legalcopy_of_SADOutubro2012pdfgt Acesso em
23 de set 2013
IMAZON Instituto do Homem e do Meio Ambiente da Amazocircnia PEREIRA D SANTOS D
VEDOVETO M GIMARAtildeES J VERIacuteSSIMO A (Orgs) Fatos Florestais da Amazocircnia
Beleacutem IMAZON 2010 244p Disponiacutevel em
MONITORING amp IMPLEMENTATION REPORT VCS Version 3 CCB Standards Third Edition
v30 50
lthttpwwwimazonorgbrpublicacoeslivrosfatos-florestais-da-amazonia-2010-1gt Acesso
em 24 de set 2013
IMAZON Instituto do Homem e do Meio Ambiente da Amazocircnia A Expansatildeo madeireira na
Amazocircnia Impactos e perspectivas para o desenvolvimento sustentaacutevel no Paraacute BARROS
AC VERIacuteSSIMO A (Eds) Beleacutem IMAZON 2002
IMAZON Instituto do Homem e do Meio Ambiente da Amazocircnia Custos e Benefiacutecios do Manejo
Florestal Para Produccedilatildeo de Madeira na Amazocircnia Oriental 1998 Disponiacutevel em
lthttpwwwimazonorgbrpublicacoesserie-amazoniacustos-e-beneficios-do-manejo-
florestal-para-producao-de-madeira-na-amazonia-orientalgt Acesso em 20 de set 2013
INPE Instituto de Pesquisas Espaciais Banco de dados PRODES 2012 Disponiacutevel em
lthttpwwwdpiinpebrprodesdigitalprodesphpgt Acesso em 09 de set 2013
INPE Instituto de Pesquisas Espaciais Banco de dados DEGRAD 2009 Disponiacutevel em
lthttpwwwobtinpebrdegradgt Acesso em 09 de set 2013
INPE Instituto de Pesquisas Espaciais Banco de dados DETER 2013 Disponiacutevel em
lthttpwwwobtinpebrdetergt Acesso em 10 de set 2013
INPE Instituto de Pesquisas Espaciais Banco de dados de queimadas e focos de calor
BDQUEIMADAS 2013 Disponiacutevel em lthttpwwwdpiinpebrproarcobdqueimadasgt
Acesso em 10 de set 2013
Instituto Carbono Brasil Soacute 2 da produccedilatildeo de madeira eacute certificada O Estado de SPaulo 2006
Disponiacutevel em lthttpwwwinstitutocarbonobrasilorgbrnoticias6noticia=119796gt Acesso
em 26 de set 2013
MONITORING amp IMPLEMENTATION REPORT VCS Version 3 CCB Standards Third Edition
v30 51
IFT Instituto Floresta Tropical Diagnoacutestico do Setor Florestal de Cotriguaccedilu Estado do Mato
Grosso 2010 Disponiacutevel em lthttpgooglEVx2RZgt Acesso em 16 de dez 2013
IPCC Guidelines for National Greenhouse Gas Inventories In National Greenhouse Gas
Inventories Programme EGGLESTON HS BUENDIA L MIWA K NGARA T TANABE
K (Eds) Japan IGES 2006
ITTO Annual review and assessment of the world timber situation 2011 Disponivel em
httpwwwittointannual_review Acesso em 10 de out 2013
KELLER M et al Coarse woody debris in undisturbed and logged forests in the eastern Brazilian
Amazon Global Change Biology vol10 PP784-795 2004
LENTINI M VERISSIMO A PEREIRA D A expansatildeo madeireira na Amazocircnia O Estado da
Amazocircnia n2 2005 Beleacutem IMAZON Disponiacutevel em
httpwwwimazonorgbruploadea_2ppdf Acesso em 06 de set 2013
LOETSCH F ZOumlHRER F HALLER K E Forest Inventory Munich BLV Verlagsgesellschaft
2nd
edition Vol II 1973 469 p
MAGNUSSON WE et al RAPELD uma modificaccedilatildeo do meacutetodo de Gentry para inventaacuterios de
biodiversidade em siacutetios para pesquisa ecoloacutegica de longa duraccedilatildeo Biota Neotrop JulDez
2005 vol 5 no 2 httpwwwbiotaneotropicaorgbrv5n2ptabstractpoint-of-
view+bn01005022005 ISSN 1676-0603
MARINELLI C E et al O programa de monitoramento da biodiversidade da biodiversidade e do
uso de recursos naturais em unidades de conservaccedilatildeo estaduais do Amazonas Secretaria
de Estado do Meio Ambiente e Desenvolvimento Sustentaacutevel - SDS Manaus SDS 2007
MONITORING amp IMPLEMENTATION REPORT VCS Version 3 CCB Standards Third Edition
v30 52
MARINELLI C E MALTEZ M H Indicadores de Sustentabilidade para Unidades de
Conservaccedilatildeo Documento-Siacutentese Workshop Instituto Socioambiental Brasiacutelia-DF 2010
76p
MAZZEI L et al Above-ground biomass dynamics after reduced-impact logging in the Eastern
Amazon Forest Ecology and Management vol 259 pp367-373 2010
MEIRELLES FILHO O Livro de Ouro da Amazocircnia 5ordf Ediccedilatildeo Rio de Janeiro EDIOURO 2007
422p Meirelles Filho J O Livro de Ouro da Amazocircnia 1ordf ed Editora Ediouro ISBN
8500021616 2007 450p
MENGER Juliana da Silva Fatores determinantes da distribuiccedilatildeo de aves no interfluacutevio Purus-
Madeira Manaus [sn] 2011 35 fl il
MCT Arquivos dos Fatores de Emissatildeo Disponiacutevel em
httpwwwmctgovbrindexphpcontentview321144htmlancora Acesso em 23 de out
2013
MMA Ministeacuterio do Meio Ambiente Avaliaccedilatildeo e identificaccedilatildeo de accedilotildees prioritaacuterias para a
conservaccedilatildeo utilizaccedilatildeo sustentaacutevel e reparticcedilatildeo dos benefiacutecios da biodiversidade na
Amazocircnia brasileira Brasiacutelia MMASBF 2001
MMA Ministeacuterio do Meio Ambiente Secretaria de Biodiversidade e Florestas Aacutereas Prioritaacuterias
para Conservaccedilatildeo Uso Sustentaacutevel e Reparticcedilatildeo de Benefiacutecios da Biodiversidade Brasileira
Atualizaccedilatildeo - Portaria MMA ndeg9 de 23 de janeiro de 2007 Brasiacutelia MMA 2007 (Seacuterie
Biodiversidade 31)
MONITORING amp IMPLEMENTATION REPORT VCS Version 3 CCB Standards Third Edition
v30 53
MMA Livro vermelho da fauna brasileira ameaccedilada de extinccedilatildeo editores Angelo Barbosa
Monteiro Machado Glaacuteucia Moreira Drummond Adriano Pereira Paglia 1ed 2008 Brasiacutelia
DF MMA Belo Horizonte MG Fundaccedilatildeo Biodiversitas (1420 p) il - (Biodiversidade 19)
OLIVEIRA M M HIGUCHI N CELES C H HIGUCHI F G 2014 Tamanho e formas de
parcelas para inventaacuterios florestais de espeacutecies arboacutereas na Amazocircnia Central Ciecircncia
Florestal Santa Maria v 24 n 3 p 645-653
PEARSON TRH WALKER S BROWN SL The Source Book for Land Use Land Use
Change and Forestry Projects BioCarbon Fund and Winrock International 2005 64 pp
PORTAL AMAZOcircNIA Amazocircnia de A a Z Disponiacutevel em
lthttpportalamazoniaglobocomgt Acesso em 13 de set 2013
PEacuteLLICO NETTO S BRENA D A Inventaacuterio florestal Curitiba Editorado pelos autores p
316 1997
PROJETO SIVAM Relatoacuterio metodoloacutegico de trabalho Revisatildeo 3 Diretoria de Geociecircncia Rio de
Janeiro 2002 330 pp
PROJETO SIVAM Atualizaccedilatildeo do RADAMBRASIL Mapa de Vegetacao da Amazonia Legal
Mapa de Fitofisionomias ndash RADAMSIPAM DNPM Ministeacuterio de Minas e Energia 2002
Disponiacutevel em httpwwwdpiinpebramb_dataShapefilesveg_Amz_SIPAMzip Acesso
em 21 de jan 2014
PROJETO FLORESTAL SANTA MARIA (PROJETO FSM-REDD) Plant Inteligecircncia Ambiental ndash
Warwick Manfrinato 2012 Disponiacutevel em
lthttpwwwflorestalsantamariacombrsitedocumentos57FSM_REDD_VCS_PD_ptpdfgt
Acesso em 09 de set 2013
MONITORING amp IMPLEMENTATION REPORT VCS Version 3 CCB Standards Third Edition
v30 54
RADAMBRASIL Programa de Integraccedilatildeo Nacional Levantamentos de Recursos Naturais v 14 ndash
RADAM DNPM Ministeacuterio de Minas e Energia Brasil 1974
RIBEIRO J E L et al Flora da Reserva Ducke guia de identificaccedilatildeo das plantas vasculares de
uma floresta de terra firme na Amazocircnia Central Manaus Editora INPA 1999
ROSAS F C W WALDEMARIN H de MATTOS G E Pteronura rasiliensis (Zimmermann
1780) In MACHADO A B M DRUMMOND G M PAGLIA A P (eds) Livro Vermelho da
Fauna Brasileira Ameaccedilada de Extinccedilatildeo Volume II 1ed Brasiacutelia DF Ministeacuterio do Meio
Ambiente 2008 p 800 - 801
ROSS D GHG Emissions Resulting from Aircraft Travel 2009 Disponiacutevel em
httpwwwcarbonplanetcomdownloadsFlight_Calculator_Information_v92pdf Acesso em
14 de out 2013
SANTOS A J et al Viabilidade econocircmica do sistema agroflorestal greviacutelea x cafeacute na regiatildeo
norte do Paranaacute CERNE vol6 n1 pp89-100 2000
SANTOS R A Custo do manejo florestal madeireiro estudo de caso Floresta Estadual do
Antimary Monografia (Bacharelado em Economia) ndash Departamento de Ciecircncias
Econocircmicas Universidade Federal do Acre 2007109p
SABOGAL C et al Manejo Florestal Empresarial na Amazocircnia Brasileira restriccedilotildees e
oportunidades (Relatoacuterio Siacutentese) Beleacutem CIFORIMAZON 2006 72p
SDSCEUC Secretaria Estadual de Meio Ambiente e Desenvolvimento Sustentaacutevel ndash Centro
Estadual de Unidades de Conservaccedilatildeo Programa de Monitoramento de Biodiversidade e
Uso de Recursos Naturais em Aacutereas Protegidas do Estado Amazonas (ProBUC) 2006
Disponiacutevel em
MONITORING amp IMPLEMENTATION REPORT VCS Version 3 CCB Standards Third Edition
v30 55
httpbrazilwcsorgDesktopModulesBring2mindDMXDownloadaspxEntryId=6168ampPortalI
d=93ampDownloadMethod=attachment Acesso em 11 de ago de 2013
SFBIMAZON Serviccedilo Florestal Brasileiro e Instituto do Homem e Meio Ambiente da Amazocircnia A
atividade madeireira na Amazocircnia brasileira produccedilatildeo receita e mercados 2010 Disponiacutevel
em httpwwwmmagovbrestruturassfb_arquivosmiolo_resexec_polo_03_95_1pdf
Acesso em 23 de out 2013
SILVA R P da Alometria estoque e dinacircmica da biomassa de florestas primaacuterias e
secundaacuterias na regiatildeo de Manaus (AM) 152 p Tese de Doutorado Programa Integrado
de Poacutes-graduaccedilatildeo em Biologia Tropical e Recursos Naturais (INPA) Manaus 2007
SILVA Z A G P G SANTOS R A Custo do manejo florestal madeireiro em floresta puacuteblica
estudo de caso no Acre 2011 Disponiacutevel em
lthttpwwwbasacombrbancoamazonia2Revistaedicao_13n13_custo_do_manejo_flores
pdfgt Acesso em 13 de set 2013
SMIDT M GALLAGHER T Factors Affecting Fuel Consumption and Harvesting Costs Auburn
School of Forestry and Wildlife Sciences Sd Disponiacutevel em
httpweb1cnrevteduforestrycofedocuments2013Smidt_Gallagherpdf Acesso em 21
de out 2013
SOARES-FILHO B et al Role of Brazilian Amazon protected areas in climate change mitigation
2010 Columbia University NY Ruth S DeFries 2010
SPF Serviccedilo Puacuteblico Federal DVPF Documento de venda de produto Florestal (Declaraccedilotildees de
venda Gethalpdf) 14 de julho de 2006
MONITORING amp IMPLEMENTATION REPORT VCS Version 3 CCB Standards Third Edition
v30 56
TIMOFEICZYK JUacuteNIOR R et al Rentabilidade econocircmica do manejo de baixo impacto em
florestas tropicais um estudo de caso Revista Floresta Curitiba v 38 n 4 p 711-725
outdez 2008
VCS Ferramenta para Demonstraccedilatildeo e Avaliaccedilatildeo de Adicionalidade para Atividades de Projetos
VCS em Agricultura Floresta e Outros Usos (AFOLU) 2012a Disponiacutevel em httpwwwv-c-
sorgsitesv-c-sorgfilesVT000120VCS20AFOLU20Additionality20Tool20v30pdf
Acesso em 24 de set 2013
VCS Ferramenta de Risco e Natildeo Permanecircncia (AFOLU) 2012B Disponiacutevel em httpv-c-
sorgsitesv-c-sorgfilesAFOLU20Non-Permanence20Risk20Tool2C20v32pdf
Acesso em 13 de set 2013
VCS Approved VCS Methodology VM0010 Version 10 - Methodology for Improved Forest
Management Conversion to Logged to Protected Forest Calculating GHG Benefits from
Preventing Planned Degradation PHUA S SHARMA S TELFER M CHANDLER H
(Eds) Califoacuternia EUA Carbon Planet Limited 2011149p
VERDEJO M E Diagnoacutestico Rural Participativo um guia praacutetico Brasiacutelia MDA 2006 62p
VIANNA A L M Diagnoacutestico Florestal do Estado do Amazonas 2010 e 2011 Manaus-AM
IDESAM 2013 (Relatoacuterio Final do Projeto Fortalecimento da participaccedilatildeo da sociedade civil
no Amazonas Foacuterum de Mudanccedilas Climaacuteticas Transparecircncia Florestal no Estado do
Amazonas ndash Mapeamento de Instrumentos Legislativos no Brasil)
WBCSDWRI The GHG Protocol for Project Accountin Washington World Business Council for
Sustainable DevelopmentWorld Resources Institute 2005148 p
MONITORING amp IMPLEMENTATION REPORT VCS Version 3 CCB Standards Third Edition
v30 57
WALKER W et al Guia de Campo para Estimativa de Biomassa Florestal e Estoque de Carbono
Woods Hole Center Research Falmouth Massachusetts USA 2011 Disponiacutevel em
httpwwwwhrcorgresourcesfieldguidescarbonpdfWHRC_FieldGuide_PortugueseSMpdf
Acesso em 14 de set 2013
WWF Metodologia para Avaliaccedilatildeo Raacutepida e a Priorizaccedilatildeo do Manejo de Unidades de
Conservaccedilatildeo (RAPPAM) 2010 Disponiacutevel em httpgooglXfDnxs Acesso em 30 de set
2013
WWF-Brasil Efetividade de Gestatildeo das Unidades de Conservaccedilatildeo no Estado do Amazonas
Secretaria de Estado do Meio Ambiente e do Desenvolvimento Sustentaacutevel do Amazonas
Instituto Chico Mendes de Conservaccedilatildeo da Biodiversidade Brasiacutelia WWF-Brasil 2011 72 p
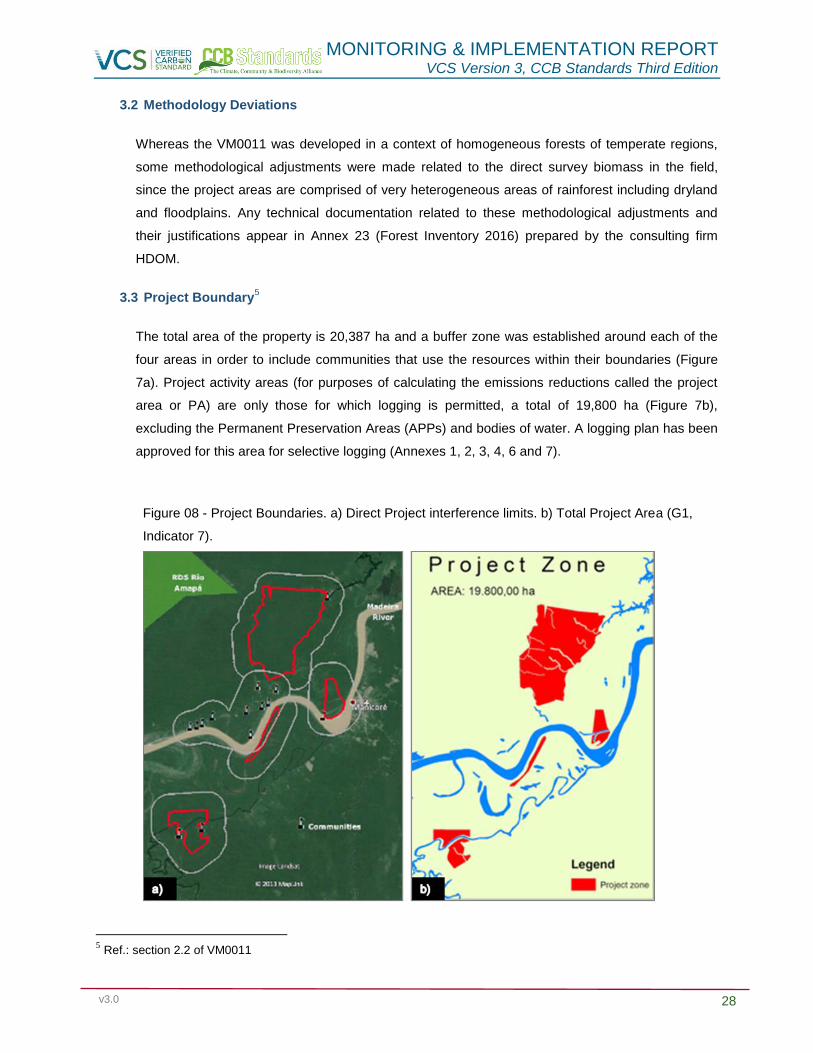
MONITORING amp IMPLEMENTATION REPORT VCS Version 3 CCB Standards Third Edition
v30 28
32 Methodology Deviations
Whereas the VM0011 was developed in a context of homogeneous forests of temperate regions
some methodological adjustments were made related to the direct survey biomass in the field
since the project areas are comprised of very heterogeneous areas of rainforest including dryland
and floodplains Any technical documentation related to these methodological adjustments and
their justifications appear in Annex 23 (Forest Inventory 2016) prepared by the consulting firm
HDOM
33 Project Boundary5
The total area of the property is 20387 ha and a buffer zone was established around each of the
four areas in order to include communities that use the resources within their boundaries (Figure
7a) Project activity areas (for purposes of calculating the emissions reductions called the project
area or PA) are only those for which logging is permitted a total of 19800 ha (Figure 7b)
excluding the Permanent Preservation Areas (APPs) and bodies of water A logging plan has been
approved for this area for selective logging (Annexes 1 2 3 4 6 and 7)
Figure 08 - Project Boundaries a) Direct Project interference limits b) Total Project Area (G1
Indicator 7)
5 Ref section 22 of VM0011
MONITORING amp IMPLEMENTATION REPORT VCS Version 3 CCB Standards Third Edition
v30 29
Stratification of the project area
For purposes of inventorying local carbon stocks and project management the project area was
stratified into 3 groups of different forest types as indicated by the VM0011 according to the
vegetation map SIPAMRADAM (DPI 2002) The forest types present in the area are rain forest
types divided into 3 categories as follows
Dense Primary Tropical Ombrophylous Alluvial Forest
Dense Primary Tropical Ombrophylous Lowland Forest
Pioneer Formations
Figure 09 - Project Area forest types
Leakage areas
There is no direct leakage resulting from planned project activities since there will be neither
displacement of management activities to other areas after the cessation of the activities within the
project area nor market leakages The project Management Plan includes the monitoring of
MONITORING amp IMPLEMENTATION REPORT VCS Version 3 CCB Standards Third Edition
v30 30
possible unanticipated leakages around the project area as well as the need to report to the
competent authorities whenever logging activities are identified in these areas For more
information on leakage see chapters 52 and 55 of this document
Temporal boundaries
Crediting period of the project
The first crediting period of the project is 37 years beginning on August 17 2012 and ending on 17
August 2049 This period is equivalent to the remaining 12 years of the first authorized
management plan (25 years from 1998) added to another 25 years in respect of a new forest
management plan that was intended as the common practice of forestry in Brazil The logging
activities could continue beyond 37 years aiming for a second crediting period
Monitoring and Reporting Period
a) Monitoring of Baseline Emissions
The monitoring of Baseline Emissions must demonstrate that the protected forest area is in
accordance with the one specified in the PD The project limit will be monitored before each
verification throughout the crediting period through new inventory information and remote sensing
and GIS as applicable Thus the project will be able to update the baseline calculations based on
the actual remaining forest area (in case of loss of forest cover by disasters for example) and that
would be subject to forest management under a ldquowithout projectrdquo scenario
b) Monitoring of Project Emissions
Project emissions will be monitored annually and compiled in every monitoring report that will detail
in particular the
Monitoring of possible illegal harvesting of timber
Monitoring of areas subject to natural disturbances
Monitoring and quantification of emissions related to air and land travel related to project
activities
c) Monitoring of Leakage
Since there will be no leakages according to the VM0011 and AFOLU Requirements no leakage
monitoring will be necessary However to be conservative the project intends to monitor any
disturbances that might affect the carbon reservoirs Once some disturbance is registered the
project will report the incident to the relevant authorities and make the necessary adjustments to
MONITORING amp IMPLEMENTATION REPORT VCS Version 3 CCB Standards Third Edition
v30 31
the baseline For more details about the monitoring of leakages see chapters 52 and 55 of this
document
Carbon stocks
The biomass reservoirs considered by the project are related to above-ground and underground
biomass
Sources and sinks of GHGs
Table 02 below describes the emission sources and sinks of greenhouse gases associated with
the baseline activities and with the project
Table 03 - Greenhouse gas emissions sources and sinks associated with baseline and project
activities
Source Gas Included JustificationExplanation
Baselin
e
Biomass
CO2 Yes Main source of project emissions through forest
degradation harvested and commercialised
wood products deadwood and forest regrowth
CH4 No Conservatively excluded
N2O No Conservatively excluded
Other No -
Fossil Fuel
consumption
CO2 Yes Main source through fossil fuel use in
machinery and transportation of timber
CH4 Yes Conservatively included
N2O Yes Conservatively included
Other No -
Electricity
consumption
CO2 Yes Main source
CH4 No -
N2O No -
Other No -
Pro
ject
Biomass
CO2 Yes Main source through unexpected natural
disturbances such as forest fires etc
CH4 Yes Included but subject to significance
N2O Yes Included but subject to significance
MONITORING amp IMPLEMENTATION REPORT VCS Version 3 CCB Standards Third Edition
v30 32
Source Gas Included JustificationExplanation
Other No _
Fossil Fuel
consumption
CO2 Yes Main source through flights and ground travel
CH4 Yes Included but subject to significance
N2O Yes Included but subject to significance
Other No _
Electricity
consumption
CO2 Yes Main source
CH4 No _
N2O No _
Other No _
34 Baseline Scenario
The choice between alternative baseline scenarios was taken together with the analysis of
additionality using the latest version of the VCS Tool for the demonstration and assessment of
additionality in Agriculture Forestry and Other Land Use VCS projects in this case VT000167
(VCS 2012a) All possible scenarios as well as the analysis of methodology barriers (steps 211
and 212 of the VM0011) are present in the chapter below In this sense to avoid redundancy of
information refer to additionality analysis to find the steps 211 and 212 of the VM0011
The baseline scenario for the project identified as the most likely to occur was selective logging8
(continuation of Business As Usual - BAU) The reference scenario assumes 37 years of selective
logging according to the 25 year logging plan approved in August 1998 (Annex 6 - document
ValdII T01 POA 1998) that in the absence of project activities would be renewed in 2024 for
another 25 years until 2049
Under this scenario the full implementation of the timber logging plan occurs and which has
already resulted in the degradation of 434769 ha (see table below) The area would be harvested
selectively for timber sold in lumber markets Below is a summary of harvest areas between 1999
and 2010 showing the managed plots and the dates on which the harvests were authorized
6 Tool for the demonstration and assessment of an additional to the VCS project activities in Agriculture Forestry and Other
Uses (AFOLU) (V 30)
7 Adapted from ldquoTool for the Demonstration and Assessment of Additionality in AR CDM project Activitiesrdquo (V02) 8 Additional information about choosing the baseline are presented in section 46 (steps 1 and 2)
MONITORING amp IMPLEMENTATION REPORT VCS Version 3 CCB Standards Third Edition
v30 33
Table 04 - Summary of areas managed since 1999
Date Managed logged area (ha)
1999 58669 (Plot 1)
2000 688 (Plot 2)
2001 ndash 2002 8315 (Plot 3)
2003 ndash 2004 750 (Plots 3 and 4)
2005 ndash 2007 1082 (Plot 5)
2008 ndash 2009 49050 (Plots 5 and 6)
TOTAL 434769
35 Additionality
The additionality analysis of the Amazon Rio project REDD+ IFM was conducted with the latest
version of the VCS Tool for the demonstration and assessment of additionality in Agriculture
Forestry and Other Land Use VCS projects the VT000167
(VCS 2012a)
To generate the reductions in GHG emissions for the project the planned baseline activities
(sustainable forest management) were terminated by the project proponent and supplanted by
environmental conservation activities In this sense the project will be managed by EBCF with
the goal of creating a fund for administrative and accounting management especially to promote
environmental management and monitoring activities of carbon pools within the project area
Alternative activities planned in the project are the provisioning and valuation of environmental
services via carbon credits (VCUs) in conjunction with the sale of Environmental Reserve Quotas
(CRAs)
4 MONITORING AND PARAMETERS OF DATA
41 Monitoring Plan Description
Due to its innovative comprehensive and integrative character the project needs to be monitored
regularly so that its actions activities and impacts can be constantly measured and evaluated To
meet this requirement the monitoring process must meet three main objectives
MONITORING amp IMPLEMENTATION REPORT VCS Version 3 CCB Standards Third Edition
v30 34
i To serve as an internal management project tool
ii To collaborate as an instrument of collective learning from the communities and
social groups directly involved
iii To work as a means of communicating results and impacts to interested institutions
and society in general Furthermore it is important to consider that monitoring if
successful will transcend the managerial aspects of the project and strengthening
the plan
To facilitate the monitoring process instead of having a reference line (to compare interventions
before and after) the first year of monitoring will serve as the starting point whose information will
be regularly and systematically compared throughout the project
Next the initial plans for monitoring benefits to the climate community and biodiversity are
described wherein the community is committed to participatory precept and to the technical and
scientific rigor which is capable of following the possible negative and positive impacts on
environmental and social aspects in the project area and its surroundings
Monitoring of Climate Impacts
The Monitoring Plan (MP) aims to provide security in the periodic estimates of reduction in
emissions especially in monitoring changes in carbon stock Therefore emissions from the
implementation of the project ex post estimates of the activities and emissions from any leakages
and isolated disturbances (eg blowdown fires pests and diseases among others) can be
calculated
The construction of the PM of the climate benefits made in full compliance with the methodological
framework provided by VM0011 ndash IFM LPF (VCS 2011) and CCBA (2008) which consists of four
specific actions to be monitored
i Implementation and execution of the project
ii Dynamics and stock of the forest biomass
iii Deforestation and forest degradation
iv Periodic reviews of ex post emissions
Remote monitoring and surveillance of the project area
Measurement of alterations and biomass loss quantification present in the PA using land use
change detection is critical to make accurate estimates of GHG emissions that account for forest
biomass increases and losses
MONITORING amp IMPLEMENTATION REPORT VCS Version 3 CCB Standards Third Edition
v30 35
Thus the use of remote sensing by satellite images of medium spatial resolution can be applied
readily in the PA and surroundings in order to monitor land use dynamics over time particularly to
identify risks and threats to forested areas In situ verification will complement landscape analysis
in a GIS environment with the aim of quantifying spatializing and identifying conversion of forest
areas into other land uses environmental degradation and other possible changes that may occur
during the term of the project
As a complementary monitoring source the project will rely on the database and information
provided by Monitoring Program of the Brazilian Amazon Forest by Satellite 910
(Prodes Digital)
conducted by the National Institute for Space Research (Instituto Nacional de Pesquisas Espaciais
- INPE) according to the Plan for Prevention and Control of Deforestation in the Amazon
1112(PPCDAm) under the National Policy on Prevention and Control of Deforestation Such
information is available online in13
digital vector files for the public in general
Other tools will provide complementary information to the monitoring such as indicators of forest
degradation and hotspots (fires and wildfires) obtained from DETER 14
SAD 15
and PROARCO16
Information is available online for free in vector format These results will be systematically related
to field data for validating or disproving the occurred event so that the focuses of deforestation and
degradation can be identified remediated reported and consequently avoided as much as
possible
A surveillance system that allows permanent territorial monitoring and inhibits the entry of intruders
through entry points in the PA will also be deployed to control the transport flow In addition one
must investigate and identify risks and threats eg mapping hotspots and areas vulnerable to fire
to illegal logging to hunting and poaching and to invasions by third parties among others
At first we estimate an effective demand for structuring the electronic monitoring system which
includes the hiring of skilled professionals field equipment electronic equipment (digital cameras
GPS desktops and notebooks smartphones printers geoprocessing software and GIS among
others) vehicles andor motorcycles motorized boats for transportation and moving around and
the collection of high resolution satellite images Empowerment and training of all involved staff
9httpwwwobtinpebrprodesdigitalmetodologiahtml
10httpwwwobtinpebrprodesmetodologiapdf 11httpwwwmmagovbrflorestascontrole-e-prevenC3A7C3A3o-do-desmatamento 12httpwwwmmagovbrimagesarquivo80120PPCDAm_FINAL_PPCDAMPDF 13httpwwwobtinpebrprodesindexhtml 14httpwwwobtinpebrdeterdados 15httpwwwimazongeoorgbrdocdownloadsphp 16httpwwwdpiinpebrproarcobdqueimadas
MONITORING amp IMPLEMENTATION REPORT VCS Version 3 CCB Standards Third Edition
v30 36
and the surrounding communities will be necessary to make the system effective17
and a constant
stream of information directed to regional actors and other stakeholders
Strategic monitoring and access points to RPDS roads will also provide support to other MPs
including social and biodiversity conservation aspects especially in the logistic support of planned
field activities
Procedures for determining the permanent sample plots (PSPs) and measurement
The calculation of the stock and increase in forest biomass will be subsidized through the
installation of PSPs in the PA and its temporal monitoring through the Continuous Forest Inventory
(CFI) The methodology proposed by VCS (2011) suggests the use of permanent andor temporary
plots however it confirms the efficiency and accuracy of sample plots
In order to demonstrate the procedural and statistical rigor used all the sampling procedures the
PA forest stratification sampling design calculation of sampling intensity and other parameters
measured in PSPs to monitor biomass balance due to ingressmortality of individuals growth in
DBH and height will be presented in detail in the Annex (Annex 23 - Forest Inventory 2016)
To promote reliable forest biomass estimates standard operating procedures (SOPs) (Section 82)
will be used by the team executing the CFI
Monitoring frequency
The monitoring frequency parameters measured in the PSPs will be no greater than 5 years from
the first measurement Other relevant parameters to monitoring the PSPs like the change in land
use in the PA and surrounding areas such as deforestation forest degradation fire sources and
natural disturbances will be regularly monitored as a project routine operation organized and
archived annually
411 Monitoring Impacts to Biodiversity
Since animal inventories have not been conducted in Amazon Rio project areas (for this project
biological information for the Rio Amapaacute RDS management plan were used) a biodiversity
monitoring system that will follow the RAPELD methodology (Rapid surveys of various taxonomic
groups (RAP) for long-term ecological studies) (MAGNUSSON et al 2005)
The RAPELD method contributes to long-term research using rapid inventory assessments biotic
complementarity and land use planning in the Amazon This method increases adequate sampling
17Linking community monitoring to national Measurement Reporting and Verification for REDD+
MONITORING amp IMPLEMENTATION REPORT VCS Version 3 CCB Standards Third Edition
v30 37
probability of biologically diverse communities which require large areas and at the same time
minimize variation of abiotic factors that affect these communities with smaller areas sampling
Evaluation and selection of indicators will be conducted in accordance with the ProBUC model
however applicably to local reality results will be updated biennially from the first survey
Biodiversity indicators are being designed and planned as suggested in the Social and
Environmental Monitoring System of Protected Areas in the Brazilian Amazon (Sistema de
Monitoramento Socioambiental das Unidades de Conservaccedilatildeo da Amazocircnia Brasileira)1819
and
Methodology for Rapid Assessment and Prioritization of Protected Areas Management20
(Metodologia para Avaliaccedilatildeo Raacutepida e Priorizaccedilatildeo do Manejo de Unidades de Conservaccedilatildeo -
RAPPAM) in line with the experiences gained and disseminated by CEUC and ICMBIO previously
described
The empowerment accountability and shared management of biodiversity conservation is the
main focus of the methodological model adopted These actions create high expectations for
environmental management of the area as the biodiversity monitoring will be conducted by the
community members themselves along with the project proponent promoting a local multiplier
effect It is worth mentioning that strict compliance with these procedures is in within EBCF`s
interest since it considers them to be key to the success of the project
The project begins with the premise that any negative impact on biodiversity in the project area
and its surroundings will not occur In the opposite sense the project aims to generate and provide
greater understanding of the territory subsidizing proposals for the conservation and sustainable
use through adoption of good management practices of natural resources as well as its replication
in other locations
412 Monitoring Social Impacts
The monitoring of social aspects include both the collection of numerical data such as quantity
volume weight (quantitative indicators) as well as information expressing opinions and
experiences (qualitative indicators) remembering that such measures are compatible and
interchangeable Data collection should be systematic and have a pre-established rate and most
likely a single indicator will require several data collection instruments such as plans field records
reports etc
Social information will be monitored through the use of participatory methodologies In this sense
the preparation process of the Amazon Rio I RPDS Management Plan was a first step For the
18Indicator Design 19Social and Environmental Monitoring of Protected Areas System in the Brazilian Amazon (Sistema de Monitoramento
Socioambiental das Unidades de Conservaccedilatildeo da Amazocircnia Brasileira) 20Metodologia para Avaliaccedilatildeo Raacutepida e a Priorizaccedilatildeo do Manejo de Unidades de Conservaccedilatildeo (RAPPAM)
MONITORING amp IMPLEMENTATION REPORT VCS Version 3 CCB Standards Third Edition
v30 38
socioeconomic characteristics of communities several community meetings land use mapping
workshops and interviews with focus groups were held in addition to field visits (Annex 10) The
main activities of the project were presented and discussed in these events emphasizing the
importance and timeliness of local valuation of environmental services as well as strategies for
raising funds to implement other projects and improvements in social well-being of communities
around the PA
5 MEASUREMENT OF GHG EMISSIONS REDUCTIONS AND REMOVALS (CLIMATE)
51 Emissions Baseline
EBCF did not carry out any wood related exploration activity in the areas since the beginning of
the REDD+ project Thus it is confirmed estimated emission reductions for the project as
8678833 t CO2eq t year
52 Project emissions
Project emissions were primarily those related to the running of offices and necessary travels for
studies meetings presentations workshops and other activities Table 10 presents a summary of
emissions based on data from Annex 21 of this report
Table 05 - 2011-2016 Project Activity Emissions
YEAR Energy
(KWh)
Energy
(t CO2eq)
Travels
(Km)
Travels
(t CO2eq)
Total
(t CO2eq)
2010
678 024 024
2011
104010 2360 2360
2012 1149 008 55724 1573 1581
2013 2756 028 236749 5429 5457
2014 2498 025 15789 459 484
2015 2231 023 27340 597 620
2016 1015 010
010
093 440290 10443 10536
53 Leakage
Not applicable according to presentation made on the REDD+ IFM document
MONITORING amp IMPLEMENTATION REPORT VCS Version 3 CCB Standards Third Edition
v30 39
54 Summary of GHG Emission Reductions And Removals
EBCF REDD+ project shows emissions reduction of 34397563 tCO2e as the balance in the
period of 2011-2015 Table 06 shows the overview of the dynamics of reductions and project
emissions up to 2048 By the year 2015 the emissions data is posted as seen in reports and from
2016 data are projects as previous average and should be adjusted as a result of future reports
Table 06 - Summary of ex ante estimates
Year
Estimated
reductions
from
baseline21
(tCO2e)
Project
Estimated
emissions 22
tCO2e)
Unplanned
estimate
Emissions23
(tCO2e)
Net GHG
Estimated
emissions
Reduction
(tCO2e)
2012 8675500 1581 0 8673919
2013 8675500 5457 0 8670043
2014 8675500 484 296296 8378720
2015 8675500 620 0 8674880
2016 8675500 2100 0 8673400
2017 8675500 2100 0 8673400
2018 8675500 2100 0 8673400
2019 8675500 2100 0 8673400
2020 8675500 2100 0 8673400
2030 8675500 2100 0 8673400
2048 8675500 2100 0 8673400
Total 3123180 25203 296296 3119989
55 Climate Change Adaptation Benefits (GL1)
There is a relatively widespread understanding in the scientific community that balanced
ecosystems have greater ecological and social resilience and adaptability to climate change
21
See annex 18 22
See annex 21 23
See annex 24- HDOM (Study on deforestation and heat spots for EBCF REDD+ Project technical report)
MONITORING amp IMPLEMENTATION REPORT VCS Version 3 CCB Standards Third Edition
v30 40
whether through protection of water bodies and regulation of river flows during peak flood and
drought or through the regular supply of environmental services products and services
Thus once the project is designed to conserve an area of native forest which in the absence of
the project scenario would remain subject to the pressure of timber management (baseline) and
consequent degradation resulting from such activities it is understood that the mere protection of
these areas alone would offer communities and the ecosystem itself better adaptability compared
to the baseline scenario
Moreover the project has an Activity Management Plan (Annex 9) which details among other
initiatives the promotion of the sustainable use of ecosystem resources through direct support in
some activities related to income generation and conservation along with community training It is
believed that in addition to ensuring a more balanced (and therefore more resilient) environment
the project will expand the options for generating income among the communities making them
more resilient and preparing them to face the greater and already perceived challenges posed by
climate change
6 COMMUNITY
61 Positive Impacts for Communities (CM1)
EBCFrsquos REDD+ project was first presented to the riverine communities in 2011 By then
communities were informed about the cessation of all timber exploration activities due to the
REDD+ project and discussions were held regarding biodiversity conservation and the sustainable
use of forest products and services as well the social development of the surrounding
communities Briefly the positive impacts along the communities were
1 Project area zoning and its surroundings
2 Contribution to building local capacity
3 Contribution to developing sustainable business in the region
4 Contribution to social and environmental diagnosis
Knowing to manage
To evaluate the progress of these initiatives throughout the development of the project we used
the methodology of the Sustainability Matrix developed by the Secretariat of Environment and
MONITORING amp IMPLEMENTATION REPORT VCS Version 3 CCB Standards Third Edition
v30 41
Sustainable Development of Amazonas State This tool was applied in 15 communities taking into
account local socio-economic aspects that underlie the development of 20 parameters considered
of great importance to community development described by specific indicators As a visual tool
the Sustainability Matrix is quite suitable for traditional populations such as the riverside and
indigenous communities surrounding the Reserve Amazon River I and other areas of the Project
Additionally the Matrix provides interesting spaces for discussion since its construction is done
collectively Through the Sustainability Matrix it was possible to identify along with the
communities projects activities and implementation strategies Budgets and monitoring and
evaluation of these projects will be detailed later through the Annual Operational Plans to be
developed and followed up in the due course Four programs and nine subprograms were defined
for management and community development (Annex 9)
62 Negative Impacts (CM2)
No negative impacts have been recorded or identified as a result of the project with stakeholders
7 BIODIVERSITY
71 Positive Impacts for Biodiversity (B1)
The benefits for biodiversity are in reducing deforestation and degradation (selective logging) in the
project area According to satellite images analysis in the project areas and their surroundings it
was observed that until 2010 300 hectares were deforested After the implementation of the
project community awareness on the importance of preservation and conservation of forests have
encouraged no deforestation degradation and a significant reduction in deforestation was
identified (see graph below) This was due to the good understanding of the projects conservation
objectives and by the involvement and support of the surrounding communities
MONITORING amp IMPLEMENTATION REPORT VCS Version 3 CCB Standards Third Edition
v30 42
Figure 10 - EBCF REDD Project and buffer areas deforestation figures (source HDOM Report)
The consequences of deforestation and degradation on biodiversity are well known Thus the fact
of not being identified changes (natural or anthropogenic) in forest areas shows there was no loss
of biodiversity no reduction in floristic diversity no impact on the dynamics of fauna and flora and
no loss of evolutionary genetic information
72 Negative Impacts on Biodiversity (B2)
There are no negative impacts on biodiversity as a result of the project
73 Exceptional Benefits for Biodiversity (GL3)
The description of exceptional benefits for biodiversity will only be possible after the re-
measurement of permanent plots (FLORA)
8 ADICIONAL INFORMATION
All activities and the consequent reduction in deforestation and degradation in and around the
project areas were maintained and funded without resources of carbon credits We understand that
with the advance of REDD+ project EBCF will have much better conditions to implement positive
actions in partnership with communities
MONITORING amp IMPLEMENTATION REPORT VCS Version 3 CCB Standards Third Edition
v30 43
REFERENCES
ADEODATO S etal Madeira de ponta a ponta o caminho da floresta ateacute o consumo Satildeo Paulo
FGV-RAE 2011
ALBAGLI S Amazocircnia fronteira geopoliacutetica da biodiversidade Revista Parcerias Estrateacutegicas n
12 p6 set2001 Centro de Estudos Estrateacutegicos do Ministeacuterio da Ciecircncia e Tecnologia
AMARAL I C Viabilidade de plantio de cafeacute na zona da mata mineira Revista Poliacutetica Agriacutecola
Ano xx n4 outnovdez 2011 Disponiacutevel em
httpwwwalicecnptiaembrapabrbitstreamdoc9309031Viabilidadedeplantiopdf Acesso
em 17 de set 2013
AMARAL P etal Floresta para Sempre um manual para a produccedilatildeo de madeira na Amazocircnia
Beleacutem IMAZON 1998 130p
AMAZONAS Lei Complementar nordm 532007 de 05062007 REGULAMENTA o inciso V do artigo
230 e o sect 1ordm do artigo 231 da Constituiccedilatildeo Estadual institui o SISTEMA ESTADUAL DE
UNIDADES DE CONSERVACcedilAtildeO - SEUC dispondo sobre infraccedilotildees e penalidades e
estabelecendo outras providecircncias Disponiacutevel em
httpwwwcetesbspgovbruserfilesfilemudancasclimaticasproclimafilelegislacaoestadua
lamazonasleilei_complementar_n_53_2007_amazonaspdf Acessado em Setembro 2013
ANTAQ Anuaacuterio Estatiacutestico 2004 Distacircncia entre os portos Disponiacutevel em
httpwwwantaqgovbrportalanuariosportuario2004TabelasDistanciaEntrePortospdf
Acesso em 23 de out 2013
ANTAQ Panorama Aquaviaacuterio Agecircncia Nacional de Transportes Aquaviaacuterios Volume 3 Brasiacutelia
ndash DF 2009
MONITORING amp IMPLEMENTATION REPORT VCS Version 3 CCB Standards Third Edition
v30 44
AREDES A F PEREIRA M W G Anaacutelise econocircmica da produccedilatildeo de cafeacute araacutebica um estudo
de caso com simulaccedilotildees de Monte Carlo para sistemas de baixa e alta produtividade
Informaccedilotildees Econocircmicas SP v38 n4 abr 2008
ARIMA E UHL C Pecuaacuteria na Amazocircnia Oriental Desempenho Atual e Perspectivas Futuras Seacuterie
Amazocircnia n1 Beleacutem IMAZON 1996 40p
BACCINI A et al Estimated carbon dioxide emissions from tropical deforestation improved by
carbon-density maps Nature Climate Change vol2 march 2012 (LETTERS Published
Online - DOI 101038NCLIMATE1354)
BARROS A C UHL C Padrotildees problemas e potencial da extraccedilatildeo madeireira ao longo do Rio
Amazonas e do seu estuaacuterio Seacuterie Amazocircnia n4 Beleacutem IMAZON 1997 42p
BRASIL Lei 121872009 (Lei Ordinaacuteria) 29122009 Institui a Poliacutetica Nacional sobre Mudanccedila
do Clima - PNMC e daacute outras Providecircncias Presidecircncia da Repuacuteblica Casa Civil Subchefia
para Assuntos Juriacutedicos Disponiacutevel em lthttpswwwplanaltogovbrccivil_03_ato2007-
20102009leil12187htmgt Acesso em 20 de set 2013
CAMPOS E F Emissatildeo de CO2 da madeira serrada da Amazocircnia o caso da exploraccedilatildeo
convencional 2012 172p Dissertaccedilatildeo - Escola Politeacutecnica Universidade de Satildeo Paulo Satildeo
Paulo
CARDOSO RS e FREITAS C E C A pesca de pequena escala no rio Madeira pelos
desembarques ocorridos em Manicoreacute (Estado do Amazonas) Brasil Revista Acta
Amazocircnica vol 38(4) 2008 781 ndash 788
CCBA Climate Community and Biodiversity Alliance-CCBA 2008 Disponiacutevel em
httpwwwclimate-standardsorgccb-standards Acesso em 03 de set 2013
MONITORING amp IMPLEMENTATION REPORT VCS Version 3 CCB Standards Third Edition
v30 45
CEPEA Centro de Estudos Avanccedilados em Economia Aplicada - ESALQUSP Economia da
pecuaacuteria de corte na regiatildeo norte do Brasil Disponiacutevel em httpgooglL2roiA Acesso em
15 de out 2013
CHAMBERS J Q et al Decomposition and carbon cycling of dead trees in tropical forests of the
central Amazon Oecologia vol122 pp380-388 2000 Agricultores se queixam de
burocracia para contratar creacutedito sustentaacutevel do Programa ABC Correio Braziliense Brasiacutelia
26 fev 2012 Disponiacutevel em
lthttpwww2correiobraziliensecombrsersustentavelp=4592gt Acesso em 10 set 2013
CULLEN Jr L VALLADARES-PAacuteDUA C Onccedilas como detetives da paisagem Ciecircncia Hoje
Vol 156 n26 pp54-571999
CPRM - Serviccedilo Geoloacutegico do Brasil Disponiacutevel em httpwwwcprmgovbr Acesso em 13 de
mar 2013
DIAS F M MORAIS S J S REZENDE R C Anaacutelise da viabilidade econocircmica para a
produccedilatildeo de melancia e cenoura com financiamento em Anaacutepolis-GO 2008 Disponiacutevel em
httpwwwprpuegbr06v1conteudopesquisainiccieneventossic2008fronteiraflashsicani
macaoIIIJORNADAarquivosresumosresumo01pdfgt Acesso em 18 de nov2013
Divisatildeo de Precessamento de Imagens (DPI) Ambdata Mapa de Vegetaccedilatildeo SIPAM RADAM
2002 Disponiacutevel em httpwwwdpiinpebrAmbdatamapa_sipamphp Acesso em 21 de
out 2013
DOMINGUES MS BERNMANN C O arco de desflorestamento na Amazocircnia da pecuaacuteria agrave
soja Ambiente amp Sociedade Satildeo Paulo vol15 n2 pp1-22 maioago 2012
MONITORING amp IMPLEMENTATION REPORT VCS Version 3 CCB Standards Third Edition
v30 46
EBCF Criaccedilatildeo da primeira reserva particular de desenvolvimento sustentaacutevel do mundo na
floresta amazocircnica Disponiacutevel emlthttpwwwebcfcombrblog20130624criacao-da-
primeira-reserva-particular-de-desenvolvimento-sustentavel-do-mundo-na-floresta-
amazonicagt Acesso em 21 de set 2013
EMBRAPA Sistema Brasileiro de Classificaccedilatildeo de Solos 2ordf Ed Rio de Janeiro Embrapa Solos
2006 306 p
FELDPAUSCH T R et al When big trees fall Damage and carbon export by reduced impact
logging in southern Amazonia Forest Ecology and Management Vol 219 pp199-215 2005
FEARNSIDE P MDesmatamento na Amazocircnia dinacircmica impactos e controle Acta Amazocircnica
vol 36 n3 pp 395-400 2006
FILGUEIRAS T S et al 1994 Caminhamento Um meacutetodo expedito para levantamentos
floriacutesticos qualitativos Caderno de Geociecircncia IBGE vol12 pp39-43 1994
Forest Management Public Summary for Gethal Amazonas SA Induacutestria de Madeira
Compensada Certification Code SW-FMCOC-119 Date of Certification October 1
2000 Date of Public Summary October 2000 Updated for Annual Audit 2002 Annual Audit
2003 (Gethalpdf)
Globo Rural Linha de financiamento para a agricultura de baixo carbono tem pouca procura
2011 Disponiacutevel em httpwwwrainforest-allianceorgforestrydocumentsgethalpdf
Acesso em 16 de nov 2013
GREENPEACE Face a Face com a Destruiccedilatildeo Relatoacuterio Greenpeace sobre as companhias
multinacionais madeireiras na Amazocircnia Brasileira 1999 Disponiacutevel em
MONITORING amp IMPLEMENTATION REPORT VCS Version 3 CCB Standards Third Edition
v30 47
lthttpwwwgreenpeaceorgbramazoniaface_destruicaopdfgt Acesso em 11 de set
2013
Governo do Estado do Amazonas Plano de Gestao da RDS do Rio Amapaacute 2010 Disponiacutevel em
httpobservatoriowwforgbrsite_mediauploadgestaoplanoManejorio_amapapdf Acesso
em 24 de ago 2013
HDOM Estimates from processing the forest inventories data carried out during the CADAF
Project Final Technical Report 2012 Disponiacutevel em wwwhdomcombr Acesso em 27 de
maio 2013
HIGUCHI N 1986-87 Amostragem sistemaacutetica versus amostragem aleatoacuteria em floresta tropical
uacutemida de terra-firme na regiatildeo de Manaus Acta Amazonica 1617 (uacutenico) 393-400
HIGUCHI N SANTOS J JARDIM FCS Tamanho de parcela amostral para inventaacuterios
florestais Acta Amazocircnica vol12 n1 pp91-103 1982
HIGUCHI F G PINTO A C M ISHIZUKA M KAJIMOTO T LIMA A J N SANTOS J
HIGUCHI N Estoque e dinacircmica de biomassa acima do solo das florestas de terra firme do
estado do Amazonas In Adriano Joseacute Nogueira Lima Flaacutevia Machado Durgante Moacir
Alberto Assis Campos Joaquim dos Santos Moriyoshi Ishizuka Niro Higuchi (Org)
Dinacircmica do carbono das florestas da Amazocircnia resultados do Projeto CADAF
1edManaus INPA 2014 v 1 p 29-34
HOLMES T P etal Custos e benefiacutecios financeiros da exploraccedilatildeo de impacto reduzido em
comparaccedilatildeo agrave exploraccedilatildeo florestal convencional na Amazocircnia oriental 2ordf ed Beleacutem
Fundaccedilatildeo Floresta Tropical 2002 66p
HUSCH B MILLER C I BEERS T W Forest mensuration New York Ronald Press 1971
HUSCH B MILLER C I BEERS T W Forest Mensuration New York John Wiley amp Sons
2nd
ed 1972 402 p
MONITORING amp IMPLEMENTATION REPORT VCS Version 3 CCB Standards Third Edition
v30 48
IBGE Instituto Brasileiro de Geografia e Estatiacutestica Diretoria de GeociecircnciasCoordenaccedilatildeo de
Recursos Naturais e Estudos Ambientais Geologia Solos Hidrografia e Vegetaccedilatildeo 2000
IBGE Instituto Brasileiro de Geografia e Estatiacutestica Manicoreacute 2010 Disponiacutevel
emlthttpwwwsidraibgegovbrgt Acesso em 05 de set 2013
IBGE Instituto Brasileiro de Geografia e Estatiacutestica 2011 Disponiacutevel em httpwwwibgegovbr
Acesso em 19 de mar 2013
IBGE Instituto Brasileiro de Geografia e Estatiacutestica Extraccedilatildeo vegetal e silvicultura para o
municiacutepio de Manicoreacute 2011 Disponiacutevel em
lthttpcidadesibgegovbrxtrastemasphplang=ampcodmun=130270ampidtema=102ampsearch=a
mazonas|manicore|extracao-vegetal-e-silvicultura-2011gt Acesso em 10 de out 2013
IBGE Instituto Brasileiro de Geografia e Estatiacutestica Censo Demograacutefico 2010 Disponiacutevel em
lthttpcidadesibgegovbrxtrastemasphpcodmun=130270ampidtema=116gt Acesso em 18
de out 2013
IBGE Instituto Brasileiro de Geografia e Estatiacutestica Censo Demograacutefico 2010 Disponiacutevel
emlthttpcidadesibgegovbrxtrashomephpgt Acesso em 08 de out 2013
IDESAM Reduccedilotildees de Emissotildees do Desmatamento e Degradaccedilatildeo Florestal (REDD+) estudo de
oportunidades para a regiatildeo sul do Amazonas CENAMO M Cl CARRERO G C
GANDOLFO P (Org) Manaus 2011 Disponiacutevel em
lthttpwwwobservatoriodoreddorgbrsitepdfestudodeoportunidadespdfgt Acesso em 13 de
set 2013
MONITORING amp IMPLEMENTATION REPORT VCS Version 3 CCB Standards Third Edition
v30 49
IDESAM Semeando Sustentabilidade em Apuiacute ndash Resultados e Perspectivas 2011 Manaus
Disponivel em lthttpidesamorgbrsemeando-sustentabilidade-em-apui-resultados-e-
perspectivasUxX8nfldWYI
IEA Instituto de Economia Aplicada CO2 Emissions from fuel combustion 2012 Disponiacutevel em
httpwwwieaorgco2highlightsco2highlightspdf Acesso em 09 de out 2013
IGREJA H L S CATIQUE J Anaacutelise neotectocircnica do lineamento de Itacoatiara centro leste do
Estado do Amazonas In Simpoacutesio Nacional de Estudos Tectocircnicos 6 1997 Pirenoacutepolis
Anais Pirenoacutepolis-GO SBG-Nuacutecleo Brasiacutelia1997
IMAZON Instituto do Homem e do Meio Ambiente da Amazocircnia Fatos Florestais 2010a
Disponiacutevel em httpwwwimazonorgbrpublicacoeslivrosfatos-florestais-da-amazonia-
2010-1 Acesso em 14 de out 2013
IMAZOM Instituto do Homem e do Meio Ambiente da Amazocircnia Mercado e preccedilo da madeira
amazocircnica 2010 Disponiacutevel em httpwwwimazonorgbrpublicacoesprecos-de-madeira-
em-toraboletim-de-precos-de-madeira-em-tora-na-amazonia-julho-2010at_downloadfile
Acesso em 23 de nov 2013
IMAZON Instituto do Homem e do Meio Ambiente da Amazocircnia Portal de Geoinformaccedilatildeo sobre
a Amazocircnia Disponiacutevel em lthttpwwwimazongeoorgbrimazongeophpgt Acesso em 06
de set 2013
IMAZON Instituto do Homem e do Meio Ambiente da Amazocircnia Transparecircncia florestal
Amazocircnia Legal 2012 Disponiacutevel em lthttpwwwimazonorgbrpublicacoestransparencia-
florestaltransparencia-florestal-amazonia-legalcopy_of_SADOutubro2012pdfgt Acesso em
23 de set 2013
IMAZON Instituto do Homem e do Meio Ambiente da Amazocircnia PEREIRA D SANTOS D
VEDOVETO M GIMARAtildeES J VERIacuteSSIMO A (Orgs) Fatos Florestais da Amazocircnia
Beleacutem IMAZON 2010 244p Disponiacutevel em
MONITORING amp IMPLEMENTATION REPORT VCS Version 3 CCB Standards Third Edition
v30 50
lthttpwwwimazonorgbrpublicacoeslivrosfatos-florestais-da-amazonia-2010-1gt Acesso
em 24 de set 2013
IMAZON Instituto do Homem e do Meio Ambiente da Amazocircnia A Expansatildeo madeireira na
Amazocircnia Impactos e perspectivas para o desenvolvimento sustentaacutevel no Paraacute BARROS
AC VERIacuteSSIMO A (Eds) Beleacutem IMAZON 2002
IMAZON Instituto do Homem e do Meio Ambiente da Amazocircnia Custos e Benefiacutecios do Manejo
Florestal Para Produccedilatildeo de Madeira na Amazocircnia Oriental 1998 Disponiacutevel em
lthttpwwwimazonorgbrpublicacoesserie-amazoniacustos-e-beneficios-do-manejo-
florestal-para-producao-de-madeira-na-amazonia-orientalgt Acesso em 20 de set 2013
INPE Instituto de Pesquisas Espaciais Banco de dados PRODES 2012 Disponiacutevel em
lthttpwwwdpiinpebrprodesdigitalprodesphpgt Acesso em 09 de set 2013
INPE Instituto de Pesquisas Espaciais Banco de dados DEGRAD 2009 Disponiacutevel em
lthttpwwwobtinpebrdegradgt Acesso em 09 de set 2013
INPE Instituto de Pesquisas Espaciais Banco de dados DETER 2013 Disponiacutevel em
lthttpwwwobtinpebrdetergt Acesso em 10 de set 2013
INPE Instituto de Pesquisas Espaciais Banco de dados de queimadas e focos de calor
BDQUEIMADAS 2013 Disponiacutevel em lthttpwwwdpiinpebrproarcobdqueimadasgt
Acesso em 10 de set 2013
Instituto Carbono Brasil Soacute 2 da produccedilatildeo de madeira eacute certificada O Estado de SPaulo 2006
Disponiacutevel em lthttpwwwinstitutocarbonobrasilorgbrnoticias6noticia=119796gt Acesso
em 26 de set 2013
MONITORING amp IMPLEMENTATION REPORT VCS Version 3 CCB Standards Third Edition
v30 51
IFT Instituto Floresta Tropical Diagnoacutestico do Setor Florestal de Cotriguaccedilu Estado do Mato
Grosso 2010 Disponiacutevel em lthttpgooglEVx2RZgt Acesso em 16 de dez 2013
IPCC Guidelines for National Greenhouse Gas Inventories In National Greenhouse Gas
Inventories Programme EGGLESTON HS BUENDIA L MIWA K NGARA T TANABE
K (Eds) Japan IGES 2006
ITTO Annual review and assessment of the world timber situation 2011 Disponivel em
httpwwwittointannual_review Acesso em 10 de out 2013
KELLER M et al Coarse woody debris in undisturbed and logged forests in the eastern Brazilian
Amazon Global Change Biology vol10 PP784-795 2004
LENTINI M VERISSIMO A PEREIRA D A expansatildeo madeireira na Amazocircnia O Estado da
Amazocircnia n2 2005 Beleacutem IMAZON Disponiacutevel em
httpwwwimazonorgbruploadea_2ppdf Acesso em 06 de set 2013
LOETSCH F ZOumlHRER F HALLER K E Forest Inventory Munich BLV Verlagsgesellschaft
2nd
edition Vol II 1973 469 p
MAGNUSSON WE et al RAPELD uma modificaccedilatildeo do meacutetodo de Gentry para inventaacuterios de
biodiversidade em siacutetios para pesquisa ecoloacutegica de longa duraccedilatildeo Biota Neotrop JulDez
2005 vol 5 no 2 httpwwwbiotaneotropicaorgbrv5n2ptabstractpoint-of-
view+bn01005022005 ISSN 1676-0603
MARINELLI C E et al O programa de monitoramento da biodiversidade da biodiversidade e do
uso de recursos naturais em unidades de conservaccedilatildeo estaduais do Amazonas Secretaria
de Estado do Meio Ambiente e Desenvolvimento Sustentaacutevel - SDS Manaus SDS 2007
MONITORING amp IMPLEMENTATION REPORT VCS Version 3 CCB Standards Third Edition
v30 52
MARINELLI C E MALTEZ M H Indicadores de Sustentabilidade para Unidades de
Conservaccedilatildeo Documento-Siacutentese Workshop Instituto Socioambiental Brasiacutelia-DF 2010
76p
MAZZEI L et al Above-ground biomass dynamics after reduced-impact logging in the Eastern
Amazon Forest Ecology and Management vol 259 pp367-373 2010
MEIRELLES FILHO O Livro de Ouro da Amazocircnia 5ordf Ediccedilatildeo Rio de Janeiro EDIOURO 2007
422p Meirelles Filho J O Livro de Ouro da Amazocircnia 1ordf ed Editora Ediouro ISBN
8500021616 2007 450p
MENGER Juliana da Silva Fatores determinantes da distribuiccedilatildeo de aves no interfluacutevio Purus-
Madeira Manaus [sn] 2011 35 fl il
MCT Arquivos dos Fatores de Emissatildeo Disponiacutevel em
httpwwwmctgovbrindexphpcontentview321144htmlancora Acesso em 23 de out
2013
MMA Ministeacuterio do Meio Ambiente Avaliaccedilatildeo e identificaccedilatildeo de accedilotildees prioritaacuterias para a
conservaccedilatildeo utilizaccedilatildeo sustentaacutevel e reparticcedilatildeo dos benefiacutecios da biodiversidade na
Amazocircnia brasileira Brasiacutelia MMASBF 2001
MMA Ministeacuterio do Meio Ambiente Secretaria de Biodiversidade e Florestas Aacutereas Prioritaacuterias
para Conservaccedilatildeo Uso Sustentaacutevel e Reparticcedilatildeo de Benefiacutecios da Biodiversidade Brasileira
Atualizaccedilatildeo - Portaria MMA ndeg9 de 23 de janeiro de 2007 Brasiacutelia MMA 2007 (Seacuterie
Biodiversidade 31)
MONITORING amp IMPLEMENTATION REPORT VCS Version 3 CCB Standards Third Edition
v30 53
MMA Livro vermelho da fauna brasileira ameaccedilada de extinccedilatildeo editores Angelo Barbosa
Monteiro Machado Glaacuteucia Moreira Drummond Adriano Pereira Paglia 1ed 2008 Brasiacutelia
DF MMA Belo Horizonte MG Fundaccedilatildeo Biodiversitas (1420 p) il - (Biodiversidade 19)
OLIVEIRA M M HIGUCHI N CELES C H HIGUCHI F G 2014 Tamanho e formas de
parcelas para inventaacuterios florestais de espeacutecies arboacutereas na Amazocircnia Central Ciecircncia
Florestal Santa Maria v 24 n 3 p 645-653
PEARSON TRH WALKER S BROWN SL The Source Book for Land Use Land Use
Change and Forestry Projects BioCarbon Fund and Winrock International 2005 64 pp
PORTAL AMAZOcircNIA Amazocircnia de A a Z Disponiacutevel em
lthttpportalamazoniaglobocomgt Acesso em 13 de set 2013
PEacuteLLICO NETTO S BRENA D A Inventaacuterio florestal Curitiba Editorado pelos autores p
316 1997
PROJETO SIVAM Relatoacuterio metodoloacutegico de trabalho Revisatildeo 3 Diretoria de Geociecircncia Rio de
Janeiro 2002 330 pp
PROJETO SIVAM Atualizaccedilatildeo do RADAMBRASIL Mapa de Vegetacao da Amazonia Legal
Mapa de Fitofisionomias ndash RADAMSIPAM DNPM Ministeacuterio de Minas e Energia 2002
Disponiacutevel em httpwwwdpiinpebramb_dataShapefilesveg_Amz_SIPAMzip Acesso
em 21 de jan 2014
PROJETO FLORESTAL SANTA MARIA (PROJETO FSM-REDD) Plant Inteligecircncia Ambiental ndash
Warwick Manfrinato 2012 Disponiacutevel em
lthttpwwwflorestalsantamariacombrsitedocumentos57FSM_REDD_VCS_PD_ptpdfgt
Acesso em 09 de set 2013
MONITORING amp IMPLEMENTATION REPORT VCS Version 3 CCB Standards Third Edition
v30 54
RADAMBRASIL Programa de Integraccedilatildeo Nacional Levantamentos de Recursos Naturais v 14 ndash
RADAM DNPM Ministeacuterio de Minas e Energia Brasil 1974
RIBEIRO J E L et al Flora da Reserva Ducke guia de identificaccedilatildeo das plantas vasculares de
uma floresta de terra firme na Amazocircnia Central Manaus Editora INPA 1999
ROSAS F C W WALDEMARIN H de MATTOS G E Pteronura rasiliensis (Zimmermann
1780) In MACHADO A B M DRUMMOND G M PAGLIA A P (eds) Livro Vermelho da
Fauna Brasileira Ameaccedilada de Extinccedilatildeo Volume II 1ed Brasiacutelia DF Ministeacuterio do Meio
Ambiente 2008 p 800 - 801
ROSS D GHG Emissions Resulting from Aircraft Travel 2009 Disponiacutevel em
httpwwwcarbonplanetcomdownloadsFlight_Calculator_Information_v92pdf Acesso em
14 de out 2013
SANTOS A J et al Viabilidade econocircmica do sistema agroflorestal greviacutelea x cafeacute na regiatildeo
norte do Paranaacute CERNE vol6 n1 pp89-100 2000
SANTOS R A Custo do manejo florestal madeireiro estudo de caso Floresta Estadual do
Antimary Monografia (Bacharelado em Economia) ndash Departamento de Ciecircncias
Econocircmicas Universidade Federal do Acre 2007109p
SABOGAL C et al Manejo Florestal Empresarial na Amazocircnia Brasileira restriccedilotildees e
oportunidades (Relatoacuterio Siacutentese) Beleacutem CIFORIMAZON 2006 72p
SDSCEUC Secretaria Estadual de Meio Ambiente e Desenvolvimento Sustentaacutevel ndash Centro
Estadual de Unidades de Conservaccedilatildeo Programa de Monitoramento de Biodiversidade e
Uso de Recursos Naturais em Aacutereas Protegidas do Estado Amazonas (ProBUC) 2006
Disponiacutevel em
MONITORING amp IMPLEMENTATION REPORT VCS Version 3 CCB Standards Third Edition
v30 55
httpbrazilwcsorgDesktopModulesBring2mindDMXDownloadaspxEntryId=6168ampPortalI
d=93ampDownloadMethod=attachment Acesso em 11 de ago de 2013
SFBIMAZON Serviccedilo Florestal Brasileiro e Instituto do Homem e Meio Ambiente da Amazocircnia A
atividade madeireira na Amazocircnia brasileira produccedilatildeo receita e mercados 2010 Disponiacutevel
em httpwwwmmagovbrestruturassfb_arquivosmiolo_resexec_polo_03_95_1pdf
Acesso em 23 de out 2013
SILVA R P da Alometria estoque e dinacircmica da biomassa de florestas primaacuterias e
secundaacuterias na regiatildeo de Manaus (AM) 152 p Tese de Doutorado Programa Integrado
de Poacutes-graduaccedilatildeo em Biologia Tropical e Recursos Naturais (INPA) Manaus 2007
SILVA Z A G P G SANTOS R A Custo do manejo florestal madeireiro em floresta puacuteblica
estudo de caso no Acre 2011 Disponiacutevel em
lthttpwwwbasacombrbancoamazonia2Revistaedicao_13n13_custo_do_manejo_flores
pdfgt Acesso em 13 de set 2013
SMIDT M GALLAGHER T Factors Affecting Fuel Consumption and Harvesting Costs Auburn
School of Forestry and Wildlife Sciences Sd Disponiacutevel em
httpweb1cnrevteduforestrycofedocuments2013Smidt_Gallagherpdf Acesso em 21
de out 2013
SOARES-FILHO B et al Role of Brazilian Amazon protected areas in climate change mitigation
2010 Columbia University NY Ruth S DeFries 2010
SPF Serviccedilo Puacuteblico Federal DVPF Documento de venda de produto Florestal (Declaraccedilotildees de
venda Gethalpdf) 14 de julho de 2006
MONITORING amp IMPLEMENTATION REPORT VCS Version 3 CCB Standards Third Edition
v30 56
TIMOFEICZYK JUacuteNIOR R et al Rentabilidade econocircmica do manejo de baixo impacto em
florestas tropicais um estudo de caso Revista Floresta Curitiba v 38 n 4 p 711-725
outdez 2008
VCS Ferramenta para Demonstraccedilatildeo e Avaliaccedilatildeo de Adicionalidade para Atividades de Projetos
VCS em Agricultura Floresta e Outros Usos (AFOLU) 2012a Disponiacutevel em httpwwwv-c-
sorgsitesv-c-sorgfilesVT000120VCS20AFOLU20Additionality20Tool20v30pdf
Acesso em 24 de set 2013
VCS Ferramenta de Risco e Natildeo Permanecircncia (AFOLU) 2012B Disponiacutevel em httpv-c-
sorgsitesv-c-sorgfilesAFOLU20Non-Permanence20Risk20Tool2C20v32pdf
Acesso em 13 de set 2013
VCS Approved VCS Methodology VM0010 Version 10 - Methodology for Improved Forest
Management Conversion to Logged to Protected Forest Calculating GHG Benefits from
Preventing Planned Degradation PHUA S SHARMA S TELFER M CHANDLER H
(Eds) Califoacuternia EUA Carbon Planet Limited 2011149p
VERDEJO M E Diagnoacutestico Rural Participativo um guia praacutetico Brasiacutelia MDA 2006 62p
VIANNA A L M Diagnoacutestico Florestal do Estado do Amazonas 2010 e 2011 Manaus-AM
IDESAM 2013 (Relatoacuterio Final do Projeto Fortalecimento da participaccedilatildeo da sociedade civil
no Amazonas Foacuterum de Mudanccedilas Climaacuteticas Transparecircncia Florestal no Estado do
Amazonas ndash Mapeamento de Instrumentos Legislativos no Brasil)
WBCSDWRI The GHG Protocol for Project Accountin Washington World Business Council for
Sustainable DevelopmentWorld Resources Institute 2005148 p
MONITORING amp IMPLEMENTATION REPORT VCS Version 3 CCB Standards Third Edition
v30 57
WALKER W et al Guia de Campo para Estimativa de Biomassa Florestal e Estoque de Carbono
Woods Hole Center Research Falmouth Massachusetts USA 2011 Disponiacutevel em
httpwwwwhrcorgresourcesfieldguidescarbonpdfWHRC_FieldGuide_PortugueseSMpdf
Acesso em 14 de set 2013
WWF Metodologia para Avaliaccedilatildeo Raacutepida e a Priorizaccedilatildeo do Manejo de Unidades de
Conservaccedilatildeo (RAPPAM) 2010 Disponiacutevel em httpgooglXfDnxs Acesso em 30 de set
2013
WWF-Brasil Efetividade de Gestatildeo das Unidades de Conservaccedilatildeo no Estado do Amazonas
Secretaria de Estado do Meio Ambiente e do Desenvolvimento Sustentaacutevel do Amazonas
Instituto Chico Mendes de Conservaccedilatildeo da Biodiversidade Brasiacutelia WWF-Brasil 2011 72 p
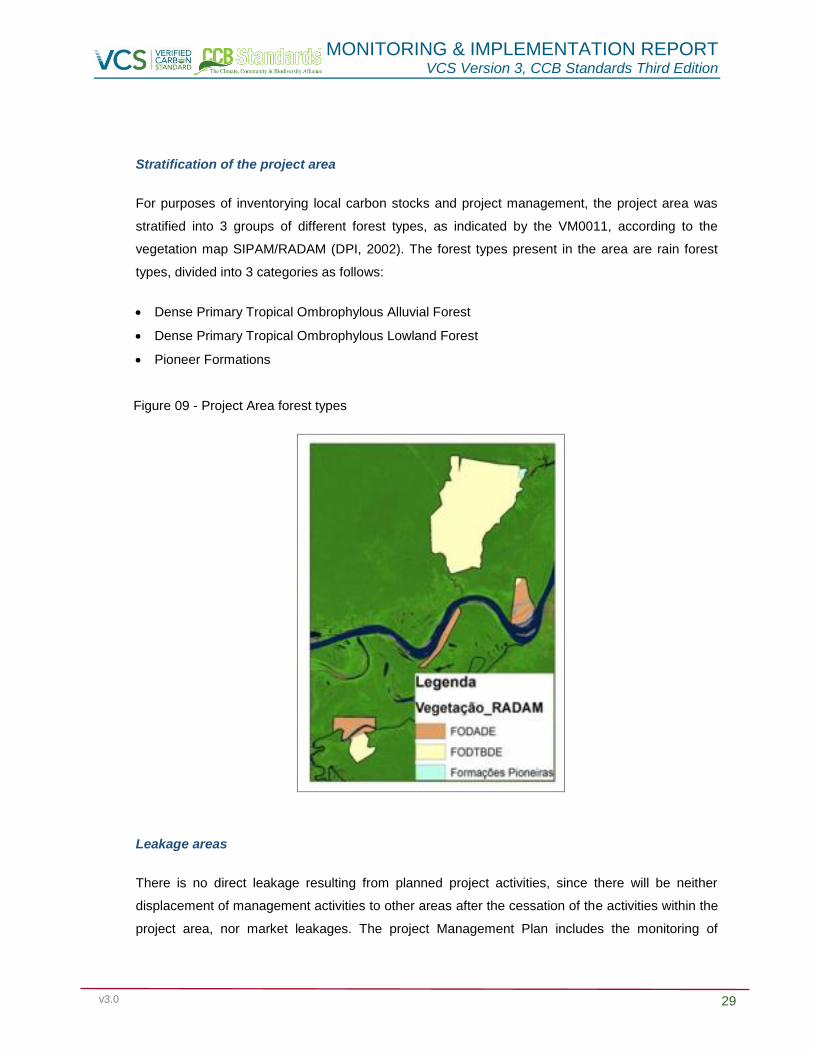
MONITORING amp IMPLEMENTATION REPORT VCS Version 3 CCB Standards Third Edition
v30 30
possible unanticipated leakages around the project area as well as the need to report to the
competent authorities whenever logging activities are identified in these areas For more
information on leakage see chapters 52 and 55 of this document
Temporal boundaries
Crediting period of the project
The first crediting period of the project is 37 years beginning on August 17 2012 and ending on 17
August 2049 This period is equivalent to the remaining 12 years of the first authorized
management plan (25 years from 1998) added to another 25 years in respect of a new forest
management plan that was intended as the common practice of forestry in Brazil The logging
activities could continue beyond 37 years aiming for a second crediting period
Monitoring and Reporting Period
a) Monitoring of Baseline Emissions
The monitoring of Baseline Emissions must demonstrate that the protected forest area is in
accordance with the one specified in the PD The project limit will be monitored before each
verification throughout the crediting period through new inventory information and remote sensing
and GIS as applicable Thus the project will be able to update the baseline calculations based on
the actual remaining forest area (in case of loss of forest cover by disasters for example) and that
would be subject to forest management under a ldquowithout projectrdquo scenario
b) Monitoring of Project Emissions
Project emissions will be monitored annually and compiled in every monitoring report that will detail
in particular the
Monitoring of possible illegal harvesting of timber
Monitoring of areas subject to natural disturbances
Monitoring and quantification of emissions related to air and land travel related to project
activities
c) Monitoring of Leakage
Since there will be no leakages according to the VM0011 and AFOLU Requirements no leakage
monitoring will be necessary However to be conservative the project intends to monitor any
disturbances that might affect the carbon reservoirs Once some disturbance is registered the
project will report the incident to the relevant authorities and make the necessary adjustments to
MONITORING amp IMPLEMENTATION REPORT VCS Version 3 CCB Standards Third Edition
v30 31
the baseline For more details about the monitoring of leakages see chapters 52 and 55 of this
document
Carbon stocks
The biomass reservoirs considered by the project are related to above-ground and underground
biomass
Sources and sinks of GHGs
Table 02 below describes the emission sources and sinks of greenhouse gases associated with
the baseline activities and with the project
Table 03 - Greenhouse gas emissions sources and sinks associated with baseline and project
activities
Source Gas Included JustificationExplanation
Baselin
e
Biomass
CO2 Yes Main source of project emissions through forest
degradation harvested and commercialised
wood products deadwood and forest regrowth
CH4 No Conservatively excluded
N2O No Conservatively excluded
Other No -
Fossil Fuel
consumption
CO2 Yes Main source through fossil fuel use in
machinery and transportation of timber
CH4 Yes Conservatively included
N2O Yes Conservatively included
Other No -
Electricity
consumption
CO2 Yes Main source
CH4 No -
N2O No -
Other No -
Pro
ject
Biomass
CO2 Yes Main source through unexpected natural
disturbances such as forest fires etc
CH4 Yes Included but subject to significance
N2O Yes Included but subject to significance
MONITORING amp IMPLEMENTATION REPORT VCS Version 3 CCB Standards Third Edition
v30 32
Source Gas Included JustificationExplanation
Other No _
Fossil Fuel
consumption
CO2 Yes Main source through flights and ground travel
CH4 Yes Included but subject to significance
N2O Yes Included but subject to significance
Other No _
Electricity
consumption
CO2 Yes Main source
CH4 No _
N2O No _
Other No _
34 Baseline Scenario
The choice between alternative baseline scenarios was taken together with the analysis of
additionality using the latest version of the VCS Tool for the demonstration and assessment of
additionality in Agriculture Forestry and Other Land Use VCS projects in this case VT000167
(VCS 2012a) All possible scenarios as well as the analysis of methodology barriers (steps 211
and 212 of the VM0011) are present in the chapter below In this sense to avoid redundancy of
information refer to additionality analysis to find the steps 211 and 212 of the VM0011
The baseline scenario for the project identified as the most likely to occur was selective logging8
(continuation of Business As Usual - BAU) The reference scenario assumes 37 years of selective
logging according to the 25 year logging plan approved in August 1998 (Annex 6 - document
ValdII T01 POA 1998) that in the absence of project activities would be renewed in 2024 for
another 25 years until 2049
Under this scenario the full implementation of the timber logging plan occurs and which has
already resulted in the degradation of 434769 ha (see table below) The area would be harvested
selectively for timber sold in lumber markets Below is a summary of harvest areas between 1999
and 2010 showing the managed plots and the dates on which the harvests were authorized
6 Tool for the demonstration and assessment of an additional to the VCS project activities in Agriculture Forestry and Other
Uses (AFOLU) (V 30)
7 Adapted from ldquoTool for the Demonstration and Assessment of Additionality in AR CDM project Activitiesrdquo (V02) 8 Additional information about choosing the baseline are presented in section 46 (steps 1 and 2)
MONITORING amp IMPLEMENTATION REPORT VCS Version 3 CCB Standards Third Edition
v30 33
Table 04 - Summary of areas managed since 1999
Date Managed logged area (ha)
1999 58669 (Plot 1)
2000 688 (Plot 2)
2001 ndash 2002 8315 (Plot 3)
2003 ndash 2004 750 (Plots 3 and 4)
2005 ndash 2007 1082 (Plot 5)
2008 ndash 2009 49050 (Plots 5 and 6)
TOTAL 434769
35 Additionality
The additionality analysis of the Amazon Rio project REDD+ IFM was conducted with the latest
version of the VCS Tool for the demonstration and assessment of additionality in Agriculture
Forestry and Other Land Use VCS projects the VT000167
(VCS 2012a)
To generate the reductions in GHG emissions for the project the planned baseline activities
(sustainable forest management) were terminated by the project proponent and supplanted by
environmental conservation activities In this sense the project will be managed by EBCF with
the goal of creating a fund for administrative and accounting management especially to promote
environmental management and monitoring activities of carbon pools within the project area
Alternative activities planned in the project are the provisioning and valuation of environmental
services via carbon credits (VCUs) in conjunction with the sale of Environmental Reserve Quotas
(CRAs)
4 MONITORING AND PARAMETERS OF DATA
41 Monitoring Plan Description
Due to its innovative comprehensive and integrative character the project needs to be monitored
regularly so that its actions activities and impacts can be constantly measured and evaluated To
meet this requirement the monitoring process must meet three main objectives
MONITORING amp IMPLEMENTATION REPORT VCS Version 3 CCB Standards Third Edition
v30 34
i To serve as an internal management project tool
ii To collaborate as an instrument of collective learning from the communities and
social groups directly involved
iii To work as a means of communicating results and impacts to interested institutions
and society in general Furthermore it is important to consider that monitoring if
successful will transcend the managerial aspects of the project and strengthening
the plan
To facilitate the monitoring process instead of having a reference line (to compare interventions
before and after) the first year of monitoring will serve as the starting point whose information will
be regularly and systematically compared throughout the project
Next the initial plans for monitoring benefits to the climate community and biodiversity are
described wherein the community is committed to participatory precept and to the technical and
scientific rigor which is capable of following the possible negative and positive impacts on
environmental and social aspects in the project area and its surroundings
Monitoring of Climate Impacts
The Monitoring Plan (MP) aims to provide security in the periodic estimates of reduction in
emissions especially in monitoring changes in carbon stock Therefore emissions from the
implementation of the project ex post estimates of the activities and emissions from any leakages
and isolated disturbances (eg blowdown fires pests and diseases among others) can be
calculated
The construction of the PM of the climate benefits made in full compliance with the methodological
framework provided by VM0011 ndash IFM LPF (VCS 2011) and CCBA (2008) which consists of four
specific actions to be monitored
i Implementation and execution of the project
ii Dynamics and stock of the forest biomass
iii Deforestation and forest degradation
iv Periodic reviews of ex post emissions
Remote monitoring and surveillance of the project area
Measurement of alterations and biomass loss quantification present in the PA using land use
change detection is critical to make accurate estimates of GHG emissions that account for forest
biomass increases and losses
MONITORING amp IMPLEMENTATION REPORT VCS Version 3 CCB Standards Third Edition
v30 35
Thus the use of remote sensing by satellite images of medium spatial resolution can be applied
readily in the PA and surroundings in order to monitor land use dynamics over time particularly to
identify risks and threats to forested areas In situ verification will complement landscape analysis
in a GIS environment with the aim of quantifying spatializing and identifying conversion of forest
areas into other land uses environmental degradation and other possible changes that may occur
during the term of the project
As a complementary monitoring source the project will rely on the database and information
provided by Monitoring Program of the Brazilian Amazon Forest by Satellite 910
(Prodes Digital)
conducted by the National Institute for Space Research (Instituto Nacional de Pesquisas Espaciais
- INPE) according to the Plan for Prevention and Control of Deforestation in the Amazon
1112(PPCDAm) under the National Policy on Prevention and Control of Deforestation Such
information is available online in13
digital vector files for the public in general
Other tools will provide complementary information to the monitoring such as indicators of forest
degradation and hotspots (fires and wildfires) obtained from DETER 14
SAD 15
and PROARCO16
Information is available online for free in vector format These results will be systematically related
to field data for validating or disproving the occurred event so that the focuses of deforestation and
degradation can be identified remediated reported and consequently avoided as much as
possible
A surveillance system that allows permanent territorial monitoring and inhibits the entry of intruders
through entry points in the PA will also be deployed to control the transport flow In addition one
must investigate and identify risks and threats eg mapping hotspots and areas vulnerable to fire
to illegal logging to hunting and poaching and to invasions by third parties among others
At first we estimate an effective demand for structuring the electronic monitoring system which
includes the hiring of skilled professionals field equipment electronic equipment (digital cameras
GPS desktops and notebooks smartphones printers geoprocessing software and GIS among
others) vehicles andor motorcycles motorized boats for transportation and moving around and
the collection of high resolution satellite images Empowerment and training of all involved staff
9httpwwwobtinpebrprodesdigitalmetodologiahtml
10httpwwwobtinpebrprodesmetodologiapdf 11httpwwwmmagovbrflorestascontrole-e-prevenC3A7C3A3o-do-desmatamento 12httpwwwmmagovbrimagesarquivo80120PPCDAm_FINAL_PPCDAMPDF 13httpwwwobtinpebrprodesindexhtml 14httpwwwobtinpebrdeterdados 15httpwwwimazongeoorgbrdocdownloadsphp 16httpwwwdpiinpebrproarcobdqueimadas
MONITORING amp IMPLEMENTATION REPORT VCS Version 3 CCB Standards Third Edition
v30 36
and the surrounding communities will be necessary to make the system effective17
and a constant
stream of information directed to regional actors and other stakeholders
Strategic monitoring and access points to RPDS roads will also provide support to other MPs
including social and biodiversity conservation aspects especially in the logistic support of planned
field activities
Procedures for determining the permanent sample plots (PSPs) and measurement
The calculation of the stock and increase in forest biomass will be subsidized through the
installation of PSPs in the PA and its temporal monitoring through the Continuous Forest Inventory
(CFI) The methodology proposed by VCS (2011) suggests the use of permanent andor temporary
plots however it confirms the efficiency and accuracy of sample plots
In order to demonstrate the procedural and statistical rigor used all the sampling procedures the
PA forest stratification sampling design calculation of sampling intensity and other parameters
measured in PSPs to monitor biomass balance due to ingressmortality of individuals growth in
DBH and height will be presented in detail in the Annex (Annex 23 - Forest Inventory 2016)
To promote reliable forest biomass estimates standard operating procedures (SOPs) (Section 82)
will be used by the team executing the CFI
Monitoring frequency
The monitoring frequency parameters measured in the PSPs will be no greater than 5 years from
the first measurement Other relevant parameters to monitoring the PSPs like the change in land
use in the PA and surrounding areas such as deforestation forest degradation fire sources and
natural disturbances will be regularly monitored as a project routine operation organized and
archived annually
411 Monitoring Impacts to Biodiversity
Since animal inventories have not been conducted in Amazon Rio project areas (for this project
biological information for the Rio Amapaacute RDS management plan were used) a biodiversity
monitoring system that will follow the RAPELD methodology (Rapid surveys of various taxonomic
groups (RAP) for long-term ecological studies) (MAGNUSSON et al 2005)
The RAPELD method contributes to long-term research using rapid inventory assessments biotic
complementarity and land use planning in the Amazon This method increases adequate sampling
17Linking community monitoring to national Measurement Reporting and Verification for REDD+
MONITORING amp IMPLEMENTATION REPORT VCS Version 3 CCB Standards Third Edition
v30 37
probability of biologically diverse communities which require large areas and at the same time
minimize variation of abiotic factors that affect these communities with smaller areas sampling
Evaluation and selection of indicators will be conducted in accordance with the ProBUC model
however applicably to local reality results will be updated biennially from the first survey
Biodiversity indicators are being designed and planned as suggested in the Social and
Environmental Monitoring System of Protected Areas in the Brazilian Amazon (Sistema de
Monitoramento Socioambiental das Unidades de Conservaccedilatildeo da Amazocircnia Brasileira)1819
and
Methodology for Rapid Assessment and Prioritization of Protected Areas Management20
(Metodologia para Avaliaccedilatildeo Raacutepida e Priorizaccedilatildeo do Manejo de Unidades de Conservaccedilatildeo -
RAPPAM) in line with the experiences gained and disseminated by CEUC and ICMBIO previously
described
The empowerment accountability and shared management of biodiversity conservation is the
main focus of the methodological model adopted These actions create high expectations for
environmental management of the area as the biodiversity monitoring will be conducted by the
community members themselves along with the project proponent promoting a local multiplier
effect It is worth mentioning that strict compliance with these procedures is in within EBCF`s
interest since it considers them to be key to the success of the project
The project begins with the premise that any negative impact on biodiversity in the project area
and its surroundings will not occur In the opposite sense the project aims to generate and provide
greater understanding of the territory subsidizing proposals for the conservation and sustainable
use through adoption of good management practices of natural resources as well as its replication
in other locations
412 Monitoring Social Impacts
The monitoring of social aspects include both the collection of numerical data such as quantity
volume weight (quantitative indicators) as well as information expressing opinions and
experiences (qualitative indicators) remembering that such measures are compatible and
interchangeable Data collection should be systematic and have a pre-established rate and most
likely a single indicator will require several data collection instruments such as plans field records
reports etc
Social information will be monitored through the use of participatory methodologies In this sense
the preparation process of the Amazon Rio I RPDS Management Plan was a first step For the
18Indicator Design 19Social and Environmental Monitoring of Protected Areas System in the Brazilian Amazon (Sistema de Monitoramento
Socioambiental das Unidades de Conservaccedilatildeo da Amazocircnia Brasileira) 20Metodologia para Avaliaccedilatildeo Raacutepida e a Priorizaccedilatildeo do Manejo de Unidades de Conservaccedilatildeo (RAPPAM)
MONITORING amp IMPLEMENTATION REPORT VCS Version 3 CCB Standards Third Edition
v30 38
socioeconomic characteristics of communities several community meetings land use mapping
workshops and interviews with focus groups were held in addition to field visits (Annex 10) The
main activities of the project were presented and discussed in these events emphasizing the
importance and timeliness of local valuation of environmental services as well as strategies for
raising funds to implement other projects and improvements in social well-being of communities
around the PA
5 MEASUREMENT OF GHG EMISSIONS REDUCTIONS AND REMOVALS (CLIMATE)
51 Emissions Baseline
EBCF did not carry out any wood related exploration activity in the areas since the beginning of
the REDD+ project Thus it is confirmed estimated emission reductions for the project as
8678833 t CO2eq t year
52 Project emissions
Project emissions were primarily those related to the running of offices and necessary travels for
studies meetings presentations workshops and other activities Table 10 presents a summary of
emissions based on data from Annex 21 of this report
Table 05 - 2011-2016 Project Activity Emissions
YEAR Energy
(KWh)
Energy
(t CO2eq)
Travels
(Km)
Travels
(t CO2eq)
Total
(t CO2eq)
2010
678 024 024
2011
104010 2360 2360
2012 1149 008 55724 1573 1581
2013 2756 028 236749 5429 5457
2014 2498 025 15789 459 484
2015 2231 023 27340 597 620
2016 1015 010
010
093 440290 10443 10536
53 Leakage
Not applicable according to presentation made on the REDD+ IFM document
MONITORING amp IMPLEMENTATION REPORT VCS Version 3 CCB Standards Third Edition
v30 39
54 Summary of GHG Emission Reductions And Removals
EBCF REDD+ project shows emissions reduction of 34397563 tCO2e as the balance in the
period of 2011-2015 Table 06 shows the overview of the dynamics of reductions and project
emissions up to 2048 By the year 2015 the emissions data is posted as seen in reports and from
2016 data are projects as previous average and should be adjusted as a result of future reports
Table 06 - Summary of ex ante estimates
Year
Estimated
reductions
from
baseline21
(tCO2e)
Project
Estimated
emissions 22
tCO2e)
Unplanned
estimate
Emissions23
(tCO2e)
Net GHG
Estimated
emissions
Reduction
(tCO2e)
2012 8675500 1581 0 8673919
2013 8675500 5457 0 8670043
2014 8675500 484 296296 8378720
2015 8675500 620 0 8674880
2016 8675500 2100 0 8673400
2017 8675500 2100 0 8673400
2018 8675500 2100 0 8673400
2019 8675500 2100 0 8673400
2020 8675500 2100 0 8673400
2030 8675500 2100 0 8673400
2048 8675500 2100 0 8673400
Total 3123180 25203 296296 3119989
55 Climate Change Adaptation Benefits (GL1)
There is a relatively widespread understanding in the scientific community that balanced
ecosystems have greater ecological and social resilience and adaptability to climate change
21
See annex 18 22
See annex 21 23
See annex 24- HDOM (Study on deforestation and heat spots for EBCF REDD+ Project technical report)
MONITORING amp IMPLEMENTATION REPORT VCS Version 3 CCB Standards Third Edition
v30 40
whether through protection of water bodies and regulation of river flows during peak flood and
drought or through the regular supply of environmental services products and services
Thus once the project is designed to conserve an area of native forest which in the absence of
the project scenario would remain subject to the pressure of timber management (baseline) and
consequent degradation resulting from such activities it is understood that the mere protection of
these areas alone would offer communities and the ecosystem itself better adaptability compared
to the baseline scenario
Moreover the project has an Activity Management Plan (Annex 9) which details among other
initiatives the promotion of the sustainable use of ecosystem resources through direct support in
some activities related to income generation and conservation along with community training It is
believed that in addition to ensuring a more balanced (and therefore more resilient) environment
the project will expand the options for generating income among the communities making them
more resilient and preparing them to face the greater and already perceived challenges posed by
climate change
6 COMMUNITY
61 Positive Impacts for Communities (CM1)
EBCFrsquos REDD+ project was first presented to the riverine communities in 2011 By then
communities were informed about the cessation of all timber exploration activities due to the
REDD+ project and discussions were held regarding biodiversity conservation and the sustainable
use of forest products and services as well the social development of the surrounding
communities Briefly the positive impacts along the communities were
1 Project area zoning and its surroundings
2 Contribution to building local capacity
3 Contribution to developing sustainable business in the region
4 Contribution to social and environmental diagnosis
Knowing to manage
To evaluate the progress of these initiatives throughout the development of the project we used
the methodology of the Sustainability Matrix developed by the Secretariat of Environment and
MONITORING amp IMPLEMENTATION REPORT VCS Version 3 CCB Standards Third Edition
v30 41
Sustainable Development of Amazonas State This tool was applied in 15 communities taking into
account local socio-economic aspects that underlie the development of 20 parameters considered
of great importance to community development described by specific indicators As a visual tool
the Sustainability Matrix is quite suitable for traditional populations such as the riverside and
indigenous communities surrounding the Reserve Amazon River I and other areas of the Project
Additionally the Matrix provides interesting spaces for discussion since its construction is done
collectively Through the Sustainability Matrix it was possible to identify along with the
communities projects activities and implementation strategies Budgets and monitoring and
evaluation of these projects will be detailed later through the Annual Operational Plans to be
developed and followed up in the due course Four programs and nine subprograms were defined
for management and community development (Annex 9)
62 Negative Impacts (CM2)
No negative impacts have been recorded or identified as a result of the project with stakeholders
7 BIODIVERSITY
71 Positive Impacts for Biodiversity (B1)
The benefits for biodiversity are in reducing deforestation and degradation (selective logging) in the
project area According to satellite images analysis in the project areas and their surroundings it
was observed that until 2010 300 hectares were deforested After the implementation of the
project community awareness on the importance of preservation and conservation of forests have
encouraged no deforestation degradation and a significant reduction in deforestation was
identified (see graph below) This was due to the good understanding of the projects conservation
objectives and by the involvement and support of the surrounding communities
MONITORING amp IMPLEMENTATION REPORT VCS Version 3 CCB Standards Third Edition
v30 42
Figure 10 - EBCF REDD Project and buffer areas deforestation figures (source HDOM Report)
The consequences of deforestation and degradation on biodiversity are well known Thus the fact
of not being identified changes (natural or anthropogenic) in forest areas shows there was no loss
of biodiversity no reduction in floristic diversity no impact on the dynamics of fauna and flora and
no loss of evolutionary genetic information
72 Negative Impacts on Biodiversity (B2)
There are no negative impacts on biodiversity as a result of the project
73 Exceptional Benefits for Biodiversity (GL3)
The description of exceptional benefits for biodiversity will only be possible after the re-
measurement of permanent plots (FLORA)
8 ADICIONAL INFORMATION
All activities and the consequent reduction in deforestation and degradation in and around the
project areas were maintained and funded without resources of carbon credits We understand that
with the advance of REDD+ project EBCF will have much better conditions to implement positive
actions in partnership with communities
MONITORING amp IMPLEMENTATION REPORT VCS Version 3 CCB Standards Third Edition
v30 43
REFERENCES
ADEODATO S etal Madeira de ponta a ponta o caminho da floresta ateacute o consumo Satildeo Paulo
FGV-RAE 2011
ALBAGLI S Amazocircnia fronteira geopoliacutetica da biodiversidade Revista Parcerias Estrateacutegicas n
12 p6 set2001 Centro de Estudos Estrateacutegicos do Ministeacuterio da Ciecircncia e Tecnologia
AMARAL I C Viabilidade de plantio de cafeacute na zona da mata mineira Revista Poliacutetica Agriacutecola
Ano xx n4 outnovdez 2011 Disponiacutevel em
httpwwwalicecnptiaembrapabrbitstreamdoc9309031Viabilidadedeplantiopdf Acesso
em 17 de set 2013
AMARAL P etal Floresta para Sempre um manual para a produccedilatildeo de madeira na Amazocircnia
Beleacutem IMAZON 1998 130p
AMAZONAS Lei Complementar nordm 532007 de 05062007 REGULAMENTA o inciso V do artigo
230 e o sect 1ordm do artigo 231 da Constituiccedilatildeo Estadual institui o SISTEMA ESTADUAL DE
UNIDADES DE CONSERVACcedilAtildeO - SEUC dispondo sobre infraccedilotildees e penalidades e
estabelecendo outras providecircncias Disponiacutevel em
httpwwwcetesbspgovbruserfilesfilemudancasclimaticasproclimafilelegislacaoestadua
lamazonasleilei_complementar_n_53_2007_amazonaspdf Acessado em Setembro 2013
ANTAQ Anuaacuterio Estatiacutestico 2004 Distacircncia entre os portos Disponiacutevel em
httpwwwantaqgovbrportalanuariosportuario2004TabelasDistanciaEntrePortospdf
Acesso em 23 de out 2013
ANTAQ Panorama Aquaviaacuterio Agecircncia Nacional de Transportes Aquaviaacuterios Volume 3 Brasiacutelia
ndash DF 2009
MONITORING amp IMPLEMENTATION REPORT VCS Version 3 CCB Standards Third Edition
v30 44
AREDES A F PEREIRA M W G Anaacutelise econocircmica da produccedilatildeo de cafeacute araacutebica um estudo
de caso com simulaccedilotildees de Monte Carlo para sistemas de baixa e alta produtividade
Informaccedilotildees Econocircmicas SP v38 n4 abr 2008
ARIMA E UHL C Pecuaacuteria na Amazocircnia Oriental Desempenho Atual e Perspectivas Futuras Seacuterie
Amazocircnia n1 Beleacutem IMAZON 1996 40p
BACCINI A et al Estimated carbon dioxide emissions from tropical deforestation improved by
carbon-density maps Nature Climate Change vol2 march 2012 (LETTERS Published
Online - DOI 101038NCLIMATE1354)
BARROS A C UHL C Padrotildees problemas e potencial da extraccedilatildeo madeireira ao longo do Rio
Amazonas e do seu estuaacuterio Seacuterie Amazocircnia n4 Beleacutem IMAZON 1997 42p
BRASIL Lei 121872009 (Lei Ordinaacuteria) 29122009 Institui a Poliacutetica Nacional sobre Mudanccedila
do Clima - PNMC e daacute outras Providecircncias Presidecircncia da Repuacuteblica Casa Civil Subchefia
para Assuntos Juriacutedicos Disponiacutevel em lthttpswwwplanaltogovbrccivil_03_ato2007-
20102009leil12187htmgt Acesso em 20 de set 2013
CAMPOS E F Emissatildeo de CO2 da madeira serrada da Amazocircnia o caso da exploraccedilatildeo
convencional 2012 172p Dissertaccedilatildeo - Escola Politeacutecnica Universidade de Satildeo Paulo Satildeo
Paulo
CARDOSO RS e FREITAS C E C A pesca de pequena escala no rio Madeira pelos
desembarques ocorridos em Manicoreacute (Estado do Amazonas) Brasil Revista Acta
Amazocircnica vol 38(4) 2008 781 ndash 788
CCBA Climate Community and Biodiversity Alliance-CCBA 2008 Disponiacutevel em
httpwwwclimate-standardsorgccb-standards Acesso em 03 de set 2013
MONITORING amp IMPLEMENTATION REPORT VCS Version 3 CCB Standards Third Edition
v30 45
CEPEA Centro de Estudos Avanccedilados em Economia Aplicada - ESALQUSP Economia da
pecuaacuteria de corte na regiatildeo norte do Brasil Disponiacutevel em httpgooglL2roiA Acesso em
15 de out 2013
CHAMBERS J Q et al Decomposition and carbon cycling of dead trees in tropical forests of the
central Amazon Oecologia vol122 pp380-388 2000 Agricultores se queixam de
burocracia para contratar creacutedito sustentaacutevel do Programa ABC Correio Braziliense Brasiacutelia
26 fev 2012 Disponiacutevel em
lthttpwww2correiobraziliensecombrsersustentavelp=4592gt Acesso em 10 set 2013
CULLEN Jr L VALLADARES-PAacuteDUA C Onccedilas como detetives da paisagem Ciecircncia Hoje
Vol 156 n26 pp54-571999
CPRM - Serviccedilo Geoloacutegico do Brasil Disponiacutevel em httpwwwcprmgovbr Acesso em 13 de
mar 2013
DIAS F M MORAIS S J S REZENDE R C Anaacutelise da viabilidade econocircmica para a
produccedilatildeo de melancia e cenoura com financiamento em Anaacutepolis-GO 2008 Disponiacutevel em
httpwwwprpuegbr06v1conteudopesquisainiccieneventossic2008fronteiraflashsicani
macaoIIIJORNADAarquivosresumosresumo01pdfgt Acesso em 18 de nov2013
Divisatildeo de Precessamento de Imagens (DPI) Ambdata Mapa de Vegetaccedilatildeo SIPAM RADAM
2002 Disponiacutevel em httpwwwdpiinpebrAmbdatamapa_sipamphp Acesso em 21 de
out 2013
DOMINGUES MS BERNMANN C O arco de desflorestamento na Amazocircnia da pecuaacuteria agrave
soja Ambiente amp Sociedade Satildeo Paulo vol15 n2 pp1-22 maioago 2012
MONITORING amp IMPLEMENTATION REPORT VCS Version 3 CCB Standards Third Edition
v30 46
EBCF Criaccedilatildeo da primeira reserva particular de desenvolvimento sustentaacutevel do mundo na
floresta amazocircnica Disponiacutevel emlthttpwwwebcfcombrblog20130624criacao-da-
primeira-reserva-particular-de-desenvolvimento-sustentavel-do-mundo-na-floresta-
amazonicagt Acesso em 21 de set 2013
EMBRAPA Sistema Brasileiro de Classificaccedilatildeo de Solos 2ordf Ed Rio de Janeiro Embrapa Solos
2006 306 p
FELDPAUSCH T R et al When big trees fall Damage and carbon export by reduced impact
logging in southern Amazonia Forest Ecology and Management Vol 219 pp199-215 2005
FEARNSIDE P MDesmatamento na Amazocircnia dinacircmica impactos e controle Acta Amazocircnica
vol 36 n3 pp 395-400 2006
FILGUEIRAS T S et al 1994 Caminhamento Um meacutetodo expedito para levantamentos
floriacutesticos qualitativos Caderno de Geociecircncia IBGE vol12 pp39-43 1994
Forest Management Public Summary for Gethal Amazonas SA Induacutestria de Madeira
Compensada Certification Code SW-FMCOC-119 Date of Certification October 1
2000 Date of Public Summary October 2000 Updated for Annual Audit 2002 Annual Audit
2003 (Gethalpdf)
Globo Rural Linha de financiamento para a agricultura de baixo carbono tem pouca procura
2011 Disponiacutevel em httpwwwrainforest-allianceorgforestrydocumentsgethalpdf
Acesso em 16 de nov 2013
GREENPEACE Face a Face com a Destruiccedilatildeo Relatoacuterio Greenpeace sobre as companhias
multinacionais madeireiras na Amazocircnia Brasileira 1999 Disponiacutevel em
MONITORING amp IMPLEMENTATION REPORT VCS Version 3 CCB Standards Third Edition
v30 47
lthttpwwwgreenpeaceorgbramazoniaface_destruicaopdfgt Acesso em 11 de set
2013
Governo do Estado do Amazonas Plano de Gestao da RDS do Rio Amapaacute 2010 Disponiacutevel em
httpobservatoriowwforgbrsite_mediauploadgestaoplanoManejorio_amapapdf Acesso
em 24 de ago 2013
HDOM Estimates from processing the forest inventories data carried out during the CADAF
Project Final Technical Report 2012 Disponiacutevel em wwwhdomcombr Acesso em 27 de
maio 2013
HIGUCHI N 1986-87 Amostragem sistemaacutetica versus amostragem aleatoacuteria em floresta tropical
uacutemida de terra-firme na regiatildeo de Manaus Acta Amazonica 1617 (uacutenico) 393-400
HIGUCHI N SANTOS J JARDIM FCS Tamanho de parcela amostral para inventaacuterios
florestais Acta Amazocircnica vol12 n1 pp91-103 1982
HIGUCHI F G PINTO A C M ISHIZUKA M KAJIMOTO T LIMA A J N SANTOS J
HIGUCHI N Estoque e dinacircmica de biomassa acima do solo das florestas de terra firme do
estado do Amazonas In Adriano Joseacute Nogueira Lima Flaacutevia Machado Durgante Moacir
Alberto Assis Campos Joaquim dos Santos Moriyoshi Ishizuka Niro Higuchi (Org)
Dinacircmica do carbono das florestas da Amazocircnia resultados do Projeto CADAF
1edManaus INPA 2014 v 1 p 29-34
HOLMES T P etal Custos e benefiacutecios financeiros da exploraccedilatildeo de impacto reduzido em
comparaccedilatildeo agrave exploraccedilatildeo florestal convencional na Amazocircnia oriental 2ordf ed Beleacutem
Fundaccedilatildeo Floresta Tropical 2002 66p
HUSCH B MILLER C I BEERS T W Forest mensuration New York Ronald Press 1971
HUSCH B MILLER C I BEERS T W Forest Mensuration New York John Wiley amp Sons
2nd
ed 1972 402 p
MONITORING amp IMPLEMENTATION REPORT VCS Version 3 CCB Standards Third Edition
v30 48
IBGE Instituto Brasileiro de Geografia e Estatiacutestica Diretoria de GeociecircnciasCoordenaccedilatildeo de
Recursos Naturais e Estudos Ambientais Geologia Solos Hidrografia e Vegetaccedilatildeo 2000
IBGE Instituto Brasileiro de Geografia e Estatiacutestica Manicoreacute 2010 Disponiacutevel
emlthttpwwwsidraibgegovbrgt Acesso em 05 de set 2013
IBGE Instituto Brasileiro de Geografia e Estatiacutestica 2011 Disponiacutevel em httpwwwibgegovbr
Acesso em 19 de mar 2013
IBGE Instituto Brasileiro de Geografia e Estatiacutestica Extraccedilatildeo vegetal e silvicultura para o
municiacutepio de Manicoreacute 2011 Disponiacutevel em
lthttpcidadesibgegovbrxtrastemasphplang=ampcodmun=130270ampidtema=102ampsearch=a
mazonas|manicore|extracao-vegetal-e-silvicultura-2011gt Acesso em 10 de out 2013
IBGE Instituto Brasileiro de Geografia e Estatiacutestica Censo Demograacutefico 2010 Disponiacutevel em
lthttpcidadesibgegovbrxtrastemasphpcodmun=130270ampidtema=116gt Acesso em 18
de out 2013
IBGE Instituto Brasileiro de Geografia e Estatiacutestica Censo Demograacutefico 2010 Disponiacutevel
emlthttpcidadesibgegovbrxtrashomephpgt Acesso em 08 de out 2013
IDESAM Reduccedilotildees de Emissotildees do Desmatamento e Degradaccedilatildeo Florestal (REDD+) estudo de
oportunidades para a regiatildeo sul do Amazonas CENAMO M Cl CARRERO G C
GANDOLFO P (Org) Manaus 2011 Disponiacutevel em
lthttpwwwobservatoriodoreddorgbrsitepdfestudodeoportunidadespdfgt Acesso em 13 de
set 2013
MONITORING amp IMPLEMENTATION REPORT VCS Version 3 CCB Standards Third Edition
v30 49
IDESAM Semeando Sustentabilidade em Apuiacute ndash Resultados e Perspectivas 2011 Manaus
Disponivel em lthttpidesamorgbrsemeando-sustentabilidade-em-apui-resultados-e-
perspectivasUxX8nfldWYI
IEA Instituto de Economia Aplicada CO2 Emissions from fuel combustion 2012 Disponiacutevel em
httpwwwieaorgco2highlightsco2highlightspdf Acesso em 09 de out 2013
IGREJA H L S CATIQUE J Anaacutelise neotectocircnica do lineamento de Itacoatiara centro leste do
Estado do Amazonas In Simpoacutesio Nacional de Estudos Tectocircnicos 6 1997 Pirenoacutepolis
Anais Pirenoacutepolis-GO SBG-Nuacutecleo Brasiacutelia1997
IMAZON Instituto do Homem e do Meio Ambiente da Amazocircnia Fatos Florestais 2010a
Disponiacutevel em httpwwwimazonorgbrpublicacoeslivrosfatos-florestais-da-amazonia-
2010-1 Acesso em 14 de out 2013
IMAZOM Instituto do Homem e do Meio Ambiente da Amazocircnia Mercado e preccedilo da madeira
amazocircnica 2010 Disponiacutevel em httpwwwimazonorgbrpublicacoesprecos-de-madeira-
em-toraboletim-de-precos-de-madeira-em-tora-na-amazonia-julho-2010at_downloadfile
Acesso em 23 de nov 2013
IMAZON Instituto do Homem e do Meio Ambiente da Amazocircnia Portal de Geoinformaccedilatildeo sobre
a Amazocircnia Disponiacutevel em lthttpwwwimazongeoorgbrimazongeophpgt Acesso em 06
de set 2013
IMAZON Instituto do Homem e do Meio Ambiente da Amazocircnia Transparecircncia florestal
Amazocircnia Legal 2012 Disponiacutevel em lthttpwwwimazonorgbrpublicacoestransparencia-
florestaltransparencia-florestal-amazonia-legalcopy_of_SADOutubro2012pdfgt Acesso em
23 de set 2013
IMAZON Instituto do Homem e do Meio Ambiente da Amazocircnia PEREIRA D SANTOS D
VEDOVETO M GIMARAtildeES J VERIacuteSSIMO A (Orgs) Fatos Florestais da Amazocircnia
Beleacutem IMAZON 2010 244p Disponiacutevel em
MONITORING amp IMPLEMENTATION REPORT VCS Version 3 CCB Standards Third Edition
v30 50
lthttpwwwimazonorgbrpublicacoeslivrosfatos-florestais-da-amazonia-2010-1gt Acesso
em 24 de set 2013
IMAZON Instituto do Homem e do Meio Ambiente da Amazocircnia A Expansatildeo madeireira na
Amazocircnia Impactos e perspectivas para o desenvolvimento sustentaacutevel no Paraacute BARROS
AC VERIacuteSSIMO A (Eds) Beleacutem IMAZON 2002
IMAZON Instituto do Homem e do Meio Ambiente da Amazocircnia Custos e Benefiacutecios do Manejo
Florestal Para Produccedilatildeo de Madeira na Amazocircnia Oriental 1998 Disponiacutevel em
lthttpwwwimazonorgbrpublicacoesserie-amazoniacustos-e-beneficios-do-manejo-
florestal-para-producao-de-madeira-na-amazonia-orientalgt Acesso em 20 de set 2013
INPE Instituto de Pesquisas Espaciais Banco de dados PRODES 2012 Disponiacutevel em
lthttpwwwdpiinpebrprodesdigitalprodesphpgt Acesso em 09 de set 2013
INPE Instituto de Pesquisas Espaciais Banco de dados DEGRAD 2009 Disponiacutevel em
lthttpwwwobtinpebrdegradgt Acesso em 09 de set 2013
INPE Instituto de Pesquisas Espaciais Banco de dados DETER 2013 Disponiacutevel em
lthttpwwwobtinpebrdetergt Acesso em 10 de set 2013
INPE Instituto de Pesquisas Espaciais Banco de dados de queimadas e focos de calor
BDQUEIMADAS 2013 Disponiacutevel em lthttpwwwdpiinpebrproarcobdqueimadasgt
Acesso em 10 de set 2013
Instituto Carbono Brasil Soacute 2 da produccedilatildeo de madeira eacute certificada O Estado de SPaulo 2006
Disponiacutevel em lthttpwwwinstitutocarbonobrasilorgbrnoticias6noticia=119796gt Acesso
em 26 de set 2013
MONITORING amp IMPLEMENTATION REPORT VCS Version 3 CCB Standards Third Edition
v30 51
IFT Instituto Floresta Tropical Diagnoacutestico do Setor Florestal de Cotriguaccedilu Estado do Mato
Grosso 2010 Disponiacutevel em lthttpgooglEVx2RZgt Acesso em 16 de dez 2013
IPCC Guidelines for National Greenhouse Gas Inventories In National Greenhouse Gas
Inventories Programme EGGLESTON HS BUENDIA L MIWA K NGARA T TANABE
K (Eds) Japan IGES 2006
ITTO Annual review and assessment of the world timber situation 2011 Disponivel em
httpwwwittointannual_review Acesso em 10 de out 2013
KELLER M et al Coarse woody debris in undisturbed and logged forests in the eastern Brazilian
Amazon Global Change Biology vol10 PP784-795 2004
LENTINI M VERISSIMO A PEREIRA D A expansatildeo madeireira na Amazocircnia O Estado da
Amazocircnia n2 2005 Beleacutem IMAZON Disponiacutevel em
httpwwwimazonorgbruploadea_2ppdf Acesso em 06 de set 2013
LOETSCH F ZOumlHRER F HALLER K E Forest Inventory Munich BLV Verlagsgesellschaft
2nd
edition Vol II 1973 469 p
MAGNUSSON WE et al RAPELD uma modificaccedilatildeo do meacutetodo de Gentry para inventaacuterios de
biodiversidade em siacutetios para pesquisa ecoloacutegica de longa duraccedilatildeo Biota Neotrop JulDez
2005 vol 5 no 2 httpwwwbiotaneotropicaorgbrv5n2ptabstractpoint-of-
view+bn01005022005 ISSN 1676-0603
MARINELLI C E et al O programa de monitoramento da biodiversidade da biodiversidade e do
uso de recursos naturais em unidades de conservaccedilatildeo estaduais do Amazonas Secretaria
de Estado do Meio Ambiente e Desenvolvimento Sustentaacutevel - SDS Manaus SDS 2007
MONITORING amp IMPLEMENTATION REPORT VCS Version 3 CCB Standards Third Edition
v30 52
MARINELLI C E MALTEZ M H Indicadores de Sustentabilidade para Unidades de
Conservaccedilatildeo Documento-Siacutentese Workshop Instituto Socioambiental Brasiacutelia-DF 2010
76p
MAZZEI L et al Above-ground biomass dynamics after reduced-impact logging in the Eastern
Amazon Forest Ecology and Management vol 259 pp367-373 2010
MEIRELLES FILHO O Livro de Ouro da Amazocircnia 5ordf Ediccedilatildeo Rio de Janeiro EDIOURO 2007
422p Meirelles Filho J O Livro de Ouro da Amazocircnia 1ordf ed Editora Ediouro ISBN
8500021616 2007 450p
MENGER Juliana da Silva Fatores determinantes da distribuiccedilatildeo de aves no interfluacutevio Purus-
Madeira Manaus [sn] 2011 35 fl il
MCT Arquivos dos Fatores de Emissatildeo Disponiacutevel em
httpwwwmctgovbrindexphpcontentview321144htmlancora Acesso em 23 de out
2013
MMA Ministeacuterio do Meio Ambiente Avaliaccedilatildeo e identificaccedilatildeo de accedilotildees prioritaacuterias para a
conservaccedilatildeo utilizaccedilatildeo sustentaacutevel e reparticcedilatildeo dos benefiacutecios da biodiversidade na
Amazocircnia brasileira Brasiacutelia MMASBF 2001
MMA Ministeacuterio do Meio Ambiente Secretaria de Biodiversidade e Florestas Aacutereas Prioritaacuterias
para Conservaccedilatildeo Uso Sustentaacutevel e Reparticcedilatildeo de Benefiacutecios da Biodiversidade Brasileira
Atualizaccedilatildeo - Portaria MMA ndeg9 de 23 de janeiro de 2007 Brasiacutelia MMA 2007 (Seacuterie
Biodiversidade 31)
MONITORING amp IMPLEMENTATION REPORT VCS Version 3 CCB Standards Third Edition
v30 53
MMA Livro vermelho da fauna brasileira ameaccedilada de extinccedilatildeo editores Angelo Barbosa
Monteiro Machado Glaacuteucia Moreira Drummond Adriano Pereira Paglia 1ed 2008 Brasiacutelia
DF MMA Belo Horizonte MG Fundaccedilatildeo Biodiversitas (1420 p) il - (Biodiversidade 19)
OLIVEIRA M M HIGUCHI N CELES C H HIGUCHI F G 2014 Tamanho e formas de
parcelas para inventaacuterios florestais de espeacutecies arboacutereas na Amazocircnia Central Ciecircncia
Florestal Santa Maria v 24 n 3 p 645-653
PEARSON TRH WALKER S BROWN SL The Source Book for Land Use Land Use
Change and Forestry Projects BioCarbon Fund and Winrock International 2005 64 pp
PORTAL AMAZOcircNIA Amazocircnia de A a Z Disponiacutevel em
lthttpportalamazoniaglobocomgt Acesso em 13 de set 2013
PEacuteLLICO NETTO S BRENA D A Inventaacuterio florestal Curitiba Editorado pelos autores p
316 1997
PROJETO SIVAM Relatoacuterio metodoloacutegico de trabalho Revisatildeo 3 Diretoria de Geociecircncia Rio de
Janeiro 2002 330 pp
PROJETO SIVAM Atualizaccedilatildeo do RADAMBRASIL Mapa de Vegetacao da Amazonia Legal
Mapa de Fitofisionomias ndash RADAMSIPAM DNPM Ministeacuterio de Minas e Energia 2002
Disponiacutevel em httpwwwdpiinpebramb_dataShapefilesveg_Amz_SIPAMzip Acesso
em 21 de jan 2014
PROJETO FLORESTAL SANTA MARIA (PROJETO FSM-REDD) Plant Inteligecircncia Ambiental ndash
Warwick Manfrinato 2012 Disponiacutevel em
lthttpwwwflorestalsantamariacombrsitedocumentos57FSM_REDD_VCS_PD_ptpdfgt
Acesso em 09 de set 2013
MONITORING amp IMPLEMENTATION REPORT VCS Version 3 CCB Standards Third Edition
v30 54
RADAMBRASIL Programa de Integraccedilatildeo Nacional Levantamentos de Recursos Naturais v 14 ndash
RADAM DNPM Ministeacuterio de Minas e Energia Brasil 1974
RIBEIRO J E L et al Flora da Reserva Ducke guia de identificaccedilatildeo das plantas vasculares de
uma floresta de terra firme na Amazocircnia Central Manaus Editora INPA 1999
ROSAS F C W WALDEMARIN H de MATTOS G E Pteronura rasiliensis (Zimmermann
1780) In MACHADO A B M DRUMMOND G M PAGLIA A P (eds) Livro Vermelho da
Fauna Brasileira Ameaccedilada de Extinccedilatildeo Volume II 1ed Brasiacutelia DF Ministeacuterio do Meio
Ambiente 2008 p 800 - 801
ROSS D GHG Emissions Resulting from Aircraft Travel 2009 Disponiacutevel em
httpwwwcarbonplanetcomdownloadsFlight_Calculator_Information_v92pdf Acesso em
14 de out 2013
SANTOS A J et al Viabilidade econocircmica do sistema agroflorestal greviacutelea x cafeacute na regiatildeo
norte do Paranaacute CERNE vol6 n1 pp89-100 2000
SANTOS R A Custo do manejo florestal madeireiro estudo de caso Floresta Estadual do
Antimary Monografia (Bacharelado em Economia) ndash Departamento de Ciecircncias
Econocircmicas Universidade Federal do Acre 2007109p
SABOGAL C et al Manejo Florestal Empresarial na Amazocircnia Brasileira restriccedilotildees e
oportunidades (Relatoacuterio Siacutentese) Beleacutem CIFORIMAZON 2006 72p
SDSCEUC Secretaria Estadual de Meio Ambiente e Desenvolvimento Sustentaacutevel ndash Centro
Estadual de Unidades de Conservaccedilatildeo Programa de Monitoramento de Biodiversidade e
Uso de Recursos Naturais em Aacutereas Protegidas do Estado Amazonas (ProBUC) 2006
Disponiacutevel em
MONITORING amp IMPLEMENTATION REPORT VCS Version 3 CCB Standards Third Edition
v30 55
httpbrazilwcsorgDesktopModulesBring2mindDMXDownloadaspxEntryId=6168ampPortalI
d=93ampDownloadMethod=attachment Acesso em 11 de ago de 2013
SFBIMAZON Serviccedilo Florestal Brasileiro e Instituto do Homem e Meio Ambiente da Amazocircnia A
atividade madeireira na Amazocircnia brasileira produccedilatildeo receita e mercados 2010 Disponiacutevel
em httpwwwmmagovbrestruturassfb_arquivosmiolo_resexec_polo_03_95_1pdf
Acesso em 23 de out 2013
SILVA R P da Alometria estoque e dinacircmica da biomassa de florestas primaacuterias e
secundaacuterias na regiatildeo de Manaus (AM) 152 p Tese de Doutorado Programa Integrado
de Poacutes-graduaccedilatildeo em Biologia Tropical e Recursos Naturais (INPA) Manaus 2007
SILVA Z A G P G SANTOS R A Custo do manejo florestal madeireiro em floresta puacuteblica
estudo de caso no Acre 2011 Disponiacutevel em
lthttpwwwbasacombrbancoamazonia2Revistaedicao_13n13_custo_do_manejo_flores
pdfgt Acesso em 13 de set 2013
SMIDT M GALLAGHER T Factors Affecting Fuel Consumption and Harvesting Costs Auburn
School of Forestry and Wildlife Sciences Sd Disponiacutevel em
httpweb1cnrevteduforestrycofedocuments2013Smidt_Gallagherpdf Acesso em 21
de out 2013
SOARES-FILHO B et al Role of Brazilian Amazon protected areas in climate change mitigation
2010 Columbia University NY Ruth S DeFries 2010
SPF Serviccedilo Puacuteblico Federal DVPF Documento de venda de produto Florestal (Declaraccedilotildees de
venda Gethalpdf) 14 de julho de 2006
MONITORING amp IMPLEMENTATION REPORT VCS Version 3 CCB Standards Third Edition
v30 56
TIMOFEICZYK JUacuteNIOR R et al Rentabilidade econocircmica do manejo de baixo impacto em
florestas tropicais um estudo de caso Revista Floresta Curitiba v 38 n 4 p 711-725
outdez 2008
VCS Ferramenta para Demonstraccedilatildeo e Avaliaccedilatildeo de Adicionalidade para Atividades de Projetos
VCS em Agricultura Floresta e Outros Usos (AFOLU) 2012a Disponiacutevel em httpwwwv-c-
sorgsitesv-c-sorgfilesVT000120VCS20AFOLU20Additionality20Tool20v30pdf
Acesso em 24 de set 2013
VCS Ferramenta de Risco e Natildeo Permanecircncia (AFOLU) 2012B Disponiacutevel em httpv-c-
sorgsitesv-c-sorgfilesAFOLU20Non-Permanence20Risk20Tool2C20v32pdf
Acesso em 13 de set 2013
VCS Approved VCS Methodology VM0010 Version 10 - Methodology for Improved Forest
Management Conversion to Logged to Protected Forest Calculating GHG Benefits from
Preventing Planned Degradation PHUA S SHARMA S TELFER M CHANDLER H
(Eds) Califoacuternia EUA Carbon Planet Limited 2011149p
VERDEJO M E Diagnoacutestico Rural Participativo um guia praacutetico Brasiacutelia MDA 2006 62p
VIANNA A L M Diagnoacutestico Florestal do Estado do Amazonas 2010 e 2011 Manaus-AM
IDESAM 2013 (Relatoacuterio Final do Projeto Fortalecimento da participaccedilatildeo da sociedade civil
no Amazonas Foacuterum de Mudanccedilas Climaacuteticas Transparecircncia Florestal no Estado do
Amazonas ndash Mapeamento de Instrumentos Legislativos no Brasil)
WBCSDWRI The GHG Protocol for Project Accountin Washington World Business Council for
Sustainable DevelopmentWorld Resources Institute 2005148 p
MONITORING amp IMPLEMENTATION REPORT VCS Version 3 CCB Standards Third Edition
v30 57
WALKER W et al Guia de Campo para Estimativa de Biomassa Florestal e Estoque de Carbono
Woods Hole Center Research Falmouth Massachusetts USA 2011 Disponiacutevel em
httpwwwwhrcorgresourcesfieldguidescarbonpdfWHRC_FieldGuide_PortugueseSMpdf
Acesso em 14 de set 2013
WWF Metodologia para Avaliaccedilatildeo Raacutepida e a Priorizaccedilatildeo do Manejo de Unidades de
Conservaccedilatildeo (RAPPAM) 2010 Disponiacutevel em httpgooglXfDnxs Acesso em 30 de set
2013
WWF-Brasil Efetividade de Gestatildeo das Unidades de Conservaccedilatildeo no Estado do Amazonas
Secretaria de Estado do Meio Ambiente e do Desenvolvimento Sustentaacutevel do Amazonas
Instituto Chico Mendes de Conservaccedilatildeo da Biodiversidade Brasiacutelia WWF-Brasil 2011 72 p
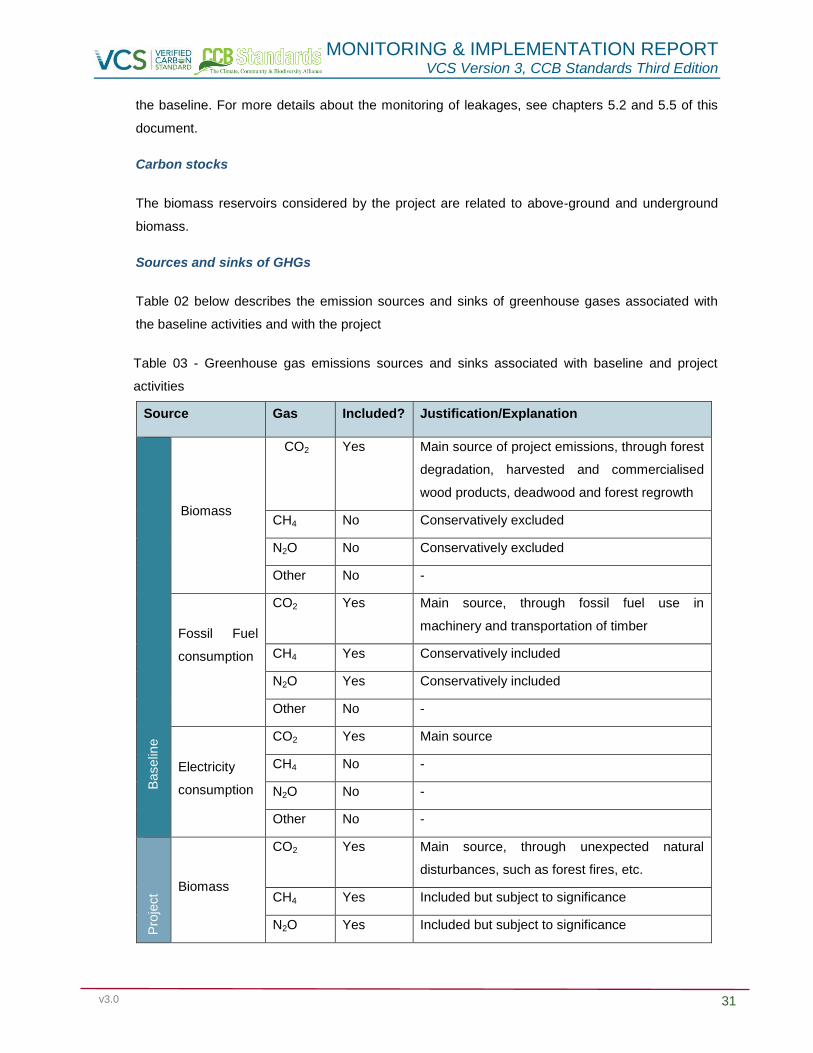
MONITORING amp IMPLEMENTATION REPORT VCS Version 3 CCB Standards Third Edition
v30 32
Source Gas Included JustificationExplanation
Other No _
Fossil Fuel
consumption
CO2 Yes Main source through flights and ground travel
CH4 Yes Included but subject to significance
N2O Yes Included but subject to significance
Other No _
Electricity
consumption
CO2 Yes Main source
CH4 No _
N2O No _
Other No _
34 Baseline Scenario
The choice between alternative baseline scenarios was taken together with the analysis of
additionality using the latest version of the VCS Tool for the demonstration and assessment of
additionality in Agriculture Forestry and Other Land Use VCS projects in this case VT000167
(VCS 2012a) All possible scenarios as well as the analysis of methodology barriers (steps 211
and 212 of the VM0011) are present in the chapter below In this sense to avoid redundancy of
information refer to additionality analysis to find the steps 211 and 212 of the VM0011
The baseline scenario for the project identified as the most likely to occur was selective logging8
(continuation of Business As Usual - BAU) The reference scenario assumes 37 years of selective
logging according to the 25 year logging plan approved in August 1998 (Annex 6 - document
ValdII T01 POA 1998) that in the absence of project activities would be renewed in 2024 for
another 25 years until 2049
Under this scenario the full implementation of the timber logging plan occurs and which has
already resulted in the degradation of 434769 ha (see table below) The area would be harvested
selectively for timber sold in lumber markets Below is a summary of harvest areas between 1999
and 2010 showing the managed plots and the dates on which the harvests were authorized
6 Tool for the demonstration and assessment of an additional to the VCS project activities in Agriculture Forestry and Other
Uses (AFOLU) (V 30)
7 Adapted from ldquoTool for the Demonstration and Assessment of Additionality in AR CDM project Activitiesrdquo (V02) 8 Additional information about choosing the baseline are presented in section 46 (steps 1 and 2)
MONITORING amp IMPLEMENTATION REPORT VCS Version 3 CCB Standards Third Edition
v30 33
Table 04 - Summary of areas managed since 1999
Date Managed logged area (ha)
1999 58669 (Plot 1)
2000 688 (Plot 2)
2001 ndash 2002 8315 (Plot 3)
2003 ndash 2004 750 (Plots 3 and 4)
2005 ndash 2007 1082 (Plot 5)
2008 ndash 2009 49050 (Plots 5 and 6)
TOTAL 434769
35 Additionality
The additionality analysis of the Amazon Rio project REDD+ IFM was conducted with the latest
version of the VCS Tool for the demonstration and assessment of additionality in Agriculture
Forestry and Other Land Use VCS projects the VT000167
(VCS 2012a)
To generate the reductions in GHG emissions for the project the planned baseline activities
(sustainable forest management) were terminated by the project proponent and supplanted by
environmental conservation activities In this sense the project will be managed by EBCF with
the goal of creating a fund for administrative and accounting management especially to promote
environmental management and monitoring activities of carbon pools within the project area
Alternative activities planned in the project are the provisioning and valuation of environmental
services via carbon credits (VCUs) in conjunction with the sale of Environmental Reserve Quotas
(CRAs)
4 MONITORING AND PARAMETERS OF DATA
41 Monitoring Plan Description
Due to its innovative comprehensive and integrative character the project needs to be monitored
regularly so that its actions activities and impacts can be constantly measured and evaluated To
meet this requirement the monitoring process must meet three main objectives
MONITORING amp IMPLEMENTATION REPORT VCS Version 3 CCB Standards Third Edition
v30 34
i To serve as an internal management project tool
ii To collaborate as an instrument of collective learning from the communities and
social groups directly involved
iii To work as a means of communicating results and impacts to interested institutions
and society in general Furthermore it is important to consider that monitoring if
successful will transcend the managerial aspects of the project and strengthening
the plan
To facilitate the monitoring process instead of having a reference line (to compare interventions
before and after) the first year of monitoring will serve as the starting point whose information will
be regularly and systematically compared throughout the project
Next the initial plans for monitoring benefits to the climate community and biodiversity are
described wherein the community is committed to participatory precept and to the technical and
scientific rigor which is capable of following the possible negative and positive impacts on
environmental and social aspects in the project area and its surroundings
Monitoring of Climate Impacts
The Monitoring Plan (MP) aims to provide security in the periodic estimates of reduction in
emissions especially in monitoring changes in carbon stock Therefore emissions from the
implementation of the project ex post estimates of the activities and emissions from any leakages
and isolated disturbances (eg blowdown fires pests and diseases among others) can be
calculated
The construction of the PM of the climate benefits made in full compliance with the methodological
framework provided by VM0011 ndash IFM LPF (VCS 2011) and CCBA (2008) which consists of four
specific actions to be monitored
i Implementation and execution of the project
ii Dynamics and stock of the forest biomass
iii Deforestation and forest degradation
iv Periodic reviews of ex post emissions
Remote monitoring and surveillance of the project area
Measurement of alterations and biomass loss quantification present in the PA using land use
change detection is critical to make accurate estimates of GHG emissions that account for forest
biomass increases and losses
MONITORING amp IMPLEMENTATION REPORT VCS Version 3 CCB Standards Third Edition
v30 35
Thus the use of remote sensing by satellite images of medium spatial resolution can be applied
readily in the PA and surroundings in order to monitor land use dynamics over time particularly to
identify risks and threats to forested areas In situ verification will complement landscape analysis
in a GIS environment with the aim of quantifying spatializing and identifying conversion of forest
areas into other land uses environmental degradation and other possible changes that may occur
during the term of the project
As a complementary monitoring source the project will rely on the database and information
provided by Monitoring Program of the Brazilian Amazon Forest by Satellite 910
(Prodes Digital)
conducted by the National Institute for Space Research (Instituto Nacional de Pesquisas Espaciais
- INPE) according to the Plan for Prevention and Control of Deforestation in the Amazon
1112(PPCDAm) under the National Policy on Prevention and Control of Deforestation Such
information is available online in13
digital vector files for the public in general
Other tools will provide complementary information to the monitoring such as indicators of forest
degradation and hotspots (fires and wildfires) obtained from DETER 14
SAD 15
and PROARCO16
Information is available online for free in vector format These results will be systematically related
to field data for validating or disproving the occurred event so that the focuses of deforestation and
degradation can be identified remediated reported and consequently avoided as much as
possible
A surveillance system that allows permanent territorial monitoring and inhibits the entry of intruders
through entry points in the PA will also be deployed to control the transport flow In addition one
must investigate and identify risks and threats eg mapping hotspots and areas vulnerable to fire
to illegal logging to hunting and poaching and to invasions by third parties among others
At first we estimate an effective demand for structuring the electronic monitoring system which
includes the hiring of skilled professionals field equipment electronic equipment (digital cameras
GPS desktops and notebooks smartphones printers geoprocessing software and GIS among
others) vehicles andor motorcycles motorized boats for transportation and moving around and
the collection of high resolution satellite images Empowerment and training of all involved staff
9httpwwwobtinpebrprodesdigitalmetodologiahtml
10httpwwwobtinpebrprodesmetodologiapdf 11httpwwwmmagovbrflorestascontrole-e-prevenC3A7C3A3o-do-desmatamento 12httpwwwmmagovbrimagesarquivo80120PPCDAm_FINAL_PPCDAMPDF 13httpwwwobtinpebrprodesindexhtml 14httpwwwobtinpebrdeterdados 15httpwwwimazongeoorgbrdocdownloadsphp 16httpwwwdpiinpebrproarcobdqueimadas
MONITORING amp IMPLEMENTATION REPORT VCS Version 3 CCB Standards Third Edition
v30 36
and the surrounding communities will be necessary to make the system effective17
and a constant
stream of information directed to regional actors and other stakeholders
Strategic monitoring and access points to RPDS roads will also provide support to other MPs
including social and biodiversity conservation aspects especially in the logistic support of planned
field activities
Procedures for determining the permanent sample plots (PSPs) and measurement
The calculation of the stock and increase in forest biomass will be subsidized through the
installation of PSPs in the PA and its temporal monitoring through the Continuous Forest Inventory
(CFI) The methodology proposed by VCS (2011) suggests the use of permanent andor temporary
plots however it confirms the efficiency and accuracy of sample plots
In order to demonstrate the procedural and statistical rigor used all the sampling procedures the
PA forest stratification sampling design calculation of sampling intensity and other parameters
measured in PSPs to monitor biomass balance due to ingressmortality of individuals growth in
DBH and height will be presented in detail in the Annex (Annex 23 - Forest Inventory 2016)
To promote reliable forest biomass estimates standard operating procedures (SOPs) (Section 82)
will be used by the team executing the CFI
Monitoring frequency
The monitoring frequency parameters measured in the PSPs will be no greater than 5 years from
the first measurement Other relevant parameters to monitoring the PSPs like the change in land
use in the PA and surrounding areas such as deforestation forest degradation fire sources and
natural disturbances will be regularly monitored as a project routine operation organized and
archived annually
411 Monitoring Impacts to Biodiversity
Since animal inventories have not been conducted in Amazon Rio project areas (for this project
biological information for the Rio Amapaacute RDS management plan were used) a biodiversity
monitoring system that will follow the RAPELD methodology (Rapid surveys of various taxonomic
groups (RAP) for long-term ecological studies) (MAGNUSSON et al 2005)
The RAPELD method contributes to long-term research using rapid inventory assessments biotic
complementarity and land use planning in the Amazon This method increases adequate sampling
17Linking community monitoring to national Measurement Reporting and Verification for REDD+
MONITORING amp IMPLEMENTATION REPORT VCS Version 3 CCB Standards Third Edition
v30 37
probability of biologically diverse communities which require large areas and at the same time
minimize variation of abiotic factors that affect these communities with smaller areas sampling
Evaluation and selection of indicators will be conducted in accordance with the ProBUC model
however applicably to local reality results will be updated biennially from the first survey
Biodiversity indicators are being designed and planned as suggested in the Social and
Environmental Monitoring System of Protected Areas in the Brazilian Amazon (Sistema de
Monitoramento Socioambiental das Unidades de Conservaccedilatildeo da Amazocircnia Brasileira)1819
and
Methodology for Rapid Assessment and Prioritization of Protected Areas Management20
(Metodologia para Avaliaccedilatildeo Raacutepida e Priorizaccedilatildeo do Manejo de Unidades de Conservaccedilatildeo -
RAPPAM) in line with the experiences gained and disseminated by CEUC and ICMBIO previously
described
The empowerment accountability and shared management of biodiversity conservation is the
main focus of the methodological model adopted These actions create high expectations for
environmental management of the area as the biodiversity monitoring will be conducted by the
community members themselves along with the project proponent promoting a local multiplier
effect It is worth mentioning that strict compliance with these procedures is in within EBCF`s
interest since it considers them to be key to the success of the project
The project begins with the premise that any negative impact on biodiversity in the project area
and its surroundings will not occur In the opposite sense the project aims to generate and provide
greater understanding of the territory subsidizing proposals for the conservation and sustainable
use through adoption of good management practices of natural resources as well as its replication
in other locations
412 Monitoring Social Impacts
The monitoring of social aspects include both the collection of numerical data such as quantity
volume weight (quantitative indicators) as well as information expressing opinions and
experiences (qualitative indicators) remembering that such measures are compatible and
interchangeable Data collection should be systematic and have a pre-established rate and most
likely a single indicator will require several data collection instruments such as plans field records
reports etc
Social information will be monitored through the use of participatory methodologies In this sense
the preparation process of the Amazon Rio I RPDS Management Plan was a first step For the
18Indicator Design 19Social and Environmental Monitoring of Protected Areas System in the Brazilian Amazon (Sistema de Monitoramento
Socioambiental das Unidades de Conservaccedilatildeo da Amazocircnia Brasileira) 20Metodologia para Avaliaccedilatildeo Raacutepida e a Priorizaccedilatildeo do Manejo de Unidades de Conservaccedilatildeo (RAPPAM)
MONITORING amp IMPLEMENTATION REPORT VCS Version 3 CCB Standards Third Edition
v30 38
socioeconomic characteristics of communities several community meetings land use mapping
workshops and interviews with focus groups were held in addition to field visits (Annex 10) The
main activities of the project were presented and discussed in these events emphasizing the
importance and timeliness of local valuation of environmental services as well as strategies for
raising funds to implement other projects and improvements in social well-being of communities
around the PA
5 MEASUREMENT OF GHG EMISSIONS REDUCTIONS AND REMOVALS (CLIMATE)
51 Emissions Baseline
EBCF did not carry out any wood related exploration activity in the areas since the beginning of
the REDD+ project Thus it is confirmed estimated emission reductions for the project as
8678833 t CO2eq t year
52 Project emissions
Project emissions were primarily those related to the running of offices and necessary travels for
studies meetings presentations workshops and other activities Table 10 presents a summary of
emissions based on data from Annex 21 of this report
Table 05 - 2011-2016 Project Activity Emissions
YEAR Energy
(KWh)
Energy
(t CO2eq)
Travels
(Km)
Travels
(t CO2eq)
Total
(t CO2eq)
2010
678 024 024
2011
104010 2360 2360
2012 1149 008 55724 1573 1581
2013 2756 028 236749 5429 5457
2014 2498 025 15789 459 484
2015 2231 023 27340 597 620
2016 1015 010
010
093 440290 10443 10536
53 Leakage
Not applicable according to presentation made on the REDD+ IFM document
MONITORING amp IMPLEMENTATION REPORT VCS Version 3 CCB Standards Third Edition
v30 39
54 Summary of GHG Emission Reductions And Removals
EBCF REDD+ project shows emissions reduction of 34397563 tCO2e as the balance in the
period of 2011-2015 Table 06 shows the overview of the dynamics of reductions and project
emissions up to 2048 By the year 2015 the emissions data is posted as seen in reports and from
2016 data are projects as previous average and should be adjusted as a result of future reports
Table 06 - Summary of ex ante estimates
Year
Estimated
reductions
from
baseline21
(tCO2e)
Project
Estimated
emissions 22
tCO2e)
Unplanned
estimate
Emissions23
(tCO2e)
Net GHG
Estimated
emissions
Reduction
(tCO2e)
2012 8675500 1581 0 8673919
2013 8675500 5457 0 8670043
2014 8675500 484 296296 8378720
2015 8675500 620 0 8674880
2016 8675500 2100 0 8673400
2017 8675500 2100 0 8673400
2018 8675500 2100 0 8673400
2019 8675500 2100 0 8673400
2020 8675500 2100 0 8673400
2030 8675500 2100 0 8673400
2048 8675500 2100 0 8673400
Total 3123180 25203 296296 3119989
55 Climate Change Adaptation Benefits (GL1)
There is a relatively widespread understanding in the scientific community that balanced
ecosystems have greater ecological and social resilience and adaptability to climate change
21
See annex 18 22
See annex 21 23
See annex 24- HDOM (Study on deforestation and heat spots for EBCF REDD+ Project technical report)
MONITORING amp IMPLEMENTATION REPORT VCS Version 3 CCB Standards Third Edition
v30 40
whether through protection of water bodies and regulation of river flows during peak flood and
drought or through the regular supply of environmental services products and services
Thus once the project is designed to conserve an area of native forest which in the absence of
the project scenario would remain subject to the pressure of timber management (baseline) and
consequent degradation resulting from such activities it is understood that the mere protection of
these areas alone would offer communities and the ecosystem itself better adaptability compared
to the baseline scenario
Moreover the project has an Activity Management Plan (Annex 9) which details among other
initiatives the promotion of the sustainable use of ecosystem resources through direct support in
some activities related to income generation and conservation along with community training It is
believed that in addition to ensuring a more balanced (and therefore more resilient) environment
the project will expand the options for generating income among the communities making them
more resilient and preparing them to face the greater and already perceived challenges posed by
climate change
6 COMMUNITY
61 Positive Impacts for Communities (CM1)
EBCFrsquos REDD+ project was first presented to the riverine communities in 2011 By then
communities were informed about the cessation of all timber exploration activities due to the
REDD+ project and discussions were held regarding biodiversity conservation and the sustainable
use of forest products and services as well the social development of the surrounding
communities Briefly the positive impacts along the communities were
1 Project area zoning and its surroundings
2 Contribution to building local capacity
3 Contribution to developing sustainable business in the region
4 Contribution to social and environmental diagnosis
Knowing to manage
To evaluate the progress of these initiatives throughout the development of the project we used
the methodology of the Sustainability Matrix developed by the Secretariat of Environment and
MONITORING amp IMPLEMENTATION REPORT VCS Version 3 CCB Standards Third Edition
v30 41
Sustainable Development of Amazonas State This tool was applied in 15 communities taking into
account local socio-economic aspects that underlie the development of 20 parameters considered
of great importance to community development described by specific indicators As a visual tool
the Sustainability Matrix is quite suitable for traditional populations such as the riverside and
indigenous communities surrounding the Reserve Amazon River I and other areas of the Project
Additionally the Matrix provides interesting spaces for discussion since its construction is done
collectively Through the Sustainability Matrix it was possible to identify along with the
communities projects activities and implementation strategies Budgets and monitoring and
evaluation of these projects will be detailed later through the Annual Operational Plans to be
developed and followed up in the due course Four programs and nine subprograms were defined
for management and community development (Annex 9)
62 Negative Impacts (CM2)
No negative impacts have been recorded or identified as a result of the project with stakeholders
7 BIODIVERSITY
71 Positive Impacts for Biodiversity (B1)
The benefits for biodiversity are in reducing deforestation and degradation (selective logging) in the
project area According to satellite images analysis in the project areas and their surroundings it
was observed that until 2010 300 hectares were deforested After the implementation of the
project community awareness on the importance of preservation and conservation of forests have
encouraged no deforestation degradation and a significant reduction in deforestation was
identified (see graph below) This was due to the good understanding of the projects conservation
objectives and by the involvement and support of the surrounding communities
MONITORING amp IMPLEMENTATION REPORT VCS Version 3 CCB Standards Third Edition
v30 42
Figure 10 - EBCF REDD Project and buffer areas deforestation figures (source HDOM Report)
The consequences of deforestation and degradation on biodiversity are well known Thus the fact
of not being identified changes (natural or anthropogenic) in forest areas shows there was no loss
of biodiversity no reduction in floristic diversity no impact on the dynamics of fauna and flora and
no loss of evolutionary genetic information
72 Negative Impacts on Biodiversity (B2)
There are no negative impacts on biodiversity as a result of the project
73 Exceptional Benefits for Biodiversity (GL3)
The description of exceptional benefits for biodiversity will only be possible after the re-
measurement of permanent plots (FLORA)
8 ADICIONAL INFORMATION
All activities and the consequent reduction in deforestation and degradation in and around the
project areas were maintained and funded without resources of carbon credits We understand that
with the advance of REDD+ project EBCF will have much better conditions to implement positive
actions in partnership with communities
MONITORING amp IMPLEMENTATION REPORT VCS Version 3 CCB Standards Third Edition
v30 43
REFERENCES
ADEODATO S etal Madeira de ponta a ponta o caminho da floresta ateacute o consumo Satildeo Paulo
FGV-RAE 2011
ALBAGLI S Amazocircnia fronteira geopoliacutetica da biodiversidade Revista Parcerias Estrateacutegicas n
12 p6 set2001 Centro de Estudos Estrateacutegicos do Ministeacuterio da Ciecircncia e Tecnologia
AMARAL I C Viabilidade de plantio de cafeacute na zona da mata mineira Revista Poliacutetica Agriacutecola
Ano xx n4 outnovdez 2011 Disponiacutevel em
httpwwwalicecnptiaembrapabrbitstreamdoc9309031Viabilidadedeplantiopdf Acesso
em 17 de set 2013
AMARAL P etal Floresta para Sempre um manual para a produccedilatildeo de madeira na Amazocircnia
Beleacutem IMAZON 1998 130p
AMAZONAS Lei Complementar nordm 532007 de 05062007 REGULAMENTA o inciso V do artigo
230 e o sect 1ordm do artigo 231 da Constituiccedilatildeo Estadual institui o SISTEMA ESTADUAL DE
UNIDADES DE CONSERVACcedilAtildeO - SEUC dispondo sobre infraccedilotildees e penalidades e
estabelecendo outras providecircncias Disponiacutevel em
httpwwwcetesbspgovbruserfilesfilemudancasclimaticasproclimafilelegislacaoestadua
lamazonasleilei_complementar_n_53_2007_amazonaspdf Acessado em Setembro 2013
ANTAQ Anuaacuterio Estatiacutestico 2004 Distacircncia entre os portos Disponiacutevel em
httpwwwantaqgovbrportalanuariosportuario2004TabelasDistanciaEntrePortospdf
Acesso em 23 de out 2013
ANTAQ Panorama Aquaviaacuterio Agecircncia Nacional de Transportes Aquaviaacuterios Volume 3 Brasiacutelia
ndash DF 2009
MONITORING amp IMPLEMENTATION REPORT VCS Version 3 CCB Standards Third Edition
v30 44
AREDES A F PEREIRA M W G Anaacutelise econocircmica da produccedilatildeo de cafeacute araacutebica um estudo
de caso com simulaccedilotildees de Monte Carlo para sistemas de baixa e alta produtividade
Informaccedilotildees Econocircmicas SP v38 n4 abr 2008
ARIMA E UHL C Pecuaacuteria na Amazocircnia Oriental Desempenho Atual e Perspectivas Futuras Seacuterie
Amazocircnia n1 Beleacutem IMAZON 1996 40p
BACCINI A et al Estimated carbon dioxide emissions from tropical deforestation improved by
carbon-density maps Nature Climate Change vol2 march 2012 (LETTERS Published
Online - DOI 101038NCLIMATE1354)
BARROS A C UHL C Padrotildees problemas e potencial da extraccedilatildeo madeireira ao longo do Rio
Amazonas e do seu estuaacuterio Seacuterie Amazocircnia n4 Beleacutem IMAZON 1997 42p
BRASIL Lei 121872009 (Lei Ordinaacuteria) 29122009 Institui a Poliacutetica Nacional sobre Mudanccedila
do Clima - PNMC e daacute outras Providecircncias Presidecircncia da Repuacuteblica Casa Civil Subchefia
para Assuntos Juriacutedicos Disponiacutevel em lthttpswwwplanaltogovbrccivil_03_ato2007-
20102009leil12187htmgt Acesso em 20 de set 2013
CAMPOS E F Emissatildeo de CO2 da madeira serrada da Amazocircnia o caso da exploraccedilatildeo
convencional 2012 172p Dissertaccedilatildeo - Escola Politeacutecnica Universidade de Satildeo Paulo Satildeo
Paulo
CARDOSO RS e FREITAS C E C A pesca de pequena escala no rio Madeira pelos
desembarques ocorridos em Manicoreacute (Estado do Amazonas) Brasil Revista Acta
Amazocircnica vol 38(4) 2008 781 ndash 788
CCBA Climate Community and Biodiversity Alliance-CCBA 2008 Disponiacutevel em
httpwwwclimate-standardsorgccb-standards Acesso em 03 de set 2013
MONITORING amp IMPLEMENTATION REPORT VCS Version 3 CCB Standards Third Edition
v30 45
CEPEA Centro de Estudos Avanccedilados em Economia Aplicada - ESALQUSP Economia da
pecuaacuteria de corte na regiatildeo norte do Brasil Disponiacutevel em httpgooglL2roiA Acesso em
15 de out 2013
CHAMBERS J Q et al Decomposition and carbon cycling of dead trees in tropical forests of the
central Amazon Oecologia vol122 pp380-388 2000 Agricultores se queixam de
burocracia para contratar creacutedito sustentaacutevel do Programa ABC Correio Braziliense Brasiacutelia
26 fev 2012 Disponiacutevel em
lthttpwww2correiobraziliensecombrsersustentavelp=4592gt Acesso em 10 set 2013
CULLEN Jr L VALLADARES-PAacuteDUA C Onccedilas como detetives da paisagem Ciecircncia Hoje
Vol 156 n26 pp54-571999
CPRM - Serviccedilo Geoloacutegico do Brasil Disponiacutevel em httpwwwcprmgovbr Acesso em 13 de
mar 2013
DIAS F M MORAIS S J S REZENDE R C Anaacutelise da viabilidade econocircmica para a
produccedilatildeo de melancia e cenoura com financiamento em Anaacutepolis-GO 2008 Disponiacutevel em
httpwwwprpuegbr06v1conteudopesquisainiccieneventossic2008fronteiraflashsicani
macaoIIIJORNADAarquivosresumosresumo01pdfgt Acesso em 18 de nov2013
Divisatildeo de Precessamento de Imagens (DPI) Ambdata Mapa de Vegetaccedilatildeo SIPAM RADAM
2002 Disponiacutevel em httpwwwdpiinpebrAmbdatamapa_sipamphp Acesso em 21 de
out 2013
DOMINGUES MS BERNMANN C O arco de desflorestamento na Amazocircnia da pecuaacuteria agrave
soja Ambiente amp Sociedade Satildeo Paulo vol15 n2 pp1-22 maioago 2012
MONITORING amp IMPLEMENTATION REPORT VCS Version 3 CCB Standards Third Edition
v30 46
EBCF Criaccedilatildeo da primeira reserva particular de desenvolvimento sustentaacutevel do mundo na
floresta amazocircnica Disponiacutevel emlthttpwwwebcfcombrblog20130624criacao-da-
primeira-reserva-particular-de-desenvolvimento-sustentavel-do-mundo-na-floresta-
amazonicagt Acesso em 21 de set 2013
EMBRAPA Sistema Brasileiro de Classificaccedilatildeo de Solos 2ordf Ed Rio de Janeiro Embrapa Solos
2006 306 p
FELDPAUSCH T R et al When big trees fall Damage and carbon export by reduced impact
logging in southern Amazonia Forest Ecology and Management Vol 219 pp199-215 2005
FEARNSIDE P MDesmatamento na Amazocircnia dinacircmica impactos e controle Acta Amazocircnica
vol 36 n3 pp 395-400 2006
FILGUEIRAS T S et al 1994 Caminhamento Um meacutetodo expedito para levantamentos
floriacutesticos qualitativos Caderno de Geociecircncia IBGE vol12 pp39-43 1994
Forest Management Public Summary for Gethal Amazonas SA Induacutestria de Madeira
Compensada Certification Code SW-FMCOC-119 Date of Certification October 1
2000 Date of Public Summary October 2000 Updated for Annual Audit 2002 Annual Audit
2003 (Gethalpdf)
Globo Rural Linha de financiamento para a agricultura de baixo carbono tem pouca procura
2011 Disponiacutevel em httpwwwrainforest-allianceorgforestrydocumentsgethalpdf
Acesso em 16 de nov 2013
GREENPEACE Face a Face com a Destruiccedilatildeo Relatoacuterio Greenpeace sobre as companhias
multinacionais madeireiras na Amazocircnia Brasileira 1999 Disponiacutevel em
MONITORING amp IMPLEMENTATION REPORT VCS Version 3 CCB Standards Third Edition
v30 47
lthttpwwwgreenpeaceorgbramazoniaface_destruicaopdfgt Acesso em 11 de set
2013
Governo do Estado do Amazonas Plano de Gestao da RDS do Rio Amapaacute 2010 Disponiacutevel em
httpobservatoriowwforgbrsite_mediauploadgestaoplanoManejorio_amapapdf Acesso
em 24 de ago 2013
HDOM Estimates from processing the forest inventories data carried out during the CADAF
Project Final Technical Report 2012 Disponiacutevel em wwwhdomcombr Acesso em 27 de
maio 2013
HIGUCHI N 1986-87 Amostragem sistemaacutetica versus amostragem aleatoacuteria em floresta tropical
uacutemida de terra-firme na regiatildeo de Manaus Acta Amazonica 1617 (uacutenico) 393-400
HIGUCHI N SANTOS J JARDIM FCS Tamanho de parcela amostral para inventaacuterios
florestais Acta Amazocircnica vol12 n1 pp91-103 1982
HIGUCHI F G PINTO A C M ISHIZUKA M KAJIMOTO T LIMA A J N SANTOS J
HIGUCHI N Estoque e dinacircmica de biomassa acima do solo das florestas de terra firme do
estado do Amazonas In Adriano Joseacute Nogueira Lima Flaacutevia Machado Durgante Moacir
Alberto Assis Campos Joaquim dos Santos Moriyoshi Ishizuka Niro Higuchi (Org)
Dinacircmica do carbono das florestas da Amazocircnia resultados do Projeto CADAF
1edManaus INPA 2014 v 1 p 29-34
HOLMES T P etal Custos e benefiacutecios financeiros da exploraccedilatildeo de impacto reduzido em
comparaccedilatildeo agrave exploraccedilatildeo florestal convencional na Amazocircnia oriental 2ordf ed Beleacutem
Fundaccedilatildeo Floresta Tropical 2002 66p
HUSCH B MILLER C I BEERS T W Forest mensuration New York Ronald Press 1971
HUSCH B MILLER C I BEERS T W Forest Mensuration New York John Wiley amp Sons
2nd
ed 1972 402 p
MONITORING amp IMPLEMENTATION REPORT VCS Version 3 CCB Standards Third Edition
v30 48
IBGE Instituto Brasileiro de Geografia e Estatiacutestica Diretoria de GeociecircnciasCoordenaccedilatildeo de
Recursos Naturais e Estudos Ambientais Geologia Solos Hidrografia e Vegetaccedilatildeo 2000
IBGE Instituto Brasileiro de Geografia e Estatiacutestica Manicoreacute 2010 Disponiacutevel
emlthttpwwwsidraibgegovbrgt Acesso em 05 de set 2013
IBGE Instituto Brasileiro de Geografia e Estatiacutestica 2011 Disponiacutevel em httpwwwibgegovbr
Acesso em 19 de mar 2013
IBGE Instituto Brasileiro de Geografia e Estatiacutestica Extraccedilatildeo vegetal e silvicultura para o
municiacutepio de Manicoreacute 2011 Disponiacutevel em
lthttpcidadesibgegovbrxtrastemasphplang=ampcodmun=130270ampidtema=102ampsearch=a
mazonas|manicore|extracao-vegetal-e-silvicultura-2011gt Acesso em 10 de out 2013
IBGE Instituto Brasileiro de Geografia e Estatiacutestica Censo Demograacutefico 2010 Disponiacutevel em
lthttpcidadesibgegovbrxtrastemasphpcodmun=130270ampidtema=116gt Acesso em 18
de out 2013
IBGE Instituto Brasileiro de Geografia e Estatiacutestica Censo Demograacutefico 2010 Disponiacutevel
emlthttpcidadesibgegovbrxtrashomephpgt Acesso em 08 de out 2013
IDESAM Reduccedilotildees de Emissotildees do Desmatamento e Degradaccedilatildeo Florestal (REDD+) estudo de
oportunidades para a regiatildeo sul do Amazonas CENAMO M Cl CARRERO G C
GANDOLFO P (Org) Manaus 2011 Disponiacutevel em
lthttpwwwobservatoriodoreddorgbrsitepdfestudodeoportunidadespdfgt Acesso em 13 de
set 2013
MONITORING amp IMPLEMENTATION REPORT VCS Version 3 CCB Standards Third Edition
v30 49
IDESAM Semeando Sustentabilidade em Apuiacute ndash Resultados e Perspectivas 2011 Manaus
Disponivel em lthttpidesamorgbrsemeando-sustentabilidade-em-apui-resultados-e-
perspectivasUxX8nfldWYI
IEA Instituto de Economia Aplicada CO2 Emissions from fuel combustion 2012 Disponiacutevel em
httpwwwieaorgco2highlightsco2highlightspdf Acesso em 09 de out 2013
IGREJA H L S CATIQUE J Anaacutelise neotectocircnica do lineamento de Itacoatiara centro leste do
Estado do Amazonas In Simpoacutesio Nacional de Estudos Tectocircnicos 6 1997 Pirenoacutepolis
Anais Pirenoacutepolis-GO SBG-Nuacutecleo Brasiacutelia1997
IMAZON Instituto do Homem e do Meio Ambiente da Amazocircnia Fatos Florestais 2010a
Disponiacutevel em httpwwwimazonorgbrpublicacoeslivrosfatos-florestais-da-amazonia-
2010-1 Acesso em 14 de out 2013
IMAZOM Instituto do Homem e do Meio Ambiente da Amazocircnia Mercado e preccedilo da madeira
amazocircnica 2010 Disponiacutevel em httpwwwimazonorgbrpublicacoesprecos-de-madeira-
em-toraboletim-de-precos-de-madeira-em-tora-na-amazonia-julho-2010at_downloadfile
Acesso em 23 de nov 2013
IMAZON Instituto do Homem e do Meio Ambiente da Amazocircnia Portal de Geoinformaccedilatildeo sobre
a Amazocircnia Disponiacutevel em lthttpwwwimazongeoorgbrimazongeophpgt Acesso em 06
de set 2013
IMAZON Instituto do Homem e do Meio Ambiente da Amazocircnia Transparecircncia florestal
Amazocircnia Legal 2012 Disponiacutevel em lthttpwwwimazonorgbrpublicacoestransparencia-
florestaltransparencia-florestal-amazonia-legalcopy_of_SADOutubro2012pdfgt Acesso em
23 de set 2013
IMAZON Instituto do Homem e do Meio Ambiente da Amazocircnia PEREIRA D SANTOS D
VEDOVETO M GIMARAtildeES J VERIacuteSSIMO A (Orgs) Fatos Florestais da Amazocircnia
Beleacutem IMAZON 2010 244p Disponiacutevel em
MONITORING amp IMPLEMENTATION REPORT VCS Version 3 CCB Standards Third Edition
v30 50
lthttpwwwimazonorgbrpublicacoeslivrosfatos-florestais-da-amazonia-2010-1gt Acesso
em 24 de set 2013
IMAZON Instituto do Homem e do Meio Ambiente da Amazocircnia A Expansatildeo madeireira na
Amazocircnia Impactos e perspectivas para o desenvolvimento sustentaacutevel no Paraacute BARROS
AC VERIacuteSSIMO A (Eds) Beleacutem IMAZON 2002
IMAZON Instituto do Homem e do Meio Ambiente da Amazocircnia Custos e Benefiacutecios do Manejo
Florestal Para Produccedilatildeo de Madeira na Amazocircnia Oriental 1998 Disponiacutevel em
lthttpwwwimazonorgbrpublicacoesserie-amazoniacustos-e-beneficios-do-manejo-
florestal-para-producao-de-madeira-na-amazonia-orientalgt Acesso em 20 de set 2013
INPE Instituto de Pesquisas Espaciais Banco de dados PRODES 2012 Disponiacutevel em
lthttpwwwdpiinpebrprodesdigitalprodesphpgt Acesso em 09 de set 2013
INPE Instituto de Pesquisas Espaciais Banco de dados DEGRAD 2009 Disponiacutevel em
lthttpwwwobtinpebrdegradgt Acesso em 09 de set 2013
INPE Instituto de Pesquisas Espaciais Banco de dados DETER 2013 Disponiacutevel em
lthttpwwwobtinpebrdetergt Acesso em 10 de set 2013
INPE Instituto de Pesquisas Espaciais Banco de dados de queimadas e focos de calor
BDQUEIMADAS 2013 Disponiacutevel em lthttpwwwdpiinpebrproarcobdqueimadasgt
Acesso em 10 de set 2013
Instituto Carbono Brasil Soacute 2 da produccedilatildeo de madeira eacute certificada O Estado de SPaulo 2006
Disponiacutevel em lthttpwwwinstitutocarbonobrasilorgbrnoticias6noticia=119796gt Acesso
em 26 de set 2013
MONITORING amp IMPLEMENTATION REPORT VCS Version 3 CCB Standards Third Edition
v30 51
IFT Instituto Floresta Tropical Diagnoacutestico do Setor Florestal de Cotriguaccedilu Estado do Mato
Grosso 2010 Disponiacutevel em lthttpgooglEVx2RZgt Acesso em 16 de dez 2013
IPCC Guidelines for National Greenhouse Gas Inventories In National Greenhouse Gas
Inventories Programme EGGLESTON HS BUENDIA L MIWA K NGARA T TANABE
K (Eds) Japan IGES 2006
ITTO Annual review and assessment of the world timber situation 2011 Disponivel em
httpwwwittointannual_review Acesso em 10 de out 2013
KELLER M et al Coarse woody debris in undisturbed and logged forests in the eastern Brazilian
Amazon Global Change Biology vol10 PP784-795 2004
LENTINI M VERISSIMO A PEREIRA D A expansatildeo madeireira na Amazocircnia O Estado da
Amazocircnia n2 2005 Beleacutem IMAZON Disponiacutevel em
httpwwwimazonorgbruploadea_2ppdf Acesso em 06 de set 2013
LOETSCH F ZOumlHRER F HALLER K E Forest Inventory Munich BLV Verlagsgesellschaft
2nd
edition Vol II 1973 469 p
MAGNUSSON WE et al RAPELD uma modificaccedilatildeo do meacutetodo de Gentry para inventaacuterios de
biodiversidade em siacutetios para pesquisa ecoloacutegica de longa duraccedilatildeo Biota Neotrop JulDez
2005 vol 5 no 2 httpwwwbiotaneotropicaorgbrv5n2ptabstractpoint-of-
view+bn01005022005 ISSN 1676-0603
MARINELLI C E et al O programa de monitoramento da biodiversidade da biodiversidade e do
uso de recursos naturais em unidades de conservaccedilatildeo estaduais do Amazonas Secretaria
de Estado do Meio Ambiente e Desenvolvimento Sustentaacutevel - SDS Manaus SDS 2007
MONITORING amp IMPLEMENTATION REPORT VCS Version 3 CCB Standards Third Edition
v30 52
MARINELLI C E MALTEZ M H Indicadores de Sustentabilidade para Unidades de
Conservaccedilatildeo Documento-Siacutentese Workshop Instituto Socioambiental Brasiacutelia-DF 2010
76p
MAZZEI L et al Above-ground biomass dynamics after reduced-impact logging in the Eastern
Amazon Forest Ecology and Management vol 259 pp367-373 2010
MEIRELLES FILHO O Livro de Ouro da Amazocircnia 5ordf Ediccedilatildeo Rio de Janeiro EDIOURO 2007
422p Meirelles Filho J O Livro de Ouro da Amazocircnia 1ordf ed Editora Ediouro ISBN
8500021616 2007 450p
MENGER Juliana da Silva Fatores determinantes da distribuiccedilatildeo de aves no interfluacutevio Purus-
Madeira Manaus [sn] 2011 35 fl il
MCT Arquivos dos Fatores de Emissatildeo Disponiacutevel em
httpwwwmctgovbrindexphpcontentview321144htmlancora Acesso em 23 de out
2013
MMA Ministeacuterio do Meio Ambiente Avaliaccedilatildeo e identificaccedilatildeo de accedilotildees prioritaacuterias para a
conservaccedilatildeo utilizaccedilatildeo sustentaacutevel e reparticcedilatildeo dos benefiacutecios da biodiversidade na
Amazocircnia brasileira Brasiacutelia MMASBF 2001
MMA Ministeacuterio do Meio Ambiente Secretaria de Biodiversidade e Florestas Aacutereas Prioritaacuterias
para Conservaccedilatildeo Uso Sustentaacutevel e Reparticcedilatildeo de Benefiacutecios da Biodiversidade Brasileira
Atualizaccedilatildeo - Portaria MMA ndeg9 de 23 de janeiro de 2007 Brasiacutelia MMA 2007 (Seacuterie
Biodiversidade 31)
MONITORING amp IMPLEMENTATION REPORT VCS Version 3 CCB Standards Third Edition
v30 53
MMA Livro vermelho da fauna brasileira ameaccedilada de extinccedilatildeo editores Angelo Barbosa
Monteiro Machado Glaacuteucia Moreira Drummond Adriano Pereira Paglia 1ed 2008 Brasiacutelia
DF MMA Belo Horizonte MG Fundaccedilatildeo Biodiversitas (1420 p) il - (Biodiversidade 19)
OLIVEIRA M M HIGUCHI N CELES C H HIGUCHI F G 2014 Tamanho e formas de
parcelas para inventaacuterios florestais de espeacutecies arboacutereas na Amazocircnia Central Ciecircncia
Florestal Santa Maria v 24 n 3 p 645-653
PEARSON TRH WALKER S BROWN SL The Source Book for Land Use Land Use
Change and Forestry Projects BioCarbon Fund and Winrock International 2005 64 pp
PORTAL AMAZOcircNIA Amazocircnia de A a Z Disponiacutevel em
lthttpportalamazoniaglobocomgt Acesso em 13 de set 2013
PEacuteLLICO NETTO S BRENA D A Inventaacuterio florestal Curitiba Editorado pelos autores p
316 1997
PROJETO SIVAM Relatoacuterio metodoloacutegico de trabalho Revisatildeo 3 Diretoria de Geociecircncia Rio de
Janeiro 2002 330 pp
PROJETO SIVAM Atualizaccedilatildeo do RADAMBRASIL Mapa de Vegetacao da Amazonia Legal
Mapa de Fitofisionomias ndash RADAMSIPAM DNPM Ministeacuterio de Minas e Energia 2002
Disponiacutevel em httpwwwdpiinpebramb_dataShapefilesveg_Amz_SIPAMzip Acesso
em 21 de jan 2014
PROJETO FLORESTAL SANTA MARIA (PROJETO FSM-REDD) Plant Inteligecircncia Ambiental ndash
Warwick Manfrinato 2012 Disponiacutevel em
lthttpwwwflorestalsantamariacombrsitedocumentos57FSM_REDD_VCS_PD_ptpdfgt
Acesso em 09 de set 2013
MONITORING amp IMPLEMENTATION REPORT VCS Version 3 CCB Standards Third Edition
v30 54
RADAMBRASIL Programa de Integraccedilatildeo Nacional Levantamentos de Recursos Naturais v 14 ndash
RADAM DNPM Ministeacuterio de Minas e Energia Brasil 1974
RIBEIRO J E L et al Flora da Reserva Ducke guia de identificaccedilatildeo das plantas vasculares de
uma floresta de terra firme na Amazocircnia Central Manaus Editora INPA 1999
ROSAS F C W WALDEMARIN H de MATTOS G E Pteronura rasiliensis (Zimmermann
1780) In MACHADO A B M DRUMMOND G M PAGLIA A P (eds) Livro Vermelho da
Fauna Brasileira Ameaccedilada de Extinccedilatildeo Volume II 1ed Brasiacutelia DF Ministeacuterio do Meio
Ambiente 2008 p 800 - 801
ROSS D GHG Emissions Resulting from Aircraft Travel 2009 Disponiacutevel em
httpwwwcarbonplanetcomdownloadsFlight_Calculator_Information_v92pdf Acesso em
14 de out 2013
SANTOS A J et al Viabilidade econocircmica do sistema agroflorestal greviacutelea x cafeacute na regiatildeo
norte do Paranaacute CERNE vol6 n1 pp89-100 2000
SANTOS R A Custo do manejo florestal madeireiro estudo de caso Floresta Estadual do
Antimary Monografia (Bacharelado em Economia) ndash Departamento de Ciecircncias
Econocircmicas Universidade Federal do Acre 2007109p
SABOGAL C et al Manejo Florestal Empresarial na Amazocircnia Brasileira restriccedilotildees e
oportunidades (Relatoacuterio Siacutentese) Beleacutem CIFORIMAZON 2006 72p
SDSCEUC Secretaria Estadual de Meio Ambiente e Desenvolvimento Sustentaacutevel ndash Centro
Estadual de Unidades de Conservaccedilatildeo Programa de Monitoramento de Biodiversidade e
Uso de Recursos Naturais em Aacutereas Protegidas do Estado Amazonas (ProBUC) 2006
Disponiacutevel em
MONITORING amp IMPLEMENTATION REPORT VCS Version 3 CCB Standards Third Edition
v30 55
httpbrazilwcsorgDesktopModulesBring2mindDMXDownloadaspxEntryId=6168ampPortalI
d=93ampDownloadMethod=attachment Acesso em 11 de ago de 2013
SFBIMAZON Serviccedilo Florestal Brasileiro e Instituto do Homem e Meio Ambiente da Amazocircnia A
atividade madeireira na Amazocircnia brasileira produccedilatildeo receita e mercados 2010 Disponiacutevel
em httpwwwmmagovbrestruturassfb_arquivosmiolo_resexec_polo_03_95_1pdf
Acesso em 23 de out 2013
SILVA R P da Alometria estoque e dinacircmica da biomassa de florestas primaacuterias e
secundaacuterias na regiatildeo de Manaus (AM) 152 p Tese de Doutorado Programa Integrado
de Poacutes-graduaccedilatildeo em Biologia Tropical e Recursos Naturais (INPA) Manaus 2007
SILVA Z A G P G SANTOS R A Custo do manejo florestal madeireiro em floresta puacuteblica
estudo de caso no Acre 2011 Disponiacutevel em
lthttpwwwbasacombrbancoamazonia2Revistaedicao_13n13_custo_do_manejo_flores
pdfgt Acesso em 13 de set 2013
SMIDT M GALLAGHER T Factors Affecting Fuel Consumption and Harvesting Costs Auburn
School of Forestry and Wildlife Sciences Sd Disponiacutevel em
httpweb1cnrevteduforestrycofedocuments2013Smidt_Gallagherpdf Acesso em 21
de out 2013
SOARES-FILHO B et al Role of Brazilian Amazon protected areas in climate change mitigation
2010 Columbia University NY Ruth S DeFries 2010
SPF Serviccedilo Puacuteblico Federal DVPF Documento de venda de produto Florestal (Declaraccedilotildees de
venda Gethalpdf) 14 de julho de 2006
MONITORING amp IMPLEMENTATION REPORT VCS Version 3 CCB Standards Third Edition
v30 56
TIMOFEICZYK JUacuteNIOR R et al Rentabilidade econocircmica do manejo de baixo impacto em
florestas tropicais um estudo de caso Revista Floresta Curitiba v 38 n 4 p 711-725
outdez 2008
VCS Ferramenta para Demonstraccedilatildeo e Avaliaccedilatildeo de Adicionalidade para Atividades de Projetos
VCS em Agricultura Floresta e Outros Usos (AFOLU) 2012a Disponiacutevel em httpwwwv-c-
sorgsitesv-c-sorgfilesVT000120VCS20AFOLU20Additionality20Tool20v30pdf
Acesso em 24 de set 2013
VCS Ferramenta de Risco e Natildeo Permanecircncia (AFOLU) 2012B Disponiacutevel em httpv-c-
sorgsitesv-c-sorgfilesAFOLU20Non-Permanence20Risk20Tool2C20v32pdf
Acesso em 13 de set 2013
VCS Approved VCS Methodology VM0010 Version 10 - Methodology for Improved Forest
Management Conversion to Logged to Protected Forest Calculating GHG Benefits from
Preventing Planned Degradation PHUA S SHARMA S TELFER M CHANDLER H
(Eds) Califoacuternia EUA Carbon Planet Limited 2011149p
VERDEJO M E Diagnoacutestico Rural Participativo um guia praacutetico Brasiacutelia MDA 2006 62p
VIANNA A L M Diagnoacutestico Florestal do Estado do Amazonas 2010 e 2011 Manaus-AM
IDESAM 2013 (Relatoacuterio Final do Projeto Fortalecimento da participaccedilatildeo da sociedade civil
no Amazonas Foacuterum de Mudanccedilas Climaacuteticas Transparecircncia Florestal no Estado do
Amazonas ndash Mapeamento de Instrumentos Legislativos no Brasil)
WBCSDWRI The GHG Protocol for Project Accountin Washington World Business Council for
Sustainable DevelopmentWorld Resources Institute 2005148 p
MONITORING amp IMPLEMENTATION REPORT VCS Version 3 CCB Standards Third Edition
v30 57
WALKER W et al Guia de Campo para Estimativa de Biomassa Florestal e Estoque de Carbono
Woods Hole Center Research Falmouth Massachusetts USA 2011 Disponiacutevel em
httpwwwwhrcorgresourcesfieldguidescarbonpdfWHRC_FieldGuide_PortugueseSMpdf
Acesso em 14 de set 2013
WWF Metodologia para Avaliaccedilatildeo Raacutepida e a Priorizaccedilatildeo do Manejo de Unidades de
Conservaccedilatildeo (RAPPAM) 2010 Disponiacutevel em httpgooglXfDnxs Acesso em 30 de set
2013
WWF-Brasil Efetividade de Gestatildeo das Unidades de Conservaccedilatildeo no Estado do Amazonas
Secretaria de Estado do Meio Ambiente e do Desenvolvimento Sustentaacutevel do Amazonas
Instituto Chico Mendes de Conservaccedilatildeo da Biodiversidade Brasiacutelia WWF-Brasil 2011 72 p
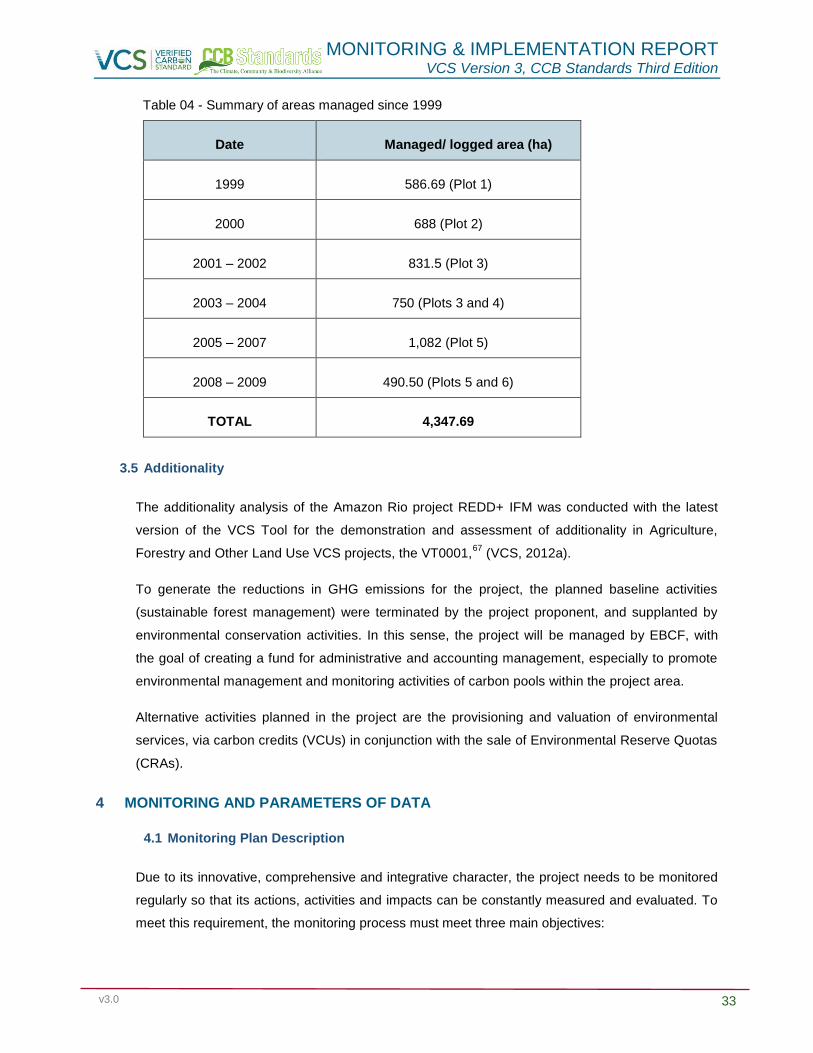
MONITORING amp IMPLEMENTATION REPORT VCS Version 3 CCB Standards Third Edition
v30 33
Table 04 - Summary of areas managed since 1999
Date Managed logged area (ha)
1999 58669 (Plot 1)
2000 688 (Plot 2)
2001 ndash 2002 8315 (Plot 3)
2003 ndash 2004 750 (Plots 3 and 4)
2005 ndash 2007 1082 (Plot 5)
2008 ndash 2009 49050 (Plots 5 and 6)
TOTAL 434769
35 Additionality
The additionality analysis of the Amazon Rio project REDD+ IFM was conducted with the latest
version of the VCS Tool for the demonstration and assessment of additionality in Agriculture
Forestry and Other Land Use VCS projects the VT000167
(VCS 2012a)
To generate the reductions in GHG emissions for the project the planned baseline activities
(sustainable forest management) were terminated by the project proponent and supplanted by
environmental conservation activities In this sense the project will be managed by EBCF with
the goal of creating a fund for administrative and accounting management especially to promote
environmental management and monitoring activities of carbon pools within the project area
Alternative activities planned in the project are the provisioning and valuation of environmental
services via carbon credits (VCUs) in conjunction with the sale of Environmental Reserve Quotas
(CRAs)
4 MONITORING AND PARAMETERS OF DATA
41 Monitoring Plan Description
Due to its innovative comprehensive and integrative character the project needs to be monitored
regularly so that its actions activities and impacts can be constantly measured and evaluated To
meet this requirement the monitoring process must meet three main objectives
MONITORING amp IMPLEMENTATION REPORT VCS Version 3 CCB Standards Third Edition
v30 34
i To serve as an internal management project tool
ii To collaborate as an instrument of collective learning from the communities and
social groups directly involved
iii To work as a means of communicating results and impacts to interested institutions
and society in general Furthermore it is important to consider that monitoring if
successful will transcend the managerial aspects of the project and strengthening
the plan
To facilitate the monitoring process instead of having a reference line (to compare interventions
before and after) the first year of monitoring will serve as the starting point whose information will
be regularly and systematically compared throughout the project
Next the initial plans for monitoring benefits to the climate community and biodiversity are
described wherein the community is committed to participatory precept and to the technical and
scientific rigor which is capable of following the possible negative and positive impacts on
environmental and social aspects in the project area and its surroundings
Monitoring of Climate Impacts
The Monitoring Plan (MP) aims to provide security in the periodic estimates of reduction in
emissions especially in monitoring changes in carbon stock Therefore emissions from the
implementation of the project ex post estimates of the activities and emissions from any leakages
and isolated disturbances (eg blowdown fires pests and diseases among others) can be
calculated
The construction of the PM of the climate benefits made in full compliance with the methodological
framework provided by VM0011 ndash IFM LPF (VCS 2011) and CCBA (2008) which consists of four
specific actions to be monitored
i Implementation and execution of the project
ii Dynamics and stock of the forest biomass
iii Deforestation and forest degradation
iv Periodic reviews of ex post emissions
Remote monitoring and surveillance of the project area
Measurement of alterations and biomass loss quantification present in the PA using land use
change detection is critical to make accurate estimates of GHG emissions that account for forest
biomass increases and losses
MONITORING amp IMPLEMENTATION REPORT VCS Version 3 CCB Standards Third Edition
v30 35
Thus the use of remote sensing by satellite images of medium spatial resolution can be applied
readily in the PA and surroundings in order to monitor land use dynamics over time particularly to
identify risks and threats to forested areas In situ verification will complement landscape analysis
in a GIS environment with the aim of quantifying spatializing and identifying conversion of forest
areas into other land uses environmental degradation and other possible changes that may occur
during the term of the project
As a complementary monitoring source the project will rely on the database and information
provided by Monitoring Program of the Brazilian Amazon Forest by Satellite 910
(Prodes Digital)
conducted by the National Institute for Space Research (Instituto Nacional de Pesquisas Espaciais
- INPE) according to the Plan for Prevention and Control of Deforestation in the Amazon
1112(PPCDAm) under the National Policy on Prevention and Control of Deforestation Such
information is available online in13
digital vector files for the public in general
Other tools will provide complementary information to the monitoring such as indicators of forest
degradation and hotspots (fires and wildfires) obtained from DETER 14
SAD 15
and PROARCO16
Information is available online for free in vector format These results will be systematically related
to field data for validating or disproving the occurred event so that the focuses of deforestation and
degradation can be identified remediated reported and consequently avoided as much as
possible
A surveillance system that allows permanent territorial monitoring and inhibits the entry of intruders
through entry points in the PA will also be deployed to control the transport flow In addition one
must investigate and identify risks and threats eg mapping hotspots and areas vulnerable to fire
to illegal logging to hunting and poaching and to invasions by third parties among others
At first we estimate an effective demand for structuring the electronic monitoring system which
includes the hiring of skilled professionals field equipment electronic equipment (digital cameras
GPS desktops and notebooks smartphones printers geoprocessing software and GIS among
others) vehicles andor motorcycles motorized boats for transportation and moving around and
the collection of high resolution satellite images Empowerment and training of all involved staff
9httpwwwobtinpebrprodesdigitalmetodologiahtml
10httpwwwobtinpebrprodesmetodologiapdf 11httpwwwmmagovbrflorestascontrole-e-prevenC3A7C3A3o-do-desmatamento 12httpwwwmmagovbrimagesarquivo80120PPCDAm_FINAL_PPCDAMPDF 13httpwwwobtinpebrprodesindexhtml 14httpwwwobtinpebrdeterdados 15httpwwwimazongeoorgbrdocdownloadsphp 16httpwwwdpiinpebrproarcobdqueimadas
MONITORING amp IMPLEMENTATION REPORT VCS Version 3 CCB Standards Third Edition
v30 36
and the surrounding communities will be necessary to make the system effective17
and a constant
stream of information directed to regional actors and other stakeholders
Strategic monitoring and access points to RPDS roads will also provide support to other MPs
including social and biodiversity conservation aspects especially in the logistic support of planned
field activities
Procedures for determining the permanent sample plots (PSPs) and measurement
The calculation of the stock and increase in forest biomass will be subsidized through the
installation of PSPs in the PA and its temporal monitoring through the Continuous Forest Inventory
(CFI) The methodology proposed by VCS (2011) suggests the use of permanent andor temporary
plots however it confirms the efficiency and accuracy of sample plots
In order to demonstrate the procedural and statistical rigor used all the sampling procedures the
PA forest stratification sampling design calculation of sampling intensity and other parameters
measured in PSPs to monitor biomass balance due to ingressmortality of individuals growth in
DBH and height will be presented in detail in the Annex (Annex 23 - Forest Inventory 2016)
To promote reliable forest biomass estimates standard operating procedures (SOPs) (Section 82)
will be used by the team executing the CFI
Monitoring frequency
The monitoring frequency parameters measured in the PSPs will be no greater than 5 years from
the first measurement Other relevant parameters to monitoring the PSPs like the change in land
use in the PA and surrounding areas such as deforestation forest degradation fire sources and
natural disturbances will be regularly monitored as a project routine operation organized and
archived annually
411 Monitoring Impacts to Biodiversity
Since animal inventories have not been conducted in Amazon Rio project areas (for this project
biological information for the Rio Amapaacute RDS management plan were used) a biodiversity
monitoring system that will follow the RAPELD methodology (Rapid surveys of various taxonomic
groups (RAP) for long-term ecological studies) (MAGNUSSON et al 2005)
The RAPELD method contributes to long-term research using rapid inventory assessments biotic
complementarity and land use planning in the Amazon This method increases adequate sampling
17Linking community monitoring to national Measurement Reporting and Verification for REDD+
MONITORING amp IMPLEMENTATION REPORT VCS Version 3 CCB Standards Third Edition
v30 37
probability of biologically diverse communities which require large areas and at the same time
minimize variation of abiotic factors that affect these communities with smaller areas sampling
Evaluation and selection of indicators will be conducted in accordance with the ProBUC model
however applicably to local reality results will be updated biennially from the first survey
Biodiversity indicators are being designed and planned as suggested in the Social and
Environmental Monitoring System of Protected Areas in the Brazilian Amazon (Sistema de
Monitoramento Socioambiental das Unidades de Conservaccedilatildeo da Amazocircnia Brasileira)1819
and
Methodology for Rapid Assessment and Prioritization of Protected Areas Management20
(Metodologia para Avaliaccedilatildeo Raacutepida e Priorizaccedilatildeo do Manejo de Unidades de Conservaccedilatildeo -
RAPPAM) in line with the experiences gained and disseminated by CEUC and ICMBIO previously
described
The empowerment accountability and shared management of biodiversity conservation is the
main focus of the methodological model adopted These actions create high expectations for
environmental management of the area as the biodiversity monitoring will be conducted by the
community members themselves along with the project proponent promoting a local multiplier
effect It is worth mentioning that strict compliance with these procedures is in within EBCF`s
interest since it considers them to be key to the success of the project
The project begins with the premise that any negative impact on biodiversity in the project area
and its surroundings will not occur In the opposite sense the project aims to generate and provide
greater understanding of the territory subsidizing proposals for the conservation and sustainable
use through adoption of good management practices of natural resources as well as its replication
in other locations
412 Monitoring Social Impacts
The monitoring of social aspects include both the collection of numerical data such as quantity
volume weight (quantitative indicators) as well as information expressing opinions and
experiences (qualitative indicators) remembering that such measures are compatible and
interchangeable Data collection should be systematic and have a pre-established rate and most
likely a single indicator will require several data collection instruments such as plans field records
reports etc
Social information will be monitored through the use of participatory methodologies In this sense
the preparation process of the Amazon Rio I RPDS Management Plan was a first step For the
18Indicator Design 19Social and Environmental Monitoring of Protected Areas System in the Brazilian Amazon (Sistema de Monitoramento
Socioambiental das Unidades de Conservaccedilatildeo da Amazocircnia Brasileira) 20Metodologia para Avaliaccedilatildeo Raacutepida e a Priorizaccedilatildeo do Manejo de Unidades de Conservaccedilatildeo (RAPPAM)
MONITORING amp IMPLEMENTATION REPORT VCS Version 3 CCB Standards Third Edition
v30 38
socioeconomic characteristics of communities several community meetings land use mapping
workshops and interviews with focus groups were held in addition to field visits (Annex 10) The
main activities of the project were presented and discussed in these events emphasizing the
importance and timeliness of local valuation of environmental services as well as strategies for
raising funds to implement other projects and improvements in social well-being of communities
around the PA
5 MEASUREMENT OF GHG EMISSIONS REDUCTIONS AND REMOVALS (CLIMATE)
51 Emissions Baseline
EBCF did not carry out any wood related exploration activity in the areas since the beginning of
the REDD+ project Thus it is confirmed estimated emission reductions for the project as
8678833 t CO2eq t year
52 Project emissions
Project emissions were primarily those related to the running of offices and necessary travels for
studies meetings presentations workshops and other activities Table 10 presents a summary of
emissions based on data from Annex 21 of this report
Table 05 - 2011-2016 Project Activity Emissions
YEAR Energy
(KWh)
Energy
(t CO2eq)
Travels
(Km)
Travels
(t CO2eq)
Total
(t CO2eq)
2010
678 024 024
2011
104010 2360 2360
2012 1149 008 55724 1573 1581
2013 2756 028 236749 5429 5457
2014 2498 025 15789 459 484
2015 2231 023 27340 597 620
2016 1015 010
010
093 440290 10443 10536
53 Leakage
Not applicable according to presentation made on the REDD+ IFM document
MONITORING amp IMPLEMENTATION REPORT VCS Version 3 CCB Standards Third Edition
v30 39
54 Summary of GHG Emission Reductions And Removals
EBCF REDD+ project shows emissions reduction of 34397563 tCO2e as the balance in the
period of 2011-2015 Table 06 shows the overview of the dynamics of reductions and project
emissions up to 2048 By the year 2015 the emissions data is posted as seen in reports and from
2016 data are projects as previous average and should be adjusted as a result of future reports
Table 06 - Summary of ex ante estimates
Year
Estimated
reductions
from
baseline21
(tCO2e)
Project
Estimated
emissions 22
tCO2e)
Unplanned
estimate
Emissions23
(tCO2e)
Net GHG
Estimated
emissions
Reduction
(tCO2e)
2012 8675500 1581 0 8673919
2013 8675500 5457 0 8670043
2014 8675500 484 296296 8378720
2015 8675500 620 0 8674880
2016 8675500 2100 0 8673400
2017 8675500 2100 0 8673400
2018 8675500 2100 0 8673400
2019 8675500 2100 0 8673400
2020 8675500 2100 0 8673400
2030 8675500 2100 0 8673400
2048 8675500 2100 0 8673400
Total 3123180 25203 296296 3119989
55 Climate Change Adaptation Benefits (GL1)
There is a relatively widespread understanding in the scientific community that balanced
ecosystems have greater ecological and social resilience and adaptability to climate change
21
See annex 18 22
See annex 21 23
See annex 24- HDOM (Study on deforestation and heat spots for EBCF REDD+ Project technical report)
MONITORING amp IMPLEMENTATION REPORT VCS Version 3 CCB Standards Third Edition
v30 40
whether through protection of water bodies and regulation of river flows during peak flood and
drought or through the regular supply of environmental services products and services
Thus once the project is designed to conserve an area of native forest which in the absence of
the project scenario would remain subject to the pressure of timber management (baseline) and
consequent degradation resulting from such activities it is understood that the mere protection of
these areas alone would offer communities and the ecosystem itself better adaptability compared
to the baseline scenario
Moreover the project has an Activity Management Plan (Annex 9) which details among other
initiatives the promotion of the sustainable use of ecosystem resources through direct support in
some activities related to income generation and conservation along with community training It is
believed that in addition to ensuring a more balanced (and therefore more resilient) environment
the project will expand the options for generating income among the communities making them
more resilient and preparing them to face the greater and already perceived challenges posed by
climate change
6 COMMUNITY
61 Positive Impacts for Communities (CM1)
EBCFrsquos REDD+ project was first presented to the riverine communities in 2011 By then
communities were informed about the cessation of all timber exploration activities due to the
REDD+ project and discussions were held regarding biodiversity conservation and the sustainable
use of forest products and services as well the social development of the surrounding
communities Briefly the positive impacts along the communities were
1 Project area zoning and its surroundings
2 Contribution to building local capacity
3 Contribution to developing sustainable business in the region
4 Contribution to social and environmental diagnosis
Knowing to manage
To evaluate the progress of these initiatives throughout the development of the project we used
the methodology of the Sustainability Matrix developed by the Secretariat of Environment and
MONITORING amp IMPLEMENTATION REPORT VCS Version 3 CCB Standards Third Edition
v30 41
Sustainable Development of Amazonas State This tool was applied in 15 communities taking into
account local socio-economic aspects that underlie the development of 20 parameters considered
of great importance to community development described by specific indicators As a visual tool
the Sustainability Matrix is quite suitable for traditional populations such as the riverside and
indigenous communities surrounding the Reserve Amazon River I and other areas of the Project
Additionally the Matrix provides interesting spaces for discussion since its construction is done
collectively Through the Sustainability Matrix it was possible to identify along with the
communities projects activities and implementation strategies Budgets and monitoring and
evaluation of these projects will be detailed later through the Annual Operational Plans to be
developed and followed up in the due course Four programs and nine subprograms were defined
for management and community development (Annex 9)
62 Negative Impacts (CM2)
No negative impacts have been recorded or identified as a result of the project with stakeholders
7 BIODIVERSITY
71 Positive Impacts for Biodiversity (B1)
The benefits for biodiversity are in reducing deforestation and degradation (selective logging) in the
project area According to satellite images analysis in the project areas and their surroundings it
was observed that until 2010 300 hectares were deforested After the implementation of the
project community awareness on the importance of preservation and conservation of forests have
encouraged no deforestation degradation and a significant reduction in deforestation was
identified (see graph below) This was due to the good understanding of the projects conservation
objectives and by the involvement and support of the surrounding communities
MONITORING amp IMPLEMENTATION REPORT VCS Version 3 CCB Standards Third Edition
v30 42
Figure 10 - EBCF REDD Project and buffer areas deforestation figures (source HDOM Report)
The consequences of deforestation and degradation on biodiversity are well known Thus the fact
of not being identified changes (natural or anthropogenic) in forest areas shows there was no loss
of biodiversity no reduction in floristic diversity no impact on the dynamics of fauna and flora and
no loss of evolutionary genetic information
72 Negative Impacts on Biodiversity (B2)
There are no negative impacts on biodiversity as a result of the project
73 Exceptional Benefits for Biodiversity (GL3)
The description of exceptional benefits for biodiversity will only be possible after the re-
measurement of permanent plots (FLORA)
8 ADICIONAL INFORMATION
All activities and the consequent reduction in deforestation and degradation in and around the
project areas were maintained and funded without resources of carbon credits We understand that
with the advance of REDD+ project EBCF will have much better conditions to implement positive
actions in partnership with communities
MONITORING amp IMPLEMENTATION REPORT VCS Version 3 CCB Standards Third Edition
v30 43
REFERENCES
ADEODATO S etal Madeira de ponta a ponta o caminho da floresta ateacute o consumo Satildeo Paulo
FGV-RAE 2011
ALBAGLI S Amazocircnia fronteira geopoliacutetica da biodiversidade Revista Parcerias Estrateacutegicas n
12 p6 set2001 Centro de Estudos Estrateacutegicos do Ministeacuterio da Ciecircncia e Tecnologia
AMARAL I C Viabilidade de plantio de cafeacute na zona da mata mineira Revista Poliacutetica Agriacutecola
Ano xx n4 outnovdez 2011 Disponiacutevel em
httpwwwalicecnptiaembrapabrbitstreamdoc9309031Viabilidadedeplantiopdf Acesso
em 17 de set 2013
AMARAL P etal Floresta para Sempre um manual para a produccedilatildeo de madeira na Amazocircnia
Beleacutem IMAZON 1998 130p
AMAZONAS Lei Complementar nordm 532007 de 05062007 REGULAMENTA o inciso V do artigo
230 e o sect 1ordm do artigo 231 da Constituiccedilatildeo Estadual institui o SISTEMA ESTADUAL DE
UNIDADES DE CONSERVACcedilAtildeO - SEUC dispondo sobre infraccedilotildees e penalidades e
estabelecendo outras providecircncias Disponiacutevel em
httpwwwcetesbspgovbruserfilesfilemudancasclimaticasproclimafilelegislacaoestadua
lamazonasleilei_complementar_n_53_2007_amazonaspdf Acessado em Setembro 2013
ANTAQ Anuaacuterio Estatiacutestico 2004 Distacircncia entre os portos Disponiacutevel em
httpwwwantaqgovbrportalanuariosportuario2004TabelasDistanciaEntrePortospdf
Acesso em 23 de out 2013
ANTAQ Panorama Aquaviaacuterio Agecircncia Nacional de Transportes Aquaviaacuterios Volume 3 Brasiacutelia
ndash DF 2009
MONITORING amp IMPLEMENTATION REPORT VCS Version 3 CCB Standards Third Edition
v30 44
AREDES A F PEREIRA M W G Anaacutelise econocircmica da produccedilatildeo de cafeacute araacutebica um estudo
de caso com simulaccedilotildees de Monte Carlo para sistemas de baixa e alta produtividade
Informaccedilotildees Econocircmicas SP v38 n4 abr 2008
ARIMA E UHL C Pecuaacuteria na Amazocircnia Oriental Desempenho Atual e Perspectivas Futuras Seacuterie
Amazocircnia n1 Beleacutem IMAZON 1996 40p
BACCINI A et al Estimated carbon dioxide emissions from tropical deforestation improved by
carbon-density maps Nature Climate Change vol2 march 2012 (LETTERS Published
Online - DOI 101038NCLIMATE1354)
BARROS A C UHL C Padrotildees problemas e potencial da extraccedilatildeo madeireira ao longo do Rio
Amazonas e do seu estuaacuterio Seacuterie Amazocircnia n4 Beleacutem IMAZON 1997 42p
BRASIL Lei 121872009 (Lei Ordinaacuteria) 29122009 Institui a Poliacutetica Nacional sobre Mudanccedila
do Clima - PNMC e daacute outras Providecircncias Presidecircncia da Repuacuteblica Casa Civil Subchefia
para Assuntos Juriacutedicos Disponiacutevel em lthttpswwwplanaltogovbrccivil_03_ato2007-
20102009leil12187htmgt Acesso em 20 de set 2013
CAMPOS E F Emissatildeo de CO2 da madeira serrada da Amazocircnia o caso da exploraccedilatildeo
convencional 2012 172p Dissertaccedilatildeo - Escola Politeacutecnica Universidade de Satildeo Paulo Satildeo
Paulo
CARDOSO RS e FREITAS C E C A pesca de pequena escala no rio Madeira pelos
desembarques ocorridos em Manicoreacute (Estado do Amazonas) Brasil Revista Acta
Amazocircnica vol 38(4) 2008 781 ndash 788
CCBA Climate Community and Biodiversity Alliance-CCBA 2008 Disponiacutevel em
httpwwwclimate-standardsorgccb-standards Acesso em 03 de set 2013
MONITORING amp IMPLEMENTATION REPORT VCS Version 3 CCB Standards Third Edition
v30 45
CEPEA Centro de Estudos Avanccedilados em Economia Aplicada - ESALQUSP Economia da
pecuaacuteria de corte na regiatildeo norte do Brasil Disponiacutevel em httpgooglL2roiA Acesso em
15 de out 2013
CHAMBERS J Q et al Decomposition and carbon cycling of dead trees in tropical forests of the
central Amazon Oecologia vol122 pp380-388 2000 Agricultores se queixam de
burocracia para contratar creacutedito sustentaacutevel do Programa ABC Correio Braziliense Brasiacutelia
26 fev 2012 Disponiacutevel em
lthttpwww2correiobraziliensecombrsersustentavelp=4592gt Acesso em 10 set 2013
CULLEN Jr L VALLADARES-PAacuteDUA C Onccedilas como detetives da paisagem Ciecircncia Hoje
Vol 156 n26 pp54-571999
CPRM - Serviccedilo Geoloacutegico do Brasil Disponiacutevel em httpwwwcprmgovbr Acesso em 13 de
mar 2013
DIAS F M MORAIS S J S REZENDE R C Anaacutelise da viabilidade econocircmica para a
produccedilatildeo de melancia e cenoura com financiamento em Anaacutepolis-GO 2008 Disponiacutevel em
httpwwwprpuegbr06v1conteudopesquisainiccieneventossic2008fronteiraflashsicani
macaoIIIJORNADAarquivosresumosresumo01pdfgt Acesso em 18 de nov2013
Divisatildeo de Precessamento de Imagens (DPI) Ambdata Mapa de Vegetaccedilatildeo SIPAM RADAM
2002 Disponiacutevel em httpwwwdpiinpebrAmbdatamapa_sipamphp Acesso em 21 de
out 2013
DOMINGUES MS BERNMANN C O arco de desflorestamento na Amazocircnia da pecuaacuteria agrave
soja Ambiente amp Sociedade Satildeo Paulo vol15 n2 pp1-22 maioago 2012
MONITORING amp IMPLEMENTATION REPORT VCS Version 3 CCB Standards Third Edition
v30 46
EBCF Criaccedilatildeo da primeira reserva particular de desenvolvimento sustentaacutevel do mundo na
floresta amazocircnica Disponiacutevel emlthttpwwwebcfcombrblog20130624criacao-da-
primeira-reserva-particular-de-desenvolvimento-sustentavel-do-mundo-na-floresta-
amazonicagt Acesso em 21 de set 2013
EMBRAPA Sistema Brasileiro de Classificaccedilatildeo de Solos 2ordf Ed Rio de Janeiro Embrapa Solos
2006 306 p
FELDPAUSCH T R et al When big trees fall Damage and carbon export by reduced impact
logging in southern Amazonia Forest Ecology and Management Vol 219 pp199-215 2005
FEARNSIDE P MDesmatamento na Amazocircnia dinacircmica impactos e controle Acta Amazocircnica
vol 36 n3 pp 395-400 2006
FILGUEIRAS T S et al 1994 Caminhamento Um meacutetodo expedito para levantamentos
floriacutesticos qualitativos Caderno de Geociecircncia IBGE vol12 pp39-43 1994
Forest Management Public Summary for Gethal Amazonas SA Induacutestria de Madeira
Compensada Certification Code SW-FMCOC-119 Date of Certification October 1
2000 Date of Public Summary October 2000 Updated for Annual Audit 2002 Annual Audit
2003 (Gethalpdf)
Globo Rural Linha de financiamento para a agricultura de baixo carbono tem pouca procura
2011 Disponiacutevel em httpwwwrainforest-allianceorgforestrydocumentsgethalpdf
Acesso em 16 de nov 2013
GREENPEACE Face a Face com a Destruiccedilatildeo Relatoacuterio Greenpeace sobre as companhias
multinacionais madeireiras na Amazocircnia Brasileira 1999 Disponiacutevel em
MONITORING amp IMPLEMENTATION REPORT VCS Version 3 CCB Standards Third Edition
v30 47
lthttpwwwgreenpeaceorgbramazoniaface_destruicaopdfgt Acesso em 11 de set
2013
Governo do Estado do Amazonas Plano de Gestao da RDS do Rio Amapaacute 2010 Disponiacutevel em
httpobservatoriowwforgbrsite_mediauploadgestaoplanoManejorio_amapapdf Acesso
em 24 de ago 2013
HDOM Estimates from processing the forest inventories data carried out during the CADAF
Project Final Technical Report 2012 Disponiacutevel em wwwhdomcombr Acesso em 27 de
maio 2013
HIGUCHI N 1986-87 Amostragem sistemaacutetica versus amostragem aleatoacuteria em floresta tropical
uacutemida de terra-firme na regiatildeo de Manaus Acta Amazonica 1617 (uacutenico) 393-400
HIGUCHI N SANTOS J JARDIM FCS Tamanho de parcela amostral para inventaacuterios
florestais Acta Amazocircnica vol12 n1 pp91-103 1982
HIGUCHI F G PINTO A C M ISHIZUKA M KAJIMOTO T LIMA A J N SANTOS J
HIGUCHI N Estoque e dinacircmica de biomassa acima do solo das florestas de terra firme do
estado do Amazonas In Adriano Joseacute Nogueira Lima Flaacutevia Machado Durgante Moacir
Alberto Assis Campos Joaquim dos Santos Moriyoshi Ishizuka Niro Higuchi (Org)
Dinacircmica do carbono das florestas da Amazocircnia resultados do Projeto CADAF
1edManaus INPA 2014 v 1 p 29-34
HOLMES T P etal Custos e benefiacutecios financeiros da exploraccedilatildeo de impacto reduzido em
comparaccedilatildeo agrave exploraccedilatildeo florestal convencional na Amazocircnia oriental 2ordf ed Beleacutem
Fundaccedilatildeo Floresta Tropical 2002 66p
HUSCH B MILLER C I BEERS T W Forest mensuration New York Ronald Press 1971
HUSCH B MILLER C I BEERS T W Forest Mensuration New York John Wiley amp Sons
2nd
ed 1972 402 p
MONITORING amp IMPLEMENTATION REPORT VCS Version 3 CCB Standards Third Edition
v30 48
IBGE Instituto Brasileiro de Geografia e Estatiacutestica Diretoria de GeociecircnciasCoordenaccedilatildeo de
Recursos Naturais e Estudos Ambientais Geologia Solos Hidrografia e Vegetaccedilatildeo 2000
IBGE Instituto Brasileiro de Geografia e Estatiacutestica Manicoreacute 2010 Disponiacutevel
emlthttpwwwsidraibgegovbrgt Acesso em 05 de set 2013
IBGE Instituto Brasileiro de Geografia e Estatiacutestica 2011 Disponiacutevel em httpwwwibgegovbr
Acesso em 19 de mar 2013
IBGE Instituto Brasileiro de Geografia e Estatiacutestica Extraccedilatildeo vegetal e silvicultura para o
municiacutepio de Manicoreacute 2011 Disponiacutevel em
lthttpcidadesibgegovbrxtrastemasphplang=ampcodmun=130270ampidtema=102ampsearch=a
mazonas|manicore|extracao-vegetal-e-silvicultura-2011gt Acesso em 10 de out 2013
IBGE Instituto Brasileiro de Geografia e Estatiacutestica Censo Demograacutefico 2010 Disponiacutevel em
lthttpcidadesibgegovbrxtrastemasphpcodmun=130270ampidtema=116gt Acesso em 18
de out 2013
IBGE Instituto Brasileiro de Geografia e Estatiacutestica Censo Demograacutefico 2010 Disponiacutevel
emlthttpcidadesibgegovbrxtrashomephpgt Acesso em 08 de out 2013
IDESAM Reduccedilotildees de Emissotildees do Desmatamento e Degradaccedilatildeo Florestal (REDD+) estudo de
oportunidades para a regiatildeo sul do Amazonas CENAMO M Cl CARRERO G C
GANDOLFO P (Org) Manaus 2011 Disponiacutevel em
lthttpwwwobservatoriodoreddorgbrsitepdfestudodeoportunidadespdfgt Acesso em 13 de
set 2013
MONITORING amp IMPLEMENTATION REPORT VCS Version 3 CCB Standards Third Edition
v30 49
IDESAM Semeando Sustentabilidade em Apuiacute ndash Resultados e Perspectivas 2011 Manaus
Disponivel em lthttpidesamorgbrsemeando-sustentabilidade-em-apui-resultados-e-
perspectivasUxX8nfldWYI
IEA Instituto de Economia Aplicada CO2 Emissions from fuel combustion 2012 Disponiacutevel em
httpwwwieaorgco2highlightsco2highlightspdf Acesso em 09 de out 2013
IGREJA H L S CATIQUE J Anaacutelise neotectocircnica do lineamento de Itacoatiara centro leste do
Estado do Amazonas In Simpoacutesio Nacional de Estudos Tectocircnicos 6 1997 Pirenoacutepolis
Anais Pirenoacutepolis-GO SBG-Nuacutecleo Brasiacutelia1997
IMAZON Instituto do Homem e do Meio Ambiente da Amazocircnia Fatos Florestais 2010a
Disponiacutevel em httpwwwimazonorgbrpublicacoeslivrosfatos-florestais-da-amazonia-
2010-1 Acesso em 14 de out 2013
IMAZOM Instituto do Homem e do Meio Ambiente da Amazocircnia Mercado e preccedilo da madeira
amazocircnica 2010 Disponiacutevel em httpwwwimazonorgbrpublicacoesprecos-de-madeira-
em-toraboletim-de-precos-de-madeira-em-tora-na-amazonia-julho-2010at_downloadfile
Acesso em 23 de nov 2013
IMAZON Instituto do Homem e do Meio Ambiente da Amazocircnia Portal de Geoinformaccedilatildeo sobre
a Amazocircnia Disponiacutevel em lthttpwwwimazongeoorgbrimazongeophpgt Acesso em 06
de set 2013
IMAZON Instituto do Homem e do Meio Ambiente da Amazocircnia Transparecircncia florestal
Amazocircnia Legal 2012 Disponiacutevel em lthttpwwwimazonorgbrpublicacoestransparencia-
florestaltransparencia-florestal-amazonia-legalcopy_of_SADOutubro2012pdfgt Acesso em
23 de set 2013
IMAZON Instituto do Homem e do Meio Ambiente da Amazocircnia PEREIRA D SANTOS D
VEDOVETO M GIMARAtildeES J VERIacuteSSIMO A (Orgs) Fatos Florestais da Amazocircnia
Beleacutem IMAZON 2010 244p Disponiacutevel em
MONITORING amp IMPLEMENTATION REPORT VCS Version 3 CCB Standards Third Edition
v30 50
lthttpwwwimazonorgbrpublicacoeslivrosfatos-florestais-da-amazonia-2010-1gt Acesso
em 24 de set 2013
IMAZON Instituto do Homem e do Meio Ambiente da Amazocircnia A Expansatildeo madeireira na
Amazocircnia Impactos e perspectivas para o desenvolvimento sustentaacutevel no Paraacute BARROS
AC VERIacuteSSIMO A (Eds) Beleacutem IMAZON 2002
IMAZON Instituto do Homem e do Meio Ambiente da Amazocircnia Custos e Benefiacutecios do Manejo
Florestal Para Produccedilatildeo de Madeira na Amazocircnia Oriental 1998 Disponiacutevel em
lthttpwwwimazonorgbrpublicacoesserie-amazoniacustos-e-beneficios-do-manejo-
florestal-para-producao-de-madeira-na-amazonia-orientalgt Acesso em 20 de set 2013
INPE Instituto de Pesquisas Espaciais Banco de dados PRODES 2012 Disponiacutevel em
lthttpwwwdpiinpebrprodesdigitalprodesphpgt Acesso em 09 de set 2013
INPE Instituto de Pesquisas Espaciais Banco de dados DEGRAD 2009 Disponiacutevel em
lthttpwwwobtinpebrdegradgt Acesso em 09 de set 2013
INPE Instituto de Pesquisas Espaciais Banco de dados DETER 2013 Disponiacutevel em
lthttpwwwobtinpebrdetergt Acesso em 10 de set 2013
INPE Instituto de Pesquisas Espaciais Banco de dados de queimadas e focos de calor
BDQUEIMADAS 2013 Disponiacutevel em lthttpwwwdpiinpebrproarcobdqueimadasgt
Acesso em 10 de set 2013
Instituto Carbono Brasil Soacute 2 da produccedilatildeo de madeira eacute certificada O Estado de SPaulo 2006
Disponiacutevel em lthttpwwwinstitutocarbonobrasilorgbrnoticias6noticia=119796gt Acesso
em 26 de set 2013
MONITORING amp IMPLEMENTATION REPORT VCS Version 3 CCB Standards Third Edition
v30 51
IFT Instituto Floresta Tropical Diagnoacutestico do Setor Florestal de Cotriguaccedilu Estado do Mato
Grosso 2010 Disponiacutevel em lthttpgooglEVx2RZgt Acesso em 16 de dez 2013
IPCC Guidelines for National Greenhouse Gas Inventories In National Greenhouse Gas
Inventories Programme EGGLESTON HS BUENDIA L MIWA K NGARA T TANABE
K (Eds) Japan IGES 2006
ITTO Annual review and assessment of the world timber situation 2011 Disponivel em
httpwwwittointannual_review Acesso em 10 de out 2013
KELLER M et al Coarse woody debris in undisturbed and logged forests in the eastern Brazilian
Amazon Global Change Biology vol10 PP784-795 2004
LENTINI M VERISSIMO A PEREIRA D A expansatildeo madeireira na Amazocircnia O Estado da
Amazocircnia n2 2005 Beleacutem IMAZON Disponiacutevel em
httpwwwimazonorgbruploadea_2ppdf Acesso em 06 de set 2013
LOETSCH F ZOumlHRER F HALLER K E Forest Inventory Munich BLV Verlagsgesellschaft
2nd
edition Vol II 1973 469 p
MAGNUSSON WE et al RAPELD uma modificaccedilatildeo do meacutetodo de Gentry para inventaacuterios de
biodiversidade em siacutetios para pesquisa ecoloacutegica de longa duraccedilatildeo Biota Neotrop JulDez
2005 vol 5 no 2 httpwwwbiotaneotropicaorgbrv5n2ptabstractpoint-of-
view+bn01005022005 ISSN 1676-0603
MARINELLI C E et al O programa de monitoramento da biodiversidade da biodiversidade e do
uso de recursos naturais em unidades de conservaccedilatildeo estaduais do Amazonas Secretaria
de Estado do Meio Ambiente e Desenvolvimento Sustentaacutevel - SDS Manaus SDS 2007
MONITORING amp IMPLEMENTATION REPORT VCS Version 3 CCB Standards Third Edition
v30 52
MARINELLI C E MALTEZ M H Indicadores de Sustentabilidade para Unidades de
Conservaccedilatildeo Documento-Siacutentese Workshop Instituto Socioambiental Brasiacutelia-DF 2010
76p
MAZZEI L et al Above-ground biomass dynamics after reduced-impact logging in the Eastern
Amazon Forest Ecology and Management vol 259 pp367-373 2010
MEIRELLES FILHO O Livro de Ouro da Amazocircnia 5ordf Ediccedilatildeo Rio de Janeiro EDIOURO 2007
422p Meirelles Filho J O Livro de Ouro da Amazocircnia 1ordf ed Editora Ediouro ISBN
8500021616 2007 450p
MENGER Juliana da Silva Fatores determinantes da distribuiccedilatildeo de aves no interfluacutevio Purus-
Madeira Manaus [sn] 2011 35 fl il
MCT Arquivos dos Fatores de Emissatildeo Disponiacutevel em
httpwwwmctgovbrindexphpcontentview321144htmlancora Acesso em 23 de out
2013
MMA Ministeacuterio do Meio Ambiente Avaliaccedilatildeo e identificaccedilatildeo de accedilotildees prioritaacuterias para a
conservaccedilatildeo utilizaccedilatildeo sustentaacutevel e reparticcedilatildeo dos benefiacutecios da biodiversidade na
Amazocircnia brasileira Brasiacutelia MMASBF 2001
MMA Ministeacuterio do Meio Ambiente Secretaria de Biodiversidade e Florestas Aacutereas Prioritaacuterias
para Conservaccedilatildeo Uso Sustentaacutevel e Reparticcedilatildeo de Benefiacutecios da Biodiversidade Brasileira
Atualizaccedilatildeo - Portaria MMA ndeg9 de 23 de janeiro de 2007 Brasiacutelia MMA 2007 (Seacuterie
Biodiversidade 31)
MONITORING amp IMPLEMENTATION REPORT VCS Version 3 CCB Standards Third Edition
v30 53
MMA Livro vermelho da fauna brasileira ameaccedilada de extinccedilatildeo editores Angelo Barbosa
Monteiro Machado Glaacuteucia Moreira Drummond Adriano Pereira Paglia 1ed 2008 Brasiacutelia
DF MMA Belo Horizonte MG Fundaccedilatildeo Biodiversitas (1420 p) il - (Biodiversidade 19)
OLIVEIRA M M HIGUCHI N CELES C H HIGUCHI F G 2014 Tamanho e formas de
parcelas para inventaacuterios florestais de espeacutecies arboacutereas na Amazocircnia Central Ciecircncia
Florestal Santa Maria v 24 n 3 p 645-653
PEARSON TRH WALKER S BROWN SL The Source Book for Land Use Land Use
Change and Forestry Projects BioCarbon Fund and Winrock International 2005 64 pp
PORTAL AMAZOcircNIA Amazocircnia de A a Z Disponiacutevel em
lthttpportalamazoniaglobocomgt Acesso em 13 de set 2013
PEacuteLLICO NETTO S BRENA D A Inventaacuterio florestal Curitiba Editorado pelos autores p
316 1997
PROJETO SIVAM Relatoacuterio metodoloacutegico de trabalho Revisatildeo 3 Diretoria de Geociecircncia Rio de
Janeiro 2002 330 pp
PROJETO SIVAM Atualizaccedilatildeo do RADAMBRASIL Mapa de Vegetacao da Amazonia Legal
Mapa de Fitofisionomias ndash RADAMSIPAM DNPM Ministeacuterio de Minas e Energia 2002
Disponiacutevel em httpwwwdpiinpebramb_dataShapefilesveg_Amz_SIPAMzip Acesso
em 21 de jan 2014
PROJETO FLORESTAL SANTA MARIA (PROJETO FSM-REDD) Plant Inteligecircncia Ambiental ndash
Warwick Manfrinato 2012 Disponiacutevel em
lthttpwwwflorestalsantamariacombrsitedocumentos57FSM_REDD_VCS_PD_ptpdfgt
Acesso em 09 de set 2013
MONITORING amp IMPLEMENTATION REPORT VCS Version 3 CCB Standards Third Edition
v30 54
RADAMBRASIL Programa de Integraccedilatildeo Nacional Levantamentos de Recursos Naturais v 14 ndash
RADAM DNPM Ministeacuterio de Minas e Energia Brasil 1974
RIBEIRO J E L et al Flora da Reserva Ducke guia de identificaccedilatildeo das plantas vasculares de
uma floresta de terra firme na Amazocircnia Central Manaus Editora INPA 1999
ROSAS F C W WALDEMARIN H de MATTOS G E Pteronura rasiliensis (Zimmermann
1780) In MACHADO A B M DRUMMOND G M PAGLIA A P (eds) Livro Vermelho da
Fauna Brasileira Ameaccedilada de Extinccedilatildeo Volume II 1ed Brasiacutelia DF Ministeacuterio do Meio
Ambiente 2008 p 800 - 801
ROSS D GHG Emissions Resulting from Aircraft Travel 2009 Disponiacutevel em
httpwwwcarbonplanetcomdownloadsFlight_Calculator_Information_v92pdf Acesso em
14 de out 2013
SANTOS A J et al Viabilidade econocircmica do sistema agroflorestal greviacutelea x cafeacute na regiatildeo
norte do Paranaacute CERNE vol6 n1 pp89-100 2000
SANTOS R A Custo do manejo florestal madeireiro estudo de caso Floresta Estadual do
Antimary Monografia (Bacharelado em Economia) ndash Departamento de Ciecircncias
Econocircmicas Universidade Federal do Acre 2007109p
SABOGAL C et al Manejo Florestal Empresarial na Amazocircnia Brasileira restriccedilotildees e
oportunidades (Relatoacuterio Siacutentese) Beleacutem CIFORIMAZON 2006 72p
SDSCEUC Secretaria Estadual de Meio Ambiente e Desenvolvimento Sustentaacutevel ndash Centro
Estadual de Unidades de Conservaccedilatildeo Programa de Monitoramento de Biodiversidade e
Uso de Recursos Naturais em Aacutereas Protegidas do Estado Amazonas (ProBUC) 2006
Disponiacutevel em
MONITORING amp IMPLEMENTATION REPORT VCS Version 3 CCB Standards Third Edition
v30 55
httpbrazilwcsorgDesktopModulesBring2mindDMXDownloadaspxEntryId=6168ampPortalI
d=93ampDownloadMethod=attachment Acesso em 11 de ago de 2013
SFBIMAZON Serviccedilo Florestal Brasileiro e Instituto do Homem e Meio Ambiente da Amazocircnia A
atividade madeireira na Amazocircnia brasileira produccedilatildeo receita e mercados 2010 Disponiacutevel
em httpwwwmmagovbrestruturassfb_arquivosmiolo_resexec_polo_03_95_1pdf
Acesso em 23 de out 2013
SILVA R P da Alometria estoque e dinacircmica da biomassa de florestas primaacuterias e
secundaacuterias na regiatildeo de Manaus (AM) 152 p Tese de Doutorado Programa Integrado
de Poacutes-graduaccedilatildeo em Biologia Tropical e Recursos Naturais (INPA) Manaus 2007
SILVA Z A G P G SANTOS R A Custo do manejo florestal madeireiro em floresta puacuteblica
estudo de caso no Acre 2011 Disponiacutevel em
lthttpwwwbasacombrbancoamazonia2Revistaedicao_13n13_custo_do_manejo_flores
pdfgt Acesso em 13 de set 2013
SMIDT M GALLAGHER T Factors Affecting Fuel Consumption and Harvesting Costs Auburn
School of Forestry and Wildlife Sciences Sd Disponiacutevel em
httpweb1cnrevteduforestrycofedocuments2013Smidt_Gallagherpdf Acesso em 21
de out 2013
SOARES-FILHO B et al Role of Brazilian Amazon protected areas in climate change mitigation
2010 Columbia University NY Ruth S DeFries 2010
SPF Serviccedilo Puacuteblico Federal DVPF Documento de venda de produto Florestal (Declaraccedilotildees de
venda Gethalpdf) 14 de julho de 2006
MONITORING amp IMPLEMENTATION REPORT VCS Version 3 CCB Standards Third Edition
v30 56
TIMOFEICZYK JUacuteNIOR R et al Rentabilidade econocircmica do manejo de baixo impacto em
florestas tropicais um estudo de caso Revista Floresta Curitiba v 38 n 4 p 711-725
outdez 2008
VCS Ferramenta para Demonstraccedilatildeo e Avaliaccedilatildeo de Adicionalidade para Atividades de Projetos
VCS em Agricultura Floresta e Outros Usos (AFOLU) 2012a Disponiacutevel em httpwwwv-c-
sorgsitesv-c-sorgfilesVT000120VCS20AFOLU20Additionality20Tool20v30pdf
Acesso em 24 de set 2013
VCS Ferramenta de Risco e Natildeo Permanecircncia (AFOLU) 2012B Disponiacutevel em httpv-c-
sorgsitesv-c-sorgfilesAFOLU20Non-Permanence20Risk20Tool2C20v32pdf
Acesso em 13 de set 2013
VCS Approved VCS Methodology VM0010 Version 10 - Methodology for Improved Forest
Management Conversion to Logged to Protected Forest Calculating GHG Benefits from
Preventing Planned Degradation PHUA S SHARMA S TELFER M CHANDLER H
(Eds) Califoacuternia EUA Carbon Planet Limited 2011149p
VERDEJO M E Diagnoacutestico Rural Participativo um guia praacutetico Brasiacutelia MDA 2006 62p
VIANNA A L M Diagnoacutestico Florestal do Estado do Amazonas 2010 e 2011 Manaus-AM
IDESAM 2013 (Relatoacuterio Final do Projeto Fortalecimento da participaccedilatildeo da sociedade civil
no Amazonas Foacuterum de Mudanccedilas Climaacuteticas Transparecircncia Florestal no Estado do
Amazonas ndash Mapeamento de Instrumentos Legislativos no Brasil)
WBCSDWRI The GHG Protocol for Project Accountin Washington World Business Council for
Sustainable DevelopmentWorld Resources Institute 2005148 p
MONITORING amp IMPLEMENTATION REPORT VCS Version 3 CCB Standards Third Edition
v30 57
WALKER W et al Guia de Campo para Estimativa de Biomassa Florestal e Estoque de Carbono
Woods Hole Center Research Falmouth Massachusetts USA 2011 Disponiacutevel em
httpwwwwhrcorgresourcesfieldguidescarbonpdfWHRC_FieldGuide_PortugueseSMpdf
Acesso em 14 de set 2013
WWF Metodologia para Avaliaccedilatildeo Raacutepida e a Priorizaccedilatildeo do Manejo de Unidades de
Conservaccedilatildeo (RAPPAM) 2010 Disponiacutevel em httpgooglXfDnxs Acesso em 30 de set
2013
WWF-Brasil Efetividade de Gestatildeo das Unidades de Conservaccedilatildeo no Estado do Amazonas
Secretaria de Estado do Meio Ambiente e do Desenvolvimento Sustentaacutevel do Amazonas
Instituto Chico Mendes de Conservaccedilatildeo da Biodiversidade Brasiacutelia WWF-Brasil 2011 72 p
MONITORING amp IMPLEMENTATION REPORT VCS Version 3 CCB Standards Third Edition
v30 34
i To serve as an internal management project tool
ii To collaborate as an instrument of collective learning from the communities and
social groups directly involved
iii To work as a means of communicating results and impacts to interested institutions
and society in general Furthermore it is important to consider that monitoring if
successful will transcend the managerial aspects of the project and strengthening
the plan
To facilitate the monitoring process instead of having a reference line (to compare interventions
before and after) the first year of monitoring will serve as the starting point whose information will
be regularly and systematically compared throughout the project
Next the initial plans for monitoring benefits to the climate community and biodiversity are
described wherein the community is committed to participatory precept and to the technical and
scientific rigor which is capable of following the possible negative and positive impacts on
environmental and social aspects in the project area and its surroundings
Monitoring of Climate Impacts
The Monitoring Plan (MP) aims to provide security in the periodic estimates of reduction in
emissions especially in monitoring changes in carbon stock Therefore emissions from the
implementation of the project ex post estimates of the activities and emissions from any leakages
and isolated disturbances (eg blowdown fires pests and diseases among others) can be
calculated
The construction of the PM of the climate benefits made in full compliance with the methodological
framework provided by VM0011 ndash IFM LPF (VCS 2011) and CCBA (2008) which consists of four
specific actions to be monitored
i Implementation and execution of the project
ii Dynamics and stock of the forest biomass
iii Deforestation and forest degradation
iv Periodic reviews of ex post emissions
Remote monitoring and surveillance of the project area
Measurement of alterations and biomass loss quantification present in the PA using land use
change detection is critical to make accurate estimates of GHG emissions that account for forest
biomass increases and losses
MONITORING amp IMPLEMENTATION REPORT VCS Version 3 CCB Standards Third Edition
v30 35
Thus the use of remote sensing by satellite images of medium spatial resolution can be applied
readily in the PA and surroundings in order to monitor land use dynamics over time particularly to
identify risks and threats to forested areas In situ verification will complement landscape analysis
in a GIS environment with the aim of quantifying spatializing and identifying conversion of forest
areas into other land uses environmental degradation and other possible changes that may occur
during the term of the project
As a complementary monitoring source the project will rely on the database and information
provided by Monitoring Program of the Brazilian Amazon Forest by Satellite 910
(Prodes Digital)
conducted by the National Institute for Space Research (Instituto Nacional de Pesquisas Espaciais
- INPE) according to the Plan for Prevention and Control of Deforestation in the Amazon
1112(PPCDAm) under the National Policy on Prevention and Control of Deforestation Such
information is available online in13
digital vector files for the public in general
Other tools will provide complementary information to the monitoring such as indicators of forest
degradation and hotspots (fires and wildfires) obtained from DETER 14
SAD 15
and PROARCO16
Information is available online for free in vector format These results will be systematically related
to field data for validating or disproving the occurred event so that the focuses of deforestation and
degradation can be identified remediated reported and consequently avoided as much as
possible
A surveillance system that allows permanent territorial monitoring and inhibits the entry of intruders
through entry points in the PA will also be deployed to control the transport flow In addition one
must investigate and identify risks and threats eg mapping hotspots and areas vulnerable to fire
to illegal logging to hunting and poaching and to invasions by third parties among others
At first we estimate an effective demand for structuring the electronic monitoring system which
includes the hiring of skilled professionals field equipment electronic equipment (digital cameras
GPS desktops and notebooks smartphones printers geoprocessing software and GIS among
others) vehicles andor motorcycles motorized boats for transportation and moving around and
the collection of high resolution satellite images Empowerment and training of all involved staff
9httpwwwobtinpebrprodesdigitalmetodologiahtml
10httpwwwobtinpebrprodesmetodologiapdf 11httpwwwmmagovbrflorestascontrole-e-prevenC3A7C3A3o-do-desmatamento 12httpwwwmmagovbrimagesarquivo80120PPCDAm_FINAL_PPCDAMPDF 13httpwwwobtinpebrprodesindexhtml 14httpwwwobtinpebrdeterdados 15httpwwwimazongeoorgbrdocdownloadsphp 16httpwwwdpiinpebrproarcobdqueimadas
MONITORING amp IMPLEMENTATION REPORT VCS Version 3 CCB Standards Third Edition
v30 36
and the surrounding communities will be necessary to make the system effective17
and a constant
stream of information directed to regional actors and other stakeholders
Strategic monitoring and access points to RPDS roads will also provide support to other MPs
including social and biodiversity conservation aspects especially in the logistic support of planned
field activities
Procedures for determining the permanent sample plots (PSPs) and measurement
The calculation of the stock and increase in forest biomass will be subsidized through the
installation of PSPs in the PA and its temporal monitoring through the Continuous Forest Inventory
(CFI) The methodology proposed by VCS (2011) suggests the use of permanent andor temporary
plots however it confirms the efficiency and accuracy of sample plots
In order to demonstrate the procedural and statistical rigor used all the sampling procedures the
PA forest stratification sampling design calculation of sampling intensity and other parameters
measured in PSPs to monitor biomass balance due to ingressmortality of individuals growth in
DBH and height will be presented in detail in the Annex (Annex 23 - Forest Inventory 2016)
To promote reliable forest biomass estimates standard operating procedures (SOPs) (Section 82)
will be used by the team executing the CFI
Monitoring frequency
The monitoring frequency parameters measured in the PSPs will be no greater than 5 years from
the first measurement Other relevant parameters to monitoring the PSPs like the change in land
use in the PA and surrounding areas such as deforestation forest degradation fire sources and
natural disturbances will be regularly monitored as a project routine operation organized and
archived annually
411 Monitoring Impacts to Biodiversity
Since animal inventories have not been conducted in Amazon Rio project areas (for this project
biological information for the Rio Amapaacute RDS management plan were used) a biodiversity
monitoring system that will follow the RAPELD methodology (Rapid surveys of various taxonomic
groups (RAP) for long-term ecological studies) (MAGNUSSON et al 2005)
The RAPELD method contributes to long-term research using rapid inventory assessments biotic
complementarity and land use planning in the Amazon This method increases adequate sampling
17Linking community monitoring to national Measurement Reporting and Verification for REDD+
MONITORING amp IMPLEMENTATION REPORT VCS Version 3 CCB Standards Third Edition
v30 37
probability of biologically diverse communities which require large areas and at the same time
minimize variation of abiotic factors that affect these communities with smaller areas sampling
Evaluation and selection of indicators will be conducted in accordance with the ProBUC model
however applicably to local reality results will be updated biennially from the first survey
Biodiversity indicators are being designed and planned as suggested in the Social and
Environmental Monitoring System of Protected Areas in the Brazilian Amazon (Sistema de
Monitoramento Socioambiental das Unidades de Conservaccedilatildeo da Amazocircnia Brasileira)1819
and
Methodology for Rapid Assessment and Prioritization of Protected Areas Management20
(Metodologia para Avaliaccedilatildeo Raacutepida e Priorizaccedilatildeo do Manejo de Unidades de Conservaccedilatildeo -
RAPPAM) in line with the experiences gained and disseminated by CEUC and ICMBIO previously
described
The empowerment accountability and shared management of biodiversity conservation is the
main focus of the methodological model adopted These actions create high expectations for
environmental management of the area as the biodiversity monitoring will be conducted by the
community members themselves along with the project proponent promoting a local multiplier
effect It is worth mentioning that strict compliance with these procedures is in within EBCF`s
interest since it considers them to be key to the success of the project
The project begins with the premise that any negative impact on biodiversity in the project area
and its surroundings will not occur In the opposite sense the project aims to generate and provide
greater understanding of the territory subsidizing proposals for the conservation and sustainable
use through adoption of good management practices of natural resources as well as its replication
in other locations
412 Monitoring Social Impacts
The monitoring of social aspects include both the collection of numerical data such as quantity
volume weight (quantitative indicators) as well as information expressing opinions and
experiences (qualitative indicators) remembering that such measures are compatible and
interchangeable Data collection should be systematic and have a pre-established rate and most
likely a single indicator will require several data collection instruments such as plans field records
reports etc
Social information will be monitored through the use of participatory methodologies In this sense
the preparation process of the Amazon Rio I RPDS Management Plan was a first step For the
18Indicator Design 19Social and Environmental Monitoring of Protected Areas System in the Brazilian Amazon (Sistema de Monitoramento
Socioambiental das Unidades de Conservaccedilatildeo da Amazocircnia Brasileira) 20Metodologia para Avaliaccedilatildeo Raacutepida e a Priorizaccedilatildeo do Manejo de Unidades de Conservaccedilatildeo (RAPPAM)
MONITORING amp IMPLEMENTATION REPORT VCS Version 3 CCB Standards Third Edition
v30 38
socioeconomic characteristics of communities several community meetings land use mapping
workshops and interviews with focus groups were held in addition to field visits (Annex 10) The
main activities of the project were presented and discussed in these events emphasizing the
importance and timeliness of local valuation of environmental services as well as strategies for
raising funds to implement other projects and improvements in social well-being of communities
around the PA
5 MEASUREMENT OF GHG EMISSIONS REDUCTIONS AND REMOVALS (CLIMATE)
51 Emissions Baseline
EBCF did not carry out any wood related exploration activity in the areas since the beginning of
the REDD+ project Thus it is confirmed estimated emission reductions for the project as
8678833 t CO2eq t year
52 Project emissions
Project emissions were primarily those related to the running of offices and necessary travels for
studies meetings presentations workshops and other activities Table 10 presents a summary of
emissions based on data from Annex 21 of this report
Table 05 - 2011-2016 Project Activity Emissions
YEAR Energy
(KWh)
Energy
(t CO2eq)
Travels
(Km)
Travels
(t CO2eq)
Total
(t CO2eq)
2010
678 024 024
2011
104010 2360 2360
2012 1149 008 55724 1573 1581
2013 2756 028 236749 5429 5457
2014 2498 025 15789 459 484
2015 2231 023 27340 597 620
2016 1015 010
010
093 440290 10443 10536
53 Leakage
Not applicable according to presentation made on the REDD+ IFM document
MONITORING amp IMPLEMENTATION REPORT VCS Version 3 CCB Standards Third Edition
v30 39
54 Summary of GHG Emission Reductions And Removals
EBCF REDD+ project shows emissions reduction of 34397563 tCO2e as the balance in the
period of 2011-2015 Table 06 shows the overview of the dynamics of reductions and project
emissions up to 2048 By the year 2015 the emissions data is posted as seen in reports and from
2016 data are projects as previous average and should be adjusted as a result of future reports
Table 06 - Summary of ex ante estimates
Year
Estimated
reductions
from
baseline21
(tCO2e)
Project
Estimated
emissions 22
tCO2e)
Unplanned
estimate
Emissions23
(tCO2e)
Net GHG
Estimated
emissions
Reduction
(tCO2e)
2012 8675500 1581 0 8673919
2013 8675500 5457 0 8670043
2014 8675500 484 296296 8378720
2015 8675500 620 0 8674880
2016 8675500 2100 0 8673400
2017 8675500 2100 0 8673400
2018 8675500 2100 0 8673400
2019 8675500 2100 0 8673400
2020 8675500 2100 0 8673400
2030 8675500 2100 0 8673400
2048 8675500 2100 0 8673400
Total 3123180 25203 296296 3119989
55 Climate Change Adaptation Benefits (GL1)
There is a relatively widespread understanding in the scientific community that balanced
ecosystems have greater ecological and social resilience and adaptability to climate change
21
See annex 18 22
See annex 21 23
See annex 24- HDOM (Study on deforestation and heat spots for EBCF REDD+ Project technical report)
MONITORING amp IMPLEMENTATION REPORT VCS Version 3 CCB Standards Third Edition
v30 40
whether through protection of water bodies and regulation of river flows during peak flood and
drought or through the regular supply of environmental services products and services
Thus once the project is designed to conserve an area of native forest which in the absence of
the project scenario would remain subject to the pressure of timber management (baseline) and
consequent degradation resulting from such activities it is understood that the mere protection of
these areas alone would offer communities and the ecosystem itself better adaptability compared
to the baseline scenario
Moreover the project has an Activity Management Plan (Annex 9) which details among other
initiatives the promotion of the sustainable use of ecosystem resources through direct support in
some activities related to income generation and conservation along with community training It is
believed that in addition to ensuring a more balanced (and therefore more resilient) environment
the project will expand the options for generating income among the communities making them
more resilient and preparing them to face the greater and already perceived challenges posed by
climate change
6 COMMUNITY
61 Positive Impacts for Communities (CM1)
EBCFrsquos REDD+ project was first presented to the riverine communities in 2011 By then
communities were informed about the cessation of all timber exploration activities due to the
REDD+ project and discussions were held regarding biodiversity conservation and the sustainable
use of forest products and services as well the social development of the surrounding
communities Briefly the positive impacts along the communities were
1 Project area zoning and its surroundings
2 Contribution to building local capacity
3 Contribution to developing sustainable business in the region
4 Contribution to social and environmental diagnosis
Knowing to manage
To evaluate the progress of these initiatives throughout the development of the project we used
the methodology of the Sustainability Matrix developed by the Secretariat of Environment and
MONITORING amp IMPLEMENTATION REPORT VCS Version 3 CCB Standards Third Edition
v30 41
Sustainable Development of Amazonas State This tool was applied in 15 communities taking into
account local socio-economic aspects that underlie the development of 20 parameters considered
of great importance to community development described by specific indicators As a visual tool
the Sustainability Matrix is quite suitable for traditional populations such as the riverside and
indigenous communities surrounding the Reserve Amazon River I and other areas of the Project
Additionally the Matrix provides interesting spaces for discussion since its construction is done
collectively Through the Sustainability Matrix it was possible to identify along with the
communities projects activities and implementation strategies Budgets and monitoring and
evaluation of these projects will be detailed later through the Annual Operational Plans to be
developed and followed up in the due course Four programs and nine subprograms were defined
for management and community development (Annex 9)
62 Negative Impacts (CM2)
No negative impacts have been recorded or identified as a result of the project with stakeholders
7 BIODIVERSITY
71 Positive Impacts for Biodiversity (B1)
The benefits for biodiversity are in reducing deforestation and degradation (selective logging) in the
project area According to satellite images analysis in the project areas and their surroundings it
was observed that until 2010 300 hectares were deforested After the implementation of the
project community awareness on the importance of preservation and conservation of forests have
encouraged no deforestation degradation and a significant reduction in deforestation was
identified (see graph below) This was due to the good understanding of the projects conservation
objectives and by the involvement and support of the surrounding communities
MONITORING amp IMPLEMENTATION REPORT VCS Version 3 CCB Standards Third Edition
v30 42
Figure 10 - EBCF REDD Project and buffer areas deforestation figures (source HDOM Report)
The consequences of deforestation and degradation on biodiversity are well known Thus the fact
of not being identified changes (natural or anthropogenic) in forest areas shows there was no loss
of biodiversity no reduction in floristic diversity no impact on the dynamics of fauna and flora and
no loss of evolutionary genetic information
72 Negative Impacts on Biodiversity (B2)
There are no negative impacts on biodiversity as a result of the project
73 Exceptional Benefits for Biodiversity (GL3)
The description of exceptional benefits for biodiversity will only be possible after the re-
measurement of permanent plots (FLORA)
8 ADICIONAL INFORMATION
All activities and the consequent reduction in deforestation and degradation in and around the
project areas were maintained and funded without resources of carbon credits We understand that
with the advance of REDD+ project EBCF will have much better conditions to implement positive
actions in partnership with communities
MONITORING amp IMPLEMENTATION REPORT VCS Version 3 CCB Standards Third Edition
v30 43
REFERENCES
ADEODATO S etal Madeira de ponta a ponta o caminho da floresta ateacute o consumo Satildeo Paulo
FGV-RAE 2011
ALBAGLI S Amazocircnia fronteira geopoliacutetica da biodiversidade Revista Parcerias Estrateacutegicas n
12 p6 set2001 Centro de Estudos Estrateacutegicos do Ministeacuterio da Ciecircncia e Tecnologia
AMARAL I C Viabilidade de plantio de cafeacute na zona da mata mineira Revista Poliacutetica Agriacutecola
Ano xx n4 outnovdez 2011 Disponiacutevel em
httpwwwalicecnptiaembrapabrbitstreamdoc9309031Viabilidadedeplantiopdf Acesso
em 17 de set 2013
AMARAL P etal Floresta para Sempre um manual para a produccedilatildeo de madeira na Amazocircnia
Beleacutem IMAZON 1998 130p
AMAZONAS Lei Complementar nordm 532007 de 05062007 REGULAMENTA o inciso V do artigo
230 e o sect 1ordm do artigo 231 da Constituiccedilatildeo Estadual institui o SISTEMA ESTADUAL DE
UNIDADES DE CONSERVACcedilAtildeO - SEUC dispondo sobre infraccedilotildees e penalidades e
estabelecendo outras providecircncias Disponiacutevel em
httpwwwcetesbspgovbruserfilesfilemudancasclimaticasproclimafilelegislacaoestadua
lamazonasleilei_complementar_n_53_2007_amazonaspdf Acessado em Setembro 2013
ANTAQ Anuaacuterio Estatiacutestico 2004 Distacircncia entre os portos Disponiacutevel em
httpwwwantaqgovbrportalanuariosportuario2004TabelasDistanciaEntrePortospdf
Acesso em 23 de out 2013
ANTAQ Panorama Aquaviaacuterio Agecircncia Nacional de Transportes Aquaviaacuterios Volume 3 Brasiacutelia
ndash DF 2009
MONITORING amp IMPLEMENTATION REPORT VCS Version 3 CCB Standards Third Edition
v30 44
AREDES A F PEREIRA M W G Anaacutelise econocircmica da produccedilatildeo de cafeacute araacutebica um estudo
de caso com simulaccedilotildees de Monte Carlo para sistemas de baixa e alta produtividade
Informaccedilotildees Econocircmicas SP v38 n4 abr 2008
ARIMA E UHL C Pecuaacuteria na Amazocircnia Oriental Desempenho Atual e Perspectivas Futuras Seacuterie
Amazocircnia n1 Beleacutem IMAZON 1996 40p
BACCINI A et al Estimated carbon dioxide emissions from tropical deforestation improved by
carbon-density maps Nature Climate Change vol2 march 2012 (LETTERS Published
Online - DOI 101038NCLIMATE1354)
BARROS A C UHL C Padrotildees problemas e potencial da extraccedilatildeo madeireira ao longo do Rio
Amazonas e do seu estuaacuterio Seacuterie Amazocircnia n4 Beleacutem IMAZON 1997 42p
BRASIL Lei 121872009 (Lei Ordinaacuteria) 29122009 Institui a Poliacutetica Nacional sobre Mudanccedila
do Clima - PNMC e daacute outras Providecircncias Presidecircncia da Repuacuteblica Casa Civil Subchefia
para Assuntos Juriacutedicos Disponiacutevel em lthttpswwwplanaltogovbrccivil_03_ato2007-
20102009leil12187htmgt Acesso em 20 de set 2013
CAMPOS E F Emissatildeo de CO2 da madeira serrada da Amazocircnia o caso da exploraccedilatildeo
convencional 2012 172p Dissertaccedilatildeo - Escola Politeacutecnica Universidade de Satildeo Paulo Satildeo
Paulo
CARDOSO RS e FREITAS C E C A pesca de pequena escala no rio Madeira pelos
desembarques ocorridos em Manicoreacute (Estado do Amazonas) Brasil Revista Acta
Amazocircnica vol 38(4) 2008 781 ndash 788
CCBA Climate Community and Biodiversity Alliance-CCBA 2008 Disponiacutevel em
httpwwwclimate-standardsorgccb-standards Acesso em 03 de set 2013
MONITORING amp IMPLEMENTATION REPORT VCS Version 3 CCB Standards Third Edition
v30 45
CEPEA Centro de Estudos Avanccedilados em Economia Aplicada - ESALQUSP Economia da
pecuaacuteria de corte na regiatildeo norte do Brasil Disponiacutevel em httpgooglL2roiA Acesso em
15 de out 2013
CHAMBERS J Q et al Decomposition and carbon cycling of dead trees in tropical forests of the
central Amazon Oecologia vol122 pp380-388 2000 Agricultores se queixam de
burocracia para contratar creacutedito sustentaacutevel do Programa ABC Correio Braziliense Brasiacutelia
26 fev 2012 Disponiacutevel em
lthttpwww2correiobraziliensecombrsersustentavelp=4592gt Acesso em 10 set 2013
CULLEN Jr L VALLADARES-PAacuteDUA C Onccedilas como detetives da paisagem Ciecircncia Hoje
Vol 156 n26 pp54-571999
CPRM - Serviccedilo Geoloacutegico do Brasil Disponiacutevel em httpwwwcprmgovbr Acesso em 13 de
mar 2013
DIAS F M MORAIS S J S REZENDE R C Anaacutelise da viabilidade econocircmica para a
produccedilatildeo de melancia e cenoura com financiamento em Anaacutepolis-GO 2008 Disponiacutevel em
httpwwwprpuegbr06v1conteudopesquisainiccieneventossic2008fronteiraflashsicani
macaoIIIJORNADAarquivosresumosresumo01pdfgt Acesso em 18 de nov2013
Divisatildeo de Precessamento de Imagens (DPI) Ambdata Mapa de Vegetaccedilatildeo SIPAM RADAM
2002 Disponiacutevel em httpwwwdpiinpebrAmbdatamapa_sipamphp Acesso em 21 de
out 2013
DOMINGUES MS BERNMANN C O arco de desflorestamento na Amazocircnia da pecuaacuteria agrave
soja Ambiente amp Sociedade Satildeo Paulo vol15 n2 pp1-22 maioago 2012
MONITORING amp IMPLEMENTATION REPORT VCS Version 3 CCB Standards Third Edition
v30 46
EBCF Criaccedilatildeo da primeira reserva particular de desenvolvimento sustentaacutevel do mundo na
floresta amazocircnica Disponiacutevel emlthttpwwwebcfcombrblog20130624criacao-da-
primeira-reserva-particular-de-desenvolvimento-sustentavel-do-mundo-na-floresta-
amazonicagt Acesso em 21 de set 2013
EMBRAPA Sistema Brasileiro de Classificaccedilatildeo de Solos 2ordf Ed Rio de Janeiro Embrapa Solos
2006 306 p
FELDPAUSCH T R et al When big trees fall Damage and carbon export by reduced impact
logging in southern Amazonia Forest Ecology and Management Vol 219 pp199-215 2005
FEARNSIDE P MDesmatamento na Amazocircnia dinacircmica impactos e controle Acta Amazocircnica
vol 36 n3 pp 395-400 2006
FILGUEIRAS T S et al 1994 Caminhamento Um meacutetodo expedito para levantamentos
floriacutesticos qualitativos Caderno de Geociecircncia IBGE vol12 pp39-43 1994
Forest Management Public Summary for Gethal Amazonas SA Induacutestria de Madeira
Compensada Certification Code SW-FMCOC-119 Date of Certification October 1
2000 Date of Public Summary October 2000 Updated for Annual Audit 2002 Annual Audit
2003 (Gethalpdf)
Globo Rural Linha de financiamento para a agricultura de baixo carbono tem pouca procura
2011 Disponiacutevel em httpwwwrainforest-allianceorgforestrydocumentsgethalpdf
Acesso em 16 de nov 2013
GREENPEACE Face a Face com a Destruiccedilatildeo Relatoacuterio Greenpeace sobre as companhias
multinacionais madeireiras na Amazocircnia Brasileira 1999 Disponiacutevel em
MONITORING amp IMPLEMENTATION REPORT VCS Version 3 CCB Standards Third Edition
v30 47
lthttpwwwgreenpeaceorgbramazoniaface_destruicaopdfgt Acesso em 11 de set
2013
Governo do Estado do Amazonas Plano de Gestao da RDS do Rio Amapaacute 2010 Disponiacutevel em
httpobservatoriowwforgbrsite_mediauploadgestaoplanoManejorio_amapapdf Acesso
em 24 de ago 2013
HDOM Estimates from processing the forest inventories data carried out during the CADAF
Project Final Technical Report 2012 Disponiacutevel em wwwhdomcombr Acesso em 27 de
maio 2013
HIGUCHI N 1986-87 Amostragem sistemaacutetica versus amostragem aleatoacuteria em floresta tropical
uacutemida de terra-firme na regiatildeo de Manaus Acta Amazonica 1617 (uacutenico) 393-400
HIGUCHI N SANTOS J JARDIM FCS Tamanho de parcela amostral para inventaacuterios
florestais Acta Amazocircnica vol12 n1 pp91-103 1982
HIGUCHI F G PINTO A C M ISHIZUKA M KAJIMOTO T LIMA A J N SANTOS J
HIGUCHI N Estoque e dinacircmica de biomassa acima do solo das florestas de terra firme do
estado do Amazonas In Adriano Joseacute Nogueira Lima Flaacutevia Machado Durgante Moacir
Alberto Assis Campos Joaquim dos Santos Moriyoshi Ishizuka Niro Higuchi (Org)
Dinacircmica do carbono das florestas da Amazocircnia resultados do Projeto CADAF
1edManaus INPA 2014 v 1 p 29-34
HOLMES T P etal Custos e benefiacutecios financeiros da exploraccedilatildeo de impacto reduzido em
comparaccedilatildeo agrave exploraccedilatildeo florestal convencional na Amazocircnia oriental 2ordf ed Beleacutem
Fundaccedilatildeo Floresta Tropical 2002 66p
HUSCH B MILLER C I BEERS T W Forest mensuration New York Ronald Press 1971
HUSCH B MILLER C I BEERS T W Forest Mensuration New York John Wiley amp Sons
2nd
ed 1972 402 p
MONITORING amp IMPLEMENTATION REPORT VCS Version 3 CCB Standards Third Edition
v30 48
IBGE Instituto Brasileiro de Geografia e Estatiacutestica Diretoria de GeociecircnciasCoordenaccedilatildeo de
Recursos Naturais e Estudos Ambientais Geologia Solos Hidrografia e Vegetaccedilatildeo 2000
IBGE Instituto Brasileiro de Geografia e Estatiacutestica Manicoreacute 2010 Disponiacutevel
emlthttpwwwsidraibgegovbrgt Acesso em 05 de set 2013
IBGE Instituto Brasileiro de Geografia e Estatiacutestica 2011 Disponiacutevel em httpwwwibgegovbr
Acesso em 19 de mar 2013
IBGE Instituto Brasileiro de Geografia e Estatiacutestica Extraccedilatildeo vegetal e silvicultura para o
municiacutepio de Manicoreacute 2011 Disponiacutevel em
lthttpcidadesibgegovbrxtrastemasphplang=ampcodmun=130270ampidtema=102ampsearch=a
mazonas|manicore|extracao-vegetal-e-silvicultura-2011gt Acesso em 10 de out 2013
IBGE Instituto Brasileiro de Geografia e Estatiacutestica Censo Demograacutefico 2010 Disponiacutevel em
lthttpcidadesibgegovbrxtrastemasphpcodmun=130270ampidtema=116gt Acesso em 18
de out 2013
IBGE Instituto Brasileiro de Geografia e Estatiacutestica Censo Demograacutefico 2010 Disponiacutevel
emlthttpcidadesibgegovbrxtrashomephpgt Acesso em 08 de out 2013
IDESAM Reduccedilotildees de Emissotildees do Desmatamento e Degradaccedilatildeo Florestal (REDD+) estudo de
oportunidades para a regiatildeo sul do Amazonas CENAMO M Cl CARRERO G C
GANDOLFO P (Org) Manaus 2011 Disponiacutevel em
lthttpwwwobservatoriodoreddorgbrsitepdfestudodeoportunidadespdfgt Acesso em 13 de
set 2013
MONITORING amp IMPLEMENTATION REPORT VCS Version 3 CCB Standards Third Edition
v30 49
IDESAM Semeando Sustentabilidade em Apuiacute ndash Resultados e Perspectivas 2011 Manaus
Disponivel em lthttpidesamorgbrsemeando-sustentabilidade-em-apui-resultados-e-
perspectivasUxX8nfldWYI
IEA Instituto de Economia Aplicada CO2 Emissions from fuel combustion 2012 Disponiacutevel em
httpwwwieaorgco2highlightsco2highlightspdf Acesso em 09 de out 2013
IGREJA H L S CATIQUE J Anaacutelise neotectocircnica do lineamento de Itacoatiara centro leste do
Estado do Amazonas In Simpoacutesio Nacional de Estudos Tectocircnicos 6 1997 Pirenoacutepolis
Anais Pirenoacutepolis-GO SBG-Nuacutecleo Brasiacutelia1997
IMAZON Instituto do Homem e do Meio Ambiente da Amazocircnia Fatos Florestais 2010a
Disponiacutevel em httpwwwimazonorgbrpublicacoeslivrosfatos-florestais-da-amazonia-
2010-1 Acesso em 14 de out 2013
IMAZOM Instituto do Homem e do Meio Ambiente da Amazocircnia Mercado e preccedilo da madeira
amazocircnica 2010 Disponiacutevel em httpwwwimazonorgbrpublicacoesprecos-de-madeira-
em-toraboletim-de-precos-de-madeira-em-tora-na-amazonia-julho-2010at_downloadfile
Acesso em 23 de nov 2013
IMAZON Instituto do Homem e do Meio Ambiente da Amazocircnia Portal de Geoinformaccedilatildeo sobre
a Amazocircnia Disponiacutevel em lthttpwwwimazongeoorgbrimazongeophpgt Acesso em 06
de set 2013
IMAZON Instituto do Homem e do Meio Ambiente da Amazocircnia Transparecircncia florestal
Amazocircnia Legal 2012 Disponiacutevel em lthttpwwwimazonorgbrpublicacoestransparencia-
florestaltransparencia-florestal-amazonia-legalcopy_of_SADOutubro2012pdfgt Acesso em
23 de set 2013
IMAZON Instituto do Homem e do Meio Ambiente da Amazocircnia PEREIRA D SANTOS D
VEDOVETO M GIMARAtildeES J VERIacuteSSIMO A (Orgs) Fatos Florestais da Amazocircnia
Beleacutem IMAZON 2010 244p Disponiacutevel em
MONITORING amp IMPLEMENTATION REPORT VCS Version 3 CCB Standards Third Edition
v30 50
lthttpwwwimazonorgbrpublicacoeslivrosfatos-florestais-da-amazonia-2010-1gt Acesso
em 24 de set 2013
IMAZON Instituto do Homem e do Meio Ambiente da Amazocircnia A Expansatildeo madeireira na
Amazocircnia Impactos e perspectivas para o desenvolvimento sustentaacutevel no Paraacute BARROS
AC VERIacuteSSIMO A (Eds) Beleacutem IMAZON 2002
IMAZON Instituto do Homem e do Meio Ambiente da Amazocircnia Custos e Benefiacutecios do Manejo
Florestal Para Produccedilatildeo de Madeira na Amazocircnia Oriental 1998 Disponiacutevel em
lthttpwwwimazonorgbrpublicacoesserie-amazoniacustos-e-beneficios-do-manejo-
florestal-para-producao-de-madeira-na-amazonia-orientalgt Acesso em 20 de set 2013
INPE Instituto de Pesquisas Espaciais Banco de dados PRODES 2012 Disponiacutevel em
lthttpwwwdpiinpebrprodesdigitalprodesphpgt Acesso em 09 de set 2013
INPE Instituto de Pesquisas Espaciais Banco de dados DEGRAD 2009 Disponiacutevel em
lthttpwwwobtinpebrdegradgt Acesso em 09 de set 2013
INPE Instituto de Pesquisas Espaciais Banco de dados DETER 2013 Disponiacutevel em
lthttpwwwobtinpebrdetergt Acesso em 10 de set 2013
INPE Instituto de Pesquisas Espaciais Banco de dados de queimadas e focos de calor
BDQUEIMADAS 2013 Disponiacutevel em lthttpwwwdpiinpebrproarcobdqueimadasgt
Acesso em 10 de set 2013
Instituto Carbono Brasil Soacute 2 da produccedilatildeo de madeira eacute certificada O Estado de SPaulo 2006
Disponiacutevel em lthttpwwwinstitutocarbonobrasilorgbrnoticias6noticia=119796gt Acesso
em 26 de set 2013
MONITORING amp IMPLEMENTATION REPORT VCS Version 3 CCB Standards Third Edition
v30 51
IFT Instituto Floresta Tropical Diagnoacutestico do Setor Florestal de Cotriguaccedilu Estado do Mato
Grosso 2010 Disponiacutevel em lthttpgooglEVx2RZgt Acesso em 16 de dez 2013
IPCC Guidelines for National Greenhouse Gas Inventories In National Greenhouse Gas
Inventories Programme EGGLESTON HS BUENDIA L MIWA K NGARA T TANABE
K (Eds) Japan IGES 2006
ITTO Annual review and assessment of the world timber situation 2011 Disponivel em
httpwwwittointannual_review Acesso em 10 de out 2013
KELLER M et al Coarse woody debris in undisturbed and logged forests in the eastern Brazilian
Amazon Global Change Biology vol10 PP784-795 2004
LENTINI M VERISSIMO A PEREIRA D A expansatildeo madeireira na Amazocircnia O Estado da
Amazocircnia n2 2005 Beleacutem IMAZON Disponiacutevel em
httpwwwimazonorgbruploadea_2ppdf Acesso em 06 de set 2013
LOETSCH F ZOumlHRER F HALLER K E Forest Inventory Munich BLV Verlagsgesellschaft
2nd
edition Vol II 1973 469 p
MAGNUSSON WE et al RAPELD uma modificaccedilatildeo do meacutetodo de Gentry para inventaacuterios de
biodiversidade em siacutetios para pesquisa ecoloacutegica de longa duraccedilatildeo Biota Neotrop JulDez
2005 vol 5 no 2 httpwwwbiotaneotropicaorgbrv5n2ptabstractpoint-of-
view+bn01005022005 ISSN 1676-0603
MARINELLI C E et al O programa de monitoramento da biodiversidade da biodiversidade e do
uso de recursos naturais em unidades de conservaccedilatildeo estaduais do Amazonas Secretaria
de Estado do Meio Ambiente e Desenvolvimento Sustentaacutevel - SDS Manaus SDS 2007
MONITORING amp IMPLEMENTATION REPORT VCS Version 3 CCB Standards Third Edition
v30 52
MARINELLI C E MALTEZ M H Indicadores de Sustentabilidade para Unidades de
Conservaccedilatildeo Documento-Siacutentese Workshop Instituto Socioambiental Brasiacutelia-DF 2010
76p
MAZZEI L et al Above-ground biomass dynamics after reduced-impact logging in the Eastern
Amazon Forest Ecology and Management vol 259 pp367-373 2010
MEIRELLES FILHO O Livro de Ouro da Amazocircnia 5ordf Ediccedilatildeo Rio de Janeiro EDIOURO 2007
422p Meirelles Filho J O Livro de Ouro da Amazocircnia 1ordf ed Editora Ediouro ISBN
8500021616 2007 450p
MENGER Juliana da Silva Fatores determinantes da distribuiccedilatildeo de aves no interfluacutevio Purus-
Madeira Manaus [sn] 2011 35 fl il
MCT Arquivos dos Fatores de Emissatildeo Disponiacutevel em
httpwwwmctgovbrindexphpcontentview321144htmlancora Acesso em 23 de out
2013
MMA Ministeacuterio do Meio Ambiente Avaliaccedilatildeo e identificaccedilatildeo de accedilotildees prioritaacuterias para a
conservaccedilatildeo utilizaccedilatildeo sustentaacutevel e reparticcedilatildeo dos benefiacutecios da biodiversidade na
Amazocircnia brasileira Brasiacutelia MMASBF 2001
MMA Ministeacuterio do Meio Ambiente Secretaria de Biodiversidade e Florestas Aacutereas Prioritaacuterias
para Conservaccedilatildeo Uso Sustentaacutevel e Reparticcedilatildeo de Benefiacutecios da Biodiversidade Brasileira
Atualizaccedilatildeo - Portaria MMA ndeg9 de 23 de janeiro de 2007 Brasiacutelia MMA 2007 (Seacuterie
Biodiversidade 31)
MONITORING amp IMPLEMENTATION REPORT VCS Version 3 CCB Standards Third Edition
v30 53
MMA Livro vermelho da fauna brasileira ameaccedilada de extinccedilatildeo editores Angelo Barbosa
Monteiro Machado Glaacuteucia Moreira Drummond Adriano Pereira Paglia 1ed 2008 Brasiacutelia
DF MMA Belo Horizonte MG Fundaccedilatildeo Biodiversitas (1420 p) il - (Biodiversidade 19)
OLIVEIRA M M HIGUCHI N CELES C H HIGUCHI F G 2014 Tamanho e formas de
parcelas para inventaacuterios florestais de espeacutecies arboacutereas na Amazocircnia Central Ciecircncia
Florestal Santa Maria v 24 n 3 p 645-653
PEARSON TRH WALKER S BROWN SL The Source Book for Land Use Land Use
Change and Forestry Projects BioCarbon Fund and Winrock International 2005 64 pp
PORTAL AMAZOcircNIA Amazocircnia de A a Z Disponiacutevel em
lthttpportalamazoniaglobocomgt Acesso em 13 de set 2013
PEacuteLLICO NETTO S BRENA D A Inventaacuterio florestal Curitiba Editorado pelos autores p
316 1997
PROJETO SIVAM Relatoacuterio metodoloacutegico de trabalho Revisatildeo 3 Diretoria de Geociecircncia Rio de
Janeiro 2002 330 pp
PROJETO SIVAM Atualizaccedilatildeo do RADAMBRASIL Mapa de Vegetacao da Amazonia Legal
Mapa de Fitofisionomias ndash RADAMSIPAM DNPM Ministeacuterio de Minas e Energia 2002
Disponiacutevel em httpwwwdpiinpebramb_dataShapefilesveg_Amz_SIPAMzip Acesso
em 21 de jan 2014
PROJETO FLORESTAL SANTA MARIA (PROJETO FSM-REDD) Plant Inteligecircncia Ambiental ndash
Warwick Manfrinato 2012 Disponiacutevel em
lthttpwwwflorestalsantamariacombrsitedocumentos57FSM_REDD_VCS_PD_ptpdfgt
Acesso em 09 de set 2013
MONITORING amp IMPLEMENTATION REPORT VCS Version 3 CCB Standards Third Edition
v30 54
RADAMBRASIL Programa de Integraccedilatildeo Nacional Levantamentos de Recursos Naturais v 14 ndash
RADAM DNPM Ministeacuterio de Minas e Energia Brasil 1974
RIBEIRO J E L et al Flora da Reserva Ducke guia de identificaccedilatildeo das plantas vasculares de
uma floresta de terra firme na Amazocircnia Central Manaus Editora INPA 1999
ROSAS F C W WALDEMARIN H de MATTOS G E Pteronura rasiliensis (Zimmermann
1780) In MACHADO A B M DRUMMOND G M PAGLIA A P (eds) Livro Vermelho da
Fauna Brasileira Ameaccedilada de Extinccedilatildeo Volume II 1ed Brasiacutelia DF Ministeacuterio do Meio
Ambiente 2008 p 800 - 801
ROSS D GHG Emissions Resulting from Aircraft Travel 2009 Disponiacutevel em
httpwwwcarbonplanetcomdownloadsFlight_Calculator_Information_v92pdf Acesso em
14 de out 2013
SANTOS A J et al Viabilidade econocircmica do sistema agroflorestal greviacutelea x cafeacute na regiatildeo
norte do Paranaacute CERNE vol6 n1 pp89-100 2000
SANTOS R A Custo do manejo florestal madeireiro estudo de caso Floresta Estadual do
Antimary Monografia (Bacharelado em Economia) ndash Departamento de Ciecircncias
Econocircmicas Universidade Federal do Acre 2007109p
SABOGAL C et al Manejo Florestal Empresarial na Amazocircnia Brasileira restriccedilotildees e
oportunidades (Relatoacuterio Siacutentese) Beleacutem CIFORIMAZON 2006 72p
SDSCEUC Secretaria Estadual de Meio Ambiente e Desenvolvimento Sustentaacutevel ndash Centro
Estadual de Unidades de Conservaccedilatildeo Programa de Monitoramento de Biodiversidade e
Uso de Recursos Naturais em Aacutereas Protegidas do Estado Amazonas (ProBUC) 2006
Disponiacutevel em
MONITORING amp IMPLEMENTATION REPORT VCS Version 3 CCB Standards Third Edition
v30 55
httpbrazilwcsorgDesktopModulesBring2mindDMXDownloadaspxEntryId=6168ampPortalI
d=93ampDownloadMethod=attachment Acesso em 11 de ago de 2013
SFBIMAZON Serviccedilo Florestal Brasileiro e Instituto do Homem e Meio Ambiente da Amazocircnia A
atividade madeireira na Amazocircnia brasileira produccedilatildeo receita e mercados 2010 Disponiacutevel
em httpwwwmmagovbrestruturassfb_arquivosmiolo_resexec_polo_03_95_1pdf
Acesso em 23 de out 2013
SILVA R P da Alometria estoque e dinacircmica da biomassa de florestas primaacuterias e
secundaacuterias na regiatildeo de Manaus (AM) 152 p Tese de Doutorado Programa Integrado
de Poacutes-graduaccedilatildeo em Biologia Tropical e Recursos Naturais (INPA) Manaus 2007
SILVA Z A G P G SANTOS R A Custo do manejo florestal madeireiro em floresta puacuteblica
estudo de caso no Acre 2011 Disponiacutevel em
lthttpwwwbasacombrbancoamazonia2Revistaedicao_13n13_custo_do_manejo_flores
pdfgt Acesso em 13 de set 2013
SMIDT M GALLAGHER T Factors Affecting Fuel Consumption and Harvesting Costs Auburn
School of Forestry and Wildlife Sciences Sd Disponiacutevel em
httpweb1cnrevteduforestrycofedocuments2013Smidt_Gallagherpdf Acesso em 21
de out 2013
SOARES-FILHO B et al Role of Brazilian Amazon protected areas in climate change mitigation
2010 Columbia University NY Ruth S DeFries 2010
SPF Serviccedilo Puacuteblico Federal DVPF Documento de venda de produto Florestal (Declaraccedilotildees de
venda Gethalpdf) 14 de julho de 2006
MONITORING amp IMPLEMENTATION REPORT VCS Version 3 CCB Standards Third Edition
v30 56
TIMOFEICZYK JUacuteNIOR R et al Rentabilidade econocircmica do manejo de baixo impacto em
florestas tropicais um estudo de caso Revista Floresta Curitiba v 38 n 4 p 711-725
outdez 2008
VCS Ferramenta para Demonstraccedilatildeo e Avaliaccedilatildeo de Adicionalidade para Atividades de Projetos
VCS em Agricultura Floresta e Outros Usos (AFOLU) 2012a Disponiacutevel em httpwwwv-c-
sorgsitesv-c-sorgfilesVT000120VCS20AFOLU20Additionality20Tool20v30pdf
Acesso em 24 de set 2013
VCS Ferramenta de Risco e Natildeo Permanecircncia (AFOLU) 2012B Disponiacutevel em httpv-c-
sorgsitesv-c-sorgfilesAFOLU20Non-Permanence20Risk20Tool2C20v32pdf
Acesso em 13 de set 2013
VCS Approved VCS Methodology VM0010 Version 10 - Methodology for Improved Forest
Management Conversion to Logged to Protected Forest Calculating GHG Benefits from
Preventing Planned Degradation PHUA S SHARMA S TELFER M CHANDLER H
(Eds) Califoacuternia EUA Carbon Planet Limited 2011149p
VERDEJO M E Diagnoacutestico Rural Participativo um guia praacutetico Brasiacutelia MDA 2006 62p
VIANNA A L M Diagnoacutestico Florestal do Estado do Amazonas 2010 e 2011 Manaus-AM
IDESAM 2013 (Relatoacuterio Final do Projeto Fortalecimento da participaccedilatildeo da sociedade civil
no Amazonas Foacuterum de Mudanccedilas Climaacuteticas Transparecircncia Florestal no Estado do
Amazonas ndash Mapeamento de Instrumentos Legislativos no Brasil)
WBCSDWRI The GHG Protocol for Project Accountin Washington World Business Council for
Sustainable DevelopmentWorld Resources Institute 2005148 p
MONITORING amp IMPLEMENTATION REPORT VCS Version 3 CCB Standards Third Edition
v30 57
WALKER W et al Guia de Campo para Estimativa de Biomassa Florestal e Estoque de Carbono
Woods Hole Center Research Falmouth Massachusetts USA 2011 Disponiacutevel em
httpwwwwhrcorgresourcesfieldguidescarbonpdfWHRC_FieldGuide_PortugueseSMpdf
Acesso em 14 de set 2013
WWF Metodologia para Avaliaccedilatildeo Raacutepida e a Priorizaccedilatildeo do Manejo de Unidades de
Conservaccedilatildeo (RAPPAM) 2010 Disponiacutevel em httpgooglXfDnxs Acesso em 30 de set
2013
WWF-Brasil Efetividade de Gestatildeo das Unidades de Conservaccedilatildeo no Estado do Amazonas
Secretaria de Estado do Meio Ambiente e do Desenvolvimento Sustentaacutevel do Amazonas
Instituto Chico Mendes de Conservaccedilatildeo da Biodiversidade Brasiacutelia WWF-Brasil 2011 72 p

MONITORING amp IMPLEMENTATION REPORT VCS Version 3 CCB Standards Third Edition
v30 41
Sustainable Development of Amazonas State This tool was applied in 15 communities taking into
account local socio-economic aspects that underlie the development of 20 parameters considered
of great importance to community development described by specific indicators As a visual tool
the Sustainability Matrix is quite suitable for traditional populations such as the riverside and
indigenous communities surrounding the Reserve Amazon River I and other areas of the Project
Additionally the Matrix provides interesting spaces for discussion since its construction is done
collectively Through the Sustainability Matrix it was possible to identify along with the
communities projects activities and implementation strategies Budgets and monitoring and
evaluation of these projects will be detailed later through the Annual Operational Plans to be
developed and followed up in the due course Four programs and nine subprograms were defined
for management and community development (Annex 9)
62 Negative Impacts (CM2)
No negative impacts have been recorded or identified as a result of the project with stakeholders
7 BIODIVERSITY
71 Positive Impacts for Biodiversity (B1)
The benefits for biodiversity are in reducing deforestation and degradation (selective logging) in the
project area According to satellite images analysis in the project areas and their surroundings it
was observed that until 2010 300 hectares were deforested After the implementation of the
project community awareness on the importance of preservation and conservation of forests have
encouraged no deforestation degradation and a significant reduction in deforestation was
identified (see graph below) This was due to the good understanding of the projects conservation
objectives and by the involvement and support of the surrounding communities
MONITORING amp IMPLEMENTATION REPORT VCS Version 3 CCB Standards Third Edition
v30 42
Figure 10 - EBCF REDD Project and buffer areas deforestation figures (source HDOM Report)
The consequences of deforestation and degradation on biodiversity are well known Thus the fact
of not being identified changes (natural or anthropogenic) in forest areas shows there was no loss
of biodiversity no reduction in floristic diversity no impact on the dynamics of fauna and flora and
no loss of evolutionary genetic information
72 Negative Impacts on Biodiversity (B2)
There are no negative impacts on biodiversity as a result of the project
73 Exceptional Benefits for Biodiversity (GL3)
The description of exceptional benefits for biodiversity will only be possible after the re-
measurement of permanent plots (FLORA)
8 ADICIONAL INFORMATION
All activities and the consequent reduction in deforestation and degradation in and around the
project areas were maintained and funded without resources of carbon credits We understand that
with the advance of REDD+ project EBCF will have much better conditions to implement positive
actions in partnership with communities
MONITORING amp IMPLEMENTATION REPORT VCS Version 3 CCB Standards Third Edition
v30 43
REFERENCES
ADEODATO S etal Madeira de ponta a ponta o caminho da floresta ateacute o consumo Satildeo Paulo
FGV-RAE 2011
ALBAGLI S Amazocircnia fronteira geopoliacutetica da biodiversidade Revista Parcerias Estrateacutegicas n
12 p6 set2001 Centro de Estudos Estrateacutegicos do Ministeacuterio da Ciecircncia e Tecnologia
AMARAL I C Viabilidade de plantio de cafeacute na zona da mata mineira Revista Poliacutetica Agriacutecola
Ano xx n4 outnovdez 2011 Disponiacutevel em
httpwwwalicecnptiaembrapabrbitstreamdoc9309031Viabilidadedeplantiopdf Acesso
em 17 de set 2013
AMARAL P etal Floresta para Sempre um manual para a produccedilatildeo de madeira na Amazocircnia
Beleacutem IMAZON 1998 130p
AMAZONAS Lei Complementar nordm 532007 de 05062007 REGULAMENTA o inciso V do artigo
230 e o sect 1ordm do artigo 231 da Constituiccedilatildeo Estadual institui o SISTEMA ESTADUAL DE
UNIDADES DE CONSERVACcedilAtildeO - SEUC dispondo sobre infraccedilotildees e penalidades e
estabelecendo outras providecircncias Disponiacutevel em
httpwwwcetesbspgovbruserfilesfilemudancasclimaticasproclimafilelegislacaoestadua
lamazonasleilei_complementar_n_53_2007_amazonaspdf Acessado em Setembro 2013
ANTAQ Anuaacuterio Estatiacutestico 2004 Distacircncia entre os portos Disponiacutevel em
httpwwwantaqgovbrportalanuariosportuario2004TabelasDistanciaEntrePortospdf
Acesso em 23 de out 2013
ANTAQ Panorama Aquaviaacuterio Agecircncia Nacional de Transportes Aquaviaacuterios Volume 3 Brasiacutelia
ndash DF 2009
MONITORING amp IMPLEMENTATION REPORT VCS Version 3 CCB Standards Third Edition
v30 44
AREDES A F PEREIRA M W G Anaacutelise econocircmica da produccedilatildeo de cafeacute araacutebica um estudo
de caso com simulaccedilotildees de Monte Carlo para sistemas de baixa e alta produtividade
Informaccedilotildees Econocircmicas SP v38 n4 abr 2008
ARIMA E UHL C Pecuaacuteria na Amazocircnia Oriental Desempenho Atual e Perspectivas Futuras Seacuterie
Amazocircnia n1 Beleacutem IMAZON 1996 40p
BACCINI A et al Estimated carbon dioxide emissions from tropical deforestation improved by
carbon-density maps Nature Climate Change vol2 march 2012 (LETTERS Published
Online - DOI 101038NCLIMATE1354)
BARROS A C UHL C Padrotildees problemas e potencial da extraccedilatildeo madeireira ao longo do Rio
Amazonas e do seu estuaacuterio Seacuterie Amazocircnia n4 Beleacutem IMAZON 1997 42p
BRASIL Lei 121872009 (Lei Ordinaacuteria) 29122009 Institui a Poliacutetica Nacional sobre Mudanccedila
do Clima - PNMC e daacute outras Providecircncias Presidecircncia da Repuacuteblica Casa Civil Subchefia
para Assuntos Juriacutedicos Disponiacutevel em lthttpswwwplanaltogovbrccivil_03_ato2007-
20102009leil12187htmgt Acesso em 20 de set 2013
CAMPOS E F Emissatildeo de CO2 da madeira serrada da Amazocircnia o caso da exploraccedilatildeo
convencional 2012 172p Dissertaccedilatildeo - Escola Politeacutecnica Universidade de Satildeo Paulo Satildeo
Paulo
CARDOSO RS e FREITAS C E C A pesca de pequena escala no rio Madeira pelos
desembarques ocorridos em Manicoreacute (Estado do Amazonas) Brasil Revista Acta
Amazocircnica vol 38(4) 2008 781 ndash 788
CCBA Climate Community and Biodiversity Alliance-CCBA 2008 Disponiacutevel em
httpwwwclimate-standardsorgccb-standards Acesso em 03 de set 2013
MONITORING amp IMPLEMENTATION REPORT VCS Version 3 CCB Standards Third Edition
v30 45
CEPEA Centro de Estudos Avanccedilados em Economia Aplicada - ESALQUSP Economia da
pecuaacuteria de corte na regiatildeo norte do Brasil Disponiacutevel em httpgooglL2roiA Acesso em
15 de out 2013
CHAMBERS J Q et al Decomposition and carbon cycling of dead trees in tropical forests of the
central Amazon Oecologia vol122 pp380-388 2000 Agricultores se queixam de
burocracia para contratar creacutedito sustentaacutevel do Programa ABC Correio Braziliense Brasiacutelia
26 fev 2012 Disponiacutevel em
lthttpwww2correiobraziliensecombrsersustentavelp=4592gt Acesso em 10 set 2013
CULLEN Jr L VALLADARES-PAacuteDUA C Onccedilas como detetives da paisagem Ciecircncia Hoje
Vol 156 n26 pp54-571999
CPRM - Serviccedilo Geoloacutegico do Brasil Disponiacutevel em httpwwwcprmgovbr Acesso em 13 de
mar 2013
DIAS F M MORAIS S J S REZENDE R C Anaacutelise da viabilidade econocircmica para a
produccedilatildeo de melancia e cenoura com financiamento em Anaacutepolis-GO 2008 Disponiacutevel em
httpwwwprpuegbr06v1conteudopesquisainiccieneventossic2008fronteiraflashsicani
macaoIIIJORNADAarquivosresumosresumo01pdfgt Acesso em 18 de nov2013
Divisatildeo de Precessamento de Imagens (DPI) Ambdata Mapa de Vegetaccedilatildeo SIPAM RADAM
2002 Disponiacutevel em httpwwwdpiinpebrAmbdatamapa_sipamphp Acesso em 21 de
out 2013
DOMINGUES MS BERNMANN C O arco de desflorestamento na Amazocircnia da pecuaacuteria agrave
soja Ambiente amp Sociedade Satildeo Paulo vol15 n2 pp1-22 maioago 2012
MONITORING amp IMPLEMENTATION REPORT VCS Version 3 CCB Standards Third Edition
v30 46
EBCF Criaccedilatildeo da primeira reserva particular de desenvolvimento sustentaacutevel do mundo na
floresta amazocircnica Disponiacutevel emlthttpwwwebcfcombrblog20130624criacao-da-
primeira-reserva-particular-de-desenvolvimento-sustentavel-do-mundo-na-floresta-
amazonicagt Acesso em 21 de set 2013
EMBRAPA Sistema Brasileiro de Classificaccedilatildeo de Solos 2ordf Ed Rio de Janeiro Embrapa Solos
2006 306 p
FELDPAUSCH T R et al When big trees fall Damage and carbon export by reduced impact
logging in southern Amazonia Forest Ecology and Management Vol 219 pp199-215 2005
FEARNSIDE P MDesmatamento na Amazocircnia dinacircmica impactos e controle Acta Amazocircnica
vol 36 n3 pp 395-400 2006
FILGUEIRAS T S et al 1994 Caminhamento Um meacutetodo expedito para levantamentos
floriacutesticos qualitativos Caderno de Geociecircncia IBGE vol12 pp39-43 1994
Forest Management Public Summary for Gethal Amazonas SA Induacutestria de Madeira
Compensada Certification Code SW-FMCOC-119 Date of Certification October 1
2000 Date of Public Summary October 2000 Updated for Annual Audit 2002 Annual Audit
2003 (Gethalpdf)
Globo Rural Linha de financiamento para a agricultura de baixo carbono tem pouca procura
2011 Disponiacutevel em httpwwwrainforest-allianceorgforestrydocumentsgethalpdf
Acesso em 16 de nov 2013
GREENPEACE Face a Face com a Destruiccedilatildeo Relatoacuterio Greenpeace sobre as companhias
multinacionais madeireiras na Amazocircnia Brasileira 1999 Disponiacutevel em
MONITORING amp IMPLEMENTATION REPORT VCS Version 3 CCB Standards Third Edition
v30 47
lthttpwwwgreenpeaceorgbramazoniaface_destruicaopdfgt Acesso em 11 de set
2013
Governo do Estado do Amazonas Plano de Gestao da RDS do Rio Amapaacute 2010 Disponiacutevel em
httpobservatoriowwforgbrsite_mediauploadgestaoplanoManejorio_amapapdf Acesso
em 24 de ago 2013
HDOM Estimates from processing the forest inventories data carried out during the CADAF
Project Final Technical Report 2012 Disponiacutevel em wwwhdomcombr Acesso em 27 de
maio 2013
HIGUCHI N 1986-87 Amostragem sistemaacutetica versus amostragem aleatoacuteria em floresta tropical
uacutemida de terra-firme na regiatildeo de Manaus Acta Amazonica 1617 (uacutenico) 393-400
HIGUCHI N SANTOS J JARDIM FCS Tamanho de parcela amostral para inventaacuterios
florestais Acta Amazocircnica vol12 n1 pp91-103 1982
HIGUCHI F G PINTO A C M ISHIZUKA M KAJIMOTO T LIMA A J N SANTOS J
HIGUCHI N Estoque e dinacircmica de biomassa acima do solo das florestas de terra firme do
estado do Amazonas In Adriano Joseacute Nogueira Lima Flaacutevia Machado Durgante Moacir
Alberto Assis Campos Joaquim dos Santos Moriyoshi Ishizuka Niro Higuchi (Org)
Dinacircmica do carbono das florestas da Amazocircnia resultados do Projeto CADAF
1edManaus INPA 2014 v 1 p 29-34
HOLMES T P etal Custos e benefiacutecios financeiros da exploraccedilatildeo de impacto reduzido em
comparaccedilatildeo agrave exploraccedilatildeo florestal convencional na Amazocircnia oriental 2ordf ed Beleacutem
Fundaccedilatildeo Floresta Tropical 2002 66p
HUSCH B MILLER C I BEERS T W Forest mensuration New York Ronald Press 1971
HUSCH B MILLER C I BEERS T W Forest Mensuration New York John Wiley amp Sons
2nd
ed 1972 402 p
MONITORING amp IMPLEMENTATION REPORT VCS Version 3 CCB Standards Third Edition
v30 48
IBGE Instituto Brasileiro de Geografia e Estatiacutestica Diretoria de GeociecircnciasCoordenaccedilatildeo de
Recursos Naturais e Estudos Ambientais Geologia Solos Hidrografia e Vegetaccedilatildeo 2000
IBGE Instituto Brasileiro de Geografia e Estatiacutestica Manicoreacute 2010 Disponiacutevel
emlthttpwwwsidraibgegovbrgt Acesso em 05 de set 2013
IBGE Instituto Brasileiro de Geografia e Estatiacutestica 2011 Disponiacutevel em httpwwwibgegovbr
Acesso em 19 de mar 2013
IBGE Instituto Brasileiro de Geografia e Estatiacutestica Extraccedilatildeo vegetal e silvicultura para o
municiacutepio de Manicoreacute 2011 Disponiacutevel em
lthttpcidadesibgegovbrxtrastemasphplang=ampcodmun=130270ampidtema=102ampsearch=a
mazonas|manicore|extracao-vegetal-e-silvicultura-2011gt Acesso em 10 de out 2013
IBGE Instituto Brasileiro de Geografia e Estatiacutestica Censo Demograacutefico 2010 Disponiacutevel em
lthttpcidadesibgegovbrxtrastemasphpcodmun=130270ampidtema=116gt Acesso em 18
de out 2013
IBGE Instituto Brasileiro de Geografia e Estatiacutestica Censo Demograacutefico 2010 Disponiacutevel
emlthttpcidadesibgegovbrxtrashomephpgt Acesso em 08 de out 2013
IDESAM Reduccedilotildees de Emissotildees do Desmatamento e Degradaccedilatildeo Florestal (REDD+) estudo de
oportunidades para a regiatildeo sul do Amazonas CENAMO M Cl CARRERO G C
GANDOLFO P (Org) Manaus 2011 Disponiacutevel em
lthttpwwwobservatoriodoreddorgbrsitepdfestudodeoportunidadespdfgt Acesso em 13 de
set 2013
MONITORING amp IMPLEMENTATION REPORT VCS Version 3 CCB Standards Third Edition
v30 49
IDESAM Semeando Sustentabilidade em Apuiacute ndash Resultados e Perspectivas 2011 Manaus
Disponivel em lthttpidesamorgbrsemeando-sustentabilidade-em-apui-resultados-e-
perspectivasUxX8nfldWYI
IEA Instituto de Economia Aplicada CO2 Emissions from fuel combustion 2012 Disponiacutevel em
httpwwwieaorgco2highlightsco2highlightspdf Acesso em 09 de out 2013
IGREJA H L S CATIQUE J Anaacutelise neotectocircnica do lineamento de Itacoatiara centro leste do
Estado do Amazonas In Simpoacutesio Nacional de Estudos Tectocircnicos 6 1997 Pirenoacutepolis
Anais Pirenoacutepolis-GO SBG-Nuacutecleo Brasiacutelia1997
IMAZON Instituto do Homem e do Meio Ambiente da Amazocircnia Fatos Florestais 2010a
Disponiacutevel em httpwwwimazonorgbrpublicacoeslivrosfatos-florestais-da-amazonia-
2010-1 Acesso em 14 de out 2013
IMAZOM Instituto do Homem e do Meio Ambiente da Amazocircnia Mercado e preccedilo da madeira
amazocircnica 2010 Disponiacutevel em httpwwwimazonorgbrpublicacoesprecos-de-madeira-
em-toraboletim-de-precos-de-madeira-em-tora-na-amazonia-julho-2010at_downloadfile
Acesso em 23 de nov 2013
IMAZON Instituto do Homem e do Meio Ambiente da Amazocircnia Portal de Geoinformaccedilatildeo sobre
a Amazocircnia Disponiacutevel em lthttpwwwimazongeoorgbrimazongeophpgt Acesso em 06
de set 2013
IMAZON Instituto do Homem e do Meio Ambiente da Amazocircnia Transparecircncia florestal
Amazocircnia Legal 2012 Disponiacutevel em lthttpwwwimazonorgbrpublicacoestransparencia-
florestaltransparencia-florestal-amazonia-legalcopy_of_SADOutubro2012pdfgt Acesso em
23 de set 2013
IMAZON Instituto do Homem e do Meio Ambiente da Amazocircnia PEREIRA D SANTOS D
VEDOVETO M GIMARAtildeES J VERIacuteSSIMO A (Orgs) Fatos Florestais da Amazocircnia
Beleacutem IMAZON 2010 244p Disponiacutevel em
MONITORING amp IMPLEMENTATION REPORT VCS Version 3 CCB Standards Third Edition
v30 50
lthttpwwwimazonorgbrpublicacoeslivrosfatos-florestais-da-amazonia-2010-1gt Acesso
em 24 de set 2013
IMAZON Instituto do Homem e do Meio Ambiente da Amazocircnia A Expansatildeo madeireira na
Amazocircnia Impactos e perspectivas para o desenvolvimento sustentaacutevel no Paraacute BARROS
AC VERIacuteSSIMO A (Eds) Beleacutem IMAZON 2002
IMAZON Instituto do Homem e do Meio Ambiente da Amazocircnia Custos e Benefiacutecios do Manejo
Florestal Para Produccedilatildeo de Madeira na Amazocircnia Oriental 1998 Disponiacutevel em
lthttpwwwimazonorgbrpublicacoesserie-amazoniacustos-e-beneficios-do-manejo-
florestal-para-producao-de-madeira-na-amazonia-orientalgt Acesso em 20 de set 2013
INPE Instituto de Pesquisas Espaciais Banco de dados PRODES 2012 Disponiacutevel em
lthttpwwwdpiinpebrprodesdigitalprodesphpgt Acesso em 09 de set 2013
INPE Instituto de Pesquisas Espaciais Banco de dados DEGRAD 2009 Disponiacutevel em
lthttpwwwobtinpebrdegradgt Acesso em 09 de set 2013
INPE Instituto de Pesquisas Espaciais Banco de dados DETER 2013 Disponiacutevel em
lthttpwwwobtinpebrdetergt Acesso em 10 de set 2013
INPE Instituto de Pesquisas Espaciais Banco de dados de queimadas e focos de calor
BDQUEIMADAS 2013 Disponiacutevel em lthttpwwwdpiinpebrproarcobdqueimadasgt
Acesso em 10 de set 2013
Instituto Carbono Brasil Soacute 2 da produccedilatildeo de madeira eacute certificada O Estado de SPaulo 2006
Disponiacutevel em lthttpwwwinstitutocarbonobrasilorgbrnoticias6noticia=119796gt Acesso
em 26 de set 2013
MONITORING amp IMPLEMENTATION REPORT VCS Version 3 CCB Standards Third Edition
v30 51
IFT Instituto Floresta Tropical Diagnoacutestico do Setor Florestal de Cotriguaccedilu Estado do Mato
Grosso 2010 Disponiacutevel em lthttpgooglEVx2RZgt Acesso em 16 de dez 2013
IPCC Guidelines for National Greenhouse Gas Inventories In National Greenhouse Gas
Inventories Programme EGGLESTON HS BUENDIA L MIWA K NGARA T TANABE
K (Eds) Japan IGES 2006
ITTO Annual review and assessment of the world timber situation 2011 Disponivel em
httpwwwittointannual_review Acesso em 10 de out 2013
KELLER M et al Coarse woody debris in undisturbed and logged forests in the eastern Brazilian
Amazon Global Change Biology vol10 PP784-795 2004
LENTINI M VERISSIMO A PEREIRA D A expansatildeo madeireira na Amazocircnia O Estado da
Amazocircnia n2 2005 Beleacutem IMAZON Disponiacutevel em
httpwwwimazonorgbruploadea_2ppdf Acesso em 06 de set 2013
LOETSCH F ZOumlHRER F HALLER K E Forest Inventory Munich BLV Verlagsgesellschaft
2nd
edition Vol II 1973 469 p
MAGNUSSON WE et al RAPELD uma modificaccedilatildeo do meacutetodo de Gentry para inventaacuterios de
biodiversidade em siacutetios para pesquisa ecoloacutegica de longa duraccedilatildeo Biota Neotrop JulDez
2005 vol 5 no 2 httpwwwbiotaneotropicaorgbrv5n2ptabstractpoint-of-
view+bn01005022005 ISSN 1676-0603
MARINELLI C E et al O programa de monitoramento da biodiversidade da biodiversidade e do
uso de recursos naturais em unidades de conservaccedilatildeo estaduais do Amazonas Secretaria
de Estado do Meio Ambiente e Desenvolvimento Sustentaacutevel - SDS Manaus SDS 2007
MONITORING amp IMPLEMENTATION REPORT VCS Version 3 CCB Standards Third Edition
v30 52
MARINELLI C E MALTEZ M H Indicadores de Sustentabilidade para Unidades de
Conservaccedilatildeo Documento-Siacutentese Workshop Instituto Socioambiental Brasiacutelia-DF 2010
76p
MAZZEI L et al Above-ground biomass dynamics after reduced-impact logging in the Eastern
Amazon Forest Ecology and Management vol 259 pp367-373 2010
MEIRELLES FILHO O Livro de Ouro da Amazocircnia 5ordf Ediccedilatildeo Rio de Janeiro EDIOURO 2007
422p Meirelles Filho J O Livro de Ouro da Amazocircnia 1ordf ed Editora Ediouro ISBN
8500021616 2007 450p
MENGER Juliana da Silva Fatores determinantes da distribuiccedilatildeo de aves no interfluacutevio Purus-
Madeira Manaus [sn] 2011 35 fl il
MCT Arquivos dos Fatores de Emissatildeo Disponiacutevel em
httpwwwmctgovbrindexphpcontentview321144htmlancora Acesso em 23 de out
2013
MMA Ministeacuterio do Meio Ambiente Avaliaccedilatildeo e identificaccedilatildeo de accedilotildees prioritaacuterias para a
conservaccedilatildeo utilizaccedilatildeo sustentaacutevel e reparticcedilatildeo dos benefiacutecios da biodiversidade na
Amazocircnia brasileira Brasiacutelia MMASBF 2001
MMA Ministeacuterio do Meio Ambiente Secretaria de Biodiversidade e Florestas Aacutereas Prioritaacuterias
para Conservaccedilatildeo Uso Sustentaacutevel e Reparticcedilatildeo de Benefiacutecios da Biodiversidade Brasileira
Atualizaccedilatildeo - Portaria MMA ndeg9 de 23 de janeiro de 2007 Brasiacutelia MMA 2007 (Seacuterie
Biodiversidade 31)
MONITORING amp IMPLEMENTATION REPORT VCS Version 3 CCB Standards Third Edition
v30 53
MMA Livro vermelho da fauna brasileira ameaccedilada de extinccedilatildeo editores Angelo Barbosa
Monteiro Machado Glaacuteucia Moreira Drummond Adriano Pereira Paglia 1ed 2008 Brasiacutelia
DF MMA Belo Horizonte MG Fundaccedilatildeo Biodiversitas (1420 p) il - (Biodiversidade 19)
OLIVEIRA M M HIGUCHI N CELES C H HIGUCHI F G 2014 Tamanho e formas de
parcelas para inventaacuterios florestais de espeacutecies arboacutereas na Amazocircnia Central Ciecircncia
Florestal Santa Maria v 24 n 3 p 645-653
PEARSON TRH WALKER S BROWN SL The Source Book for Land Use Land Use
Change and Forestry Projects BioCarbon Fund and Winrock International 2005 64 pp
PORTAL AMAZOcircNIA Amazocircnia de A a Z Disponiacutevel em
lthttpportalamazoniaglobocomgt Acesso em 13 de set 2013
PEacuteLLICO NETTO S BRENA D A Inventaacuterio florestal Curitiba Editorado pelos autores p
316 1997
PROJETO SIVAM Relatoacuterio metodoloacutegico de trabalho Revisatildeo 3 Diretoria de Geociecircncia Rio de
Janeiro 2002 330 pp
PROJETO SIVAM Atualizaccedilatildeo do RADAMBRASIL Mapa de Vegetacao da Amazonia Legal
Mapa de Fitofisionomias ndash RADAMSIPAM DNPM Ministeacuterio de Minas e Energia 2002
Disponiacutevel em httpwwwdpiinpebramb_dataShapefilesveg_Amz_SIPAMzip Acesso
em 21 de jan 2014
PROJETO FLORESTAL SANTA MARIA (PROJETO FSM-REDD) Plant Inteligecircncia Ambiental ndash
Warwick Manfrinato 2012 Disponiacutevel em
lthttpwwwflorestalsantamariacombrsitedocumentos57FSM_REDD_VCS_PD_ptpdfgt
Acesso em 09 de set 2013
MONITORING amp IMPLEMENTATION REPORT VCS Version 3 CCB Standards Third Edition
v30 54
RADAMBRASIL Programa de Integraccedilatildeo Nacional Levantamentos de Recursos Naturais v 14 ndash
RADAM DNPM Ministeacuterio de Minas e Energia Brasil 1974
RIBEIRO J E L et al Flora da Reserva Ducke guia de identificaccedilatildeo das plantas vasculares de
uma floresta de terra firme na Amazocircnia Central Manaus Editora INPA 1999
ROSAS F C W WALDEMARIN H de MATTOS G E Pteronura rasiliensis (Zimmermann
1780) In MACHADO A B M DRUMMOND G M PAGLIA A P (eds) Livro Vermelho da
Fauna Brasileira Ameaccedilada de Extinccedilatildeo Volume II 1ed Brasiacutelia DF Ministeacuterio do Meio
Ambiente 2008 p 800 - 801
ROSS D GHG Emissions Resulting from Aircraft Travel 2009 Disponiacutevel em
httpwwwcarbonplanetcomdownloadsFlight_Calculator_Information_v92pdf Acesso em
14 de out 2013
SANTOS A J et al Viabilidade econocircmica do sistema agroflorestal greviacutelea x cafeacute na regiatildeo
norte do Paranaacute CERNE vol6 n1 pp89-100 2000
SANTOS R A Custo do manejo florestal madeireiro estudo de caso Floresta Estadual do
Antimary Monografia (Bacharelado em Economia) ndash Departamento de Ciecircncias
Econocircmicas Universidade Federal do Acre 2007109p
SABOGAL C et al Manejo Florestal Empresarial na Amazocircnia Brasileira restriccedilotildees e
oportunidades (Relatoacuterio Siacutentese) Beleacutem CIFORIMAZON 2006 72p
SDSCEUC Secretaria Estadual de Meio Ambiente e Desenvolvimento Sustentaacutevel ndash Centro
Estadual de Unidades de Conservaccedilatildeo Programa de Monitoramento de Biodiversidade e
Uso de Recursos Naturais em Aacutereas Protegidas do Estado Amazonas (ProBUC) 2006
Disponiacutevel em
MONITORING amp IMPLEMENTATION REPORT VCS Version 3 CCB Standards Third Edition
v30 55
httpbrazilwcsorgDesktopModulesBring2mindDMXDownloadaspxEntryId=6168ampPortalI
d=93ampDownloadMethod=attachment Acesso em 11 de ago de 2013
SFBIMAZON Serviccedilo Florestal Brasileiro e Instituto do Homem e Meio Ambiente da Amazocircnia A
atividade madeireira na Amazocircnia brasileira produccedilatildeo receita e mercados 2010 Disponiacutevel
em httpwwwmmagovbrestruturassfb_arquivosmiolo_resexec_polo_03_95_1pdf
Acesso em 23 de out 2013
SILVA R P da Alometria estoque e dinacircmica da biomassa de florestas primaacuterias e
secundaacuterias na regiatildeo de Manaus (AM) 152 p Tese de Doutorado Programa Integrado
de Poacutes-graduaccedilatildeo em Biologia Tropical e Recursos Naturais (INPA) Manaus 2007
SILVA Z A G P G SANTOS R A Custo do manejo florestal madeireiro em floresta puacuteblica
estudo de caso no Acre 2011 Disponiacutevel em
lthttpwwwbasacombrbancoamazonia2Revistaedicao_13n13_custo_do_manejo_flores
pdfgt Acesso em 13 de set 2013
SMIDT M GALLAGHER T Factors Affecting Fuel Consumption and Harvesting Costs Auburn
School of Forestry and Wildlife Sciences Sd Disponiacutevel em
httpweb1cnrevteduforestrycofedocuments2013Smidt_Gallagherpdf Acesso em 21
de out 2013
SOARES-FILHO B et al Role of Brazilian Amazon protected areas in climate change mitigation
2010 Columbia University NY Ruth S DeFries 2010
SPF Serviccedilo Puacuteblico Federal DVPF Documento de venda de produto Florestal (Declaraccedilotildees de
venda Gethalpdf) 14 de julho de 2006
MONITORING amp IMPLEMENTATION REPORT VCS Version 3 CCB Standards Third Edition
v30 56
TIMOFEICZYK JUacuteNIOR R et al Rentabilidade econocircmica do manejo de baixo impacto em
florestas tropicais um estudo de caso Revista Floresta Curitiba v 38 n 4 p 711-725
outdez 2008
VCS Ferramenta para Demonstraccedilatildeo e Avaliaccedilatildeo de Adicionalidade para Atividades de Projetos
VCS em Agricultura Floresta e Outros Usos (AFOLU) 2012a Disponiacutevel em httpwwwv-c-
sorgsitesv-c-sorgfilesVT000120VCS20AFOLU20Additionality20Tool20v30pdf
Acesso em 24 de set 2013
VCS Ferramenta de Risco e Natildeo Permanecircncia (AFOLU) 2012B Disponiacutevel em httpv-c-
sorgsitesv-c-sorgfilesAFOLU20Non-Permanence20Risk20Tool2C20v32pdf
Acesso em 13 de set 2013
VCS Approved VCS Methodology VM0010 Version 10 - Methodology for Improved Forest
Management Conversion to Logged to Protected Forest Calculating GHG Benefits from
Preventing Planned Degradation PHUA S SHARMA S TELFER M CHANDLER H
(Eds) Califoacuternia EUA Carbon Planet Limited 2011149p
VERDEJO M E Diagnoacutestico Rural Participativo um guia praacutetico Brasiacutelia MDA 2006 62p
VIANNA A L M Diagnoacutestico Florestal do Estado do Amazonas 2010 e 2011 Manaus-AM
IDESAM 2013 (Relatoacuterio Final do Projeto Fortalecimento da participaccedilatildeo da sociedade civil
no Amazonas Foacuterum de Mudanccedilas Climaacuteticas Transparecircncia Florestal no Estado do
Amazonas ndash Mapeamento de Instrumentos Legislativos no Brasil)
WBCSDWRI The GHG Protocol for Project Accountin Washington World Business Council for
Sustainable DevelopmentWorld Resources Institute 2005148 p
MONITORING amp IMPLEMENTATION REPORT VCS Version 3 CCB Standards Third Edition
v30 57
WALKER W et al Guia de Campo para Estimativa de Biomassa Florestal e Estoque de Carbono
Woods Hole Center Research Falmouth Massachusetts USA 2011 Disponiacutevel em
httpwwwwhrcorgresourcesfieldguidescarbonpdfWHRC_FieldGuide_PortugueseSMpdf
Acesso em 14 de set 2013
WWF Metodologia para Avaliaccedilatildeo Raacutepida e a Priorizaccedilatildeo do Manejo de Unidades de
Conservaccedilatildeo (RAPPAM) 2010 Disponiacutevel em httpgooglXfDnxs Acesso em 30 de set
2013
WWF-Brasil Efetividade de Gestatildeo das Unidades de Conservaccedilatildeo no Estado do Amazonas
Secretaria de Estado do Meio Ambiente e do Desenvolvimento Sustentaacutevel do Amazonas
Instituto Chico Mendes de Conservaccedilatildeo da Biodiversidade Brasiacutelia WWF-Brasil 2011 72 p
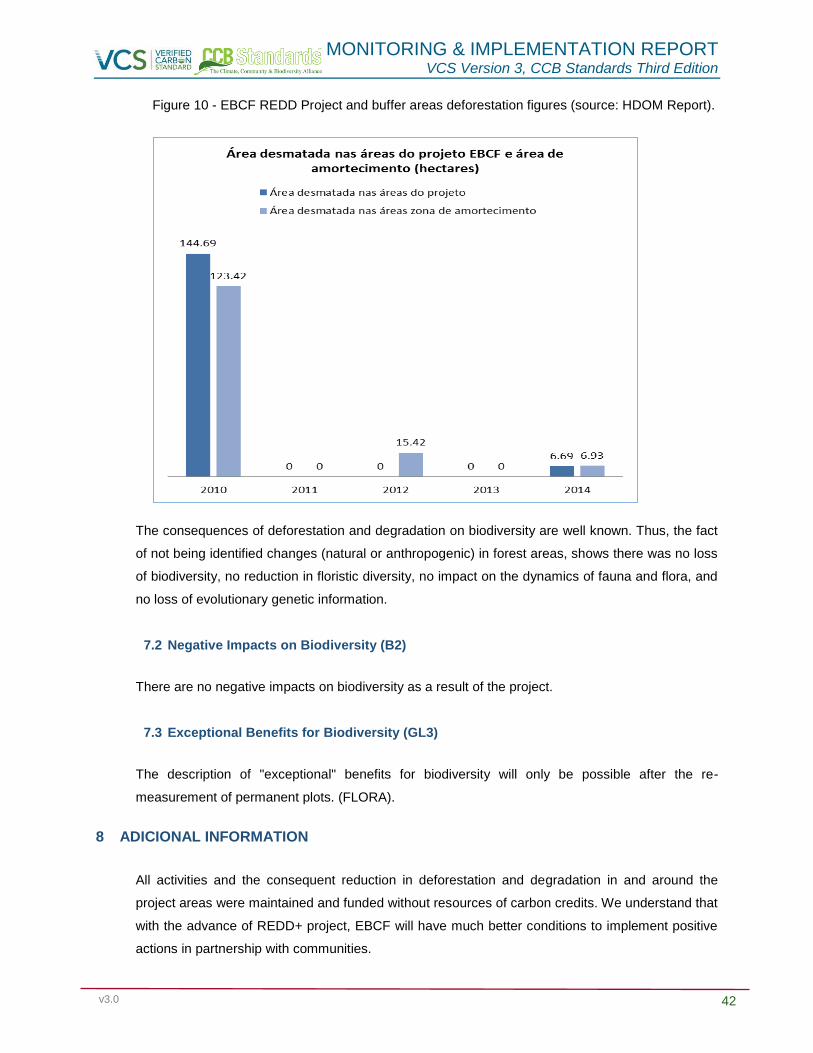
MONITORING amp IMPLEMENTATION REPORT VCS Version 3 CCB Standards Third Edition
v30 42
Figure 10 - EBCF REDD Project and buffer areas deforestation figures (source HDOM Report)
The consequences of deforestation and degradation on biodiversity are well known Thus the fact
of not being identified changes (natural or anthropogenic) in forest areas shows there was no loss
of biodiversity no reduction in floristic diversity no impact on the dynamics of fauna and flora and
no loss of evolutionary genetic information
72 Negative Impacts on Biodiversity (B2)
There are no negative impacts on biodiversity as a result of the project
73 Exceptional Benefits for Biodiversity (GL3)
The description of exceptional benefits for biodiversity will only be possible after the re-
measurement of permanent plots (FLORA)
8 ADICIONAL INFORMATION
All activities and the consequent reduction in deforestation and degradation in and around the
project areas were maintained and funded without resources of carbon credits We understand that
with the advance of REDD+ project EBCF will have much better conditions to implement positive
actions in partnership with communities
MONITORING amp IMPLEMENTATION REPORT VCS Version 3 CCB Standards Third Edition
v30 43
REFERENCES
ADEODATO S etal Madeira de ponta a ponta o caminho da floresta ateacute o consumo Satildeo Paulo
FGV-RAE 2011
ALBAGLI S Amazocircnia fronteira geopoliacutetica da biodiversidade Revista Parcerias Estrateacutegicas n
12 p6 set2001 Centro de Estudos Estrateacutegicos do Ministeacuterio da Ciecircncia e Tecnologia
AMARAL I C Viabilidade de plantio de cafeacute na zona da mata mineira Revista Poliacutetica Agriacutecola
Ano xx n4 outnovdez 2011 Disponiacutevel em
httpwwwalicecnptiaembrapabrbitstreamdoc9309031Viabilidadedeplantiopdf Acesso
em 17 de set 2013
AMARAL P etal Floresta para Sempre um manual para a produccedilatildeo de madeira na Amazocircnia
Beleacutem IMAZON 1998 130p
AMAZONAS Lei Complementar nordm 532007 de 05062007 REGULAMENTA o inciso V do artigo
230 e o sect 1ordm do artigo 231 da Constituiccedilatildeo Estadual institui o SISTEMA ESTADUAL DE
UNIDADES DE CONSERVACcedilAtildeO - SEUC dispondo sobre infraccedilotildees e penalidades e
estabelecendo outras providecircncias Disponiacutevel em
httpwwwcetesbspgovbruserfilesfilemudancasclimaticasproclimafilelegislacaoestadua
lamazonasleilei_complementar_n_53_2007_amazonaspdf Acessado em Setembro 2013
ANTAQ Anuaacuterio Estatiacutestico 2004 Distacircncia entre os portos Disponiacutevel em
httpwwwantaqgovbrportalanuariosportuario2004TabelasDistanciaEntrePortospdf
Acesso em 23 de out 2013
ANTAQ Panorama Aquaviaacuterio Agecircncia Nacional de Transportes Aquaviaacuterios Volume 3 Brasiacutelia
ndash DF 2009
MONITORING amp IMPLEMENTATION REPORT VCS Version 3 CCB Standards Third Edition
v30 44
AREDES A F PEREIRA M W G Anaacutelise econocircmica da produccedilatildeo de cafeacute araacutebica um estudo
de caso com simulaccedilotildees de Monte Carlo para sistemas de baixa e alta produtividade
Informaccedilotildees Econocircmicas SP v38 n4 abr 2008
ARIMA E UHL C Pecuaacuteria na Amazocircnia Oriental Desempenho Atual e Perspectivas Futuras Seacuterie
Amazocircnia n1 Beleacutem IMAZON 1996 40p
BACCINI A et al Estimated carbon dioxide emissions from tropical deforestation improved by
carbon-density maps Nature Climate Change vol2 march 2012 (LETTERS Published
Online - DOI 101038NCLIMATE1354)
BARROS A C UHL C Padrotildees problemas e potencial da extraccedilatildeo madeireira ao longo do Rio
Amazonas e do seu estuaacuterio Seacuterie Amazocircnia n4 Beleacutem IMAZON 1997 42p
BRASIL Lei 121872009 (Lei Ordinaacuteria) 29122009 Institui a Poliacutetica Nacional sobre Mudanccedila
do Clima - PNMC e daacute outras Providecircncias Presidecircncia da Repuacuteblica Casa Civil Subchefia
para Assuntos Juriacutedicos Disponiacutevel em lthttpswwwplanaltogovbrccivil_03_ato2007-
20102009leil12187htmgt Acesso em 20 de set 2013
CAMPOS E F Emissatildeo de CO2 da madeira serrada da Amazocircnia o caso da exploraccedilatildeo
convencional 2012 172p Dissertaccedilatildeo - Escola Politeacutecnica Universidade de Satildeo Paulo Satildeo
Paulo
CARDOSO RS e FREITAS C E C A pesca de pequena escala no rio Madeira pelos
desembarques ocorridos em Manicoreacute (Estado do Amazonas) Brasil Revista Acta
Amazocircnica vol 38(4) 2008 781 ndash 788
CCBA Climate Community and Biodiversity Alliance-CCBA 2008 Disponiacutevel em
httpwwwclimate-standardsorgccb-standards Acesso em 03 de set 2013
MONITORING amp IMPLEMENTATION REPORT VCS Version 3 CCB Standards Third Edition
v30 45
CEPEA Centro de Estudos Avanccedilados em Economia Aplicada - ESALQUSP Economia da
pecuaacuteria de corte na regiatildeo norte do Brasil Disponiacutevel em httpgooglL2roiA Acesso em
15 de out 2013
CHAMBERS J Q et al Decomposition and carbon cycling of dead trees in tropical forests of the
central Amazon Oecologia vol122 pp380-388 2000 Agricultores se queixam de
burocracia para contratar creacutedito sustentaacutevel do Programa ABC Correio Braziliense Brasiacutelia
26 fev 2012 Disponiacutevel em
lthttpwww2correiobraziliensecombrsersustentavelp=4592gt Acesso em 10 set 2013
CULLEN Jr L VALLADARES-PAacuteDUA C Onccedilas como detetives da paisagem Ciecircncia Hoje
Vol 156 n26 pp54-571999
CPRM - Serviccedilo Geoloacutegico do Brasil Disponiacutevel em httpwwwcprmgovbr Acesso em 13 de
mar 2013
DIAS F M MORAIS S J S REZENDE R C Anaacutelise da viabilidade econocircmica para a
produccedilatildeo de melancia e cenoura com financiamento em Anaacutepolis-GO 2008 Disponiacutevel em
httpwwwprpuegbr06v1conteudopesquisainiccieneventossic2008fronteiraflashsicani
macaoIIIJORNADAarquivosresumosresumo01pdfgt Acesso em 18 de nov2013
Divisatildeo de Precessamento de Imagens (DPI) Ambdata Mapa de Vegetaccedilatildeo SIPAM RADAM
2002 Disponiacutevel em httpwwwdpiinpebrAmbdatamapa_sipamphp Acesso em 21 de
out 2013
DOMINGUES MS BERNMANN C O arco de desflorestamento na Amazocircnia da pecuaacuteria agrave
soja Ambiente amp Sociedade Satildeo Paulo vol15 n2 pp1-22 maioago 2012
MONITORING amp IMPLEMENTATION REPORT VCS Version 3 CCB Standards Third Edition
v30 46
EBCF Criaccedilatildeo da primeira reserva particular de desenvolvimento sustentaacutevel do mundo na
floresta amazocircnica Disponiacutevel emlthttpwwwebcfcombrblog20130624criacao-da-
primeira-reserva-particular-de-desenvolvimento-sustentavel-do-mundo-na-floresta-
amazonicagt Acesso em 21 de set 2013
EMBRAPA Sistema Brasileiro de Classificaccedilatildeo de Solos 2ordf Ed Rio de Janeiro Embrapa Solos
2006 306 p
FELDPAUSCH T R et al When big trees fall Damage and carbon export by reduced impact
logging in southern Amazonia Forest Ecology and Management Vol 219 pp199-215 2005
FEARNSIDE P MDesmatamento na Amazocircnia dinacircmica impactos e controle Acta Amazocircnica
vol 36 n3 pp 395-400 2006
FILGUEIRAS T S et al 1994 Caminhamento Um meacutetodo expedito para levantamentos
floriacutesticos qualitativos Caderno de Geociecircncia IBGE vol12 pp39-43 1994
Forest Management Public Summary for Gethal Amazonas SA Induacutestria de Madeira
Compensada Certification Code SW-FMCOC-119 Date of Certification October 1
2000 Date of Public Summary October 2000 Updated for Annual Audit 2002 Annual Audit
2003 (Gethalpdf)
Globo Rural Linha de financiamento para a agricultura de baixo carbono tem pouca procura
2011 Disponiacutevel em httpwwwrainforest-allianceorgforestrydocumentsgethalpdf
Acesso em 16 de nov 2013
GREENPEACE Face a Face com a Destruiccedilatildeo Relatoacuterio Greenpeace sobre as companhias
multinacionais madeireiras na Amazocircnia Brasileira 1999 Disponiacutevel em
MONITORING amp IMPLEMENTATION REPORT VCS Version 3 CCB Standards Third Edition
v30 47
lthttpwwwgreenpeaceorgbramazoniaface_destruicaopdfgt Acesso em 11 de set
2013
Governo do Estado do Amazonas Plano de Gestao da RDS do Rio Amapaacute 2010 Disponiacutevel em
httpobservatoriowwforgbrsite_mediauploadgestaoplanoManejorio_amapapdf Acesso
em 24 de ago 2013
HDOM Estimates from processing the forest inventories data carried out during the CADAF
Project Final Technical Report 2012 Disponiacutevel em wwwhdomcombr Acesso em 27 de
maio 2013
HIGUCHI N 1986-87 Amostragem sistemaacutetica versus amostragem aleatoacuteria em floresta tropical
uacutemida de terra-firme na regiatildeo de Manaus Acta Amazonica 1617 (uacutenico) 393-400
HIGUCHI N SANTOS J JARDIM FCS Tamanho de parcela amostral para inventaacuterios
florestais Acta Amazocircnica vol12 n1 pp91-103 1982
HIGUCHI F G PINTO A C M ISHIZUKA M KAJIMOTO T LIMA A J N SANTOS J
HIGUCHI N Estoque e dinacircmica de biomassa acima do solo das florestas de terra firme do
estado do Amazonas In Adriano Joseacute Nogueira Lima Flaacutevia Machado Durgante Moacir
Alberto Assis Campos Joaquim dos Santos Moriyoshi Ishizuka Niro Higuchi (Org)
Dinacircmica do carbono das florestas da Amazocircnia resultados do Projeto CADAF
1edManaus INPA 2014 v 1 p 29-34
HOLMES T P etal Custos e benefiacutecios financeiros da exploraccedilatildeo de impacto reduzido em
comparaccedilatildeo agrave exploraccedilatildeo florestal convencional na Amazocircnia oriental 2ordf ed Beleacutem
Fundaccedilatildeo Floresta Tropical 2002 66p
HUSCH B MILLER C I BEERS T W Forest mensuration New York Ronald Press 1971
HUSCH B MILLER C I BEERS T W Forest Mensuration New York John Wiley amp Sons
2nd
ed 1972 402 p
MONITORING amp IMPLEMENTATION REPORT VCS Version 3 CCB Standards Third Edition
v30 48
IBGE Instituto Brasileiro de Geografia e Estatiacutestica Diretoria de GeociecircnciasCoordenaccedilatildeo de
Recursos Naturais e Estudos Ambientais Geologia Solos Hidrografia e Vegetaccedilatildeo 2000
IBGE Instituto Brasileiro de Geografia e Estatiacutestica Manicoreacute 2010 Disponiacutevel
emlthttpwwwsidraibgegovbrgt Acesso em 05 de set 2013
IBGE Instituto Brasileiro de Geografia e Estatiacutestica 2011 Disponiacutevel em httpwwwibgegovbr
Acesso em 19 de mar 2013
IBGE Instituto Brasileiro de Geografia e Estatiacutestica Extraccedilatildeo vegetal e silvicultura para o
municiacutepio de Manicoreacute 2011 Disponiacutevel em
lthttpcidadesibgegovbrxtrastemasphplang=ampcodmun=130270ampidtema=102ampsearch=a
mazonas|manicore|extracao-vegetal-e-silvicultura-2011gt Acesso em 10 de out 2013
IBGE Instituto Brasileiro de Geografia e Estatiacutestica Censo Demograacutefico 2010 Disponiacutevel em
lthttpcidadesibgegovbrxtrastemasphpcodmun=130270ampidtema=116gt Acesso em 18
de out 2013
IBGE Instituto Brasileiro de Geografia e Estatiacutestica Censo Demograacutefico 2010 Disponiacutevel
emlthttpcidadesibgegovbrxtrashomephpgt Acesso em 08 de out 2013
IDESAM Reduccedilotildees de Emissotildees do Desmatamento e Degradaccedilatildeo Florestal (REDD+) estudo de
oportunidades para a regiatildeo sul do Amazonas CENAMO M Cl CARRERO G C
GANDOLFO P (Org) Manaus 2011 Disponiacutevel em
lthttpwwwobservatoriodoreddorgbrsitepdfestudodeoportunidadespdfgt Acesso em 13 de
set 2013
MONITORING amp IMPLEMENTATION REPORT VCS Version 3 CCB Standards Third Edition
v30 49
IDESAM Semeando Sustentabilidade em Apuiacute ndash Resultados e Perspectivas 2011 Manaus
Disponivel em lthttpidesamorgbrsemeando-sustentabilidade-em-apui-resultados-e-
perspectivasUxX8nfldWYI
IEA Instituto de Economia Aplicada CO2 Emissions from fuel combustion 2012 Disponiacutevel em
httpwwwieaorgco2highlightsco2highlightspdf Acesso em 09 de out 2013
IGREJA H L S CATIQUE J Anaacutelise neotectocircnica do lineamento de Itacoatiara centro leste do
Estado do Amazonas In Simpoacutesio Nacional de Estudos Tectocircnicos 6 1997 Pirenoacutepolis
Anais Pirenoacutepolis-GO SBG-Nuacutecleo Brasiacutelia1997
IMAZON Instituto do Homem e do Meio Ambiente da Amazocircnia Fatos Florestais 2010a
Disponiacutevel em httpwwwimazonorgbrpublicacoeslivrosfatos-florestais-da-amazonia-
2010-1 Acesso em 14 de out 2013
IMAZOM Instituto do Homem e do Meio Ambiente da Amazocircnia Mercado e preccedilo da madeira
amazocircnica 2010 Disponiacutevel em httpwwwimazonorgbrpublicacoesprecos-de-madeira-
em-toraboletim-de-precos-de-madeira-em-tora-na-amazonia-julho-2010at_downloadfile
Acesso em 23 de nov 2013
IMAZON Instituto do Homem e do Meio Ambiente da Amazocircnia Portal de Geoinformaccedilatildeo sobre
a Amazocircnia Disponiacutevel em lthttpwwwimazongeoorgbrimazongeophpgt Acesso em 06
de set 2013
IMAZON Instituto do Homem e do Meio Ambiente da Amazocircnia Transparecircncia florestal
Amazocircnia Legal 2012 Disponiacutevel em lthttpwwwimazonorgbrpublicacoestransparencia-
florestaltransparencia-florestal-amazonia-legalcopy_of_SADOutubro2012pdfgt Acesso em
23 de set 2013
IMAZON Instituto do Homem e do Meio Ambiente da Amazocircnia PEREIRA D SANTOS D
VEDOVETO M GIMARAtildeES J VERIacuteSSIMO A (Orgs) Fatos Florestais da Amazocircnia
Beleacutem IMAZON 2010 244p Disponiacutevel em
MONITORING amp IMPLEMENTATION REPORT VCS Version 3 CCB Standards Third Edition
v30 50
lthttpwwwimazonorgbrpublicacoeslivrosfatos-florestais-da-amazonia-2010-1gt Acesso
em 24 de set 2013
IMAZON Instituto do Homem e do Meio Ambiente da Amazocircnia A Expansatildeo madeireira na
Amazocircnia Impactos e perspectivas para o desenvolvimento sustentaacutevel no Paraacute BARROS
AC VERIacuteSSIMO A (Eds) Beleacutem IMAZON 2002
IMAZON Instituto do Homem e do Meio Ambiente da Amazocircnia Custos e Benefiacutecios do Manejo
Florestal Para Produccedilatildeo de Madeira na Amazocircnia Oriental 1998 Disponiacutevel em
lthttpwwwimazonorgbrpublicacoesserie-amazoniacustos-e-beneficios-do-manejo-
florestal-para-producao-de-madeira-na-amazonia-orientalgt Acesso em 20 de set 2013
INPE Instituto de Pesquisas Espaciais Banco de dados PRODES 2012 Disponiacutevel em
lthttpwwwdpiinpebrprodesdigitalprodesphpgt Acesso em 09 de set 2013
INPE Instituto de Pesquisas Espaciais Banco de dados DEGRAD 2009 Disponiacutevel em
lthttpwwwobtinpebrdegradgt Acesso em 09 de set 2013
INPE Instituto de Pesquisas Espaciais Banco de dados DETER 2013 Disponiacutevel em
lthttpwwwobtinpebrdetergt Acesso em 10 de set 2013
INPE Instituto de Pesquisas Espaciais Banco de dados de queimadas e focos de calor
BDQUEIMADAS 2013 Disponiacutevel em lthttpwwwdpiinpebrproarcobdqueimadasgt
Acesso em 10 de set 2013
Instituto Carbono Brasil Soacute 2 da produccedilatildeo de madeira eacute certificada O Estado de SPaulo 2006
Disponiacutevel em lthttpwwwinstitutocarbonobrasilorgbrnoticias6noticia=119796gt Acesso
em 26 de set 2013
MONITORING amp IMPLEMENTATION REPORT VCS Version 3 CCB Standards Third Edition
v30 51
IFT Instituto Floresta Tropical Diagnoacutestico do Setor Florestal de Cotriguaccedilu Estado do Mato
Grosso 2010 Disponiacutevel em lthttpgooglEVx2RZgt Acesso em 16 de dez 2013
IPCC Guidelines for National Greenhouse Gas Inventories In National Greenhouse Gas
Inventories Programme EGGLESTON HS BUENDIA L MIWA K NGARA T TANABE
K (Eds) Japan IGES 2006
ITTO Annual review and assessment of the world timber situation 2011 Disponivel em
httpwwwittointannual_review Acesso em 10 de out 2013
KELLER M et al Coarse woody debris in undisturbed and logged forests in the eastern Brazilian
Amazon Global Change Biology vol10 PP784-795 2004
LENTINI M VERISSIMO A PEREIRA D A expansatildeo madeireira na Amazocircnia O Estado da
Amazocircnia n2 2005 Beleacutem IMAZON Disponiacutevel em
httpwwwimazonorgbruploadea_2ppdf Acesso em 06 de set 2013
LOETSCH F ZOumlHRER F HALLER K E Forest Inventory Munich BLV Verlagsgesellschaft
2nd
edition Vol II 1973 469 p
MAGNUSSON WE et al RAPELD uma modificaccedilatildeo do meacutetodo de Gentry para inventaacuterios de
biodiversidade em siacutetios para pesquisa ecoloacutegica de longa duraccedilatildeo Biota Neotrop JulDez
2005 vol 5 no 2 httpwwwbiotaneotropicaorgbrv5n2ptabstractpoint-of-
view+bn01005022005 ISSN 1676-0603
MARINELLI C E et al O programa de monitoramento da biodiversidade da biodiversidade e do
uso de recursos naturais em unidades de conservaccedilatildeo estaduais do Amazonas Secretaria
de Estado do Meio Ambiente e Desenvolvimento Sustentaacutevel - SDS Manaus SDS 2007
MONITORING amp IMPLEMENTATION REPORT VCS Version 3 CCB Standards Third Edition
v30 52
MARINELLI C E MALTEZ M H Indicadores de Sustentabilidade para Unidades de
Conservaccedilatildeo Documento-Siacutentese Workshop Instituto Socioambiental Brasiacutelia-DF 2010
76p
MAZZEI L et al Above-ground biomass dynamics after reduced-impact logging in the Eastern
Amazon Forest Ecology and Management vol 259 pp367-373 2010
MEIRELLES FILHO O Livro de Ouro da Amazocircnia 5ordf Ediccedilatildeo Rio de Janeiro EDIOURO 2007
422p Meirelles Filho J O Livro de Ouro da Amazocircnia 1ordf ed Editora Ediouro ISBN
8500021616 2007 450p
MENGER Juliana da Silva Fatores determinantes da distribuiccedilatildeo de aves no interfluacutevio Purus-
Madeira Manaus [sn] 2011 35 fl il
MCT Arquivos dos Fatores de Emissatildeo Disponiacutevel em
httpwwwmctgovbrindexphpcontentview321144htmlancora Acesso em 23 de out
2013
MMA Ministeacuterio do Meio Ambiente Avaliaccedilatildeo e identificaccedilatildeo de accedilotildees prioritaacuterias para a
conservaccedilatildeo utilizaccedilatildeo sustentaacutevel e reparticcedilatildeo dos benefiacutecios da biodiversidade na
Amazocircnia brasileira Brasiacutelia MMASBF 2001
MMA Ministeacuterio do Meio Ambiente Secretaria de Biodiversidade e Florestas Aacutereas Prioritaacuterias
para Conservaccedilatildeo Uso Sustentaacutevel e Reparticcedilatildeo de Benefiacutecios da Biodiversidade Brasileira
Atualizaccedilatildeo - Portaria MMA ndeg9 de 23 de janeiro de 2007 Brasiacutelia MMA 2007 (Seacuterie
Biodiversidade 31)
MONITORING amp IMPLEMENTATION REPORT VCS Version 3 CCB Standards Third Edition
v30 53
MMA Livro vermelho da fauna brasileira ameaccedilada de extinccedilatildeo editores Angelo Barbosa
Monteiro Machado Glaacuteucia Moreira Drummond Adriano Pereira Paglia 1ed 2008 Brasiacutelia
DF MMA Belo Horizonte MG Fundaccedilatildeo Biodiversitas (1420 p) il - (Biodiversidade 19)
OLIVEIRA M M HIGUCHI N CELES C H HIGUCHI F G 2014 Tamanho e formas de
parcelas para inventaacuterios florestais de espeacutecies arboacutereas na Amazocircnia Central Ciecircncia
Florestal Santa Maria v 24 n 3 p 645-653
PEARSON TRH WALKER S BROWN SL The Source Book for Land Use Land Use
Change and Forestry Projects BioCarbon Fund and Winrock International 2005 64 pp
PORTAL AMAZOcircNIA Amazocircnia de A a Z Disponiacutevel em
lthttpportalamazoniaglobocomgt Acesso em 13 de set 2013
PEacuteLLICO NETTO S BRENA D A Inventaacuterio florestal Curitiba Editorado pelos autores p
316 1997
PROJETO SIVAM Relatoacuterio metodoloacutegico de trabalho Revisatildeo 3 Diretoria de Geociecircncia Rio de
Janeiro 2002 330 pp
PROJETO SIVAM Atualizaccedilatildeo do RADAMBRASIL Mapa de Vegetacao da Amazonia Legal
Mapa de Fitofisionomias ndash RADAMSIPAM DNPM Ministeacuterio de Minas e Energia 2002
Disponiacutevel em httpwwwdpiinpebramb_dataShapefilesveg_Amz_SIPAMzip Acesso
em 21 de jan 2014
PROJETO FLORESTAL SANTA MARIA (PROJETO FSM-REDD) Plant Inteligecircncia Ambiental ndash
Warwick Manfrinato 2012 Disponiacutevel em
lthttpwwwflorestalsantamariacombrsitedocumentos57FSM_REDD_VCS_PD_ptpdfgt
Acesso em 09 de set 2013
MONITORING amp IMPLEMENTATION REPORT VCS Version 3 CCB Standards Third Edition
v30 54
RADAMBRASIL Programa de Integraccedilatildeo Nacional Levantamentos de Recursos Naturais v 14 ndash
RADAM DNPM Ministeacuterio de Minas e Energia Brasil 1974
RIBEIRO J E L et al Flora da Reserva Ducke guia de identificaccedilatildeo das plantas vasculares de
uma floresta de terra firme na Amazocircnia Central Manaus Editora INPA 1999
ROSAS F C W WALDEMARIN H de MATTOS G E Pteronura rasiliensis (Zimmermann
1780) In MACHADO A B M DRUMMOND G M PAGLIA A P (eds) Livro Vermelho da
Fauna Brasileira Ameaccedilada de Extinccedilatildeo Volume II 1ed Brasiacutelia DF Ministeacuterio do Meio
Ambiente 2008 p 800 - 801
ROSS D GHG Emissions Resulting from Aircraft Travel 2009 Disponiacutevel em
httpwwwcarbonplanetcomdownloadsFlight_Calculator_Information_v92pdf Acesso em
14 de out 2013
SANTOS A J et al Viabilidade econocircmica do sistema agroflorestal greviacutelea x cafeacute na regiatildeo
norte do Paranaacute CERNE vol6 n1 pp89-100 2000
SANTOS R A Custo do manejo florestal madeireiro estudo de caso Floresta Estadual do
Antimary Monografia (Bacharelado em Economia) ndash Departamento de Ciecircncias
Econocircmicas Universidade Federal do Acre 2007109p
SABOGAL C et al Manejo Florestal Empresarial na Amazocircnia Brasileira restriccedilotildees e
oportunidades (Relatoacuterio Siacutentese) Beleacutem CIFORIMAZON 2006 72p
SDSCEUC Secretaria Estadual de Meio Ambiente e Desenvolvimento Sustentaacutevel ndash Centro
Estadual de Unidades de Conservaccedilatildeo Programa de Monitoramento de Biodiversidade e
Uso de Recursos Naturais em Aacutereas Protegidas do Estado Amazonas (ProBUC) 2006
Disponiacutevel em
MONITORING amp IMPLEMENTATION REPORT VCS Version 3 CCB Standards Third Edition
v30 55
httpbrazilwcsorgDesktopModulesBring2mindDMXDownloadaspxEntryId=6168ampPortalI
d=93ampDownloadMethod=attachment Acesso em 11 de ago de 2013
SFBIMAZON Serviccedilo Florestal Brasileiro e Instituto do Homem e Meio Ambiente da Amazocircnia A
atividade madeireira na Amazocircnia brasileira produccedilatildeo receita e mercados 2010 Disponiacutevel
em httpwwwmmagovbrestruturassfb_arquivosmiolo_resexec_polo_03_95_1pdf
Acesso em 23 de out 2013
SILVA R P da Alometria estoque e dinacircmica da biomassa de florestas primaacuterias e
secundaacuterias na regiatildeo de Manaus (AM) 152 p Tese de Doutorado Programa Integrado
de Poacutes-graduaccedilatildeo em Biologia Tropical e Recursos Naturais (INPA) Manaus 2007
SILVA Z A G P G SANTOS R A Custo do manejo florestal madeireiro em floresta puacuteblica
estudo de caso no Acre 2011 Disponiacutevel em
lthttpwwwbasacombrbancoamazonia2Revistaedicao_13n13_custo_do_manejo_flores
pdfgt Acesso em 13 de set 2013
SMIDT M GALLAGHER T Factors Affecting Fuel Consumption and Harvesting Costs Auburn
School of Forestry and Wildlife Sciences Sd Disponiacutevel em
httpweb1cnrevteduforestrycofedocuments2013Smidt_Gallagherpdf Acesso em 21
de out 2013
SOARES-FILHO B et al Role of Brazilian Amazon protected areas in climate change mitigation
2010 Columbia University NY Ruth S DeFries 2010
SPF Serviccedilo Puacuteblico Federal DVPF Documento de venda de produto Florestal (Declaraccedilotildees de
venda Gethalpdf) 14 de julho de 2006
MONITORING amp IMPLEMENTATION REPORT VCS Version 3 CCB Standards Third Edition
v30 56
TIMOFEICZYK JUacuteNIOR R et al Rentabilidade econocircmica do manejo de baixo impacto em
florestas tropicais um estudo de caso Revista Floresta Curitiba v 38 n 4 p 711-725
outdez 2008
VCS Ferramenta para Demonstraccedilatildeo e Avaliaccedilatildeo de Adicionalidade para Atividades de Projetos
VCS em Agricultura Floresta e Outros Usos (AFOLU) 2012a Disponiacutevel em httpwwwv-c-
sorgsitesv-c-sorgfilesVT000120VCS20AFOLU20Additionality20Tool20v30pdf
Acesso em 24 de set 2013
VCS Ferramenta de Risco e Natildeo Permanecircncia (AFOLU) 2012B Disponiacutevel em httpv-c-
sorgsitesv-c-sorgfilesAFOLU20Non-Permanence20Risk20Tool2C20v32pdf
Acesso em 13 de set 2013
VCS Approved VCS Methodology VM0010 Version 10 - Methodology for Improved Forest
Management Conversion to Logged to Protected Forest Calculating GHG Benefits from
Preventing Planned Degradation PHUA S SHARMA S TELFER M CHANDLER H
(Eds) Califoacuternia EUA Carbon Planet Limited 2011149p
VERDEJO M E Diagnoacutestico Rural Participativo um guia praacutetico Brasiacutelia MDA 2006 62p
VIANNA A L M Diagnoacutestico Florestal do Estado do Amazonas 2010 e 2011 Manaus-AM
IDESAM 2013 (Relatoacuterio Final do Projeto Fortalecimento da participaccedilatildeo da sociedade civil
no Amazonas Foacuterum de Mudanccedilas Climaacuteticas Transparecircncia Florestal no Estado do
Amazonas ndash Mapeamento de Instrumentos Legislativos no Brasil)
WBCSDWRI The GHG Protocol for Project Accountin Washington World Business Council for
Sustainable DevelopmentWorld Resources Institute 2005148 p
MONITORING amp IMPLEMENTATION REPORT VCS Version 3 CCB Standards Third Edition
v30 57
WALKER W et al Guia de Campo para Estimativa de Biomassa Florestal e Estoque de Carbono
Woods Hole Center Research Falmouth Massachusetts USA 2011 Disponiacutevel em
httpwwwwhrcorgresourcesfieldguidescarbonpdfWHRC_FieldGuide_PortugueseSMpdf
Acesso em 14 de set 2013
WWF Metodologia para Avaliaccedilatildeo Raacutepida e a Priorizaccedilatildeo do Manejo de Unidades de
Conservaccedilatildeo (RAPPAM) 2010 Disponiacutevel em httpgooglXfDnxs Acesso em 30 de set
2013
WWF-Brasil Efetividade de Gestatildeo das Unidades de Conservaccedilatildeo no Estado do Amazonas
Secretaria de Estado do Meio Ambiente e do Desenvolvimento Sustentaacutevel do Amazonas
Instituto Chico Mendes de Conservaccedilatildeo da Biodiversidade Brasiacutelia WWF-Brasil 2011 72 p
MONITORING amp IMPLEMENTATION REPORT VCS Version 3 CCB Standards Third Edition
v30 45
CEPEA Centro de Estudos Avanccedilados em Economia Aplicada - ESALQUSP Economia da
pecuaacuteria de corte na regiatildeo norte do Brasil Disponiacutevel em httpgooglL2roiA Acesso em
15 de out 2013
CHAMBERS J Q et al Decomposition and carbon cycling of dead trees in tropical forests of the
central Amazon Oecologia vol122 pp380-388 2000 Agricultores se queixam de
burocracia para contratar creacutedito sustentaacutevel do Programa ABC Correio Braziliense Brasiacutelia
26 fev 2012 Disponiacutevel em
lthttpwww2correiobraziliensecombrsersustentavelp=4592gt Acesso em 10 set 2013
CULLEN Jr L VALLADARES-PAacuteDUA C Onccedilas como detetives da paisagem Ciecircncia Hoje
Vol 156 n26 pp54-571999
CPRM - Serviccedilo Geoloacutegico do Brasil Disponiacutevel em httpwwwcprmgovbr Acesso em 13 de
mar 2013
DIAS F M MORAIS S J S REZENDE R C Anaacutelise da viabilidade econocircmica para a
produccedilatildeo de melancia e cenoura com financiamento em Anaacutepolis-GO 2008 Disponiacutevel em
httpwwwprpuegbr06v1conteudopesquisainiccieneventossic2008fronteiraflashsicani
macaoIIIJORNADAarquivosresumosresumo01pdfgt Acesso em 18 de nov2013
Divisatildeo de Precessamento de Imagens (DPI) Ambdata Mapa de Vegetaccedilatildeo SIPAM RADAM
2002 Disponiacutevel em httpwwwdpiinpebrAmbdatamapa_sipamphp Acesso em 21 de
out 2013
DOMINGUES MS BERNMANN C O arco de desflorestamento na Amazocircnia da pecuaacuteria agrave
soja Ambiente amp Sociedade Satildeo Paulo vol15 n2 pp1-22 maioago 2012
MONITORING amp IMPLEMENTATION REPORT VCS Version 3 CCB Standards Third Edition
v30 46
EBCF Criaccedilatildeo da primeira reserva particular de desenvolvimento sustentaacutevel do mundo na
floresta amazocircnica Disponiacutevel emlthttpwwwebcfcombrblog20130624criacao-da-
primeira-reserva-particular-de-desenvolvimento-sustentavel-do-mundo-na-floresta-
amazonicagt Acesso em 21 de set 2013
EMBRAPA Sistema Brasileiro de Classificaccedilatildeo de Solos 2ordf Ed Rio de Janeiro Embrapa Solos
2006 306 p
FELDPAUSCH T R et al When big trees fall Damage and carbon export by reduced impact
logging in southern Amazonia Forest Ecology and Management Vol 219 pp199-215 2005
FEARNSIDE P MDesmatamento na Amazocircnia dinacircmica impactos e controle Acta Amazocircnica
vol 36 n3 pp 395-400 2006
FILGUEIRAS T S et al 1994 Caminhamento Um meacutetodo expedito para levantamentos
floriacutesticos qualitativos Caderno de Geociecircncia IBGE vol12 pp39-43 1994
Forest Management Public Summary for Gethal Amazonas SA Induacutestria de Madeira
Compensada Certification Code SW-FMCOC-119 Date of Certification October 1
2000 Date of Public Summary October 2000 Updated for Annual Audit 2002 Annual Audit
2003 (Gethalpdf)
Globo Rural Linha de financiamento para a agricultura de baixo carbono tem pouca procura
2011 Disponiacutevel em httpwwwrainforest-allianceorgforestrydocumentsgethalpdf
Acesso em 16 de nov 2013
GREENPEACE Face a Face com a Destruiccedilatildeo Relatoacuterio Greenpeace sobre as companhias
multinacionais madeireiras na Amazocircnia Brasileira 1999 Disponiacutevel em
MONITORING amp IMPLEMENTATION REPORT VCS Version 3 CCB Standards Third Edition
v30 47
lthttpwwwgreenpeaceorgbramazoniaface_destruicaopdfgt Acesso em 11 de set
2013
Governo do Estado do Amazonas Plano de Gestao da RDS do Rio Amapaacute 2010 Disponiacutevel em
httpobservatoriowwforgbrsite_mediauploadgestaoplanoManejorio_amapapdf Acesso
em 24 de ago 2013
HDOM Estimates from processing the forest inventories data carried out during the CADAF
Project Final Technical Report 2012 Disponiacutevel em wwwhdomcombr Acesso em 27 de
maio 2013
HIGUCHI N 1986-87 Amostragem sistemaacutetica versus amostragem aleatoacuteria em floresta tropical
uacutemida de terra-firme na regiatildeo de Manaus Acta Amazonica 1617 (uacutenico) 393-400
HIGUCHI N SANTOS J JARDIM FCS Tamanho de parcela amostral para inventaacuterios
florestais Acta Amazocircnica vol12 n1 pp91-103 1982
HIGUCHI F G PINTO A C M ISHIZUKA M KAJIMOTO T LIMA A J N SANTOS J
HIGUCHI N Estoque e dinacircmica de biomassa acima do solo das florestas de terra firme do
estado do Amazonas In Adriano Joseacute Nogueira Lima Flaacutevia Machado Durgante Moacir
Alberto Assis Campos Joaquim dos Santos Moriyoshi Ishizuka Niro Higuchi (Org)
Dinacircmica do carbono das florestas da Amazocircnia resultados do Projeto CADAF
1edManaus INPA 2014 v 1 p 29-34
HOLMES T P etal Custos e benefiacutecios financeiros da exploraccedilatildeo de impacto reduzido em
comparaccedilatildeo agrave exploraccedilatildeo florestal convencional na Amazocircnia oriental 2ordf ed Beleacutem
Fundaccedilatildeo Floresta Tropical 2002 66p
HUSCH B MILLER C I BEERS T W Forest mensuration New York Ronald Press 1971
HUSCH B MILLER C I BEERS T W Forest Mensuration New York John Wiley amp Sons
2nd
ed 1972 402 p
MONITORING amp IMPLEMENTATION REPORT VCS Version 3 CCB Standards Third Edition
v30 48
IBGE Instituto Brasileiro de Geografia e Estatiacutestica Diretoria de GeociecircnciasCoordenaccedilatildeo de
Recursos Naturais e Estudos Ambientais Geologia Solos Hidrografia e Vegetaccedilatildeo 2000
IBGE Instituto Brasileiro de Geografia e Estatiacutestica Manicoreacute 2010 Disponiacutevel
emlthttpwwwsidraibgegovbrgt Acesso em 05 de set 2013
IBGE Instituto Brasileiro de Geografia e Estatiacutestica 2011 Disponiacutevel em httpwwwibgegovbr
Acesso em 19 de mar 2013
IBGE Instituto Brasileiro de Geografia e Estatiacutestica Extraccedilatildeo vegetal e silvicultura para o
municiacutepio de Manicoreacute 2011 Disponiacutevel em
lthttpcidadesibgegovbrxtrastemasphplang=ampcodmun=130270ampidtema=102ampsearch=a
mazonas|manicore|extracao-vegetal-e-silvicultura-2011gt Acesso em 10 de out 2013
IBGE Instituto Brasileiro de Geografia e Estatiacutestica Censo Demograacutefico 2010 Disponiacutevel em
lthttpcidadesibgegovbrxtrastemasphpcodmun=130270ampidtema=116gt Acesso em 18
de out 2013
IBGE Instituto Brasileiro de Geografia e Estatiacutestica Censo Demograacutefico 2010 Disponiacutevel
emlthttpcidadesibgegovbrxtrashomephpgt Acesso em 08 de out 2013
IDESAM Reduccedilotildees de Emissotildees do Desmatamento e Degradaccedilatildeo Florestal (REDD+) estudo de
oportunidades para a regiatildeo sul do Amazonas CENAMO M Cl CARRERO G C
GANDOLFO P (Org) Manaus 2011 Disponiacutevel em
lthttpwwwobservatoriodoreddorgbrsitepdfestudodeoportunidadespdfgt Acesso em 13 de
set 2013
MONITORING amp IMPLEMENTATION REPORT VCS Version 3 CCB Standards Third Edition
v30 49
IDESAM Semeando Sustentabilidade em Apuiacute ndash Resultados e Perspectivas 2011 Manaus
Disponivel em lthttpidesamorgbrsemeando-sustentabilidade-em-apui-resultados-e-
perspectivasUxX8nfldWYI
IEA Instituto de Economia Aplicada CO2 Emissions from fuel combustion 2012 Disponiacutevel em
httpwwwieaorgco2highlightsco2highlightspdf Acesso em 09 de out 2013
IGREJA H L S CATIQUE J Anaacutelise neotectocircnica do lineamento de Itacoatiara centro leste do
Estado do Amazonas In Simpoacutesio Nacional de Estudos Tectocircnicos 6 1997 Pirenoacutepolis
Anais Pirenoacutepolis-GO SBG-Nuacutecleo Brasiacutelia1997
IMAZON Instituto do Homem e do Meio Ambiente da Amazocircnia Fatos Florestais 2010a
Disponiacutevel em httpwwwimazonorgbrpublicacoeslivrosfatos-florestais-da-amazonia-
2010-1 Acesso em 14 de out 2013
IMAZOM Instituto do Homem e do Meio Ambiente da Amazocircnia Mercado e preccedilo da madeira
amazocircnica 2010 Disponiacutevel em httpwwwimazonorgbrpublicacoesprecos-de-madeira-
em-toraboletim-de-precos-de-madeira-em-tora-na-amazonia-julho-2010at_downloadfile
Acesso em 23 de nov 2013
IMAZON Instituto do Homem e do Meio Ambiente da Amazocircnia Portal de Geoinformaccedilatildeo sobre
a Amazocircnia Disponiacutevel em lthttpwwwimazongeoorgbrimazongeophpgt Acesso em 06
de set 2013
IMAZON Instituto do Homem e do Meio Ambiente da Amazocircnia Transparecircncia florestal
Amazocircnia Legal 2012 Disponiacutevel em lthttpwwwimazonorgbrpublicacoestransparencia-
florestaltransparencia-florestal-amazonia-legalcopy_of_SADOutubro2012pdfgt Acesso em
23 de set 2013
IMAZON Instituto do Homem e do Meio Ambiente da Amazocircnia PEREIRA D SANTOS D
VEDOVETO M GIMARAtildeES J VERIacuteSSIMO A (Orgs) Fatos Florestais da Amazocircnia
Beleacutem IMAZON 2010 244p Disponiacutevel em
MONITORING amp IMPLEMENTATION REPORT VCS Version 3 CCB Standards Third Edition
v30 50
lthttpwwwimazonorgbrpublicacoeslivrosfatos-florestais-da-amazonia-2010-1gt Acesso
em 24 de set 2013
IMAZON Instituto do Homem e do Meio Ambiente da Amazocircnia A Expansatildeo madeireira na
Amazocircnia Impactos e perspectivas para o desenvolvimento sustentaacutevel no Paraacute BARROS
AC VERIacuteSSIMO A (Eds) Beleacutem IMAZON 2002
IMAZON Instituto do Homem e do Meio Ambiente da Amazocircnia Custos e Benefiacutecios do Manejo
Florestal Para Produccedilatildeo de Madeira na Amazocircnia Oriental 1998 Disponiacutevel em
lthttpwwwimazonorgbrpublicacoesserie-amazoniacustos-e-beneficios-do-manejo-
florestal-para-producao-de-madeira-na-amazonia-orientalgt Acesso em 20 de set 2013
INPE Instituto de Pesquisas Espaciais Banco de dados PRODES 2012 Disponiacutevel em
lthttpwwwdpiinpebrprodesdigitalprodesphpgt Acesso em 09 de set 2013
INPE Instituto de Pesquisas Espaciais Banco de dados DEGRAD 2009 Disponiacutevel em
lthttpwwwobtinpebrdegradgt Acesso em 09 de set 2013
INPE Instituto de Pesquisas Espaciais Banco de dados DETER 2013 Disponiacutevel em
lthttpwwwobtinpebrdetergt Acesso em 10 de set 2013
INPE Instituto de Pesquisas Espaciais Banco de dados de queimadas e focos de calor
BDQUEIMADAS 2013 Disponiacutevel em lthttpwwwdpiinpebrproarcobdqueimadasgt
Acesso em 10 de set 2013
Instituto Carbono Brasil Soacute 2 da produccedilatildeo de madeira eacute certificada O Estado de SPaulo 2006
Disponiacutevel em lthttpwwwinstitutocarbonobrasilorgbrnoticias6noticia=119796gt Acesso
em 26 de set 2013
MONITORING amp IMPLEMENTATION REPORT VCS Version 3 CCB Standards Third Edition
v30 51
IFT Instituto Floresta Tropical Diagnoacutestico do Setor Florestal de Cotriguaccedilu Estado do Mato
Grosso 2010 Disponiacutevel em lthttpgooglEVx2RZgt Acesso em 16 de dez 2013
IPCC Guidelines for National Greenhouse Gas Inventories In National Greenhouse Gas
Inventories Programme EGGLESTON HS BUENDIA L MIWA K NGARA T TANABE
K (Eds) Japan IGES 2006
ITTO Annual review and assessment of the world timber situation 2011 Disponivel em
httpwwwittointannual_review Acesso em 10 de out 2013
KELLER M et al Coarse woody debris in undisturbed and logged forests in the eastern Brazilian
Amazon Global Change Biology vol10 PP784-795 2004
LENTINI M VERISSIMO A PEREIRA D A expansatildeo madeireira na Amazocircnia O Estado da
Amazocircnia n2 2005 Beleacutem IMAZON Disponiacutevel em
httpwwwimazonorgbruploadea_2ppdf Acesso em 06 de set 2013
LOETSCH F ZOumlHRER F HALLER K E Forest Inventory Munich BLV Verlagsgesellschaft
2nd
edition Vol II 1973 469 p
MAGNUSSON WE et al RAPELD uma modificaccedilatildeo do meacutetodo de Gentry para inventaacuterios de
biodiversidade em siacutetios para pesquisa ecoloacutegica de longa duraccedilatildeo Biota Neotrop JulDez
2005 vol 5 no 2 httpwwwbiotaneotropicaorgbrv5n2ptabstractpoint-of-
view+bn01005022005 ISSN 1676-0603
MARINELLI C E et al O programa de monitoramento da biodiversidade da biodiversidade e do
uso de recursos naturais em unidades de conservaccedilatildeo estaduais do Amazonas Secretaria
de Estado do Meio Ambiente e Desenvolvimento Sustentaacutevel - SDS Manaus SDS 2007
MONITORING amp IMPLEMENTATION REPORT VCS Version 3 CCB Standards Third Edition
v30 52
MARINELLI C E MALTEZ M H Indicadores de Sustentabilidade para Unidades de
Conservaccedilatildeo Documento-Siacutentese Workshop Instituto Socioambiental Brasiacutelia-DF 2010
76p
MAZZEI L et al Above-ground biomass dynamics after reduced-impact logging in the Eastern
Amazon Forest Ecology and Management vol 259 pp367-373 2010
MEIRELLES FILHO O Livro de Ouro da Amazocircnia 5ordf Ediccedilatildeo Rio de Janeiro EDIOURO 2007
422p Meirelles Filho J O Livro de Ouro da Amazocircnia 1ordf ed Editora Ediouro ISBN
8500021616 2007 450p
MENGER Juliana da Silva Fatores determinantes da distribuiccedilatildeo de aves no interfluacutevio Purus-
Madeira Manaus [sn] 2011 35 fl il
MCT Arquivos dos Fatores de Emissatildeo Disponiacutevel em
httpwwwmctgovbrindexphpcontentview321144htmlancora Acesso em 23 de out
2013
MMA Ministeacuterio do Meio Ambiente Avaliaccedilatildeo e identificaccedilatildeo de accedilotildees prioritaacuterias para a
conservaccedilatildeo utilizaccedilatildeo sustentaacutevel e reparticcedilatildeo dos benefiacutecios da biodiversidade na
Amazocircnia brasileira Brasiacutelia MMASBF 2001
MMA Ministeacuterio do Meio Ambiente Secretaria de Biodiversidade e Florestas Aacutereas Prioritaacuterias
para Conservaccedilatildeo Uso Sustentaacutevel e Reparticcedilatildeo de Benefiacutecios da Biodiversidade Brasileira
Atualizaccedilatildeo - Portaria MMA ndeg9 de 23 de janeiro de 2007 Brasiacutelia MMA 2007 (Seacuterie
Biodiversidade 31)
MONITORING amp IMPLEMENTATION REPORT VCS Version 3 CCB Standards Third Edition
v30 53
MMA Livro vermelho da fauna brasileira ameaccedilada de extinccedilatildeo editores Angelo Barbosa
Monteiro Machado Glaacuteucia Moreira Drummond Adriano Pereira Paglia 1ed 2008 Brasiacutelia
DF MMA Belo Horizonte MG Fundaccedilatildeo Biodiversitas (1420 p) il - (Biodiversidade 19)
OLIVEIRA M M HIGUCHI N CELES C H HIGUCHI F G 2014 Tamanho e formas de
parcelas para inventaacuterios florestais de espeacutecies arboacutereas na Amazocircnia Central Ciecircncia
Florestal Santa Maria v 24 n 3 p 645-653
PEARSON TRH WALKER S BROWN SL The Source Book for Land Use Land Use
Change and Forestry Projects BioCarbon Fund and Winrock International 2005 64 pp
PORTAL AMAZOcircNIA Amazocircnia de A a Z Disponiacutevel em
lthttpportalamazoniaglobocomgt Acesso em 13 de set 2013
PEacuteLLICO NETTO S BRENA D A Inventaacuterio florestal Curitiba Editorado pelos autores p
316 1997
PROJETO SIVAM Relatoacuterio metodoloacutegico de trabalho Revisatildeo 3 Diretoria de Geociecircncia Rio de
Janeiro 2002 330 pp
PROJETO SIVAM Atualizaccedilatildeo do RADAMBRASIL Mapa de Vegetacao da Amazonia Legal
Mapa de Fitofisionomias ndash RADAMSIPAM DNPM Ministeacuterio de Minas e Energia 2002
Disponiacutevel em httpwwwdpiinpebramb_dataShapefilesveg_Amz_SIPAMzip Acesso
em 21 de jan 2014
PROJETO FLORESTAL SANTA MARIA (PROJETO FSM-REDD) Plant Inteligecircncia Ambiental ndash
Warwick Manfrinato 2012 Disponiacutevel em
lthttpwwwflorestalsantamariacombrsitedocumentos57FSM_REDD_VCS_PD_ptpdfgt
Acesso em 09 de set 2013
MONITORING amp IMPLEMENTATION REPORT VCS Version 3 CCB Standards Third Edition
v30 54
RADAMBRASIL Programa de Integraccedilatildeo Nacional Levantamentos de Recursos Naturais v 14 ndash
RADAM DNPM Ministeacuterio de Minas e Energia Brasil 1974
RIBEIRO J E L et al Flora da Reserva Ducke guia de identificaccedilatildeo das plantas vasculares de
uma floresta de terra firme na Amazocircnia Central Manaus Editora INPA 1999
ROSAS F C W WALDEMARIN H de MATTOS G E Pteronura rasiliensis (Zimmermann
1780) In MACHADO A B M DRUMMOND G M PAGLIA A P (eds) Livro Vermelho da
Fauna Brasileira Ameaccedilada de Extinccedilatildeo Volume II 1ed Brasiacutelia DF Ministeacuterio do Meio
Ambiente 2008 p 800 - 801
ROSS D GHG Emissions Resulting from Aircraft Travel 2009 Disponiacutevel em
httpwwwcarbonplanetcomdownloadsFlight_Calculator_Information_v92pdf Acesso em
14 de out 2013
SANTOS A J et al Viabilidade econocircmica do sistema agroflorestal greviacutelea x cafeacute na regiatildeo
norte do Paranaacute CERNE vol6 n1 pp89-100 2000
SANTOS R A Custo do manejo florestal madeireiro estudo de caso Floresta Estadual do
Antimary Monografia (Bacharelado em Economia) ndash Departamento de Ciecircncias
Econocircmicas Universidade Federal do Acre 2007109p
SABOGAL C et al Manejo Florestal Empresarial na Amazocircnia Brasileira restriccedilotildees e
oportunidades (Relatoacuterio Siacutentese) Beleacutem CIFORIMAZON 2006 72p
SDSCEUC Secretaria Estadual de Meio Ambiente e Desenvolvimento Sustentaacutevel ndash Centro
Estadual de Unidades de Conservaccedilatildeo Programa de Monitoramento de Biodiversidade e
Uso de Recursos Naturais em Aacutereas Protegidas do Estado Amazonas (ProBUC) 2006
Disponiacutevel em
MONITORING amp IMPLEMENTATION REPORT VCS Version 3 CCB Standards Third Edition
v30 55
httpbrazilwcsorgDesktopModulesBring2mindDMXDownloadaspxEntryId=6168ampPortalI
d=93ampDownloadMethod=attachment Acesso em 11 de ago de 2013
SFBIMAZON Serviccedilo Florestal Brasileiro e Instituto do Homem e Meio Ambiente da Amazocircnia A
atividade madeireira na Amazocircnia brasileira produccedilatildeo receita e mercados 2010 Disponiacutevel
em httpwwwmmagovbrestruturassfb_arquivosmiolo_resexec_polo_03_95_1pdf
Acesso em 23 de out 2013
SILVA R P da Alometria estoque e dinacircmica da biomassa de florestas primaacuterias e
secundaacuterias na regiatildeo de Manaus (AM) 152 p Tese de Doutorado Programa Integrado
de Poacutes-graduaccedilatildeo em Biologia Tropical e Recursos Naturais (INPA) Manaus 2007
SILVA Z A G P G SANTOS R A Custo do manejo florestal madeireiro em floresta puacuteblica
estudo de caso no Acre 2011 Disponiacutevel em
lthttpwwwbasacombrbancoamazonia2Revistaedicao_13n13_custo_do_manejo_flores
pdfgt Acesso em 13 de set 2013
SMIDT M GALLAGHER T Factors Affecting Fuel Consumption and Harvesting Costs Auburn
School of Forestry and Wildlife Sciences Sd Disponiacutevel em
httpweb1cnrevteduforestrycofedocuments2013Smidt_Gallagherpdf Acesso em 21
de out 2013
SOARES-FILHO B et al Role of Brazilian Amazon protected areas in climate change mitigation
2010 Columbia University NY Ruth S DeFries 2010
SPF Serviccedilo Puacuteblico Federal DVPF Documento de venda de produto Florestal (Declaraccedilotildees de
venda Gethalpdf) 14 de julho de 2006
MONITORING amp IMPLEMENTATION REPORT VCS Version 3 CCB Standards Third Edition
v30 56
TIMOFEICZYK JUacuteNIOR R et al Rentabilidade econocircmica do manejo de baixo impacto em
florestas tropicais um estudo de caso Revista Floresta Curitiba v 38 n 4 p 711-725
outdez 2008
VCS Ferramenta para Demonstraccedilatildeo e Avaliaccedilatildeo de Adicionalidade para Atividades de Projetos
VCS em Agricultura Floresta e Outros Usos (AFOLU) 2012a Disponiacutevel em httpwwwv-c-
sorgsitesv-c-sorgfilesVT000120VCS20AFOLU20Additionality20Tool20v30pdf
Acesso em 24 de set 2013
VCS Ferramenta de Risco e Natildeo Permanecircncia (AFOLU) 2012B Disponiacutevel em httpv-c-
sorgsitesv-c-sorgfilesAFOLU20Non-Permanence20Risk20Tool2C20v32pdf
Acesso em 13 de set 2013
VCS Approved VCS Methodology VM0010 Version 10 - Methodology for Improved Forest
Management Conversion to Logged to Protected Forest Calculating GHG Benefits from
Preventing Planned Degradation PHUA S SHARMA S TELFER M CHANDLER H
(Eds) Califoacuternia EUA Carbon Planet Limited 2011149p
VERDEJO M E Diagnoacutestico Rural Participativo um guia praacutetico Brasiacutelia MDA 2006 62p
VIANNA A L M Diagnoacutestico Florestal do Estado do Amazonas 2010 e 2011 Manaus-AM
IDESAM 2013 (Relatoacuterio Final do Projeto Fortalecimento da participaccedilatildeo da sociedade civil
no Amazonas Foacuterum de Mudanccedilas Climaacuteticas Transparecircncia Florestal no Estado do
Amazonas ndash Mapeamento de Instrumentos Legislativos no Brasil)
WBCSDWRI The GHG Protocol for Project Accountin Washington World Business Council for
Sustainable DevelopmentWorld Resources Institute 2005148 p
MONITORING amp IMPLEMENTATION REPORT VCS Version 3 CCB Standards Third Edition
v30 57
WALKER W et al Guia de Campo para Estimativa de Biomassa Florestal e Estoque de Carbono
Woods Hole Center Research Falmouth Massachusetts USA 2011 Disponiacutevel em
httpwwwwhrcorgresourcesfieldguidescarbonpdfWHRC_FieldGuide_PortugueseSMpdf
Acesso em 14 de set 2013
WWF Metodologia para Avaliaccedilatildeo Raacutepida e a Priorizaccedilatildeo do Manejo de Unidades de
Conservaccedilatildeo (RAPPAM) 2010 Disponiacutevel em httpgooglXfDnxs Acesso em 30 de set
2013
WWF-Brasil Efetividade de Gestatildeo das Unidades de Conservaccedilatildeo no Estado do Amazonas
Secretaria de Estado do Meio Ambiente e do Desenvolvimento Sustentaacutevel do Amazonas
Instituto Chico Mendes de Conservaccedilatildeo da Biodiversidade Brasiacutelia WWF-Brasil 2011 72 p

MONITORING amp IMPLEMENTATION REPORT VCS Version 3 CCB Standards Third Edition
v30 47
lthttpwwwgreenpeaceorgbramazoniaface_destruicaopdfgt Acesso em 11 de set
2013
Governo do Estado do Amazonas Plano de Gestao da RDS do Rio Amapaacute 2010 Disponiacutevel em
httpobservatoriowwforgbrsite_mediauploadgestaoplanoManejorio_amapapdf Acesso
em 24 de ago 2013
HDOM Estimates from processing the forest inventories data carried out during the CADAF
Project Final Technical Report 2012 Disponiacutevel em wwwhdomcombr Acesso em 27 de
maio 2013
HIGUCHI N 1986-87 Amostragem sistemaacutetica versus amostragem aleatoacuteria em floresta tropical
uacutemida de terra-firme na regiatildeo de Manaus Acta Amazonica 1617 (uacutenico) 393-400
HIGUCHI N SANTOS J JARDIM FCS Tamanho de parcela amostral para inventaacuterios
florestais Acta Amazocircnica vol12 n1 pp91-103 1982
HIGUCHI F G PINTO A C M ISHIZUKA M KAJIMOTO T LIMA A J N SANTOS J
HIGUCHI N Estoque e dinacircmica de biomassa acima do solo das florestas de terra firme do
estado do Amazonas In Adriano Joseacute Nogueira Lima Flaacutevia Machado Durgante Moacir
Alberto Assis Campos Joaquim dos Santos Moriyoshi Ishizuka Niro Higuchi (Org)
Dinacircmica do carbono das florestas da Amazocircnia resultados do Projeto CADAF
1edManaus INPA 2014 v 1 p 29-34
HOLMES T P etal Custos e benefiacutecios financeiros da exploraccedilatildeo de impacto reduzido em
comparaccedilatildeo agrave exploraccedilatildeo florestal convencional na Amazocircnia oriental 2ordf ed Beleacutem
Fundaccedilatildeo Floresta Tropical 2002 66p
HUSCH B MILLER C I BEERS T W Forest mensuration New York Ronald Press 1971
HUSCH B MILLER C I BEERS T W Forest Mensuration New York John Wiley amp Sons
2nd
ed 1972 402 p
MONITORING amp IMPLEMENTATION REPORT VCS Version 3 CCB Standards Third Edition
v30 48
IBGE Instituto Brasileiro de Geografia e Estatiacutestica Diretoria de GeociecircnciasCoordenaccedilatildeo de
Recursos Naturais e Estudos Ambientais Geologia Solos Hidrografia e Vegetaccedilatildeo 2000
IBGE Instituto Brasileiro de Geografia e Estatiacutestica Manicoreacute 2010 Disponiacutevel
emlthttpwwwsidraibgegovbrgt Acesso em 05 de set 2013
IBGE Instituto Brasileiro de Geografia e Estatiacutestica 2011 Disponiacutevel em httpwwwibgegovbr
Acesso em 19 de mar 2013
IBGE Instituto Brasileiro de Geografia e Estatiacutestica Extraccedilatildeo vegetal e silvicultura para o
municiacutepio de Manicoreacute 2011 Disponiacutevel em
lthttpcidadesibgegovbrxtrastemasphplang=ampcodmun=130270ampidtema=102ampsearch=a
mazonas|manicore|extracao-vegetal-e-silvicultura-2011gt Acesso em 10 de out 2013
IBGE Instituto Brasileiro de Geografia e Estatiacutestica Censo Demograacutefico 2010 Disponiacutevel em
lthttpcidadesibgegovbrxtrastemasphpcodmun=130270ampidtema=116gt Acesso em 18
de out 2013
IBGE Instituto Brasileiro de Geografia e Estatiacutestica Censo Demograacutefico 2010 Disponiacutevel
emlthttpcidadesibgegovbrxtrashomephpgt Acesso em 08 de out 2013
IDESAM Reduccedilotildees de Emissotildees do Desmatamento e Degradaccedilatildeo Florestal (REDD+) estudo de
oportunidades para a regiatildeo sul do Amazonas CENAMO M Cl CARRERO G C
GANDOLFO P (Org) Manaus 2011 Disponiacutevel em
lthttpwwwobservatoriodoreddorgbrsitepdfestudodeoportunidadespdfgt Acesso em 13 de
set 2013
MONITORING amp IMPLEMENTATION REPORT VCS Version 3 CCB Standards Third Edition
v30 49
IDESAM Semeando Sustentabilidade em Apuiacute ndash Resultados e Perspectivas 2011 Manaus
Disponivel em lthttpidesamorgbrsemeando-sustentabilidade-em-apui-resultados-e-
perspectivasUxX8nfldWYI
IEA Instituto de Economia Aplicada CO2 Emissions from fuel combustion 2012 Disponiacutevel em
httpwwwieaorgco2highlightsco2highlightspdf Acesso em 09 de out 2013
IGREJA H L S CATIQUE J Anaacutelise neotectocircnica do lineamento de Itacoatiara centro leste do
Estado do Amazonas In Simpoacutesio Nacional de Estudos Tectocircnicos 6 1997 Pirenoacutepolis
Anais Pirenoacutepolis-GO SBG-Nuacutecleo Brasiacutelia1997
IMAZON Instituto do Homem e do Meio Ambiente da Amazocircnia Fatos Florestais 2010a
Disponiacutevel em httpwwwimazonorgbrpublicacoeslivrosfatos-florestais-da-amazonia-
2010-1 Acesso em 14 de out 2013
IMAZOM Instituto do Homem e do Meio Ambiente da Amazocircnia Mercado e preccedilo da madeira
amazocircnica 2010 Disponiacutevel em httpwwwimazonorgbrpublicacoesprecos-de-madeira-
em-toraboletim-de-precos-de-madeira-em-tora-na-amazonia-julho-2010at_downloadfile
Acesso em 23 de nov 2013
IMAZON Instituto do Homem e do Meio Ambiente da Amazocircnia Portal de Geoinformaccedilatildeo sobre
a Amazocircnia Disponiacutevel em lthttpwwwimazongeoorgbrimazongeophpgt Acesso em 06
de set 2013
IMAZON Instituto do Homem e do Meio Ambiente da Amazocircnia Transparecircncia florestal
Amazocircnia Legal 2012 Disponiacutevel em lthttpwwwimazonorgbrpublicacoestransparencia-
florestaltransparencia-florestal-amazonia-legalcopy_of_SADOutubro2012pdfgt Acesso em
23 de set 2013
IMAZON Instituto do Homem e do Meio Ambiente da Amazocircnia PEREIRA D SANTOS D
VEDOVETO M GIMARAtildeES J VERIacuteSSIMO A (Orgs) Fatos Florestais da Amazocircnia
Beleacutem IMAZON 2010 244p Disponiacutevel em
MONITORING amp IMPLEMENTATION REPORT VCS Version 3 CCB Standards Third Edition
v30 50
lthttpwwwimazonorgbrpublicacoeslivrosfatos-florestais-da-amazonia-2010-1gt Acesso
em 24 de set 2013
IMAZON Instituto do Homem e do Meio Ambiente da Amazocircnia A Expansatildeo madeireira na
Amazocircnia Impactos e perspectivas para o desenvolvimento sustentaacutevel no Paraacute BARROS
AC VERIacuteSSIMO A (Eds) Beleacutem IMAZON 2002
IMAZON Instituto do Homem e do Meio Ambiente da Amazocircnia Custos e Benefiacutecios do Manejo
Florestal Para Produccedilatildeo de Madeira na Amazocircnia Oriental 1998 Disponiacutevel em
lthttpwwwimazonorgbrpublicacoesserie-amazoniacustos-e-beneficios-do-manejo-
florestal-para-producao-de-madeira-na-amazonia-orientalgt Acesso em 20 de set 2013
INPE Instituto de Pesquisas Espaciais Banco de dados PRODES 2012 Disponiacutevel em
lthttpwwwdpiinpebrprodesdigitalprodesphpgt Acesso em 09 de set 2013
INPE Instituto de Pesquisas Espaciais Banco de dados DEGRAD 2009 Disponiacutevel em
lthttpwwwobtinpebrdegradgt Acesso em 09 de set 2013
INPE Instituto de Pesquisas Espaciais Banco de dados DETER 2013 Disponiacutevel em
lthttpwwwobtinpebrdetergt Acesso em 10 de set 2013
INPE Instituto de Pesquisas Espaciais Banco de dados de queimadas e focos de calor
BDQUEIMADAS 2013 Disponiacutevel em lthttpwwwdpiinpebrproarcobdqueimadasgt
Acesso em 10 de set 2013
Instituto Carbono Brasil Soacute 2 da produccedilatildeo de madeira eacute certificada O Estado de SPaulo 2006
Disponiacutevel em lthttpwwwinstitutocarbonobrasilorgbrnoticias6noticia=119796gt Acesso
em 26 de set 2013
MONITORING amp IMPLEMENTATION REPORT VCS Version 3 CCB Standards Third Edition
v30 51
IFT Instituto Floresta Tropical Diagnoacutestico do Setor Florestal de Cotriguaccedilu Estado do Mato
Grosso 2010 Disponiacutevel em lthttpgooglEVx2RZgt Acesso em 16 de dez 2013
IPCC Guidelines for National Greenhouse Gas Inventories In National Greenhouse Gas
Inventories Programme EGGLESTON HS BUENDIA L MIWA K NGARA T TANABE
K (Eds) Japan IGES 2006
ITTO Annual review and assessment of the world timber situation 2011 Disponivel em
httpwwwittointannual_review Acesso em 10 de out 2013
KELLER M et al Coarse woody debris in undisturbed and logged forests in the eastern Brazilian
Amazon Global Change Biology vol10 PP784-795 2004
LENTINI M VERISSIMO A PEREIRA D A expansatildeo madeireira na Amazocircnia O Estado da
Amazocircnia n2 2005 Beleacutem IMAZON Disponiacutevel em
httpwwwimazonorgbruploadea_2ppdf Acesso em 06 de set 2013
LOETSCH F ZOumlHRER F HALLER K E Forest Inventory Munich BLV Verlagsgesellschaft
2nd
edition Vol II 1973 469 p
MAGNUSSON WE et al RAPELD uma modificaccedilatildeo do meacutetodo de Gentry para inventaacuterios de
biodiversidade em siacutetios para pesquisa ecoloacutegica de longa duraccedilatildeo Biota Neotrop JulDez
2005 vol 5 no 2 httpwwwbiotaneotropicaorgbrv5n2ptabstractpoint-of-
view+bn01005022005 ISSN 1676-0603
MARINELLI C E et al O programa de monitoramento da biodiversidade da biodiversidade e do
uso de recursos naturais em unidades de conservaccedilatildeo estaduais do Amazonas Secretaria
de Estado do Meio Ambiente e Desenvolvimento Sustentaacutevel - SDS Manaus SDS 2007
MONITORING amp IMPLEMENTATION REPORT VCS Version 3 CCB Standards Third Edition
v30 52
MARINELLI C E MALTEZ M H Indicadores de Sustentabilidade para Unidades de
Conservaccedilatildeo Documento-Siacutentese Workshop Instituto Socioambiental Brasiacutelia-DF 2010
76p
MAZZEI L et al Above-ground biomass dynamics after reduced-impact logging in the Eastern
Amazon Forest Ecology and Management vol 259 pp367-373 2010
MEIRELLES FILHO O Livro de Ouro da Amazocircnia 5ordf Ediccedilatildeo Rio de Janeiro EDIOURO 2007
422p Meirelles Filho J O Livro de Ouro da Amazocircnia 1ordf ed Editora Ediouro ISBN
8500021616 2007 450p
MENGER Juliana da Silva Fatores determinantes da distribuiccedilatildeo de aves no interfluacutevio Purus-
Madeira Manaus [sn] 2011 35 fl il
MCT Arquivos dos Fatores de Emissatildeo Disponiacutevel em
httpwwwmctgovbrindexphpcontentview321144htmlancora Acesso em 23 de out
2013
MMA Ministeacuterio do Meio Ambiente Avaliaccedilatildeo e identificaccedilatildeo de accedilotildees prioritaacuterias para a
conservaccedilatildeo utilizaccedilatildeo sustentaacutevel e reparticcedilatildeo dos benefiacutecios da biodiversidade na
Amazocircnia brasileira Brasiacutelia MMASBF 2001
MMA Ministeacuterio do Meio Ambiente Secretaria de Biodiversidade e Florestas Aacutereas Prioritaacuterias
para Conservaccedilatildeo Uso Sustentaacutevel e Reparticcedilatildeo de Benefiacutecios da Biodiversidade Brasileira
Atualizaccedilatildeo - Portaria MMA ndeg9 de 23 de janeiro de 2007 Brasiacutelia MMA 2007 (Seacuterie
Biodiversidade 31)
MONITORING amp IMPLEMENTATION REPORT VCS Version 3 CCB Standards Third Edition
v30 53
MMA Livro vermelho da fauna brasileira ameaccedilada de extinccedilatildeo editores Angelo Barbosa
Monteiro Machado Glaacuteucia Moreira Drummond Adriano Pereira Paglia 1ed 2008 Brasiacutelia
DF MMA Belo Horizonte MG Fundaccedilatildeo Biodiversitas (1420 p) il - (Biodiversidade 19)
OLIVEIRA M M HIGUCHI N CELES C H HIGUCHI F G 2014 Tamanho e formas de
parcelas para inventaacuterios florestais de espeacutecies arboacutereas na Amazocircnia Central Ciecircncia
Florestal Santa Maria v 24 n 3 p 645-653
PEARSON TRH WALKER S BROWN SL The Source Book for Land Use Land Use
Change and Forestry Projects BioCarbon Fund and Winrock International 2005 64 pp
PORTAL AMAZOcircNIA Amazocircnia de A a Z Disponiacutevel em
lthttpportalamazoniaglobocomgt Acesso em 13 de set 2013
PEacuteLLICO NETTO S BRENA D A Inventaacuterio florestal Curitiba Editorado pelos autores p
316 1997
PROJETO SIVAM Relatoacuterio metodoloacutegico de trabalho Revisatildeo 3 Diretoria de Geociecircncia Rio de
Janeiro 2002 330 pp
PROJETO SIVAM Atualizaccedilatildeo do RADAMBRASIL Mapa de Vegetacao da Amazonia Legal
Mapa de Fitofisionomias ndash RADAMSIPAM DNPM Ministeacuterio de Minas e Energia 2002
Disponiacutevel em httpwwwdpiinpebramb_dataShapefilesveg_Amz_SIPAMzip Acesso
em 21 de jan 2014
PROJETO FLORESTAL SANTA MARIA (PROJETO FSM-REDD) Plant Inteligecircncia Ambiental ndash
Warwick Manfrinato 2012 Disponiacutevel em
lthttpwwwflorestalsantamariacombrsitedocumentos57FSM_REDD_VCS_PD_ptpdfgt
Acesso em 09 de set 2013
MONITORING amp IMPLEMENTATION REPORT VCS Version 3 CCB Standards Third Edition
v30 54
RADAMBRASIL Programa de Integraccedilatildeo Nacional Levantamentos de Recursos Naturais v 14 ndash
RADAM DNPM Ministeacuterio de Minas e Energia Brasil 1974
RIBEIRO J E L et al Flora da Reserva Ducke guia de identificaccedilatildeo das plantas vasculares de
uma floresta de terra firme na Amazocircnia Central Manaus Editora INPA 1999
ROSAS F C W WALDEMARIN H de MATTOS G E Pteronura rasiliensis (Zimmermann
1780) In MACHADO A B M DRUMMOND G M PAGLIA A P (eds) Livro Vermelho da
Fauna Brasileira Ameaccedilada de Extinccedilatildeo Volume II 1ed Brasiacutelia DF Ministeacuterio do Meio
Ambiente 2008 p 800 - 801
ROSS D GHG Emissions Resulting from Aircraft Travel 2009 Disponiacutevel em
httpwwwcarbonplanetcomdownloadsFlight_Calculator_Information_v92pdf Acesso em
14 de out 2013
SANTOS A J et al Viabilidade econocircmica do sistema agroflorestal greviacutelea x cafeacute na regiatildeo
norte do Paranaacute CERNE vol6 n1 pp89-100 2000
SANTOS R A Custo do manejo florestal madeireiro estudo de caso Floresta Estadual do
Antimary Monografia (Bacharelado em Economia) ndash Departamento de Ciecircncias
Econocircmicas Universidade Federal do Acre 2007109p
SABOGAL C et al Manejo Florestal Empresarial na Amazocircnia Brasileira restriccedilotildees e
oportunidades (Relatoacuterio Siacutentese) Beleacutem CIFORIMAZON 2006 72p
SDSCEUC Secretaria Estadual de Meio Ambiente e Desenvolvimento Sustentaacutevel ndash Centro
Estadual de Unidades de Conservaccedilatildeo Programa de Monitoramento de Biodiversidade e
Uso de Recursos Naturais em Aacutereas Protegidas do Estado Amazonas (ProBUC) 2006
Disponiacutevel em
MONITORING amp IMPLEMENTATION REPORT VCS Version 3 CCB Standards Third Edition
v30 55
httpbrazilwcsorgDesktopModulesBring2mindDMXDownloadaspxEntryId=6168ampPortalI
d=93ampDownloadMethod=attachment Acesso em 11 de ago de 2013
SFBIMAZON Serviccedilo Florestal Brasileiro e Instituto do Homem e Meio Ambiente da Amazocircnia A
atividade madeireira na Amazocircnia brasileira produccedilatildeo receita e mercados 2010 Disponiacutevel
em httpwwwmmagovbrestruturassfb_arquivosmiolo_resexec_polo_03_95_1pdf
Acesso em 23 de out 2013
SILVA R P da Alometria estoque e dinacircmica da biomassa de florestas primaacuterias e
secundaacuterias na regiatildeo de Manaus (AM) 152 p Tese de Doutorado Programa Integrado
de Poacutes-graduaccedilatildeo em Biologia Tropical e Recursos Naturais (INPA) Manaus 2007
SILVA Z A G P G SANTOS R A Custo do manejo florestal madeireiro em floresta puacuteblica
estudo de caso no Acre 2011 Disponiacutevel em
lthttpwwwbasacombrbancoamazonia2Revistaedicao_13n13_custo_do_manejo_flores
pdfgt Acesso em 13 de set 2013
SMIDT M GALLAGHER T Factors Affecting Fuel Consumption and Harvesting Costs Auburn
School of Forestry and Wildlife Sciences Sd Disponiacutevel em
httpweb1cnrevteduforestrycofedocuments2013Smidt_Gallagherpdf Acesso em 21
de out 2013
SOARES-FILHO B et al Role of Brazilian Amazon protected areas in climate change mitigation
2010 Columbia University NY Ruth S DeFries 2010
SPF Serviccedilo Puacuteblico Federal DVPF Documento de venda de produto Florestal (Declaraccedilotildees de
venda Gethalpdf) 14 de julho de 2006
MONITORING amp IMPLEMENTATION REPORT VCS Version 3 CCB Standards Third Edition
v30 56
TIMOFEICZYK JUacuteNIOR R et al Rentabilidade econocircmica do manejo de baixo impacto em
florestas tropicais um estudo de caso Revista Floresta Curitiba v 38 n 4 p 711-725
outdez 2008
VCS Ferramenta para Demonstraccedilatildeo e Avaliaccedilatildeo de Adicionalidade para Atividades de Projetos
VCS em Agricultura Floresta e Outros Usos (AFOLU) 2012a Disponiacutevel em httpwwwv-c-
sorgsitesv-c-sorgfilesVT000120VCS20AFOLU20Additionality20Tool20v30pdf
Acesso em 24 de set 2013
VCS Ferramenta de Risco e Natildeo Permanecircncia (AFOLU) 2012B Disponiacutevel em httpv-c-
sorgsitesv-c-sorgfilesAFOLU20Non-Permanence20Risk20Tool2C20v32pdf
Acesso em 13 de set 2013
VCS Approved VCS Methodology VM0010 Version 10 - Methodology for Improved Forest
Management Conversion to Logged to Protected Forest Calculating GHG Benefits from
Preventing Planned Degradation PHUA S SHARMA S TELFER M CHANDLER H
(Eds) Califoacuternia EUA Carbon Planet Limited 2011149p
VERDEJO M E Diagnoacutestico Rural Participativo um guia praacutetico Brasiacutelia MDA 2006 62p
VIANNA A L M Diagnoacutestico Florestal do Estado do Amazonas 2010 e 2011 Manaus-AM
IDESAM 2013 (Relatoacuterio Final do Projeto Fortalecimento da participaccedilatildeo da sociedade civil
no Amazonas Foacuterum de Mudanccedilas Climaacuteticas Transparecircncia Florestal no Estado do
Amazonas ndash Mapeamento de Instrumentos Legislativos no Brasil)
WBCSDWRI The GHG Protocol for Project Accountin Washington World Business Council for
Sustainable DevelopmentWorld Resources Institute 2005148 p
MONITORING amp IMPLEMENTATION REPORT VCS Version 3 CCB Standards Third Edition
v30 57
WALKER W et al Guia de Campo para Estimativa de Biomassa Florestal e Estoque de Carbono
Woods Hole Center Research Falmouth Massachusetts USA 2011 Disponiacutevel em
httpwwwwhrcorgresourcesfieldguidescarbonpdfWHRC_FieldGuide_PortugueseSMpdf
Acesso em 14 de set 2013
WWF Metodologia para Avaliaccedilatildeo Raacutepida e a Priorizaccedilatildeo do Manejo de Unidades de
Conservaccedilatildeo (RAPPAM) 2010 Disponiacutevel em httpgooglXfDnxs Acesso em 30 de set
2013
WWF-Brasil Efetividade de Gestatildeo das Unidades de Conservaccedilatildeo no Estado do Amazonas
Secretaria de Estado do Meio Ambiente e do Desenvolvimento Sustentaacutevel do Amazonas
Instituto Chico Mendes de Conservaccedilatildeo da Biodiversidade Brasiacutelia WWF-Brasil 2011 72 p
MONITORING amp IMPLEMENTATION REPORT VCS Version 3 CCB Standards Third Edition
v30 48
IBGE Instituto Brasileiro de Geografia e Estatiacutestica Diretoria de GeociecircnciasCoordenaccedilatildeo de
Recursos Naturais e Estudos Ambientais Geologia Solos Hidrografia e Vegetaccedilatildeo 2000
IBGE Instituto Brasileiro de Geografia e Estatiacutestica Manicoreacute 2010 Disponiacutevel
emlthttpwwwsidraibgegovbrgt Acesso em 05 de set 2013
IBGE Instituto Brasileiro de Geografia e Estatiacutestica 2011 Disponiacutevel em httpwwwibgegovbr
Acesso em 19 de mar 2013
IBGE Instituto Brasileiro de Geografia e Estatiacutestica Extraccedilatildeo vegetal e silvicultura para o
municiacutepio de Manicoreacute 2011 Disponiacutevel em
lthttpcidadesibgegovbrxtrastemasphplang=ampcodmun=130270ampidtema=102ampsearch=a
mazonas|manicore|extracao-vegetal-e-silvicultura-2011gt Acesso em 10 de out 2013
IBGE Instituto Brasileiro de Geografia e Estatiacutestica Censo Demograacutefico 2010 Disponiacutevel em
lthttpcidadesibgegovbrxtrastemasphpcodmun=130270ampidtema=116gt Acesso em 18
de out 2013
IBGE Instituto Brasileiro de Geografia e Estatiacutestica Censo Demograacutefico 2010 Disponiacutevel
emlthttpcidadesibgegovbrxtrashomephpgt Acesso em 08 de out 2013
IDESAM Reduccedilotildees de Emissotildees do Desmatamento e Degradaccedilatildeo Florestal (REDD+) estudo de
oportunidades para a regiatildeo sul do Amazonas CENAMO M Cl CARRERO G C
GANDOLFO P (Org) Manaus 2011 Disponiacutevel em
lthttpwwwobservatoriodoreddorgbrsitepdfestudodeoportunidadespdfgt Acesso em 13 de
set 2013
MONITORING amp IMPLEMENTATION REPORT VCS Version 3 CCB Standards Third Edition
v30 49
IDESAM Semeando Sustentabilidade em Apuiacute ndash Resultados e Perspectivas 2011 Manaus
Disponivel em lthttpidesamorgbrsemeando-sustentabilidade-em-apui-resultados-e-
perspectivasUxX8nfldWYI
IEA Instituto de Economia Aplicada CO2 Emissions from fuel combustion 2012 Disponiacutevel em
httpwwwieaorgco2highlightsco2highlightspdf Acesso em 09 de out 2013
IGREJA H L S CATIQUE J Anaacutelise neotectocircnica do lineamento de Itacoatiara centro leste do
Estado do Amazonas In Simpoacutesio Nacional de Estudos Tectocircnicos 6 1997 Pirenoacutepolis
Anais Pirenoacutepolis-GO SBG-Nuacutecleo Brasiacutelia1997
IMAZON Instituto do Homem e do Meio Ambiente da Amazocircnia Fatos Florestais 2010a
Disponiacutevel em httpwwwimazonorgbrpublicacoeslivrosfatos-florestais-da-amazonia-
2010-1 Acesso em 14 de out 2013
IMAZOM Instituto do Homem e do Meio Ambiente da Amazocircnia Mercado e preccedilo da madeira
amazocircnica 2010 Disponiacutevel em httpwwwimazonorgbrpublicacoesprecos-de-madeira-
em-toraboletim-de-precos-de-madeira-em-tora-na-amazonia-julho-2010at_downloadfile
Acesso em 23 de nov 2013
IMAZON Instituto do Homem e do Meio Ambiente da Amazocircnia Portal de Geoinformaccedilatildeo sobre
a Amazocircnia Disponiacutevel em lthttpwwwimazongeoorgbrimazongeophpgt Acesso em 06
de set 2013
IMAZON Instituto do Homem e do Meio Ambiente da Amazocircnia Transparecircncia florestal
Amazocircnia Legal 2012 Disponiacutevel em lthttpwwwimazonorgbrpublicacoestransparencia-
florestaltransparencia-florestal-amazonia-legalcopy_of_SADOutubro2012pdfgt Acesso em
23 de set 2013
IMAZON Instituto do Homem e do Meio Ambiente da Amazocircnia PEREIRA D SANTOS D
VEDOVETO M GIMARAtildeES J VERIacuteSSIMO A (Orgs) Fatos Florestais da Amazocircnia
Beleacutem IMAZON 2010 244p Disponiacutevel em
MONITORING amp IMPLEMENTATION REPORT VCS Version 3 CCB Standards Third Edition
v30 50
lthttpwwwimazonorgbrpublicacoeslivrosfatos-florestais-da-amazonia-2010-1gt Acesso
em 24 de set 2013
IMAZON Instituto do Homem e do Meio Ambiente da Amazocircnia A Expansatildeo madeireira na
Amazocircnia Impactos e perspectivas para o desenvolvimento sustentaacutevel no Paraacute BARROS
AC VERIacuteSSIMO A (Eds) Beleacutem IMAZON 2002
IMAZON Instituto do Homem e do Meio Ambiente da Amazocircnia Custos e Benefiacutecios do Manejo
Florestal Para Produccedilatildeo de Madeira na Amazocircnia Oriental 1998 Disponiacutevel em
lthttpwwwimazonorgbrpublicacoesserie-amazoniacustos-e-beneficios-do-manejo-
florestal-para-producao-de-madeira-na-amazonia-orientalgt Acesso em 20 de set 2013
INPE Instituto de Pesquisas Espaciais Banco de dados PRODES 2012 Disponiacutevel em
lthttpwwwdpiinpebrprodesdigitalprodesphpgt Acesso em 09 de set 2013
INPE Instituto de Pesquisas Espaciais Banco de dados DEGRAD 2009 Disponiacutevel em
lthttpwwwobtinpebrdegradgt Acesso em 09 de set 2013
INPE Instituto de Pesquisas Espaciais Banco de dados DETER 2013 Disponiacutevel em
lthttpwwwobtinpebrdetergt Acesso em 10 de set 2013
INPE Instituto de Pesquisas Espaciais Banco de dados de queimadas e focos de calor
BDQUEIMADAS 2013 Disponiacutevel em lthttpwwwdpiinpebrproarcobdqueimadasgt
Acesso em 10 de set 2013
Instituto Carbono Brasil Soacute 2 da produccedilatildeo de madeira eacute certificada O Estado de SPaulo 2006
Disponiacutevel em lthttpwwwinstitutocarbonobrasilorgbrnoticias6noticia=119796gt Acesso
em 26 de set 2013
MONITORING amp IMPLEMENTATION REPORT VCS Version 3 CCB Standards Third Edition
v30 51
IFT Instituto Floresta Tropical Diagnoacutestico do Setor Florestal de Cotriguaccedilu Estado do Mato
Grosso 2010 Disponiacutevel em lthttpgooglEVx2RZgt Acesso em 16 de dez 2013
IPCC Guidelines for National Greenhouse Gas Inventories In National Greenhouse Gas
Inventories Programme EGGLESTON HS BUENDIA L MIWA K NGARA T TANABE
K (Eds) Japan IGES 2006
ITTO Annual review and assessment of the world timber situation 2011 Disponivel em
httpwwwittointannual_review Acesso em 10 de out 2013
KELLER M et al Coarse woody debris in undisturbed and logged forests in the eastern Brazilian
Amazon Global Change Biology vol10 PP784-795 2004
LENTINI M VERISSIMO A PEREIRA D A expansatildeo madeireira na Amazocircnia O Estado da
Amazocircnia n2 2005 Beleacutem IMAZON Disponiacutevel em
httpwwwimazonorgbruploadea_2ppdf Acesso em 06 de set 2013
LOETSCH F ZOumlHRER F HALLER K E Forest Inventory Munich BLV Verlagsgesellschaft
2nd
edition Vol II 1973 469 p
MAGNUSSON WE et al RAPELD uma modificaccedilatildeo do meacutetodo de Gentry para inventaacuterios de
biodiversidade em siacutetios para pesquisa ecoloacutegica de longa duraccedilatildeo Biota Neotrop JulDez
2005 vol 5 no 2 httpwwwbiotaneotropicaorgbrv5n2ptabstractpoint-of-
view+bn01005022005 ISSN 1676-0603
MARINELLI C E et al O programa de monitoramento da biodiversidade da biodiversidade e do
uso de recursos naturais em unidades de conservaccedilatildeo estaduais do Amazonas Secretaria
de Estado do Meio Ambiente e Desenvolvimento Sustentaacutevel - SDS Manaus SDS 2007
MONITORING amp IMPLEMENTATION REPORT VCS Version 3 CCB Standards Third Edition
v30 52
MARINELLI C E MALTEZ M H Indicadores de Sustentabilidade para Unidades de
Conservaccedilatildeo Documento-Siacutentese Workshop Instituto Socioambiental Brasiacutelia-DF 2010
76p
MAZZEI L et al Above-ground biomass dynamics after reduced-impact logging in the Eastern
Amazon Forest Ecology and Management vol 259 pp367-373 2010
MEIRELLES FILHO O Livro de Ouro da Amazocircnia 5ordf Ediccedilatildeo Rio de Janeiro EDIOURO 2007
422p Meirelles Filho J O Livro de Ouro da Amazocircnia 1ordf ed Editora Ediouro ISBN
8500021616 2007 450p
MENGER Juliana da Silva Fatores determinantes da distribuiccedilatildeo de aves no interfluacutevio Purus-
Madeira Manaus [sn] 2011 35 fl il
MCT Arquivos dos Fatores de Emissatildeo Disponiacutevel em
httpwwwmctgovbrindexphpcontentview321144htmlancora Acesso em 23 de out
2013
MMA Ministeacuterio do Meio Ambiente Avaliaccedilatildeo e identificaccedilatildeo de accedilotildees prioritaacuterias para a
conservaccedilatildeo utilizaccedilatildeo sustentaacutevel e reparticcedilatildeo dos benefiacutecios da biodiversidade na
Amazocircnia brasileira Brasiacutelia MMASBF 2001
MMA Ministeacuterio do Meio Ambiente Secretaria de Biodiversidade e Florestas Aacutereas Prioritaacuterias
para Conservaccedilatildeo Uso Sustentaacutevel e Reparticcedilatildeo de Benefiacutecios da Biodiversidade Brasileira
Atualizaccedilatildeo - Portaria MMA ndeg9 de 23 de janeiro de 2007 Brasiacutelia MMA 2007 (Seacuterie
Biodiversidade 31)
MONITORING amp IMPLEMENTATION REPORT VCS Version 3 CCB Standards Third Edition
v30 53
MMA Livro vermelho da fauna brasileira ameaccedilada de extinccedilatildeo editores Angelo Barbosa
Monteiro Machado Glaacuteucia Moreira Drummond Adriano Pereira Paglia 1ed 2008 Brasiacutelia
DF MMA Belo Horizonte MG Fundaccedilatildeo Biodiversitas (1420 p) il - (Biodiversidade 19)
OLIVEIRA M M HIGUCHI N CELES C H HIGUCHI F G 2014 Tamanho e formas de
parcelas para inventaacuterios florestais de espeacutecies arboacutereas na Amazocircnia Central Ciecircncia
Florestal Santa Maria v 24 n 3 p 645-653
PEARSON TRH WALKER S BROWN SL The Source Book for Land Use Land Use
Change and Forestry Projects BioCarbon Fund and Winrock International 2005 64 pp
PORTAL AMAZOcircNIA Amazocircnia de A a Z Disponiacutevel em
lthttpportalamazoniaglobocomgt Acesso em 13 de set 2013
PEacuteLLICO NETTO S BRENA D A Inventaacuterio florestal Curitiba Editorado pelos autores p
316 1997
PROJETO SIVAM Relatoacuterio metodoloacutegico de trabalho Revisatildeo 3 Diretoria de Geociecircncia Rio de
Janeiro 2002 330 pp
PROJETO SIVAM Atualizaccedilatildeo do RADAMBRASIL Mapa de Vegetacao da Amazonia Legal
Mapa de Fitofisionomias ndash RADAMSIPAM DNPM Ministeacuterio de Minas e Energia 2002
Disponiacutevel em httpwwwdpiinpebramb_dataShapefilesveg_Amz_SIPAMzip Acesso
em 21 de jan 2014
PROJETO FLORESTAL SANTA MARIA (PROJETO FSM-REDD) Plant Inteligecircncia Ambiental ndash
Warwick Manfrinato 2012 Disponiacutevel em
lthttpwwwflorestalsantamariacombrsitedocumentos57FSM_REDD_VCS_PD_ptpdfgt
Acesso em 09 de set 2013
MONITORING amp IMPLEMENTATION REPORT VCS Version 3 CCB Standards Third Edition
v30 54
RADAMBRASIL Programa de Integraccedilatildeo Nacional Levantamentos de Recursos Naturais v 14 ndash
RADAM DNPM Ministeacuterio de Minas e Energia Brasil 1974
RIBEIRO J E L et al Flora da Reserva Ducke guia de identificaccedilatildeo das plantas vasculares de
uma floresta de terra firme na Amazocircnia Central Manaus Editora INPA 1999
ROSAS F C W WALDEMARIN H de MATTOS G E Pteronura rasiliensis (Zimmermann
1780) In MACHADO A B M DRUMMOND G M PAGLIA A P (eds) Livro Vermelho da
Fauna Brasileira Ameaccedilada de Extinccedilatildeo Volume II 1ed Brasiacutelia DF Ministeacuterio do Meio
Ambiente 2008 p 800 - 801
ROSS D GHG Emissions Resulting from Aircraft Travel 2009 Disponiacutevel em
httpwwwcarbonplanetcomdownloadsFlight_Calculator_Information_v92pdf Acesso em
14 de out 2013
SANTOS A J et al Viabilidade econocircmica do sistema agroflorestal greviacutelea x cafeacute na regiatildeo
norte do Paranaacute CERNE vol6 n1 pp89-100 2000
SANTOS R A Custo do manejo florestal madeireiro estudo de caso Floresta Estadual do
Antimary Monografia (Bacharelado em Economia) ndash Departamento de Ciecircncias
Econocircmicas Universidade Federal do Acre 2007109p
SABOGAL C et al Manejo Florestal Empresarial na Amazocircnia Brasileira restriccedilotildees e
oportunidades (Relatoacuterio Siacutentese) Beleacutem CIFORIMAZON 2006 72p
SDSCEUC Secretaria Estadual de Meio Ambiente e Desenvolvimento Sustentaacutevel ndash Centro
Estadual de Unidades de Conservaccedilatildeo Programa de Monitoramento de Biodiversidade e
Uso de Recursos Naturais em Aacutereas Protegidas do Estado Amazonas (ProBUC) 2006
Disponiacutevel em
MONITORING amp IMPLEMENTATION REPORT VCS Version 3 CCB Standards Third Edition
v30 55
httpbrazilwcsorgDesktopModulesBring2mindDMXDownloadaspxEntryId=6168ampPortalI
d=93ampDownloadMethod=attachment Acesso em 11 de ago de 2013
SFBIMAZON Serviccedilo Florestal Brasileiro e Instituto do Homem e Meio Ambiente da Amazocircnia A
atividade madeireira na Amazocircnia brasileira produccedilatildeo receita e mercados 2010 Disponiacutevel
em httpwwwmmagovbrestruturassfb_arquivosmiolo_resexec_polo_03_95_1pdf
Acesso em 23 de out 2013
SILVA R P da Alometria estoque e dinacircmica da biomassa de florestas primaacuterias e
secundaacuterias na regiatildeo de Manaus (AM) 152 p Tese de Doutorado Programa Integrado
de Poacutes-graduaccedilatildeo em Biologia Tropical e Recursos Naturais (INPA) Manaus 2007
SILVA Z A G P G SANTOS R A Custo do manejo florestal madeireiro em floresta puacuteblica
estudo de caso no Acre 2011 Disponiacutevel em
lthttpwwwbasacombrbancoamazonia2Revistaedicao_13n13_custo_do_manejo_flores
pdfgt Acesso em 13 de set 2013
SMIDT M GALLAGHER T Factors Affecting Fuel Consumption and Harvesting Costs Auburn
School of Forestry and Wildlife Sciences Sd Disponiacutevel em
httpweb1cnrevteduforestrycofedocuments2013Smidt_Gallagherpdf Acesso em 21
de out 2013
SOARES-FILHO B et al Role of Brazilian Amazon protected areas in climate change mitigation
2010 Columbia University NY Ruth S DeFries 2010
SPF Serviccedilo Puacuteblico Federal DVPF Documento de venda de produto Florestal (Declaraccedilotildees de
venda Gethalpdf) 14 de julho de 2006
MONITORING amp IMPLEMENTATION REPORT VCS Version 3 CCB Standards Third Edition
v30 56
TIMOFEICZYK JUacuteNIOR R et al Rentabilidade econocircmica do manejo de baixo impacto em
florestas tropicais um estudo de caso Revista Floresta Curitiba v 38 n 4 p 711-725
outdez 2008
VCS Ferramenta para Demonstraccedilatildeo e Avaliaccedilatildeo de Adicionalidade para Atividades de Projetos
VCS em Agricultura Floresta e Outros Usos (AFOLU) 2012a Disponiacutevel em httpwwwv-c-
sorgsitesv-c-sorgfilesVT000120VCS20AFOLU20Additionality20Tool20v30pdf
Acesso em 24 de set 2013
VCS Ferramenta de Risco e Natildeo Permanecircncia (AFOLU) 2012B Disponiacutevel em httpv-c-
sorgsitesv-c-sorgfilesAFOLU20Non-Permanence20Risk20Tool2C20v32pdf
Acesso em 13 de set 2013
VCS Approved VCS Methodology VM0010 Version 10 - Methodology for Improved Forest
Management Conversion to Logged to Protected Forest Calculating GHG Benefits from
Preventing Planned Degradation PHUA S SHARMA S TELFER M CHANDLER H
(Eds) Califoacuternia EUA Carbon Planet Limited 2011149p
VERDEJO M E Diagnoacutestico Rural Participativo um guia praacutetico Brasiacutelia MDA 2006 62p
VIANNA A L M Diagnoacutestico Florestal do Estado do Amazonas 2010 e 2011 Manaus-AM
IDESAM 2013 (Relatoacuterio Final do Projeto Fortalecimento da participaccedilatildeo da sociedade civil
no Amazonas Foacuterum de Mudanccedilas Climaacuteticas Transparecircncia Florestal no Estado do
Amazonas ndash Mapeamento de Instrumentos Legislativos no Brasil)
WBCSDWRI The GHG Protocol for Project Accountin Washington World Business Council for
Sustainable DevelopmentWorld Resources Institute 2005148 p
MONITORING amp IMPLEMENTATION REPORT VCS Version 3 CCB Standards Third Edition
v30 57
WALKER W et al Guia de Campo para Estimativa de Biomassa Florestal e Estoque de Carbono
Woods Hole Center Research Falmouth Massachusetts USA 2011 Disponiacutevel em
httpwwwwhrcorgresourcesfieldguidescarbonpdfWHRC_FieldGuide_PortugueseSMpdf
Acesso em 14 de set 2013
WWF Metodologia para Avaliaccedilatildeo Raacutepida e a Priorizaccedilatildeo do Manejo de Unidades de
Conservaccedilatildeo (RAPPAM) 2010 Disponiacutevel em httpgooglXfDnxs Acesso em 30 de set
2013
WWF-Brasil Efetividade de Gestatildeo das Unidades de Conservaccedilatildeo no Estado do Amazonas
Secretaria de Estado do Meio Ambiente e do Desenvolvimento Sustentaacutevel do Amazonas
Instituto Chico Mendes de Conservaccedilatildeo da Biodiversidade Brasiacutelia WWF-Brasil 2011 72 p

MONITORING amp IMPLEMENTATION REPORT VCS Version 3 CCB Standards Third Edition
v30 51
IFT Instituto Floresta Tropical Diagnoacutestico do Setor Florestal de Cotriguaccedilu Estado do Mato
Grosso 2010 Disponiacutevel em lthttpgooglEVx2RZgt Acesso em 16 de dez 2013
IPCC Guidelines for National Greenhouse Gas Inventories In National Greenhouse Gas
Inventories Programme EGGLESTON HS BUENDIA L MIWA K NGARA T TANABE
K (Eds) Japan IGES 2006
ITTO Annual review and assessment of the world timber situation 2011 Disponivel em
httpwwwittointannual_review Acesso em 10 de out 2013
KELLER M et al Coarse woody debris in undisturbed and logged forests in the eastern Brazilian
Amazon Global Change Biology vol10 PP784-795 2004
LENTINI M VERISSIMO A PEREIRA D A expansatildeo madeireira na Amazocircnia O Estado da
Amazocircnia n2 2005 Beleacutem IMAZON Disponiacutevel em
httpwwwimazonorgbruploadea_2ppdf Acesso em 06 de set 2013
LOETSCH F ZOumlHRER F HALLER K E Forest Inventory Munich BLV Verlagsgesellschaft
2nd
edition Vol II 1973 469 p
MAGNUSSON WE et al RAPELD uma modificaccedilatildeo do meacutetodo de Gentry para inventaacuterios de
biodiversidade em siacutetios para pesquisa ecoloacutegica de longa duraccedilatildeo Biota Neotrop JulDez
2005 vol 5 no 2 httpwwwbiotaneotropicaorgbrv5n2ptabstractpoint-of-
view+bn01005022005 ISSN 1676-0603
MARINELLI C E et al O programa de monitoramento da biodiversidade da biodiversidade e do
uso de recursos naturais em unidades de conservaccedilatildeo estaduais do Amazonas Secretaria
de Estado do Meio Ambiente e Desenvolvimento Sustentaacutevel - SDS Manaus SDS 2007
MONITORING amp IMPLEMENTATION REPORT VCS Version 3 CCB Standards Third Edition
v30 52
MARINELLI C E MALTEZ M H Indicadores de Sustentabilidade para Unidades de
Conservaccedilatildeo Documento-Siacutentese Workshop Instituto Socioambiental Brasiacutelia-DF 2010
76p
MAZZEI L et al Above-ground biomass dynamics after reduced-impact logging in the Eastern
Amazon Forest Ecology and Management vol 259 pp367-373 2010
MEIRELLES FILHO O Livro de Ouro da Amazocircnia 5ordf Ediccedilatildeo Rio de Janeiro EDIOURO 2007
422p Meirelles Filho J O Livro de Ouro da Amazocircnia 1ordf ed Editora Ediouro ISBN
8500021616 2007 450p
MENGER Juliana da Silva Fatores determinantes da distribuiccedilatildeo de aves no interfluacutevio Purus-
Madeira Manaus [sn] 2011 35 fl il
MCT Arquivos dos Fatores de Emissatildeo Disponiacutevel em
httpwwwmctgovbrindexphpcontentview321144htmlancora Acesso em 23 de out
2013
MMA Ministeacuterio do Meio Ambiente Avaliaccedilatildeo e identificaccedilatildeo de accedilotildees prioritaacuterias para a
conservaccedilatildeo utilizaccedilatildeo sustentaacutevel e reparticcedilatildeo dos benefiacutecios da biodiversidade na
Amazocircnia brasileira Brasiacutelia MMASBF 2001
MMA Ministeacuterio do Meio Ambiente Secretaria de Biodiversidade e Florestas Aacutereas Prioritaacuterias
para Conservaccedilatildeo Uso Sustentaacutevel e Reparticcedilatildeo de Benefiacutecios da Biodiversidade Brasileira
Atualizaccedilatildeo - Portaria MMA ndeg9 de 23 de janeiro de 2007 Brasiacutelia MMA 2007 (Seacuterie
Biodiversidade 31)
MONITORING amp IMPLEMENTATION REPORT VCS Version 3 CCB Standards Third Edition
v30 53
MMA Livro vermelho da fauna brasileira ameaccedilada de extinccedilatildeo editores Angelo Barbosa
Monteiro Machado Glaacuteucia Moreira Drummond Adriano Pereira Paglia 1ed 2008 Brasiacutelia
DF MMA Belo Horizonte MG Fundaccedilatildeo Biodiversitas (1420 p) il - (Biodiversidade 19)
OLIVEIRA M M HIGUCHI N CELES C H HIGUCHI F G 2014 Tamanho e formas de
parcelas para inventaacuterios florestais de espeacutecies arboacutereas na Amazocircnia Central Ciecircncia
Florestal Santa Maria v 24 n 3 p 645-653
PEARSON TRH WALKER S BROWN SL The Source Book for Land Use Land Use
Change and Forestry Projects BioCarbon Fund and Winrock International 2005 64 pp
PORTAL AMAZOcircNIA Amazocircnia de A a Z Disponiacutevel em
lthttpportalamazoniaglobocomgt Acesso em 13 de set 2013
PEacuteLLICO NETTO S BRENA D A Inventaacuterio florestal Curitiba Editorado pelos autores p
316 1997
PROJETO SIVAM Relatoacuterio metodoloacutegico de trabalho Revisatildeo 3 Diretoria de Geociecircncia Rio de
Janeiro 2002 330 pp
PROJETO SIVAM Atualizaccedilatildeo do RADAMBRASIL Mapa de Vegetacao da Amazonia Legal
Mapa de Fitofisionomias ndash RADAMSIPAM DNPM Ministeacuterio de Minas e Energia 2002
Disponiacutevel em httpwwwdpiinpebramb_dataShapefilesveg_Amz_SIPAMzip Acesso
em 21 de jan 2014
PROJETO FLORESTAL SANTA MARIA (PROJETO FSM-REDD) Plant Inteligecircncia Ambiental ndash
Warwick Manfrinato 2012 Disponiacutevel em
lthttpwwwflorestalsantamariacombrsitedocumentos57FSM_REDD_VCS_PD_ptpdfgt
Acesso em 09 de set 2013
MONITORING amp IMPLEMENTATION REPORT VCS Version 3 CCB Standards Third Edition
v30 54
RADAMBRASIL Programa de Integraccedilatildeo Nacional Levantamentos de Recursos Naturais v 14 ndash
RADAM DNPM Ministeacuterio de Minas e Energia Brasil 1974
RIBEIRO J E L et al Flora da Reserva Ducke guia de identificaccedilatildeo das plantas vasculares de
uma floresta de terra firme na Amazocircnia Central Manaus Editora INPA 1999
ROSAS F C W WALDEMARIN H de MATTOS G E Pteronura rasiliensis (Zimmermann
1780) In MACHADO A B M DRUMMOND G M PAGLIA A P (eds) Livro Vermelho da
Fauna Brasileira Ameaccedilada de Extinccedilatildeo Volume II 1ed Brasiacutelia DF Ministeacuterio do Meio
Ambiente 2008 p 800 - 801
ROSS D GHG Emissions Resulting from Aircraft Travel 2009 Disponiacutevel em
httpwwwcarbonplanetcomdownloadsFlight_Calculator_Information_v92pdf Acesso em
14 de out 2013
SANTOS A J et al Viabilidade econocircmica do sistema agroflorestal greviacutelea x cafeacute na regiatildeo
norte do Paranaacute CERNE vol6 n1 pp89-100 2000
SANTOS R A Custo do manejo florestal madeireiro estudo de caso Floresta Estadual do
Antimary Monografia (Bacharelado em Economia) ndash Departamento de Ciecircncias
Econocircmicas Universidade Federal do Acre 2007109p
SABOGAL C et al Manejo Florestal Empresarial na Amazocircnia Brasileira restriccedilotildees e
oportunidades (Relatoacuterio Siacutentese) Beleacutem CIFORIMAZON 2006 72p
SDSCEUC Secretaria Estadual de Meio Ambiente e Desenvolvimento Sustentaacutevel ndash Centro
Estadual de Unidades de Conservaccedilatildeo Programa de Monitoramento de Biodiversidade e
Uso de Recursos Naturais em Aacutereas Protegidas do Estado Amazonas (ProBUC) 2006
Disponiacutevel em
MONITORING amp IMPLEMENTATION REPORT VCS Version 3 CCB Standards Third Edition
v30 55
httpbrazilwcsorgDesktopModulesBring2mindDMXDownloadaspxEntryId=6168ampPortalI
d=93ampDownloadMethod=attachment Acesso em 11 de ago de 2013
SFBIMAZON Serviccedilo Florestal Brasileiro e Instituto do Homem e Meio Ambiente da Amazocircnia A
atividade madeireira na Amazocircnia brasileira produccedilatildeo receita e mercados 2010 Disponiacutevel
em httpwwwmmagovbrestruturassfb_arquivosmiolo_resexec_polo_03_95_1pdf
Acesso em 23 de out 2013
SILVA R P da Alometria estoque e dinacircmica da biomassa de florestas primaacuterias e
secundaacuterias na regiatildeo de Manaus (AM) 152 p Tese de Doutorado Programa Integrado
de Poacutes-graduaccedilatildeo em Biologia Tropical e Recursos Naturais (INPA) Manaus 2007
SILVA Z A G P G SANTOS R A Custo do manejo florestal madeireiro em floresta puacuteblica
estudo de caso no Acre 2011 Disponiacutevel em
lthttpwwwbasacombrbancoamazonia2Revistaedicao_13n13_custo_do_manejo_flores
pdfgt Acesso em 13 de set 2013
SMIDT M GALLAGHER T Factors Affecting Fuel Consumption and Harvesting Costs Auburn
School of Forestry and Wildlife Sciences Sd Disponiacutevel em
httpweb1cnrevteduforestrycofedocuments2013Smidt_Gallagherpdf Acesso em 21
de out 2013
SOARES-FILHO B et al Role of Brazilian Amazon protected areas in climate change mitigation
2010 Columbia University NY Ruth S DeFries 2010
SPF Serviccedilo Puacuteblico Federal DVPF Documento de venda de produto Florestal (Declaraccedilotildees de
venda Gethalpdf) 14 de julho de 2006
MONITORING amp IMPLEMENTATION REPORT VCS Version 3 CCB Standards Third Edition
v30 56
TIMOFEICZYK JUacuteNIOR R et al Rentabilidade econocircmica do manejo de baixo impacto em
florestas tropicais um estudo de caso Revista Floresta Curitiba v 38 n 4 p 711-725
outdez 2008
VCS Ferramenta para Demonstraccedilatildeo e Avaliaccedilatildeo de Adicionalidade para Atividades de Projetos
VCS em Agricultura Floresta e Outros Usos (AFOLU) 2012a Disponiacutevel em httpwwwv-c-
sorgsitesv-c-sorgfilesVT000120VCS20AFOLU20Additionality20Tool20v30pdf
Acesso em 24 de set 2013
VCS Ferramenta de Risco e Natildeo Permanecircncia (AFOLU) 2012B Disponiacutevel em httpv-c-
sorgsitesv-c-sorgfilesAFOLU20Non-Permanence20Risk20Tool2C20v32pdf
Acesso em 13 de set 2013
VCS Approved VCS Methodology VM0010 Version 10 - Methodology for Improved Forest
Management Conversion to Logged to Protected Forest Calculating GHG Benefits from
Preventing Planned Degradation PHUA S SHARMA S TELFER M CHANDLER H
(Eds) Califoacuternia EUA Carbon Planet Limited 2011149p
VERDEJO M E Diagnoacutestico Rural Participativo um guia praacutetico Brasiacutelia MDA 2006 62p
VIANNA A L M Diagnoacutestico Florestal do Estado do Amazonas 2010 e 2011 Manaus-AM
IDESAM 2013 (Relatoacuterio Final do Projeto Fortalecimento da participaccedilatildeo da sociedade civil
no Amazonas Foacuterum de Mudanccedilas Climaacuteticas Transparecircncia Florestal no Estado do
Amazonas ndash Mapeamento de Instrumentos Legislativos no Brasil)
WBCSDWRI The GHG Protocol for Project Accountin Washington World Business Council for
Sustainable DevelopmentWorld Resources Institute 2005148 p
MONITORING amp IMPLEMENTATION REPORT VCS Version 3 CCB Standards Third Edition
v30 57
WALKER W et al Guia de Campo para Estimativa de Biomassa Florestal e Estoque de Carbono
Woods Hole Center Research Falmouth Massachusetts USA 2011 Disponiacutevel em
httpwwwwhrcorgresourcesfieldguidescarbonpdfWHRC_FieldGuide_PortugueseSMpdf
Acesso em 14 de set 2013
WWF Metodologia para Avaliaccedilatildeo Raacutepida e a Priorizaccedilatildeo do Manejo de Unidades de
Conservaccedilatildeo (RAPPAM) 2010 Disponiacutevel em httpgooglXfDnxs Acesso em 30 de set
2013
WWF-Brasil Efetividade de Gestatildeo das Unidades de Conservaccedilatildeo no Estado do Amazonas
Secretaria de Estado do Meio Ambiente e do Desenvolvimento Sustentaacutevel do Amazonas
Instituto Chico Mendes de Conservaccedilatildeo da Biodiversidade Brasiacutelia WWF-Brasil 2011 72 p
MONITORING amp IMPLEMENTATION REPORT VCS Version 3 CCB Standards Third Edition
v30 52
MARINELLI C E MALTEZ M H Indicadores de Sustentabilidade para Unidades de
Conservaccedilatildeo Documento-Siacutentese Workshop Instituto Socioambiental Brasiacutelia-DF 2010
76p
MAZZEI L et al Above-ground biomass dynamics after reduced-impact logging in the Eastern
Amazon Forest Ecology and Management vol 259 pp367-373 2010
MEIRELLES FILHO O Livro de Ouro da Amazocircnia 5ordf Ediccedilatildeo Rio de Janeiro EDIOURO 2007
422p Meirelles Filho J O Livro de Ouro da Amazocircnia 1ordf ed Editora Ediouro ISBN
8500021616 2007 450p
MENGER Juliana da Silva Fatores determinantes da distribuiccedilatildeo de aves no interfluacutevio Purus-
Madeira Manaus [sn] 2011 35 fl il
MCT Arquivos dos Fatores de Emissatildeo Disponiacutevel em
httpwwwmctgovbrindexphpcontentview321144htmlancora Acesso em 23 de out
2013
MMA Ministeacuterio do Meio Ambiente Avaliaccedilatildeo e identificaccedilatildeo de accedilotildees prioritaacuterias para a
conservaccedilatildeo utilizaccedilatildeo sustentaacutevel e reparticcedilatildeo dos benefiacutecios da biodiversidade na
Amazocircnia brasileira Brasiacutelia MMASBF 2001
MMA Ministeacuterio do Meio Ambiente Secretaria de Biodiversidade e Florestas Aacutereas Prioritaacuterias
para Conservaccedilatildeo Uso Sustentaacutevel e Reparticcedilatildeo de Benefiacutecios da Biodiversidade Brasileira
Atualizaccedilatildeo - Portaria MMA ndeg9 de 23 de janeiro de 2007 Brasiacutelia MMA 2007 (Seacuterie
Biodiversidade 31)
MONITORING amp IMPLEMENTATION REPORT VCS Version 3 CCB Standards Third Edition
v30 53
MMA Livro vermelho da fauna brasileira ameaccedilada de extinccedilatildeo editores Angelo Barbosa
Monteiro Machado Glaacuteucia Moreira Drummond Adriano Pereira Paglia 1ed 2008 Brasiacutelia
DF MMA Belo Horizonte MG Fundaccedilatildeo Biodiversitas (1420 p) il - (Biodiversidade 19)
OLIVEIRA M M HIGUCHI N CELES C H HIGUCHI F G 2014 Tamanho e formas de
parcelas para inventaacuterios florestais de espeacutecies arboacutereas na Amazocircnia Central Ciecircncia
Florestal Santa Maria v 24 n 3 p 645-653
PEARSON TRH WALKER S BROWN SL The Source Book for Land Use Land Use
Change and Forestry Projects BioCarbon Fund and Winrock International 2005 64 pp
PORTAL AMAZOcircNIA Amazocircnia de A a Z Disponiacutevel em
lthttpportalamazoniaglobocomgt Acesso em 13 de set 2013
PEacuteLLICO NETTO S BRENA D A Inventaacuterio florestal Curitiba Editorado pelos autores p
316 1997
PROJETO SIVAM Relatoacuterio metodoloacutegico de trabalho Revisatildeo 3 Diretoria de Geociecircncia Rio de
Janeiro 2002 330 pp
PROJETO SIVAM Atualizaccedilatildeo do RADAMBRASIL Mapa de Vegetacao da Amazonia Legal
Mapa de Fitofisionomias ndash RADAMSIPAM DNPM Ministeacuterio de Minas e Energia 2002
Disponiacutevel em httpwwwdpiinpebramb_dataShapefilesveg_Amz_SIPAMzip Acesso
em 21 de jan 2014
PROJETO FLORESTAL SANTA MARIA (PROJETO FSM-REDD) Plant Inteligecircncia Ambiental ndash
Warwick Manfrinato 2012 Disponiacutevel em
lthttpwwwflorestalsantamariacombrsitedocumentos57FSM_REDD_VCS_PD_ptpdfgt
Acesso em 09 de set 2013
MONITORING amp IMPLEMENTATION REPORT VCS Version 3 CCB Standards Third Edition
v30 54
RADAMBRASIL Programa de Integraccedilatildeo Nacional Levantamentos de Recursos Naturais v 14 ndash
RADAM DNPM Ministeacuterio de Minas e Energia Brasil 1974
RIBEIRO J E L et al Flora da Reserva Ducke guia de identificaccedilatildeo das plantas vasculares de
uma floresta de terra firme na Amazocircnia Central Manaus Editora INPA 1999
ROSAS F C W WALDEMARIN H de MATTOS G E Pteronura rasiliensis (Zimmermann
1780) In MACHADO A B M DRUMMOND G M PAGLIA A P (eds) Livro Vermelho da
Fauna Brasileira Ameaccedilada de Extinccedilatildeo Volume II 1ed Brasiacutelia DF Ministeacuterio do Meio
Ambiente 2008 p 800 - 801
ROSS D GHG Emissions Resulting from Aircraft Travel 2009 Disponiacutevel em
httpwwwcarbonplanetcomdownloadsFlight_Calculator_Information_v92pdf Acesso em
14 de out 2013
SANTOS A J et al Viabilidade econocircmica do sistema agroflorestal greviacutelea x cafeacute na regiatildeo
norte do Paranaacute CERNE vol6 n1 pp89-100 2000
SANTOS R A Custo do manejo florestal madeireiro estudo de caso Floresta Estadual do
Antimary Monografia (Bacharelado em Economia) ndash Departamento de Ciecircncias
Econocircmicas Universidade Federal do Acre 2007109p
SABOGAL C et al Manejo Florestal Empresarial na Amazocircnia Brasileira restriccedilotildees e
oportunidades (Relatoacuterio Siacutentese) Beleacutem CIFORIMAZON 2006 72p
SDSCEUC Secretaria Estadual de Meio Ambiente e Desenvolvimento Sustentaacutevel ndash Centro
Estadual de Unidades de Conservaccedilatildeo Programa de Monitoramento de Biodiversidade e
Uso de Recursos Naturais em Aacutereas Protegidas do Estado Amazonas (ProBUC) 2006
Disponiacutevel em
MONITORING amp IMPLEMENTATION REPORT VCS Version 3 CCB Standards Third Edition
v30 55
httpbrazilwcsorgDesktopModulesBring2mindDMXDownloadaspxEntryId=6168ampPortalI
d=93ampDownloadMethod=attachment Acesso em 11 de ago de 2013
SFBIMAZON Serviccedilo Florestal Brasileiro e Instituto do Homem e Meio Ambiente da Amazocircnia A
atividade madeireira na Amazocircnia brasileira produccedilatildeo receita e mercados 2010 Disponiacutevel
em httpwwwmmagovbrestruturassfb_arquivosmiolo_resexec_polo_03_95_1pdf
Acesso em 23 de out 2013
SILVA R P da Alometria estoque e dinacircmica da biomassa de florestas primaacuterias e
secundaacuterias na regiatildeo de Manaus (AM) 152 p Tese de Doutorado Programa Integrado
de Poacutes-graduaccedilatildeo em Biologia Tropical e Recursos Naturais (INPA) Manaus 2007
SILVA Z A G P G SANTOS R A Custo do manejo florestal madeireiro em floresta puacuteblica
estudo de caso no Acre 2011 Disponiacutevel em
lthttpwwwbasacombrbancoamazonia2Revistaedicao_13n13_custo_do_manejo_flores
pdfgt Acesso em 13 de set 2013
SMIDT M GALLAGHER T Factors Affecting Fuel Consumption and Harvesting Costs Auburn
School of Forestry and Wildlife Sciences Sd Disponiacutevel em
httpweb1cnrevteduforestrycofedocuments2013Smidt_Gallagherpdf Acesso em 21
de out 2013
SOARES-FILHO B et al Role of Brazilian Amazon protected areas in climate change mitigation
2010 Columbia University NY Ruth S DeFries 2010
SPF Serviccedilo Puacuteblico Federal DVPF Documento de venda de produto Florestal (Declaraccedilotildees de
venda Gethalpdf) 14 de julho de 2006
MONITORING amp IMPLEMENTATION REPORT VCS Version 3 CCB Standards Third Edition
v30 56
TIMOFEICZYK JUacuteNIOR R et al Rentabilidade econocircmica do manejo de baixo impacto em
florestas tropicais um estudo de caso Revista Floresta Curitiba v 38 n 4 p 711-725
outdez 2008
VCS Ferramenta para Demonstraccedilatildeo e Avaliaccedilatildeo de Adicionalidade para Atividades de Projetos
VCS em Agricultura Floresta e Outros Usos (AFOLU) 2012a Disponiacutevel em httpwwwv-c-
sorgsitesv-c-sorgfilesVT000120VCS20AFOLU20Additionality20Tool20v30pdf
Acesso em 24 de set 2013
VCS Ferramenta de Risco e Natildeo Permanecircncia (AFOLU) 2012B Disponiacutevel em httpv-c-
sorgsitesv-c-sorgfilesAFOLU20Non-Permanence20Risk20Tool2C20v32pdf
Acesso em 13 de set 2013
VCS Approved VCS Methodology VM0010 Version 10 - Methodology for Improved Forest
Management Conversion to Logged to Protected Forest Calculating GHG Benefits from
Preventing Planned Degradation PHUA S SHARMA S TELFER M CHANDLER H
(Eds) Califoacuternia EUA Carbon Planet Limited 2011149p
VERDEJO M E Diagnoacutestico Rural Participativo um guia praacutetico Brasiacutelia MDA 2006 62p
VIANNA A L M Diagnoacutestico Florestal do Estado do Amazonas 2010 e 2011 Manaus-AM
IDESAM 2013 (Relatoacuterio Final do Projeto Fortalecimento da participaccedilatildeo da sociedade civil
no Amazonas Foacuterum de Mudanccedilas Climaacuteticas Transparecircncia Florestal no Estado do
Amazonas ndash Mapeamento de Instrumentos Legislativos no Brasil)
WBCSDWRI The GHG Protocol for Project Accountin Washington World Business Council for
Sustainable DevelopmentWorld Resources Institute 2005148 p
MONITORING amp IMPLEMENTATION REPORT VCS Version 3 CCB Standards Third Edition
v30 57
WALKER W et al Guia de Campo para Estimativa de Biomassa Florestal e Estoque de Carbono
Woods Hole Center Research Falmouth Massachusetts USA 2011 Disponiacutevel em
httpwwwwhrcorgresourcesfieldguidescarbonpdfWHRC_FieldGuide_PortugueseSMpdf
Acesso em 14 de set 2013
WWF Metodologia para Avaliaccedilatildeo Raacutepida e a Priorizaccedilatildeo do Manejo de Unidades de
Conservaccedilatildeo (RAPPAM) 2010 Disponiacutevel em httpgooglXfDnxs Acesso em 30 de set
2013
WWF-Brasil Efetividade de Gestatildeo das Unidades de Conservaccedilatildeo no Estado do Amazonas
Secretaria de Estado do Meio Ambiente e do Desenvolvimento Sustentaacutevel do Amazonas
Instituto Chico Mendes de Conservaccedilatildeo da Biodiversidade Brasiacutelia WWF-Brasil 2011 72 p

MONITORING amp IMPLEMENTATION REPORT VCS Version 3 CCB Standards Third Edition
v30 57
WALKER W et al Guia de Campo para Estimativa de Biomassa Florestal e Estoque de Carbono
Woods Hole Center Research Falmouth Massachusetts USA 2011 Disponiacutevel em
httpwwwwhrcorgresourcesfieldguidescarbonpdfWHRC_FieldGuide_PortugueseSMpdf
Acesso em 14 de set 2013
WWF Metodologia para Avaliaccedilatildeo Raacutepida e a Priorizaccedilatildeo do Manejo de Unidades de
Conservaccedilatildeo (RAPPAM) 2010 Disponiacutevel em httpgooglXfDnxs Acesso em 30 de set
2013
WWF-Brasil Efetividade de Gestatildeo das Unidades de Conservaccedilatildeo no Estado do Amazonas
Secretaria de Estado do Meio Ambiente e do Desenvolvimento Sustentaacutevel do Amazonas
Instituto Chico Mendes de Conservaccedilatildeo da Biodiversidade Brasiacutelia WWF-Brasil 2011 72 p
Related Documents


