MONITORING FUTURE NATIONAL SURVEY RESULTS ON DRUG USE 1975–2012 2012 Overview the Sponsored by The National Institute on Drug Abuse at The National Institutes of Health Key Findings on Adolescent Drug Use Lloyd D. Johnston Patrick M. O’Malley Jerald G. Bachman John E. Schulenberg

Welcome message from author
This document is posted to help you gain knowledge. Please leave a comment to let me know what you think about it! Share it to your friends and learn new things together.
Transcript
MONITORING FUTURE
NATIONAL SURVEY RESULTS ON DRUG USE
1975–2012
2012Overview
the
Sponsored by The National Institute on Drug Abuse at The National Institutes of Health
Key Findings on Adolescent Drug Use
Lloyd D. Johnston Patrick M. O’Malley Jerald G. Bachman
John E. Schulenberg
MONITORING THE FUTURE
NATIONAL RESULTS ON DRUG USE
2012 Overview Key Findings on Adolescent
Drug Use
by
Lloyd D. Johnston, Ph.D. Patrick M. O’Malley, Ph.D. Jerald G. Bachman, Ph.D.
John E. Schulenberg, Ph.D.
The University of Michigan Institute for Social Research
Sponsored by: The National Institute on Drug Abuse
National Institutes of Health
This publication was written by the principal investigators and staff of the Monitoring the Future project at the Institute for Social Research, the University of Michigan, under Research Grant No. 3 R01 DA 01411 from the National Institute on Drug Abuse. The findings and conclusions in this report are those of the authors and do not necessarily represent the views of the sponsor.
Public Domain Notice
All material appearing in this volume is in the public domain and may be reproduced or copied without permission from the authors. Citation of the source is appreciated.
Recommended Citation Johnston, L. D., O’Malley, P. M., Bachman, J. G., & Schulenberg, J. E. (2013). Monitoring the Future national results on drug use: 2012 Overview, Key Findings on Adolescent Drug Use. Ann Arbor: Institute for Social Research, The University of Michigan.
Institute for Social Research The University of Michigan
Ann Arbor, Michigan Printed February 2013
Contents
Click on any item below (in blue) to go directly to that page.
Introduction ............................................................................................................................. 1
Study Design and Methods ..................................................................................................... 3
Summary of Key Findings ..................................................................................................... 5
Specific Results by Drug
Any Illicit Drug ...................................................................................................... 10 Marijuana ............................................................................................................... 12 Synthetic Marijuana ............................................................................................... 14 Inhalants ................................................................................................................. 16 LSD ........................................................................................................................ 18 Cocaine .................................................................................................................. 20 Crack ...................................................................................................................... 22 Amphetamines ....................................................................................................... 24 Methamphetamine and Crystal Methamphetamine (Ice) ...................................... 26 Heroin .................................................................................................................... 28 Other Narcotic Drugs, Including OxyContin and Vicodin .................................... 30 Tranquilizers .......................................................................................................... 32 Sedatives (Barbiturates) ......................................................................................... 34 Ecstasy (MDMA) and Other “Club Drugs” ........................................................... 36 Alcohol .................................................................................................................. 38 Cigarettes ............................................................................................................... 40 Smokeless and Other Forms of Tobacco ............................................................... 42 Small Cigars and Tobacco Using a Hookah .......................................................... 44 Steroids .................................................................................................................. 46
Subgroup Differences ........................................................................................................... 48
Lessons Learned ................................................................................................................... 50
Tables Covering All Drugs
1. Trends in Lifetime Prevalence of Use of Various Drugs for Grades 8, 10, and 12 Combined ................................................................................................... 51
2. Trends in Annual Prevalence of Use of Various Drugs for Grades 8, 10, and 12 Combined ................................................................................................... 52 3. Trends in 30-Day Prevalence of Use of Various Drugs for Grades 8, 10,
and 12 Combined ................................................................................................... 53 4. Trends in Daily Prevalence of Use of Selected Drugs for Grades 8, 10,
and 12 Combined ................................................................................................... 54 5. Trends in Lifetime Prevalence of Use of Various Drugs in Grades 8, 10,
and 12 ..................................................................................................................... 55
Contents (continued)
6. Trends in Annual Prevalence of Use of Various Drugs in Grades 8,
10, and 12 ............................................................................................................... 59 7. Trends in 30-Day Prevalence of Use of Various Drugs in Grades 8,
10, and 12 ............................................................................................................... 64 8. Trends in 30-Day Prevalence of Daily Use of Various Drugs in Grades
8, 10, and 12 ........................................................................................................... 68 9. Trends in Harmfulness of Drugs as Perceived by 8th Graders .............................. 71
10. Trends in Harmfulness of Drugs as Perceived by 10th Graders ............................ 72 11. Trends in Harmfulness of Drugs as Perceived by 12th Graders ............................ 73 12. Trends in Disapproval of Drug Use in Grade 8 ..................................................... 76 13. Trends in Disapproval of Drug Use in Grade 10 ................................................... 77 14. Trends in Disapproval of Drug Use in Grade 12 ................................................... 78 15. Trends in Availability of Drugs as Perceived by 8th Graders ............................... 80 16. Trends in Availability of Drugs as Perceived by 10th Graders ............................. 81 17. Trends in Availability of Drugs as Perceived by 12th Graders ............................. 82
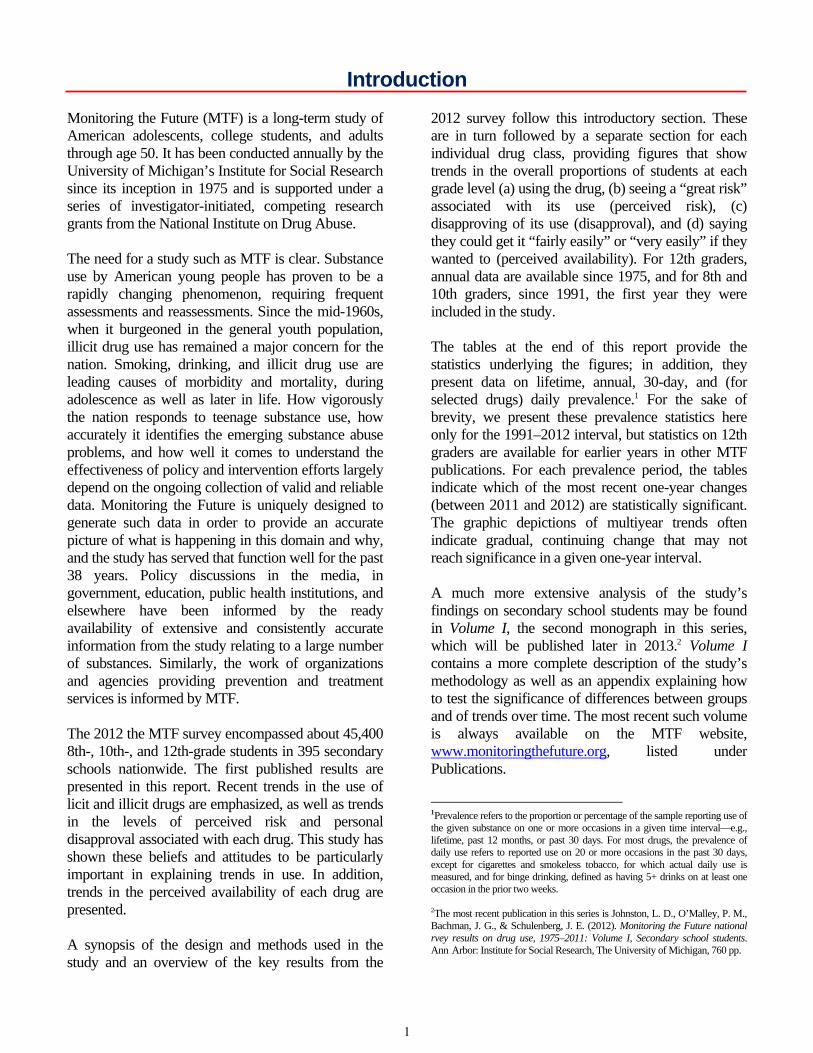
Introduction Monitoring the Future (MTF) is a long-term study of American adolescents, college students, and adults through age 50. It has been conducted annually by the University of Michigan’s Institute for Social Research since its inception in 1975 and is supported under a series of investigator-initiated, competing research grants from the National Institute on Drug Abuse. The need for a study such as MTF is clear. Substance use by American young people has proven to be a rapidly changing phenomenon, requiring frequent assessments and reassessments. Since the mid-1960s, when it burgeoned in the general youth population, illicit drug use has remained a major concern for the nation. Smoking, drinking, and illicit drug use are leading causes of morbidity and mortality, during adolescence as well as later in life. How vigorously the nation responds to teenage substance use, how accurately it identifies the emerging substance abuse problems, and how well it comes to understand the effectiveness of policy and intervention efforts largely depend on the ongoing collection of valid and reliable data. Monitoring the Future is uniquely designed to generate such data in order to provide an accurate picture of what is happening in this domain and why, and the study has served that function well for the past 38 years. Policy discussions in the media, in government, education, public health institutions, and elsewhere have been informed by the ready availability of extensive and consistently accurate information from the study relating to a large number of substances. Similarly, the work of organizations and agencies providing prevention and treatment services is informed by MTF. The 2012 the MTF survey encompassed about 45,400 8th-, 10th-, and 12th-grade students in 395 secondary schools nationwide. The first published results are presented in this report. Recent trends in the use of licit and illicit drugs are emphasized, as well as trends in the levels of perceived risk and personal disapproval associated with each drug. This study has shown these beliefs and attitudes to be particularly important in explaining trends in use. In addition, trends in the perceived availability of each drug are presented. A synopsis of the design and methods used in the study and an overview of the key results from the
2012 survey follow this introductory section. These are in turn followed by a separate section for each individual drug class, providing figures that show trends in the overall proportions of students at each grade level (a) using the drug, (b) seeing a “great risk” associated with its use (perceived risk), (c) disapproving of its use (disapproval), and (d) saying they could get it “fairly easily” or “very easily” if they wanted to (perceived availability). For 12th graders, annual data are available since 1975, and for 8th and 10th graders, since 1991, the first year they were included in the study. The tables at the end of this report provide the statistics underlying the figures; in addition, they present data on lifetime, annual, 30-day, and (for selected drugs) daily prevalence.1 For the sake of brevity, we present these prevalence statistics here only for the 1991–2012 interval, but statistics on 12th graders are available for earlier years in other MTF publications. For each prevalence period, the tables indicate which of the most recent one-year changes (between 2011 and 2012) are statistically significant. The graphic depictions of multiyear trends often indicate gradual, continuing change that may not reach significance in a given one-year interval. A much more extensive analysis of the study’s findings on secondary school students may be found in Volume I, the second monograph in this series, which will be published later in 2013.2 Volume I contains a more complete description of the study’s methodology as well as an appendix explaining how to test the significance of differences between groups and of trends over time. The most recent such volume is always available on the MTF website, www.monitoringthefuture.org, listed under Publications.
1Prevalence refers to the proportion or percentage of the sample reporting use of the given substance on one or more occasions in a given time interval—e.g., lifetime, past 12 months, or past 30 days. For most drugs, the prevalence of daily use refers to reported use on 20 or more occasions in the past 30 days, except for cigarettes and smokeless tobacco, for which actual daily use is measured, and for binge drinking, defined as having 5+ drinks on at least one occasion in the prior two weeks. 2The most recent publication in this series is Johnston, L. D., O’Malley, P. M., Bachman, J. G., & Schulenberg, J. E. (2012). Monitoring the Future national rvey results on drug use, 1975–2011: Volume I, Secondary school students. Ann Arbor: Institute for Social Research, The University of Michigan, 760 pp.
1

MTF’s findings on American college students and adults through age 55 are not covered in this early Overview report because the data from those populations become available later in the year. These findings will be covered in Volume II, the third monograph in this annual series, which will be published later in 2013.3 A fourth monograph, HIV/AIDS; Risk and Protective Behaviors Among Young Adults, dealing with national trends in HIV/AIDS-related risk and protective behaviors among young adults 21 to 35 years old, was added to
3The most recent publication in this series is: Johnston, L. D., O’Malley, P. M., Bachman, J. G., & Schulenberg, J. E. (2012). Monitoring the Future national survey results on drug use, 1975–2011: Volume II, College students & adults ages 19–50. Ann Arbor: Institute for Social Research, The University of Michigan, 314 pp.
the series in 2009.4 For the publication years prior to 2010, the volumes in these annual series are available from the NIDA Drug Publications Research Dissemination Center at 877-NIDA-NIH (877-643-2644); or by e-mail at http://drugpubs.drugabuse.gov. Beginning with the 2010 publication date, the volumes are available electronically at the MTF website. Further information on the study, including its latest press releases, a listing of all publications, and the text of many of them may be found at www.monitoringthefuture.org.
4The most recent publication in this series is: Johnston, L. D., O’Malley, P. M., Bachman, J. G., Schulenberg, J. E., & Patrick, M. E. (2012). HIV/AIDS: Risk and protective behaviors among American young adults, 2004–2011. Ann Arbor: Institute for Social Research, The University of Michigan, 114 pp.
2
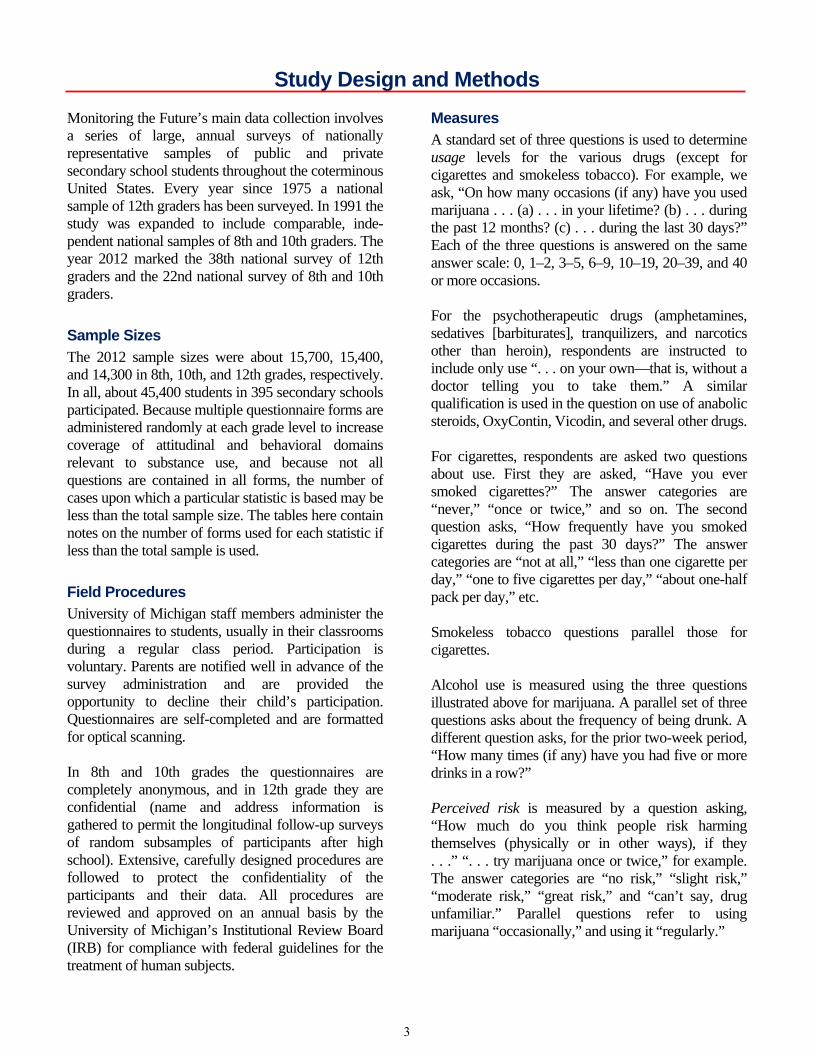
Study Design and Methods Monitoring the Future’s main data collection involves a series of large, annual surveys of nationally representative samples of public and private secondary school students throughout the coterminous United States. Every year since 1975 a national sample of 12th graders has been surveyed. In 1991 the study was expanded to include comparable, inde-pendent national samples of 8th and 10th graders. The year 2012 marked the 38th national survey of 12th graders and the 22nd national survey of 8th and 10th graders.
Sample Sizes
The 2012 sample sizes were about 15,700, 15,400, and 14,300 in 8th, 10th, and 12th grades, respectively. In all, about 45,400 students in 395 secondary schools participated. Because multiple questionnaire forms are administered randomly at each grade level to increase coverage of attitudinal and behavioral domains relevant to substance use, and because not all questions are contained in all forms, the number of cases upon which a particular statistic is based may be less than the total sample size. The tables here contain notes on the number of forms used for each statistic if less than the total sample is used.
Field Procedures
University of Michigan staff members administer the questionnaires to students, usually in their classrooms during a regular class period. Participation is voluntary. Parents are notified well in advance of the survey administration and are provided the opportunity to decline their child’s participation. Questionnaires are self-completed and are formatted for optical scanning. In 8th and 10th grades the questionnaires are completely anonymous, and in 12th grade they are confidential (name and address information is gathered to permit the longitudinal follow-up surveys of random subsamples of participants after high school). Extensive, carefully designed procedures are followed to protect the confidentiality of the participants and their data. All procedures are reviewed and approved on an annual basis by the University of Michigan’s Institutional Review Board (IRB) for compliance with federal guidelines for the treatment of human subjects.
Measures
A standard set of three questions is used to determine usage levels for the various drugs (except for cigarettes and smokeless tobacco). For example, we ask, “On how many occasions (if any) have you used marijuana . . . (a) . . . in your lifetime? (b) . . . during the past 12 months? (c) . . . during the last 30 days?” Each of the three questions is answered on the same answer scale: 0, 1–2, 3–5, 6–9, 10–19, 20–39, and 40 or more occasions. For the psychotherapeutic drugs (amphetamines, sedatives [barbiturates], tranquilizers, and narcotics other than heroin), respondents are instructed to include only use “. . . on your own—that is, without a doctor telling you to take them.” A similar qualification is used in the question on use of anabolic steroids, OxyContin, Vicodin, and several other drugs. For cigarettes, respondents are asked two questions about use. First they are asked, “Have you ever smoked cigarettes?” The answer categories are “never,” “once or twice,” and so on. The second question asks, “How frequently have you smoked cigarettes during the past 30 days?” The answer categories are “not at all,” “less than one cigarette per day,” “one to five cigarettes per day,” “about one-half pack per day,” etc. Smokeless tobacco questions parallel those for cigarettes. Alcohol use is measured using the three questions illustrated above for marijuana. A parallel set of three questions asks about the frequency of being drunk. A different question asks, for the prior two-week period, “How many times (if any) have you had five or more drinks in a row?” Perceived risk is measured by a question asking, “How much do you think people risk harming themselves (physically or in other ways), if they . . .” “. . . try marijuana once or twice,” for example. The answer categories are “no risk,” “slight risk,” “moderate risk,” “great risk,” and “can’t say, drug unfamiliar.” Parallel questions refer to using marijuana “occasionally,” and using it “regularly.”
3
Disapproval is measured by the question “Do YOU disapprove of people doing each of the following?” followed by “trying marijuana once or twice,” for example. Answer categories are “don’t disapprove,” “disapprove,” and “strongly disapprove.” In the 8th- and 10th-grade questionnaires, a fourth category—“can’t say, drug unfamiliar”—is provided and included in the calculation of percentages.
Perceived availability is measured by the question “How difficult do you think it would be for you to get each of the following types of drugs, if you wanted some?” Answer categories are “probably impossible,” “very difficult,” “fairly difficult,” “fairly easy,” and “very easy.” For 8th and 10th graders, an additional answer category—“can’t say, drug unfamiliar”—is offered and included in the calculation of percentages.
4
Summary of Key Findings One important finding of the MTF study is that cohort effects—lasting differences between different cohorts entering secondary school—have emerged, beginning with increases in drug use during the early 1990s. Such cohort effects mean that usage rates (and sometimes attitudes and beliefs about various drugs) reach peaks and valleys in different years for different grades. We have seen such cohort effects for cigarette smoking throughout most of the life of the study, but they were much less evident for illicit drugs until the mid-1990s. Since then, 8th graders have tended to be the first to show turnarounds in illicit drug use, and have generally shown the greatest proportional declines from recent peak levels of use, attained for the most part during the 1990s, while the proportional declines have generally been smallest among 12th graders. In 2008, we introduced a set of tables providing an overview of drug use trends for the three grades combined. While there are important differences by grade, this approach gives a more succinct summary of the general nature of historical trends over the last several years (Tables 1–4). Later sections in this monograph deal separately with each class of drugs and provide data for each grade individually. Of particular importance this year were findings relating to relatively new synthetic drugs and some relating to the use of more traditional drugs of abuse, like marijuana and ecstasy. We begin by discussing the newest drug covered by the study, “bath salts.” “Bath Salts,” so-called because they are sold over the counter as apparently innocuous products like bath salts but really contain strong stumulants, have been given much attention in the news in the past two years; however, there has been very little scientific information about the prevalence of their use. We believe that the 2012 MTF survey provides the first national survey data on their use. Fortunately, we find the annual prevalence rates in 2012 to be very low, at 0.8%, 0.6%, and 1.3% in grades 8, 10, and 12, respectively. Data on calls to the national poison control centers relating to bath salts suggest that use may have risen rapidly after 2010, peaked in the first half of 2011 (with 3,500 calls about them), but declined by half in the first half of 2012 (1,700 calls), and continued to decline since then. (See
http://www.aapcc.org/alerts/bath-salts/.) So, our estimates may well reflect prevalence after the peak rates of use. If so, two factors most likely account for the sharp decline in their use—one is that the Drug Enforcement Administration scheduled the most commonly used chemicals in bath salts (cathinones) effective October 2011; and the other is the fact that the media widely disseminated how dangerous their use can be, likely driving up perceived risk. Marijuana use, which had been rising among teens for the past four years, continued to rise in 2011 in all prevalence periods for 10th and 12th graders; but in 2012 these increases halted. The recent rise in use stood in stark contrast to the long, gradual decline that had been occurring over the preceding decade. (Although use among 8th graders had been rising, annual prevalence decreased after 2010.) It is relevant that perceived risk for marijuana has been falling for the past six years, and disapproval declined for the past three to four years. These changes would normally portend a further increase in use. Of particular importance, daily marijuana use increased significantly in all three grades in 2010, rising further in all three grades in 2011, and leveled in 2012. Daily use now stands at 1.1%, 3.5%, and 6.5% in grades 8, 10, and 12. In other words, roughly one in fifteen high school seniors today is a current daily, or near-daily, marijuana user. Synthetic marijuana, which goes by such names as Spice and K-2, is an herbal drug mixture that usually contains designer chemicals that fall into the cannibinoid family. Until March of 2011 these drugs were not scheduled by the Drug Enforcement Administration, so they were readily and legally available on the Internet and in head shops, gas stations, etc. The DEA did schedule them beginning March 1, 2011, making the possession and sale of their most commonly used ingredients no longer legal. MTF first addressed the use of synthetic marijuana in its 2011 survey, asking 12th graders about use in the prior 12 months, which would have covered a considerable period of time prior to the drugs being scheduled. Some 11.4% indicated use in the prior 12 months. Despite this policy intervention, use among 12th graders remained unchanged in 2012 at 11.3%, which suggests either that compliance with
5
the new scheduling has been limited or that those who produce these products have succeeded in continuing to change their chemical formulas to avoid using the scheduled ingredients. In 2012 for the first time 8th and 10th graders were asked about their use of synthetic marijuana; annual prevalence rates were 4.4% and 8.8%, respectively.
Drugs Declining in Use
Most of the other individual illicit drugs showed no significant change in use between 2011 and 2012. Only ecstasy, salvia, heroin used without a needle, Vicodin, and Oxycontin showed statistically significant declines this year. Both of the licit drugs, alcohol and tobacco, also showed some further decline in 2012, though the story for alcohol is mixed. Ecstasy. After a decline of several years in perceived risk and disapproval of ecstasy use—which we had been warning could presage a rebound in use—ecstasy use did appear to be rebounding, particularly among the older teens. However, in 2012 it was one of the few drugs showing a significant decline in use, which occurred in all three grades. Salvia divinorum, an herb in the mint family with hallucinogenic effects, also showed declines in all three grades in 2012 (significant in 10th and 12th), with annual prevalence at 1.4%, 2.5%, and 4.4% in grades 8, 10, and 12, respectively. Heroin use without using a needle declined significantly in 8th and 12th grades, and remained unchanged in 10th grade in 2012 (but at lower than recent peak levels). Annual prevalence rates are now down to 0.3% for 8th grade and 0.4% for 10th and 12th grades. Other Narcotics. The use of narcotic drugs other than heroin (most of which are prescription analgesics) increased sharply in recent years, as have emergency room admissions involving these drugs, making this class of drugs of particular concern. Use in 12th grade—the only grade for which use is reported—showed some nonsignificant decline in 2012. The two major components of this class are Vicodin and OxyContin, and both showed nonsignificant declines in all three grades. However, for the three grades combined, the declines for both Vicodin and OxyContin were significant in 2012, as a result of the
greater precision gained with the larger combined sample. Alcohol use, including binge drinking (having five or more drinks in a row at least once in past two weeks), reached historically low levels in 2011 in all three grades under study. In 2012, a significant further decline in binge drinking was seen among 8th graders, but there was a slight increase among 10th graders, and 12th graders showed a statistically significant increase from 22% to 24%. Alcohol use had been in a long-term pattern of decline since about 1980, with the interruption of a few years in the early 1990s during which alcohol use increased along with the use of cigarettes and almost all illicit drugs. In 1981, 41% of 12th graders reported having five or more drinks in a row on at least one occasion in the two weeks prior to the survey; thus the recent two percentage-point increase to 24% in 2012 still leaves it well below peak levels of the 1980s. Cigarettes. After decelerating considerably in recent years, the long-term decline in cigarette use, which began in the mid-1990s, appeared to come to a halt in the lower grades in 2010. Indeed, both 8th and 10th graders showed evidence of a slight increase in smoking in 2010, though the increases did not reach statistical significance. Perceived risk and subsequently disapproval had both leveled off some years ago. In 2011, however, the decline in teen smoking resumed in the lower grades and also continued among 12th graders; in 2012 all three grades showed further decline—significant for the three grades combined. Perceived risk and disapproval both continued to rise in all three grades in 2012, suggesting future decline in use; availability also continued to decline among 8th and 10th graders (12th graders are not asked about availability). Use of any illicit drug. In 2012 all three grades showed non-significant declines in the any illicit drug use index. The percentage using any illicit drug other than marijuana has been declining gradually since about 2001.
Other Drugs Showing Consistent but Small Declines in Use
Several other drugs showed signs of decreased use in 2012. These include: any illicit drug, inhalants, and tranquilizers.
6

Inhalants. Inhalant use continued its long-term gradual decline in all grades, but only the 30-day prevalence decline among 8th graders was statistically significant. Of the three groups, the younger students are most likely to be using inhalants: the annual prevalence of use is 6%, 4%, and 3% in grades 8, 10, and 12, respectively—the opposite of the grade differences seen for virtually all other drugs. Tranquilizers. In 2012 there was some decline in all measures of tranquilizer use at all three grade levels, though none reached statistical significance. Nevertheless, in 2012 all three grades reached their lowest level of annual prevalence in some years. Perceived availability of tranquilizers continues a gradual decline that has been very substantial over the life of the study.
Drugs Holding Steady in 2012
The use of a number of other drugs held steady this year. These include cocaine powder, crack, methamphetamine, crystal methamphetamine, Rohypnol, GHB, Ketamine, steroids, over-the-counter cough and cold medicines taken to get high, sedatives, and any prescription drug taken without medical supervision. The psychotherapeutic drugs now make up a larger part of the overall U.S. drug problem than was true 10–15 years ago, in part because use increased for many prescription drugs over that period, and in part because use of a number of street drugs has declined substantially since the mid-1990s. It seems likely that young people are less concerned about the dangers of using these prescription drugs outside of medical regimen, likely because they are widely used for legitimate purposes. (Indeed, the low levels of perceived risk for sedatives and amphetamines observed among 12th graders illustrate this point.) Also, prescription psychotherapeutic drugs are now being advertised directly to the consumer, which implies both that they are widely used and safe to use. Fortunately, the use of most of these drugs has either leveled or begun to decline in the past few years. The proportion of 12th graders misusing any of these prescription drugs (i.e., amphetamines, sedatives, tranquilizers, or narcotics other than heroin) in the prior year has leveled at 14.8%—about where it has been since 2008 and down slightly from 17.1% in 2005.
One Drug Possibly Increasing in Use
Adderall. One drug class that showed some sign of increasing use this year was Adderall, but only among 12th graders and not significantly. While the misuse (use outside of medical supervision) of Adderall may still be rising at grade 12—possibly because it is being used to enhance adacemic performance—misuse is down from peak levels in grades 8 and 10 where it held steady this year.
Tobacco and Alcohol Use
The findings concerning use of the licit drugs—cigarettes and alcohol—remain a basis for considerable concern. Cigarettes. Four in every ten American young people (40%) have tried cigarettes by 12th grade, and nearly one in six (17%) 12th graders is a current smoker. (These proportions would be higher if high school dropouts were included in the study’s coverage.) Even as early as 8th grade, one in six (16%) has tried cigarettes, and 1 in 20 (5%) has already become a current smoker. Fortunately, there has been some real improvement in these rates since the mid- to late 1990s, following a dramatic increase in adolescent smoking earlier in the 1990s. Some of the improvement was simply regaining lost ground; however, in 2012, cigarette use reached the lowest levels recorded in the life of the MTF study, going back over 37 years in the case of 12th graders and 21 years in the case of 8th and 10th graders. Thirty-day prevalence of cigarette use reached a peak in 1996 at grades 8 and 10, capping a rapid climb from the 1991 levels (when data were first gathered on these grades). Between 1996 and 2012, current smoking fell very considerably in these grades (by 77% and 64%, respectively). However, the decline in use had decelerated in recent years, and in 2010 there was evidence of some increase in smoking rates among 8th and 10th graders (though not statistically significant). In 2011, and again in 2012, use decreased among 8th and 10th graders. For 12th graders, peak use occurred in 1997 at 37%, and has since shown a more modest decline since then, dropping to 17% in 2012. Because of the strong cohort effect that we have consistently observed for cigarette smoking, we expect use at 12th grade to continue to show declines, as the lighter using cohorts of 8th and 10th graders become 12th graders.
7
Overall increases in perceived risk and disapproval appear to have contributed to the downturn in cigarette use. Perceived risk increased substantially and steadily in all grades from 1995 through 2004, after which it leveled in 8th and 10th grades; however, it continued rising in 12th grade until 2006, after which it leveled and then declined some in 2008. Disapproval of smoking had been rising steadily in all grades since 1996. After 2004, the rise decelerated in the lower grades through 2006—again, reflecting a cohort effect in this attitude. All three grades showed slight increases in perceived risk and in disapproval in 2012. It seems likely that some of the attitudinal change surrounding cigarettes is attributable to the adverse publicity suffered by the tobacco industry in the 1990s, as well as a reduction in cigarette advertising and an increase in antismoking advertising reaching children. Various other attitudes toward smoking became more unfavorable during that interval, as well, though some have since leveled off. For example, among 8th graders, the proportions saying that they “prefer to date people who don’t smoke” rose from 71% in 1996 to 81% by 2004, about where it remains in 2012. Similar changes occurred in 10th and 12th grades, as well. Thus, at the present time, smoking is likely to make an adolescent less attractive to the great majority of potential romantic partners. However, most of the negative connotations of smoking and smokers have leveled off in the past few years. In addition to changes in attitudes and beliefs about smoking, price likely also played an important role in the decline in use. Cigarette prices rose appreciably in the late 1990s and early 2000s as cigarette companies tried to cover the costs of the tobacco settlement, and as many states increased excise taxes on cigarettes. More recently there was a significant increase in the federal tobacco tax in 2009, which may have contributed to the continuation of the decline in use since then. Smokeless tobacco. The mid-1990s to the early 2000s saw a substantial decline in smokeless tobacco use, but the declines ended and a rebound in use developed from the mid-2000s through 2010. Since 2010, there have been modest declines in all three grades. (The two-year declines are not statistically significant at any grade level, nor are the one-year or two-year declines for the three grades combined.) Perceived
risk and disapproval appear to have played important roles in the earlier decline in smokeless tobacco use. In all three grades, perceived risk and disapproval rose fairly steadily from 1995 through 2004, as use was falling. However, there was not much change between 2004 and 2010, suggesting that other factors may have led to the increases in smokeless tobacco use during that time interval. These factors might include increased promotion of these products, a proliferation of types of smokeless tobacco products available, and increased restrictions on places where cigarette smoking is permitted. The decline or leveling in smokeless use since 2010 may be attributable, at least in part, to the 2009 increase in federal taxes on tobacco. Perceived risk declined significantly in 2012 among both 8th and 10th graders, which could portend a future rise in use. Alcohol remains the substance most widely used by today’s teenagers. Despite recent declining rates, seven out of every ten students (69%) have consumed alcohol (more than just a few sips) by the end of high school, and three out of ten (30%) have done so by 8th grade. In fact, over half (54%) of 12th graders and more than one seventh (13%) of 8th graders in 2012 report having been drunk at least once in their life. Alcohol use began a substantial decline in the 1980s. To a considerable degree, alcohol trends have tended to parallel the trends in illicit drug use. These include a modest increase in binge drinking (defined as having five or more drinks in a row at least once in the past two weeks) in the early to mid-1990s, though it was a proportionally smaller increase than was seen for cigarettes and most of the illicit drugs. Fortunately, binge drinking rates leveled off in the early 2000s, just about when the illicit drug rates began to turn around, and in 2002 a drop in drinking and drunkenness resumed in all grades. Gradual declines continued into 2011, and we saw the study’s lowest rates of teen drinking and drunkeness in all three grades that year. In 2012 the decline continued among 8th graders, but use leveled among 10th graders and there was somewhat of a rebound among 12th graders, who showed a significant increase in binge drinking, for example. Still, the longer term trend data available for 12th graders show that alcohol usage rates, and binge drinking in particular, are now substantially below peak levels measured in the early 1980s.
8

9
Any Illicit Drug MTF routinely reports three different indexes of illicit drug use—any illicit drug, any illicit drug other than marijuana, and any illicit drug including inhalants.5 In this section we discuss only the first two; the statistics for all three may be found in Tables 5–7. In order to make comparisons over time, we have kept the definitions of these indexes constant. Levels would be little affected by the inclusion of newer substances, primarily because most individuals using newer ones are also using the more prevalent drugs included in the indexes. The major exception has been inhalants, the use of which is quite prevalent in the lower grades, so in 1991 a special index that includes inhalants was added.
Trends in Use
In the late 20th century, young Americans reached extraordinarily high levels of illicit drug use by U.S. as well as international standards. The trends in lifetime use of any illicit drug are given in the first panel on the facing page.6 In 1975, when MTF began, the majority of young people (55%) had used an illicit drug by the time they left high school. This figure rose to two thirds (66%) in 1981 before a long and gradual decline to 41% in 1992—the low point. After 1992 the proportion rose considerably to a recent high point of 55% in 1999; it then declined gradually to 47% in 2007 through 2009, and stands at 49% in 2012. Trends for annual, as opposed to lifetime, prevalence appear in the second (upper right) panel. They are quite parallel to those for lifetime prevalence, but at a lower level. Among 8th graders, a gradual and continuing falloff occurred after 1996. Peak rates since 1991 were reached in 1997 in the two upper grades and declined little for several years. Between 2001 and 2007 all three grades showed declines, but the annual use rates in all three grades are slightly higher in 2012. Because marijuana is much more prevalent than any other illicit drug, trends in its use tend to drive the index of any illicit drug use. Thus we also report an index that excludes marijuana, and
5Footnote ‘a’ to Tables 5 through 8 provides the exact definition of any illicit drug. 6This is the only set of figures in this Overview presenting lifetime use statistics. For other drugs, lifetime statistics may be found in Table 5.
shows the proportions of students who use the other, so-called “harder” illicit drugs. The proportions who have used any illicit drug other than marijuana in their lifetime are shown in the third panel (lower left). In 1975 over one third (36%) of 12th graders had tried some illicit drug other than marijuana. This figure rose to 43% by 1981, then declined for a long period to a low of 25% in 1992. Some increase followed in the 1990s as the use of a number of drugs rose steadily, and it reached 30% by 1997. (In 2001 it was 31%, but this apparent upward shift in the estimate was an artifact due to a change in the question wording for “other hallucinogens” and tranquilizers.7) Lifetime prevalence among 12th graders then fell slightly, to 24% by 2009, where it remained in 2012. The fourth panel presents the annual prevalence data for any illicit drug other than marijuana, which shows a pattern of change over the past few years similar to the index of any illicit drug use, but with much less pronounced change since 1991. It has been dropping fairly steadily and gradually in all three grades in recent years and continued to drop in 2012, though not by statistically significant amounts. Overall, these data reveal that, while use of individual drugs (other than marijuana) may fluctuate widely, the proportion using any of them is much more stable. In other words, the proportion of students prone to using such drugs and willing to cross the normative barriers to such use changes more gradually. The usage rate for each individual drug, on the other hand, reflects many more rapidly changing determinants specific to that drug: how widely its psychoactive potential is recognized, how favorable the reports of its supposed benefits are, how risky its use is seen to be, how acceptable it is in the peer group, how accessible it is, and so on.
7The term psychedelics was replaced with hallucinogens, and shrooms was added to the list of examples, resulting in somewhat more respondents indicating use of this class of drugs. For tranquilizers, Xanax was added to the list of examples given, slightly raising the reported prevalence of use.
10
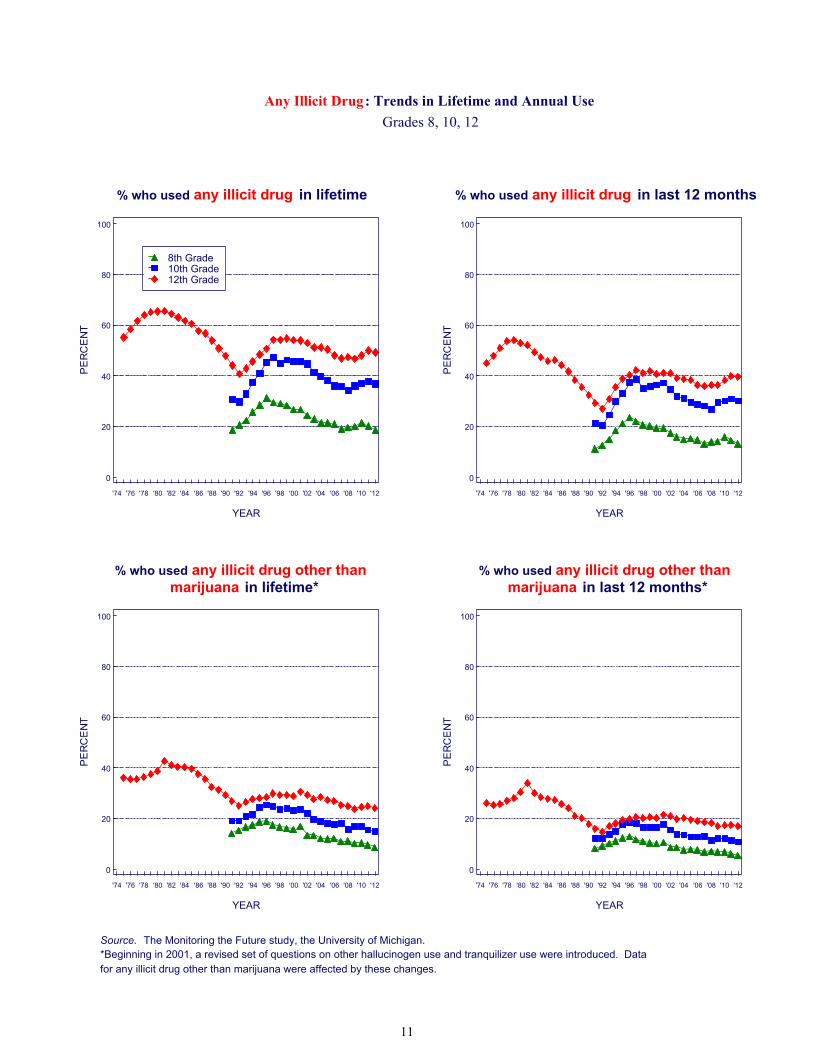
Any Illicit Drug : Trends in Lifetime and Annual Use
Grades 8, 10, 12
Source. The Monitoring the Future study, the University of Michigan.*Beginning in 2001, a revised set of questions on other hallucinogen use and tranquilizer use were introduced. Datafor any illicit drug other than marijuana were affected by these changes.
% who used any illicit drug in lifetime % who used any illicit drug in last 12 months
% who used any illicit drug other than marijuana in lifetime*
% who used any illicit drug other than marijuana in last 12 months*
PE
RC
EN
T
0
20
40
60
80
100
YEAR
'74 '76 '78 '80 '82 '84 '86 '88 '90 '92 '94 '96 '98 '00 '02 '04 '06 '08 '10 '12
8th Grade10th Grade12th Grade
PE
RC
EN
T
0
20
40
60
80
100
YEAR
'74 '76 '78 '80 '82 '84 '86 '88 '90 '92 '94 '96 '98 '00 '02 '04 '06 '08 '10 '12
PE
RC
EN
T
0
20
40
60
80
100
YEAR
'74 '76 '78 '80 '82 '84 '86 '88 '90 '92 '94 '96 '98 '00 '02 '04 '06 '08 '10 '12
PE
RC
EN
T
0
20
40
60
80
100
YEAR
'74 '76 '78 '80 '82 '84 '86 '88 '90 '92 '94 '96 '98 '00 '02 '04 '06 '08 '10 '12
11

Marijuana Marijuana has been the most widely used illicit drug throughout MTF’s 38 year history. It can be taken orally, mixed with food, and smoked in a concentrated form as hashish—the use of which is much more common in Europe. The great majority of consumption in the U.S. involves smoking it in rolled cigarettes (“joints”), in pipes or water pipes, or in hollowed-out cigars (“blunts”).
Trends in Use
Annual marijuana prevalence peaked among 12th graders in 1979 at 51%, following a rise that began during the 1960s. Then use declined fairly steadily for 13 years, bottoming at 22% in 1992—a decline of more than half. The 1990s, however, saw a resurgence of use. After a considerable increase (one that actually began among 8th graders a year earlier than among 10th and 12th graders), annual prevalence rates peaked in 1996 at 8th grade and in 1997 at 10th and 12th grades. After these peak years, use declined among all three grades through 2006, 2007, or 2008; after the declines, there began an upturn in use in all three grades, lasting for three years in the lower grades and longer in grade 12. In 2011 and 2012 there was some decline in use in grade 8, with 10th and 12th grades leveling in 2012. In 2010 a significant increase in daily use occurred in all three grades, followed by a nonsignificant increase in 2011. In 2012 there were non-significant declines for daily use in the lower grades and a leveling at 12th grade with use reaching 1.1%, 3.5%, and 6.5% in grades 8, 10, and 12, respectively.
Perceived Risk
The proportion of students seeing great risk from using marijuana regularly fell during the rise in use in the 1970s, and again during the subsequent rise in the 1990s. Indeed, at 10th and 12th grades, perceived risk declined a year before use rose in the upturn of the 1990s, making perceived risk a leading indicator of
change in use. (The same may have happened at 8th grade as well, but we lack data starting early enough to know.) The decline in perceived risk halted in 1996 in 8th and 10th grades; the increases in use ended a year or two later, again making perceived risk a leading indicator of use. From 1996 to 2000, perceived risk held fairly steady and the decline in use in the upper grades stalled. After some decline prior to 2002, perceived risk increased in all grades through 2004 as use decreased. Perceived risk fell after 2004 and 2005 in 8th and 12th grades respectively, (and since 2008 in 10th grade) presaging the more recent resurgence in marijuana use; but no increase in perceived risk preceded the leveling of use in 2012. Perceived risk did decline some in all grades in 2012, however, suggesting that there might be further increases in use.
Disapproval
Personal disapproval of trying marijuana fell considerably among 8th graders between 1991 and 1996 and among 10th and 12th graders between 1992 and 1997—by 17, 21, and 19 percentage points, respectively, over those intervals of increasing use. After that there was some modest increase in disapproval among 8th graders, but not much among 10th and 12th graders until 2004, when the lower grades showed increases. From 2003 to 2007 (2008 in the case of 10th graders) disapproval increased in all three grades, but has declined some since then as use rose.
Availability
Ever since the MTF study began in 1975, between 81% and 90% of 12th graders each year have said that they could get marijuana fairly easily or very easily if they wanted some. It has been considerably less accessible to younger adolescents. Still, in 2012, 37% of 8th graders, 69% of 10th graders, and 82% of 12th graders reported it as being fairly or very easy to get. It thus seems clear that marijuana has remained highly accessible to the older teens.
12
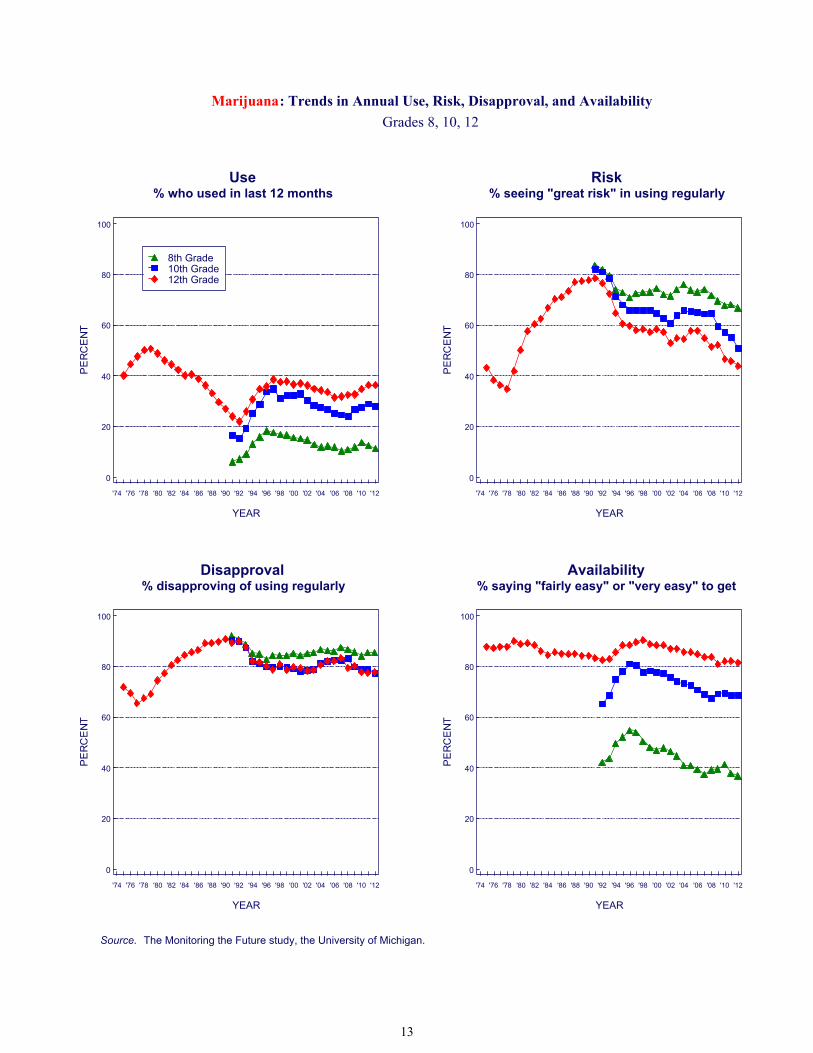
Marijuana: Trends in Annual Use, Risk, Disapproval, and Availability
Grades 8, 10, 12
Source. The Monitoring the Future study, the University of Michigan.
Use% who used in last 12 months
Risk% seeing "great risk" in using regularly
Disapproval% disapproving of using regularly
Availability% saying "fairly easy" or "very easy" to get
PE
RC
EN
T
0
20
40
60
80
100
YEAR
'74 '76 '78 '80 '82 '84 '86 '88 '90 '92 '94 '96 '98 '00 '02 '04 '06 '08 '10 '12
8th Grade10th Grade12th Grade
PE
RC
EN
T
0
20
40
60
80
100
YEAR
'74 '76 '78 '80 '82 '84 '86 '88 '90 '92 '94 '96 '98 '00 '02 '04 '06 '08 '10 '12
PE
RC
EN
T
0
20
40
60
80
100
YEAR
'74 '76 '78 '80 '82 '84 '86 '88 '90 '92 '94 '96 '98 '00 '02 '04 '06 '08 '10 '12
PE
RC
EN
T
0
20
40
60
80
100
YEAR
'74 '76 '78 '80 '82 '84 '86 '88 '90 '92 '94 '96 '98 '00 '02 '04 '06 '08 '10 '12
13
Synthetic Marijuana Synthetic marijuana has generally been sold over-the-counter under such labels as Spice and K-2. It usually contains some herbal materials that have been sprayed with one or more of the designer chemicals that fall into the cannibinoid family. Until March of 2011 these drugs were not scheduled by the Drug Enforcement Administration, so they were readily and legally available on the Internet and in head shops, gas stations, etc. However, the DEA scheduled many of the most widely used chemicals beginning March 1, 2011, making their possession and sale no longer legal.
Trends in Use
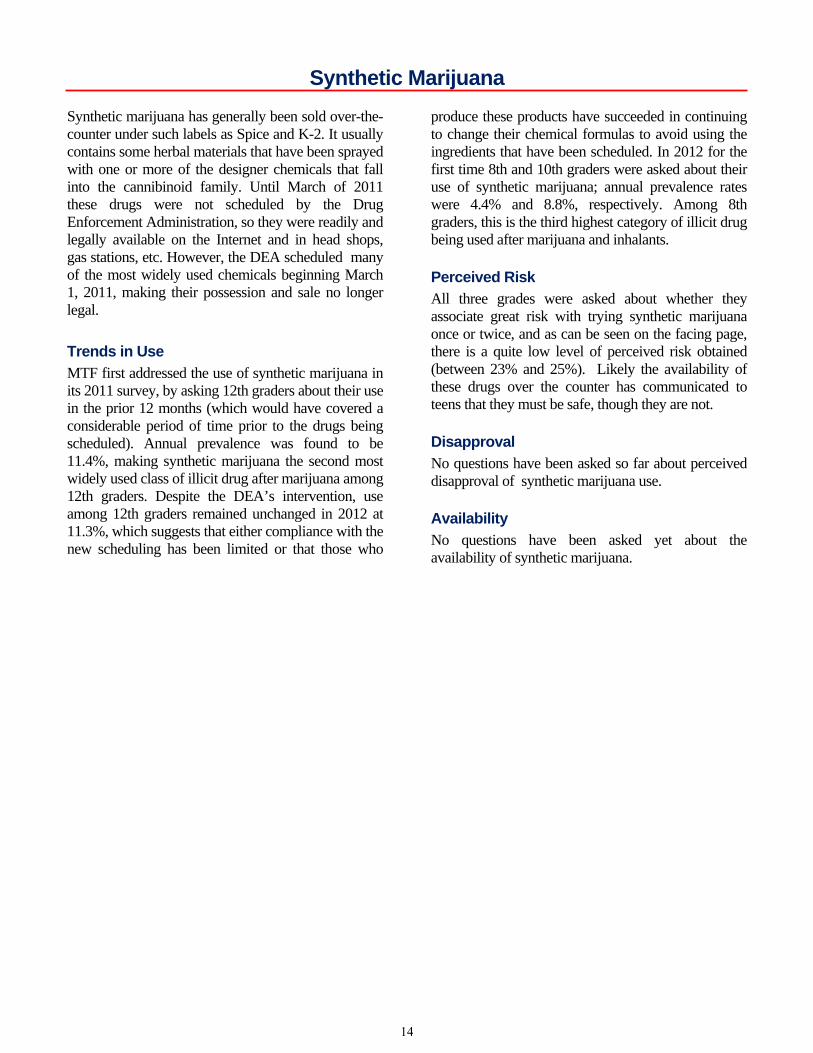
MTF first addressed the use of synthetic marijuana in its 2011 survey, by asking 12th graders about their use in the prior 12 months (which would have covered a considerable period of time prior to the drugs being scheduled). Annual prevalence was found to be 11.4%, making synthetic marijuana the second most widely used class of illicit drug after marijuana among 12th graders. Despite the DEA’s intervention, use among 12th graders remained unchanged in 2012 at 11.3%, which suggests that either compliance with the new scheduling has been limited or that those who
produce these products have succeeded in continuing to change their chemical formulas to avoid using the ingredients that have been scheduled. In 2012 for the first time 8th and 10th graders were asked about their use of synthetic marijuana; annual prevalence rates were 4.4% and 8.8%, respectively. Among 8th graders, this is the third highest category of illicit drug being used after marijuana and inhalants.
Perceived Risk
All three grades were asked about whether they associate great risk with trying synthetic marijuana once or twice, and as can be seen on the facing page, there is a quite low level of perceived risk obtained (between 23% and 25%). Likely the availability of these drugs over the counter has communicated to teens that they must be safe, though they are not.
Disapproval
No questions have been asked so far about perceived disapproval of synthetic marijuana use.
Availability
No questions have been asked yet about the availability of synthetic marijuana.
14

Synthetic Marijuana : Trends in Annual Use and Risk
Grades 8, 10, 12
Source. The Monitoring the Future study, the University of Michigan.
Use% who used in last 12 months
Risk% seeing "great risk" in using once or twice
Disapproval% disapproving of using once or twice
Availability% saying "fairly easy" or "very easy" to get
PE
RC
EN
T
0
4
8
12
16
20
YEAR
'74 '76 '78 '80 '82 '84 '86 '88 '90 '92 '94 '96 '98 '00 '02 '04 '06 '08 '10 '12
8th Grade10th Grade12th Grade
PE
RC
EN
T
0
20
40
60
80
100
YEAR
'74 '76 '78 '80 '82 '84 '86 '88 '90 '92 '94 '96 '98 '00 '02 '04 '06 '08 '10 '12
PE
RC
EN
T
0
20
40
60
80
100
YEAR
'74 '76 '78 '80 '82 '84 '86 '88 '90 '92 '94 '96 '98 '00 '02 '04 '06 '08 '10 '12
(no data)
PE
RC
EN
T
0
20
40
60
80
100
YEAR
'74 '76 '78 '80 '82 '84 '86 '88 '90 '92 '94 '96 '98 '00 '02 '04 '06 '08 '10 '12
(no data)
15
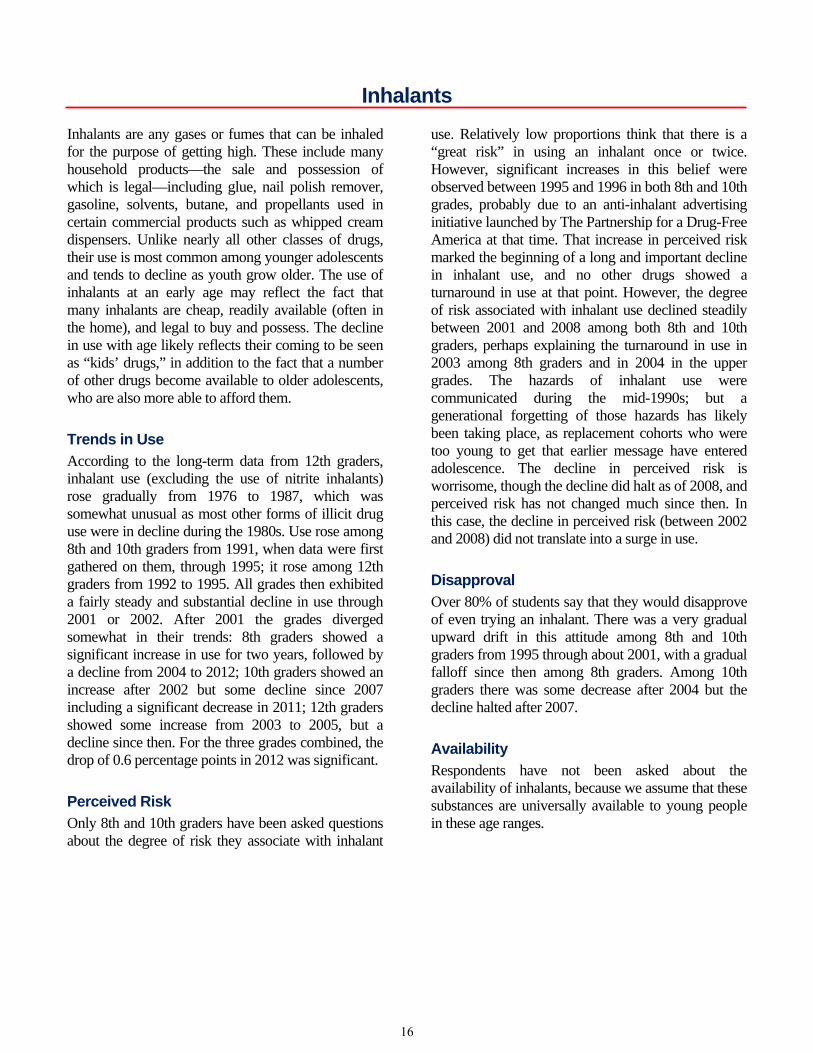
Inhalants Inhalants are any gases or fumes that can be inhaled for the purpose of getting high. These include many household products—the sale and possession of which is legal—including glue, nail polish remover, gasoline, solvents, butane, and propellants used in certain commercial products such as whipped cream dispensers. Unlike nearly all other classes of drugs, their use is most common among younger adolescents and tends to decline as youth grow older. The use of inhalants at an early age may reflect the fact that many inhalants are cheap, readily available (often in the home), and legal to buy and possess. The decline in use with age likely reflects their coming to be seen as “kids’ drugs,” in addition to the fact that a number of other drugs become available to older adolescents, who are also more able to afford them.
Trends in Use
According to the long-term data from 12th graders, inhalant use (excluding the use of nitrite inhalants) rose gradually from 1976 to 1987, which was somewhat unusual as most other forms of illicit drug use were in decline during the 1980s. Use rose among 8th and 10th graders from 1991, when data were first gathered on them, through 1995; it rose among 12th graders from 1992 to 1995. All grades then exhibited a fairly steady and substantial decline in use through 2001 or 2002. After 2001 the grades diverged somewhat in their trends: 8th graders showed a significant increase in use for two years, followed by a decline from 2004 to 2012; 10th graders showed an increase after 2002 but some decline since 2007 including a significant decrease in 2011; 12th graders showed some increase from 2003 to 2005, but a decline since then. For the three grades combined, the drop of 0.6 percentage points in 2012 was significant.
Perceived Risk
Only 8th and 10th graders have been asked questions about the degree of risk they associate with inhalant
use. Relatively low proportions think that there is a “great risk” in using an inhalant once or twice. However, significant increases in this belief were observed between 1995 and 1996 in both 8th and 10th grades, probably due to an anti-inhalant advertising initiative launched by The Partnership for a Drug-Free America at that time. That increase in perceived risk marked the beginning of a long and important decline in inhalant use, and no other drugs showed a turnaround in use at that point. However, the degree of risk associated with inhalant use declined steadily between 2001 and 2008 among both 8th and 10th graders, perhaps explaining the turnaround in use in 2003 among 8th graders and in 2004 in the upper grades. The hazards of inhalant use were communicated during the mid-1990s; but a generational forgetting of those hazards has likely been taking place, as replacement cohorts who were too young to get that earlier message have entered adolescence. The decline in perceived risk is worrisome, though the decline did halt as of 2008, and perceived risk has not changed much since then. In this case, the decline in perceived risk (between 2002 and 2008) did not translate into a surge in use.
Disapproval
Over 80% of students say that they would disapprove of even trying an inhalant. There was a very gradual upward drift in this attitude among 8th and 10th graders from 1995 through about 2001, with a gradual falloff since then among 8th graders. Among 10th graders there was some decrease after 2004 but the decline halted after 2007.
Availability
Respondents have not been asked about the availability of inhalants, because we assume that these substances are universally available to young people in these age ranges.
16
Inhalants: Trends in Annual Use, Risk, and Disapproval
Grades 8, 10, 12
Source. The Monitoring the Future study, the University of Michigan.
Use% who used in last 12 months
Risk% seeing "great risk" in using once or twice
Disapproval% disapproving of using once or twice
Availability% saying "fairly easy" or "very easy" to get
PE
RC
EN
T
0
6
12
18
24
30
YEAR
'74 '76 '78 '80 '82 '84 '86 '88 '90 '92 '94 '96 '98 '00 '02 '04 '06 '08 '10 '12
8th Grade10th Grade12th Grade
PE
RC
EN
T
0
20
40
60
80
100
YEAR
'74 '76 '78 '80 '82 '84 '86 '88 '90 '92 '94 '96 '98 '00 '02 '04 '06 '08 '10 '12
PE
RC
EN
T
0
20
40
60
80
100
YEAR
'74 '76 '78 '80 '82 '84 '86 '88 '90 '92 '94 '96 '98 '00 '02 '04 '06 '08 '10 '12
PE
RC
EN
T
0
20
40
60
80
100
YEAR
'74 '76 '78 '80 '82 '84 '86 '88 '90 '92 '94 '96 '98 '00 '02 '04 '06 '08 '10 '12
(no data)
17
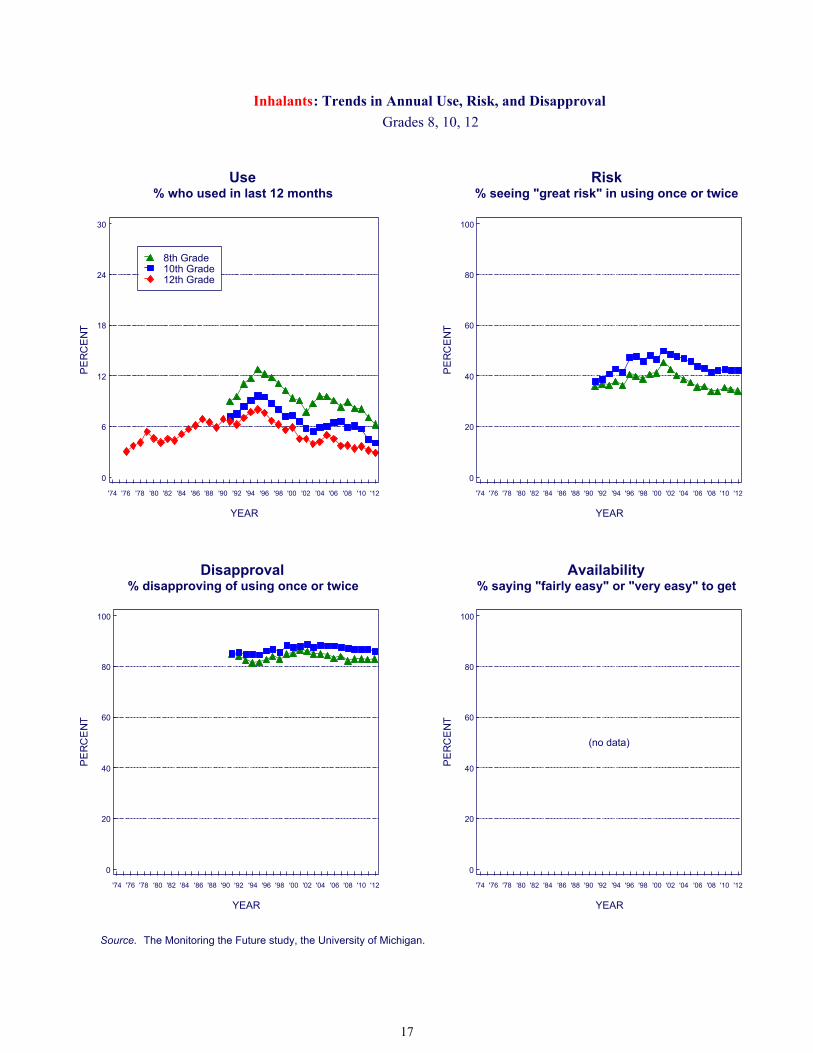
LSD For some years, LSD was the most widely used drug within the larger class of hallucinogens. This is no longer true, due to sharp decreases in its use combined with an increasing use of psilocybin. (Statistics on overall hallucinogen use and on use of hallucinogens other than LSD are shown in the tables at the end of this report.)
Trends in Use
Annual prevalence of LSD use among 12th graders has been below 10% since MTF began. Use declined some for the first 10 years among 12th graders, likely continuing a decline that had begun before 1975. Use was fairly level in the latter half of the 1980s but, as was true for a number of other drugs, rose in all three grades between 1991 and 1996. Between 1996 and 2006 or so, use declined in all three grades, with particularly sharp declines between 2001 and 2003. Since then use has remained at historically low levels.
Perceived Risk
We think it likely that perceived risk for LSD use increased during the early 1970s, before MTF began, as concerns grew about possible neurological and genetic effects (most of which were never scientifically confirmed) as well as “bad trips” and “flashbacks.” However, there was some decline in perceived risk in the late 1970s, after which it remained fairly level among 12th graders through most of the 1980s. A substantial decline occurred in all grades in the early 1990s, as use rose. Since about 2000, perceived risk declined steadily and substantially among 8th graders until 2007, when it leveled; it declined considerably among 10th graders before leveling around 2002, but held fairly steady among 12th graders since 2002. The decline in the lower grades suggests that younger teens are less knowledgeable about this drug’s effects than their predecessors—through what we have called “generational forgetting”—making them vulnerable to a resurgence in use. The decline of LSD use in recent years, despite a fall in perceived risk, suggests that some factors other than a change in underlying attitudes and beliefs were contributing to the downturn—prior to 2001 some
displacement by ecstasy may have been a factor, while more recently a decline in availability (discussed below) likely is a factor.
Disapproval
Disapproval of LSD use was quite high among 12th graders through most of the 1980s, but began to decline after 1991 along with perceived risk. All three grades exhibited a decline in disapproval through 1996, with disapproval of experimentation dropping 11 percentage points between 1991 and 1996 among 12th graders. After 1996 a slight increase in disapproval emerged among 12th graders, accompanied by a leveling among 10th graders and some further decline among 8th graders. Since 2001, disapproval of LSD use has diverged among the three grades, declining considerably among 8th graders, declining less among 10th graders, and increasing significantly among 12th graders. Note, however, that the percentages of 8th and 10th graders who respond with “can’t say, drug unfamiliar” increased through 2008 (a finding consistent with the notion that generational forgetting has been occurring); thus the base for disapproval has shrunk, suggesting that the real decline of disapproval among the younger students is less than it appears here. In 2012 disapproval of LSD use dropped significantly in 8th grade.
Availability
Reported availability of LSD by 12th graders fell considerably from 1975 to 1979, declined a bit further until 1986, and then began a substantial rise, reaching a peak in 1995. LSD availability also rose somewhat among 8th and 10th graders in the early 1990s, reaching a peak in 1995 or 1996. Since those peak years, there has been considerable falloff in availability in all three grades, including a significant decrease for 8th and 10th graders in 2012, quite possibly in part because fewer students have LSD-using friends from whom they could gain access. There was also very likely a decrease in supply due to the closing of a major LSD-producing lab by the Drug Enforcement Administration in 2000. It is clear that attitudinal changes cannot explain the recent declines in use.
18
LSD: Trends in Annual Use, Risk, Disapproval, and Availability
Grades 8, 10, 12
Source. The Monitoring the Future study, the University of Michigan.
Use% who used in last 12 months
Risk% seeing "great risk" in using once or twice
Disapproval% disapproving of using once or twice
Availability% saying "fairly easy" or "very easy" to get
PE
RC
EN
T
0
6
12
18
24
30
YEAR
'74 '76 '78 '80 '82 '84 '86 '88 '90 '92 '94 '96 '98 '00 '02 '04 '06 '08 '10 '12
8th Grade10th Grade12th Grade
PE
RC
EN
T
0
20
40
60
80
100
YEAR
'74 '76 '78 '80 '82 '84 '86 '88 '90 '92 '94 '96 '98 '00 '02 '04 '06 '08 '10 '12
PE
RC
EN
T
0
20
40
60
80
100
YEAR
'74 '76 '78 '80 '82 '84 '86 '88 '90 '92 '94 '96 '98 '00 '02 '04 '06 '08 '10 '12
PE
RC
EN
T
0
20
40
60
80
100
YEAR
'74 '76 '78 '80 '82 '84 '86 '88 '90 '92 '94 '96 '98 '00 '02 '04 '06 '08 '10 '12
19

Cocaine Cocaine was used almost exclusively in powder form for some years, though “freebasing” emerged for a while. Then the early 1980s brought the advent of crack cocaine. Our original questions did not distinguish among different forms of cocaine or modes of administration. Since 1987, though, we have asked separate questions about the use of crack and “cocaine other than crack,” which has consisted almost entirely of powder cocaine use. Data on overall cocaine use are presented in the figures in this section, and results for crack alone are presented in the next section.
Trends in Use
There have been some important changes in the levels of overall cocaine use over the life of MTF. Use among 12th graders originally burgeoned in the late 1970s and remained fairly stable through the first half of the 1980s before starting a precipitous decline after 1986. Annual prevalence among 12th graders dropped by about three quarters between 1986 and 1992. Between 1992 and 1999, use reversed course again and doubled before declining by 2000. Use also rose among 8th and 10th graders after 1992 before reaching peak levels in 1998 and 1999. Over the last decade, use declined in all three grades; 12th-grade use stands at an historical low of just 2.7% in 2012, with use by 8th and 10th graders still lower.
Perceived Risk
General questions about the dangers of cocaine have been asked only of 12th graders. The results tell a fascinating story. They show that perceived risk for experimental use fell in the latter half of the 1970s (when use was rising), stayed level in the first half of the 1980s (when use was level), and then jumped very sharply in a single year (by 14 percentage points between 1986 and 1987), just when the substantial decline in use began. The year 1986 was marked by a national media frenzy over crack cocaine and also by the widely publicized cocaine-related death of Len Bias, a National Basketball Association first-round draft pick. Bias’ death was originally reported as resulting from his first experience with cocaine. Though that was later proven to be incorrect, the message had already “taken.” We believe that this event helped to persuade many young people that use of cocaine at any level is dangerous, no matter how
healthy the individual.8 Perceived risk continued to rise through 1991 as the fall in use continued. Perceived risk declined modestly from 1991 to 2000, and use rose from 1992–2000. Perceived risk has leveled in recent years at far higher levels than existed prior to 1987, and there is as yet little evidence of generational forgetting of cocaine’s risks—at least among the 12th graders.
Disapproval
Questions about disapproval of cocaine have been asked only of 12th graders. Disapproval of cocaine use by 12th graders followed a cross-time pattern similar to that for perceived risk, although its seven-percentage-point jump in 1987 was not quite as pronounced. There was some decline from 1991 to 1997, followed by a period of stability. In recent years there has been a slight drift upwards in disapproval.
Availability
The proportion of 12th graders saying that it would be “fairly easy” or “very easy” for them to get cocaine if they wanted some was 33% in 1977, rose to 48% by 1980 as use rose, and held fairly level through 1982; then, after a one-year drop, it increased steadily to 59% by 1989 (in a period of rapidly declining use). Perceived availability then fell back to about 47% by 1994. After 2007 it has dropped significantly and stands at 30% in 2012—about half of its peak level in 1988. Note that the pattern of change does not map well onto the pattern of actual use, suggesting that changes in overall availability have not been a major determinant of use—particularly during the sharp decline in use in the late 1980s. The advent of crack cocaine in the early 1980s, however, provided a lower cost form of cocaine, thus reducing the prior social class differences in use.
8Trends in perceived risk in Table 11 show a particularly sharp rise from 34% in 1986 to 48% in 1987 for trying cocaine once or twice.
20

Cocaine (including Crack): Trends in Annual Use, Risk, Disapproval, and Availability
Grades 8, 10, 12
Source. The Monitoring the Future study, the University of Michigan.
Use% who used in last 12 months
Risk% seeing "great risk" in using once or twice
Disapproval% disapproving of using once or twice
Availability% saying "fairly easy" or "very easy" to get
PE
RC
EN
T
0
4
8
12
16
20
YEAR
'74 '76 '78 '80 '82 '84 '86 '88 '90 '92 '94 '96 '98 '00 '02 '04 '06 '08 '10 '12
8th Grade10th Grade12th Grade
PE
RC
EN
T
0
20
40
60
80
100
YEAR
'74 '76 '78 '80 '82 '84 '86 '88 '90 '92 '94 '96 '98 '00 '02 '04 '06 '08 '10 '12
PE
RC
EN
T
0
20
40
60
80
100
YEAR
'74 '76 '78 '80 '82 '84 '86 '88 '90 '92 '94 '96 '98 '00 '02 '04 '06 '08 '10 '12
PE
RC
EN
T
0
20
40
60
80
100
YEAR
'74 '76 '78 '80 '82 '84 '86 '88 '90 '92 '94 '96 '98 '00 '02 '04 '06 '08 '10 '12
21

Crack
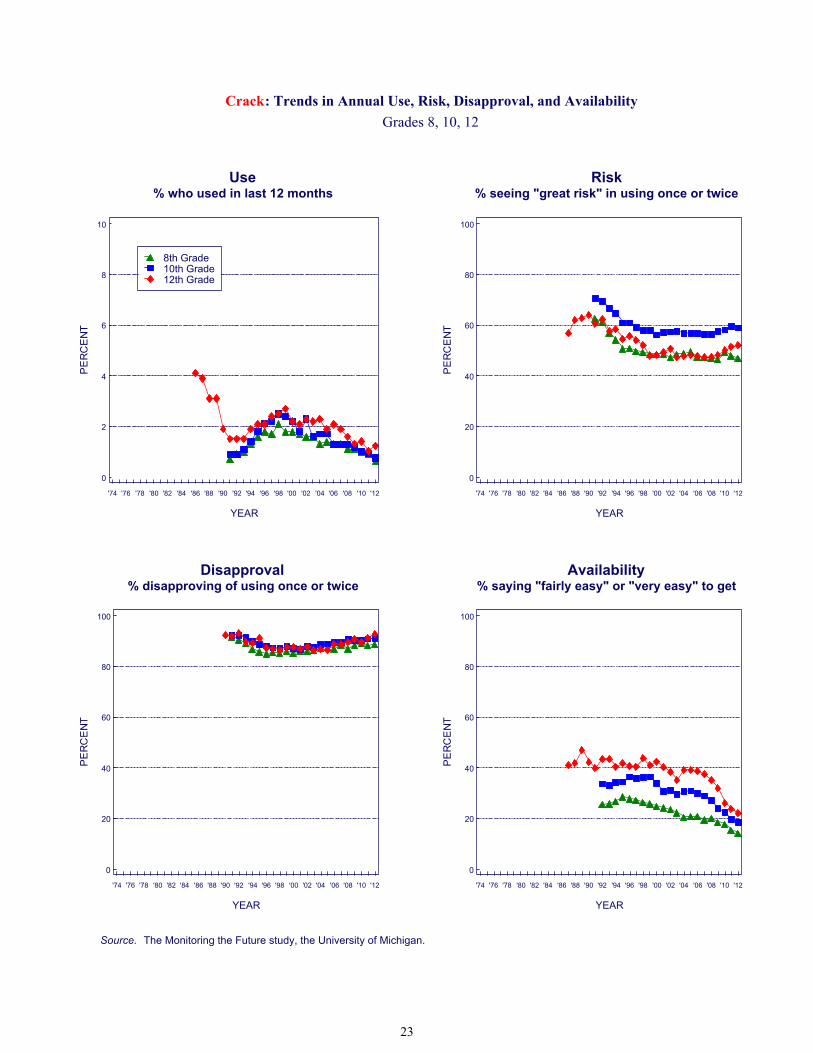
Several indirect indicators suggest that crack use grew rapidly in the period 1983–1986, beginning before we had direct measures of its use. In 1986 a single usage question was included in one of the five 12th-grade questionnaire forms, asking those who indicated any cocaine use in the prior 12 months if they had used crack. The results from that question represent the first data point in the first panel on the facing page. After that, we introduced into several questionnaire forms three questions about crack use covering our usual three prevalence periods.
Trends in Use
Clearly crack use rose rapidly in the early 1980s, judging by the 4% prevalence reached in 1986; but, after 1986 there was a precipitous drop in crack use among 12th graders—a drop that continued through 1991. After 1991 for 8th and 10th graders (when data were first available) and after 1993 for 12th graders, all three grades showed a slow, steady increase in use through 1998. Since 1999, annual prevalence dropped by roughly seven tenths in 8th and 10th grades and by about half in 12th grade. As with many drugs, the decline at 12th grade lagged behind those in the lower grades due to a cohort effect.
Perceived Risk
By the time we added questions about the perceived risk of using crack in 1987, crack was already seen by 12th graders as one of the most dangerous illicit drugs: 57% saw a great risk in even trying it. This compared to 54% for heroin, for example. (See the previous section on cocaine for a discussion of changes in perceived risk in 1986.) Perceived risk for crack rose still higher through 1990, reaching 64% of 12th graders who said they thought there was a great risk in taking crack once or twice. (Use was dropping during that interval.) After 1990 some falloff in perceived risk began, well before crack use began to increase in 1994. Thus, here again, perceived risk was a leading indicator. Between 1991 and 1998 there was a considerable falloff in this belief in grades 8 and 10, as use rose quite steadily. Perceived risk leveled in 2000 in grades 8 and 12 and a year later in grade 10. We think that the declines in perceived risk for crack and cocaine during the 1990s may well reflect an example of generational forgetting, wherein the class cohorts that were in adolescence when the adverse
consequences were most obvious (i.e., in the mid-1980s) were replaced by newer cohorts who had heard much less about the dangers of this drug as they were growing up; nevertheless, it is still seen as a relatively dangerous drug.
Disapproval
Disapproval of crack use was not included in MTF until 1990, by which time it was also at a very high level, with 92% of 12th graders saying that they disapproved of even trying it. Disapproval of crack use declined slightly but steadily in all three grades from 1991 through about 1997. Since 1997, disapproval has increased slightly in all three grades, by 3 to 6 percentage points by 2012.
Availability
Crack availability did not change dramatically across most of the interval for which data are available, as the fourth panel on the facing page illustrates. Eighth and 10th graders reported some modest increase in availability in the early 1990s. This was followed by a slow, steady decrease from 1995 through 2004 in 8th grade (followed by a leveling) and sharper drops among 10th and 12th graders beginning in 1999 and 2000, respectively. Since 2007, availability has declined, particularly in the upper grades. NOTE: The distinction between crack cocaine and other forms of cocaine (mostly powder) was made several years after the study’s inception. The figures on the facing page begin their trend lines when these distinctions were introduced for the different types of measures. Figures are not presented here for the “other forms of cocaine” measures, simply because the trend curves look extremely similar to those for crack. (All statistics are contained in the tables presented later.) Although the trends are very similar, the absolute levels of use, risk, etc., are somewhat different. Usage levels tend to be higher for cocaine powder compared to crack, and the levels of perceived risk a bit lower, while disapproval has been close for the two different forms of cocaine and relative availability has varied (see Tables 15 through 17).
22
Crack: Trends in Annual Use, Risk, Disapproval, and Availability
Grades 8, 10, 12
Source. The Monitoring the Future study, the University of Michigan.
Use% who used in last 12 months
Risk% seeing "great risk" in using once or twice
Disapproval% disapproving of using once or twice
Availability% saying "fairly easy" or "very easy" to get
PE
RC
EN
T
0
2
4
6
8
10
YEAR
'74 '76 '78 '80 '82 '84 '86 '88 '90 '92 '94 '96 '98 '00 '02 '04 '06 '08 '10 '12
8th Grade10th Grade12th Grade
PE
RC
EN
T
0
20
40
60
80
100
YEAR
'74 '76 '78 '80 '82 '84 '86 '88 '90 '92 '94 '96 '98 '00 '02 '04 '06 '08 '10 '12
PE
RC
EN
T
0
20
40
60
80
100
YEAR
'74 '76 '78 '80 '82 '84 '86 '88 '90 '92 '94 '96 '98 '00 '02 '04 '06 '08 '10 '12
PE
RC
EN
T
0
20
40
60
80
100
YEAR
'74 '76 '78 '80 '82 '84 '86 '88 '90 '92 '94 '96 '98 '00 '02 '04 '06 '08 '10 '12
23
Amphetamines Amphetamines, a class of psychotherapeutic stim-ulants, had a relatively high prevalence of use in the youth population for many years. The behavior reported here excludes any use under medical supervision. Amphetamines are controlled sub-stances—they cannot be bought or sold without a doctor’s prescription—but some are diverted from legitimate channels, and some are manufactured and/or imported illegally.
Trends in Use
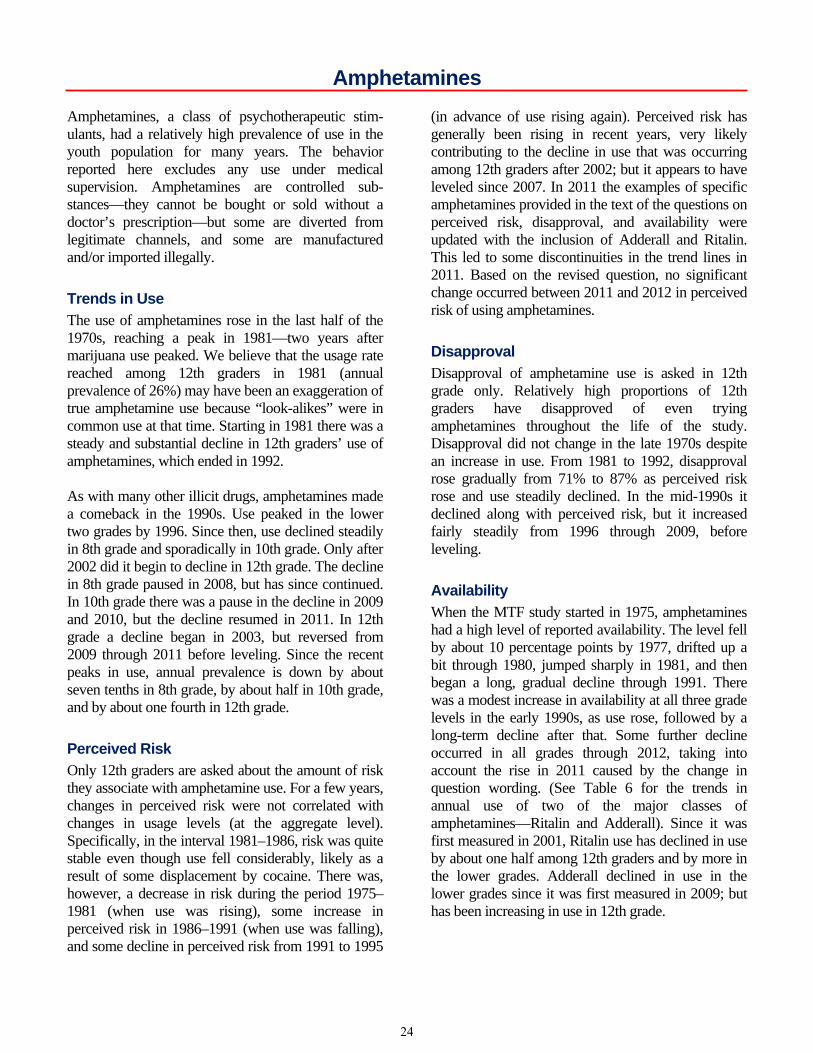
The use of amphetamines rose in the last half of the 1970s, reaching a peak in 1981—two years after marijuana use peaked. We believe that the usage rate reached among 12th graders in 1981 (annual prevalence of 26%) may have been an exaggeration of true amphetamine use because “look-alikes” were in common use at that time. Starting in 1981 there was a steady and substantial decline in 12th graders’ use of amphetamines, which ended in 1992. As with many other illicit drugs, amphetamines made a comeback in the 1990s. Use peaked in the lower two grades by 1996. Since then, use declined steadily in 8th grade and sporadically in 10th grade. Only after 2002 did it begin to decline in 12th grade. The decline in 8th grade paused in 2008, but has since continued. In 10th grade there was a pause in the decline in 2009 and 2010, but the decline resumed in 2011. In 12th grade a decline began in 2003, but reversed from 2009 through 2011 before leveling. Since the recent peaks in use, annual prevalence is down by about seven tenths in 8th grade, by about half in 10th grade, and by about one fourth in 12th grade.
Perceived Risk
Only 12th graders are asked about the amount of risk they associate with amphetamine use. For a few years, changes in perceived risk were not correlated with changes in usage levels (at the aggregate level). Specifically, in the interval 1981–1986, risk was quite stable even though use fell considerably, likely as a result of some displacement by cocaine. There was, however, a decrease in risk during the period 1975–1981 (when use was rising), some increase in perceived risk in 1986–1991 (when use was falling), and some decline in perceived risk from 1991 to 1995
(in advance of use rising again). Perceived risk has generally been rising in recent years, very likely contributing to the decline in use that was occurring among 12th graders after 2002; but it appears to have leveled since 2007. In 2011 the examples of specific amphetamines provided in the text of the questions on perceived risk, disapproval, and availability were updated with the inclusion of Adderall and Ritalin. This led to some discontinuities in the trend lines in 2011. Based on the revised question, no significant change occurred between 2011 and 2012 in perceived risk of using amphetamines.
Disapproval
Disapproval of amphetamine use is asked in 12th grade only. Relatively high proportions of 12th graders have disapproved of even trying amphetamines throughout the life of the study. Disapproval did not change in the late 1970s despite an increase in use. From 1981 to 1992, disapproval rose gradually from 71% to 87% as perceived risk rose and use steadily declined. In the mid-1990s it declined along with perceived risk, but it increased fairly steadily from 1996 through 2009, before leveling.
Availability
When the MTF study started in 1975, amphetamines had a high level of reported availability. The level fell by about 10 percentage points by 1977, drifted up a bit through 1980, jumped sharply in 1981, and then began a long, gradual decline through 1991. There was a modest increase in availability at all three grade levels in the early 1990s, as use rose, followed by a long-term decline after that. Some further decline occurred in all grades through 2012, taking into account the rise in 2011 caused by the change in question wording. (See Table 6 for the trends in annual use of two of the major classes of amphetamines—Ritalin and Adderall). Since it was first measured in 2001, Ritalin use has declined in use by about one half among 12th graders and by more in the lower grades. Adderall declined in use in the lower grades since it was first measured in 2009; but has been increasing in use in 12th grade.
24
Amphetamines: Trends in Annual Use, Risk, Disapproval, and Availability
Grades 8, 10, 12
Source. The Monitoring the Future study, the University of Michigan.*In 2011 the list of examples was changed from uppers, pep pills, bennies, speed to uppers, speed, Adderall, Ritalin, etc.These changes likely explain the discontinuity in the 2011 results.
Use% who used in last 12 months
Risk*% seeing "great risk" in using once or twice
Disapproval*% disapproving of using once or twice
Availability*% saying "fairly easy" or "very easy" to get
PE
RC
EN
T
0
10
20
30
40
50
YEAR
'74 '76 '78 '80 '82 '84 '86 '88 '90 '92 '94 '96 '98 '00 '02 '04 '06 '08 '10 '12
8th Grade10th Grade12th Grade
PE
RC
EN
T
0
20
40
60
80
100
YEAR
'74 '76 '78 '80 '82 '84 '86 '88 '90 '92 '94 '96 '98 '00 '02 '04 '06 '08 '10 '12
PE
RC
EN
T
0
20
40
60
80
100
YEAR
'74 '76 '78 '80 '82 '84 '86 '88 '90 '92 '94 '96 '98 '00 '02 '04 '06 '08 '10 '12
PE
RC
EN
T
0
20
40
60
80
100
YEAR
'74 '76 '78 '80 '82 '84 '86 '88 '90 '92 '94 '96 '98 '00 '02 '04 '06 '08 '10 '12
25
Methamphetamine and Crystal Methamphetamine (Ice) One subclass of amphetamines is called meth-amphetamine (“speed”). This subclass has been around for a long time and gave rise to the phrase “speed kills” in the 1960s. Probably because of the reputation it got at that time as a particularly dangerous drug, it was not popular for some years, so we did not include a full set of questions about its use in MTF’s early questionnaires. One form of metham-phetamine, crystal methamphetamine or “ice,” grew in popularity in the 1980s. It comes in crystallized form, as the name implies, and the chunks can be heated and the fumes inhaled, much like crack.
Trends in Use
For most of the life of the study, the only question about methamphetamine use has been contained in a single 12th-grade questionnaire form. Respondents who indicated using any type of amphetamines in the prior 12 months were asked in a sequel question to indicate on a prespecified list the types they had used during that period. Methamphetamine was one type on the list, and data exist on its use since 1976. (The rates are not graphed here until 1990.) In 1976, annual prevalence on this measure was 1.9%; it then roughly doubled to 3.7% by 1981 (the peak year), before declining for over a decade all the way down to 0.4% by 1992. Use then rose again in the 1990s, as did use of a number of drugs, reaching 1.3% by 1998. In other words, it has followed a cross-time trajectory fairly similar to that for amphetamines as a whole. In 1990, in the 12th-grade questionnaires only, we introduced our usual set of three questions for crystal methamphetamine, measuring lifetime, annual, and 30-day use. Among 12th graders in 1990, 1.3% indicated any use in the prior year; use then climbed to 3.0% by 1998, and has generally been declining since. This variable is charted on the first facing panel. Responding to the growing concern about meth-amphetamine use in general—not just crystal methamphetamine use—we added a full set of three questions about the use of any methamphetamine to the 1999 questionnaires for all three grade levels.
These questions yield a somewhat higher annual prevalence for 12th graders: 4.3% in 2000, compared to the sum of the methamphetamine and crystal methamphetamine answers in the other, branching question format, which totaled 2.8%. It would appear, then, that the long-term method we had been using for tracking methamphetamine use probably yielded an understatement of the absolute prevalence level, perhaps because some proportion of metham-phetamine users did not correctly categorize themselves initially as amphetamine users (even though methamphetamine was given as one of the examples of amphetamines). We think it likely that the shape of the trend curve was not distorted, however. The newer questions for methamphetamine (not graphed here) show annual prevalence rates in 2012 of 1.0% for 8th and 10th graders, and 1.1% for 12th graders. All of these levels are down considerably from the first measurement taken in 1999, when they were 3.2%, 4.6%, and 4.7% (see Table 6). So, despite growing public concern about the methamphetamine problem in the United States, use actually has shown a fairly steady decline over the past 13 years, at least among secondary school students. (A similar decline in methamphetamine use did not begin to appear among college students and young adults until after 2004, likely reflecting a cohort effect.)
Other Measures
No questions have yet been added to the study on perceived risk, disapproval, or availability with regard to overall methamphetamine use. Data on perceived risk and availability for crystal methamphetamine, specifically, may be found on the facing page. Clearly the perceived risk of crystal methamphet-amine use has risen considerably since 2003, very likely explaining much of the decline in use since then. Its perceived availability has been falling in all three grades since 2006, perhaps in part because there are many fewer users.
26
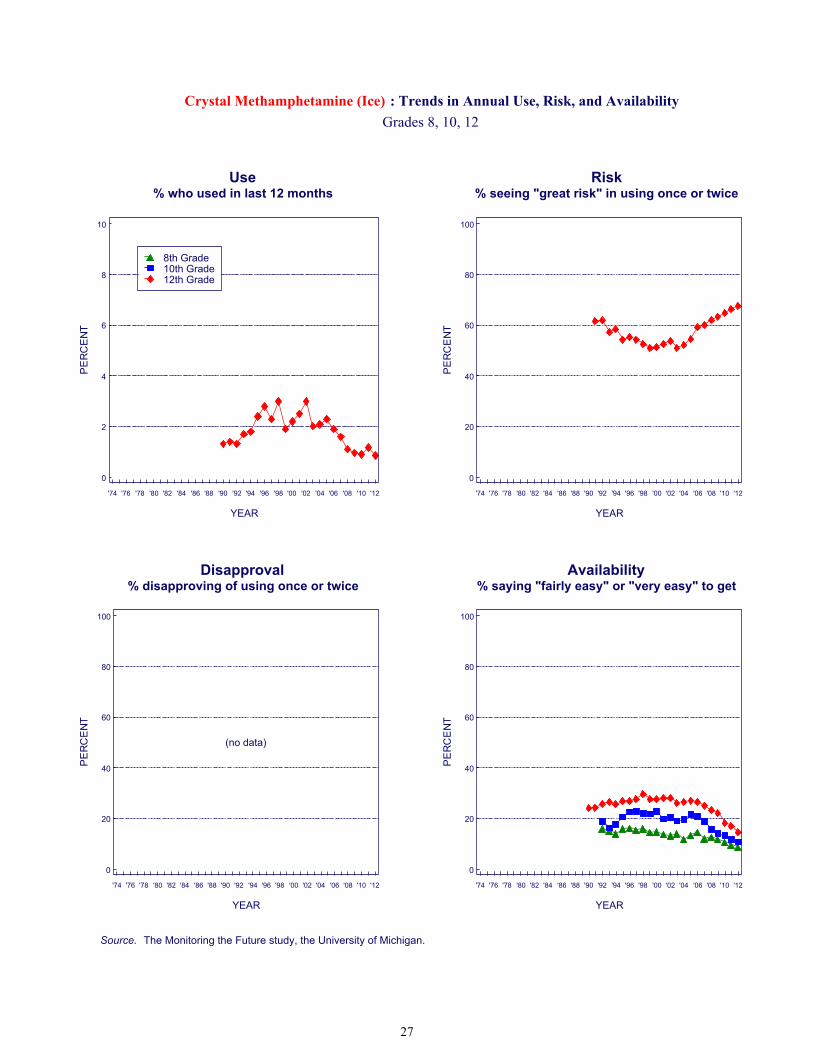
Crystal Methamphetamine (Ice) : Trends in Annual Use, Risk, and Availability
Grades 8, 10, 12
Source. The Monitoring the Future study, the University of Michigan.
Use% who used in last 12 months
Risk% seeing "great risk" in using once or twice
Disapproval% disapproving of using once or twice
Availability% saying "fairly easy" or "very easy" to get
PE
RC
EN
T
0
2
4
6
8
10
YEAR
'74 '76 '78 '80 '82 '84 '86 '88 '90 '92 '94 '96 '98 '00 '02 '04 '06 '08 '10 '12
8th Grade10th Grade12th Grade
PE
RC
EN
T
0
20
40
60
80
100
YEAR
'74 '76 '78 '80 '82 '84 '86 '88 '90 '92 '94 '96 '98 '00 '02 '04 '06 '08 '10 '12
PE
RC
EN
T
0
20
40
60
80
100
YEAR
'74 '76 '78 '80 '82 '84 '86 '88 '90 '92 '94 '96 '98 '00 '02 '04 '06 '08 '10 '12
(no data)
PE
RC
EN
T
0
20
40
60
80
100
YEAR
'74 '76 '78 '80 '82 '84 '86 '88 '90 '92 '94 '96 '98 '00 '02 '04 '06 '08 '10 '12
27
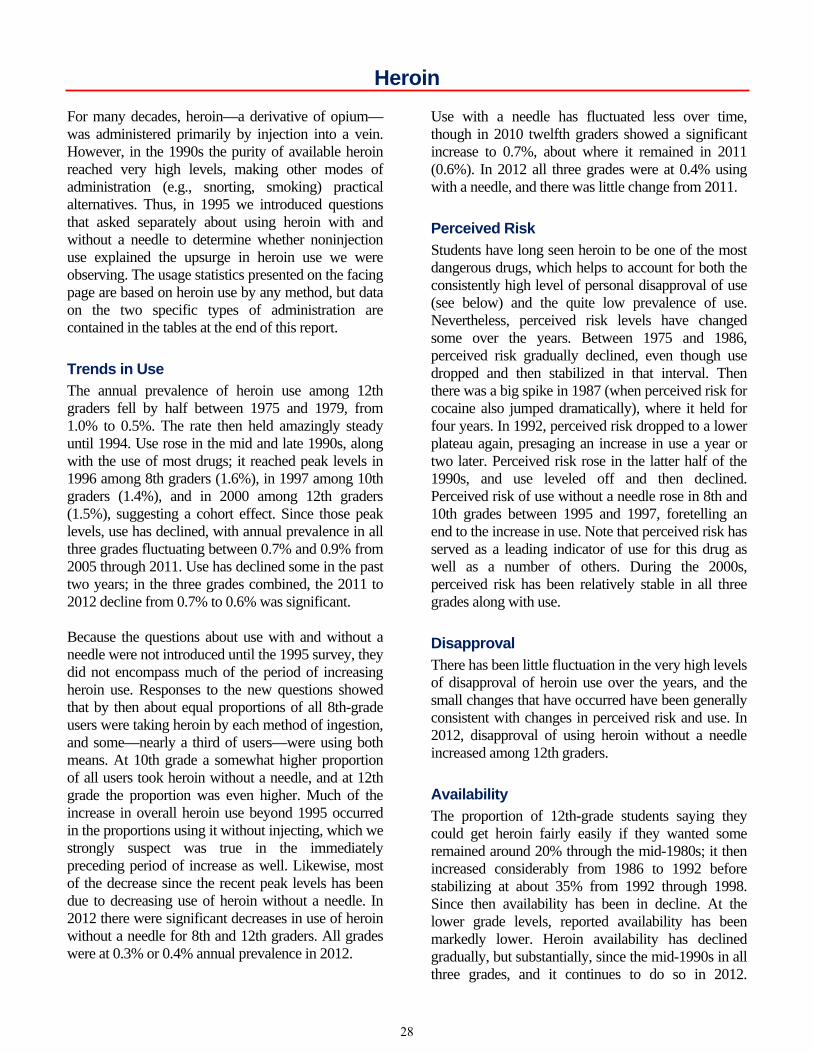
Heroin
For many decades, heroin—a derivative of opium—was administered primarily by injection into a vein. However, in the 1990s the purity of available heroin reached very high levels, making other modes of administration (e.g., snorting, smoking) practical alternatives. Thus, in 1995 we introduced questions that asked separately about using heroin with and without a needle to determine whether noninjection use explained the upsurge in heroin use we were observing. The usage statistics presented on the facing page are based on heroin use by any method, but data on the two specific types of administration are contained in the tables at the end of this report.
Trends in Use
The annual prevalence of heroin use among 12th graders fell by half between 1975 and 1979, from 1.0% to 0.5%. The rate then held amazingly steady until 1994. Use rose in the mid and late 1990s, along with the use of most drugs; it reached peak levels in 1996 among 8th graders (1.6%), in 1997 among 10th graders (1.4%), and in 2000 among 12th graders (1.5%), suggesting a cohort effect. Since those peak levels, use has declined, with annual prevalence in all three grades fluctuating between 0.7% and 0.9% from 2005 through 2011. Use has declined some in the past two years; in the three grades combined, the 2011 to 2012 decline from 0.7% to 0.6% was significant. Because the questions about use with and without a needle were not introduced until the 1995 survey, they did not encompass much of the period of increasing heroin use. Responses to the new questions showed that by then about equal proportions of all 8th-grade users were taking heroin by each method of ingestion, and some—nearly a third of users—were using both means. At 10th grade a somewhat higher proportion of all users took heroin without a needle, and at 12th grade the proportion was even higher. Much of the increase in overall heroin use beyond 1995 occurred in the proportions using it without injecting, which we strongly suspect was true in the immediately preceding period of increase as well. Likewise, most of the decrease since the recent peak levels has been due to decreasing use of heroin without a needle. In 2012 there were significant decreases in use of heroin without a needle for 8th and 12th graders. All grades were at 0.3% or 0.4% annual prevalence in 2012.
Use with a needle has fluctuated less over time, though in 2010 twelfth graders showed a significant increase to 0.7%, about where it remained in 2011 (0.6%). In 2012 all three grades were at 0.4% using with a needle, and there was little change from 2011.
Perceived Risk
Students have long seen heroin to be one of the most dangerous drugs, which helps to account for both the consistently high level of personal disapproval of use (see below) and the quite low prevalence of use. Nevertheless, perceived risk levels have changed some over the years. Between 1975 and 1986, perceived risk gradually declined, even though use dropped and then stabilized in that interval. Then there was a big spike in 1987 (when perceived risk for cocaine also jumped dramatically), where it held for four years. In 1992, perceived risk dropped to a lower plateau again, presaging an increase in use a year or two later. Perceived risk rose in the latter half of the 1990s, and use leveled off and then declined. Perceived risk of use without a needle rose in 8th and 10th grades between 1995 and 1997, foretelling an end to the increase in use. Note that perceived risk has served as a leading indicator of use for this drug as well as a number of others. During the 2000s, perceived risk has been relatively stable in all three grades along with use.
Disapproval
There has been little fluctuation in the very high levels of disapproval of heroin use over the years, and the small changes that have occurred have been generally consistent with changes in perceived risk and use. In 2012, disapproval of using heroin without a needle increased among 12th graders.
Availability
The proportion of 12th-grade students saying they could get heroin fairly easily if they wanted some remained around 20% through the mid-1980s; it then increased considerably from 1986 to 1992 before stabilizing at about 35% from 1992 through 1998. Since then availability has been in decline. At the lower grade levels, reported availability has been markedly lower. Heroin availability has declined gradually, but substantially, since the mid-1990s in all three grades, and it continues to do so in 2012.
28
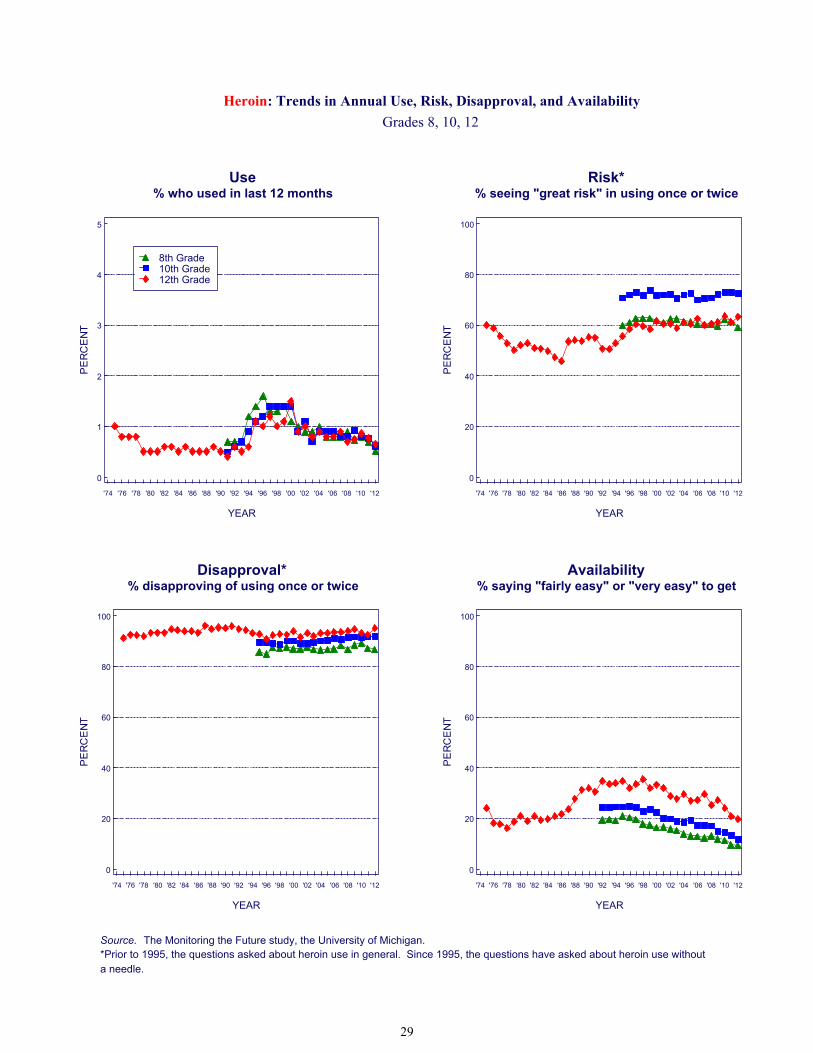
Heroin: Trends in Annual Use, Risk, Disapproval, and Availability
Grades 8, 10, 12
Source. The Monitoring the Future study, the University of Michigan.*Prior to 1995, the questions asked about heroin use in general. Since 1995, the questions have asked about heroin use withouta needle.
Use% who used in last 12 months
Risk*% seeing "great risk" in using once or twice
Disapproval*% disapproving of using once or twice
Availability% saying "fairly easy" or "very easy" to get
PE
RC
EN
T
0
1
2
3
4
5
YEAR
'74 '76 '78 '80 '82 '84 '86 '88 '90 '92 '94 '96 '98 '00 '02 '04 '06 '08 '10 '12
8th Grade10th Grade12th Grade
PE
RC
EN
T
0
20
40
60
80
100
YEAR
'74 '76 '78 '80 '82 '84 '86 '88 '90 '92 '94 '96 '98 '00 '02 '04 '06 '08 '10 '12
PE
RC
EN
T
0
20
40
60
80
100
YEAR
'74 '76 '78 '80 '82 '84 '86 '88 '90 '92 '94 '96 '98 '00 '02 '04 '06 '08 '10 '12
PE
RC
EN
T
0
20
40
60
80
100
YEAR
'74 '76 '78 '80 '82 '84 '86 '88 '90 '92 '94 '96 '98 '00 '02 '04 '06 '08 '10 '12
29
Other Narcotic Drugs, Including OxyContin and Vicodin There are a number of narcotic drugs other than heroin—all controlled substances. Many are analgesics that can be prescribed by physicians and dentists for pain. Like heroin, many are derived from opium, but there are also a number of synthetic analogues in use today, with OxyContin and Vicodin being two of the major ones. Throughout the life of the MTF study, we have asked about the use of any narcotic drug other than heroin without specifying which one. Examples of drugs in the class are provided in the question stem. In one of the six 12th-grade questionnaire forms, however, respondents indicating that they had used any narcotic in the past 12 months were then asked to check which of a fairly long list of such drugs they used. Table E-4 in Volume I of this annual monograph series provides trends in their annual prevalence data. In the late 1970s, opium and codeine were among the narcotics most widely used. In recent years Vicodin, codeine, Percocet, and OxyContin have been the most prevalent.
Trends in Use
Use is reported only for 12th graders, because we considered the data from 8th and 10th graders to be of questionable validity. As shown in the first panel of the facing page, 12th graders’ use of narcotics other than heroin generally trended down from about 1977 through 1992, dropping considerably. After 1992 use rose rather steeply as all forms of substance use were increasing, with annual prevalence nearly tripling from 3.3% in 1992 to 9.5% in 2004, before leveling. (In 2002 the question was revised to add Vicodin, OxyContin, and Percocet to the examples given, which clearly had the effect of increasing reported prevalence, as may be seen in the first panel on the facing page. So the extent of the increase over the full time span likely is exaggerated, but probably not by much, because these drugs came onto the scene later,
during the rise. They simply were not being fully reported until the late 1990s.) Use rates for two narcotics of recent interest—OxyContin and Vicodin—are presented in the second and third panels on the facing page, in a departure from the usual arrangement. There are no data to display for disapproval of use of narcotics other than heroin, and only limited data on perceived risk (since 2010). OxyContin use increased some in all grades from 2002 (when it was first measured) through 2011, though the trend lines have been irregular. In 2012 the prevalence rate dropped in all three grades; though no single grade change was significant, the change for the three grades combined was. Annual prevalence in 2012 was 1.6%, 3.0%, and 4.3% in grades 8, 10, and 12, respectively. Use of Vicodin, on the other hand, remained fairly steady at somewhat higher levels since 2002, until among 10th and 12th graders its use declined after 2009. Use among 8th graders also declined in 2011. In 2012 annual prevalence rates were 1.3%, 4.4%, and 7.5% in grades 8, 10, and 12; and the decline in 2012 was significant for the three grades combined.
Availability
Questions were asked about the availability of narcotics other than heroin, taken as a class. Perceived availability increased gradually among 12th graders from 1978 through 1989, even as reported use was dropping. Perceived availability then rose further, from 1991 through 2001, as use rose quite sharply before leveling by about 2000 and then declining after 2006. In contrast, perceived availability has declined among 8th and 10th graders since the late 1990s. (A change in question wording in 2010 to include OxyContin and Vicodin as examples presumably accounts for the considerable jump in reported availability that year.) Availability declined further in all three grades in 2011 and 2012.
30

Narcotics other than Heroin (including OxyContin and Vicodin) :
Trends in Annual Use and Availability
Grades 8, 10, 12
Source. The Monitoring the Future study, the University of Michigan.*Beginning in 2002, a revised set of questions on other narcotics use was introduced in which Talwin, laudanum, and paregoricwere replaced with Vicodin, OxyContin, and Percocet.**In 2010 the list of examples was changed from methadone, opium to Vicodin, OxyContin, Percocet, etc.
Use of Narcotics other than Heroin% who used any narcotics other than heroin
in last 12 months*OxyContin Use
% who used OxyContin in last 12 months
Vicodin Use% who used Vicodin in last 12 months
Availability of Narcotics other than Heroin**% saying "fairly easy" or "very easy" to get
PE
RC
EN
T
0
4
8
12
16
20
YEAR
'74 '76 '78 '80 '82 '84 '86 '88 '90 '92 '94 '96 '98 '00 '02 '04 '06 '08 '10 '12
8th Grade10th Grade12th Grade
PE
RC
EN
T0
4
8
12
16
20
YEAR
'74 '76 '78 '80 '82 '84 '86 '88 '90 '92 '94 '96 '98 '00 '02 '04 '06 '08 '10 '12
PE
RC
EN
T
0
4
8
12
16
20
YEAR
'74 '76 '78 '80 '82 '84 '86 '88 '90 '92 '94 '96 '98 '00 '02 '04 '06 '08 '10 '12
PE
RC
EN
T
0
20
40
60
80
100
YEAR
'74 '76 '78 '80 '82 '84 '86 '88 '90 '92 '94 '96 '98 '00 '02 '04 '06 '08 '10 '12
31
Tranquilizers Tranquilizers are psychotherapeutic drugs that are legally sold only by prescription, like amphetamines. They are central nervous depressants and, for the most part, comprise benzodiazepines (minor tranquilizers), although some nonbenzodiazepines have been introduced. Respondents are instructed to exclude any medically prescribed use from their answers. At present, Xanax is the tranquilizer most commonly used by 12th graders (only 12th graders are asked to indicate which specific tranquilizers they used). (See Table E-3 in appendix E of Volume I in this monograph series for details.) Valium, Klonopin, and Soma are other tranquilizers, used at somewhat lower levels. In 2001 the examples given in the tranquilizer question were modified to reflect changes in the drugs in common use—Miltown was dropped and Xanax was added. As the first panel on the facing page shows, this caused a modest increase in the reported level of tranquilizer use in the upper grades, so we have broken the trend line to reflect the point of redefinition.
Trends in Use
During the late 1970s and all of the 1980s, tranquilizers fell steadily from popularity, with 12th graders’ use declining by three fourths over the 15-year interval between 1977 and 1992. Their use then increased, as happened with many other drugs during the 1990s. Annual prevalence more than doubled among 12th graders, rising steadily through 2002, before leveling. Use also rose steadily among 10th graders, but began to decline some in 2002. Use peaked much earlier among 8th graders, in 1996, and then declined slightly for two years. Tranquilizer use has remained relatively stable since then among 8th graders, at considerably lower levels than the upper
two grades, though they did show a significant decline in 2011followed by a modest further decline in 2012. From 2002 to 2005 there was some decline among 10th graders, followed by a leveling then a resumption of the decline in 2011, while among 12th graders there was a very gradual decline from 2002 through 2007, before leveling and then decreasing in 2010 and 2012. This staggered pattern of change suggests that a cohort effect has been at work. At present the prevalence of use of these prescription-type drugs is modestly lower than their recent peak levels, with annual prevalence rates of 1.8%, 4.3%, and 5.3% in grades 8, 10, and 12, respectively.
Perceived Risk and Disapproval
Data have not been collected on perceived risk and disapproval primarily due to questionnaire space limitations.
Availability
As the number of 12th graders reporting non-medically prescribed tranquilizer use fell dramatically during the 1970s and 1980s, so did the proportion saying that tranquilizers would be fairly or very easy to get. Whether declining use caused the decline in availability or vice versa is unclear. However, 12th graders’ perceived availability has continued to fall since then, even as use rebounded in the 1990s; it is now down by more than three fourths over the life of the study—from 72% in 1975 to 15% by 2012 saying that tranquilizers would be fairly or very easy to get if they wanted some. Availability has fallen fairly continuously since 1991 in the lower grades as well, though not as sharply. The declines have continued in 2012 in all three grades.
32

Tranquilizers : Trends in Annual Use and Availability
Grades 8, 10, 12
Source. The Monitoring the Future study, the University of Michigan.*Beginning in 2001, a revised set of questions on tranquilizer use was introduced in which Xanax replaced Miltown in thelist of examples.
Use*% who used in last 12 months
Risk% seeing "great risk" in using once or twice
Disapproval% disapproving of using once or twice
Availability% saying "fairly easy" or "very easy" to get
PE
RC
EN
T
0
6
12
18
24
30
YEAR
'74 '76 '78 '80 '82 '84 '86 '88 '90 '92 '94 '96 '98 '00 '02 '04 '06 '08 '10 '12
8th Grade10th Grade12th Grade
PE
RC
EN
T
0
20
40
60
80
100
YEAR
'74 '76 '78 '80 '82 '84 '86 '88 '90 '92 '94 '96 '98 '00 '02 '04 '06 '08 '10 '12
(no data)
PE
RC
EN
T
0
20
40
60
80
100
YEAR
'74 '76 '78 '80 '82 '84 '86 '88 '90 '92 '94 '96 '98 '00 '02 '04 '06 '08 '10 '12
(no data)
PE
RC
EN
T
0
20
40
60
80
100
YEAR
'74 '76 '78 '80 '82 '84 '86 '88 '90 '92 '94 '96 '98 '00 '02 '04 '06 '08 '10 '12
33
Sedatives (Barbiturates) Like tranquilizers, sedatives are prescription-controlled psychotherapeutic drugs that act as central nervous system depressants. They are used to assist sleep and relieve anxiety. Though for many years respondents have been asked specifically about their use of barbiturate sedatives, they likely have been including other classes of sedatives in their answers. In 2004 the question on use was revised to say “sedatives/barbiturates”—a change that appeared to have no impact on reported levels of use. Respondents are told for what purposes sedatives are prescribed and are instructed to exclude from their answers any use under medical supervision. Usage data are reported only for 12th graders because we believe that 8th- and 10th-grade students tend to overreport use, perhaps including in their answers their use of nonprescription sleep aids or other over-the-counter drugs.
Trends in Use
As with tranquilizers, the use of sedatives (bar-biturates) fell steadily among 12th graders from the mid-1970s through the early 1990s. From 1975 to 1992 annual prevalence fell by three fourths, from 10.7% to 2.8%. As with many other drugs, a gradual, long-term resurgence in sedative use occurred after 1992, but unlike the case with most illegal drugs, sedative (barbiturate) use continued to rise steadily through 2005, well beyond the point at which the use of most illegal drugs began falling. Use has declined some since 2005, and by 2012 the annual prevalence rate is down by about four tenths from its recent peak. The sedative methaqualone has been included in the MTF study from the very beginning, and has never been as popular as barbiturates; use rates have generally been declining since 1975, reaching an annual prevalence of just 0.5% in 2007, about where it has remained since.
Perceived Risk
Trying sedatives (barbiturates) was never seen by most students as very dangerous; and it is clear from
the second panel on the facing page that changes in perceived risk cannot explain the trends in use that occurred from 1975 through 1986, when perceived risk was actually declining along with use. But then perceived risk shifted up some through 1991 while use was still falling. It dropped back some through 1995, as use was increasing, and then remained relatively stable for a few years. Perceived risk has generally been at quite low levels, which may help to explain why the use of this class of psychotherapeutic drugs (and likely others) has stayed at relatively high levels in the first half of the decade of the 2000s. However, perceived risk began to rise a bit after 2000, foretelling the decline in use that began after 2005. When the term “sedatives” was changed to “sedatives/barbiturates” in 2004, the trend line shifted down slightly, but perceived risk has continued to climb some until 2009, before leveling. As perceived risk has risen, use has declined some.
Disapproval
Like many illicit drugs other than marijuana, sedative (barbiturate) use has received the disapproval of most high school seniors since 1975, with some variation in disapproval rates that have moved consistently with usage patterns. The necessary change in question wording in 2004 appeared to lessen disapproval slightly. There has been some modest increase in disapproval since 2000.
Availability
As the fourth panel on the facing page shows, the perceived availability of sedatives (barbiturates) has generally been declining during most of the life of the study, except for one upward shift that occurred in 1981—a year in which look-alike drugs became more widespread. (The necessary change in question text in 2004 appears to have had the effect of increasing reported availability among 12th graders but not among students in the lower grades.) As with tranquilizers, perceived availability for sedatives (barbiturates) continued its long term decline in 2012.
34
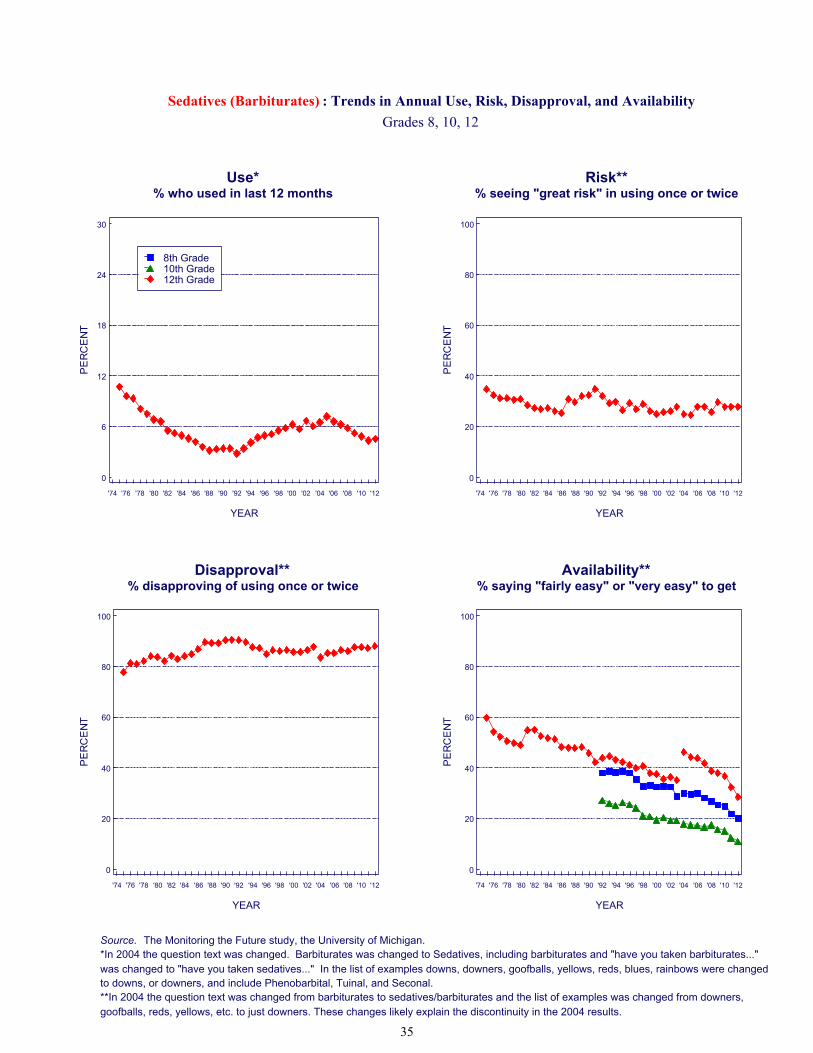
Sedatives (Barbiturates) : Trends in Annual Use, Risk, Disapproval, and Availability
Grades 8, 10, 12
Source. The Monitoring the Future study, the University of Michigan.*In 2004 the question text was changed. Barbiturates was changed to Sedatives, including barbiturates and "have you taken barbiturates..."was changed to "have you taken sedatives..." In the list of examples downs, downers, goofballs, yellows, reds, blues, rainbows were changedto downs, or downers, and include Phenobarbital, Tuinal, and Seconal.**In 2004 the question text was changed from barbiturates to sedatives/barbiturates and the list of examples was changed from downers,goofballs, reds, yellows, etc. to just downers. These changes likely explain the discontinuity in the 2004 results.
Use*% who used in last 12 months
Risk**% seeing "great risk" in using once or twice
Disapproval**% disapproving of using once or twice
Availability**% saying "fairly easy" or "very easy" to get
PE
RC
EN
T
0
6
12
18
24
30
YEAR
'74 '76 '78 '80 '82 '84 '86 '88 '90 '92 '94 '96 '98 '00 '02 '04 '06 '08 '10 '12
8th Grade10th Grade12th Grade
PE
RC
EN
T
0
20
40
60
80
100
YEAR
'74 '76 '78 '80 '82 '84 '86 '88 '90 '92 '94 '96 '98 '00 '02 '04 '06 '08 '10 '12
PE
RC
EN
T
0
20
40
60
80
100
YEAR
'74 '76 '78 '80 '82 '84 '86 '88 '90 '92 '94 '96 '98 '00 '02 '04 '06 '08 '10 '12
PE
RC
EN
T
0
20
40
60
80
100
YEAR
'74 '76 '78 '80 '82 '84 '86 '88 '90 '92 '94 '96 '98 '00 '02 '04 '06 '08 '10 '12
35
Ecstasy (MDMA) and Other “Club Drugs”
“Club drugs,” so called because they have been popular at night clubs and raves, include LSD, MDMA (ecstasy), methamphetamine, GHB (gammahydroxybutyrate), ketamine (special K), and Rohypnol. (For discussion of LSD and methamphetamine, see prior pages in this Overview.) Rohypnol and GHB are labeled date rape drugs because they can have amnesiac effects and be added to food or drink without a victim's knowledge. By 2011, both drugs had shown significant declines since their peak levels of annual use (Table 6). In 2011, annual prevalence for Rohypnol use was 0.8%, 0.6%, and 1.3%, and for GHB use, 0.6%, 0.5%, and 1.4% in grades 8, 10, and 12, respectively. Annual prevalence for another club drug, ketamine, had also shown significant declines, and was at 0.8%, 1.2%, and 1.7% in 2011. Questions about GHB and ketamine use were dropped from the 2012 surveys of 8th and 10th graders. In 2012, annual prevalence among 12th graders for Rohypnol, GHB, and ketamine was 1.5%, 1.4%, and 1.5%, respectively. Annual prevalence among 8th and 10th graders for Rohypnol was 0.4% and 0.5%. No questions about risk, disapproval, or availability are asked for Rohypnol, GHB, or ketamine.
Trends in Ecstasy Use
Ecstasy (3,4-methylenedioxymethamphetamine or MDMA) is used more for its mildly hallucinogenic properties than for its stimulant properties. Questions on ecstasy use were added to 8th-, 10th-, and 12th-grade surveys in 1996. At that time annual prevalence of ecstasy use in high school was 4.6%—considerably higher than among college students and young adults (surveyed for MDMA since 1989)—but it fell over the next two years. Use then rose sharply from 1999 to 2001, bringing annual prevalence up to 6.2% among 10th graders and 9.2% among 12th graders. From 2000 to 2001, use also began to rise among 8th graders, (3.5%). In 2002, use decreased sharply—by about one fifth—in all three grades, followed by an even sharper decline in 2003. Decelerated drops continued into 2004. By 2005 the decline halted among 8th and 10th graders but continued for another year among 12th graders. A rebound in high school use over the next two to three years raised concerns abbout a new epidemic of ecstasy use but after 2007 the trend lines leveled off in all grades. Use again
increased significantly in the lower grades from 2009 to 2010 (1.3% to 2.4% in 8th and 3.7% to 4.7% in 10th grade), but then declined in 2011 in both grades. Use among 12th graders increased in 2011, but use declined significantly in all three grades in 2012.
Perceived Risk of Ecstasy Use
In 2001, 12th graders’ perceived risk of ecstasy use jumped by eight percentage points and in 2002 by another seven. Significant increases occurred in 2003 for all grades. This sharp rise likely explains the drop in use that we predicted. From 2004 to 2011 we saw a troubling drop in perceived risk (first among 8th and 10th, and then among 12th graders), corresponding to the increase in use in the upper two grades and then in all three grades. This suggests a generational forgetting of the dangers of ecstasy use resulting from generational replacement. In 2012 only 8th grade showed much further decline. The rebound in use after 2004 might be explained by the sizable drop in perceived risk, but the recent decline of perceived risk cannot explain the decline in use in 2012.
Disapproval of Ecstasy Use
Disapproval of ecstasy use declined some after 1998 but increased significantly in all three grades in 2002, perhaps due to the rise in perceived risk. The rise in disapproval continued through 2003 for 8th, 2004 for 10th, and 2006 for 12th graders, suggesting some cohort effect. After those peaks, disapproval dropped sharply among 8th graders before leveling, dropped by less among 10th graders before leveling, and did not drop among 12th graders until 2010—suggesting a cohort effect. We previously stated that the erosion in perceived risk and disapproval—which has been sharpest among 8th graders—left these age groups more vulnerable to a possible rebound in ecstasy use; some rebound appears to have occurred.
Availability of Ecstasy
The figure shows a dramatic rise in 12th graders’ perceived availability of ecstasy after 1991, particular-ly between 1999 and 2001, consistent with informal reports about growing importation of the drug. Perceived availability then declined considerably in all grades after 2001 and continues to decline in the lower grades. Therefore, decreased availability may account for the drop in use in 2012.
36
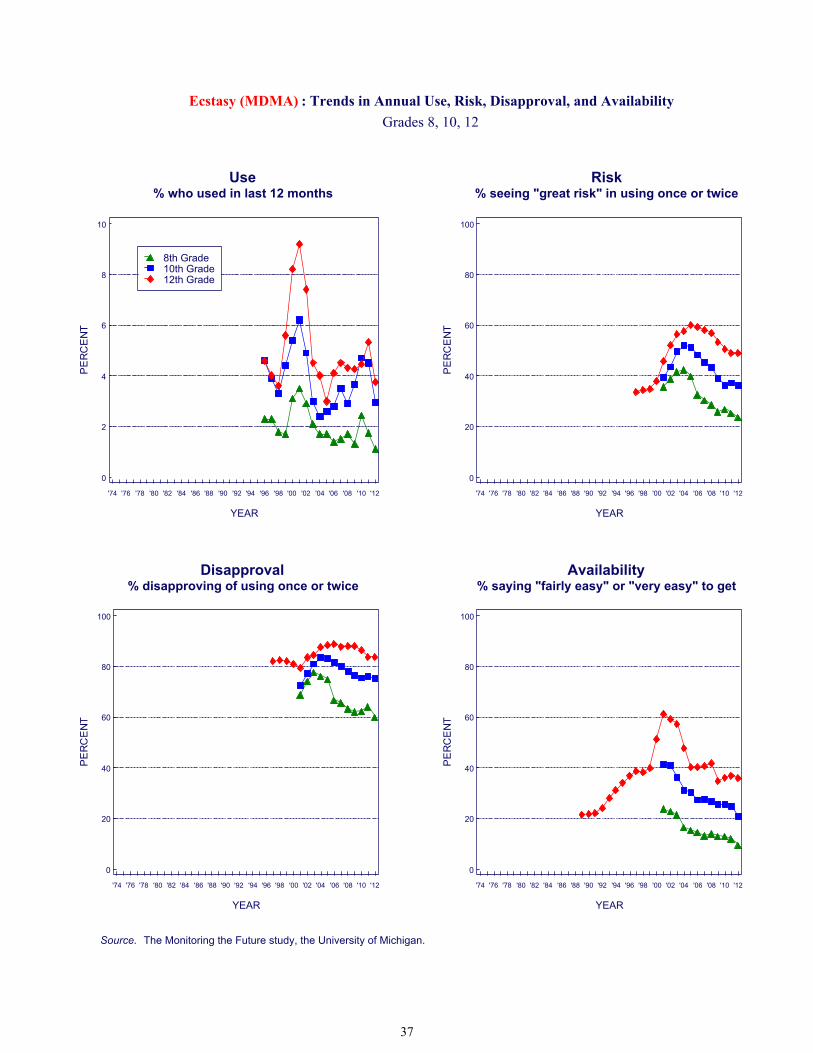
Ecstasy (MDMA) : Trends in Annual Use, Risk, Disapproval, and Availability
Grades 8, 10, 12
Source. The Monitoring the Future study, the University of Michigan.
Use% who used in last 12 months
Risk% seeing "great risk" in using once or twice
Disapproval% disapproving of using once or twice
Availability% saying "fairly easy" or "very easy" to get
PE
RC
EN
T
0
2
4
6
8
10
YEAR
'74 '76 '78 '80 '82 '84 '86 '88 '90 '92 '94 '96 '98 '00 '02 '04 '06 '08 '10 '12
8th Grade10th Grade12th Grade
PE
RC
EN
T
0
20
40
60
80
100
YEAR
'74 '76 '78 '80 '82 '84 '86 '88 '90 '92 '94 '96 '98 '00 '02 '04 '06 '08 '10 '12
PE
RC
EN
T
0
20
40
60
80
100
YEAR
'74 '76 '78 '80 '82 '84 '86 '88 '90 '92 '94 '96 '98 '00 '02 '04 '06 '08 '10 '12
PE
RC
EN
T
0
20
40
60
80
100
YEAR
'74 '76 '78 '80 '82 '84 '86 '88 '90 '92 '94 '96 '98 '00 '02 '04 '06 '08 '10 '12
37
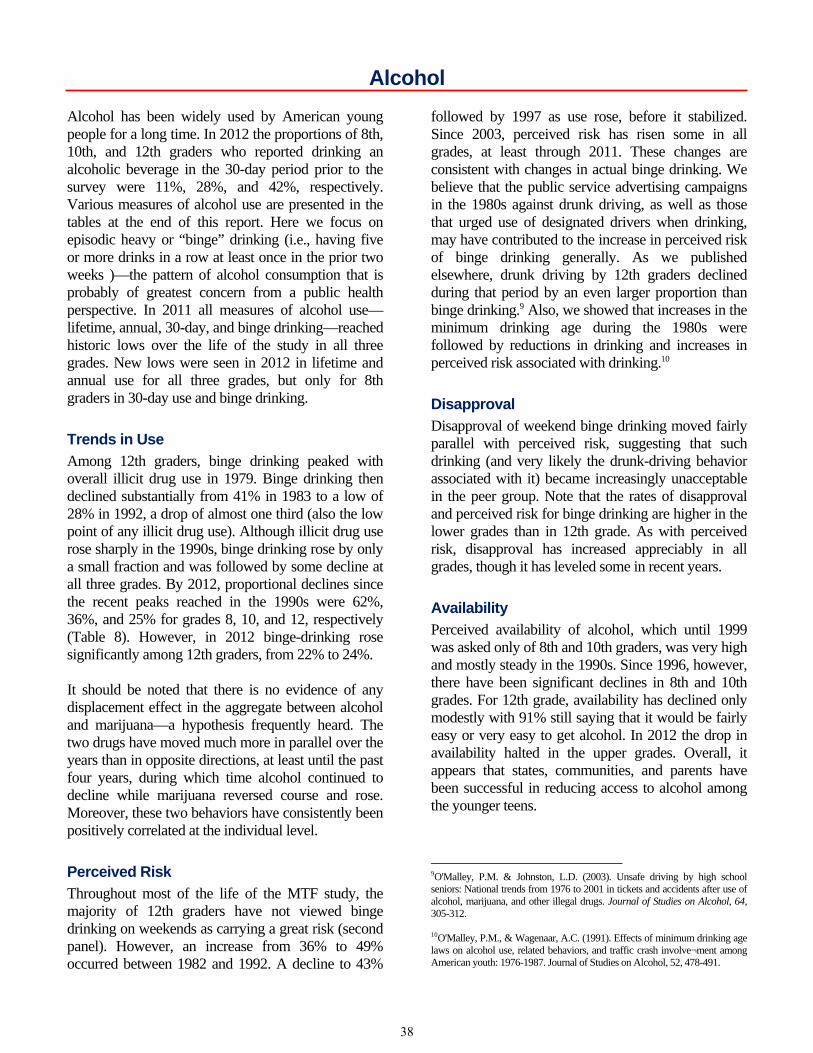
Alcohol Alcohol has been widely used by American young people for a long time. In 2012 the proportions of 8th, 10th, and 12th graders who reported drinking an alcoholic beverage in the 30-day period prior to the survey were 11%, 28%, and 42%, respectively. Various measures of alcohol use are presented in the tables at the end of this report. Here we focus on episodic heavy or “binge” drinking (i.e., having five or more drinks in a row at least once in the prior two weeks )—the pattern of alcohol consumption that is probably of greatest concern from a public health perspective. In 2011 all measures of alcohol use—lifetime, annual, 30-day, and binge drinking—reached historic lows over the life of the study in all three grades. New lows were seen in 2012 in lifetime and annual use for all three grades, but only for 8th graders in 30-day use and binge drinking.
Trends in Use
Among 12th graders, binge drinking peaked with overall illicit drug use in 1979. Binge drinking then declined substantially from 41% in 1983 to a low of 28% in 1992, a drop of almost one third (also the low point of any illicit drug use). Although illicit drug use rose sharply in the 1990s, binge drinking rose by only a small fraction and was followed by some decline at all three grades. By 2012, proportional declines since the recent peaks reached in the 1990s were 62%, 36%, and 25% for grades 8, 10, and 12, respectively (Table 8). However, in 2012 binge-drinking rose significantly among 12th graders, from 22% to 24%. It should be noted that there is no evidence of any displacement effect in the aggregate between alcohol and marijuana—a hypothesis frequently heard. The two drugs have moved much more in parallel over the years than in opposite directions, at least until the past four years, during which time alcohol continued to decline while marijuana reversed course and rose. Moreover, these two behaviors have consistently been positively correlated at the individual level.
Perceived Risk
Throughout most of the life of the MTF study, the majority of 12th graders have not viewed binge drinking on weekends as carrying a great risk (second panel). However, an increase from 36% to 49% occurred between 1982 and 1992. A decline to 43%
followed by 1997 as use rose, before it stabilized. Since 2003, perceived risk has risen some in all grades, at least through 2011. These changes are consistent with changes in actual binge drinking. We believe that the public service advertising campaigns in the 1980s against drunk driving, as well as those that urged use of designated drivers when drinking, may have contributed to the increase in perceived risk of binge drinking generally. As we published elsewhere, drunk driving by 12th graders declined during that period by an even larger proportion than binge drinking.9 Also, we showed that increases in the minimum drinking age during the 1980s were followed by reductions in drinking and increases in perceived risk associated with drinking.10
Disapproval
Disapproval of weekend binge drinking moved fairly parallel with perceived risk, suggesting that such drinking (and very likely the drunk-driving behavior associated with it) became increasingly unacceptable in the peer group. Note that the rates of disapproval and perceived risk for binge drinking are higher in the lower grades than in 12th grade. As with perceived risk, disapproval has increased appreciably in all grades, though it has leveled some in recent years.
Availability
Perceived availability of alcohol, which until 1999 was asked only of 8th and 10th graders, was very high and mostly steady in the 1990s. Since 1996, however, there have been significant declines in 8th and 10th grades. For 12th grade, availability has declined only modestly with 91% still saying that it would be fairly easy or very easy to get alcohol. In 2012 the drop in availability halted in the upper grades. Overall, it appears that states, communities, and parents have been successful in reducing access to alcohol among the younger teens.
9O'Malley, P.M. & Johnston, L.D. (2003). Unsafe driving by high school seniors: National trends from 1976 to 2001 in tickets and accidents after use of alcohol, marijuana, and other illegal drugs. Journal of Studies on Alcohol, 64, 305-312. 10O'Malley, P.M., & Wagenaar, A.C. (1991). Effects of minimum drinking age laws on alcohol use, related behaviors, and traffic crash involve¬ment among American youth: 1976-1987. Journal of Studies on Alcohol, 52, 478-491.
38
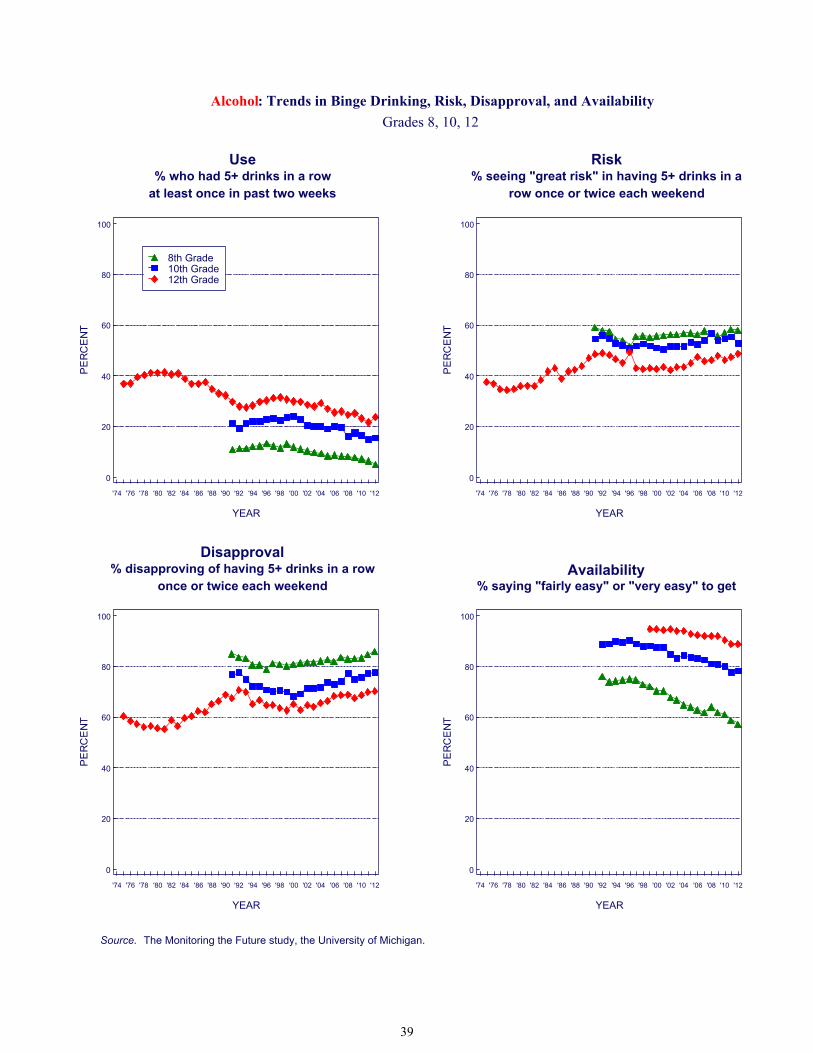
Alcohol: Trends in Binge Drinking, Risk, Disapproval, and Availability
Grades 8, 10, 12
Source. The Monitoring the Future study, the University of Michigan.
Use% who had 5+ drinks in a row
at least once in past two weeks
Risk% seeing "great risk" in having 5+ drinks in a
row once or twice each weekend
Disapproval% disapproving of having 5+ drinks in a row
once or twice each weekendAvailability
% saying "fairly easy" or "very easy" to get
PE
RC
EN
T
0
20
40
60
80
100
YEAR
'74 '76 '78 '80 '82 '84 '86 '88 '90 '92 '94 '96 '98 '00 '02 '04 '06 '08 '10 '12
8th Grade10th Grade12th Grade
PE
RC
EN
T
0
20
40
60
80
100
YEAR
'74 '76 '78 '80 '82 '84 '86 '88 '90 '92 '94 '96 '98 '00 '02 '04 '06 '08 '10 '12
PE
RC
EN
T
0
20
40
60
80
100
YEAR
'74 '76 '78 '80 '82 '84 '86 '88 '90 '92 '94 '96 '98 '00 '02 '04 '06 '08 '10 '12
PE
RC
EN
T
0
20
40
60
80
100
YEAR
'74 '76 '78 '80 '82 '84 '86 '88 '90 '92 '94 '96 '98 '00 '02 '04 '06 '08 '10 '12
39

Cigarettes Cigarette smoking is the leading cause of preventable disease and mortality in the United States, and is usually initiated in adolescence. That makes what happens in adolescence particularly important.
Trends in Use
Differences in smoking rates between various birth cohorts (or, in this case, school class cohorts) tend to stay with those cohorts throughout the life cycle. This means that it is critical to prevent smoking very early. It also means that the trends in a given historical period may differ across various grade levels as changes in use occurring earlier in adolescence work their way up the age spectrum ( i.e., “cohort effects”). Among 12th graders, 30-day prevalence of smoking reached a peak in 1976, at 39%. (The peak likely occurred considerably earlier at lower grade levels as these same class cohorts passed through them in previous years.) After about a one quarter drop in 12th-grade 30-day prevalence between 1976 and 1981, the rate remained there until 1992 (28%). In the 1990s, smoking began to rise sharply, after 1991 among 8th and 10th graders and 1992 among 12th graders. Over the next four to five years, smoking rates increased by about one half in the lower two grades and by almost one third in grade 12—very substantial increases to which MTF drew public attention. Smoking peaked in 1996 for 8th and 10th graders and in 1997 for 12th graders before beginning a fairly steady and substantial decline that continued through 2004 for 8th and 10th graders (12th graders increased a bit in 2004). Between the peak levels in the mid-1990s and 2004, 30-day prevalence of smoking declined by 56% in 8th grade, 47% in 10th, and 32% in 12th. It is noteworthy, however, that this important decline in adolescent smoking decelerated sharply after about 2002. There was some further decline after 2004 in all grades, but the declines appeared to end in the lower two grades in 2010. In both 2011 and 2012, however, declines occurred in all three grades. An increase in 2009 in federal taxes on cigarettes (from $0.39 to $1.01 per pack) may have contributed to this resumption of the declines in use.
Perceived Risk
Among 12th graders, the proportion seeing great risk in pack-a-day smoking rose before and during the first
period of decline in use in the late 1970s. It leveled in 1980 (before use leveled), declined a bit in 1982, but then started to rise again gradually for five years. (It is possible that cigarette advertising effectively offset the influence of rising perceptions of risk during that period.) Perceived risk fell some in the early 1990s at all three grade levels as use increased sharply. Since then, there has generally been an increase (though not entirely consistently) in perceived risk. All three grades showed an increase in 2011, accompanied by a decline in use; the 2012 levels of perceived risk are the highest ever observed. Note the differences in the extent of perceived risk among grade levels. There is a clear age effect; alas, by the time most youngsters fully appreciate the hazards of smoking, many of their classmates have already initiated the behavior.
Disapproval
Disapproval rates for smoking have been fairly high throughout the study and, unlike perceived risk, are higher in the lower grade levels. Among 12th graders, there was a gradual increase in disapproval of smoking from 1976 to 1986, some erosion over the following five years, and then steeper erosion from the early 1990s through 1997. After 1997, disapproval rose for some years in all three grades, but leveled in grade 12 after 2006 and in the lower grades after 2007. Disapproval has risen further over the past two years. We measure a number of other smoking-related attitudes; these became increasingly negative for some years, but leveled off four to five years ago (see Table 3 in the 2012 MTF press release on teen smoking, http://www.monitoringthefuture.org/press.html).
Availability
When the question was first introduced in 1992, availability of cigarettes was reported to be very high by 8th graders (78% saying fairly or very easy to get) and 10th graders (89%). (We do not ask the question of 12th graders, for whom we assume accessibility to be nearly universal.) Since 1996, availability has declined considerably, especially among 8th graders. Some 51% of 8th graders and 73% of 10th graders now say that cigarettes would be easy to get, reflecting declines since 1992 of 35 and 18 percentage points, respectively.
40
Cigarettes: Trends in 30-Day Use, Risk, Disapproval, and Availability
Grades 8, 10, 12
Source. The Monitoring the Future study, the University of Michigan.
Use% who used in last 30 days
Risk% seeing "great risk" in smoking a pack
or more per day
Disapproval% disapproving of smoking a pack
or more per dayAvailability
% saying "fairly easy" or "very easy" to get
PE
RC
EN
T
0
20
40
60
80
100
YEAR
'74 '76 '78 '80 '82 '84 '86 '88 '90 '92 '94 '96 '98 '00 '02 '04 '06 '08 '10 '12
8th Grade10th Grade12th Grade
PE
RC
EN
T
0
20
40
60
80
100
YEAR
'74 '76 '78 '80 '82 '84 '86 '88 '90 '92 '94 '96 '98 '00 '02 '04 '06 '08 '10 '12
PE
RC
EN
T
0
20
40
60
80
100
YEAR
'74 '76 '78 '80 '82 '84 '86 '88 '90 '92 '94 '96 '98 '00 '02 '04 '06 '08 '10 '12
PE
RC
EN
T
0
20
40
60
80
100
YEAR
'74 '76 '78 '80 '82 '84 '86 '88 '90 '92 '94 '96 '98 '00 '02 '04 '06 '08 '10 '12
41
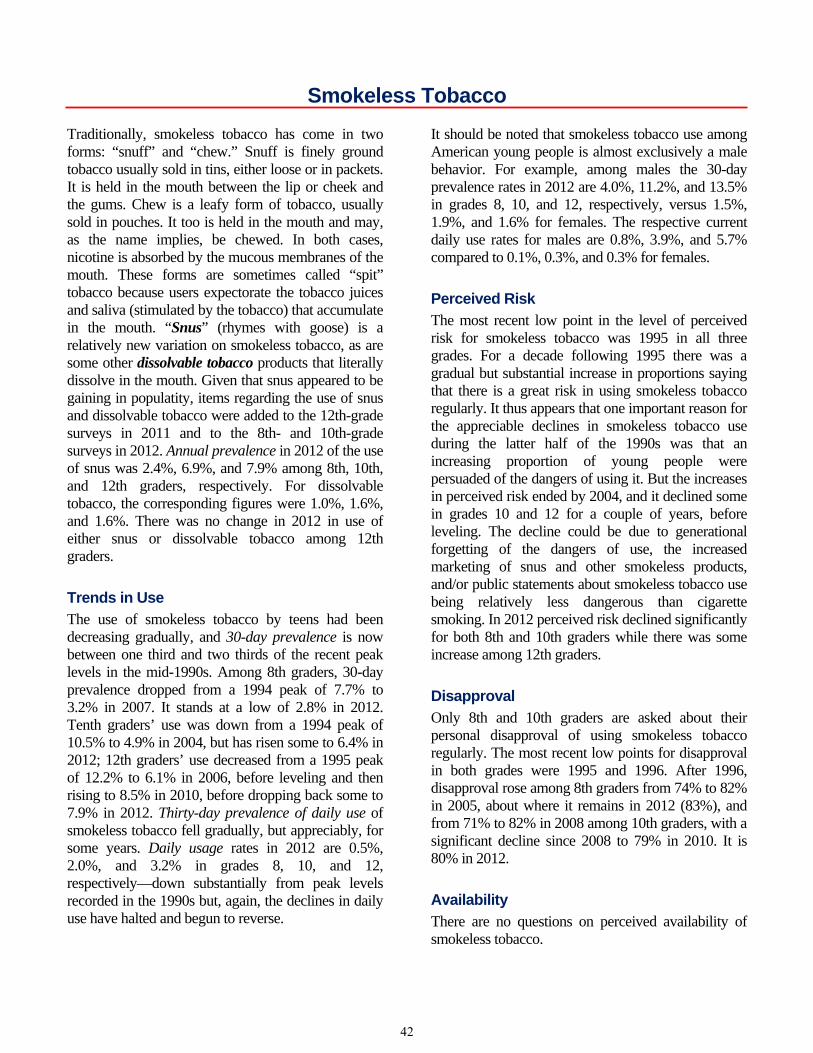
Smokeless Tobacco Traditionally, smokeless tobacco has come in two forms: “snuff” and “chew.” Snuff is finely ground tobacco usually sold in tins, either loose or in packets. It is held in the mouth between the lip or cheek and the gums. Chew is a leafy form of tobacco, usually sold in pouches. It too is held in the mouth and may, as the name implies, be chewed. In both cases, nicotine is absorbed by the mucous membranes of the mouth. These forms are sometimes called “spit” tobacco because users expectorate the tobacco juices and saliva (stimulated by the tobacco) that accumulate in the mouth. “Snus” (rhymes with goose) is a relatively new variation on smokeless tobacco, as are some other dissolvable tobacco products that literally dissolve in the mouth. Given that snus appeared to be gaining in populatity, items regarding the use of snus and dissolvable tobacco were added to the 12th-grade surveys in 2011 and to the 8th- and 10th-grade surveys in 2012. Annual prevalence in 2012 of the use of snus was 2.4%, 6.9%, and 7.9% among 8th, 10th, and 12th graders, respectively. For dissolvable tobacco, the corresponding figures were 1.0%, 1.6%, and 1.6%. There was no change in 2012 in use of either snus or dissolvable tobacco among 12th graders.
Trends in Use
The use of smokeless tobacco by teens had been decreasing gradually, and 30-day prevalence is now between one third and two thirds of the recent peak levels in the mid-1990s. Among 8th graders, 30-day prevalence dropped from a 1994 peak of 7.7% to 3.2% in 2007. It stands at a low of 2.8% in 2012. Tenth graders’ use was down from a 1994 peak of 10.5% to 4.9% in 2004, but has risen some to 6.4% in 2012; 12th graders’ use decreased from a 1995 peak of 12.2% to 6.1% in 2006, before leveling and then rising to 8.5% in 2010, before dropping back some to 7.9% in 2012. Thirty-day prevalence of daily use of smokeless tobacco fell gradually, but appreciably, for some years. Daily usage rates in 2012 are 0.5%, 2.0%, and 3.2% in grades 8, 10, and 12, respectively—down substantially from peak levels recorded in the 1990s but, again, the declines in daily use have halted and begun to reverse.
It should be noted that smokeless tobacco use among American young people is almost exclusively a male behavior. For example, among males the 30-day prevalence rates in 2012 are 4.0%, 11.2%, and 13.5% in grades 8, 10, and 12, respectively, versus 1.5%, 1.9%, and 1.6% for females. The respective current daily use rates for males are 0.8%, 3.9%, and 5.7% compared to 0.1%, 0.3%, and 0.3% for females.
Perceived Risk
The most recent low point in the level of perceived risk for smokeless tobacco was 1995 in all three grades. For a decade following 1995 there was a gradual but substantial increase in proportions saying that there is a great risk in using smokeless tobacco regularly. It thus appears that one important reason for the appreciable declines in smokeless tobacco use during the latter half of the 1990s was that an increasing proportion of young people were persuaded of the dangers of using it. But the increases in perceived risk ended by 2004, and it declined some in grades 10 and 12 for a couple of years, before leveling. The decline could be due to generational forgetting of the dangers of use, the increased marketing of snus and other smokeless products, and/or public statements about smokeless tobacco use being relatively less dangerous than cigarette smoking. In 2012 perceived risk declined significantly for both 8th and 10th graders while there was some increase among 12th graders.
Disapproval
Only 8th and 10th graders are asked about their personal disapproval of using smokeless tobacco regularly. The most recent low points for disapproval in both grades were 1995 and 1996. After 1996, disapproval rose among 8th graders from 74% to 82% in 2005, about where it remains in 2012 (83%), and from 71% to 82% in 2008 among 10th graders, with a significant decline since 2008 to 79% in 2010. It is 80% in 2012.
Availability
There are no questions on perceived availability of smokeless tobacco.
42
Smokeless Tobacco : Trends in 30-Day Use, Risk, and Disapproval
Grades 8, 10, 12
Source. The Monitoring the Future study, the University of Michigan.
Use% who used in last 30 days
Risk% seeing "great risk" in using regularly
Disapproval% disapproving of using regularly
Availability% saying "fairly easy" or "very easy" to get
PE
RC
EN
T
0
6
12
18
24
30
YEAR
'74 '76 '78 '80 '82 '84 '86 '88 '90 '92 '94 '96 '98 '00 '02 '04 '06 '08 '10 '12
8th Grade10th Grade12th Grade
PE
RC
EN
T
0
20
40
60
80
100
YEAR
'74 '76 '78 '80 '82 '84 '86 '88 '90 '92 '94 '96 '98 '00 '02 '04 '06 '08 '10 '12
PE
RC
EN
T
0
20
40
60
80
100
YEAR
'74 '76 '78 '80 '82 '84 '86 '88 '90 '92 '94 '96 '98 '00 '02 '04 '06 '08 '10 '12
PE
RC
EN
T
0
20
40
60
80
100
YEAR
'74 '76 '78 '80 '82 '84 '86 '88 '90 '92 '94 '96 '98 '00 '02 '04 '06 '08 '10 '12
(no data)
43
Small Cigars and Tobacco Using a Hookah Twelfth graders were first asked about smoking small cigars and smoking tobacco using hookahs (waterpipes) in 2010. The past year prevalence rate in 2012 was 18.3% for hookah smoking (up from 17.1% in 2010) and 19.9% for small cigars (down significantly from 23.1% in 2010). The increases in
the federal taxes on tobacco products, instituted in 2009, may well have played a role in leveling or decreasing use of these products. The increase on a pack of small cigars was the same as for regular cigarettes (from $0.39 to $1.01 per pack).
44

Small Cigars and Tobacco using a Hookah : Trends in Annual Use
Grade 12
Source. The Monitoring the Future study, the University of Michigan.
Small Cigar Use% who used in last 12 months
Use of Tobacco with a Hookah% who used in last 12 months
Disapproval% disapproving of using once or twice
Availability% saying "fairly easy" or "very easy" to get
PE
RC
EN
T
0
10
20
30
40
50
YEAR
'74 '76 '78 '80 '82 '84 '86 '88 '90 '92 '94 '96 '98 '00 '02 '04 '06 '08 '10 '12
12th Grade
PE
RC
EN
T
0
10
20
30
40
50
YEAR
'74 '76 '78 '80 '82 '84 '86 '88 '90 '92 '94 '96 '98 '00 '02 '04 '06 '08 '10 '12
PE
RC
EN
T
0
20
40
60
80
100
YEAR
'74 '76 '78 '80 '82 '84 '86 '88 '90 '92 '94 '96 '98 '00 '02 '04 '06 '08 '10 '12
(no data)
PE
RC
EN
T
0
20
40
60
80
100
YEAR
'74 '76 '78 '80 '82 '84 '86 '88 '90 '92 '94 '96 '98 '00 '02 '04 '06 '08 '10 '12
(no data)
45
Steroids Unlike all other drugs discussed in this Overview, anabolic steroids are not usually taken for their psychoactive effects but rather for muscle and strength development. However, they are similar to most other drugs studied here in two respects: they are controlled substances for which there is an illicit market, and they can have adverse consequences for the user. Questions about steroid use were added to MTF questionnaires beginning in 1989. Respondents are asked: “Steroids, or anabolic steroids, are sometimes prescribed by doctors to promote healing from certain types of injuries. Some athletes, and others, have used them to try to increase muscle development. On how many occasions (if any) have you taken steroids on your own—that is, without a doctor telling you to take them . . . ?” In 2006 the question text was changed slightly in some questionnaire forms—the phrase “to promote healing from certain types of injuries” was replaced by “to treat certain conditions.” The resulting data did not show any effect from this rewording. In 2007 the remaining forms were changed in the same manner.
Trends in Use
Anabolic steroids are used predominately by males; therefore, data based on all respondents can mask the higher rates and larger fluctuations that occur among males. (For example, in 2012, annual prevalence rates were 0.8%, 1.3%, and 1.7% for boys in grades 8, 10, and 12, compared with 0.3%, 0.4%, and 0.7% for girls.) Between 1991 and 1998, the overall annual prevalence rate was fairly stable among 8th and 10th graders, ranging between 0.9% and 1.2%. In 1999, however, use jumped from 1.2% to 1.7% in both 8th and 10th grades. (Almost all of that increase occurred among boys increasing from 1.6% in 1998 to 2.5% in 1999 in 8th grade and from 1.9% to 2.8% in 10th grade. Thus, rates among boys increased by about half in a single year.) Among all 8th graders, steroid use has declined by almost two thirds to 0.6% in 2012. Among 10th graders, use continued to increase, reaching 2.2% in 2002, but then declined by more than half to 0.8% by 2012. In 12th grade there was a different trend story. With data going back to 1989, we can see that steroid use first fell from 1.9% overall in 1989 to 1.1% in 1992—the low point. From 1992 to 1999 there was a more gradual increase in use, reaching 1.7% in 2000. In 2001, use rose significantly
among 12th graders to 2.4% (possibly reflecting a cohort effect with the younger, heavier-using cohorts getting older). Their use decreased significantly in 2005 to 1.5%, where it remained in 2010, before falling slightly more to 1.3% in 2012. Use is now down from recent peak levels by 63%, 63%, and 51% among 8th, 10th, and 12th graders, respectively. (The use of androstenedione—a steroid precursor—has also declined sharply since 2001.)
Perceived Risk
Perceived risk and disapproval were asked of 8th and 10th graders for only a few years. All grades seemed to have a peak in perceived risk around 1993. The longer term data from 12th graders show a ten percentage-point drop between 1998 and 2000, and an additional three percentage-point drop by 2003 (to 55%, the lowest point ever). A change this sharp is quite unusual and highly significant, suggesting that some particular event or events in 1998—quite possibly publicity about use of performance-enhancing substances by famous athletes, in particular use of androstenedione by a famous home-run-hitting baseball player—made steroids seem less risky. It seems likely that perceived risk dropped substantially in the lower grades as well, and the sharp upturn in their use that year would be consistent with such a change. By 2006, perceived risk for 12th graders was up to 60%, about where it has remained since.
Disapproval
Disapproval of steroid use has been quite high for some years. Between 1998 and 2003 there was a modest decrease, though not as dramatic as the drop in perceived risk. From 2003 to 2008, disapproval rose some—as perceived risk rose and use declined—then leveled.
Availability
Perceived availability of steroids was relatively high and increased with grade level; but it has declined appreciably at all grades in recent years and is still declining. Some steroids were previously sold over the counter, but now a number have been scheduled by the DEA. Androstenedione was classified as a Schedule III controlled substance in 2005.
46

Steroids: Trends in Annual Use, Risk, Disapproval, and Availability
Grades 8, 10, 12
Source. The Monitoring the Future study, the University of Michigan.*Question discontinued in 8th- and 10th-grade questionnaires in 1995.
Use% who used in last 12 months
Risk*% seeing "great risk" in using once or twice
Disapproval*% disapproving of using once or twice
Availability% saying "fairly easy" or "very easy" to get
PE
RC
EN
T
0
1
2
3
4
5
YEAR
'74 '76 '78 '80 '82 '84 '86 '88 '90 '92 '94 '96 '98 '00 '02 '04 '06 '08 '10 '12
8th Grade10th Grade12th Grade
PE
RC
EN
T
0
20
40
60
80
100
YEAR
'74 '76 '78 '80 '82 '84 '86 '88 '90 '92 '94 '96 '98 '00 '02 '04 '06 '08 '10 '12
PE
RC
EN
T
0
20
40
60
80
100
YEAR
'74 '76 '78 '80 '82 '84 '86 '88 '90 '92 '94 '96 '98 '00 '02 '04 '06 '08 '10 '12
PE
RC
EN
T
0
20
40
60
80
100
YEAR
'74 '76 '78 '80 '82 '84 '86 '88 '90 '92 '94 '96 '98 '00 '02 '04 '06 '08 '10 '12
47
Subgroup Differences Understanding the important subgroup variations in substance use among the nation’s youth allows for more informed considerations of substance use etiology and prevention. In this section, we present a brief overview of some of the major demographic subgroup differences. Space does not permit a full discussion or documentation of the many subgroup differences on the drugs covered in this report. However, Volume I in this monograph series contains an extensive appendix (Appendix D) with tables giving the subgroup prevalence levels and trends for all of the classes of drugs discussed here. Chapters 4 and 5 in Volume I also present a more in-depth discussion and interpretation of those subgroup differences. Com-parisons are made by gender, college plans, region of the country, community size, socioeonomic level (as measured by educational level of the parents), and race/ethnicity. In addition, Monitoring the Future Occasional Papers 77 and 79 provide in chart form the many subgroup trends for all drugs; they are available on the MTF website (http://www.monitoringthefuture.org/pubs/occpapers/mtf-occ79.pdf). The reader will probably find the graphic presentations in these occasional papers much easier to comprehend than the tabular material.
Gender
Generally, we have found males to have somewhat higher rates of illicit drug use than females (especially higher rates of frequent use), and much higher rates of smokeless tobacco and steroid use. Males have generally had higher rates of heavy drinking; how-ever, in their 30-day prevalence of alcohol use at 8th grade, girls overtook the boys in 2002 and have had higher rates since. At 10th grade, girls caught up to the boys by 2005, but boys have had higher 30-day prevalence of alcohol use for the past four years. The genders have had roughly equivalent rates of cigarette smoking in recent years among 8th and 10th graders, at least until the last few years as use by males has exceeded use by females. Among 12th graders, the two genders have reversed order twice during the life of the study, but since 1991 males have had slightly higher smoking rates. These gender differences appear to emerge as students grow older. In 8th grade, females actually have higher rates of use for some
drugs, including inhalants, and they have higher rates of tranquilizer use in all three grades. Rates of amphetamine use are fairly close for both genders in all grades. Usage rates for the various substances generally tend to move much in parallel across time for both genders, and the absolute differences tend to be largest in the historical periods in which overall prevalence rates are highest.
College Plans
While in high school, those students who are not college-bound (a decreasing proportion of the total youth population) are considerably more likely to be at risk for using illicit drugs, drinking heavily, and particularly smoking cigarettes. Again, these dif-ferences are largest in periods of highest prevalence. In the lower grades, it was the college-bound who had a greater increase in cigarette smoking in the early to mid-1990s than did their non-college-bound peers; but they also showed a considerably larger decline since then, leaving them with much lower smoking rates at present.
Region of the Country
The differences associated with region of the country are sufficiently varied and complex that we cannot do justice to them here. In the past, the Northeast and West tended to have the highest proportions of students using any illicit drug, and the South the lowest; however, these rankings do not apply to many of the specific drugs and do not apply to all grades today. In particular, the cocaine epidemic of the early 1980s was much more pronounced in the West and Northeast than in the other two regions, although the differences decreased as the overall epidemic subsided. While the South and West have generally had lower rates of drinking among students than the Northeast and the Midwest, those differences have narrowed somewhat in recent years. Cigarette smoking rates have generally been lowest in the West. The upsurge of ecstasy use in 1999 occurred primarily in the Northeast, but that drug’s newfound popularity then spread to the three other regions of the country.
Population Density
There have not been very large or consistent differences in overall illicit drug use associated with
48

population density since MTF began, helping to demonstrate just how ubiquitous the illicit drug phenomenon has been in this country. Crack and heroin use have generally not been concentrated in urban areas, as is commonly believed, meaning that no parents and schools should assume that their children are immune to these threats simply because they do not live in a city.
Socioeconomic Level
The average level of education of the student’s parents, as reported by the student, is used as a proxy for socioeconomic status of the family. For many drugs the differences in use by socioeconomic class are very small, and the trends have been highly parallel. One very interesting difference occurred for cocaine, the use of which was positively associated with socioeconomic level in the early 1980s. However, with the advent of crack, which offered cocaine at a lower price, that association nearly disappeared by 1986. Cigarette smoking showed a similar narrowing of class differences, but this time it was a large negative association with socioeconomic level that diminished considerably between roughly 1985 and 1993. In more recent years, that negative association has re-emerged in the lower grades as use declined faster among students from more educated families. We believe that the removal of the Joe Camel ad campaign may have played a role in this. With regard to alcohol, in recent years there has been essentially no association between parental education and binge drinking among 12th graders, a small negative correlation among 10th graders, and a somewhat stronger negative correlation among 8th graders. (The correlations in 2012 for 8th, 10th, and 12th grades were -.098, -.036, and -.003, respectively.)
Race/Ethnicity
Among the most dramatic and interesting subgroup differences are those found among the three largest racial/ethnic groups—Whites, African Americans,
and Hispanics. For a mumber of years African-American students had substantially lower rates of use of any illicit drug than did Whites, but the differences have narrowed in recent years in the lower grades as a result of increasing marijuana use among African-American students. Marijuana use tends to drive the overall index. Still, African Americans have lower levels of use for most licit and illicit drugs at all three grade levels—in particular for hallucinogens, ecstasy, and all forms of prescription drugs. Their use of alcohol, and cigarettes, is also lower. In fact, African Americans’ use of cigarettes has been dramatically lower than Whites’ use—a difference that emerged largely during the life of the study (i.e., since 1975). Hispanic students have rates of use that tend to place them between the other two groups in 12th grade—usually closer to the rates for Whites than for African Americans. Hispanics do have the highest reported rates of use for some drugs in 12th grade—marijuana, inhalants, cocaine, crack, salvia, Ritalin, and crystal methamphetamine. In 8th grade, however, they tend to come out highest of the three racial/ethnic groups on nearly all classes of drugs. One possible explanation for this change in ranking between 8th and 12th grade may lie in the considerably higher school dropout rates of Hispanic youth: more of the drug-prone segment of that ethnic group may leave school before 12th grade compared to the other two racial/ethnic groups. Another explanation could be that Hispanics are more precocious in their initiation of these types of behaviors. Like African-American students, Hispanic students generally have lower rates than White students of misusing any of the prescription drugs. Again, we refer the reader to Occasional Paper 79 on subgroup differences at http://www.monitoringthefuture.org/pubs/occpapers/mtf-occ79.pdf for a much more complete picture of these complex subgroup differences and how they have changed over the years.
49
Lessons Learned
Implications for Prevention
The wide divergence in historical trajectories of the various drugs over time helps to illustrate that, to a considerable degree, the determinants of use are often specific to each drug. These determinants include both perceived benefits and perceived adverse outcomes that young people come to associate with each drug. Unfortunately, word of the supposed benefits of using a drug usually spreads much faster than information about the adverse consequences. Supposed benefits take only rumor and a few testimonials, the spread of which have been hastened and expanded greatly by the media and the Internet. It usually takes much longer for the evidence of adverse consequences (e.g., death, disease, overdose, addiction) to cumulate and then be disseminated. Thus, when a new drug comes onto the scene, it has a considerable “grace period” during which its benefits are alleged and its consequences are not yet known. We believe that ecstasy illustrated this dynamic. Synthetic marijuana and so-called “bath salts” are two more recent examples where evidence of adverse outcomes is only beginning to catch up to the push that these drugs have received through the Internet and the media. To a considerable degree, prevention must occur drug by drug, because people will not necessarily generalize the adverse consequences of one drug to the use of others. Many beliefs and attitudes held by young people are drug specific. The figures in this Overview on perceived risk and disapproval for the various drugs—attitudes and beliefs that we have shown to be important in explaining many drug trends over the years—amply illustrate this assertion. These attitudes and beliefs are at quite different levels for the various drugs and, more importantly, often trend quite differently over time.
“Generational Forgetting” Helps Keep the Drug Epidemic Going
Another point worth keeping in mind is that there tends to be a continuous flow of new drugs onto the scene and of older ones being rediscovered by young
people. Many drugs have made a comeback years after they first fell from popularity, often because knowledge among youth of their adverse consequences faded as generational replacement took place. We call this process “generational forgetting.” Examples include LSD and methamphetamine, two drugs used widely in the 1960s that made a comeback in the 1990s after their initial popularity faded as a result of their adverse consequences becoming widely recognized during periods of high use. Heroin, cocaine, PCP, and crack are some others that have followed a similar pattern. LSD, inhalants, and ecstasy have all shown some effects of generational forgetting in recent years—that is, perceived risk has declined appreciably for those drugs—which puts future cohorts at greater risk of having a resurgence in use. In the case of LSD, perceived risk among 8th graders has declined noticeably, and more students are saying that they are not familiar with the drug. It would appear that a resurgence in availability (which declined very sharply after about 2001, most likely due to the FDA closing a major lab in 2000) could generate another increase in use. As for newly emerging drugs, examples include nitrite inhalants and PCP in the 1970s; crack and crystal methamphetamine in the 1980s; Rohypnol, GHB, and ecstasy in the 1990s; dextromethorphan, and salvia in the 2000s, and “bath salts” and “synthetic marijuana” more recently. The frequent introduction of new drugs (or new forms or new modes of administration of older drugs, as illustrated by crack, crystal methamphetamine, and noninjected heroin) helps keep this nation’s drug problem alive. Because of the lag times described previously, the forces of containment are always playing catch-up with the forces of encouragement and exploitation. Organized efforts to reduce the grace period experienced by new drugs would seem to be among the most promising responses for minimizing the damage they will cause. Such efforts regarding ecstasy by the National Institute on Drug Abuse and others appeared to pay off.
50
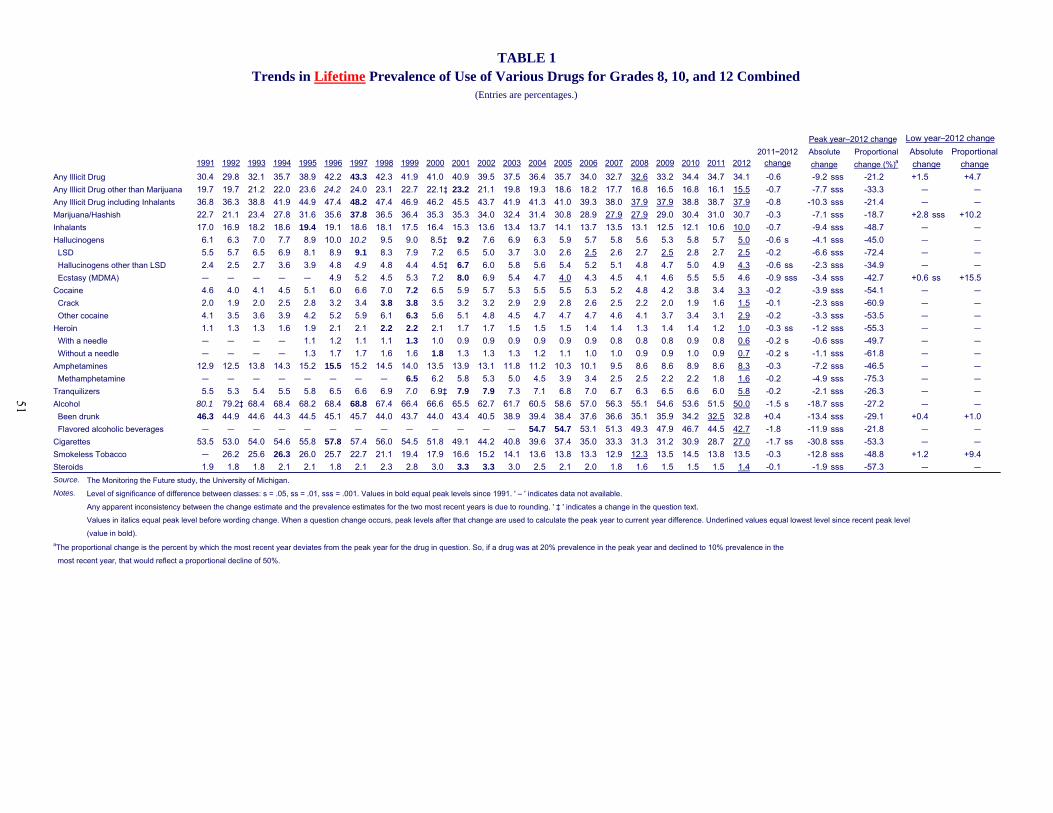
Low year–2012 change
1991 1992 1993 1994 1995 1996 1997 1998 1999 2000 2001 2002 2003 2004 2005 2006 2007 2008 2009 2010 2011 2012
Any Illicit Drug 30.4 29.8 32.1 35.7 38.9 42.2 43.3 42.3 41.9 41.0 40.9 39.5 37.5 36.4 35.7 34.0 32.7 32.6 33.2 34.4 34.7 34.1 -0.6 -9.2 sss -21.2 +1.5 +4.7Any Illicit Drug other than Marijuana 19.7 19.7 21.2 22.0 23.6 24.2 24.0 23.1 22.7 22.1‡ 23.2 21.1 19.8 19.3 18.6 18.2 17.7 16.8 16.5 16.8 16.1 15.5 -0.7 -7.7 sss -33.3 ― ―
Any Illicit Drug including Inhalants 36.8 36.3 38.8 41.9 44.9 47.4 48.2 47.4 46.9 46.2 45.5 43.7 41.9 41.3 41.0 39.3 38.0 37.9 37.9 38.8 38.7 37.9 -0.8 -10.3 sss -21.4 ― ―
Marijuana/Hashish 22.7 21.1 23.4 27.8 31.6 35.6 37.8 36.5 36.4 35.3 35.3 34.0 32.4 31.4 30.8 28.9 27.9 27.9 29.0 30.4 31.0 30.7 -0.3 -7.1 sss -18.7 +2.8 sss +10.2Inhalants 17.0 16.9 18.2 18.6 19.4 19.1 18.6 18.1 17.5 16.4 15.3 13.6 13.4 13.7 14.1 13.7 13.5 13.1 12.5 12.1 10.6 10.0 -0.7 -9.4 sss -48.7 ― ―
Hallucinogens 6.1 6.3 7.0 7.7 8.9 10.0 10.2 9.5 9.0 8.5‡ 9.2 7.6 6.9 6.3 5.9 5.7 5.8 5.6 5.3 5.8 5.7 5.0 -0.6 s -4.1 sss -45.0 ― ―
LSD 5.5 5.7 6.5 6.9 8.1 8.9 9.1 8.3 7.9 7.2 6.5 5.0 3.7 3.0 2.6 2.5 2.6 2.7 2.5 2.8 2.7 2.5 -0.2 -6.6 sss -72.4 ― ―
Hallucinogens other than LSD 2.4 2.5 2.7 3.6 3.9 4.8 4.9 4.8 4.4 4.5‡ 6.7 6.0 5.8 5.6 5.4 5.2 5.1 4.8 4.7 5.0 4.9 4.3 -0.6 ss -2.3 sss -34.9 ― ―
Ecstasy (MDMA) ― ― ― ― ― 4.9 5.2 4.5 5.3 7.2 8.0 6.9 5.4 4.7 4.0 4.3 4.5 4.1 4.6 5.5 5.5 4.6 -0.9 sss -3.4 sss -42.7 +0.6 ss +15.5Cocaine 4.6 4.0 4.1 4.5 5.1 6.0 6.6 7.0 7.2 6.5 5.9 5.7 5.3 5.5 5.5 5.3 5.2 4.8 4.2 3.8 3.4 3.3 -0.2 -3.9 sss -54.1 ― ―
Crack 2.0 1.9 2.0 2.5 2.8 3.2 3.4 3.8 3.8 3.5 3.2 3.2 2.9 2.9 2.8 2.6 2.5 2.2 2.0 1.9 1.6 1.5 -0.1 -2.3 sss -60.9 ― ―
Other cocaine 4.1 3.5 3.6 3.9 4.2 5.2 5.9 6.1 6.3 5.6 5.1 4.8 4.5 4.7 4.7 4.7 4.6 4.1 3.7 3.4 3.1 2.9 -0.2 -3.3 sss -53.5 ― ―
Heroin 1.1 1.3 1.3 1.6 1.9 2.1 2.1 2.2 2.2 2.1 1.7 1.7 1.5 1.5 1.5 1.4 1.4 1.3 1.4 1.4 1.2 1.0 -0.3 ss -1.2 sss -55.3 ― ―
With a needle ― ― ― ― 1.1 1.2 1.1 1.1 1.3 1.0 0.9 0.9 0.9 0.9 0.9 0.9 0.8 0.8 0.8 0.9 0.8 0.6 -0.2 s -0.6 sss -49.7 ― ―
Without a needle ― ― ― ― 1.3 1.7 1.7 1.6 1.6 1.8 1.3 1.3 1.3 1.2 1.1 1.0 1.0 0.9 0.9 1.0 0.9 0.7 -0.2 s -1.1 sss -61.8 ― ―
Amphetamines 12.9 12.5 13.8 14.3 15.2 15.5 15.2 14.5 14.0 13.5 13.9 13.1 11.8 11.2 10.3 10.1 9.5 8.6 8.6 8.9 8.6 8.3 -0.3 -7.2 sss -46.5 ― ―
Methamphetamine ― ― ― ― ― ― ― ― 6.5 6.2 5.8 5.3 5.0 4.5 3.9 3.4 2.5 2.5 2.2 2.2 1.8 1.6 -0.2 -4.9 sss -75.3 ― ―
Tranquilizers 5.5 5.3 5.4 5.5 5.8 6.5 6.6 6.9 7.0 6.9‡ 7.9 7.9 7.3 7.1 6.8 7.0 6.7 6.3 6.5 6.6 6.0 5.8 -0.2 -2.1 sss -26.3 ― ―
Alcohol 80.1 79.2‡ 68.4 68.4 68.2 68.4 68.8 67.4 66.4 66.6 65.5 62.7 61.7 60.5 58.6 57.0 56.3 55.1 54.6 53.6 51.5 50.0 -1.5 s -18.7 sss -27.2 ― ―
Been drunk 46.3 44.9 44.6 44.3 44.5 45.1 45.7 44.0 43.7 44.0 43.4 40.5 38.9 39.4 38.4 37.6 36.6 35.1 35.9 34.2 32.5 32.8 +0.4 -13.4 sss -29.1 +0.4 +1.0 Flavored alcoholic beverages ― ― ― ― ― ― ― ― ― ― ― ― ― 54.7 54.7 53.1 51.3 49.3 47.9 46.7 44.5 42.7 -1.8 -11.9 sss -21.8 ― ―
Cigarettes 53.5 53.0 54.0 54.6 55.8 57.8 57.4 56.0 54.5 51.8 49.1 44.2 40.8 39.6 37.4 35.0 33.3 31.3 31.2 30.9 28.7 27.0 -1.7 ss -30.8 sss -53.3 ― ―
Smokeless Tobacco ― 26.2 25.6 26.3 26.0 25.7 22.7 21.1 19.4 17.9 16.6 15.2 14.1 13.6 13.8 13.3 12.9 12.3 13.5 14.5 13.8 13.5 -0.3 -12.8 sss -48.8 +1.2 +9.4Steroids 1.9 1.8 1.8 2.1 2.1 1.8 2.1 2.3 2.8 3.0 3.3 3.3 3.0 2.5 2.1 2.0 1.8 1.6 1.5 1.5 1.5 1.4 -0.1 -1.9 sss -57.3 ― ―
Source. The Monitoring the Future study, the University of Michigan.Notes. Level of significance of difference between classes: s = .05, ss = .01, sss = .001. Values in bold equal peak levels since 1991. ' – ' indicates data not available.
Any apparent inconsistency between the change estimate and the prevalence estimates for the two most recent years is due to rounding. ' ‡ ' indicates a change in the question text.
Values in italics equal peak level before wording change. When a question change occurs, peak levels after that change are used to calculate the peak year to current year difference. Underlined values equal lowest level since recent peak level
(value in bold).aThe proportional change is the percent by which the most recent year deviates from the peak year for the drug in question. So, if a drug was at 20% prevalence in the peak year and declined to 10% prevalence in the
most recent year, that would reflect a proportional decline of 50%.
TABLE 1Trends in Lifetime Prevalence of Use of Various Drugs for Grades 8, 10, and 12 Combined
(Entries are percentages.)
Proportionalchange
Absolutechangechange change
2011–2012 Absolute Proportionalchange (%)a
Peak year–2012 change
51
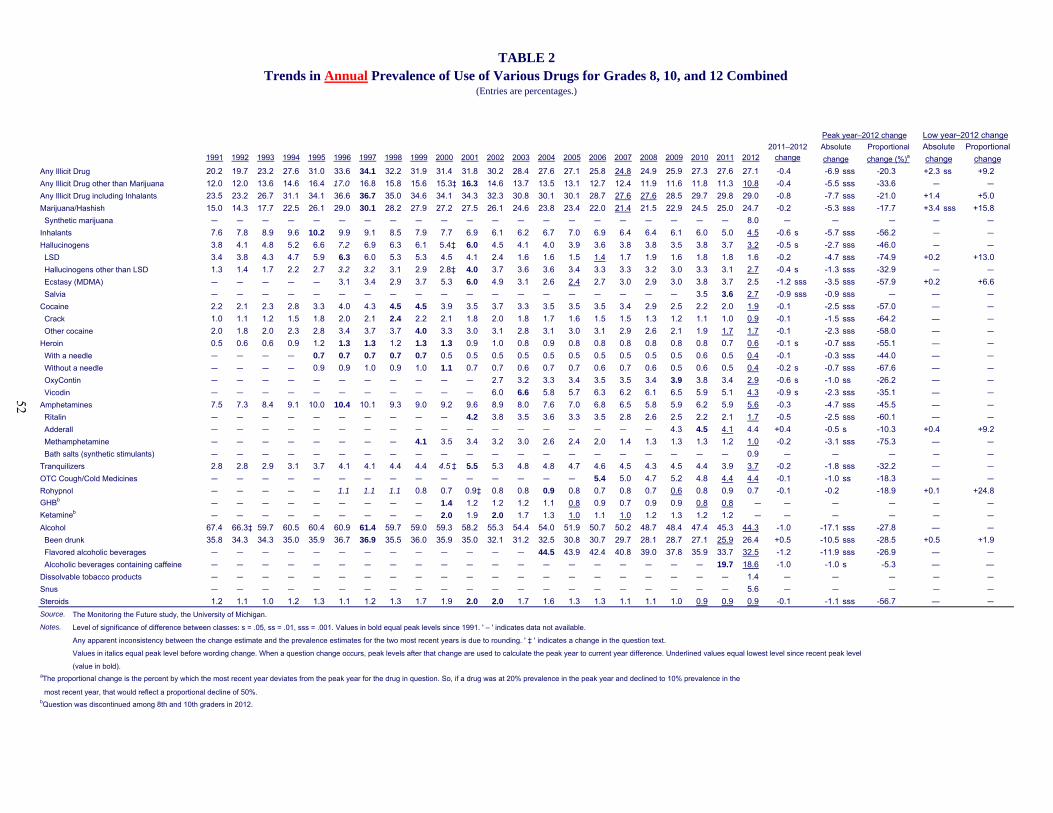
1991 1992 1993 1994 1995 1996 1997 1998 1999 2000 2001 2002 2003 2004 2005 2006 2007 2008 2009 2010 2011 2012
Any Illicit Drug 20.2 19.7 23.2 27.6 31.0 33.6 34.1 32.2 31.9 31.4 31.8 30.2 28.4 27.6 27.1 25.8 24.8 24.9 25.9 27.3 27.6 27.1 -0.4 -6.9 sss -20.3 +2.3 ss +9.2Any Illicit Drug other than Marijuana 12.0 12.0 13.6 14.6 16.4 17.0 16.8 15.8 15.6 15.3‡ 16.3 14.6 13.7 13.5 13.1 12.7 12.4 11.9 11.6 11.8 11.3 10.8 -0.4 -5.5 sss -33.6 ― ―
Any Illicit Drug including Inhalants 23.5 23.2 26.7 31.1 34.1 36.6 36.7 35.0 34.6 34.1 34.3 32.3 30.8 30.1 30.1 28.7 27.6 27.6 28.5 29.7 29.8 29.0 -0.8 -7.7 sss -21.0 +1.4 +5.0Marijuana/Hashish 15.0 14.3 17.7 22.5 26.1 29.0 30.1 28.2 27.9 27.2 27.5 26.1 24.6 23.8 23.4 22.0 21.4 21.5 22.9 24.5 25.0 24.7 -0.2 -5.3 sss -17.7 +3.4 sss +15.8 Synthetic marijuana ― ― ― ― ― ― ― ― ― ― ― ― ― ― ― ― ― ― ― ― ― 8.0 ― ― ― ― ―
Inhalants 7.6 7.8 8.9 9.6 10.2 9.9 9.1 8.5 7.9 7.7 6.9 6.1 6.2 6.7 7.0 6.9 6.4 6.4 6.1 6.0 5.0 4.5 -0.6 s -5.7 sss -56.2 ― ―
Hallucinogens 3.8 4.1 4.8 5.2 6.6 7.2 6.9 6.3 6.1 5.4‡ 6.0 4.5 4.1 4.0 3.9 3.6 3.8 3.8 3.5 3.8 3.7 3.2 -0.5 s -2.7 sss -46.0 ― ―
LSD 3.4 3.8 4.3 4.7 5.9 6.3 6.0 5.3 5.3 4.5 4.1 2.4 1.6 1.6 1.5 1.4 1.7 1.9 1.6 1.8 1.8 1.6 -0.2 -4.7 sss -74.9 +0.2 +13.0 Hallucinogens other than LSD 1.3 1.4 1.7 2.2 2.7 3.2 3.2 3.1 2.9 2.8‡ 4.0 3.7 3.6 3.6 3.4 3.3 3.3 3.2 3.0 3.3 3.1 2.7 -0.4 s -1.3 sss -32.9 ― ―
Ecstasy (MDMA) ― ― ― ― ― 3.1 3.4 2.9 3.7 5.3 6.0 4.9 3.1 2.6 2.4 2.7 3.0 2.9 3.0 3.8 3.7 2.5 -1.2 sss -3.5 sss -57.9 +0.2 +6.6 Salvia ― ― ― ― ― ― ― ― ― ― ― ― ― ― ― ― ― ― ― 3.5 3.6 2.7 -0.9 sss -0.9 sss ― ― ―
Cocaine 2.2 2.1 2.3 2.8 3.3 4.0 4.3 4.5 4.5 3.9 3.5 3.7 3.3 3.5 3.5 3.5 3.4 2.9 2.5 2.2 2.0 1.9 -0.1 -2.5 sss -57.0 ― ―
Crack 1.0 1.1 1.2 1.5 1.8 2.0 2.1 2.4 2.2 2.1 1.8 2.0 1.8 1.7 1.6 1.5 1.5 1.3 1.2 1.1 1.0 0.9 -0.1 -1.5 sss -64.2 ― ―
Other cocaine 2.0 1.8 2.0 2.3 2.8 3.4 3.7 3.7 4.0 3.3 3.0 3.1 2.8 3.1 3.0 3.1 2.9 2.6 2.1 1.9 1.7 1.7 -0.1 -2.3 sss -58.0 ― ―
Heroin 0.5 0.6 0.6 0.9 1.2 1.3 1.3 1.2 1.3 1.3 0.9 1.0 0.8 0.9 0.8 0.8 0.8 0.8 0.8 0.8 0.7 0.6 -0.1 s -0.7 sss -55.1 ― ―
With a needle ― ― ― ― 0.7 0.7 0.7 0.7 0.7 0.5 0.5 0.5 0.5 0.5 0.5 0.5 0.5 0.5 0.5 0.6 0.5 0.4 -0.1 -0.3 sss -44.0 ― ―
Without a needle ― ― ― ― 0.9 0.9 1.0 0.9 1.0 1.1 0.7 0.7 0.6 0.7 0.7 0.6 0.7 0.6 0.5 0.6 0.5 0.4 -0.2 s -0.7 sss -67.6 ― ―
OxyContin ― ― ― ― ― ― ― ― ― ― ― 2.7 3.2 3.3 3.4 3.5 3.5 3.4 3.9 3.8 3.4 2.9 -0.6 s -1.0 ss -26.2 ― ―
Vicodin ― ― ― ― ― ― ― ― ― ― ― 6.0 6.6 5.8 5.7 6.3 6.2 6.1 6.5 5.9 5.1 4.3 -0.9 s -2.3 sss -35.1 ― ―
Amphetamines 7.5 7.3 8.4 9.1 10.0 10.4 10.1 9.3 9.0 9.2 9.6 8.9 8.0 7.6 7.0 6.8 6.5 5.8 5.9 6.2 5.9 5.6 -0.3 -4.7 sss -45.5 ― ―
Ritalin ― ― ― ― ― ― ― ― ― ― 4.2 3.8 3.5 3.6 3.3 3.5 2.8 2.6 2.5 2.2 2.1 1.7 -0.5 -2.5 sss -60.1 ― ―
Adderall ― ― ― ― ― ― ― ― ― ― ― ― ― ― ― ― ― ― 4.3 4.5 4.1 4.4 +0.4 -0.5 s -10.3 +0.4 +9.2 Methamphetamine ― ― ― ― ― ― ― ― 4.1 3.5 3.4 3.2 3.0 2.6 2.4 2.0 1.4 1.3 1.3 1.3 1.2 1.0 -0.2 -3.1 sss -75.3 ― ―
Bath salts (synthetic stimulants) ― ― ― ― ― ― ― ― ― ― ― ― ― ― ― ― ― ― ― ― ― 0.9 ― ― ― ― ―
Tranquilizers 2.8 2.8 2.9 3.1 3.7 4.1 4.1 4.4 4.4 4.5 ‡ 5.5 5.3 4.8 4.8 4.7 4.6 4.5 4.3 4.5 4.4 3.9 3.7 -0.2 -1.8 sss -32.2 ― ―
OTC Cough/Cold Medicines ― ― ― ― ― ― ― ― ― ― ― ― ― ― ― 5.4 5.0 4.7 5.2 4.8 4.4 4.4 -0.1 -1.0 ss -18.3 ― ―
Rohypnol ― ― ― ― ― 1.1 1.1 1.1 0.8 0.7 0.9‡ 0.8 0.8 0.9 0.8 0.7 0.8 0.7 0.6 0.8 0.9 0.7 -0.1 -0.2 -18.9 +0.1 +24.8GHBb
― ― ― ― ― ― ― ― ― 1.4 1.2 1.2 1.2 1.1 0.8 0.9 0.7 0.9 0.9 0.8 0.8 ― ― ― ― ― ―
Ketamineb― ― ― ― ― ― ― ― ― 2.0 1.9 2.0 1.7 1.3 1.0 1.1 1.0 1.2 1.3 1.2 1.2 ― ― ― ― ― ―
Alcohol 67.4 66.3‡ 59.7 60.5 60.4 60.9 61.4 59.7 59.0 59.3 58.2 55.3 54.4 54.0 51.9 50.7 50.2 48.7 48.4 47.4 45.3 44.3 -1.0 -17.1 sss -27.8 ― ―
Been drunk 35.8 34.3 34.3 35.0 35.9 36.7 36.9 35.5 36.0 35.9 35.0 32.1 31.2 32.5 30.8 30.7 29.7 28.1 28.7 27.1 25.9 26.4 +0.5 -10.5 sss -28.5 +0.5 +1.9 Flavored alcoholic beverages ― ― ― ― ― ― ― ― ― ― ― ― ― 44.5 43.9 42.4 40.8 39.0 37.8 35.9 33.7 32.5 -1.2 -11.9 sss -26.9 ― ―
Alcoholic beverages containing caffeine ― ― ― ― ― ― ― ― ― ― ― ― ― ― ― ― ― ― ― ― 19.7 18.6 -1.0 -1.0 s -5.3 ― ―Dissolvable tobacco products ― ― ― ― ― ― ― ― ― ― ― ― ― ― ― ― ― ― ― ― ― 1.4 ― ― ― ― ―
Snus ― ― ― ― ― ― ― ― ― ― ― ― ― ― ― ― ― ― ― ― ― 5.6 ― ― ― ― ―
Steroids 1.2 1.1 1.0 1.2 1.3 1.1 1.2 1.3 1.7 1.9 2.0 2.0 1.7 1.6 1.3 1.3 1.1 1.1 1.0 0.9 0.9 0.9 -0.1 -1.1 sss -56.7 ― ―
Source. The Monitoring the Future study, the University of Michigan.
Notes. Level of significance of difference between classes: s = .05, ss = .01, sss = .001. Values in bold equal peak levels since 1991. ' – ' indicates data not available.
Any apparent inconsistency between the change estimate and the prevalence estimates for the two most recent years is due to rounding. ' ‡ ' indicates a change in the question text.
Values in italics equal peak level before wording change. When a question change occurs, peak levels after that change are used to calculate the peak year to current year difference. Underlined values equal lowest level since recent peak level
(value in bold).aThe proportional change is the percent by which the most recent year deviates from the peak year for the drug in question. So, if a drug was at 20% prevalence in the peak year and declined to 10% prevalence in the
most recent year, that would reflect a proportional decline of 50%.bQuestion was discontinued among 8th and 10th graders in 2012.
TABLE 2Trends in Annual Prevalence of Use of Various Drugs for Grades 8, 10, and 12 Combined
(Entries are percentages.)
Absolutechange
Absolutechange
2011–2012change
Peak year–2012 changeProportionalchange (%)a
Low year–2012 changeProportional
change
52
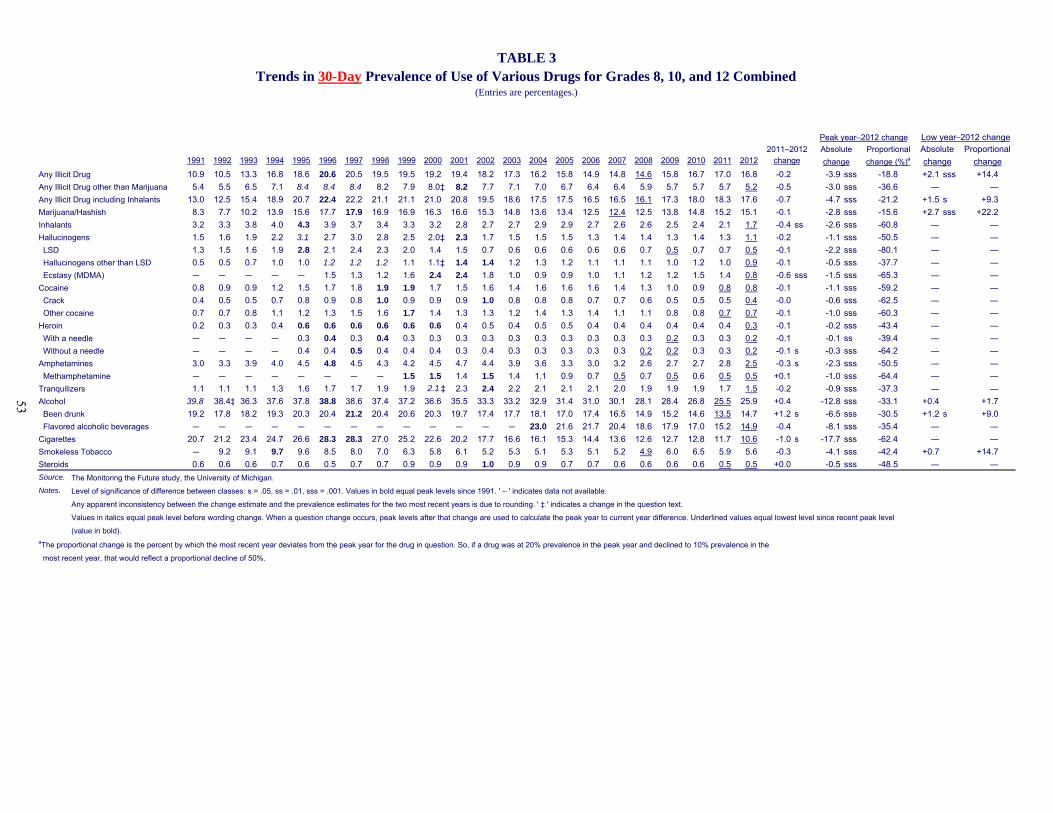
1991 1992 1993 1994 1995 1996 1997 1998 1999 2000 2001 2002 2003 2004 2005 2006 2007 2008 2009 2010 2011 2012
Any Illicit Drug 10.9 10.5 13.3 16.8 18.6 20.6 20.5 19.5 19.5 19.2 19.4 18.2 17.3 16.2 15.8 14.9 14.8 14.6 15.8 16.7 17.0 16.8 -0.2 -3.9 sss -18.8 +2.1 sss +14.4Any Illicit Drug other than Marijuana 5.4 5.5 6.5 7.1 8.4 8.4 8.4 8.2 7.9 8.0‡ 8.2 7.7 7.1 7.0 6.7 6.4 6.4 5.9 5.7 5.7 5.7 5.2 -0.5 -3.0 sss -36.6 ― ―Any Illicit Drug including Inhalants 13.0 12.5 15.4 18.9 20.7 22.4 22.2 21.1 21.1 21.0 20.8 19.5 18.6 17.5 17.5 16.5 16.5 16.1 17.3 18.0 18.3 17.6 -0.7 -4.7 sss -21.2 +1.5 s +9.3Marijuana/Hashish 8.3 7.7 10.2 13.9 15.6 17.7 17.9 16.9 16.9 16.3 16.6 15.3 14.8 13.6 13.4 12.5 12.4 12.5 13.8 14.8 15.2 15.1 -0.1 -2.8 sss -15.6 +2.7 sss +22.2Inhalants 3.2 3.3 3.8 4.0 4.3 3.9 3.7 3.4 3.3 3.2 2.8 2.7 2.7 2.9 2.9 2.7 2.6 2.6 2.5 2.4 2.1 1.7 -0.4 ss -2.6 sss -60.8 ― ―Hallucinogens 1.5 1.6 1.9 2.2 3.1 2.7 3.0 2.8 2.5 2.0‡ 2.3 1.7 1.5 1.5 1.5 1.3 1.4 1.4 1.3 1.4 1.3 1.1 -0.2 -1.1 sss -50.5 ― ― LSD 1.3 1.5 1.6 1.9 2.8 2.1 2.4 2.3 2.0 1.4 1.5 0.7 0.6 0.6 0.6 0.6 0.6 0.7 0.5 0.7 0.7 0.5 -0.1 -2.2 sss -80.1 ― ― Hallucinogens other than LSD 0.5 0.5 0.7 1.0 1.0 1.2 1.2 1.2 1.1 1.1‡ 1.4 1.4 1.2 1.3 1.2 1.1 1.1 1.1 1.0 1.2 1.0 0.9 -0.1 -0.5 sss -37.7 ― ― Ecstasy (MDMA) ― ― ― ― ― 1.5 1.3 1.2 1.6 2.4 2.4 1.8 1.0 0.9 0.9 1.0 1.1 1.2 1.2 1.5 1.4 0.8 -0.6 sss -1.5 sss -65.3 ― ―Cocaine 0.8 0.9 0.9 1.2 1.5 1.7 1.8 1.9 1.9 1.7 1.5 1.6 1.4 1.6 1.6 1.6 1.4 1.3 1.0 0.9 0.8 0.8 -0.1 -1.1 sss -59.2 ― ― Crack 0.4 0.5 0.5 0.7 0.8 0.9 0.8 1.0 0.9 0.9 0.9 1.0 0.8 0.8 0.8 0.7 0.7 0.6 0.5 0.5 0.5 0.4 -0.0 -0.6 sss -62.5 ― ― Other cocaine 0.7 0.7 0.8 1.1 1.2 1.3 1.5 1.6 1.7 1.4 1.3 1.3 1.2 1.4 1.3 1.4 1.1 1.1 0.8 0.8 0.7 0.7 -0.1 -1.0 sss -60.3 ― ―Heroin 0.2 0.3 0.3 0.4 0.6 0.6 0.6 0.6 0.6 0.6 0.4 0.5 0.4 0.5 0.5 0.4 0.4 0.4 0.4 0.4 0.4 0.3 -0.1 -0.2 sss -43.4 ― ― With a needle ― ― ― ― 0.3 0.4 0.3 0.4 0.3 0.3 0.3 0.3 0.3 0.3 0.3 0.3 0.3 0.3 0.2 0.3 0.3 0.2 -0.1 -0.1 ss -39.4 ― ― Without a needle ― ― ― ― 0.4 0.4 0.5 0.4 0.4 0.4 0.3 0.4 0.3 0.3 0.3 0.3 0.3 0.2 0.2 0.3 0.3 0.2 -0.1 s -0.3 sss -64.2 ― ―Amphetamines 3.0 3.3 3.9 4.0 4.5 4.8 4.5 4.3 4.2 4.5 4.7 4.4 3.9 3.6 3.3 3.0 3.2 2.6 2.7 2.7 2.8 2.5 -0.3 s -2.3 sss -50.5 ― ― Methamphetamine ― ― ― ― ― ― ― ― 1.5 1.5 1.4 1.5 1.4 1.1 0.9 0.7 0.5 0.7 0.5 0.6 0.5 0.5 +0.1 -1.0 sss -64.4 ― ―Tranquilizers 1.1 1.1 1.1 1.3 1.6 1.7 1.7 1.9 1.9 2.1 ‡ 2.3 2.4 2.2 2.1 2.1 2.1 2.0 1.9 1.9 1.9 1.7 1.5 -0.2 -0.9 sss -37.3 ― ―Alcohol 39.8 38.4‡ 36.3 37.6 37.8 38.8 38.6 37.4 37.2 36.6 35.5 33.3 33.2 32.9 31.4 31.0 30.1 28.1 28.4 26.8 25.5 25.9 +0.4 -12.8 sss -33.1 +0.4 +1.7 Been drunk 19.2 17.8 18.2 19.3 20.3 20.4 21.2 20.4 20.6 20.3 19.7 17.4 17.7 18.1 17.0 17.4 16.5 14.9 15.2 14.6 13.5 14.7 +1.2 s -6.5 sss -30.5 +1.2 s +9.0 Flavored alcoholic beverages ― ― ― ― ― ― ― ― ― ― ― ― ― 23.0 21.6 21.7 20.4 18.6 17.9 17.0 15.2 14.9 -0.4 -8.1 sss -35.4 ― ―Cigarettes 20.7 21.2 23.4 24.7 26.6 28.3 28.3 27.0 25.2 22.6 20.2 17.7 16.6 16.1 15.3 14.4 13.6 12.6 12.7 12.8 11.7 10.6 -1.0 s -17.7 sss -62.4 ― ―Smokeless Tobacco ― 9.2 9.1 9.7 9.6 8.5 8.0 7.0 6.3 5.8 6.1 5.2 5.3 5.1 5.3 5.1 5.2 4.9 6.0 6.5 5.9 5.6 -0.3 -4.1 sss -42.4 +0.7 +14.7Steroids 0.6 0.6 0.6 0.7 0.6 0.5 0.7 0.7 0.9 0.9 0.9 1.0 0.9 0.9 0.7 0.7 0.6 0.6 0.6 0.6 0.5 0.5 +0.0 -0.5 sss -48.5 ― ―Source. The Monitoring the Future study, the University of Michigan.Notes. Level of significance of difference between classes: s = .05, ss = .01, sss = .001. Values in bold equal peak levels since 1991. ' – ' indicates data not available.
Any apparent inconsistency between the change estimate and the prevalence estimates for the two most recent years is due to rounding. ' ‡ ' indicates a change in the question text.
Values in italics equal peak level before wording change. When a question change occurs, peak levels after that change are used to calculate the peak year to current year difference. Underlined values equal lowest level since recent peak level
(value in bold).aThe proportional change is the percent by which the most recent year deviates from the peak year for the drug in question. So, if a drug was at 20% prevalence in the peak year and declined to 10% prevalence in the
most recent year, that would reflect a proportional decline of 50%.
TABLE 3Trends in 30-Day Prevalence of Use of Various Drugs for Grades 8, 10, and 12 Combined
(Entries are percentages.)
Absolutechangechange change
2011–2012 AbsolutePeak year–2012 change
Proportionalchange (%)a
Low year–2012 changeProportional
change
53

1991 1992 1993 1994 1995 1996 1997 1998 1999 2000 2001 2002 2003 2004 2005 2006 2007 2008 2009 2010 2011 2012Marijuana 0.9 0.9 1.2 2.1 2.7 3.2 3.4 3.4 3.5 3.5 3.7 3.5 3.4 3.0 2.9 2.8 2.7 2.8 2.8 3.4 3.6 3.6 -0.0 -0.1 -3.0 +0.8 sss +31.1Alcohol 1.7 1.6‡ 2.0 1.8 1.9 2.0 2.1 2.2 2.0 1.7 2.0 1.9 1.7 1.5 1.5 1.5 1.6 1.4 1.3 1.4 1.0 1.2 +0.2 s -1.0 sss -44.4 +0.2 s +19.0 5+ drinks in a row in last 2 weeks 20.0 19.0 19.5 20.3 21.1 21.9 21.9 21.5 21.7 21.2 20.4 18.9 18.6 18.8 17.5 17.4 17.2 15.5 16.1 14.9 13.6 14.3 +0.7 -7.6 sss -34.7 +0.7 +5.0 Been drunk 0.4 0.4 0.5 0.6 0.7 0.7 0.9 0.8 0.9 0.8 0.7 0.6 0.7 0.7 0.6 0.7 0.6 0.6 0.5 0.6 0.5 0.6 +0.1 -0.3 sss -32.8 +0.1 +21.0Cigarettes 12.4 11.9 13.5 14.0 15.5 16.8 16.9 15.4 15.0 13.4 11.6 10.2 9.3 9.0 8.0 7.6 7.1 6.4 6.4 6.4 5.7 5.2 -0.5 -11.7 sss -69.3 ― ―
1/2 pack+/day 6.5 6.1 6.9 7.2 7.9 8.7 8.6 7.9 7.6 6.4 5.7 4.9 4.5 4.1 3.7 3.4 3.0 2.7 2.6 2.5 2.1 1.9 -0.2 -6.8 sss -77.9 ― ―
Smokeless tobacco ― 3.0 2.7 2.9 2.5 2.3 2.5 2.1 1.7 1.9 2.0 1.4 1.6 1.7 1.6 1.5 1.6 1.6 1.8 2.1 1.8 1.9 +0.1 -1.1 ss -37.5 +0.4 +27.7Source. The Monitoring the Future study, the University of Michigan.
Notes. Level of significance of difference between classes: s = .05, ss = .01, sss = .001. Values in bold equal peak levels since 1991. ' – ' indicates data not available.
Any apparent inconsistency between the change estimate and the prevalence estimates for the two most recent years is due to rounding. ' ‡ ' indicates a change in the question text.
Values in italics equal peak level before wording change. When a question change occurs, peak levels after that change are used to calculate the peak year to current year difference. Underlined values equal lowest level since recent peak level
(value in bold).aThe proportional change is the percent by which the most recent year deviates from the peak year for the drug in question. So, if a drug was at 20% prevalence in the peak year and declined to 10% prevalence in the
most recent year, that would reflect a proportional decline of 50%.
TABLE 4Trends in Daily Prevalence of Use of Selected Drugs for Grades 8, 10, and 12 Combined
(Entries are percentages.)
Absolutechangechange change
2011–2012 AbsolutePeak year–2012 change
Proportionalchange (%)a
Low year–2012 changeProportional
change
54
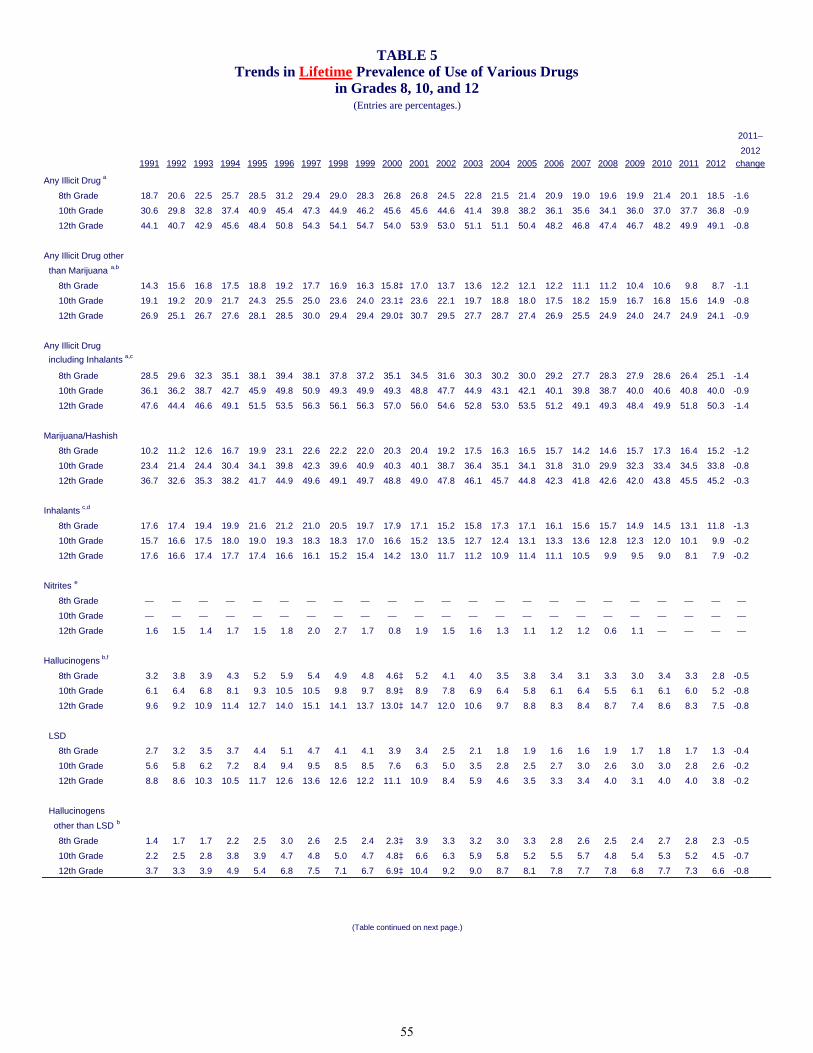
1991 1992 1993 1994 1995 1996 1997 1998 1999 2000 2001 2002 2003 2004 2005 2006 2007 2008 2009 2010 2011 2012
8th Grade 18.7 20.6 22.5 25.7 28.5 31.2 29.4 29.0 28.3 26.8 26.8 24.5 22.8 21.5 21.4 20.9 19.0 19.6 19.9 21.4 20.1 18.5 -1.6
10th Grade 30.6 29.8 32.8 37.4 40.9 45.4 47.3 44.9 46.2 45.6 45.6 44.6 41.4 39.8 38.2 36.1 35.6 34.1 36.0 37.0 37.7 36.8 -0.9
12th Grade 44.1 40.7 42.9 45.6 48.4 50.8 54.3 54.1 54.7 54.0 53.9 53.0 51.1 51.1 50.4 48.2 46.8 47.4 46.7 48.2 49.9 49.1 -0.8
Any Illicit Drug other
8th Grade 14.3 15.6 16.8 17.5 18.8 19.2 17.7 16.9 16.3 15.8‡ 17.0 13.7 13.6 12.2 12.1 12.2 11.1 11.2 10.4 10.6 9.8 8.7 -1.1
10th Grade 19.1 19.2 20.9 21.7 24.3 25.5 25.0 23.6 24.0 23.1‡ 23.6 22.1 19.7 18.8 18.0 17.5 18.2 15.9 16.7 16.8 15.6 14.9 -0.8
12th Grade 26.9 25.1 26.7 27.6 28.1 28.5 30.0 29.4 29.4 29.0‡ 30.7 29.5 27.7 28.7 27.4 26.9 25.5 24.9 24.0 24.7 24.9 24.1 -0.9
including Inhalants a,c
8th Grade 28.5 29.6 32.3 35.1 38.1 39.4 38.1 37.8 37.2 35.1 34.5 31.6 30.3 30.2 30.0 29.2 27.7 28.3 27.9 28.6 26.4 25.1 -1.4
10th Grade 36.1 36.2 38.7 42.7 45.9 49.8 50.9 49.3 49.9 49.3 48.8 47.7 44.9 43.1 42.1 40.1 39.8 38.7 40.0 40.6 40.8 40.0 -0.9
12th Grade 47.6 44.4 46.6 49.1 51.5 53.5 56.3 56.1 56.3 57.0 56.0 54.6 52.8 53.0 53.5 51.2 49.1 49.3 48.4 49.9 51.8 50.3 -1.4
8th Grade 10.2 11.2 12.6 16.7 19.9 23.1 22.6 22.2 22.0 20.3 20.4 19.2 17.5 16.3 16.5 15.7 14.2 14.6 15.7 17.3 16.4 15.2 -1.2
10th Grade 23.4 21.4 24.4 30.4 34.1 39.8 42.3 39.6 40.9 40.3 40.1 38.7 36.4 35.1 34.1 31.8 31.0 29.9 32.3 33.4 34.5 33.8 -0.8
12th Grade 36.7 32.6 35.3 38.2 41.7 44.9 49.6 49.1 49.7 48.8 49.0 47.8 46.1 45.7 44.8 42.3 41.8 42.6 42.0 43.8 45.5 45.2 -0.3
8th Grade 17.6 17.4 19.4 19.9 21.6 21.2 21.0 20.5 19.7 17.9 17.1 15.2 15.8 17.3 17.1 16.1 15.6 15.7 14.9 14.5 13.1 11.8 -1.3
10th Grade 15.7 16.6 17.5 18.0 19.0 19.3 18.3 18.3 17.0 16.6 15.2 13.5 12.7 12.4 13.1 13.3 13.6 12.8 12.3 12.0 10.1 9.9 -0.2
12th Grade 17.6 16.6 17.4 17.7 17.4 16.6 16.1 15.2 15.4 14.2 13.0 11.7 11.2 10.9 11.4 11.1 10.5 9.9 9.5 9.0 8.1 7.9 -0.2
8th Grade — — — — — — — — — — — — — — — — — — — — — — —
10th Grade — — — — — — — — — — — — — — — — — — — — — — —
12th Grade 1.6 1.5 1.4 1.7 1.5 1.8 2.0 2.7 1.7 0.8 1.9 1.5 1.6 1.3 1.1 1.2 1.2 0.6 1.1 — — — —
8th Grade 3.2 3.8 3.9 4.3 5.2 5.9 5.4 4.9 4.8 4.6‡ 5.2 4.1 4.0 3.5 3.8 3.4 3.1 3.3 3.0 3.4 3.3 2.8 -0.5
10th Grade 6.1 6.4 6.8 8.1 9.3 10.5 10.5 9.8 9.7 8.9‡ 8.9 7.8 6.9 6.4 5.8 6.1 6.4 5.5 6.1 6.1 6.0 5.2 -0.8
12th Grade 9.6 9.2 10.9 11.4 12.7 14.0 15.1 14.1 13.7 13.0‡ 14.7 12.0 10.6 9.7 8.8 8.3 8.4 8.7 7.4 8.6 8.3 7.5 -0.8
8th Grade 2.7 3.2 3.5 3.7 4.4 5.1 4.7 4.1 4.1 3.9 3.4 2.5 2.1 1.8 1.9 1.6 1.6 1.9 1.7 1.8 1.7 1.3 -0.4
10th Grade 5.6 5.8 6.2 7.2 8.4 9.4 9.5 8.5 8.5 7.6 6.3 5.0 3.5 2.8 2.5 2.7 3.0 2.6 3.0 3.0 2.8 2.6 -0.2
12th Grade 8.8 8.6 10.3 10.5 11.7 12.6 13.6 12.6 12.2 11.1 10.9 8.4 5.9 4.6 3.5 3.3 3.4 4.0 3.1 4.0 4.0 3.8 -0.2
8th Grade 1.4 1.7 1.7 2.2 2.5 3.0 2.6 2.5 2.4 2.3‡ 3.9 3.3 3.2 3.0 3.3 2.8 2.6 2.5 2.4 2.7 2.8 2.3 -0.5
10th Grade 2.2 2.5 2.8 3.8 3.9 4.7 4.8 5.0 4.7 4.8‡ 6.6 6.3 5.9 5.8 5.2 5.5 5.7 4.8 5.4 5.3 5.2 4.5 -0.7
12th Grade 3.7 3.3 3.9 4.9 5.4 6.8 7.5 7.1 6.7 6.9‡ 10.4 9.2 9.0 8.7 8.1 7.8 7.7 7.8 6.8 7.7 7.3 6.6 -0.8
(Table continued on next page.)
LSD
Hallucinogens
other than LSD b
Inhalants c,d
Nitrites e
Hallucinogens b,f
2012
TABLE 5Trends in Lifetime Prevalence of Use of Various Drugs
in Grades 8, 10, and 12
2011–
change
Any Illicit Drug a
than Marijuana a,b
Any Illicit Drug
Marijuana/Hashish
(Entries are percentages.)
55

1991 1992 1993 1994 1995 1996 1997 1998 1999 2000 2001 2002 2003 2004 2005 2006 2007 2008 2009 2010 2011 2012
8th Grade — — — — — — — — — — — — — — — — — — — — — — —
10th Grade — — — — — — — — — — — — — — — — — — — — — — —
12th Grade 2.9 2.4 2.9 2.8 2.7 4.0 3.9 3.9 3.4 3.4 3.5 3.1 2.5 1.6 2.4 2.2 2.1 1.8 1.7 1.8 2.3 1.6 -0.7
8th Grade — — — — — 3.4 3.2 2.7 2.7 4.3 5.2 4.3 3.2 2.8 2.8 2.5 2.3 2.4 2.2 3.3 2.6 2.0 -0.6
10th Grade — — — — — 5.6 5.7 5.1 6.0 7.3 8.0 6.6 5.4 4.3 4.0 4.5 5.2 4.3 5.5 6.4 6.6 5.0 -1.6 ss
12th Grade — — — — — 6.1 6.9 5.8 8.0 11.0 11.7 10.5 8.3 7.5 5.4 6.5 6.5 6.2 6.5 7.3 8.0 7.2 -0.9
8th Grade 2.3 2.9 2.9 3.6 4.2 4.5 4.4 4.6 4.7 4.5 4.3 3.6 3.6 3.4 3.7 3.4 3.1 3.0 2.6 2.6 2.2 1.9 -0.3
10th Grade 4.1 3.3 3.6 4.3 5.0 6.5 7.1 7.2 7.7 6.9 5.7 6.1 5.1 5.4 5.2 4.8 5.3 4.5 4.6 3.7 3.3 3.3 0.0
12th Grade 7.8 6.1 6.1 5.9 6.0 7.1 8.7 9.3 9.8 8.6 8.2 7.8 7.7 8.1 8.0 8.5 7.8 7.2 6.0 5.5 5.2 4.9 -0.3
8th Grade 1.3 1.6 1.7 2.4 2.7 2.9 2.7 3.2 3.1 3.1 3.0 2.5 2.5 2.4 2.4 2.3 2.1 2.0 1.7 1.5 1.5 1.0 -0.4 s
10th Grade 1.7 1.5 1.8 2.1 2.8 3.3 3.6 3.9 4.0 3.7 3.1 3.6 2.7 2.6 2.5 2.2 2.3 2.0 2.1 1.8 1.6 1.4 -0.2
12th Grade 3.1 2.6 2.6 3.0 3.0 3.3 3.9 4.4 4.6 3.9 3.7 3.8 3.6 3.9 3.5 3.5 3.2 2.8 2.4 2.4 1.9 2.1 +0.2
8th Grade 2.0 2.4 2.4 3.0 3.4 3.8 3.5 3.7 3.8 3.5 3.3 2.8 2.7 2.6 2.9 2.7 2.6 2.4 2.1 2.1 1.8 1.6 -0.2
10th Grade 3.8 3.0 3.3 3.8 4.4 5.5 6.1 6.4 6.8 6.0 5.0 5.2 4.5 4.8 4.6 4.3 4.8 4.0 4.1 3.4 3.0 3.0 0.0
12th Grade 7.0 5.3 5.4 5.2 5.1 6.4 8.2 8.4 8.8 7.7 7.4 7.0 6.7 7.3 7.1 7.9 6.8 6.5 5.3 5.1 4.9 4.4 -0.4
8th Grade 1.2 1.4 1.4 2.0 2.3 2.4 2.1 2.3 2.3 1.9 1.7 1.6 1.6 1.6 1.5 1.4 1.3 1.4 1.3 1.3 1.2 0.8 -0.3 s
10th Grade 1.2 1.2 1.3 1.5 1.7 2.1 2.1 2.3 2.3 2.2 1.7 1.8 1.5 1.5 1.5 1.4 1.5 1.2 1.5 1.3 1.2 1.1 -0.1
12th Grade 0.9 1.2 1.1 1.2 1.6 1.8 2.1 2.0 2.0 2.4 1.8 1.7 1.5 1.5 1.5 1.4 1.5 1.3 1.2 1.6 1.4 1.1 -0.3
8th Grade — — — — 1.5 1.6 1.3 1.4 1.6 1.1 1.2 1.0 1.0 1.1 1.0 1.0 0.9 0.9 0.9 0.9 0.8 0.6 -0.2
10th Grade — — — — 1.0 1.1 1.1 1.2 1.3 1.0 0.8 1.0 0.9 0.8 0.8 0.9 0.9 0.7 0.9 0.8 0.8 0.7 -0.1
12th Grade — — — — 0.7 0.8 0.9 0.8 0.9 0.8 0.7 0.8 0.7 0.7 0.9 0.8 0.7 0.7 0.6 1.1 0.9 0.7 -0.2
8th Grade — — — — 1.5 1.6 1.4 1.5 1.4 1.3 1.1 1.0 1.1 1.0 0.9 0.9 0.7 0.9 0.8 0.7 0.7 0.5 -0.2
10th Grade — — — — 1.1 1.7 1.7 1.7 1.6 1.7 1.3 1.3 1.0 1.1 1.1 1.0 1.1 0.8 1.0 0.9 0.8 0.8 0.0
12th Grade — — — — 1.4 1.7 2.1 1.6 1.8 2.4 1.5 1.6 1.8 1.4 1.3 1.1 1.4 1.1 0.9 1.4 1.3 0.8 -0.5 s
8th Grade — — — — — — — — — — — — — — — — — — — — — — —
10th Grade — — — — — — — — — — — — — — — — — — — — — — —
12th Grade 6.6 6.1 6.4 6.6 7.2 8.2 9.7 9.8 10.2 10.6 9.9‡ 13.5 13.2 13.5 12.8 13.4 13.1 13.2 13.2 13.0 13.0 12.2 -0.8
(Table continued on next page.)
Narcotics other than Heroin k,l
TABLE 5 (cont.)Trends in Lifetime Prevalence of Use of Various Drugs
in Grades 8, 10, and 12
2011–
2012
change
Heroin i
With a Needle j
Without a Needle j
Other Cocaine h
Cocaine
Crack
(Entries are percentages.)
PCP e
Ecstasy (MDMA) g
56

1991 1992 1993 1994 1995 1996 1997 1998 1999 2000 2001 2002 2003 2004 2005 2006 2007 2008 2009 2010 2011 2012
8th Grade 10.5 10.8 11.8 12.3 13.1 13.5 12.3 11.3 10.7 9.9 10.2 8.7 8.4 7.5 7.4 7.3 6.5 6.8 6.0 5.7 5.2 4.5 -0.7
10th Grade 13.2 13.1 14.9 15.1 17.4 17.7 17.0 16.0 15.7 15.7 16.0 14.9 13.1 11.9 11.1 11.2 11.1 9.0 10.3 10.6 9.0 8.9 -0.2
12th Grade 15.4 13.9 15.1 15.7 15.3 15.3 16.5 16.4 16.3 15.6 16.2 16.8 14.4 15.0 13.1 12.4 11.4 10.5 9.9 11.1 12.2 12.0 -0.2
Methamphetamine n,o
8th Grade — — — — — — — — 4.5 4.2 4.4 3.5 3.9 2.5 3.1 2.7 1.8 2.3 1.6 1.8 1.3 1.3 0.0
10th Grade — — — — — — — — 7.3 6.9 6.4 6.1 5.2 5.3 4.1 3.2 2.8 2.4 2.8 2.5 2.1 1.8 -0.3
12th Grade — — — — — — — — 8.2 7.9 6.9 6.7 6.2 6.2 4.5 4.4 3.0 2.8 2.4 2.3 2.1 1.7 -0.3
8th Grade — — — — — — — — — — — — — — — — — — — — — — —
10th Grade — — — — — — — — — — — — — — — — — — — — — — —
12th Grade 3.3 2.9 3.1 3.4 3.9 4.4 4.4 5.3 4.8 4.0 4.1 4.7 3.9 4.0 4.0 3.4 3.4 2.8 2.1 1.8 2.1 1.7 -0.4
Sedatives (Barbiturates) k,p
8th Grade — — — — — — — — — — — — — — — — — — — — — — —
10th Grade — — — — — — — — — — — — — — — — — — — — — — —
12th Grade 6.2 5.5 6.3 7.0 7.4 7.6 8.1 8.7 8.9 9.2 8.7 9.5 8.8 9.9 10.5 10.2 9.3 8.5 8.2 7.5 7.0 6.9 -0.1
8th Grade — — — — — — — — — — — — — — — — — — — — — — —
10th Grade — — — — — — — — — — — — — — — — — — — — — — —
12th Grade 1.3 1.6 0.8 1.4 1.2 2.0 1.7 1.6 1.8 0.8 1.1 1.5 1.0 1.3 1.3 1.2 1.0 0.8 0.7 0.4 0.6 0.8 +0.2
8th Grade 3.8 4.1 4.4 4.6 4.5 5.3 4.8 4.6 4.4 4.4‡ 5.0 4.3 4.4 4.0 4.1 4.3 3.9 3.9 3.9 4.4 3.4 3.0 -0.3
10th Grade 5.8 5.9 5.7 5.4 6.0 7.1 7.3 7.8 7.9 8.0‡ 9.2 8.8 7.8 7.3 7.1 7.2 7.4 6.8 7.0 7.3 6.8 6.3 -0.5
12th Grade 7.2 6.0 6.4 6.6 7.1 7.2 7.8 8.5 9.3 8.9‡ 10.3 11.4 10.2 10.6 9.9 10.3 9.5 8.9 9.3 8.5 8.7 8.5 -0.2
Any Prescription Drug q
8th Grade — — — — — — — — — — — — — — — — — — — — — — —
10th Grade — — — — — — — — — — — — — — — — — — — — — — —
12th Grade — — — — — — — — — — — — — — 24.0 23.9 22.2 21.5 20.9 21.6 21.7 21.2 -0.6
8th Grade — — — — — 1.5 1.1 1.4 1.3 1.0 1.1 0.8 1.0 1.0 1.1 1.0 1.0 0.7 0.7 0.9 2.0 1.0 -1.0 s
10th Grade — — — — — 1.5 1.7 2.0 1.8 1.3 1.5 1.3 1.0 1.2 1.0 0.8 1.3 0.9 0.7 1.4 1.2 0.8 -0.4
12th Grade — — — — — 1.2 1.8 3.0 2.0 1.5 1.7 — — — — — — — — — — — —
8th Grade 70.1 69.3‡ 55.7 55.8 54.5 55.3 53.8 52.5 52.1 51.7 50.5 47.0 45.6 43.9 41.0 40.5 38.9 38.9 36.6 35.8 33.1 29.5 -3.6 sss
10th Grade 83.8 82.3‡ 71.6 71.1 70.5 71.8 72.0 69.8 70.6 71.4 70.1 66.9 66.0 64.2 63.2 61.5 61.7 58.3 59.1 58.2 56.0 54.0 -2.0
12th Grade 88.0 87.5‡ 80.0 80.4 80.7 79.2 81.7 81.4 80.0 80.3 79.7 78.4 76.6 76.8 75.1 72.7 72.2 71.9 72.3 71.0 70.0 69.4 -0.6
8th Grade 26.7 26.8 26.4 25.9 25.3 26.8 25.2 24.8 24.8 25.1 23.4 21.3 20.3 19.9 19.5 19.5 17.9 18.0 17.4 16.3 14.8 12.8 -2.1 ss
10th Grade 50.0 47.7 47.9 47.2 46.9 48.5 49.4 46.7 48.9 49.3 48.2 44.0 42.4 42.3 42.1 41.4 41.2 37.2 38.6 36.9 35.9 34.6 -1.3
12th Grade 65.4 63.4 62.5 62.9 63.2 61.8 64.2 62.4 62.3 62.3 63.9 61.6 58.1 60.3 57.5 56.4 55.1 54.7 56.5 54.1 51.0 54.2 +3.2
Rohypnol r
Alcohol s
Any Use
Been Drunk o
(Table continued on next page.)
Tranquilizers b,k
Amphetamines k,m
TABLE 5 (cont.)Trends in Lifetime Prevalence of Use of Various Drugs
in Grades 8, 10, and 12
2011–
2012
change
Methaqualone e,k
Crystal Methamphetamine (Ice) o
(Entries are percentages.)
57
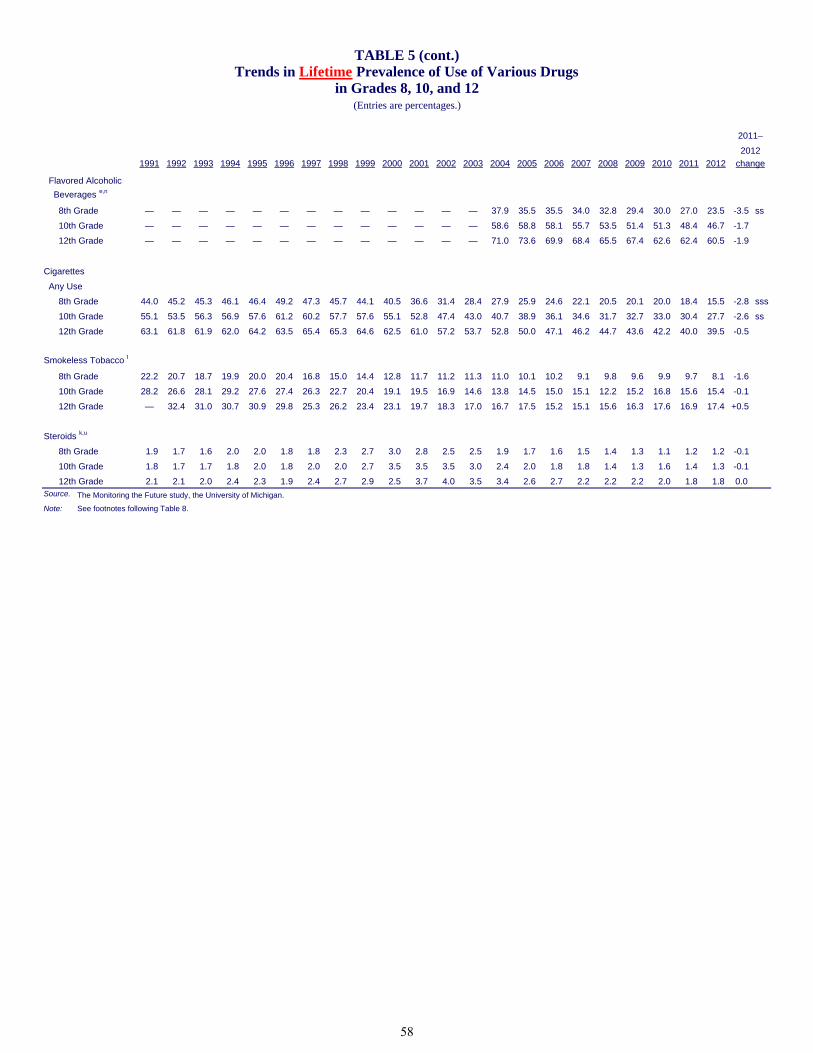
1991 1992 1993 1994 1995 1996 1997 1998 1999 2000 2001 2002 2003 2004 2005 2006 2007 2008 2009 2010 2011 2012
Beverages e,n
8th Grade — — — — — — — — — — — — — 37.9 35.5 35.5 34.0 32.8 29.4 30.0 27.0 23.5 -3.5 ss
10th Grade — — — — — — — — — — — — — 58.6 58.8 58.1 55.7 53.5 51.4 51.3 48.4 46.7 -1.7
12th Grade — — — — — — — — — — — — — 71.0 73.6 69.9 68.4 65.5 67.4 62.6 62.4 60.5 -1.9
8th Grade 44.0 45.2 45.3 46.1 46.4 49.2 47.3 45.7 44.1 40.5 36.6 31.4 28.4 27.9 25.9 24.6 22.1 20.5 20.1 20.0 18.4 15.5 -2.8 sss
10th Grade 55.1 53.5 56.3 56.9 57.6 61.2 60.2 57.7 57.6 55.1 52.8 47.4 43.0 40.7 38.9 36.1 34.6 31.7 32.7 33.0 30.4 27.7 -2.6 ss
12th Grade 63.1 61.8 61.9 62.0 64.2 63.5 65.4 65.3 64.6 62.5 61.0 57.2 53.7 52.8 50.0 47.1 46.2 44.7 43.6 42.2 40.0 39.5 -0.5
Smokeless Tobacco t
8th Grade 22.2 20.7 18.7 19.9 20.0 20.4 16.8 15.0 14.4 12.8 11.7 11.2 11.3 11.0 10.1 10.2 9.1 9.8 9.6 9.9 9.7 8.1 -1.6
10th Grade 28.2 26.6 28.1 29.2 27.6 27.4 26.3 22.7 20.4 19.1 19.5 16.9 14.6 13.8 14.5 15.0 15.1 12.2 15.2 16.8 15.6 15.4 -0.1
12th Grade — 32.4 31.0 30.7 30.9 29.8 25.3 26.2 23.4 23.1 19.7 18.3 17.0 16.7 17.5 15.2 15.1 15.6 16.3 17.6 16.9 17.4 +0.5
8th Grade 1.9 1.7 1.6 2.0 2.0 1.8 1.8 2.3 2.7 3.0 2.8 2.5 2.5 1.9 1.7 1.6 1.5 1.4 1.3 1.1 1.2 1.2 -0.1
10th Grade 1.8 1.7 1.7 1.8 2.0 1.8 2.0 2.0 2.7 3.5 3.5 3.5 3.0 2.4 2.0 1.8 1.8 1.4 1.3 1.6 1.4 1.3 -0.1
12th Grade 2.1 2.1 2.0 2.4 2.3 1.9 2.4 2.7 2.9 2.5 3.7 4.0 3.5 3.4 2.6 2.7 2.2 2.2 2.2 2.0 1.8 1.8 0.0Source. The Monitoring the Future study, the University of Michigan.
Note: See footnotes following Table 8.
change
Cigarettes
Any Use
Steroids k,u
Flavored Alcoholic
2012
TABLE 5 (cont.)Trends in Lifetime Prevalence of Use of Various Drugs
in Grades 8, 10, and 12
2011–
(Entries are percentages.)
58

1991 1992 1993 1994 1995 1996 1997 1998 1999 2000 2001 2002 2003 2004 2005 2006 2007 2008 2009 2010 2011 2012
8th Grade 11.3 12.9 15.1 18.5 21.4 23.6 22.1 21.0 20.5 19.5 19.5 17.7 16.1 15.2 15.5 14.8 13.2 14.1 14.5 16.0 14.7 13.4 -1.3
10th Grade 21.4 20.4 24.7 30.0 33.3 37.5 38.5 35.0 35.9 36.4 37.2 34.8 32.0 31.1 29.8 28.7 28.1 26.9 29.4 30.2 31.1 30.1 -0.9
12th Grade 29.4 27.1 31.0 35.8 39.0 40.2 42.4 41.4 42.1 40.9 41.4 41.0 39.3 38.8 38.4 36.5 35.9 36.6 36.5 38.3 40.0 39.7 -0.3
8th Grade 8.4 9.3 10.4 11.3 12.6 13.1 11.8 11.0 10.5 10.2‡ 10.8 8.8 8.8 7.9 8.1 7.7 7.0 7.4 7.0 7.1 6.4 5.5 -0.9
10th Grade 12.2 12.3 13.9 15.2 17.5 18.4 18.2 16.6 16.7 16.7‡ 17.9 15.7 13.8 13.5 12.9 12.7 13.1 11.3 12.2 12.1 11.2 10.8 -0.4
12th Grade 16.2 14.9 17.1 18.0 19.4 19.8 20.7 20.2 20.7 20.4‡ 21.6 20.9 19.8 20.5 19.7 19.2 18.5 18.3 17.0 17.3 17.6 17.0 -0.5
including Inhalants a,c
8th Grade 16.7 18.2 21.1 24.2 27.1 28.7 27.2 26.2 25.3 24.0 23.9 21.4 20.4 20.2 20.4 19.7 18.0 19.0 18.8 20.3 18.2 17.0 -1.2
10th Grade 23.9 23.5 27.4 32.5 35.6 39.6 40.3 37.1 37.7 38.0 38.7 36.1 33.5 32.9 31.7 30.7 30.2 28.8 31.2 31.8 32.5 31.5 -1.1
12th Grade 31.2 28.8 32.5 37.6 40.2 41.9 43.3 42.4 42.8 42.5 42.6 42.1 40.5 39.1 40.3 38.0 37.0 37.3 37.6 39.2 41.5 40.2 -1.3
8th Grade 6.2 7.2 9.2 13.0 15.8 18.3 17.7 16.9 16.5 15.6 15.4 14.6 12.8 11.8 12.2 11.7 10.3 10.9 11.8 13.7 12.5 11.4 -1.1
10th Grade 16.5 15.2 19.2 25.2 28.7 33.6 34.8 31.1 32.1 32.2 32.7 30.3 28.2 27.5 26.6 25.2 24.6 23.9 26.7 27.5 28.8 28.0 -0.8
12th Grade 23.9 21.9 26.0 30.7 34.7 35.8 38.5 37.5 37.8 36.5 37.0 36.2 34.9 34.3 33.6 31.5 31.7 32.4 32.8 34.8 36.4 36.4 0.0
Synthetic Marijuana n,o
8th Grade — — — — — — — — — — — — — — — — — — — — — 4.4 —
10th Grade — — — — — — — — — — — — — — — — — — — — — 8.8 —
12th Grade — — — — — — — — — — — — — — — — — — — — 11.4 11.3 -0.1
8th Grade 9.0 9.5 11.0 11.7 12.8 12.2 11.8 11.1 10.3 9.4 9.1 7.7 8.7 9.6 9.5 9.1 8.3 8.9 8.1 8.1 7.0 6.2 -0.8
10th Grade 7.1 7.5 8.4 9.1 9.6 9.5 8.7 8.0 7.2 7.3 6.6 5.8 5.4 5.9 6.0 6.5 6.6 5.9 6.1 5.7 4.5 4.1 -0.4
12th Grade 6.6 6.2 7.0 7.7 8.0 7.6 6.7 6.2 5.6 5.9 4.5 4.5 3.9 4.2 5.0 4.5 3.7 3.8 3.4 3.6 3.2 2.9 -0.3
8th Grade — — — — — — — — — — — — — — — — — — — — — — —
10th Grade — — — — — — — — — — — — — — — — — — — — — — —
12th Grade 0.9 0.5 0.9 1.1 1.1 1.6 1.2 1.4 0.9 0.6 0.6 1.1 0.9 0.8 0.6 0.5 0.8 0.6 0.9 — — — —
8th Grade 1.9 2.5 2.6 2.7 3.6 4.1 3.7 3.4 2.9 2.8‡ 3.4 2.6 2.6 2.2 2.4 2.1 1.9 2.1 1.9 2.2 2.2 1.6 -0.6 s
10th Grade 4.0 4.3 4.7 5.8 7.2 7.8 7.6 6.9 6.9 6.1‡ 6.2 4.7 4.1 4.1 4.0 4.1 4.4 3.9 4.1 4.2 4.1 3.5 -0.6
12th Grade 5.8 5.9 7.4 7.6 9.3 10.1 9.8 9.0 9.4 8.1‡ 9.1 6.6 5.9 6.2 5.5 4.9 5.4 5.9 4.7 5.5 5.2 4.8 -0.4
8th Grade 1.7 2.1 2.3 2.4 3.2 3.5 3.2 2.8 2.4 2.4 2.2 1.5 1.3 1.1 1.2 0.9 1.1 1.3 1.1 1.2 1.1 0.8 -0.3
10th Grade 3.7 4.0 4.2 5.2 6.5 6.9 6.7 5.9 6.0 5.1 4.1 2.6 1.7 1.6 1.5 1.7 1.9 1.8 1.9 1.9 1.8 1.7 -0.1
12th Grade 5.2 5.6 6.8 6.9 8.4 8.8 8.4 7.6 8.1 6.6 6.6 3.5 1.9 2.2 1.8 1.7 2.1 2.7 1.9 2.6 2.7 2.4 -0.3
TABLE 6Trends in Annual Prevalence of Use of Various Drugs
in Grades 8, 10, and 12
2011–
(Entries are percentages.)
2012
change
Any Illicit Drug a
Any Illicit Drug other
than Marijuana a,b
Any Illicit Drug
(Table continued on next page.)
Marijuana/Hashish
LSD
Inhalants c,d
Nitrites e
Hallucinogens b,f
59
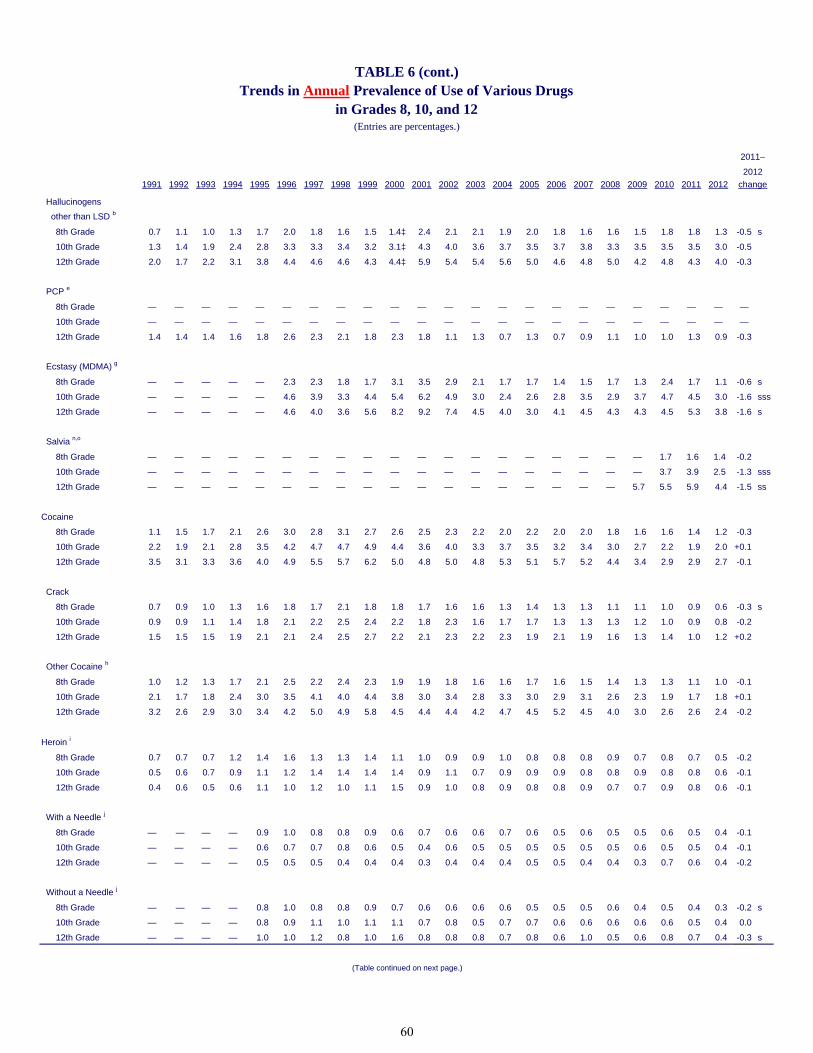
1991 1992 1993 1994 1995 1996 1997 1998 1999 2000 2001 2002 2003 2004 2005 2006 2007 2008 2009 2010 2011 2012
8th Grade 0.7 1.1 1.0 1.3 1.7 2.0 1.8 1.6 1.5 1.4‡ 2.4 2.1 2.1 1.9 2.0 1.8 1.6 1.6 1.5 1.8 1.8 1.3 -0.5 s
10th Grade 1.3 1.4 1.9 2.4 2.8 3.3 3.3 3.4 3.2 3.1‡ 4.3 4.0 3.6 3.7 3.5 3.7 3.8 3.3 3.5 3.5 3.5 3.0 -0.5
12th Grade 2.0 1.7 2.2 3.1 3.8 4.4 4.6 4.6 4.3 4.4‡ 5.9 5.4 5.4 5.6 5.0 4.6 4.8 5.0 4.2 4.8 4.3 4.0 -0.3
8th Grade — — — — — — — — — — — — — — — — — — — — — — —
10th Grade — — — — — — — — — — — — — — — — — — — — — — —
12th Grade 1.4 1.4 1.4 1.6 1.8 2.6 2.3 2.1 1.8 2.3 1.8 1.1 1.3 0.7 1.3 0.7 0.9 1.1 1.0 1.0 1.3 0.9 -0.3
8th Grade — — — — — 2.3 2.3 1.8 1.7 3.1 3.5 2.9 2.1 1.7 1.7 1.4 1.5 1.7 1.3 2.4 1.7 1.1 -0.6 s
10th Grade — — — — — 4.6 3.9 3.3 4.4 5.4 6.2 4.9 3.0 2.4 2.6 2.8 3.5 2.9 3.7 4.7 4.5 3.0 -1.6 sss
12th Grade — — — — — 4.6 4.0 3.6 5.6 8.2 9.2 7.4 4.5 4.0 3.0 4.1 4.5 4.3 4.3 4.5 5.3 3.8 -1.6 s
8th Grade — — — — — — — — — — — — — — — — — — — 1.7 1.6 1.4 -0.2
10th Grade — — — — — — — — — — — — — — — — — — — 3.7 3.9 2.5 -1.3 sss
12th Grade — — — — — — — — — — — — — — — — — — 5.7 5.5 5.9 4.4 -1.5 ss
8th Grade 1.1 1.5 1.7 2.1 2.6 3.0 2.8 3.1 2.7 2.6 2.5 2.3 2.2 2.0 2.2 2.0 2.0 1.8 1.6 1.6 1.4 1.2 -0.3
10th Grade 2.2 1.9 2.1 2.8 3.5 4.2 4.7 4.7 4.9 4.4 3.6 4.0 3.3 3.7 3.5 3.2 3.4 3.0 2.7 2.2 1.9 2.0 +0.1
12th Grade 3.5 3.1 3.3 3.6 4.0 4.9 5.5 5.7 6.2 5.0 4.8 5.0 4.8 5.3 5.1 5.7 5.2 4.4 3.4 2.9 2.9 2.7 -0.1
8th Grade 0.7 0.9 1.0 1.3 1.6 1.8 1.7 2.1 1.8 1.8 1.7 1.6 1.6 1.3 1.4 1.3 1.3 1.1 1.1 1.0 0.9 0.6 -0.3 s
10th Grade 0.9 0.9 1.1 1.4 1.8 2.1 2.2 2.5 2.4 2.2 1.8 2.3 1.6 1.7 1.7 1.3 1.3 1.3 1.2 1.0 0.9 0.8 -0.2
12th Grade 1.5 1.5 1.5 1.9 2.1 2.1 2.4 2.5 2.7 2.2 2.1 2.3 2.2 2.3 1.9 2.1 1.9 1.6 1.3 1.4 1.0 1.2 +0.2
8th Grade 1.0 1.2 1.3 1.7 2.1 2.5 2.2 2.4 2.3 1.9 1.9 1.8 1.6 1.6 1.7 1.6 1.5 1.4 1.3 1.3 1.1 1.0 -0.1
10th Grade 2.1 1.7 1.8 2.4 3.0 3.5 4.1 4.0 4.4 3.8 3.0 3.4 2.8 3.3 3.0 2.9 3.1 2.6 2.3 1.9 1.7 1.8 +0.1
12th Grade 3.2 2.6 2.9 3.0 3.4 4.2 5.0 4.9 5.8 4.5 4.4 4.4 4.2 4.7 4.5 5.2 4.5 4.0 3.0 2.6 2.6 2.4 -0.2
8th Grade 0.7 0.7 0.7 1.2 1.4 1.6 1.3 1.3 1.4 1.1 1.0 0.9 0.9 1.0 0.8 0.8 0.8 0.9 0.7 0.8 0.7 0.5 -0.2
10th Grade 0.5 0.6 0.7 0.9 1.1 1.2 1.4 1.4 1.4 1.4 0.9 1.1 0.7 0.9 0.9 0.9 0.8 0.8 0.9 0.8 0.8 0.6 -0.1
12th Grade 0.4 0.6 0.5 0.6 1.1 1.0 1.2 1.0 1.1 1.5 0.9 1.0 0.8 0.9 0.8 0.8 0.9 0.7 0.7 0.9 0.8 0.6 -0.1
8th Grade — — — — 0.9 1.0 0.8 0.8 0.9 0.6 0.7 0.6 0.6 0.7 0.6 0.5 0.6 0.5 0.5 0.6 0.5 0.4 -0.1
10th Grade — — — — 0.6 0.7 0.7 0.8 0.6 0.5 0.4 0.6 0.5 0.5 0.5 0.5 0.5 0.5 0.6 0.5 0.5 0.4 -0.1
12th Grade — — — — 0.5 0.5 0.5 0.4 0.4 0.4 0.3 0.4 0.4 0.4 0.5 0.5 0.4 0.4 0.3 0.7 0.6 0.4 -0.2
8th Grade — — — — 0.8 1.0 0.8 0.8 0.9 0.7 0.6 0.6 0.6 0.6 0.5 0.5 0.5 0.6 0.4 0.5 0.4 0.3 -0.2 s
10th Grade — — — — 0.8 0.9 1.1 1.0 1.1 1.1 0.7 0.8 0.5 0.7 0.7 0.6 0.6 0.6 0.6 0.6 0.5 0.4 0.0
12th Grade — — — — 1.0 1.0 1.2 0.8 1.0 1.6 0.8 0.8 0.8 0.7 0.8 0.6 1.0 0.5 0.6 0.8 0.7 0.4 -0.3 s
Heroin i
With a Needle j
Without a Needle j
(Table continued on next page.)
Crack
Trends in Annual Prevalence of Use of Various Drugs in Grades 8, 10, and 12
2011–
Hallucinogens
other than LSD b
PCP e
2012
change
Other Cocaine h
Salvia n,o
Ecstasy (MDMA) g
Cocaine
(Entries are percentages.)
TABLE 6 (cont.)
60
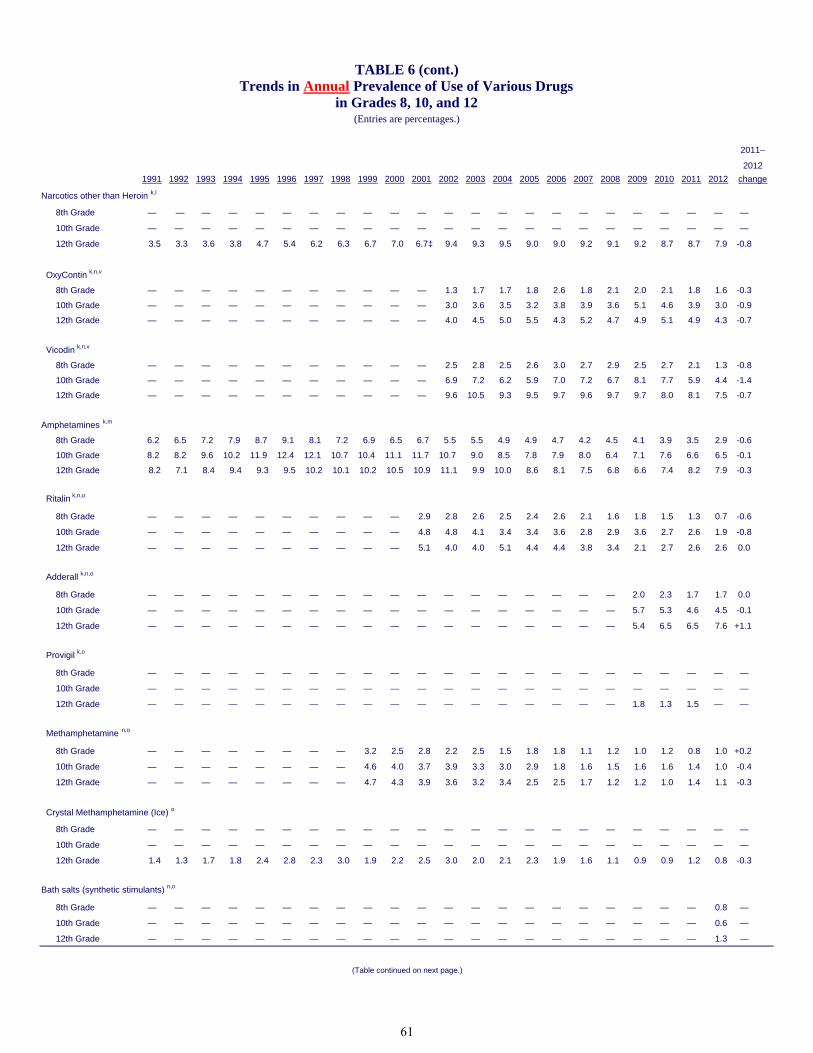
1991 1992 1993 1994 1995 1996 1997 1998 1999 2000 2001 2002 2003 2004 2005 2006 2007 2008 2009 2010 2011 2012
8th Grade — — — — — — — — — — — — — — — — — — — — — — —
10th Grade — — — — — — — — — — — — — — — — — — — — — — —
12th Grade 3.5 3.3 3.6 3.8 4.7 5.4 6.2 6.3 6.7 7.0 6.7‡ 9.4 9.3 9.5 9.0 9.0 9.2 9.1 9.2 8.7 8.7 7.9 -0.8
8th Grade — — — — — — — — — — — 1.3 1.7 1.7 1.8 2.6 1.8 2.1 2.0 2.1 1.8 1.6 -0.3
10th Grade — — — — — — — — — — — 3.0 3.6 3.5 3.2 3.8 3.9 3.6 5.1 4.6 3.9 3.0 -0.9
12th Grade — — — — — — — — — — — 4.0 4.5 5.0 5.5 4.3 5.2 4.7 4.9 5.1 4.9 4.3 -0.7
8th Grade — — — — — — — — — — — 2.5 2.8 2.5 2.6 3.0 2.7 2.9 2.5 2.7 2.1 1.3 -0.8
10th Grade — — — — — — — — — — — 6.9 7.2 6.2 5.9 7.0 7.2 6.7 8.1 7.7 5.9 4.4 -1.4
12th Grade — — — — — — — — — — — 9.6 10.5 9.3 9.5 9.7 9.6 9.7 9.7 8.0 8.1 7.5 -0.7
8th Grade 6.2 6.5 7.2 7.9 8.7 9.1 8.1 7.2 6.9 6.5 6.7 5.5 5.5 4.9 4.9 4.7 4.2 4.5 4.1 3.9 3.5 2.9 -0.6
10th Grade 8.2 8.2 9.6 10.2 11.9 12.4 12.1 10.7 10.4 11.1 11.7 10.7 9.0 8.5 7.8 7.9 8.0 6.4 7.1 7.6 6.6 6.5 -0.1
12th Grade 8.2 7.1 8.4 9.4 9.3 9.5 10.2 10.1 10.2 10.5 10.9 11.1 9.9 10.0 8.6 8.1 7.5 6.8 6.6 7.4 8.2 7.9 -0.3
Ritalin k,n,o
8th Grade — — — — — — — — — — 2.9 2.8 2.6 2.5 2.4 2.6 2.1 1.6 1.8 1.5 1.3 0.7 -0.6
10th Grade — — — — — — — — — — 4.8 4.8 4.1 3.4 3.4 3.6 2.8 2.9 3.6 2.7 2.6 1.9 -0.8
12th Grade — — — — — — — — — — 5.1 4.0 4.0 5.1 4.4 4.4 3.8 3.4 2.1 2.7 2.6 2.6 0.0
Adderall k,n,o
8th Grade — — — — — — — — — — — — — — — — — — 2.0 2.3 1.7 1.7 0.0
10th Grade — — — — — — — — — — — — — — — — — — 5.7 5.3 4.6 4.5 -0.1
12th Grade — — — — — — — — — — — — — — — — — — 5.4 6.5 6.5 7.6 +1.1
Provigil k,o
8th Grade — — — — — — — — — — — — — — — — — — — — — — —
10th Grade — — — — — — — — — — — — — — — — — — — — — — —
12th Grade — — — — — — — — — — — — — — — — — — 1.8 1.3 1.5 — —
Methamphetamine n,o
8th Grade — — — — — — — — 3.2 2.5 2.8 2.2 2.5 1.5 1.8 1.8 1.1 1.2 1.0 1.2 0.8 1.0 +0.2
10th Grade — — — — — — — — 4.6 4.0 3.7 3.9 3.3 3.0 2.9 1.8 1.6 1.5 1.6 1.6 1.4 1.0 -0.4
12th Grade — — — — — — — — 4.7 4.3 3.9 3.6 3.2 3.4 2.5 2.5 1.7 1.2 1.2 1.0 1.4 1.1 -0.3
8th Grade — — — — — — — — — — — — — — — — — — — — — — —
10th Grade — — — — — — — — — — — — — — — — — — — — — — —
12th Grade 1.4 1.3 1.7 1.8 2.4 2.8 2.3 3.0 1.9 2.2 2.5 3.0 2.0 2.1 2.3 1.9 1.6 1.1 0.9 0.9 1.2 0.8 -0.3
Bath salts (synthetic stimulants) n,o
8th Grade — — — — — — — — — — — — — — — — — — — — — 0.8 —
10th Grade — — — — — — — — — — — — — — — — — — — — — 0.6 —
12th Grade — — — — — — — — — — — — — — — — — — — — — 1.3 —
change
OxyContin k,n,v
Crystal Methamphetamine (Ice) o
(Table continued on next page.)
Narcotics other than Heroin k,l
Vicodin k,n,v
Amphetamines k,m
TABLE 6 (cont.)Trends in Annual Prevalence of Use of Various Drugs
in Grades 8, 10, and 12
2011–
2012
(Entries are percentages.)
61
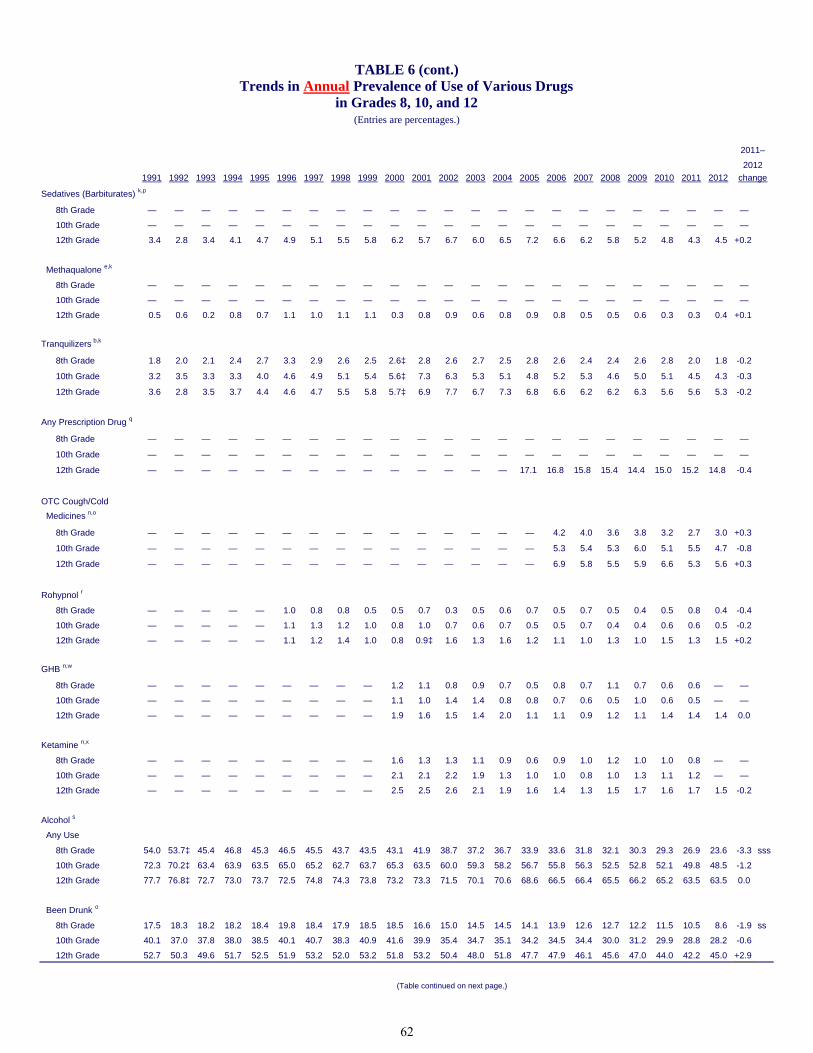
1991 1992 1993 1994 1995 1996 1997 1998 1999 2000 2001 2002 2003 2004 2005 2006 2007 2008 2009 2010 2011 2012
Sedatives (Barbiturates) k,p
8th Grade — — — — — — — — — — — — — — — — — — — — — — —
10th Grade — — — — — — — — — — — — — — — — — — — — — — —
12th Grade 3.4 2.8 3.4 4.1 4.7 4.9 5.1 5.5 5.8 6.2 5.7 6.7 6.0 6.5 7.2 6.6 6.2 5.8 5.2 4.8 4.3 4.5 +0.2
8th Grade — — — — — — — — — — — — — — — — — — — — — — —
10th Grade — — — — — — — — — — — — — — — — — — — — — — —
12th Grade 0.5 0.6 0.2 0.8 0.7 1.1 1.0 1.1 1.1 0.3 0.8 0.9 0.6 0.8 0.9 0.8 0.5 0.5 0.6 0.3 0.3 0.4 +0.1
8th Grade 1.8 2.0 2.1 2.4 2.7 3.3 2.9 2.6 2.5 2.6‡ 2.8 2.6 2.7 2.5 2.8 2.6 2.4 2.4 2.6 2.8 2.0 1.8 -0.2
10th Grade 3.2 3.5 3.3 3.3 4.0 4.6 4.9 5.1 5.4 5.6‡ 7.3 6.3 5.3 5.1 4.8 5.2 5.3 4.6 5.0 5.1 4.5 4.3 -0.3
12th Grade 3.6 2.8 3.5 3.7 4.4 4.6 4.7 5.5 5.8 5.7‡ 6.9 7.7 6.7 7.3 6.8 6.6 6.2 6.2 6.3 5.6 5.6 5.3 -0.2
8th Grade — — — — — — — — — — — — — — — — — — — — — — —
10th Grade — — — — — — — — — — — — — — — — — — — — — — —
12th Grade — — — — — — — — — — — — — — 17.1 16.8 15.8 15.4 14.4 15.0 15.2 14.8 -0.4
8th Grade — — — — — — — — — — — — — — — 4.2 4.0 3.6 3.8 3.2 2.7 3.0 +0.3
10th Grade — — — — — — — — — — — — — — — 5.3 5.4 5.3 6.0 5.1 5.5 4.7 -0.8
12th Grade — — — — — — — — — — — — — — — 6.9 5.8 5.5 5.9 6.6 5.3 5.6 +0.3
8th Grade — — — — — 1.0 0.8 0.8 0.5 0.5 0.7 0.3 0.5 0.6 0.7 0.5 0.7 0.5 0.4 0.5 0.8 0.4 -0.4
10th Grade — — — — — 1.1 1.3 1.2 1.0 0.8 1.0 0.7 0.6 0.7 0.5 0.5 0.7 0.4 0.4 0.6 0.6 0.5 -0.2
12th Grade — — — — — 1.1 1.2 1.4 1.0 0.8 0.9‡ 1.6 1.3 1.6 1.2 1.1 1.0 1.3 1.0 1.5 1.3 1.5 +0.2
GHB n,w
8th Grade — — — — — — — — — 1.2 1.1 0.8 0.9 0.7 0.5 0.8 0.7 1.1 0.7 0.6 0.6 — —
10th Grade — — — — — — — — — 1.1 1.0 1.4 1.4 0.8 0.8 0.7 0.6 0.5 1.0 0.6 0.5 — —
12th Grade — — — — — — — — — 1.9 1.6 1.5 1.4 2.0 1.1 1.1 0.9 1.2 1.1 1.4 1.4 1.4 0.0
8th Grade — — — — — — — — — 1.6 1.3 1.3 1.1 0.9 0.6 0.9 1.0 1.2 1.0 1.0 0.8 — —
10th Grade — — — — — — — — — 2.1 2.1 2.2 1.9 1.3 1.0 1.0 0.8 1.0 1.3 1.1 1.2 — —
12th Grade — — — — — — — — — 2.5 2.5 2.6 2.1 1.9 1.6 1.4 1.3 1.5 1.7 1.6 1.7 1.5 -0.2
8th Grade 54.0 53.7‡ 45.4 46.8 45.3 46.5 45.5 43.7 43.5 43.1 41.9 38.7 37.2 36.7 33.9 33.6 31.8 32.1 30.3 29.3 26.9 23.6 -3.3 sss
10th Grade 72.3 70.2‡ 63.4 63.9 63.5 65.0 65.2 62.7 63.7 65.3 63.5 60.0 59.3 58.2 56.7 55.8 56.3 52.5 52.8 52.1 49.8 48.5 -1.2
12th Grade 77.7 76.8‡ 72.7 73.0 73.7 72.5 74.8 74.3 73.8 73.2 73.3 71.5 70.1 70.6 68.6 66.5 66.4 65.5 66.2 65.2 63.5 63.5 0.0
8th Grade 17.5 18.3 18.2 18.2 18.4 19.8 18.4 17.9 18.5 18.5 16.6 15.0 14.5 14.5 14.1 13.9 12.6 12.7 12.2 11.5 10.5 8.6 -1.9 ss
10th Grade 40.1 37.0 37.8 38.0 38.5 40.1 40.7 38.3 40.9 41.6 39.9 35.4 34.7 35.1 34.2 34.5 34.4 30.0 31.2 29.9 28.8 28.2 -0.6
12th Grade 52.7 50.3 49.6 51.7 52.5 51.9 53.2 52.0 53.2 51.8 53.2 50.4 48.0 51.8 47.7 47.9 46.1 45.6 47.0 44.0 42.2 45.0 +2.9
Any Use
Been Drunk o
Any Prescription Drug q
Medicines n,o
(Table continued on next page.)
Rohypnol r
Ketamine n,x
in Grades 8, 10, and 12
2011–
(Entries are percentages.)
Alcohol s
TABLE 6 (cont.)
Methaqualone e,k
Trends in Annual Prevalence of Use of Various Drugs
2012
change
Tranquilizers b,k
OTC Cough/Cold
62
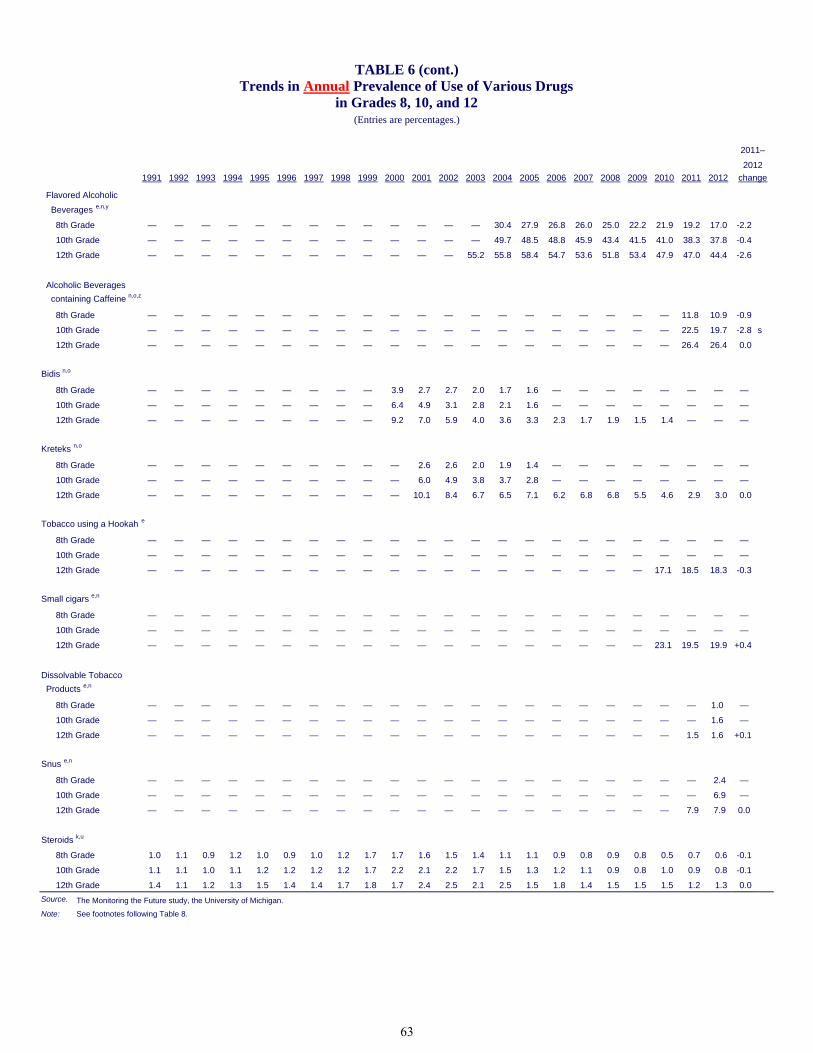
1991 1992 1993 1994 1995 1996 1997 1998 1999 2000 2001 2002 2003 2004 2005 2006 2007 2008 2009 2010 2011 2012
Flavored Alcoholic
8th Grade — — — — — — — — — — — — — 30.4 27.9 26.8 26.0 25.0 22.2 21.9 19.2 17.0 -2.2
10th Grade — — — — — — — — — — — — — 49.7 48.5 48.8 45.9 43.4 41.5 41.0 38.3 37.8 -0.4
12th Grade — — — — — — — — — — — — 55.2 55.8 58.4 54.7 53.6 51.8 53.4 47.9 47.0 44.4 -2.6
Alcoholic Beverages
containing Caffeine n,o,z
8th Grade — — — — — — — — — — — — — — — — — — — — 11.8 10.9 -0.9
10th Grade — — — — — — — — — — — — — — — — — — — — 22.5 19.7 -2.8 s
12th Grade — — — — — — — — — — — — — — — — — — — — 26.4 26.4 0.0
Bidis n,o
8th Grade — — — — — — — — — 3.9 2.7 2.7 2.0 1.7 1.6 — — — — — — — —
10th Grade — — — — — — — — — 6.4 4.9 3.1 2.8 2.1 1.6 — — — — — — — —
12th Grade — — — — — — — — — 9.2 7.0 5.9 4.0 3.6 3.3 2.3 1.7 1.9 1.5 1.4 — — —
Kreteks n,o
8th Grade — — — — — — — — — — 2.6 2.6 2.0 1.9 1.4 — — — — — — — —
10th Grade — — — — — — — — — — 6.0 4.9 3.8 3.7 2.8 — — — — — — — —
12th Grade — — — — — — — — — — 10.1 8.4 6.7 6.5 7.1 6.2 6.8 6.8 5.5 4.6 2.9 3.0 0.0
Tobacco using a Hookah e
8th Grade — — — — — — — — — — — — — — — — — — — — — — —
10th Grade — — — — — — — — — — — — — — — — — — — — — — —
12th Grade — — — — — — — — — — — — — — — — — — — 17.1 18.5 18.3 -0.3
Small cigars e,n
8th Grade — — — — — — — — — — — — — — — — — — — — — — —
10th Grade — — — — — — — — — — — — — — — — — — — — — — —
12th Grade — — — — — — — — — — — — — — — — — — — 23.1 19.5 19.9 +0.4
Dissolvable Tobacco
Products e,n
8th Grade — — — — — — — — — — — — — — — — — — — — — 1.0 —
10th Grade — — — — — — — — — — — — — — — — — — — — — 1.6 —
12th Grade — — — — — — — — — — — — — — — — — — — — 1.5 1.6 +0.1
Snus e,n
8th Grade — — — — — — — — — — — — — — — — — — — — — 2.4 —
10th Grade — — — — — — — — — — — — — — — — — — — — — 6.9 —
12th Grade — — — — — — — — — — — — — — — — — — — — 7.9 7.9 0.0
8th Grade 1.0 1.1 0.9 1.2 1.0 0.9 1.0 1.2 1.7 1.7 1.6 1.5 1.4 1.1 1.1 0.9 0.8 0.9 0.8 0.5 0.7 0.6 -0.1
10th Grade 1.1 1.1 1.0 1.1 1.2 1.2 1.2 1.2 1.7 2.2 2.1 2.2 1.7 1.5 1.3 1.2 1.1 0.9 0.8 1.0 0.9 0.8 -0.1
12th Grade 1.4 1.1 1.2 1.3 1.5 1.4 1.4 1.7 1.8 1.7 2.4 2.5 2.1 2.5 1.5 1.8 1.4 1.5 1.5 1.5 1.2 1.3 0.0
Source. The Monitoring the Future study, the University of Michigan.
Note: See footnotes following Table 8.
(Entries are percentages.)
Beverages e,n,y
in Grades 8, 10, and 12
2011–
2012
change
TABLE 6 (cont.)Trends in Annual Prevalence of Use of Various Drugs
Steroids k,u
63
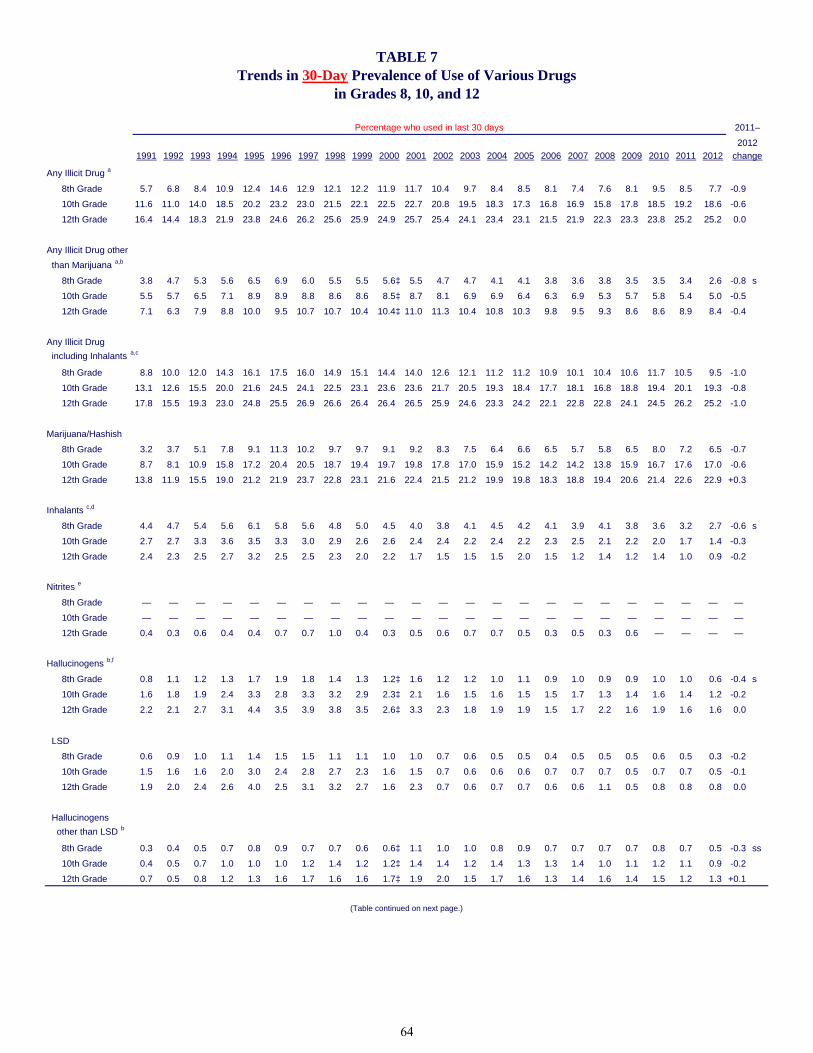
1991 1992 1993 1994 1995 1996 1997 1998 1999 2000 2001 2002 2003 2004 2005 2006 2007 2008 2009 2010 2011 2012
8th Grade 5.7 6.8 8.4 10.9 12.4 14.6 12.9 12.1 12.2 11.9 11.7 10.4 9.7 8.4 8.5 8.1 7.4 7.6 8.1 9.5 8.5 7.7 -0.9
10th Grade 11.6 11.0 14.0 18.5 20.2 23.2 23.0 21.5 22.1 22.5 22.7 20.8 19.5 18.3 17.3 16.8 16.9 15.8 17.8 18.5 19.2 18.6 -0.6
12th Grade 16.4 14.4 18.3 21.9 23.8 24.6 26.2 25.6 25.9 24.9 25.7 25.4 24.1 23.4 23.1 21.5 21.9 22.3 23.3 23.8 25.2 25.2 0.0
Any Illicit Drug other
8th Grade 3.8 4.7 5.3 5.6 6.5 6.9 6.0 5.5 5.5 5.6‡ 5.5 4.7 4.7 4.1 4.1 3.8 3.6 3.8 3.5 3.5 3.4 2.6 -0.8 s
10th Grade 5.5 5.7 6.5 7.1 8.9 8.9 8.8 8.6 8.6 8.5‡ 8.7 8.1 6.9 6.9 6.4 6.3 6.9 5.3 5.7 5.8 5.4 5.0 -0.5
12th Grade 7.1 6.3 7.9 8.8 10.0 9.5 10.7 10.7 10.4 10.4‡ 11.0 11.3 10.4 10.8 10.3 9.8 9.5 9.3 8.6 8.6 8.9 8.4 -0.4
including Inhalants a,c
8th Grade 8.8 10.0 12.0 14.3 16.1 17.5 16.0 14.9 15.1 14.4 14.0 12.6 12.1 11.2 11.2 10.9 10.1 10.4 10.6 11.7 10.5 9.5 -1.0
10th Grade 13.1 12.6 15.5 20.0 21.6 24.5 24.1 22.5 23.1 23.6 23.6 21.7 20.5 19.3 18.4 17.7 18.1 16.8 18.8 19.4 20.1 19.3 -0.8
12th Grade 17.8 15.5 19.3 23.0 24.8 25.5 26.9 26.6 26.4 26.4 26.5 25.9 24.6 23.3 24.2 22.1 22.8 22.8 24.1 24.5 26.2 25.2 -1.0
8th Grade 3.2 3.7 5.1 7.8 9.1 11.3 10.2 9.7 9.7 9.1 9.2 8.3 7.5 6.4 6.6 6.5 5.7 5.8 6.5 8.0 7.2 6.5 -0.7
10th Grade 8.7 8.1 10.9 15.8 17.2 20.4 20.5 18.7 19.4 19.7 19.8 17.8 17.0 15.9 15.2 14.2 14.2 13.8 15.9 16.7 17.6 17.0 -0.6
12th Grade 13.8 11.9 15.5 19.0 21.2 21.9 23.7 22.8 23.1 21.6 22.4 21.5 21.2 19.9 19.8 18.3 18.8 19.4 20.6 21.4 22.6 22.9 +0.3
8th Grade 4.4 4.7 5.4 5.6 6.1 5.8 5.6 4.8 5.0 4.5 4.0 3.8 4.1 4.5 4.2 4.1 3.9 4.1 3.8 3.6 3.2 2.7 -0.6 s
10th Grade 2.7 2.7 3.3 3.6 3.5 3.3 3.0 2.9 2.6 2.6 2.4 2.4 2.2 2.4 2.2 2.3 2.5 2.1 2.2 2.0 1.7 1.4 -0.3
12th Grade 2.4 2.3 2.5 2.7 3.2 2.5 2.5 2.3 2.0 2.2 1.7 1.5 1.5 1.5 2.0 1.5 1.2 1.4 1.2 1.4 1.0 0.9 -0.2
8th Grade — — — — — — — — — — — — — — — — — — — — — — —
10th Grade — — — — — — — — — — — — — — — — — — — — — — —
12th Grade 0.4 0.3 0.6 0.4 0.4 0.7 0.7 1.0 0.4 0.3 0.5 0.6 0.7 0.7 0.5 0.3 0.5 0.3 0.6 — — — —
8th Grade 0.8 1.1 1.2 1.3 1.7 1.9 1.8 1.4 1.3 1.2‡ 1.6 1.2 1.2 1.0 1.1 0.9 1.0 0.9 0.9 1.0 1.0 0.6 -0.4 s
10th Grade 1.6 1.8 1.9 2.4 3.3 2.8 3.3 3.2 2.9 2.3‡ 2.1 1.6 1.5 1.6 1.5 1.5 1.7 1.3 1.4 1.6 1.4 1.2 -0.2
12th Grade 2.2 2.1 2.7 3.1 4.4 3.5 3.9 3.8 3.5 2.6‡ 3.3 2.3 1.8 1.9 1.9 1.5 1.7 2.2 1.6 1.9 1.6 1.6 0.0
LSD
8th Grade 0.6 0.9 1.0 1.1 1.4 1.5 1.5 1.1 1.1 1.0 1.0 0.7 0.6 0.5 0.5 0.4 0.5 0.5 0.5 0.6 0.5 0.3 -0.2
10th Grade 1.5 1.6 1.6 2.0 3.0 2.4 2.8 2.7 2.3 1.6 1.5 0.7 0.6 0.6 0.6 0.7 0.7 0.7 0.5 0.7 0.7 0.5 -0.1
12th Grade 1.9 2.0 2.4 2.6 4.0 2.5 3.1 3.2 2.7 1.6 2.3 0.7 0.6 0.7 0.7 0.6 0.6 1.1 0.5 0.8 0.8 0.8 0.0
Hallucinogens
other than LSD b
8th Grade 0.3 0.4 0.5 0.7 0.8 0.9 0.7 0.7 0.6 0.6‡ 1.1 1.0 1.0 0.8 0.9 0.7 0.7 0.7 0.7 0.8 0.7 0.5 -0.3 ss
10th Grade 0.4 0.5 0.7 1.0 1.0 1.0 1.2 1.4 1.2 1.2‡ 1.4 1.4 1.2 1.4 1.3 1.3 1.4 1.0 1.1 1.2 1.1 0.9 -0.2
12th Grade 0.7 0.5 0.8 1.2 1.3 1.6 1.7 1.6 1.6 1.7‡ 1.9 2.0 1.5 1.7 1.6 1.3 1.4 1.6 1.4 1.5 1.2 1.3 +0.1
Nitrites e
Hallucinogens b,f
(Table continued on next page.)
change
Any Illicit Drug a
than Marijuana a,b
Any Illicit Drug
Marijuana/Hashish
Inhalants c,d
TABLE 7Trends in 30-Day Prevalence of Use of Various Drugs
in Grades 8, 10, and 12
Percentage who used in last 30 days 2011–
2012
64
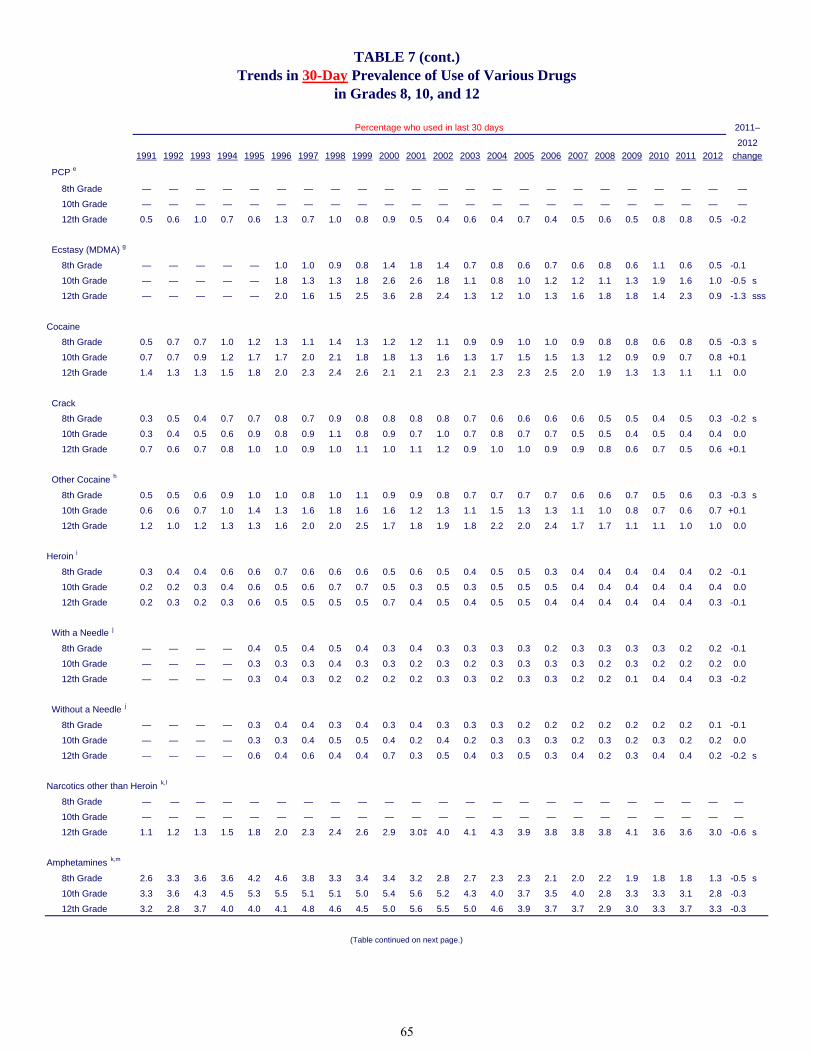
1991 1992 1993 1994 1995 1996 1997 1998 1999 2000 2001 2002 2003 2004 2005 2006 2007 2008 2009 2010 2011 2012
PCP e
8th Grade — — — — — — — — — — — — — — — — — — — — — — —
10th Grade — — — — — — — — — — — — — — — — — — — — — — —
12th Grade 0.5 0.6 1.0 0.7 0.6 1.3 0.7 1.0 0.8 0.9 0.5 0.4 0.6 0.4 0.7 0.4 0.5 0.6 0.5 0.8 0.8 0.5 -0.2
8th Grade — — — — — 1.0 1.0 0.9 0.8 1.4 1.8 1.4 0.7 0.8 0.6 0.7 0.6 0.8 0.6 1.1 0.6 0.5 -0.1
10th Grade — — — — — 1.8 1.3 1.3 1.8 2.6 2.6 1.8 1.1 0.8 1.0 1.2 1.2 1.1 1.3 1.9 1.6 1.0 -0.5 s
12th Grade — — — — — 2.0 1.6 1.5 2.5 3.6 2.8 2.4 1.3 1.2 1.0 1.3 1.6 1.8 1.8 1.4 2.3 0.9 -1.3 sss
8th Grade 0.5 0.7 0.7 1.0 1.2 1.3 1.1 1.4 1.3 1.2 1.2 1.1 0.9 0.9 1.0 1.0 0.9 0.8 0.8 0.6 0.8 0.5 -0.3 s
10th Grade 0.7 0.7 0.9 1.2 1.7 1.7 2.0 2.1 1.8 1.8 1.3 1.6 1.3 1.7 1.5 1.5 1.3 1.2 0.9 0.9 0.7 0.8 +0.1
12th Grade 1.4 1.3 1.3 1.5 1.8 2.0 2.3 2.4 2.6 2.1 2.1 2.3 2.1 2.3 2.3 2.5 2.0 1.9 1.3 1.3 1.1 1.1 0.0
8th Grade 0.3 0.5 0.4 0.7 0.7 0.8 0.7 0.9 0.8 0.8 0.8 0.8 0.7 0.6 0.6 0.6 0.6 0.5 0.5 0.4 0.5 0.3 -0.2 s
10th Grade 0.3 0.4 0.5 0.6 0.9 0.8 0.9 1.1 0.8 0.9 0.7 1.0 0.7 0.8 0.7 0.7 0.5 0.5 0.4 0.5 0.4 0.4 0.0
12th Grade 0.7 0.6 0.7 0.8 1.0 1.0 0.9 1.0 1.1 1.0 1.1 1.2 0.9 1.0 1.0 0.9 0.9 0.8 0.6 0.7 0.5 0.6 +0.1
8th Grade 0.5 0.5 0.6 0.9 1.0 1.0 0.8 1.0 1.1 0.9 0.9 0.8 0.7 0.7 0.7 0.7 0.6 0.6 0.7 0.5 0.6 0.3 -0.3 s
10th Grade 0.6 0.6 0.7 1.0 1.4 1.3 1.6 1.8 1.6 1.6 1.2 1.3 1.1 1.5 1.3 1.3 1.1 1.0 0.8 0.7 0.6 0.7 +0.1
12th Grade 1.2 1.0 1.2 1.3 1.3 1.6 2.0 2.0 2.5 1.7 1.8 1.9 1.8 2.2 2.0 2.4 1.7 1.7 1.1 1.1 1.0 1.0 0.0
8th Grade 0.3 0.4 0.4 0.6 0.6 0.7 0.6 0.6 0.6 0.5 0.6 0.5 0.4 0.5 0.5 0.3 0.4 0.4 0.4 0.4 0.4 0.2 -0.1
10th Grade 0.2 0.2 0.3 0.4 0.6 0.5 0.6 0.7 0.7 0.5 0.3 0.5 0.3 0.5 0.5 0.5 0.4 0.4 0.4 0.4 0.4 0.4 0.0
12th Grade 0.2 0.3 0.2 0.3 0.6 0.5 0.5 0.5 0.5 0.7 0.4 0.5 0.4 0.5 0.5 0.4 0.4 0.4 0.4 0.4 0.4 0.3 -0.1
8th Grade — — — — 0.4 0.5 0.4 0.5 0.4 0.3 0.4 0.3 0.3 0.3 0.3 0.2 0.3 0.3 0.3 0.3 0.2 0.2 -0.1
10th Grade — — — — 0.3 0.3 0.3 0.4 0.3 0.3 0.2 0.3 0.2 0.3 0.3 0.3 0.3 0.2 0.3 0.2 0.2 0.2 0.0
12th Grade — — — — 0.3 0.4 0.3 0.2 0.2 0.2 0.2 0.3 0.3 0.2 0.3 0.3 0.2 0.2 0.1 0.4 0.4 0.3 -0.2
8th Grade — — — — 0.3 0.4 0.4 0.3 0.4 0.3 0.4 0.3 0.3 0.3 0.2 0.2 0.2 0.2 0.2 0.2 0.2 0.1 -0.1
10th Grade — — — — 0.3 0.3 0.4 0.5 0.5 0.4 0.2 0.4 0.2 0.3 0.3 0.3 0.2 0.3 0.2 0.3 0.2 0.2 0.0
12th Grade — — — — 0.6 0.4 0.6 0.4 0.4 0.7 0.3 0.5 0.4 0.3 0.5 0.3 0.4 0.2 0.3 0.4 0.4 0.2 -0.2 s
8th Grade — — — — — — — — — — — — — — — — — — — — — — —
10th Grade — — — — — — — — — — — — — — — — — — — — — — —
12th Grade 1.1 1.2 1.3 1.5 1.8 2.0 2.3 2.4 2.6 2.9 3.0‡ 4.0 4.1 4.3 3.9 3.8 3.8 3.8 4.1 3.6 3.6 3.0 -0.6 s
8th Grade 2.6 3.3 3.6 3.6 4.2 4.6 3.8 3.3 3.4 3.4 3.2 2.8 2.7 2.3 2.3 2.1 2.0 2.2 1.9 1.8 1.8 1.3 -0.5 s
10th Grade 3.3 3.6 4.3 4.5 5.3 5.5 5.1 5.1 5.0 5.4 5.6 5.2 4.3 4.0 3.7 3.5 4.0 2.8 3.3 3.3 3.1 2.8 -0.3
12th Grade 3.2 2.8 3.7 4.0 4.0 4.1 4.8 4.6 4.5 5.0 5.6 5.5 5.0 4.6 3.9 3.7 3.7 2.9 3.0 3.3 3.7 3.3 -0.3
Amphetamines k,m
(Table continued on next page.)
Crack
Other Cocaine h
Heroin i
With a Needle j
Without a Needle j
Narcotics other than Heroin k,l
Percentage who used in last 30 days 2011–
2012
change
Ecstasy (MDMA) g
Cocaine
TABLE 7 (cont.)Trends in 30-Day Prevalence of Use of Various Drugs
in Grades 8, 10, and 12
65
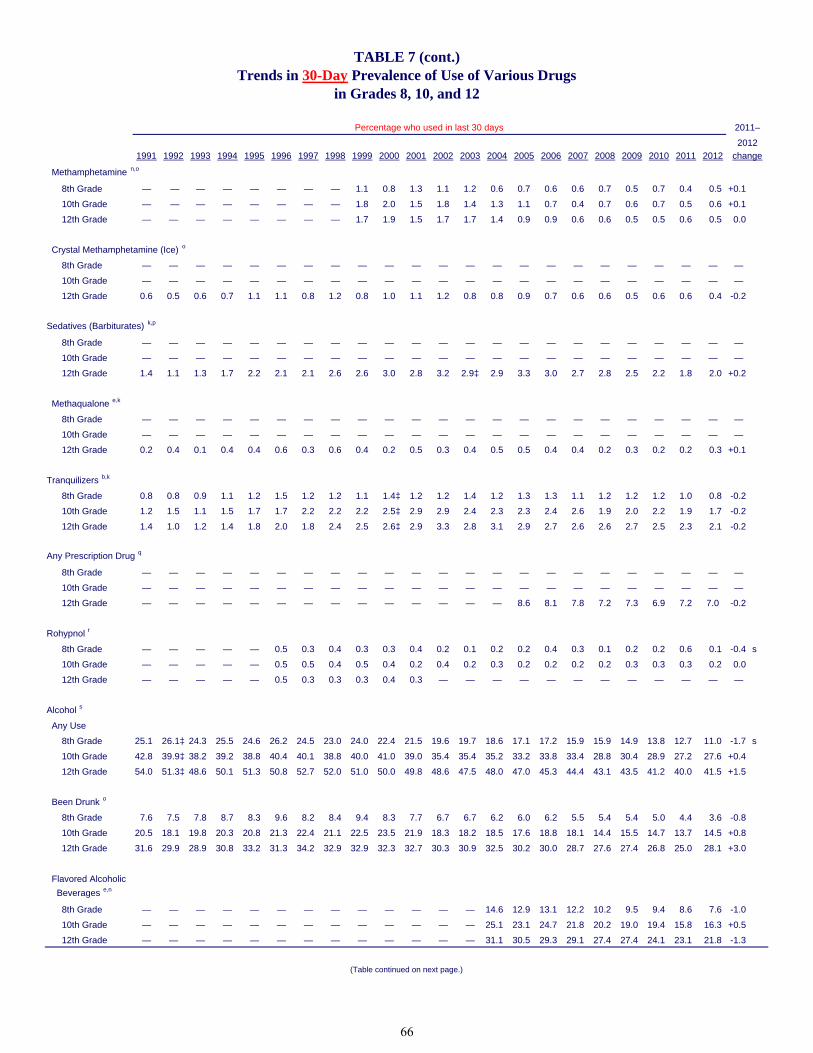
1991 1992 1993 1994 1995 1996 1997 1998 1999 2000 2001 2002 2003 2004 2005 2006 2007 2008 2009 2010 2011 2012
Methamphetamine n,o
8th Grade — — — — — — — — 1.1 0.8 1.3 1.1 1.2 0.6 0.7 0.6 0.6 0.7 0.5 0.7 0.4 0.5 +0.1
10th Grade — — — — — — — — 1.8 2.0 1.5 1.8 1.4 1.3 1.1 0.7 0.4 0.7 0.6 0.7 0.5 0.6 +0.1
12th Grade — — — — — — — — 1.7 1.9 1.5 1.7 1.7 1.4 0.9 0.9 0.6 0.6 0.5 0.5 0.6 0.5 0.0
8th Grade — — — — — — — — — — — — — — — — — — — — — — —
10th Grade — — — — — — — — — — — — — — — — — — — — — — —
12th Grade 0.6 0.5 0.6 0.7 1.1 1.1 0.8 1.2 0.8 1.0 1.1 1.2 0.8 0.8 0.9 0.7 0.6 0.6 0.5 0.6 0.6 0.4 -0.2
Sedatives (Barbiturates) k,p
8th Grade — — — — — — — — — — — — — — — — — — — — — — —
10th Grade — — — — — — — — — — — — — — — — — — — — — — —
12th Grade 1.4 1.1 1.3 1.7 2.2 2.1 2.1 2.6 2.6 3.0 2.8 3.2 2.9‡ 2.9 3.3 3.0 2.7 2.8 2.5 2.2 1.8 2.0 +0.2
8th Grade — — — — — — — — — — — — — — — — — — — — — — —
10th Grade — — — — — — — — — — — — — — — — — — — — — — —
12th Grade 0.2 0.4 0.1 0.4 0.4 0.6 0.3 0.6 0.4 0.2 0.5 0.3 0.4 0.5 0.5 0.4 0.4 0.2 0.3 0.2 0.2 0.3 +0.1
8th Grade 0.8 0.8 0.9 1.1 1.2 1.5 1.2 1.2 1.1 1.4‡ 1.2 1.2 1.4 1.2 1.3 1.3 1.1 1.2 1.2 1.2 1.0 0.8 -0.2
10th Grade 1.2 1.5 1.1 1.5 1.7 1.7 2.2 2.2 2.2 2.5‡ 2.9 2.9 2.4 2.3 2.3 2.4 2.6 1.9 2.0 2.2 1.9 1.7 -0.2
12th Grade 1.4 1.0 1.2 1.4 1.8 2.0 1.8 2.4 2.5 2.6‡ 2.9 3.3 2.8 3.1 2.9 2.7 2.6 2.6 2.7 2.5 2.3 2.1 -0.2
Any Prescription Drug q
8th Grade — — — — — — — — — — — — — — — — — — — — — — —
10th Grade — — — — — — — — — — — — — — — — — — — — — — —
12th Grade — — — — — — — — — — — — — — 8.6 8.1 7.8 7.2 7.3 6.9 7.2 7.0 -0.2
8th Grade — — — — — 0.5 0.3 0.4 0.3 0.3 0.4 0.2 0.1 0.2 0.2 0.4 0.3 0.1 0.2 0.2 0.6 0.1 -0.4 s
10th Grade — — — — — 0.5 0.5 0.4 0.5 0.4 0.2 0.4 0.2 0.3 0.2 0.2 0.2 0.2 0.3 0.3 0.3 0.2 0.0
12th Grade — — — — — 0.5 0.3 0.3 0.3 0.4 0.3 — — — — — — — — — — — —
8th Grade 25.1 26.1‡ 24.3 25.5 24.6 26.2 24.5 23.0 24.0 22.4 21.5 19.6 19.7 18.6 17.1 17.2 15.9 15.9 14.9 13.8 12.7 11.0 -1.7 s
10th Grade 42.8 39.9‡ 38.2 39.2 38.8 40.4 40.1 38.8 40.0 41.0 39.0 35.4 35.4 35.2 33.2 33.8 33.4 28.8 30.4 28.9 27.2 27.6 +0.4
12th Grade 54.0 51.3‡ 48.6 50.1 51.3 50.8 52.7 52.0 51.0 50.0 49.8 48.6 47.5 48.0 47.0 45.3 44.4 43.1 43.5 41.2 40.0 41.5 +1.5
8th Grade 7.6 7.5 7.8 8.7 8.3 9.6 8.2 8.4 9.4 8.3 7.7 6.7 6.7 6.2 6.0 6.2 5.5 5.4 5.4 5.0 4.4 3.6 -0.8
10th Grade 20.5 18.1 19.8 20.3 20.8 21.3 22.4 21.1 22.5 23.5 21.9 18.3 18.2 18.5 17.6 18.8 18.1 14.4 15.5 14.7 13.7 14.5 +0.8
12th Grade 31.6 29.9 28.9 30.8 33.2 31.3 34.2 32.9 32.9 32.3 32.7 30.3 30.9 32.5 30.2 30.0 28.7 27.6 27.4 26.8 25.0 28.1 +3.0
Flavored Alcoholic
Beverages e,n
8th Grade — — — — — — — — — — — — — 14.6 12.9 13.1 12.2 10.2 9.5 9.4 8.6 7.6 -1.0
10th Grade — — — — — — — — — — — — — 25.1 23.1 24.7 21.8 20.2 19.0 19.4 15.8 16.3 +0.5
12th Grade — — — — — — — — — — — — — 31.1 30.5 29.3 29.1 27.4 27.4 24.1 23.1 21.8 -1.3
Alcohol s
Any Use
Been Drunk o
(Table continued on next page.)
2012
change
Crystal Methamphetamine (Ice) o
Methaqualone e,k
Tranquilizers b,k
Rohypnol r
TABLE 7 (cont.)Trends in 30-Day Prevalence of Use of Various Drugs
in Grades 8, 10, and 12
Percentage who used in last 30 days 2011–
66
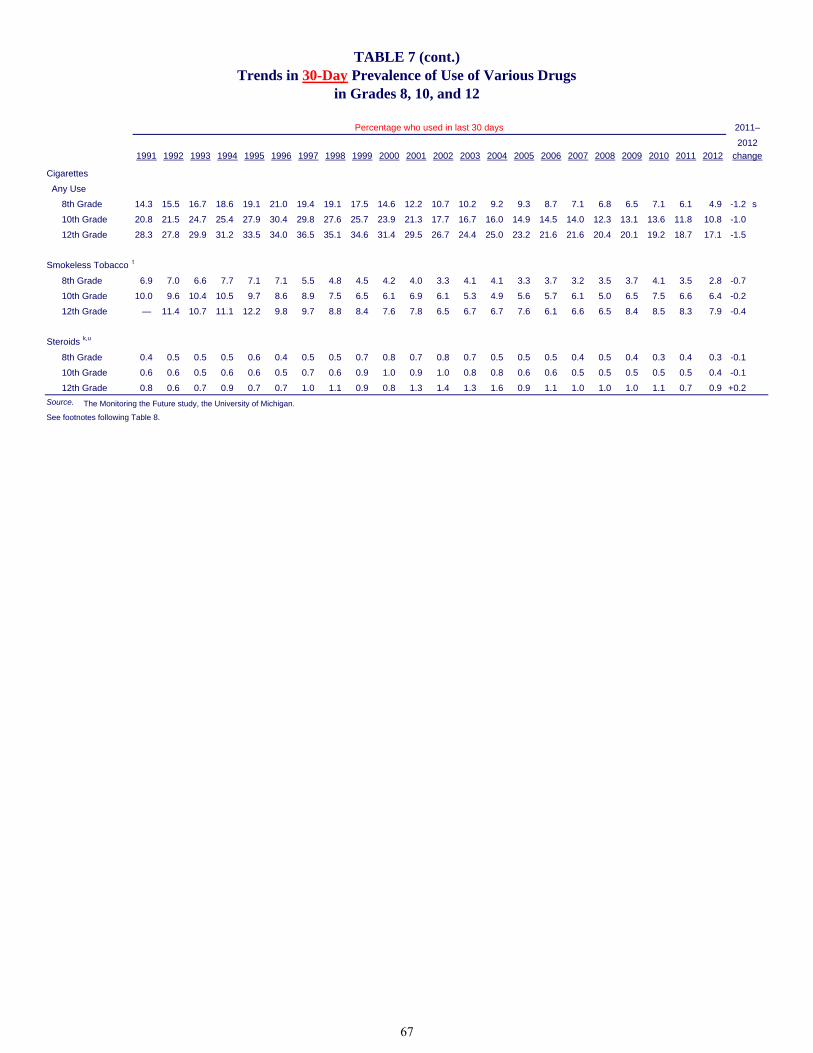
1991 1992 1993 1994 1995 1996 1997 1998 1999 2000 2001 2002 2003 2004 2005 2006 2007 2008 2009 2010 2011 2012
8th Grade 14.3 15.5 16.7 18.6 19.1 21.0 19.4 19.1 17.5 14.6 12.2 10.7 10.2 9.2 9.3 8.7 7.1 6.8 6.5 7.1 6.1 4.9 -1.2 s
10th Grade 20.8 21.5 24.7 25.4 27.9 30.4 29.8 27.6 25.7 23.9 21.3 17.7 16.7 16.0 14.9 14.5 14.0 12.3 13.1 13.6 11.8 10.8 -1.0
12th Grade 28.3 27.8 29.9 31.2 33.5 34.0 36.5 35.1 34.6 31.4 29.5 26.7 24.4 25.0 23.2 21.6 21.6 20.4 20.1 19.2 18.7 17.1 -1.5
8th Grade 6.9 7.0 6.6 7.7 7.1 7.1 5.5 4.8 4.5 4.2 4.0 3.3 4.1 4.1 3.3 3.7 3.2 3.5 3.7 4.1 3.5 2.8 -0.7
10th Grade 10.0 9.6 10.4 10.5 9.7 8.6 8.9 7.5 6.5 6.1 6.9 6.1 5.3 4.9 5.6 5.7 6.1 5.0 6.5 7.5 6.6 6.4 -0.2
12th Grade — 11.4 10.7 11.1 12.2 9.8 9.7 8.8 8.4 7.6 7.8 6.5 6.7 6.7 7.6 6.1 6.6 6.5 8.4 8.5 8.3 7.9 -0.4
8th Grade 0.4 0.5 0.5 0.5 0.6 0.4 0.5 0.5 0.7 0.8 0.7 0.8 0.7 0.5 0.5 0.5 0.4 0.5 0.4 0.3 0.4 0.3 -0.1
10th Grade 0.6 0.6 0.5 0.6 0.6 0.5 0.7 0.6 0.9 1.0 0.9 1.0 0.8 0.8 0.6 0.6 0.5 0.5 0.5 0.5 0.5 0.4 -0.1
12th Grade 0.8 0.6 0.7 0.9 0.7 0.7 1.0 1.1 0.9 0.8 1.3 1.4 1.3 1.6 0.9 1.1 1.0 1.0 1.0 1.1 0.7 0.9 +0.2
Source. The Monitoring the Future study, the University of Michigan.
See footnotes following Table 8.
Any Use
Smokeless Tobacco t
Steroids k,u
in Grades 8, 10, and 12
Percentage who used in last 30 days 2011–
2012
change
Cigarettes
TABLE 7 (cont.)Trends in 30-Day Prevalence of Use of Various Drugs
67
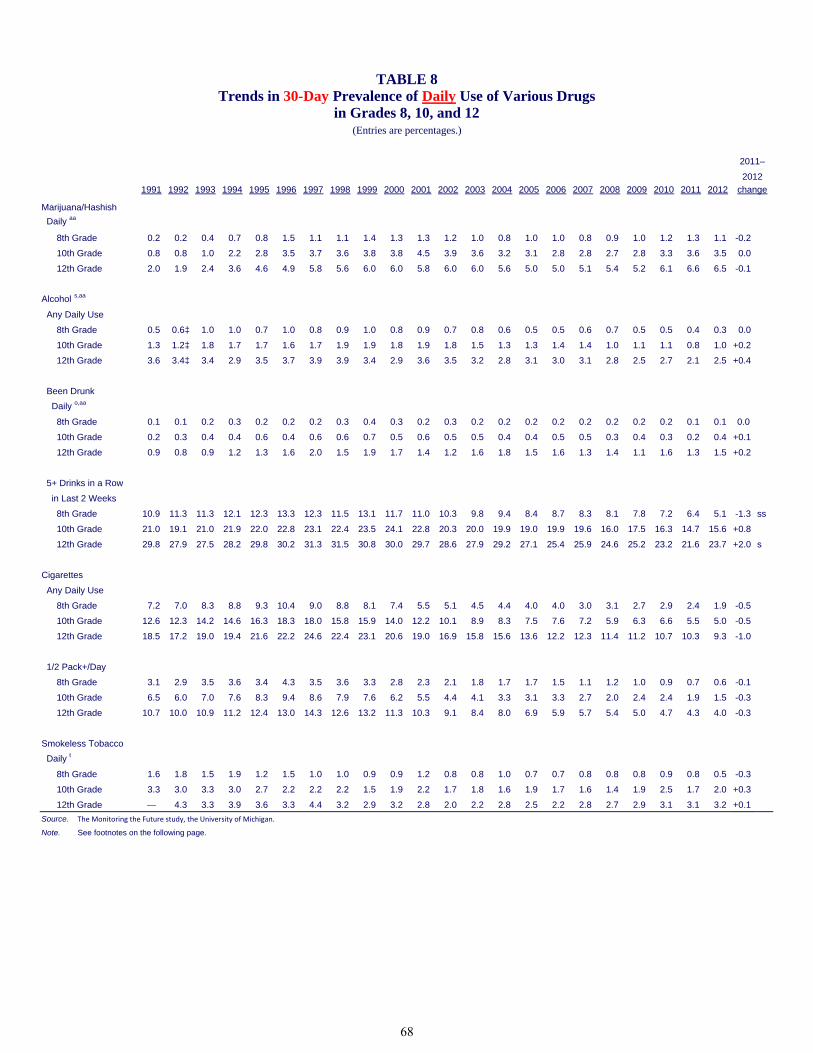
1991 1992 1993 1994 1995 1996 1997 1998 1999 2000 2001 2002 2003 2004 2005 2006 2007 2008 2009 2010 2011 2012
Daily aa
8th Grade 0.2 0.2 0.4 0.7 0.8 1.5 1.1 1.1 1.4 1.3 1.3 1.2 1.0 0.8 1.0 1.0 0.8 0.9 1.0 1.2 1.3 1.1 -0.2
10th Grade 0.8 0.8 1.0 2.2 2.8 3.5 3.7 3.6 3.8 3.8 4.5 3.9 3.6 3.2 3.1 2.8 2.8 2.7 2.8 3.3 3.6 3.5 0.0
12th Grade 2.0 1.9 2.4 3.6 4.6 4.9 5.8 5.6 6.0 6.0 5.8 6.0 6.0 5.6 5.0 5.0 5.1 5.4 5.2 6.1 6.6 6.5 -0.1
Any Daily Use
8th Grade 0.5 0.6‡ 1.0 1.0 0.7 1.0 0.8 0.9 1.0 0.8 0.9 0.7 0.8 0.6 0.5 0.5 0.6 0.7 0.5 0.5 0.4 0.3 0.0
10th Grade 1.3 1.2‡ 1.8 1.7 1.7 1.6 1.7 1.9 1.9 1.8 1.9 1.8 1.5 1.3 1.3 1.4 1.4 1.0 1.1 1.1 0.8 1.0 +0.2
12th Grade 3.6 3.4‡ 3.4 2.9 3.5 3.7 3.9 3.9 3.4 2.9 3.6 3.5 3.2 2.8 3.1 3.0 3.1 2.8 2.5 2.7 2.1 2.5 +0.4
8th Grade 0.1 0.1 0.2 0.3 0.2 0.2 0.2 0.3 0.4 0.3 0.2 0.3 0.2 0.2 0.2 0.2 0.2 0.2 0.2 0.2 0.1 0.1 0.0
10th Grade 0.2 0.3 0.4 0.4 0.6 0.4 0.6 0.6 0.7 0.5 0.6 0.5 0.5 0.4 0.4 0.5 0.5 0.3 0.4 0.3 0.2 0.4 +0.1
12th Grade 0.9 0.8 0.9 1.2 1.3 1.6 2.0 1.5 1.9 1.7 1.4 1.2 1.6 1.8 1.5 1.6 1.3 1.4 1.1 1.6 1.3 1.5 +0.2
5+ Drinks in a Row
8th Grade 10.9 11.3 11.3 12.1 12.3 13.3 12.3 11.5 13.1 11.7 11.0 10.3 9.8 9.4 8.4 8.7 8.3 8.1 7.8 7.2 6.4 5.1 -1.3 ss
10th Grade 21.0 19.1 21.0 21.9 22.0 22.8 23.1 22.4 23.5 24.1 22.8 20.3 20.0 19.9 19.0 19.9 19.6 16.0 17.5 16.3 14.7 15.6 +0.8
12th Grade 29.8 27.9 27.5 28.2 29.8 30.2 31.3 31.5 30.8 30.0 29.7 28.6 27.9 29.2 27.1 25.4 25.9 24.6 25.2 23.2 21.6 23.7 +2.0 s
Cigarettes
Any Daily Use
8th Grade 7.2 7.0 8.3 8.8 9.3 10.4 9.0 8.8 8.1 7.4 5.5 5.1 4.5 4.4 4.0 4.0 3.0 3.1 2.7 2.9 2.4 1.9 -0.5
10th Grade 12.6 12.3 14.2 14.6 16.3 18.3 18.0 15.8 15.9 14.0 12.2 10.1 8.9 8.3 7.5 7.6 7.2 5.9 6.3 6.6 5.5 5.0 -0.5
12th Grade 18.5 17.2 19.0 19.4 21.6 22.2 24.6 22.4 23.1 20.6 19.0 16.9 15.8 15.6 13.6 12.2 12.3 11.4 11.2 10.7 10.3 9.3 -1.0
1/2 Pack+/Day
8th Grade 3.1 2.9 3.5 3.6 3.4 4.3 3.5 3.6 3.3 2.8 2.3 2.1 1.8 1.7 1.7 1.5 1.1 1.2 1.0 0.9 0.7 0.6 -0.1
10th Grade 6.5 6.0 7.0 7.6 8.3 9.4 8.6 7.9 7.6 6.2 5.5 4.4 4.1 3.3 3.1 3.3 2.7 2.0 2.4 2.4 1.9 1.5 -0.3
12th Grade 10.7 10.0 10.9 11.2 12.4 13.0 14.3 12.6 13.2 11.3 10.3 9.1 8.4 8.0 6.9 5.9 5.7 5.4 5.0 4.7 4.3 4.0 -0.3
8th Grade 1.6 1.8 1.5 1.9 1.2 1.5 1.0 1.0 0.9 0.9 1.2 0.8 0.8 1.0 0.7 0.7 0.8 0.8 0.8 0.9 0.8 0.5 -0.3
10th Grade 3.3 3.0 3.3 3.0 2.7 2.2 2.2 2.2 1.5 1.9 2.2 1.7 1.8 1.6 1.9 1.7 1.6 1.4 1.9 2.5 1.7 2.0 +0.3
12th Grade — 4.3 3.3 3.9 3.6 3.3 4.4 3.2 2.9 3.2 2.8 2.0 2.2 2.8 2.5 2.2 2.8 2.7 2.9 3.1 3.1 3.2 +0.1
Source. The Monitoring the Future study, the University of Michigan.
Note. See footnotes on the following page.
Smokeless Tobacco
Daily t
TABLE 8Trends in 30-Day Prevalence of Daily Use of Various Drugs
in Grades 8, 10, and 12
2011–
2012
change
Marijuana/Hashish
Been Drunk
in Last 2 Weeks
Alcohol s,aa
Daily o,aa
(Entries are percentages.)
68
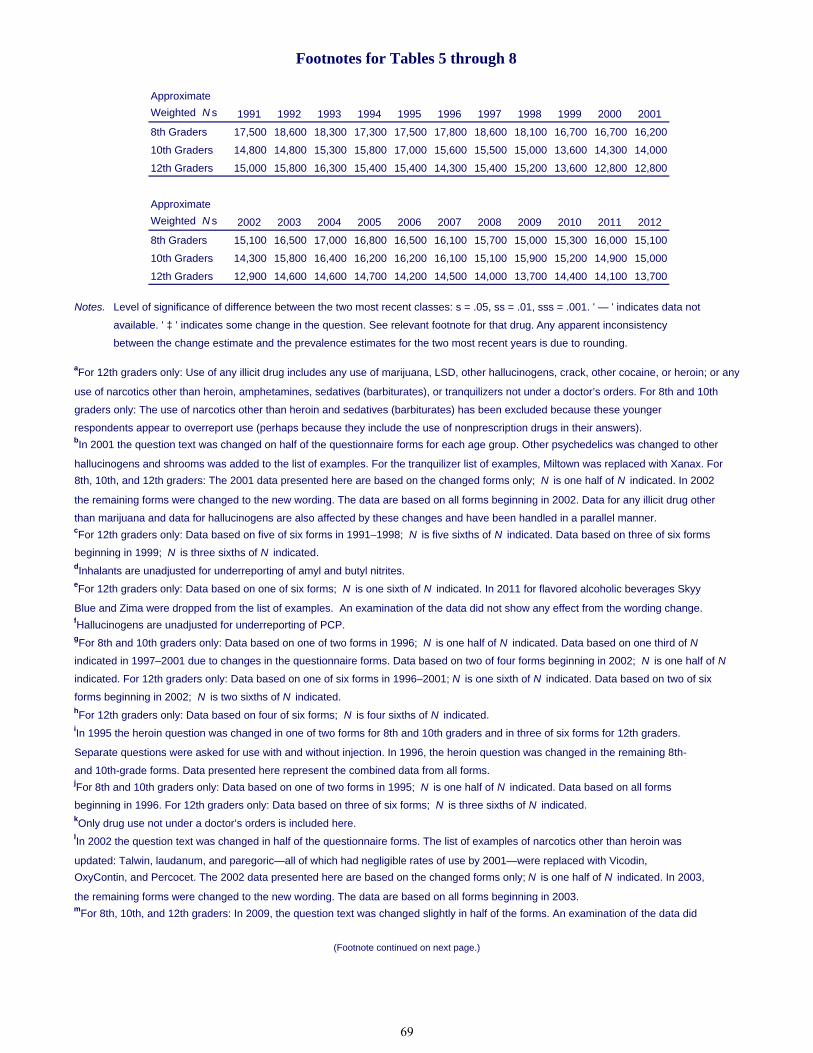
Approximate
Weighted N s 1991 1992 1993 1994 1995 1996 1997 1998 1999 2000 2001
8th Graders 17,500 18,600 18,300 17,300 17,500 17,800 18,600 18,100 16,700 16,700 16,200
10th Graders 14,800 14,800 15,300 15,800 17,000 15,600 15,500 15,000 13,600 14,300 14,000
12th Graders 15,000 15,800 16,300 15,400 15,400 14,300 15,400 15,200 13,600 12,800 12,800
Approximate
Weighted N s 2002 2003 2004 2005 2006 2007 2008 2009 2010 2011 2012
8th Graders 15,100 16,500 17,000 16,800 16,500 16,100 15,700 15,000 15,300 16,000 15,100
10th Graders 14,300 15,800 16,400 16,200 16,200 16,100 15,100 15,900 15,200 14,900 15,000
12th Graders 12,900 14,600 14,600 14,700 14,200 14,500 14,000 13,700 14,400 14,100 13,700
Notes. Level of significance of difference between the two most recent classes: s = .05, ss = .01, sss = .001. ' — ' indicates data not
available. ' ‡ ' indicates some change in the question. See relevant footnote for that drug. Any apparent inconsistency
between the change estimate and the prevalence estimates for the two most recent years is due to rounding.
aFor 12th graders only: Use of any illicit drug includes any use of marijuana, LSD, other hallucinogens, crack, other cocaine, or heroin; or any
use of narcotics other than heroin, amphetamines, sedatives (barbiturates), or tranquilizers not under a doctor’s orders. For 8th and 10th
graders only: The use of narcotics other than heroin and sedatives (barbiturates) has been excluded because these younger
respondents appear to overreport use (perhaps because they include the use of nonprescription drugs in their answers).bIn 2001 the question text was changed on half of the questionnaire forms for each age group. Other psychedelics was changed to other
hallucinogens and shrooms was added to the list of examples. For the tranquilizer list of examples, Miltown was replaced with Xanax. For
8th, 10th, and 12th graders: The 2001 data presented here are based on the changed forms only; N is one half of N indicated. In 2002
the remaining forms were changed to the new wording. The data are based on all forms beginning in 2002. Data for any illicit drug other
than marijuana and data for hallucinogens are also affected by these changes and have been handled in a parallel manner. cFor 12th graders only: Data based on five of six forms in 1991–1998; N is five sixths of N indicated. Data based on three of six forms
beginning in 1999; N is three sixths of N indicated. dInhalants are unadjusted for underreporting of amyl and butyl nitrites.eFor 12th graders only: Data based on one of six forms; N is one sixth of N indicated. In 2011 for flavored alcoholic beverages Skyy
Blue and Zima were dropped from the list of examples. An examination of the data did not show any effect from the wording change.fHallucinogens are unadjusted for underreporting of PCP.gFor 8th and 10th graders only: Data based on one of two forms in 1996; N is one half of N indicated. Data based on one third of N
indicated in 1997–2001 due to changes in the questionnaire forms. Data based on two of four forms beginning in 2002; N is one half of N
indicated. For 12th graders only: Data based on one of six forms in 1996–2001; N is one sixth of N indicated. Data based on two of six
forms beginning in 2002; N is two sixths of N indicated. hFor 12th graders only: Data based on four of six forms; N is four sixths of N indicated.iIn 1995 the heroin question was changed in one of two forms for 8th and 10th graders and in three of six forms for 12th graders.
Separate questions were asked for use with and without injection. In 1996, the heroin question was changed in the remaining 8th-
and 10th-grade forms. Data presented here represent the combined data from all forms.jFor 8th and 10th graders only: Data based on one of two forms in 1995; N is one half of N indicated. Data based on all forms
beginning in 1996. For 12th graders only: Data based on three of six forms; N is three sixths of N indicated. kOnly drug use not under a doctor’s orders is included here.lIn 2002 the question text was changed in half of the questionnaire forms. The list of examples of narcotics other than heroin was
updated: Talwin, laudanum, and paregoric—all of which had negligible rates of use by 2001—were replaced with Vicodin,
OxyContin, and Percocet. The 2002 data presented here are based on the changed forms only; N is one half of N indicated. In 2003,
the remaining forms were changed to the new wording. The data are based on all forms beginning in 2003. mFor 8th, 10th, and 12th graders: In 2009, the question text was changed slightly in half of the forms. An examination of the data did
Footnotes for Tables 5 through 8
(Footnote continued on next page.)
69
not show any effect from the wording change. In 2010 the remaining forms were changed in a like manner. In 2011 the question text was
changed slightly in one form; bennies, Benzedrine and Methadrine were dropped from the list of examples. An examination of the data
did not show any effect from the wording change. nFor 8th and 10th graders only: Data based on one of four forms; N is one third of N indicated. In 2011for flavored alcoholic beverages:
Skyy Blue and Zima were dropped from the list of examples. An examination of the data did not show any effect from the wording change. oFor 12th graders only: Data based on two of six forms; N is two sixths of N indicated. Bidis and kreteks based on one of six forms
beginning in 2009; N is one sixth N indicated.pFor 12th graders only: In 2004 the barbiturate question text was changed on half of the questionnaire forms. Barbiturates was changed
to sedatives including barbiturates, and “have you taken barbiturates . . . ” was changed to “have you taken sedatives . . . ” In the list of
examples downs, downers, goofballs, yellow, reds, blues, rainbows were changed to downs, or downers, and include Phenobarbital,
Tuinal, Nembutal, and Seconal. An examination of the data did not show any effect from the wording change. In 2005 the remaining
forms were changed in a like manner.qThe use of any prescription drug includes use of any of the following: amphetamines, sedatives (barbiturates), narcotics other than
heroin, or tranquilizers “…without a doctor telling you to use them.”rFor 8th and 10th graders only: Data based on one of two forms in 1996; N is one half of N indicated. Data based on three of four forms
in 1997–1998; N is two thirds of N indicated. Data based on two of four forms in 1999–2001; N is one third of N indicated. Data based
on one of four forms beginning in 2002; N is one sixth of N indicated. For 12th graders only: Data based on one of six forms in 1996–2001;
N is one sixth of N indicated. Data based on two of six forms in 2002–2009; N is two sixths of N indicated. Data for 2001 and 2002 are
not comparable due to changes in the questionnaire forms. Data based on one of six forms beginning in 2010; N is one sixth of N indicated. sFor 8th, 10th, and 12th graders: In 1993, the question text was changed slightly in half of the forms to indicate that a drink meant more than
just a few sips. The 1993 data are based on the changed forms only; N is one half of N indicated for these groups. In 1994 the remaining
forms were changed to the new wording. The data are based on all forms beginning in 1994. In 2004, the question text was changed
slightly in half of the forms. An examination of the data did not show any effect from the wording change. The remaining forms
were changed in 2005.tFor 8th and 10th graders only: Data based on one of two forms for 1991–1996 and on two of four forms beginning in 1997; N is one half
of N indicated. For 12th graders only: Data based on one of six forms; N is one sixth of N indicated. For all grades in 2011: snus and
dissolvable tobacco were added to the list of examples. An examination of the data did not show any effect from the wording change. uFor 8th and 10th graders only: In 2006, the question text was changed slightly in half of the questionnaire forms. An examination of the data
did not show any effect from the wording change. In 2007 the remaining forms were changed in a like manner. In 2008 the question text
was changed slightly in half of the questionnaire forms. An examination of the data did not show any effect from the wording change. In
2009 the remaining forms were changed in a like manner. For 12th graders only: Data based on two of six forms in 1991–2005; N is two
sixths of N indicated. Data based on three of six forms beginning in 2006; N is three sixths of N indicated. In 2006 a slightly altered
version of the question was added to a third form. An examination of the data did not show any effect from the wording change. In
2007 the remaining forms were changed in a like manner. In 2008 the question text was changed slightly in two of the questionnaire forms.
An examination of the data did not show any effect from the wording change. In 2009 the remaining form was changed in a like manner.vFor 12th graders only: Data based on two of six forms in 2002–2005; N is two sixths of N indicated. Data based on three of six forms
beginning in 2006; N is three sixths of N indicated. wFor 12th graders only: Data based on two of six forms in 2000; N is two sixths of N indicated. Data based on three of six forms in
2001; N is three sixths of N indicated. Data based on one of six forms beginning in 2002; N is one sixth of N indicated. xFor 12th graders only: Data based on two of six forms in 2000; N is two sixths of N indicated. Data based on three of six forms in
2001–2009; N is three sixths of N indicated. Data based on two of six forms beginning in 2010; N is two sixths of N indicated. yThe 2003 flavored alcoholic beverage data were created by adjusting the 2004 data to reflect the change in the 2003 and 2004 alcopops
data.zFor 8th and 10th graders only: Data based on one of four forms; N is one third of N indicated. For 12th graders only: Data based on two
of six forms; N is two sixths of N indicated. For all grades: In 2011 the question text was “…had an alcoholic beverage containing
caffeine (like Four Loko or Joose).” In 2012 the question text was changed to “…had an alcoholic beverage mixed with an energy drink
(like Red Bull).” An examination of the data did not show any effect from the wording changes.aaDaily use is defined as use on 20 or more occasions in the past 30 days except for cigarettes and smokeless tobacco, for which actual
daily use is measured, and for 5+ drinks, for which the prevalence of having five or more drinks in a row in the last two weeks is measured.
Footnotes for Tables 5 through 8 (cont.)
70

1991 1992 1993 1994 1995 1996 1997 1998 1999 2000 2001 2002 2003 2004 2005 2006 2007 2008 2009 2010 2011 2012
Try marijuana once or twice b 40.4 39.1 36.2 31.6 28.9 27.9 25.3 28.1 28.0 29.0 27.7 28.2 30.2 31.9 31.4 32.2 32.8 31.1 29.5 29.5 28.2 26.0 -2.2 s
Smoke marijuana occasionally b 57.9 56.3 53.8 48.6 45.9 44.3 43.1 45.0 45.7 47.4 46.3 46.0 48.6 50.5 48.9 48.9 50.2 48.1 44.8 44.1 43.4 41.7 -1.7
Smoke marijuana regularly b 83.8 82.0 79.6 74.3 73.0 70.9 72.7 73.0 73.3 74.8 72.2 71.7 74.2 76.2 73.9 73.2 74.3 72.0 69.8 68.0 68.3 66.9 -1.5
Try synthetic marijuana once or twice c — — — — — — — — — — — — — — — — — — — — — 24.4 —
Take synthetic marijuana occasionally c — — — — — — — — — — — — — — — — — — — — — 36.8 —
Try inhalants once or twice d 35.9 37.0 36.5 37.9 36.4 40.8 40.1 38.9 40.8 41.2 45.6 42.8 40.3 38.7 37.5 35.8 35.9 33.9 34.1 35.5 34.7 34.2 -0.6
Take inhalants regularly d 65.6 64.4 64.6 65.5 64.8 68.2 68.7 67.2 68.8 69.9 71.6 69.9 67.4 66.4 64.1 62.1 61.9 59.2 58.1 60.6 59.0 59.0 0.0
Take LSD once or twice e — — 42.1 38.3 36.7 36.5 37.0 34.9 34.1 34.0 31.6 29.6 27.9 26.8 25.8 23.8 22.8 21.9 21.4 23.6 21.7 19.9 -1.9
Take LSD regularly e — — 68.3 65.8 64.4 63.6 64.1 59.6 58.8 57.5 52.9 49.3 48.2 45.2 44.0 40.0 38.5 36.9 37.0 38.6 37.8 35.0 -2.8
Try ecstasy (MDMA) once or twice c — — — — — — — — — — 35.8 38.9 41.9 42.5 40.0 32.8 30.4 28.6 26.0 27.0 25.4 23.6 -1.8
Take ecstasy (MDMA) occasionally c — — — — — — — — — — 55.5 61.8 65.8 65.1 60.8 52.0 48.6 46.8 43.9 45.0 43.7 41.0 -2.7
Try salvia once or twice c — — — — — — — — — — — — — — — — — — — — — 9.5 —
Take salvia occasionally c — — — — — — — — — — — — — — — — — — — — — 16.1 —
Try crack once or twice d 62.8 61.2 57.2 54.4 50.8 51.0 49.9 49.3 48.7 48.5 48.6 47.4 48.7 49.0 49.6 47.6 47.3 47.1 46.6 49.6 48.1 47.0 -1.2
Take crack occasionally d 82.2 79.6 76.8 74.4 72.1 71.6 71.2 70.6 70.6 70.1 70.0 69.7 70.3 70.4 69.4 68.7 68.3 67.9 66.6 68.4 67.7 67.8 +0.1
Try cocaine powder once or twice d 55.5 54.1 50.7 48.4 44.9 45.2 45.0 44.0 43.3 43.3 43.9 43.2 43.7 44.4 44.2 43.5 43.5 42.7 42.3 45.7 43.3 42.8 -0.5
Take cocaine powder occasionally d 77.0 74.3 71.8 69.1 66.4 65.7 65.8 65.2 65.4 65.5 65.8 64.9 65.8 66.0 65.3 64.0 64.2 62.7 62.3 64.2 63.5 63.3 -0.2
Try heroin once or twice without using
a needle e — — — — 60.1 61.3 63.0 62.8 63.0 62.0 61.1 62.6 62.7 61.6 61.4 60.4 60.3 60.8 60.0 62.3 61.7 59.1 -2.6
Take heroin occasionally without using
a needle e — — — — 76.8 76.6 79.2 79.0 78.9 78.6 78.5 78.5 77.8 77.5 76.8 75.3 76.4 75.5 74.0 76.7 75.9 75.1 -0.8
Try OxyContin once or twice c — — — — — — — — — — — — — — — — — — — — — 21.9 —
Take OxyContin occasionally c — — — — — — — — — — — — — — — — — — — — — 35.3 —
Try Vicodin once or twice c — — — — — — — — — — — — — — — — — — — — — 17.5 —
Take Vicodin occasionally c — — — — — — — — — — — — — — — — — — — — — 29.4 —
Try Adderall once or twice c — — — — — — — — — — — — — — — — — — — — — 17.6 —
Take Adderall occasionally c — — — — — — — — — — — — — — — — — — — — — 29.9 —
Try bath salts (synthetic stimulants)
once or twice c — — — — — — — — — — — — — — — — — — — — — 24.9 —
Take bath salts (synthetic stimulants)
occasionally c — — — — — — — — — — — — — — — — — — — — — 38.8 —
Try cough/cold medicine once or twice c — — — — — — — — — — — — — — — — — — — — — 21.2 —
Take cough/cold medicine occasionally c — — — — — — — — — — — — — — — — — — — — — 38.8 —
Try one or two drinks of an alcoholic
beverage (beer, wine, liquor) b 11.0 12.1 12.4 11.6 11.6 11.8 10.4 12.1 11.6 11.9 12.2 12.5 12.6 13.7 13.9 14.2 14.9 13.5 14.4 14.9 14.5 13.9 -0.7
Take one or two drinks nearly every day b 31.8 32.4 32.6 29.9 30.5 28.6 29.1 30.3 29.7 30.4 30.0 29.6 29.9 31.0 31.4 31.3 32.6 31.5 31.5 32.3 31.8 31.4 -0.4
Have five or more drinks once or twice
each weekend b 59.1 58.0 57.7 54.7 54.1 51.8 55.6 56.0 55.3 55.9 56.1 56.4 56.5 56.9 57.2 56.4 57.9 57.0 55.8 57.2 58.4 58.2 -0.3
Smoke one to five cigarettes per day c — — — — — — — — 26.9 28.9 30.5 32.8 33.4 37.0 37.5 37.0 38.6 38.6 38.6 38.2 37.4 40.4 +3.0
Smoke one or more packs of cigarettes
per day f 51.6 50.8 52.7 50.8 49.8 50.4 52.6 54.3 54.8 58.8 57.1 57.5 57.7 62.4 61.5 59.4 61.1 59.8 59.1 60.9 62.5 62.6 +0.1
Use smokeless tobacco regularly 35.1 35.1 36.9 35.5 33.5 34.0 35.2 36.5 37.1 39.0 38.2 39.4 39.7 41.3 40.8 39.5 41.8 41.0 40.8 41.8 40.8 37.8 -2.9 sTake dissolvable tobacco regularly c — — — — — — — — — — — — — — — — — — — — — 34.8 —
Take snus regularly c — — — — — — — — — — — — — — — — — — — — — 42.2 —
Take steroids g 64.2 69.5 70.2 67.6 — — — — — — — — — — — — — — — — — — —
Approximate weighted N = 17,400 18,700 18,400 17,400 17,500 17,900 18,800 18,100 16,700 16,700 16,200 15,100 16,500 17,000 16,800 16,500 16,100 15,700 15,000 15,300 16,000 15,100
Source. The Monitoring the Future study, the University of Michigan.
Notes. Level of significance of difference between the two most recent classes: s = .05, ss = .01, sss = .001. ' — ' indicates data not available. Any apparent inconsistency between the change estimate and the prevalence estimates
for the two most recent years is due to rounding.aAnswer alternatives were: (1) No risk, (2) Slight risk, (3) Moderate risk, (4) Great risk, and (5) Can’t say, drug unfamiliar.bBeginning in 2012 data based on two thirds of N indicated.cData based on one third of N indicated.dBeginning in 1997, data based on two thirds of N indicated due to changes in questionnaire forms.eData based on one of two forms in 1993–1996; N is one half of N indicated. Beginning in 1997, data based on one third of N indicated due to changes in questionnaire forms.fBeginning in 1999, data based on two thirds of N indicated due to changes in questionnaire forms.gData based on two forms in 1991 and 1992. Data based on one of two forms in 1993 and 1994; N is one half of N indicated.
TABLE 9 Trends in Harmfulness of Drugs as Perceived by 8th Graders
How much do you think people risk harming themselves (physically or in other ways), if they . . .
Percentage saying great risk a 2011–
2012change
71

1991 1992 1993 1994 1995 1996 1997 1998 1999 2000 2001 2002 2003 2004 2005 2006 2007 2008 2009 2010 2011 2012
Try marijuana once or twice b 30.0 31.9 29.7 24.4 21.5 20.0 18.8 19.6 19.2 18.5 17.9 19.9 21.1 22.0 22.3 22.2 22.2 23.1 20.5 19.9 19.3 17.2 -2.1 s
Smoke marijuana occasionally b 48.6 48.9 46.1 38.9 35.4 32.8 31.9 32.5 33.5 32.4 31.2 32.0 34.9 36.2 36.6 35.6 36.0 37.0 32.9 30.9 30.1 26.8 -3.3 ss
Smoke marijuana regularly b 82.1 81.1 78.5 71.3 67.9 65.9 65.9 65.8 65.9 64.7 62.8 60.8 63.9 65.6 65.5 64.9 64.5 64.8 59.5 57.2 55.2 50.9 -4.2 ss
Try synthetic marijuana once or twice c — — — — — — — — — — — — — — — — — — — — — 24.6 —
Take synthetic marijuana occasionally c — — — — — — — — — — — — — — — — — — — — — 34.9 —
Try inhalants once or twice d 37.8 38.7 40.9 42.7 41.6 47.2 47.5 45.8 48.2 46.6 49.9 48.7 47.7 46.7 45.7 43.9 43.0 41.2 42.0 42.5 42.4 42.4 0.0
Take inhalants regularly d 69.8 67.9 69.6 71.5 71.8 75.8 74.5 73.3 76.3 75.0 76.4 73.4 72.2 73.0 71.2 70.2 68.6 66.8 66.8 67.1 66.2 66.1 -0.1
Take LSD once or twice e — — 48.7 46.5 44.7 45.1 44.5 43.5 45.0 43.0 41.3 40.1 40.8 40.6 40.3 38.8 35.4 34.6 34.9 33.9 34.2 34.7 +0.5
Take LSD regularly e — — 78.9 75.9 75.5 75.3 73.8 72.3 73.9 72.0 68.8 64.9 63.0 63.1 60.8 60.7 56.8 55.7 56.7 56.1 54.9 56.4 +1.6
Try ecstasy (MDMA) once or twice c — — — — — — — — — — 39.4 43.5 49.7 52.0 51.4 48.4 45.3 43.2 38.9 36.3 37.2 36.2 -0.9
Take ecstasy (MDMA) occasionally c — — — — — — — — — — 64.8 67.3 71.7 74.6 72.8 71.3 68.2 66.4 62.1 59.2 60.8 59.8 -1.0
Try salvia once or twice c — — — — — — — — — — — — — — — — — — — — — 12.2 —
Take salvia occasionally c — — — — — — — — — — — — — — — — — — — — — 20.3 —
Try crack once or twice d 70.4 69.6 66.6 64.7 60.9 60.9 59.2 58.0 57.8 56.1 57.1 57.4 57.6 56.7 57.0 56.6 56.4 56.5 57.7 58.1 59.5 59.0 -0.5
Take crack occasionally d 87.4 86.4 84.4 83.1 81.2 80.3 78.7 77.5 79.1 76.9 77.3 75.7 76.4 76.7 76.9 76.2 76.0 76.5 75.9 76.2 76.5 76.7 +0.2
Try cocaine powder once or twice d 59.1 59.2 57.5 56.4 53.5 53.6 52.2 50.9 51.6 48.8 50.6 51.3 51.8 50.7 51.3 50.2 49.5 49.8 50.8 52.9 53.0 53.4 +0.5
Take cocaine powder occasionally d 82.2 80.1 79.1 77.8 75.6 75.0 73.9 71.8 73.6 70.9 72.3 71.0 71.4 72.2 72.4 71.3 70.9 71.1 71.0 72.2 72.0 72.6 +0.6
Try heroin once or twice without using
a needle e — — — — 70.7 72.1 73.1 71.7 73.7 71.7 72.0 72.2 70.6 72.0 72.4 70.0 70.5 70.8 72.2 73.0 72.9 72.6 -0.4
Take heroin occasionally without using
a needle e — — — — 85.1 85.8 86.5 84.9 86.5 85.2 85.4 83.4 83.5 85.4 85.2 83.6 84.2 83.1 83.3 84.8 83.4 84.4 +1.0
Try OxyContin once or twice c — — — — — — — — — — — — — — — — — — — — — 30.9 —
Take OxyContin occasionally c — — — — — — — — — — — — — — — — — — — — — 48.3 —
Try Vicodin once or twice c — — — — — — — — — — — — — — — — — — — — — 23.2 —
Take Vicodin occasionally c — — — — — — — — — — — — — — — — — — — — — 40.3 —
Try Adderall once or twice c — — — — — — — — — — — — — — — — — — — — — 19.7 —
Take Adderall occasionally c — — — — — — — — — — — — — — — — — — — — — 34.3 —
Try bath salts (synthetic stimulants)
once or twice c — — — — — — — — — — — — — — — — — — — — — 32.3 —
Take bath salts (synthetic stimulants)
occasionally c — — — — — — — — — — — — — — — — — — — — — 44.9 —
Try cough/cold medicine once or twice c — — — — — — — — — — — — — — — — — — — — — 23.6 —
Take cough/cold medicine occasionally c — — — — — — — — — — — — — — — — — — — — — 40.4 —
Try one or two drinks of an alcoholic
beverage (beer, wine, liquor) b 9.0 10.1 10.9 9.4 9.3 8.9 9.0 10.1 10.5 9.6 9.8 11.5 11.5 10.8 11.5 11.1 11.6 12.6 11.9 11.9 12.3 11.3 -1.0
Take one or two drinks nearly every day b 36.1 36.8 35.9 32.5 31.7 31.2 31.8 31.9 32.9 32.3 31.5 31.0 30.9 31.3 32.6 31.7 33.3 35.0 33.8 33.1 32.9 31.8 -1.1
Have five or more drinks once or twice
each weekend b 54.7 55.9 54.9 52.9 52.0 50.9 51.8 52.5 51.9 51.0 50.7 51.7 51.6 51.7 53.3 52.4 54.1 56.6 54.2 54.6 55.5 52.8 -2.7 s
Smoke one to five cigarettes per day c — — — — — — — — 28.4 30.2 32.4 35.1 38.1 39.7 41.0 41.3 41.7 43.5 42.8 41.4 44.8 49.1 +4.3 s
Smoke one or more packs of cigarettes
per day f 60.3 59.3 60.7 59.0 57.0 57.9 59.9 61.9 62.7 65.9 64.7 64.3 65.7 68.4 68.1 67.7 68.2 69.1 67.3 67.2 69.8 71.6 +1.7
Use smokeless tobacco regularly 40.3 39.6 44.2 42.2 38.2 41.0 42.2 42.8 44.2 46.7 46.2 46.9 48.0 47.8 46.1 45.9 46.7 48.0 44.7 43.7 45.7 42.9 -2.8 ss
Take dissolvable tobacco regularly c — — — — — — — — — — — — — — — — — — — — — 33.3 —
Take snus regularly c — — — — — — — — — — — — — — — — — — — — — 41.0 —
Take steroids g 67.1 72.7 73.4 72.5 — — — — — — — — — — — — — — — — — — —
Approximate weighted N = 14,700 14,800 15,300 15,900 17,000 15,700 15,600 15,000 13,600 14,300 14,000 14,300 15,800 16,400 16,200 16,200 16,100 15,100 15,900 15,200 14,900 15,000
Source. The Monitoring the Future study, the University of Michigan.
Notes. Level of significance of difference between the two most recent classes: s = .05, ss = .01, sss = .001. ' — ' indicates data not available. Any apparent inconsistency between the change estimate and the prevalence
estimates for the two most recent years is due to rounding.aAnswer alternatives were: (1) No risk, (2) Slight risk, (3) Moderate risk, (4) Great risk, and (5) Can’t say, drug unfamiliar.bBeginning in 2012 data based on two thirds of N indicated.cData based on one third of N indicated.dBeginning in 1997, data based on two thirds of N indicated due to changes in questionnaire forms.eData based on one of two forms in 1993–1996; N is one half of N indicated. Beginning in 1997, data based on one third of N indicated due to changes in questionnaire forms.fBeginning in 1999, data based on two thirds of N indicated due to changes in questionnaire forms.gData based on two forms in 1991 and 1992. Data based on one of two forms in 1993 and 1994; N is one half of N indicated.
TABLE 10Trends in Harmfulness of Drugs as Perceived by 10th Graders
How much do you think people risk harming themselves (physically or in other ways), if they . . .
Percentage saying great risk a 2011–
2012change
72

1975 1976 1977 1978 1979 1980 1981 1982 1983 1984 1985 1986 1987 1988 1989 1990 1991 1992 1993
TABLE 11Trends in Harmfulness of Drugs as Perceived by 12th Graders
How much do you think people risk harming themselves (physically or in other ways), if they . . .
Percentage saying great risk a
(Years cont.)
Try marijuana once or twice 15.1 11.4 9.5 8.1 9.4 10.0 13.0 11.5 12.7 14.7 14.8 15.1 18.4 19.0 23.6 23.1 27.1 24.5 21.9
Smoke marijuana occasionally 18.1 15.0 13.4 12.4 13.5 14.7 19.1 18.3 20.6 22.6 24.5 25.0 30.4 31.7 36.5 36.9 40.6 39.6 35.6
Smoke marijuana regularly 43.3 38.6 36.4 34.9 42.0 50.4 57.6 60.4 62.8 66.9 70.4 71.3 73.5 77.0 77.5 77.8 78.6 76.5 72.5
Try synthetic marijuana once or twice — — — — — — — — — — — — — — — — — — —
Take Synthetic Marijuana occasionally — — — — — — — — — — — — — — — — — — —
Try LSD once or twice 49.4 45.7 43.2 42.7 41.6 43.9 45.5 44.9 44.7 45.4 43.5 42.0 44.9 45.7 46.0 44.7 46.6 42.3 39.5
Take LSD regularly 81.4 80.8 79.1 81.1 82.4 83.0 83.5 83.5 83.2 83.8 82.9 82.6 83.8 84.2 84.3 84.5 84.3 81.8 79.4
Try PCP once or twice — — — — — — — — — — — — 55 6 58 8 56 6 55 2 51 7 54 8 50 8Try PCP once or twice — — — — — — — — — — — — 55.6 58.8 56.6 55.2 51.7 54.8 50.8
Try ecstasy (MDMA) once or twice — — — — — — — — — — — — — — — — — — —
Try salvia once or twice b — — — — — — — — — — — — — — — — — — —
Take salvia occasionally — — — — — — — — — — — — — — — — — — —
Try cocaine once or twice 42.6 39.1 35.6 33.2 31.5 31.3 32.1 32.8 33.0 35.7 34.0 33.5 47.9 51.2 54.9 59.4 59.4 56.8 57.6
Take cocaine occasionally — — — — — — — — — — — 54.2 66.8 69.2 71.8 73.9 75.5 75.1 73.3
Take cocaine regularly 73.1 72.3 68.2 68.2 69.5 69.2 71.2 73.0 74.3 78.8 79.0 82.2 88.5 89.2 90.2 91.1 90.4 90.2 90.1
Try crack once or twice — — — — — — — — — — — — 57.0 62.1 62.9 64.3 60.6 62.4 57.6
T k k i ll 70 4 73 2 75 3 80 4 76 5 76 3 73 9Take crack occasionally — — — — — — — — — — — — 70.4 73.2 75.3 80.4 76.5 76.3 73.9
Take crack regularly — — — — — — — — — — — — 84.6 84.8 85.6 91.6 90.1 89.3 87.5
Try cocaine powder once or twice — — — — — — — — — — — — 45.3 51.7 53.8 53.9 53.6 57.1 53.2
Take cocaine powder occasionally — — — — — — — — — — — — 56.8 61.9 65.8 71.1 69.8 70.8 68.6
Take cocaine powder regularly — — — — — — — — — — — — 81.4 82.9 83.9 90.2 88.9 88.4 87.0
Try heroin once or twice 60.1 58.9 55.8 52.9 50.4 52.1 52.9 51.1 50.8 49.8 47.3 45.8 53.6 54.0 53.8 55.4 55.2 50.9 50.7
Take heroin occasionally 75.6 75.6 71.9 71.4 70.9 70.9 72.2 69.8 71.8 70.7 69.8 68.2 74.6 73.8 75.5 76.6 74.9 74.2 72.0
Take heroin regularly 87.2 88.6 86.1 86.6 87.5 86.2 87.5 86.0 86.1 87.2 86.0 87.1 88.7 88.8 89.5 90.2 89.6 89.2 88.3
Try heroin once or twice without using a needle — — — — — — — — — — — — — — — — — — —
Take heroin occasionally without using a needle — — — — — — — — — — — — — — — — — — —
Try any narcotic other than heroin (codeine, Vicodin,
OxyContin, Percocet, etc.) once or twice — — — — — — — — — — — — — — — — — — —
Take any narcotic other than heroin occasionally — — — — — — — — — — — — — — — — — — —
Take any narcotic other than heroin regularly — — — — — — — — — — — — — — — — — — —
Try amphetamines once or twice c 35.4 33.4 30.8 29.9 29.7 29.7 26.4 25.3 24.7 25.4 25.2 25.1 29.1 29.6 32.8 32.2 36.3 32.6 31.3
Take amphetamines regularly c 69 0 67 3 66 6 67 1 69 9 69 1 66 1 64 7 64 8 67 1 67 2 67 3 69 4 69 8 71 2 71 2 74 1 72 4 69 9Take amphetamines regularly 69.0 67.3 66.6 67.1 69.9 69.1 66.1 64.7 64.8 67.1 67.2 67.3 69.4 69.8 71.2 71.2 74.1 72.4 69.9
Try Adderall once or twice — — — — — — — — — — — — — — — — — — —
Try Adderall occasionally — — — — — — — — — — — — — — — — — — —
Try crystal methamphetamine (ice) once or twice — — — — — — — — — — — — — — — — 61.6 61.9 57.5
Try bath salts (synthetic stimulants)
once or twice — — — — — — — — — — — — — — — — — — —
Take bath salts (synthetic stimulants)
occasionally — — — — — — — — — — — — — — — — — — —
T d ti (b bit t ) t i d 34 8 32 5 31 2 31 3 30 7 30 9 28 4 27 5 27 0 27 4 26 1 25 4 30 9 29 7 32 2 32 4 35 1 32 2 29 2Try sedatives (barbiturates) once or twice d 34.8 32.5 31.2 31.3 30.7 30.9 28.4 27.5 27.0 27.4 26.1 25.4 30.9 29.7 32.2 32.4 35.1 32.2 29.2
Take sedatives (barbiturates) regularly d 69.1 67.7 68.6 68.4 71.6 72.2 69.9 67.6 67.7 68.5 68.3 67.2 69.4 69.6 70.5 70.2 70.5 70.2 66.1
Try one or two drinks of an alcoholic beverage
(beer, wine, liquor) 5.3 4.8 4.1 3.4 4.1 3.8 4.6 3.5 4.2 4.6 5.0 4.6 6.2 6.0 6.0 8.3 9.1 8.6 8.2
Take one or two drinks nearly every day 21.5 21.2 18.5 19.6 22.6 20.3 21.6 21.6 21.6 23.0 24.4 25.1 26.2 27.3 28.5 31.3 32.7 30.6 28.2
Take four or five drinks nearly every day 63.5 61.0 62.9 63.1 66.2 65.7 64.5 65.5 66.8 68.4 69.8 66.5 69.7 68.5 69.8 70.9 69.5 70.5 67.8
Have five or more drinks once or twice
each weekend 37.8 37.0 34.7 34.5 34.9 35.9 36.3 36.0 38.6 41.7 43.0 39.1 41.9 42.6 44.0 47.1 48.6 49.0 48.3
Smoke one or more packs of cigarettes per day 51.3 56.4 58.4 59.0 63.0 63.7 63.3 60.5 61.2 63.8 66.5 66.0 68.6 68.0 67.2 68.2 69.4 69.2 69.5
— — — — — — — — — — — 25.8 30.0 33.2 32.9 34.2 37.4 35.5 38.9
Take steroids — — — — — — — — — — — — — — 63.8 69.9 65.6 70.7 69.1
Approximate weighted N = 2,804 2,918 3,052 3,770 3,250 3,234 3,604 3,557 3,305 3,262 3,250 3,020 3,315 3,276 2,796 2,553 2,549 2,684 2,759
(Table continued on next page.)
Use smokeless tobacco regularly
73
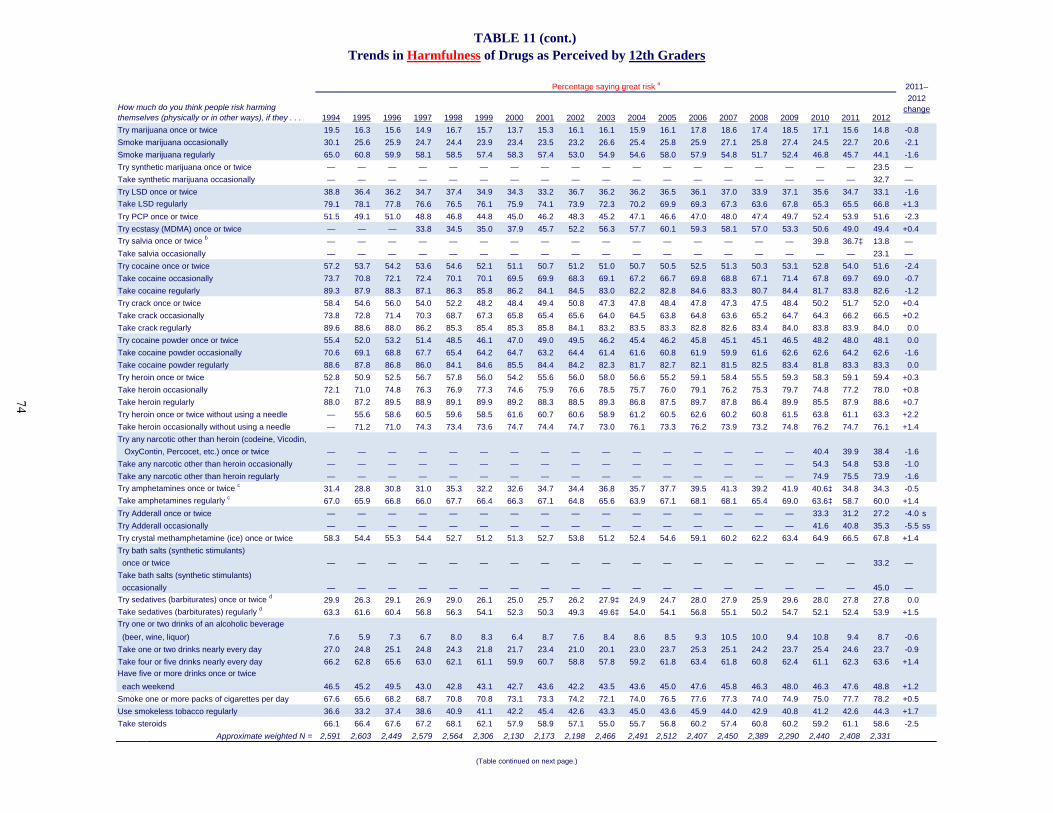
1994 1995 1996 1997 1998 1999 2000 2001 2002 2003 2004 2005 2006 2007 2008 2009 2010 2011 2012
TABLE 11 (cont.) Trends in Harmfulness of Drugs as Perceived by 12th Graders
How much do you think people risk harming themselves (physically or in other ways), if they . . .
2011–
2012change
Percentage saying great risk a
Try marijuana once or twice 19.5 16.3 15.6 14.9 16.7 15.7 13.7 15.3 16.1 16.1 15.9 16.1 17.8 18.6 17.4 18.5 17.1 15.6 14.8 -0.8
Smoke marijuana occasionally 30.1 25.6 25.9 24.7 24.4 23.9 23.4 23.5 23.2 26.6 25.4 25.8 25.9 27.1 25.8 27.4 24.5 22.7 20.6 -2.1
Smoke marijuana regularly 65.0 60.8 59.9 58.1 58.5 57.4 58.3 57.4 53.0 54.9 54.6 58.0 57.9 54.8 51.7 52.4 46.8 45.7 44.1 -1.6
Try synthetic marijuana once or twice — — — — — — — — — — — — — — — — — — 23.5 —
Take synthetic marijuana occasionally — — — — — — — — — — — — — — — — — — 32.7 —
Try LSD once or twice 38.8 36.4 36.2 34.7 37.4 34.9 34.3 33.2 36.7 36.2 36.2 36.5 36.1 37.0 33.9 37.1 35.6 34.7 33.1 -1.6
Take LSD regularly 79.1 78.1 77.8 76.6 76.5 76.1 75.9 74.1 73.9 72.3 70.2 69.9 69.3 67.3 63.6 67.8 65.3 65.5 66.8 +1.3
Try PCP once or twice 51.5 49.1 51.0 48.8 46.8 44.8 45.0 46.2 48.3 45.2 47.1 46.6 47.0 48.0 47.4 49.7 52.4 53.9 51.6 -2.3Try PCP once or twice 51.5 49.1 51.0 48.8 46.8 44.8 45.0 46.2 48.3 45.2 47.1 46.6 47.0 48.0 47.4 49.7 52.4 53.9 51.6 2.3
Try ecstasy (MDMA) once or twice — — — 33.8 34.5 35.0 37.9 45.7 52.2 56.3 57.7 60.1 59.3 58.1 57.0 53.3 50.6 49.0 49.4 +0.4
Try salvia once or twice b — — — — — — — — — — — — — — — — 39.8 36.7‡ 13.8 —
Take salvia occasionally — — — — — — — — — — — — — — — — — — 23.1 —
Try cocaine once or twice 57.2 53.7 54.2 53.6 54.6 52.1 51.1 50.7 51.2 51.0 50.7 50.5 52.5 51.3 50.3 53.1 52.8 54.0 51.6 -2.4
Take cocaine occasionally 73.7 70.8 72.1 72.4 70.1 70.1 69.5 69.9 68.3 69.1 67.2 66.7 69.8 68.8 67.1 71.4 67.8 69.7 69.0 -0.7
Take cocaine regularly 89.3 87.9 88.3 87.1 86.3 85.8 86.2 84.1 84.5 83.0 82.2 82.8 84.6 83.3 80.7 84.4 81.7 83.8 82.6 -1.2
Try crack once or twice 58.4 54.6 56.0 54.0 52.2 48.2 48.4 49.4 50.8 47.3 47.8 48.4 47.8 47.3 47.5 48.4 50.2 51.7 52.0 +0.4
T k k i ll 73 8 72 8 71 4 70 3 68 7 67 3 65 8 65 4 65 6 64 0 64 5 63 8 64 8 63 6 65 2 64 7 64 3 66 2 66 5 +0 2Take crack occasionally 73.8 72.8 71.4 70.3 68.7 67.3 65.8 65.4 65.6 64.0 64.5 63.8 64.8 63.6 65.2 64.7 64.3 66.2 66.5 +0.2
Take crack regularly 89.6 88.6 88.0 86.2 85.3 85.4 85.3 85.8 84.1 83.2 83.5 83.3 82.8 82.6 83.4 84.0 83.8 83.9 84.0 0.0
Try cocaine powder once or twice 55.4 52.0 53.2 51.4 48.5 46.1 47.0 49.0 49.5 46.2 45.4 46.2 45.8 45.1 45.1 46.5 48.2 48.0 48.1 0.0
Take cocaine powder occasionally 70.6 69.1 68.8 67.7 65.4 64.2 64.7 63.2 64.4 61.4 61.6 60.8 61.9 59.9 61.6 62.6 62.6 64.2 62.6 -1.6
Take cocaine powder regularly 88.6 87.8 86.8 86.0 84.1 84.6 85.5 84.4 84.2 82.3 81.7 82.7 82.1 81.5 82.5 83.4 81.8 83.3 83.3 0.0
Try heroin once or twice 52.8 50.9 52.5 56.7 57.8 56.0 54.2 55.6 56.0 58.0 56.6 55.2 59.1 58.4 55.5 59.3 58.3 59.1 59.4 +0.3
Take heroin occasionally 72.1 71.0 74.8 76.3 76.9 77.3 74.6 75.9 76.6 78.5 75.7 76.0 79.1 76.2 75.3 79.7 74.8 77.2 78.0 +0.8
Take heroin regularly 88.0 87.2 89.5 88.9 89.1 89.9 89.2 88.3 88.5 89.3 86.8 87.5 89.7 87.8 86.4 89.9 85.5 87.9 88.6 +0.7
Try heroin once or twice without using a needle — 55.6 58.6 60.5 59.6 58.5 61.6 60.7 60.6 58.9 61.2 60.5 62.6 60.2 60.8 61.5 63.8 61.1 63.3 +2.2
Take heroin occasionally without using a needle — 71.2 71.0 74.3 73.4 73.6 74.7 74.4 74.7 73.0 76.1 73.3 76.2 73.9 73.2 74.8 76.2 74.7 76.1 +1.4
Try any narcotic other than heroin (codeine, Vicodin,
OxyContin, Percocet, etc.) once or twice — — — — — — — — — — — — — — — — 40.4 39.9 38.4 -1.6
Take any narcotic other than heroin occasionally — — — — — — — — — — — — — — — — 54.3 54.8 53.8 -1.0
Take any narcotic other than heroin regularly — — — — — — — — — — — — — — — — 74.9 75.5 73.9 -1.6
Try amphetamines once or twice c 31.4 28.8 30.8 31.0 35.3 32.2 32.6 34.7 34.4 36.8 35.7 37.7 39.5 41.3 39.2 41.9 40.6‡ 34.8 34.3 -0.5
Take amphetamines regularly c 67.0 65.9 66.8 66.0 67.7 66.4 66.3 67.1 64.8 65.6 63.9 67.1 68.1 68.1 65.4 69.0 63.6‡ 58.7 60.0 +1.4p g y ‡
Try Adderall once or twice — — — — — — — — — — — — — — — — 33.3 31.2 27.2 -4.0 s
Try Adderall occasionally — — — — — — — — — — — — — — — — 41.6 40.8 35.3 -5.5 ss
Try crystal methamphetamine (ice) once or twice 58.3 54.4 55.3 54.4 52.7 51.2 51.3 52.7 53.8 51.2 52.4 54.6 59.1 60.2 62.2 63.4 64.9 66.5 67.8 +1.4
Try bath salts (synthetic stimulants)
once or twice — — — — — — — — — — — — — — — — — — 33.2 —
Take bath salts (synthetic stimulants)
occasionally — — — — — — — — — — — — — — — — — — 45.0 —
Try sedatives (barbiturates) once or twice d 29 9 26 3 29 1 26 9 29 0 26 1 25 0 25 7 26 2 27 9‡ 24 9 24 7 28 0 27 9 25 9 29 6 28 0 27 8 27 8 0 0Try sedatives (barbiturates) once or twice 29.9 26.3 29.1 26.9 29.0 26.1 25.0 25.7 26.2 27.9‡ 24.9 24.7 28.0 27.9 25.9 29.6 28.0 27.8 27.8 0.0
Take sedatives (barbiturates) regularly d 63.3 61.6 60.4 56.8 56.3 54.1 52.3 50.3 49.3 49.6‡ 54.0 54.1 56.8 55.1 50.2 54.7 52.1 52.4 53.9 +1.5
Try one or two drinks of an alcoholic beverage
(beer, wine, liquor) 7.6 5.9 7.3 6.7 8.0 8.3 6.4 8.7 7.6 8.4 8.6 8.5 9.3 10.5 10.0 9.4 10.8 9.4 8.7 -0.6
Take one or two drinks nearly every day 27.0 24.8 25.1 24.8 24.3 21.8 21.7 23.4 21.0 20.1 23.0 23.7 25.3 25.1 24.2 23.7 25.4 24.6 23.7 -0.9
Take four or five drinks nearly every day 66.2 62.8 65.6 63.0 62.1 61.1 59.9 60.7 58.8 57.8 59.2 61.8 63.4 61.8 60.8 62.4 61.1 62.3 63.6 +1.4
Have five or more drinks once or twice
each weekend 46.5 45.2 49.5 43.0 42.8 43.1 42.7 43.6 42.2 43.5 43.6 45.0 47.6 45.8 46.3 48.0 46.3 47.6 48.8 +1.2
Smoke one or more packs of cigarettes per day 67.6 65.6 68.2 68.7 70.8 70.8 73.1 73.3 74.2 72.1 74.0 76.5 77.6 77.3 74.0 74.9 75.0 77.7 78.2 +0.5
36.6 33.2 37.4 38.6 40.9 41.1 42.2 45.4 42.6 43.3 45.0 43.6 45.9 44.0 42.9 40.8 41.2 42.6 44.3 +1.7
Take steroids 66.1 66.4 67.6 67.2 68.1 62.1 57.9 58.9 57.1 55.0 55.7 56.8 60.2 57.4 60.8 60.2 59.2 61.1 58.6 -2.5
Approximate weighted N = 2,591 2,603 2,449 2,579 2,564 2,306 2,130 2,173 2,198 2,466 2,491 2,512 2,407 2,450 2,389 2,290 2,440 2,408 2,331
Use smokeless tobacco regularly
(Table continued on next page.)
74
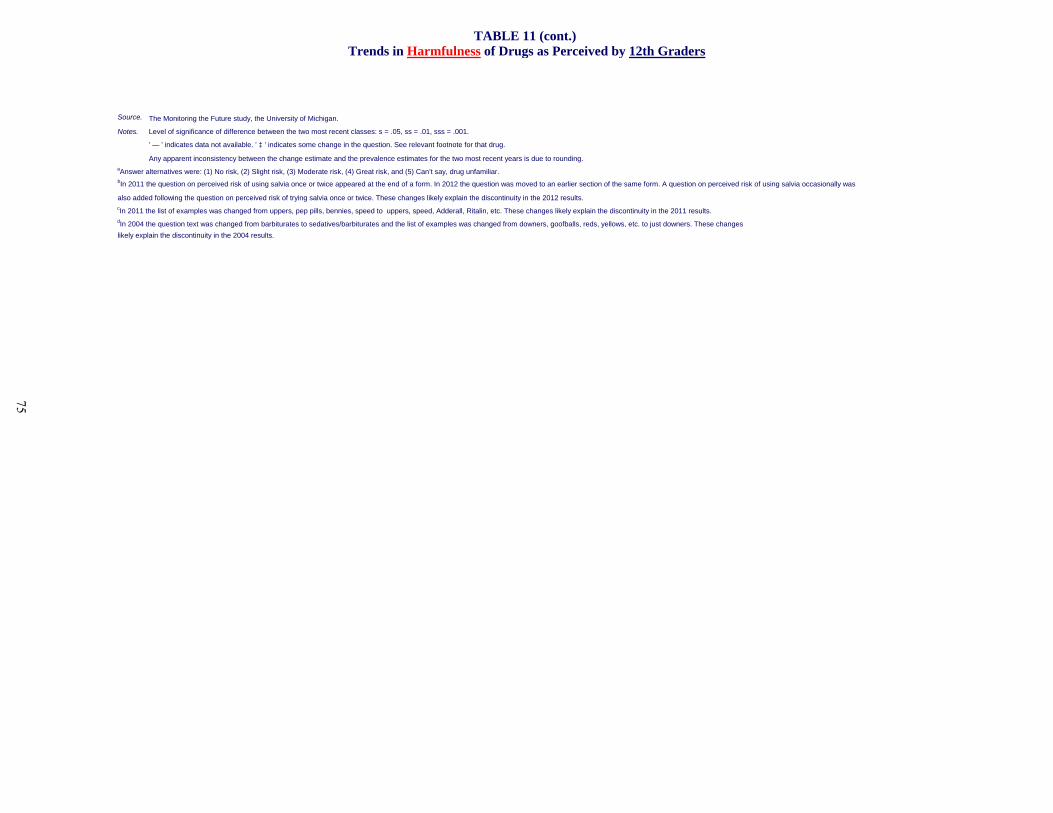
Source. The Monitoring the Future study, the University of Michigan.
TABLE 11 (cont.) Trends in Harmfulness of Drugs as Perceived by 12th Graders
Notes. Level of significance of difference between the two most recent classes: s = .05, ss = .01, sss = .001.
' — ' indicates data not available. ' ‡ ' indicates some change in the question. See relevant footnote for that drug.
Any apparent inconsistency between the change estimate and the prevalence estimates for the two most recent years is due to rounding.
bIn 2011 the question on perceived risk of using salvia once or twice appeared at the end of a form. In 2012 the question was moved to an earlier section of the same form. A question on perceived risk of using salvia occasionally was
also added following the question on perceived risk of trying salvia once or twice. These changes likely explain the discontinuity in the 2012 results.
aAnswer alternatives were: (1) No risk, (2) Slight risk, (3) Moderate risk, (4) Great risk, and (5) Can’t say, drug unfamiliar.
cIn 2011 the list of examples was changed from uppers, pep pills, bennies, speed to uppers, speed, Adderall, Ritalin, etc. These changes likely explain the discontinuity in the 2011 results.dIn 2004 the question text was changed from barbiturates to sedatives/barbiturates and the list of examples was changed from downers, goofballs, reds, yellows, etc. to just downers. These changes
likely explain the discontinuity in the 2004 results.
75
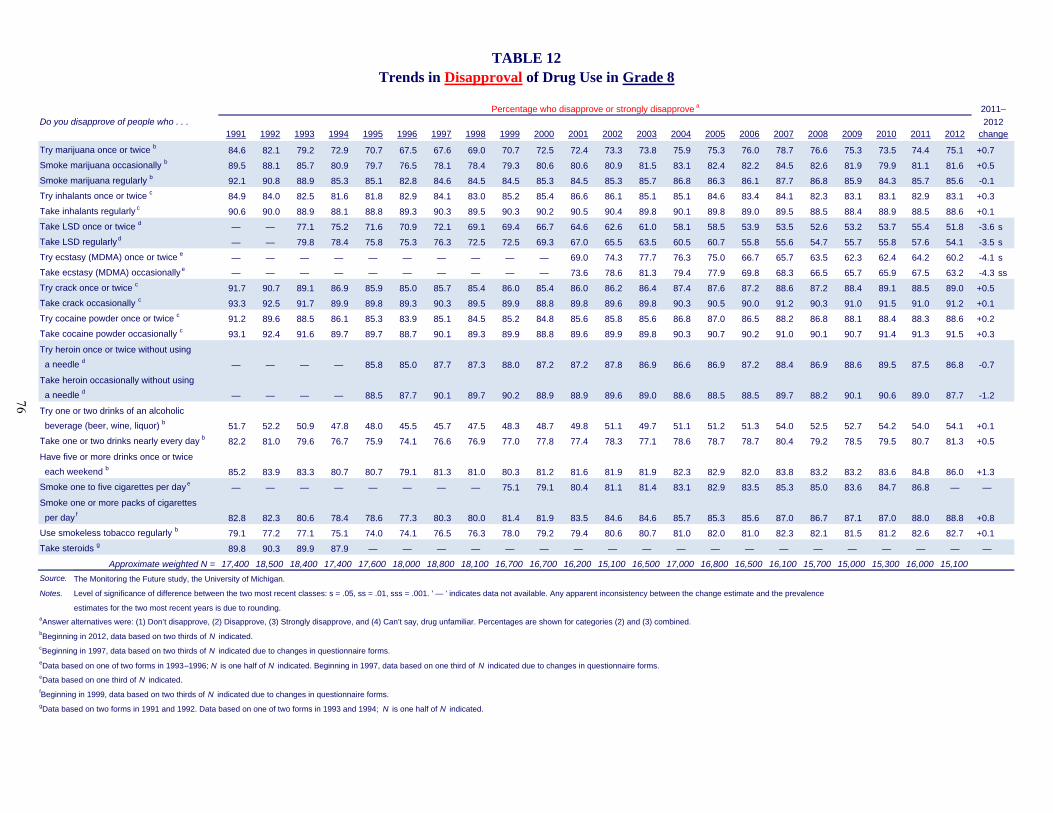
Do you disapprove of people who . . .1991 1992 1993 1994 1995 1996 1997 1998 1999 2000 2001 2002 2003 2004 2005 2006 2007 2008 2009 2010 2011 2012
Try marijuana once or twice b 84.6 82.1 79.2 72.9 70.7 67.5 67.6 69.0 70.7 72.5 72.4 73.3 73.8 75.9 75.3 76.0 78.7 76.6 75.3 73.5 74.4 75.1 +0.7
Smoke marijuana occasionally b 89.5 88.1 85.7 80.9 79.7 76.5 78.1 78.4 79.3 80.6 80.6 80.9 81.5 83.1 82.4 82.2 84.5 82.6 81.9 79.9 81.1 81.6 +0.5
Smoke marijuana regularly b 92.1 90.8 88.9 85.3 85.1 82.8 84.6 84.5 84.5 85.3 84.5 85.3 85.7 86.8 86.3 86.1 87.7 86.8 85.9 84.3 85.7 85.6 -0.1
Try inhalants once or twice c 84.9 84.0 82.5 81.6 81.8 82.9 84.1 83.0 85.2 85.4 86.6 86.1 85.1 85.1 84.6 83.4 84.1 82.3 83.1 83.1 82.9 83.1 +0.3
Take inhalants regularly c 90.6 90.0 88.9 88.1 88.8 89.3 90.3 89.5 90.3 90.2 90.5 90.4 89.8 90.1 89.8 89.0 89.5 88.5 88.4 88.9 88.5 88.6 +0.1
Take LSD once or twice d — — 77.1 75.2 71.6 70.9 72.1 69.1 69.4 66.7 64.6 62.6 61.0 58.1 58.5 53.9 53.5 52.6 53.2 53.7 55.4 51.8 -3.6 s
Take LSD regularly d — — 79.8 78.4 75.8 75.3 76.3 72.5 72.5 69.3 67.0 65.5 63.5 60.5 60.7 55.8 55.6 54.7 55.7 55.8 57.6 54.1 -3.5 s
Try ecstasy (MDMA) once or twice e — — — — — — — — — — 69.0 74.3 77.7 76.3 75.0 66.7 65.7 63.5 62.3 62.4 64.2 60.2 -4.1 s
Take ecstasy (MDMA) occasionally e — — — — — — — — — — 73.6 78.6 81.3 79.4 77.9 69.8 68.3 66.5 65.7 65.9 67.5 63.2 -4.3 ss
Try crack once or twice c 91.7 90.7 89.1 86.9 85.9 85.0 85.7 85.4 86.0 85.4 86.0 86.2 86.4 87.4 87.6 87.2 88.6 87.2 88.4 89.1 88.5 89.0 +0.5
Take crack occasionally c 93.3 92.5 91.7 89.9 89.8 89.3 90.3 89.5 89.9 88.8 89.8 89.6 89.8 90.3 90.5 90.0 91.2 90.3 91.0 91.5 91.0 91.2 +0.1
Try cocaine powder once or twice c 91.2 89.6 88.5 86.1 85.3 83.9 85.1 84.5 85.2 84.8 85.6 85.8 85.6 86.8 87.0 86.5 88.2 86.8 88.1 88.4 88.3 88.6 +0.2
Take cocaine powder occasionally c 93.1 92.4 91.6 89.7 89.7 88.7 90.1 89.3 89.9 88.8 89.6 89.9 89.8 90.3 90.7 90.2 91.0 90.1 90.7 91.4 91.3 91.5 +0.3
Try heroin once or twice without using
a needle d — — — — 85.8 85.0 87.7 87.3 88.0 87.2 87.2 87.8 86.9 86.6 86.9 87.2 88.4 86.9 88.6 89.5 87.5 86.8 -0.7
Take heroin occasionally without using
a needle d — — — — 88.5 87.7 90.1 89.7 90.2 88.9 88.9 89.6 89.0 88.6 88.5 88.5 89.7 88.2 90.1 90.6 89.0 87.7 -1.2
Try one or two drinks of an alcoholic
beverage (beer, wine, liquor) b 51.7 52.2 50.9 47.8 48.0 45.5 45.7 47.5 48.3 48.7 49.8 51.1 49.7 51.1 51.2 51.3 54.0 52.5 52.7 54.2 54.0 54.1 +0.1
Take one or two drinks nearly every day b 82.2 81.0 79.6 76.7 75.9 74.1 76.6 76.9 77.0 77.8 77.4 78.3 77.1 78.6 78.7 78.7 80.4 79.2 78.5 79.5 80.7 81.3 +0.5
Have five or more drinks once or twice
each weekend b 85.2 83.9 83.3 80.7 80.7 79.1 81.3 81.0 80.3 81.2 81.6 81.9 81.9 82.3 82.9 82.0 83.8 83.2 83.2 83.6 84.8 86.0 +1.3
Smoke one to five cigarettes per day e — — — — — — — — 75.1 79.1 80.4 81.1 81.4 83.1 82.9 83.5 85.3 85.0 83.6 84.7 86.8 — —
Smoke one or more packs of cigarettes
per day f 82.8 82.3 80.6 78.4 78.6 77.3 80.3 80.0 81.4 81.9 83.5 84.6 84.6 85.7 85.3 85.6 87.0 86.7 87.1 87.0 88.0 88.8 +0.8
Use smokeless tobacco regularly b 79.1 77.2 77.1 75.1 74.0 74.1 76.5 76.3 78.0 79.2 79.4 80.6 80.7 81.0 82.0 81.0 82.3 82.1 81.5 81.2 82.6 82.7 +0.1
Take steroids g 89.8 90.3 89.9 87.9 — — — — — — — — — — — — — — — — — — —
Approximate weighted N = 17,400 18,500 18,400 17,400 17,600 18,000 18,800 18,100 16,700 16,700 16,200 15,100 16,500 17,000 16,800 16,500 16,100 15,700 15,000 15,300 16,000 15,100
Source. The Monitoring the Future study, the University of Michigan.
Notes. Level of significance of difference between the two most recent classes: s = .05, ss = .01, sss = .001. ' — ' indicates data not available. Any apparent inconsistency between the change estimate and the prevalence
estimates for the two most recent years is due to rounding.aAnswer alternatives were: (1) Don’t disapprove, (2) Disapprove, (3) Strongly disapprove, and (4) Can’t say, drug unfamiliar. Percentages are shown for categories (2) and (3) combined.bBeginning in 2012, data based on two thirds of N indicated.cBeginning in 1997, data based on two thirds of N indicated due to changes in questionnaire forms.eData based on one of two forms in 1993–1996; N is one half of N indicated. Beginning in 1997, data based on one third of N indicated due to changes in questionnaire forms.eData based on one third of N indicated.fBeginning in 1999, data based on two thirds of N indicated due to changes in questionnaire forms.gData based on two forms in 1991 and 1992. Data based on one of two forms in 1993 and 1994; N is one half of N indicated.
change
TABLE 12Trends in Disapproval of Drug Use in Grade 8
Percentage who disapprove or strongly disapprove a 2011–
2012
76

Do you disapprove of people who . . .1991 1992 1993 1994 1995 1996 1997 1998 1999 2000 2001 2002 2003 2004 2005 2006 2007 2008 2009 2010 2011 2012
Try marijuana once or twice b 74.6 74.8 70.3 62.4 59.8 55.5 54.1 56.0 56.2 54.9 54.8 57.8 58.1 60.4 61.3 62.5 63.9 64.5 60.1 59.2 58.5 56.2 -2.3
Smoke marijuana occasionally b 83.7 83.6 79.4 72.3 70.0 66.9 66.2 67.3 68.2 67.2 66.2 68.3 68.4 70.8 71.9 72.6 73.3 73.6 69.2 68.0 67.9 65.7 -2.2
Smoke marijuana regularly b 90.4 90.0 87.4 82.2 81.1 79.7 79.7 80.1 79.8 79.1 78.0 78.6 78.8 81.3 82.0 82.5 82.4 83.0 79.9 78.7 78.8 77.3 -1.5
Try inhalants once or twice c 85.2 85.6 84.8 84.9 84.5 86.0 86.9 85.6 88.4 87.5 87.8 88.6 87.7 88.5 88.1 88.1 87.6 87.1 87.0 86.5 86.9 85.7 -1.1
Take inhalants regularly c 91.0 91.5 90.9 91.0 90.9 91.7 91.7 91.1 92.4 91.8 91.3 91.8 91.0 92.3 91.9 92.2 91.8 91.6 91.1 90.8 90.9 90.0 -0.9
Take LSD once or twice d — — 82.1 79.3 77.9 76.8 76.6 76.7 77.8 77.0 75.4 74.6 74.4 72.4 71.8 71.2 67.7 66.3 67.8 68.2 68.5 68.3 -0.2
Take LSD regularly d — — 86.8 85.6 84.8 84.5 83.4 82.9 84.3 82.1 80.8 79.4 77.6 75.9 75.0 74.9 71.5 69.8 72.2 72.9 72.5 73.0 +0.4
Try ecstasy (MDMA) once or twice e — — — — — — — — — — 72.6 77.4 81.0 83.7 83.1 81.6 80.0 78.1 76.5 75.5 76.1 75.3 -0.8
Take ecstasy (MDMA) occasionally e — — — — — — — — — — 81.0 84.6 86.3 88.0 87.4 86.0 84.3 83.0 81.3 81.3 82.2 81.2 -1.0
Try crack once or twice c 92.5 92.5 91.4 89.9 88.7 88.2 87.4 87.1 87.8 87.1 86.9 88.0 87.6 88.6 88.8 89.5 89.5 90.8 90.4 90.3 90.9 91.0 +0.1
Take crack occasionally c 94.3 94.4 93.6 92.5 91.7 91.9 91.0 90.6 91.5 90.9 90.6 91.0 91.0 91.8 91.8 92.0 92.7 92.9 92.8 92.4 93.0 93.0 +0.1
Try cocaine powder once or twice c 90.8 91.1 90.0 88.1 86.8 86.1 85.1 84.9 86.0 84.8 85.3 86.4 85.9 86.8 86.9 87.3 87.7 88.6 88.4 89.0 89.4 89.3 0.0
Take cocaine powder occasionally c 94.0 94.0 93.2 92.1 91.4 91.1 90.4 89.7 90.7 89.9 90.2 89.9 90.4 91.2 91.2 91.4 92.0 92.1 92.1 92.2 92.5 92.4 -0.1
Try heroin once or twice without using
a needle d — — — — 89.7 89.5 89.1 88.6 90.1 90.1 89.1 89.2 89.3 90.1 90.3 91.1 90.7 91.4 91.6 91.4 91.6 91.9 +0.4
Take heroin occasionally without using
a needle d — — — — 91.6 91.7 91.4 90.5 91.8 92.3 90.8 90.7 90.6 91.8 92.0 92.5 92.5 92.5 93.0 92.4 92.4 92.9 +0.5
Try one or two drinks of an alcoholic
beverage (beer, wine, liquor) b 37.6 39.9 38.5 36.5 36.1 34.2 33.7 34.7 35.1 33.4 34.7 37.7 36.8 37.6 38.5 37.8 39.5 41.8 39.7 40.3 41.5 39.6 -1.9
Take one or two drinks nearly every day b 81.7 81.7 78.6 75.2 75.4 73.8 75.4 74.6 75.4 73.8 73.8 74.9 74.2 75.1 76.9 76.4 77.1 79.1 77.6 77.6 80.0 78.0 -2.0
Have five or more drinks once or twice
each weekend b 76.7 77.6 74.7 72.3 72.2 70.7 70.2 70.5 69.9 68.2 69.2 71.5 71.6 71.8 73.7 72.9 74.1 77.2 75.1 75.9 77.3 77.5 +0.2
Smoke one to five cigarettes per day e — — — — — — — — 67.8 69.1 71.2 74.3 76.2 77.5 79.3 80.2 79.7 82.5 80.0 80.6 82.1 — —
Smoke one or more packs of cigarettes
per day f 79.4 77.8 76.5 73.9 73.2 71.6 73.8 75.3 76.1 76.7 78.2 80.6 81.4 82.7 84.3 83.2 84.7 85.2 84.5 83.9 85.8 86.0 +0.3
Use smokeless tobacco regularly b 75.4 74.6 73.8 71.2 71.0 71.0 72.3 73.2 75.1 75.8 76.1 78.7 79.4 80.2 80.5 80.5 80.9 81.8 79.5 78.5 79.5 79.5 +0.1
Take steroids g 90.0 91.0 91.2 90.8 — — — — — — — — — — — — — — — — — — —
Approximate weighted N = 14,800 14,800 15,300 15,900 17,000 15,700 15,600 15,000 13,600 14,300 14,000 14,300 15,800 16,400 16,200 16,200 16,100 15,100 15,900 15,200 14,900 15,000
Source. The Monitoring the Future study, the University of Michigan.
Notes. Level of significance of difference between the two most recent classes: s = .05, ss = .01, sss = .001. ' — ' indicates data not available. Any apparent inconsistency between the change estimate and the prevalence
estimates for the two most recent years is due to rounding.
aAnswer alternatives were: (1) Don’t disapprove, (2) Disapprove, (3) Strongly disapprove, and (4) Can’t say, drug unfamiliar. Percentages are shown for categories (2) and (3) combined.
bBeginning in 2012, data based on two thirds of N indicated.
cBeginning in 1997, data based on two thirds of N indicated due to changes in questionnaire forms.dData based on one of two forms in 1993–1996; N is one half of N indicated. Beginning in 1997, data based on one third of N indicated due to changes in questionnaire forms. eData based on one third of N indicated.fBeginning in 1999, data based on two thirds of N indicated due to changes in questionnaire forms.gData based on two forms in 1991 and 1992. Data based on one of two forms in 1993 and 1994; N is one half of N indicated.
change
TABLE 13Trends in Disapproval of Drug Use in Grade 10
Percentage who disapprove or strongly disapprove a 2011–
2012
77
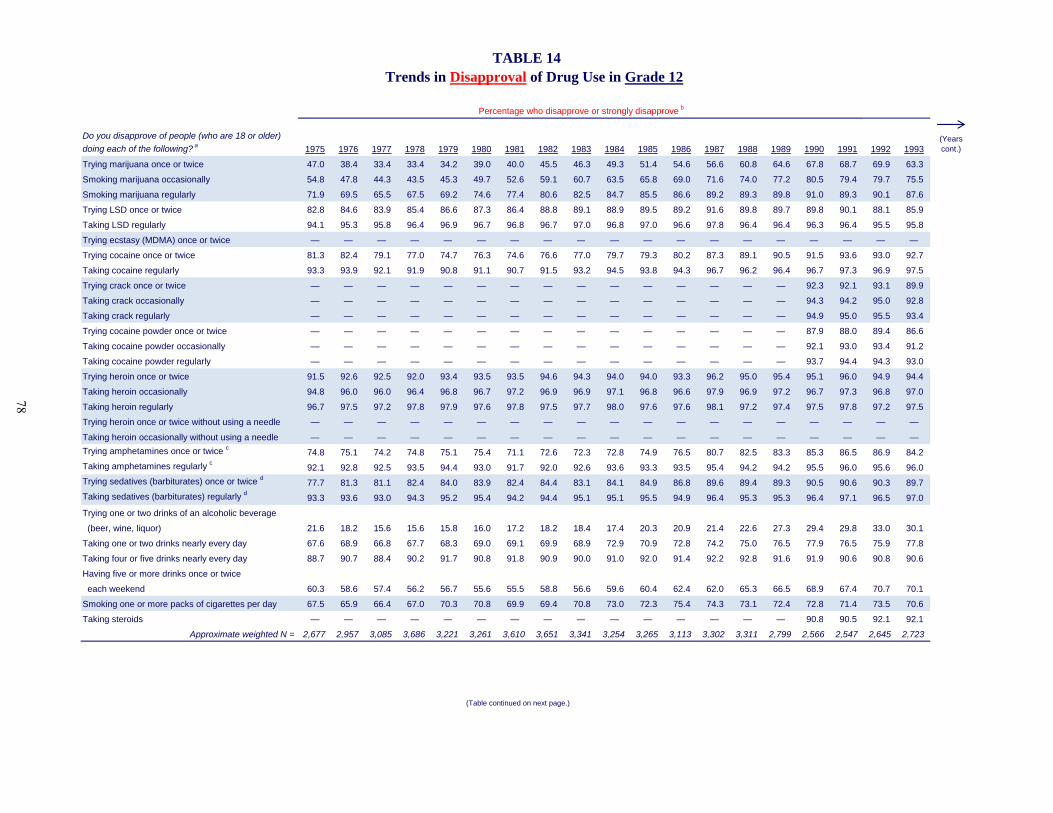
TABLE 14Trends in Disapproval of Drug Use in Grade 12
Percentage who disapprove or strongly disapprove b
(Years Do you disapprove of people (who are 18 or older)
1975 1976 1977 1978 1979 1980 1981 1982 1983 1984 1985 1986 1987 1988 1989 1990 1991 1992 1993
Trying marijuana once or twice 47.0 38.4 33.4 33.4 34.2 39.0 40.0 45.5 46.3 49.3 51.4 54.6 56.6 60.8 64.6 67.8 68.7 69.9 63.3
Smoking marijuana occasionally 54.8 47.8 44.3 43.5 45.3 49.7 52.6 59.1 60.7 63.5 65.8 69.0 71.6 74.0 77.2 80.5 79.4 79.7 75.5
Smoking marijuana regularly 71.9 69.5 65.5 67.5 69.2 74.6 77.4 80.6 82.5 84.7 85.5 86.6 89.2 89.3 89.8 91.0 89.3 90.1 87.6
Trying LSD once or twice 82.8 84.6 83.9 85.4 86.6 87.3 86.4 88.8 89.1 88.9 89.5 89.2 91.6 89.8 89.7 89.8 90.1 88.1 85.9
Taking LSD regularly 94.1 95.3 95.8 96.4 96.9 96.7 96.8 96.7 97.0 96.8 97.0 96.6 97.8 96.4 96.4 96.3 96.4 95.5 95.8
T i t (MDMA) t i
(cont.)doing each of the following? a
Trying ecstasy (MDMA) once or twice — — — — — — — — — — — — — — — — — — —
Trying cocaine once or twice 81.3 82.4 79.1 77.0 74.7 76.3 74.6 76.6 77.0 79.7 79.3 80.2 87.3 89.1 90.5 91.5 93.6 93.0 92.7
Taking cocaine regularly 93.3 93.9 92.1 91.9 90.8 91.1 90.7 91.5 93.2 94.5 93.8 94.3 96.7 96.2 96.4 96.7 97.3 96.9 97.5
Trying crack once or twice — — — — — — — — — — — — — — — 92.3 92.1 93.1 89.9
Taking crack occasionally — — — — — — — — — — — — — — — 94.3 94.2 95.0 92.8
Taking crack regularly — — — — — — — — — — — — — — — 94.9 95.0 95.5 93.4
Trying cocaine powder once or twice — — — — — — — — — — — — — — — 87 9 88 0 89 4 86 6Trying cocaine powder once or twice 87.9 88.0 89.4 86.6
Taking cocaine powder occasionally — — — — — — — — — — — — — — — 92.1 93.0 93.4 91.2
Taking cocaine powder regularly — — — — — — — — — — — — — — — 93.7 94.4 94.3 93.0
Trying heroin once or twice 91.5 92.6 92.5 92.0 93.4 93.5 93.5 94.6 94.3 94.0 94.0 93.3 96.2 95.0 95.4 95.1 96.0 94.9 94.4
Taking heroin occasionally 94.8 96.0 96.0 96.4 96.8 96.7 97.2 96.9 96.9 97.1 96.8 96.6 97.9 96.9 97.2 96.7 97.3 96.8 97.0
Taking heroin regularly 96.7 97.5 97.2 97.8 97.9 97.6 97.8 97.5 97.7 98.0 97.6 97.6 98.1 97.2 97.4 97.5 97.8 97.2 97.5
Trying heroin once or twice without using a needle — — — — — — — — — — — — — — — — — — —
Taking heroin occasionally without using a needle — — — — — — — — — — — — — — — — — — —
Trying amphetamines once or twice c 74.8 75.1 74.2 74.8 75.1 75.4 71.1 72.6 72.3 72.8 74.9 76.5 80.7 82.5 83.3 85.3 86.5 86.9 84.2
Taking amphetamines regularly c 92.1 92.8 92.5 93.5 94.4 93.0 91.7 92.0 92.6 93.6 93.3 93.5 95.4 94.2 94.2 95.5 96.0 95.6 96.0
Trying sedatives (barbiturates) once or twice d 77.7 81.3 81.1 82.4 84.0 83.9 82.4 84.4 83.1 84.1 84.9 86.8 89.6 89.4 89.3 90.5 90.6 90.3 89.7
Taking sedatives (barbiturates) regularly d 93.3 93.6 93.0 94.3 95.2 95.4 94.2 94.4 95.1 95.1 95.5 94.9 96.4 95.3 95.3 96.4 97.1 96.5 97.0
Trying one or two drinks of an alcoholic beverage
(beer, wine, liquor) 21.6 18.2 15.6 15.6 15.8 16.0 17.2 18.2 18.4 17.4 20.3 20.9 21.4 22.6 27.3 29.4 29.8 33.0 30.1
Taking one or two drinks nearly every day 67.6 68.9 66.8 67.7 68.3 69.0 69.1 69.9 68.9 72.9 70.9 72.8 74.2 75.0 76.5 77.9 76.5 75.9 77.8
Taking four or five drinks nearly every day 88.7 90.7 88.4 90.2 91.7 90.8 91.8 90.9 90.0 91.0 92.0 91.4 92.2 92.8 91.6 91.9 90.6 90.8 90.6
Having five or more drinks once or twice
each weekend 60.3 58.6 57.4 56.2 56.7 55.6 55.5 58.8 56.6 59.6 60.4 62.4 62.0 65.3 66.5 68.9 67.4 70.7 70.1
Smoking one or more packs of cigarettes per day 67.5 65.9 66.4 67.0 70.3 70.8 69.9 69.4 70.8 73.0 72.3 75.4 74.3 73.1 72.4 72.8 71.4 73.5 70.6
Taking steroids 90 8 90 5 92 1 92 1Taking steroids — — — — — — — — — — — — — — — 90.8 90.5 92.1 92.1
Approximate weighted N = 2,677 2,957 3,085 3,686 3,221 3,261 3,610 3,651 3,341 3,254 3,265 3,113 3,302 3,311 2,799 2,566 2,547 2,645 2,723
(Table continued on next page.)
78
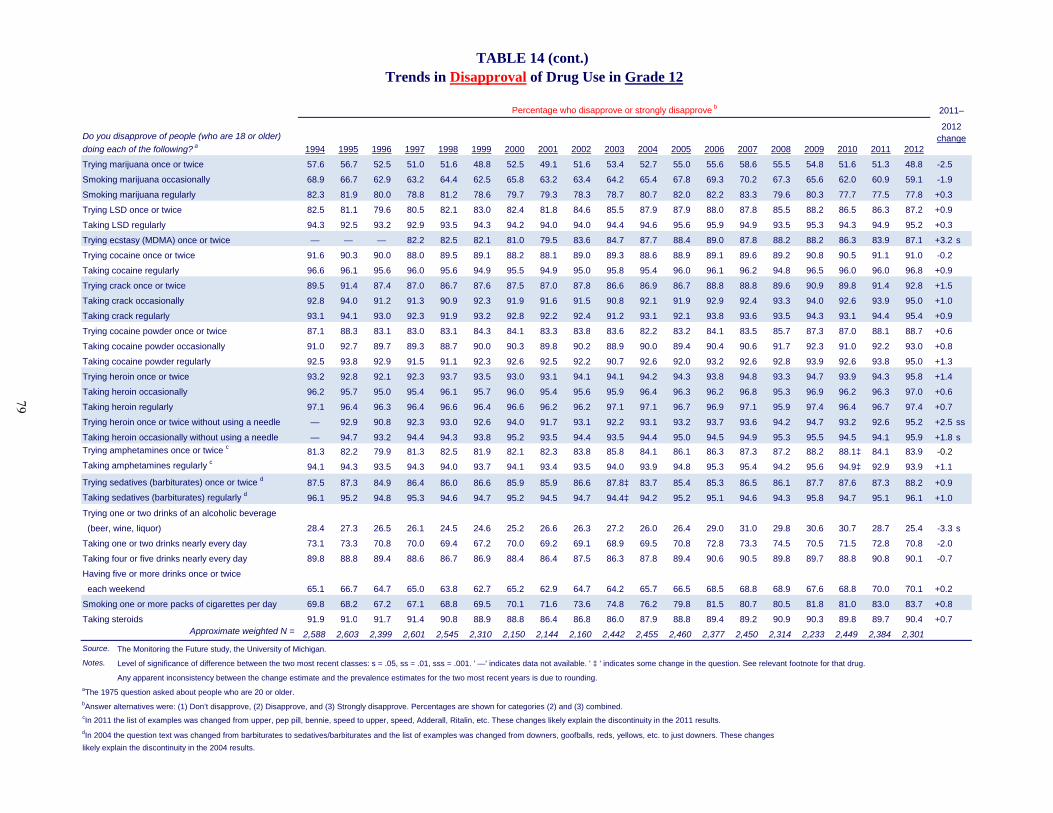
TABLE 14 (cont.) Trends in Disapproval of Drug Use in Grade 12
Percentage who disapprove or strongly disapprove b 2011–
2012changeDo you disapprove of people (who are 18 or older)
1994 1995 1996 1997 1998 1999 2000 2001 2002 2003 2004 2005 2006 2007 2008 2009 2010 2011 2012
Trying marijuana once or twice 57.6 56.7 52.5 51.0 51.6 48.8 52.5 49.1 51.6 53.4 52.7 55.0 55.6 58.6 55.5 54.8 51.6 51.3 48.8 -2.5
Smoking marijuana occasionally 68.9 66.7 62.9 63.2 64.4 62.5 65.8 63.2 63.4 64.2 65.4 67.8 69.3 70.2 67.3 65.6 62.0 60.9 59.1 -1.9
Smoking marijuana regularly 82.3 81.9 80.0 78.8 81.2 78.6 79.7 79.3 78.3 78.7 80.7 82.0 82.2 83.3 79.6 80.3 77.7 77.5 77.8 +0.3
Trying LSD once or twice 82.5 81.1 79.6 80.5 82.1 83.0 82.4 81.8 84.6 85.5 87.9 87.9 88.0 87.8 85.5 88.2 86.5 86.3 87.2 +0.9
Taking LSD regularly 94.3 92.5 93.2 92.9 93.5 94.3 94.2 94.0 94.0 94.4 94.6 95.6 95.9 94.9 93.5 95.3 94.3 94.9 95.2 +0.3
T i t (MDMA) t i 82 2 82 5 82 1 81 0 79 5 83 6 84 7 87 7 88 4 89 0 87 8 88 2 88 2 86 3 83 9 87 1 +3 2
gdoing each of the following? a
Trying ecstasy (MDMA) once or twice — — — 82.2 82.5 82.1 81.0 79.5 83.6 84.7 87.7 88.4 89.0 87.8 88.2 88.2 86.3 83.9 87.1 +3.2 s
Trying cocaine once or twice 91.6 90.3 90.0 88.0 89.5 89.1 88.2 88.1 89.0 89.3 88.6 88.9 89.1 89.6 89.2 90.8 90.5 91.1 91.0 -0.2
Taking cocaine regularly 96.6 96.1 95.6 96.0 95.6 94.9 95.5 94.9 95.0 95.8 95.4 96.0 96.1 96.2 94.8 96.5 96.0 96.0 96.8 +0.9
Trying crack once or twice 89.5 91.4 87.4 87.0 86.7 87.6 87.5 87.0 87.8 86.6 86.9 86.7 88.8 88.8 89.6 90.9 89.8 91.4 92.8 +1.5
Taking crack occasionally 92.8 94.0 91.2 91.3 90.9 92.3 91.9 91.6 91.5 90.8 92.1 91.9 92.9 92.4 93.3 94.0 92.6 93.9 95.0 +1.0
Taking crack regularly 93.1 94.1 93.0 92.3 91.9 93.2 92.8 92.2 92.4 91.2 93.1 92.1 93.8 93.6 93.5 94.3 93.1 94.4 95.4 +0.9
Trying cocaine powder once or twice 87 1 88 3 83 1 83 0 83 1 84 3 84 1 83 3 83 8 83 6 82 2 83 2 84 1 83 5 85 7 87 3 87 0 88 1 88 7 +0 6Trying cocaine powder once or twice 87.1 88.3 83.1 83.0 83.1 84.3 84.1 83.3 83.8 83.6 82.2 83.2 84.1 83.5 85.7 87.3 87.0 88.1 88.7 +0.6
Taking cocaine powder occasionally 91.0 92.7 89.7 89.3 88.7 90.0 90.3 89.8 90.2 88.9 90.0 89.4 90.4 90.6 91.7 92.3 91.0 92.2 93.0 +0.8
Taking cocaine powder regularly 92.5 93.8 92.9 91.5 91.1 92.3 92.6 92.5 92.2 90.7 92.6 92.0 93.2 92.6 92.8 93.9 92.6 93.8 95.0 +1.3
Trying heroin once or twice 93.2 92.8 92.1 92.3 93.7 93.5 93.0 93.1 94.1 94.1 94.2 94.3 93.8 94.8 93.3 94.7 93.9 94.3 95.8 +1.4
Taking heroin occasionally 96.2 95.7 95.0 95.4 96.1 95.7 96.0 95.4 95.6 95.9 96.4 96.3 96.2 96.8 95.3 96.9 96.2 96.3 97.0 +0.6
Taking heroin regularly 97.1 96.4 96.3 96.4 96.6 96.4 96.6 96.2 96.2 97.1 97.1 96.7 96.9 97.1 95.9 97.4 96.4 96.7 97.4 +0.7
Trying heroin once or twice without using a needle — 92.9 90.8 92.3 93.0 92.6 94.0 91.7 93.1 92.2 93.1 93.2 93.7 93.6 94.2 94.7 93.2 92.6 95.2 +2.5 ss
Taking heroin occasionally without using a needle — 94.7 93.2 94.4 94.3 93.8 95.2 93.5 94.4 93.5 94.4 95.0 94.5 94.9 95.3 95.5 94.5 94.1 95.9 +1.8 s
Trying amphetamines once or twice c 81.3 82.2 79.9 81.3 82.5 81.9 82.1 82.3 83.8 85.8 84.1 86.1 86.3 87.3 87.2 88.2 88.1‡ 84.1 83.9 -0.2
Taking amphetamines regularly c 94.1 94.3 93.5 94.3 94.0 93.7 94.1 93.4 93.5 94.0 93.9 94.8 95.3 95.4 94.2 95.6 94.9‡ 92.9 93.9 +1.1
Trying sedatives (barbiturates) once or twice d 87.5 87.3 84.9 86.4 86.0 86.6 85.9 85.9 86.6 87.8‡ 83.7 85.4 85.3 86.5 86.1 87.7 87.6 87.3 88.2 +0.9
Taking sedatives (barbiturates) regularly d 96.1 95.2 94.8 95.3 94.6 94.7 95.2 94.5 94.7 94.4‡ 94.2 95.2 95.1 94.6 94.3 95.8 94.7 95.1 96.1 +1.0
Trying one or two drinks of an alcoholic beverage
(beer, wine, liquor) 28.4 27.3 26.5 26.1 24.5 24.6 25.2 26.6 26.3 27.2 26.0 26.4 29.0 31.0 29.8 30.6 30.7 28.7 25.4 -3.3 s
Taking one or two drinks nearly every day 73.1 73.3 70.8 70.0 69.4 67.2 70.0 69.2 69.1 68.9 69.5 70.8 72.8 73.3 74.5 70.5 71.5 72.8 70.8 -2.0
Taking four or five drinks nearly every day 89.8 88.8 89.4 88.6 86.7 86.9 88.4 86.4 87.5 86.3 87.8 89.4 90.6 90.5 89.8 89.7 88.8 90.8 90.1 -0.7
Having five or more drinks once or twice
each weekend 65.1 66.7 64.7 65.0 63.8 62.7 65.2 62.9 64.7 64.2 65.7 66.5 68.5 68.8 68.9 67.6 68.8 70.0 70.1 +0.2
Smoking one or more packs of cigarettes per day 69.8 68.2 67.2 67.1 68.8 69.5 70.1 71.6 73.6 74.8 76.2 79.8 81.5 80.7 80.5 81.8 81.0 83.0 83.7 +0.8
Taking steroids 91 9 91 0 91 7 91 4 90 8 88 9 88 8 86 4 86 8 86 0 87 9 88 8 89 4 89 2 90 9 90 3 89 8 89 7 90 4 +0 7Taking steroids 91.9 91.0 91.7 91.4 90.8 88.9 88.8 86.4 86.8 86.0 87.9 88.8 89.4 89.2 90.9 90.3 89.8 89.7 90.4 +0.7Approximate weighted N = 2,588 2,603 2,399 2,601 2,545 2,310 2,150 2,144 2,160 2,442 2,455 2,460 2,377 2,450 2,314 2,233 2,449 2,384 2,301
Source. The Monitoring the Future study, the University of Michigan.
Notes. Level of significance of difference between the two most recent classes: s = .05, ss = .01, sss = .001. ' —' indicates data not available. ' ‡ ' indicates some change in the question. See relevant footnote for that drug.
Any apparent inconsistency between the change estimate and the prevalence estimates for the two most recent years is due to rounding.aThe 1975 question asked about people who are 20 or older.bAnswer alternatives were: (1) Don’t disapprove, (2) Disapprove, and (3) Strongly disapprove. Percentages are shown for categories (2) and (3) combined.cIn 2011 the list of examples was changed from upper, pep pill, bennie, speed to upper, speed, Adderall, Ritalin, etc. These changes likely explain the discontinuity in the 2011 results.
dIn 2004 the question text was changed from barbiturates to sedatives/barbiturates and the list of examples was changed from downers, goofballs, reds, yellows, etc. to just downers. These changes
likely explain the discontinuity in the 2004 results.
79
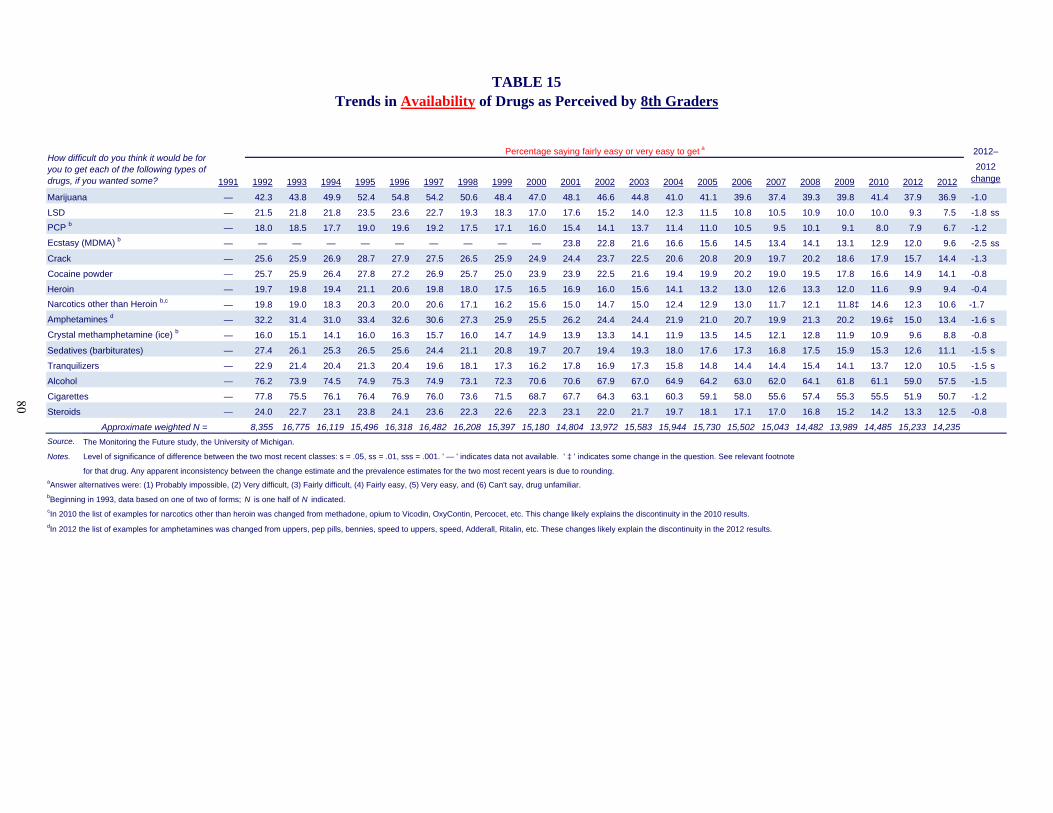
1991 1992 1993 1994 1995 1996 1997 1998 1999 2000 2001 2002 2003 2004 2005 2006 2007 2008 2009 2010 2012 2012
Marijuana — 42.3 43.8 49.9 52.4 54.8 54.2 50.6 48.4 47.0 48.1 46.6 44.8 41.0 41.1 39.6 37.4 39.3 39.8 41.4 37.9 36.9 -1.0
LSD — 21.5 21.8 21.8 23.5 23.6 22.7 19.3 18.3 17.0 17.6 15.2 14.0 12.3 11.5 10.8 10.5 10.9 10.0 10.0 9.3 7.5 -1.8 ss
PCP b — 18.0 18.5 17.7 19.0 19.6 19.2 17.5 17.1 16.0 15.4 14.1 13.7 11.4 11.0 10.5 9.5 10.1 9.1 8.0 7.9 6.7 -1.2
Ecstasy (MDMA) b — — — — — — — — — — 23.8 22.8 21.6 16.6 15.6 14.5 13.4 14.1 13.1 12.9 12.0 9.6 -2.5 ss
Crack — 25.6 25.9 26.9 28.7 27.9 27.5 26.5 25.9 24.9 24.4 23.7 22.5 20.6 20.8 20.9 19.7 20.2 18.6 17.9 15.7 14.4 -1.3
Cocaine powder — 25.7 25.9 26.4 27.8 27.2 26.9 25.7 25.0 23.9 23.9 22.5 21.6 19.4 19.9 20.2 19.0 19.5 17.8 16.6 14.9 14.1 -0.8
Heroin — 19.7 19.8 19.4 21.1 20.6 19.8 18.0 17.5 16.5 16.9 16.0 15.6 14.1 13.2 13.0 12.6 13.3 12.0 11.6 9.9 9.4 -0.4
Narcotics other than Heroin b,c — 19.8 19.0 18.3 20.3 20.0 20.6 17.1 16.2 15.6 15.0 14.7 15.0 12.4 12.9 13.0 11.7 12.1 11.8‡ 14.6 12.3 10.6 -1.7
Amphetamines d — 32.2 31.4 31.0 33.4 32.6 30.6 27.3 25.9 25.5 26.2 24.4 24.4 21.9 21.0 20.7 19.9 21.3 20.2 19.6‡ 15.0 13.4 -1.6 s
Crystal methamphetamine (ice) b — 16.0 15.1 14.1 16.0 16.3 15.7 16.0 14.7 14.9 13.9 13.3 14.1 11.9 13.5 14.5 12.1 12.8 11.9 10.9 9.6 8.8 -0.8
Sedatives (barbiturates) — 27.4 26.1 25.3 26.5 25.6 24.4 21.1 20.8 19.7 20.7 19.4 19.3 18.0 17.6 17.3 16.8 17.5 15.9 15.3 12.6 11.1 -1.5 s
Tranquilizers — 22.9 21.4 20.4 21.3 20.4 19.6 18.1 17.3 16.2 17.8 16.9 17.3 15.8 14.8 14.4 14.4 15.4 14.1 13.7 12.0 10.5 -1.5 s
Alcohol — 76.2 73.9 74.5 74.9 75.3 74.9 73.1 72.3 70.6 70.6 67.9 67.0 64.9 64.2 63.0 62.0 64.1 61.8 61.1 59.0 57.5 -1.5
Cigarettes — 77.8 75.5 76.1 76.4 76.9 76.0 73.6 71.5 68.7 67.7 64.3 63.1 60.3 59.1 58.0 55.6 57.4 55.3 55.5 51.9 50.7 -1.2
Steroids — 24.0 22.7 23.1 23.8 24.1 23.6 22.3 22.6 22.3 23.1 22.0 21.7 19.7 18.1 17.1 17.0 16.8 15.2 14.2 13.3 12.5 -0.8
Approximate weighted N = 8,355 16,775 16,119 15,496 16,318 16,482 16,208 15,397 15,180 14,804 13,972 15,583 15,944 15,730 15,502 15,043 14,482 13,989 14,485 15,233 14,235
Source. The Monitoring the Future study, the University of Michigan.
Notes. Level of significance of difference between the two most recent classes: s = .05, ss = .01, sss = .001. ' — ' indicates data not available. ' ‡ ' indicates some change in the question. See relevant footnote
for that drug. Any apparent inconsistency between the change estimate and the prevalence estimates for the two most recent years is due to rounding. aAnswer alternatives were: (1) Probably impossible, (2) Very difficult, (3) Fairly difficult, (4) Fairly easy, (5) Very easy, and (6) Can't say, drug unfamiliar. bBeginning in 1993, data based on one of two of forms; N is one half of N indicated.cIn 2010 the list of examples for narcotics other than heroin was changed from methadone, opium to Vicodin, OxyContin, Percocet, etc. This change likely explains the discontinuity in the 2010 results.
dIn 2012 the list of examples for amphetamines was changed from uppers, pep pills, bennies, speed to uppers, speed, Adderall, Ritalin, etc. These changes likely explain the discontinuity in the 2012 results.
TABLE 15Trends in Availability of Drugs as Perceived by 8th Graders
How difficult do you think it would be for you to get each of the following types of drugs, if you wanted some?
Percentage saying fairly easy or very easy to get a 2012–
2012change
80
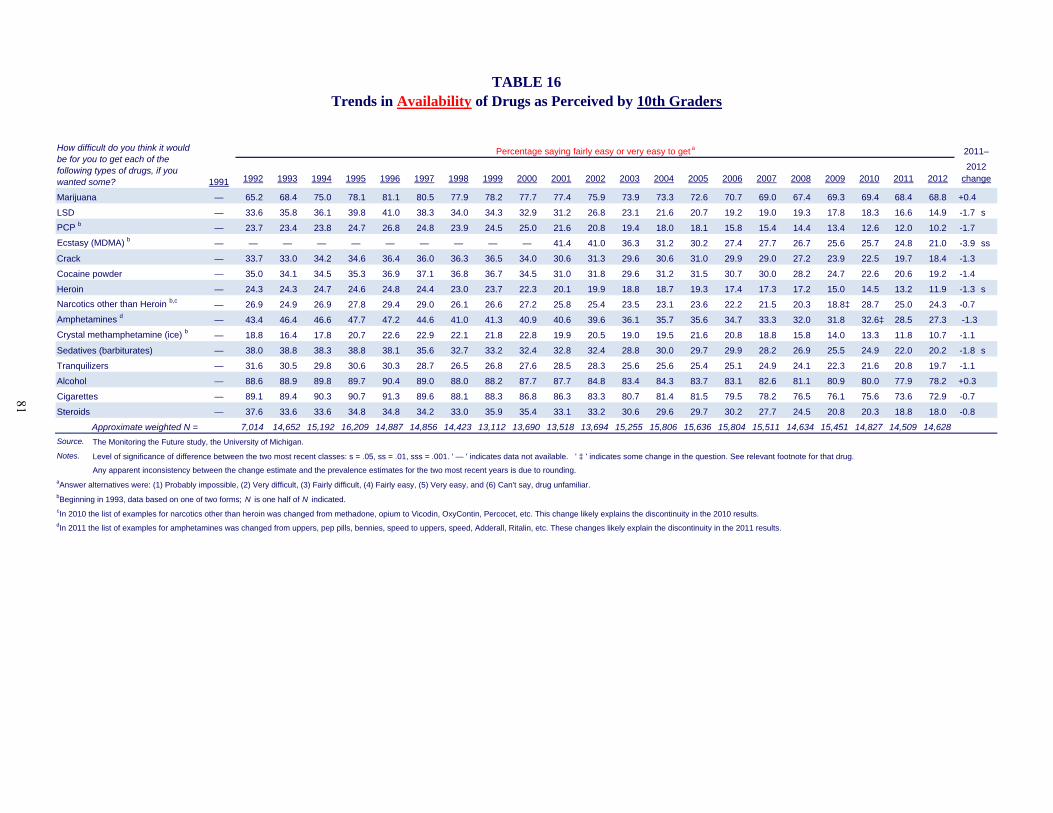
1991 1992 1993 1994 1995 1996 1997 1998 1999 2000 2001 2002 2003 2004 2005 2006 2007 2008 2009 2010 2011 2012
Marijuana — 65.2 68.4 75.0 78.1 81.1 80.5 77.9 78.2 77.7 77.4 75.9 73.9 73.3 72.6 70.7 69.0 67.4 69.3 69.4 68.4 68.8 +0.4
LSD — 33.6 35.8 36.1 39.8 41.0 38.3 34.0 34.3 32.9 31.2 26.8 23.1 21.6 20.7 19.2 19.0 19.3 17.8 18.3 16.6 14.9 -1.7 s
PCP b — 23.7 23.4 23.8 24.7 26.8 24.8 23.9 24.5 25.0 21.6 20.8 19.4 18.0 18.1 15.8 15.4 14.4 13.4 12.6 12.0 10.2 -1.7
Ecstasy (MDMA) b — — — — — — — — — — 41.4 41.0 36.3 31.2 30.2 27.4 27.7 26.7 25.6 25.7 24.8 21.0 -3.9 ss
Crack — 33.7 33.0 34.2 34.6 36.4 36.0 36.3 36.5 34.0 30.6 31.3 29.6 30.6 31.0 29.9 29.0 27.2 23.9 22.5 19.7 18.4 -1.3
Cocaine powder — 35.0 34.1 34.5 35.3 36.9 37.1 36.8 36.7 34.5 31.0 31.8 29.6 31.2 31.5 30.7 30.0 28.2 24.7 22.6 20.6 19.2 -1.4
Heroin — 24.3 24.3 24.7 24.6 24.8 24.4 23.0 23.7 22.3 20.1 19.9 18.8 18.7 19.3 17.4 17.3 17.2 15.0 14.5 13.2 11.9 -1.3 s
Narcotics other than Heroin b,c — 26.9 24.9 26.9 27.8 29.4 29.0 26.1 26.6 27.2 25.8 25.4 23.5 23.1 23.6 22.2 21.5 20.3 18.8‡ 28.7 25.0 24.3 -0.7
Amphetamines d — 43.4 46.4 46.6 47.7 47.2 44.6 41.0 41.3 40.9 40.6 39.6 36.1 35.7 35.6 34.7 33.3 32.0 31.8 32.6‡ 28.5 27.3 -1.3
Crystal methamphetamine (ice) b — 18.8 16.4 17.8 20.7 22.6 22.9 22.1 21.8 22.8 19.9 20.5 19.0 19.5 21.6 20.8 18.8 15.8 14.0 13.3 11.8 10.7 -1.1
Sedatives (barbiturates) — 38.0 38.8 38.3 38.8 38.1 35.6 32.7 33.2 32.4 32.8 32.4 28.8 30.0 29.7 29.9 28.2 26.9 25.5 24.9 22.0 20.2 -1.8 s
Tranquilizers — 31.6 30.5 29.8 30.6 30.3 28.7 26.5 26.8 27.6 28.5 28.3 25.6 25.6 25.4 25.1 24.9 24.1 22.3 21.6 20.8 19.7 -1.1
Alcohol — 88.6 88.9 89.8 89.7 90.4 89.0 88.0 88.2 87.7 87.7 84.8 83.4 84.3 83.7 83.1 82.6 81.1 80.9 80.0 77.9 78.2 +0.3
Cigarettes — 89.1 89.4 90.3 90.7 91.3 89.6 88.1 88.3 86.8 86.3 83.3 80.7 81.4 81.5 79.5 78.2 76.5 76.1 75.6 73.6 72.9 -0.7
Steroids — 37.6 33.6 33.6 34.8 34.8 34.2 33.0 35.9 35.4 33.1 33.2 30.6 29.6 29.7 30.2 27.7 24.5 20.8 20.3 18.8 18.0 -0.8
Approximate weighted N = 7,014 14,652 15,192 16,209 14,887 14,856 14,423 13,112 13,690 13,518 13,694 15,255 15,806 15,636 15,804 15,511 14,634 15,451 14,827 14,509 14,628
Source. The Monitoring the Future study, the University of Michigan.
Notes. Level of significance of difference between the two most recent classes: s = .05, ss = .01, sss = .001. ' — ' indicates data not available. ' ‡ ' indicates some change in the question. See relevant footnote for that drug.
Any apparent inconsistency between the change estimate and the prevalence estimates for the two most recent years is due to rounding.aAnswer alternatives were: (1) Probably impossible, (2) Very difficult, (3) Fairly difficult, (4) Fairly easy, (5) Very easy, and (6) Can't say, drug unfamiliar. bBeginning in 1993, data based on one of two forms; N is one half of N indicated.cIn 2010 the list of examples for narcotics other than heroin was changed from methadone, opium to Vicodin, OxyContin, Percocet, etc. This change likely explains the discontinuity in the 2010 results.dIn 2011 the list of examples for amphetamines was changed from uppers, pep pills, bennies, speed to uppers, speed, Adderall, Ritalin, etc. These changes likely explain the discontinuity in the 2011 results.
TABLE 16Trends in Availability of Drugs as Perceived by 10th Graders
How difficult do you think it would be for you to get each of the following types of drugs, if you wanted some?
Percentage saying fairly easy or very easy to get a 2011–
2012change
81
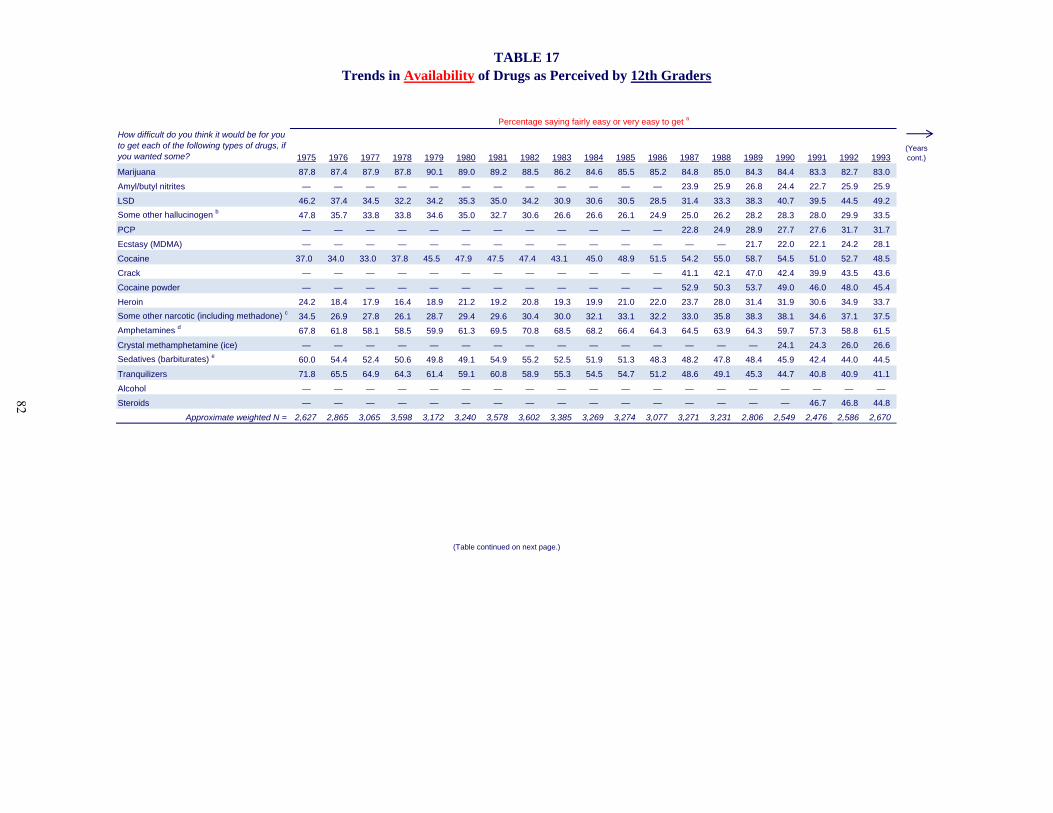
TABLE 17Trends in Availability of Drugs as Perceived by 12th Graders
How difficult do you think it would be for you t t h f th f ll i t f d if
Percentage saying fairly easy or very easy to get a
1975 1976 1977 1978 1979 1980 1981 1982 1983 1984 1985 1986 1987 1988 1989 1990 1991 1992 1993
Marijuana 87.8 87.4 87.9 87.8 90.1 89.0 89.2 88.5 86.2 84.6 85.5 85.2 84.8 85.0 84.3 84.4 83.3 82.7 83.0
Amyl/butyl nitrites — — — — — — — — — — — — 23.9 25.9 26.8 24.4 22.7 25.9 25.9
LSD 46.2 37.4 34.5 32.2 34.2 35.3 35.0 34.2 30.9 30.6 30.5 28.5 31.4 33.3 38.3 40.7 39.5 44.5 49.2
Some other hallucinogen b 47.8 35.7 33.8 33.8 34.6 35.0 32.7 30.6 26.6 26.6 26.1 24.9 25.0 26.2 28.2 28.3 28.0 29.9 33.5
PCP — — — — — — — — — — — — 22.8 24.9 28.9 27.7 27.6 31.7 31.7
(Years cont.)
to get each of the following types of drugs, if you wanted some?
Ecstasy (MDMA) — — — — — — — — — — — — — — 21.7 22.0 22.1 24.2 28.1
Cocaine 37.0 34.0 33.0 37.8 45.5 47.9 47.5 47.4 43.1 45.0 48.9 51.5 54.2 55.0 58.7 54.5 51.0 52.7 48.5
Crack — — — — — — — — — — — — 41.1 42.1 47.0 42.4 39.9 43.5 43.6
Cocaine powder — — — — — — — — — — — — 52.9 50.3 53.7 49.0 46.0 48.0 45.4
Heroin 24.2 18.4 17.9 16.4 18.9 21.2 19.2 20.8 19.3 19.9 21.0 22.0 23.7 28.0 31.4 31.9 30.6 34.9 33.7
Some other narcotic (including methadone) c 34.5 26.9 27.8 26.1 28.7 29.4 29.6 30.4 30.0 32.1 33.1 32.2 33.0 35.8 38.3 38.1 34.6 37.1 37.5
Amphetamines d 67.8 61.8 58.1 58.5 59.9 61.3 69.5 70.8 68.5 68.2 66.4 64.3 64.5 63.9 64.3 59.7 57.3 58.8 61.5Amphetamines 67.8 61.8 58.1 58.5 59.9 61.3 69.5 70.8 68.5 68.2 66.4 64.3 64.5 63.9 64.3 59.7 57.3 58.8 61.5
Crystal methamphetamine (ice) — — — — — — — — — — — — — — — 24.1 24.3 26.0 26.6
Sedatives (barbiturates) e 60.0 54.4 52.4 50.6 49.8 49.1 54.9 55.2 52.5 51.9 51.3 48.3 48.2 47.8 48.4 45.9 42.4 44.0 44.5
Tranquilizers 71.8 65.5 64.9 64.3 61.4 59.1 60.8 58.9 55.3 54.5 54.7 51.2 48.6 49.1 45.3 44.7 40.8 40.9 41.1
Alcohol — — — — — — — — — — — — — — — — — — —
Steroids — — — — — — — — — — — — — — — — 46.7 46.8 44.8
Approximate weighted N = 2,627 2,865 3,065 3,598 3,172 3,240 3,578 3,602 3,385 3,269 3,274 3,077 3,271 3,231 2,806 2,549 2,476 2,586 2,670
(Table continued on next page.)
82
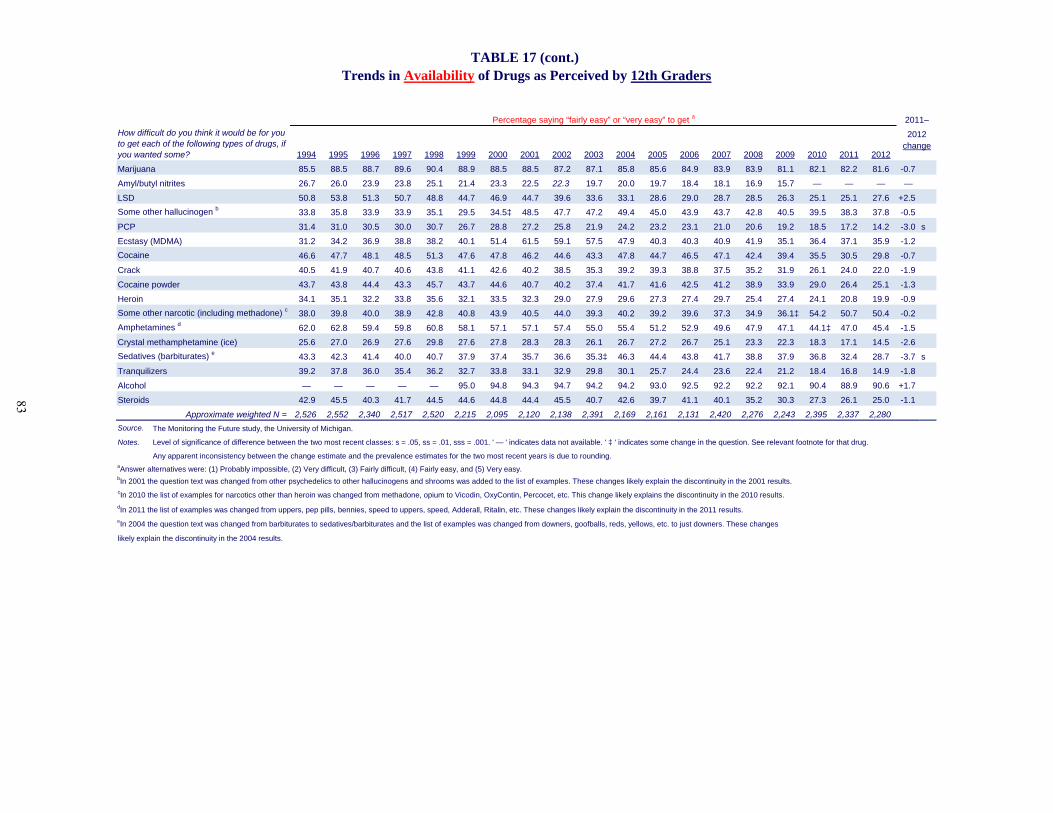
TABLE 17 (cont.)
2011–
2012h
Trends in Availability of Drugs as Perceived by 12th Graders
How difficult do you think it would be for you to get each of the following types of drugs if
Percentage saying “fairly easy” or “very easy” to get a
1994 1995 1996 1997 1998 1999 2000 2001 2002 2003 2004 2005 2006 2007 2008 2009 2010 2011 2012
Marijuana 85.5 88.5 88.7 89.6 90.4 88.9 88.5 88.5 87.2 87.1 85.8 85.6 84.9 83.9 83.9 81.1 82.1 82.2 81.6 -0.7
Amyl/butyl nitrites 26.7 26.0 23.9 23.8 25.1 21.4 23.3 22.5 22.3 19.7 20.0 19.7 18.4 18.1 16.9 15.7 — — — —
LSD 50.8 53.8 51.3 50.7 48.8 44.7 46.9 44.7 39.6 33.6 33.1 28.6 29.0 28.7 28.5 26.3 25.1 25.1 27.6 +2.5
Some other hallucinogen b 33.8 35.8 33.9 33.9 35.1 29.5 34.5‡ 48.5 47.7 47.2 49.4 45.0 43.9 43.7 42.8 40.5 39.5 38.3 37.8 -0.5
PCP 31.4 31.0 30.5 30.0 30.7 26.7 28.8 27.2 25.8 21.9 24.2 23.2 23.1 21.0 20.6 19.2 18.5 17.2 14.2 -3.0 s
E (MDMA) 31 2 34 2 36 9 38 8 38 2 40 1 1 4 61 9 1 4 9 40 3 40 3 40 9 41 9 3 1 36 4 3 1 3 9 1 2
changeto get each of the following types of drugs, if you wanted some?
Ecstasy (MDMA) 31.2 34.2 36.9 38.8 38.2 40.1 51.4 61.5 59.1 57.5 47.9 40.3 40.3 40.9 41.9 35.1 36.4 37.1 35.9 -1.2
Cocaine 46.6 47.7 48.1 48.5 51.3 47.6 47.8 46.2 44.6 43.3 47.8 44.7 46.5 47.1 42.4 39.4 35.5 30.5 29.8 -0.7
Crack 40.5 41.9 40.7 40.6 43.8 41.1 42.6 40.2 38.5 35.3 39.2 39.3 38.8 37.5 35.2 31.9 26.1 24.0 22.0 -1.9
Cocaine powder 43.7 43.8 44.4 43.3 45.7 43.7 44.6 40.7 40.2 37.4 41.7 41.6 42.5 41.2 38.9 33.9 29.0 26.4 25.1 -1.3
Heroin 34.1 35.1 32.2 33.8 35.6 32.1 33.5 32.3 29.0 27.9 29.6 27.3 27.4 29.7 25.4 27.4 24.1 20.8 19.9 -0.9
Some other narcotic (including methadone) c 38.0 39.8 40.0 38.9 42.8 40.8 43.9 40.5 44.0 39.3 40.2 39.2 39.6 37.3 34.9 36.1‡ 54.2 50.7 50.4 -0.2
Amphetamines d 62.0 62.8 59.4 59.8 60.8 58.1 57.1 57.1 57.4 55.0 55.4 51.2 52.9 49.6 47.9 47.1 44.1‡ 47.0 45.4 -1.5
Crystal methamphetamine (ice) 25.6 27.0 26.9 27.6 29.8 27.6 27.8 28.3 28.3 26.1 26.7 27.2 26.7 25.1 23.3 22.3 18.3 17.1 14.5 -2.6
Sedatives (barbiturates) e 43.3 42.3 41.4 40.0 40.7 37.9 37.4 35.7 36.6 35.3‡ 46.3 44.4 43.8 41.7 38.8 37.9 36.8 32.4 28.7 -3.7 s
Tranquilizers 39.2 37.8 36.0 35.4 36.2 32.7 33.8 33.1 32.9 29.8 30.1 25.7 24.4 23.6 22.4 21.2 18.4 16.8 14.9 -1.8
Alcohol — — — — — 95.0 94.8 94.3 94.7 94.2 94.2 93.0 92.5 92.2 92.2 92.1 90.4 88.9 90.6 +1.7
Steroids 42.9 45.5 40.3 41.7 44.5 44.6 44.8 44.4 45.5 40.7 42.6 39.7 41.1 40.1 35.2 30.3 27.3 26.1 25.0 -1.1
Approximate weighted N = 2,526 2,552 2,340 2,517 2,520 2,215 2,095 2,120 2,138 2,391 2,169 2,161 2,131 2,420 2,276 2,243 2,395 2,337 2,280
Source The Monitoring the Future study the University of MichiganSource. The Monitoring the Future study, the University of Michigan.
Notes. Level of significance of difference between the two most recent classes: s = .05, ss = .01, sss = .001. ' — ' indicates data not available. ' ‡ ' indicates some change in the question. See relevant footnote for that drug.
Any apparent inconsistency between the change estimate and the prevalence estimates for the two most recent years is due to rounding.aAnswer alternatives were: (1) Probably impossible, (2) Very difficult, (3) Fairly difficult, (4) Fairly easy, and (5) Very easy.bIn 2001 the question text was changed from other psychedelics to other hallucinogens and shrooms was added to the list of examples. These changes likely explain the discontinuity in the 2001 results.cIn 2010 the list of examples for narcotics other than heroin was changed from methadone, opium to Vicodin, OxyContin, Percocet, etc. This change likely explains the discontinuity in the 2010 results.
eIn 2004 the question text was changed from barbiturates to sedatives/barbiturates and the list of examples was changed from downers goofballs reds yellows etc to just downers These changes
dIn 2011 the list of examples was changed from uppers, pep pills, bennies, speed to uppers, speed, Adderall, Ritalin, etc. These changes likely explain the discontinuity in the 2011 results.
In 2004 the question text was changed from barbiturates to sedatives/barbiturates and the list of examples was changed from downers, goofballs, reds, yellows, etc. to just downers. These changes
likely explain the discontinuity in the 2004 results.
83

Monitoring the Future website: http://www.monitoringthefuture.org

Institute for Social Research
The University of Michigan
2013
Related Documents