INTERNATIONAL JOURNAL OF GEOMATICS AND GEOSCIENCES Volume 2, No 1, 2011 © Copyright 2010 All rights reserved Integrated Publishing services Research article ISSN 0976 – 4380 Submitted on July 2011 published on September 2011 21 Monitoring desertification risk through climate change and human interference using Remote sensing and GIS techniques Arnab Kundu 1 , Dipanwita Dutta 2 1 Centre for the Study of Regional Development, School of Social Sciences, Jawaharlal Nehru University, New Delhi110067, India. 2 Indian Institute of Remote Sensing, Department of Space, Indian Space Research Organisation, Dehradun248001, Uttarakhand, India. [email protected] ABSTRACT The threat of global climate change has radically increased the attention directed towards understanding the effect on environment and its natural and human induced changes. Climatic conditions along with certain human activities such as improper agricultural practices, violent use of fertilizers, overgrazing and other unsustainable practices have accelerated the conversion of fertile lands into arid lands and this eventually leads to land degradation and desertification. The term “desertification” indicates land degradation in arid, semiarid and dry subhumid areas resulting from climate variations and human activity. Stable degradation of vegetation cover is one of the basic characteristics of desertification process. Changes in vegetation cover of the Churu district of Western Rajasthan are very clearly detected from long term satellite data and it has been used for monitoring desertification process. In this paper, long term NOAAAVHRR (19832003) data has been used to monitor desertification processes through NDVI timetrend. The study is based on the analysis of regional long term changes of vegetation conditions that indicates the ongoing desertification processes. Vegetation growth is entirely depended upon rainfall. Here, long term NDVI trend has been analysed corresponding with the long term annual rainfall (19832003). It identifies the areas affected by desertification process as a circumstance of climate change. The results confirmed that some parts of Churu district is under climatically induced desertification processes. Keywords: Climate change, Land Degradation, Desertification, Vegetation cover, NOAAAVHRR NDVI, Rainfall. 1. Introduction According to Adger et al., (2000) over 250 million people are directly affected by desertification and some one billion people in over 100 countries are at risk. India, being one of the leading developing countries of the world is not exempted from the problem related to various natural hazards. Among them, desertification has emerged as a major economic, social and environmental problem in western part of India. The "Great Indian Desert" or Thar, located in Western India, is surrounded by Indus plains in the west, Aravalli Range in the southeast, Rann of Kutch in the south, and Punjab plains in the north and northeast. About 91% of the desert, i.e. 2.08 million square km falls in

Welcome message from author
This document is posted to help you gain knowledge. Please leave a comment to let me know what you think about it! Share it to your friends and learn new things together.
Transcript

INTERNATIONAL JOURNAL OF GEOMATICS AND GEOSCIENCES Volume 2, No 1, 2011
© Copyright 2010 All rights reserved Integrated Publishing services Research article ISSN 0976 – 4380
Submitted on July 2011 published on September 2011 21
Monitoring desertification risk through climate change and human interference using Remote sensing and GIS techniques
Arnab Kundu 1 , Dipanwita Dutta 2 1 Centre for the Study of Regional Development, School of Social Sciences, Jawaharlal
Nehru University, New Delhi110067, India. 2 Indian Institute of Remote Sensing, Department of Space, Indian Space Research
Organisation, Dehradun248001, Uttarakhand, India. [email protected]
ABSTRACT
The threat of global climate change has radically increased the attention directed towards understanding the effect on environment and its natural and human induced changes. Climatic conditions along with certain human activities such as improper agricultural practices, violent use of fertilizers, overgrazing and other unsustainable practices have accelerated the conversion of fertile lands into arid lands and this eventually leads to land degradation and desertification. The term “desertification” indicates land degradation in arid, semiarid and dry subhumid areas resulting from climate variations and human activity. Stable degradation of vegetation cover is one of the basic characteristics of desertification process. Changes in vegetation cover of the Churu district of Western Rajasthan are very clearly detected from long term satellite data and it has been used for monitoring desertification process. In this paper, long term NOAAAVHRR (19832003) data has been used to monitor desertification processes through NDVI timetrend. The study is based on the analysis of regional long term changes of vegetation conditions that indicates the ongoing desertification processes. Vegetation growth is entirely depended upon rainfall. Here, long term NDVI trend has been analysed corresponding with the long term annual rainfall (19832003). It identifies the areas affected by desertification process as a circumstance of climate change. The results confirmed that some parts of Churu district is under climatically induced desertification processes.
Keywords: Climate change, Land Degradation, Desertification, Vegetation cover, NOAAAVHRR NDVI, Rainfall.
1. Introduction
According to Adger et al., (2000) over 250 million people are directly affected by desertification and some one billion people in over 100 countries are at risk. India, being one of the leading developing countries of the world is not exempted from the problem related to various natural hazards. Among them, desertification has emerged as a major economic, social and environmental problem in western part of India. The "Great Indian Desert" or Thar, located in Western India, is surrounded by Indus plains in the west, Aravalli Range in the southeast, Rann of Kutch in the south, and Punjab plains in the north and northeast. About 91% of the desert, i.e. 2.08 million square km falls in

Monitoring desertification risk through climate change and human interference using Remote sensing and GIS techniques
Arnab Kundu, Dipanwita Dutta
International Journal of Geomatics and Geosciences Volume 2 Issue 1, 2011
22
Rajasthan which cover about 61% of the geographical area of the Rajasthan (Sinha et al., 2000). Encroachment of the Thar Desert towards its Eastern boarder has become a serious problem to the adjoining districts of the desert. It is slowly capturing the arable lands by reducing their productivity. A large number of population and animals of this region are at risk due to shifting of sand dunes, dust storms and as a consequence decreasing agricultural productivity. To handle the desertification problem, various programmes were undertaken by Govt. of India. As for example, Desert Development Program (DDP) started in197778 with the objectives to control desertification, restore the ecological balance of desert and semidesert areas and create conditions for raising the level of production, income and employment of the population of these areas. In spite of several attempts taken by our Government, there is lack of well planned management and actual information on climate and human induced desertification. It is true that climate induced desertification is inevitable and difficult to prevent. But, it is possible to identify the areas exposed to desertification processes and that would be useful for making a strategy to prevent the expansion of the desert. Different methods of evaluating desertification include the use of direct observation and measurement, mathematical models and parametric equation, estimates, remote sensing and indicators (Rubio and Bochet, 1998). Nowa days, Remote Sensing is the most successful approach for detecting the long term desertification process and vegetation changes. It is crucial to identify suitable indicators for monitoring desertification at local, regional and global scale. The importance of indicators in monitoring desertification was recognized by FAO and UNEP in the year of 1980 and they proposed 22 indicators in the Provisional Methodology for Assessment and Mapping of Desertification. Liping Di, (2003) made a detailed study on recent progress of remote sensing on monitoring of desertification and mentioned that remote sensing is the only tool of choice for desertification studies at regional and global scale. Remote sensing has been successfully applied to the process of monitoring desert expansion and to the assessment of factors that cause desertification (Hanan et al., 1991). There is a distinct effect of desertification on vegetation cover. The decreasing trend in vegetation cover indicates the ongoing desertification process in an area. The Normalized Difference Vegetation Index derived from the long term NOAA AVHRR data is an established technique for monitoring long term changes in vegetation cover. The NDVI and its relation to green biomass was first suggested and demonstrated by Rouse et al., (1973) and Tucker (1979). It is one of the most widely used vegetation index and its utility in satellite assessment and monitoring of global vegetation cover has been well exploited over the past two decades (Huete and Liu, 1994; Leprieur et al., 2000). In his study, Zhang (1999) found a strong correlation (R 2 =0.73) between NOAA AVHRR NDVI and Vegetation cover. The present study attempts to investigate the areas experiencing long term degradation of vegetation cover response to climate change in the district, Churu. Here, two indicators of desertification have been selected to identify climate induced desertification, one is long term rainfall and the other is remote sensing based indicator NDVI.
2. Study area
The district Churu, situated in the eastern part of the Thar Desert occupies 13,740.95 square kilometres area which is about 12.40 percent of Indian Arid lands exposed to different forms of desertification processes. It consists of six tehsils namely Sujangarh,
Monitoring desertification risk through climate change and human interference using Remote sensing and GIS techniques
Arnab Kundu, Dipanwita Dutta
International Journal of Geomatics and Geosciences Volume 2 Issue 1, 2011
23
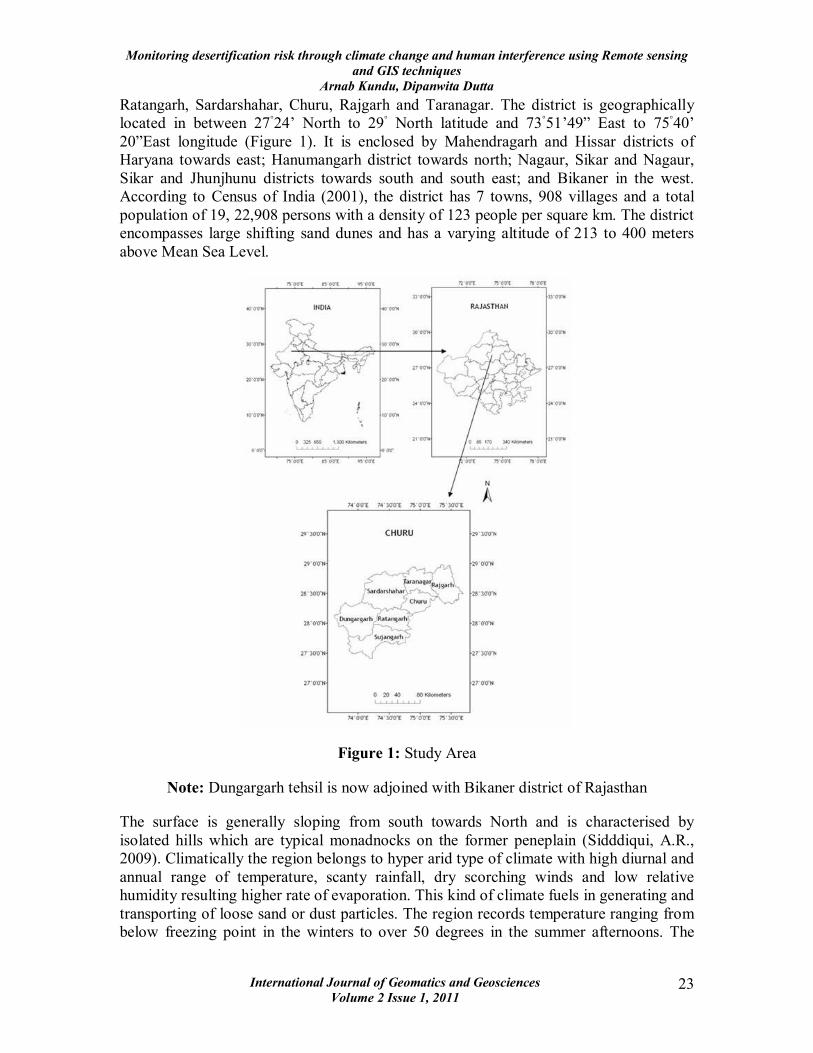
Ratangarh, Sardarshahar, Churu, Rajgarh and Taranagar. The district is geographically located in between 27 24’ North to 29 North latitude and 73 51’49” East to 75 40’ 20”East longitude (Figure 1). It is enclosed by Mahendragarh and Hissar districts of Haryana towards east; Hanumangarh district towards north; Nagaur, Sikar and Nagaur, Sikar and Jhunjhunu districts towards south and south east; and Bikaner in the west. According to Census of India (2001), the district has 7 towns, 908 villages and a total population of 19, 22,908 persons with a density of 123 people per square km. The district encompasses large shifting sand dunes and has a varying altitude of 213 to 400 meters above Mean Sea Level.
Figure 1: Study Area
Note: Dungargarh tehsil is now adjoined with Bikaner district of Rajasthan
The surface is generally sloping from south towards North and is characterised by isolated hills which are typical monadnocks on the former peneplain (Sidddiqui, A.R., 2009). Climatically the region belongs to hyper arid type of climate with high diurnal and annual range of temperature, scanty rainfall, dry scorching winds and low relative humidity resulting higher rate of evaporation. This kind of climate fuels in generating and transporting of loose sand or dust particles. The region records temperature ranging from below freezing point in the winters to over 50 degrees in the summer afternoons. The

Monitoring desertification risk through climate change and human interference using Remote sensing and GIS techniques
Arnab Kundu, Dipanwita Dutta
International Journal of Geomatics and Geosciences Volume 2 Issue 1, 2011
24
pattern of rainfall varies spatially; it increases from West to East. The district is characterized by sandy to sandy loam calcareous type of soil which is coarse in texture, less structured with negligible amount of organic matter. As a result of it, the sub surface percolation rate of soil has become higher and the water holding capacity of the soil profiles have become low (Sidddiqui, A.R., 2009). The spatial pattern of vegetation shows a great influence of spatial pattern of precipitation over here. Though there is a poor vegetation cover, the area towards east is greener than west. Large areas are covered with thorny scrubs, grasses with isolated trees. The scarcity of vegetation covers is strengthening the Aeolian processes and making the sand dunes mobile. The economy of Churu is mainly based on agriculture and animal husbandry. The major crops are oilseeds, Wheat, Jowar (Sorghum), kharif pulses and bajra (pearl millet).
3. Materials and Method
3.1 NDVI Data
The NDVI is a good indicator of green biomass, leaf area index and pattern of production (Thinkable et al. 2004). The fundamental behind this index is that the internal mesophyll structure of healthy green leaves strongly reflects NIR radiation and leaf chlorophyll and other pigments absorb a large proportion of the red VIS radiation. This becomes reverse in case of unhealthy or water stressed vegetation. NDVI is calculated by the difference between reflectance in near infrared (NIR) and visible red (VIS) band of electromagnetic spectrum.
NDVI= (NIR−VIS) / (NIR+VIS) The NDVI value varies between 1.0 to +1.0. It ranges from 0.1 in deserts up to 0.8 in dense tropical rain forest. The Values between 0 and 0.1 denotes rocks and bare soil and less than 1 indicate iceclouds, waterclouds, and snow. The NDVI has been used for description of continental land cover, vegetation classification and vegetation phenology (Tucker et al. 1985, Tarpley et al. 1984). NDVI derived from Advance Very High Resolution Radiometer (AVHRR) onboard NOAA is much used for monitoring vegetation growth and health and assessing desertification (Prince and Justice, 1991; Tucker et al., 1991; Nicholson et al., 1998; Prince et al., 1998; Diouf and Lambin, 2001; Anyamba and Tucker, 2005; Olsson et al., 2005). NDVI is calculated from channel 1(visible) and channel 2(infrared) of AVHRR. In this study, fortnightly GIMMS NDVI from NOAA (AVHRR) has been used for a time period of 21 years (1983 – 2003). This data was collected from the National Oceanic and Atmospheric Administration (NOAA) satellite which holds the Advanced Very High Resolution Radiometer (AVHRR) sensor and primarily operated by USA. These sensors collect the global data on a daily basis for a multiplicity of land, ocean, and atmospheric applications. Besides these, it is also used to monitor forest fire, analysis of vegetation, weather forecasting, climatic condition, study of drought, measurement of global sea surface temperature and ocean related research. The NDVI is considered as a ‘greenness’ index in studies of dry land vegetation cover. It has found that in arid and semiarid regions, NDVI is well correlated with parameters such as leaf area index, Greenleaf, biomass, vegetation cover, etc. (Nicholson et al., 1998). In his study, Zhang (1999) also found a strong correlation (R 2 =0.73) between NOAA AVHRR NDVI and Vegetation cover.

Monitoring desertification risk through climate change and human interference using Remote sensing and GIS techniques
Arnab Kundu, Dipanwita Dutta
International Journal of Geomatics and Geosciences Volume 2 Issue 1, 2011
25
Table 1: Characteristics of NOAAAVHRR sensor Characteristics NOAAAVHRR Inclination of Orbit 98.922º Height above surface 851 Km Number of orbits/day 14.1
Times of coverage at equator 01:41 Descending 13:41 Ascending
Orbital Period 102 min Latitudinal Coverage 90 ºN90ºS Cycle Duration 1 Day Ground Coverage 2842 Km Field of View(FOV) ±55.4º Instantaneous Field of View(IFOV 1.391.51 mrad Ground Resolution (Nadir) 1.1 Km
Number of Channels
One Visible (0.50.7um) One Near Infrared (0.71.1um) One Middle Infrared Two Thermal Infrared
The NDVI data was freely downloaded from the University of Maryland Global Land Cover Facility Data Distribution Centre (http://www.glcf.umiacs.umd.edu/data/gimms/). The images were processed by the Global Inventory Modelling and Monitoring System (GIMMS) group at NASA’s Goddard Space Flight Centre. For this research, fortnightly NDVI data was gathered from already processed 15day NDVI composites using the maximum value compositing procedure to minimize effects of cloud contamination, varying solar zenith angles and surface topography (Holben, 1986). The Preprocessing of 15 day composite GIMMSNDVI (1983 – 2003) data was carried out through following steps:
1. Conversion from GEO tiff format to .img format
2. Layer Stacking 3. Reprojection
4. Scaling 5. Subset
The GIMMS NDVI data is available in GEOtiff format which were first converted into image format. Then this 15 day composite dataset of 21 years (19832003) has been stacked. Each stacked layer of all years encloses ten layers representing ten fortnights (JuneOctober) of growing season. These stacked layers were then reprojected into Albers Equal Area Projection with WGS 84 datum. This projection was chosen to keep the similar pixel size. The following projection parameters are given for Albers Equal Area Projection for India. These reprojected images were rescaled to retain the NDVI value ranging from +1 to 1 using the scale factor 0.001.
Monitoring desertification risk through climate change and human interference using Remote sensing and GIS techniques
Arnab Kundu, Dipanwita Dutta
International Journal of Geomatics and Geosciences Volume 2 Issue 1, 2011
26
Parameters used for Albers Equal Area Projection:
1. Spheroid Name: WGS 84
2. Datum Name: WGS 84 3. Latitude of 1st Standard Parallel: 12º N
4. Latitude of 2nd Standard Parallel: 28º N 5. Longitude of Central Meridian: 78º E
6. Latitude of origin of projection: 20º N 7. False Easting at central meridian: 2000000.0 mts.
8. False Northing at origin: 2000000.0 mts.
3.2 Rainfall Data
Longterm (19832003) monthly Rainfall data from India Meteorological Department (IMD) were used in this study. Monthly rainfall data of growing season (JuneOctober) were collected from different rain gauge stations scattered in and around of the Churu district. The rainfall of different months of growing season was then averaged for each rain gauge station to obtain the mean rainfall of growing season.
3.3 Methodology
The study was carried out aiming to a goal to identify areas undergoing climate induced desertification processes through remote sensing based indicator NDVI and climate based indicator rainfall. The data was processed to make it ready for further geostatistical analysis. After preprocessing of the AVHRRNDVI images (19832003), they were normalized for regression analysis. The normalization of multi temporal NDVI was executed using the following formula:
[(NDVIn*100) +100]
Then, all normalized NDVI images were stacked together. The fortnights of growing season (JuneOctober) have been taken into account in this study. After stacking, the fortnights of growing season were integrated through the following equation.
[15/2(NDVIt+2*NDVIt2+2*NDVIt3+…2*NDVItn)]
Here, NDVIt indicates NDVI of each fortnight of growing season.
On the other hand, mean rainfall of growing season of each rain gauge station was taken into account from the year 1983 to 2003. The latitude, longitude and mean rainfall of each rain gauge stations were copied to coordinate calculator through ERDAS Imagine 9.2 software for interpolation purpose. Then the x, y coordinates (input and output) were saved as .dat file. After that, it was imported as ASCII file of point coverage to make a

Monitoring desertification risk through climate change and human interference using Remote sensing and GIS techniques
Arnab Kundu, Dipanwita Dutta
International Journal of Geomatics and Geosciences Volume 2 Issue 1, 2011
27
vector map of coordinate system. After this, ArcGIS 9.3 was used to interpolate rainfall of all stations. The Inverse Distance Weighted (IDW) method with power 2 was used to make interpolation map of all years. Since this method assumes that things that are close to one another are more alike than those that are farther apart. Then all layers of rainfall have been stacked and then subset of the study area was generated.
After preparing the database for the analysis, the correlation coefficients were obtained from the regression analysis between integrated NDVI and mean rainfall. The analysis was done spatially or in pixel basis to show that how far NDVI of each pixel is dependent upon rainfall received by the area represented by each pixel. It was performed based on the logic that the NDVI and Net Primary Productivity of an area are strongly determined by the amount of rainfall received. The NPP values alone may not serve as an indicator of desertification without taking the rainfall into account (Prince et al., 1998). In arid and semiarid lands seasonal sums of multitemporal NDVI has found strongly correlated with vegetation production (Prince and Tucker, 1986; Prince, 1991; Nicholson and Farrar, 1994; Nicholson et al., 1998; Wessels et al., 2006). Also, multitemporal NDVI has been used by many researchers (Anyamba, Tucker, 2005, Herrmann et al., 2005) to find long term vegetation changes. Past researches denote that long term vegetation stress can be identified by long term NDVI data and thus it can be useful for monitoring desertification processes. For this reason, a time trend analysis was performed using the multitemporal integrated NDVI to observe the spatiotemporal pattern of vegetation condition of Churu district. The temporal trend of NDVI was computed for each pixel area using linear least square regression over the period 1983 to 2003. This technique represents a simple, yet robust, way to reveal longterm trends in a temporal sequence of data that departs from the short term annual fluctuations (Hellden, U., Tottrup, C., 2008). The regression and time trend analysis was performed through in built model maker tool of ERDAS IMAGINE 9.2 and ENVI 4.7 software. Intersection of time trend map of NDVI and correlation coefficient of rainfallNDVI used to quantify the areas under the process of desertification response to climate change.
4. Results and Discussion
Several previous researches have produced a strong positive relationship between NDVI and rainfall in dry regions all over the world. Although, response of vegetation to precipitation varies between geographical regions and vegetation types (Li, B. et al., 2002, Li, J. et al., 2004, Nicholson et al., 1994), most of the studies voted for precipitation as a strong indicator of vegetation. The spatial pattern of average growing season NDVI and rainfall over the period 19832003 has been illustrated in figure 2. The average growing season rainfall of past twenty one year’s varies between 200500 mm. The rainfall mainly occurs during monsoon and extends from July to September. The spatial pattern of rainfall shows that it is gradually declining from southeast to northwest. The average growing season NDVI of past twenty one year show more or less similar spatial pattern. It has also been decreased from southeast to northwest corresponding with pattern of rainfall in the region (figure 2).

Monitoring desertification risk through climate change and human interference using Remote sensing and GIS techniques
Arnab Kundu, Dipanwita Dutta
International Journal of Geomatics and Geosciences Volume 2 Issue 1, 2011
28
Figure 2: Mean Rainfall and NDVI (19832003)
The correlation between integrated NDVI and rainfall is illustrated in figure 3, revealing high correlation between the two parameters exists in the Northern part of the district whereas the South Eastern part surprisingly experiences a reverse condition. These two distinct cases say that the vegetation response to rainfall has become more pronounced in the Northern part of the district while there is less impact of rainfall on vegetation condition of South Eastern region of the district. The areas with significant positive correlation coefficient demark the climatic influence on vegetation condition whereas the areas with negative coefficient indicate intrusion of anthropological factors rather than climatic factors. The map of correlation coefficient clearly distinguishes two type of vegetation, one is influenced by climate and other is influenced by human.

Monitoring desertification risk through climate change and human interference using Remote sensing and GIS techniques
Arnab Kundu, Dipanwita Dutta
International Journal of Geomatics and Geosciences Volume 2 Issue 1, 2011
29
Figure 3: Correlation Coefficient (r) between integrated NDVI and Rainfall (left); NDVI Time Trend (right)
Alteration of vegetation cover can be happened both by climate change and anthropological activities. To identify the areas under desertification process, the time trend of growing season NDVI (19832003) was calculated for the district Churu, illustrated in figure 3 (right). The map displays two categories of NDVI trends: positive trends which are considered to represent improvement of vegetation cover and negative trends indicating a declining trend in vegetation cover. Strong negative trends of NDVI in some parts of the district suggest degradation of vegetation cover during the past two decades. On contrary, moderate to high positive trend is also notable over some areas indicating greening of those areas within last 21 years. Over the entire district, about 52.03% of all pixels experienced a moderate to high declining trends of NDVI while 13.28% of all pixels undergone an increasing trend of vegetation (figure 4).
About 34.69% area out of the whole district has a stable vegetation condition (figure 4). The long term degradation of vegetation as monitored by NDVI is an indicator of desertification (Hill, J., et al, 2008). It is noteworthy that the decreasing or increasing trend of NDVI as an indicator of desertification is a combined result of climate and anthropological activities. To detect the areas under climate induced desertification process, both coefficient map and time trend map were used. The areas of significant positive correlation between multi temporal NDVI and rainfall with decreasing trend of NDVI, indicates vegetation degradation response to climate change. Beside this, human induced desertification is being noticed in the areas of significant negative correlation between multi temporal NDVI and rainfall with decreasing trend of NDVI.

Monitoring desertification risk through climate change and human interference using Remote sensing and GIS techniques
Arnab Kundu, Dipanwita Dutta
International Journal of Geomatics and Geosciences Volume 2 Issue 1, 2011
30
Figure 4: Area wise distribution (%) of NDVI time trend (left); Measurement of area (%) affected by climate induced and human induced desertification (right)
It was found that about 64.54% of area under desertification is caused by climate induced processes and 35.46% area is undergone a human induced change of vegetation cover. The long term climate induced degradation of vegetation indicates a slow change in the pattern and distribution of rainfall. High evapotranspiration exceeding rainfall along with strong winds is lowering the soil moisture and making them dry while fine sand grains blowing from the Thar Desert slowly altering the texture of soil and declining the primary productivity. Besides this, increasing trend of population pressure also accelerating the problem of overgrazing and over ploughing which made the area vulnerable. The study shows, this area is gradually desertifying as a complex consequence of both climate and anthropogenic factors.
5. Conclusions
The results obtained from the study reveals that the NOAA AVHRR data can successfully monitor and identify areas under the several process of desertification response to climate change. The correlation between NDVI and rainfall is prominent in some areas of Churu which indicates the strong climatic influence on vegetation condition of those areas. Both of the indicators can be used in remote sensing information based model for evaluating desertification monitoring and estimation. The NDVI time trend clearly recognizes the areas with long term vegetation degradation indicating the ongoing desertification process. The study reveals that more than half of the district is undergone a declining trend of vegetation cover indicating the ongoing process of desertification. Within this, about 64.54% area is experiencing desertification due to climatic processes and 35.46% area is undergone human induced desertification processes. Also, this remote sensing based technique has become helpful to identify areas under the process of greening as an impact of anthropogenic effect. The declining trend in vegetation explicitly supports the information on encroachment of the Thar Desert. The study reveals that the global availability of coarsescale, multi temporal data archives of NOAAAVHRR have great potential to answer the questions arrived from long term vegetation changes.
Acknowledgement
Monitoring desertification risk through climate change and human interference using Remote sensing and GIS techniques
Arnab Kundu, Dipanwita Dutta
International Journal of Geomatics and Geosciences Volume 2 Issue 1, 2011
31
The authors express their sincere gratitude and utmost respect to Dr. N. R. Patel, Scientist, Agriculture and Soils Division, Indian Institute of Remote Sensing, Dept. of Space, Indian Space Research Organisation, Dehradun, Uttarakhand, India for his expert direction and support.
6. References
1. Adger, W. N., Benjaminsen, T. A., Brown and K., Svarstad, (H. Eds)., (2000), “Advancing a Political Ecology of Global Environmental Discourse”, Centre of Social and Economic Research on the Global Environment, University of East Anglia, London.
2. Anyamba, A, and Tucker, C. J., (2005), “Analysis of Sahelian vegetation dynamics using NOAAAVHRR NDVI data from 19812003”, Journal of Arid Environments, 63, pp 596614.
3. Diouf, A. and Lambin, E., (2001), “Monitoring landcover changes in semi arid regions: Remote Sensing data and field observations in the Ferlo, Senegal”, Journal of Arid Environments, 48, pp 129–148.
4. Di, L., (2003), “Recent Progress on Remote Sensing Monitoring of Desertification”, Annals of Arid Zone, 42, p 3.
5. Hanan, N. P., Prince, S. D., and Hiernaux, P. H. Y., (1991), “Spectral modelling of multicomponent landscapes in the Sahel”, International Journal of Remote Sensing, 12, pp 1243−1258.
6. Helldén, U. and Tottrup, C., (2008), “Regional desertification: A global synthesis, Global and Planetary Change”, 64(34), pp 169176.
7. Herrmann, S. M., Anyamba, A. and Tucker, C. J., (2005), “Recent trends in vegetation dynamics in the African Sahel and their relationship to climate”, Global Environmental Change, 15, pp 394–404.
8. Hill, J., Stellmes, M., Udelhoven, Th., Röder, A. and Sommer, S., (2008), “Mediterranean desertification and land degradation Mapping related land use change syndromes based on satellite observations”, Global and Planetary Change, 64, pp 146–157.
9. Holben, B. N., (1986), “Characteristics of maximumvalue composite images from temporal AVHRR data”, International Journal of Remote Sensing, 7, pp 14171434.
10. http://www.glcf.umiacs.umd.edu/data/gimms/
11. Huete, A. R., and Liu, H., (1994), “An error and sensitivity analysis of the atmospheric and soilcorrecting variants of the NDVI for the MODISEOS”, IEEE Transactions on Geoscience and Remote Sensing, 32(4), pp 897905.
Monitoring desertification risk through climate change and human interference using Remote sensing and GIS techniques
Arnab Kundu, Dipanwita Dutta
International Journal of Geomatics and Geosciences Volume 2 Issue 1, 2011
32
12. Li B., Tao, S. and Dawson R. W., (2002), “Relation between AVHRR NDVI and ecoclimatic parameters in China”, International Journal of Remote Sensing, 23, pp 989999.
13. Li J., Lewis J., Rowland J., Tappan G. and Tieszen, L., (2004), “Evaluation of land performance in Senegal using multitemporal NDVI and rainfall series”, Journal of Arid Environments, 59, pp 463480.
14. Leprieur, C., Kerr, Y. H., Mastorchio, S. and Meunier, J. C., (2000), “Monitoring vegetation cover across semiarid regions: Comparison of remote observations from various scales”, International Journal of Remote Sensing, 21(2), pp 281–300.
15. Nicholson, S. E., Farrar and T. J., (1994), “The influence of soil type on the relationships between NDVI”, rainfall and soil moisture in semiarid Botswana. Part I. NDVI response to rainfall, Remote Sensing of Environment, 50, pp 107–120.
16. Nicholson, S. E., Tucker, C. J., Ba, M. B., (1998), “Desertification, drought, and surface vegetation: an example from the West African Sahel”, Bulletin of the American Meteorological Society, 79, pp 1–15.
17. Olsson, L., Eklundh, L. and Ardo, J., (2005), “A recent greening of the Sahel – trends, patterns and potential causes”, Journal of Arid Environments, 63, pp 556566.
18. Prince, S. D., (1991), “A model of regional primary production for use with coarseresolution satellite data”, Internatioal Journal of Remote Sensing, 12, pp 1313–1330.
19. Prince, S. D. and Justice, C. O., (1991), “Coarse resolution remote sensing in the Sahelian environment”, International Journal of Remote Sensing, 12, pp 1133–1421.
20. Prince, S. D. and Tucker, C. J., (1986), “Satellite remote sensing of rangelands in Botswana II: NOAA AVHRR and herbaceous vegetation”, International Journal of Remote Sensing, 7, pp 555–1570.
21. Prince, S. D., Brown de Colstoun and E., Kravitz, L. L., (1998), “Evidence from rainuse efficiencies does not indicate extensive Sahelian desertification”, Global Change Biology, 4, pp 359–374.
22. Rouse, J. W., Haas, R. H., Schell, J. A. and Deering, D. W., (1973), “Monitoring vegetation systems in the Great Plains with ERTS”, Third ERTS Symposium, NASA SP351 I: pp 309317.

Monitoring desertification risk through climate change and human interference using Remote sensing and GIS techniques
Arnab Kundu, Dipanwita Dutta
International Journal of Geomatics and Geosciences Volume 2 Issue 1, 2011
33
23. Rubio, J. L. and Bochet, E., (1998), “Desertification indicators as diagnosis criteria for desertification risk assessment in Europe”, Journal of Arid Environments, 39(2), pp 113120.
24. Siddiqui, A. R., (2009), “Integrating Environmental Indicators to diagnose desertification risk zone using geospatial approach: A case study of Churu district in arid lands of western Rajasthan”, ITC, University of Twente, Post Graduate Diploma Thesis.
25. Sinha, R. K., Bhatia, S. and Vishnoi, R., (2000), “Desertification control and rangeland management in the Thar desert of India”, Indira Gandhi Centre for Human Ecology, Environment and Population Studies, Rajasthan University, Jaipur302004 (INDIA).
26. Tarpley, J. P., Schneider, S. R. and Money, R. L., (1984), “Global vegetation indices from NOAA7 meteorological satellite” Journal of Climate and Applied Meteorology, 23, pp 491–494.
27. Thenkabail, P. S. and M. S. D. N. Gamage., (2004), “The Use of Remote Sensing Data for Drought Assessment and Monitoring in Southwest Asia”, Colombo, Srilanka, International Water Management Institute: pp 123.
28. Tucker, C. J., Townshend, J. R. G. and Goff, T. E., (1985), “African land cover classification using satellite data”, Science, 227, pp 369–375.
29. Tucker, C. J., (1979), “Red and photographic infrared linear combinations for monitoring vegetation”, Remote Sensing of Environment, 8(2), pp 127–150.
30. Tucker, C. J., Dregne, H.E. and Newcombe, W.W., (1991), “Expansion and contraction of the Sahara Desert from 1980–1990”, Science, 253, pp 299–301.
31. Wessels, K. J., Prince, S. D., Zambatis, N., MacFadyen, S., Frost, P. E. and VanZyl, D., (2006), “Relationship between herbaceous biomass and 1km2 Advanced Very High Resolution Radiometer (AVHRR) NDVI in Kruger National Park”, South Africa, International Journal of Remote Sensing, 27, pp 951–973.
32. Zhang, Y., (1999), “A new merging method and its spectral and spatial effects”, International Journal of Remote Sensing, 29, pp 20032014.
Related Documents