Environ. Sci. Technol. 1994, 28, 850-858 Monitoring Aromatic Surfactants and Their Biodegradation Intermediates in Raw and Treated Sewages by Solid-Phase Extraction and Liquid Chromatography Antonio Di Corcla' and Roberto Samperi Dipartimento di Chimica, Universith La Sapienza di Roma, Piazza Aldo Moro 5, 00185 Roma, Italy Antonio Marcominl Dipartimento di Scienze Ambientali, Universith di Venezia, Calle Larga S. Marta 2137,1-30123 Venezla, Italy On the basis of solid-phase extraction, a simple procedure for determining simultaneously two aromatic surfactant classes, i.e., linear alkylbenzene sulfonates (LAS) and nonylphenol polyethoxylates (NPEO), as well as their biodegradation intermediates in raw and treated sewages is presented. This procedure involved passing 10 and 100 mL of an influent and effluent water sample, respectively, through a 1-g graphitized carbon black (GCB) extraction cartridge. By exploitingthe presence of positivelycharged active centers on the GCB surface, we succeeded in fractionating the complex mixture of the analytes con- sidered by differential elution. The first fraction contained NPEO and nonylphenol (NP). The second fraction contained the carboxylated biotransformation products of NPEO, i.e., nonylphenoxy carboxylic acids (NPEC). Finally, the last fraction contained LAS and their me- tabolites, Le., carboxylic sulfophenyl acids (SPC). By suitably adjusting the chromatographic conditions, any group of analytes was subfractionated and quantified by liquid chromatography with fluorometric detection. Re- coveries of all compounds of interest ranged between 89 % and 99%. This procedure was empolyed for 1 year to assess monthly the concentrations of the analytes con- sidered in raw and treated sewages of a mechanical- biological treatment plant. Introduction The two aromatic surfactants linear alkylbenzene sul- fonate (LAS) and nonylphenol polyethoxylate (NPEO) (Figure 11, have been extensivelystudied in the last decade, and their biodegradation behavior was characterized in a wide variety of laboratory (1-6) and field (7-1 7) conditions. The anionic LAS was shown to biodegrade quickly under aerobicconditions. LAS biodegradation intermediates are mono- and dicarboxylic sulfophenyl acids (SPC) that are formed by w-oxidation of the alkyl chain terminal carbon followed by successive @-oxidation (2). Under aerobic conditions, hydrolytic shortening of the polyethoxy chain of NPEO is generally favored, leading to the formation of lower oligomers, such as those having two (NPBEO) and one (NPlEO) ethoxy units (4), and ultimately to the completely de-ethoxylated product, i.e., nonylphenol (NP) (18). Moreover, under an aerobic situation, the biodeg- radation experiments (6) and monitoring of treated sewages (19) showed that NPBEO and NPlEO can be subsequently oxidized to nonylphenoxy carboxylic acids * To whom correspondence should be addressed. 850 Environ. Sci. Technol., Vol. 28, No. 5, 1994 Llnear Alkylbenrene Sulphonates (US) Nonylphenol Polyethoxylates (NPEO) @? so; example of 4-C,, IAS "n = 1,ZO Sulphophenyl Carboxylates(SPC) Nonylphenoxy Carboxylates (NPEC) I_ NPlEC, n=O example of SP3C, NPZEC, n=l so3 Flgure 1. Structuresand acronyms of linear alkylbenzene sulfonates (LAS), sulfophenyl carboxylates (SPC), nonylphenol polyethoxylates (NPEO), and nonylphenol polyethoxycarboxylates. (NPBECandNPlEC, respectively). Only traces of NP3EC were detected by Ahel et al. (20) on analyzing effluents from various treatment plants in the area of Ziirich. A comprehensive final assessment of the environmental impact of the two surfactants and their metabolites mentioned above can be greatly encouraged by the development of selective, simple, and reliable analytical procedures for their simultaneous determination in en- vironmental samples. Barber et al. (21) reported on the simultaneous determination of these compounds by employing the gas chromatography/mass spectrometry (GUMS) technique. The feasibility of separating LAS and NPEO by reversed-phase (RP)liquid chromatography (LC) with octyl- (C-8) or octadecyl-bonded silica (C-18) columns was shown (22, 23). In their pioneering work, Swisher et al. (24) showed that SPC mixtures could be successfully characterized by direct injection into a LC column. NPEC were analyzed by normal-phase HPLC after derivatization to methyl esters (20). Very recently, we assessed the feasibility of determining simultaneously LAS, NPEO, and their metabolites in water in a simple and rapid way (25). The analytes were extracted by a C-18 solid-phase extraction (SPE) cartridge, and the final extract was chromatographed by RP-LC with fluorometric detection. Graphitized carbon black (GCB),commercially referred to as Carbopackor Carbograph, is a well-known adsorbent extensively used for the SPE of a variety of analytes of environmental interest (26-30). As previously shown (30, 31), the extraction of complex mixtures from aqueous samples and their class fractionation by stepwise desorp- 0013-936X/94/09280850$04.50/0 0 1994 American Chemical Society

Welcome message from author
This document is posted to help you gain knowledge. Please leave a comment to let me know what you think about it! Share it to your friends and learn new things together.
Transcript

Environ. Sci. Technol. 1994, 28, 850-858
Monitoring Aromatic Surfactants and Their Biodegradation Intermediates in Raw and Treated Sewages by Solid-Phase Extraction and Liquid Chromatography
Antonio Di Corcla' and Roberto Samperi
Dipartimento di Chimica, Universith La Sapienza di Roma, Piazza Aldo Moro 5, 00185 Roma, Italy
Antonio Marcominl
Dipartimento di Scienze Ambientali, Universith di Venezia, Calle Larga S. Marta 2137, 1-30123 Venezla, Italy
On the basis of solid-phase extraction, a simple procedure for determining simultaneously two aromatic surfactant classes, i.e., linear alkylbenzene sulfonates (LAS) and nonylphenol polyethoxylates (NPEO), as well as their biodegradation intermediates in raw and treated sewages is presented. This procedure involved passing 10 and 100 mL of an influent and effluent water sample, respectively, through a 1-g graphitized carbon black (GCB) extraction cartridge. By exploiting the presence of positively charged active centers on the GCB surface, we succeeded in fractionating the complex mixture of the analytes con- sidered by differential elution. The first fraction contained NPEO and nonylphenol (NP). The second fraction contained the carboxylated biotransformation products of NPEO, i.e., nonylphenoxy carboxylic acids (NPEC). Finally, the last fraction contained LAS and their me- tabolites, Le., carboxylic sulfophenyl acids (SPC). By suitably adjusting the chromatographic conditions, any group of analytes was subfractionated and quantified by liquid chromatography with fluorometric detection. Re- coveries of all compounds of interest ranged between 89 % and 99%. This procedure was empolyed for 1 year to assess monthly the concentrations of the analytes con- sidered in raw and treated sewages of a mechanical- biological treatment plant.
Introduction
The two aromatic surfactants linear alkylbenzene sul- fonate (LAS) and nonylphenol polyethoxylate (NPEO) (Figure 11, have been extensively studied in the last decade, and their biodegradation behavior was characterized in a wide variety of laboratory (1-6) and field (7-1 7) conditions. The anionic LAS was shown to biodegrade quickly under aerobic conditions. LAS biodegradation intermediates are mono- and dicarboxylic sulfophenyl acids (SPC) that are formed by w-oxidation of the alkyl chain terminal carbon followed by successive @-oxidation (2). Under aerobic conditions, hydrolytic shortening of the polyethoxy chain of NPEO is generally favored, leading to the formation of lower oligomers, such as those having two (NPBEO) and one (NPlEO) ethoxy units ( 4 ) , and ultimately to the completely de-ethoxylated product, i.e., nonylphenol (NP) (18). Moreover, under an aerobic situation, the biodeg- radation experiments (6) and monitoring of treated sewages (19) showed that NPBEO and NPlEO can be subsequently oxidized to nonylphenoxy carboxylic acids
* To whom correspondence should be addressed.
850 Environ. Sci. Technol., Vol. 28, No. 5, 1994
Llnear Alkylbenrene Sulphonates (US) Nonylphenol Polyethoxylates (NPEO)
@? so;
example of 4-C,, I A S "n = 1,ZO
Sulphophenyl Carboxylates (SPC) Nonylphenoxy Carboxylates (NPEC)
I _
NPlEC, n=O
example of SP3C, NPZEC, n=l
so3
Flgure 1. Structures and acronyms of linear alkylbenzene sulfonates (LAS), sulfophenyl carboxylates (SPC), nonylphenol polyethoxylates (NPEO), and nonylphenol polyethoxycarboxylates.
(NPBEC andNPlEC, respectively). Only traces of NP3EC were detected by Ahel et al. (20) on analyzing effluents from various treatment plants in the area of Ziirich.
A comprehensive final assessment of the environmental impact of the two surfactants and their metabolites mentioned above can be greatly encouraged by the development of selective, simple, and reliable analytical procedures for their simultaneous determination in en- vironmental samples. Barber et al. (21) reported on the simultaneous determination of these compounds by employing the gas chromatography/mass spectrometry (GUMS) technique. The feasibility of separating LAS and NPEO by reversed-phase (RP) liquid chromatography (LC) with octyl- (C-8) or octadecyl-bonded silica (C-18) columns was shown (22, 23). In their pioneering work, Swisher et al. (24) showed that SPC mixtures could be successfully characterized by direct injection into a LC column. NPEC were analyzed by normal-phase HPLC after derivatization to methyl esters (20). Very recently, we assessed the feasibility of determining simultaneously LAS, NPEO, and their metabolites in water in a simple and rapid way (25). The analytes were extracted by a C-18 solid-phase extraction (SPE) cartridge, and the final extract was chromatographed by RP-LC with fluorometric detection.
Graphitized carbon black (GCB), commercially referred to as Carbopackor Carbograph, is a well-known adsorbent extensively used for the SPE of a variety of analytes of environmental interest (26-30). As previously shown (30, 31), the extraction of complex mixtures from aqueous samples and their class fractionation by stepwise desorp-
0013-936X/94/09280850$04.50/0 0 1994 American Chemical Society

tion can be rapidly and easily achieved by the use of a single GCB cartridge.
This work had two purposes. The first was to improve the analytical procedure cited above for determining simultaneously LAS, NPEO, and their biodegradation intermediates in aqueous samples. The second objective was to assess the concentrations of the analytes in raw and treated sewages as well as the distribution patterns of the biodegradation products of the two classes of surfactants.
Experimental Section
Reagents and Chemicals. The two commercial sur- factants Marlon A and Marlophen 810 were supplied by Chemische Werke Huls AG, Marl, Germany. Marlon A is a Clo-C13 LAS mixture. The exact percentage weight of each LAS homologue was 12.876, 41.876, 36.176, and 9.3%, respectively, for c10-c13 LAS (29). C9 LAS was synthesized by direct sulfonation of nonylbenzene at 70 OC (Fluka, AG, Bucks, Switzerland) (25). Marlophen 810 contains NPEO chain isomers and oligomers with an average of 11 and a range of 1-18 ethoxy units. Imbentin- N/7A, a mixture of 4-nonylphenol and mono- and di- ethoxylates, containing also small amounts of nonylphenol triethoxylate, was received from W. Kolb AG, Hedingen Switzerland. Pure Clz DATS was kindly supplied by L. Cavalli (Enichem Augusta Industriale). Some authentic biodegradation products of LAS and NPEO were syn- thesized and characterized according to procedures pre- viously reported (25). They are as follows: sulfopheny- lacetic acid (SP2Cz); sulfophenyl-3-propionic acid (SP3C3); sulfophenyl-2-butyric acid (SP2C4); sulfophenyl-3-butyric acid (SP3C4); sulfophenyl-4-butyric acid (SP4C4); sul- fophenyl-&valeric acid (SP5Cs); sulfophenyl-2-malonic acid (SP2DC3); sulfophenyl-3-glutaric acid (SP3DC6); nonylphenoxyacetic acid (NPlEC); nonylphenoxyethoxy- acetic acid (NPPEC); and nonylphenoxydiethoxy acid (NPSEC). A mixture of ring and chain isomers of nonylphenol was supplied by Aldrich Chemical Co. (Mil- waukee, WI). Stock solutions (1 g/L) of the compounds and mixtures of the compounds reported above were prepared. Various working standard solutions were also prepared by appropriately mixing the various analytes. The compositions and the concentrations (reported in parentheses) of these solutions were as follows: solution 1, Marlophen 810 (100 mg/L) and NP (10 mg/L); solution 2, NPlEC and NP2EC (20 mg/L each); and solution 3, Marlon A (100 mg/L), CQ LAS (5 mg/L), and each individual synthesized SPC (20 mg/L).
Trifluoroacetic acid (TFA), formic acid, tetraethylam- monium chloride (TEACl), and tetramethylammonium hydroxide-5H20 (TMAOH) were from Aldrich. For LC, distilled water was further purified by the Elgastat UHQPS apparatus (Elga, Buchs, U.K.). Methanol of chromato- graphic grade, labeled as “Chromasolv”, was from Riedel de Haen, Selze, Germany. All other solvents were of reagent grade and were used as supplied.
The eluant systems utilized for the stepwise desorption of the analytes from the GCB surface were as follows: eluant A, methylene chloride/methanol(7030, v/v); eluant B, 25 mmol/L of formic acid in methylene chloride/ methanol (90:10, v/v); eluant C, 10 mmol/L of TMAOH in methylene chloride/methanol(90:10, v/v). The eluant phases were prepared daily and stored at 4 OC when unused.
GCB (120-400 mesh size) and the other materials used for preparing SPE cartridges were supplied by Alltech
Associates, Deerfield, IL. The extraction cartridge was prepared by packing 1 g of GCB in a polypropylene tube (6.7 x 1.3 cm i.d.) and placing polyethylene frits above and below the sorbent bed. To avoid crushing the GCB particles, which results in a decrease in the permeability of the cartridge, the upper frit was placed gently on the sorbent bed. The trap was fitted into a side-arm filtering flask, and liquids were forced to pass through the cartridge by vacuum from a water pump.
Before processing water samples, the cartridge was washed sequentially with 7 mL of eluant C, 3 mL of methanol, and 30 mL of distilled water acidified with HC1 (PH 2).
Sample Collection. Over 1 year, influent and effluent waters were collected monthly in glass bottles as 24-h composite samples from one mechanical-biological sewage treatment plant in the area of Rome. Samples were preserved in 1 76 (v/v) formalin. If not assayed within 1-2 days, samples were stored at 4 “C.
Sample Preparation. Before extraction, water samples were vigorously shaken to ensure adequate mixing and suspension of particulate material. Immediately after that, 10 and 100 mL of influent and effluent water samples respectively were taken, and the sewage effluent samples were acidified to pH = 3 with concentrated HC1. This operation served to increase the retention volumes of the dicarboxylated forms of SPC on the GCB cartridge. For recovery studies, known volumes of the composite working standard solutions of surfactants and their intermediates were added to water samples. After the samples were spiked, the analytes were allowed to equilibrate between water and the suspended material for a couple of hours. The analytes were extracted by passing the sample through the GCB cartridge at flow rates of about 20-30 mL/min with the aid of vacuum. A sample of 10-15 mL of distilled water, which was used to wash the reservoir containing the sample, was then passed through the trap. An additional 7 mL of water was applied directly to the top of the cartridge. Water remaining in the cartridge was partially removed by drawing room air through the cartridge for 1 min. Residual water was eliminated by slowly passing through the trap 2 mL of methanol. After air-drying the trap, a conical-bottom glass vial (-1.4 cm id.) was placed below the cartridge, and 7 mL of eluant A was percolated at 4-5 mL/min through the sorbent bed for desorbing NPEO and NP. The last drops of eluant A were collected by decreasing the pressure in the flask. This operation was repeated when collecting the other two fractions. After suitably regulating the pressure, the fraction containing the weakly acidic analytes, i.e., the carboxylated forms of NPEO, was eluted by 7 mL of eluant B and collected in a second vial. Finally, LAS and their related SPC intermediates were eluted from the cartridge with 7 mL of eluant C.
Before solvent removal, the basic extract C containing LAS and SPC was neutralized by adding 120 pL of formic acid (1 mol/L) in acetonitrile. This operation was done in order to avoid partial esterification of the carboxylic groups of the SPC by methanol in a basic solution. Extract B containing NPEC and extract C containing LAS and SPC were dried in a water bath at 30 OC under a nitrogen stream. Extract A containing NPEO and NP was con- centrated to an approximate volume of 200 pL. Some evaporative losses of NP (nonylphenol) were observed by concentrating the extract at lower volumes. After being
Environ. Scl. Technol., Vol. 28, No. 5, 1994 851

dried, the residue of extract B was reconstituted with 200 pL of a water/methanol mixture (35/65, v/v) containing a phosphate buffer (10 mmol/L, pH 6.9) and TEACl (10 mmol/L). A 50-pL sample of this solution was injected into the LC apparatus. A total of 200 pL of a water/ methanol mixture (50/50, v/v) acidified with TFA (0.2 %) was used for reconstituting the residue of extract C, and 20 pL of this solution was analyzed by LC. Finally, 50 rL of the final extract A was injected into the LC column after measuring exactly its volume. LC Analysis. Liquid chromatography was carried out
with a Varian (Walnut Creek, CA) Model 9010 ternary pump chromatograph equipped with a Rheodyne Model 7125 injector having a 50-pL loop and with a fluorometric Model 650-10-s (Perkin-Elmer Corp., Norwalk, CT) detector. A 25 cm X 4.6 mm i.d. column filled with 5-pm particlesize, Csreverse-phase packing (Supelco) was used. Solvent A was water with 0.2% (v/v) TFA. Solvent B was phosphate buffer (1 mmol/L, pH 6.5) with TEACI, 10 mmol/L. Solvent C was methanol. For separating LAS and their related biodegradation product8 (SPC), the initial mobile phase composition was 90% solvent A and 10% solvent C. This was programmed linearly to 80% after 50 min. Whenanalyzing LAS ininfluentsoftreatment plants, theanalytes werechromatographed isocraticallywith76% solvent C. NPEO and NP were eluted with 23% solvent B and 77% solvent C. Finally, the NPEO metabolites (NPEC) were fractionated by 65% solvent C and 35% solvent B. When the mobile phase used for subfraction- ating NPEC was replaced with that selected for chro- matographing LAS and SPC,or viceversa,an equilibration time of more than 30 min was required to obtain reproducible chromatographic conditions. In order to save time, the three fractions were chromatographed in the following order: fraction C, followed by fraction A, and lastly, fraction B.
In all cases, the flow rates of the mobile phases were 1.5 mL/min. The fluorometric detector was set a t an exci- tation wavelength of 225 nm (10-nm slit width) and an emission wavelength of 295 nm (15-nm slit width).
Quantitation. Peak area measurements were carried out by the use of a Model 1020 PE Nelson integrator (Perkin-Elmer). The concentrations in unspiked and spiked samples of those analytes for which standards were available were calculated by external calibration. The quantitation of the larger types of both SPC and NPEC, for which standards were not available, was carried out as described below. The responseofthefluorometricdetector was linearly related to injected amounts of every analyte up to 10 pg.
Results and Discussion
Analyte Group Fractionation. The GCB material has on its surface pcaitively charged oxygen complexes able to bind anions via electrostatic forces. The surface concentration of these singular adsorption sites was reportedto be76nequiv/m2 (32). Althoughfewinnumber, the presence of these active centers enables GCB to act as both an anion exchanger and a nonspecific adsorbent. This peculiarity is well-illustrated in Figure 2, where the separation of some selected analytes representative of each class of surfactants and related degradation produds is shown. In this experiment, the surfactants and their intermediates were adsorbed onto the GCB surface from 100 mL of a tap water sample.
832 Envhon. Scl. Tednol.. Vd. 28, No. 5. 1994
BO
50
% 40
30
20
10
"
R.cw*r l
2 4 6 8 10 12 14 16 18
Elvtlon "OIYnu In11
Flgure 2. &oup wpratbn of LAS. NPEO, and their biointarmedlates by the GCB extraction cartrEge. The compositions of the Wee eluant systems are reported under the Experimental Sectlon.
Neutral compounds, such as NPEO, were eluted from the extraction cartridge by passing through it a neutral solvent mixture (eluant phase A). This mixture was also able to elute NP, which is a very weakly acidic compound. In a recent study (32), we observed that a complete hase- neutral/acid fractionation could be achieved by a GCB column, provided the acidic compounds have a pK. lower than 7. In accordance with the behavior shown by conventional anion exchangers (33), complete desorption of weakly acidic compounds, such as NPEC, was achieved by moderately acidifying a suitable eluant organic solvent mixture, while the more acidic LAS and SPC still remained adsorbed onto the GCB surface. These latter compounds were completely removed from the adsorbent by adding to the solvent mixture a more effective displacing agent, such as TMAOH (32).
By this procedure, we measured that the individual concentrations of each SPC and NPEC species in sewage influents were very close to the detection limit of this method. Moreover, the analytical LC column procedure was able to separate LAS from NPEO. Nevertheless, we maintained the same extraction and purification scheme as for the effluent water samples. Thus, NPEO and LAS were collected in two separate fractions and separately quantified by LC, while the intermediate fraction con- taining weakly acidic species was discharged. Again, this was done in order to decrease the possibility of interfer- ences with the analysis of the two surfactant classes by unknown compounds.
Chromatography. In our previous work (B) , aCrLC column was selected for separating a LAS mixture. This column offers the advantage over the commonly used Cta one in that all the positional isomers of each LAS homologue are eluted as a single peak. In this situation, the interpretation and the quantitation of the chromato- grams are facilitated. Unfortunately, when chromato- graphing SPC, this favorable condition was not encoun- tered. In fact, by both using the ion-pair (IP) and the ion-suppression (IS) LC techniques, we observed that the three synthesized isomers of the sulfophenylhutyric acid (SPCd were eluted as three distinct peaks. In both cases, these three compounds were eluted with retention times that increase as the attached benzene ring approaches the carboxylic group. In terms of retention and peak sharp- ness, LAS and SPC can be positively chromatographed by both the IP and the IS techniques. As shown elsewhere (%), the elution order of SPC by the latter technique follows more strictly that of decreasing polarity of the eluates. This feature of the IS technique can be advan-

I I I I I I I I I I 1
.,.e. ... C, ... 5.
... DS.
..*e, ..IC. I , ,115. ... C ,
I I I I I I I L ,lo ,I, 2 0 2s 30 2s 10 1- 50 , ,me lrnl"1
Flgure 3. LC chromatograms of SPC derived from both LAS and DATS obtained by injecting extract C (see the Experimental Section) of (A) an aerobic bioassay sampies:biotransformation products of C, ,-LAS (upper), C12-LAS (middle), and a Cl0-Cl3-LAS mixture (lower); (6) a sewage effluent sample, and (C) an aerobic bioassay sample containing C12-DATS.
tageously exploited for tentatively assigning peaks of a complex chromatogram to those SPC for which authentic standards are unavailable. For this reason, we chose the IS technique for the subfractionation of SPC. In Figure 3A, the chromatograms for authentic SPC are shown, while a typical chromatogram obtained from analyzing an extract of a treated sewage sample containing SPC and residual LAS is presented in Figure 3B. The former chromatograms were obtained by injecting extracts relative to aqueous solutions where SPC were generated by an activated sludge inoculum. These laboratory experiments were conducted by following a procedure reported elsewhere (34). The identification and quantification of the LAS metabolites formed by the aerobic bioassays were carried out by GC/ MS according to a method developed by Trehy et al. (35). On this basis and considering the elution order of the synthesized positional isomers of SPC4 on the LC column, peaks for the other in vitro generated SPC were individ- uated on the LC chromatogram. As can be seen, the fractionation of the SPC-containing extract of the treated sewage produced a large number of peaks that only in part could be assigned to LAS intermediates. Dialkyltetralin sulfonates and dialkylindane sulfonate (DATS) are ali- cyclic analogs of LAS present in LAS formulations in the range from 0.4% to 14% (36). Field et al. (16) found that the concentration of the DATS intermediates in a treated sewage was comparable to that of LAS ones. To evaluate whether unidentified sulfocarboxy compounds leaving the
I
I
n B
I I 1 I i 1
YP2.C
NP1.C A A
wsmc
r I 1 I 1 1 0 II 10 10 LO 2.
Ilmo lmlnl
Figure 4. LC chromatograms obtained by Injecting extract B (see the Experimental Section) of (A) a synthesized NPlEC-NPBEC mixture, (8) an effluent sample poor in NP>BEC, and (C) an effluent sample rich in NP>3EC.
Envlron. Scl. Technol., Vol. 28, No. 5, 1994 859
367.2 79,955
. . . . . . . . . . . . . . i 41 1.2 71,055
" . . . . . . . . . . . . . . . . . . . . . . . . . . . . . - 1
455.2 112,470
. . . . . . . . . . . . . . . . . . . . . . .
499.2 148,480
543.2 179,640
100-
50-
. . & . . . . . . . . . . . . . . , 204,815 587.2
100-
50-
631.2 211,190
100-
50 - 0 . - . . . . . . . . . . . . . . . . . . . . . . . . . . . .
675.2 191,245
100-
50-
0- - I . - . . . . . . . . . . . . . . . . . . . . . . . . . . d
0.0 5.0 10.0 15.0 20.0 25.0 30.0 1 165 331 495 51 7 51 7 51 7
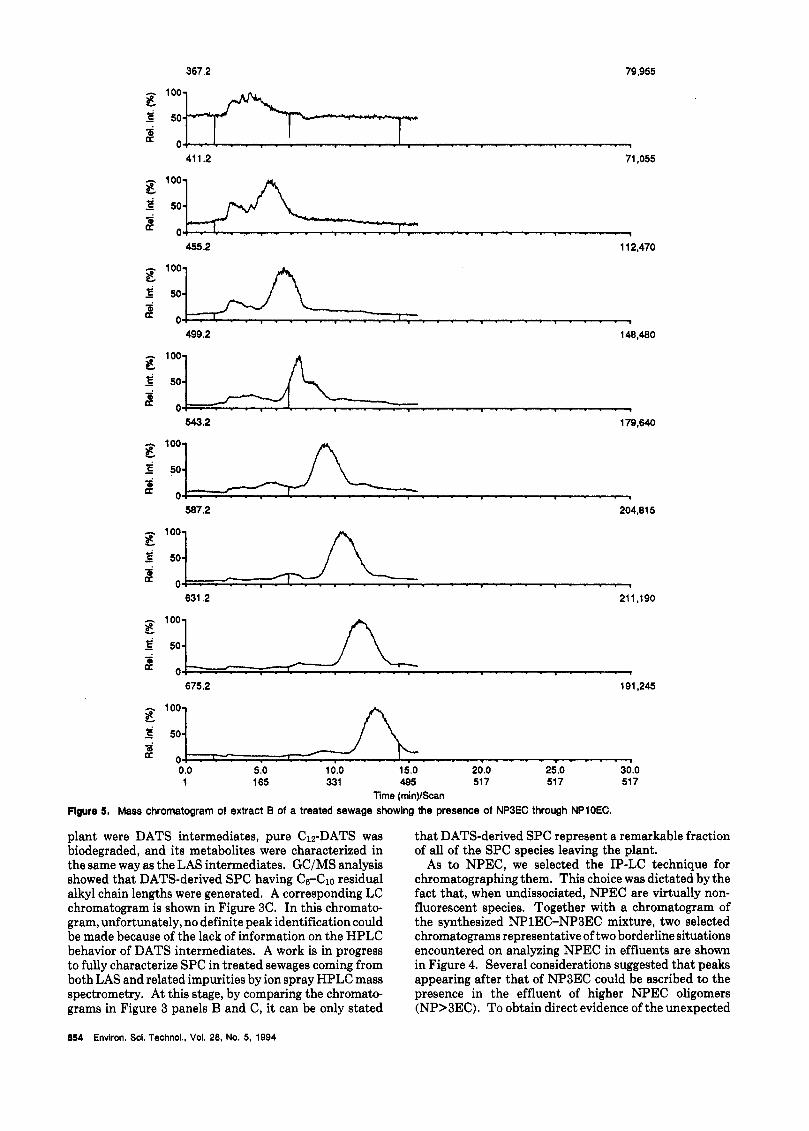
Time (rnin)/Scan Flgure 5. Mass chromatogram of extract B of a treated sewage showing the presence of NP3EC through NPlOEC.
plant were DATS intermediates, pure C12-DATS was biodegraded, and its metabolites were characterized in the same way as the LAS intermediates. GC/MS analysis showed that DATS-derived SPC having Ce-Clo residual alkyl chain lengths were generated. A corresponding LC chromatogram is shown in Figure 3C. In this chromato- gram, unfortunately, no definite peak identification could be made because of the lack of information on the HPLC behavior of DATS intermediates. A work is in progress to fully characterize SPC in treated sewages coming from both LAS and related impurities by ion spray HPLC mass spectrometry. At this stage, by comparing the chromato- grams in Figure 3 panels B and C, it can be only stated
that DATS-derived SPC represent a remarkable fraction of all of the SPC species leaving the plant.
As to NPEC, we selected the IP-LC technique for chromatographing them. This choice was dictated by the fact that, when undissociated, NPEC are virtually non- fluorescent species. Together with a chromatogram of the synthesized NPlEC-NP3EC mixture, two selected chromatograms representative of two borderline situations encountered on analyzing NPEC in effluents are shown in Figure 4. Several considerations suggested that peaks appearing after that of NP3EC could be ascribed to the presence in the effluent of higher NPEC oligomers (NP>3EC). To obtain direct evidence of the unexpected
854 Envlron. Scl. Technol., Vol. 28, No. 5, 1994

A
N PEO I I
B
w 1 L 1'0 1L 0 0 10 10 0
Rlme tmln)
Figure 6. Typical LC chromatogram of NPEO and NP obtained by injecting (A) a standard solution and (B) extract A (see the Experimental Section) of a treated sewage sample.
presence of NP>3EC in treated sewages, a NPEC- containing extract was analyzed by ion spray HPLC-MS. Briefly, the extract was injected into the HPLC column with water/acetonitrile (30/70, v/v) acidified with 0.02 % TFA (v/v) as the mobile phase. A suitable fraction of the effluent from the column was introduced to a Perkin Elmer Sciex API I mass spectrometer equipped with an atmo- spheric pressure articulated ion spray source. Qualitative analysis was performed by selective-ion monitoring (SIM) with rn lz values corresponding to protonated molecular ions ranging from 367.2 [NPE3C+Hl+ to 675.2 [NPElOC+Hl+. The mass chromatogram reported in Figure 5 clearly demonstrates that NPEC having more than two ethoxy units can also occur in treated sewages.
Finally, Figure 6 shows a chromatogram obtained by injecting the standard solution containing both NPEO and NP. Under the chromatographic conditions used by us (221, all the various oligomers and isomers of NPEO were eluted as a single broadened peak. From this point onward, the acronym NPEO will indicate the total NPEO. In the same figure, a typical chromatogram obtained from analyzing an extract of a treated sewage sample containing the compounds mentioned above is also presented.
Recovery Studies. Surfactants present in both influ- ent and effluent water samples are distributed between the liquid phase and the particulate matter suspended in it. In our experience, up to 90% of the CWLAS present
in influent aqueous samples can be adsorbed by suspended solids. This situation led Swisher (1) to the conclusion that it is very difficult, if not impossible, to take a representative fraction of the sample contained in the collecting bottles. To circumvent this difficulty, some authors (37) proposed to separate the solid phase from the liquid one, extract surfactants from the particulate matter and add the extract to the liquid phase. In order to evaluate whether specific, time-consuming expedients had to be adopted for obtaining an accurate measurement of the surfactant concentrations in sewage samples, some experiments were conducted. One 24-h composite sample of an influent sewage and that of the corresponding final effluent were collected in calibrated glass bottles and assayed by following three different subsampling methods. The first method was the filtration of the sample and the separate analysis of the surfactants contained in the two phases. The second method, the simplest one, was to vigorously shake the bottle containing the sample for 1 min, and immediately after that, to take a fraction that was carried through the extraction procedure. The third method involved desorption of the analytes from sus- pended solids by the addition of a known volume of methanol (=50%, v/v) to the aqueous sample, 1-min shaking, and extraction of the sample after 1 h to allow adsorbed surfactants to migrate toward the partially organic liquid phase. As measured by us, 313 and 16 mg/L were the respective amounts of particulate matter present in the influent and the effluent samples examined. Analyses were made in triplicate. By comparing the data reported in Table 1, it appears that no significant variation of the concentrations of LAS and NPEO was evident by varying the sampling method. The absence of any adverse effect obtained by following the second subsampling procedure was likely the result of particular care taken on drawing rapidly an aliquot of the aqueous sample, while the particulate matter was still uniformly dispersed. In fact, when sample withdrawal did not immediately follow the shaking, LASS were progressively lost, according to their alkyl chain length.
The influence of the volume of an effluent sewage sample applied to the GCB extraction cartridge on the recovery and group separation of surfactants and their metabolites was assessed. For this purpose, a pooled (n = 5) treated sewage sample containing NPEO, NP, NPlEC, LAS, and SPC was acidified to pH = 3 and amended by adding stock solutions of sulfophenylmalonate (SP2DC3), sul- fophenylglutarate (SP3DC& and sulfophenylpropionate (SP3Cd to produce individual concentration levels of 100
- Table 1. Concentrations (pg/L) of LAS, NPEO, and NP Measured in Sewage Samples by Varying the Sample Preparation Method.
method l b 2c 3d sewage raw treated raw treated raw treated phase liquid solid total liquid solid total
- Ce LAS 239 13 252 0.8 0.8 238 0.7 257 0.8 Cio LAS 959 271 1230 3.3 0.1 3.4 1215 3.2 1240 3.2 Cii LAS 1139 907 2046 8.1 1.3 9.4 2021 9.7 2075 9.8 Ciz LAS 684 1676 2360 5.9 2.2 8.1 2321 8.3 2305 8.5 Ci3 LAS 138 1100 1238 1.9 1.8 3.7 1251 3.7 1268 3.8 NPEO 154 49 203 6.9 3.0 9.9 208 9.6 195 9.9 NP 1 11 12 0.3 0.7 1.0 13 1.0 11 1.1 Average values from triplicate measurements. * Sample filtration followed by separate determination of the analytes in the two phases.
Subsampling immediately after sample agitation. Analyte determination after sample dilution (l:l , v/v) with methanol.
Environ. Sci. Technol., Voi. 28, No. 5, 1994 855

Table 2. Accuracy of Method for Determination of LAS, NPEO, SPC, and NPEC in Raw and Treated Sewages
raw sewage
CiLAS 113-302 6w 9 6 + 7 CloLAS 64C-1620 1900 9 6 t 5 CnLAS 10962703 6100 95+4 CnLAS 635-1462 5270 94+4 &LAS 174-481 1360 92+7 SP24 ndc SP3Cs nd SPZC, nd SP3Cb nd SP4Cb nd SP5Cs nd SP2DCa nd SP3DCs nd NPEO 64-115 200 9 6 f 4 NP 2.7-7.5 20 89+7 NPlEf! nd . .. .-- __ NP2EC nd
treated sewage wncn
&? added recovery av %
<0.61.5 6.6 94+6 2.1-6.2 22 93 + 5 8.617.8 72 9 3 + 4 10.616.3 62 94*5 4.4-6.6 16 91 + 7 nd 34 93+6 0.64.0 34 97+4 1.CM.5 34 98+4 3.1-22 34 96+6 0.7-2.3 34 98+4 2.2-12 34 100+5 - 34 92*7 1.65.4 34 94+ 5 4.1-9.7 34 99+ 5 0.7-2.6 2.5 90+ 7 1.5-3.9 10 96+ 5 5.1-9.4 10 9 8 f 4
Five samplea. b Arithmetic mean *1 standard deviation. c nd = not detectable.
d L . These three compounds were originally present in the sample at a negligible level. Thereafter, aliquots of 50,100, and 200 mL of the aqueous sample were analyzed in duplicate. Under these conditions, no significant loss of LAS, NPEO, and NP was evident. Vice versa, effects of carryover and significant losses of SP3C3, SP2DC3, SP3DC6, and NPlEC occurred when extracting the 200- mL sample volume. In particular, about 30% of NPlEC was found in the fraction containing NPEO and 25% of SP3C3 was present in that containing NPEC. Even worse, 73% and 58%, respectively, of SPZDCmndSP3DCspassed unretained through the extraction cartridge. In a previous paper (32), it was shown that large amounts of fulvic acids in water can profoundly affect the recovery and the group separation of acidic compounds extracted by a GCB extraction cartridge. That anomalously large concentra- tions of fulvic acids in treated sewages could affect the quality of the analysis, even analyzing 100 mL of the aqueous sample, was considered. When monitoring
Table 3. Precision of Method (n = 6) for Determination of LAS, NPEO, and Some Selected Related Biodegradation Intermediates
raw aawage treated sewage mncn * CVa
(WIL) ( % I (NIL) (%)
concn * CVO
cl, LAS 0.852 2.9 9.3 3.3 sP3c. 5.3 4.0 SP3BCa SP3CS !P3CB
1.3 6.5 16.0 2.4 6.2
~~
S 3.1 SPSC, 11.8 3.3 NPEO 0.307 2.6 20.3 3.6 NPlEC 12.8 2.6 NP2EC 17.1 3.5 N P 0.016 5.6 1.8 6.3
CV = mefficient of variation.
the addition of known amounts of SP2DC3. Particular attention was payed to those effluents whose final extracts appeared to contain relatively large amounts of fulvic acids (a deep brownish coloration is a valid indication). No appreciable loss of the added sulfophenyl dicarboxylic acid was noted in any case.
Accuracy andPrecision. The accuracyof thismethod is reported in Table 2. LAS, NPEO, and some selected related biodegradation products were added at the indi- cated concentrations to the individual samples of each matrix considered and assayed. LAS-amended sewage influentsamples were prepared by adding thesesurfactants directly from the stock solution.
To assess the precision of the overall method, including sampling from the collecting bottles, replicate analyses of one sample of an untreated sewage and one of a treated sewage were carried out. Before analysis, the sewage effluent was spiked with some selected authentic SPC. Results are shown in Table 3.
Limit of Detection. Under the experimental condi- tions used, the limits of detection (LODs) (simal to noise
monthly asew-age treatment plant in the area of Rome fo; 1 year, effluent samples were occasionallyreanalyzedafter
ratio = 5 ) for the various analytes considered were approximately estimated. AstoLASs, SPCs, and NPECs,
LAS mglL NPEO NP
mglL pg/L
0.30 30
0.20 0
0.10 10
0.0 i 0
0.36 12.0
10.0
8.0
6.0
4.0
2.0
0.0 November December January February March Apd May June Juiy Augurt September October
Month
Flgura 7. Levels of LAS, NF'EO. end NP monkwed monmly in 24-h composne raw sewage samples entering h e plant (Ostia,lSSl-lS92).
866 Envkon. Sd. Tschol.. Vd. 28, No. 5, 1994

NPEO U S
30-- PglL 4 250
ZW
150
100
50
2.6 20-
10-
0 OJ-
NP w
4
- 3
- 2
- 1
0
November December January February March April May June July August ?@ember octoki
1.15
0.85 0.85 140
0.70 0.70 60
40
20
Month
- 1.2 .. 1.0
.’ 0.8
.’ 0.6
.’ 0.4
.. 0.2
* 0.0
FlpureS. Approximateheisof SPCand NECmonltoredmonthlyin 24-hcompositebeatedsewagesemplesleaving~pbnt(Ostla,1991-1992).
the LOD were calculated by selecting one representive for each group of analytes. Considering the analysis of 100 mL of a treated sewage sample, the LODs (in pg/L) are reported in parentheses as follows: CII-LAS (l), SP4C. (0.8),NPlEC (0.3), NPEO (O.G),andNP (0.2). Ohviously, the LODs for a raw sewage sample have to be increased by a factor 10 (see Experimental Section).
Application to Raw and Treated Sewages. It has to he pointed out that the concentrations of the various analytes reported below were obtained by analyzing monthly 24-h composite samples.
The concentrations of LAS, NPEO, and NP in the sewage influents and effluents over the 1-year monitoring period are respectively shown in Figures 7 and 8. The NPEO content was more than 1 order of magnitude lower than that of LAS. This suggests the prevailing domestic origin of the sewage, as NPEO are not present in household formulations. The reported concentrations refer to the total inflowing LAS, NPEO, and NP since, as discussed
above, our method allows the simultaneous determination of the dissolved and adsorbed fractions of the compounds considered. By comparing the influent-effluent concen- trations, it was calculated that the elimination of LAS from the wastewater after the overall treatment was between99.8and94.3% (mean =98.4*1.4%),whilethat of NPEO was between 84.6% and 98.3% (mean value, 94.3 * 4.0%). The removal of NP, accounting for up to 93% on the basis of the percentage effluent to influent ratio, has to he substantially ascribed to sludge sorption, according to previous investigations (7,13).
For reasons reported in part above and in part below, only a semiquantitative assessment of the concentrations of SPC and NPEC in effluents could be made (Figure 9). For NPEC, we chose to report data for NPlEC-NP3EC separatelyfrom those for NP>3EC. Contraryto the latter group of compounds, the availability of authentic stan- dards allowed us to measure the concentrations of N P l E C NP3ECwithagoodacnuacy. Under thechromatographic
Ewbm. Sd. Tebrol.. Vol. 28. No. 5. 1994 857

conditions selected and when present in the sample in abundant amounts, NP>3EC were eluted as an indented broadened peak (see Figure 4B). I n this case, the total concentration of the NP>3EC species was calculated by assuming all of them have the same molar quantum efficiency as NPZEC, combining the various peaks for NP>3EC into one, and assigning to the NP>SEC mixture an approximate, average molecular weight equal t o tha t of NP7EC. As to SPC, it has to be outlined that monthly concentrations of SPC calculated by us refer t o the total concentrations of sulfophenyl carboxylic acids formed upon biodegradation of both LAS and related byproducts, i.e., DATS. The concentrations of the SPC in treated sewages were calculated by (i) assuming all the peaks appearing before those for t he residual LAS were produced by the various isomers and homologues of SPC coming from both LAS and DATS, (ii) assuming that DATS intermediates have the same molar quantum efficiency as the LAS ones, and (iii) subdividing the chromatograms relative to the elution of SPCs in various regions; each one is supposed to contain all the possible isomers of each SPC homologue. The total area of all the peaks present in one region was compared to that of t he peak for the corresponding SPC generated by the aerobic bioassay.
Acknowledgments
We wish to thank the ACEA for financially supporting this research work and the sewage treatment plant operators in the area of Rome for collecting sewage samples. Thanks are expressed also to BrunoCasetta (Perkin Elmer) for the HPLC-MS analysis of a NPEC-containing extract.
Literature Cited
Swisher, R. D. Surfactant Biodegradation, 2nd ed.; Marcel Dekker, Inc.: New York, 1987. Schoberl, P. Tenside Deterg. 1989, 26, 86-94. Wagener, S.; Schink. Water Res. 1987, 21, 615-621. Brueschweiler, H.; Gamperle, H.; Schwager, H. Tenside Deterg. 1983,20, 317-324. Yoshimura, K. JAOCS, J. Amer. Oil Chem. Soc. 1986,63, 1590-1596. Ball, H. A.; Reinhard, M.; McCarty, P. L. Environ. Sei. Technol. 1989,23, 951-961. Brunner,P.D.; Capri, S.; Marcomini, A.; Giger, W. Water Res. 1989,22, 1465-1472. Berna, J. L.; Ferrer, J.; Moreno, A.; Prats, D.; Ruiz Bevia. Tenside Deterg. 1989, 26, 101-107. Marcomini, A.; Capel, P. D.; Lichtensteiger, T.; Brunner, P. D.; Giger, W. J. Environ. Qual. 1989, 18, 523-528. Marcomini, A. Behaviour of NPE/NP in sludge treated soils and in landfills. In Proceedings of the Status Seminar on Nonylphenol polyethoxylates and Nonylphenol; Swedish Environmental Protection Agency Report 3907; Swedish Protection Agency: Stockholm, 1991. Waters, J.; Holt, M. S.; Matthijs, E. Tenside Deterg. 1989, 26, 129-135.
(12) Holt, M. S.; Bernstein, S. L. Water Res. 1992,26,613-617. (13) Giger, W.; Ahel, M.; Koch, M.; Laubsher, H. U.; Schaffner,
C.; Schneider. Water Sei. Technol. 1987, 19, 449-460. (14) Stephanou, E.; Giger, W. Environ. Sei. Technol. 1982, 16,
800-805. (15) Brawn, D.; de Henau, H.; Garrigan, J. T.; Gerike, P.; Holt,
M. S.; Kunkel, E.; Matthijs, E.; Waters, J.; Watkinson, R. J. Tenside Deterg. 1987, 24, 1-7.
(16) Field, J. A.; Leenheer, J. A.; Thorn, K. A.; Barber, L. B.; Rostad, C.; Macalady, D. L.; Daniel, S. R. J. J. Contam. Hydrol. 1992, 9, 55-78.
(17) Field, J. A.; Barber, L. B., 11; Thurman, E. M.; Moore, B. L.; Lawrence, D. L.; Peake, D. A. Enuiron. Sei. Technol. 1992,26, 1140-1148.
(18) Giger, W.; Brunner, P. H.; Schaffer, C. Science 1984,225, 623-625.
(19) Ahel, M.; Giger, W.; Koch, M. In Organic Micropollutants in the Aquatic Environment; Bjorseth, A., Angeletti, G., Eds.; D. Reidel Publishing Co.: Dordrecht, The Netherlands,
(20) Ahel, M.; Conrad T.; Giger, W. Environ. Sei. Technol. 1987,
(21) Barber, L. B,, 11; Field, J. A.; Brown, G.; Tabor, 6. F. Abstracts from the203rd National Meeting of the American Chemical Society; San Francisco, CA, Apr 1992; American Chemical Society: Washington, DC, 1992; Vol. 31, p 382.
(22) Marcomini, A.; Giger, W. Anal. Chem. 1987,59,1709-1715. (23) Marcomini, A,; Pavoni, B.; Stelluto, S. Znt. J . Environ. Anal.
Chem. 1989,35,207-218. (24) Swisher, R. D.; Gledhill, W. E.; Kimerle, R. A.; Taulli, T.
A. Znt. Congr. Surf. Act. Subst. 1976, 7th, Paper 117. (25) Marcomini, A.; Di Corcia, A.; Samperi, R.; Capri, S. J .
Chromatogr. 1993,59, 644-651. (26) Borra, C.; Di Corcia, A.; Marchetti, M.; Samperi, R. Anal
Chem. 1986,58, 2048-2052. (27) Di Corcia, A.; Marchetti, M. Anal. Chem. 1991, 63, 580-
585. (28) Di Corcia, A.; Marchetti, M. Enuiron. Sei. Technol. 1992,
26, 66-74. (29) Di Corcia, A.; Marchetti, M.; Marcomini, A.; Samperi, R.
(30) Di Corcia, A.; Marcomini, A.; Samperi, R.; Stelluto, S. Anal.
(31) Andreolini,F.; Borra, C.; Caccamo, F.; Di Corcia, A.; Samperi,
(32) Di Corcia, A.; Marchese, S.; Samperi, R. J. Chromatogr.
(33) Fotsis,T.; Jiirvenpaa, P.; Adlercreutz, H. J . Steroid Biochem.
(34) Marcomini, A.; Cavalli, L. Proceedings of the 3th World
(35) Trehy, M. L.; Gledhill, W. E.; Orth, R. G. Anal. Chem. 1990,
(36) Moreno,A.;Bravo, J.;Berna, J. L. JAOCS, J . Am. Oil Chem.
(37) Kikuchi, M.; Tokai, A.; Yoshida, T. Water Res. 1986, 20,
1986; pp 414-428.
21, 697-703.
Anal. Chem. 1991,63, 1179-1182.
Chem. 1993,65,907-912.
R. Anal. Chem. 1987,59, 1720-1725.
1993,642, 163-174.
1980,12, 503-510.
Surfactant Congress; London, June 2-6, 1992; pp 8-16.
62, 2581-2586.
Soc. 1988,65, 1000-1006.
643-650.
Received for review July 6,1993. Revised manuscript received December 22, 1993. Accepted January 31, 1994.'
0 Abstract published in Advance ACS Abstracts, March 1,1994.
858 Environ. Scl. Technol., Vol. 28, No. 5, 1994
Related Documents