MONITORING AND MODELING NEARSHORE DREDGE DISPOSAL FOR INDIRECT BEACH NOURISHMENT, OCEAN BEACH, SAN FRANCISCO Patrick L. Barnard 1 , Daniel M. Hanes 1 , Jamie Lescinski 1 and Edwin Elias 2 Nearshore dredge disposal was performed during the summer of 2005 at Ocean Beach, San Francisco, CA, a high energy tidal and wave environment. This trial run was an attempt to provide a buffer to a reach of coastline where wave attack during the winter months has had a severe impact on existing sewage infrastructure. Although the subsequent beach response was inconclusive, after one year the peak of the disposal mound had migrated ~100 m toward the shore, providing evidence that annual dredge disposal at this site could be beneficial over the long-term by at the very least providing: 1) additional wave dissipation during storms 2) compatible sediment to feed nearshore bars, 3) sediment cover on an exposed sewage outfall pipe, and 4) a viable alternative to the shoaling offshore disposal site. Numerical modeling suggests that despite the strong tidal currents in the region, wave forcing is the dominant factor moving the sediment slowly toward shore, and placing sediment at just slightly shallower depths (e.g. < 8 m vs. > 9 m) in the future would have a more immediate impact. INTRODUCTION Implementing innovative and cost-effective techniques to mitigate beach erosion and protect critical infrastructure are becomingly increasingly important due to the potential coastal impact of rising sea level (Leatherman et al. 2003) and the escalating costs of erosion control. Nearshore berm emplacement has proven an effective and cost-saving form of indirect beach nourishment abroad (e.g. van Duin et al. 2004) but is rarely used in the United States. In June 2005, the United States Army Corps of Engineers (USACE) dredged approximately 225,000 m 3 of sand from the Main Shipping Channel at the mouth of San Francisco Bay and placed it in a newly designated disposal site immediately offshore of an erosion hot spot at Ocean Beach, San Francisco (Fig. 1). This paper reports on the initial outcome of this demonstration project and describes the monitoring and numerical modeling of the bathymetric evolution of the test dredge disposal site and the adjacent coastal region from June 2005 to May 2006. THE CONCEPT Unlike traditional beach nourishment projects, the dredged material in this project was placed in a mound well outside of the surf zone, in depths ranging 1 United States Geological Survey, 400 Natural Bridges Drive, Santa Cruz, CA 95060, USA 2 WL/ Delft Hydraulics, 2600 MH Delft, The Netherlands

Welcome message from author
This document is posted to help you gain knowledge. Please leave a comment to let me know what you think about it! Share it to your friends and learn new things together.
Transcript

MONITORING AND MODELING NEARSHORE DREDGE DISPOSAL FOR INDIRECT BEACH NOURISHMENT, OCEAN BEACH, SAN
FRANCISCO
Patrick L. Barnard1, Daniel M. Hanes1, Jamie Lescinski1 and Edwin Elias2
Nearshore dredge disposal was performed during the summer of 2005 at Ocean Beach, San Francisco, CA, a high energy tidal and wave environment. This trial run was an attempt to provide a buffer to a reach of coastline where wave attack during the winter months has had a severe impact on existing sewage infrastructure. Although the subsequent beach response was inconclusive, after one year the peak of the disposal mound had migrated ~100 m toward the shore, providing evidence that annual dredge disposal at this site could be beneficial over the long-term by at the very least providing: 1) additional wave dissipation during storms 2) compatible sediment to feed nearshore bars, 3) sediment cover on an exposed sewage outfall pipe, and 4) a viable alternative to the shoaling offshore disposal site. Numerical modeling suggests that despite the strong tidal currents in the region, wave forcing is the dominant factor moving the sediment slowly toward shore, and placing sediment at just slightly shallower depths (e.g. < 8 m vs. > 9 m) in the future would have a more immediate impact.
INTRODUCTION Implementing innovative and cost-effective techniques to mitigate beach erosion and protect critical infrastructure are becomingly increasingly important due to the potential coastal impact of rising sea level (Leatherman et al. 2003) and the escalating costs of erosion control. Nearshore berm emplacement has proven an effective and cost-saving form of indirect beach nourishment abroad (e.g. van Duin et al. 2004) but is rarely used in the United States. In June 2005, the United States Army Corps of Engineers (USACE) dredged approximately 225,000 m3 of sand from the Main Shipping Channel at the mouth of San Francisco Bay and placed it in a newly designated disposal site immediately offshore of an erosion hot spot at Ocean Beach, San Francisco (Fig. 1). This paper reports on the initial outcome of this demonstration project and describes the monitoring and numerical modeling of the bathymetric evolution of the test dredge disposal site and the adjacent coastal region from June 2005 to May 2006.
THE CONCEPT Unlike traditional beach nourishment projects, the dredged material in this project was placed in a mound well outside of the surf zone, in depths ranging
1 United States Geological Survey, 400 Natural Bridges Drive, Santa Cruz, CA 95060, USA 2 WL/ Delft Hydraulics, 2600 MH Delft, The Netherlands
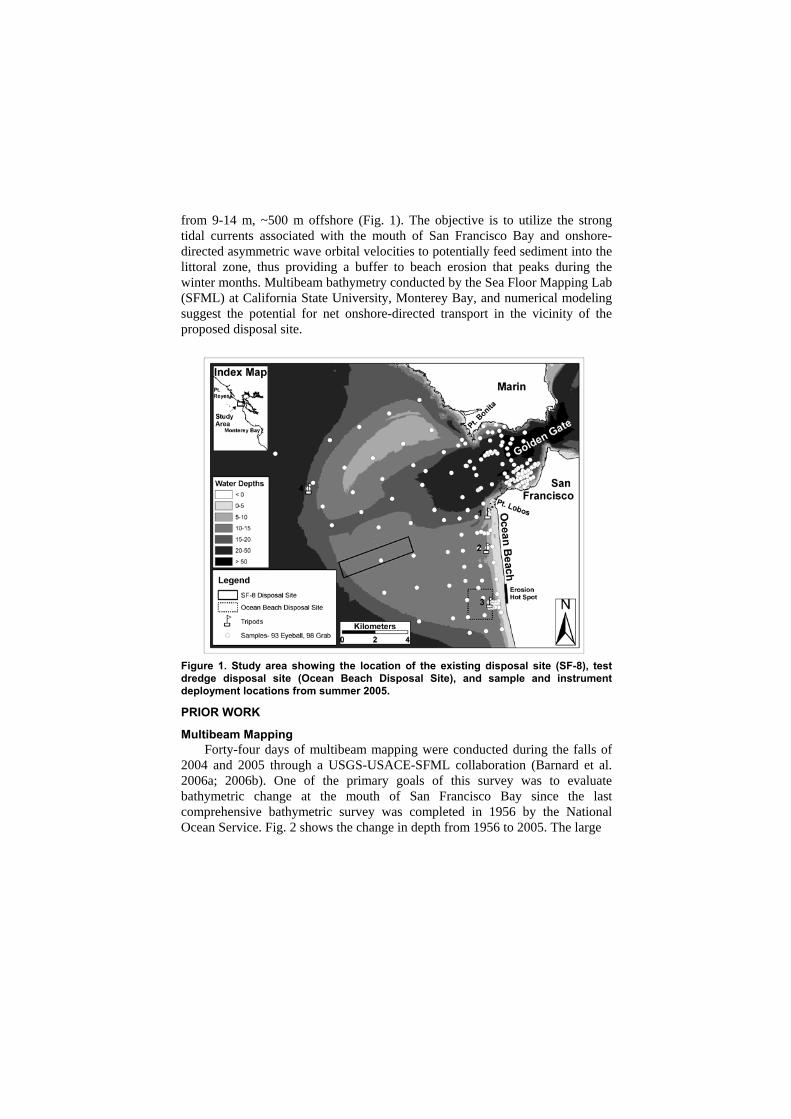
from 9-14 m, ~500 m offshore (Fig. 1). The objective is to utilize the strong tidal currents associated with the mouth of San Francisco Bay and onshore-directed asymmetric wave orbital velocities to potentially feed sediment into the littoral zone, thus providing a buffer to beach erosion that peaks during the winter months. Multibeam bathymetry conducted by the Sea Floor Mapping Lab (SFML) at California State University, Monterey Bay, and numerical modeling suggest the potential for net onshore-directed transport in the vicinity of the proposed disposal site.
Figure 1. Study area showing the location of the existing disposal site (SF-8), test dredge disposal site (Ocean Beach Disposal Site), and sample and instrument deployment locations from summer 2005.
PRIOR WORK
Multibeam Mapping Forty-four days of multibeam mapping were conducted during the falls of 2004 and 2005 through a USGS-USACE-SFML collaboration (Barnard et al. 2006a; 2006b). One of the primary goals of this survey was to evaluate bathymetric change at the mouth of San Francisco Bay since the last comprehensive bathymetric survey was completed in 1956 by the National Ocean Service. Fig. 2 shows the change in depth from 1956 to 2005. The large

Figure 2. Change between bathymetric surveys conducted in 1956 and 2005.
scale morphological trend is ebb tidal delta constriction and sediment loss. The average depth change in the entire region was -60 cm (erosion), which amounts to ~92 million m3 of sediment loss in the region common to both surveys. Even with a conservative vertical error bar of +/-30 cm this is a significant trend. The outer lobe of the ebb tidal delta is completely dominated by erosion. Several likely causes include a reduction in tidal prism/currents due to San Francisco Bay development and a decrease in sediment supply due to both removal by sand mining inside the bay (Chin et al. 1998; 2004) and reduced influx of hydraulic mining debris from the Sacramento River (Gilbert 1917). There are two distinct accretionary mounds in the SF-8 disposal site, presumably the result of dredge disposal in this area that has totaled ~18 million m3 since disposal commenced on this site in 1971 (United States Army Corps of Engineers 1996). This accretion has increased navigational hazards for USACE dredging operations. Note also the nearshore erosion seaward of the erosion hot spot at Ocean Beach (Fig. 2), leaving this reach of the beach more susceptible to wave attack. The multibeam bathymetry shows the large-scale bedform morphology, primarily sand waves with wavelengths > 5-10 m, along Ocean Beach. The bedform orientation indicates dominance by tidal forcing outside of the surf zone (Jordan 1962) (Fig. 3). Most bedforms in the northern half of Ocean Beach are oriented with their crests nearly perpendicular to the shoreline (Fig. 3, Inset

A), while toward the middle of the beach, approximately 1.5 km north of the erosion hot spot, there are indications of onshore directed transport (Fig. 3, Inset B). The Southwest Ocean Outfall Pipe, constructed in the late 1970’s (Woodward Clyde Consultants 1978), is located in the southern end of Ocean Beach and carries approximately one-third of San Francisco’s treated sewage out to sea. The only bedforms observable offshore of the erosion hot spot are scour ripples associated with the Outfall Pipe (Fig. 3, Inset C) and ripple scour depressions oriented east-west.
Figure 3. Multibeam survey from 2004 (pre-disposal) showing A) alongshore migrating bedforms, B) onshore-directed bedform morphologies north of the disposal site, and C) intense scour associated with the outfall pipe, the approximate site of the June 2005 dredge disposal.
In summary, three important management issues were highlighted by the multibeam survey:
1. The SF-8 disposal site is accreting and a new site for disposing of ship channel sediment may soon be essential.
2. The Southwest Ocean Outfall Pipe is exposed and is causing severe scour in the immediate vicinity. The ramifications for the structural integrity of the outfall pipe and the influence of this scour on the adjacent coastline are unknown.

3. Most of the region offshore of the erosion hot spot at Ocean Beach has lost > 1 m of sediment since 1956, reducing the wave protection these shoals formerly provided to the adjacent beach, and indicating a general reduction in sediment supply to this reach of the ebb tidal delta.
Beach and Nearshore Studies Work to date by the USGS suggests strong seasonal fluctuations in beach and nearshore sand volumes, high cross-shore sediment transport rates, and large short-term changes in beach morphology (Barnard and Hanes 2005). Intrannual shoreline positions can exceed 80 m, as measured during the 1997-98 El Niño period. Quarterly USGS nearshore bathymetric surveys using Personal Watercraft (PWC) with Real-Time Kinematic Global Positioning Systems (GPS) show seasonal cross-shore transport rates that can exceed 1000 m3 per m of shoreline. Monthly 3-D beach surveys using All-Terrain Vehicles (ATV) with Differential GPS have logged instances of dramatic changes in beach morphology, particularly during the winter months, when powerful storms can temporarily remove large volumes of beach sediment, leaving the beach and associated infrastructure more vulnerable to further wave attack. The winter beach is typically narrower and steeper, while the summer beach is wider and flatter. Southern Ocean Beach is the most vulnerable, historically narrow and often the first to lose significant sediment when the winter storm season begins. Grain size surveys along Ocean Beach using both settling tube results and a digital bed sediment camera (Chezar and Rubin 2004; Rubin 2004) show that the grain size in the swash zone is quite consistent alongshore with a median grain size of 0.28 mm, with some coarser gravel lags occasionally occurring in the southern half of the 7 km long beach.
MONITORING PROGRAM The performance of the nearshore dredge disposal was monitored via multibeam bathymetric mapping, beach and nearshore mapping using ATVs and PWCs, grain size analysis, and direct physical process measurements, from May 2005 to May 2006 (Fig. 1). Five multibeam surveys (performed by SFML) were conducted: pre-dredge (May 2005), post dredge (June 2005), 1 month post-dredge (July 2005) 4 months post–dredge (October 2005), and 1 year post-dredge (May 2006). The USGS performed PWC surveys in May 2005 and November 2005. The beach was mapped using ATVs in May, June, July, August and November, 2005. In June 2005, at the onset of the dredge disposal, the USGS deployed 4 tripods offshore of Ocean Beach, each equipped with a current profiler, to make calculations of the directional wave spectrum, water levels and tidal currents from in situ measurements (Fig. 1). The instrument locations were chosen to best characterize the physical processes at Ocean Beach, especially at the dredge disposal site. These data will also allow us to validate our numerical models, Delft3D (Delft Hydraulics 2005) and NearCoM (Kirby 2005), for hydrodynamics, sediment transport, and morphological

evolution. Once validated, predictions of sediment transport from the disposal site can be performed. The USGS conducted eight days of sediment sampling in June and July 2005. A total of 191 stations were sampled by collecting grab samples or employing a digital bed sediment ‘eyeball’ camera at the mouth of San Francisco Bay, with emphasis immediately on and around the Ocean Beach disposal site (Fig. 1). The subsequent sediment analysis will serve to track the dredge disposal (if the grain size is different from the surrounding sediment), to determine if the grain size of the dredge disposal is suitable for bed load transport under the prevailing hydrodynamic conditions of the area, and as input for use in future sediment transport models at Ocean Beach.
RESULTS AND DISCUSSION
Multibeam Mapping of Dredge Disposal Evolution Fig. 4 shows the bathymetric change in June and October 2005, associated with the dredge disposal, relative to the bathymetry measured in May 2005. The peak of the asymmetric disposal mound in June is ~1.75 m high in 10.5 m water depth, with some secondary mounds scattered throughout the site in depths as shallow as 9 m. By October the peak location has moved ~30 m to the east, but the mound has greatly dissipated and the overall volume within the survey area has been reduced by ~50%. Much of this volume loss is likely attributed to the summer seasonal cross-shore sediment flux, that is, the natural cross-shore sediment transport trend toward the beach. A large portion of the dredge volume was placed in the vicinity of the exposed outfall pipe, and cross-sections (Fig. 5) show that some accretion has occurred around severely exposed portions of the pipe, reducing the exposure and thus the scour potential. However, much of the pipe remains exposed.

Dredge Disposal Cross Section
-13
-12.5
-12
-11.5
-11
-10.5
-10
-9.5
-9
-8.5
-80 100 200 300 400 500 600 700 800
Distance (m)
Dep
th (
m)
May 2005 June 2005 July 2005 Oct 2005 May 2006
Figure 4. Bathymetric change between June and October 2005. The black box represents the Ocean Beach disposal site. The shaded box onshore is the erosion hot spot. Fig. 5 shows the bathymetric change after one year. The disposal mound is clearly more dispersed, but the volume has actually increased, likely due to the seasonal offshore transport of sediment during the winter and spring. However, careful cross-section analysis indicates that the mound peak has migrated ~100 m toward the shore.
A B
June 2005
↓ May 2006
↓

Figure 5. Bathymetric change at the center of the disposal site after one year, with cross-section showing the onshore migration of the primary disposal mound. See Fig. 4 for view extent.
Beach and Nearshore Surveys A comparison of topographic beach surveys during the May-August period in both 2004 and 2005 indicate a higher rate of beach accretion during the initial disposal period in summer 2005 (Fig. 6), particularly along the northern half of Ocean Beach. However, this higher rate of accretion could be attributed to a number of variables (e.g. wave height, set-up, dominant wave direction, etc.), and without a longer term data set it is not possible to isolate the dredge disposal as the direct cause of this accretion.
Volume Change (m3)
2004 2005 May-June 144,00 0 30,680 June-July -136,440 92,520 July-Aug NA 209,280 July-Oct 286,680 NA
Figure 6. Beach response along the erosion hot spot after the June 2005 disposal, compared to beach change during the same period in 2004. The northern section of Ocean Beach (not pictured) shows more noticeable accretion in summer 2005. Between May and November 2005, the PWC surveys indicate a high rate of cross-shore sediment transport (Barnard and Hanes 2005). PWC surveys at Ocean Beach indicate that cross-shore sediment transport is significant out to ~8

m water depth, and seasonal profile change (i.e. depth of closure) can be detected out to at least ~11 m of water depth, encompassing large portions of the disposal area (Fig. 7).
Figure 7. Cross-shore transect from PWC surveys at Ocean Beach. Transect location is shown in Fig. 4.
In situ Instruments Tidal currents and waves measured at all sites are indicative of a highly dynamic coastal system, where both processes play important roles in sediment transport and the resulting morphology. Preliminary measurement analysis from the current profiler placed at the disposal site in June 2005 (Fig. 1, Site 3) clearly show the potential for sand transport with summer waves approaching 2.5 m (offshore > 4 m) and tidal currents peaking at 60 to 80 cm/s. However, despite the evidence of onshore-directed transport north of the site in the form of sand waves (Fig. 3), the tidal currents at this site are predominately north-south, i.e. alongshore.
Grain size analysis Intense sampling about the dredge disposal region indicates that surficial sediments consist of fine sand (d50= 0.18 mm), broadly consistent with nearshore bar and dune sediment found at Ocean Beach, but finer than beach sand (d50= 0.28 mm). This sediment is therefore not ideally compatible to stay on the beach, but could build up the nearshore bars and help protect the beach from direct wave attack.

Modeling A Delft3D hydrodynamic and wave model was previously established for this region. The hydrodynamic model was calibrated using regional tide stations, with the resolution amplified in the vicinity of the dredge disposal site for this study. A plot of residual sediment transport under typical summer conditions based on tidal forcing alone indicates only minimal transport from the disposal site (Fig. 8), with net transport predominately north-south. However, once waves are introduced, the residual transport increases substantially in the shallower depths (Fig. 9), where wave-induced bottom currents produce net-onshore directed transport.
Figure 8. Residual transport of the dredge disposal mound with tidal forcing only.

Figure 9. Residual transport of the dredge disposal mound with tidal and wave forcing, illustrating the dominance of shallow wave forcing in the dredge disposal migration.
Disposal Mound Migration Cross-sections through the dredge deposal mound illustrate net onshore migration of the mound peak of ~100 m between June 2005 and May 2006 (Fig 5.). This migration rate is broadly consistent with the empirical model proposed by Douglass (1995; 1996), taking into account that this model was based on data from the milder wave climates of the Atlantic and Gulf Coasts. The model is based on the following power relation:
E[C]=ah-b (1)
where E[C] = expected value of migration (m/yr), a= coefficient b= exponent and h=depth (m). Empirical data suggests a best fit of A= 0.3 and b=4 or 5. Therefore, mound migration rate varies ~ to the 4th or 5th power with depth. This explains the pattern of onshore directed transport in Fig. 9, where at shallower depths wave forcing increases dramatically, i.e. the mound migration rate would double in only about 15% less depth (Douglass 1996). The peak of the primary mound began in 10.5 m water depth and the shallowest secondary mound began in 9 m water depth, which was controlled by the draft of dredging vessel. However, if sediment could be placed in even 1 m shallower depth in the future, theoretically doubling the onshore migration rate, then the possible beach protection afforded by the dredge disposal might be more immediate and substantial.

NEARSHORE DREDGE DISPOSAL- LESSONS LEARNED Although the disposal mound migrated ~100 m toward the shore, the sediment was placed in depths too great for a more immediate response. The volume placed was also quite small, and with a seasonal cross-shore transport rate of ~1000 m3 per m of shoreline along the 7-km long beach, tracking a fraction of the 225,000 m3 of disposal sediment in the active nearshore zone would be impossible. The grain size is also too fine to stay on the beach, although it could feed the nearshore bar system. Further, it has become clear that tidal currents are unlikely to feed sediment toward the shoreline on this part of the beach. Despite the ambiguity of the initial coastal response, the repeated multibeam surveys do indicate that the mound is migrating toward shore and could provide added wave dissipation during winter storms, especially if dredge is placed annually in this location. The mound is, however, deep enough such that longshore transport would not be interrupted, a common problem with shallow mound placement. Lastly, the placement of this mound has filled in some scour holes about the outfall pipe, giving it added protection. This could be a viable location for the long-term placement of dredge material, relieving the stress on the existing offshore disposal site.
CONCLUSIONS The response of the beach and nearshore region to the June 2005 test dredge disposal thus far is largely inconclusive. Initially ~50% of the sediment dispersed from the site, but the volume within the disposal area then remained relatively constant for at least 1 year. Further, the peak of the disposal mound migrated toward shore at a rate of ~100 m/yr. It will likely take at least several more years of disposals of similar magnitude in this new location and careful monitoring to determine if the beach and nearshore region will benefit from the artificial increase in nearshore sediment supply to this area.
ACKNOWLEDGEMENTS This research was supported by the U.S. Geological Survey Coastal and Marine Geology Program and the United States Army Corps of Engineers, San Francisco District. The Seafloor Mapping Lab at California State University, Monterey Bay, performed the multibeam mapping.
REFERENCES Barnard, P.L. and D.M. Hanes. 2005. Integrating field research, modeling and
remote sensing to quantify morphodynamics in a high-energy coastal setting, Ocean Beach, San Francisco, California, Proceedings of the 5th International Conference on Coastal Dynamics, American Society of Civil Engineers, Barcelona, Spain, 1-14.

Barnard, P.L., D.M. Hanes, R.G. Kvitek, and P.J. Iampietro. 2006a. Sand
Waves at the mouth of San Francisco Bay, California, U.S. Geological Survey, Scientific Investigations Map, 2006-2944, 5 map sheets.
Barnard, P.L., D.M. Hanes, D.M. Rubin and R.G. Kvitek. 2006b. Giant sand waves at the mouth of San Francisco Bay. Eos, Transactions of the American Geophysical Union, 87(29), 285, 289.
Chezar, H. and D.M. Rubin. 2004. Underwater Microscope System, United States Patent Office, The United States of America as represented by the Secretary of the Interior, 9 pp.
Chin, J.L., P.R. Carlson, F.L. Wong, and D.A. Cacchione. 1998. Multibeam data and socio-economic issues in west-central San Francisco Bay (CA), U.S. Geological Survey Open-file Report, 98-139.
Chin, J.L., F.L. Wong, and P.R. Carlson. 2004. Shifting shoals and shattered rocks- how man has transformed the floor of West-central San Francisco Bay, U.S. Geological Survey Circular, 1259, 30 pp.
Delft Hydraulics. 2005. User Manual Delft3D- FLOW, WL/ Delft Hydraulics, 614 pp.
Douglass, S.D. 1995. Estimating landward migration of nearshore constructed sand mounds, Journal of Waterway, Port, Coastal, and Ocean Engineering, 121(5), 247-250.
Douglass, S.D. 1996. Nearshore placement of sand, 25th International Conference on Coastal Engineering, ASCE, Orlando, 3708-3721.
Gilbert, G.K. 1917. Hydraulic-mining debris in the Sierra Nevada, U.S. Geological Survey Professional Paper, 105, 154 pp.
Jordan, G.F. 1962. Large submarine sand waves, Science, 136, 839-848. Kirby, J.T. 2005. An overview of the NearCoM model system: Philosophy,
sample configurations and testing, Research Report, Center for Applied Coastal Research, University of Delaware.
Leatherman, S.P., B.C. Douglas, and J.L. LaBrecque. 2003. Sea level and coastal erosion require large-scale monitoring, EOS Transactions, 84(12), 13, 17.
Rubin, D.M. 2004. A simple autocorrelation algorithm for determining grain size from digital images of sediment, Journal of Sedimentary Research, 74(1), 160-165.
United States Army Corps of Engineers. 1996. Ocean Beach Storm Damage Reduction Feasibility Study, USACE San Francisco District, Final Feasibility Study for the City and County of San Francisco.
van Duin, M.J.P., N.R. Wiersma, D.J.R. Walstra, L.C. van Rijn, and M.J.F. Stive. 2004. Nourishing the shoreface: observations and hindcasting of the Egmond case, The Netherlands, Coastal Engineering, 51, 813-837.
Woodward Clyde Consultants. 1978. Coastal Engineering Evaluation- Southwest Ocean Outfall Project, Subtask 3-2 Addendum.

Related Documents