MONITORING AND EVENT MANAGEMENT OF CRITICAL INFRASTRUCTURES A Master's Thesis Submitted to the Faculty of the Escola Tècnica d'Enginyeria de Telecomunicació de Barcelona Universitat Politècnica de Catalunya by Daniel E. Hernández R. In partial fulfilment of the requirements for the degree of MASTER IN TELECOMMUNICATIONS ENGINEERING Advisors Hiram Fernández Jordi Casademont Barcelona, June 2016

Welcome message from author
This document is posted to help you gain knowledge. Please leave a comment to let me know what you think about it! Share it to your friends and learn new things together.
Transcript

MONITORING AND EVENT MANAGEMENT
OF CRITICAL INFRASTRUCTURES
A Master's Thesis
Submitted to the Faculty of the
Escola Tècnica d'Enginyeria de Telecomunicació de Barcelona
Universitat Politècnica de Catalunya
by
Daniel E. Hernández R.
In partial fulfilment
of the requirements for the degree of
MASTER IN TELECOMMUNICATIONS ENGINEERING
Advisors
Hiram Fernández Jordi Casademont
Barcelona, June 2016


i
Title of the thesis:
MONITORING AND EVENT MANAGEMENT OF CRITICAL INFRASTRUCTURES
Author:
Daniel E. Hernández Romero
Advisors:
Hiram Fernández, Jordi Casademont
Abstract
As cyberattacks are on the rise, enterprises must find a way to secure and monitor its critical
IT assets in order to minimize any impact upon successful attacks. Critical Infrastructures
are not only reduced to the Government and Public Sector; any kind of running business has
some kind of IT infrastructure that is critical to the development of its daily operations.
The present thesis delivers the design of a secure network architecture to monitor a critical
infrastructure. It features basic perimeter security consisting of high-availability firewalls, a
DMZ to properly isolate the internal network, a central location to store logs from selected
hosts, and a Security Operations Centre based on a SIEM software (Splunk), making real-
time monitoring possible via informational dashboards.
Last of all, an alert scheme is implemented: an e-mail is sent out from Splunk should a critical
service go down in the Critical Infrastructure.

ii
To everyone who found time to lend an ear
amidst syslogs’ cries.
To my family my strength and tide,
to C and her gliding hand in mine.

iii
Acknowledgements
I’d like to express my immense gratitude towards Hiram’s mentorship throughout the
development of the project, for always pointing in a direction that’s always technologically
fruitful and challenging. For Jordi’s availability and counselling. Troubleshooting is a rocky
slope, thank you for paving the road.

iv
Revision history and approval record
Revision Date Purpose
0 17/05/2016 Document creation
1 29/06/2016 Document revision
Written by: Reviewed and approved by:
Date 29/06/2016 Date 29/06/2016
Name Daniel Hernández Romero Name Jordi Casademont
Position Project Author Position Project Supervisor

v
Table of contents
Abstract ........................................................................................................................................................................... i
CHAPTER 1.................................................................................................................................................................... 1
Introduction.................................................................................................................................................................. 1
1.1. Objectives ................................................................................................................................................... 1
1.2. Scope ............................................................................................................................................................ 2
1.3. Project Timeline ...................................................................................................................................... 3
CHAPTER 2.................................................................................................................................................................... 4
Background ................................................................................................................................................................... 4
2.1. Virtualized Environment ..................................................................................................................... 4
2.2. Firewall Usage .......................................................................................................................................... 5
2.3. Dual-Firewall DMZ ................................................................................................................................. 5
2.4. Critical Infrastructure ........................................................................................................................... 6
2.4.1. Critical Infrastructures within a business ........................................................................... 6
2.5. Log Files ...................................................................................................................................................... 7
2.5.1. Syslog implementations ............................................................................................................. 7
2.5.2. Event Log Monitoring and Event Correlation .................................................................... 7
2.6. Security Information and Event Management (SIEM) ............................................................ 8
2.6.1. Choosing a SIEM ............................................................................................................................. 8
CHAPTER 3.................................................................................................................................................................... 9
Project Development ................................................................................................................................................ 9
3.1. Architecture Overview .......................................................................................................................... 9
3.1.1. Subnets Definition ......................................................................................................................... 9
3.1.2. Resources....................................................................................................................................... 11
3.1.3. Oracle Virtual Box ...................................................................................................................... 12
3.1.4. Virtual Switch Configuration ................................................................................................. 12
3.1.5. Thin Clients ................................................................................................................................... 14
3.1.6. Firewall Installation and Configuration ............................................................................ 15
3.1.7. Centralized Logging Server .................................................................................................... 28
. Critical Infrastructure ................................................................................................................................ 31
3.2. SIEM ........................................................................................................................................................... 40

vi
3.2.1. Network Configuration ............................................................................................................ 40
3.2.2. Splunk ............................................................................................................................................. 40
3.2.3. Getting Data In ............................................................................................................................. 42
3.2.4. Search App and Big Data Analysis ....................................................................................... 44
3.2.5. Relevant Events ........................................................................................................................... 45
3.2.6. Correlating Events ..................................................................................................................... 45
3.2.7. Dashboards ................................................................................................................................... 47
3.2.8. Alert Generation ......................................................................................................................... 53
CHAPTER 4................................................................................................................................................................. 57
Results .......................................................................................................................................................................... 57
4.1. Real-Time Monitoring via Dashboards ....................................................................................... 57
4.2. Customizable Alert Generation ...................................................................................................... 58
CHAPTER 5................................................................................................................................................................. 59
Project Budget .......................................................................................................................................................... 59
5.1. Open-Source ........................................................................................................................................... 59
5.2. Initial Costs ............................................................................................................................................. 59
CHAPTER 6................................................................................................................................................................. 60
Conclusions ................................................................................................................................................................ 60
6.1. Scope completion ................................................................................................................................. 60
6.2. Recommendations ............................................................................................................................... 60
References .................................................................................................................................................................. 61
Appendix ..................................................................................................................................................................... 63

vii
List of Figures
Project Gantt Chart .................................................................................................................................................... 3
Dual Firewall DMZ Architecture .......................................................................................................................... 6
Splunk Integrations .................................................................................................................................................. 8
Top level view of the network architecture ................................................................................................. 10
Architecture deployment in Oracle Virtual Box Manager ...................................................................... 12
Oracle Virtual Box Available Internal Networks ........................................................................................ 13
Extra interface configuration via VBoxManage.exe tool ......................................................................... 14
Network configuration for Internal Firewall Client Manager (Debian) ........................................... 15
Network configuration for External Firewall Client Manager (Ubuntu) ......................................... 15
Initial pfSense configuration setup .................................................................................................................. 16
WebConfigurator’s login prompt for the External Primary Firewall ................................................ 16
Interface configuration for External Primary Firewall ............................................................................ 17
Interface configuration for Internal Primary Firewall. ............................................................................ 17
Interface configuration for External Backup Firewall. ............................................................................ 17
Interface configuration for Internal Backup Firewall. ............................................................................. 17
Internal Primary Firewall Home Dashboard ............................................................................................... 18
pfSense Top Toolbar .............................................................................................................................................. 19
CARP-type Virtual IP creation ............................................................................................................................ 19
Final Virtual IP configuration for common gateway usage.................................................................... 20
High-Availability configuration is accessed through the main toolbar ............................................ 20
PFSYNC protocol handles sync communication between the firewalls ........................................... 21
Synchronization settings between the Primary and Backup Firewall .............................................. 21
CARP status on the Internal Firewall Cluster .............................................................................................. 22
NTP service configuration on the External Firewall Cluster ................................................................. 23
NTP server configuration on SIEM system ................................................................................................... 23
NTP service configuration on the Internal Firewall Cluster .................................................................. 24
DNS Forwarder enablement on the Internal Firewall Cluster.............................................................. 24
DNS Resolver configuration on the External Firewall Cluster. ............................................................ 25
The DNS Server on the Internal Firewall Cluster is the External Firewall Cluster ...................... 25
The DNS Server on the External Firewall Cluster is Google. ................................................................. 25

viii
Gateways on the Internal Firewall Cluster: DMZ (10.0.125.0/24) ..................................................... 26
Gateways on the External Firewall Cluster: DMZ (10.0.125.0/24) and Internet (WAN) ......... 26
Internal Firewall Cluster Rules: LAN interface ........................................................................................... 26
Internal Firewall Cluster Aliases ....................................................................................................................... 27
Central Logging Server Network configuration .......................................................................................... 28
Central Logging Server’s Routing Table ......................................................................................................... 28
TCP/UDP log reception modules on rsyslog.conf ...................................................................................... 29
Logging template on rsyslog.conf ..................................................................................................................... 29
Inherent rsyslog logging rules ........................................................................................................................... 30
Central Logging Server Directory tree, Internal Firewall Cluster Logs ............................................ 30
Critical Infrastructure’s network configuration ......................................................................................... 32
Critical Infrastructure’s routing table and DNS query ............................................................................. 33
EasyPLC Program Editor: Main sequence for water tank filling ......................................................... 33
Water Supply Tank simulation on EasyPLC. HMI System is running. ............................................... 34
Critical Infrastructure Processes. VirtualPLC is running. ....................................................................... 34
SNARE Remote Control Configuration ........................................................................................................... 35
SNARE Network configuration .......................................................................................................................... 36
SNARE Objectives Configuration ...................................................................................................................... 37
Log in Lastest Events tab: C:\EasyPLC\HMILib was accessed ............................................................. 37
Splunk Enterprise login page ............................................................................................................................. 38
Local Performance counter definition ............................................................................................................ 38
Adding logging for running services ............................................................................................................... 39
Sample of event logging for memory and processor counters ............................................................. 39
Forward Data configuration on the Critical Infrastructure ................................................................... 39
SIEM static network configuration .................................................................................................................. 40
Splunk installation directory tree and scripts ............................................................................................. 40
Starting up Splunk Enterprise ............................................................................................................................ 41
Splunk home and Settings tab ............................................................................................................................ 41
Splunk listening on TCP port 9997 for cooked data ................................................................................. 42
Splunk Data Inputs ................................................................................................................................................. 42
Splunk listening on UDP port 6160 intended for Snare logs ................................................................. 43
Host resquest restriction ..................................................................................................................................... 43
Search App main screen ....................................................................................................................................... 44
Example search query ........................................................................................................................................... 45

ix
Example sub search query ................................................................................................................................... 45
Transaction command usage .............................................................................................................................. 46
Search query for % of CPU utilization ............................................................................................................ 47
CPU Utilization dashboard. ................................................................................................................................. 47
Search query for the % of Memory Utilization ........................................................................................... 48
Memory in Use dashboard ................................................................................................................................... 48
Audit Directory Service Access .......................................................................................................................... 49
Windows Folder Audit configuration ............................................................................................................. 49
Search query .............................................................................................................................................................. 50
The Home Dashboard for folder access includes a time picker ........................................................... 50
Running Services search query ......................................................................................................................... 51
Services Dashboard ................................................................................................................................................ 51
Query for Critical Processes counter ............................................................................................................... 52
Processes Runtime Dashboard .......................................................................................................................... 52
Search query that generates the alert ............................................................................................................. 53
Alert configuration window ................................................................................................................................ 53
Triggered action: send email. ............................................................................................................................. 54
Alert email configuration. .................................................................................................................................... 54
Splunk Mail Server configuration ..................................................................................................................... 55
[email protected] SMTP activity extracted directly from Gmail ............................ 56
History of triggered alerts by Process DOWN ............................................................................................. 56
General History of triggered alerts .................................................................................................................. 56
Home Dashboards ................................................................................................................................................... 57
Alert email, as received, from the SIEM ......................................................................................................... 58

x
List of Tables
Table 1. Active resources ........................................................................................................................................ 6

1
CHAPTER 1
Introduction
As cyberattacks are on the rise, companies’ have an urgent need to stay one step
ahead, and keep up with effective early detection and incident response in order to minimize
a possible impact on their networks. Budget destined to financing said protection is not
always as substantial as required; while common attacks on infrastructures—such as
ransomwares and DDoS—may render the whole system useless, ultimately affecting revenue
in the best-case scenario.
Furthermore, Critical Infrastructures are not limited to Governments and Public
Industries, most running businesses have elements within its IT architecture that are crucial
not only for their continuity, but also for the well-being of their population and/or customers.
Every single IT system generates thousands of logs per minute, a gold mine of
information that has to be treated wisely in order to have the massive stream working in our
favour.
Having an appropriate structure to harness machine data, coupled with the adequate
tools to interpret it, has the potential to both determine the infrastructure’s operational
health in real time; and its security posture within its regulatory policy.
The present project is defined within the current trend of big data analysis oriented
towards security events, and its aim is to make basic perimeter security and monitoring
affordable to virtually any company—regardless of their sector—by means of open-source
tools and reasonably priced licensing.
1.1. Objectives
a. Design and provision of a network architecture with the intent of monitoring the
performance of a Critical Infrastructure.
b. Alert generation and early reporting on possible attacks against the Critical
Infrastructure.

2
1.2. Scope
The design and implementation of a security architecture to monitor a Critical
Infrastructure, comprising High-Availability Firewalls, a DMZ, a Central Logging Server,
Management Thin Clients, as well as the network planning regarding VLANS and
segmentation, the inclusion of an event collection and correlation system (SIEM) in order to
be used as a Security Operations Centre (SOC), the simulation of a Critical infrastructure by
means of PLC emulation software, and finally, early detection of a possible attack against said
Critical Infrastructure, in the form of an e-mail alert containing information regarding the
incident.
Moreover, when monitoring performance, the following parameters are taken into
account: RAM, CPU, and Running Services. Security monitoring will be based on logging
events over any attempt to access configuration folders that simulate the Critical
Infrastructure (C:/EasyPLC), and critical processes’ uptime.
Lastly, the entire architecture will be simulated in a virtual environment using Oracle
VirtualBox.

3
1.3. Project Timeline
The present project requires a research stage so as to evaluate and define the appropriate technologies, to define the architecture, sketch
the network planning, and deploy a proof of concept. The technological composition stage follows the research, where the selected instances are
installed, along with the initial configuration and network provision.
The development stage is crucial—and represents the core of the project—as work towards the objectives completion is performed.
Dashboards, event correlation, alert reporting, the core functions of the architecture are configured during this stage. Ultimately, the quality stage
ensures the system’s fine-tuning for optimal performance.
Figure 1. Task list with Gantt chart as extracted from Microsoft Project planning

4
CHAPTER 2
Background
2.1. Virtualized Environment
The process of virtualization pertains to the creation–by software means—of a
virtual version of a technological resource (such as an operating system, a hardware
appliance, or even a shared network resource). The available hardware resources are pooled
in an abstraction layer accommodated between the host (physical machine) and the guest
(virtual machine). [16]
Said abstraction layer manages the host's four main resources (CPU, Memory,
Network Adapters, and Peripherals) so as to dynamically allocate them among the guests,
enabling the cohabitation of multiple virtual machines on the same physical computer.
There are three main types of virtualization:
a. Para-virtualization:
Guest programs are executed within their own isolated environments;
however, since a hardware environment is not completely simulated, said programs
need to be modified in order to run successfully.
b. Partial Virtualization:
Most hardware environment instances are simulated, though not all,
requiring some guest programs to be modified in order to run in the virtualized
environment.
c. Full Virtualization:
The virtual environment is simulated in its entirety [15], enabling an
unmodified guest operating system to run with all its native configuration.

5
2.2. Firewall Usage
Provides means to control incoming and outgoing network traffic based on a
predefined set of rules, it can be either hardware based or software based. Its target is to
establish a barrier between a trusted internal network and an external network (which is
untrusted by default). [13]
There are different types of firewalls, according to their placement within the network and
where exactly is the communication directed:
Packet filters: Operating on a low level TCP/IP layer, they function by preventing packets
from passing through the firewall unless they match an established rule. It may be stateless
or stateful, depending on their capability to maintain context about active sessions to speed
packet processing (where active session information includes IP address, TCP/UDP ports,
connection lifetime, handshakes, etc.)
Application layer firewall: Working on the application level of the OSI model, it may intercept
all type of communication generated by—or towards—a specific application. It analyses all
traffic so as to identify malicious content and drop the packets without acknowledgement to
the sender)
Proxy servers: mainly for internal usage, it acts as a gateway by relaying input packets in the
manner of an application, while blocking other requests. It is widely used to filter user access
by content to ensure the conformity of a policy.
2.3. Dual-Firewall DMZ
Term derived from “demilitarized zone”, it constitutes a perimeter subnetwork
(either physical or logical) that contains external-facing services accessing a largely
untrusted network (e.g. The Internet) [14]
Its purpose is to add an extra layer of security to an organization LAN (Local Area
Network), since no external element has direct access to the internal hosts. It is devised as a
neutral zone, belonging neither to the external network nor the internal network.
The most secure approach is to use two firewalls for this purpose. The first firewall is
external-facing or “front-end” and allows the traffic from the Internet to the DMZ. A second
firewall is internal-facing or “back-end” and only allows traffic from the DMZ to the internal
network.
Any service that requires external access is provided by the front-end firewall and
then forwarded on to the LAN through the back-end firewall.

6
Figure 2. Dual Firewall DMZ architecture
(Retrieved from http://i.stack.imgur.com/JjaRg.png)
2.4. Critical Infrastructure
A critical infrastructure represents an asset or system which is essential for the
maintenance of vital societal functions. It constitutes a wide range of facilities, depending on
the governments’ security directives; however, a common denominator among the USA NIPP
and the EPCIP [1] are:
c. Supply Plants (Gas, Electricity, Water)
d. Oil Production (and subsequent distribution chain)
e. Telecommunications
f. Public Health (hospitals, ambulances)
g. Transportation System.
h. Financial Services (stock exchange, banks)
i. Security Services (military, police)
Any threat against said structures is regarded as a hazard in security, national economic
security, public health. [2]
2.4.1. Critical Infrastructures within a business
A critical infrastructure is also an element within a business’ IT infrastructure that is
crucial to ensure daily operation continuity. Consequently, its protection should not be
specifically oriented towards governments and municipalities; but accessible at an
Enterprise level as well.

7
2.5. Log Files
Virtually every process within a system automatically generates a log instance, where
new lines are appended at the end of the file correlating to the most recent events. These are
critical to have an insight of what the system is actually doing. Since logs are written on local
disks, when the system grows in number of hosts, log management may become a dire task,
overcomplicating the troubleshooting of a particular error. The pragmatic approach is to
setup a centralized logging server in order to aggregate all log information in a common
location.
2.5.1. Syslog implementations
There are native daemons that allow the processing and forwarding of log messages
in UNIX systems, such as rsyslog and syslog-ng. Depending on the scalability requirements
other solutions may be implemented, offering distributed log collectors designed for high-
volume and high throughput event collection (e.g. Splunk, Logstash) [3]
2.5.2. Event Log Monitoring and Event Correlation
The main input for security and performance analysis is via event messages
generated by network assets. A comprehensive record can be maintained, resulting very
useful for later audit procedures.
However, it is of the utmost importance to have an appropriate event correlation.
Only a cross-relation among all events in the system may actually detect an anomaly in the
network, a potential harmful activity may go undetected should the correlation fail to
associate the appropriate events.
A conceptual interpretation procedure where new meaning is assigned to a set of
events that happen within a predefined time interval [4]. During the event correlation
process, new events might be inserted into the event stream and original events might be
removed.
The following event correlation approaches may be taken:
a. Rule based, events correlated according to conditions and actions, specifically
tailored by security analysts.
b. Codebook based, a specific chain of events interpreted as a main transaction
events. In order to correlate a stream of events, the codebook interprets vectors
to its own codebook of main events.
c. Graph based, the focus shifts to hardware devices, where a relation among these
is established beforehand. A graph is constructed and then is used to find the root
cause of a fault event.
d. Neural network based, the highest known type of detection. Based on neural net
training to detect anomalies based on a big data learning approach of an event
stream.

8
2.6. Security Information and Event Management (SIEM)
Common endpoint for logs and events, network-wide, assisting security analysis, and
enhancing the possibility to react faster upon any security threat [5]. Its main functions are:
Data aggregation: receiving data from various sources. Centralization of information.
Correlation: Linking events together, finding common attributes in order to turn data into
useful information.
Alerting: Correlated events provide a deeper insight into what needs to be investigated with
the utmost importance.
Dashboards: Aiding in real-time monitoring, enhances the assistance in recognising patterns
and anomalies-that otherwise would be very hard to find out via log entries.
2.6.1. Choosing a SIEM
The basic requirement is that of a tool to help manage and analyse log files on
premise, centralized, that is able to support a wide range of log formats, and handle the
majority of Operating Systems without overcomplicating its initial setup and configuration.
Preferably open-source and counting with a free licensing alternative.
Not only does Splunk counts with all of the above, it also offers wide options to
organize and display the information by means of charts, dashboards and tables, it also
counts with the possibility to include plugins in order to process most types of log formats
and technologies.
Figure 3. Splunk Integrations
(Retrieved from http://blog.takipi.com/log-management-tools-face-off-splunk-vs-logstash-vs-sumo-logic/)
There is little difference between its free, open-source version, and its paid version.
Mostly differentiating in technical support and indexing capacity. The user is able to perform
a full deployment with no limit to the number of hosts, searches, alerts, correlations or
reports, having the only constraint of a daily indexing volume of 500 MB, which is enough for
a controlled environment at a reduced scale. Furthermore, there are different licence types
according to the needs.

9
CHAPTER 3
Project Development
3.1. Architecture Overview
The highlighting feature of the design is its High-Availability cluster, provided by a
stand-by redundancy both in the front-end and internal Firewalls. The synchronization is
routed towards a separate VLAN, and should the failover be performed, the stand-by backup
Firewall will receive the signal over said VLAN and immediately take over the routing and
firewalling tasks.
Moreover, a DMZ has been implemented in order to minimize to the minimum degree
the external exposure of the critical network. All outbound traffic towards the Internet
generated by the internal network should expressly be routed towards the DMZ and then
towards the exterior, making a two-step rule through the aforementioned Firewalls.
Lastly, any attack from the exterior will be focused solely on a single interface on the
front-end Firewall, shielding the internal network and the Critical Infrastructure.
3.1.1. Subnets Definition
There are no DHCP servers in the architecture, mainly to prevent queries from
unknown hosts to associate to the network as well as a possible spoofing. Consequently, a
static routing has been established, ensuring the most secure approach from the networking
perspective.
All subnets have been defined within the Internet Engineering Task Force’s (IETF)
RFC1918 “Address Allocation for Private Internets”, corresponding to 24-bit block addresses
(single class A networks, beginning in 10.0.0.0/8), expressly reserved by the Internet
Assigned Numbers Authority (IANA) for private networking.

10
The network is consisted of 7 subnets:
10.0.0.0/24: Internal network – Internal FW management, Syslog Server
10.0.15.0/24: Internal network – Internal FW high-availability synchronization
10.0.25.0/24: Internal network – SIEM traffic
10.0.35.0./24: Internal network – Critical Infrastructure
10.0.100.0/24: Internal network – External FW management
10.0.115.0/24: Internal network – External FW high-availability synchronization
10.0.125.0/24: DMZ – Services gateways
Figure 4. Top level view of the network architecture

11
3.1.2. Resources
The main Operation System choice is based on open-source availability and clarity in
development documentation. Debian and Ubuntu have been chosen for the ThinClient,
Syslog Server, and SIEM implementations; whereas FreeBSD has been chosen for the firewall
deployment (by default, due to pfSense platform). The distribution is as follows:
MACHINE OS INT IP VIRTUAL IP GATEWAY USERS
Front Primary Firewall
pfSense 2.2.6 x64
WAN Default - -
admin LAN 10.0.100.1 10.0.100.15 -
SYNC 10.0.115.1 10.0.115.15 -
DMZ 10.0.125.11 10.0.125.15 -
Front Backup Firewall
pfSense 2.2.6 x64
WAN Default - -
admin LAN 10.0.100.2 10.0.100.15 -
SYNC 10.0.115.2 10.0.115.15 -
DMZ 10.0.125.12 10.0.125.15 -
Front ThinClient
Ubuntu 15.10 x64
enp0s3 10.0.100.20 - 10.0.100.15 fwmgmt
Internal Primary Firewall
pfSense 2.2.6 x64
DMZ 10.0.125.1 10.0.125.5 -
admin
LAN 10.0.0.1 10.0.0.15 -
SYNC 10.0.15.1 10.0.15.15 -
SIEM 10.0.25.1 10.0.25.15 -
INFR 10.0.35.1 10.0.35.15 -
Backup Firewall
pfSense 2.2.6 x64
DMZ 10.0.125.2 10.0.125.5 -
admin
LAN 10.0.0.2 10.0.0.15 -
SYNC 10.0.15.2 10.0.15.15 -
SIEM 10.0.25.2 10.0.25.15 -
INFR 10.0.35.2 10.0.35.15 -
Internal ThinClient
Debian 8.3.0 x64
eth0 10.0.0.20 - 10.0.0.15 fwmgmt
Syslog Server Debian
8.3.0 x64 eth0 10.0.0.10 - 10.0.15.15 logadmin
Splunk Ubuntu
15.10 x64 enp0s3 10.0.25.10 - 10.0.25.15 splunkadmin
Critical Infrastructure
Windows 7 Ethernet
1 10.0.35.10 - 10.0.35.15 infradmin
Table 1. Active resources

12
3.1.3. Oracle Virtual Box
Figure 5. Architecture deployment in Oracle Virtual Box Manager
A virtualized environment has been chosen in order to simulate the system, and test-
drive the theoretical design. Oracle Virtual Box provides a reliable and scalable platform to
manage Virtual Machines, along with its own Network Manager to host local connections
within the environment.
For a full description of all network interface configuration, including Internal
Networks, Drivers, and number of adapters by Virtual Machine, appendix (section 1) may be
consulted.
3.1.4. Virtual Switch Configuration
Given that all routing among Virtual Machines is static, it would be necessary to
incorporate a Virtualized Switch to handle all VLAN traffic. However, Oracle Virtual Box
reckons said need, and provides internal networking switching via its Internal Network
option when configuring virtualized hardware adapters in a Virtual Machine. It suffices to
specify the correct VLAN name, the rest is handled seamlessly, provided that all subnet
segmentation is done properly within the guest OS.

13
Figure 6. Oracle Virtual Box Available Internal Networks
VLAN mapping onto Oracle Virtual Box, achieved via the aforementioned Internal Network option, has been implemented as follows:
10.0.0.0/24: int_management
10.0.15.0/24: int_sync
10.0.25.0/24: int_siem
10.0.35.0./24: int_infrastructure
10.0.100.0/24: front_management
10.0.115.0/24: front_sync
10.0.125.0/24: front_dmz
The visual interface constraints the maximum number of available adapters to four;
however, more may be added via command line using the VBoxManage.exe tool [6], as can be
seen in the following figure:

14
Figure 7. Extra interface configuration via VBoxManage.exe tool
Looking at figure 7, the step-by step configuration is interpreted as follows:
a. Modify Virtual Machine INTBCKP, enable Network Interface Card #5 (NIC5) and
attach to an internal network.
b. NIC5’s internal network is “int_infrastructure” (correlating to 10.0.35.0/24 in the
architecture design)
c. Set the promiscuous mode on NIC5 to “Allow VMs” (hides all host traffic from this
VM but allows the VM to see traffic from/to other VMs) so, the only networking
that can be done is within the design.
d. Emulate the Ethernet Am79C970A PCnet-PCI II onto NIC5 (selected as the
standard network hardware for all the elements in the design, for its driver is
supported in most OS distributions by default)
e. Set the cable connection to on (may be turned off in the event of a hot-plug
troubleshoot)
3.1.5. Thin Clients
Clients with reduced functionality, their only purpose is to serve as an administrative
tool to manage firewalls. They’re completely isolated from the Internet, and their only
interface is attached to the LAN network of their respective firewall.
The static routing has been configured as follows:

15
Figure 8. Network configuration for Internal Firewall Client Manager (Debian)
Figure 9. Network configuration for External Firewall Client Manager (Ubuntu)
3.1.6. Firewall Installation and Configuration
PfSense is chosen as a free, well-documented, open-source project running on top of
a FreeBSD Linux distribution. It serves both as a firewall and routing platform. It offers a
wide range of features and a packaging system, enabling its further expansion without
adding unnecessary bloatware and its inherent security vulnerabilities.
The installation is carried out with an ISO image over a FreeBSD instance in Oracle
Virtual Box, said ISO can be found in the official website and is free to download.

16
Figure 10. Initial pfSense configuration setup
The above figure shows the opening display after completing the wizard for the
initial configuration (setting time zone, hostname, domain, interface recognition and IP
assignment). Further setup must be done using the webConfigurator, accessible only via the
LAN IP (10.0.100.1) from a terminal’s browser within the same network segment (in this
case, an external thin client with the IP 10.0.100.10)
Figure 11. WebConfigurator’s login prompt for the External Primary Firewall

17
3.1.6.1. Firewall Interfaces
One of the main reasons to choose pfSense over other open-source firewall projects
is its scalability. PfSense is able to accommodate as many interfaces as the network requires,
along with its rulesets and services. These may be configured using the webConfigurator UI
or the command line. [7]
Four firewalls are required for the implementation, two for the external network, and
two for the internal network (each network has its primary firewall and a backup one in
order to enable high availability). The DMZ separates both networks.
The necessary interfaces are allocated via the command line following the design in
figure 4, assigning as many interfaces as network segments attached to each Firewall, and
naming them accordingly. Thus, rendering the following configuration:
Figure 12. Interface configuration for External Primary Firewall
Figure 13. Interface configuration for Internal Primary Firewall.
Similarly, the interface configuration on the backup firewalls is equivalent:
Figure 14. Interface configuration for External Backup Firewall.
Figure 15. Interface configuration for Internal Backup Firewall.

18
3.1.6.2. pfSense User Interface
Once all the interfaces have been assigned with their respective IP addresses, further
configuration may take place. By logging in into the webConfigurator on the Primary Internal
Firewall (IP address: 10.0.0.1), the Home Dashboard is displayed.
This dashboard may be customized to the client’s need, but it generally displays the
Firewall’s hostname, domain, its version, CPU, system’s time, DNS servers, and interfaces’
information and status (up/down).
Figure 16. Internal Primary Firewall Home Dashboard
There’s also a top toolbar with the following options:
a. System (General configuration, high availability and user management)
b. Interfaces (Interfaces setup, renaming, IP addresses, etc)
c. Firewall (Aliases, NAT, rules configuration and Virtual IP setup)
d. Services (configuration of NTP, DHCP, SNMP, WoLAN, among others)
e. VPN (VPN access configuration)
f. Status (event information, from failovers to system logs, FW logs, traffics graphs,
etc)
g. Diagnostics (tools to troubleshoot connectivity issues, firewall states, tables,
packet capture, and its own command prompt )
h. Gold (licensing and membership)
i. Help (wide range of documentation, including community forums, e-books and
Wikis)

19
Figure 17. pfSense Top Toolbar
3.1.6.3. Shared Virtual Addresses
In order to set up the High-Availability cluster, a common gateway must be placed on
each network segment, so as to avoid gateway duplication (or misdirection) once clients join
the network. This can be achieved by creating a Virtual IP (figure 18) that can be used by the
Primary and Backup Firewall interchangeably, regardless of their default interface IP
address.
CARP (Common Address Redundancy Protocol) handles the Firewall Cluster’s high-
availability in pfSense, so a Virtual IP of said type must be added on each interface of the
Primary Firewall.
Figure 18. CARP-type Virtual IP creation

20
Figure 19. Final Virtual IP configuration for common gateway usage
3.1.6.4. Failover Implementation
According to pfSense documentation [7], pfsync transfers state insertion, update, and
deletion messages between firewalls. Each firewall sends these messages out via multicast
on a specified interface. Following the documentation advise, a dedicated interface for said
handling has been defined (SYNC) due to the amount of synchronization traffic.
Figure 20. High-Availability configuration is accessed through the main toolbar
The failover configuration is stated in the Primary (master) Firewall, said
configuration will be mirrored in the specified Backup Firewall by means of pfsync protocol.
As shown in the figure below, after the interface choice, the peer IP address is
entered. It is important that both firewalls have mirrored management settings so as to act
as a single cluster.

21
Figure 21. PFSYNC protocol handles sync communication between the firewalls
Following the sync communication setup, it is time to choose what states shall be
synchronized by selecting the specific settings:
Figure 22. Synchronization settings between the Primary and Backup Firewall

22
Furthermore, the current state of the redundancy setting may be checked at all times
following the main toolbar: Status > CARP (failover)
Figure 23. CARP status on the Internal Firewall Cluster
3.1.6.5. Gateway Services
A set of services have been put in place in order to let the system run smoothly. A key
component, for example, is the system time. All elements across the network should be
synchronized so as to achieve the required precision when logging an event. The very
implementation of a SIEM is purposeless if the recorded events are off time. No early
response can be carried out for events arriving with irregular timestamps.
In order to synchronize all timestamps, a central NTP (Network Time Protocol)
service has been conceived. The External Firewall Cluster gets its time from the closest
Network Time Foundation’s pool server [8] and listens on the DMZ interface for any NTP
queries.

23
Figure 24. NTP service configuration on the External Firewall Cluster
Figure 25. NTP server configuration on SIEM system
Moreover, the Internal Firewall Cluster listens on all its interfaces and solves internal
NTP queries after getting the time from the External Firewall Cluster by querying the DMZ
gateway. Internal clients, such as the SIEM and Syslog Server query directly their respective
gateways (Internal Firewall Cluster’s Virtual IP) for time synchronization.

24
Figure 26. NTP service configuration on the Internal Firewall Cluster
Following the same basis, a DNS Resolver and DNS Forwarder have been
implemented. The Internal Firewall Cluster receives DNS queries from the internal network
(listening on all its interfaces) and forwards said queries towards the External Firewall
Cluster via the DMZ Upstream Gateway (DMZUPSTRM).
Figure 27. DNS Forwarder enablement on the Internal Firewall Cluster
Moreover, the External Firewall Cluster listens on its own interfaces, and solves all
queries by using Google’s servers.

25
Figure 28. DNS Resolver configuration on the External Firewall Cluster.
Figure 29. The DNS Server on the Internal Firewall Cluster is the External Firewall Cluster
Figure 30. The DNS Server on the External Firewall Cluster is Google.
Lastly, the DMZUPSTRM has been envisioned to route traffic from the internal
network through the DMZ towards the external network, and even to the Internet (if allowed
by the firewall ruleset)

26
Gateways on the Internal Firewall Cluster: DMZ (10.0.125.0/24)
Figure 31. Gateways on the External Firewall Cluster: DMZ (10.0.125.0/24) and Internet (WAN DHCP)
3.1.6.6. Firewall Rulesets
In order to control what traffic is allowed to enter an interface on the firewall, a
ruleset must be established. Firewall rules on interfaces process traffic in the inbound
direction, following a top-down manner and stopping on the first match. If no user-defined
rule is matched the traffic in question is denied by default; however, the default rule on the
LAN interface prevents a possible lockout by allowing the LAN subnet to any destination (to
be used for management purposes). Only traffic explicitly allowed in the interface ruleset
shall be passed.
Figure 32. Internal Firewall Cluster Rules: LAN interface

27
They are managed via the main top toolbar in Firewall > Rules. There is a tab for
each defined interface. Moreover, system aliases can be defined to simplify the ruleset
definition and make it more user-friendly. By navigating to Firewall > Aliases, not only can
client IP addresses be defined, but also groups, ports, and even URLs.
Figure 33. Internal Firewall Cluster Aliases
3.1.6.7. Log Forwarding
Each firewall has been set up to forward all of its logs towards the Central Logging Server, as
illustrated in the following figure:
Figure 34. Remote logging configuration for the External Firewall Cluster

28
3.1.7. Centralized Logging Server
In order to maintain an organized stream of security events, a central logging server
has been implemented. All firewall security logs, as well as any system events—including
failover and synchronization—are being routed towards a central location for convenient
storage and forwarding towards the SIEM.
3.1.7.1. Network Configuration
The Syslog Server belongs in the Internal Network, more specifically in the
10.0.0.0/24 subnet, its gateway is the Internal Firewall Cluster LAN interface (10.0.0.15),
and its DNS nameserver is the Internal Firewall Cluster’s DMZ gateway. By default, its traffic
is routed through its aforementioned Firewall gateway.
Figure 35. Central Logging Server Network configuration
Figure 36. Central Logging Server’s Routing Table

29
3.1.7.2. Log Reception
Log reception has been provided by Linux’s native service rsyslog (Rocket-Fast
System for Log Processing), enabling listener modules on TCP and UDP ports 514.
Figure 37. TCP/UDP log reception modules on rsyslog.conf
Figure 38. Logging template on rsyslog.conf
Logs are organized and stored in the central server using a template
definition, as seen in figure 39. The template is named “security” and registers every
log by filing them under the directory /var/log/security by hostname and program
name.

30
Figure 39. Inherent rsyslog logging rules
Moreover, the configuration rules inherent to rsyslog capture all standard linux log
files and stores them by facility (figure 40), resulting in an orderly tree that reinforces an
efficient SIEM event lookup. In the figure below, the Internal Firewall Cluster’s logs are
shown: ntp synchronizations, logins, ruleset matchs, shutdowns, among other system events.
Figure 40. Central Logging Server Directory tree, Internal Firewall Cluster Logs

31
3.1.7.3. Log Forwarding and Folder Monitor
Finally, once all the system’s logs are properly received and stored, it is time to
forward them on to the SIEM. For said purpose, an instance of Splunk has been used: “Splunk
Universal Forwarder”.
This instance is based on a daemon named splunkd that monitors specified folders on
the local disk and forwards them on to an specified host in outputs.conf (as shown in the
figure below, in this case, on to the SIEM over TCP port 9997)
Figure 41. Print of the outputs.conf contents
Figure 42. List of monitored folders, towards the end: /var/log/security
.

32
Critical Infrastructure
The main objective of the project is to be able to monitor the system performance of
an infrastructure that is deemed critical by EU directives. The physical performance (e.g.
Main function of the Infrastructure) and physical security (Access Controls, Procedures, etc.)
are considered out of scope of the project, so as to focus on a software level functionality.
3.1.7.4. Network Configuration
Figure 43. Critical Infrastructure’s network configuration
The Critical Infrastructure belongs in the Internal Network, more specifically in the
10.0.35.0/24 subnet, its gateway is the Internal Firewall Cluster INFRA interface
(10.0.35.15), as well as its DNS nameserver. By default, its traffic is routed through its
aforementioned Firewall gateway.

33
Figure 44. Critical Infrastructure’s routing table and DNS query
3.1.7.5. EasyPLC
In order to emulate a Critical Infrastructure within the EU security mainframe, a PLC
program running on Windows has been put in place for the purpose of simulating a water
supply facility. EasyPLC has been the software of choice, following the open-source focus and
its convenient library. Furthermore, a demo sequence has been modified and customized for
said purpose, accommodating two tanks (a digital one and an analogue one) along with a
control panel to simulate the entire physical environment.
Figure 45. EasyPLC Program Editor: Main sequence for water tank filling

34
Figure 46. Water Supply Tank simulation on EasyPLC. HMI System is running.
Moreover, the crucial aspect of the project is to ensure the real-time monitoring of
said simulation, regardless of its physical function. The critical processes that must be
reported on are:
a. VirtualPLC.exe *32: in charge of the PLC virtualization, a program is loaded onto
said virtual PLC and then set in run mode.
b. HMI_System.exe *32: “Human Interface Module”, responsible of presenting the
visual information of the system to the operational personnel.
Figure 47. Critical Infrastructure Processes. VirtualPLC is running.

35
The objective is to set up an alarm in the Security Operation Centre should any of the
aforementioned processes go down; however, Windows registers an abundant amount of
security logs for every single system event.
3.1.7.6. Processing and Forwarding Windows Security Events
Forwarding the entirety of Windows events towards the SIEM presents a burden on
the network in traffic volume, while also diminishing the SIEM’s index capacity (500MB per
day for the free version).
In order to avoid noise and unessential event logging in the network, there must be a
pre-processing and log filtering before the forwarding. Two widely available, open-source
tools are used for said purpose, each with different intent:
a. SNARE
Acronym for System Intrusion Analysis and Reporting Environment, collects Windows
audit log data from a host system and pushes said data to a server in order to facilitate a
centralized log analysis and reporting. It is considered as the “de facto standard for Windows
event retrieval” and complies with the majority of information security guidelines related to
eventlog collection and system auditing. [9]
It functions as an agent on the host system with a web-based interface for configuration,
reachable on https://localhost:6161.
Figure 48. SNARE Remote Control Configuration

36
Several parameters may be configured both in the Network Configuration and Objectives Configuration tabs, more specifically and relevant to the project:
Figure 49. SNARE Network configuration
The Destination Server Address is targeted towards the SIEM over UDP port 6160.
SNARE is given the appropriate permission to automatically set the audit configuration for
the objects that are to be monitored.
The output format is set to Syslog, so as to keep compatibility with UNIX systems, and the
Priority (available only if Syslog is selected) is set to “Emergency”, overriding the criticality
at the reception.
Said configuration has been tailored to reach the main objective for which SNARE
implementation within the project has been devised: monitoring folder access.

37
Figure 50. SNARE Objectives Configuration
For the event filtering, the following guidelines were configured via the Objectives Configuration tab, as shown in the figure 50:
Exclude Event IDs:
4656 (A handle to an object was requested)
4688 (A new process has been created)
4690 (An attempt was made to duplicate a handle to an object)
Exclude Processes matching any instance of “Splunk” (such as Splunkd)
Include User Group Management Events
Include Reboot Events
Include File Events that match the directory C:\EasyPLC\*
Figure 51. Log in Lastest Events tab: C:\EasyPLC\HMILib was accessed
Lastly, all filtered events may be seen in the Latest Events tab, a very useful tool when
troubleshooting log collection within the SIEM.

38
b. Splunk Heavy-Forwarder
In order to complement SNARE’s share of log forwarding, an instance of Splunk has been
installed onto the Critical Infrastructure, specifically to cover the rest of the objective: to
monitor the system performance.
Said instance is configured to monitor exclusively performance counter parameters, and
forward a certain set of field extractions on to the SIEM. This is commonly known as a Heavy
Forwarder, since it performs a previous processing before data forwarding. It provides a
stream of cooked data.
Figure 52. Splunk Enterprise login page
The Local Performance Monitoring may be found by navigating through the main
toolbar in Data Settings > Data Inputs > Local Performance Monitoring. Three performance
counters have been defined: CriticalInfraMemory, CriticalInfraProcessor, and CriticalInfraProcess, in order to monitor the percentage of committed memory bytes in use,
percentage of processor time, and monitor both VirtualPLC and HMI_System, respectively.
The polling interval may be adjusted as required, in seconds, so as to accommodate
the real-time monitoring feature of the proposed main objective.
Figure 53. Local Performance counter definition
39
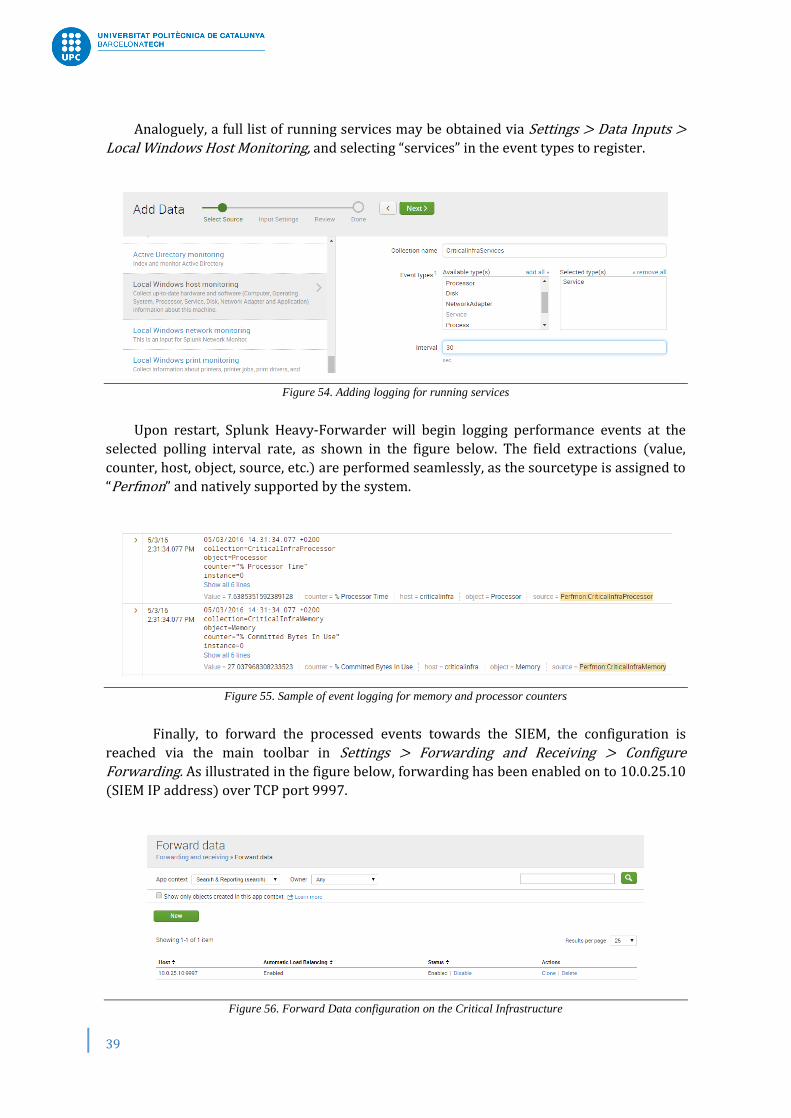
Analoguely, a full list of running services may be obtained via Settings > Data Inputs > Local Windows Host Monitoring, and selecting “services” in the event types to register.
Figure 54. Adding logging for running services
Upon restart, Splunk Heavy-Forwarder will begin logging performance events at the
selected polling interval rate, as shown in the figure below. The field extractions (value,
counter, host, object, source, etc.) are performed seamlessly, as the sourcetype is assigned to
“Perfmon” and natively supported by the system.
Figure 55. Sample of event logging for memory and processor counters
Finally, to forward the processed events towards the SIEM, the configuration is
reached via the main toolbar in Settings > Forwarding and Receiving > Configure Forwarding. As illustrated in the figure below, forwarding has been enabled on to 10.0.25.10
(SIEM IP address) over TCP port 9997.
Figure 56. Forward Data configuration on the Critical Infrastructure

40
3.2. SIEM
3.2.1. Network Configuration
The SIEM belongs in the Internal Network, more specifically in the 10.0.25.0/24
subnet; its gateway is the Internal Firewall Cluster SIEM interface (10.0.25.15), as well as its
DNS nameserver. By default, its traffic is routed through its aforementioned Firewall
gateway.
Figure 57. SIEM static network configuration
3.2.2. Splunk
The package corresponding to the Enterprise Edition was retrieved from Splunk’s
official website and decompressed onto the root folder. The corresponding scripts and
libraries are appropriately set in place by default, as shown in figure 58, so no further action
must be taken apart from running the program for the first time.
Figure 58. Splunk installation directory tree and scripts

41
Figure 59 shows the command to run Splunk, it binds several ports on start-up (such
as TCP 8000 for management), validates indexes, starts the Splunk Server daemon, among
other preliminary checks.
Figure 59. Starting up Splunk Enterprise
Upon start-up completion, a web server is made available on 127.0.0.1 (alternatively,
localhost, or siem, being the latter its hostname) and TCP port 8000, thus providing the main
user interface for configuration. Furthermore, the main GUI is loaded, accessible from any
common web browser (figure 60)
Figure 60. Splunk home and Settings tab

42
3.2.3. Getting Data In
In order to index data coming from the Centralized Logging Server and the Critical
Infrastructure’s Heavy Forwarder, a listener on TCP port 9997 must be configured. This may
be done by navigating to Settings > Forwarding and Receiving
Figure 61. Splunk listening on TCP port 9997 for cooked data
On one hand, the SIEM is able to index events coming from said sources without
worrying about field extractions or source types, since the data stream has been pre-
processed in the origin. Its task is to identify and index incoming events for further analysis.
On the other hand, there is still uncooked data that is being forwarded to the SIEM
(i.e. Snare) that must be indexed in order to ultimately have the complete network event
stream. For this purpose, a new listener must be configured, as shown in the figure below, in
Settings > Data Inputs > UDP
Figure 62. Splunk Data Inputs

43
Snare is forwarding Windows Security Events targeting UDP port 6160, so a new
listener is to be created, in order to acknowledge said stream. Additionally, the source
hostname is overridden so as to match the data coming from the pre-processed events (i.e.
criticalinfra), along with the source type “windows_snare_syslog”, which provides the
adequate field extractions to index the data uniformly.
Figure 63. Splunk listening on UDP port 6160 intended for Snare logs
Moreover, a host restriction is set in place by accepting exclusively UDP data from the
Critical Infrastructure, with the aim of making up for the lack of handshake in the UDP
protocol.
Figure 64. Host resquest restriction

44
3.2.4. Search App and Big Data Analysis
The core development of the project, apart from providing the supporting
architecture to monitor the performance of a Critical Infrastructure, is analysing what is
going on in the network. Being able to differentiate, group, correlate and manage a massive
amount of events in order to extract relevant information, and present it to the Security
Analyst in a convenient and orderly manner.
Figure 65. Search App main screen
Once the information stream is being properly indexed by Splunk, the appropriate
field extraction is performed (according to the incoming source type), by extracting the
relevant information from the raw logs and made available for subsequent querying over
field tags.
Splunk Search App’s commands provide the required flexibility to handle from the
most basic functions to the most complex ones. A Splunk search is performed by means of
commands and arguments that chained together in conjunction with a pipe character “|”
results in a filtered event output.
It supports keywords, quoted phrases, Boolean expressions, wildcards, field names,
and comparison expressions. Generally, a common query will include a field (from the
available extracted fields) and an argument or value. When entering several fields, the AND
operator is implied. For example:

45
Figure 66. Example search query
The query above returns three events from the host “criticalinfra” and source
“Perfmon:CriticalInfraProcessor” (associated to the % of CPU Committed Bytes) within a 1
minute window.
Moreover, subsearches may be performed by means of brackets and the usage of the
“search” command. For example:
Figure 66. Example sub search query
The figure above shows a query for the latest 5 events from the host “criticalinfra”
having “Perfmon:CriticalInfraProcessor” as their source.
A table with the full command guide has been annexed in the appendix (section 2)
with their usage. The most relevant and applicable to the project are: transaction, eval, table,
and search.
3.2.5. Relevant Events
Once all the information can be located in the SIEM, it is of the utmost importance to
identify which events are relevant to the actual monitoring, especially for Windows, given
the high amount of event types generated.
For instance, for security events generated by attempts to access an object, Windows
Event ID 4663 [11] is of interest. However, due to the high amount of irrelevant events
generated by Windows, several of them must also be filtered out (such as Event ID 4656,
4688, and 4690)
3.2.6. Correlating Events
The key aspect of data analysis is finding a relationship among seemingly unrelated
events to work out the system analysis and monitoring, whether it is matching time, source,
object, or even a combination of relevant fields.

46
Splunk supports event correlations using time and geographic locations, transactions,
sub-searches, field lookups, and joins. However, the main focus will be on the command
transaction, since it enables event grouping (ideal for the high amount of Windows events)
when a unique ID identifier is not sufficient to discriminate between events (Windows’
Handle and PID are reused) [10]
The command transaction aggregates events according to specified constraints, it
functions by analysing the raw data from each event, along with the time and date of the
earliest member. Additionally, two new fields are generated to help the analysis: duration
and eventcount.
Figure 67. Transaction command usage
Take the query above, for example, and all requests for objects contained in the
EasyPLC folder. The transaction command is used to group events that have the same
process as object requester, narrowing down the information from 158 events (the total sum
of the column eventcount down to just 4 main events.

47
3.2.7. Dashboards
In order to present the relevant information in a visual manner, dashboards have
been configured so as to aid the security analyst in identifying anomalies in the Critical
Infrastructure’s performance. Several parameters have been selected for said task:
Percentage of CPU Utilization
Figure 68. Search query for % of CPU utilization
The above figure illustrates the query to retrieve the counter for the CPU utilization.
It is described as follows: all events from the Critical Infrastructure are evaluated, more
specifically, those generated by the performance counter “Perfmon:CriticalInfraProcessor”.
Afterwards, a timestamp modification is performed in order to keep exclusively the hour in
24H format, followed by an evaluation with the purpose of rounding the Processor
percentage to the most significant two decimals. Finally, a table is drafted to visualize the
formatted time with their respective value.
The query is then routed onto a panel in the Home Dashboard, as depicted in the
figure below:
Figure 69. CPU Utilization dashboard.

48
Percentage of Memory in Use
Figure 70. Search query for the % of Memory Utilization
Analogously, for the memory performance counter, a similar query is performed and
described as follows: gather all events from the Critical Infrastructure generated by the
Memory performance counter. Create a variable named “Time” in order to store the
timestamp in 24H format. Similarly, create another variable named “Memory” and store the
Memory percentage value rounded to the two most significant decimals. Finally, draft a table
with Time and Memory.
Next, a Home Dashboard is created with the information from the previous table
(Time in the X-axis, and Memory in the Y-axis) for its monitoring.
Figure 71. Memory in Use dashboard

49
Access to Configuration Folder
The access to the PLC’s configuration folder is yet another feature to monitor in the
Critical Infrastructure. This is slightly more complicated, since a number of previous on-site
Windows configurations must be performed in order to have the required security events.
First, the Local Security Policy must be accessed, and via Local Policies > Audit Policy any success or failure attempt to access a directory must be audited.
Figure 72. Audit Directory Service Access
Then, the target folder’s advanced properties (in this case, C:\EasyPLC\) allow a special
security configuration. By following Security > Auditing > Add, a new auditing entry may be
added as seen in the figure below:
Figure 73. Windows Folder Audit configuration

50
The folder has been configured to generate an audit security event with any of the
following attempts on its main folder or subfolders:
a. Traverse folder / execute file
b. List folder / read data
c. Create files / write data
d. Create folders / append data
e. Delete subfolders and files
f. Delete
Furthermore, back in the SIEM, the following search query renders the dashboard to
monitor the aforementioned accesses.
Figure 74. Search query
The search query has the following rationale: gather all Windows 4663 events with
message “an attempt was made to access an object” that were generated on the folder
“C:\EasyPLC” and its subfolders, and explicitly not generated by a PLC process. Then, the
variable Action will host the message “Folder Accessed” instead of the actual system message
“An attempt was made to access an object.”
Now, in order to group and consolidate duplicated events onto a single event, the
transaction command is used to correlate folders accessed at the same time, regardless of its
Handle ID. Finally, a table is drafted with the most relevant information: timestamp, the
action, folder accessed, process name, and account name, as represented in the figure below.
Figure 75. The Home Dashboard for folder access includes a time picker

51
Running Services
In order to retrieve the service list previously generated in the Critical Infrastructure,
the following query is performed:
Figure 76. Running Services search query
Gather all events generated by the source criticalinfraservices, group them by the same
time and State (since two lists are generated with the same timestamp: running services, and
stopped services), then perform a new search for the desired State, and keep only the latest
result. Lastly, for cosmetic purposes DisplayName is renamed as Service.
The Home Dashboard shows the latest Running Services list.
Figure 77. Services Dashboard

52
Monitoring Critical Processes
As mentioned previously, the core of the monitoring of the Critical Infrastructure’s
function can be abstracted to the monitoring of its main processes, namely, HMI_System.exe
(Human-Machine Interface System) and VirtualPLC.exe (PLC emulation)
Figure 78. Query for Critical Processes counter
Gather all performance events generated by CriticalInfraProcess, group them by time
and its instance (VirtualPLC/HMI_System), and retain the latest result for each instance.
The variable uptime will hold the latest runtime value, in minutes, without decimals;
whereas the variable time_diff will have the time difference, in seconds, between the latest’
result arrival time and the current time (the search must always be run in a real-time
window).
The variable status will be set to “Process UP” should the time difference be less than the
polling interval plus a 10% safeguard (current polling interval has been set to 90 seconds, as
shown in figure 53; if the time difference is greater than the polling interval-meaning that no
performance event has arrived recently, thus assuming there might be a process outage.
Lastly, the flag mail_alert will be raised should the process status be “Process DOWN”.
Figure 79. Processes Runtime Dashboard
Finally, the Home Dashboard for the monitoring of HMI_System.exe and
VirtualPLC.exe can be seen in the figure above.

53
3.2.8. Alert Generation
In order to ensure an early incident response alerts can be set up to notify when a
certain condition has been met.
Figure 80. Search query that generates the alert
Splunk searches can be conveniently saved as alerts. The figure above shows a query
based on the Critical Processes’ home dashboard. The objective is to send an email should
any of the aforementioned processes exits. An additional line has been added to the original
query so as to search for raised flags. By going on the upper right-hand corner and selecting
Save As > Alert, the following window shows up:
Figure 81. Alert configuration window
The relevant configuration pertaining the alert is its trigger condition set to Per-Result basis, and its type set to Real-time, so the system will be continuously monitoring the
variable mail_alert. Now, it does not suffice to trigger an alert, an action must be added.
Splunk offers several options regarding this aspect, including running a script, and
posting to a specified URL (HTTP POST). The selected option for this project, however, is the
email notification, as seen in the following figure:

54
Figure 82. Triggered action: send email.
The figure below shows the email format configuration:
To: recipient’s email.
Priority: set to Highest, this is reflected upon the email’s receipt.
Subject: “Splunk Alert: CRITICAL PROCESS DOWN”
Message: fully customizable, variables regarding the alert generation may be used,
such as the trigger time in hours, minutes, and seconds.
Include: a PDF may be included for traceability purposes, as well as the inline result
of the search query (raw event data related to the process’ last polling)
Figure 83. Alert email configuration.

55
In order to actually send out the email, a provider must be set. The implementation of a
SMTP server was considered; however, it represents an unjustified workload for the actual
return when there are more viable solutions, such as Gmail.
An email account was created under the name [email protected], and by
disabling the two-step sign-in verification it could be automated to serve as Splunk’s default
Mail Server.
This is done going to Settings > Server Settings > Email Settings and configuring Gmail’s
SMTP parameters (URL, port, and encryption protocol), along with the account’s information,
as shown in the figure below.
Figure 84. Splunk Mail Server configuration
Evidence of automation can be found by actually login in the management account on
Gmail, and clicking on the bottom right-hand corner on “Details” to see the history of account
activity by type, as the following figure illustrates:

56
Figure 85. [email protected] SMTP activity extracted directly from Gmail
Lastly, the history of triggered alerts can be consulted directly on the Operations Centre,
by selecting Activity > Triggered Alerts, and also, by navigating to the specific alert type on
Settings > Searches, reports, and alerts > Process DOWN.
Figure 86. History of triggered alerts by Process DOWN
Figure 87. General History of triggered alerts

57
CHAPTER 4
Results
4.1. Real-Time Monitoring via Dashboards
As seen in the figure below, the Critical Infrastructure’s performance can be monitored
remotely from the Security Operations Centre. Security information such as accesses to the
PLC configuration folder and Running Windows Services are also displayed.
Figure 88. Home Dashboards
Moreover, its critical processes are monitored in real-time, should one of these go
down an alert is triggered and an email is sent.
These parameters and views may be personalised according to the client’s needs and
specifications, however, it could also be offered as a basic display setting, and further on
expanded in bundle with other security services additions.

58
4.2. Customizable Alert Generation
Any type of information found in the SIEM can be reported externally, the current
project proposed an alert based on a Critical Infrastructure’s process availability and SMTP
delivery. However, this may be easily scalable to essentially any security event generated in
the system (account logins, sudo command executions, firewall rules match or blocked traffic,
etc.) and a customizable delivery method, such as an immediate HTTP post to a specified
URL, or a hard copy log in a remote server.
Figure 89. Alert email, as received, from the SIEM

59
CHAPTER 5
Project Budget
5.1. Open-Source
The open-source focus is centred on the free distribution and development, not only
does it enhance the financial viability of the project, but it also offers the possibility of
tailoring said project to the final client’s needs and shape it in the most technologically
adequate way for further scalability. Tools like pfSense and Splunk are found in the avant-
garde of said focus, providing all of the above plus an optional premium choice, should more
out-of-the-box functionality—or extended features—be needed.
5.2. Initial Costs
The main cost is derived from the personnel worktime invested in developing the
project, since the entirety of the tools at hand are open source and readily available with a
computer and a working Internet connection.
Amount of days dedicated to background training: 19 (152 hours)
Amount of days dedicated to the technical composition: 12 (96 hours)
Amount of days dedicated to the development and fine tuning: 22 (176 hours)
Total amount of hours: 424
Price per hour: 8.00 €
Splunk 1GB/day yearly license 1,700 € [12]
Project cost: 5,092.00 €

60
CHAPTER 6
Conclusions
6.1. Scope completion
The Critical Infrastructure’s performance can be monitored by implementing Splunk
as a SIEM, and ultimately acting as an Operations Centre for a Security Technician.
Furthermore, the option to fine-tune parameters is flexible enough so as to adjust the project
specifically to the client’s needs.
A basic security mainframe has been provided, including high availability firewalls
with restricting rulesets, a dual-firewall DMZ providing the minimum possible area for attack,
a central logging server for convenient storage, and a SIEM with an alert scheme to ensure an
early incident response.
6.2. Recommendations
This project has been envisioned to provide the backbone of a secure architecture
oriented towards monitoring Critical Infrastructures; however, it would be ideal to
complement it with additional security elements.
Most of these additional solutions may be implemented natively in pfSense (e.g. an
IPS and IDS via Snort package inclusion). Also, with an adequate investment, even more
interesting solutions may be achieved, such as a DLP (Data Loss Prevention), NAC (Network
Access Control) and Antivirus deployment, choosing from flagship security vendors, such as
McAfee, Kaspersky, FireEye, among others.
Depending on the client’s needs, Oracle VirtualBox may not fulfil Enterprise
requirements in terms of scalability, technical support, or internal regulations. Generally, it is
preferred to rely on licensed solutions like Citrix Xenserver, and benefit from its guaranteed
24/7 support, wider framework, upgrades, hot-fixes and continuous updates.
Lastly, the present project may be aimed towards clients with critical monitoring
needs who are lacking the resources for a proprietary solution, such as small towns wanting
to ensure their traffic light systems are always running, and farms employing automated
mechanisms to count their livestock running on a SCADA system.

61
References
[1] Crisis and Terrorism, Migration and Home Affairs. “Critical Infrastructures”.
European Commission, 2016. [Online] Available: http://ec.europa.eu/dgs/home-
affairs/what-we-do/policies/crisis-and-terrorism/critical-infrastructure/index_en.htm
Accessed on May 2016
[2] Homeland Security. “Partnering for Critical Infrastructure Security”. NIPP, 2103.
[Online] Available:
https://www.dhs.gov/sites/default/files/publications/NIPP%202013_Partnering%20for%
20Critical%20Infrastructure%20Security%20and%20Resilience_508_0.pdf
Accessed on May 2016
[3] J. Wilder, “Centralized Logging” Jason Wilder’s Blog, 2012. [Online] Available:
http://jasonwilder.com/blog/2012/01/03/centralized-logging/
Accessed on May 2016
[4] G. Jakobson, M. Weismann, “Real-time telecommunications network management:
extending event correlation with temporal constraints”. Proceedings of the fourth international symposium on Integrated network management IV, pp 290-301, Chapman &
Hall, Ltd. London, UK, 1995.
Accessed on May 2016
[5] A, Lane. “Understanding and Selecting SIEM/LM: Use Cases, Part 1”. Securosis, 2016.
[Online] Available: https://securosis.com/blog/understanding-and-selecting-siem-lm-use-
cases-part-1
Accessed on May 2016
[6] Oracle Corporation, “Oracle VM VirtualBox User Manual, Chapter 8: VBoxManage”
VirtualBox, 2016. [Online] Available:
https://www.virtualbox.org/manual/ch08.html#vboxmanage-modifyvm
Accessed on May 2016
[7] pfSense Documentation, “How many interfaces does pfSense support” pfSense, 2015.
[Online] Available:
https://doc.pfsense.org/index.php/How_many_interfaces_does_pfSense_support
Accessed on May 2016

62
[8] Network Time Foundation, “NTP: The Network Time Protocol”. The NTP Project, 2014. [Online] Available: http://www.ntp.org/
Accessed on June 2016
[9] Intersect Alliance, “SNARE: System Intrusion Analysis & Reporting Environment.
Guide to SNARE for Windows”. [Online] Available: https://www.intersectalliance.com/wp-
content/uploads/user_guides/Guide_to_Snare_for_Windows-4.2.pdf
Accessed on June 2016
[10] Microsoft Developer Network. “.NET Framework: Process.Id Property” Microsoft MSDN, 2016. [Online] Available: https://msdn.microsoft.com/en-
us/library/system.diagnostics.process.id(v=vs.110).aspx
Accessed on June 2016
[11] Windows Security Log Encyclopaedia, “Windows Security Log Events” Ultimate Windows Security, 2016. [Online] Available:
https://www.ultimatewindowssecurity.com/securitylog/encyclopedia/Default.aspx
Accessed on June 2016
[12] Learn Splunk “How much splunk costs?” LearnSplunk, 2016. [Online] Available:
http://www.learnsplunk.com/splunk-pricing---splunk-licensing-model.html
Accessed on June 2016
[13] Microsoft TechNet “Perimeter Firewall Design” Microsoft Library, 2016. [Online]
Available: https://technet.microsoft.com/en-us/library/cc700828.aspx
Accessed on June 2016
[14] D, Shinder. “Strengthen network defences by using a DMZ” Techrepublic, 2005.
[Online] Available: http://www.techrepublic.com/article/solutionbase-strengthen-network-
defenses-by-using-a-dmz/
Accessed on June 2016
[15] Oracle Corporation, “Virtualization” Oracle VM Virtualbox, 2016. [Online] Available:
https://www.virtualbox.org/wiki/Virtualization
Accessed on June 2016
[16] IBM Global Education. “Virtualization in Education” IBM, 2007. [Online] Available:
http://www.techrepublic.com/article/solutionbase-strengthen-network-defenses-by-using-
a-dmz/
Accessed on June 2016

63
Appendix
Section 1: VM Network Configuration in VirtualBox:
a. VM according to their network segment and their OS description

64
b. Network configuration for the External Firewall Cluster
c. Network Configuration for the Internal Firewall Cluster

65
d. Network Configuration for the Management Clients
e. Network Configuration for the Central Logging Server
f. Network Configuration for the SIEM and Critical Infrastructure
Related Documents