MONITORING AND ASSESSING STRUCTURAL DAMAGE IN HISTORIC BUILDINGS Julia Armesto ([email protected]) Pedro Arias ([email protected]) Javier Roca ([email protected]) Henrique Lorenzo ([email protected]) University of Vigo, Spain Abstract In the cultural heritage field, the monitoring of the integrity of structures can greatly benefit from 3D digitising techniques. The aim of deformation analysis and structural surveillance is the early detection of damage in order to be able to react appropriately and in good time. The devices that have been traditionally used in the measurement of fissures, cracks and fractures are contact tools whose application depends on accessibility; moreover, they only provide discrete point measurements rather than giving a continuous record of the damage dimension in the whole affected area, as modern 3D modelling techniques can do. Among these techniques, close range photogrammetry is still the most complete, economical, portable, flexible and widely used approach in architectural applications. This paper is focused on the application of close range photogrammetry in the detection and monitoring of structural damage. The following procedure is proposed: the gathering at different epochs of 3D point clouds in the neighbourhood of cracks; the comparison among the successive point clouds by means of shape parameters; and the application of a bootstrap test for the detection of the significant statistical results. This procedure is applied to the analysis of structural damage detected in a masonry structure of cultural heritage interest: Bası ´lica da Ascensio ´n, located in the north-west of Spain. Keywords: bootstrap test, close range photogrammetry, heritage conservation, structural monitoring Introduction Monuments and heritage sites provide structures of great value, since they are proof of historic forms of life and the history of modern societies, and show the existence of a tangible cultural identity. The architectural heritage gives a distinctive aspect to its environment, constitutes one of the essential elements of the rural and urban landscape, and, furthermore, a tourist resource of great importance for many rural communities. Nowadays, the architectural and cultural heritage is recognised as a fragile and irreplaceable resource that should be preserved and transmitted to future generations (UNESCO, 1972). However, protection policies are not always as efficient as they should be, to which could The Photogrammetric Record 23(121): 36–50 (March 2008) Ó 2008 The Authors. Journal Compilation Ó 2008 The Remote Sensing and Photogrammetry Society and Blackwell Publishing Ltd. Blackwell Publishing Ltd. 9600 Garsington Road, Oxford OX4 2DQ, UK and 350 Main Street Malden, MA 02148, USA.

Welcome message from author
This document is posted to help you gain knowledge. Please leave a comment to let me know what you think about it! Share it to your friends and learn new things together.
Transcript
MONITORING AND ASSESSING STRUCTURAL DAMAGEIN HISTORIC BUILDINGS
Julia Armesto ([email protected])
Pedro Arias ([email protected])
Javier Roca ([email protected])
Henrique Lorenzo ([email protected])
University of Vigo, Spain
Abstract
In the cultural heritage field, the monitoring of the integrity of structures cangreatly benefit from 3D digitising techniques. The aim of deformation analysis andstructural surveillance is the early detection of damage in order to be able to reactappropriately and in good time. The devices that have been traditionally used in themeasurement of fissures, cracks and fractures are contact tools whose applicationdepends on accessibility; moreover, they only provide discrete point measurementsrather than giving a continuous record of the damage dimension in the whole affectedarea, as modern 3D modelling techniques can do. Among these techniques, closerange photogrammetry is still the most complete, economical, portable, flexible andwidely used approach in architectural applications. This paper is focused on theapplication of close range photogrammetry in the detection and monitoring ofstructural damage. The following procedure is proposed: the gathering at differentepochs of 3D point clouds in the neighbourhood of cracks; the comparison among thesuccessive point clouds by means of shape parameters; and the application of abootstrap test for the detection of the significant statistical results. This procedure isapplied to the analysis of structural damage detected in a masonry structure ofcultural heritage interest: Basılica da Ascension, located in the north-west of Spain.
Keywords: bootstrap test, close range photogrammetry, heritage conservation,structural monitoring
Introduction
Monuments and heritage sites provide structures of great value, since they are proof ofhistoric forms of life and the history of modern societies, and show the existence of atangible cultural identity. The architectural heritage gives a distinctive aspect to itsenvironment, constitutes one of the essential elements of the rural and urban landscape,and, furthermore, a tourist resource of great importance for many rural communities.Nowadays, the architectural and cultural heritage is recognised as a fragile and irreplaceableresource that should be preserved and transmitted to future generations (UNESCO, 1972).However, protection policies are not always as efficient as they should be, to which could
The Photogrammetric Record 23(121): 36–50 (March 2008)
� 2008 The Authors. Journal Compilation � 2008 The Remote Sensing and Photogrammetry Society and Blackwell Publishing Ltd.
Blackwell Publishing Ltd. 9600 Garsington Road, Oxford OX4 2DQ, UK and 350 Main Street Malden, MA 02148, USA.
be added lack of interest on the part of individual citizens and an adverse socio-economicclimate in rural areas. As an example, on many buildings the passage of time has caused agreat deal of damage to the materials, including partial or total degradation of the structureas a whole.
One of the causes of the partial or total degradation of a structure is the result of stressesthat exceed the resistance to flexion, traction or compression of the construction materials. Theconsequence of an overload is the appearance of fissures, cracks or fractures. When this type ofdamage is detected, it is necessary to carry out monitoring and control procedures in order tocheck the stability of the area and quantify the development of the damage. This then assistsdecisions about the urgency of restoration work necessary to avoid further structural decay.
Techniques that have been traditionally used in the measurement of fissures, cracks andfractures normally involve contact tools that incorporate on the one hand an attachment systemto be fixed to the structure and, on the other hand, a measuring system—usually one-dimensional—through a graduated bar or potentiometric measurements. These systems canachieve high precision (better than a few millimetres) but they have a great inconvenience, thatis, their application depends on accessibility, and in any case, they provide discrete pointmeasurements in place of giving a continuous record of the extent of damage in the whole areaaffected, such as can be provided by modern 3D digitising techniques.
The effective use of non-contact 3D modelling techniques in industry (for example, byTucker and Kurfess, 2006; Ruan et al., 2007); medicine (Malian et al., 2005); computer vision(Dias et al., 2006) and other fields has also engendered a spectacular advance in thegeometrical documentation of heritage assets. An archive gathered over time provides valuableinformation when restoration is required. Furthermore, high resolution models can assistformal studies of individual properties; in the case of damaged works of art or monuments, thedigital model can provide reference data as an exact guide to the restoration needed. In recentyears, numerous research papers have been published that deal with the documentation ofheritage assets using 3D modelling techniques. Guidi et al. (2004) focused on creating amethodology to monitor fragile wooden sculptures over the years giving special attention tomodelling accuracy and quality control procedures. Pereira et al. (2004) cover the acquisitionof architectural archives using different techniques and instrumentation and the comparison ofresults in terms of accuracy. Valzano et al. (2005) and El-Hakim et al. (2006) accomplish thevirtual reconstruction of heritage sites, the former for interpretation and entertainment purposeswhile the latter focuses on inferring the original appearance of a site. Recently Alves andBartolo (2006) developed a novel system for the rapid generation of 3D computer models fromexisting buildings that allow a direct link to rapid prototyping systems. Finally, in Arias et al.(2007b) low-cost photogrammetric techniques are compared to traditional methods in thegraphic and metric documentation of traditional buildings.
In the cultural heritage field, the monitoring of the integrity of structures can also greatlybenefit from 3D modelling techniques. The main aim of deformation analysis and structuraldamage surveillance is the early detection of damage in order to be able to react appropriatelyand in good time. Much effort has been devoted to investigations of deformation analysis andof structural testing and monitoring by non-contact techniques. Pieraccini et al. (2001)reviewed the state of the art of 3D acquisition and digitising techniques applied to heritagemonitoring. Mills et al. (2001) described the measurement of deformation of a pavement fromstereoscopic imagery using both analytical and digital photogrammetric instrumentation. Dareet al. (2002) accomplished automatic crack detection and measurement in single digital images.Maas and Hampel (2006) discussed the major hardware and software modules of a toolbox forcivil engineering materials testing and large structure monitoring. Ergun and Baz (2006)addressed the use of a digital photogrammetric expert measurement system for deformation
The Photogrammetric Record
� 2008 The Authors. Journal Compilation � 2008 The Remote Sensing and Photogrammetry Society and Blackwell Publishing Ltd. 37
measurements on concrete surfaces. Arias et al. (2007a) showed a multidisciplinary approachto structural analysis of historic masonry bridges involving close range photogrammetry andground-penetrating radar techniques, as well as the development of structural models based onfinite elements. Despite these interesting approaches much work remains to be done.
Measuring and Monitoring the Growth of Cracks: Statement of the Problem
In order to establish an adequate system for measuring and monitoring cracks in heritagemonuments, which should be non-destructive and involve long periods of time (Woodhouseet al., 1999), it is necessary to take into account the environment in which such measurementsare required, establish an adequate procedure for the comparison of 3D models and finallydetermine the value of the results obtained.
Conventionally, for detecting deformations, estimated coordinates obtained from leastsquares adjustment of observations of the same points made at different epochs are comparedwith each other by using statistical tests, commonly congruency testing (Welsch and Heunecke,2001). Therefore, this procedure is called conventional or geometrical analysis, and requiresthe alignment of successive models into a common coordinate system or referringmeasurements to a common fixed reference. Some examples of the feasibility of this systemcan be found in Mokarrami and Ebadi (2004), Robson et al. (2004) and Parian et al. (2006).Alternatives to this system based on estimation of coordinates are the comparison of matchedsurfaces (Gruen and Akca, 2005) and shape signatures (Cardone et al., 2003).
When measuring structural damage to heritage monuments, it is convenient to take intoaccount that:
(a) It cannot be assumed that all or part of the structure or any other element of itssurroundings will not move.
(b) Natural or artificial features with a definite defined geometry are not always availableto provide a precise reference frame.
(c) Because of the time intervals between successive measurements (months or years) it isundesirable for both aesthetic and functional reasons to use fixed targets as checkpoints.
A viable alternative is to compare point clouds or surface shape signatures that do not varyin relation to the coordinate systems used, such as the geometrical parameters taken from theshape of the object (Cardone et al., 2003).
This paper is focused on the application of close range digital photogrammetry in themonitoring of structural damage to heritage monuments. This technique has been chosen sinceit still remains the most complete, economical, portable, flexible and widely used approach inarchitectural applications, as pointed out by Remondino and El-Hakim (2006). A close rangephotogrammetric procedure is proposed based on gathering 3D point clouds for a given crackat different dates, the comparison among the successive clouds of points through shapeparameters and the application of a bootstrap procedure for the detection of the statisticalsignificance of the result. This procedure is applied to the analysis of structural damagedetected on a historic masonry structure, the Basılica da Ascension, in the north-west of Spain.
Methodology
A crack constitutes a particular case in the measuring of objects since it is not a physicalfeature, but a free space between the stones or ashlars that form a wall, in the case of masonryconstructions. The first step in order to measure a crack lies in its definition as a concrete
Armesto et al. Monitoring and assessing structural damage in historic buildings
38 � 2008 The Authors. Journal Compilation � 2008 The Remote Sensing and Photogrammetry Society and Blackwell Publishing Ltd.
geometrical form, and a way of doing it is to define the points of the borders of the ashlars thatlimit the form and width of the crack. Close range photogrammetry allows the spatialcoordinates of these points to be obtained, in a precise manner, such that the crack is perfectlydefined in the three-dimensional space. The temporal analysis is then reduced to two keymatters: on the one hand, obtaining quantitative values of the dimensions of the crack, startingfrom a cloud of points on its border; the other important task to be solved lies in comparingthese quantitative dimensional values adequately, having regard to the statistical significance ofthe comparison. While the first task is indispensable for an objective assessment of thedimensions of the damage, the second is essential to interpreting the results of the comparison.
To measure cracks, the use of the surface area defined by the border points as a shapeparameter to the temporal–dimensional control is proposed, since the computation of thisparameter, starting from the information given by a photogrammetric measurement, is simpleenough and does not require a great volume of calculations. On the other hand, it can beexpected that any relative displacement of the ashlars forming the frame of the crack implies avariation of the value of the surface area described.
Thus, the difference between the area values obtained for the surface of the crack definedfrom the border points in successive epochs can be considered as a valid quantity parameter forthe temporal analysis of a crack. However, a differential value between areas obtained bycomparing two 3D models cannot be taken as a base to give a solid diagnosis, since the spatialcoordinate estimation of the outline points of these models involves a calculation error, an errorthat is transmitted to the area calculation and, consequently, to the final differential valuebetween areas. Thus, it is essential to assess the statistical significance of the result obtained. Todo so, bootstrap methods are used. They are computer-intensive methods of statistical analysisthat use simulation to calculate standard errors, confidence intervals (CI) and significance tests.These methods have been widely applied by quantitative researchers in the life sciences(Figueiras et al., 2005; Cadarso-Suarez et al., 2006; Manly, 2006), environmental sciences(Anderson and Thompson, 2004; Fernandez de Castro et al., 2005; Roca-Pardinas et al., 2005),ecology (Pla, 2004), econometrics (Sperlich et al., 2002) and other areas where statistics areused.
In this section the basis of the proposed procedures for the temporal–dimensional analysisof cracks in heritage monuments is presented. It is organised as follows. In the first section, thebasis for the construction of a photogrammetric model of a studied crack is shown. The surfacedefined by the cloud of points is obtained and its area calculated. This process is common foreach of the successive measurements. In the last section, the application of the bootstrap testfor the calculation of the statistical significance of the results is described.
Photogrammetric 3D Modelling of Cracks
As is well known, close range photogrammetry provides 3D coordinates of any givenpoint located on the surface of the measured object, in this case, the outline of a crack in somepart of a structure. The result of the photogrammetric measurement of a crack at two differentdates is two clouds of points, being fðX i1 ; Y i1 ; Zi1Þg
ni¼1 and fðX j2 ; Y j2 ; Zj2Þg
mj¼1 the
estimated 3D coordinates of the points dating from the first and second measurement,respectively. It is to be expected that these points are distributed randomly around the crackand in theory define the boundary of the same region but cannot in practice guarantee a matchbetween pairs of points.
One of the advantages of current digital photogrammetric work stations based oncollinearity equations and iterative linearised least squares methods (Cooper and Robson,2001), is that they introduce automatic estimators of the adjustment quality, and thus the
The Photogrammetric Record
� 2008 The Authors. Journal Compilation � 2008 The Remote Sensing and Photogrammetry Society and Blackwell Publishing Ltd. 39
accuracy of coordinate estimation (Mason, 1995). The estimation precision offðrX
i1 ; rYi1 ; r
Zi1Þg
ni¼1 and fðrX
j2 ; rYj2 ; r
Zj2Þg
mj¼1 (standard deviations of the estimated coordi-
nates for each point i and j, respectively) depends on many factors, especially the geometryof the individual shots and the redundancy level of the measurements. As the sizes of thesamples of i and j points are increased, the more precise will be the estimates of the cracksize.
A further advantage of the multi-station bundle adjustment is that it permits the evaluationof interior orientation parameters without significant loss of accuracy when cameras have notbeen previously calibrated.
Measurement of the Growth of Cracks: Surface Area Comparison
As has been previously indicated, in order to measure the crack it is necessary totransform the outline cloud of points to a representation at the same scale in each measurement.A way of doing it consists in first defining the enclosed surface by the points that define theborder of the crack in the damaged wall, and then calculating the area. The simplest basicplanar form is the triangle. Delaunay triangulation, commonly used in surveying and mapping,computer vision, finite element analysis and so forth, can be used to approximate the S1 and S2surfaces starting from the clouds of points i and j, respectively.
The area of each component triangle of the surface S1 can be computed as
A ¼ffiffiffiffiffiffiffiffiffiffiffiffiffiffiffiffiffiffiffiffiffiffiffiffiffiffiffiffiffiffiffiffiffiffiffiffiffiffiffiffiffiffiffiffiffiffiffiffiffisðs� d1Þðs� d2Þðs� d3Þ
p
where d1, d2, d3 are the lengths of the sides of the triangle, computed as a function ofthe coordinates of the vertices, and s denotes the semiperimeter. Similarly, the area ofcomponent triangles of S2 is computed. The total areas A1 and A2 of the surfaces S1 and S2are obtained as arithmetical sums of the areas of each of the triangles. The estimated crackgrowth in the time interval between the successive measurements can be obtained throughthe calculation of the arithmetical difference between the estimated areas: cDif ¼ A2 � A1.
Crack Growth Accuracy Assessment: Bootstrap-Based Confidence Intervals
In order to detect whether the true difference Dif = A2 ) A1 is significant, it is necessary tobuild an interval where the hypothetical value Dif is placed with a determined probability. Thatis to say, that the lower limit (LL) and the upper limit (UL) are calculated in a way that thefollowing probability is complied with:
pðLL � Dif � ULÞ ¼ 1� a
where [LL,UL] is a confidence interval (CI) for Dif with a confidence level of 1 ) a.However, in order to build such an interval, it is necessary to know the distribution of theestimation cDif . In this section the bootstrap method is proposed that was introduced byEfron in 1979 (see Efron and Tibshirani, 1993; Hardle and Mammen, 1993; Kauermann andOpsomer, 2003; Roca-Pardinas et al., 2004, 2005), in order to close up the distribution ofcDif , which will allow the corresponding approximated CI to be obtained. The bootstrapmethods are statistical resampling methods to analyse the variability of an estimator Tobtained from a sample X = X1, . . . , Xn of the distribution F. The procedure to approximatethe distribution of T = T(X, F) is as follows:
Armesto et al. Monitoring and assessing structural damage in historic buildings
40 � 2008 The Authors. Journal Compilation � 2008 The Remote Sensing and Photogrammetry Society and Blackwell Publishing Ltd.
(a) Computation of the empirical distribution F nðxÞ ¼ n�1Pn
i¼1 IfXi�xg for b = 1, . . . , B,B being a large number.
(b) Simulation of a random sample X�;b ¼ X �;b1 ; . . . ;X �;bn from the empirical distributionF n (that is, Xi ¼ X �j , probability n)1).
(c) Evaluation of T for the bootstrap sample; the bootstrap version of the statisticT*,b = T(X*,b, Fn) is obtained.
Finally, the distribution of T is approximated through the histogram corresponding to thevalues T*,1, . . . , T*,B.
The variations of the standard method, as the non-parametric bootstrap, parametricbootstrap, smoothed bootstrap or wild bootstrap, differ in the distribution function F that isconsidered in the resampling (Cao-Abad and Gonzalez-Manteiga, 1993; Hardle and Mammen,1993). The original bootstrap procedure may often be modified in order to match thetheoretical model. The selection of the resampling plan is essential in achieving a distributionof T* that properly approximates the distribution of T.
In this case, the bootstrap methodology can be adapted to obtain the CI for A1, A2, andDif = A2 ) A1. The steps are as follows:
Step 1: Starting from the original data fðX i1; Y i1; Zi1Þgni¼1 and fðX j2; Y j2; Zj2Þg
mj¼1, the
estimated areas A1 and A2 are obtained, and the difference cDif ¼ A2 � A1, as explained inprevious sections.
Step 2: The bootstrap samples fðX �bi1 ; Y�bi1 ; Z
�bi1 Þg
ni¼1 and fðX �bj2 ; Y
�bj2 ; Z
�bj2 Þg
mj¼1 are generated
for a large number of repetitions, b = 1, . . ., B. The corresponding values of area A�b1 and A
�b2 ,
and the difference cDif �b ¼ A�b2 � A
�b1 are obtained. The bootstrap replicas have been generated
according to X�bi1 � NðX i1; r
Xi1Þ, Y
�bi1 � NðY i1; r
Yi1Þ, Z
�bi1 � NðZi1; r
Zi1Þ, X
�bi2 � NðX i2;r
Xi2Þ,
Y�b2i � NðY i2; r
Yi2Þ and Z
�bi2 � NðZi2; r
Zi2Þ.
Step 3: Finally the 100% · (1 ) a) limits for the bilateral CI of A1 and A2 are computed by
CIðA1Þ ¼ ð2A1 � A1�a=21 ; 2A1 � Aa=2
1 Þ
CIðA2Þ ¼ ð2A2 � A1�a=22 ; 2A2 � Aa=2
2 Þwhere A
p1 and A
p2 represent the percentiles p of the bootstrapped estimates A
�11 ; . . . ; A
�B1 and
A�12 ; . . . ; A
�B2 .
Moreover, to verify whether the hypothesis A2 > A1 is significant, the unilateral CI for Difis built:
CIðDif Þ ¼ ða;þ1Þ
where a ¼ 2cDif � Dif 1�a, being Dif p the percentile p of cDif �1; . . . ; cDif �B, and a > 0 ischecked.
A Case Study
The Basılica da Ascension in Allariz, north-west Spain (Fig. 1), is important in thenational architectural heritage. The basilica forms part of an important site known as SantaMarina de Augas Santas, which includes an abundance of archaeological remains revealingancient settlement in the area. The construction of the Basılica da Ascension began in the 14th
The Photogrammetric Record
� 2008 The Authors. Journal Compilation � 2008 The Remote Sensing and Photogrammetry Society and Blackwell Publishing Ltd. 41
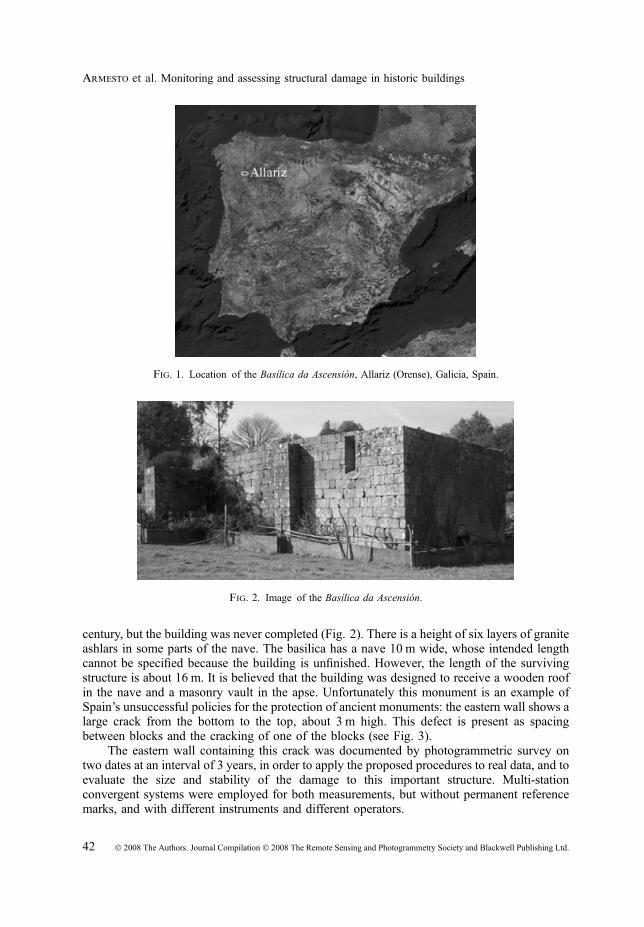
century, but the building was never completed (Fig. 2). There is a height of six layers of graniteashlars in some parts of the nave. The basilica has a nave 10 m wide, whose intended lengthcannot be specified because the building is unfinished. However, the length of the survivingstructure is about 16 m. It is believed that the building was designed to receive a wooden roofin the nave and a masonry vault in the apse. Unfortunately this monument is an example ofSpain’s unsuccessful policies for the protection of ancient monuments: the eastern wall shows alarge crack from the bottom to the top, about 3 m high. This defect is present as spacingbetween blocks and the cracking of one of the blocks (see Fig. 3).
The eastern wall containing this crack was documented by photogrammetric survey ontwo dates at an interval of 3 years, in order to apply the proposed procedures to real data, and toevaluate the size and stability of the damage to this important structure. Multi-stationconvergent systems were employed for both measurements, but without permanent referencemarks, and with different instruments and different operators.
Fig. 1. Location of the Basılica da Ascension, Allariz (Orense), Galicia, Spain.
Fig. 2. Image of the Basılica da Ascension.
Armesto et al. Monitoring and assessing structural damage in historic buildings
42 � 2008 The Authors. Journal Compilation � 2008 The Remote Sensing and Photogrammetry Society and Blackwell Publishing Ltd.
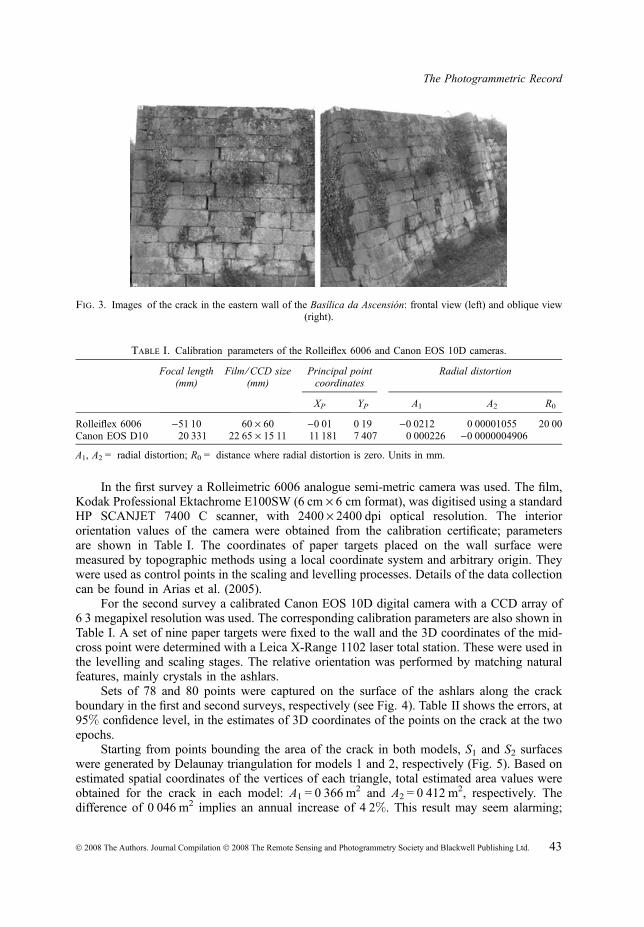
In the first survey a Rolleimetric 6006 analogue semi-metric camera was used. The film,Kodak Professional Ektachrome E100SW (6 cm · 6 cm format), was digitised using a standardHP SCANJET 7400 C scanner, with 2400 · 2400 dpi optical resolution. The interiororientation values of the camera were obtained from the calibration certificate; parametersare shown in Table I. The coordinates of paper targets placed on the wall surface weremeasured by topographic methods using a local coordinate system and arbitrary origin. Theywere used as control points in the scaling and levelling processes. Details of the data collectioncan be found in Arias et al. (2005).
For the second survey a calibrated Canon EOS 10D digital camera with a CCD array of6Æ3 megapixel resolution was used. The corresponding calibration parameters are also shown inTable I. A set of nine paper targets were fixed to the wall and the 3D coordinates of the mid-cross point were determined with a Leica X-Range 1102 laser total station. These were used inthe levelling and scaling stages. The relative orientation was performed by matching naturalfeatures, mainly crystals in the ashlars.
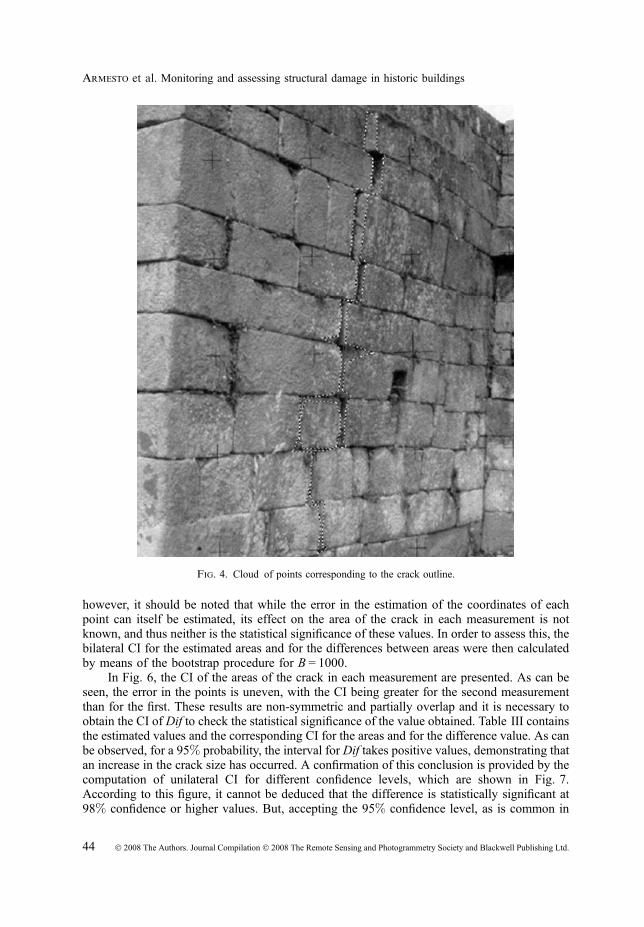
Sets of 78 and 80 points were captured on the surface of the ashlars along the crackboundary in the first and second surveys, respectively (see Fig. 4). Table II shows the errors, at95% confidence level, in the estimates of 3D coordinates of the points on the crack at the twoepochs.
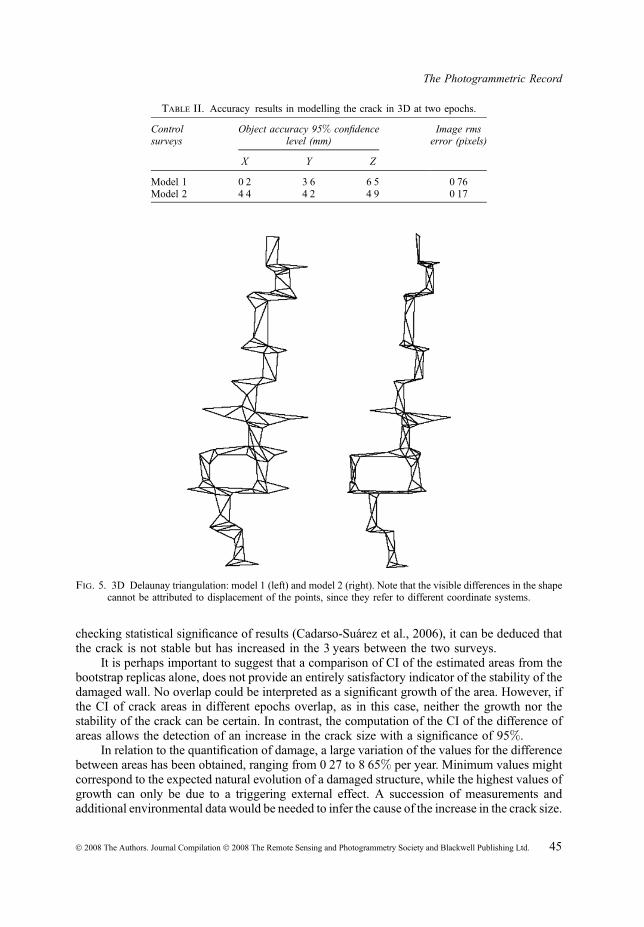
Starting from points bounding the area of the crack in both models, S1 and S2 surfaceswere generated by Delaunay triangulation for models 1 and 2, respectively (Fig. 5). Based onestimated spatial coordinates of the vertices of each triangle, total estimated area values wereobtained for the crack in each model: A1 = 0Æ366 m2 and A2 = 0Æ412 m2, respectively. Thedifference of 0Æ046 m2 implies an annual increase of 4Æ2%. This result may seem alarming;
Fig. 3. Images of the crack in the eastern wall of the Basılica da Ascension: frontal view (left) and oblique view(right).
Table I. Calibration parameters of the Rolleiflex 6006 and Canon EOS 10D cameras.
Focal length(mm)
Film ⁄CCD size(mm)
Principal pointcoordinates
Radial distortion
XP YP A1 A2 R0
Rolleiflex 6006 )51Æ10 60 · 60 )0Æ01 0Æ19 )0Æ0212 0Æ00001055 20Æ00Canon EOS D10 20Æ331 22Æ65 · 15Æ11 11Æ181 7Æ407 0Æ000226 )0Æ0000004906
A1, A2 = radial distortion; R0 = distance where radial distortion is zero. Units in mm.
The Photogrammetric Record
� 2008 The Authors. Journal Compilation � 2008 The Remote Sensing and Photogrammetry Society and Blackwell Publishing Ltd. 43
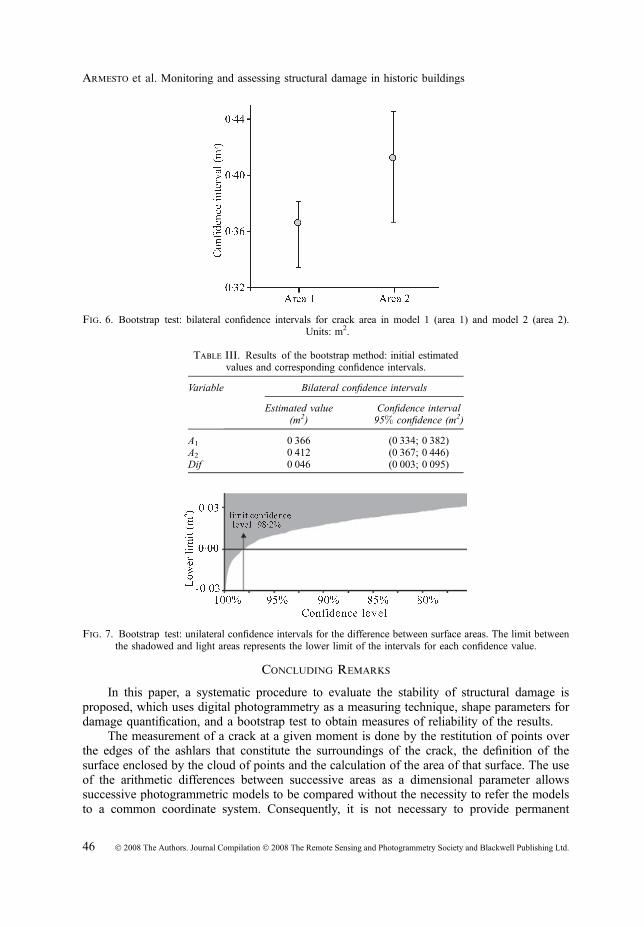
however, it should be noted that while the error in the estimation of the coordinates of eachpoint can itself be estimated, its effect on the area of the crack in each measurement is notknown, and thus neither is the statistical significance of these values. In order to assess this, thebilateral CI for the estimated areas and for the differences between areas were then calculatedby means of the bootstrap procedure for B = 1000.
In Fig. 6, the CI of the areas of the crack in each measurement are presented. As can beseen, the error in the points is uneven, with the CI being greater for the second measurementthan for the first. These results are non-symmetric and partially overlap and it is necessary toobtain the CI of Dif to check the statistical significance of the value obtained. Table III containsthe estimated values and the corresponding CI for the areas and for the difference value. As canbe observed, for a 95% probability, the interval for Dif takes positive values, demonstrating thatan increase in the crack size has occurred. A confirmation of this conclusion is provided by thecomputation of unilateral CI for different confidence levels, which are shown in Fig. 7.According to this figure, it cannot be deduced that the difference is statistically significant at98% confidence or higher values. But, accepting the 95% confidence level, as is common in
Fig. 4. Cloud of points corresponding to the crack outline.
Armesto et al. Monitoring and assessing structural damage in historic buildings
44 � 2008 The Authors. Journal Compilation � 2008 The Remote Sensing and Photogrammetry Society and Blackwell Publishing Ltd.
checking statistical significance of results (Cadarso-Suarez et al., 2006), it can be deduced thatthe crack is not stable but has increased in the 3 years between the two surveys.
It is perhaps important to suggest that a comparison of CI of the estimated areas from thebootstrap replicas alone, does not provide an entirely satisfactory indicator of the stability of thedamaged wall. No overlap could be interpreted as a significant growth of the area. However, ifthe CI of crack areas in different epochs overlap, as in this case, neither the growth nor thestability of the crack can be certain. In contrast, the computation of the CI of the difference ofareas allows the detection of an increase in the crack size with a significance of 95%.
In relation to the quantification of damage, a large variation of the values for the differencebetween areas has been obtained, ranging from 0Æ27 to 8Æ65% per year. Minimum values mightcorrespond to the expected natural evolution of a damaged structure, while the highest values ofgrowth can only be due to a triggering external effect. A succession of measurements andadditional environmental data would be needed to infer the cause of the increase in the crack size.
Table II. Accuracy results in modelling the crack in 3D at two epochs.
Controlsurveys
Object accuracy 95% confidencelevel (mm)
Image rmserror (pixels)
X Y Z
Model 1 0Æ2 3Æ6 6Æ5 0Æ76Model 2 4Æ4 4Æ2 4Æ9 0Æ17
Fig. 5. 3D Delaunay triangulation: model 1 (left) and model 2 (right). Note that the visible differences in the shapecannot be attributed to displacement of the points, since they refer to different coordinate systems.
The Photogrammetric Record
� 2008 The Authors. Journal Compilation � 2008 The Remote Sensing and Photogrammetry Society and Blackwell Publishing Ltd. 45
Concluding Remarks
In this paper, a systematic procedure to evaluate the stability of structural damage isproposed, which uses digital photogrammetry as a measuring technique, shape parameters fordamage quantification, and a bootstrap test to obtain measures of reliability of the results.
The measurement of a crack at a given moment is done by the restitution of points overthe edges of the ashlars that constitute the surroundings of the crack, the definition of thesurface enclosed by the cloud of points and the calculation of the area of that surface. The useof the arithmetic differences between successive areas as a dimensional parameter allowssuccessive photogrammetric models to be compared without the necessity to refer the modelsto a common coordinate system. Consequently, it is not necessary to provide permanent
Fig. 6. Bootstrap test: bilateral confidence intervals for crack area in model 1 (area 1) and model 2 (area 2).Units: m2.
Table III. Results of the bootstrap method: initial estimatedvalues and corresponding confidence intervals.
Variable Bilateral confidence intervals
Estimated value(m2)
Confidence interval95% confidence (m2)
A1 0Æ366 (0Æ334; 0Æ382)A2 0Æ412 (0Æ367; 0Æ446)Dif 0Æ046 (0Æ003; 0Æ095)
Fig. 7. Bootstrap test: unilateral confidence intervals for the difference between surface areas. The limit betweenthe shadowed and light areas represents the lower limit of the intervals for each confidence value.
Armesto et al. Monitoring and assessing structural damage in historic buildings
46 � 2008 The Authors. Journal Compilation � 2008 The Remote Sensing and Photogrammetry Society and Blackwell Publishing Ltd.
reference marks or targets on the building nor to apply alignment systems. An essentialadvantage of this technique as a temporal–dimensional control system for cracks is that it doesnot require direct contact with the structure and allows measurement of cracks which wouldotherwise be difficult to access using traditional methods.
The main obstacle to the application of close range digital photogrammetry in measuringdamaged walls in buildings and its monitoring without a common system of coordinates lies inestablishing the statistical consistency of the quantitative comparison among the 3D models soobtained. This problem is solved by applying a bootstrap test that allows the evaluation of thestatistical significance of estimated changes in the size of the crack as measured in successiveyears, starting from the errors derived from the calculation of the spatial position of the borderpoints of the crack. A limitation of this methodology is that it does not permit the determinationof small rotations in any cracks within a damaged area.
references
Alves, N. M. and Bartolo, P. J., 2006. Integrated computational tools for virtual and physical automaticconstruction. Automation in Construction, 15(3): 257–271.
Anderson, M. J. and Thompson, A. A., 2004. Multivariate control charts for ecological and environmentalmonitoring. Ecological Applications, 14(6): 1921–1935.
Arias, P., Herraez, J., Lorenzo, H. and Ordonez, C., 2005. Control of structural problems in cultural heritagemonuments using close-range photogrammetry and computer methods. Computers and Structures, 83(21 ⁄ 22):1754–1766.
Arias, P., Armesto, J., Di-Capua, D., Gonzalez-Drigo, R., Lorenzo, H. and Perez-Gracia, V., 2007a.Digital photogrammetry, GPR and computational analysis of structural damages in a mediaeval bridge.Engineering Failure Analysis, 14(8): 1444–1457.
Arias, P., Ordonez, C., Lorenzo, H., Herraez, J. and Armesto, J., 2007b. Low-cost documentation oftraditional agro-industrial buildings by close-range photogrammetry. Building and Environment, 42(4): 1817–1827.
Cadarso-Suarez, C., Roca-Pardinas, J., Molenberghs, G., Faes, C., Nacher, V., Ojeda, S. and Acuna,C., 2006. Flexible modelling of neuron firing rates across different experimental conditions: an application toneural activity in the prefrontal cortex during a discrimination task. Journal of the Royal Statistical Society:Series C (Applied Statistics), 55(4): 431–447.
Cao-Abad, R. and Gonzalez-Manteiga, W., 1993. Bootstrap methods in regression smoothing. Journal ofNonparametric Statistics, 2(4): 379–388.
Cardone, A., Gupta, S. K. and Karnik, M., 2003. A survey of shape similarity assessment algorithms forproduct design and manufacturing applications. Journal of Computing and Information Science in Engi-neering, 3(2): 109–118.
Cooper, M. A. R. and Robson, S., 2001. Theory of close range photogrammetry. Close Range Photogrammetryand Machine Vision (Ed. K. B. Atkinson). Whittles, Caithness. 371 pages: 9–51.
Dare, P. M., Hanley, H. B., Fraser, C. S., Riedel, B. and Niemeier, W., 2002. An operational application ofautomatic feature extraction: the measurement of cracks in concrete structures. Photogrammetric Record,17(99): 453–464.
Dias, P., Matos, M. and Santos, V., 2006. 3D reconstruction of real world scenes using a low-cost 3D rangescanner. Computer-Aided Civil and Infrastructure Engineering, 21(7): 486–497.
Efron, B. and Tibshirani, R. J., 1993. An Introduction to the Bootstrap. Chapman and Hall, New York. 436pages.
El-Hakim, S., MacDonald, G., Lapointe, J.-F., Gonzo, L. and Jemtrud, M., 2006. On the digital recon-struction and interactive presentation of heritage sites through time. 7th International Symposium onVirtual Reality, Archaeology and Cultural Heritage (VAST 2006). Nicosia, Cyprus. 9.
Ergun, B. and Baz, I., 2006. Design of an expert measurement system for close-range photogrammetric appli-cations. Optical Engineering, 45(5): 1–5.
Fernandez de Castro, B., Guillas, S. and Gonzalez Manteiga, W., 2005. Functional samples and bootstrapfor predicting sulfur dioxide levels. Technometrics, 47(2): 212–222.
Figueiras, A., Roca-Pardinas, J. and Cadarso-Suarez, C., 2005. A bootstrap method to avoid the effect ofconcurvity in generalized additive models in time-series studies of air pollution. Journal of Epidemiology andCommunity Health, 59(10): 881–884.
The Photogrammetric Record
� 2008 The Authors. Journal Compilation � 2008 The Remote Sensing and Photogrammetry Society and Blackwell Publishing Ltd. 47
Gruen, A. and Akca, D., 2005. Least squares 3D surface and curve matching. ISPRS Journal of Photogrammetry& Remote Sensing, 59(3): 151–174.
Guidi, G., Beraldin, J.-A. and Atzeni, C., 2004. High-accuracy 3D modeling of cultural heritage: the digitizingof Donatello’s ‘‘Maddalena’’. IEEE Transactions on Image Processing, 13(3): 370–380.
Hardle, W. and Mammen, E., 1993. Comparing nonparametric versus parametric regression fits. Annals ofStatistics, 21(4): 1926–1947.
Kauermann, G. and Opsomer, J. D., 2003. Local likelihood estimation in generalized additive models. Scan-dinavian Journal of Statistics, 30(2): 317–337.
Maas, H.-G. and Hampel, U., 2006. Photogrammetric techniques in civil engineering material testing andstructure monitoring. Photogrammetric Engineering & Remote Sensing, 72(1): 39–45.
Malian, A., Azizi, A., van den Heuvel, F. A. and Zolfaghari, M., 2005. Development of a robust photo-grammetric metrology system for monitoring the healing of bedsores. Photogrammetric Record, 20(111): 241–273.
Manly, B. F. J., 2006. Randomization, Bootstrap and Monte Carlo Methods in Biology. Third edition. Chapmanand Hall, London. 455 pages.
Mason, S. O., 1995. Conceptual model of the convergent multistation network configuration task. Photogram-metric Record, 15(86): 277–299.
Mills, J. P., Newton, I. and Peirson, G. C., 2001. Pavement deformation monitoring in a rolling load facility.Photogrammetric Record, 17(97): 7–24.
Mokarrami, A. and Ebadi, H., 2004. Evaluation of geometrical accuracy in displacement monitoring of engi-neering structures using close-range photogrammetry. International Archives of the Photogrammetry, RemoteSensing and Spatial Information Sciences, 35(B5): 753–758.
Parian, J. A., Gruen, A. and Cozzani, A., 2006. High accuracy deformation monitoring of space structures byheuristic simulation. 12th FIG Symposium., 10 pages (on CD-ROM).
Pereira, Z., Morgado, A. and Gomes Pereira, L., 2004. Comparison of different approaches to createarchitectural archives. International Archives of the Photogrammetry, Remote Sensing and Spatial InformationSciences, 35(B5): 552–557.
Pieraccini, M., Guidi, G. and Atzeni, C., 2001. 3D digitizing of cultural heritage. Journal of Cultural Heritage,2(1): 63–70.
Pla, L., 2004. Bootstrap confidence intervals for the Shannon biodiversity index: a simulation study. Journal ofAgricultural, Biological & Environmental Statistics, 9(1): 42–56.
Remondino, F. and El-Hakim, S., 2006. Image-based 3D modelling: a review. Photogrammetric Record,21(115): 269–291.
Robson, S., Bucklow, S., Woodhouse, N. and Papadaki, H., 2004. Periodic photogrammetric monitoring andsurface reconstruction of a historical wood panel painting for restoration purposes. International Archives ofthe Photogrammetry, Remote Sensing and Spatial Information Sciences, 35(B5): 395–400.
Roca-Pardinas, J., Gonzalez-Manteiga, W., Febrero-Bande, M., Prada-Sanchez, J. M. and Cadarso-Suarez, C., 2004. Predicting binary time series of SO2 using generalized additive models with unknown linkfunction. Environmetrics, 15(7): 729–742.
Roca-Pardinas, J., Cadarso-Suarez, C. and Gonzalez-Manteiga, W., 2005. Testing for interactions ingeneralized additive models: applications to SO2 pollution data. Statistics and Computing, 15(4): 289–299.
Ruan, J. K., Ke, Y. L., Fan, S. Q. and Dong, H. Y., 2007. Research on rapid repairing techniques for auto paneldies. Journal of Materials Processing Technology, 187–188: 69–72.
Sperlich, S., Tjøstheim, D. and Yang, L., 2002. Nonparametric estimation and testing of interaction in additivemodels. Econometric Theory, 18(2): 197–251.
Tucker, T. M. and Kurfess, T. R., 2006. Point cloud to CAD model registration methods in manufacturinginspection. Journal of Computing and Information Science in Engineering, 6(4): 418–421.
UNESCO 1972. Convention concerning the protection of the world cultural and natural heritage, Paris, 16thNovember 1972. http: ⁄ ⁄whc.unesco.org ⁄ ?cid=175 ⁄ [Accessed: 15th November 2007].
Valzano, V., Bandiera, A. and Beraldin, J.-A., 2005. Realistic representations of cultural heritage sites andobjects through laser scanner information. 10th International Congress on Cultural Heritage and NewTechnologies (CAA 2005), Vienna, Austria. 12 pages.
Welsch, W. and Heunecke, O., 2001. Models and terminology for the analysis of geodetic monitoringobservations. FIG 10th International Symposium on Deformation Measurements. International Federation ofSurveyors Publication 25. 22 pages.
Woodhouse, N. G., Robson, S. and Eyre, J. R., 1999. Vision metrology and three dimensional visualization instructural testing and monitoring. Photogrammetric Record, 16(94): 625–641.
Armesto et al. Monitoring and assessing structural damage in historic buildings
48 � 2008 The Authors. Journal Compilation � 2008 The Remote Sensing and Photogrammetry Society and Blackwell Publishing Ltd.
Resume
Dans le domaine du patrimoine culturel, on peut tirer un grand benefice del’emploi des techniques de numerisation 3D pour le suivi de l’integrite des structures.La surveillance des structures et l’analyse des deformations constituent l’etapeinitiale de la detection des dommages, de facon a pouvoir intervenir en temps voulu etde facon appropriee. Les dispositifs que l’on a utilises de facon classique pourmesurer les fissures, les lezardes et les cassures sont des outils qui viennent aucontact et sont tributaires de l’accessibilite ; de plus ils ne peuvent fournir que desdeterminations en des points isoles, sans enregistrer de facon tres complete ledommage dans toute sa dimension, comme peuvent le faire les techniques modernesde modelisation 3D. Parmi ces techniques, la photogrammetrie a courte distancereste la solution la plus complete, la plus economique, souple, portable et la plusrepandue dans les applications architecturales. On a centre cet article sur l’emploi dela photogrammetrie a courte distance pour la detection et le suivi des dommages desstructures. On propose de proceder comme suit : saisie a dfferentes epoques denuages de points 3D au voisinage des cassures ; comparaison de ces nuagessuccessifs de points au moyen de parametres lies aux formes ; et utilisation d’unprogramme pour la detection de resultats statistiquement significatifs. On a appliquecette procedure a l’analyse des dommages detectes sur une structure en maconnerieparticulierement interessante du patrimoine culturel : la Basilique de l’Ascension,situee dans le Nord-Ouest de l’Espagne.
Zusammenfassung
Moderne Techniken zur 3D Digitalisierung konnen die Uberwachung vonDenkmalern unterstutzen. Das Ziel einer Deformationsanalyse oder der Uberwa-chung der Struktur von Objekten ist die fruhe Erkennung von Schaden, um rechtzeitiggeeignete Gegenmaßnahmen einleiten zu konnen. Traditionell wurden Gerate zurVermessung von Kluften, Rissen und Bruchen verwendet, die nicht beruhrungsloswaren, und somit einen Zugang zu diesen Objektstellen bedurften. Diese Methodenliefern allerdings immer nur punktuelle Informationen im Messgebiet, anstelle vonkontinuierlichen Aufzeichnungen des gesamten Schadensgebietes, wie es vonmodernen 3D Modellierungstechniken ermoglicht wird. Unter diesen Techniken istdie Nahbereichsphotogrammetrie immer noch das umfassendste Verfahren, tragbar,flexibel und weit verbreitet in allen Architekturanwendungen und Gegenstand auchdieses Beitrags. Folgendes Verfahren wird vorgeschlagen, um strukturelle Schaden zuerkennen und zu uberwachen: (a) die Erfassung von 3D Punktwolken in derNahbarschaft von Rissen, (b) der Vergleich aufeinander folgender Punktwolken durchFormparameter und (c) die Anwendung eines Bootstrap-Systems fur die Erkennungsignifikanter statistischer Ergebnisse. Diese Prozedur wird am Beispiel der Analysestrukturellen Schaden in Mauerwerk der Basılica da Ascension, im NordwestenSpaniens, vorgestellt.
Resumen
En el campo del patrimonio cultural, el seguimiento de la integridad deestructuras puede beneficiarse considerablemente de las tecnicas de digitalizaciontridimensional. El objetivo del analisis de deformaciones y medicion de estructuras
The Photogrammetric Record
� 2008 The Authors. Journal Compilation � 2008 The Remote Sensing and Photogrammetry Society and Blackwell Publishing Ltd. 49
es la deteccion precoz de danos con el fin de reaccionar adecuadamente y a tiempo.Los sistemas empleados tradicionalmente en la medicion de fisuras, grietasy fracturas requieren un contacto directo con la estructura y su aplicacionesta supeditada a la accesibilidad. Ademas, este tipo de herramientas proporcionanunicamente un numero discreto de mediciones puntuales, en lugar de proporcionarun registro continuo de la dimension del dano en toda el area afectada, informacionque se puede obtener con las modernas tecnicas de modelado tridimensional. Entreestas, la fotogrametrıa de objeto cercano es todavıa la mas completa, barata, flexibley ampliamente empleada en aplicaciones arquitectonicas. Este artıculo se ocupa dela aplicacion de la fotogrametrıa de objeto cercano a la deteccion y seguimiento dedanos estructurales. Se propone el siguiente procedimiento de actuacion: restitucionde nubes de puntos en el contorno de una grieta en diferentes fechas, a continuacioncomparacion entre las sucesivas nubes mediante parametros de forma, y finalmenteaplicacion de una prueba de replicacion muestral para medir la significanciaestadıstica de los resultados. Este procedimiento se aplica al analisis de los danosestructurales detectados en una construccion de mamposterıa de un elemento delpatrimonio cultural espanol: la Basılica da Ascension, en el Noroeste de la PenınsulaIberica.
Armesto et al. Monitoring and assessing structural damage in historic buildings
50 � 2008 The Authors. Journal Compilation � 2008 The Remote Sensing and Photogrammetry Society and Blackwell Publishing Ltd.
Related Documents