Land 2015, 4, 337-354; doi:10.3390/land4020337 land ISSN 2073-445X www.mdpi.com/journal/land/ Article Monitoring 60 Years of Land Cover Change in the Marathon Area, Greece Apostolos Gaitanis 1 , Kleomenis Kalogeropoulos 1, *, Vassilis Detsis 2 and Christos Chalkias 1 1 Department of Geography, Harokopio University of Athens, El. Venizelou 70, Athens 17671, Greece; E-Mails: [email protected] (A.G.); [email protected] (C.C.) 2 Department of Home Economics and Ecology, Harokopio University of Athens, El. Venizelou 70, Athens 17671, Greece; E-Mail: [email protected] * Author to whom correspondence should be addressed; E-Mail: [email protected]; Tel./Fax: +30-210-954-9347. Academic Editors: Paul Aplin and Andrew Millington Received: 21 April 2014 / Accepted: 16 April 2015 / Published: 23 April 2015 Abstract: This study deals with the landscape evolution reflected in the changes of land cover in the suburban area of Marathon, Attica, Greece. The study was based on remote sensing images covering the time period between 1945 and 2007. Several other types of data were also used, such as a digital terrain model, historical orthophotos, vegetation maps, geological maps, cadastral maps and aerial photos. These types of data were used in order to create the spatial database for the classification/interpretation of land cover and to identify the land cover changes that occurred during the period in question. The results of this study showed significant land cover changes, especially for the land covered by forests and wetlands with a 47% and a 37% decrease, respectively. The spatial arrangement of the development of residential areas was partially predictable, while the occurrence of land cover changes due to retrogressive vegetation succession appeared rather idiosyncratically throughout the area initially covered by forest. Keywords: land cover changes; land cover monitoring; remote sensing; Marathon; Attica; Greece; retrogressive succession; residential development OPEN ACCESS

Welcome message from author
This document is posted to help you gain knowledge. Please leave a comment to let me know what you think about it! Share it to your friends and learn new things together.
Transcript
Land 2015, 4, 337-354; doi:10.3390/land4020337
land ISSN 2073-445X
www.mdpi.com/journal/land/
Article
Monitoring 60 Years of Land Cover Change in the Marathon Area, Greece
Apostolos Gaitanis 1, Kleomenis Kalogeropoulos 1,*, Vassilis Detsis 2 and Christos Chalkias 1
1 Department of Geography, Harokopio University of Athens, El. Venizelou 70, Athens 17671,
Greece; E-Mails: [email protected] (A.G.); [email protected] (C.C.) 2 Department of Home Economics and Ecology, Harokopio University of Athens, El. Venizelou 70,
Athens 17671, Greece; E-Mail: [email protected]
* Author to whom correspondence should be addressed; E-Mail: [email protected];
Tel./Fax: +30-210-954-9347.
Academic Editors: Paul Aplin and Andrew Millington
Received: 21 April 2014 / Accepted: 16 April 2015 / Published: 23 April 2015
Abstract: This study deals with the landscape evolution reflected in the changes of land
cover in the suburban area of Marathon, Attica, Greece. The study was based on remote
sensing images covering the time period between 1945 and 2007. Several other types of data
were also used, such as a digital terrain model, historical orthophotos, vegetation maps,
geological maps, cadastral maps and aerial photos. These types of data were used in order to
create the spatial database for the classification/interpretation of land cover and to identify
the land cover changes that occurred during the period in question. The results of this study
showed significant land cover changes, especially for the land covered by forests and
wetlands with a 47% and a 37% decrease, respectively. The spatial arrangement of the
development of residential areas was partially predictable, while the occurrence of land
cover changes due to retrogressive vegetation succession appeared rather idiosyncratically
throughout the area initially covered by forest.
Keywords: land cover changes; land cover monitoring; remote sensing; Marathon; Attica;
Greece; retrogressive succession; residential development
OPEN ACCESS
Land 2015, 4 338
1. Introduction
The understanding of land cover changes is particularly important, because it is the link needed to
explore the broader changes taking place in the global environment and also to promote environmental
sustainability. Land cover is the recipient of constant configuration changes and transformations taking
place in land use, as for example when a forest is converted into pasture, cultivated land or even into an
urban area. Thus, ever-changing land use is the main proximate cause of land cover change. However,
the main driving forces behind this change can be found within a range of environmental, economic,
technological, institutional, cultural and demographic factors [1–5].
Land use changes are the oldest of all anthropogenic impacts on the environment, and they are
characterized as a facet of “global change” for good reason. For example, the changing of land cover
and, especially, the conversion of forest land into other uses has been recognized as a contributor to
climate change, accounting for 33% of the increase of CO2 in the atmosphere since 1850, as well as a
major driver of biodiversity loss. Furthermore, land use changes have led to the usurping of 40% of the
net primary productivity of the land [6].
Equally important are the influences of those regional and global changes within society. Changes in
land use/cover can affect the potential of these biological systems to provide various benefits for human
needs; in other words, they may modify the provision of ecosystem services. By studying and exploring
the historical land use/cover changes, we can understand the changes that happened in the past, and thus,
it becomes easier to understand the future evolution that will occur [1]. Understanding the factors that
contribute to land use changes and developing models to simulate these changes are necessary,
particularly in understanding the dynamics of global and local environmental changes [7].
Land cover mapping is a prerequisite in developing plans for a sustainable management of the Earth’s
surface. Remote sensing (RS) and GIS technologies provide the possibility of accurate mapping of land
cover, as well as of the changes that occur. These function as a powerful combination due to the
flexibility provided by an integrated spectral and spatial data management. These data can be combined
in order to identify and quantify the land cover changes [8–12]. Thus, with the use of the above-mentioned
technologies, the different sources of data can be used in a single frame of reference for comparisons [13].
In order to measure the land cover changes that occur in any given area at various temporal intervals,
it is necessary to identify the different land cover types with snapshots taken at different times. Much
research has been undertaken on land cover changes over time in various settings, e.g., in
forest areas [14], watersheds [15], mountain landscapes [16], as well as in protected habitat areas [17],
wetlands [18] or islands [19].
Nevertheless, both the patterns and the processes involved are not fully understood yet [20]. The
present study is an attempt to assess the connection between the land cover changes and the human
intervention factor with a focus on its effects on the spatial manifestations of change. We hypothesized
that the change trajectories in the area will differ according to the initial land cover [21]. We further
hypothesized that the spatial occurrence of change within the land cover classes expected to change will
be predictable in the case of changes driven by a few proximate drivers, as is the case with urban sprawl.
It has been found that urban sprawl can be predicted at broad geographic scales by means of a few
explanatory variables [22]; however, the usefulness of this approach at fine scales is not known. On the
other hand, land cover changes should be idiosyncratic, and thus, their positioning will be hardly
Land 2015, 4 339
predictable in cases that many proximate drivers are confounded, as is often the case with Mediterranean
vegetation degradation. A number of different trajectories and outcomes are possible depending on the
initial conditions, the nature and the intensity of disturbances [23]. The overall changes in the area are
presented to frame the problem, and then, the first hypothesis was explored in the case of urban
development and the second in the case of forest retrogressive succession.
2. Study Area
The municipality of Marathon is located in the northeast of the prefecture of Attica, Greece. It lies
42 km away from the center of Athens (Figure 1). The Community of Grammatiko, the Municipality of
Kapandriti, the Community of Stamata and the Municipality of Nea Makri are the surrounding
administrative units. The eastern border of the study area is the southern Evoikos Gulf, which runs along
a 10-km coastline. The total area of the municipality is 95.56 km2, while the total population of the
municipality in the census of 2001 amounted to 8882 residents (Hellenic Statistical Authority), while it
increased to 12,849 in the census of 2011. Part of the increase can be attributed to second homes that
turned into main residence. The Municipality of Marathon is comprised of eight districts: Marathon,
Aghios Panteleimon, Ano Souli, Avra, Vothon, Vranas, Kato Souli and Schinias. The settlement of
Marathon has had the largest population up to the 1961 census. The second most populous settlement
has been that of Kato Souli. From 1971 onwards, though, Aghios Panteleimon has shown a sharp
increase in the number of inhabitants, which makes it the most populous region after the settlement of
Marathon. It is also observed that a few settlements were abandoned, such as Mpeis Lofos (1991), and
in turn, entirely new settlements emerged, namely Vranas, Avra and Schinias.
The significant increase in the population of the Athens, especially during the postwar period, led to
stifling conditions (in terms of high population density) within the Athens metropolitan area. As a result,
a large part of the population felt the need to establish a second residence within the neighboring coastal
and (less so) forested areas. From a certain point onwards, a number of factors led to the construction
also of permanent residences in the eastern part of Attica: the improvement of road networks, especially
during the last decade, the construction of a new highway (Attiki Odos), as well as the construction of
the Eleftherios Venizelos Airport (in the late 1990s) within the Municipality of Spata.
The climate in the Marathon area is Mediterranean, with relatively hot summers and mild winters.
The long-term average annual rainfall is 567 mm and the long-term monthly average temperature ranges
from 10 °C to 27 °C (Hellenic National Meteorological Service). According to the bioclimatic
classification by Emberger, the Municipality of Marathon is part of the semi-arid bioclimatic etage,
characterized by mild winters with rare frost and snow and minimum average temperatures of the coldest
month ranging from 3 °C–7 °C. This area within Marathon, according to Greece’s Vegetation Map,
belongs to the semi-Mediterranean vegetation zone (Quercetalia ilicis). In particular, it belongs to the
sub-zone of the Oleo-Ceratonion of the thermo-Mediterranean formations (vegetation
thermomediterraneenne) in the Eastern Mediterranean [24]. The native vegetation in the area of Marathon
is dominated by clusters of Aleppo (Pinus halepensis) and stone pine (Pinus pinea; this species is limited
to a mixed forest along the coast within the national park, see below), the species of sclerophyllous
Mediterranean vegetation (maquis shrublands) and seasonal dimorphic dwarf
shrubs (phrygana).
Land 2015, 4 340
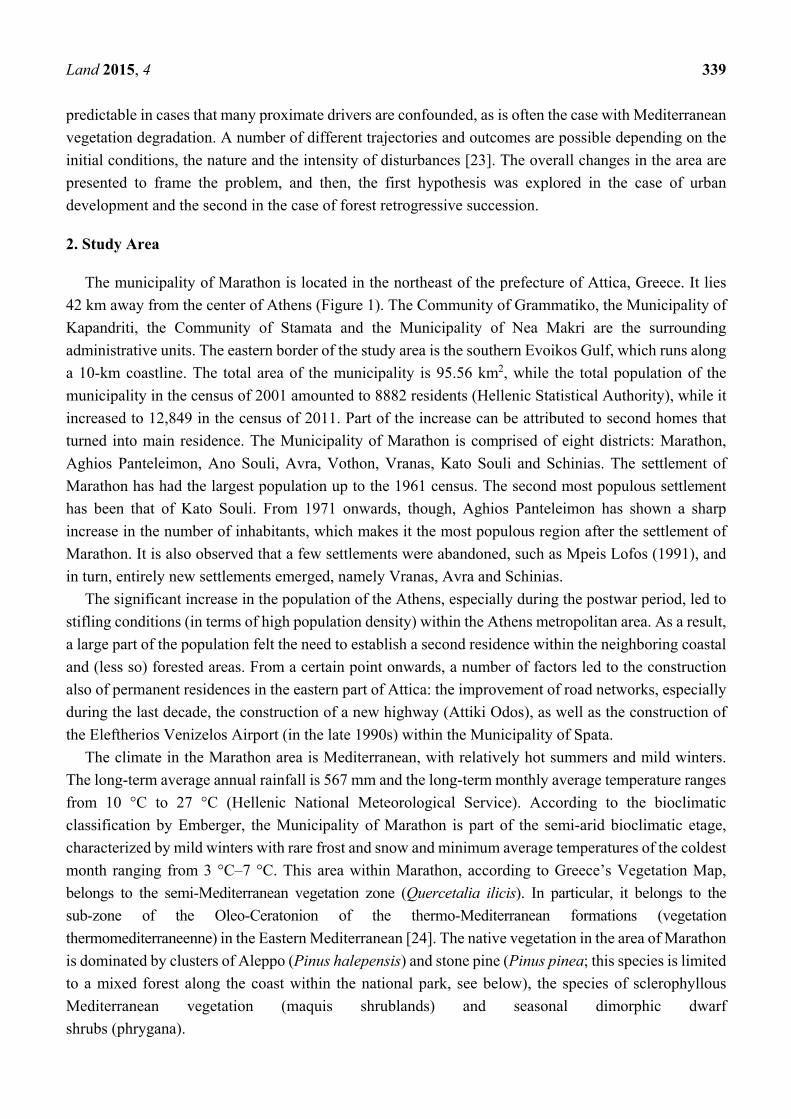
Figure 1. The study area (Marathon, Attica, Greece).
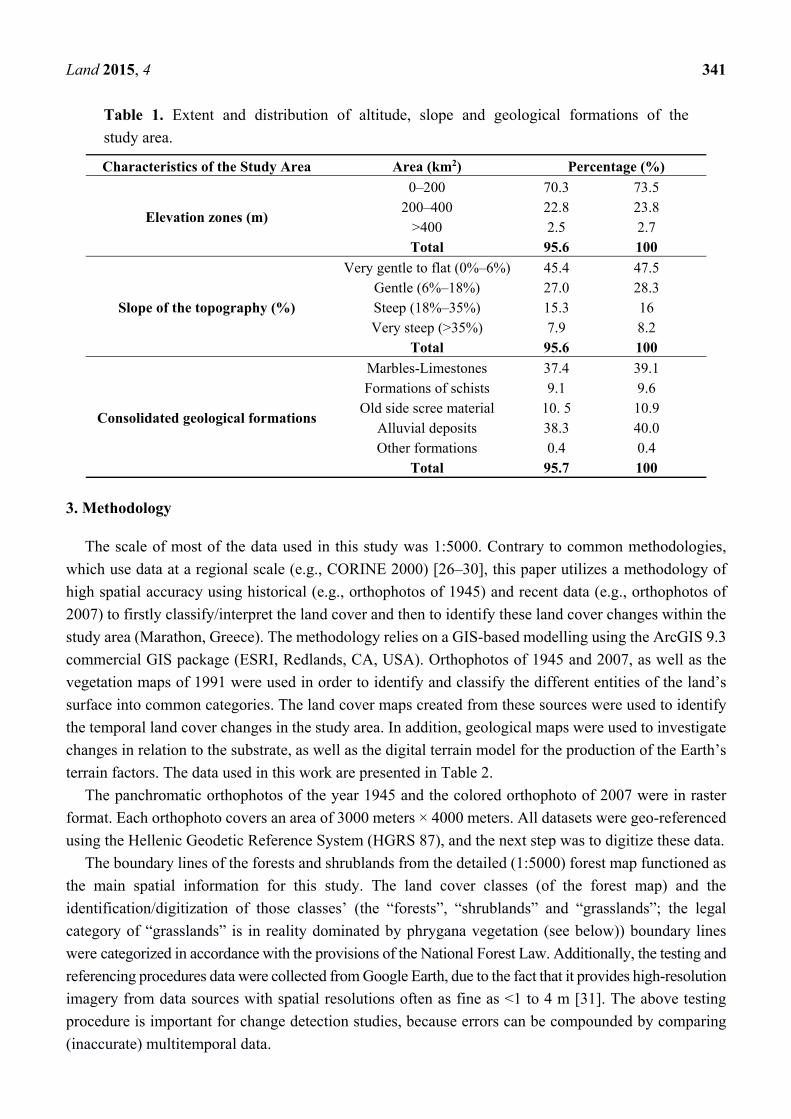
Table 1 shows the distribution of elevation classes within the study area, the extent and distribution
of the topographic slope and the distribution of consolidated geological formations within the study area.
The largest percentage (73.5%) belongs to the 0–200 m class, followed by 23.83% in the class ranging
from 200 to 400 meters. The lowest elevation is observed at sea level and the maximum at 562.46 meters.
To investigate the effects of topography, the slope was categorized into four classes: very gentle to flat
(0%–6%), gentle (6%–18%), steep (18%–35%) and very steep (>35%) [25], which cover 47.5%, 28.3%,
16% and 8.2% of the study area, respectively (Table 1). The larger part of the study area (75.8%) is
dominated by flat to gentle slopes. In terms of geological formations, the study area is covered by alluvial
deposits, followed by the formations of marbles-limestones and, lastly, by the formation of old side scree
material and schists with a distribution spread throughout the area. A further important characteristic of
the area is the presence of wetlands, dominated by species like Phragmites australis and Juncus sp., as
well as of springs and wells and easy access to groundwater.
In the Municipality area of Marathon Municipality, there are two protected areas. The first area
consists of the land and sea surrounding the National Park of Schinias-Marathon, which is classified as
a national park. The other protected area is the mountain of Agriliki. It is declared as a CORINE
(Coordination of Information on the Environment, which is a program of the Commission European)
biotope, and its total area amounts to 1934 hectares (19.34 km2).
Land 2015, 4 341
Table 1. Extent and distribution of altitude, slope and geological formations of the
study area.
Characteristics of the Study Area Area (km2) Percentage (%)
Elevation zones (m)
0–200 70.3 73.5 200–400 22.8 23.8
>400 2.5 2.7 Total 95.6 100
Slope of the topography (%)
Very gentle to flat (0%–6%) 45.4 47.5 Gentle (6%–18%) 27.0 28.3 Steep (18%–35%) 15.3 16 Very steep (>35%) 7.9 8.2
Total 95.6 100
Consolidated geological formations
Marbles-Limestones 37.4 39.1 Formations of schists 9.1 9.6
Old side scree material 10. 5 10.9 Alluvial deposits 38.3 40.0 Other formations 0.4 0.4
Total 95.7 100
3. Methodology
The scale of most of the data used in this study was 1:5000. Contrary to common methodologies,
which use data at a regional scale (e.g., CORINE 2000) [26–30], this paper utilizes a methodology of
high spatial accuracy using historical (e.g., orthophotos of 1945) and recent data (e.g., orthophotos of
2007) to firstly classify/interpret the land cover and then to identify these land cover changes within the
study area (Marathon, Greece). The methodology relies on a GIS-based modelling using the ArcGIS 9.3
commercial GIS package (ESRI, Redlands, CA, USA). Orthophotos of 1945 and 2007, as well as the
vegetation maps of 1991 were used in order to identify and classify the different entities of the land’s
surface into common categories. The land cover maps created from these sources were used to identify
the temporal land cover changes in the study area. In addition, geological maps were used to investigate
changes in relation to the substrate, as well as the digital terrain model for the production of the Earth’s
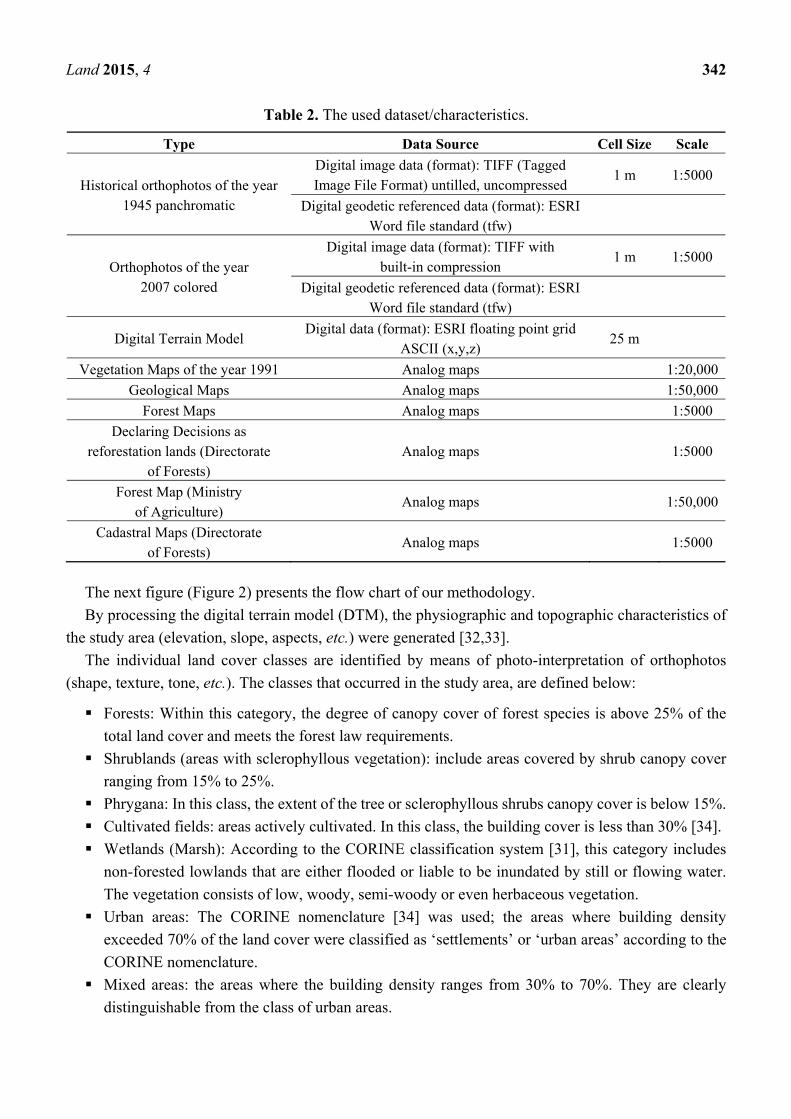
terrain factors. The data used in this work are presented in Table 2.
The panchromatic orthophotos of the year 1945 and the colored orthophoto of 2007 were in raster
format. Each orthophoto covers an area of 3000 meters × 4000 meters. All datasets were geo-referenced
using the Hellenic Geodetic Reference System (HGRS 87), and the next step was to digitize these data.
The boundary lines of the forests and shrublands from the detailed (1:5000) forest map functioned as
the main spatial information for this study. The land cover classes (of the forest map) and the
identification/digitization of those classes’ (the “forests”, “shrublands” and “grasslands”; the legal
category of “grasslands” is in reality dominated by phrygana vegetation (see below)) boundary lines
were categorized in accordance with the provisions of the National Forest Law. Additionally, the testing and
referencing procedures data were collected from Google Earth, due to the fact that it provides high-resolution
imagery from data sources with spatial resolutions often as fine as <1 to 4 m [31]. The above testing
procedure is important for change detection studies, because errors can be compounded by comparing
(inaccurate) multitemporal data.
Land 2015, 4 342
Table 2. The used dataset/characteristics.
Type Data Source Cell Size Scale
Historical orthophotos of the year 1945 panchromatic
Digital image data (format): TIFF (Tagged Image File Format) untilled, uncompressed
1 m 1:5000
Digital geodetic referenced data (format): ESRI Word file standard (tfw)
Orthophotos of the year 2007 colored
Digital image data (format): TIFF with built-in compression
1 m 1:5000
Digital geodetic referenced data (format): ESRI Word file standard (tfw)
Digital Terrain Model Digital data (format): ESRI floating point grid
ASCII (x,y,z) 25 m
Vegetation Maps of the year 1991 Analog maps 1:20,000
Geological Maps Analog maps 1:50,000
Forest Maps Analog maps 1:5000
Declaring Decisions as reforestation lands (Directorate
of Forests) Analog maps 1:5000
Forest Map (Ministry of Agriculture)
Analog maps 1:50,000
Cadastral Maps (Directorate of Forests)
Analog maps 1:5000
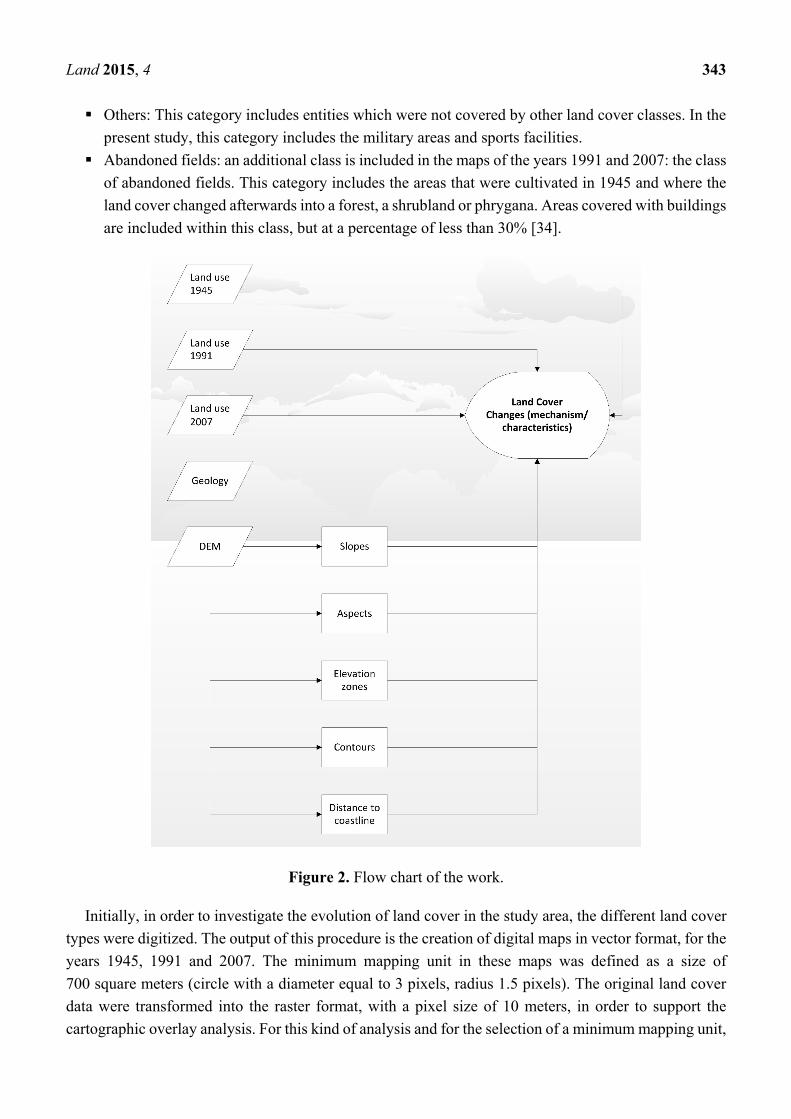
The next figure (Figure 2) presents the flow chart of our methodology.
By processing the digital terrain model (DTM), the physiographic and topographic characteristics of
the study area (elevation, slope, aspects, etc.) were generated [32,33].
The individual land cover classes are identified by means of photo-interpretation of orthophotos
(shape, texture, tone, etc.). The classes that occurred in the study area, are defined below:
Forests: Within this category, the degree of canopy cover of forest species is above 25% of the
total land cover and meets the forest law requirements.
Shrublands (areas with sclerophyllous vegetation): include areas covered by shrub canopy cover
ranging from 15% to 25%.
Phrygana: In this class, the extent of the tree or sclerophyllous shrubs canopy cover is below 15%.
Cultivated fields: areas actively cultivated. In this class, the building cover is less than 30% [34].
Wetlands (Marsh): According to the CORINE classification system [31], this category includes
non-forested lowlands that are either flooded or liable to be inundated by still or flowing water.
The vegetation consists of low, woody, semi-woody or even herbaceous vegetation.
Urban areas: The CORINE nomenclature [34] was used; the areas where building density
exceeded 70% of the land cover were classified as ‘settlements’ or ‘urban areas’ according to the
CORINE nomenclature.
Mixed areas: the areas where the building density ranges from 30% to 70%. They are clearly
distinguishable from the class of urban areas.
Land 2015, 4 343
Others: This category includes entities which were not covered by other land cover classes. In the
present study, this category includes the military areas and sports facilities.
Abandoned fields: an additional class is included in the maps of the years 1991 and 2007: the class
of abandoned fields. This category includes the areas that were cultivated in 1945 and where the
land cover changed afterwards into a forest, a shrubland or phrygana. Areas covered with buildings
are included within this class, but at a percentage of less than 30% [34].
Figure 2. Flow chart of the work.
Initially, in order to investigate the evolution of land cover in the study area, the different land cover
types were digitized. The output of this procedure is the creation of digital maps in vector format, for the
years 1945, 1991 and 2007. The minimum mapping unit in these maps was defined as a size of
700 square meters (circle with a diameter equal to 3 pixels, radius 1.5 pixels). The original land cover
data were transformed into the raster format, with a pixel size of 10 meters, in order to support the
cartographic overlay analysis. For this kind of analysis and for the selection of a minimum mapping unit,
Land 2015, 4 344
we had to keep in mind the consistency of the method and the availability of the data. In our case, we
had to integrate detailed vector datasets with the digital terrain model from 1:50,000 maps. Thus, in order
to implement a multi-criteria cartographic overlay analysis, we chose to convert the datasets to raster
format with a 10-m cell size. The chosen pixel size (10 m) of the cartographic layers in conjunction with
the detailed spatial resolution (<1 to 4 m) of the remotely-sensed imagery which was used in the
validation procedure has provided the required accuracy for the proposed methodology. The validation
of the classification was implemented for the year 2007 by using 106 sample points (random stratified
sampling) and field work in combination with photointerpretation of detailed remotely-sensed images in
order to estimate the “real value” of the land cover for each sampling point (Table 3). The calculated
Kappa coefficient (0.8) showed that the classification was “satisfactory” [35,36].
Table 3. Sampling for the validation of the methodology.
TYPE Number of Samples TRUE FALSE
Wetlands 6 5 1 Forests 7 6 1
Shrublands 45 44 1 Mixed 11 8 3
Cultivated Fields 29 24 5 Urban 1 1 0
Grasslands 4 3 1 Other 3 0 3
The converted raster data, in combination with the slope, aspect and elevation data, were used to build
the map overlay model, so that the land cover changes and the spatial patterns of these changes in the
study area could be identified. Then, the connection of all raster data was conducted using the “combine”
function within the GIS environment. Finally, to investigate the relationship/interdependence between
land cover changes and the environmental factors that cause them, the “Zonal statistics method” was
used for finding the characteristic patterns (spatial patterns) that affect these changes. The data used to
map burned areas were extracted from the “decisions” of the Forest Service, in the event of a fire or
clearing. A total of 59 decisions were issued for the fires that occurred between 1982 and 1998. Two
additional analyses were carried out to detect the spatial patterns of change. The interior of the original
forest patches was divided into zones of up to 50 m from the forest edge, 50–100 m, 100–250 m
and >250 m, and the proportion of change as a result of retrogressive succession that occurred within
each class was determined. The same approach was used to detect the pattern of urban sprawl relevant
to the seashore. Five hundred meter-wide zones of ascending distance to shore were established, and the
degree of sprawl of urban and mixed areas within each was recorded.
In order to assess the key factors affecting the evolution of Marathon’s landscape, as well as to assess
the causes of land cover changes, socio-economic data from the Hellenic Statistical Authority
(EL.STAT.) was collected [19] in order to assist in explaining how human intervention affected these
changes and vice versa. The data concerns the components of the change within in the total population
and the economically-active population employed in the primary production sector for the years 1940,
1951, 1961, 1971, 1981, 1991 and 2001. The methodology of this work is briefly depicted in Figure 2.
Land 2015, 4 345
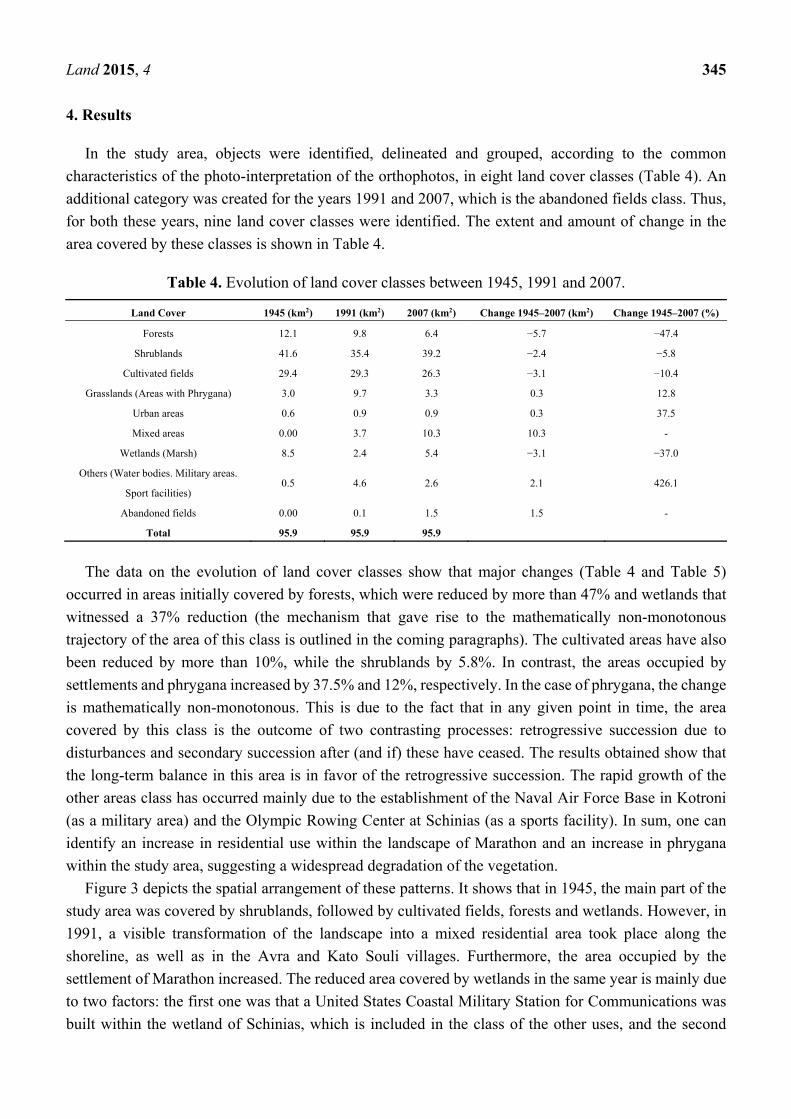
4. Results
In the study area, objects were identified, delineated and grouped, according to the common
characteristics of the photo-interpretation of the orthophotos, in eight land cover classes (Table 4). An
additional category was created for the years 1991 and 2007, which is the abandoned fields class. Thus,
for both these years, nine land cover classes were identified. The extent and amount of change in the
area covered by these classes is shown in Table 4.
Table 4. Evolution of land cover classes between 1945, 1991 and 2007.
Land Cover 1945 (km2) 1991 (km2) 2007 (km2) Change 1945–2007 (km2) Change 1945–2007 (%)
Forests 12.1 9.8 6.4 −5.7 −47.4
Shrublands 41.6 35.4 39.2 −2.4 −5.8
Cultivated fields 29.4 29.3 26.3 −3.1 −10.4
Grasslands (Areas with Phrygana) 3.0 9.7 3.3 0.3 12.8
Urban areas 0.6 0.9 0.9 0.3 37.5
Mixed areas 0.00 3.7 10.3 10.3 -
Wetlands (Marsh) 8.5 2.4 5.4 −3.1 −37.0
Others (Water bodies. Military areas.
Sport facilities) 0.5 4.6 2.6 2.1 426.1
Abandoned fields 0.00 0.1 1.5 1.5 -
Total 95.9 95.9 95.9
The data on the evolution of land cover classes show that major changes (Table 4 and Table 5)
occurred in areas initially covered by forests, which were reduced by more than 47% and wetlands that
witnessed a 37% reduction (the mechanism that gave rise to the mathematically non-monotonous
trajectory of the area of this class is outlined in the coming paragraphs). The cultivated areas have also
been reduced by more than 10%, while the shrublands by 5.8%. In contrast, the areas occupied by
settlements and phrygana increased by 37.5% and 12%, respectively. In the case of phrygana, the change
is mathematically non-monotonous. This is due to the fact that in any given point in time, the area
covered by this class is the outcome of two contrasting processes: retrogressive succession due to
disturbances and secondary succession after (and if) these have ceased. The results obtained show that
the long-term balance in this area is in favor of the retrogressive succession. The rapid growth of the
other areas class has occurred mainly due to the establishment of the Naval Air Force Base in Kotroni
(as a military area) and the Olympic Rowing Center at Schinias (as a sports facility). In sum, one can
identify an increase in residential use within the landscape of Marathon and an increase in phrygana
within the study area, suggesting a widespread degradation of the vegetation.
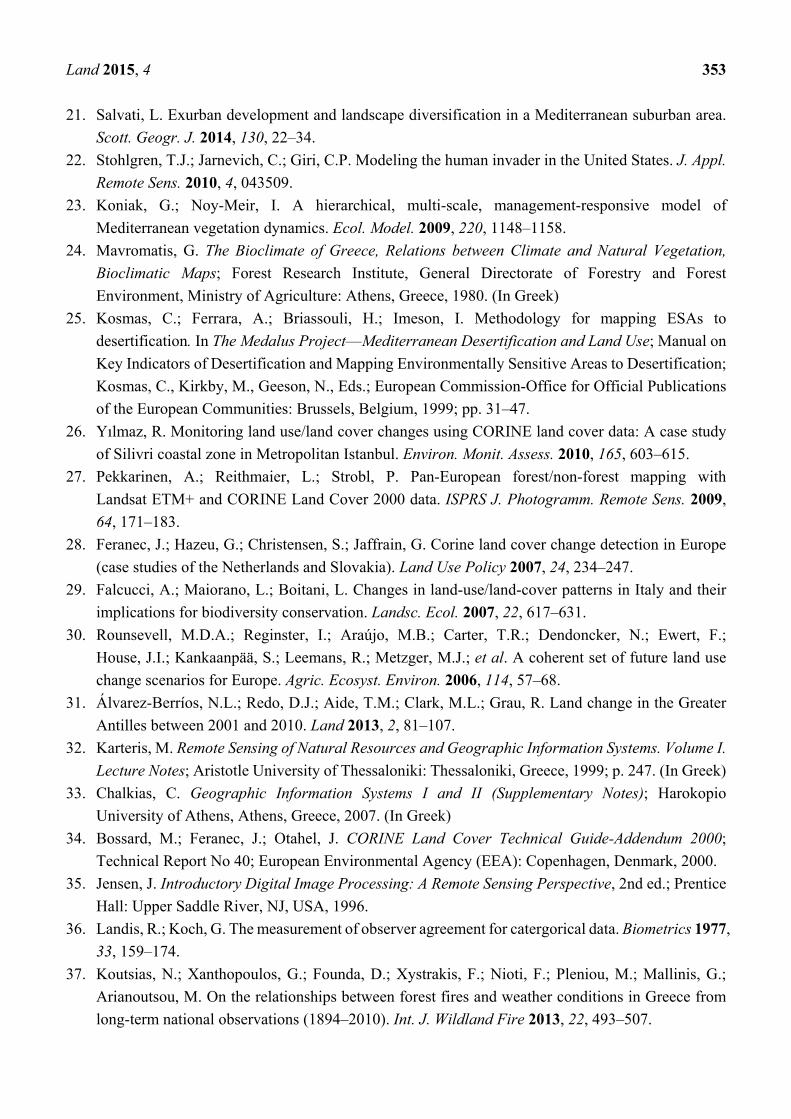
Figure 3 depicts the spatial arrangement of these patterns. It shows that in 1945, the main part of the
study area was covered by shrublands, followed by cultivated fields, forests and wetlands. However, in
1991, a visible transformation of the landscape into a mixed residential area took place along the
shoreline, as well as in the Avra and Kato Souli villages. Furthermore, the area occupied by the
settlement of Marathon increased. The reduced area covered by wetlands in the same year is mainly due
to two factors: the first one was that a United States Coastal Military Station for Communications was
built within the wetland of Schinias, which is included in the class of the other uses, and the second
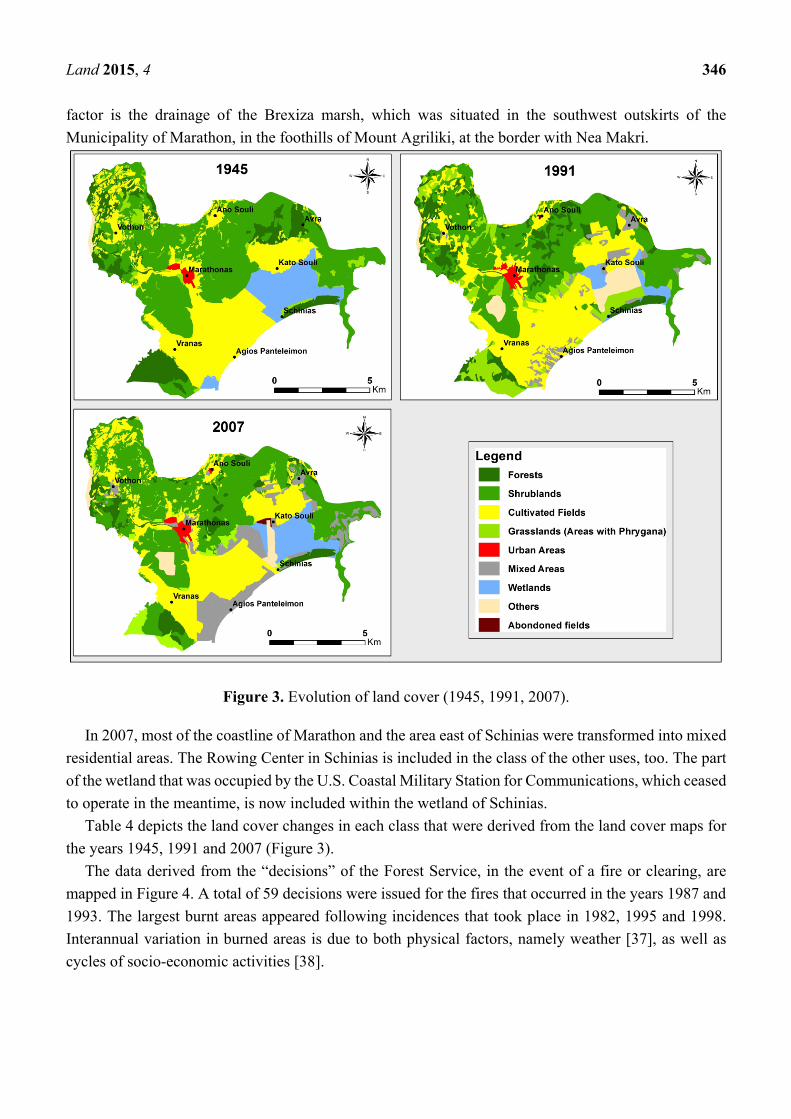
Land 2015, 4 346
factor is the drainage of the Brexiza marsh, which was situated in the southwest outskirts of the
Municipality of Marathon, in the foothills of Mount Agriliki, at the border with Nea Makri.
Figure 3. Evolution of land cover (1945, 1991, 2007).
In 2007, most of the coastline of Marathon and the area east of Schinias were transformed into mixed
residential areas. The Rowing Center in Schinias is included in the class of the other uses, too. The part
of the wetland that was occupied by the U.S. Coastal Military Station for Communications, which ceased
to operate in the meantime, is now included within the wetland of Schinias.
Table 4 depicts the land cover changes in each class that were derived from the land cover maps for
the years 1945, 1991 and 2007 (Figure 3).
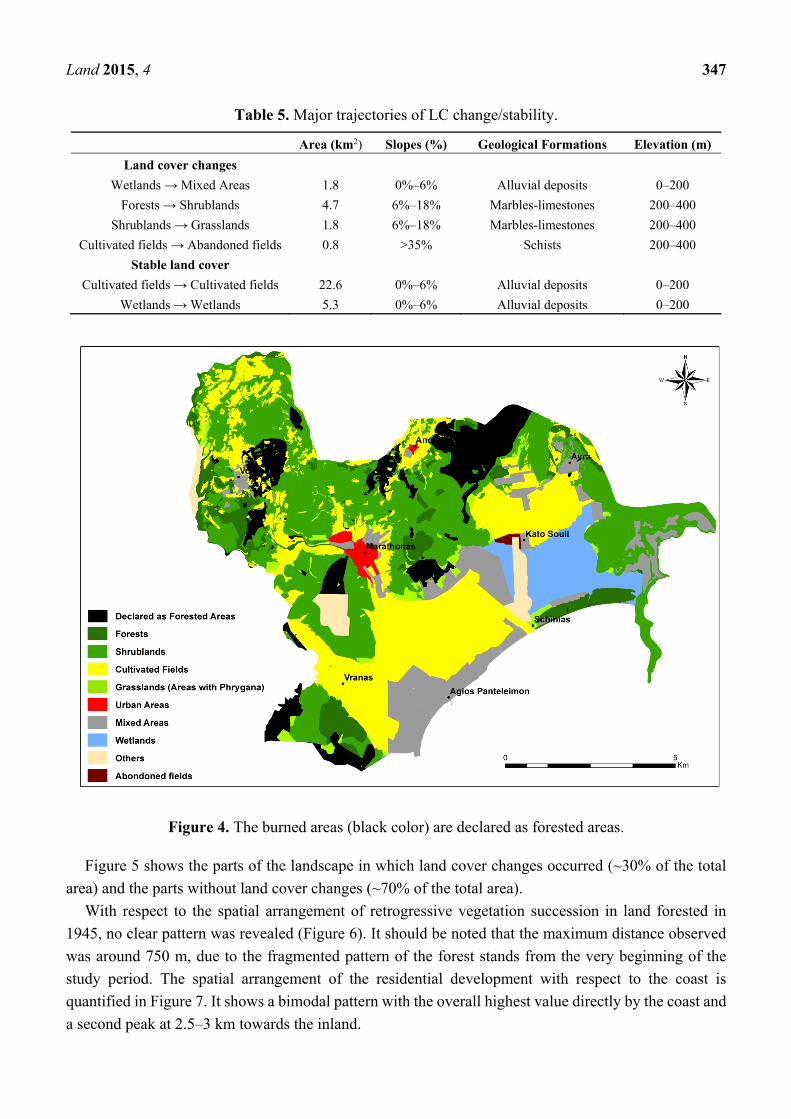
The data derived from the “decisions” of the Forest Service, in the event of a fire or clearing, are
mapped in Figure 4. A total of 59 decisions were issued for the fires that occurred in the years 1987 and
1993. The largest burnt areas appeared following incidences that took place in 1982, 1995 and 1998.
Interannual variation in burned areas is due to both physical factors, namely weather [37], as well as
cycles of socio-economic activities [38].
Land 2015, 4 347
Table 5. Major trajectories of LC change/stability.
Area (km2) Slopes (%) Geological Formations Elevation (m)
Land cover changes
Wetlands → Μixed Areas 1.8 0%–6% Alluvial deposits 0–200
Forests → Shrublands 4.7 6%–18% Μarbles-limestones 200–400
Shrublands → Grasslands 1.8 6%–18% Μarbles-limestones 200–400
Cultivated fields → Abandoned fields 0.8 >35% Schists 200–400
Stable land cover
Cultivated fields → Cultivated fields 22.6 0%–6% Alluvial deposits 0–200
Wetlands → Wetlands 5.3 0%–6% Alluvial deposits 0–200
Figure 4. The burned areas (black color) are declared as forested areas.
Figure 5 shows the parts of the landscape in which land cover changes occurred (~30% of the total
area) and the parts without land cover changes (~70% of the total area).
With respect to the spatial arrangement of retrogressive vegetation succession in land forested in
1945, no clear pattern was revealed (Figure 6). It should be noted that the maximum distance observed
was around 750 m, due to the fragmented pattern of the forest stands from the very beginning of the
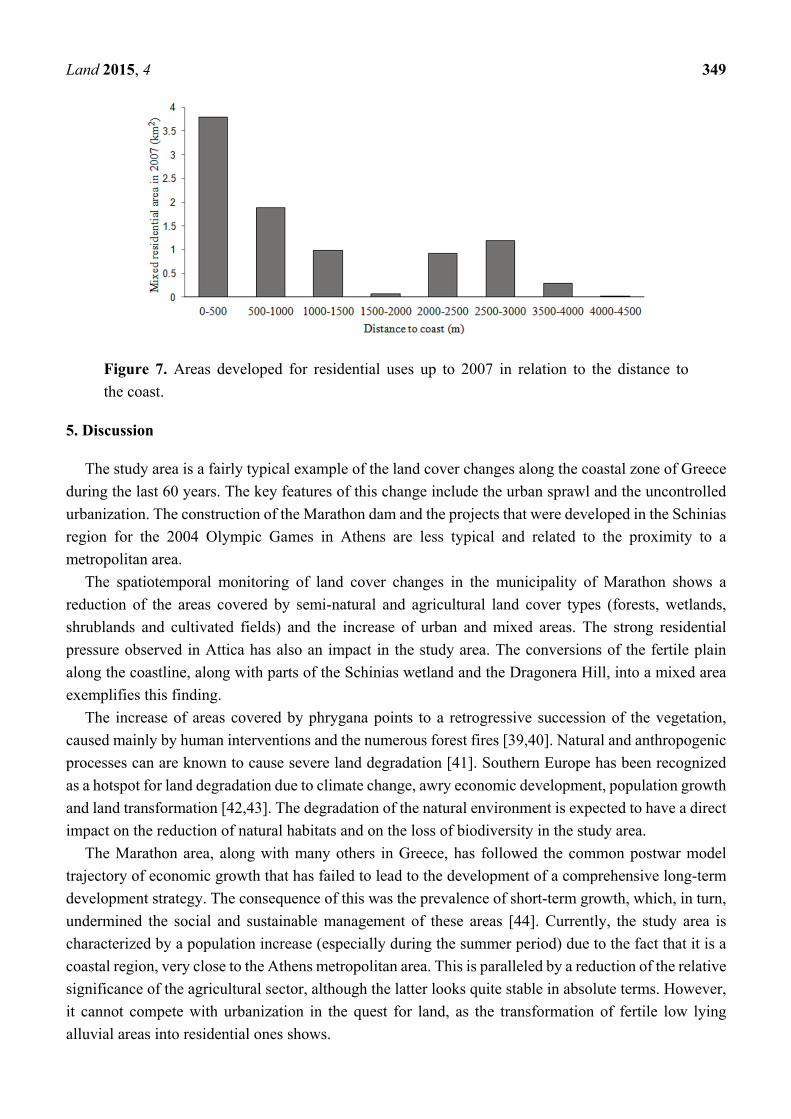
study period. The spatial arrangement of the residential development with respect to the coast is
quantified in Figure 7. It shows a bimodal pattern with the overall highest value directly by the coast and
a second peak at 2.5–3 km towards the inland.
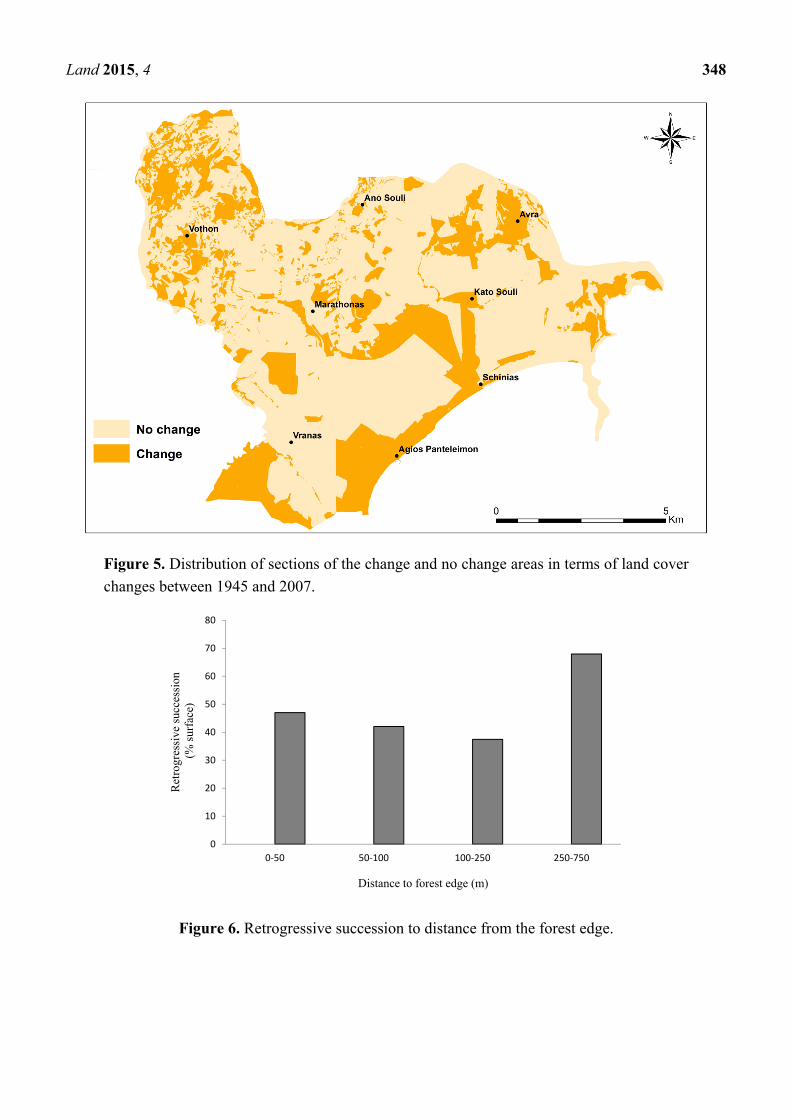
Land 2015, 4 348
Figure 5. Distribution of sections of the change and no change areas in terms of land cover
changes between 1945 and 2007.
Figure 6. Retrogressive succession to distance from the forest edge.
0
10
20
30
40
50
60
70
80
0-50 50-100 100-250 250-750
Ret
rogr
essi
ve s
ucce
ssio
n(%
sur
face
)
Distance to forest edge (m)
Land 2015, 4 349
Figure 7. Areas developed for residential uses up to 2007 in relation to the distance to
the coast.
5. Discussion
The study area is a fairly typical example of the land cover changes along the coastal zone of Greece
during the last 60 years. The key features of this change include the urban sprawl and the uncontrolled
urbanization. The construction of the Marathon dam and the projects that were developed in the Schinias
region for the 2004 Olympic Games in Athens are less typical and related to the proximity to a
metropolitan area.
The spatiotemporal monitoring of land cover changes in the municipality of Marathon shows a
reduction of the areas covered by semi-natural and agricultural land cover types (forests, wetlands,
shrublands and cultivated fields) and the increase of urban and mixed areas. The strong residential
pressure observed in Attica has also an impact in the study area. The conversions of the fertile plain
along the coastline, along with parts of the Schinias wetland and the Dragonera Hill, into a mixed area
exemplifies this finding.
The increase of areas covered by phrygana points to a retrogressive succession of the vegetation,
caused mainly by human interventions and the numerous forest fires [39,40]. Natural and anthropogenic
processes can are known to cause severe land degradation [41]. Southern Europe has been recognized
as a hotspot for land degradation due to climate change, awry economic development, population growth
and land transformation [42,43]. The degradation of the natural environment is expected to have a direct
impact on the reduction of natural habitats and on the loss of biodiversity in the study area.
The Marathon area, along with many others in Greece, has followed the common postwar model
trajectory of economic growth that has failed to lead to the development of a comprehensive long-term
development strategy. The consequence of this was the prevalence of short-term growth, which, in turn,
undermined the social and sustainable management of these areas [44]. Currently, the study area is
characterized by a population increase (especially during the summer period) due to the fact that it is a
coastal region, very close to the Athens metropolitan area. This is paralleled by a reduction of the relative
significance of the agricultural sector, although the latter looks quite stable in absolute terms. However,
it cannot compete with urbanization in the quest for land, as the transformation of fertile low lying
alluvial areas into residential ones shows.
Land 2015, 4 350
A major driver for the land cover transformation was the pressure exerted on the area as a consequence
of the Olympic Games in Athens in 2004. This pressure has recently surfaced with the urban
development study together with the other areas that hosted the Olympic Games [45,46]. For instance,
it was argued that the construction of the Olympic Rowing and Canoeing Center was supposed to restore
or even enhance processes related to the wetland characteristic of the site and the environmental
functions of the area (e.g., provide habitat for hygrophilous species, restore the water balance in the
wider wetland complex), while the development of Schinias was supposed to upgrade the whole area.
Many of the Olympic facilities were to promote the conservation and the protection of the environment.
However, after the Olympic Games ended, many of the Olympic facilities were deserted, resulting in the
further deterioration of their respective regions.
The general frame outlined thus far allows a validation of our initial hypotheses. Transitions leading
to the development of mixed residential areas took place primarily on former agricultural land over
alluvial deposits in low lying plain areas. The residential development is primarily driven by the
proximity to the coast, especially in areas with access to sandy beaches. However, in our case, this
hypothesis could only partly be confirmed. While the first peak of the residential development occurred
directly by the coast, a second one deviated from the expected pattern. Local politics and economics
favored the development at the Kato Souli area during the 1970s, leading to a deviation from the broad
pattern that is generally accepted as valid at higher spatial scales.
The second hypothesis seems to be consistent with the data. Loss of forest to shrublands and phrygana
occurred primarily in sloping land over limestone or marble. Retrogressive vegetation succession is
driven by, and depends on, a large number of factors, namely intensity, extend and recurrence intervals
of forest fires, site recovery potential, grazing pressure, forest management, implementation of protective
legislation, etc. The complex combinations of these factors along with the fragmented spatial pattern of
forest stands made the spatial manifestations of the retrogression probability pretty unpredictable.
Contrary to the legitimate expectation that the forest edge would be most affected, this type of conversion
was widespread throughout the initial area covered by forests.
6. Conclusions
In this study, the land cover changes that occurred within the last 60 years in the area of Marathon,
Attica, Greece, were reconstructed. Historical data from various sources, such as forest agency archives,
cadastral maps, as well as other documentation, were integrated, together with remote sensory data and
other spatial databases. The coastal area of Marathon has developed into a semi-urban area with rural
features. Although the cultivated land is still the dominant type of land cover in the study area, covering
26.32 km2 (~30% of the total area), this land cover class decreased in extent by 10% throughout the
study period. The main reasons for this are the abandonment of the cultivated land areas in steep slopes,
but mostly the extension of the residential areas. The area covered by natural vegetation, such as forests,
shrublands and wetlands, has also decreased by 47%, 6% and 37%, respectively, while transitions
occurred also among vegetation types. Nowadays, these areas only cover half of the study area. The
urban areas together with the mixed areas exhibited the opposite trend, namely an increase to 10.25 km2.
This transition occurred mainly within the coastal zone.
Land 2015, 4 351
Lastly, the identification of the main trajectories of land cover changes showed that the forest areas,
as well as the coastal zone are the most liable to undergo a land cover change. While the former transition
is largely unpredictable spatially, the latter occurs mostly by the coast. A departure from the expected
pattern was observed, though, showing that the power and economics configurations at low spatial levels
can give rise to locally-specific patterns. The cultivated lands remained more or less stable in the low
elevation alluvium fields, despite significant losses at the coastal zone. The conservation of these areas
and their agricultural use is crucial for the preservation of the rural character of the area in the future.
Acknowledgments
We would like to thank the Editor of the Land journal and the anonymous reviewers for their
comments and corrections that significantly improved the paper.
Author Contributions
Apostolos Gaitanis prepared the datasets, created the landcover data series through photo
interpretation and drafted the manuscript in Greek. Kleomenis Kalogeropoulos participated in the spatial
database creation, in the implementation of overlay analysis and drafted the English version of the paper.
Vasilis Detsis participated in the design of the methodolody, in the literature review concerning land
cover change analysis, and in the discussion of the results. Christos Chalkias conceived the study,
designed the GIS-based analysis and participated in the discussion. All authors participated in the
revision of the manuscript. Moreover, all authors approved the final manuscript.
Conflicts of Interest
The authors declare no conflict of interest.
References
1. Sherbinin, A. A Guide of Land-Use and Land-Cover Change (LUCC). A Collaborative Effort of
SEDAC and the IGBP/IHDP LUCC Project, 2002. Available online: http://sedac.ciesin.columbia.edu/
tg/guide_frame.jsp?rd=lu (accessed on 5 June 2013).
2. Eludoyin, O.S.; Wokocha, C.C.; Ayolagha, G. GIS assessment of land use and land cover changes
in OBIO/AKPOR L.G.A., Rivers State, Nigeria. Res. J. Environ. Earth Sci. 2011, 3, 307–313.
3. Stellmes, M.; Röder, A.; Udelhoven, T.; Hill, J. Mapping syndromes of land change in Spain with
remote sensing time series, demographic and climatic data. Land Use Policy 2013, 30, 685–702.
4. Salvati, L.; Sateriano, A.; Zitti, M. Long-term land cover changes and climate variations—A
country-scale approach for a new policy target. Land Use Policy 2013, 30, 401–407.
5. Darwish, T.; Khater, C.; Jomaa, I.; Stehouwer, R.; Shaban, A.; Hamzé, M. Environmental impact
of quarries on natural resources in Lebanon. Land Degrad. Dev. 2011, 22, 345–358.
6. Vitousek, P.M.; Mooney, H.A.; Lubchenco, J.; Melillo, J.M. Human domination of Earth’s
ecosystems. Science 1997, 277, 494–499.
7. Veldkamp, A.; Lambin, E.F. Editorial: Predicting land use change. Agric. Ecosyst. Environ. 2001,
85, 1–6.
Land 2015, 4 352
8. Huang, Z.; Jia, X. Integrating remotely sensed data, GIS and expert knowledge to update object-based
land use/land cover information. Int. J. Remote Sens. 2012, 33, 905–921.
9. Wang, Q.; Zhou, K.; Sun, L.; Qin, Y.; Li, G.; Wang, J.; Li, M.; Chen, L. Analyzing land cover
changes influenced by topographic factors based on technologies of RS and GIS—A case study of
Yuli county of Xinjiang. Lecture Notes Electr. Eng. 2012, 172, 403–410.
10. Paudel, S.; Yuan, F. Assessing landscape changes and dynamics using patch analysis and GIS
modeling. Int. J. Appl. Earth Obs. Geoinf. 2012, 16, 66–76.
11. Peng, J.; Liu, Y.; Shen, H.; Han, Y.; Pan, Y. Vegetation coverage change and associated driving
forces in mountain areas of Northwestern Yunnan, China using RS and GIS. Environ. Monit. Assess.
2012, 184, 4787–4798.
12. Ustaoglu, B. Spatiotemporal analysis of land cover change patterns in western part of the Sakarya
River Delta and its surroundings in Turkey. Energy Educ. Sci. Technol. Part A: Energy Sci. Res.
2012, 29, 721–730.
13. Papšiene, L.; Papšys, K. Changes affecting generalization of land cover features in a smaller scale.
Geod. Cartogr. 2012, 38, 98–105.
14. Μas, J.F. Monitoring land-cover changes: A comparison of change detection techniques. Int. J.
Remote Sens. 1999, 20, 139–152.
15. Chouvardas, D.; Evangelou, Ch.; Kourakly, P.; Ispikoudis, I.; Papanastasis, V.P. Temporal
evolution of forest landscapes in relation to socioeconomic changes: The case of Hortiatis watershed
in Greece. In Woodland Cultures in Time and Space: Tales from the Past, Messages for the Future,
1st ed.; Saratsi, E., Bόrgi, M., Johann, E., Kirby, K.J., Moreno, D., Watkins, C., Eds.; Embryo
Publications: Athens, Greece, 2009; pp. 346–353.
16. Mitka, A.; Chouvardas, D.; Ispikoudis, I. Over time changes (1963–1998) at the landscape of
kopatsaraiikon villages of Grevena. In Range Science and Quality of Life, Proceedings of the 7th
Panhellenic Rangeland Congress, Xanthi, Greece, 14–16 November 2010; Sidiropoulos, Ed.;
Ministry of Environment, Energy & Climate Change and Greek Range and Pasture Society: Xanthi,
Greece, 2010; Auction No. 16, pp. 97–102. (In Greek)
17. Platis, P.; Meliadis, I.; Papachristou, T.; Trakolis, S.; Kachantzidis, K.; Mantzanas, K.; Makras, A.;
Dimalexis, A.; Bodosakis, S. Continuous Monitoring of Changes in Habitat Mountains Akarnanika
Using Satellite Images for the Sustainable Management and Protection; Final Report (Issue A)
Programme “Environmental Protection and Sustainable Development”; Ministry of Environment
(ETERPS), Forest Research Institute (ETHIAGE): Thessaloniki, Greece, 2004; p. 58 (a separate
publication). (In Greek)
18. Papastergiadou, E.S.; Retalis, A.; Kalliris, P.; Georgiadis, T.H. Land use changes and associated
environmental impacts on the Mediterranean shallow Lake Stymfalia, Greece. Hydrobiologia 2007,
584, 361–372.
19. Detsis, V.; Ntasiopoulou, G.; Chalkias, C.; Efthymiou, G. Recent insular mediterranean landscape
evolution: A case study on Syros, Greece. Landsc. Res. 2010, 35, 361–381.
20. Mallinis, G.; Koutsias, N.; Arianoutsou, M. Monitoring land use/land cover transformations
from 1945 to 2007 in two peri-urban mountainous areas of Athens metropolitan area, Greece.
Sci. Total Environ. 2014, 490, 262–278.
Land 2015, 4 353
21. Salvati, L. Exurban development and landscape diversification in a Mediterranean suburban area.
Scott. Geogr. J. 2014, 130, 22–34.
22. Stohlgren, T.J.; Jarnevich, C.; Giri, C.P. Modeling the human invader in the United States. J. Appl.
Remote Sens. 2010, 4, 043509.
23. Koniak, G.; Noy-Meir, I. A hierarchical, multi-scale, management-responsive model of
Mediterranean vegetation dynamics. Ecol. Model. 2009, 220, 1148–1158.
24. Mavromatis, G. The Bioclimate of Greece, Relations between Climate and Natural Vegetation,
Bioclimatic Maps; Forest Research Institute, General Directorate of Forestry and Forest
Environment, Ministry of Agriculture: Athens, Greece, 1980. (In Greek)
25. Kosmas, C.; Ferrara, A.; Briassouli, H.; Imeson, I. Methodology for mapping ESAs to
desertification. In The Medalus Project—Mediterranean Desertification and Land Use; Manual on
Key Indicators of Desertification and Mapping Environmentally Sensitive Areas to Desertification;
Kosmas, C., Kirkby, M., Geeson, N., Eds.; European Commission-Office for Official Publications
of the European Communities: Brussels, Belgium, 1999; pp. 31–47.
26. Yılmaz, R. Monitoring land use/land cover changes using CORINE land cover data: A case study
of Silivri coastal zone in Metropolitan Istanbul. Environ. Monit. Assess. 2010, 165, 603–615.
27. Pekkarinen, A.; Reithmaier, L.; Strobl, P. Pan-European forest/non-forest mapping with
Landsat ETM+ and CORINE Land Cover 2000 data. ISPRS J. Photogramm. Remote Sens. 2009,
64, 171–183.
28. Feranec, J.; Hazeu, G.; Christensen, S.; Jaffrain, G. Corine land cover change detection in Europe
(case studies of the Netherlands and Slovakia). Land Use Policy 2007, 24, 234–247.
29. Falcucci, A.; Maiorano, L.; Boitani, L. Changes in land-use/land-cover patterns in Italy and their
implications for biodiversity conservation. Landsc. Ecol. 2007, 22, 617–631.
30. Rounsevell, M.D.A.; Reginster, I.; Araújo, M.B.; Carter, T.R.; Dendoncker, N.; Ewert, F.;
House, J.I.; Kankaanpää, S.; Leemans, R.; Metzger, M.J.; et al. A coherent set of future land use
change scenarios for Europe. Agric. Ecosyst. Environ. 2006, 114, 57–68.
31. Álvarez-Berríos, N.L.; Redo, D.J.; Aide, T.M.; Clark, M.L.; Grau, R. Land change in the Greater
Antilles between 2001 and 2010. Land 2013, 2, 81–107.
32. Karteris, M. Remote Sensing of Natural Resources and Geographic Information Systems. Volume I.
Lecture Notes; Aristotle University of Thessaloniki: Thessaloniki, Greece, 1999; p. 247. (In Greek)
33. Chalkias, C. Geographic Information Systems I and II (Supplementary Notes); Harokopio
University of Athens, Athens, Greece, 2007. (In Greek)
34. Bossard, M.; Feranec, J.; Otahel, J. CORINE Land Cover Technical Guide-Addendum 2000;
Technical Report No 40; European Environmental Agency (EEA): Copenhagen, Denmark, 2000.
35. Jensen, J. Introductory Digital Image Processing: A Remote Sensing Perspective, 2nd ed.; Prentice
Hall: Upper Saddle River, NJ, USA, 1996.
36. Landis, R.; Koch, G. The measurement of observer agreement for catergorical data. Biometrics 1977,
33, 159–174.
37. Koutsias, N.; Xanthopoulos, G.; Founda, D.; Xystrakis, F.; Nioti, F.; Pleniou, M.; Mallinis, G.;
Arianoutsou, M. On the relationships between forest fires and weather conditions in Greece from
long-term national observations (1894–2010). Int. J. Wildland Fire 2013, 22, 493–507.

Land 2015, 4 354
38. Salvati, L.; Ranalli, F. Land of fires: Urban growth, economic crisis, and forest fires in Attica,
Greece. Geogr. Res. 2015, 53, 68–80.
39. Xanthakis, M.; Xanthopoulos, G. Determining land use changes in the Marathon area during a
century with the use of geographic information systems. In Proceedings of the 13th Pan-Hellenic
Foresters Congress-No II , Kastoria, Greece, 7–10 October 2007. (In Greek).
40. Braun-Blanquet, J. Pflanzensoziologie, Auflage; Springer: Vienna, Austria, 1964, Volume 3.
(In German).
41. Sommer, S.; Zucca, C.; Grainger, A.; Cherlet, M.; Zougmore, R.; Sokona, Y.; Hill, J. Application
of indicator systems for monitoring and assessment of desertification from national to global scales.
Land Degrad. Dev. 2011, 22, 184–197.
42. Geist, H.J.; Lambin, E.F. Dynamic causal patterns of desertification. Bioscience 2004, 54, 817–829.
43. Salvati, L. From simplicity to complexity: The changing geography of land vulnerability to
degradation in Italy. Geogr. Res. 2013, 51, 318–328.
44. Kalogeropoulos, K.; Chalkias, C.H.; Pissias, E.; Karalis, S.; Psarogiannis, A. Allocation of small
reservoirs as a key of development in Insular areas. Aeihoros. 2015, in press.
45. Guo, M.; Huang, X.; Li, H.; Li, X.; Ming, A. Agricultural and urban land use change
analysis in Changping County, Beijing, using remote sensing and GIS. Proc. SPIE
2013, doi:10.1117/12.2020179.
46. Fang, C.; Chen, X.; Ma, J. Olympic main venue construction and urban growth model monitoring
using remote sensing temporal data. Proc. SPIE 2007, 6790, doi:10.1117/12.747796.
© 2015 by the authors; licensee MDPI, Basel, Switzerland. This article is an open access article
distributed under the terms and conditions of the Creative Commons Attribution license
(http://creativecommons.org/licenses/by/4.0/).
Related Documents


![USPE Marathon 2018 - Athlete Information Sheet [v4] Marathon 201… · The SSE Airtricity Dublin Marathon (the Marathon) is organised by Marathon Events DAC (MEM DAC). Official timing](https://static.cupdf.com/doc/110x72/5eaccc76571291540012a086/uspe-marathon-2018-athlete-information-sheet-v4-marathon-201-the-sse-airtricity.jpg)