Office of Energy Regulation November 2009 Monitor Wholesale Markets for Gas and Electricity 2009 Office of Energy Regulation of the Netherlands Competition Authority The Hague, November 2009 Marcel Vermeulen Simon Bremer Vera Barfi Masihi

Welcome message from author
This document is posted to help you gain knowledge. Please leave a comment to let me know what you think about it! Share it to your friends and learn new things together.
Transcript

Office of Energy Regulation November 2009
Monitor Wholesale Markets for Gas and Electricity
2009
Office of Energy Regulation
of the Netherlands Competition Authority
The Hague, November 2009
Marcel Vermeulen
Simon Bremer
Vera Barfi Masihi

Office of Energy Regulation November 2009

NMa Office of Energy Regulation - 3 / 67 - November 2009
Management Summary
The wholesale gas market
Access to the infrastructure (capacity) and free tradability of gas (commodity) are essential for a properly
functioning wholesale gas market. In this respect several positive developments took place in 2008. Quality
conversion is now available in larger volumes, unused transmission capacity can be made available again,
and the trading volumes on the TTF gas hub are increasing.
- Since mid-2008 the capacity restrictions in quality conversion pose less problems. In recent years
demand for quality conversion exceeded the capacity of the conversion stations. In July 2008 GTS
and Gasterra agreed to meet the market demand for quality conversion using gas swaps – swapping
high calorific gas for low calorific gas.
- In 2008 two initiatives were launched to make unused border capacity available to the market again.
Although transmission capacity is fully booked on a first come, first served basis, the actual use of
the capacity is often lower. In February 2008 the TSOs, GTS and BEB launched a platform for day-
ahead interruptible capacity. In May 2008 the APX and Trac-X gas exchanges started secondary
trading in firm day-ahead capacity.
- In 2008 the traded and delivered volumes on the TTF grew strongly after years of modest growth.
The traded volume increased from 290 to 636 TWh and the delivered volume from 78 to 196 TWh.
The TTF's share of the total gas flows in the Netherlands has increased from 8% to 18%.
In short, 2008 saw more capacity being made available to the market and more commodity being supplied
on the trading hub. This is of course in itself good for competition. But for the overall picture, little progress
has been made. The wholesale gas market still has some major shortcomings. Shippers perceive the limited
access to flexibility as a hindrance, and the product offer on the TTF is not sufficient to meet their needs.
- Access to flexibility is crucial if energy suppliers are to source their gas independently. Seasonal
flexibility is needed to meet the high gas demand in winter, while short term flexibility is needed to
accommodate variations in consumption between and within days. This flexibility can be delivered
by the underground storage facilities which were properly utilised for the first time in 2008.
However, limited access for third parties means that energy suppliers cannot meet their need for
flexibility, so they remain dependent on Gasterra.
- Gasterra predominantly delivers this gas at the physical exit points. Shippers cannot redesignate this
gas, re-trade it or combine it with gas from other sources. This prevents energy suppliers from
optimising their gas sourcing with portfolio management. The TTF virtual marketplace is not an
alternative because flexibility is in short supply. Volumes of low-calorific gas needed for seasonal
flexibility are still limited, and although there is evidence of more liquid day-ahead trading, there is
almost no trading in within-day products.
Competition on the wholesale gas market is still in its early stages. Measures have already been put in place
to eliminate some shortcomings, these are the new market model and the market-based balancing system.
Both of these are the result of the Gas Letter from the Minister and the underlying TTF advice from the NMa.
These measures facilitate a development towards more competition. But for a better functioning market the
commitment of all market participants is required. Gasterra, the exclusive marketer of Groningen gas, has a
key responsibility here. Energy suppliers should be able to obtain gas on the TTF in the required periods and
quantities. Otherwise the development of the wholesale gas market will just be stalled further.

NMa Office of Energy Regulation - 4 / 67 - November 2009
The wholesale electricity market
Competition in the wholesale electricity market has progressed further than in the gas market. Tennet's
balancing system has served as inspiration for the upcoming balancing regime on the gas market, and both
day-ahead capacity on the border and day-ahead commodity on the exchange have been available for many
years. Positive developments in 2008 were the introduction of netting and intraday capacity on the borders
and an increase in liquidity on the APX.
- In September 2008 the TSOs Tennet, RWE, Eon and Elia introduced the principle of netting on the
borders with Germany and Belgium. As a result, the available day-ahead capacity for imports and
exports is increasing with the size of the nominations of annual and monthly capacity in the
opposite direction.
- On the cross-border connections with Germany, market parties can reserve year-ahead, month-
ahead and day-ahead capacity. It was previously not possible to respond to changing market
conditions on the day of execution itself. But since December 2008 any capacity remaining after the
(explicit) daily auction has been made available to the market on an intraday basis. On the border
with Belgium, where implicit daily auctions are being held, this has been possible since May 2009.
- The volume of day-ahead trading on the APX electricity exchange has increased by more than 4 TWh
to 25 TWh. The diminishing price sensitivity to additional demand indicates a further improvement
in liquidity. 50 MW additional demand would result in a price increase of 0.5% (previously 0.9%),
and 500 MW additional demand would result in a price increase of 6.1% (previously 14.3%).
The introduction of netting and intraday trading on the borders means that border capacity is being utilised
better. Market coupling in particular (the joint auctioning of day-ahead capacity and commodity on the
exchange) with Germany and, at a later stage, Norway will help bring about further optimisation. The limited
availability of interconnection capacity for the market remains a problem, however, as does the concentrated
market structure of the wholesale electricity market.
- All measures aimed at improving the utilisation of the available border capacity (market coupling,
netting, intra-day) are of course useful in themselves. But in the light of the physical capacity present
on the borders, more capacity needs to be made available to the market. There is evidently such
serious congestion on foreign networks in particular that Tennet is reducing the available capacity
on the Dutch borders from 7000 MW to 4600 MW.
- Market structure indicators point to an increase in pivotality of one or more market players and also
the extent to which players are pivotal has increased. Moreover, judged by the coverage ratio for new
investments, the profitability of electricity production has also increased. The profits on
inframarginal capacity evidently compensate sufficiently for the negative markup of the marginal
power plant. It is a good sign that these profits are translating into large-scale plans for construction
of new power plants.
Investment in transmission capacity is the solution to both of these obstacles. Congestion problems must be
addressed on a European level, so that investments in domestic networks will also make more border
capacity available. A regional investment plan is already on the European agenda. In addition, the market
structure will be significantly less concentrated once the new power plants are operational. The necessary
network upgrades have a longer lead time than the construction of a power plant, however. In January 2009
the NMa published a vision document containing a guideline for making network capacity less scarce. At the
same time congestion management by Tennet should fulfil as many requests for connection as possible.

NMa Office of Energy Regulation - 5 / 67 - November 2009
Contents Management Summary...........................................................................................................................................3
List of figures...........................................................................................................................................................7
List of tables ........................................................................................................................................................... 9
1 Introduction................................................................................................................................................... 11
2 Gas................................................................................................................................................................. 13
2.1 Introduction............................................................................................................................................. 13
2.2 Infrastructure........................................................................................................................................... 15
2.2.1 Introduction................................................................................................................................... 15
2.2.2 Transmission capacity................................................................................................................... 15
2.2.3 Quality conversion capacity ......................................................................................................... 20
2.2.4 Storage capacity............................................................................................................................ 22
2.2.5 Conclusion.................................................................................................................................... 24
2.3 Competition............................................................................................................................................ 24
2.3.1 Introduction.................................................................................................................................. 24
2.3.2 Market structure............................................................................................................................25
2.3.3 Market outcomes.......................................................................................................................... 28
2.3.4 Conclusion.................................................................................................................................... 30
2.4 Marketplaces........................................................................................................................................... 31
2.4.1 Introduction................................................................................................................................... 31
2.4.2 TTF volumes .................................................................................................................................. 31
2.4.3 Liquidity on the TTF.......................................................................................................................34
2.4.4 Conclusion.....................................................................................................................................39
2.5 Final remarks...........................................................................................................................................39
3 Electricity........................................................................................................................................................41
3.1 Introduction.............................................................................................................................................41
3.2 Infrastructure.......................................................................................................................................... 42
3.2.1 Introduction.................................................................................................................................. 42
3.2.2 Interconnection capacity.............................................................................................................. 42
3.2.3 Conclusion..................................................................................................................................... 51
3.3 Competition............................................................................................................................................. 51
3.3.1 Introduction................................................................................................................................... 51
3.3.2 Market structure............................................................................................................................ 51
3.3.3 Market outcomes........................................................................................................................... 55
3.3.4 Conclusion.....................................................................................................................................59
3.4 Marketplaces...........................................................................................................................................59
3.4.1 Introduction...................................................................................................................................59
3.4.2 Trading on the APX spot market ..................................................................................................60
3.4.3 Trading in OTC forward contracts ................................................................................................63
3.4.4 Conclusion.................................................................................................................................... 67
3.5 Final remarks.......................................................................................................................................... 67

NMa Office of Energy Regulation - 6 / 67 - November 2009
NMa Office of Energy Regulation - 7 / 67 - November 2009
List of figures Gas
Figure 1: Gas balance: demand for gas (daily totals), 2008.................................................................................14
Figure 2: Gas balance: supply of gas (daily totals), 2008 ....................................................................................14
Figure 3: TTF price compared with gas prices on foreign hubs (expressed as hub/TTF ratio) ..........................16
Figure 4: Available, booked and used import capacity of H-gas ........................................................................16
Figure 5: Utilisation rate of import capacity of H-gas NL-DE in relation to price difference TTF-BEB, 2008 ....17
Figure 6: Available, booked and used export capacity of H-gas ..........................................................................18
Figure 7: Utilisation rate of export capacity of H-gas NL-UK in relation to price difference TTF-NBP, 2008....19
Figure 8: Available, booked and used export capacity of L-gas........................................................................... 20
Figure 9: Intake of nitrogen (load duration curve) ...............................................................................................21
Figure 10: Intake of nitrogen (monthly averages) ................................................................................................21
Figure 11: Withdrawal and injection of gas storage (load duration curve) ......................................................... 22
Figure 12: Withdrawal and injection of gas storage (monthly averages).............................................................23
Figure 13: Capacity of other players compared with market demand (pivotal supplier analysis).......................25
Figure 14: Residual Supply Index (frequency diagram)....................................................................................... 26
Figure 15: TTF prices (frequency diagram) .......................................................................................................... 28
Figure 16: Gas price, oil price and load ............................................................................................................... 29
Figure 17: Relationship between market structure (RSI) and market outcomes (TTF price) ............................ 29
Figure 18: Traded and delivered volumes on the TTF (monthly totals)............................................................... 31
Figure 19: Churn on TTF (ratio of traded/delivered) and share of TTF in gas flows...........................................32
Figure 20: TTF volumes (delivered) broken down into H-gas and L-gas............................................................33
Figure 21: TTF volumes (traded) broken down into within-day, prompt and curve............................................33
Figure 22: TTF volumes (traded) broken down into exchanges, OTC market and bilateral contracts...............34
Figure 23: Volatility of prices on TTF (monthly contracts)...................................................................................35
Figure 24: Bid/offer spread on TTF (monthly contracts) .....................................................................................36
Figure 25: Resilience on the TTF...........................................................................................................................37
Figure 26: Depth of the market on the TTF..........................................................................................................37
Figure 27: International comparison of price volatility (monthly contracts).......................................................38
Figure 28: International comparison of bid/offer spread (monthly contracts) ...................................................38
Electricity
Figure 29: APX price compared with prices on foreign electricity exchanges (expressed as ratio
exchange/APX) ......................................................................................................................................................43
Figure 30: Utilisation of import capacity from Belgium (daily average MWh)....................................................43
Figure 31: Utilisation of export capacity to Belgium (daily average MWh) ......................................................... 44
Figure 32: Utilisation rate of NL-BE interconnection in relation to price difference APX-Belpex, 2008.............45
Figure 33: Utilisation of import capacity from Germany (daily average MWh)...................................................45
Figure 34: Utilisation of export capacity to Germany (daily average MWh) ....................................................... 46
Figure 35: Utilisation rate of NL-DE interconnection in relation to price difference APX-EEX, 2008................ 47
Figure 36: Utilisation of import capacity from Norway (daily average MWh).................................................... 47
Figure 37: Utilisation of export capacity to Norway (daily average MWh).......................................................... 48

NMa Office of Energy Regulation - 8 / 67 - November 2009
Figure 38: Utilisation rate of NL-NO interconnection in relation to price difference APX-NordPool Spot, 2008
.............................................................................................................................................................................. 49
Figure 39: Number of pivotal players, peak hours (daily average) ......................................................................52
Figure 40: RSI at sector level, peak hours (frequency) ........................................................................................52
Figure 41: Fuel prices of gas, coal, CO2 ................................................................................................................54
Figure 42: Merit order of sector (average per annum) ........................................................................................54
Figure 43: Electricity prices APX and OTC, peak hours........................................................................................ 55
Figure 44: Markup, peak hours (frequency) .........................................................................................................57
Figure 45: Relationship between market structure (RSI sector) and market outcomes (markup), peak hours 57
Figure 46: Coverage ratio (ratio of profit to investment costs) ...........................................................................58
Figure 47: Traded volume on APX (annual totals) ..............................................................................................60
Figure 48: Traded volumes on APX, EEX and Powernext (monthly totals) .........................................................61
Figure 49: Price sensitivity on APX with 50 MW additional demand ..................................................................61
Figure 50: Price sensitivity on APX with 500 MW additional demand ............................................................... 62
Figure 51: Electricity prices APX day-ahead and Tennet imbalance, peak hours.................................................63
Figure 52: Traded and cleared volumes on ENDEX (annual totals) ....................................................................63
Figure 53: Price volatility on OTC monthly contracts, peak hours...................................................................... 64
Figure 54: Bid/offer spread on OTC monthly contracts, peak hours...................................................................65
Figure 55: International comparison of price volatility OTC monthly contracts, peak hours ............................66
Figure 56: International comparison of bid/offer spread OTC monthly contracts, peak hours........................66

NMa Office of Energy Regulation - 9 / 67 - November 2009
List of tables Gas
Table 1: Utilisation rate and full utilisation (% of hours) of H-gas import capacity ...........................................17
Table 2: Utilisation rate and full utilisation (% of hours) of H-gas export capacity............................................18
Table 3: Utilisation rate and full utilisation (% of hours) of L-gas export capacity............................................ 20
Table 4: Utilisation rate of gas storage facilities (average) ..................................................................................23
Table 5: Market structure indicators for PSI (% of hours) and RSI .................................................................... 26
Table 6: Views of shippers on barriers to enter the gas market ..........................................................................27
Table 7: Views of shippers on degree of transparency in the gas market ...........................................................27
Table 8: Results of regression analysis of TTF day-ahead, 2006-2008............................................................... 30
Table 9: Traded and delivered volumes on the TTF (annual totals)....................................................................32
Table 10: Churn on TTF (ratio of traded/delivered) and share of TTF in gas flows............................................32
Table 11: Volatility of prices on TTF for daily, monthly, annual contracts (annual averages %).........................35
Table 12: Bid/offer spread on TTF for daily, monthly, annual contracts (annual averages %)...........................36
Electricity
Table 13: Utilisation rate and full utilisation (% hours) of import capacity from Belgium ................................ 44
Table 14: Utilisation rate and full utilisation (% hours) of export capacity to Belgium ..................................... 44
Table 15: Utilisation rate and full utilisation (% hours) of import capacity from Germany................................45
Table 16: Utilisation rate and full utilisation (% hours) of export capacity to Germany.................................... 46
Table 17: Utilisation rate and full utilisation (% hours) of import capacity from Norway................................. 47
Table 18: Utilisation rate and full utilisation (% hours) of export capacity to Norway...................................... 48
Table 19: Efficiency of cross-border trading between the Netherlands and neighbouring countries................ 49
Table 20: Common price pattern (PCA) for the Netherlands and neighbouring countries ...............................50
Table 21: Impact of introduction of trilateral market coupling (NL, FR, DE region) according to PCA.............50
Table 22: Impact of start of NorNed cable (NL, NO, DE, FR region) according to PCA....................................50
Table 23: Market structure PSI (% hours) and RSI sector level, peak hours.......................................................53
Table 24: Views of traders on degree of transparency in electricity market ........................................................53
Table 25: Dispatch inefficiency at sector level and at portfolio level, peak hours in 2008..................................56
Table 26: Results of regression analysis of markup, 2006-2008.........................................................................58
Table 27: Market outcome indicators markup (peak hours) and coverage ratio (annual average) ...................59
Table 28: Traded volume on APX (annual totals)................................................................................................60
Table 29: Price sensitivity (% increase) on APX with 50 MW and 500 MW additional demand....................... 62
Table 30: Traded and cleared volumes on ENDEX (annual totals) .................................................................... 64
Table 31: Price volatility on OTC monthly, quarterly, annual contracts, (annual average %) ............................ 64
Table 32: Bid-offer spread on OTC monthly, quarterly, annual contracts, (% annual average) .........................65

NMa Office of Energy Regulation - 10 / 67 - November 2009

NMa Office of Energy Regulation - 11 / 67 - November 2009
1 Introduction
The Netherlands Competition Authority (NMa) has the statutory duty of keeping a watchful eye on the
wholesale markets for electricity and gas.1 The aim of this monitoring is to determine whether competition in
these markets is impeded and which measures the NMa and the Minister of Economic Affairs can take to
remove these impediments. Because of the relationship between the electricity and gas markets, the
similarities in the manner of analysing them, and the desire to achieve efficiency advantages in the
monitoring, like last year the analysis of the gas market and that of the electricity market have been combined
in a single report.
Met hod of appr oach
The monitoring of competition on the wholesale markets consists, roughly, of comparing observed
developments with benchmarks. Three main aspects here are:
Access to and availability of infrastructure;
Degree of competition among players;
Degree of liquidity of marketplaces.
Access to essential infrastructure, such as the high voltage network and the high pressure network, form the
basis for the creation of competitive energy markets and the development of liquid marketplaces. The
infrastructure must, in principle, be accessible to all market parties on terms which not only take sufficient
account of the need to earn back the investment costs but also ensure that the decisions on using the
infrastructure are made as efficiently as possible. Competitive markets are also characterised by a structure in
which market parties are not able to exercise market power and prices are determined by the marginal costs
of supply. Liquidity in marketplaces minimises transaction costs and inspires confidence in the market.
In order to determine to what degree the actual market situation has achieved the ideal situation, we use
various criteria, depending on the availability of data and/or the possibility of calculating these benchmarks.
The criteria we apply are:
• Development over time, both within the year itself and in comparison with the previous year;
• Situations in other countries, in particular countries with which the Netherlands has cross border
connections, such as Germany, Belgium and the United Kingdom;
• Deviation from critical values of specific key indicators, such as the RSI, markup and the coverage ratio
of investments.2
1 The Electricity Act 1998 (section 5, subsection 3) states (translated): ‘The board of the competition authority in exercising the tasks and
powers assigned to it on the grounds of this act and the Gas Act takes into account the interest of promoting an electricity market and a
gas market that are non-discriminatory and transparent and characterised by actual competition and effective market operation. It keeps
a close eye on the degree to which the electricity market and the gas market satisfy the [...] aforementioned interests [...].’
2 If the RSI (Residual Supply Index) is smaller than 1, a player has the possibility of influencing the market outcomes. If the markup is
positive, that is a sign of (temporary) allocative inefficiency. If the degree of coverage of investments is greater than 1, it is a sign of
(temporary) surplus profits.

NMa Office of Energy Regulation - 12 / 67 - November 2009
Gat her ing dat a and in f or mat ion
Based on the general starting points listed above, the monitoring of the wholesale markets consists of
gathering and analysing data and information about infrastructure, competition and marketplaces. The
aforementioned statutory basis gives the NMa the power to request the necessary data from the market
parties. These data requests are partly compulsory; for the rest market parties participate in information
gathering on a voluntary basis. In addition to requests to market parties, information is gathered from
external sources as well, such as from Platts and TSO Auction (see table).
Gathered data
Component Target group Quantities
Gas market GTS Available, booked and used capacity per hour per
type of infrastructure
Gas storage operators Characteristics and use of gas storage facilities
Shippers Survey on liquidity of marketplaces and
transparency in the market
APX/ENDEX Prices, volumes and market analyses
Marketplaces (external) Prices and volumes
Electricity market Tennet Available, obtained and nominated
interconnection (cross border) capacity per hour
Available production capacity of power plants per
hour
Producers Production per power plant per hour
Characteristics of power plants
Traders Survey on liquidity of marketplaces and
transparency in the market
APX/ENDEX Prices, volumes and market analyses
Marketplaces (external) Prices and volumes
In addition to analysing the gathered data, two sounding board sessions were held with the sector to discuss
the analyses and the findings.
St r uct ur e of t he Monit or
The developments in the gas and electricity markets are reported in chapters 2 and 3 respectively. The
structure of these chapters is identical. First we examine the efficiency in the use of infrastructure, then the
degree of competition on the wholesale market and finally the liquidity of marketplaces.

NMa Office of Energy Regulation - 13 / 67 - November 2009
2 Gas
2.1 Introduction
A properly operating gas wholesale market is essential if suppliers in the retail market are to be able to
compete with one another for the customer’s favour.
In purchasing gas energy suppliers have to differentiate themselves from their competitors. If there is little
choice in the wholesale market and all energy suppliers conclude contracts with the gas provider(s) on the
same terms, competition in the retail market will not flourish. Keen pricing in the retail market can only be
expected if suppliers can develop their own purchasing strategy. This calls for a competitive wholesale market
with several active providers with a wide range of gas products and related services. Only then will the Dutch
energy consumer also be able to benefit from competition in the energy markets.
What does a well-functioning wholesale gas market look like? Because demand for gas is to a large extent
dependent on temperature and exhibits peaks in daily consumption, suppliers to end-users must be able to
vary their gas supply. An important requirement, therefore, is for suppliers to be able to combine gas from
different sources according to these consumption profiles. Gas can be obtained on the national trading hub,
by importing from abroad and by using underground storage facilities. On the trading hub, suppliers
purchase blocks of gas with different durations (year, month, day etc.) to give shape to their profile. By
reserving transmission capacity on the borders for long or short periods, gas can also be obtained from
abroad. In addition, underground gas storage facilities are used to accommodate seasonal demand or other
variations in consumption. Energy suppliers transport this gas according to the consumption profile from the
high-pressure network to the end-user connections.
However, the reality of the wholesale market tells a different story. The Groningen production field meets a
significant proportion of the demand for seasonal and short term flexibility (see box on Gas Balancing). The
gas trading company Gasterra has the exclusive right to market this Groningen gas. Gasterra delivers most of
its gas directly from the source to the end-user connection. These gas supplies match the consumption
profile, for which Gasterra generally takes over balancing responsibility from the energy supplier. The unique
swing capacity of the Groningen production field makes this flexible supply possible. However, because it is
delivered directly at the end-user connections, the gas from Groningen cannot be traded again and also
cannot be combined with gas from underground storage facilities, for example. This hinders energy suppliers
in their attempts to develop their own purchasing strategy on the gas wholesale market.
Only when market players have sufficient flexibility available themselves and gas is available in all forms and
volumes on the TTF marketplace can the gas market be said to be functioning properly. Access to
infrastructure, healthy competition and a liquid trading hub are therefore vitally important for achieving a
well-functioning gas wholesale market. The market monitor measures the extent of progress in these aspects
and identifies any obstacles that stand in the way of further development.

NMa Office of Energy Regulation - 14 / 67 - November 2009
Gas Balance
Figure 1: Gas balance: demand for gas (daily totals), 2008
Figure 2: Gas balance: supply of gas (daily totals), 2008

NMa Office of Energy Regulation - 15 / 67 - November 2009
The above box illustrates the variation in the demand for and supply of gas during the course of the year.
Producers, trading companies, industrial users and suppliers to end-users are all active in the wholesale gas
market. The demand for gas differs from one market party to the next. Industrial users with a 24 hour
production process use a constant flow of gas, while suppliers to households are faced with peaks and
troughs in gas consumption (figure 1). There are also differences in the gas supply between producers. Gas
from the small fields is produced virtually continuously at maximum output, while gas production from the
Groningen field varies markedly over time (figure 2). Both figures illustrate the role of underground gas
storage facilities. In the winter these facilities supply flexibility to the market, and in the summer they are
replenished.
2.2 Infrastructure
2.2.1 Introduction
Access to infrastructure is essential to enable market participants to play an active role in the wholesale gas
market. Shippers need transmission capacity, quality conversion capacity and storage capacity. Efficient
cross-border trading implies that price signals determine the direction of the gas flows and also that the
capacity is fully utilised if there are price differences between countries. This requires an optimal allocation of
the available transmission capacity to shippers. In addition to transmission capacity, shippers also need
quality conversion and flexibility. Imported high calorific gas has to be converted to low calorific gas for
supplying to the retail market. Because of the fluctuating consumption pattern of households in particular,
flexibility also needs to be added to the flat import profile. Optimum use of conversion stations and gas
storage facilities therefore plays a key role in achieving a properly functioning gas market.
In this chapter on infrastructure we analyse the utilisation of transmission capacity, quality conversion
capacity and storage capacity.
2.2.2 Transmission capacity
The Netherlands imports high calorific gas at border points with Germany and Belgium, for which GTS
makes firm transmission capacity of more than 38 GW available to the market. The Netherlands exports high
calorific gas at border points with Germany, Belgium and the United Kingdom. For this purpose, GTS makes
firm capacity of more than 66 GW available to the market. For exports of low calorific gas at border points
with Germany and Belgium, more than 87 GW is available.
We illustrate the use of these connections in figures showing the available, booked and used capacity. The
utilisation rate indicator tells us how intensively border capacity is being used. If the usage is equal to the
available capacity in any given hour, we call this full utilisation. The extent to which there is optimal utilisation
of the border capacity is illustrated in figures showing the maximum utilisation on a day (peak usage rate)
compared to the price difference on the gas hubs.

NMa Office of Energy Regulation - 16 / 67 - November 2009
The prices on the gas hubs in the Netherlands and neighbouring countries seem to have moved closer in
2008. Compared with previous years big price differences were of shorter duration and prices on one hub
were not structurally above or below those of another country.
Figure 3: TTF price compared with gas prices on foreign hubs (expressed as hub/TTF ratio)
In this section we look at the utilisation of the import capacity (high calorific gas) and of the export capacity
(high and low calorific gas).3
Ut i l isat ion of impor t capacit y
Figure 4: Available, booked and used import capacity of H-gas
3 The figures show an aggregation over the countries, and the tables show the border points per country.

NMa Office of Energy Regulation - 17 / 67 - November 2009
The increase in available import capacity was achieved on the border with Germany. Partly as a result of this,
the utilisation rate was considerably lower in 2008, but the volume of gas flowing into the Netherlands from
abroad was lower in a physical sense as well. Whereas import flows in 2007 regularly reached the capacity
limits (physical congestion), this no longer happened in 2008. Full utilisation was not achieved during any
hour.
Table 1: Utilisation rate and full utilisation (% of hours) of H-gas import capacity
Import capacity of H-gas 2006 2007 2008
Germany Utilisation rate 78% 84% 70%
Full utilisation 0% 2% 0%
Belgium Utilisation rate 62% 41% 20%
Full utilisation 30% 0% 0%
As in the previous year, the border capacity with Germany for 2008 was fully booked. GTS allocates the
capacity on a first come, first served basis. Bookings are made on a firm basis as long as the capacity
permits. Thereafter, bookings are registered on an interruptible basis. Some interruptible capacity was still
available in 2008. The following figure shows that the more expensive the gas on the TTF (day-ahead) is in
comparison to the German gas hub BEB, the better the import capacity is utilised. And yet the available
import capacity is never fully utilised, even when there are significant price differences. Shippers see
themselves confronted with a trade-off here: definite gains from arbitrage (since transmission costs are paid
when capacity is booked) against more balancing risks because fewer flexibility options remain.
Figure 5: Utilisation rate of import capacity of H-gas NL-DE in relation to price difference TTF-BEB, 2008

NMa Office of Energy Regulation - 18 / 67 - November 2009
Another reason why these opportunities remain unutilised is the inability of market participants that are
interested in arbitrage gains to obtain the necessary day-ahead capacity (contractual congestion). In 2008
two initiatives were launched to make short-term capacity available to the market. In February the TSOs GTS
and BEB started a platform (EUCABO) on which shippers can book day-ahead interruptible capacity. In May
the APX and Trac-X gas exchanges started secondary trading in firm day-ahead capacity. The EUCABO
platform is being used to a limited extent; in the secondary market there is evidence of some activity on the
German side in particular.
Ut i l isat ion of expor t capacit y
Figure 6: Available, booked and used export capacity of H-gas4
Exports of high calorific gas only face a certain degree of physical congestion on the border with Belgium;
these border points were fully utilised 4% of the time.
Table 2: Utilisation rate and full utilisation (% of hours) of H-gas export capacity
Export capacity of H-gas 2006 2007 2008
Germany Utilisation rate 41% 44% 48%
Full utilisation 0% 0% 0%
Belgium Utilisation rate 42% 59% 58%
Full utilisation 0% 7% 4%
United Kingdom Utilisation rate 85% 51% 68%
Full utilisation 0% 0% 0%
4 Note on the graph: Because of the lack of data on BBL bookings in 2006 and 2007, it has been assumed to be the same as the available
capacity (as in 2008). In addition, the increase in available capacity after the commissioning of the BBL (December 2006) coincides
with a drop in available capacity on the German and Belgian borders.

NMa Office of Energy Regulation - 19 / 67 - November 2009
The capacity of the BBL (Balgzand Bacton Line) export connection with the United Kingdom is fully booked
for the entire year. At certain times utilisation came in close proximity to capacity limits, but there was usually
enough room left to transport more gas. Although the BBL connection is used more intensively on days when
TTF prices are lower than those on NBP, many opportunities for arbitrage between the markets remain
unused. This indicates contractual congestion on the connection with the United Kingdom.
Figure 7: Utilisation rate of export capacity of H-gas NL-UK in relation to price difference TTF-NBP, 2008
Exports of low calorific gas have a much stronger seasonal pattern than exports of high calorific gas. In that
sense, the Netherlands is an exporter of flexibility (figure 8). The capacity on the border with Belgium is fully
booked; there is some capacity available on the border with Germany. Physical congestion does not occur in
exports of low calorific gas. The utilisation rate also remains stable on both borders.

NMa Office of Energy Regulation - 20 / 67 - November 2009
Figure 8: Available, booked and used export capacity of L-gas.
Table 3: Utilisation rate and full utilisation (% of hours) of L-gas export capacity
Export capacity of L gas 2006 2007 2008
Germany Utilisation rate 31% 32% 32%
Full utilisation 0% 0% 0%
Belgium Utilisation rate 47% 48% 45%
Full utilisation 0% 0% 0%
2.2.3 Quality conversion capacity
Quality conversion enables shippers to convert the gas quality. Quality conversion is essential because end-
users take a specific gas quality, namely low calorific gas. Conversion takes place by mixing H-gas with L-gas
or adding nitrogen to H-gas. GTS has mixing stations and nitrogen injection stations at a number of
locations on the high pressure network. In 2008 the quality conversion capacity averaged more than 34
million KCEs (quality conversion units), 90% of which from nitrogen fixation and 10% from mixing different
qualities.
NMa Office of Energy Regulation - 21 / 67 - November 2009
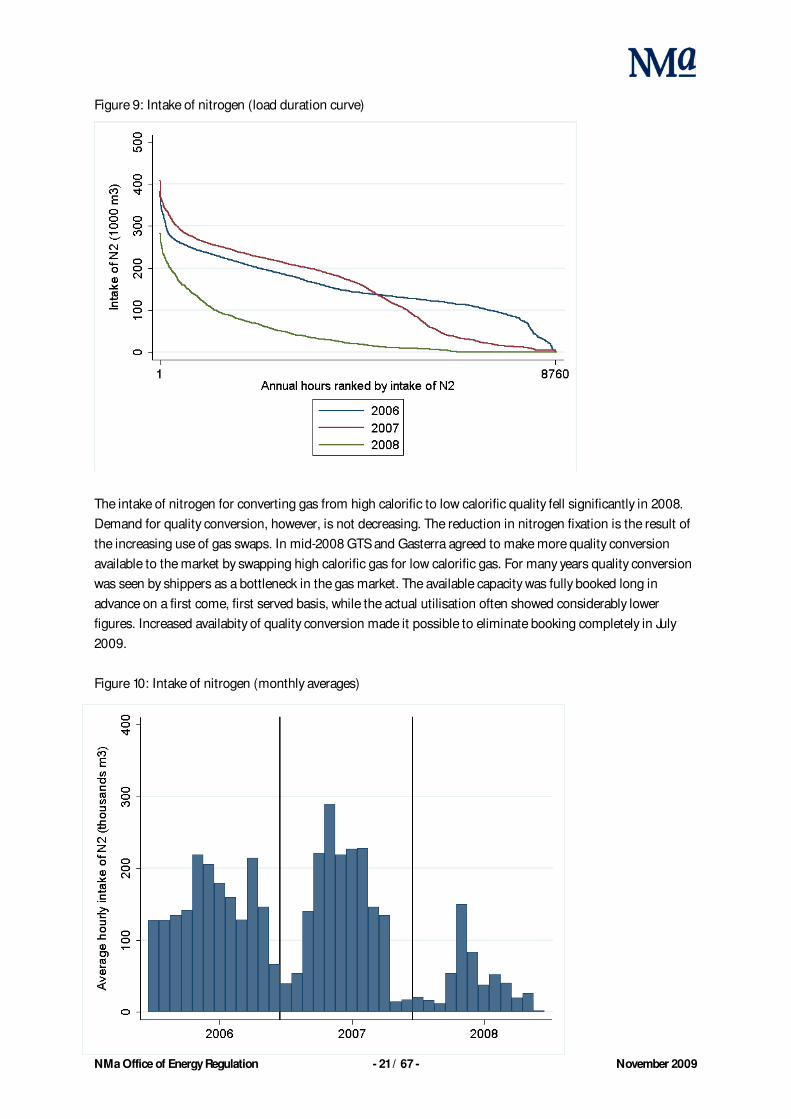
Figure 9: Intake of nitrogen (load duration curve)
The intake of nitrogen for converting gas from high calorific to low calorific quality fell significantly in 2008.
Demand for quality conversion, however, is not decreasing. The reduction in nitrogen fixation is the result of
the increasing use of gas swaps. In mid-2008 GTS and Gasterra agreed to make more quality conversion
available to the market by swapping high calorific gas for low calorific gas. For many years quality conversion
was seen by shippers as a bottleneck in the gas market. The available capacity was fully booked long in
advance on a first come, first served basis, while the actual utilisation often showed considerably lower
figures. Increased availabity of quality conversion made it possible to eliminate booking completely in July
2009.
Figure 10: Intake of nitrogen (monthly averages)

NMa Office of Energy Regulation - 22 / 67 - November 2009
2.2.4 Storage capacity
Gas storage enables shippers to obtain flexibility. Flexibility in the gas supply is essential because the demand
for gas is not constant. Gas consumption varies between seasons, but also from day to day with peaks during
the day. In the Netherlands there are two operational gas storage facilities for seasonal flexibility with a
working volume of around 45 TWh and a send-out capacity of around 45 GW. The storage capacity of
Grijpskerk (H-gas) has 11% third party access; the rest of the capacity at Grijpskerk and all Norg storage
capacity (L-gas) is reserved by the operator NAM. This reserved capacity is exclusively allocated to Gasterra.
In terms of short term flexibility, more than 11 TWh of working volume and almost 29 GW of send-out
capacity is connected to the Dutch high pressure network (excluding the LNG Maasvlakte peak shaver). The
operators Essent, Nuon and RWE use these storages for their own purposes without third party access, while
the operator TAQA makes 7% of the storage in Alkmaar available for third party access.
Figure 11: Withdrawal and injection of gas storage (load duration curve)
The above figure shows, by way of a load duration curve, how the capacity of gas storage facilities connected
to the GTS high pressure network is utilised. Apparent is the higher utilisation of the withdrawal capacity in
2008 compared with previous years. Looking at the annual pattern in the figure below, the seasonal cycle is
also much more visible.
NMa Office of Energy Regulation - 23 / 67 - November 2009
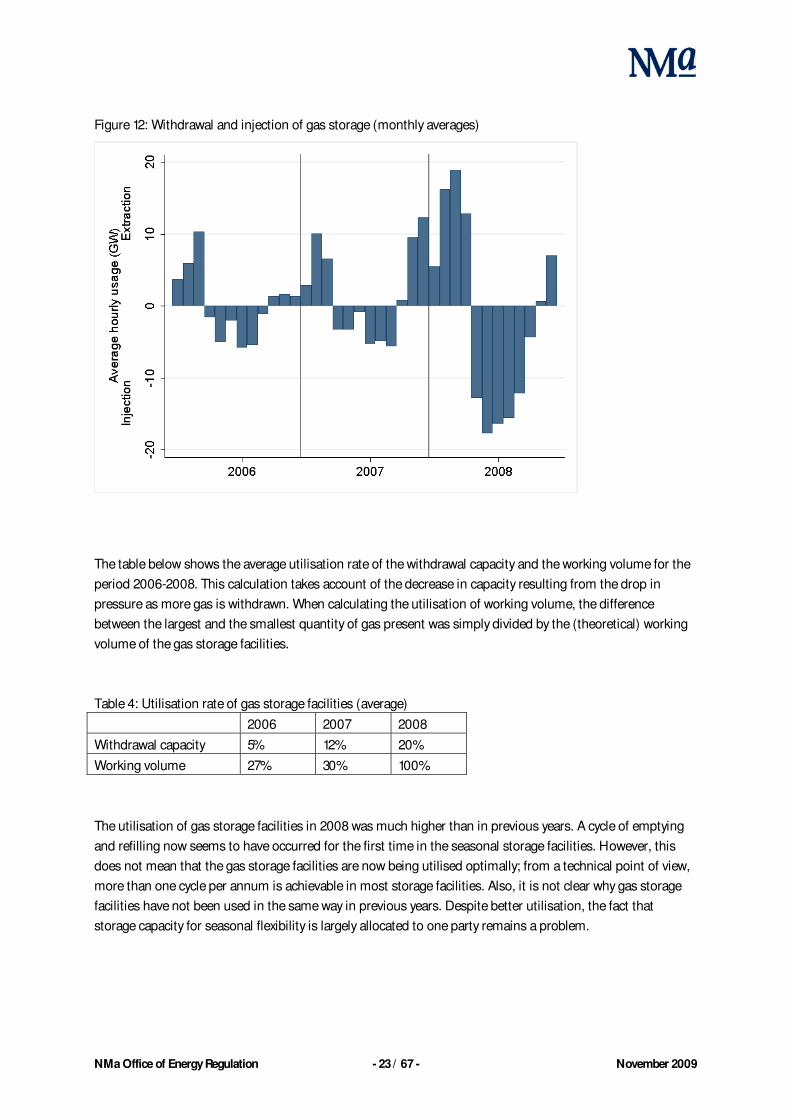
Figure 12: Withdrawal and injection of gas storage (monthly averages)
The table below shows the average utilisation rate of the withdrawal capacity and the working volume for the
period 2006-2008. This calculation takes account of the decrease in capacity resulting from the drop in
pressure as more gas is withdrawn. When calculating the utilisation of working volume, the difference
between the largest and the smallest quantity of gas present was simply divided by the (theoretical) working
volume of the gas storage facilities.
Table 4: Utilisation rate of gas storage facilities (average)
2006 2007 2008
Withdrawal capacity 5% 12% 20%
Working volume 27% 30% 100%
The utilisation of gas storage facilities in 2008 was much higher than in previous years. A cycle of emptying
and refilling now seems to have occurred for the first time in the seasonal storage facilities. However, this
does not mean that the gas storage facilities are now being utilised optimally; from a technical point of view,
more than one cycle per annum is achievable in most storage facilities. Also, it is not clear why gas storage
facilities have not been used in the same way in previous years. Despite better utilisation, the fact that
storage capacity for seasonal flexibility is largely allocated to one party remains a problem.

NMa Office of Energy Regulation - 24 / 67 - November 2009
2.2.5 Conclusion
Physical gas flows between countries are only driven by price signals to a limited extent. Although the border
capacity is better utilised when there are bigger price differences, even then some of the capacity remains
unused. Market players book capacity generously to ensure flexibility, as a result of which allocation on a first
come, first served basis does not result in efficient cross-border trading. Positive developments in 2008 were
the availability of day-ahead capacity on an interruptible basis and the creation of a secondary market for day-
ahead firm capacity. Particularly important progress was made in the area of quality conversion. On account
of the use of gas swaps the capacity of conversion stations now no longer imposes a ceiling on quantities of
gas to be converted. This has made it possible to do away with booking quality conversion in advance
altogether in July 2009. Furthermore, storage capacity was much better utilised in 2008 than in previous
years. The pattern of injection and withdrawal is much closer to the seasonal cycle one would normally
expect. Because of the limited third party access to underground storage facilities, this does not alter the
dependence faced by energy suppliers in terms of seasonal flexibility in particular.
2.3 Competition
2.3.1 Introduction
On a level playing field the players have access to all the relevant infrastructure on the same terms. With an
unequal distribution of capacity, it is not inconceivable that during periods of high market demand one or
more players will become pivotal. After all, the gas market is marked by highly fluctuating demand.
Households have a clear daily pattern in gas take-up, with peaks in the morning and evening. But much more
important is the seasonal component in the demand for gas. On winter days demand is many times higher
than it is in the summer. If this pivotality affects a substantial part of the capacity, this can have adverse
consequences on market outcomes.
In this chapter on competition we look at the market structure, followed by the market outcomes. We
establish whether players are pivotal in the market and what impact this has on market outcomes. A lack of
transparency and possible barriers to entry may keep the market concentrated. The Monitor therefore also
surveys the opinions of shippers on these aspects of the market structure.

NMa Office of Energy Regulation - 25 / 67 - November 2009
2.3.2 Market structure
Concent r at ion in suppl y
To gain insight into market structure, the pivotal supplier analysis is often used in economic studies of energy
markets.5 This analysis shows how often a dominant player is pivotal in the market. This gives more
information on potential market power than traditional indicators such as market share or the HHI
(Hirschman-Herfindahl Index). A high market share (or high HHI) does not necessarily indicate market
power if the other players have sufficient capacity to meet the entire demand. In that case the player with the
high market share will probably not be able to drive up the price. If at any time the joint capacity of the other
players is insufficient to meet the entire market demand, then this market party is pivotal in that hour.
The pivotal supplier index is expressed in the percentage of hours in which one or more players are pivotal.
To calculate this index, we need to know the total capacity available to players other than Gasterra and the
load per hour for the specific year. Capacity includes production fields, gas storage facilities, imports,
interruptible demand and linepack. Capacity and demand (load duration curve) are shown in the following
figure. To the left of the point where the demand and the capacity line intersect, these other players are not
able to meet the entire demand. In 2008 this was the case in 5,411 hours, or 62% of the time.
Figure 13: Capacity of other players compared with market demand (pivotal supplier analysis)
5 See, for example, Structure and performance of six European wholesale electricity markets in 2003, 2004 and 2005, London Economics
in association with Global Energy Decisions and Directorate General of Competition (2007); Research into gas flexibility services – a
report prepared for DTe, Frontier Economics (2008).

NMa Office of Energy Regulation - 26 / 67 - November 2009
This graph also shows that the extent to which Gasterra is pivotal varies strongly. At peak hours the demand
for gas is more than double the capacity available to other players. The extent to which a player is pivotal can
be measured with the Residual Supply Index (RSI). The RSI can be defined as: the joint capacity of other
players/ total load. This indicator is closely related to the Pivotal Supplier Analysis; an RSI value below 1 means
that a supplier is pivotal. The more pivotal a player is (a lower RSI), the more freedom it has in terms of
pricing. The average Residual Supply Index in 2008 was 0.88.
The following RSI frequency diagram shows that the seasons have a clear impact on the market structure.
During the winter the RSI value is close to 0.5, while in the summer it is well above 1. This underlines that
pivotality is an issue in winter in particular.
Figure 14: Residual Supply Index (frequency diagram)
Table 5: Market structure indicators for PSI (% of hours) and RSI
2006 2007 2008
Pivotal Supplier Index 60% 65% 62%
Residual Supply Index 0.87 0.86 0.88
Tr anspar ency and obst acl es t o ent r y
The market structure indicators have changed little in recent years (table 5). There have also been no
significant shifts in capacity between players. The survey of shippers also reveals that they regard the scarcity
in transmission capacity and storage capacity as a significant barrier to entry. Available quality conversion is
now seen as much less of a barrier (table 6).

NMa Office of Energy Regulation - 27 / 67 - November 2009
Table 6: Views of shippers on barriers to enter the gas market
In addition to the scarcity in capacity, a market with poor transparency can deter shippers from participating
more in the market. The survey of shippers reveals that information on available storage capacity and on the
price of flexibility is insufficiently transparent. The quality and timeliness of balancing information is generally
rated as poor (table 7). In view of the upcoming introduction of a new balancing regime, this is cause for
concern. Several shippers cite the quality and timeliness of balancing information as the most urgent area for
improvement in the gas market.
Table 7: Views of shippers on degree of transparency in the gas market
Low barrier Average barrier High barrier
Administrative procedures
General terms and conditions
Scarcity in storage capacity
2007 average
67% interval
Scarcity in transport capacity
Scarcity in QualityConversion capacity
Scarcity of flexibility
Entr
y to
whole
sale
mark
et
Acce
ss to
ga
s sto
rag
e
2008 average
Very bad Bad Neutral Good Very good
Gas p
rnc
es
Fle
x p
rices
Tra
nsp
ort
cap
ac
ity
Sto
rag
e
cap
ac
ity
Ste
eri
ng
info
rmati
on
Ch
an
ce o
f
inte
rrup
tio
n
APX-gas
Endex gas market
OTC market
Short term available
Transport capacity
Bilateral market
Tolerance
Physical storage
Virtual storage
Long term available
Transport capacity
Short term available
Storage capacity
Long term available
Storage capacity
Quality
Steering information
Timeliness
Steering information
Transport capacity
Quality conversioncapacity
Short term available
Quality conversion capacity
Long term available
Quality conversion capacityCo
nv
ers
ion
cap
ac
ity
2007 average
2008 average
67% interval

NMa Office of Energy Regulation - 28 / 67 - November 2009
2.3.3 Market outcomes
In the absence of a marketplace where demand and supply determine the price of gas, the oil price has been
used as a reference price for gas. Prices in bilateral gas contracts are indexed to oil prices to a significant
extent. These days gas hubs are taking an increasing share of the trading volume. An indicator of market
development therefore is whether the prices on the gas hubs are increasingly reflecting demand and supply
factors or whether they are still following the oil price.
The past three years provide a changing picture of the level of TTF prices. The average TTF price for day-
ahead gas of EUR 25/MWh in 2008 is more than EUR 10 higher than in the previous year.
Figure 15: TTF prices (frequency diagram)
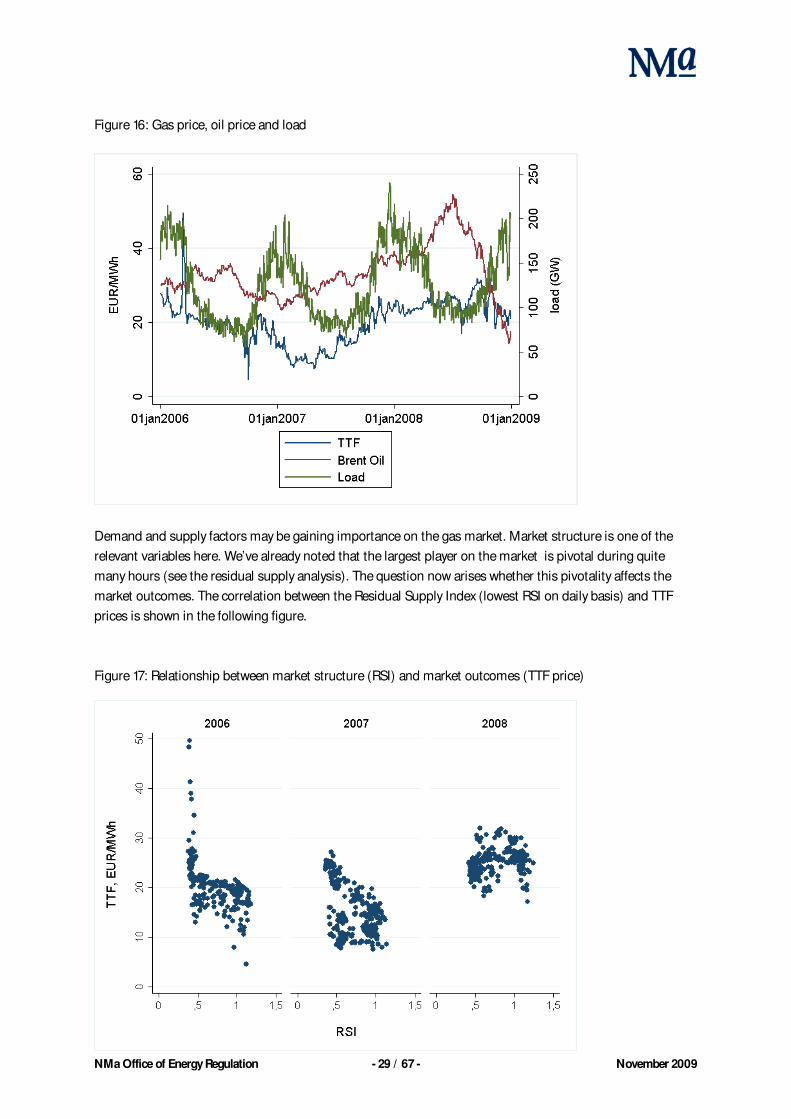
The following graph shows the gas price, the price of crude oil and the load on the Dutch high pressure
network over the period 2006-2008. At first glance the gas price seems to follow the oil price quite closely.
But the peaks in the oil price in 2008 are only reflected in the gas price to a limited extent. These high oil
prices occurred in the summer, a period in which demand for gas is at its lowest.
NMa Office of Energy Regulation - 29 / 67 - November 2009
Figure 16: Gas price, oil price and load
Demand and supply factors may be gaining importance on the gas market. Market structure is one of the
relevant variables here. We’ve already noted that the largest player on the market is pivotal during quite
many hours (see the residual supply analysis). The question now arises whether this pivotality affects the
market outcomes. The correlation between the Residual Supply Index (lowest RSI on daily basis) and TTF
prices is shown in the following figure.
Figure 17: Relationship between market structure (RSI) and market outcomes (TTF price)
NMa Office of Energy Regulation - 30 / 67 - November 2009
In 2008 we see TTF prices moving within a limited bandwidth compared with previous years, but they are at a
higher level (see also the frequency diagram). The figure for 2006 and 2007 shows that high TTF prices occur
with a low RSI, although it is difficult to identify a general trend in 2008. It is likely that the extremes in the
TTF prices were caused among other things by a shortage in the market. To find out more about the
relationship between market structure and market outcomes, we carried out an econometric analysis over the
period 2006-2008 with more explanatory variables (see box below). This analysis examines the causality and
its direction.
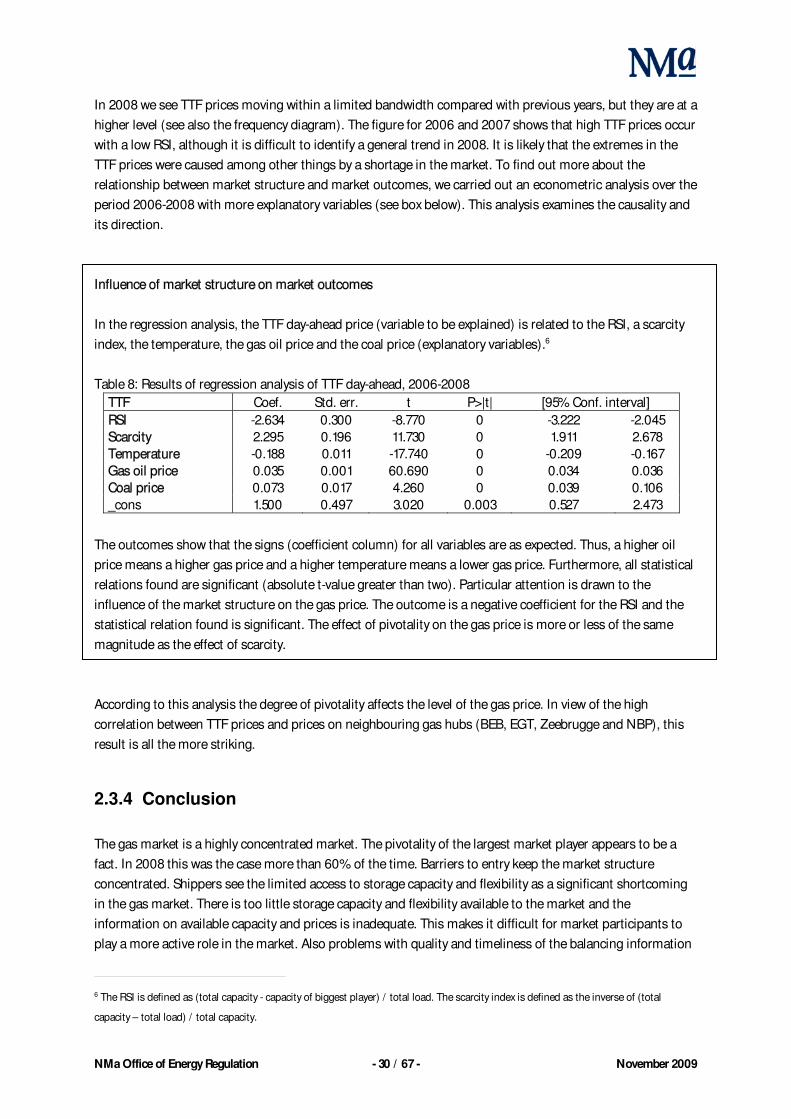
In the regression analysis, the TTF day-ahead price (variable to be explained) is related to the RSI, a scarcity
index, the temperature, the gas oil price and the coal price (explanatory variables).6
Table 8: Results of regression analysis of TTF day-ahead, 2006-2008
Coef. Std. err. t P>|t| [95% Conf. interval]
-2.634 0.300 -8.770 0 -3.222 -2.045
2.295 0.196 11.730 0 1.911 2.678
-0.188 0.011 -17.740 0 -0.209 -0.167
0.035 0.001 60.690 0 0.034 0.036
0.073 0.017 4.260 0 0.039 0.106
_cons 1.500 0.497 3.020 0.003 0.527 2.473
The outcomes show that the signs (coefficient column) for all variables are as expected. Thus, a higher oil
price means a higher gas price and a higher temperature means a lower gas price. Furthermore, all statistical
relations found are significant (absolute t-value greater than two). Particular attention is drawn to the
influence of the market structure on the gas price. The outcome is a negative coefficient for the RSI and the
statistical relation found is significant. The effect of pivotality on the gas price is more or less of the same
magnitude as the effect of scarcity.
According to this analysis the degree of pivotality affects the level of the gas price. In view of the high
correlation between TTF prices and prices on neighbouring gas hubs (BEB, EGT, Zeebrugge and NBP), this
result is all the more striking.
2.3.4 Conclusion
The gas market is a highly concentrated market. The pivotality of the largest market player appears to be a
fact. In 2008 this was the case more than 60% of the time. Barriers to entry keep the market structure
concentrated. Shippers see the limited access to storage capacity and flexibility as a significant shortcoming
in the gas market. There is too little storage capacity and flexibility available to the market and the
information on available capacity and prices is inadequate. This makes it difficult for market participants to
play a more active role in the market. Also problems with quality and timeliness of the balancing information
6 The RSI is defined as (total capacity - capacity of biggest player) / total load. The scarcity index is defined as the inverse of (total
capacity – total load) / total capacity.
NMa Office of Energy Regulation - 31 / 67 - November 2009
pose obstacles for participation. At the same time, demand and supply factors and therefore market
structure seem to play a more defining role in market outcomes. The gas price no longer automatically
follows the peaks and troughs in the oil price. High prices as a result of a shortage in the market are then a
manifestation of a properly functioning market. But we also note that (the extent of) pivotality in itself is a
relevant factor with an impact on market outcomes.
2.4 Marketplaces
2.4.1 Introduction
A liquid gas hub enables shippers to steer their own course. This requires a wide range of products and
services with different durations to be available on the gas hub. Blocks of gas of different durations (year,
month, etc.) are needed to build up a rough profile. Then if take-up forecasts change, gas can still be
purchased or sold. In order to more accurately match the supply to the actual gas take-up, a supply of short-
term day-ahead and within-day products on the TTF is crucial.
In this chapter on marketplaces we take a look at the development of liquidity on the TTF. First we discuss
traded and delivered volumes on the TTF. Then we look at the liquidity indicators: volatility, spread, resilience
and depth. We also make a comparison with neighbouring hubs such as NBP and Zeebrugge.
2.4.2 TTF volumes
In this section we show the development of total traded and delivered volumes on the TTF. We then examine
the division of these volumes over gas quality (H-gas or L-gas), time dimension (long-term or short-term
products) and marketplace (exchanges, OTC or bilateral).
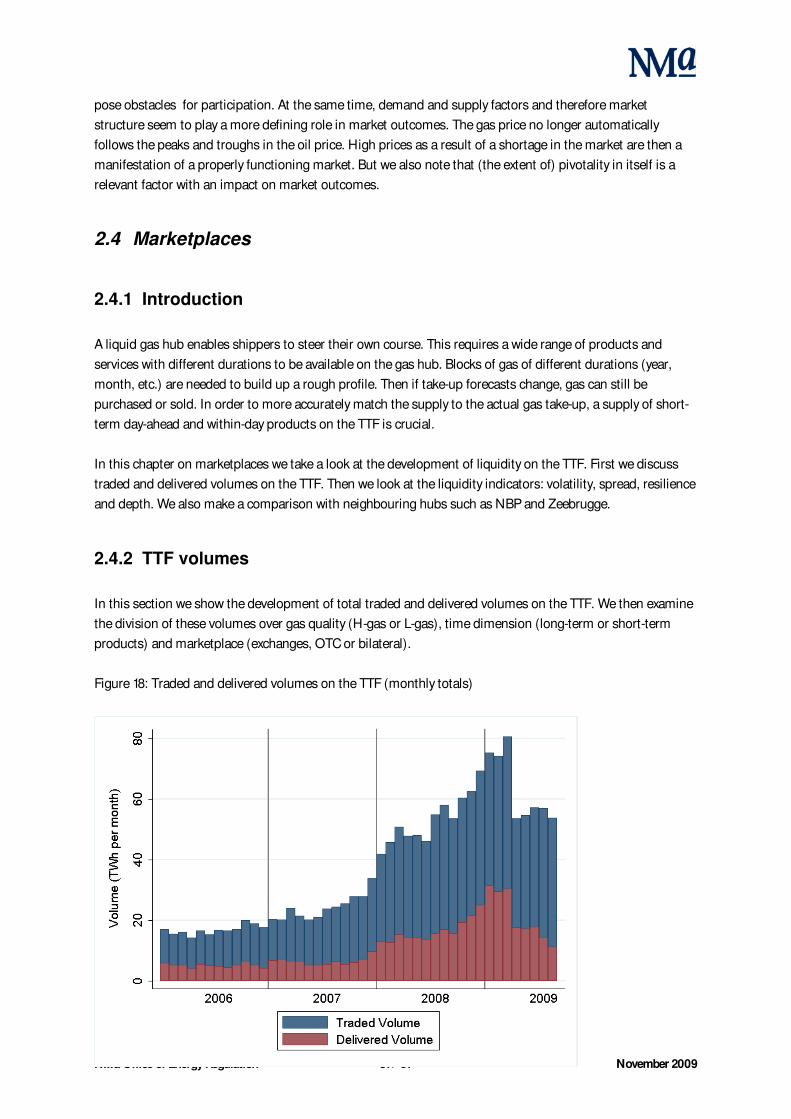
Figure 18: Traded and delivered volumes on the TTF (monthly totals)

NMa Office of Energy Regulation - 32 / 67 - November 2009
Table 9: Traded and delivered volumes on the TTF (annual totals)
2006 2007 2008
Traded volumes (TWh) 201 290 636
Delivered volumes (TWh) 61 78 196
The traded volume and the delivered volume both more than doubled in 2008. Whereas growth in TTF
volumes had to a certain extent stagnated in previous years, trading on the TTF recovered in 2008. Volumes
in the first half of 2009 show clearly that the growth of 2008 is not continuing for the time being. This could
be related to the drop in demand for gas as a result of the economic downturn. The increasing significance of
TTF in the gas market can be seen from the proportion of the total gas flows made up by TTF gas. This
increased from 8% in 2007 to 18% in 2008.7 The churn rate on the TTF, a measure expressing how often
delivered gas has been traded, was slightly lower in 2008. This is to be expected given the high growth in the
delivered volume. On the other hand, it could also be an indication of possible restrictive conditions imposed
on TTF delivery.
Figure 19: Churn on TTF (ratio of traded/delivered) and share of TTF in gas flows
Table 10: Churn on TTF (ratio of traded/delivered) and share of TTF in gas flows
2006 2007 2008
Churn on TTF 3.3 3.7 3.2
TTF share 6% 8% 18%
7 This 18% is the delivered volume on the TTF divided by the total take-up (domestic and border points). When the TTF volume is
expressed in domestic take-up, the share works out at 41%. This picture is slightly skewed since gas delivered on the TTF is also
exported. A breakdown by small customer would therefore provide more insight. TTF's share of the small customer market (low calorific)
is 9%.
01
23
4
Ratio tra
ded v
olu
me/d
eliv
ere
d v
olu
me T
TF
05
10
15
20
25
30
35
40
Mark
et share
of T
TF
(%
)
01jan2006 01jan2007 01jan2008 01jan2009
Market share of the TTF
Ratio Traded/Delivered on TTF

NMa Office of Energy Regulation - 33 / 67 - November 2009
Volumes alone do not tell the whole story. It is undoubtedly a positive development that there is considerably
more gas available on the TTF. How this gas appears in the product offerings on the TTF is at least as
important. Gas quality and the time dimension are relevant issues here. Shippers need low calorific gas to
supply the retail segment, particularly households. In addition, the gas must be available in different
durations in order to obtain the necessary flexibility.
Figure 20: TTF volumes (delivered) broken down into H-gas and L-gas
Figure 21: TTF volumes (traded) broken down into within-day, prompt and curve8

NMa Office of Energy Regulation - 34 / 67 - November 2009
The quantity of delivered L-gas on the TTF increased significantly in 2008. In view of the absence of L-gas on
the TTF in 2006 and the limited volume in 2007, this was a necessary development. But these quantities can
only provide a small part of the gas needed to supply the retail segment. The fact that the capacity restriction
on quality conversion is posing less problems does not mean that all the H-gas can now easily be converted.
It is even doubtful whether any TTF gas can be supplied to the households at all because the share of short-
term products remains low. This makes it difficult if not impossible for shippers to put together the
consumption profile with TTF gas.
Although there is still much scope for improvement in the supply of low calorific gas and short-term products
on the TTF, it is a positive sign that shippers are performing comparatively more transactions via the gas
exchange and fewer on the bilateral route. In view of the as yet limited extent of these transactions, however,
this is no more than a good start.
Figure 22: TTF volumes (traded) broken down into exchanges, OTC market and bilateral contracts
2.4.3 Liquidity on the TTF
The development of liquidity on the TTF can not only be judged from the volume. Relevant indicators of
liquidity are volatility of the prices and the bid/offer spread. Volatility is a measure of expressing price
fluctuations. Generally speaking, the greater the volatility, the greater the uncertainty surrounding the price.
The bid/offer spread provides an indication of the level of transaction costs. The lower the bid/offer spread,
the easier it is to arrive at a transaction. In addition, the survey of shippers asked about the number of
standard lots that can be traded without affecting the price and how far ahead (days, months, years) shippers
trade in products. These liquidity indicators are known as resilience and depth of the market respectively.
8 Prompt means day-ahead, weekend, balance of the week, working week + 1 and balance of the month. Curve products include months,
quarters, summer/winter, year(s) ahead.

NMa Office of Energy Regulation - 35 / 67 - November 2009
Vol at i l i t y and spr ead
Figure 23: Volatility of prices on TTF (monthly contracts)
Table 11: Volatility of prices on TTF for daily, monthly, annual contracts (annual averages %)
2006 2007 2008
Day ahead 5.1 4.4 3
Month ahead 1.8 3.1 1.8
Year ahead 0.8 1.2 1.3
For day-ahead contracts, the volatility has been developing positively now for three consecutive years.
Monthly contracts are back at 2006 levels despite an improvement on last year. It can be seen that the
volatility of annual contracts is increasing slightly over the years.
NMa Office of Energy Regulation - 36 / 67 - November 2009
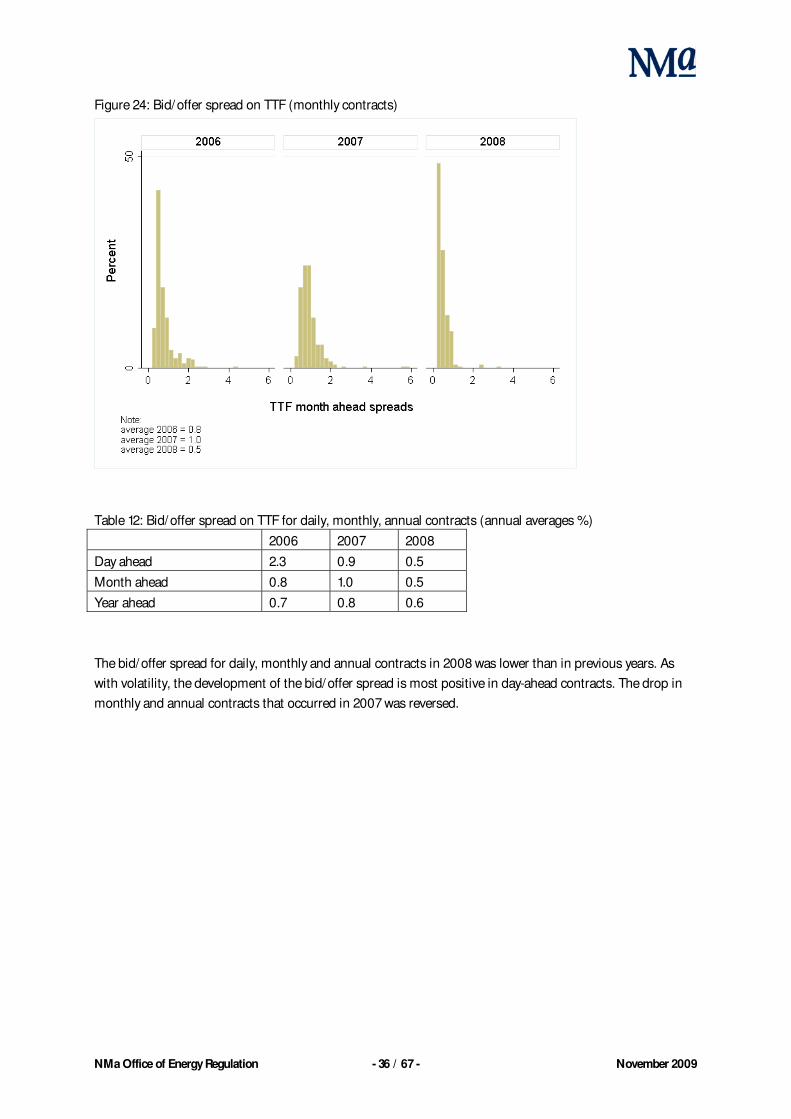
Figure 24: Bid/offer spread on TTF (monthly contracts)
Table 12: Bid/offer spread on TTF for daily, monthly, annual contracts (annual averages %)
2006 2007 2008
Day ahead 2.3 0.9 0.5
Month ahead 0.8 1.0 0.5
Year ahead 0.7 0.8 0.6
The bid/offer spread for daily, monthly and annual contracts in 2008 was lower than in previous years. As
with volatility, the development of the bid/offer spread is most positive in day-ahead contracts. The drop in
monthly and annual contracts that occurred in 2007 was reversed.

NMa Office of Energy Regulation - 37 / 67 - November 2009
Resi l ience and dept h of t he mar ket
Figure 25: Resilience on the TTF
Resilience has increased for almost all contracts on the TTF. Shippers were asked about the number of
standard 30 MW lots they can trade without influencing the price. The large increase in resilience in day-
ahead contracts is yet another indication of a more liquid day-ahead market on the TTF.
Figure 26: Depth of the market on the TTF
The depth of the market on the TTF has decreased significantly for monthly and quarterly contracts. Shippers
evidently prefer to enter into contracts closer to the delivery date. Uncertainty about price developments is a
possible explanation for this.

NMa Office of Energy Regulation - 38 / 67 - November 2009
A comparison with the gas hubs in neighbouring countries reveals that with the exception of the spread in
Germany, the volatility and bid/offer spread on the TTF in 2008 was more or less comparable.
Figure 27: International comparison of price volatility (monthly contracts)
Figure 28: International comparison of bid/offer spread (monthly contracts)

NMa Office of Energy Regulation - 39 / 67 - November 2009
2.4.4 Conclusion
Traded and delivered volumes on the TTF increased substantially in 2008. This is a major boost for the gas
market. Gas is also being increasingly traded on APX and ENDEX, an indication of more confidence in pricing
on the gas exchanges. However, the share of low calorific gas remains limited and there has been virtually no
improvement in the supply of within-day products. This implies that the TTF offers the industrial segment
(H-gas) genuine opportunities for sourcing, although it is not yet a viable alternative for the retail segment
serving households. Nonetheless, it is clear that the TTF is developing into a more liquid gas hub. Particularly
in the case of day-ahead contracts, the liquidity indicators (volatility, bid/offer spread and resilience) point to
a positive development.
2.5 Final remarks
Competition in the wholesale gas market is to a large extent being frustrated by the limited access to
flexibility. A small number of underground storage facilities for seasonal flexibility has been opened to third
parties, and short-term flexibility, particularly within-day, is hardly available on the TTF. This makes it difficult
if not impossible for providers to put together the required take-off profile of their customers. These energy
suppliers will therefore not manage to differentiate themselves from competitors in the retail market on the
basis of their purchasing strategy. The introduction of the new market model will probably only have a slight
impact on this. Providers who have their own gas storage facilities have more opportunities for portfolio
optimisation, but with the new balancing regime there are also calls to offer this flexibility on the bid ladder.
One complicating factor is the relatively limited capacity of Dutch gas storage facilities. Because of the swing
production in the Groningen field, there were virtually no incentives to invest in underground storage
facilities. Therefore, competition in the Dutch gas market would benefit from more flexibility being offered on
the TTF. As the exclusive marketer of Groningen gas, Gasterra plays a key role in the transition to a more
competitive market.

NMa Office of Energy Regulation - 40 / 67 - November 2009

NMa Office of Energy Regulation - 41 / 67 - November 2009
3 Electricity
3.1 Introduction
As with gas, a properly operating electricity wholesale market is essential if suppliers in the retail market are
to compete with one another for the customer’s favour.
A fundamental characteristic of the electricity market is that consumption and production must be balanced
at all times. Unlike gas, however, there is no buffer capacity in the electricity network, and there is as yet no
way to store electricity on a large scale. On the other hand, temperature only plays a minor role in the
demand for electricity, so days and seasons only differ slightly. Like gas, however, electricity is subject to a
daily take-up pattern. The demand for electricity differs from hour to hour, which implies the production at
power plants also varies throughout the day.
What does a well-functioning wholesale electricity market look like? Because production needs to equal
consumption, it is important that energy suppliers are able to meet the demand for electricity from hour to
hour. Suppliers can build up this consumption profile with electricity blocks of various durations (for
instance month, day, hour). Suppliers buy these blocks of electricity through several different channels. They
can obtain it straight from the producer, through a broker or on the electricity exchange. Market participants
can also reserve transmission capacity on the borders for long or short periods in order to import from
abroad. Access to transmission capacity and liquid marketplaces are therefore essential elements in the
wholesale electricity market. Smart purchasing on (inter)national marketplaces should enable energy
suppliers to provide end-users with a competitive offering.
In practice, suppliers have good opportunities to obtain the necessary blocks of electricity. Besides bilateral
agreements or OTC (over the counter), suppliers can obtain forward contracts on the ENDEX futures market.
Capacity is also auctioned on an annual and monthly basis at cross-border connections. Since the demand
for electricity changes hour by hour, the short term is also very relevant. Suppliers can obtain short-term
blocks on the APX day-ahead market, where electricity for every hour of the next day is traded. Moreover day-
ahead border capacity is also auctioned on an hourly basis. Compared to the gas market, where the
commodity is traded mainly in forward contracts and where border capacity is allocated on a first come, first
served basis, the wholesale electricity market is much further developed. But the electricity market is
dominated by a few major producers, many of whom are vertically integrated with large suppliers to the retail
market. It is therefore very important for energy suppliers with little or no production capacity to be able to
trust pricing on the wholesale market, otherwise they will not succeed in differentiating themselves from their
competitors in the retail market.
Access to infrastructure, healthy competition and liquid marketplaces are therefore vitally important for
achieving a well-functioning wholesale electricity market. The market monitor measures the extent of
progress in these aspects and identifies any obstacles that stand in the way of further development.

NMa Office of Energy Regulation - 42 / 67 - November 2009
3.2 Infrastructure
3.2.1 Introduction
Cross-border trading in electricity has a positive impact on competition in the Dutch wholesale electricity
market. During peak hours shortages on the Dutch market can exert upward pressure on prices. Imports of
cheap electricity from abroad then have a disciplining effect. Cross-border trading can furthermore lead to
more efficient electricity generation when generation costs vary from country to country (at a particular time).
In this section we look at the utilisation of interconnection capacity (imports and exports) with Belgium,
Germany and Norway respectively.
3.2.2 Interconnection capacity
The Netherlands has cross-border connections with Belgium, Germany and Norway. Tennet makes 1400 MW
of capacity available to the market on the border with Belgium, 2500 MW on the border with Germany and
700 MW on the border with Norway. For these borders, Entso-E reports an NTC (net transfer capacity) of
2300 MW with Belgium, 4000 MW with Germany and 700 MW with Norway. It is not clear why considerably
less capacity is available on the Dutch borders in practice.
We illustrate usage of these interconnections with figures showing the available, obtained and nominated
capacity. The utilisation rate indicator shows how intensively an interconnector is being used. If the
nominations are equal to the available capacity in any given hour, we call this full utilisation.
Cross-border trade is regarded as efficient if relative prices determine the flow direction of electricity and the
available capacity is fully utilised when there are price differences between countries. So if electricity is being
traded at a lower price on a foreign electricity exchange, it would make sense to use the full capacity to import
cheap electricity. The extent to which there is optimal utilisation of interconnection capacity is illustrated in
figures that compare (on hourly basis) the utilisation rate with the price difference on the exchanges.
Electricity prices in the Netherlands, Belgium and Germany follow one another reasonably closely, but they
can also differ quite considerably. The general picture for 2008 is that exchange prices in the Netherlands are
lower than in Belgium but higher than in Germany. The price of electricity in Norway is clearly lower than in
the Netherlands.

NMa Office of Energy Regulation - 43 / 67 - November 2009
Figure 29: APX price compared with prices on foreign electricity exchanges (expressed as ratio
exchange/APX)
In the rest of this section we look at the utilisation of the import and export capacities of Belgium, Germany
and Norway respectively.
Bel gium
Figure 30: Utilisation of import capacity from Belgium (daily average MWh)

NMa Office of Energy Regulation - 44 / 67 - November 2009
Table 13: Utilisation rate and full utilisation (% hours) of import capacity from Belgium
Imports from Belgium 2007 2008
Utilisation rate 55 25
Full utilisation 22 6
Figure 31: Utilisation of export capacity to Belgium (daily average MWh)
Table 14: Utilisation rate and full utilisation (% hours) of export capacity to Belgium
Exports to Belgium 2007 2008
Utilisation rate 22 38
Full utilisation 6 11
The interconnection capacity with Belgium was used less intensively for imports and more intensively for
exports in 2008. In that year electricity was often traded at a lower price on the APX than on Belpex, the
Belgian exchange. As a result, physical congestion on import capacity is now less of a problem (down from
22% to 6% of hours). In fact, export capacity was fully utilised more often than import capacity in 2008.
The trilateral market coupling with Belgium and France ensures optimal day-ahead trading on the borders.
Because the APX, Belpex and Powernext trading systems are connected to each other, the electricity always
flows in the right direction. As long as there is free border capacity, the exchange prices will be identical. APX,
Belpex and Powernext prices will start to diverge as soon as the border capacity forms a restriction to the
exchange of electricity (in other words full utilisation). The figure below, in which the utilisation rate is
compared with the price difference, shows that in those hours nominations are in fact still being made for
annual and monthly capacity in the opposite direction. With the introduction of netting in September 2008,
this capacity is made available for day-ahead trading. From that moment the full border capacity is utilised in
the right direction in the event of price differences between APX and Belpex.

NMa Office of Energy Regulation - 45 / 67 - November 2009
Figure 32: Utilisation rate of NL-BE interconnection in relation to price difference APX-Belpex, 2008
Ger many
Figure 33: Utilisation of import capacity from Germany (daily average MWh)
Table 15: Utilisation rate and full utilisation (% hours) of import capacity from Germany
Imports from Germany 2007 2008
Utilisation rate 80 81
Full utilisation 10 12

NMa Office of Energy Regulation - 46 / 67 - November 2009
Figure 34: Utilisation of export capacity to Germany (daily average MWh)
Table 16: Utilisation rate and full utilisation (% hours) of export capacity to Germany
Exports to Germany 2007 2008
Utilisation rate 9 10
Full utilisation 0 0
Utilisation of the border capacity with Germany is on a similar level to last year. The utilisation rate of both
import and export capacity has remained more or less the same. At 12% of hours, the physical congestion in
import capacity increased slightly in 2008. The introduction of netting on the border with Germany in
September 2008 is reflected in the additional booking of export capacity. Since December 2008 it has also
been possible to obtain intra-day capacity on the border with Germany. This has enabled players to respond
to changing market conditions on the day of execution.
Day-ahead capacity is still being auctioned explicitly on the border with Germany. Market coupling is now
scheduled to start in the spring of 2010. Until then, players will have to purchase the commodity and the
capacity separately. Coordination is complicated by the fact that the auction for day-ahead capacity closes
before the prices on the electricity exchanges are known. As can be seen in the figure below, therefore, the
interconnection capacity with Germany is not being optimally utilised. When APX prices are higher the import
capacity is often not fully utilised, and when APX prices are lower the Netherlands sometimes continues to
import electricity.

NMa Office of Energy Regulation - 47 / 67 - November 2009
Figure 35: Utilisation rate of NL-DE interconnection in relation to price difference APX-EEX, 2008
Nor way
Figure 36: Utilisation of import capacity from Norway (daily average MWh)
Table 17: Utilisation rate and full utilisation (% hours) of import capacity from Norway
Imports from Norway 2007 2008
Utilisation rate 97
Full utilisation 94

NMa Office of Energy Regulation - 48 / 67 - November 2009
Figure 37: Utilisation of export capacity to Norway (daily average MWh)
Table 18: Utilisation rate and full utilisation (% hours) of export capacity to Norway
Export to Norway 2007 2008
Utilisation rate 75
Full utilisation 46
The NorNed cable between the Netherlands and Norway started operation in May 2008. Day-ahead capacity
is auctioned explicitly on this connection. The figures show that the cable is mainly used to import electricity
from Norway. It is clear from the utilisation rate that this connection was necessary. The utilisation rate of the
available import capacity is 97%, and for export capacity 75%. These figures are calculated on the actual
available capacity. Ramping constraints imposed by the Norwegian TSO for reasons of system integrity mean
that the 700 MW of the NorNed cable is not always available. Ramping takes place in two stages (from 0 to
300 MW and from 300 to 700 MW and back), so it is also not possible to reverse the direction of the flow at
once.
Right from the start the intention was to create market coupling between the Netherlands and Norway on the
NorNed cable. On account of certain obstacles, including different gate closure times on the APX and
NordPool, this has not yet happened. Although the available capacity on the NorNed cable is being well used,
the figure below shows that it is by no means being used optimally. In view of the electricity prices at both
ends of the cable, the electricity regularly flows in the opposite direction. This is partly the result of the
ramping constraints mentioned above. With market coupling, however, the capacity should at least no longer
be utilised entirely in the opposite direction.

NMa Office of Energy Regulation - 49 / 67 - November 2009
Figure 38: Utilisation rate of NL-NO interconnection in relation to price difference APX-NordPool Spot, 2008
We measure the efficiency of cross-border trading by plotting the use of the capacity against price differences
between countries. The greater the price difference, the more desirable it is to make optimal use of capacity.
This concerns both the direction of the flow of electricity and the utilisation rate of the capacity. The efficiency
of cross-border trading is measured with the cross border efficiency indicator9 . On the connections between
Belgium and the Netherlands this is close to 1. Market coupling is responsible for this high score. Because
market coupling has not yet been achieved between Germany and the Netherlands, the cross border
efficiency of these border connections is quite a bit lower. The capacity that is made available on the
connection between Norway and the Netherlands is almost always fully utilised, so cross-border trading is
highly efficient.
Table 19: Efficiency of cross-border trading between the Netherlands and neighbouring countries
Cross border efficiency 2007 2008
Belgium – Netherlands 0.97 0.96
Germany – Netherlands 0.53 0.54
Norway – Netherlands 0.94
9 This indicator has a maximum of 1. The efficiënt part of cross-border trade (price difference multiplied by utilised capacity) is divided by
the total (including the unused capacity when there’s a favourable price difference and capacity used in the wrong flow direction).

NMa Office of Energy Regulation - 50 / 67 - November 2009
Market integration
Border capacity ensures that the Dutch electricity market is connected to neighbouring countries. Therefore,
it would be logical to ask the question: to what extent are markets integrated by now?
In figure 29 we saw that prices in the Netherlands, Belgium and Germany follow one another reasonably
closely, but also that they differ quite considerably in some periods. The price level in Norway is usually lower
than those in the other countries. By using a Principal Component Analysis (PCA) we can ascertain which part
of the movements in prices is driven by a common price pattern. We have performed this analysis for the
region comprising the Netherlands, France and Germany. We find that this common price pattern explains
82% of the price movements. If we also include Norway in this analysis, this principal component amounts
to 70%.
Table 20: Common price pattern (PCA) for the Netherlands and neighbouring countries
This analysis can also be performed for several successive periods. This makes it possible to examine the
impact of measures designed to promote market integration, such as the introduction of trilateral market
coupling (21 November 2006) or the start of the NorNed cable (6 May 2008). The following tables show the
results of this analysis.
Table 21: Impact of introduction of trilateral market coupling (NL, FR, DE region) according to PCA
Introduction of market coupling 01/01/2004 to 21/11/2006 21/11/2006 to 11/06/2009
All hours 0.72 0.83
Peak hours 0.78 0.79
Non-peak hours 0.86 0.89
Table 22: Impact of start of NorNed cable (NL, NO, DE, FR region) according to PCA
Commissioning of NorNed 01/01/2006 to 06/05/2008 06/05/2008 to 11/06/2009
All hours 0.62 0.77
Peak hours 0.59 0.76
Non-peak hours 0.68 0.77
The principal component analysis shows that trilateral market coupling and the NorNed cable have both
promoted further market integration. Also the PCA shows that both have done so to a considerable extent.
TLC has added another 11% to the common price pattern and through NorNed an additional 15% of prices
are now driven by a common pattern. The analysis therefore also suggests that NorNed’s contribution to
market integration is even greater than that of trilateral market coupling for the specific regions defined.
Common price pattern NL, FR, DE region NL, NO, DE, FR region
All hours 0.82 0.70
Peak hours 0.79 0.68
Non-peak hours 0.88 0.78

NMa Office of Energy Regulation - 51 / 67 - November 2009
3.2.3 Conclusion
Transmission capacity on the borders is allocated in various ways. On the border with Germany and Norway
day-ahead capacity is auctioned explicitly, and on the border with Belgium (and France) day-ahead capacity is
auctioned implicitly on the electricity exchange. Depending on the auctioning method, cross-border trading is
efficient to a more or lesser extent. Market coupling ensures optimal utilisation of day-ahead capacity. As a
result of the introduction of netting in 2008 more capacity is now available for day-ahead, which enables the
connections with Belgium to be even better utilised. Optimal utilisation has clearly not yet been achieved on
the border connections with Germany and Norway. When prices differ significantly the capacity is not fully
utilised and electricity regularly flows in the wrong direction. Market coupling with Germany and Norway will
represent a major step forward. Furthermore, it is still surprising that Tennet makes about 4600 MW of
capacity available in total, while Entso-E puts the figure at 7000 MW for the Dutch border connections.
3.3 Competition
3.3.1 Introduction
The demand for electricity changes from hour to hour and is relatively price-inelastic. In terms of the supply
of electricity, the ascending merit order (industry cost curve) is a key feature. This means that the marginal
costs of electricity production, and, in a competitive market, the price, will be higher when demand is higher.
The extent of the price increase is determined by the shape of the merit order, but the market structure could
also be a relevant factor. Concentration on the supply side can make individual producers pivotal during peak
hours. This results in additional upward pressure on prices, which has an adverse effect on market outcomes:
the further the price rises above the marginal production cost, the less efficient the market outcomes are.
In this section we take a look at the market structure followed by the market outcomes. In our discussion of
the market structure we examine concentration on the supply side (pivotal supplier), transparency of the
market and the cost structure of the sector. With regard to market outcomes we calculate the markup (the
difference between the price and the marginal system costs) and analyse the relationship between markup
and pivotality (market structure).
3.3.2 Market structure
Concent r at ion in t he suppl y
In our assessment of the market structure, the key issue is whether certain players are able to influence
market outcomes. The opportunity to exercise market power is determined by the degree to which these
players are pivotal in meeting market demand. Indicators that measure this pivotality are the Pivotal Supplier
Index (PSI) and the Residual Supply Index (RSI).
The PSI shows for what percentage of the hours some or all of an electricity producer’s capacity is needed in
order to meet the market demand given the joint capacity of the other producers. In 2008 there were one or
more pivotal suppliers during 79% of peak hours. This percentage is once again higher than the previous

NMa Office of Energy Regulation - 52 / 67 - November 2009
year. The increase in export demand is to a large extent responsible for this. As prices in the Netherlands are
often lower, the Netherlands has been exporting more to Belgium and France. As a result the shortage in the
market has increased, as has the pivotality of certain players. The number of pivotal players has remained
more or less the same as in 2007.
Figure 39: Number of pivotal players, peak hours (daily average)
The RSI indicates the degree to which market parties are pivotal. If the RSI is less than 1, the market player
concerned is pivotal. The further the RSI drops below 1, the more capacity of this player is needed to satisfy
demand. This therefore increases the scope for this player to influence market outcomes. By taking the
lowest of the RSI values for each player, we obtain the RSI for the sector. In 2008 the RSI averaged 0.9 during
peak hours. This RSI is lower than in previous years. The extent to which one or more players are pivotal
during peak hours has therefore increased.
Figure 40: RSI at sector level, peak hours (frequency)

NMa Office of Energy Regulation - 53 / 67 - November 2009
Table 23: Market structure PSI (% hours) and RSI sector level, peak hours
2006 2007 2008
Pivotal Supplier Index 62% 72% 79%
Residual Supply Index 0.98 0.94 0.90
Tr anspar ency in t he mar ket
A lack of transparency in the market can cause a concentrated market structure to persist. In the liquidity
survey we asked traders for their views on the information provision on demand, generation, transmission
and marketplaces.
The liquidity survey shows that traders were more satisfied with the provision of information on transmission
(both domestic and cross-border) in 2008. According to the traders, transparency is improving on all aspects
of transmission (see table 24). Traders are most dissatisfied with transparency in respect of generation. They
find that there is too little information on the available production capacity (ex-ante) and on the actual
production figures (ex-post). Traders have become more dissatisfied with transparency on the OTC
marketplace. They report that there is a shortage of price information and that it is not clear how many
parties are in the market. Transparency therefore needs to be increased in the areas of generation and OTC
trading in particular.
Table 24: Views of traders on degree of transparency in electricity market
Much too high Too high Good Too low Much too lowMuch too high Too high Good Too low Much too low
load forecast
realized load
ex-ante information of availability
ex-post information on actual production
available national transmissioncapacity
foreseen maintenance
calculation method to determine cross border capacity
available cross border capacity
specific determination of executed day ahead auction
capacity auction results
nominated cross border capacity
actual used cross border capacity
historical price and volume data
number of participants involved in trading
methodology and process for price calculation
traded volumes
realised prices
number of part icipants involved in trading
historical price and volume data
number of part icipants involved in trading
methodology and process for price calculation
Dem
an
dG
en
er-
ati
on
Nati
on
al
2007 gemiddelde
2008 gemiddelde
67% interval
2007 gemiddelde
2008 gemiddelde
67% interval
Cro
ss b
ord
er
Sp
ot
mark
et
OT
CE
nd
ex
Tra
nsm
issio
nT
rad
e

NMa Office of Energy Regulation - 54 / 67 - November 2009
Cost st r uct ur e of t he indust r y
In a competitive market the price level of electricity is determined to a significant extent by the (marginal)
cost of generation. The cost per MW produced depends on the efficiency of the power plant and on fuel
prices. In 2008 the prices of gas, coal and CO2 emission allowances (start of new period) were higher than in
previous years.
Figure 41: Fuel prices of gas, coal, CO2
This increase in production costs means that the cost curve for the sector as a whole is on a higher level. The
merit order for the Netherlands also indicates this. In the merit order the Dutch generation park is ranked
according to the level of marginal production costs. Due to the inelastic demand for electricity, the merit
order gives an indication of the competitive price level. Also, individual producers become more pivotal the
closer the demand gets to the capacity limits.
Figure 42: Merit order of sector (average per annum)

NMa Office of Energy Regulation - 55 / 67 - November 2009
3.3.3 Market outcomes
Averaged over all hours, the market outcomes in 2008 are characterised by higher electricity prices and
higher profits than in 2007, with prices for gas, coal and CO2 emission allowance also at a higher level.
The average APX price during peak hours increased from EUR 58/MWh in 2007 to EUR 89/MWh in 2008.
The following figure shows the development of APX day-ahead prices and prices for OTC month-ahead and
quarter-ahead products.
Figure 43: Electricity prices APX and OTC, peak hours
One important indicator of competition is the markup. This measures the difference between the APX price
and the marginal system costs, expressed as a percentage of the marginal system costs. In 2008 the average
markup was -9% during peak hours. Compared with 2007, the average markup is lower. The following
frequency diagram (figure 44) also shows that the variation in markups has decreased.
The interpretation of negative markups must be sought in dynamic restrictions which prevent the dispatch of
power plants to be fully coordinated with the development of hourly APX prices. Also the market conditions
on the day itself, which can be read from the imbalance prices, can explain a dispatch of power plants which,
in relation to APX prices, seems less logical. A calculation of the markup with imbalance prices gives a
positive markup of almost 2% on average during peak hours in 2008.

NMa Office of Energy Regulation - 56 / 67 - November 2009
Conduct of electricity producers
An important indication of market outcomes is the markup. This gives the difference between the electricity
price and the marginal costs of the most expensive power plant. If this power plant is also the marginal
power plant under optimal dispatch, then the markup analysis is sufficient. Strategic behaviour to drive up
prices can also present itself by an inefficient dispatch of power plants. With inefficient dispatch, the marginal
power plant moves up one or more positions in the merit order, so the marginal system costs increase. This
results in a higher electricity price which, in turn, increases the margins on the inframarginal power plants.
The dispatch inefficiency indicator indicates how much more expensive the production of a unit of electricity
by the actual marginal power plant is compared with the marginal power plant in an optimal dispatch
scenario.
Observed inefficiencies on the individual portfolio level may be ascribed to missing information on factors
that determine the optimal dispatch of power plants. After all, we may assume that players will use their own
portfolio as efficiently as possible. If a player wants to withhold capacity in order to influence market
outcomes, then that will be capacity at the margin, that is to say, the most expensive capacity that, given the
demand, could be operating. If, in reaction to this, another player offers a more expensive plant, then this will
lead to higher system marginal costs at the sector level. Insofar as strategic behaviour is manifested in
dispatch inefficiency, it is therefore at the sector level.
Table 25: Dispatch inefficiency at sector level and at portfolio level, peak hours in 2008
95% confidence interval Average dispatch
inefficiency (%)
Standard error
T test1
Sector 34 0.6 33.2 35.5 29
Producer 1 10 0.2 9.9 10.7 39
Producer 2 11 0.4 10.4 11.9 34
Producer 3 13 0.4 12.6 14.3 29
Producer 4 2 0.4 1.3 3.1 43
The table above compares the dispatch inefficiency of the sector with the dispatch inefficiency within the
individual portfolios. This comparison reveals that the dispatch inefficiency of the sector is significantly
higher than that of the individual players. This may be a sign of strategic behaviour in the dispatch of power
plants. Higher dispatch inefficiency at the sector level, however, can also be caused by market imperfections
in the marketplaces. Contractual obligations in relation to purchasing fuel or selling electricity can result in a
player dispatching relatively expensive power plants while other players are not using cheaper ones.

NMa Office of Energy Regulation - 57 / 67 - November 2009
Figure 44: Markup, peak hours (frequency)
The level of the markup is closely related to the market structure. The following figure shows that high
markups occur almost exclusively when the RSI is less than 1.
Figure 45: Relationship between market structure (RSI sector) and market outcomes (markup), peak hours
In an econometric analysis we related the markup to several explanatory variables. We use this analysis to
test the causality and its direction. In addition to the RSI a scarcity index has also been included. This enables
us to establish whether high markups are caused by shortages in the market or whether pivotality has an
impact in itself. This econometric analysis (see box) confirms that pivotality is a relevant factor for the level of
the markup.

NMa Office of Energy Regulation - 58 / 67 - November 2009
Influence of market structure on market outcomes
In the regression analysis, the markup (variable to be explained) is related to the RSI at sector level, the scarcity
index and the gas, coal and CO2 prices (explanatory variables).
Table 26: Results of regression analysis of markup, 2006-2008
Coef. Std. err. t P>|t| [95% conf. interval]
-0.386 0.007 -56.4 0 -0.399 -0.372
0.855 0.001 67.41 0 0.083 0.088
-0.012 0.001 -24.17 0 -0.013 -0.011
0.008 0.001 6.43 0 0.006 0.011
2 0.008 0.000 19.37 0 0.007 0.009
_cons -0.153 0.016 -9.67 0 -0.184 -0.122
There is a statistically significant relation between the markup on the one hand and scarcity and the pivotality
of players on the other. The greater the scarcity on the market, that is to say, the less unutilised capacity there
is, the higher the markup. Despite the close correlation between scarcity and pivotality, the pivotality of
players also evidently has its own impact the markup. The greater the pivotality, that is to say, the lower the
RSI, the higher the markup. Further analysis shows us that the impact of RSI on the markup is roughly the
same as that of scarcity.
Despite the average negative markup for the marginal power plant, the profitability of electricity generation is
positive. Power plants lower in the merit order generate more than enough revenues to cover the fixed cost of
new power plants. The annual profit per MW for all (major) players is double or more than double the annual
costs of a new power plant. The investment plans in new production capacity confirm this picture. Planned
new power plants cover more than half of the current installed capacity.10
Figure 46: Coverage ratio (ratio of profit to investment costs)
10 According to the Tennet Security of Supply Monitoring Report for 2009, 18.5 GW of new large-scale thermal capacity by 2016, with 2,3
GW being preserved and shut down (16.2 GW net). The size of the current production system is 22 GW.

NMa Office of Energy Regulation - 59 / 67 - November 2009
Table 27: Market outcome indicators markup (peak hours) and coverage ratio (annual average)11
2006 2007 2008
Markup 0% 7% -9%
Coverage ratio 2.8 2.0 2.2
3.3.4 Conclusion
The market structure indicators PSI and RSI indicate a deterioration in the structure of the wholesale
electricity market. Individual producers are more frequently pivotal, and the degree of pivotality has
increased. To a large extent, this development is the result of the increase in export demand. In addition, the
costs of all fuels (gas, coal, CO2 emissions) have risen so the industry cost curve (merit order) is at a higher
level. With higher demand and higher costs, electricity prices in 2008 are above those of the previous year. In
contrast, markups have dropped. This is partly the result of higher marginal system costs (or to put it
differently: a steeper merit order) which also explains the positive coverage ratio. At the same time, the
correlation between markup and pivotality has not disappeared. In 2008 as well, it is evident that the more
pivotal a producer is, the higher the markup.
3.4 Marketplaces
3.4.1 Introduction
This section analyses the development of liquidity on the various marketplaces. In a liquid market standard
transactions can generally be carried out quickly and a high volume can be traded per transaction without
having an appreciable effect on the price. Liquidity minimises the transaction costs and inspires confidence
among market parties. This in turn draws more parties to the market, improving the liquidity further.
Growing trading volumes and decreasing price sensitivity to additional demand are signs of improved
liquidity on the APX electricity exchange. Less volatile prices and a lower bid/offer spread are indications of
better liquidity on the OTC market. In this section we will discuss trading on the APX spot market followed by
trading in OTC forward contracts.
11 The average of the degree of coverage per player. The degree of coverage is the relationship between the annual profit per MW and the
annual costs per MW of an investment in a new power plant. This is based on the following assumptions: investment amount of EUR 1
million, discount rate of 7% and investment term 25 years.

NMa Office of Energy Regulation - 60 / 67 - November 2009
3.4.2 Trading on the APX spot market
APX is a marketplace for trading in day-ahead contracts for every hour of the following day. In addition to day-
ahead trading, intraday contracts can also be traded on the APX. This is still done to a limited extent.
The total traded volume on the day-ahead market in 2008 increased by more than 4 TWh to 24.8 TWh on an
annual basis.
Figure 47: Traded volume on APX (annual totals)
Table 28: Traded volume on APX (annual totals)
2006 2007 2008
Traded volume (TWh) 19.2 20.7 24.8
On the day-ahead exchanges in Germany (EEX) and France (Powernext) the volumes also increased further in
2008. In view of the size of the national electricity market, APX volumes are relatively high compared with
France, but volume development lags behind that of Germany.

NMa Office of Energy Regulation - 61 / 67 - November 2009
Figure 48: Traded volumes on APX, EEX and Powernext (monthly totals)
The price sensitivity indicator illustrates the extent to which additional demand results in price increases.
Specifically this concerns the supply that is in the market but has not been drawn on. Simulations of
additional demand bids on the APX day-ahead market deliver the following outcomes. Price sensitivity to
additional demand decreased further in 2008. 50 MW additional demand would on average result in a price
increase of 0.5% (previously 0.9%), and 500 MW additional demand would result in a price increase of 6.1%
(previously 14.3%). This indicates that liquidity on the APX improved further in 2008.
Figure 49: Price sensitivity on APX with 50 MW additional demand

NMa Office of Energy Regulation - 62 / 67 - November 2009
Figure 50: Price sensitivity on APX with 500 MW additional demand
Table 29: Price sensitivity (% increase) on APX with 50 MW and 500 MW additional demand
2006 2007 2008
50 MW additional demand 1.4 0.9 0.5
500 MW additional demand 20.9 14.3 6.1
Intraday trading on the APX is still limited. If necessary, market participants will often adjust the balance
position on the day themselves with their own power plants or bilateral contracts. Tennet settles the
remaining imbalance against imbalance prices. This price is arrived at through a bid ladder whereby as much
electricity is called off as necessary. Imbalance prices are generally lower on average than APX day-ahead
prices but have more and larger extremes at times of shortage in the market. The following figure shows that
in these instances imbalance prices in 2008 compared with previous years are clearly higher than APX prices.

NMa Office of Energy Regulation - 63 / 67 - November 2009
Figure 51: Electricity prices APX day-ahead and Tennet imbalance, peak hours
3.4.3 Trading in OTC forward contracts
Standardised forward contracts are traded on the ENDEX futures market or on the OTC market via brokers.
ENDEX vol umes
After a drop in 2007, the total traded volume on ENDEX increased again in 2008. Most of this increase was
on the futures exchange where the volume increased by almost 50% compared with 2007.
Figure 52: Traded and cleared volumes on ENDEX (annual totals)

NMa Office of Energy Regulation - 64 / 67 - November 2009
Table 30: Traded and cleared volumes on ENDEX (annual totals)
2006 2007 2008
Traded volume (TWh) 32.1 28.0 41.2
Cleared volume (TWh) 99.2 73.0 77.5
Vol at i l i t y and spr ead on OTC mar ket
Relevant indicators of liquidity on the OTC market are volatility in prices and the spread between bid and
offer prices. Volatility is a measure of expressing price fluctuations. Generally speaking, the greater the
volatility, the greater the uncertainty surrounding the price. The bid/offer spread provides an indication of the
level of the transaction costs. The lower the bid/offer spread, the easier it is to arrive at a transaction.
Figure 53: Price volatility on OTC monthly contracts, peak hours
Table 31: Price volatility on OTC monthly, quarterly, annual contracts, (annual average %)
2006 2007 2008
Month ahead (peak) 2.4 3.3 2.0
Quarter ahead (peak) 3.1 1.9 1.6
Year ahead (base) 0.8 0.7 1.1

NMa Office of Energy Regulation - 65 / 67 - November 2009
Figure 54: Bid/offer spread on OTC monthly contracts, peak hours
Table 32: Bid-offer spread on OTC monthly, quarterly, annual contracts, (% annual average)
2006 2007 2008
Month ahead (peak) 3.5 2.6 2.0
Quarter ahead (peak) 3.4 2.1 2.4
Year ahead (base) 0.9 0.8 0.8
It is difficult to obtain a clear picture from the development of the volatility and the bid-offer spread over the
period 2006-2008. With regard to volatility there is evidence of improvement year on year in quarterly
contracts only, while in terms of the bid-offer spread only monthly contracts are improving. The volatility of
the bid-offer spread is deteriorating once more for other contracts. However, these indicators do indicate a
slight improvement in the liquidity of the Dutch OTC market across the board in 2008.

NMa Office of Energy Regulation - 66 / 67 - November 2009
A comparison with the OTC markets in Germany and France reveals that volatility is comparable in these
markets but that there is a significantly higher bid/offer spread in the Netherlands. Although this has been
decreasing in recent years, transaction costs on the Dutch OTC market are clearly higher than in
neighbouring countries.
Figure 55: International comparison of price volatility OTC monthly contracts, peak hours
Figure 56: International comparison of bid/offer spread OTC monthly contracts, peak hours

NMa Office of Energy Regulation - 67 / 67 - November 2009
3.4.4 Conclusion
Liquidity on the APX electricity exchange increased in 2008. The volume of day-ahead trading increased by
more than 4 TWh to 25 TWh. The diminishing price sensitivity to additional demand also indicates an
improvement in liquidity. 500 MW additional demand should result in a price increase of 6.1% (previously
14.3%). On the forward market the improvement in liquidity is less evident. After last year’s downswing,
ENDEX volumes have increased again, and the share of the futures exchange has also increased. Total
volumes and the futures share have been higher in previous years. The picture on the broker market differs
depending on the term of OTC contracts. On the whole, there seems to be a slight improvement. The
bid/offer spread remains high compared with other countries, however.
3.5 Final remarks
Impediments to competition in the wholesale electricity market mainly occur in the utilisation of
infrastructure and the concentrated market structure. Because the existing infrastructure is not being
optimally utilised, the Dutch wholesale market remains partly shielded from competitive pressure from
abroad. Partly on account of increased export demand from Belgium and France, electricity producers in the
Netherlands were more often pivotal in 2008. The extent to which these producers were pivotal also
increased further. This is an adverse development for energy suppliers who do not have their own production
capacity and who are dependent on the wholesale market for purchasing electricity. Measures aimed at better
utilisation of the transmission capacity on the borders intensify the competitive pressure on the Dutch
wholesale market. Market coupling with Germany and Norway, scheduled for 2010, means that the available
capacity will be utilised better. Coordinating the network investments at a regional level could also make
more physical capacity available. The announced investments in new power plants should also reduce the
pivotality of individual producers. But the Dutch high-voltage network is not designed for large-scale
expansion of the production system. To coincide with the necessary network improvements and extensions,
Tennet must connect new capacity as soon as possible using congestion management.
Related Documents