Money Management for a Foreign Exchange Trading Strategy Using a Fuzzy Inference System Amaury Hernandez-Aguila, Mario Garcia-Valdez and Oscar Castillo Abstract Trading a financial market involves the use of several tools that serve different purposes necessary to understand the behaviour of that particular market. One of the tools a trader must use is a method that determines the lot size of a trade, i.e., how many units are going to be bought or sold for a trade. Frequently, traders will use their experience and subjective deduction capabilities to determine the lot size, or simple mathematical formulas based on how much profit or loss they have realized during a particular period of time. This work proposes using a fuzzy inference system to determine the lot size, which uses input variables that any trading strategy should have access to (which means that any existing strategy can implement the proposed method). The experiments in this work compare basic trading strategies based on simple moving averages, one with a fixed lot size for every trade performed, and another one which uses the fuzzy inference system to establish a dynamic lot size. The results show that the dynamic lot size using the fuzzy inference system can help a trading strategy perform better. Keywords Fuzzy inference systems Trading strategy Money management 1 Introduction A financial market (for example, a stock market or a foreign exchange market) depicts the price movements for a particular item being traded. This means that if the Google stock market shows that a share is being sold for $50 USD, one has to pay said quantity in order to trade that market. The price for this market will change A. Hernandez-Aguila (&) M. Garcia-Valdez O. Castillo Tijuana Institute of Technology, Tijuana, BC, Mexico e-mail: [email protected] M. Garcia-Valdez e-mail: [email protected] O. Castillo e-mail: [email protected] © Springer International Publishing AG 2018 O. Castillo et al. (eds.), Fuzzy Logic Augmentation of Neural and Optimization Algorithms: Theoretical Aspects and Real Applications, Studies in Computational Intelligence 749, https://doi.org/10.1007/978-3-319-71008-2_21 275

Welcome message from author
This document is posted to help you gain knowledge. Please leave a comment to let me know what you think about it! Share it to your friends and learn new things together.
Transcript
Money Management for a ForeignExchange Trading Strategy Using a FuzzyInference System
Amaury Hernandez-Aguila, Mario Garcia-Valdez and Oscar Castillo
Abstract Trading a financial market involves the use of several tools that servedifferent purposes necessary to understand the behaviour of that particular market.One of the tools a trader must use is a method that determines the lot size of a trade,i.e., how many units are going to be bought or sold for a trade. Frequently, traderswill use their experience and subjective deduction capabilities to determine the lotsize, or simple mathematical formulas based on how much profit or loss they haverealized during a particular period of time. This work proposes using a fuzzyinference system to determine the lot size, which uses input variables that anytrading strategy should have access to (which means that any existing strategy canimplement the proposed method). The experiments in this work compare basictrading strategies based on simple moving averages, one with a fixed lot size forevery trade performed, and another one which uses the fuzzy inference system toestablish a dynamic lot size. The results show that the dynamic lot size using thefuzzy inference system can help a trading strategy perform better.
Keywords Fuzzy inference systems � Trading strategy � Money management
1 Introduction
A financial market (for example, a stock market or a foreign exchange market)depicts the price movements for a particular item being traded. This means that ifthe Google stock market shows that a share is being sold for $50 USD, one has topay said quantity in order to trade that market. The price for this market will change
A. Hernandez-Aguila (&) � M. Garcia-Valdez � O. CastilloTijuana Institute of Technology, Tijuana, BC, Mexicoe-mail: [email protected]
M. Garcia-Valdeze-mail: [email protected]
O. Castilloe-mail: [email protected]
© Springer International Publishing AG 2018O. Castillo et al. (eds.), Fuzzy Logic Augmentation of Neural and OptimizationAlgorithms: Theoretical Aspects and Real Applications, Studies inComputational Intelligence 749, https://doi.org/10.1007/978-3-319-71008-2_21
275
over time, and the price could increase or decrease. If the price increases, this meansthat a trader will have a profit equal to the current price minus $50 USD (the price atwhich the share was bought). An analogy to this process is easy to create: if onebuys a car for $2000 USD, and sells it for $2500 USD later on, a profit of $500USD was made by this transaction. But as the market price can increase, it can alsodecrease. To understand how the selling process occurs, one can imagine that a lotof cars has already been acquired. If a car is sold for $2500 USD and one buysanother car for $2000 USD later on, a profit of $500 USD was still made, eventhough the initial operation was selling a car, instead of buying one.
As one can make a profit by trading a financial market, one can also end in aloss. To explain this outcome, one can continue with the previous analogy: ifsomeone buys a car for $2000 USD, and after some time this person notices thatthis particular car model keeps getting cheaper, the trader can decide to sell the carfor $1500 USD to cut the losses (the person decides to sell the car before the marketprice decreases even more). This transaction would result in a loss of $500 USD. Inthe case of a loss in a selling transaction, one can imagine that someone has alreadya lot of cars and decides to sell one for $2000 USD. If the price has been gettinghigher over time, and this person decides that it is time to restock the car lot with thecar model that was sold before, but the current market price is $2500 USD,restocking that car will result in a loss of $500 USD.
Another variable that can be introduced to this buy/sell process is the lot size,e.g. how many cars are going to be bought/sold per transaction (following thepreviously mentioned analogy). Taking this variable into consideration, a trader candecide to buy a small lot of cars if there is a strong possibility of being wrong withthe decision of buying. Similarly, if the trader considers that there is a strongpossibility of being right with the decision of buying in the market, or if there issuspicion that the price will greatly rise, then the trader can decide to buy a biggerlot of cars. But how can a trader determine the lot size to buy or sell? Surprisingly,there are still many sources that point out that in order to determine this lot size, onecan use intuition or simple mathematical formulas. One of the most popularmethods to determine this lot size is to use a fixed percentage of the trading capitalper trade [1]. This way, a trader will risk smaller and smaller amounts if the tradingaccount has suffered losses in the past trades, and will risk bigger amounts if thetrading account has made profits. In other words, the trader should risk more ifprofits have been made, and risk less otherwise. Another way of managing this riskwould be to diversify the trades over several markets [2]. The concept that describesthe aforementioned process is called money management.
“Put two rookie traders in front of the screen, provide them with your besthigh-probability set-up, and for good measure, have each one take the opposite sideof the trade. More than likely, both will wind up losing money. However, if youtake two pros and have them trade in the opposite direction of each other, quitefrequently both traders will wind up making money—despite the seeming contra-diction of the premise. What’s the difference? What is the most important factorseparating the seasoned traders from the amateurs? The answer is money man-agement.” [3] The reader can find many literature works which state similar ideas as
276 A. Hernandez-Aguila et al.
the one expressed before, such as [1, 4, 5]. The basic idea is that if the trader is notsure about the trend that the market will take, a smaller lot size should be traded,and if there is a strong possibility of a trend to follow, the lot size should be bigger.If this principle is followed, a trader could end up making profits even if most of thetrades were lost. For example, a trader could lose 9 trades where 10 units were lostin each trade, but the trader determined that for a particular trade, a bigger lot had tobe traded. A profit of 100 units for a single good trade could result in a profit for thetotal 10 trades.
As can be noted in the previous paragraph, the determination of the lot size canbe expressed in a fuzzy manner: “if the possibility of a trend is high,” “the lot sizewill be small,” “the trading account has made a big profit,” etc. This is why thepresent work proposes the use of a fuzzy inference system as the foundation for amoney management strategy. This system will receive input variables that can beobtained from any trading strategy, and will output the lot size that should be tradedunder those circumstances. Section 4 presents the details underlying this method. Inorder to test the proposed method, an experiment was carried out and its design ispresented in Sect. 5, while the results of this experiment are presented in Sect. 6. Ifthe reader is unfamiliar with the concepts involved in the trading strategy used forthe experiments, a series of preliminary concepts are presented in Sect. 2, and somerelated works are presented in Sect. 3. Finally, Sects. 7 and 8 present some con-clusions and ideas for future works, respectively.
2 Preliminaries
In the following Subsections, some basic concepts are discussed. These conceptsare related to the proposed method presented in Sect. 4.
2.1 Trading Strategy
A trading strategy is a set of tools used by a trader in order to determine when aparticular type of trade should be executed. The type of a trade can be a buy or sellnow order (which is executed immediately), or an entry order (which will beexecuted after the market price reaches a determined threshold). These orders caninclude other operations, like a stop loss or take profit orders (the trade will stopafter a specific amount of units has been gained or lost), and trailing stops (a stoploss which gets constantly updated depending on the price movements). A tradingstrategy also incorporates a money management strategy, which determines the sizeof the lot to be traded.
The presented method in this work focuses on the money management area, i.e.determining how many units are going to be traded for each executed order.
Money Management for a Foreign … 277
2.2 Simple Moving Average
A moving average (MA) is a common operation applied to time series. In general,an MA uses a certain number of past data points in a time series to obtain anaverage for the current data point. For example, for a time series TS = [1, 4, 6–9],an MA which takes the past 3 data points as an average would calculate thefollowing points: 2, 3, 4, 5. The first average, 2, would represent the average of 1, 2,and 3. The second average, 3, would represent the average of 2, 3, and 4, and so on.If these averages are unweighted, the operation is known as a simple movingaverage (SMA), and is described by (1)
SMA ¼ pM þ pM�1 þ � � � þ pM�ðn�1Þn
¼ 1n
Xn�1
i¼0
pM�i
ð1Þ
The use of MAs in trading strategies is a common practice. The purpose ofapplying them to a financial market time series is to obtain a smoother curve whichrepresents the general direction of the market (uptrend, downtrend or stagnation)[4]. The most common way of using MAs to determine a trade opportunity is to usetwo MAs, one using a small number of data points for the average (often called ashort MA), and another one using a bigger number (often called a long MA) [4].
2.3 Volatility
The volatility of a market is obtained by calculating the average number of unitsthat a period is presenting. For example, if one is observing the chart of a financialmarket with a 15-min timeframe (which means that each data point represents theresulting movements in the last 15 min), and every data point presents movementsof 50 units, then the market has a volatility of 50 units. Similar to MAs, thevolatility can be obtained taking into consideration only the past n periods or datapoints.
3 Related Work
According to some sources, most traders end losing money by trading on financialmarkets. A study that discusses more about this subject can be found in the work byOdean and Barber [10]. Nevertheless, this study also states that the bigger com-panies do make money on the long run by trading on financial markets.A hypothesis which explains this phenomenon is that there are many inexperienced
278 A. Hernandez-Aguila et al.
individuals trading on the market, traders that are not using the correct tools and thecorrect trading process in order to make a profit. Furthermore, the psychology in thetrading process can also influence the trader’s decisions, and often makes the traderlose money [4]. Automatized trading strategies can help with the psychologicalfactor, such as the trading strategy proposed by Harris [11]. On the other hand, inorder to have a correct trading strategy, one has to have several tools to understanddifferent aspects of the trading process. For example, a one has to use an effectivemoney management strategy [12], and understand the profitability and risk one istaking while trading [11].
The present work uses a trading strategy based on moving averages (simplemoving averages, to be specific). Several works which use MAs exist, and theyhave been shown to work on specific markets before. As examples of such works,one can read the work by Pätäri and Vilska [13], who applied a trading strategy topredict the Finnish market. Similarly, Nguyen et al. [14], and Hung and Zhaojun,have applied similar techniques to forecast the French and the Vietnamesse stockmarkets, respectively. More complex methods exist involving SMAs, for example,the work by Wang et al. [15] use genetic algorithms to optimize the trading rulesbased on SMAs.
To mention a few other techniques to forecast the market, one can use neuralnetworks, which has grown to be a popular technique. As an example, one can readthe work by Chan and Teong [8]. Fuzzy systems have been used to forecastfinancial markets too, and an example is the work by Leu and Chiu [16]. Hybridsystems usually perform better than applying a single technique, as in the works byYu and Wang [17], and Wei et al. [3].
Regarding techniques to determine the lot size to be traded, i.e. money man-agement, the authors of the present work could not find methods involving com-putational intelligence techniques. Most of the techniques involve using theintuition of the trader, or simple mathematical formulas, as is explained in the workby Hakim [18].
4 Proposed Method
This work proposes a method to determine the amount of units, or lot size, that atrader or trading strategy should use for a particular trade, given certain inputvariables. In order to calculate an inference involving these input variables, a fuzzyinference system is proposed. The input variables should be obtainable in anytrading strategy. The proposed method was purposely designed like this in order tobe portable to any already existing trading strategy.
This Section will explain first the input variables used, and the fuzzy inferencesystem will follow.
Money Management for a Foreign … 279
4.1 Percentage of Change
The percentage of change is a simple calculation which involves the average profit atrading strategy has made in the past n trades, relative to the last m averages. Forexample, if the last 4 average profits are 45, 50, 60 and 50, this last average profit(50) represents *83% of the maximum obtained in the last 3 average profits (50,60, and 50). In this case, n = 4 and m = 3. With this method, a good representationof how well a method is performing during a period of time can be obtained.Furthermore, the method obtains an output which ranges from −1 to 1, which isuseful to quickly understand how well the trading strategy is performing.
4.2 Probability of Trend
Any trading strategy should give as an output whether a trade should be on a longposition (buying) or on a short position (selling). But there should also exist thepossibility to determine how strong that signal is. This strength will be called“probability of trend” in the present work, and should range from 0 to 1. Forexample, in the case of using MAs to determine the direction of the market, one canuse the ratio between the strength of the long-period MA and the short-period MAto obtain a value between 0 and 1.
4.3 Volatility
As explained in Sect. 2.3, the volatility of a market represents the average amountof units of the movements in the past n periods. Similar to how the proposedmethod calculates the percentage of change (Sect. 4.1), the volatility is calculated asa quantity relative to the last m averages. For example, if the last 5 volatilities in themarket, taking into consideration an arbitrary value for n, are 30, 40, 60 and 45, thelast value (45) will be divided by the maximum value in the last m averages. Forexample, if m = 3, then the volatility for the last period will be equal to45/60 = 0.75.
4.4 Fuzzy Inference System
A Mamdani fuzzy inference system was used in order to calculate a lot size. Threeinput variables were used: percentage of change, probability of trend, and volatility.The domains of these input variables and the membership functions are describedbelow.
280 A. Hernandez-Aguila et al.
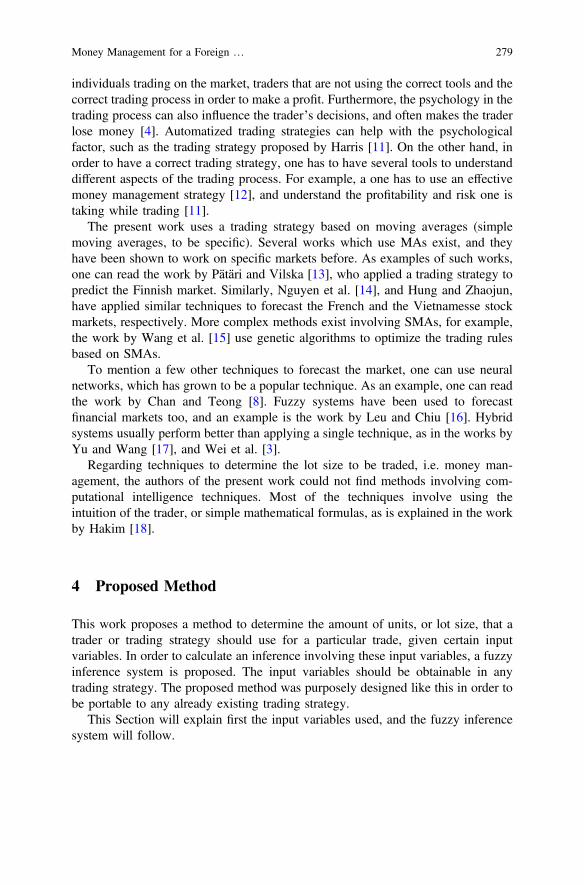
For the percentage of change, the domain of the input value can range from -1 to1. This linguistic variable is represented by four membership functions: high loss,low loss, low profit, and high profit. All the membership functions are Gaussianmembership functions. The means for each of the membership functions are asfollow: −1.0, −0.5, 0.5, and 1.0, respectively. High loss and high profit, both have astandard deviation of 0.33. In the case of low loss and low profit, both have astandard deviation of 0.15. A graphical representation of this input variable isshown in Fig. 1.
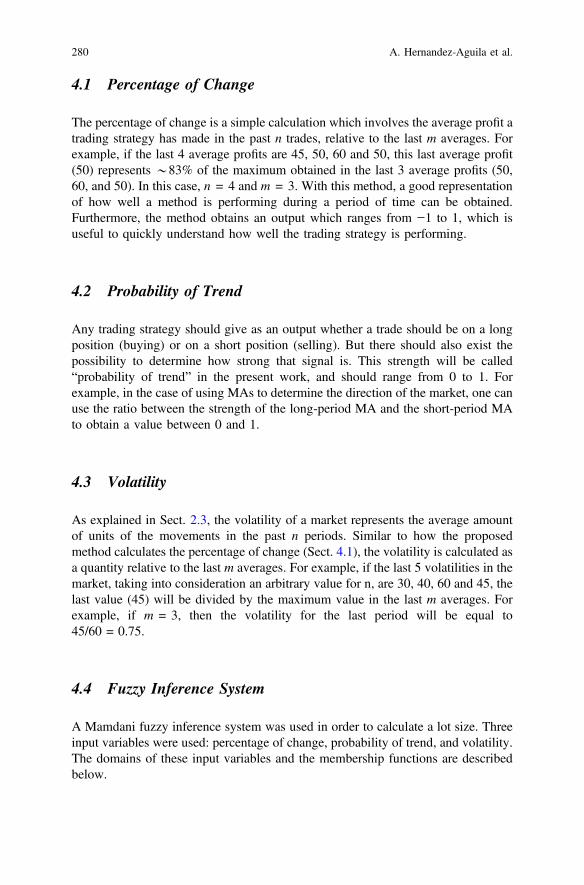
For the next input variables, and the single output variable, each of them havethe same graphical representation as is shown in Fig. 2.
The probability of change has the following three adjectives: low probability,medium probability, and high probability. In the case of volatility, the three fol-lowing adjectives: low volatility, medium volatility, and high volatility. Finally, forthe single output variable, the adjectives are: low lot size, medium lot size, and highlot size. For each of these variables, the means of the adjectives, in order, are 0.0,0.5, and 1.0, while the standard deviations are all equal to 0.15. The defuzzificationmethod to obtain the output is center of area.
Fig. 1 Graphical representation of the membership functions for the percentage of change
Fig. 2 Graphical representation of the membership functions for the probability of trend,volatility, and lot size
Money Management for a Foreign … 281
The fuzzy rules for the fuzzy inference system are as follows:
• if percentage-of-change is high-loss, then lot-size is low-lot-size• if percentage-of-change is low-loss, then lot-size is medium-lot-size• if percentage-of-change is low-profit, then lot-size is medium-lot-size• if percentage-of-change is high-profit, then lot-size is high-lot-size• if probability-of-trend is low-probability, then lot-size is low-lot-size• if probability-of-trend is medium-probability, then lot-size is medium-lot-size• if probability-of-trend is high-probability, then lot-size is high-lot-size• if volatility is low-volatility, then lot-size is low-lot-size• if volatility is medium-volatility, then lot-size is medium-lot-size• if volatility is high-volatility, then lot-size is high-lot-size
5 Experiments
An implementation of the proposed method was done in the programming languageClojure. Data was gathered from a ForEx broker called Oanda, which provides afree-to-access API. The financial market chosen for the experiment was the EUR vsUSD, with a timeframe of 15 min per session. The data was obtained from January1st 2016 to January 1st 2017.
In order to obtain the percentage of change, the average profit from the last 10trades was calculated. To obtain a relative value, the last 10 averages were used.
In the case of the volatility, the average of the last 10 prices was used to calculatethe volatility at a certain session. To obtain a relative value, the last 10 averageswere used.
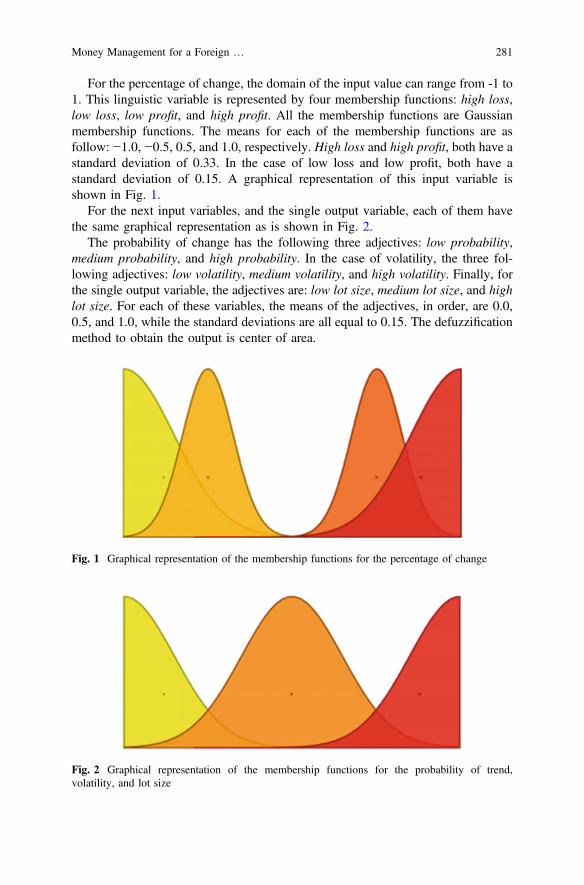
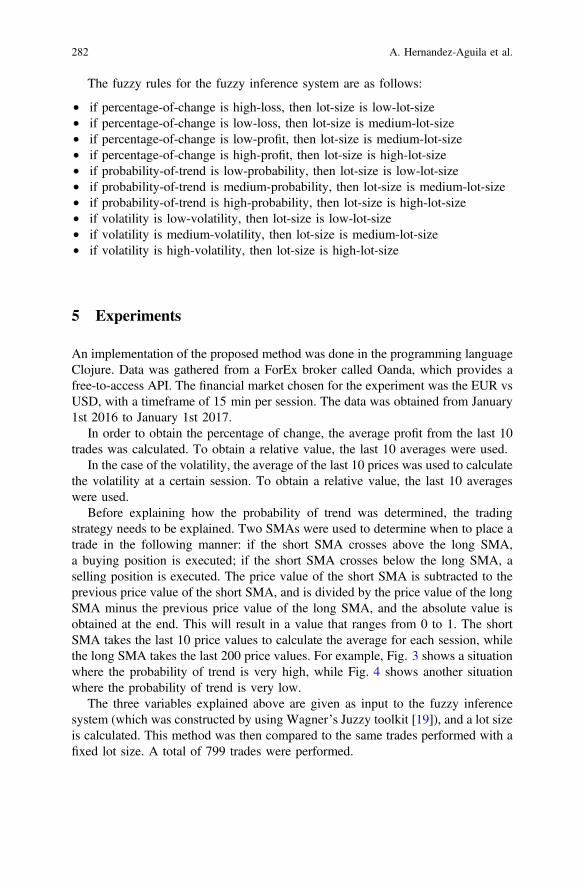
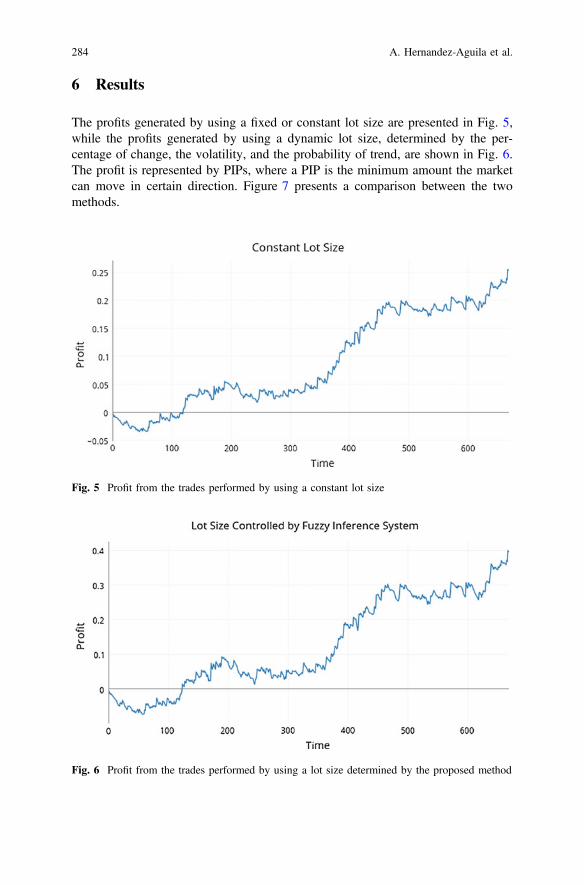
Before explaining how the probability of trend was determined, the tradingstrategy needs to be explained. Two SMAs were used to determine when to place atrade in the following manner: if the short SMA crosses above the long SMA,a buying position is executed; if the short SMA crosses below the long SMA, aselling position is executed. The price value of the short SMA is subtracted to theprevious price value of the short SMA, and is divided by the price value of the longSMA minus the previous price value of the long SMA, and the absolute value isobtained at the end. This will result in a value that ranges from 0 to 1. The shortSMA takes the last 10 price values to calculate the average for each session, whilethe long SMA takes the last 200 price values. For example, Fig. 3 shows a situationwhere the probability of trend is very high, while Fig. 4 shows another situationwhere the probability of trend is very low.
The three variables explained above are given as input to the fuzzy inferencesystem (which was constructed by using Wagner’s Juzzy toolkit [19]), and a lot sizeis calculated. This method was then compared to the same trades performed with afixed lot size. A total of 799 trades were performed.
282 A. Hernandez-Aguila et al.
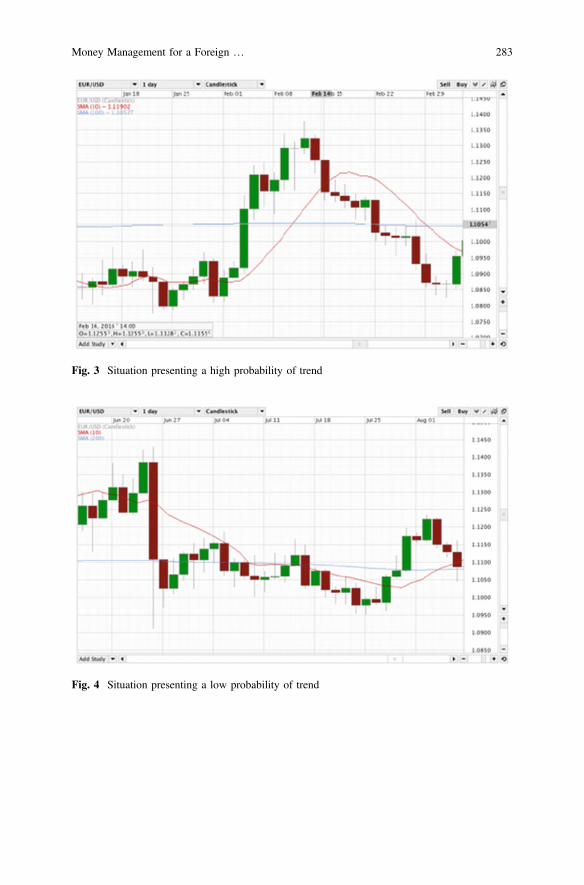
Fig. 3 Situation presenting a high probability of trend
Fig. 4 Situation presenting a low probability of trend
Money Management for a Foreign … 283
6 Results
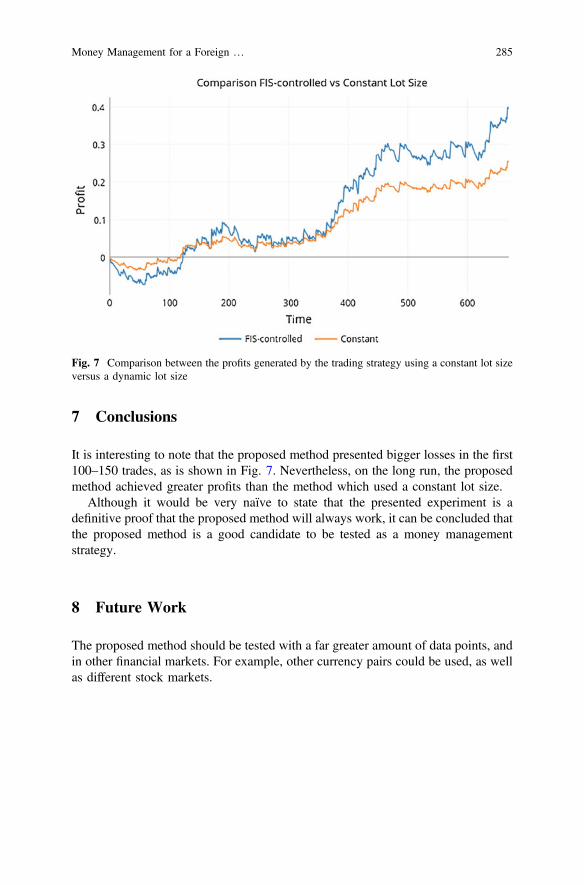
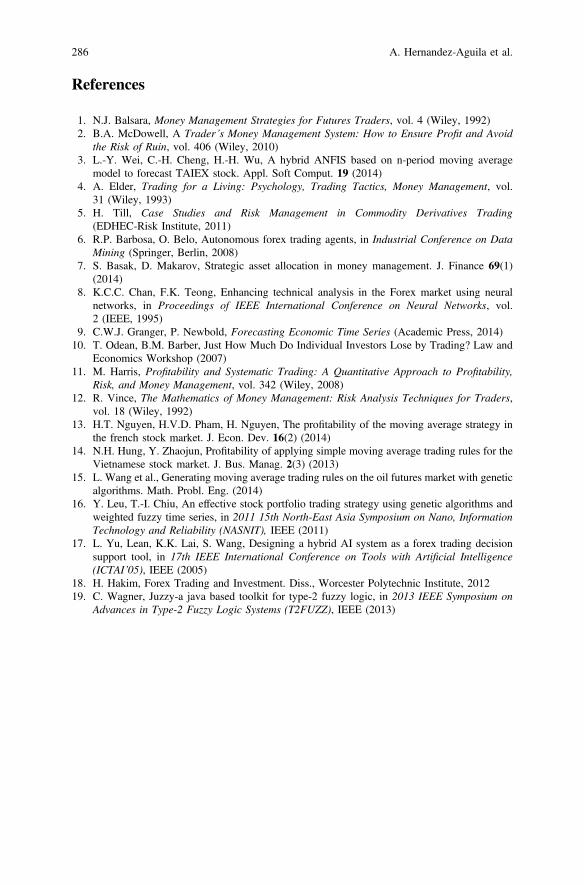
The profits generated by using a fixed or constant lot size are presented in Fig. 5,while the profits generated by using a dynamic lot size, determined by the per-centage of change, the volatility, and the probability of trend, are shown in Fig. 6.The profit is represented by PIPs, where a PIP is the minimum amount the marketcan move in certain direction. Figure 7 presents a comparison between the twomethods.
Fig. 5 Profit from the trades performed by using a constant lot size
Fig. 6 Profit from the trades performed by using a lot size determined by the proposed method
284 A. Hernandez-Aguila et al.
7 Conclusions
It is interesting to note that the proposed method presented bigger losses in the first100–150 trades, as is shown in Fig. 7. Nevertheless, on the long run, the proposedmethod achieved greater profits than the method which used a constant lot size.
Although it would be very naïve to state that the presented experiment is adefinitive proof that the proposed method will always work, it can be concluded thatthe proposed method is a good candidate to be tested as a money managementstrategy.
8 Future Work
The proposed method should be tested with a far greater amount of data points, andin other financial markets. For example, other currency pairs could be used, as wellas different stock markets.
Fig. 7 Comparison between the profits generated by the trading strategy using a constant lot sizeversus a dynamic lot size
Money Management for a Foreign … 285
References
1. N.J. Balsara, Money Management Strategies for Futures Traders, vol. 4 (Wiley, 1992)2. B.A. McDowell, A Trader’s Money Management System: How to Ensure Profit and Avoid
the Risk of Ruin, vol. 406 (Wiley, 2010)3. L.-Y. Wei, C.-H. Cheng, H.-H. Wu, A hybrid ANFIS based on n-period moving average
model to forecast TAIEX stock. Appl. Soft Comput. 19 (2014)4. A. Elder, Trading for a Living: Psychology, Trading Tactics, Money Management, vol.
31 (Wiley, 1993)5. H. Till, Case Studies and Risk Management in Commodity Derivatives Trading
(EDHEC-Risk Institute, 2011)6. R.P. Barbosa, O. Belo, Autonomous forex trading agents, in Industrial Conference on Data
Mining (Springer, Berlin, 2008)7. S. Basak, D. Makarov, Strategic asset allocation in money management. J. Finance 69(1)
(2014)8. K.C.C. Chan, F.K. Teong, Enhancing technical analysis in the Forex market using neural
networks, in Proceedings of IEEE International Conference on Neural Networks, vol.2 (IEEE, 1995)
9. C.W.J. Granger, P. Newbold, Forecasting Economic Time Series (Academic Press, 2014)10. T. Odean, B.M. Barber, Just How Much Do Individual Investors Lose by Trading? Law and
Economics Workshop (2007)11. M. Harris, Profitability and Systematic Trading: A Quantitative Approach to Profitability,
Risk, and Money Management, vol. 342 (Wiley, 2008)12. R. Vince, The Mathematics of Money Management: Risk Analysis Techniques for Traders,
vol. 18 (Wiley, 1992)13. H.T. Nguyen, H.V.D. Pham, H. Nguyen, The profitability of the moving average strategy in
the french stock market. J. Econ. Dev. 16(2) (2014)14. N.H. Hung, Y. Zhaojun, Profitability of applying simple moving average trading rules for the
Vietnamese stock market. J. Bus. Manag. 2(3) (2013)15. L. Wang et al., Generating moving average trading rules on the oil futures market with genetic
algorithms. Math. Probl. Eng. (2014)16. Y. Leu, T.-I. Chiu, An effective stock portfolio trading strategy using genetic algorithms and
weighted fuzzy time series, in 2011 15th North-East Asia Symposium on Nano, InformationTechnology and Reliability (NASNIT), IEEE (2011)
17. L. Yu, Lean, K.K. Lai, S. Wang, Designing a hybrid AI system as a forex trading decisionsupport tool, in 17th IEEE International Conference on Tools with Artificial Intelligence(ICTAI’05), IEEE (2005)
18. H. Hakim, Forex Trading and Investment. Diss., Worcester Polytechnic Institute, 201219. C. Wagner, Juzzy-a java based toolkit for type-2 fuzzy logic, in 2013 IEEE Symposium on
Advances in Type-2 Fuzzy Logic Systems (T2FUZZ), IEEE (2013)
286 A. Hernandez-Aguila et al.
Related Documents