CHAPTER 3 Monetary and Fiscal Policy in the Current Environment THE EFFORTS AND ACCOMPLISHMENTS of households and businesses produce the economic growth that leads to improved living standards. An environment that includes an open trading system, a strong market system with well-designed and efficient regulation where necessary, and legal protection of property rights fosters such progress. Monetary and fiscal policies also shape the environment within which households and businesses make their decisions. These policies are important tools used to pursue the goals of the Employment Act of 1946, which charges the Federal Government with promoting "maximum employment, production, and purchasing power." Monetary and fiscal policies can be best understood in the con- text of the events, both historical and recent, that shaped them. Such an analysis can assist in choosing policies that improve rather than disrupt short- and long-term economic performance. Of particular interest are the circumstances and policies surrounding the recent recession, which began in July 1990 and lasted until March 1991. While the decline in output was less than the average for other post-World War II recessions, by most measures the re- covery was the weakest in postwar history. Monetary policy refers to actions taken by the Federal Reserve (the Fed) that influence bank reserves, the money stock, and inter- est rates. An expansionary monetary policy tends initially to lower short-term interest rates by increasing the availability of money and credit. Lower interest rates encourage spending, particularly on investment projects. When the economy is operating well below capacity, increased spending is likely to lead to increased output. Once the economy is at or near capacity, however, rapid monetary expansion is likely to lead to inflation (a sustained increase in prices) rather than output growth. Conversely, contractionary, or tight, monetary policy reduces the growth rate of the money stock, increases short-term interest rates, and eventually lowers inflation. Fiscal policy refers to the spending and taxing policies of the Federal Government. Fiscal policy can influence total demand in the economy by changing taxes and government spending. Expan- sionary fiscal policy, for example, implements tax cuts, government 73 Digitized for FRASER http://fraser.stlouisfed.org/ Federal Reserve Bank of St. Louis

Welcome message from author
This document is posted to help you gain knowledge. Please leave a comment to let me know what you think about it! Share it to your friends and learn new things together.
Transcript
CHAPTER 3
Monetary and Fiscal Policy in theCurrent Environment
THE EFFORTS AND ACCOMPLISHMENTS of households andbusinesses produce the economic growth that leads to improvedliving standards. An environment that includes an open tradingsystem, a strong market system with well-designed and efficientregulation where necessary, and legal protection of property rightsfosters such progress. Monetary and fiscal policies also shape theenvironment within which households and businesses make theirdecisions. These policies are important tools used to pursue thegoals of the Employment Act of 1946, which charges the FederalGovernment with promoting "maximum employment, production,and purchasing power."
Monetary and fiscal policies can be best understood in the con-text of the events, both historical and recent, that shaped them.Such an analysis can assist in choosing policies that improverather than disrupt short- and long-term economic performance. Ofparticular interest are the circumstances and policies surroundingthe recent recession, which began in July 1990 and lasted untilMarch 1991. While the decline in output was less than the averagefor other post-World War II recessions, by most measures the re-covery was the weakest in postwar history.
Monetary policy refers to actions taken by the Federal Reserve(the Fed) that influence bank reserves, the money stock, and inter-est rates. An expansionary monetary policy tends initially to lowershort-term interest rates by increasing the availability of moneyand credit. Lower interest rates encourage spending, particularlyon investment projects. When the economy is operating well belowcapacity, increased spending is likely to lead to increased output.Once the economy is at or near capacity, however, rapid monetaryexpansion is likely to lead to inflation (a sustained increase inprices) rather than output growth. Conversely, contractionary, ortight, monetary policy reduces the growth rate of the money stock,increases short-term interest rates, and eventually lowers inflation.
Fiscal policy refers to the spending and taxing policies of theFederal Government. Fiscal policy can influence total demand inthe economy by changing taxes and government spending. Expan-sionary fiscal policy, for example, implements tax cuts, government
73
Digitized for FRASER http://fraser.stlouisfed.org/ Federal Reserve Bank of St. Louis
spending increases, or both, in order to increase economic activityduring downturns. Fiscal policy can also affect incentives to work,save, invest, and innovate. Changes in taxes on capital, for exam-ple, affect the after-tax return on investment in physical assets andthus the incentive for capital accumulation. Evaluations of fiscalpolicy changes must take into account the effects of both consumerand business demand and supply-side incentive effects.
MACROECONOMIC POLICY IN HISTORICALCONTEXT
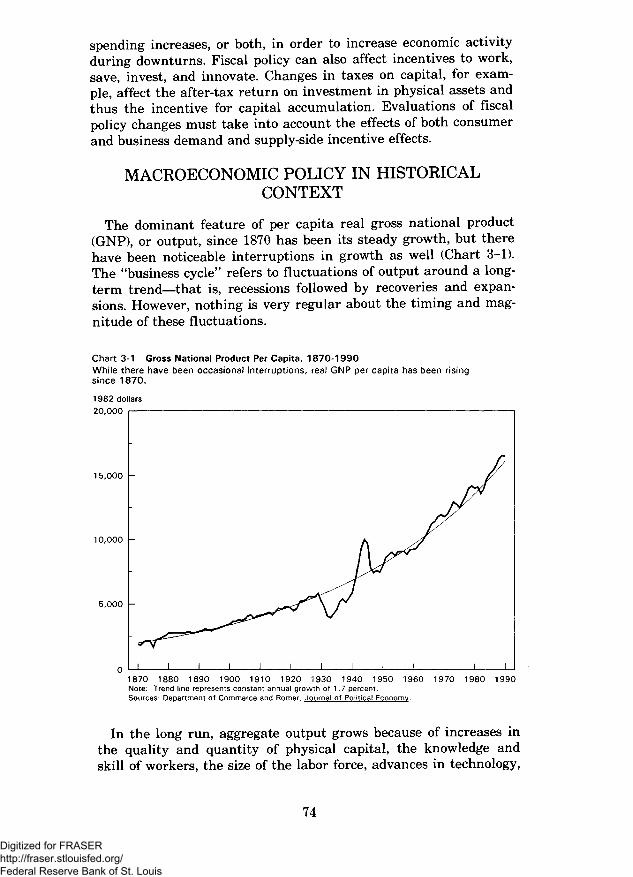
The dominant feature of per capita real gross national product(GNP), or output, since 1870 has been its steady growth, but therehave been noticeable interruptions in growth as well (Chart 3-1).The "business cycle" refers to fluctuations of output around a long-term trend—that is, recessions followed by recoveries and expan-sions. However, nothing is very regular about the timing and mag-nitude of these fluctuations.
Chart 3-1 Gross National Product Per Capita, 1870-1990While there have been occasional interruptions, real GNP per capita has been risingsince 1870.
5,000 -
1870 1880 1890 1900 1910 1920 1930 1940 1950 1960 1970 1980 1990Note: Trend line represents constant annual growth of 1.7 percent.Sources: Department of Commerce and Romer, Journal of Political Economy.
In the long run, aggregate output grows because of increases inthe quality and quantity of physical capital, the knowledge andskill of workers, the size of the labor force, advances in technology,
74
Digitized for FRASER http://fraser.stlouisfed.org/ Federal Reserve Bank of St. Louis
improved resource allocation through trade expansion and a moredynamic market system, and the entrepreneurial process that cre-ates new businesses and products. These factors do not grow at aconstant rate; this explains a small part of the variations in output.The major short-term fluctuations, however, do not reflect primari-ly changes in the productive capacity of the economy, but changesin its rate of utilization. For example, during economic declines thelabor force is not fully utilized, as indicated by high unemploymentrates.
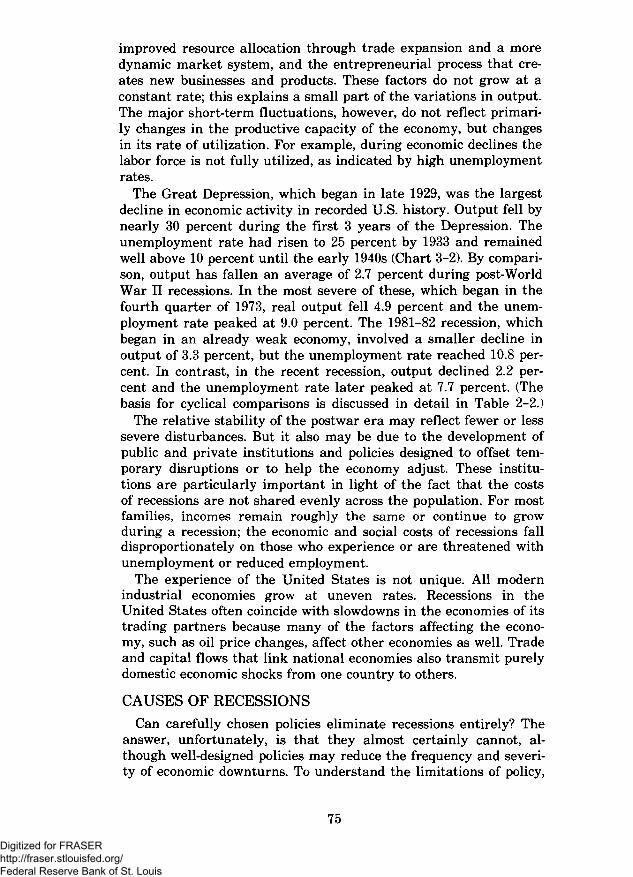
The Great Depression, which began in late 1929, was the largestdecline in economic activity in recorded U.S. history. Output fell bynearly 30 percent during the first 3 years of the Depression. Theunemployment rate had risen to 25 percent by 1933 and remainedwell above 10 percent until the early 1940s (Chart 3-2). By compari-son, output has fallen an average of 2.7 percent during post-WorldWar II recessions. In the most severe of these, which began in thefourth quarter of 1973, real output fell 4.9 percent and the unem-ployment rate peaked at 9.0 percent. The 1981-82 recession, whichbegan in an already weak economy, involved a smaller decline inoutput of 3.3 percent, but the unemployment rate reached 10.8 per-cent. In contrast, in the recent recession, output declined 2.2 per-cent and the unemployment rate later peaked at 7,7 percent. (Thebasis for cyclical comparisons is discussed in detail in Table 2-2.)
The relative stability of the postwar era may reflect fewer or lesssevere disturbances. But it also may be due to the development ofpublic and private institutions and policies designed to offset tem-porary disruptions or to help the economy adjust. These institu-tions are particularly important in light of the fact that the costsof recessions are not shared evenly across the population. For mostfamilies, incomes remain roughly the same or continue to growduring a recession; the economic and social costs of recessions falldisproportionately on those who experience or are threatened withunemployment or reduced employment.
The experience of the United States is not unique. All modernindustrial economies grow at uneven rates. Recessions in theUnited States often coincide with slowdowns in the economies of itstrading partners because many of the factors affecting the econo-my, such as oil price changes, affect other economies as well. Tradeand capital flows that link national economies also transmit purelydomestic economic shocks from one country to others.
CAUSES OF RECESSIONS
Can carefully chosen policies eliminate recessions entirely? Theanswer, unfortunately, is that they almost certainly cannot, al-though well-designed policies may reduce the frequency and severi-ty of economic downturns. To understand the limitations of policy,
75
Digitized for FRASER http://fraser.stlouisfed.org/ Federal Reserve Bank of St. Louis
Chart 3-2 Civilian Unemployment RateDuring the Great Depression the unemployment rate reached 25 percent and remained atdouble-digit levels for 10 consecutive years.
1929 1934 1939 1944 1949 1954 1959 1964 1969 1974 1979 1984 1989Note: Annual data. Prior to 1947, data are for ages 14 and over; starting in 1947, data are for ages 16 and over.Source: Department of Labor.
the factors that contribute to recessions must be taken into ac-count. They can be broadly classified as structural adjustments, ex-ternal events (also called shocks), and policy mistakes. At anygiven time, the economy may be struggling to overcome one ormore of these adverse factors. Recessions occur when a number ofunfavorable factors exist simultaneously or an unusually largeproblem arises.
A sharp reduction in expenditures on national defense, for exam-ple, gives rise to structural adjustments in production and employ-ment. Such reductions followed World War II, the Korean andVietnam wars, and are now taking place in response to the end ofthe Cold War. The Nation on the whole is better off when a conflictends and the resources devoted to national defense can be put toother uses. Nonetheless, large decreases in military spending dis-rupt production and employment as production patterns adjust tomeet changing demands. The temporary declines in output and in-creases in unemployment following World War II and the Koreanwar illustrate the costs that are incurred while resources are real-located.
76
Digitized for FRASER http://fraser.stlouisfed.org/ Federal Reserve Bank of St. Louis

External shocks in the form of large and sudden oil price in-creases have been an important factor in several recent recessions.The partial embargo on oil exports by the Organization of Petrole-um Exporting Countries in 1973 tripled world oil prices. Since oil isan important input in production, oil price shocks may lead indus-tries to change their production patterns. For example, oil-fueledplants may be refitted to run on coal. Further, since the UnitedStates is a net oil importer, it would pay more for its imported oil,thereby transferring income and wealth to oil exporting countriesand reducing the overall demand for domestic output.
In some instances policy mistakes have contributed to economicdownturns. The Great Depression is perhaps the best example.Even after production and prices had begun to decline sharply,monetary policy remained contractionary by most measures. The1930 passage of the Hawley-Smoot Tariff Act raised tariffs on manyimports, leading our trading partners to retaliate and disruptingglobal trade flows. With the economy still mired in depression in1932, a tax increase was enacted in an effort to balance the budget.But by reducing disposable income and household spending, the taxincrease deepened the Depression. This series of policy blundersturned what could have been a moderate or severe recession intothe Great Depression.
Even if no policy mistakes are made, however, structural adjust-ments and external shocks may cause occasional periods of declin-ing output. It is unrealistic to expect that well-chosen policies canalways compensate completely for all types of disturbances andeliminate recessions entirely.
THE LIMITS OF POLICYThe extent to which fiscal and monetary policies can mitigate
short-term economic fluctuations has been the subject of debate.Views on this subject have evolved considerably in recent decades,and will undoubtedly continue to evolve as circumstances changeand new policies are tried.The Activist Approach
The Keynesian view, which reached its peak of influence in the1960s, advocated government spending increases and tax cuts, sup-ported by expansionary monetary policy, to stimulate overalldemand whenever output fell below the economy's estimated capac-ity to produce. More restrictive policies were advocated when infla-tion became a greater concern. Many economists believed that astable tradeoff existed between unemployment and inflation rates:Expansionary policies would lower unemployment at the cost ofsomewhat higher—but not continually rising—inflation. It was be-lieved that ' 'activist" or "fine-tuning" policies could increasedemand whenever the economy was below capacity, reducing busi-
77
Digitized for FRASER http://fraser.stlouisfed.org/ Federal Reserve Bank of St. Louis
ness cycle fluctuations and at the same time increasing long-termgrowth in the economy's capacity. Such policies frequently changedcourse in response to short-term economic developments.Impediments to Fine-Tuning
The foundation of the activist approach was discredited by thehistorical experience of the 1960s and 1970s. Output grew rapidlyin the 1960s, but inflation, as measured by the rate of change inthe consumer price index, rose from 0.7 percent during 1961 to 6.2percent during 1969. In the 1970s the economy experienced manydifficulties, including large simultaneous increases in both inflationand unemployment. This development contradicted the idea that astable tradeoff existed between inflation and unemployment andled to a rethinking of the efficacy of fine-tuning.
It has become clear that a number of factors, including delays,forecasting difficulties, and uncertainty about the economy's re-sponse, make fine-tuning unreliable at best. Furthermore, well-in-tentioned policies may actually increase business cycle fluctuations.
Policymaking is complicated by a number of delays, or lags. Theinformation available on the current state of the economy is imper-fect; most data for a particular month or quarter are not availableuntil the next month or quarter and are often revised substantial-ly. As a result, policymakers learn that the economy has changeddirection only after the fact, resulting in a recognition lag. Buteven after it becomes clear that the economy has weakened, delaysin the political process create lags in implementing specific poli-cies. For instance, most fiscal policies require time-consuming con-gressional action and then must be approved by the Administra-tion, creating an action lag between the time problems develop andaction is taken. Finally, even after new policies are implemented,further lags may occur before economic activity is affected. A re-duction in tax rates, for example, may initially have little effect onconsumption or investment because time elapses before consumersand businesses can respond fully. Thus, expansionary countercycli-cal actions will have their intended effect only if the economywould have remained weak well into the future.
Because of the various lags, policymakers must rely on economicforecasts in setting policies. Economic forecasting is an imprecisescience; it is particularly difficult around business cycle turningpoints. Fortunately, market economies have many self-correctingtendencies that eventually reduce the effects of external shocks orstructural imbalances. As noted, disturbances such as oil priceshocks or reductions in defense spending create a need for changesin patterns of production. Growth in output tends to fall as theseadjustments begin but resumes as they are completed. While theseself-correcting tendencies are a desirable feature of market econo-mies, the pace at which adjustments occur is unpredictable, compli-
78
Digitized for FRASER http://fraser.stlouisfed.org/ Federal Reserve Bank of St. Louis
eating the forecasting process and raising the possibility that a re-covery may be well under way before the economy receives signifi-cant stimulus from policies introduced to fight the recession. Inthis case, such policies may cause higher inflation but only smallgains in production.
A further impediment to fine-tuning is uncertainty about howthe economy will respond to changes in fiscal and monetary policy.The economic response to a particular policy change depends inpart on people's expectations about future policies. For instance,firms and households may view economic policies as temporaryunder a fine-tuning regime because policy changes can be expectedto occur relatively frequently. Unpredictable policies may compli-cate the task of long-term planning for firms and households, dis-couraging investment and undermining long-term economicgrowth.
Fine-Tuning and InflationThe costs of high and variable inflation are considerable but
more subtle than the costs of recessions. In a market economy,prices provide essential information about the relative scarcity ofgoods and services. High and volatile inflation obscures this infor-mation and distorts the allocation of resources. Furthermore, unex-pected inflation arbitrarily redistributes income and wealth. Ithurts lenders and people on fixed incomes and helps borrowers,since the real value of interest and principal payments is eroded byinflation.
Inflation also has unintended effects on the tax structure thataffect incentives to work, save, and invest. The Economic RecoveryTax Act of 1981 indexed income tax brackets for inflation begin-ning in 1985, but some taxes on capital income are still affected byinflation. For example, capital gains are not indexed for inflation,and depreciation allowances are effectively reduced by inflation be-cause they are based on original rather than replacement cost.These features of the tax system cause inflation to both reduce thereal after-tax return on capital assets and discourage investment.
The late 1940s and early 1950s were marked by dramatic changesin inflation rates associated with the aftermath of World War IIand the beginning of the Korean war (Chart 3-3). From 1952 intothe mid-1960s, however, inflation never exceeded 3 percent. Therate of inflation then began to increase, albeit erratically, reachingdouble digits in 1974 and again in 1979 and 1980. In fact, from 1960to 1980 inflation was higher at each successive business cycle peak,and each recovery also began with a higher inflation rate than thepreceding one.
Why did the fine-tuning policies pursued during this period con-tribute to rising and variable inflation? If expansionary policiesstimulate demand when the economy is already approaching capac-
79
Digitized for FRASER http://fraser.stlouisfed.org/ Federal Reserve Bank of St. Louis
Chart 3-3 Consumer Price InflationDuring the 1960s and 1970s the inflation rate reached a higher level at each successivebusiness cycle peak. This upward trend was reversed in the 1980s.
Percent change from same quarter year agoP T P T P T P T P T P T P T P T P T
-51947 1952 1957 1962 1967 1972 1977 1982 1987 1992Note: Quarterly data; CPI-U, all items. Shaded areas represent recessions from peak (P) to trough (T).Source: Department of Labor.
ity, they may increase output temporarily but then, after some lag,increase prices. In particular, a monetary policy that producesgrowth in money that persistently exceeds growth in real outputinevitably leads to inflation. If expansionary policies are expectedto continue, people may anticipate higher future inflation rates aswell, complicating the process of reversing inflation.
One danger of fine-tuning is that expansionary policies maybecome addictive. Political considerations can cause policymakersto favor short-term stimulus to expand output and employment rel-ative to policies to control inflation. This is one of the reasons whyinflation was higher at the end of each recession between 1960 and1980. Policymakers may also simply overestimate the economy's ca-pacity, especially when structural adjustments or external shocksare temporarily slowing the growth of capacity. If expansionarypolicies persist after the economy is near capacity, output and em-ployment will increase very little, but inflation will continue torise.
Because of the considerable costs of inflation, episodes of highand variable inflation lead to policy actions to contain or reverse it.Reducing inflation—that is, disinflating—after an extended period
80
Digitized for FRASER http://fraser.stlouisfed.org/ Federal Reserve Bank of St. Louis
of rising or high inflation tends to result in reduced output growthand increased unemployment. The recession of 1981-82, duringwhich unemployment rates rose to almost 11 percent, was in part aconsequence of the policies introduced to reverse the rising infla-tion that had developed throughout the 1960s and 1970s. An impor-tant accomplishment of the past 12 years has been the reductionand subsequent containment of inflation, achieved in part by ad-herence to a credible, systematic monetary policy.
Alternatives to Fine-TuningFine-tuning is complicated by a number of factors such as vari-
able and uncertain lags, the need for accurate forecasts, and thetemptation to pursue overly expansionary policies. Furthermore, fre-quent policy changes complicate the task of long-term planning forfirms and households, discouraging investment and undermininglong-run economic growth.
An alternative to fine-tuning that avoids some of these difficul-ties is the establishment of systematic and clearly stated policyplans consistent with the long-term objectives of high and stableoutput growth and low and stable inflation. Credibility is achievedover time both as plans are carried out and long-term objectivesare accomplished. Even if policymakers aim to follow a systematicpolicy, however, it is not always possible to specify all contingen-cies, and changes in the economy may occasionally require thatplans be revised. For example, if the relationship between moneygrowth rates and output shifts, the targets for monetary growthwill need to be adjusted. Similarly, high and persistent budget defi-cits may necessitate changes in fiscal policies.
Fine-tuning policies can be likened to a weathervane. Just as theweathervane changes direction with the wind, fine-tuning policiesfrequently shift in response to changes in the economy. Adheringto systematic policies, on the other hand, is much like following acourse laid out by a compass. Just as travellers deviate from thecompass headings only if an obstacle such as a mountain lies intheir path, policymakers deviate from their plans only if a severeor protracted economic contraction or rising inflation is at hand. Incontrast to fine-tuning, systematic policies do not change in re-sponse to small, temporary variations in the rate of growth. Anydeviations from the announced plans are explained in the contextof long-term policy goals, so as not to undermine future credibility.One might call such a policy "gross-tuning," to distinguish it fromboth fine-tuning and from the notion that policies should be set ac-cording to rigid rules which are mechanically followed regardlessof actual and prospective developments in the economy.
81Digitized for FRASER http://fraser.stlouisfed.org/ Federal Reserve Bank of St. Louis
SUMMARY• The United States and other modern industrial economies ex-
perience occasional periods of recession when output declinesand unemployment rises.
• Recessions can result from a number of factors that impedegrowth, including unavoidable structural imbalances, externaldisturbances, and government policy errors.
• Monetary and fiscal policies may be able to mitigate reces-sions, but they cannot eliminate business cycle fluctuationscompletely. Overly aggressive attempts to do so are likely tolead to higher inflation and impede long-term growth inoutput.
RECENT ECONOMIC DEVELOPMENTS
Recent monetary and fiscal policies have been heavily influencedby the legacy of the preceding two decades, most notably by therising inflation of the late 1960s and 1970s and the emergence oflarge budget deficits during the long expansion of the 1980s. Manystructural imbalances, some of which had their roots in the 1970s,worsened the recent recession and slowed the subsequent recovery.In addition, the economy was buffeted by an oil price shock afterIraq invaded Kuwait in August 1990.
MACROECONOMIC POLICIES AND ECONOMICPERFORMANCE IN THE 1980s
The economy entered the 1980s with declining production andhigh inflation. After rising rapidly in the late 1970s, inflationreached a peak of 13.3 percent during 1979—the highest rate sincethe aftermath of World War II. Faced with high and rising infla-tion, the Federal Reserve announced new measures that were in-tended to signal its unwillingness to finance a continuing inflation-ary process. The 1979 Annual Report of the Board of Governors ofthe Federal Reserve System noted that "the System's day-to-dayoperating procedures would be altered in a way expected to makethe achievement of growth targets for the monetary aggregatesmore certain. Specifically, policy would be conducted with greateremphasis on supplying reserves to member banks at a rate believedconsistent with growth objectives for monetary aggregates; and lessattention would be focused on short-term interest rates as a guidefor open market operations." Focusing on short-term interest rates"had become less reliable in an environment of rapid and variableinflation."
Efforts to curb inflation were costly. The economy suffered abrief but steep recession from January to July of 1980, duringwhich output fell by 2.3 percent and unemployment rose to 7.8 per-
82
Digitized for FRASER http://fraser.stlouisfed.org/ Federal Reserve Bank of St. Louis

cent. Inflation edged downward slightly to 12.5 percent during1980. After a brief period of growth, the economy entered anotherrecession in July 1981 that lasted until November 1982. This reces-sion was unusually severe, with unemployment rates climbingabove 10 percent for the first time since 1941.
While the recession was painful, the loss of output was actuallyfar below the levels that many models had predicted would be nec-essary to achieve the dramatic reduction in inflation that occurred.By the time the economy emerged from the recession of 1981-82,core inflation—which excludes the volatile food and energy compo-nents—had fallen below 5 percent. One reason models overestimat-ed the loss in output was that they neglected to take into accountthe fact that credible policies could lower inflationary expectationsand lead to a faster and less costly reduction in inflation.
After a difficult 3-year period, the longest peacetime expansionin modern U.S. history began in late 1982. As is often the case, theearly phase of recovery was marked by rapid growth in output asidle resources came back into use. In 1983 real gross domestic prod-uct (GDP) grew by 3.9 percent. GDP growth increased to 6.2 per-cent in 1984, faster than during any year since 1951. By the end of1984, many of the previously idle resources had been brought backinto use and real output expanded at a rate of about 3 percentfrom 1985 to 1989. Job growth in the 1982-89 period was remarka-ble. Nonagricultural payrolls increased by 18 million, from 90 mil-lion in 1982 to 108 million in 1989, exceeding the combined in-crease in employment in Western Europe and Japan, with theirmuch larger total population, over the same period.Fiscal and Monetary Policy in the 1980s
Growth in government expenditures on programs such as defenseand medicare contributed to demand during the 1980s. FederalGovernment spending as a share of GDP rose from 20.2 percent in1979 to 23.4 percent by 1985. Substantial changes in the tax struc-ture in 1981 increased incentives to work and invest. Total tax re-ceipts, however, changed little as a percentage of GDP. By the mid-1980s, the combination of growing government spending and stabletax receipts had resulted in budget deficits that were large relativeto the size of the economy, particularly for a peacetime expansion.The Federal budget deficit averaged about 5 percent of GDP from1984 to 1986.
In response to growing concern about the deficit, the FederalGovernment in 1985 adopted (and later amended) the BalancedBudget and Emergency Deficit Control Act, known as Gramm-Rudman-Hollings (GRH), which seemed to be somewhat successfulin slowing the growth of government expenditures. While the origi-nal deficit targets under the GRH were never met, deficits did fallto about 3 percent of GDP by 1989. Still, containing spending
83Digitized for FRASER http://fraser.stlouisfed.org/ Federal Reserve Bank of St. Louis

growth and reducing the deficit remained major fiscal policy issuesas the economy entered the 1990s.
While real output and employment grew steadily following the1981-82 recession, the rate of inflation—in contrast to the 1970s—remained relatively stable. Core inflation hovered around the 4- to5-percent range from 1982 to 1988. While low compared to the ratesof the late 1970s, these rates would have been deemed unacceptablejust two decades earlier. Many argued in favor of a second round ofdisinflation. However, the Fed had eased credit conditions in late1987 and early 1988 in order to counter any economic weaknessand to ensure the smooth functioning of financial markets in thewake of the stock market crash of October 1987. It soon becameclear that the economy had remained strong in spite of the crash,with unemployment rates hovering around 5V2 percent and mon-etary aggregates growing at rates near the top of their targetranges in early 1988. Concerns about inflationary pressures roserelative to concerns about the possibility of recession.
A Shift in PolicyMindful of the cost of reversing rising inflation in the early
1980s, the Fed tightened reserve conditions in a series of steps be-ginning in March 1988 and continuing into 1989. The Fed targetfor growth in M2, a key measure of the money stock, was loweredfrom the 4- to 8-percent range in 1988 to the 3- to 7-percent rangein 1989. The Federal funds rate (a key short-term interest rate)rose by more than 3 percentage points between March 1988 andMarch 1989. This policy change is often referred to as the "soft-landing" strategy. Its presumed objective was a slow decelerationof the economy that would head off an incipient rise in inflation,and possibly even lower it, without causing a recession. This strate-gy represented a welcome break from the policies of the 1960s and1970s, which typically had reacted to inflation only after it hadrisen significantly, thereby imposing greater costs in terms of lostoutput and higher unemployment during the disinflation process.
The soft-landing strategy was laudable but went unappreciatedby many observers. Preemptive measures to contain inflation maygo unnoticed whereas measures to reduce inflation after it has al-ready risen are painfully obvious. The latter may receive morepraise, even though the former may reflect a much wiser policy.
STRUCTURAL IMBALANCES IN THE ECONOMYEven though the economy experienced strong growth in the mid-
to late-1980s, several structural imbalances were building thatwould contribute to the most recent recession and subsequent slowrecovery. Problems in the financial sector led to a credit crunch,high debt levels burdened households and corporations and inhibit-ed spending, the end of the Cold War led to reductions in defense
84
Digitized for FRASER http://fraser.stlouisfed.org/ Federal Reserve Bank of St. Louis
spending, corporate restructuring hindered employment growth,overcapacity in commercial real estate discouraged new construc-tion, and budget problems constrained the spending of State andlocal governments.The Credit Crunch
After a period of relatively easy credit in the mid-1980s, bankersand bank regulators appear to have adopted much more stringentstandards near the end of the decade, although regional creditproblems had occurred earlier. Companies that could easily obtainfinancing in the past had difficulty finding new bank loans; theyfaced a "credit crunch." In practice, it is difficult to quantify acredit crunch. A reduction in bank lending during a recession canbe caused by weak demand, limited supply, or a combination of thetwo. Nevertheless, there is evidence that a credit crunch has beenat work in the latest recession and recovery.
Banks play a unique role in financial markets, specializing in ob-taining and analyzing information on the creditworthiness of smallfirms that often have difficulty obtaining credit elsewhere. As aresult, the effects of the recent credit crunch were concentrated onsmall businesses and some types of commercial real estate thathave limited alternative funding sources. Medium-sized and largecorporations appear to have been less affected, since they canborrow in the commercial paper and bond markets, where firmsobtain financing by issuing securities directly to investors. The ef-fects were also concentrated geographically, with California andthe Northeast experiencing the tightest credit conditions.
One reason for the shift in bank lending practices was a shift inregulatory policy. During the steady growth of the 1980s, regula-tors were perhaps too sanguine, exerting insufficient control onrisk-taking by banks and savings and loans (S&Ls). By the late1980s, however, the situation had changed. The magnitude of theS&L problems had come to light, and it became clear that the gov-ernment-backed insurance fund for savings and loans (the FederalSavings and Loan Insurance Corporation, or FSLIC) would go bank-rupt, causing heavy taxpayer losses. The economy was beginning toslow, and bad loans were weakening many banks. Recognizing thatbanks were also susceptible to large losses, regulators became con-cerned about the strength of all insured financial institutions. TheCongress passed two bills—the Financial Institution Reform, Recov-ery, and Enforcement Act of 1989 and the FDIC Improvement Actof 1991—which contained several features that inadvertently con-tributed to the credit crunch and restricted bank lending (Chapter5).
Regulators worldwide focused on the need to rebuild bank capital(Box 3-1). A bank's capital is the difference between the value ofits assets (reserves, loans, and securities) and the value of its liabil-
85
Digitized for FRASER http://fraser.stlouisfed.org/ Federal Reserve Bank of St. Louis
ities (primarily deposits). In 1988 the industrialized nations agreedto a common set of capital standards for financial institutions,known as the Basle Accords. While most U.S. banks already metthe new risk-based capital standards, some fell short. Furthermore,the new rules failed to mandate adequate reserves for governmentbonds in comparison with commercial loans, unintentionally pro-viding an incentive for banks to shift their assets into governmentbonds and away from commercial loans—a tendency some havesuggested contributed to the decline in commercial lending (Chart3-4).
Chart 3-4 Loans and Securities Held by U.S. Commercial BanksCommercial banks have shifted their assets into government securities and away fromcommerical loans.
Billions of dollars700
600
500
400
300
200
100
Commercial andindustrial Loans
U.S. GovernmentSecurities
I | I I I I I
1973 1975 1977 1979 1981 1983
Source: Board of Governors of the Federal Reserve System.
1985 1987 1989 1991
The combination of higher capital standards and lower assetvalues created a "capital crunch" for banks. To increase capital,banks had to reduce their asset holdings, raise more capital, orboth. Since raising capital quickly is often expensive, many bankschose to reduce assets by cutting back on lending, which increasesthe ratio of capital to assets because capital remains approximatelythe same while assets shrink. In this sense, the capital crunch forbanks appears to have contributed to the credit crunch for busi-nesses.
Digitized for FRASER http://fraser.stlouisfed.org/ Federal Reserve Bank of St. Louis
Box 3-1.—The Role of Bank CapitalBank regulators set minimum capital standards for two rea-
sons. First, capital absorbs losses that would otherwise have tobe paid by the Federal Deposit Insurance Corporation (FDIC)or taxpayers (if the losses were large enough). Another impor-tant motive for ensuring that banks have sufficient capital isto reduce the perverse incentives caused by deposit insurance.When a bank is close to bankruptcy, it may invest in riskyprojects that have a high rate of return if they succeed. Be-cause the FDIC will absorb any insured losses, the bank is will-ing to take a gamble that could keep it from failing.
The underlying weakness in the capital position of U.S. fi-nancial institutions in recent years can be traced to a numberof causes. For the S&Ls, the problems can be traced back tolosses suffered in the late 1970s, when rising inflation andrising interest rates caused the value of their mortgage loansto plummet and their funding costs to rise. These difficultieswere compounded by losses on risky investments made in the1980s following deregulation, a situation discussed in Chapter5.
The problems facing commercial banks were more variedand on the whole not as severe. In the early 1980s, large bankssuffered major losses on loans to Third World countries. Whilethese had become less of a problem by 1990, the banks soon ex-perienced a new wave of losses. The average commercial bankloan has become more risky in recent years, in part becauseestablished firms can borrow at more favorable terms fromsources such as the commercial paper market. Losses from de-faults on real estate loans, particularly in regions where prop-erty values were falling, further eroded bank capital. Converse-ly, many believe that tighter credit conditions contributed tothe fell in property values by creating a shortage of financingfor real estate investments.
Bank capital increased markedly in 1992 due to record bank-ing industry profits and improvements in loan performance.However, a continuing challenge for bank regulators is tostrike a balance between the need to ensure that banks havesufficient capital and the need to allow banks the necessaryflexibility to provide the credit essential for economic growth.
The Buildup of Household and Corporate DebtIn addition to the constraints on the supply of credit, a number
of factors contributed to unusual softness in the demand for credit.
87
Digitized for FRASER http://fraser.stlouisfed.org/ Federal Reserve Bank of St. Louis
Consumers entered the 1990s with high levels of outstanding debtrelative to their income. The ratio of household interest paymentsto income remained between 14 and 16 percent from mid-1960 until1983 but had grown to 18 percent by the end of the 1980s (Chart 3-5). An increase in corporate indebtedness in the 1980s was broughtabout by a wave of financial restructurings. Tax laws that contin-ued to heavily favor debt over equity encouraged this trend. Therise in the share of income devoted to interest payments began toact as a constraint on private sector spending as income declinedand prospects for future growth dimmed.
Chart 3-5 Debt Service Payments as Percent of Disposable IncomeHousehold interest payments climbed from 14,2 percent of disposable income in 1983 to18.1 percent in 1990.
I960 1964 1968 1972 1976 1980 1984 1988 1992Note: Quarterly data. Debt service payments include mortgage payments.Sources: Department of Commerce and Board of Governors of the Federal Reserve System.
Recently corporate and household balance sheets have begun tostrengthen. In 1992 corporations issued a record volume of newequity, increasing their ability to borrow in the future. Much exist-ing corporate debt has been refinanced at lower rates, and newbond issues have been on the rise. The ratio of household interestpayments to income has fallen back to approximately I6V2 per-cent.
Defense Spending ReductionsOutlays on defense, which had increased substantially during the
first half of the 1980s, peaked at 6.5 percent of GDP in 1986, thenflattened and began to decline slightly (Chart 3-6). Soon thereafter,
Digitized for FRASER http://fraser.stlouisfed.org/ Federal Reserve Bank of St. Louis
it became apparent that defense spending was likely to be cut sub-stantially during the 1990s due to reforms in the Soviet Union andEastern Europe. The President's budget for fiscal 1993 calls for de-fense outlays in fiscal 1997 to fall to an estimated 3.7 percent ofGDP.
Chart 3-6 National Defense OutlaysAfter rising to 6.5 percent of GDP in fiscal 1986, national defense outlays are projected todecline to 3.7 percent of GDP in fiscal 1997.
Percent of GDP14
1954 1958 1962 1966 1970 1974 1978 1982 1986 1990 1994Fiscal Year
Note: Estimates are from July 1992 Midsession Review.Sources: Department of Commerce and Office of Management and Budget.
Reductions in defense spending have many ramifications. Overallthe Nation will benefit, since more resources will be available toprovide other goods and services. As mentioned earlier, however,certain transitional problems are associated with drawdowns.Workers no longer needed in the defense industry will not be hiredimmediately by nondefense firms, resulting in some transitionalunemployment.
Some have argued that the recent and prospective reductions indefense spending will have little effect on economic performance,even in the short run, since they represent a smaller share of GDPthan previous reductions and are scheduled over a longer period oftime. However, the short-term impact of defense spending reduc-tions is evident in the changes in unemployment rates acrossStates. Unemployment in the four States most heavily dependenton defense industry purchases—Connecticut, Virginia, Massachu-setts, and California—rose by 4.1 percentage points between 1988
89
Digitized for FRASER http://fraser.stlouisfed.org/ Federal Reserve Bank of St. Louis
and September 1992. Meanwhile, the combined unemployment ratefor all other States rose by only 1.5 percentage points. These fig-ures indicate that defense reductions are a substantial drag on theeconomy today. Although the level of defense spending should beshaped by national security needs rather than concern about tem-porary economic dislocations, such dislocations will increase in theevent of even deeper budget cuts.
The short-term impact of current defense reductions may belarger than many expected for several reasons. First, the relativelygradual rate of spending reductions may be misleading. Becausebusinesses plan for the future, they are likely to adjust their workforces and equipment purchases as soon as they are aware of im-pending reductions, rather than waiting until the cuts actuallyoccur. In addition, defense industry workers fearing the possibilityof permanent job loss are likely to reduce their spending today. Un-certainty about the nature and size of the reductions increases thenumber of workers who feel vulnerable. Finally, the increasinglyspecialized nature of defense and commercial production suggeststhat defense industry workers—including highly skilled scientistsand engineers—and perhaps some military personnel may havegreater difficulty finding comparable nondefense employment nowthan they would have 20 years ago.
The changes in State unemployment rates show that the short-term impacts of defense reductions will be severe in some regions.In some instances, defense spending reductions have coincided withproperty deflation and banking problems. Southern California is aprime example. By reducing employment opportunities and incomesubstantially in certain regions, the defense drawdown exacerbateddeclines in property values. As noted in Box 3-1, falling propertyvalues combined with increased default rates on real estate loanshave eroded bank capital. Until these structural problems begin tobe resolved and credit conditions ease, high unemployment maypersist in regions such as Southern California.Industry Restructuring
Defense downsizing is an example of industry restructuring inwhich long-term adjustment occurs in response to changing condi-tions. In this case, restructuring is a response to a lessening of thethreat to national security. Although in other cases the underlyingsources of change may be more difficult to identify, restructuringsoccur continuously in a market economy; some industries grow rap-idly while others decline. Technological breakthroughs, shifts inconsumer preferences, fluctuations in input prices, changes in do-mestic and international competition, and countless other influ-ences require firms and industries to adjust constantly in order toremain profitable.
90
Digitized for FRASER http://fraser.stlouisfed.org/ Federal Reserve Bank of St. Louis
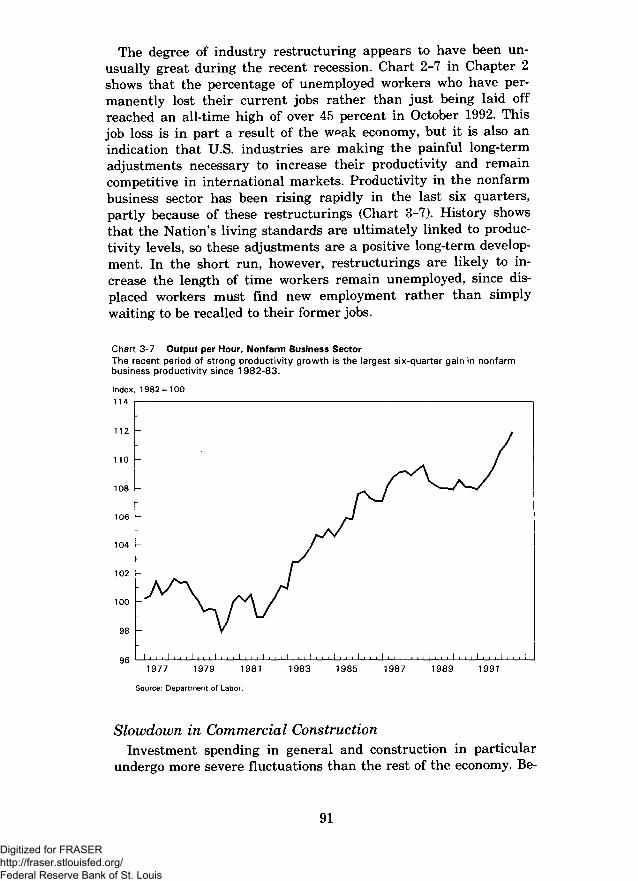
The degree of industry restructuring appears to have been un-usually great during the recent recession. Chart 2-7 in Chapter 2shows that the percentage of unemployed workers who have per-manently lost their current jobs rather than just being laid offreached an all-time high of over 45 percent in October 1992. Thisjob loss is in part a result of the weak economy, but it is also anindication that U.S. industries are making the painful long-termadjustments necessary to increase their productivity and remaincompetitive in international markets. Productivity in the nonfarmbusiness sector has been rising rapidly in the last six quarters,partly because of these restructurings (Chart 3-7). History showsthat the Nation's living standards are ultimately linked to produc-tivity levels, so these adjustments are a positive long-term develop-ment. In the short run, however, restructurings are likely to in-crease the length of time workers remain unemployed, since dis-placed workers must find new employment rather than simplywaiting to be recalled to their former jobs.
Chart 3-7 Output per Hour, Nonfarm Business SectorThe recent period of strong productivity growth is the largest six-quarter gain in nonfarmbusiness productivity since 1982-83.
Index, 1982 = 100114
112 -
1977 1979 1981 1983 1985 1987 1989 1991
Source: Department of Labor.
Slowdown in Commercial ConstructionInvestment spending in general and construction in particular
undergo more severe fluctuations than the rest of the economy. Be-
91
Digitized for FRASER http://fraser.stlouisfed.org/ Federal Reserve Bank of St. Louis
cause of the long life of structures, small changes in interest ratesor tax policies strongly affect demand for this type of investment.
Commercial real estate has recently undergone a pronouncedcycle of "boom and bust." Changes in the tax code in 1981 greatlyincreased the incentive to invest in new commercial real estate,The annual average rate of spending on nonresidential structuresfrom 1981 through 1985 rose 25 percent in real terms over the pre-vious 5-year period, in spite of the steep recession of 1981-82. The1988 tax act reversed and in fact further reduced the incentives forcommercial real estate introduced in the 1981 law. As the newmeasures were phased in, the real estate boom gradually ended.The overbuilding that occurred during the first half of the 1980sand the credit crunch in recent years would probably have endedthis boom even without the tax changes. Vacancy rates for com-mercial office space, for example, had risen sharply by the mid-1980s in many metropolitan areas.
Changes in tax laws, interest rates, and demographics contribut-ed to a slowdown in the construction of multifamily housing units.The 1986 tax reforms reversed the incentives not only for commer-cial real estate but also for multifamily housing units. Increases ininterest rates in the late 1980s raised the cost of financing new con-struction projects. Furthermore, as the ''baby-boom5J generationmatured, the rate of household formation declined. The number ofmultifamily housing units under construction rose from 379,000 in1981 to 670,000 in 1985, before falling back to 373,000 in 1989.
Reduced residential construction tends to reduce the purchase ofconsumer durables, such as furniture and home appliances, as well.Housing starts and building permits in 1992 were well above their1991 levels, but demographic trends suggest that neither householdformation nor housing starts will return to the levels of the 1960sand 1970s anytime soon.State and Local Fiscal Developments
Most States are prohibited from running a budget deficit, andlocal budgets showed relatively large surpluses in the mid-1980s.However, State and local government expenditures have risen sub-stantially in recent years. Because tax revenues failed to keep pacewith expenditures, combined State and local government surpluseshad fallen to half the level of the mid-1980's by 1990. These budgetproblems meant that expenditures could not easily be increasedand taxes could not easily be reduced.
EXTERNAL EVENTSBy 1990 many structural adjustments were adversely affecting
output growth: Banks had grown more cautious in their lendingpolicies, high debt levels had reduced household and businessspending, the defense industry was contracting, industry restruc-
92
Digitized for FRASER http://fraser.stlouisfed.org/ Federal Reserve Bank of St. Louis
turing was hindering employment growth, construction had slowedconsiderably, and State and local fiscal spending was constrained.Of these factors, it was clear that at least two—reduced defensespending and the glut of commercial real estate—would be continu-ing drags on the economy for some time to come.
The effects of these structural adjustments were aggravated byexternal events. The Iraqi invasion of Kuwait in August 1990caused world oil prices to double. This oil price shock was a furtherdrag on growth in the United States and other oil-importing indus-trial economies. Economic slowdowns that developed in some for-eign countries made economic recovery in the United States moredifficult by reducing demand for U.S. exports.
The Oil Price ShockIn the wake of the Iraqi invasion, the world price of oil soared,
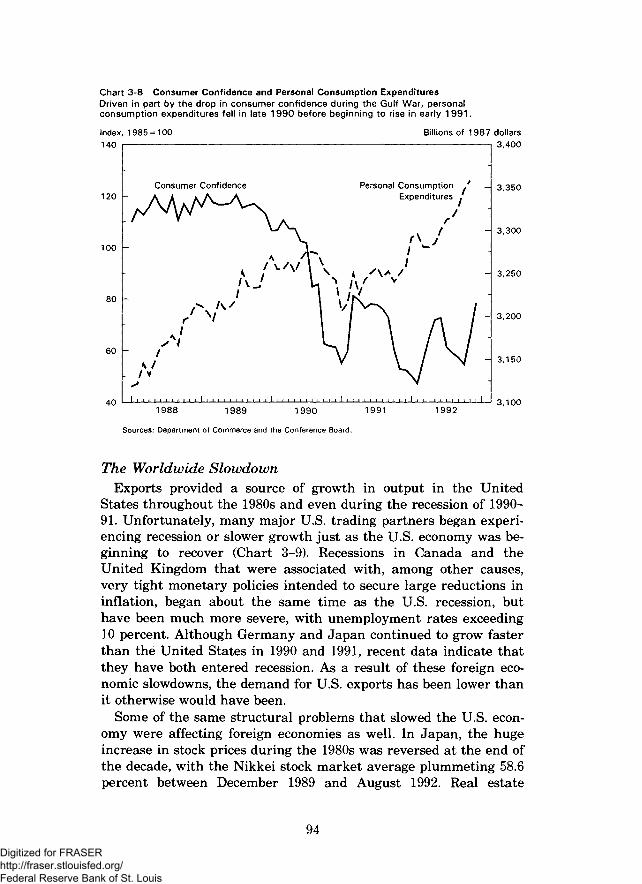
roughly doubling between July and October 1990. Consumer andbusiness confidence plummeted, reflecting uncertainty about thestandoff in the Persian Gulf. In October 1990 the ConferenceBoard's index of consumer confidence reached its lowest level since1974 (Chart 3-8). In an uncertain environment, it is natural forfirms to postpone spending until they begin to feel more confidentabout the future. Similarly, many households postpone purchasingbig-ticket items until they have solid information about their ownemployment situation. Oil price increases also disrupt the produc-tion process as firms seek to economize on energy.
Real output in the economy declined in the third and fourthquarters of 1990 and the first quarter of 1991. Civilian nonagricul-tural employment peaked at just over 115 million in May 1990 andthen fell gradually below 114 million by January 1991. The oil priceshock put upward pressure on energy prices, but weak demandmuted the impact on other prices. The annual rate of core inflationrose by less than one-half percentage point between the first andsecond half of 1990.
As the Persian Gulf conflict was resolved, oil prices fell back topre-crisis levels and consumer and business confidence increasedsharply. These developments led to a sudden burst of consumerspending (Chart 3-8) and gains in production. The short-lived eu-phoria after the Persian Gulf crisis was not sufficient to generate astrong recovery, however, because the structural problems had notbeen satisfactorily resolved. Debt burdens remained high, commer-cial and industrial lending were declining, and it became apparentthat defense reductions would accelerate due to marked changes inthe relationship between the United States and the Soviet Union.
Although real output began to grow again in the second quarterof 1991, employment hovered between 113 and 114 million for therest of the year. Output grew slowly, but only because output perworker increased; employment changed little.
93334-230 0—92 4 (QL3)Digitized for FRASER
http://fraser.stlouisfed.org/ Federal Reserve Bank of St. Louis
Consumer Confidence
W/v
, , |
f\/\
1 , , , ,
Personal ConsumptionExpenditures
r*
/ "/
•
Chart 3-8 Consumer Confidence and Personal Consumption ExpendituresDriven in part by the drop in consumer confidence during the Gulf War, personalconsumption expenditures fell in late 1990 before beginning to rise in early 1991.
Index, 1985 = 100 Billions of 1987 dollars140 | 1 3,400
- 3,350120 h
- 3,300V f\ J
100 (-A / r \ /
/ v / \ / i v '-\ 3,250
80 h
-A 3,200
60 -H 3,150
4 Q I I i i i i i i i i i i i I i i i i i i i i i i i I i i i i i i i i i i, i I i i i i i i i i i i i I i i i i i i i i i ,i i I I 3 1 0 0
1988 1989 1990 1991 1992
Sources: Department of Commerce and the Conference Board.
The Worldwide SlowdownExports provided a source of growth in output in the United
States throughout the 1980s and even during the recession of 1990-91. Unfortunately, many major U.S. trading partners began experi-encing recession or slower growth just as the U.S. economy was be-ginning to recover (Chart 3-9). Recessions in Canada and theUnited Kingdom that were associated with, among other causes,very tight monetary policies intended to secure large reductions ininflation, began about the same time as the U.S. recession, buthave been much more severe, with unemployment rates exceeding10 percent. Although Germany and Japan continued to grow fasterthan the United States in 1990 and 1991, recent data indicate thatthey have both entered recession. As a result of these foreign eco-nomic slowdowns, the demand for U.S. exports has been lower thanit otherwise would have been.
Some of the same structural problems that slowed the U.S. econ-omy were affecting foreign economies as well. In Japan, the hugeincrease in stock prices during the 1980s was reversed at the end ofthe decade, with the Nikkei stock market average plummeting 58.6percent between December 1989 and August 1992. Real estate
94
Digitized for FRASER http://fraser.stlouisfed.org/ Federal Reserve Bank of St. Louis
Chart 3-9 International Real GDP GrowthAs the U.S. economy began to recover, output growth in Germany and Japan weakenedconsiderably.
Percent change, IV/IV8
1988 1989 1990 1991 1992
|Q4 U.S. B Germany ^ J a P a n I I U-K- L J CanadaNote: Data for Japan and Germany are for GNP. Changes for 1992 are 1992.111/1991.IV at an annual rate.Sources: Organization for Economic Cooperation and Development and The Economist.
prices also fell: Residential land prices in the six largest cities de-creased 20.6 percent from the second half of 1990 to the first half of1992. These developments may depress Japanese spending by low-ering household wealth and could constrain lending since manyloans are collateralized with real estate. The Japanese slowdownappears to be worsening; output declined 0.4 percent in the thirdquarter of 1992.
Germany has had to confront the high costs of unification. Gov-ernment spending on income assistance programs has soared sinceeast and west were united in 1990, putting upward pressure onboth output and prices. Union wage demands have exceeded pro-ductivity growth, putting more upward pressure on costs andprices. Fearing an increase in inflation, the Bundesbank (Germa-ny's central bank) pursued a tight monetary policy, forcing otherEuropean countries to adopt tighter monetary policies in order tomaintain parities under the European Monetary System. Outputgrowth has slowed significantly throughout Europe in recent years.
Recent DevelopmentsAs indicated in Chapter 2, the U.S. economy has made modest
improvements over the past year. Output has grown in each quar-
95Digitized for FRASER http://fraser.stlouisfed.org/ Federal Reserve Bank of St. Louis
ter since the first quarter of 1991, although the somewhat erraticgrowth has been insufficient to support substantial increases inemployment. Meanwhile, the rate of core inflation has fallen tolevels not seen in this country for 20 years. These recent develop-ments, viewed against the backdrop of the structural adjustmentsand external shocks that have affected the economy, provide thecontext in which recent policy choices must be evaluated.
SUMMARY• Output grew rapidly during 1982-86, but the development of a
relatively large Federal budget deficit during this periodplaced constraints on fiscal policy.
• Although inflation was reduced dramatically at the beginningof the 1980s, the Fed became concerned about a possible resur-gence in 1988, leading to the adoption of a more restrictivemonetary policy.
• Many structural imbalances were contributing to a slowdownin growth by mid-1990, including problems in financial mar-kets, heavy debt burdens, the defense drawdown, industry re-structuring, commercial overbuilding, and State and local gov-ernment budget problems.
• The oil shock contributed to a recession beginning in thesummer of 1990. The persistence of several structural problemsand the slowdown in foreign economies weakened the recovery.
THE CHANNELS OF MONETARY POLICY
The goals and limitations of monetary policy can be best under-stood by first considering the basic channels through which mone-tary policy operates. Monetary policy is conducted by the FederalReserve System (the Fed), which is the central bank of the UnitedStates. The Full Employment and Balanced Growth Act of 1978 di-rects the Fed to set ranges for the growth of monetary and creditaggregates (the money supply) taking into account "past and pro-spective developments in employment, unemployment, production,investment, real income, productivity, international trade and pay-ments, and prices." The Fed is also responsible for maintaining theorderly functioning of the payments system and is one of severalFederal banking regulators.
The Fed, whose 7 governors are chosen by the President with theconsent of the Congress to serve staggered 14-year terms, is inde-pendent in the sense that its decisions do not have to be ratified byeither the Administration or the Congress. This independent statusallows the Fed to pursue the goal of low and stable inflation moreeffectively (Box 3-2). Nevertheless, the Fed sets policies that reflect
96Digitized for FRASER http://fraser.stlouisfed.org/ Federal Reserve Bank of St. Louis
the government's overall policy objectives and makes periodic re-ports to the Congress.
Box 3-2.—The Merits of an Independent Central Bank
An independent central bank is one important component ofthe American political system of checks and balances. Studieshave shown that since World War II, countries with independ-ent central banks have had lower and more stable inflationrates- For instance, between 1955 and 1988, Italy, New Zea-land, and Spain, which had the least independent centralbanks, had average inflation rates of 7 J, 7*8, and 8.5 percent,respectively. In comparison, Germany and Switzerland, whichhad the most independent central banks, had average inflationrates of 3.0 and 3J2 percent, respectively. Their lower inflationrates did not come at the expense of reduced real output Infact, the average growth rate of real GDP appears to be unre-lated to the central bank's degree of independence.
Why are independent central banks more successful atavoiding inflation? The main reason is that an independentcentral bank is less vulnerable to short-term political pressuresto inflate than are those with closer links to the government.Particularly during recessions, governments may try to rely onan overly expansionary monetary policy to hasten a recovery.Of course, it sometimes appears that a central bank shouldhave chosen a different course. But such isolated incidences donot justify reducing central bank autonomy. The relevant ques-tion is whether, on balance, allowing the Congress or the Ad-ministration to set monetary policy would result in better eco-nomic performance. The weight of evidence suggests that itwould not.
SHORT-TERM EFFECTS OF MONETARY POLICY
In setting monetary policy, the Fed states its objectives in termsof targets for short-term interest rates and target ranges for thegrowth rate of several measures of the money supply. Short-terminterest rate targets are called "operating targets" because the Fedmonitors interest rates almost continuously and generally canexert a high degree of control over them.
Interest and Exchange RatesThe Fed most frequently uses open market operations to influ-
ence short-term interest rates and credit conditions. To put down-ward pressure on interest rates, it buys U.S. Treasury securities inthe open market. The increased demand for securities causes theirprices to rise, or equivalently, their rates of return to fall. In
97
Digitized for FRASER http://fraser.stlouisfed.org/ Federal Reserve Bank of St. Louis
paying for these purchases, the Fed increases the monetary base—the money financial institutions have on deposit at the Fed plusthe currency in circulation.
While lower interest rates tend to stimulate spending on aver-age, some groups cut spending in response to lower rates. Lowerrates benefit borrowers but hurt savers. For example, senior citi-zens living off interest income from their savings suffer when inter-est rates fall.
As well as spurring increased domestic investment and spending,lower interest rates tend to increase demand by lowering the ex-change value of the dollar. Lower U.S. interest rates encourage in-vestment to be shifted to other countries where rates of return arehigher, causing demand for U.S. dollars to drop and reducing thedollar's exchange value against foreign currencies. U.S, goodsbecome cheaper for foreigners, encouraging U.S. exports, and for-eign goods become more expensive for Americans, encouraging con-sumption of domestic products.
LONG-TERM CONSEQUENCES OF MONETARY POLICY
Expansionary policies increase nominal GDP, which is the totaldollar value of goods and services produced in a year. Because thechange in nominal GDP is the sum of the change in the price leveland the change in the quantity of real output, an increase in nomi-nal GDP may reflect higher output, higher prices, or a combinationof the two. When the Fed pursues an expansionary monetarypolicy, the hope is, of course, to increase real output rather thaninflation.
As discussed earlier, in response to an increase in demand firmstend, on average, to increase production when they have excess ca-pacity and to increase prices when production approaches capacity.In a recession, many firms find themselves with excess capacity, sothat monetary expansion is likely to show up predominantly as anincrease in output. The closer the economy is to its capacity, themore likely it is that an increase in aggregate demand will in-crease inflation. But because monetary policy has long and variablelags, excessively high money growth today may not show up as in-flation for many months or even years.
Monetary policy affects both current and future interest rates, inpart because it affects people's expectations about future inflation.Distinguishing between real and nominal interest rates is essentialto understand the effect of inflation on interest rates (Box 3-3),Nominal, or market, interest rates increase with the rate of antici-pated inflation. Although the Fed may be able to temporarilyreduce short-term interest rates by adding reserves to the bankingsystem, this action may cause an increase in inflationary expecta-tions that results in higher short-term interest rates in the future.
98
Digitized for FRASER http://fraser.stlouisfed.org/ Federal Reserve Bank of St. Louis
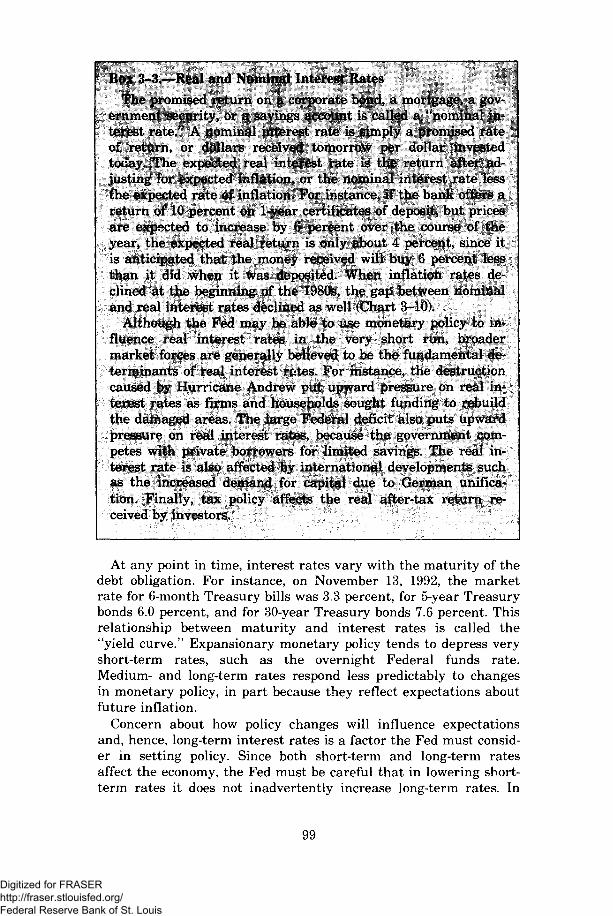
Box 3-3.—Real and Nominal Interest BatesThe promised return on a corporate bond, a mortgage, a gov-
ernment security, or a savings account is called a "nominal in-terest rate/* A nominal interest rate is simply a promised rateof return, or dollars received tomorrow per dollar investedtoday. The expected real interest rate is the return after ad-justing for expected inflation, or the nominal interest rate lessthe expected rate of inflation. For instance, if the bank offers areturn of 10 percent on 1-year certificates of deposit, but pricesare expected to increase by 6 percent over the course of theyear, the expected real return is only about 4 percent, since itis anticipated that the money received will buy 6 percent lessthan it did when it was deposited. When inflation rates de-clined at the beginning of the 1980s, the gap between nominaland real interest rates declined as well (Chart 3-10),
Although the Fed may be able to use monetary policy to in-fluence real interest rates in the very short run, broadermarket forces are generally believed to be the fundamental de-terminants of real interest rates. For instance, the destructioncaused by Hurricane Andrew put upward pressure on real in-terest rates as firms and households sought funding to rebuildthe damaged areas. The large Federal deficit also puts upwardpressure on real interest rates, because the government com-petes with private borrowers for limited savings. The real in-terest rate is also affected by international developments suchas the increased demand for capital due to German unifica-tion. Finally, tax policy affects the real after-tax return re-ceived by investors.
At any point in time, interest rates vary with the maturity of thedebt obligation. For instance, on November 13, 1992, the marketrate for 6-month Treasury bills was 3.3 percent, for 5-year Treasurybonds 6.0 percent, and for 30-year Treasury bonds 7.6 percent. Thisrelationship between maturity and interest rates is called the"yield curve." Expansionary monetary policy tends to depress veryshort-term rates, such as the overnight Federal funds rate.Medium- and long-term rates respond less predictably to changesin monetary policy, in part because they reflect expectations aboutfuture inflation.
Concern about how policy changes will influence expectationsand, hence, long-term interest rates is a factor the Fed must consid-er in setting policy. Since both short-term and long-term ratesaffect the economy, the Fed must be careful that in lowering short-term rates it does not inadvertently increase long-term rates. In
99
Digitized for FRASER http://fraser.stlouisfed.org/ Federal Reserve Bank of St. Louis

Chart 3-10 Real and Nominal 3-Month T-Bill RatesThe real rate of interest is approximately equal to the nominal 3-month T-Bill rate minusthe inflation rate as measured by the consumer price index.
Percent per year15
10
-51970 1972 1974 1976 1978 1980 1982 1984 1986 1988 1990Note: T-biil rates are for secondary market. Inflation defined as annual change in CPI-U.Sources: Department of Labor and Board of Governors of the Federal Reserve System.
fact, over the last 3 years, virtually every time the Fed lowered theshort-term Federal funds rate, long-term interest rates either de-clined or were unchanged, although the declines in long-term rateswere substantially less than the declines in short-term rates.
Some observers focus almost exclusively on relatively high long-term interest rates as the reason for the limited effectiveness of therecent loosening of monetary policy. Since November 1990, the Fed-eral funds rate has fallen by 4.7 percentage points, while the 10-year Treasury bond rate has fallen by only 1.8 percentage points.The relatively high long-term rates may slow the growth of long-term business investments and mortgage borrowing. On the otherhand, evidence suggests that many borrowers easily substituteshort-term financing for long-term debt. For instance, many firmsfinance a large proportion of their capital expenditures with short-term bank debt, and many families now finance their homes withadjustable rate mortgages. Furthermore, at the beginning of pastrecoveries, relatively high long-term rates did not appear to dis-courage increased investment spending. For these reasons, it isdoubtful that the weaker-than-expected demand for credit is dueexclusively to the level of long-term rates.
100
Digitized for FRASER http://fraser.stlouisfed.org/ Federal Reserve Bank of St. Louis
INDICATORS OF MONETARY POLICYThe Fed uses several measures, or monetary aggregates, to quan-
tify what is popularly called money. The monetary base, or MO, isthe only monetary aggregate that can be controlled with precisionthrough open market operations. In setting target ranges formoney growth rates, the Fed focuses on several broader aggregates.Until 1982 the Fed's primary target was Ml, the funds generallyused for transactions, including currency in circulation, checkingaccounts, and travelers checks. Since 1982, the primary monetarytarget has been M2—Ml plus a number of short-term financialassets such as savings accounts.
Monetary aggregates are "intermediate targets." Unlike operat-ing targets such as short-term interest rates, monetary targets areadjusted infrequently. They are intermediate to more fundamentalgoals such as maintaining a low and stable inflation rate. An im-portant consideration in choosing a monetary target is whether itexhibits a predictable relationship with nominal GDP; that is, apredictable velocity. The velocity of money is the ratio of nominalGDP to the money stock. Velocity measures the average number oftimes the money stock is spent each year in generating the trans-actions that constitute nominal GDP. If velocity were perfectly pre-dictable for a monetary aggregate under Fed control, then the Fedcould set the growth rate of nominal GDP.
In addition to interest rates and monetary aggregates, the Fedrelies on many other types of information to judge whether itspolicy is having the intended effect, including exchange rates, theunemployment rate, the level of inventories, the capacity utiliza-tion rate, commodity prices, and changes in the price level. Statisti-cal data that provide information about the current situation andthe effects of past policies also provide some insight into the future.For instance, an increase in inventories often reflects a cutback insales and signals a fall in future production, and gold prices andlong-term interest rates reflect the market's expectations about in-flation. Unfortunately, no perfect indicator or set of indicatorsexists that can accurately predict the future consequences of cur-rent policies under all circumstances.
SUMMARY• In the short run, the Fed can use monetary policy to increase
the availability of credit and to lower interest rates. In thelong run, an excessively expansionary monetary policy willlead to inflation and higher nominal interest rates.
• Interest rates, monetary aggregates, and many other indicatorshelp the Fed assess the effects of its actions. No set of indica-tors, however, provides a reliable forecast of the future conse-quences of current policy choices.
101Digitized for FRASER http://fraser.stlouisfed.org/ Federal Reserve Bank of St. Louis

MONETARY POLICY SINCE 1970
An important indicator of Fed policy is the growth rate of mone-tary aggregates, although these do not always move together overtime (Chart 3-11). Prior to 1982 the Fed's primary target was Mlbut since then it has dropped its Ml target and focused on M2. Thereason is clear from Chart 3-12: After a steady increase, the veloci-ty of Ml dropped sharply in 1981 and became much more variable,making its relationship with nominal GDP much less predictable.The velocity of M2, on the other hand, has generally been morepredictable, although its velocity also dropped sharply in 1980-82.
Starting in late 1979 the Fed made a strong commitment to re-ducing inflation. Although monetary policy was perceived as tightduring this period, in fact the growth rates of both Ml and M2were approximately the same as they had been in the late 1970s(Chart 3-11). This episode illustrates that monetary policy cannotbe evaluated simply by looking at the growth rate of the moneysupply in the abstract; rather, it must be evaluated relative to thecurrent economic situation. Given that the economy was in themidst of a sharp recession during this period, some would arguethat, by maintaining the previous growth rate of money, the Fedwas running a tight policy.
As mentioned earlier, fear of growing inflationary pressure inthe late 1980s led the Fed to try to engineer a soft landing. To dothis, the Fed had to balance the risk that reducing the growth rateof money would increase the chances of a recession against the riskthat maintaining money growth at the same rate would increaseinflation. Starting in early 1988, the Fed began to raise short-terminterest rates. The target growth range for M2 was revised down-ward in 1989, and its growth rate often remained near the bottomof the target range and sometimes even below it (Chart 3-13). Asinflationary pressures eased and inflation in fact declined in a softeconomy, the Fed cut short-term interest rates gradually from mid-1989 to late 1990 and then cut rates more aggressively, for a cumu-lative decline of about 4 percentage points since December 1990.
Some have argued that the Fed's policy in these years was theprimary cause of the most recent recession and slow recovery, butthis conclusion appears to be unwarranted. Although a somewhatmore expansionary policy may have been appropriate during therecession and early in the recovery, many other factors—some un-foreseeable, others of a severity and duration that would have beenhard to predict—were acting as a drag on the economy. Further-more, the fact that the growth of M2 remained at the low end ofthe target range came as somewhat of a surprise to the Fed. FromJanuary 1991 to October 1992, Ml grew at an annual rate of 12.0percent, but M2 lagged behind, growing at an annual rate of only
102Digitized for FRASER http://fraser.stlouisfed.org/ Federal Reserve Bank of St. Louis

Chart 3-11 Growth Rates of Monetary AggregatesThe growth rates of the various monetary aggregates are quite variable. In the past 2years, M1 growth has accelerated, while M2 growth has declined.
Percent change, 4-quarter moving average
15 -
10 -
-5
_
/ M /
- ft' S"- .-• / v
I.,.11,. 1., , 1 . , 11...1..
A/1 v
MO
i
/ V
M2
\\
\
h i i l
M1
•.. I . . .
AyJini /
f
.., i.,,
/
Ai i
/ i# i
V i
v\\V-.
VI
i
i
i
. 1 1 1 .
/
/ i f
A*'5 - .-"
1970 1972 1974 1976 1978 1980 1982 1984 1986 1988 1990 1992
Source: Board of Governors of the Federal Reserve System.
Chart 3-12 Velocities of Monetary Aggregates, 1970-92In the early 1980s, the predictability of the relationship between M1 and GDP weakenedsignificantly. As a result, M2 became the Federal Reserve's primary monetary target.
Index, 1970=100160
150
140
130
120
110
100
90
80
/ \
M1 Velocity . ' *\ /
1970 1972 1974 1976 1978 1980 1982 1984 1986 1988 1990 1992
Sources: Department of Commerce and Board of Governors of the Federal Reserve System.
103Digitized for FRASER http://fraser.stlouisfed.org/ Federal Reserve Bank of St. Louis
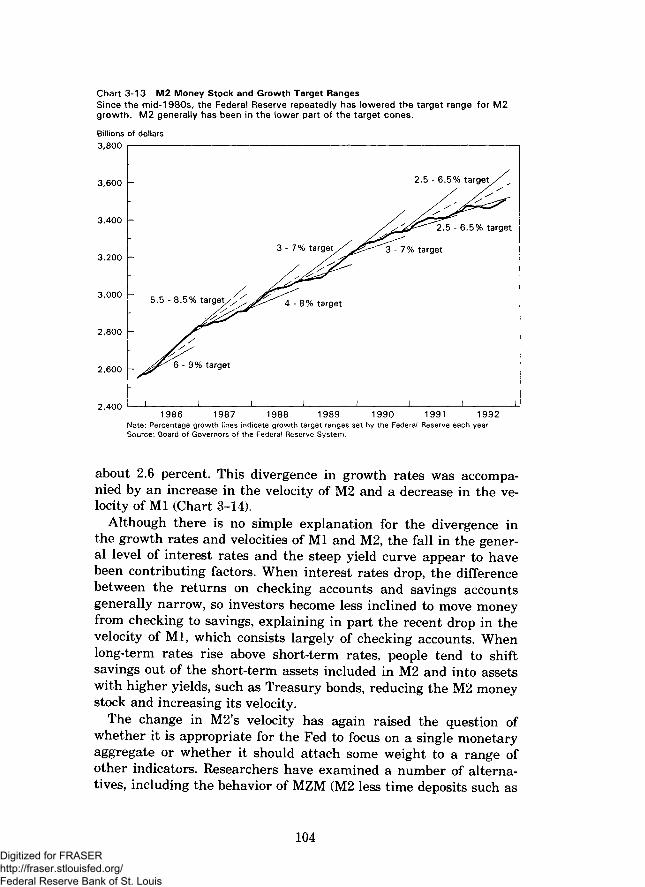
Chart 3-13 M2 Money Stock and Growth Target RangesSince the mid-1980s, the Federal Reserve repeatedly has lowered the target range for M2growth. M2 generally has been in the lower part of the target cones.
Billions of dollars
o,ouu
3,600
3,400
3,200
3,000
2,800
2,600
-
-
5.5 - 8.5% t a r g e t / X ^ ^
^ ^ t 3 - 9% target
I ! !
3-7% t a r g e t / l ^
^ 4 - 8 % target
I i
2.5 -6
3 - 7 % target
i
5% target / ^
5-6.5% target
I i1986 1987 1988 1989 1990 1991 1992
Note: Percentage growth iines indicate growth target ranges set by the Federal Reserve each year.Source: Board of Governors of the Federal Reserve System.
about 2.6 percent. This divergence in growth rates was accompa-nied by an increase in the velocity of M2 and a decrease in the ve-locity of Ml (Chart 3-14).
Although there is no simple explanation for the divergence inthe growth rates and velocities of Ml and M2, the fall in the gener-al level of interest rates and the steep yield curve appear to havebeen contributing factors. When interest rates drop, the differencebetween the returns on checking accounts and savings accountsgenerally narrow, so investors become less inclined to move moneyfrom checking to savings, explaining in part the recent drop in thevelocity of Ml, which consists largely of checking accounts. Whenlong-term rates rise above short-term rates, people tend to shiftsavings out of the short-term assets included in M2 and into assetswith higher yields, such as Treasury bonds, reducing the M2 moneystock and increasing its velocity.
The change in M2's velocity has again raised the question ofwhether it is appropriate for the Fed to focus on a single monetaryaggregate or whether it should attach some weight to a range ofother indicators. Researchers have examined a number of alterna-tives, including the behavior of MZM (M2 less time deposits such as
104Digitized for FRASER http://fraser.stlouisfed.org/ Federal Reserve Bank of St. Louis
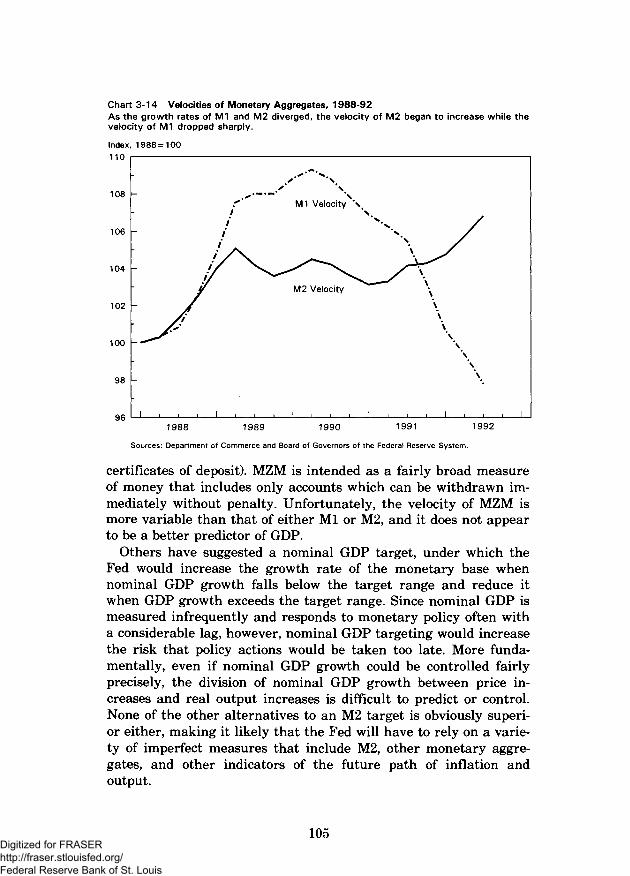
Chart 3-14 Velocities of Monetary Aggregates, 1988-92As the growth rates of M1 and M2 diverged, the velocity of M2 began to increase while thevelocity of M1 dropped sharply.
Index, 1988 = 100110
108
106
104
102
100
98
96 I • , , I , , , I , i , I , , , I
1988 1989 1990 1991 1992
Sources: Department of Commerce and Board of Governors of the Federal Reserve System.
certificates of deposit). MZM is intended as a fairly broad measureof money that includes only accounts which can be withdrawn im-mediately without penalty. Unfortunately, the velocity of MZM ismore variable than that of either Ml or M2, and it does not appearto be a better predictor of GDP.
Others have suggested a nominal GDP target, under which theFed would increase the growth rate of the monetary base whennominal GDP growth falls below the target range and reduce itwhen GDP growth exceeds the target range. Since nominal GDP ismeasured infrequently and responds to monetary policy often witha considerable lag, however, nominal GDP targeting would increasethe risk that policy actions would be taken too late. More funda-mentally, even if nominal GDP growth could be controlled fairlyprecisely, the division of nominal GDP growth between price in-creases and real output increases is difficult to predict or control.None of the other alternatives to an M2 target is obviously superi-or either, making it likely that the Fed will have to rely on a varie-ty of imperfect measures that include M2, other monetary aggre-gates, and other indicators of the future path of inflation andoutput.
105Digitized for FRASER http://fraser.stlouisfed.org/ Federal Reserve Bank of St. Louis
RECENT COMPLICATIONS FOR MONETARY POLICYHow much and how quickly spending increases in response to
lower interest rates depends on a number of factors, most of whichare beyond the Fed's control. Although short-term interest rateshave fallen a total of about 4 percentage points since December1990, demand has grown at a disappointingly weak pace for most ofthis period.
A number of factors appear to have tempered the response to in-terest rate cuts in the last few years relative to previous recoveries.Despite lower market interest rates, borrowers had difficulty ob-taining loans because of the troubled condition of many financialinstitutions. The high business and household debt levels accumu-lated in the 1980s weakened demand for new borrowing. The cap-ital-intensive sectors that usually respond most rapidly to interestrate reductions were beset by other problems that hamperedgrowth. In particular, the excess supply of and high vacancy ratesin commercial real estate damped the demand for new buildings,and a slowdown in the rate of household formation lowered thedemand for residential construction. As a result, it appears thatlower interest rates have so far failed to generate as much newspending as expected. Firms and households have benefited fromlower rates, however, as interest burdens have been reduced byrecord levels of refinancing of corporate debt and mortgages in thelast few years.
While problems such as the credit crunch and overbuilding arelikely to diminish over time as the economy adjusts, other develop-ments may have a more lasting impact on the effectiveness andchannels of monetary policy. One such development is the in-creased integration of world capital markets.
First, monetary policy cannot control interest rates and ex-change rates independently because the two are interrelated. De-creases in U.S. interest rates lower the dollar's value as investorsseek higher returns in other countries. In the early 1980s, our rela-tively tight monetary policy was one of the factors that strength-ened the dollar. Now, the tough anti-inflationary policies of theGerman Bundesbank have had the effect of strengthening the deut-sche mark and the currencies linked to it. These exchange-rateswings may lead to unwanted effects on both the balance of tradeand price levels, limiting monetary policy options. For instance, asharp appreciation of the dollar could raise the trade deficit andcause job losses in export-producing and import-competing indus-tries.
Second, as capital markets become more integrated, capital tendsto flow more quickly into those countries that offer the highest rateof return. The Fed has an increasingly limited ability to controlreal U.S. interest rates, since attempts to unilaterally lower rates
106
Digitized for FRASER http://fraser.stlouisfed.org/ Federal Reserve Bank of St. Louis
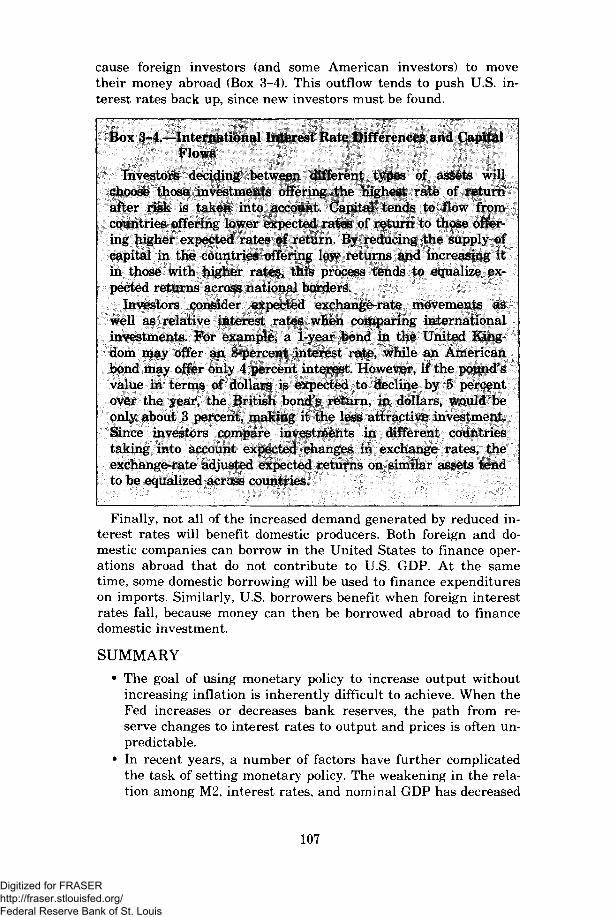
cause foreign investors (and some American investors) to movetheir money abroad (Box 3-4). This outflow tends to push U.S. in-terest rates back up, since new investors must be found.
Box 3-4.—International Interest Rate Differences and CapitalFlows
Investors deciding between different types of assets willchoose those investments offering the highest rate of returnafter risk is taken into account Capital tends to flow fromcountries offering lower expected rates of return to those offer-ing higher expected rates of return. By reducing the supply ofcapital in the countries offering low returns and increasing itin those with higher rates, this process tends to equalize ex-pected returns across national borders*
Investors consider expected exchange-rate movements aswell as relative interest rates when comparing internationalinvestments. For example, a 1-year bond in the United King-dom may offer an 8-percent interest rate, while an Americanbond may offer only 4 percent interest. However, if the pound'svalue in terms of dollars is expected to decline by 5 percentover the year, the British bond's return, in dollars, would beonly about 3 percent, making it the less attractive investment.Since investors compare investments in different countriestaking into account expected changes in exchange rates, theexchange-rate adjusted expected returns on similar assets tendto be equalized across countries.
Finally, not all of the increased demand generated by reduced in-terest rates will benefit domestic producers. Both foreign and do-mestic companies can borrow in the United States to finance oper-ations abroad that do not contribute to U.S. GDP. At the sametime, some domestic borrowing will be used to finance expenditureson imports. Similarly, U.S. borrowers benefit when foreign interestrates fall, because money can then be borrowed abroad to financedomestic investment.
SUMMARY
• The goal of using monetary policy to increase output withoutincreasing inflation is inherently difficult to achieve. When theFed increases or decreases bank reserves, the path from re-serve changes to interest rates to output and prices is often un-predictable.
• In recent years, a number of factors have further complicatedthe task of setting monetary policy. The weakening in the rela-tion among M2, interest rates, and nominal GDP has decreased
107
Digitized for FRASER http://fraser.stlouisfed.org/ Federal Reserve Bank of St. Louis
the reliability of monetary aggregates as indicators of policy,at least in the recent period.
• Transitory problems in financial markets and structuralchanges in the global economy have altered the response of theU.S. economy to the Fed's policies.
FISCAL POLICY
In light of the economy's performance over the last 2 years, it isnatural to ask what role Federal fiscal policy played in the reces-sion and slow recovery. Was policy in part responsible for the pooreconomic performance, or did policy make the economy strongerthan it otherwise would have been?
TOOLS OF FISCAL POLICY
As mentioned earlier, fiscal policy refers to changes in Federalspending and the tax system that influence demand and incentivesto work, save, and invest. Federal purchases of goods and services,which make up nearly 8 percent of GDP, contribute directly tototal spending. Changes in transfer payments and income taxesaffect spending indirectly through their impact on disposable (after-tax) income. Since households typically save a portion of additionalincome, their spending tends to change by less than their dispos-able income. Consequently, changes in transfers and taxes affecttotal spending less than changes in purchases of an equal magni-tude.
The Federal budget distinguishes between two main types of ex-penditures: mandatory and discretionary. Nearly all mandatoryspending is in the form of "entitlements," or programs such asmedicaid, medicare, and unemployment insurance which use presetcriteria to determine eligibility and benefit levels. Discretionaryspending, on the other hand, refers to government spending thatrequires annual budget appropriations. The distinction is impor-tant for fiscal policy, because short-term changes in mandatoryspending are heavily affected by short-term economic conditions,
Automatic StabilizersDiscussions of fiscal policy often divide Federal taxing and spend-
ing activities into two kinds: automatic stabilizers and discretion-ary policy. Automatic stabilizers act as buffers when the economyweakens by automatically reducing taxes and increasing govern-ment spending. Mandatory spending for programs such as unem-ployment insurance, food stamps, welfare programs, and medicaidincreases when the economy slows down since benefit criteriadepend on income or employment status. These transfer paymentshelp consumers maintain spending.
108
Digitized for FRASER http://fraser.stlouisfed.org/ Federal Reserve Bank of St. Louis
The tax system as a whole also acts as an automatic stabilizer. Inan economic slump, personal income and corporate profits arelower, so tax payments fall, helping to reduce the decline in after-tax incomes that would otherwise occur. Likewise, government rev-enues from excise and other sales-based taxes fall when purchasesdecline. In fact, taxes typically change by a larger proportion thanGDP, primarily because average income tax rates fall with incomelevels. This feature of the tax system makes after-tax income morestable than pretax income, which helps insulate consumptionspending from changes in income.
Discretionary Fiscal PolicyDiscretionary fiscal policy refers to changes in discretionary
spending and new tax legislation. Many classic examples of discre-tionary fiscal policy are new tax initiatives. For example, tax cutsin 1964 were intended to stimulate spending and economic expan-sion, while the income tax surcharge of 1968 was designed to curbrising inflation.
Since the change in total annual expenditures determines wheth-er policy has been expansionary or contractionary, it is difficult toattribute expansionary fiscal policy to specific acts of spending. Forexample, increased spending on highways in a given year is expan- *sionary only if it is not offset by a decline in some other part of theannual appropriations. Nonetheless, changes in discretionaryspending have potentially significant effects on the economy, asevidenced by the economic responses to the defense buildups anddrawdowns over the past 50 years.
RECENT BEHAVIOR OF EXPENDITURES AND TAXRECEIPTS
While expansionary and contractionary policies are easy to de-scribe, they are difficult to measure. Automatic stabilizers causethe Federal budget deficit to rise during recessions and fall duringexpansions, even without discretionary fiscal actions. For this andother reasons discussed in Chapter 6, changes in the budget deficitare an imperfect measure of discretionary fiscal policy.
More than in the past, large Federal budget deficits and budgetproblems at the State and local levels have constrained fiscalpolicy. Real Federal purchases, which fell 0.8 percent during therecent recession and recovery, rose an average of 2.1 percentduring earlier recessions and recoveries (Chart 3-15). Real Federalpurchases have fallen only once before during a similar businesscycle phase—the recession and recovery of 1969-71—and then by amuch greater amount, 15.4 percent. In both cases, defense draw-downs were occurring; recently because of the end of the Cold War,and earlier because of the winding down of the Vietnam conflict.
109Digitized for FRASER http://fraser.stlouisfed.org/ Federal Reserve Bank of St. Louis

Real defense purchases fell by 4.2 percent during the recent period,well below the decline of 20.3 percent during 1969-71.
Chart 3-15 Real Federal Spending and Taxation in Recent RecoveriesDuring the recovery of 1991-92, Federal Government purchases and transfers did notincrease as much as they had in past recoveries.
Percent change40
1961-62 1970-71 1975-76 1980-81Recovery dates
1982-83 1991-92
g g Purchases [^/] Transfer Payments £\\] ReceiptsNote: National Income and Product Accounts basis. Change is from trough of recession to fourth quarter
of recovery.Source: Department of Commerce.
Federal nondefense purchases increased 8.6 percent in the recentperiod, almost twice the average for previous recessions and recov-eries. This increase only partially offset the defense cuts, however,since defense purchases are 2Vfe times the level of nondefense pur-chases. Increases in State and local government purchases, whichare about IV2 times greater than Federal purchases, were alsobelow average. Federal, State, and local government purchasescombined rose just over 1 percent during the recession and recov-ery of 1990-92—about 40 percent of the average increase during otherrecessions and recoveries since 1959. Federal transfers have alsogrown more slowly recently than they did during earlier slow-downs, but State and local transfers have grown at twice theirnormal rate. The combined change in transfer payments for alllevels of government during the recent period was 15.5 percent,compared to the 18.6 percent average increase during previous re-cessions.
While the bottom line is that recent fiscal policy has been lessexpansionary than fiscal policy during previous recessions andearly recoveries, it does not necessarily follow that more expansion-
110Digitized for FRASER http://fraser.stlouisfed.org/ Federal Reserve Bank of St. Louis
ary policies were either possible or desirable. Growing governmentexpenditures and large Federal budget deficits acted as a con-straint on traditional forms of fiscal stimulus.
THE BUDGET PROCESSThe budget process itself also limits the potential of fiscal policy
to stimulate the economy. Each January or February the Presidentsubmits a budget for the fiscal year beginning in October, with 13appropriations proposals for discretionary spending. Mandatoryprogram expenses and interest payments on outstanding debt donot require annual appropriations but are estimated in the budget.Both houses of the Congress make separate modifications to thePresident's proposal and then meet to resolve their differences onany appropriations bills. Once this is done, the House and Senatemust pass the appropriations bills and forward them to the Presi-dent to be signed into law or vetoed.
Because the Federal budget process begins well in advance ofactual spending, and because downturns are difficult to forecast,annual appropriations are usually not an effective means of fight-ing recessions. New legislation can be introduced to modify appro-priations during the fiscal year, but there may still be legislativedelays in the Congress and further delays between appropriationand actual expenditure. For example, government procurementprocedures can involve time-consuming regulations intended toensure fairness in contract awards. In contrast, monetary policychanges can be implemented more rapidly, since open market oper-ations do not require congressional action and the extended delaysit sometimes imposes.
Reducing growth in government expenditures and budget deficitswere important long-term objectives of this Administration's fiscalpolicy. Escalating government spending and budget deficits are be-lieved to be partly responsible for the decline in conventional meas-ures of national saving and investment rates during the 1980s.Modifications to the budget process introduced as part of the Omni-bus Budget Reconciliation Act of 1990, known as the Budget En-forcement Act (BEA), were intended to improve on the GRH andbring government spending and budget deficits under control. Likeany credible deficit reduction plan, however, the BEA restricted ex-pansionary countercyclical policy actions by placing constraints onnew mandatory spending programs, tax decreases, and all discre-tionary spending. These restrictions help explain the recent behav-ior of expenditures and receipts.
Absent special circumstances, the BEA requires that any newmandatory spending program be offset by some combination of de-creases in other mandatory spending programs or by a tax in-crease. Similarly, any tax bill projected to decrease total govern-
I l lDigitized for FRASER http://fraser.stlouisfed.org/ Federal Reserve Bank of St. Louis
ment revenue would trigger across-the-board spending cuts unlessit was matched by specific cuts in spending programs. These con-straints on new mandatory spending programs and tax initiativesare known as the "pay-as-you-go" provisions of the BE A.
A problem with these provisions is that the method used to esti-mate the effects of tax changes on revenues is very imprecise. Achange in tax law can cause a series of changes—often referred toas feedback effects—in the consumption, investment, and savingdecisions of individuals and firms. Current government methods ofestimating changes in revenue allow for a very narrow range offeedback effects. While a full accounting of the feedback effectsthat new tax proposals could have is currently impractical, the ab-sence of fully dynamic estimates has limited the usefulness of theestimating process in tax policy debates.
The BEA also established legally binding caps (adjusted for infla-tion and certain technical factors) that impose a "flexible freeze"on discretionary spending growth. Originally, separate caps prohib-ited transfers of funds across three categories of spending: domes-tic, defense, and international. These "firewalls" expire after fiscal1993, when a single cap will be applied to total discretionary spend-ing.
The discretionary spending caps and pay-as-you-go rules in theBEA are much more difficult to circumvent than the GRH budgetdeficit targets. The GRH required the Administration to estimatetotal receipts and expenditures at the start of the fiscal year to de-termine if the deficit would be below the target for the upcomingyear. However, it was not difficult to pass legislation later in theyear that increased the deficit. Another weakness of the GRH wasthat the deficit was estimated only for the upcoming year, so thatlegislation significantly increasing deficits in subsequent years didnot conflict with the provisions of the GRH. For the most part, theBEA solved both of these problems by requiring the Administrationto show, within days of its passage, whether legislation signed bythe President increased or decreased the deficit over both 1- and 5-year time horizons. Legislation that violated the BEA targets re-sulted in across-the-board spending cuts to restore compliance.
Although an effective deficit reduction plan necessarily requiresconstraints on fiscal expansion, the BEA does not eliminate expan-sionary actions completely. First, the automatic stabilizers implicitin mandatory spending programs and the tax code are allowed tooperate, since the BEA deficit targets are adjusted for changes inshort-run economic conditions. Second, the BEA constraints onpolicy changes can be waived under either of two conditions: (1) inthe event of a "low-growth scenario"—two consecutive quarters ofless than 1 percent growth or a forecast of two or more consecutivequarters without growth or (2) when the President declares an
112Digitized for FRASER http://fraser.stlouisfed.org/ Federal Reserve Bank of St. Louis
emergency (such as a weak economy that does not qualify as a low-growth scenario or humanitarian relief efforts). Finally, economicactivity can be stimulated by policy changes that strengthen eco-nomic incentives without increasing spending or reducing total re-ceipts, such as an appropriately designed reduction in capital gainstax rates.
LIMITATIONS OF COUNTERCYCLICAL FISCAL POLICYEven in the absence of procedural constraints, the ability of
countercyclical fiscal policy to stimulate a weak economy may belimited. The effect of changes in purchases, transfers, and taxes ontotal spending is complex and uncertain.
ExpectationsPeople's actions depend not only on their current situation but
also on their expectations for the future. For example, many peoplein their 50s and early 60s, anticipating retirement, save a largeshare of their incomes. Fiscal policy can affect people's behavior bychanging their current disposable income, but changes in spendingwill also depend on people's expectations about their future dispos-able income. For instance, a temporary income tax cut will affectconsumption less than a permanent cut. If people think a cut inincome tax rates will last, they are likely to respond by consumingmost of their additional after-tax income. They have little reason tosave more, because they expect the higher after-tax income to lastinto the future. But if they expect that a tax cut will soon bereversed, they may save most of their temporary windfall to spendwhen taxes rise again and their disposable income falls. Givencurrent concerns about large budget deficits, unless income tax cutsare linked to reductions in future government spending, people maybe more likely to believe any current tax cut will be offset by highertaxes in the future. If so, tax cuts will have little effect on currentspending.
People's expectations about the future can affect other tax initia-tives as well. For example, when the government introduces a tem-porary investment tax allowance, businesses have an incentive toshift investment expenditures to the period in which the temporarytax credit applies. In contrast to a cut in personal income taxes forfamilies—which will have little effect on spending if it is tempo-rary—an investment tax allowance will have a stronger short-runeffect if it is temporary. If businesses know the investment tax al-lowance is permanent, they have no reason to change the timing ofexpenditures. The long-term effects of a permanent investment taxcredit or more neutral depreciation are discussed in Chapter 6.
The amplified response to a temporary investment tax allowancemay appear to make it an excellent tool for fiscal policy. But therole of people's expectations in determining the response to an in-
113Digitized for FRASER http://fraser.stlouisfed.org/ Federal Reserve Bank of St. Louis
vestment tax allowance has far-reaching implications for policy.Once businesses know that an investment tax allowance is beingconsidered, they may defer investment spending so that they arebetter able to take advantage of the investment tax allowance at alater date. Similarly, if in the past the government has introduceda temporary investment tax allowance during recessions, peoplemay defer investment at the first hint of a slowdown in the future,hoping to benefit from another tax credit. This deferral of spendingmay exacerbate fluctuations in output.
Crowding OutChanges in government purchases may also have limited effects
on total spending. For example, if the appropriation for the con-struction of a new highway system is not accompanied by a corre-sponding increase in tax revenues, the budget deficit and govern-ment borrowing will increase. Increased government borrowingmay put upward pressure on interest rates and discourage invest-ment spending, offsetting at least part of the increase in totaldemand resulting from the construction project. This reduction inprivate investment associated with an increase in governmentspending is known as "crowding out."
How important is crowding out? Unfortunately, it is difficult todistinguish the effect of changes in government spending from themany other factors that influence interest rates and private invest-ment. At present, interest rates may be particularly sensitive tochanges in fiscal policy, raising concern about crowding out. Giventhe already large budget deficit, further increases in spending nowmay seriously undermine the credibility of fiscal policy and createexpectations of higher future deficits and tighter conditions incredit markets, resulting in higher long-term interest rates now.
Actions need not increase the current government budget deficitin order for crowding out to occur. Actions that make higher spend-ing more likely in the future may increase interest rates now, evenif they have no effect on current deficits. For example, if a lawpassed today increased government spending beginning in the year2000, expectations of tighter conditions in credit markets in thefuture could raise long-term interest rates and reduce investmenttoday.
Resource AllocationCountercyclical fiscal policies also have long-term effects on the
allocation of resources that should be taken into account. For ex-ample, policymakers may decide to construct a highway system tostimulate spending in an economic downturn. The benefits thehighway system will provide may not justify the costs incurred; ifthey did, the project should have been undertaken long before theidle resources provided additional incentive. History shows that, in
114Digitized for FRASER http://fraser.stlouisfed.org/ Federal Reserve Bank of St. Louis
a market economy, idle resources typically are brought back intouse in the private sector after a period of transition. And unlikegovernment projects, these private activities are sustainable only ifthey meet the stringent test of the market: sufficient consumerdemand to ensure that the value of the activity exceeds its cost. Ifa downturn is expected to be brief, relying on the safety net of un-employment insurance and other programs while waiting for idleresources to be brought back into private activities could maximizetheir economic value. If, on the other hand, a recession is expectedto be long or severe, there is a stronger case for short-run fiscalstimulus.
SUMMARY• Automatic stabilizers increase spending and reduce taxes auto-
matically when the economy weakens.• During the recent recession and recovery period, fiscal policy
appears to have been less expansionary than it was in previousrecession and recovery periods.
• The Budget Enforcement Act places constraints on spendinggrowth and tax reductions. Expansionary measures are limitedto automatic stabilizers, increases in spending or tax cuts thatare allowed under special circumstances, and initiatives thatincrease incentives.
• Factors such as expectations and crowding out increase uncer-tainty about the response of the economy to fiscal policy.Short-term stimulus is likely to be effective only in the eventof a downturn that is expected to be long-lived or severe.
WOULD DIFFERENT POLICIES HAVE HELPED?
During the past 4 years, the economy experienced a slowdown ingrowth in 1989, a recession in late 1990 and early 1991, and thenan unusually weak recovery beginning in March 1991. Only recent-ly has the economy shown sufficient vigor to reduce the unemploy-ment rate for several consecutive months. In light of this experi-ence, would earlier and more expansionary fiscal or monetary poli-cies have been desirable during the recession and early recovery?The answer, in our opinion, is a qualified yes. Given that many ofthe factors responsible for the slow growth in the U.S. economy—defense reductions, commercial overbuilding, and the slowdown inforeign economies—were expected to persist into the future, thereappeared to be little danger that inflation would rise as a result ofa moderately more expansionary policy, although it may well havefallen more slowly.
The conclusion that more stimulative policies would have beendesirable does not come simply with hindsight. The Administration
115Digitized for FRASER http://fraser.stlouisfed.org/ Federal Reserve Bank of St. Louis
proposed fiscal policies in early 1992 that would have provided amodest stimulus to the economy. These initiatives included unilat-eral measures such as a reduction in excess income tax withhold-ing and several proposals requiring congressional action, includinga temporary investment tax allowance to speed up spending onproductive assets, a temporary tax credit for first-time homebuyers,and a reduction in the tax rate on capital gains.
The Administration's proposals would have provided short-termstimulus to the weak economy primarily by using tax incentives toencourage business and residential investment. Reductions inexcess withholding taxes were intended to stimulate householdspending, while the temporary investment tax allowance wouldhave stimulated business investment. The cut in capital gains taxeswould have increased the value of capital assets and thus, wealth,thereby providing short-term stimulus to spending in addition tolong-term incentives for investment and entrepreneurship.
The Administration's proposals were designed to avoid increasingthe already large deficit. By emphasizing investment incentives,the fiscal proposals would have increased capital formation and thepotential for long-term growth. Unfortunately, only the unilateralmeasures were implemented, since the Congress did not pass thePresident's proposals in an acceptable form.
A fiscal plan with even stronger tax incentives merited consider-ation, subject to one very important condition—that legislativeaction (not just the development of general plans) be taken at thesame time to reduce both future government spending growth andfuture budget deficits. Any policy initiative had to take into ac-count both the short-term problem of recession and slow recoveryand the long-term problem of low productivity growth that is due,in part, to insufficient national saving and investment. While therecession could have provided an argument for short-term fiscal ex-pansion, such action would have been both less effective and inap-propriate if it had sacrificed long-term goals by increasing expecta-tions of future government spending and budget deficits.
Some have argued that, given the slow growth of M2 and theoverall weakness in the economy, monetary policy has been thepredominant cause of the recent recession and weak recovery. Asnoted earlier, a number of unforeseen problems complicated thetask of setting monetary policy. It is not clear to what extent theslow growth of M2 reflected inadequate expansion of the monetarybase, weak demand, or portfolio shifts away from the assets thatconstitute M2 (undermining its usefulness as an indicator of mone-tary policy).
While it would have been desirable for monetary policy to havebeen somewhat more expansionary than it in fact was during therecession and early recovery in order to further cushion the de-
116Digitized for FRASER http://fraser.stlouisfed.org/ Federal Reserve Bank of St. Louis
clines in output and employment, such a policy could have delayedprogress on reducing inflation. Furthermore, in the presence of un-certainty about the effectiveness of fiscal and monetary policytools, there are advantages to using both to reduce the uncertaintyabout the overall response of the economy. During this period, toomuch responsibility for strengthening the economy was left to mon-etary policy. Greater help from fiscal incentives, regulatory relief,and trade liberalization was needed.
Overall, it appears that recent fiscal and monetary policy havebeen less expansionary than in the typical postwar recession andearly recovery. It should be remembered, however, that in manycases past policies proved to be too expansionary and worsened in-flation in the subsequent recovery. Nonetheless, the weakness ofthe economy—indicated by both the fall in output during the reces-sion and the substantial decline in core inflation over the pastyear—and the prospects that the weakness would continue made acase for somewhat greater stimulus from fiscal and/or monetarypolicies during the recession and early recovery. Even perfect poli-cies probably could not have prevented a recession, given themyriad factors impeding growth during this period, but they mayhave softened the recession and speeded up the recovery.
CONCLUSION
This chapter has emphasized the difficulties inherent in usingmonetary and fiscal policies to offset short-term fluctuations in theeconomy. The experience of the 1960s and 1970s has shown thatfine-tuning can be destabilizing and may even erode long-termgrowth rates by increasing the uncertainty associated with long-term planning and impeding the reallocation of resources.
In response to the apparent failure of fine-tuning, some havetaken the opposite position that there is no benefit to countercycli-cal policies, even when the economy experiences a protracted reces-sion. This argument is based on the belief that the primary effectof policy changes in response to short-term conditions is increaseduncertainty among private decision-makers, with possible negativeimpacts on output.
A more balanced view recognizes the limitations of fine-tuning,without precluding the possibility that policy may need to be ad-justed occasionally. In this view, policies are designed primarilywith long-term objectives in mind. Because sound money is indis-pensable to a well-functioning economy, monetary policy targetsare guided by the goals of maintaining low and stable rates of in-flation and facilitating the reliable provision of credit. Spendingpolicies are guided by cost-benefit analysis, taking into accountfuture effects as well as short-run economic conditions. Tax policies
117Digitized for FRASER http://fraser.stlouisfed.org/ Federal Reserve Bank of St. Louis
are structured to minimize interference with market incentives towork, save, invest, and innovate. In the present situation, fiscalpolicy should also aim for gradual reduction in the growth of gov-ernment expenditures and the budget deficit.
In certain circumstances, however, it may be necessary to changepolicies. First, it is possible that relationships between policy tar-gets, such as the growth target for M2, and policy objectives, willchange. In that case, targets for M2 may need to be adjusted and/or supplemented or replaced by targets for other monetary aggre-gates or other indicators. Second, if structural adjustments, exter-nal shocks, or other factors are expected to weaken the economyfor an extended period, then more expansionary policies may be ap-propriate to facilitate the economic adjustment process. To thegreatest extent possible, the circumstances under which policiesmight change should be specified in advance, so that credibility isenhanced rather than compromised by such deviations. The low-growth scenario provisions of the BEA are an example of this kindof "recession escape clause." When policy must deviate from the es-tablished targets, actions should be consistent—and understood tobe consistent—with the long-term objectives of high and stableoutput growth and low and stable inflation.
While the economy has endured a period of protracted weaknessduring which more expansionary policies would, in our judgment,have been desirable, economic developments in 1992 and currentindicators of future activity suggest that a more self-sustaining re-covery consistent with maintaining low inflation is finally under-way and that additional short-term fiscal and/or monetary stimu-lus may be unnecessary. If the modest recovery were to falter, anyshort-term fiscal stimulus should be tied to long-term spending re-ductions in order to minimize upward pressure on interest rates,thereby increasing the effectiveness of the short-term stimulus andreducing future deficits. Monetary policy should remain focused onsustaining a recovery consistent with low and stable inflation. In-terest rates and inflation rates are now at their lowest levels intwo decades, providing the foundation for long-term, noninflation-ary growth in output and employment.
118Digitized for FRASER http://fraser.stlouisfed.org/ Federal Reserve Bank of St. Louis
Related Documents