NANOS SURVEY Canadians’ opinions on our connection to the monarchy National survey released May, 2016 Project 2016-831A NANOS SURVEY

Welcome message from author
This document is posted to help you gain knowledge. Please leave a comment to let me know what you think about it! Share it to your friends and learn new things together.
Transcript
NANOS SURVEY
Canadians’ opinions on our connection to the monarchy
National survey released May, 2016Project 2016-831A
NANOS SURVEY

NANOS SURVEY
>Overall, Canadians support keeping a connection with the monarchy, and believe that having the Queen as Canada’s Head of State has had a positive impact on Canada’s standing in the world.
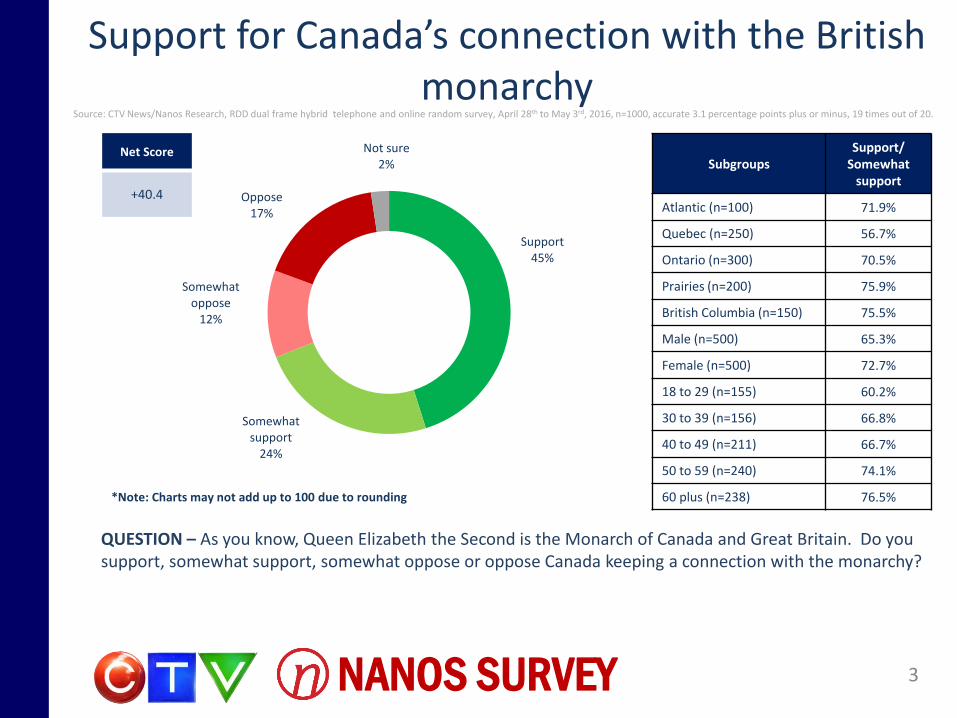
• Canadians support keeping a connection with the monarchy – Seven in ten Canadians say that they either support (45%) or somewhat support (24%) Canada keeping a connection with the monarchy. Nearly a third of Canadians somewhat oppose (12%) or oppose (17%) this decision. Two percent said they were unsure.
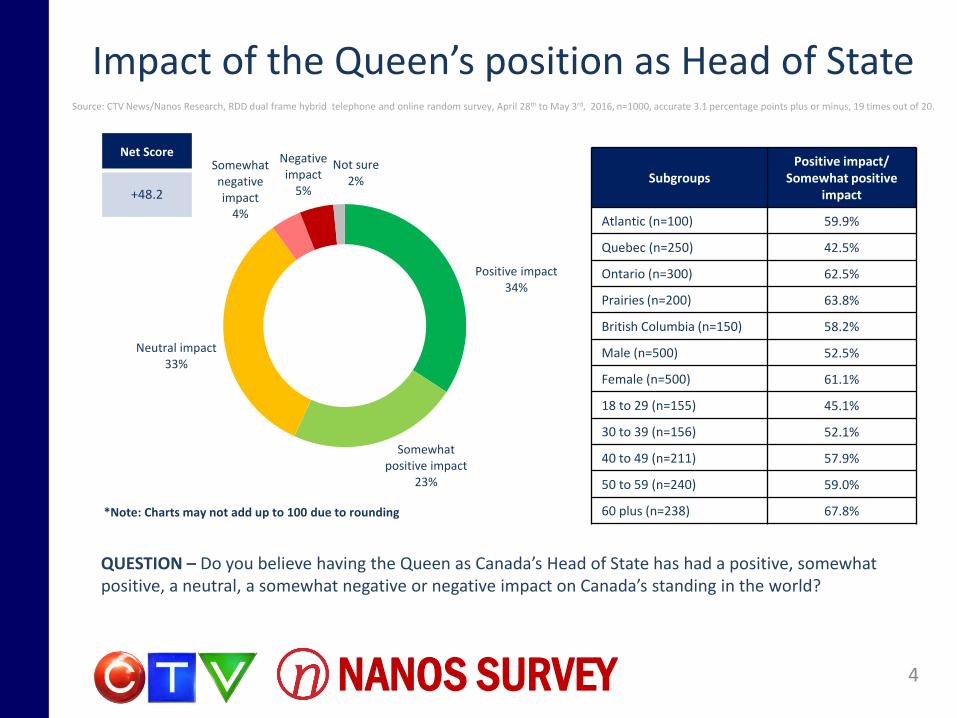
• Canadians believe that having the Queen as Canada’s Head of State has had a positive impact – More than half of Canadians believe that having the Queen as Canada’s Head of State has had a positive impact (34%) or somewhat positive impact (23%) on Canada’s standing in the world. A little over a third of Canadians believe that this has had a neutral impact (33%). Less than one in ten Canadians believe that this has had a negative impact ( five %) or somewhat negative impact (four %). Two percent were unsure.
Nanos conducted an RDD dual frame (land- and cell-lines) hybrid telephone and online random survey of 1,000 Canadians, 18 years of age or older, between April 28th and May 3rd, 2016 as part of an omnibus survey. Participants were randomly recruited by telephone using live agents and administered a survey online. The sample included both land- and cell-lines across Canada.
2
Support strong for keeping connection with monarchy – Canadians feel it has had a positive impact
NANOS SURVEY
Support for Canada’s connection with the British monarchy
3
Support45%
Somewhat support
24%
Somewhat oppose
12%
Oppose17%
Not sure2% Subgroups
Support/Somewhat
support
Atlantic (n=100) 71.9%
Quebec (n=250) 56.7%
Ontario (n=300) 70.5%
Prairies (n=200) 75.9%
British Columbia (n=150) 75.5%
Male (n=500) 65.3%
Female (n=500) 72.7%
18 to 29 (n=155) 60.2%
30 to 39 (n=156) 66.8%
40 to 49 (n=211) 66.7%
50 to 59 (n=240) 74.1%
60 plus (n=238) 76.5%
Net Score
+40.4
QUESTION – As you know, Queen Elizabeth the Second is the Monarch of Canada and Great Britain. Do you support, somewhat support, somewhat oppose or oppose Canada keeping a connection with the monarchy?
Source: CTV News/Nanos Research, RDD dual frame hybrid telephone and online random survey, April 28th to May 3rd, 2016, n=1000, accurate 3.1 percentage points plus or minus, 19 times out of 20.
*Note: Charts may not add up to 100 due to rounding
NANOS SURVEY
Impact of the Queen’s position as Head of State
4
Positive impact34%
Somewhat positive impact
23%
Neutral impact33%
Somewhat negative impact
4%
Negative impact
5%
Not sure2% Subgroups
Positive impact/Somewhat positive
impact
Atlantic (n=100) 59.9%
Quebec (n=250) 42.5%
Ontario (n=300) 62.5%
Prairies (n=200) 63.8%
British Columbia (n=150) 58.2%
Male (n=500) 52.5%
Female (n=500) 61.1%
18 to 29 (n=155) 45.1%
30 to 39 (n=156) 52.1%
40 to 49 (n=211) 57.9%
50 to 59 (n=240) 59.0%
60 plus (n=238) 67.8%
Net Score
+48.2
QUESTION – Do you believe having the Queen as Canada’s Head of State has had a positive, somewhat positive, a neutral, a somewhat negative or negative impact on Canada’s standing in the world?
*Note: Charts may not add up to 100 due to rounding
Source: CTV News/Nanos Research, RDD dual frame hybrid telephone and online random survey, April 28th to May 3rd, 2016, n=1000, accurate 3.1 percentage points plus or minus, 19 times out of 20.
NANOS SURVEY
Methodology
5
Nanos conducted an RDD dual frame (land- and cell-lines) hybrid telephone and online random survey of 1,000 Canadians, 18 years of age or older, between April 28th and May 3rd, 2016 as part of an omnibus survey. Participants were randomly recruited by telephone using live agents and administered a survey online. The sample included both land- and cell-lines across Canada. The results were statistically checked and weighted by age and gender using the latest Census information and the sample is geographically stratified to be representative of Canada.
Individuals randomly called using random digit dialling with a maximum of five call backs.
The margin of error for a random survey of 1,000 Canadians is ±3.1 percentage points, 19 times out of 20.
The data presented in this research is part of a joint project by CTV News and Nanos Research.
Note: Charts may not add up to 100 due to rounding.
NANOS SURVEY
Technical Note
6
Element Description
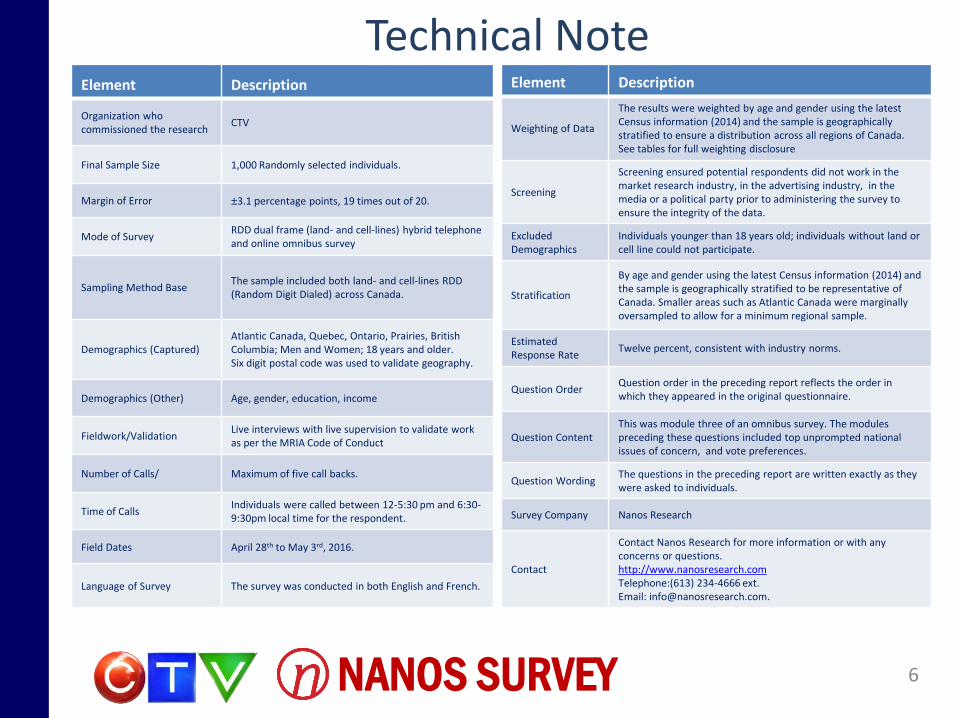
Organization who commissioned the research
CTV
Final Sample Size 1,000 Randomly selected individuals.
Margin of Error ±3.1 percentage points, 19 times out of 20.
Mode of SurveyRDD dual frame (land- and cell-lines) hybrid telephone and online omnibus survey
Sampling Method BaseThe sample included both land- and cell-lines RDD (Random Digit Dialed) across Canada.
Demographics (Captured)Atlantic Canada, Quebec, Ontario, Prairies, British Columbia; Men and Women; 18 years and older.Six digit postal code was used to validate geography.
Demographics (Other) Age, gender, education, income
Fieldwork/ValidationLive interviews with live supervision to validate work as per the MRIA Code of Conduct
Number of Calls/ Maximum of five call backs.
Time of CallsIndividuals were called between 12-5:30 pm and 6:30-9:30pm local time for the respondent.
Field Dates April 28th to May 3rd, 2016.
Language of Survey The survey was conducted in both English and French.
Element Description
Weighting of Data
The results were weighted by age and gender using the latest Census information (2014) and the sample is geographically stratified to ensure a distribution across all regions of Canada. See tables for full weighting disclosure
Screening
Screening ensured potential respondents did not work in the market research industry, in the advertising industry, in the media or a political party prior to administering the survey to ensure the integrity of the data.
Excluded Demographics
Individuals younger than 18 years old; individuals without land or cell line could not participate.
Stratification
By age and gender using the latest Census information (2014) and the sample is geographically stratified to be representative of Canada. Smaller areas such as Atlantic Canada were marginally oversampled to allow for a minimum regional sample.
Estimated Response Rate
Twelve percent, consistent with industry norms.
Question OrderQuestion order in the preceding report reflects the order in which they appeared in the original questionnaire.
Question ContentThis was module three of an omnibus survey. The modules preceding these questions included top unprompted national issues of concern, and vote preferences.
Question WordingThe questions in the preceding report are written exactly as they were asked to individuals.
Survey Company Nanos Research
Contact
Contact Nanos Research for more information or with any concerns or questions.http://www.nanosresearch.comTelephone:(613) 234-4666 ext. Email: [email protected].

NANOS SURVEY
About Nanos
7
View our brochure
Nik Nanos FMRIA Richard Jenkins
Chairman, Nanos Research Group Vice President, Nanos Research
Ottawa (613) 234-4666 ext. 237 Ottawa (613) 234-4666 ext. 230
Washington DC (202) 697-9924 [email protected]
Nanos is one of North America’s most trusted research and strategy organizations. Our team of professionals is regularly called upon by senior executives to deliver superior intelligence and market advantage whether it be helping to chart a path forward, managing a reputation or brand risk or understanding the trends that drive success. Services range from traditional telephone surveys, through to elite in-depth interviews, online research and focus groups. Nanos clients range from Fortune 500 companies through to leading advocacy groups interested in understanding and shaping the public landscape. Whether it is understanding your brand or reputation, customer needs and satisfaction, engaging employees or testing new ads or products, Nanos provides insight you can trust.

Tabulations
8NANOS SURVEY
2016-831A – CTV/Nanos Survey – Monarchy - STAT SHEET
Nanos conducted an RDD dual frame (land- and cell- lines) hybrid telephone and online random survey of 1,000 Canadians, 18 years of age or older, between April 28th to May 3rd, 2016. The sample included both land- and
cell-lines across Canada. The margin of error for a random survey of 1,000 Canadians is ±3.1 percentage points, 19 times out of 20. www.nanosresearch.com
Page 1
Region Gender Age
Canada 2016-04
Atlantic Canada Quebec Ontario Prairies
British Columbia Male Female 18 to 29 30 to 39 40 to 49 50 to 59 60 plus
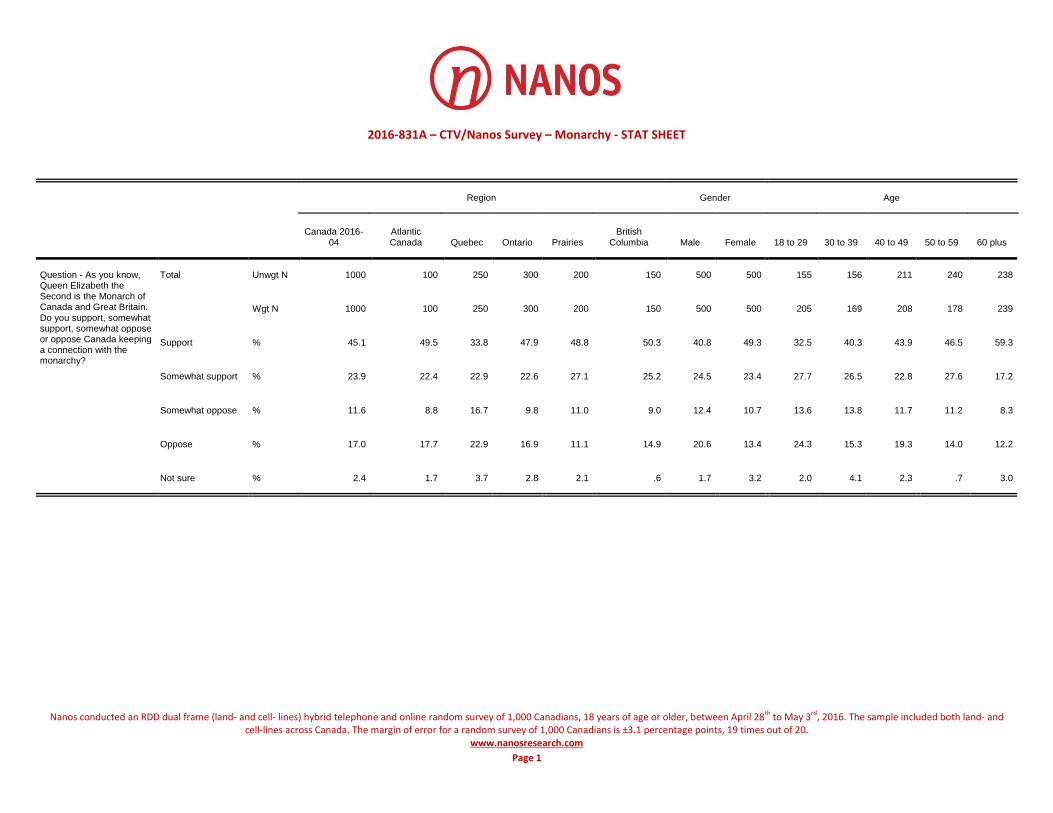
Question - As you know, Queen Elizabeth the Second is the Monarch of Canada and Great Britain. Do you support, somewhat support, somewhat oppose or oppose Canada keeping a connection with the monarchy?
Total Unwgt N 1000 100 250 300 200 150 500 500 155 156 211 240 238
Wgt N 1000 100 250 300 200 150 500 500 205 169 208 178 239
Support % 45.1 49.5 33.8 47.9 48.8 50.3 40.8 49.3 32.5 40.3 43.9 46.5 59.3
Somewhat support % 23.9 22.4 22.9 22.6 27.1 25.2 24.5 23.4 27.7 26.5 22.8 27.6 17.2
Somewhat oppose % 11.6 8.8 16.7 9.8 11.0 9.0 12.4 10.7 13.6 13.8 11.7 11.2 8.3
Oppose % 17.0 17.7 22.9 16.9 11.1 14.9 20.6 13.4 24.3 15.3 19.3 14.0 12.2
Not sure % 2.4 1.7 3.7 2.8 2.1 .6 1.7 3.2 2.0 4.1 2.3 .7 3.0
2016-831A – CTV/Nanos Survey – Monarchy - STAT SHEET
Nanos conducted an RDD dual frame (land- and cell- lines) hybrid telephone and online random survey of 1,000 Canadians, 18 years of age or older, between April 28th to May 3rd, 2016. The sample included both land- and
cell-lines across Canada. The margin of error for a random survey of 1,000 Canadians is ±3.1 percentage points, 19 times out of 20. www.nanosresearch.com
Page 2
Region Gender Age
Canada 2016-04
Atlantic Canada Quebec Ontario Prairies
British Columbia Male Female 18 to 29 30 to 39 40 to 49 50 to 59 60 plus
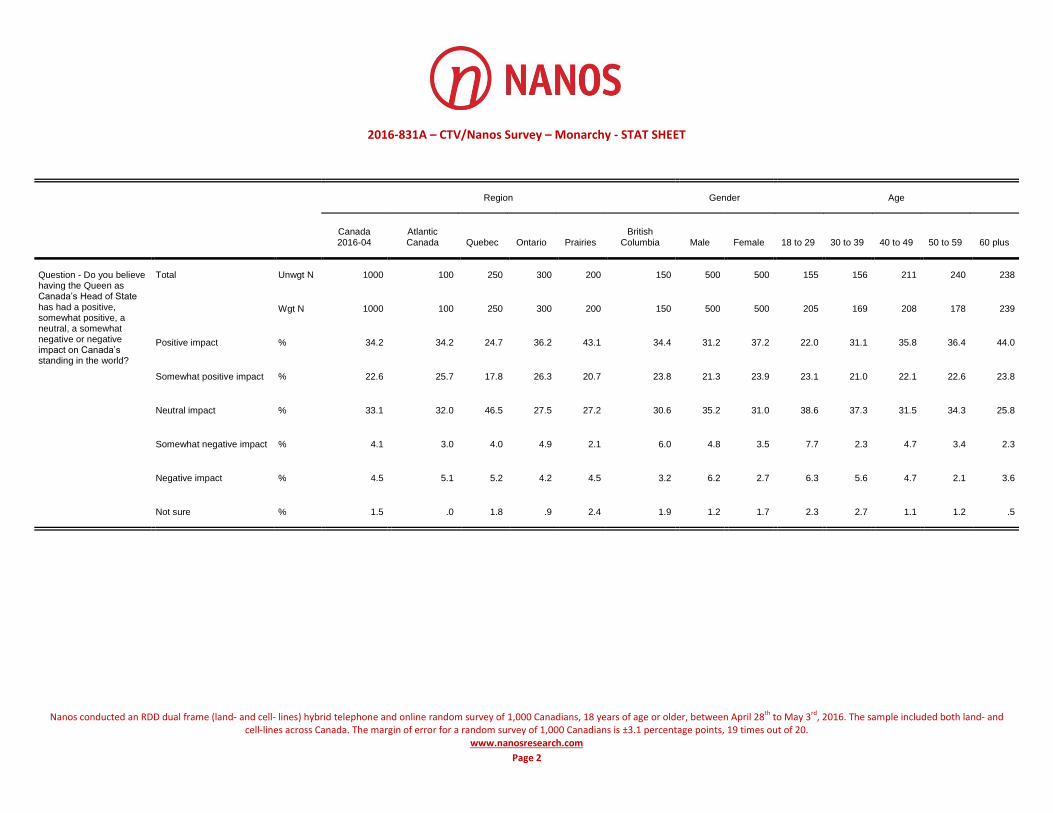
Question - Do you believe having the Queen as Canada’s Head of State has had a positive, somewhat positive, a neutral, a somewhat negative or negative impact on Canada’s standing in the world?
Total Unwgt N 1000 100 250 300 200 150 500 500 155 156 211 240 238
Wgt N 1000 100 250 300 200 150 500 500 205 169 208 178 239
Positive impact % 34.2 34.2 24.7 36.2 43.1 34.4 31.2 37.2 22.0 31.1 35.8 36.4 44.0
Somewhat positive impact % 22.6 25.7 17.8 26.3 20.7 23.8 21.3 23.9 23.1 21.0 22.1 22.6 23.8
Neutral impact % 33.1 32.0 46.5 27.5 27.2 30.6 35.2 31.0 38.6 37.3 31.5 34.3 25.8
Somewhat negative impact % 4.1 3.0 4.0 4.9 2.1 6.0 4.8 3.5 7.7 2.3 4.7 3.4 2.3
Negative impact % 4.5 5.1 5.2 4.2 4.5 3.2 6.2 2.7 6.3 5.6 4.7 2.1 3.6
Not sure % 1.5 .0 1.8 .9 2.4 1.9 1.2 1.7 2.3 2.7 1.1 1.2 .5
Related Documents